Embed Size (px)
Citation preview

www.reach-initiative.org 1
Research Terms of Reference Joint Cash Feasibility Assessment
Nigeria
January 2018
Research Cycle ID: NGA1802
1. Summary
Country of intervention Nigeria
Type of Emergency Natural disaster X Conflict X Emergency
Type of Crisis Sudden onset Slow onset Protracted
Mandating Body/ Agency Cash Working Group
Project Code 35 iADN
REACH Pillar X Planning in
Emergencies
Displacement Building Community
Resilience
Research Timeframe January – February 2018
General Objective To determine whether cash-based modalities are feasible in assessed LGA capitals of
Northeast Nigeria for 1) food assistance; 2) hygiene NFI assistance; 3) household NFI
assistance; 4) shelter repair material assistance; 5) fuel/firewood assistance.
Specific Objective(s) 1. Identify household preferences between modalities of assistance for each of
the assessed types of items;
2. Determine the capacity of markets in assessed towns to respond to an
increase in demand for the assessed types of items.
Research Questions A. Beneficiary preferences:
1) How do beneficiaries typcially access assessed items?
2) Which assistance modalities do beneficiaries prefer and why?
3) What security or non-security barriers do beneficiaries face in
accessing food from markets or distributions?
4) What access do beneficiaries have to credit?
5) Do beneficiary preference diverge from those of Bulamas
(community leaders)?
B. Market expansion capacity:
1) How has the market been affected by conflict?
2) What security and non-security barriers do vendors face in
conducting business?
3) To what extent would vendors be able to increase supply of
assessed items?
4) How are vendors supplied with the items they sell? Do they face
challenges in supply and transportation?
Research Type Quantitative Qualitative X Mixed methods
Geographic Coverage The following towns in Borno, Yobe, and Adamawa states:
Borno:
o Damboa
o Pulka

www.reach-initiative.org 2
o Mafa
o Chibok
o Dikwa
o Gwoza
o Askira Uba
o Monguno
Yobe:
o Damaturu
o Gulani
o Gujba
Adamawa:
o Madagali
o Michika
Target Population(s) Households living in assessed towns of Northeast Nigeria
Vendors of food, NFIs, shelter repair materials, and firewood/fuel in
assessed towns of Northeast Nigeria
Data Sources Secondary Data: Nigeria Basic Needs and Response Analysis Framework: Pilot
(multiple humanitarian actors, June 2017); Northeast Nigeria Joint Livelihood and
Market Recovery Assessment (multiple humanitarian actors, August 2017); Konduga
Cash Suitability Assessment (REACH and FSS; November-December 2017).
Primary data: All primary data to be collected from 1-13 February 2018. In each
assessed town, the following data will be collected:
Household data collected with 95% confidence and 10% margin of error
each for IDPs and host populations.
Key informant (KI) interviews with up to 15 Bulamas (fewer if there are fewer
than 15 Bulamas in the town, in which case all Bulamas will be interviewed).
Up to 60 interviews with vendors selling the assessed items. If there are
fewer than 60 vendors selling the assessed items in the town, then all the
vendors will be interviewed.
4 household focus group discussions (FGDs): one men’s FGD and one
women’s FGD each for IDPs and host populations.
2-3 vendor FGDs: 2 if the two largest markets are of roughy equal size, and
3 if one market is much larger than the other.
2 semi-structured interviews with heads of traders: one interview each for the
two largest markets in the town.
Expected Outputs Cleaned and raw datasets, joint analysis workshop, 13 factsheets (one per assessed
location), overview document accompanying the factsheets.
Audience
Audience type Specific actors
X Operational Operational actors seeking to determine whether cash assistance is feasible in their areas of intervention.
X Programmatic Donors seeking to determine the assistance modalities they wish to support.
Strategic
Other

www.reach-initiative.org 3
Access
X Public (available on REACH Resource Centre and other humanitarian platforms)
Restricted (bilateral dissemination only upon agreed dissemination list, no publication on REACH or other platforms)
Other
Visibility
REACH and CWG visitibility on all published outputs. A logo page will be included in
the overview document with visibility for all partners that provided data.
Dissemination
Overview and factsheets disseminated through SendInBlue over REACH Nigeria
mailing list (other than joint analysis workshop presentation, which is to be presented
rather than disseminated), as well as the Cash Working Group mailing list.
2. Background & Rationale
Following eight years of conflict in Northeast Nigeria, the region is experiencing significant humanitarian needs. In Borno
State, the area most heavily affected by the crisis, 1.37 million people were internally displaced as of the start of 2017,1 and
41% of the population reportedly faced critical food insecurity situations as of March 2017.2 In response to the crisis,
humanitarian actors have sought to provide vulnerable populations with assistance through both in-kind distributions and
cash-based assistance.
It is within this context that REACH and the Cash Working Group are conducting an assessment in order to determine the
most appropriate food assistance modality in a number of locations in Borno, Yobe, and Adamawa States. This assessment
is intended to build on the approach developed in November 2017 for a REACH and Food Security Sector assessment to
determine the most appropriate food assistance modality in the town of Konduga. The assessment will target both IDP and
host populations in the assessed towns, and will focus on food items, NFIs, firewood/fuel, and shelter repair materials, based
on operational partner requests.
3. Research Objectives
Primary objective : To determine whether cash-based modalities are feasible in assessed LGA capitals of Northeast
Nigeria for 1) food assistance; 2) hygiene NFI assistance; 3) household NFI assistance; 4) shelter repair material
assistance; 5) fuel/firewood assistance.
Specific objectives :
1. Identify household preferences between modalities of assistance for each of the assessed types of items;
2. Determine the capacity of markets in assessed towns to respond to an increase in demand for the assessed
types of items.
4. Research Questions
A. Beneficiary preferences:
1. How do beneficiaries typcially access assessed items?
2. Which assistance modalities do beneficiaries prefer and why?
3. What security or non-security barriers do beneficiaries face in accessing food from markets or
distributions?
4. What access do beneficiaries have to credit?
5. Do beneficiary preference diverge from those of Bulamas (community leaders)?
B. Market expansion capacity:
1. How has the market been affected by conflict?
2. What security and non-security barriers do vendors face in conducting business?
3. To what extent would vendors be able to increase supply of assessed items?
1 UN Office for the Coordination of Humanitarian Affairs, Nigeria Northeast: Humanitarian Overview 2017, September 2016. 2 Food and Agriculture Organisation, Cadre Harmonise for Identification of Risk Areas in Sixteen States of Nigeria, March 2017.

www.reach-initiative.org 4
4. How are vendors supplied with the items they sell? Do they face challenges in supply and
transportation?
5. Methodology
5.1. Methodology overview
Overall, the assessment will use a mixed methodology, consisting of both representative and purposive sampling, and
collecting both quantitative and qualitative data, to answer the research questions. The focus of the assessment is on two
main areas: understanding beneficiary modality preferences, and evaluating the capacity of markets to respond to an
increase in demand. These two segments of the assessment will include the following data collection components:
Understanding beneficiary preferences:
o Household interviews
o Household focus group discussions (FGDs)
o Bulama (community leader) interviews
Evaluating market expansion capacity:
o Vendor interviews
o Vendor FGDs
o Head of trader interviews
The assessment will be coordinated through the Cash Working Group (CWG) in Maiduguri, with data collected jointly by a
number of CWG partner organisations.3 The overall approach of the assessment will be developed together with partners,
who will have the opportunity to review all questionnaires and assessment tools before their deployment. After the finalisation
of tools, REACH will conduct a training on the tools for data collection teams. This training will be rolled out through a training
of trainers approach, where REACH trains partner organisation focal points, who will then train their teams in the field.
Following the trainings, data collection will begin in all assessed locations, and will take place over 13 days. Following data
collection, a Joint Analysis Workshop will be held in Maiduguri, in which partners provide input on interpreting the data and
agree upon the findings and recommendations of the assessment for each location. Further, partners will have the
opportunity to review and provide feedback on the factsheets and overview prior to publication.
Household interviews will be conducted with a stratified representative sample of households,4 with stratification based on
population group (IDP or host population) in each location. The sample for each population group in each location will have
a 95% confidence level and a 10% margin of error, with a 95% confidence level and 7% margin of error when aggregating
across the two groups. Following the completion of household interviews, a total of 4 FGDs will be conducted with residents
of the town, each consisting of 8 individuals: one men’s and one women’s FGD each for IDPs and host populations. In
addition, short interviews will be conducted with Bulamas (traditional community leaders) in order to understand whether
their preferences between assistance modalities for their communities differs from household preferences.
Individual interviews will be conducted with vendors, with the aim of interviewing at vendors in each town selling the assessed
types of items, or – if there are more than 60 vendors in the town – at least 60 vendors. The vendor interviews will focus on
security and non-security challenges to conducting business, as well as how they are supplied, the process of receiving
goods from their suppliers, and their estimated ability to respond to an increase in demand.
3 Operational partners involved in the assessment include International Rescue Committee (IRC), Oxfam, World Food Programme (WFP), Plan International, CISCOPE, Adventist Development and Relief Association (ADRA), ACTED, Christian Aid, Lindii Peace Foundation, Tearfund/CRUDAN. 4 The formula used by REACH to calculate the sample size was first outlined by Krejcie and Morgan in 1970 and has been widely used in social research, including humanitarian research, ever since (3,313 known citations). It is described as follows: n= X2 x N x (1-P) / (ME2 x (N-1)) + (X2 x P x (1-P)) Where: n = Sample size, X2 = Chi-square for the specified confidence level at 1 degree of freedom, N = Population size, P = Population proportion (assumed to be 0.5 to generate maximum sample size), ME = desired Margin of Error (expressed as proportion) - Krejcie and Morgan (1970) “Determining Sample Size for Research Activities” (Educational and Psychological Measurement, 30, pp. 607-610)

www.reach-initiative.org 5
Following the individual vendor interviews, FGDs will be conducted with groups of 8 vendors. Two FGDs will be conducted
in locations with fewer than 29 vendors in total, while 3 will be conducted in locations with 30 or more vendors. The aim of
these FGDs is to gather qualitative information not captured in the individual interviews, but will generally explore similar
themes to those of the interviews. In addition, short semi-structured interviews will be conducted with the head of traders in
each of the markets in assessed locations, which will focus on the evolution and recent history of the markets.
5.2. Populations of Interest
The populations of interest for this assessment are:
Households residing in towns in Northeastern Nigeria being covered by this assessment.
Vendors selling food, hygiene NFIs, household (non-hygiene) NFIs, fuel/firewood, and shelter repair materials in
assessed towns.
Households residing in assessed towns
Estimated population sizes of IDPs and host populations in each assessed town will be determined by triangulating the
International Organisation for Migration Displacement Tracking Matrix (IOM DTM) data with figures provided by operational
partners engaged in data collection for each location.
Vendors in assessed locations
Organisations participating in data collection will conduct initial scoping missions in each assessed location to determine the
number of markets, the days of operation of those markets, and the total number of vendors selling the assessed items.
5.3. Secondary data review
Assessments relevant to the current investigation have been conducted in the past. The Northeast Nigeria Joint Livelihood
and Market Recovery Assessment provides a baseline of market conditions across the region from August 2017.5 Moreover,
the Basic Needs and Response Analysis Framework pilot assessment, conducted in Konduga, Maiduguri, and Jere LGAs,
included components evaluating the preferred assistance modalities in these LGAs.6 The approach for this assessment
builds on that developed during the Cash Feasibility Assessment for Food Assistance in Konduga, conducted by REACH in
partnership with the Food Security Sector in November-December 2017.7
5.4. Primary Data Collection
The intended time period for primary data collection is 1-13 February. The following table shows the organisations
responsible for data collection in each assessed location
State Town Organisation
Borno
Monguno WFP
REACH CAID
Askira Uba IRC
Plan International Lindii Peace Foundation
Gwoza Plan International
Dikwa ADRA
Chibok Oxfam
Damboa Oxfam
Pulka Oxfam
Mafa Acted
5 USAID, Mercy Corps, Action Against Hunger, Cooperazione Internazionale, International Rescue Committee, Catholic Relief Services, Oxfam; Northeast Nigeria Joint Livelihood and Market Recovery Assessment, August 2017. 6 Plan International, World Food Programme, Save the Children, ICAS, Okular Analytics ; Nigeria Basic Needs and Response Analysis Framework: Pilot, June 2017. 7 REACH Initiative, Northeast Nigeria Food Security Sector, Cash Suitability Assessment for Food Assistance in Konduga, December 2017.
www.reach-initiative.org 6
Yobe
Damaturu IRC, WFP
Gulani WFP
Gujba IRC, WFP
Adamawa
Madagali IRC, CISCOPE,
TearFund/CRUDAN, PLAN
Michika IRC, Plan International, CISCOPE,
TearFund/CRUDAN
In locations where multiple organisations are collecting data, focal points from these organisations will coordinate to divide
the data collection workload and assign responsibilities at the field level. More detail on the processes for each type of data
collection can be found below.
Understanding beneficiary preferences
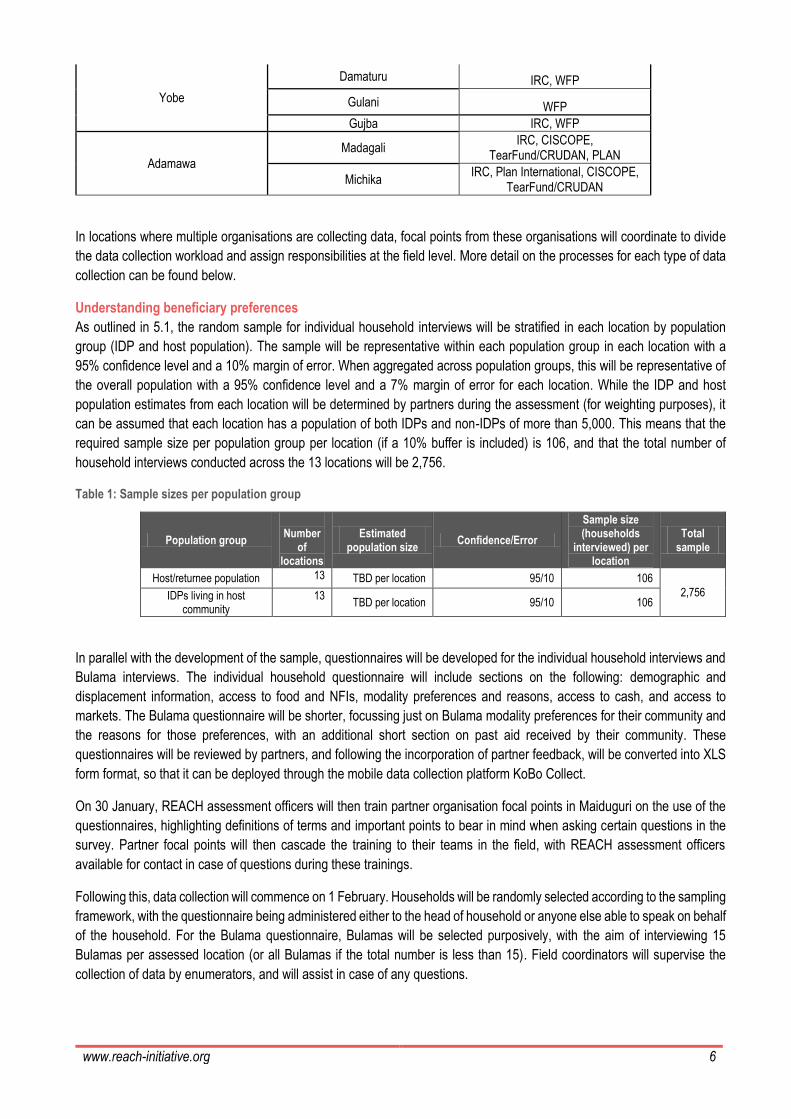
As outlined in 5.1, the random sample for individual household interviews will be stratified in each location by population
group (IDP and host population). The sample will be representative within each population group in each location with a
95% confidence level and a 10% margin of error. When aggregated across population groups, this will be representative of
the overall population with a 95% confidence level and a 7% margin of error for each location. While the IDP and host
population estimates from each location will be determined by partners during the assessment (for weighting purposes), it
can be assumed that each location has a population of both IDPs and non-IDPs of more than 5,000. This means that the
required sample size per population group per location (if a 10% buffer is included) is 106, and that the total number of
household interviews conducted across the 13 locations will be 2,756.
Table 1: Sample sizes per population group
Population group
Number
of locations
Estimated population size
Confidence/Error
Sample size (households
interviewed) per location
Total sample
Host/returnee population 13 TBD per location 95/10 106
2,756 IDPs living in host community
13 TBD per location 95/10 106
In parallel with the development of the sample, questionnaires will be developed for the individual household interviews and
Bulama interviews. The individual household questionnaire will include sections on the following: demographic and
displacement information, access to food and NFIs, modality preferences and reasons, access to cash, and access to
markets. The Bulama questionnaire will be shorter, focussing just on Bulama modality preferences for their community and
the reasons for those preferences, with an additional short section on past aid received by their community. These
questionnaires will be reviewed by partners, and following the incorporation of partner feedback, will be converted into XLS
form format, so that it can be deployed through the mobile data collection platform KoBo Collect.
On 30 January, REACH assessment officers will then train partner organisation focal points in Maiduguri on the use of the
questionnaires, highlighting definitions of terms and important points to bear in mind when asking certain questions in the
survey. Partner focal points will then cascade the training to their teams in the field, with REACH assessment officers
available for contact in case of questions during these trainings.
Following this, data collection will commence on 1 February. Households will be randomly selected according to the sampling
framework, with the questionnaire being administered either to the head of household or anyone else able to speak on behalf
of the household. For the Bulama questionnaire, Bulamas will be selected purposively, with the aim of interviewing 15
Bulamas per assessed location (or all Bulamas if the total number is less than 15). Field coordinators will supervise the
collection of data by enumerators, and will assist in case of any questions.
www.reach-initiative.org 7
At the end of each day, the field coordinators in each location will ensure that the data is uploaded from the smartphones
used by the enumerators to the Kobo Collect server. Submitted surveys from all location will be downloaded by the REACH
Database Officer, who will check and clean the data, providing any points for follow-up to the partner organisation focal
points.
Following the completion of individual interviews, data collection teams will conduct FGDs with households. In each location,
there will be one male and one female FGD for IDPs and host population, resulting in 4 household FGDs per location and a
total of 52 FGDs across all locations. FGDs will be conducted by one facilitator and one note-taker. The note-taker will use
a note-taker version of the paper questionnaire (with additional spaces) to take notes on responses. These notes will then
be transferred into a spreadsheet for ease of analysis and readability of data, before being sent to the REACH Assessment
Officer.
Evaluating market expansion capacity
This portion of the assessment will focus on food, hygiene NFIs (e.g. bathing soap, laundry powder), household NFIs (e.g.
sleeping mats, mosquito nets), fuel/firewood, and shelter repair materials (e.g. tarpaulin, nails). These item categories were
chosen during the initial planning stages of the assessment, based on the interests and information needs of the operational
partners involved.
Prior to data collection for this component of the assessment, data collection teams will conduct initial scoping missions in
each assessed location to determine the number of markets, the days of operation of those markets, and the total number
of vendors selling the assessed item categories. If there are 60 or fewer vendors in an assessed location, data collection
teams will attempt to interview all of them. If there are more than 60, then at least 60 will be interviewed. The tool development
process for these interviews will be the same as that for the household interviews, with partners reviewing draft tools,
conversion to XLSForm format for deployment through Kobo, and cascaded training.
The vendor interview questionnaire will open with a general section on the vendor’s displacement history, shop type, storage
capacity, and barriers to conducting business. This is followed by sections specifically focussed on each of the assessed
item categories (although vendors only need to respond for whichever of those assessed items that they stock), with
questions on the location of their main supplier for that item category, the means of transportation of the items from the
supplier to the vendor, any recent shortages, and the ability to respond to an increase in demand. Data will be cleaned daily,
with follow-up sent back to the field teams.
Individual vendor interviews will be followed by vendor FGDs consisting of eight individuals each. For towns with fewer than
30 vendors selling the assessed items, there will be 2 vendor FGDs, while for towns with 30 or more vendors there will be 3
vendor FGDs. These will collect more qualitative information that is harder to collect from a structured interview, such as
vendor-supplier relationships, and their views on the overall state of the market and its capacity to expand. Each vendor
FGD will consist of vendors from the same market (i.e. if there are two markets, one FGD should include only vendors from
one market, and the other FGD should include only vendors from the other market) Semi-structured qualitative interviews
will also be conducted with the head of traders in each of the markets in an assessed location, focussing on the recent
evolution of the market and informal systems operating within it. As with the household FGDs, notes from the vendor FGDs
and heads of traders interviews will be entered by a member of the data collection team into a pre-prepared spreadsheet
designed for ease of use and readability of data.
5.5. Data Analysis
Following data cleaning, the data will be analysed. During aggregation to the level of the overall population of the town,
records from IDP and host populations each will be weighted based on the estimated population size of each group.
Household data will be analysed using Excel and Stata at the level of each assessed location, although findings will also
be disaggregated between IDP and host populations. Quantitative analysis for the individual vendor interviews will also be
done through Excel and Stata, although no weighting is required for the vendor interviews as the sample was not stratified
and will likely include all or the majority of vendors selling the assessed items. Analysis from quantitative analysis will be
supplemented with qualitative findings from the FGDs and semi-structured interviews.

www.reach-initiative.org 8
Following the analysis, findings will be assembed into a presentation for a Joint Analysis Workshop (JAW) with operational
partner organisations. At the JAW, REACH will present the quantitative and qualitative findings, with partners providing
their interpretations of findings (e.g. reasons why certain options were more frequently chosen than others for a given
question) and thoughts on its implications, based on their sectoral and contextual knowledge. At the end of the
presentation, REACH and partners will have a wrap-up discussion in which conculsions regarding the overall research
objective are agreed upon, along with the recommendations for partners stemming from those conclusions.
5.6. Limitations
The main limitations that have been identified for this assessment are the following:
Findings from this assessment will apply only to towns covered in this assessment, and to the item categories
assessed. They cannot be extrapolated to apply to other parts of the respective LGAs of these towns, other towns
outside these LGAs, or to other categories of aid.
Population numbers for assessed towns, and the breakdown of population between IDPs and the host community,
are approximate estimates obtained through the triangulation of various sources, rather than precise figures. This
may lead to the introduction of minor errors during aggregation and weighting of data between population groups.
Data comes from self-reporting by households and vendors, rather than external observations and monitoring of
markets and households.
6. Product Typology
Table 3: Type and number of products required
Type of Product Number of Product(s) Additional information
Factsheet 13 Drafts of these will be produced soon after data analysis,
for the Joint Analysis Workshop. There will be one
factsheet per assessed location. Recommendations for
each location will be added following the JAW.
Quantitative Dataset 1 This dataset will contain the raw and cleaned data from
the quantitative data collection tools, in addition to a
cleaning log showing changes made during data cleaning.
It will be available to partners on request.
Joint Analysis Workshop
1 REACH will present the findings of the assessment to partners, who will assist in interpreting their significance.
Overview document 1 This will accompany the factsheets for each location, introducing the assessment and describing overall patterns and recommendations that apply to all locations.
7. Accountability to affected populations
Assessed households and vendors have given time to contribute to the assessments, answering to questionnaires and
participating in focus groups discussions. Likewise, REACH will take the time to share the results of the assessments back
with them when and if possible.
Resources are not currently available to provide feedback to participating communities. However, subsequent assessments
in forthcoming research cycles will be conducted in the same areas. When REACH returns to assessed areas, providing the
political climate allows, they will share the key findings with communities and obtain their feedback, which will potentially be
used to inform further assessments or provide updates to previous products.
8. Management arrangements and work plan
8.1 Roles and Responsibilities, Organogram
Country Focal Point (1x)
www.reach-initiative.org 9
o Strategic engagement
o Review of tools, methodology, plans and outputs
Assessment Officer (1x)
o Coordinate and oversee data collection processes with partners
o Develop research design, methodology, work plans, assessment implementation plans
o Create data collection tools and training materials
o Lead data analysis output production
Senior Field Officer (1x)
o Coordinates access to research locations covered by REACH
o Identification of enumerators in locations covered by REACH
o Conduct training of field teams in locations covered by REACH
o Oversight of REACH fieldwork
o Communication point between field and assessment/ analysis teams
o Partner organisations will likely have someone playing a similar role in each data collection location
Enumerators x 8-10 per location
o Conduct data collection in the field
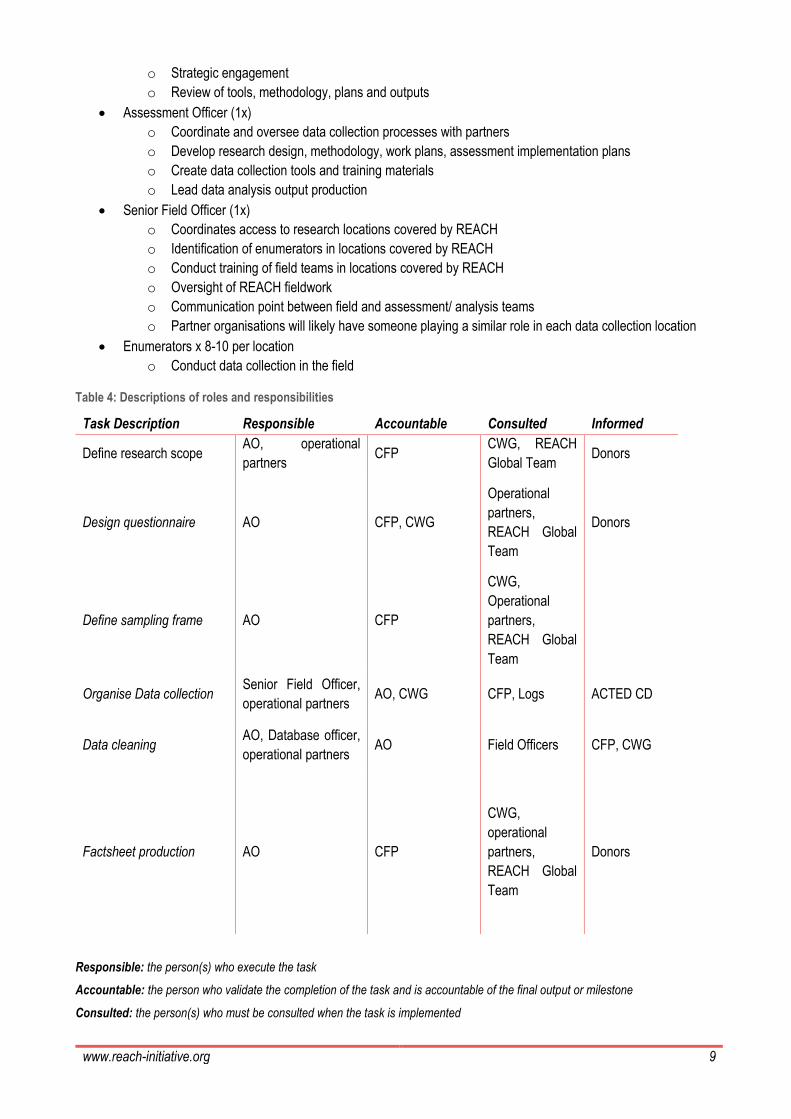
Table 4: Descriptions of roles and responsibilities
Task Description Responsible Accountable Consulted Informed
Define research scope AO, operational
partners CFP
CWG, REACH
Global Team Donors
Design questionnaire AO CFP, CWG
Operational
partners,
REACH Global
Team
Donors
Define sampling frame AO CFP
CWG,
Operational
partners,
REACH Global
Team
Organise Data collection Senior Field Officer,
operational partners AO, CWG CFP, Logs ACTED CD
Data cleaning AO, Database officer,
operational partners AO Field Officers CFP, CWG
Factsheet production AO CFP
CWG,
operational
partners,
REACH Global
Team
Donors
Responsible: the person(s) who execute the task
Accountable: the person who validate the completion of the task and is accountable of the final output or milestone
Consulted: the person(s) who must be consulted when the task is implemented

www.reach-initiative.org 10
Informed: the person(s) who need to be informed when the task is completed
8.2 Resources: HR, Logistic and Financial
REACH will supply the assessment staff needed to design the tools, conduct trainings, analyse the data and produce the
outputs, funded by its grant with ECHO. In addition, REACH will supply logistical, financial, and HR resources (also funded
by ECHO) to support data collection in Monguno. The logistical, HR, and financial resources for data collection in other
assessed towns will be provided by the partner organisations responsible for data collection in each location. For locations
where more than one organisation is collecting data, the relevant organisations will coordinate to share the workload and
costs for data collection in those locations.
8.3 Work plan
Activity January February March
1 2 3 4 1 2 3 4 1 2 3 4
Tool design
Tool review
Tool validation
TOR/ Methodology design
TOR/ Methodology review
TOR/ Methodology validation
Training
Data collection
Data checking and cleaning
Data aggregation and analysis
Draft factsheet production
Joint analysis workshop
Factsheet revision and overview drafting
Output review
Output dissemination
9. Risks & Assumptions
Table 4: List of risks and mitigating action
Risk Mitigation Measure
Change in security situation makes areas
inaccessible to REACH or partner
enumerators
Security situation will be monitored up to the start of data
collection, with partners to be contacted for contingency planning
in case locations become inaccessible.
Partner organisation data collection teams
have difficulties using the tools and the
Kobo Collect platform
A training will be conducted with partner organisation focal points
before data collection. This will include a module on using Kobo
and going through all the questionnaires to clarify any doubts.
Security situation results in travel time to
certain areas being increased
The security situation will be continually monitored and alternative
routes identified. Partners will be contacted to let them know of a
longer data collection period in case longer travel time slows
down data collection.
It is not possible to obtain approvals to
collect data from certain areas
Necessary requests for approval will be submitted in advance.
Organisations responsible for data collection will liaise with local
authorities to the extent necessary, so as to notify them of the
data collection teams’ presence. The Assessment Officer will
ensure the overall sample contains a 10% buffer, with the aim to

www.reach-initiative.org 11
survey 10% more respondents than needed to reach the target
sample size
Randomly selected sample of households
generate non-responses; interviewees in
some areas are unwilling to participate in
the assessment
The survey is anonymous and entirely voluntary, and all
households will have the right to withdraw. Survey questions will
respect humanitarian protection guidelines and enumerators will
emphasise the importance of the assessment when approaching
households. If households are unwilling to participate,
enumerators will be instructed to move on and find other
interviewees. The same applies to vendors.
10. Monitoring and Evaluation
Table 4: Monitoring and evaluation objectives and indicators
IMPACT Objective
External M&E Indicator
Internal M&E Indicator
Methodology Focal point
Tool Research-specific information
Humanitarian stakeholders are accessing IMPACT products
Number of humanitarian organisations accessing IMPACT services/products Number of individuals accessing IMPACT services/products
# of downloads of report, dataset and factsheets from Resource Centre
User monitoring
Country request to HQ
User_log
Y
# of downloads of report, dataset and factsheets from Relief Web
Country request to HQ
Y
# of downloads of report, dataset and factsheets from Country level platforms
Country team
Y
# of page clicks on report, dataset and factsheets from REACH global newsletter
Country request to HQ
N
# of page clicks on report, dataset and factsheets from country newsletter, SendInBlue, bit.ly
Country team
Y
# of visits to x webmap/x dashboard
Country request to HQ
N
IMPACT activities contribute to better
Number of humanitarian organisations utilizing
# references in HPC documents (HNO, SRP, Flash appeals,
Reference monitoring
Country team
Reference_log CWG strategy documents
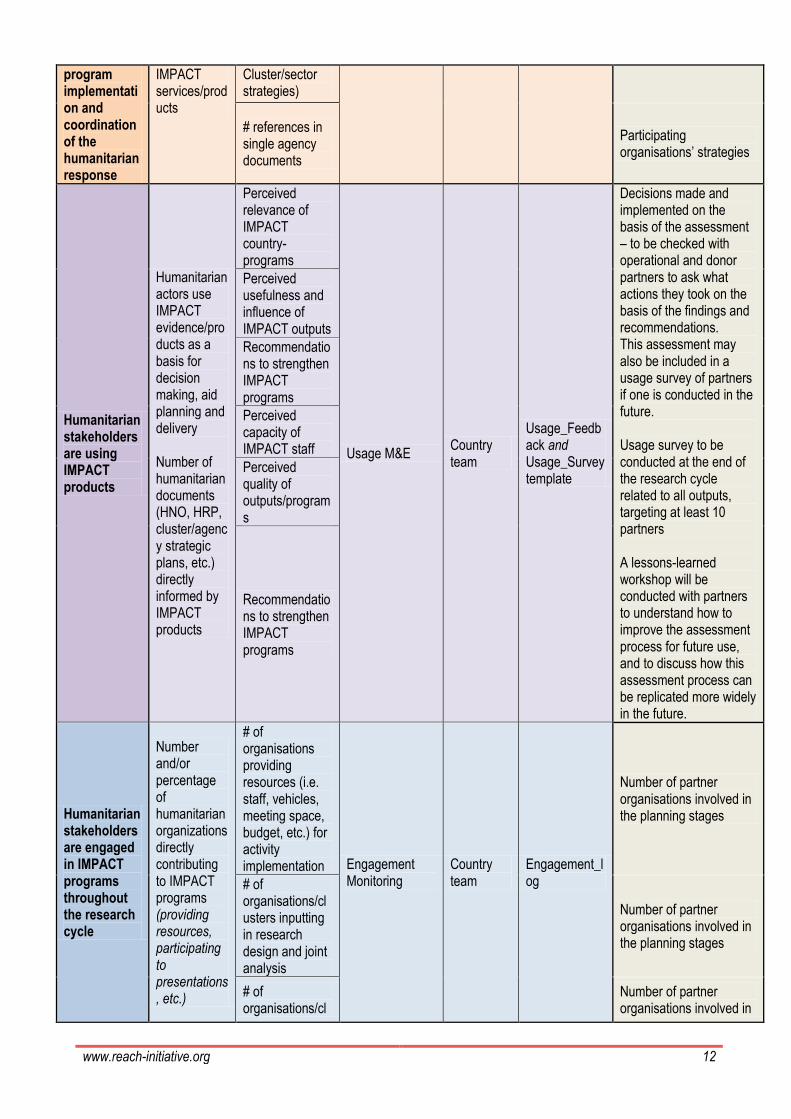
www.reach-initiative.org 12
program implementation and coordination of the humanitarian response
IMPACT services/products
Cluster/sector strategies)
# references in single agency documents
Participating organisations’ strategies
Humanitarian stakeholders are using IMPACT products
Humanitarian actors use IMPACT evidence/products as a basis for decision making, aid planning and delivery Number of humanitarian documents (HNO, HRP, cluster/agency strategic plans, etc.) directly informed by IMPACT products
Perceived relevance of IMPACT country-programs
Usage M&E Country team
Usage_Feedback and Usage_Survey template
Decisions made and implemented on the basis of the assessment – to be checked with operational and donor partners to ask what actions they took on the basis of the findings and recommendations. This assessment may also be included in a usage survey of partners if one is conducted in the future. Usage survey to be conducted at the end of the research cycle related to all outputs, targeting at least 10 partners A lessons-learned workshop will be conducted with partners to understand how to improve the assessment process for future use, and to discuss how this assessment process can be replicated more widely in the future.
Perceived usefulness and influence of IMPACT outputs
Recommendations to strengthen IMPACT programs
Perceived capacity of IMPACT staff
Perceived quality of outputs/programs
Recommendations to strengthen IMPACT programs
Humanitarian stakeholders are engaged in IMPACT programs throughout the research cycle
Number and/or percentage of humanitarian organizations directly contributing to IMPACT programs (providing resources, participating to presentations, etc.)
# of organisations providing resources (i.e. staff, vehicles, meeting space, budget, etc.) for activity implementation Engagement
Monitoring Country team
Engagement_log
Number of partner organisations involved in the planning stages
# of organisations/clusters inputting in research design and joint analysis
Number of partner organisations involved in the planning stages
# of organisations/cl
Number of partner organisations involved in
www.reach-initiative.org 13
usters attending briefings on findings;
the Joint Analysis Workshop
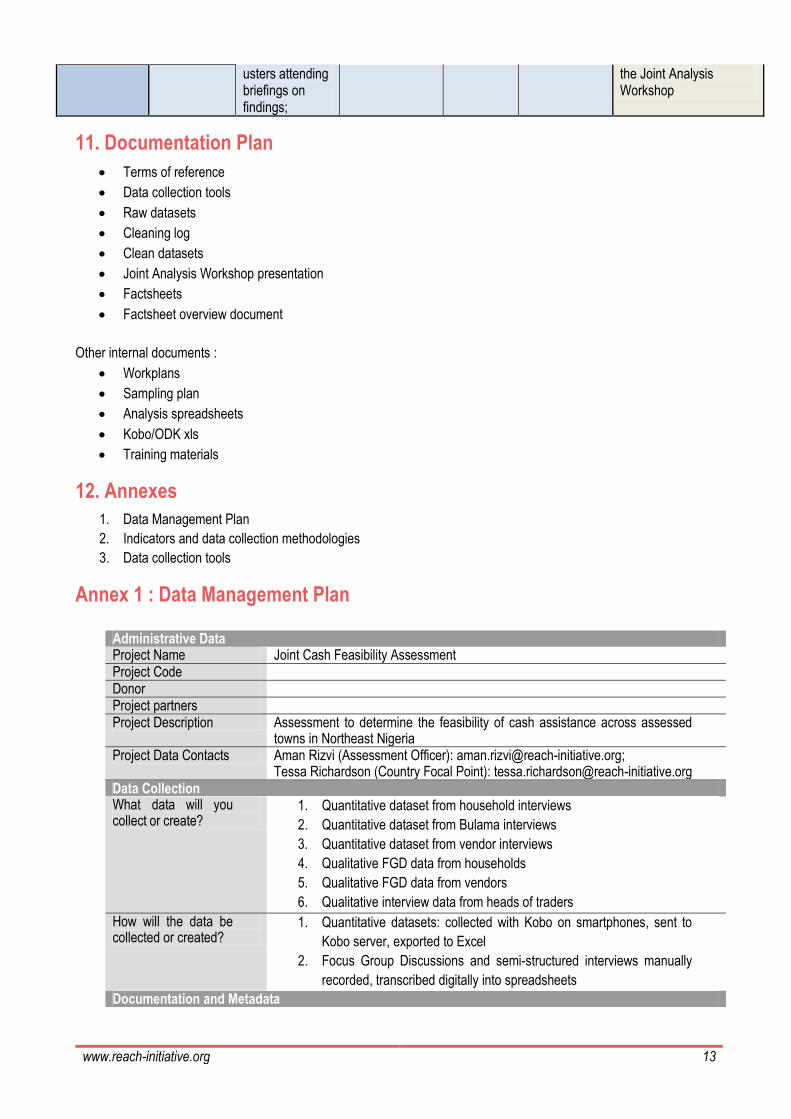
11. Documentation Plan
Terms of reference
Data collection tools
Raw datasets
Cleaning log
Clean datasets
Joint Analysis Workshop presentation
Factsheets
Factsheet overview document
Other internal documents :
Workplans
Sampling plan
Analysis spreadsheets
Kobo/ODK xls
Training materials
12. Annexes
1. Data Management Plan
2. Indicators and data collection methodologies
3. Data collection tools
Annex 1 : Data Management Plan
Administrative Data Project Name Joint Cash Feasibility Assessment Project Code Donor Project partners Project Description Assessment to determine the feasibility of cash assistance across assessed
towns in Northeast Nigeria Project Data Contacts Aman Rizvi (Assessment Officer): [email protected];
Tessa Richardson (Country Focal Point): [email protected] Data Collection What data will you collect or create?
1. Quantitative dataset from household interviews
2. Quantitative dataset from Bulama interviews
3. Quantitative dataset from vendor interviews
4. Qualitative FGD data from households
5. Qualitative FGD data from vendors
6. Qualitative interview data from heads of traders
How will the data be collected or created?
1. Quantitative datasets: collected with Kobo on smartphones, sent to
Kobo server, exported to Excel
2. Focus Group Discussions and semi-structured interviews manually
recorded, transcribed digitally into spreadsheets
Documentation and Metadata

www.reach-initiative.org 14
What documentation and metadata will accompany the data?
Date, time, UUID, enumerator name, (for vendor forms) vendor name. Data cleaning
logs will be kept.
Ethics and Legal Compliance How will you manage any ethical issues?
Liaise with partners on the ground, explain the assessment, and ensure that the
principles of ethical data collection are adhered to.
How will you manage copyright and Intellectual Property Rights (IPR) issues?
Outputs will be provided to the public on the REACH Resource Centre and circulated by the CWG.
Storage and Backup How will the data be stored and backed up during the research?
Data from the household interviews, KI interviews and collective shelter surveys is
uploaded to Kobo before being downloaded as an excel sheet. Any personal data
collected will be stored only on password-protected servers and devices. The shared
dataset will be anonymised.
All data will be backed up on the REACH dropbox system.
How will you manage access and security?
Access to the dropbox is only available to REACH staff who are part of the Africa
regional team. The Kobo server and REACH staff computers are protected with
passwords.
Selection and Preservation Which data should be retained, shared, and/or preserved?
Final copies with data cleaning logs will be kept.
What is the long-term preservation plan for the dataset?
Long term, will be kept on the dropbox system. Anonymised version will be
shared with partners and uploaded to the resource centre.
Data Sharing How will you share the data?
Final outputs will be shared to the public via the REACH Resource Centre, and
an anonymised dataset will be shared on request.
Are any restrictions on data sharing required?
No personal details identifying interviewees will be shared.
Responsibilities Who will be responsible for data management?
The AO and DBO will be responsible for the cleaning, documentation and
uploading data.
Adapted from:
DCC. (2013). Checklist for a Data Management Plan. v.4.0. Edinburgh: Digital Curation
Centre. Available online: http://www.dcc.ac.uk/resources/data-management-plans
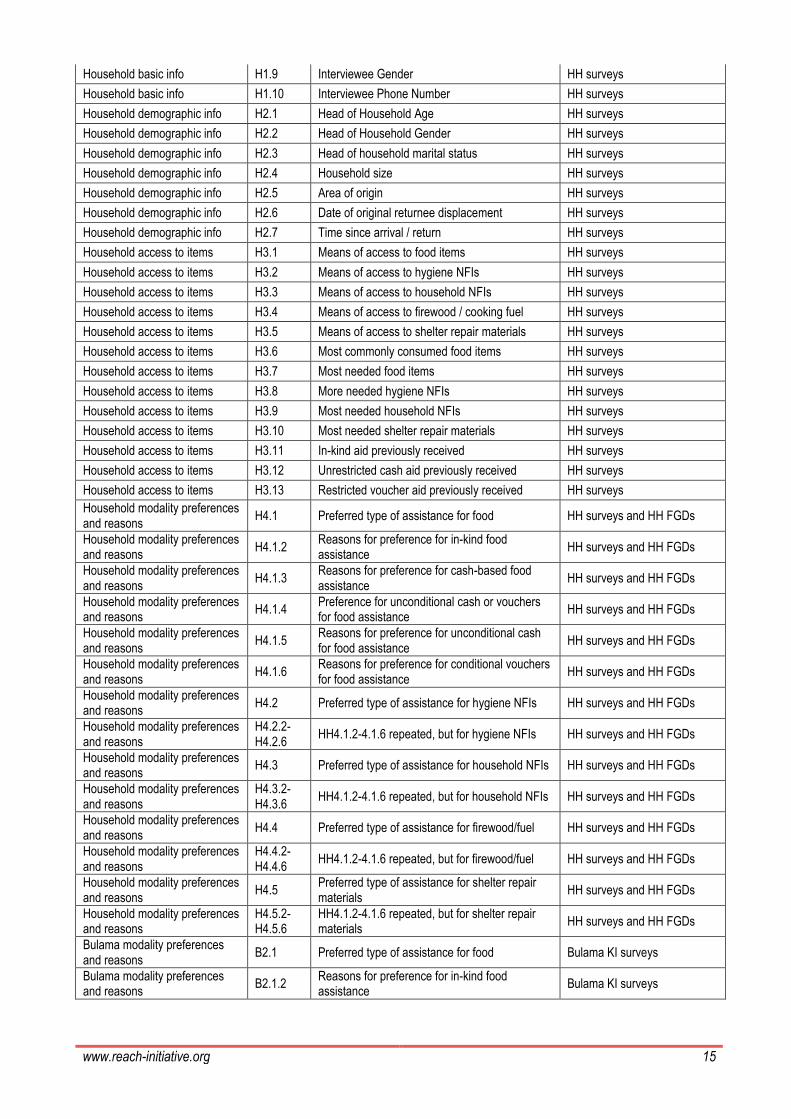
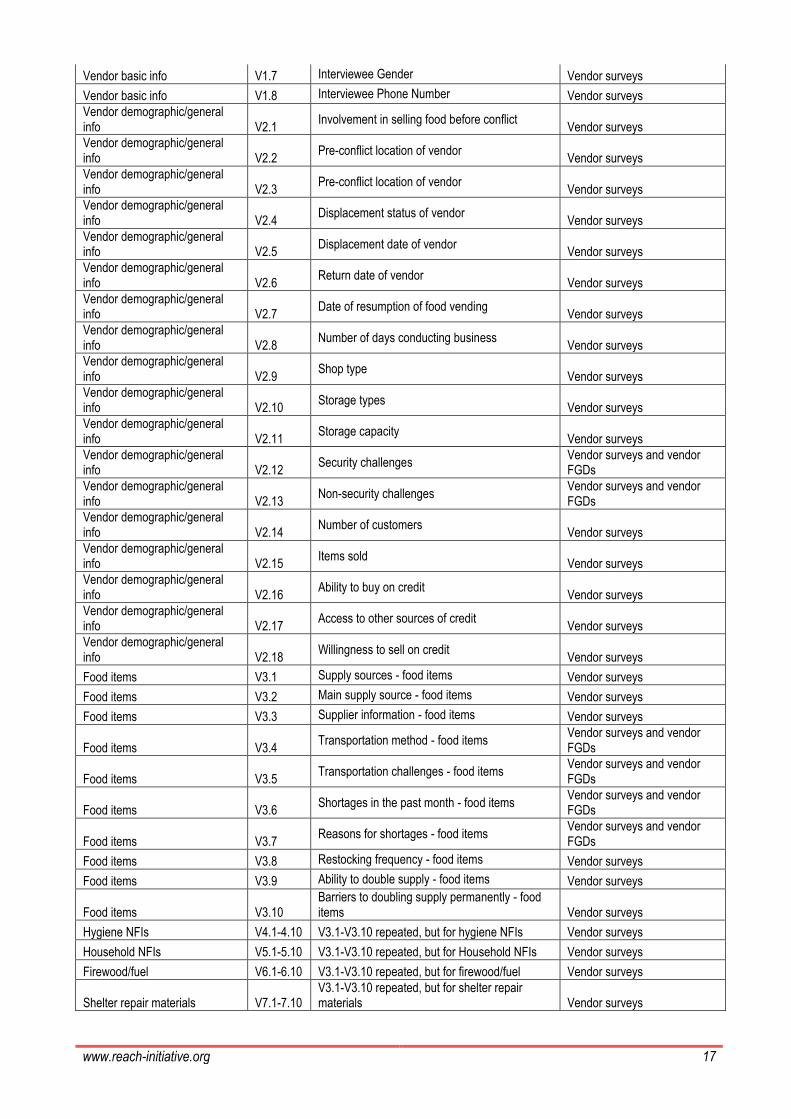
Annex 2 : Indicator list with data collection methodologies
Indicator category IN # Indicator / Variable Data collection method
Household basic info H1.1 Enumerator Info HH surveys
Household basic info H1.2 Interview location HH surveys
Household basic info H1.3 Household displacement status HH surveys
Household basic info H1.4 Settlement Type HH surveys
Household basic info H1.5 GPS location HH surveys
Household basic info H1.6 Head of Household HH surveys
Household basic info H1.7 Relationship to Head of Household HH surveys
Household basic info H1.8 Interviewee Age HH surveys
www.reach-initiative.org 15
Household basic info H1.9 Interviewee Gender HH surveys
Household basic info H1.10 Interviewee Phone Number HH surveys
Household demographic info H2.1 Head of Household Age HH surveys
Household demographic info H2.2 Head of Household Gender HH surveys
Household demographic info H2.3 Head of household marital status HH surveys
Household demographic info H2.4 Household size HH surveys
Household demographic info H2.5 Area of origin HH surveys
Household demographic info H2.6 Date of original returnee displacement HH surveys
Household demographic info H2.7 Time since arrival / return HH surveys
Household access to items H3.1 Means of access to food items HH surveys
Household access to items H3.2 Means of access to hygiene NFIs HH surveys
Household access to items H3.3 Means of access to household NFIs HH surveys
Household access to items H3.4 Means of access to firewood / cooking fuel HH surveys
Household access to items H3.5 Means of access to shelter repair materials HH surveys
Household access to items H3.6 Most commonly consumed food items HH surveys
Household access to items H3.7 Most needed food items HH surveys
Household access to items H3.8 More needed hygiene NFIs HH surveys
Household access to items H3.9 Most needed household NFIs HH surveys
Household access to items H3.10 Most needed shelter repair materials HH surveys
Household access to items H3.11 In-kind aid previously received HH surveys
Household access to items H3.12 Unrestricted cash aid previously received HH surveys
Household access to items H3.13 Restricted voucher aid previously received HH surveys
Household modality preferences and reasons
H4.1 Preferred type of assistance for food HH surveys and HH FGDs
Household modality preferences and reasons
H4.1.2 Reasons for preference for in-kind food assistance
HH surveys and HH FGDs
Household modality preferences and reasons
H4.1.3 Reasons for preference for cash-based food assistance
HH surveys and HH FGDs
Household modality preferences and reasons
H4.1.4 Preference for unconditional cash or vouchers for food assistance
HH surveys and HH FGDs
Household modality preferences and reasons
H4.1.5 Reasons for preference for unconditional cash for food assistance
HH surveys and HH FGDs
Household modality preferences and reasons
H4.1.6 Reasons for preference for conditional vouchers for food assistance
HH surveys and HH FGDs
Household modality preferences and reasons
H4.2 Preferred type of assistance for hygiene NFIs HH surveys and HH FGDs
Household modality preferences and reasons
H4.2.2-H4.2.6
HH4.1.2-4.1.6 repeated, but for hygiene NFIs HH surveys and HH FGDs
Household modality preferences and reasons
H4.3 Preferred type of assistance for household NFIs HH surveys and HH FGDs
Household modality preferences and reasons
H4.3.2-H4.3.6
HH4.1.2-4.1.6 repeated, but for household NFIs HH surveys and HH FGDs
Household modality preferences and reasons
H4.4 Preferred type of assistance for firewood/fuel HH surveys and HH FGDs
Household modality preferences and reasons
H4.4.2-H4.4.6
HH4.1.2-4.1.6 repeated, but for firewood/fuel HH surveys and HH FGDs
Household modality preferences and reasons
H4.5 Preferred type of assistance for shelter repair materials
HH surveys and HH FGDs
Household modality preferences and reasons
H4.5.2-H4.5.6
HH4.1.2-4.1.6 repeated, but for shelter repair materials
HH surveys and HH FGDs
Bulama modality preferences and reasons
B2.1 Preferred type of assistance for food Bulama KI surveys
Bulama modality preferences and reasons
B2.1.2 Reasons for preference for in-kind food assistance
Bulama KI surveys

www.reach-initiative.org 16
Bulama modality preferences and reasons
B2.1.3 Reasons for preference for cash-based food assistance
Bulama KI surveys
Bulama modality preferences and reasons
B2.1.4 Preference for unconditional cash or vouchers for food assistance
Bulama KI surveys
Bulama modality preferences and reasons
B2.1.5 Reasons for preference for unconditional cash for food assistance
Bulama KI surveys
Bulama modality preferences and reasons
B2.1.6 Reasons for preference for conditional vouchers for food assistance
Bulama KI surveys
Bulama modality preferences and reasons
B2.2 Preferred type of assistance for hygiene NFIs Bulama KI surveys
Bulama modality preferences and reasons
B2.2.2-B2.2.6
HB2.1.2-4.1.6 repeated, but for hygiene NFIs Bulama KI surveys
Bulama modality preferences and reasons
B2.3 Preferred type of assistance for Bulama NFIs Bulama KI surveys
Bulama modality preferences and reasons
B2.3.2-B2.3.6
HB2.1.2-4.1.6 repeated, but for Bulama NFIs Bulama KI surveys
Bulama modality preferences and reasons
B2.4 Preferred type of assistance for firewood/fuel Bulama KI surveys
Bulama modality preferences and reasons
B2.4.2-B2.4.6
HB2.1.2-4.1.6 repeated, but for firewood/fuel Bulama KI surveys
Bulama modality preferences and reasons
B2.5 Preferred type of assistance for shelter repair materials
Bulama KI surveys
Bulama modality preferences and reasons
B2.5.2-B2.5.6
HB2.1.2-4.1.6 repeated, but for shelter repair materials
Bulama KI surveys
Household access to cash H5.1 Cash storage safety HH surveys
Household access to cash H5.2 Reasons why cash storage not safe HH surveys
Household access to cash H5.3 Cash carrying safety HH surveys
Household access to cash H5.4 Reasons why cash carrying not safe HH surveys
Household access to cash H5.5 Access to credit from vendors HH surveys and HH FGDs
Household access to cash H5.6 Access to credit other than from vendors HH surveys and HH FGDs
Household access to cash H5.7 Access to mobile phones HH surveys
Household access to cash H5.8 Ability to use mobile phones HH surveys
Household access to cash H5.9 Access to mobile phone network coverage HH surveys
Household access to cash HF1 Openness to mobile money transfers HH FGDs
Household access to markets H6.1 Markets and traders used HH surveys
Household access to markets H6.2 Time to market HH surveys
Household access to markets H6.3 Frequency of market visits HH surveys
Household access to markets H6.4 Security risks en route to market HH surveys
Household access to markets H6.5 Security risks at market HH surveys
Household access to markets H6.6 Non-security barriers to market access HH surveys
Household access to markets HF2 Household behaviour modification due to market access barriers
HH FGDs
Household access to markets H6.7 Availability of items at markets HH surveys and HH FGDs
Household access to markets H6.8 Affordability of items at markets HH surveys and HH FGDs
Household access to markets HF3 Price stability at markets HH FGDs
Gender aspects H7.1 Access barriers for women to visit markets HH surveys and HH FGDs
Gender aspects H7.2 Women's involvement in household resource allocation
HH surveys and HH FGDs
Vendor basic info V1.1 Enumerator Info Vendor surveys
Vendor basic info V1.2 Interview location Vendor surveys
Vendor basic info V1.3 Market location Vendor surveys
Vendor basic info V1.4 Food vendor name Vendor surveys
Vendor basic info V1.5 Shop name Vendor surveys
Vendor basic info V1.6 GPS location Vendor surveys
www.reach-initiative.org 17
Vendor basic info V1.7 Interviewee Gender Vendor surveys
Vendor basic info V1.8 Interviewee Phone Number Vendor surveys
Vendor demographic/general info V2.1
Involvement in selling food before conflict Vendor surveys
Vendor demographic/general info V2.2
Pre-conflict location of vendor Vendor surveys
Vendor demographic/general info V2.3
Pre-conflict location of vendor Vendor surveys
Vendor demographic/general info V2.4
Displacement status of vendor Vendor surveys
Vendor demographic/general info V2.5
Displacement date of vendor Vendor surveys
Vendor demographic/general info V2.6
Return date of vendor Vendor surveys
Vendor demographic/general info V2.7
Date of resumption of food vending Vendor surveys
Vendor demographic/general info V2.8
Number of days conducting business Vendor surveys
Vendor demographic/general info V2.9
Shop type Vendor surveys
Vendor demographic/general info V2.10
Storage types Vendor surveys
Vendor demographic/general info V2.11
Storage capacity Vendor surveys
Vendor demographic/general info V2.12
Security challenges Vendor surveys and vendor FGDs
Vendor demographic/general info V2.13
Non-security challenges Vendor surveys and vendor FGDs
Vendor demographic/general info V2.14
Number of customers Vendor surveys
Vendor demographic/general info V2.15
Items sold Vendor surveys
Vendor demographic/general info V2.16
Ability to buy on credit Vendor surveys
Vendor demographic/general info V2.17
Access to other sources of credit Vendor surveys
Vendor demographic/general info V2.18
Willingness to sell on credit Vendor surveys
Food items V3.1 Supply sources - food items Vendor surveys
Food items V3.2 Main supply source - food items Vendor surveys
Food items V3.3 Supplier information - food items Vendor surveys
Food items V3.4 Transportation method - food items
Vendor surveys and vendor FGDs
Food items V3.5 Transportation challenges - food items
Vendor surveys and vendor FGDs
Food items V3.6 Shortages in the past month - food items
Vendor surveys and vendor FGDs
Food items V3.7 Reasons for shortages - food items
Vendor surveys and vendor FGDs
Food items V3.8 Restocking frequency - food items Vendor surveys
Food items V3.9 Ability to double supply - food items Vendor surveys
Food items V3.10 Barriers to doubling supply permanently - food items Vendor surveys
Hygiene NFIs V4.1-4.10 V3.1-V3.10 repeated, but for hygiene NFIs Vendor surveys
Household NFIs V5.1-5.10 V3.1-V3.10 repeated, but for Household NFIs Vendor surveys
Firewood/fuel V6.1-6.10 V3.1-V3.10 repeated, but for firewood/fuel Vendor surveys
Shelter repair materials V7.1-7.10 V3.1-V3.10 repeated, but for shelter repair materials Vendor surveys

www.reach-initiative.org 18
Supply and transportation VF1 Methods of choosing suppliers Vendor FGDs
Ability to of market to expand VF2 Estimated amount by which the market can increase supply Vendor FGDs
Ability to of market to expand VF3 Ability of new people to become vendors Vendor FGDs
Ability to of market to expand VF4 Vendor willingness to re-invest profits Vendor FGDs
Informal systems operating in markets VF5 Presence and role of traders association
Vendor FGDs and head of trader interviews
Informal systems operating in markets VF6 Presence of informal bartering between vendors
Vendor FGDs and head of trader interviews
Informal systems operating in markets VF7
Presence of commercial dispute resolution mechanisms
Vendor FGDs and head of trader interviews
Informal systems operating in markets VF8 Presence and barriers for women vendors
Vendor FGDs and head of trader interviews
Informal systems operating in markets VF9
Payments necessary for vendors to sell in the market
Vendor FGDs and head of trader interviews
History of the market VH1 Recent changes in vendor numbers in the market Head of trader interviews
History of the market VH2 Impact of conflict on the market Head of trader interviews
History of the market VH3 Recent changes in overall market demand Head of trader interviews
Annex 3 : Data collection tools
Structured interview questionnaires
The questionnaire for the individual household interviews can be found here.
The questionnaire for the Bulama interviews can be found here.
The questionnaire for the individual vendor interviews can be found here.
Focus group discussion and semi-structured interview questionnaires8
Household FGD questionnaire
SECTION I: PREFERENCES Research questions: What modalities do beneficiaries prefer? Why do beneficiaries prefer one modality over another? Overall question What would be your preferred means of receiving the following types of aid: 1) food, 2) hygiene NFIs, 3) household NFIs, 4) firewood/fuel, 5) shelter repair items? Why? Explain what each of the below options mean (this is especially important for the vouchers) before you record their answers Write the number of people preferring each modality in the table below
Answer Food Hygiene NFIs Household NFIs Firewood/fuel Shelter repair items
In-kind
Unrestricted cash
Vouchers
Probing questions
What could be a benefit of receiving aid through [each option]? What could be a risk of receiving aid through [each option]?
Why do you like [each option they say they like]? Why do you not like [options they do not choose as the preferred option]?
8 Instructions to facilitators have been excluded from the questionnaires for readability in this document

www.reach-initiative.org 19
(If preferences are not the same for all 5 types of items): Why do you have one preference for some items but a different preference for other items?
Have you had positive experiences with any of these food aid modalities in the past?
Have you had negative experiences with any of these food aid modalities in the past?
[If the majority prefer unrestricted cash] Other than unrestricted cash, do you prefer vouchers or in-kind aid? Why do you have this preference?
SECTION II: MARKETS Research questions: What are the main barriers to accessing food from markets? How able would the market be to meet growing demand in case of an increased cash response?
1. Which items in the following categories are generally affordable for you at markets in this town? Which items that you would like to buy are generally unaffordable? 1) food, 2) hygiene NFIs, 3) household NFIs, 4) firewood/fuel, 5) shelter repair items.
2. Are prices at markets generally stable? If not, what do you think has caused prices to fluctuate?
3. If you had enough cash to buy it, would there be enough of the following items at markets in this town to meet your
household needs? 1) food, 2) hygiene NFIs, 3) household NFIs, 4) firewood/fuel, 5) shelter repair items Note: This question is about quantities rather than affordability
If not, which items do you need but are often unavailable?
Are there certain periods of the day / week / month / year when there not enough items in the market? Please tell us about these periods and which items are most affected.
4. If you got all of these items from the market (and not through any other sources), do you think there would still be
enough to meet your household needs? Why or why not? o Probing questions
If more people bought food/NFIs/firewood/shelter repair items from the market, do you think the existing shops would be able to sell more food than they do now? Why or why not?
If more people bought food/NFIs/firewood/shelter repair items from the market, do you think more people would become vendors? To your understanding, how easy is it for new people to start selling food?
What problems do you think the market would face overall in expanding to meet people’s needs?
5. Do you face security risks on the route to markets, or at markets? What risks do you face?
(For participants that respond yes) Do you go to markets less frequently than you would prefer because of these security risks? What other precautions do you take to reduce these risks?
SECTION III: CASH Research question: What access do households have to cash, phones, and credit?
1. Do you have access in this town to any means of receiving credit or cash? If so, how do people receive cash or
credit? (e.g. bank loans, borrowing from friends/relatives, local money agent, mobile money transfers, traditional
savings associations)
o Probing questions
What do you do when you don’t have enough cash? Are there people you can rely on in those
situations?
If you receive money from relatives outside of this town, how do they send it to you?
2. Have you previously received money through mobile money transfers? How effective do you think this would be as
a way of receiving money?
o Do you own a mobile phone?
o Is there generally network coverage in this town?
www.reach-initiative.org 20
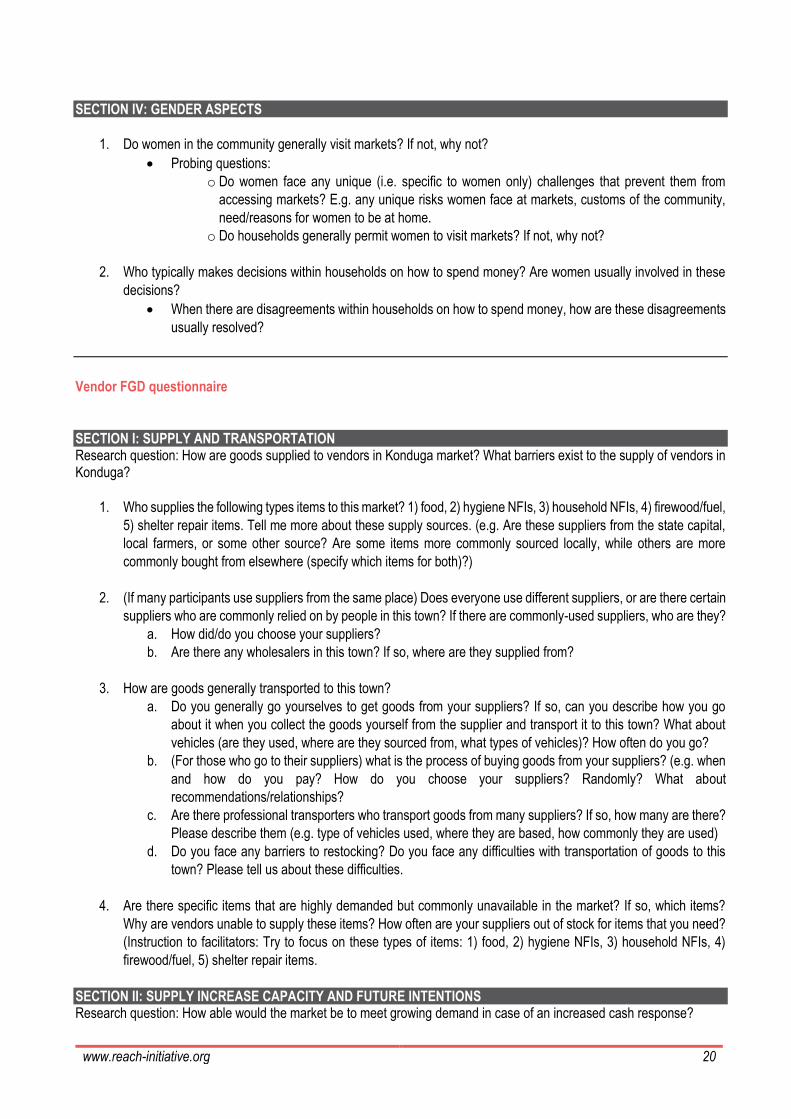
SECTION IV: GENDER ASPECTS
1. Do women in the community generally visit markets? If not, why not?
Probing questions:
o Do women face any unique (i.e. specific to women only) challenges that prevent them from
accessing markets? E.g. any unique risks women face at markets, customs of the community,
need/reasons for women to be at home.
o Do households generally permit women to visit markets? If not, why not?
2. Who typically makes decisions within households on how to spend money? Are women usually involved in these
decisions?
When there are disagreements within households on how to spend money, how are these disagreements
usually resolved?
Vendor FGD questionnaire
SECTION I: SUPPLY AND TRANSPORTATION Research question: How are goods supplied to vendors in Konduga market? What barriers exist to the supply of vendors in Konduga?
1. Who supplies the following types items to this market? 1) food, 2) hygiene NFIs, 3) household NFIs, 4) firewood/fuel,
5) shelter repair items. Tell me more about these supply sources. (e.g. Are these suppliers from the state capital,
local farmers, or some other source? Are some items more commonly sourced locally, while others are more
commonly bought from elsewhere (specify which items for both)?)
2. (If many participants use suppliers from the same place) Does everyone use different suppliers, or are there certain
suppliers who are commonly relied on by people in this town? If there are commonly-used suppliers, who are they?
a. How did/do you choose your suppliers?
b. Are there any wholesalers in this town? If so, where are they supplied from?
3. How are goods generally transported to this town?
a. Do you generally go yourselves to get goods from your suppliers? If so, can you describe how you go
about it when you collect the goods yourself from the supplier and transport it to this town? What about
vehicles (are they used, where are they sourced from, what types of vehicles)? How often do you go?
b. (For those who go to their suppliers) what is the process of buying goods from your suppliers? (e.g. when
and how do you pay? How do you choose your suppliers? Randomly? What about
recommendations/relationships?
c. Are there professional transporters who transport goods from many suppliers? If so, how many are there?
Please describe them (e.g. type of vehicles used, where they are based, how commonly they are used)
d. Do you face any barriers to restocking? Do you face any difficulties with transportation of goods to this
town? Please tell us about these difficulties.
4. Are there specific items that are highly demanded but commonly unavailable in the market? If so, which items?
Why are vendors unable to supply these items? How often are your suppliers out of stock for items that you need?
(Instruction to facilitators: Try to focus on these types of items: 1) food, 2) hygiene NFIs, 3) household NFIs, 4)
firewood/fuel, 5) shelter repair items.
SECTION II: SUPPLY INCREASE CAPACITY AND FUTURE INTENTIONS Research question: How able would the market be to meet growing demand in case of an increased cash response?

www.reach-initiative.org 21
1. What are the main security challenges to conducting business that you face? In the past 3 months, how have you sought to cope with security risks and threats? How have you modified the way you run your business? Probing questions (list a, b, and c as examples of behaviour modification if they do not understand the question or are struggling to respond; ask d as an additional question):
a. Do you work only during certain hours? b. Do you avoid certain routes to/from the market? c. Do you stop operations for a period of time after a security incident? d. Have other vendors stopped selling food entirely (i.e. closed their shops permanently) due to security
risks in the past 3 months? What occupations did they switch to instead?
2. What is the maximum amount by which existing vendors in the market could permanently increase the supply of
the following types of items in case of an increase in demand in the future? (1) food, 2) hygiene NFIs, 3) household
NFIs, 4) firewood/fuel, 5) shelter repair item) (Instruction to facilitators: ask respondents to phrase their answers in
terms of current supply, e.g. double current supply, triple current supply, 2.5x, 4x, 10x etc.)
a. What would vendors do in order to increase supply? (e.g. go more often to their suppliers to restock, find
additional suppliers either in elsewhere or locally, hire another vehicle in order to carry more goods back
during each restocking trip)
b. Would it be easier to increase supply for some items more than others? If so, which items and why?
3. What would be the main barriers to increasing supply in order to meet increasing demand?
a. If they do not mention initial cash flow, probe and ask: would vendors have enough initial cash flow to
scale up supply? Do vendors have access to credit that they could use to scale up supply (and then pay
back once they have increased their sales)?
b. If they do mention initial cash flow, ask: if initial cash flow was not a problem, would there be any other
barriers to scaling up supply? (e.g. can’t find enough cars to hire, can’t get access to enough storage
space)
4. If demand from customers in this market greatly increased, do you think former vendors would resume selling
work? Do you think new people would become vendors? Why or why not?
5. What are the main barriers to becoming a food vendor in this town?
6. What specific events do you think would cause you and other vendors to stop selling in this market?
(Instruction to facilitator: this could include security barriers like AOG attacks or road closure, as well as economic
events like price rises, or populations getting food from another source, or a new market/vendors starting business
nearby)
7. If your sales and profits increased, would you make any investments in your business? If so, what types of
investments would you make? (e.g. building/renting a solid structure for the shop, renting more storage space,
stocking more goods) If not, why not – what would you do with the money instead?
SECTION III: FINANCIAL SERVICES AND INFORMAL SYSTEMS
1. Does you supplier ever sell to you on credit? How often do you need to rely on credit from your supplier? Are there
any other conditions attached to this credit? Do you face difficulties in paying back your suppliers?
Do you rely on credit from anyone else other than your supplier? If so, tell us about these additional credit
sources?
Do you have access to any other financial services? (e.g. place to store savings, pooling together
savings/funds with other vendors) If so, what are these services? Who organises and provides these
services?
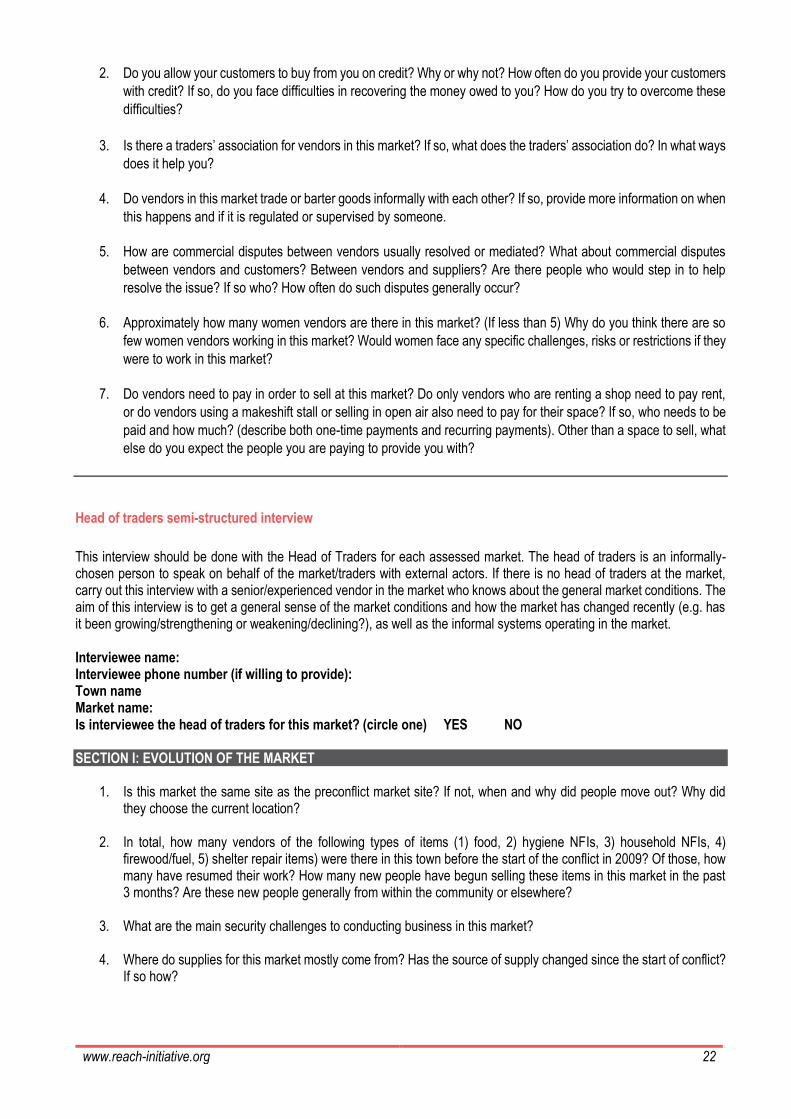
www.reach-initiative.org 22
2. Do you allow your customers to buy from you on credit? Why or why not? How often do you provide your customers
with credit? If so, do you face difficulties in recovering the money owed to you? How do you try to overcome these
difficulties?
3. Is there a traders’ association for vendors in this market? If so, what does the traders’ association do? In what ways
does it help you?
4. Do vendors in this market trade or barter goods informally with each other? If so, provide more information on when
this happens and if it is regulated or supervised by someone.
5. How are commercial disputes between vendors usually resolved or mediated? What about commercial disputes
between vendors and customers? Between vendors and suppliers? Are there people who would step in to help
resolve the issue? If so who? How often do such disputes generally occur?
6. Approximately how many women vendors are there in this market? (If less than 5) Why do you think there are so
few women vendors working in this market? Would women face any specific challenges, risks or restrictions if they
were to work in this market?
7. Do vendors need to pay in order to sell at this market? Do only vendors who are renting a shop need to pay rent,
or do vendors using a makeshift stall or selling in open air also need to pay for their space? If so, who needs to be
paid and how much? (describe both one-time payments and recurring payments). Other than a space to sell, what
else do you expect the people you are paying to provide you with?
Head of traders semi-structured interview
This interview should be done with the Head of Traders for each assessed market. The head of traders is an informally-chosen person to speak on behalf of the market/traders with external actors. If there is no head of traders at the market, carry out this interview with a senior/experienced vendor in the market who knows about the general market conditions. The aim of this interview is to get a general sense of the market conditions and how the market has changed recently (e.g. has it been growing/strengthening or weakening/declining?), as well as the informal systems operating in the market. Interviewee name: Interviewee phone number (if willing to provide): Town name Market name: Is interviewee the head of traders for this market? (circle one) YES NO SECTION I: EVOLUTION OF THE MARKET
1. Is this market the same site as the preconflict market site? If not, when and why did people move out? Why did they choose the current location?
2. In total, how many vendors of the following types of items (1) food, 2) hygiene NFIs, 3) household NFIs, 4)
firewood/fuel, 5) shelter repair items) were there in this town before the start of the conflict in 2009? Of those, how many have resumed their work? How many new people have begun selling these items in this market in the past 3 months? Are these new people generally from within the community or elsewhere?
3. What are the main security challenges to conducting business in this market?
4. Where do supplies for this market mostly come from? Has the source of supply changed since the start of conflict? If so how?
www.reach-initiative.org 23
5. What are the main challenges that vendors face in transporting goods to this town? Are there any major security risks faced during the transportation of goods? If so, what are they?
6. How many vendors rely on wholesalers in this town as an intermediary supplier? How many wholesalers are there
here?
7. Is the market open every day, or only on certain days per week? If so, on which days is it open (or which days are
the market days)? Why these days?
SECTION II: CUSTOMERS AND DEMAND
1. Compared to 3 three months ago, do traders in this market generally sell more or less of the following items? 1) food, 2) hygiene NFIs, 3) household NFIs, 4) firewood/fuel, 5) shelter repair items. How much more/less? (If there was a change) why have the trade volumes changed over 3 months?
2. How many households do you estimate regularly use this market to buy food? Is this more or less 3 months ago?
(If there was a change) why do you think the number of households using the market has changed over the past 3 months?
3. Do you think buyers are generally able to afford goods at market prices? If not, why? SECTION III: FINANCIAL SERVICES AND INFORMAL SYSTEMS
1. Do vendors in this market generally have access to credit? If so, who provides these services? Do vendors operate any savings associations (to help each other save and provide credit)? If so, how are these organised?
2. Is there a traders’ association in this market? If so, what does the traders’ association do? What services does it
provide?
3. How are commercial disputes between vendors usually resolved or mediated? What about commercial disputes
between vendors and customers? Between vendors and suppliers? Are there people who would step in to help
resolve the issue? If so who? How often do such disputes generally occur?
4. Do vendors in this market trade or barter goods informally with each other? If so, provide more information on when
this happens and if it is regulated or supervised by someone.
5. Approximately how many women vendors are there in this market? [If not very many, e.g. less than 5] Why do you
think there are so few women vendors working in this market? Would women face any specific challenges, risks or
restrictions if they were to work in this market?