Embed Size (px)
Citation preview

Research Space Productivity Study For the period of September 1, 2013 to August 31, 2014
March 6, 2015

TAMUCC Research Space Productivity Study March 6, 2015 2
TABLE OF CONTENTS
Executive Summary
Overview
Methodology and Assumptions
Annual Sponsored Projects Expenditures-By Entity
Annual Sponsored Projects Expenditures-By College/Center
Annual Sponsored Projects Expenditures-All Units
Annual Sponsored Projects Expenditures- By Principal Investigator
Funding Ratio
I.
II.
III.
IV.
V.
VI.
VII.
VIII.
3
5
6
9
13
16
20
23

TAMUCC Research Space Productivity Study March 6, 2015 3
Executive Summary
Annual direct sponsored projects expenditures have increased at 5% compound annual growth rate over the last 7 years,
from $10.9 million to $15.4 million. Federal Sponsors have been the largest source of funding for the past 7 years. For
Fiscal Year 2014, 65.6% of total funding sources came from federal sponsors.
During Fiscal Year 2014, the College of Science and Engineering accounted for 31% Sponsored Project Expenditures
and 53% of research space, while the Harte Research Institute represented 29% of expenditures and 21% of research
space. Following the Harte Research Institute, the Conrad Blucher Institute had 17% of total Sponsored Projects
Expenditures and 9% of assignable research space. All other colleges and departments accounted for 23% of Sponsored
Projects Expenditures and 17% of research space.
The number of Tenured/Tenure-Track Principal Investigators that had Sponsored Projects Expenditures for FY 2014 was
led by the College of Science & Engineering with 17 PIs (52%), followed by 7 PIs from Harte Research Institute (21%) and
5 PIs from the College of Liberal Arts (15%). All other colleges and departments combined accounted for 12% (4 PIs) of
Sponsored Projects Expenditures. The Harte Research Institute had the highest average of Sponsored Projects
Expenditures per PI at $364 thousand and also leads among Colleges and Centers with 1,369 average Square Footage
per PI.

TAMUCC Research Space Productivity Study March 6, 2015 4
Executive Summary
Among Principal Investigators, Dr. Dulal Kar leads the ranking of Top 10 Tenured/Tenure-Track Principal Investigators
with higher Sponsored Project Expenditures per Square Footage in Fiscal Year 2014. Dr. Kar had an average of $4
thousand in annual project expenditures per square foot, while Dr. Suzzette Chopin followed with $2.7 thousand. Dr.
Fereshteh Billiot presented $1.2 thousand of Sponsored Project Expenditures per Square Footage followed by Dr. Scott
King with $668 thousand and Dr. David Bridges $609 thousand. Dr. James Gibeaut from Harte Research Institute
presented the highest total Sponsored Project Expenditures, presenting $1.7 million and Dr. Gary Jeffress from the
Conrad Blucher Institute followed with total Sponsored Project Expenditures of $1.4 million. Dr. Gerardo Moreno
presented $1.1 million of Sponsored Project Expenditures. Three Principal Investigators presented Sponsored Project
Expenditures greater than $500 thousand but less than $1 million. Twenty-nine PIs had Sponsored Project Expenditures
greater than $100 thousand but less than $500 thousand and 45 PIs presented research expenditures less than $100
thousand for Fiscal Year 2014.
The average Sponsored Projects Expenditures per Square Footage for all Units during Fiscal Year 2014 was $161 while
the average for Colleges and Centers was $132. The Conrad Blucher Institute had the highest Sponsored Projects
Expenditures per Square Footage with $309 followed by Harte Research Institute with $228. The College of Science and
Engineering presented $93 Sponsored Project Expenditures per Square footage. The College of Education, College of
Nursing and Health Sciences, College of Liberal Arts and College of Science and Engineering presented Sponsored
Projects Expenditures per Square Footage below the total average for Colleges and Centers.

TAMUCC Research Space Productivity Study March 6, 2015 5
Overview
Fiscal Year
Sponsored
Project
Expenditures
Considers all Sponsored Project accounts administered by RCO.
Research, Instruction, Public Service, Scholarship and Fellowships,
Student Services and Academic Support.
All Sponsored Projects Expenditures including Indirect Costs.
Project
Accounts
Project
Functions
Time Period
Expenditures
Categories
Space Use was prorated for cases where space was shared among 2 or
more Principal Investigators.
TAMUCC
Facilities
Inventory
Report
Obtained from https://www1.thecb.state.tx.us/apps/facinv/FacSearchBldg.cfm for 2014.
Obtained from
https://www1.thecb.state.tx.us/apps/facinv/FacSearchRoom.cfm for 2014.
Retrieved from Appendices to the Reporting and Procedures Manuals for
Texas Universities-Appendix F, published by THECB, Summer 2012.
Building List
Room List
Space Use
Codes
Description
Net Assignable
Square Foot
Research Space is short of supply and it has become critically important to effectively manage it in our research effort. The
Division of Research, Commercialization and Outreach developed this annual report as an ongoing effort to generate data
required for decision-making and planning. The report considers the following sources of information:

TAMUCC Research Space Productivity Study March 6, 2015 6
Methodology
•Request space information by PIs to Colleges, Centers and VPs.
•Review consistency of information
•Determine Study Assumptions
Data Gathering
•Obtain Facilities Inventory Report
•Retrieve Sponsored Projects Expenditures from FAMIS Accounting System
•Analyze correlation of information
Data Analysis •Merge data
•Review for consistency
•Present results
Report Development
TAMUCC Research Space Productivity Study March 6, 2015 7
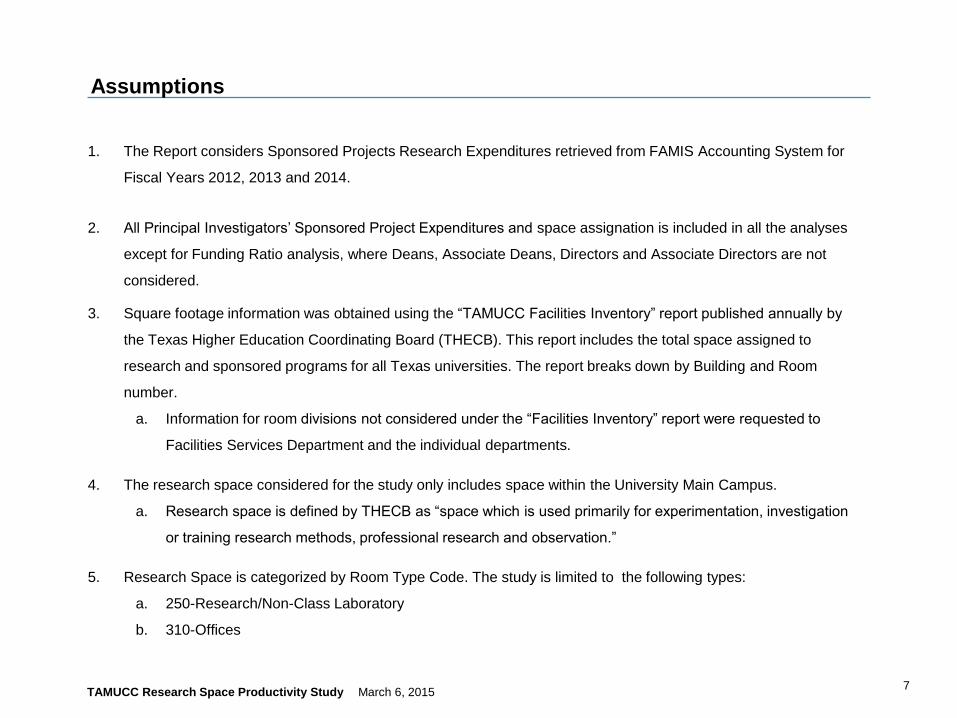
Assumptions
1. The Report considers Sponsored Projects Research Expenditures retrieved from FAMIS Accounting System for
Fiscal Years 2012, 2013 and 2014.
2. All Principal Investigators’ Sponsored Project Expenditures and space assignation is included in all the analyses
except for Funding Ratio analysis, where Deans, Associate Deans, Directors and Associate Directors are not
considered.
3. Square footage information was obtained using the “TAMUCC Facilities Inventory” report published annually by
the Texas Higher Education Coordinating Board (THECB). This report includes the total space assigned to
research and sponsored programs for all Texas universities. The report breaks down by Building and Room
number.
a. Information for room divisions not considered under the “Facilities Inventory” report were requested to
Facilities Services Department and the individual departments.
4. The research space considered for the study only includes space within the University Main Campus.
a. Research space is defined by THECB as “space which is used primarily for experimentation, investigation
or training research methods, professional research and observation.”
5. Research Space is categorized by Room Type Code. The study is limited to the following types:
a. 250-Research/Non-Class Laboratory
b. 310-Offices

TAMUCC Research Space Productivity Study March 6, 2015 8
Assumptions
5. Colleges and Centers submitted the space assignation by Principal Investigator and Department.
a. When a research space is shared among multiple researchers, an estimation of percentage usage
by Principal Investigator was requested to departments.
b. If a research space had academic and research use, an estimated percentage of the research
portion is assigned to the Principal Investigator.
6. Researchers with only office space are assigned 100% of the space, unless otherwise specified.
7. Research space used by Undergraduate Assistants, Graduate Assistants and Post-Docs are assigned to
the Principal Investigator who is the primary mentor and/or funding the position.
8. Abbreviations used on the report:
ASPE: Annual Sponsored Projects Expenditures
ASF : Assigned Square Feet
PI : Principal Investigator

TAMUCC Research Space Productivity Study March 6, 2015 9
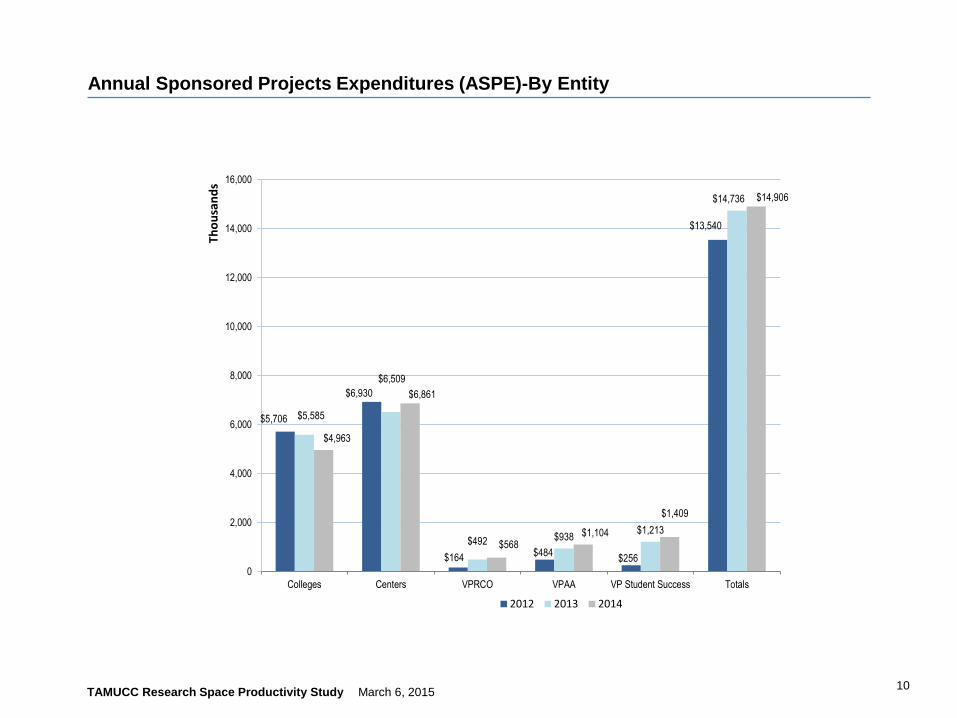
Annual Sponsored Projects Expenditures (ASPE)-By Entity
Entity 2012 2013 2014
ASPE 5,706,243$ 5,585,303$ 4,962,780$
ASF 56,357 56,357 62,212
ASPE/ASF 101$ 99$ 80$
ASPE 6,930,078$ 6,508,700$ 6,861,475$
ASF 15,638 15,638 27,250
ASPE/ASF 443$ 416$ 252$
ASPE 164,301$ 491,600$ 568,220$
ASF 537 537 358
ASPE/ASF 306$ 915$ 1,587$
ASPE 483,508$ 937,536$ 1,104,497$
ASF 1,509 1,509 632
ASPE/ASF 320$ 621$ 1,748$
ASPE 255,826$ 1,213,255$ 1,408,914$
ASF 3,336 3,336 2,416
ASPE/ASF 77$ 364$ 583$
ASPE 13,539,955$ 14,736,393$ 14,905,885$
ASF 77,376 77,376 92,868
ASPE/ASF 175$ 190$ 161$
Totals
Colleges
Centers
VPRCO
VPAA
VP Student Success
TAMUCC Research Space Productivity Study March 6, 2015 10
Annual Sponsored Projects Expenditures (ASPE)-By Entity
$5,706
$6,930
$164 $484 $256
$13,540
$5,585
$6,509
$492 $938 $1,213
$14,736
$4,963
$6,861
$568 $1,104
$1,409
$14,906
0
2,000
4,000
6,000
8,000
10,000
12,000
14,000
16,000
Colleges Centers VPRCO VPAA VP Student Success Totals
Tho
usa
nd
s
2012 2013 2014
TAMUCC Research Space Productivity Study March 6, 2015 11
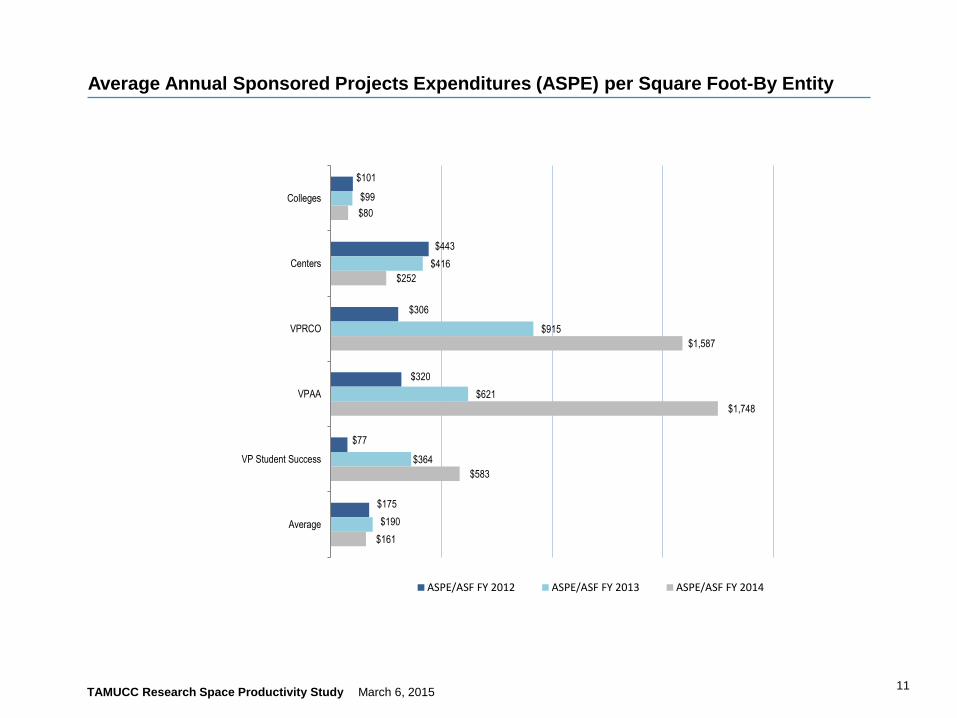
Average Annual Sponsored Projects Expenditures (ASPE) per Square Foot-By Entity
$101
$443
$306
$320
$77
$175
$99
$416
$915
$621
$364
$190
$80
$252
$1,587
$1,748
$583
$161
Colleges
Centers
VPRCO
VPAA
VP Student Success
Average
ASPE/ASF FY 2012 ASPE/ASF FY 2013 ASPE/ASF FY 2014

TAMUCC Research Space Productivity Study March 6, 2015 12
Expenditures and Research Space FY 2014-By Entity
Distribution Sponsored Projects Expenditures
Distribution Assignable Square Feet
Colleges, 33%
Centers, 46%
VPRCO, 4%
VPAA, 7%
VP Student Success, 9%
Colleges, 67%
Centers, 29%
VPRCO, 0%
VPAA, 1% VP Student
Success, 3%

TAMUCC Research Space Productivity Study March 6, 2015 13
Annual Sponsored Projects Expenditures-By College or Center
Averages
College/Center
Annual
Sponsored
Projects
Expenditures
(ASPE) FY
Annual
Sponsored
Projects
Expenditures
(ASPE) FY
Annual
Sponsored
Projects
Expenditures
(ASPE) FY
Assigned
Square Feet
(ASF)2012-2013
Assigned
Square Feet
(ASF)FY 2014
ASPE/ASF
FY 2012
ASPE/ASF
FY 2013
ASPE/ASF
FY 2014
Conrad Blucher
Institute3,158,723$ 2,336,533$ 2,492,666$ 7,558 8,079 418$ 309$ 309$
College of Education 1,227,575$ 1,032,661$ 167,364$ 5,604 6,790 219$ 184$ 25$
College of Liberal
Arts125,157$ 189,040$ 144,328$ 2,608 2,643 48$ 72$ 55$
College of Nursing
and Health Sciences1,351,646$ 795,222$ 49,741$ 5,488 3,174 246$ 145$ 16$
College of Science &
Engineering3,001,865$ 3,568,380$ 4,601,347$ 42,656 49,606 70$ 84$ 93$
Harte Research
Institute3,771,355$ 4,172,166$ 4,368,809$ 8,080 19,171 467$ 516$ 228$
Totals 12,636,321$ 12,094,002$ 11,824,254$ 71,995 89,462 176$ 168$ 132$

TAMUCC Research Space Productivity Study March 6, 2015 14
Annual Sponsored Projects Expenditures per Square Foot-By College or Center
$418
$219
$48
$246
$70
$467
$176
$309
$184
$72
$145
$84
$516
$168
$309
$25
$55
$16
$93
$228
$132
Conrad Blucher Institute
College of Education
College of Liberal Arts
College of Nursing and Health Sciences
College of Science & Engineering
Harte Research Institute
Average
ASPE/ASF FY 2012 ASPE/ASF FY 2013 ASPE/ASF FY 2014

TAMUCC Research Space Productivity Study March 6, 2015 15
Expenditures and Research Space FY 2014-By College or Center
Distribution Assignable Square Feet Distribution Assignable Square Feet by
Space Type
Conrad Blucher Institute, 9% College of
Education, 8%
College of Liberal Arts, 3%
College of Nursing and Health
Sciences, 4%
College of Science & Engineering,
55%
Harte Research Institute, 21%
Class Laboratory, 5%
Individual Study Laboratory, 2%
Office, 39%
Office Service, 2%
Research/Non-Class Laboratory,
47%
Research/Non-Class Laboratory
Service, 6%
Study Space, 0% Stack, 1%

TAMUCC Research Space Productivity Study March 6, 2015 16
Annual Sponsored Projects Expenditures (ASPE)- All Units
Averages
College/Center ASPE FY 2012 ASPE FY 2013 ASPE FY 2014
Assigned
Square Feet
(ASF) 2012-
2013
Assigned
Square Feet
(ASF) FY 2014
ASPE/ASF
FY 2012
ASPE/ASF
FY 2013
ASPE/ASF
FY 2014
Conrad Blucher
Institute3,158,723$ 2,336,533$ 2,492,666$ 7,558 8,079 418$ 309$ 309$
College of Education 1,227,575$ 1,032,661$ 167,364$ 5,604 6,790 219$ 184$ 25$
College of Liberal
Arts125,157$ 189,040$ 144,328$ 2,608 2,643 48$ 72$ 55$
College of Nursing
and Health Sciences1,351,646$ 795,222$ 49,741$ 5,488 3,174 246$ 145$ 16$
College of Science &
Engineering3,001,865$ 3,568,380$ 4,601,347$ 42,656 49,606 70$ 84$ 93$
Community Outreach 164,301$ 491,600$ 568,220$ 537 358 306$ 915$ 1,587$
ELITE/MCNAIR 261,471$ 925,817$ 941,599$ 874 231 299$ 1,059$ 4,076$
Harte Research
Institute3,771,355$ 4,172,166$ 4,368,809$ 8,080 19,171 467$ 516$ 228$
SOAR 255,826$ 913,212$ 1,167,390$ 3,220 1,676 79$ 284$ 697$
TRIO Programs -$ 300,043$ 241,524$ 116 740 -$ 2,587$ 326$
Academic Affairs 9,838$ 5,718$ 2,695$ 267 113 37$ 21$ 24$
Student Affairs 212,199$ 6,000$ 160,203$ 368 288 576$ 16$ 556$
Totals 13,539,955$ 14,736,393$ 14,905,885$ 77,376 92,868 175$ 190$ 161$

TAMUCC Research Space Productivity Study March 6, 2015 17
Annual Sponsored Projects Expenditures (ASPE)- All Units
ConradBlucherInstitute
College ofEducation
College ofLiberal Arts
College ofNursing
and HealthSciences
College ofScience &Engineerin
g
CommunityOutreach
ELITE/MCNAIR
HarteResearchInstitute
SOARTRIO
ProgramsAcademic
AffairsStudentAffairs
ASPE FY 2012 $3,158,72 $1,227,57 $125,157 $1,351,64 $3,001,86 $164,301 $261,471 $3,771,35 $255,826 $- $9,838 $212,199
ASPE FY 2013 $2,336,53 $1,032,66 $189,040 $795,222 $3,568,38 $491,600 $925,817 $4,172,16 $913,212 $300,043 $5,718 $6,000
ASPE FY 2014 $2,492,66 $167,364 $144,328 $49,741 $4,601,34 $568,220 $941,599 $4,368,80 $1,167,39 $241,524 $2,695 $160,203
$3,159
$1,228
$125
$1,352
$3,002
$164 $261
$3,771
$256 $0 $10
$212
$2,337
$1,033
$189
$795
$3,568
$492
$926
$4,172
$913
$300 $6
$6
$2,493
$167
$144 $50
$4,601
$568
$942
$4,369
$1,167
$242
$3
$160
$-
$500
$1,000
$1,500
$2,000
$2,500
$3,000
$3,500
$4,000
$4,500
$5,000
Tho
usa
nd
s
ASPE FY 2012 ASPE FY 2013 ASPE FY 2014

TAMUCC Research Space Productivity Study March 6, 2015 18
Annual Sponsored Projects Expenditures (ASPE) per Square Foot-All Units
$418
$219
$48
$246
$70
$306
$299
$467
$79
$0
$37
$576
$175
$309
$184
$72
$145
$84
$915
$1,059
$516
$284
$2,587
$21
$16
$190
$309
$25
$55
$16
$93
$1,587
$4,076
$228
$697
$326
$24
$556
$161
Conrad Blucher Institute
College of Education
College of Liberal Arts
College of Nursing and Health Sciences
College of Science & Engineering
Community Outreach
ELITE/MCNAIR
Harte Research Institute
SOAR
TRIO Programs
Academic Affairs
Student Affairs
Totals
ASPE/ASF FY 2012 ASPE/ASF FY 2013 ASPE/ASF FY 2014
TAMUCC Research Space Productivity Study March 6, 2015 19
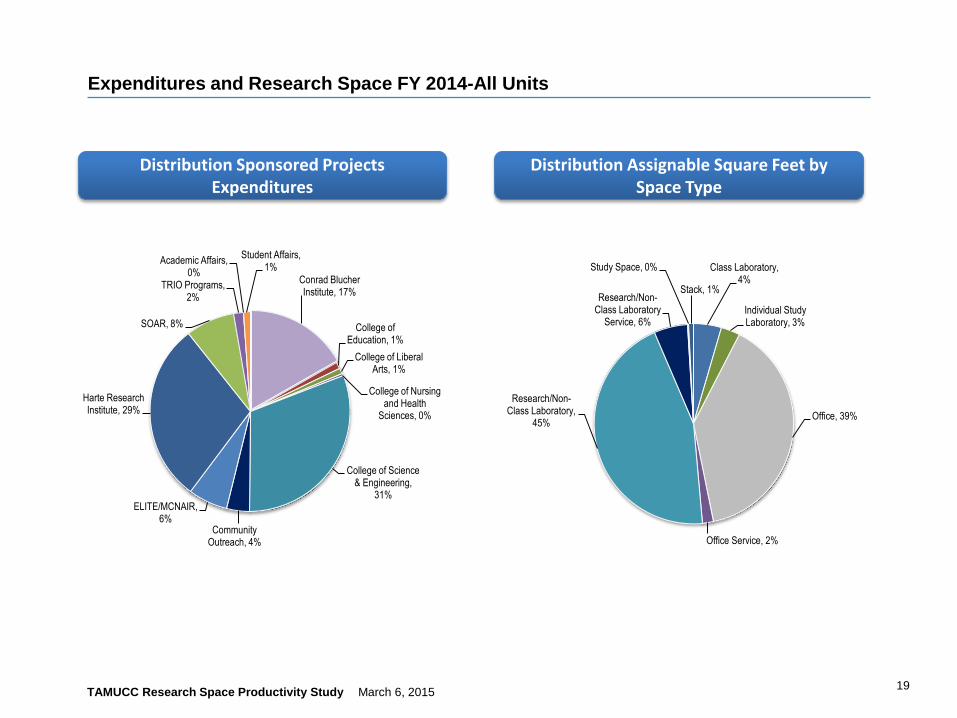
Expenditures and Research Space FY 2014-All Units
Distribution Sponsored Projects Expenditures
Distribution Assignable Square Feet by Space Type
Conrad Blucher Institute, 17%
College of Education, 1%
College of Liberal Arts, 1%
College of Nursing and Health
Sciences, 0%
College of Science & Engineering,
31%
Community Outreach, 4%
ELITE/MCNAIR, 6%
Harte Research Institute, 29%
SOAR, 8%
TRIO Programs, 2%
Academic Affairs, 0%
Student Affairs, 1% Class Laboratory,
4%
Individual Study Laboratory, 3%
Office, 39%
Office Service, 2%
Research/Non-Class Laboratory,
45%
Research/Non-Class Laboratory
Service, 6%
Study Space, 0%
Stack, 1%
TAMUCC Research Space Productivity Study March 6, 2015 20
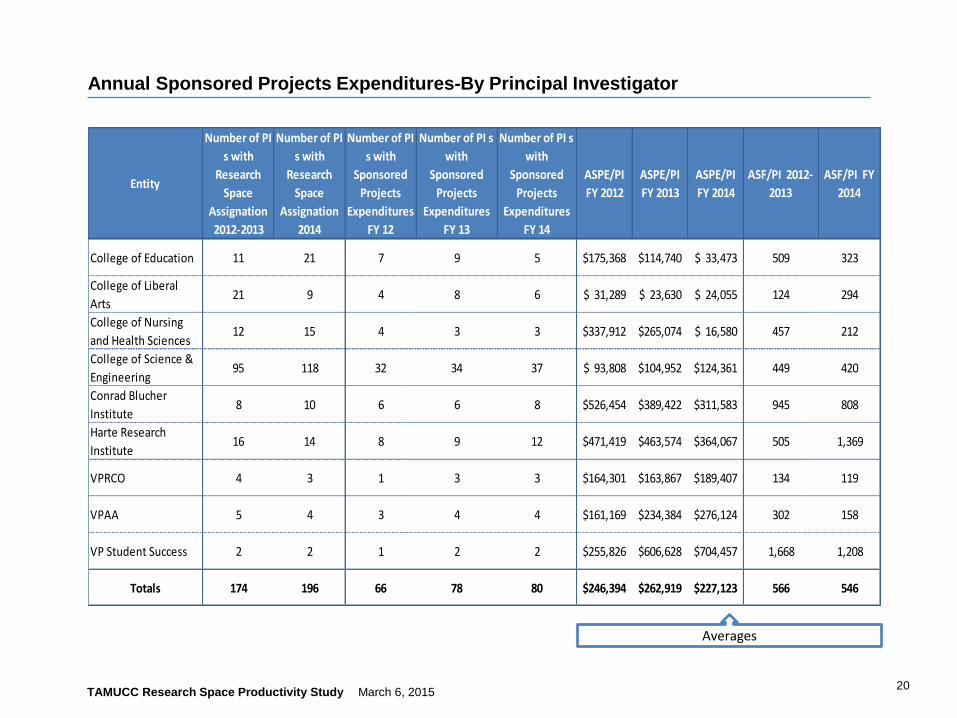
Annual Sponsored Projects Expenditures-By Principal Investigator
Averages
Entity
Number of PI
s with
Research
Space
Assignation
2012-2013
Number of PI
s with
Research
Space
Assignation
2014
Number of PI
s with
Sponsored
Projects
Expenditures
FY 12
Number of PI s
with
Sponsored
Projects
Expenditures
FY 13
Number of PI s
with
Sponsored
Projects
Expenditures
FY 14
ASPE/PI
FY 2012
ASPE/PI
FY 2013
ASPE/PI
FY 2014
ASF/PI 2012-
2013
ASF/PI FY
2014
College of Education 11 21 7 9 5 175,368$ 114,740$ 33,473$ 509 323
College of Liberal
Arts21 9 4 8 6 31,289$ 23,630$ 24,055$ 124 294
College of Nursing
and Health Sciences12 15 4 3 3 337,912$ 265,074$ 16,580$ 457 212
College of Science &
Engineering95 118 32 34 37 93,808$ 104,952$ 124,361$ 449 420
Conrad Blucher
Institute8 10 6 6 8 526,454$ 389,422$ 311,583$ 945 808
Harte Research
Institute16 14 8 9 12 471,419$ 463,574$ 364,067$ 505 1,369
VPRCO 4 3 1 3 3 164,301$ 163,867$ 189,407$ 134 119
VPAA 5 4 3 4 4 161,169$ 234,384$ 276,124$ 302 158
VP Student Success 2 2 1 2 2 255,826$ 606,628$ 704,457$ 1,668 1,208
Totals 174 196 66 78 80 246,394$ 262,919$ 227,123$ 566 546

TAMUCC Research Space Productivity Study March 6, 2015 21
Annual Sponsored Projects Expenditures-By Principal Investigator
$175
$31
$338
$94
$526
$471
$164 $161
$256
$115
$24
$265
$105
$389
$464
$164
$234
$607
$33 $24
$17
$124
$312
$364
$189
$276
$704
$0
$100
$200
$300
$400
$500
$600
$700
$800
College ofEducation
College ofLiberal Arts
College ofNursing and
Health Sciences
College ofScience &
Engineering
Conrad BlucherInstitute
Harte ResearchInstitute
VPRCO VPAA VP StudentSuccess
Tho
usa
nd
s
ASPE/PI FY 2012 ASPE/PI FY 2013 ASPE/PI FY 2014
TAMUCC Research Space Productivity Study March 6, 2015 22
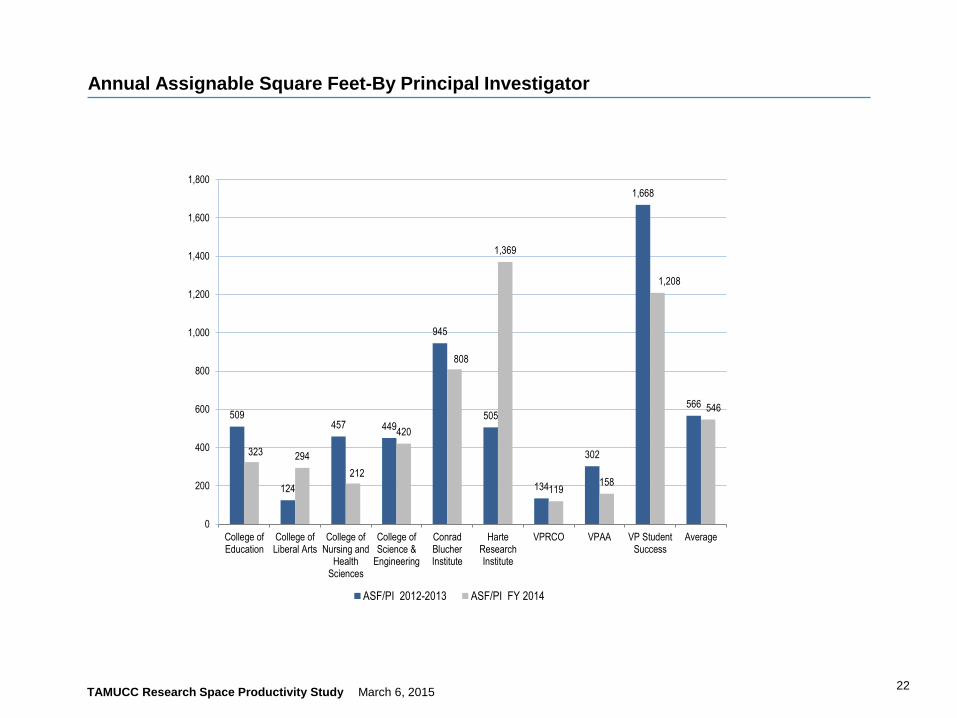
Annual Assignable Square Feet-By Principal Investigator
509
124
457 449
945
505
134
302
1,668
566
323 294
212
420
808
1,369
119 158
1,208
546
0
200
400
600
800
1,000
1,200
1,400
1,600
1,800
College ofEducation
College ofLiberal Arts
College ofNursing and
HealthSciences
College ofScience &
Engineering
ConradBlucherInstitute
HarteResearchInstitute
VPRCO VPAA VP StudentSuccess
Average
ASF/PI 2012-2013 ASF/PI FY 2014
TAMUCC Research Space Productivity Study March 6, 2015 23
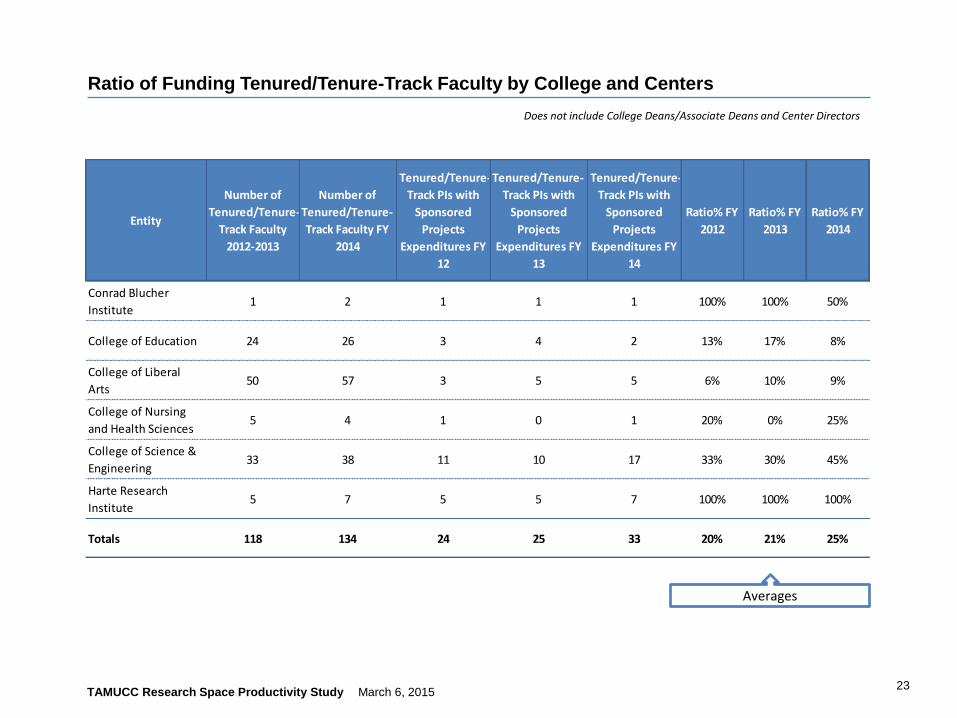
Ratio of Funding Tenured/Tenure-Track Faculty by College and Centers
Does not include College Deans/Associate Deans and Center Directors
Averages
Entity
Number of
Tenured/Tenure-
Track Faculty
2012-2013
Number of
Tenured/Tenure-
Track Faculty FY
2014
Tenured/Tenure-
Track PIs with
Sponsored
Projects
Expenditures FY
12
Tenured/Tenure-
Track PIs with
Sponsored
Projects
Expenditures FY
13
Tenured/Tenure-
Track PIs with
Sponsored
Projects
Expenditures FY
14
Ratio% FY
2012
Ratio% FY
2013
Ratio% FY
2014
Conrad Blucher
Institute1 2 1 1 1 100% 100% 50%
College of Education 24 26 3 4 2 13% 17% 8%
College of Liberal
Arts50 57 3 5 5 6% 10% 9%
College of Nursing
and Health Sciences5 4 1 0 1 20% 0% 25%
College of Science &
Engineering33 38 11 10 17 33% 30% 45%
Harte Research
Institute5 7 5 5 7 100% 100% 100%
Totals 118 134 24 25 33 20% 21% 25%

TAMUCC Research Space Productivity Study March 6, 2015 24
Ratio of Funding Tenured/Tenure-Track Faculty by College and Centers
Does not include College Deans/Associate Deans and Center Directors
100%
13%
6%
20%
33%
100%
20%
100%
17%
10%
0%
30%
100%
21%
50%
8%
9%
25%
45%
100%
25%
Conrad Blucher Institute
College of Education
College of Liberal Arts
College of Nursing and Health Sciences
College of Science & Engineering
Harte Research Institute
Average
Ratio% FY 2014 Ratio% FY 2013 Ratio% FY 2012
TAMUCC Research Space Productivity Study March 6, 2015 25
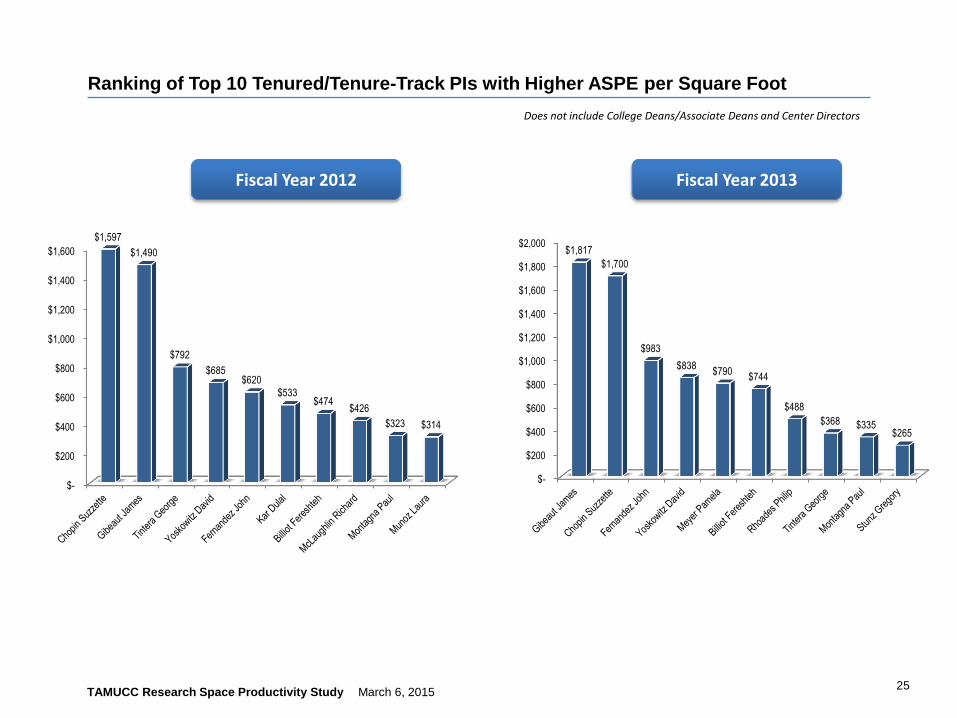
Ranking of Top 10 Tenured/Tenure-Track PIs with Higher ASPE per Square Foot
Does not include College Deans/Associate Deans and Center Directors
Fiscal Year 2012 Fiscal Year 2013
$-
$200
$400
$600
$800
$1,000
$1,200
$1,400
$1,600
$1,800
$2,000$1,817
$1,700
$983
$838 $790
$744
$488
$368 $335 $265
$-
$200
$400
$600
$800
$1,000
$1,200
$1,400
$1,600
$1,597
$1,490
$792
$685 $620
$533 $474
$426
$323 $314

TAMUCC Research Space Productivity Study March 6, 2015 26
Ranking of Top 10 Tenured/Tenure-Track PIs with Higher ASPE per Square Foot
Does not include College Deans/Associate Deans and Center Directors
Fiscal Year 2014
$-
$500
$1,000
$1,500
$2,000
$2,500
$3,000
$3,500
$4,000
$4,500$4,026
$2,743
$1,255
$668 $609 $603 $557 $433
$278 $249

TAMUCC Research Space Productivity Study March 6, 2015 27
Comparable Research Expenditures per Net Assignable Square Foot
Source: Extracted from UTSA Research Space and Expenditures Report FY 11-12, page 64. Chart developed by University
Leadership Council, The Advisory Board Company, Washington, D.C., “Allocating Laboratory Space to Maximize Research
Productivity,” June 23,2008.
336 Institutions with <$ 100 Million Annual Expenditures
Discipline Low Median High TAMUCC
Lab Based All $55 $131 $245 $132
$55
$131
$245
$132
$0
$50
$100
$150
$200
$250
$300
Low Median High TAMUCC