Embed Size (px)
Citation preview
Februar y 2016
THOUGHT LEADERSHIP SERIES
AND IMPLICATIONS FOR OCCUPANCY COSTS
EMPLOYEE PRODUCTIVITY
THE IMPACT OF OFFICE SPACE ON
TABLE OF CONTENTS
ITHE FLIP-SIDE: HOW OCCUPYING TOP QUALITY SPACE CAN BOOST PRODUCTIVITY PAGE: 6
THE DRAWBACKS OF OVER-DENSIFICATION PAGE: 5
THE EFFECT OF HIGH-QUALITY OFFICE SPACE ON EMPLOYEE RETENTION PAGE: 7
THE RESULTS: CHANGE IN PRODUCTIVITY OFFSETS CHANGE IN RENT COSTS PAGE: 8
II
PRODUCTIVITY IN THE ERA OF THE OPEN FLOOR PLAN PAGE: 4
PRODUCTIVITY IN BUSINESS AND FINANCIAL SERVICES PAGE: 10
PRODUCTIVITY IN LEGAL SERVICES PAGE: 12
KEY FINDINGS and ACTION STEPS
� Office space densification, when over-done, or undertaken by a firm in an industry
ill-suited to an open floor plan, can lead to a decline in employee productivity.
Under these circumstances, occupancy cost savings that can be achieved as a
result of densification may be more than wiped out by a decline in productivity.
� On the other hand, attributes of trophy office space — such as a prime
location, access to top-notch amenities, LEED certification, and appealing
common areas — can lead to an increase in employee productivity. Under
these circumstances, the added occupancy cost of upgrading to best-in-class
office space may be recouped in the form of increased productivity.
� In six out of ten major metropolitan areas, including Atlanta, Chicago and Los
Angeles, a mere 1% decline in productivity would wipe out the cost savings
achieved from over-densifying office space. In the remaining four major
metropolitan areas, a 2% decline in productivity would offset those savings.
� In eight out of ten major metropolitan areas, a 3% productivity gain achieved
by occupying efficient trophy office space would recoup the added cost of
upgrading to such space.
� Implications for tenants: While reducing the square footage occupied per
worker appears to be a simple way to cut costs, it is important to be aware of its
potential negative impact on productivity. Just a 2% decline in productivity can
wipe out a tenant’s cost savings, so tenants need to consider carefully whether
sharp reductions in space are in the company’s best long-term interests.
� Implications for best-in-class owners: Often it is difficult to move space
priced at the top of the market. However, the associated productivity gains
for a potential tenant may be enough to more than recoup the added costs.
Selecting an appropriate office location and layout is a major business
decision with many factors and variables to be considered. The impact on
productivity is an important factor to be highlighted.
Newmark Grubb Knight Frank4
PRODUCTIVITY IN THE ERA OF THE OPEN FLOOR PLAN
The trends of office space densification and flight-to-quality are hot topics in commercial real estate markets across the United States. The financial crisis that incited the Great Recession led to widespread acceptance and acceleration of these trends. Densification – the reduction in square feet occupied per employee – proved to be a simple way for companies to cut costs. At the same time, rising vacancy and flat-to-declining rents in office markets across the U.S. allowed many tenants to lease higher-quality space while still achieving cost savings. These trends have garnered much attention in the commercial real estate industry, and while there has been increasing anecdotal evidence of their impact on productivity, there has been little empirical study.
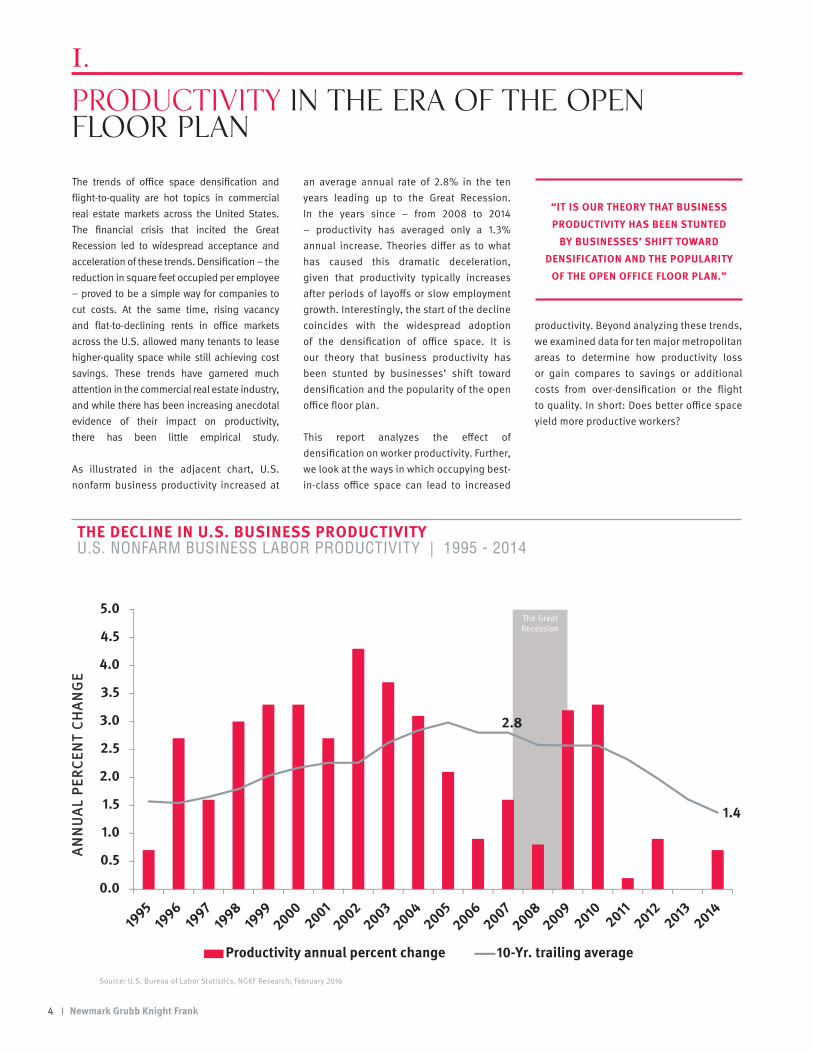
As illustrated in the adjacent chart, U.S. nonfarm business productivity increased at
an average annual rate of 2.8% in the ten years leading up to the Great Recession. In the years since – from 2008 to 2014 – productivity has averaged only a 1.3% annual increase. Theories differ as to what has caused this dramatic deceleration, given that productivity typically increases after periods of layoffs or slow employment growth. Interestingly, the start of the decline coincides with the widespread adoption of the densification of office space. It is our theory that business productivity has been stunted by businesses’ shift toward densification and the popularity of the open office floor plan.
This report analyzes the effect of densification on worker productivity. Further, we look at the ways in which occupying best-in-class office space can lead to increased
productivity. Beyond analyzing these trends, we examined data for ten major metropolitan areas to determine how productivity loss or gain compares to savings or additional costs from over-densification or the flight to quality. In short: Does better office space yield more productive workers?
“IT IS OUR THEORY THAT BUSINESS
PRODUCTIVITY HAS BEEN STUNTED
BY BUSINESSES’ SHIFT TOWARD
DENSIFICATION AND THE POPULARITY
OF THE OPEN OFFICE FLOOR PLAN.”
I.
Source: U.S. Bureau of Labor Statistics, NGKF Research; February 2016
THE DECLINE IN U.S. BUSINESS PRODUCTIVITYU.S. NONFARM BUSINESS LABOR PRODUCTIVITY | 1995 - 2014
5
THE DRAWBACKS of Over-Densification
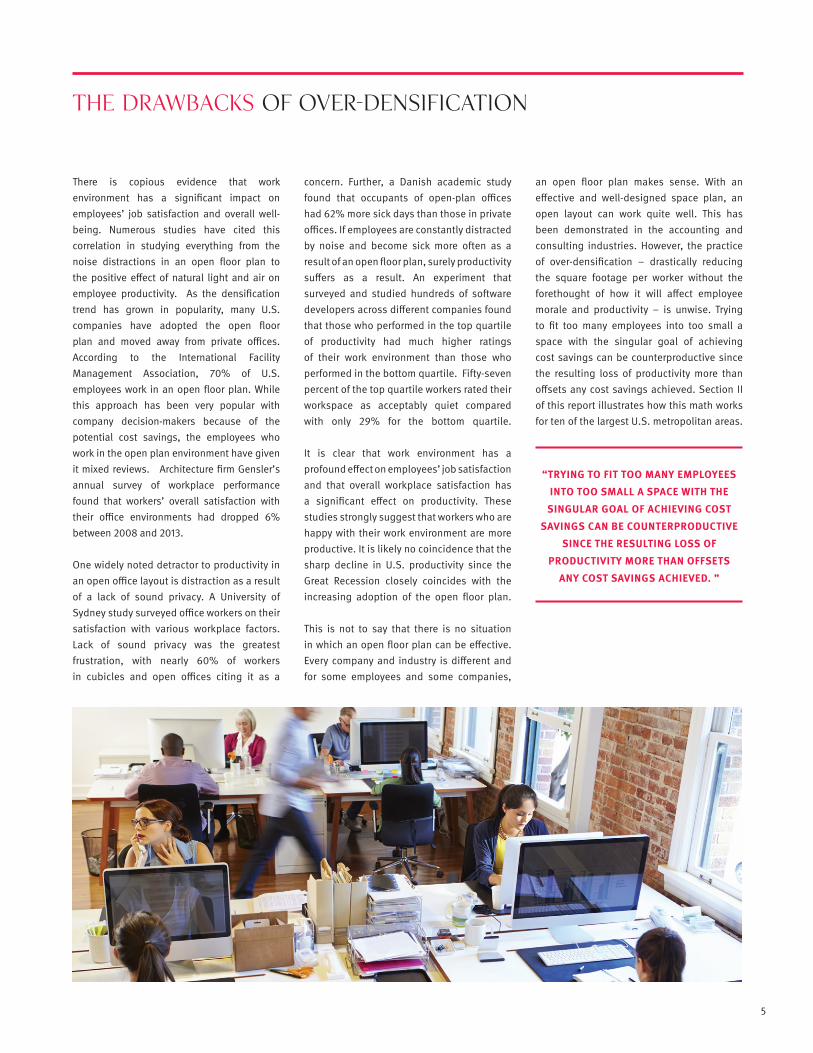
There is copious evidence that work environment has a significant impact on employees’ job satisfaction and overall well-being. Numerous studies have cited this correlation in studying everything from the noise distractions in an open floor plan to the positive effect of natural light and air on employee productivity. As the densification trend has grown in popularity, many U.S. companies have adopted the open floor plan and moved away from private offices. According to the International Facility Management Association, 70% of U.S. employees work in an open floor plan. While this approach has been very popular with company decision-makers because of the potential cost savings, the employees who work in the open plan environment have given it mixed reviews. Architecture firm Gensler’s annual survey of workplace performance found that workers’ overall satisfaction with their office environments had dropped 6% between 2008 and 2013.
One widely noted detractor to productivity in an open office layout is distraction as a result of a lack of sound privacy. A University of Sydney study surveyed office workers on their satisfaction with various workplace factors. Lack of sound privacy was the greatest frustration, with nearly 60% of workers in cubicles and open offices citing it as a
concern. Further, a Danish academic study found that occupants of open-plan offices had 62% more sick days than those in private offices. If employees are constantly distracted by noise and become sick more often as a result of an open floor plan, surely productivity suffers as a result. An experiment that surveyed and studied hundreds of software developers across different companies found that those who performed in the top quartile of productivity had much higher ratings of their work environment than those who performed in the bottom quartile. Fifty-seven percent of the top quartile workers rated their workspace as acceptably quiet compared with only 29% for the bottom quartile. It is clear that work environment has a profound effect on employees’ job satisfaction and that overall workplace satisfaction has a significant effect on productivity. These studies strongly suggest that workers who are happy with their work environment are more productive. It is likely no coincidence that the sharp decline in U.S. productivity since the Great Recession closely coincides with the increasing adoption of the open floor plan. This is not to say that there is no situation in which an open floor plan can be effective. Every company and industry is different and for some employees and some companies,
an open floor plan makes sense. With an effective and well-designed space plan, an open layout can work quite well. This has been demonstrated in the accounting and consulting industries. However, the practice of over-densification – drastically reducing the square footage per worker without the forethought of how it will affect employee morale and productivity – is unwise. Trying to fit too many employees into too small a space with the singular goal of achieving cost savings can be counterproductive since the resulting loss of productivity more than offsets any cost savings achieved. Section II of this report illustrates how this math works for ten of the largest U.S. metropolitan areas.
“TRYING TO FIT TOO MANY EMPLOYEES
INTO TOO SMALL A SPACE WITH THE
SINGULAR GOAL OF ACHIEVING COST
SAVINGS CAN BE COUNTERPRODUCTIVE
SINCE THE RESULTING LOSS OF
PRODUCTIVITY MORE THAN OFFSETS
ANY COST SAVINGS ACHIEVED. ”
Newmark Grubb Knight Frank6
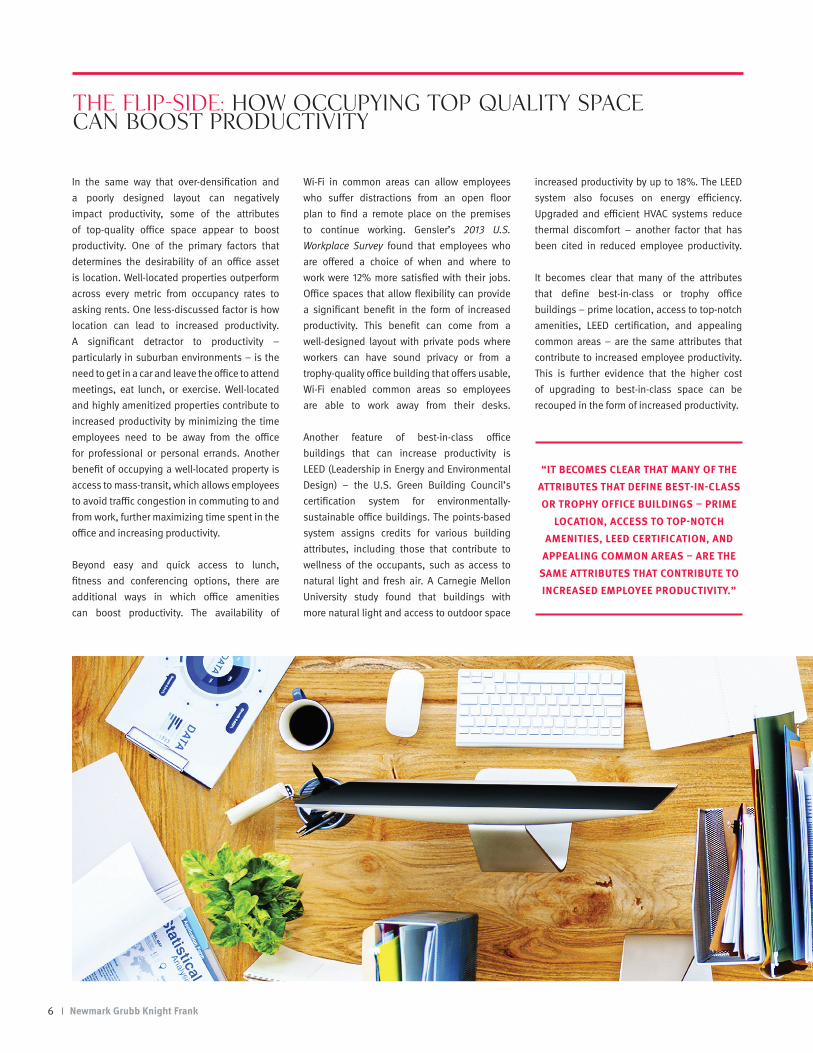
In the same way that over-densification and a poorly designed layout can negatively impact productivity, some of the attributes of top-quality office space appear to boost productivity. One of the primary factors that determines the desirability of an office asset is location. Well-located properties outperform across every metric from occupancy rates to asking rents. One less-discussed factor is how location can lead to increased productivity. A significant detractor to productivity – particularly in suburban environments – is the need to get in a car and leave the office to attend meetings, eat lunch, or exercise. Well-located and highly amenitized properties contribute to increased productivity by minimizing the time employees need to be away from the office for professional or personal errands. Another benefit of occupying a well-located property is access to mass-transit, which allows employees to avoid traffic congestion in commuting to and from work, further maximizing time spent in the office and increasing productivity.
Beyond easy and quick access to lunch, fitness and conferencing options, there are additional ways in which office amenities can boost productivity. The availability of
Wi-Fi in common areas can allow employees who suffer distractions from an open floor plan to find a remote place on the premises to continue working. Gensler’s 2013 U.S. Workplace Survey found that employees who are offered a choice of when and where to work were 12% more satisfied with their jobs. Office spaces that allow flexibility can provide a significant benefit in the form of increased productivity. This benefit can come from a well-designed layout with private pods where workers can have sound privacy or from a trophy-quality office building that offers usable, Wi-Fi enabled common areas so employees are able to work away from their desks. Another feature of best-in-class office buildings that can increase productivity is LEED (Leadership in Energy and Environmental Design) – the U.S. Green Building Council’s certification system for environmentally-sustainable office buildings. The points-based system assigns credits for various building attributes, including those that contribute to wellness of the occupants, such as access to natural light and fresh air. A Carnegie Mellon University study found that buildings with more natural light and access to outdoor space
increased productivity by up to 18%. The LEED system also focuses on energy efficiency. Upgraded and efficient HVAC systems reduce thermal discomfort – another factor that has been cited in reduced employee productivity. It becomes clear that many of the attributes that define best-in-class or trophy office buildings – prime location, access to top-notch amenities, LEED certification, and appealing common areas – are the same attributes that contribute to increased employee productivity. This is further evidence that the higher cost of upgrading to best-in-class space can be recouped in the form of increased productivity.
“IT BECOMES CLEAR THAT MANY OF THE
ATTRIBUTES THAT DEFINE BEST-IN-CLASS
OR TROPHY OFFICE BUILDINGS – PRIME
LOCATION, ACCESS TO TOP-NOTCH
AMENITIES, LEED CERTIFICATION, AND
APPEALING COMMON AREAS – ARE THE
SAME ATTRIBUTES THAT CONTRIBUTE TO
INCREASED EMPLOYEE PRODUCTIVITY.”
THE FLIP-SIDE: How Occupying Top Quality Space Can Boost Productivity
7
THE EFFECT OF HIGH-QUALITY OFFICE SPACE on Employee Retention
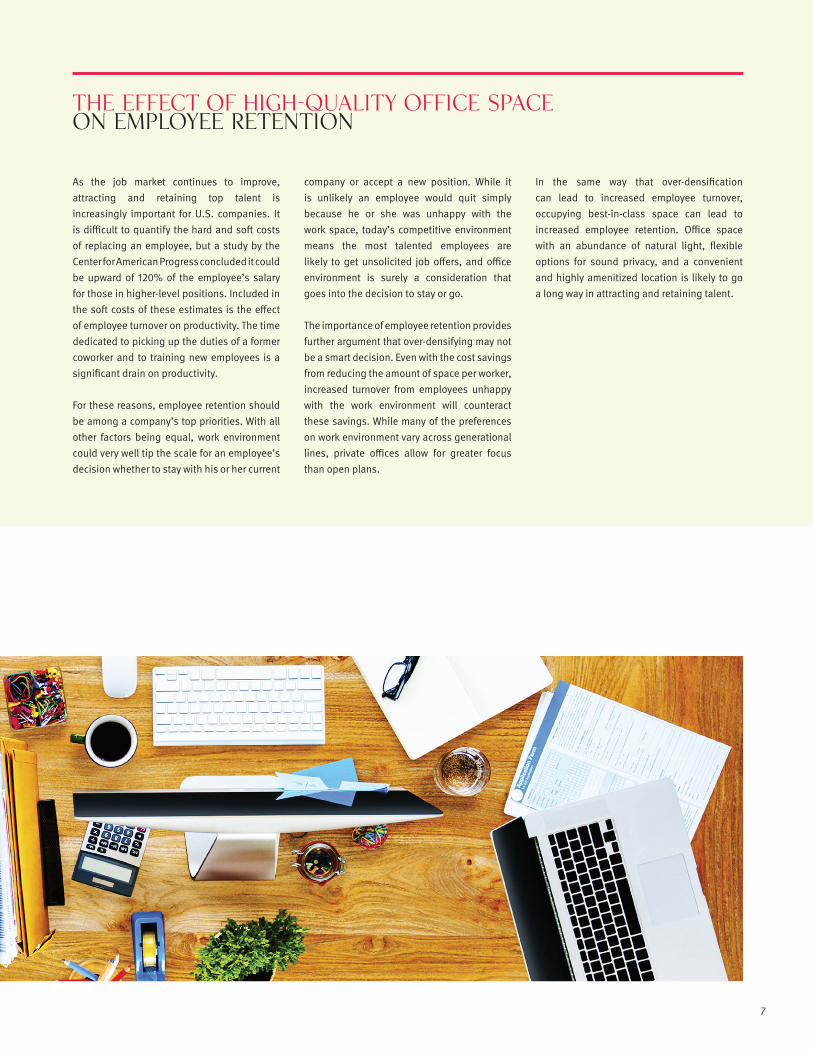
As the job market continues to improve, attracting and retaining top talent is increasingly important for U.S. companies. It is difficult to quantify the hard and soft costs of replacing an employee, but a study by the Center for American Progress concluded it could be upward of 120% of the employee’s salary for those in higher-level positions. Included in the soft costs of these estimates is the effect of employee turnover on productivity. The time dedicated to picking up the duties of a former coworker and to training new employees is a significant drain on productivity.
For these reasons, employee retention should be among a company’s top priorities. With all other factors being equal, work environment could very well tip the scale for an employee’s decision whether to stay with his or her current
company or accept a new position. While it is unlikely an employee would quit simply because he or she was unhappy with the work space, today’s competitive environment means the most talented employees are likely to get unsolicited job offers, and office environment is surely a consideration that goes into the decision to stay or go.
The importance of employee retention provides further argument that over-densifying may not be a smart decision. Even with the cost savings from reducing the amount of space per worker, increased turnover from employees unhappy with the work environment will counteract these savings. While many of the preferences on work environment vary across generational lines, private offices allow for greater focus than open plans.
In the same way that over-densification can lead to increased employee turnover, occupying best-in-class space can lead to increased employee retention. Office space with an abundance of natural light, flexible options for sound privacy, and a convenient and highly amenitized location is likely to go a long way in attracting and retaining talent.
Newmark Grubb Knight Frank8
THE RESULTS: CHANGE IN PRODUCTIVITY OFFSETS CHANGE IN RENT COSTS
It is clear that there is a correlation between over-densification and loss of productivity and between best-in-class office space and increased productivity. We simulated these two scenarios for a mock business and applied them to office market data for ten major metropolitan areas across the U.S. This allowed us to compare how a change in rental costs can be offset by a change in productivity and the amount of productivity loss or gain that would be required to reach that equilibrium.
To assess these comparisons, we took a prototypical business and financial services firm of 250 employees that occupies Class A office space in the downtown or Central Business District of each city and ran two scenarios:
• Scenario 1: The company relocates to another Class A building and over-densifies by reducing the space per employee from 200 to 180 square feet.
• Scenario 2: The company upgrades to trophy office space in an efficient layout which allows it to reduce the space per employee from 200 to 190 square feet.
We then examined the amount of productivity loss or gain that would be required to offset the rent change in these two scenarios when accounting for differing rental rate and wage levels in the various metropolitan areas. We are translating a loss of productivity into dollars by estimating the equivalent share of that employee’s annual salary – for example, a 1% loss in productivity for a given employee yields a loss to the company of 1% of that employee’s yearly wages. The table on pages 10-11 illustrates the results.
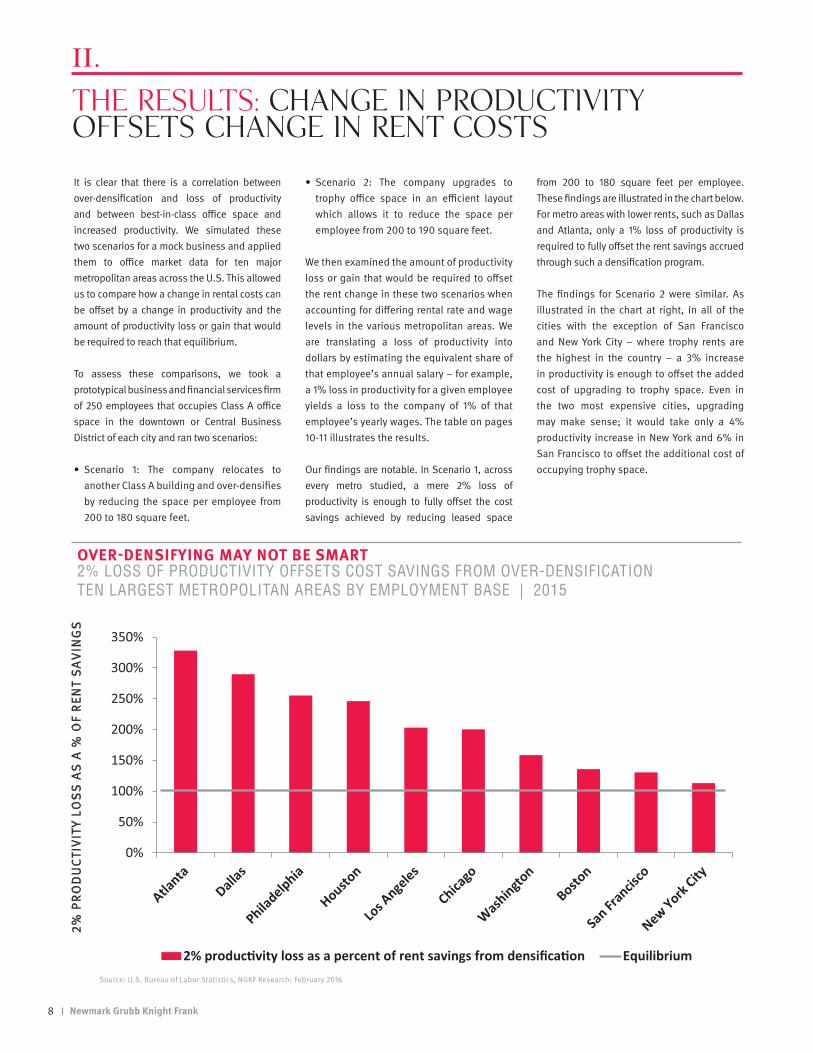
Our findings are notable. In Scenario 1, across every metro studied, a mere 2% loss of productivity is enough to fully offset the cost savings achieved by reducing leased space
from 200 to 180 square feet per employee. These findings are illustrated in the chart below. For metro areas with lower rents, such as Dallas and Atlanta, only a 1% loss of productivity is required to fully offset the rent savings accrued through such a densification program.
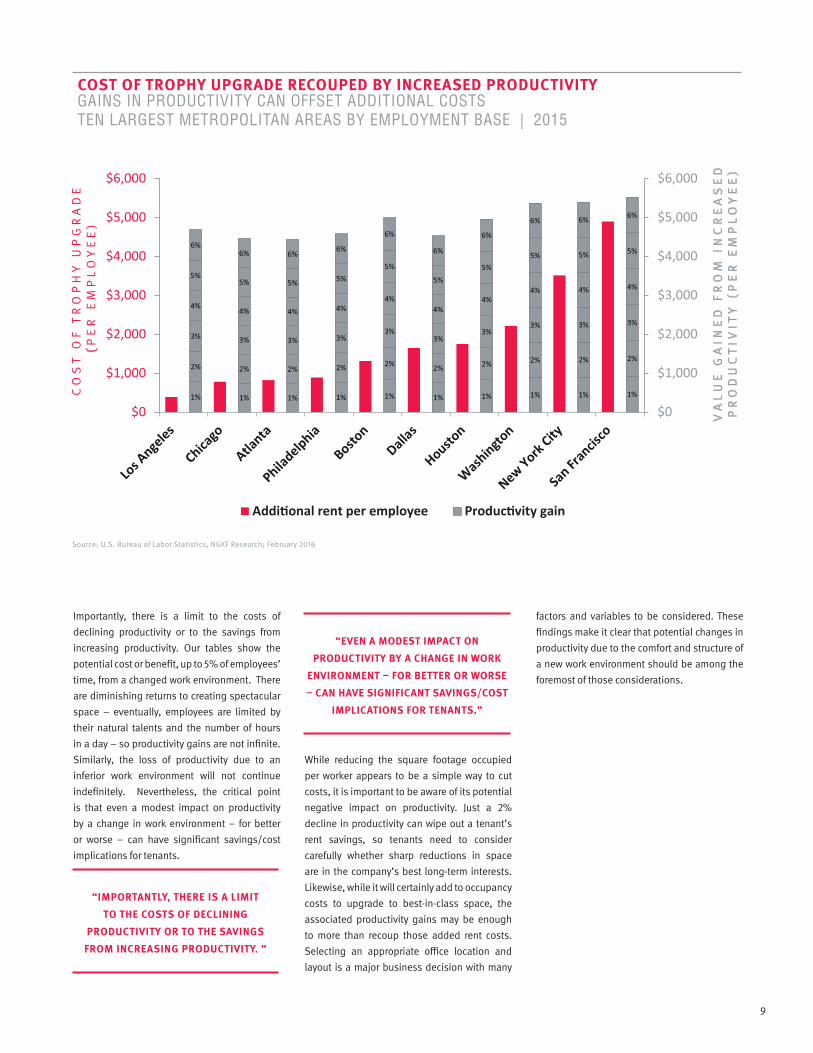
The findings for Scenario 2 were similar. As illustrated in the chart at right, in all of the cities with the exception of San Francisco and New York City – where trophy rents are the highest in the country – a 3% increase in productivity is enough to offset the added cost of upgrading to trophy space. Even in the two most expensive cities, upgrading may make sense; it would take only a 4% productivity increase in New York and 6% in San Francisco to offset the additional cost of occupying trophy space.
II.
Source: U.S. Bureau of Labor Statistics, NGKF Research; February 2016
OVER-DENSIFYING MAY NOT BE SMART2% LOSS OF PRODUCTIVITY OFFSETS COST SAVINGS FROM OVER-DENSIFICATION TEN LARGEST METROPOLITAN AREAS BY EMPLOYMENT BASE | 2015
9
Source: U.S. Bureau of Labor Statistics, NGKF Research; February 2016
COST OF TROPHY UPGRADE RECOUPED BY INCREASED PRODUCTIVITYGAINS IN PRODUCTIVITY CAN OFFSET ADDITIONAL COSTS TEN LARGEST METROPOLITAN AREAS BY EMPLOYMENT BASE | 2015
Importantly, there is a limit to the costs of declining productivity or to the savings from increasing productivity. Our tables show the potential cost or benefit, up to 5% of employees’ time, from a changed work environment. There are diminishing returns to creating spectacular space – eventually, employees are limited by their natural talents and the number of hours in a day – so productivity gains are not infinite. Similarly, the loss of productivity due to an inferior work environment will not continue indefinitely. Nevertheless, the critical point is that even a modest impact on productivity by a change in work environment – for better or worse – can have significant savings/cost implications for tenants.
While reducing the square footage occupied per worker appears to be a simple way to cut costs, it is important to be aware of its potential negative impact on productivity. Just a 2% decline in productivity can wipe out a tenant’s rent savings, so tenants need to consider carefully whether sharp reductions in space are in the company’s best long-term interests. Likewise, while it will certainly add to occupancy costs to upgrade to best-in-class space, the associated productivity gains may be enough to more than recoup those added rent costs. Selecting an appropriate office location and layout is a major business decision with many
factors and variables to be considered. These findings make it clear that potential changes in productivity due to the comfort and structure of a new work environment should be among the foremost of those considerations.
“IMPORTANTLY, THERE IS A LIMIT
TO THE COSTS OF DECLINING
PRODUCTIVITY OR TO THE SAVINGS
FROM INCREASING PRODUCTIVITY. ”
“EVEN A MODEST IMPACT ON
PRODUCTIVITY BY A CHANGE IN WORK
ENVIRONMENT – FOR BETTER OR WORSE
– CAN HAVE SIGNIFICANT SAVINGS/COST
IMPLICATIONS FOR TENANTS.”
Newmark Grubb Knight Frank10
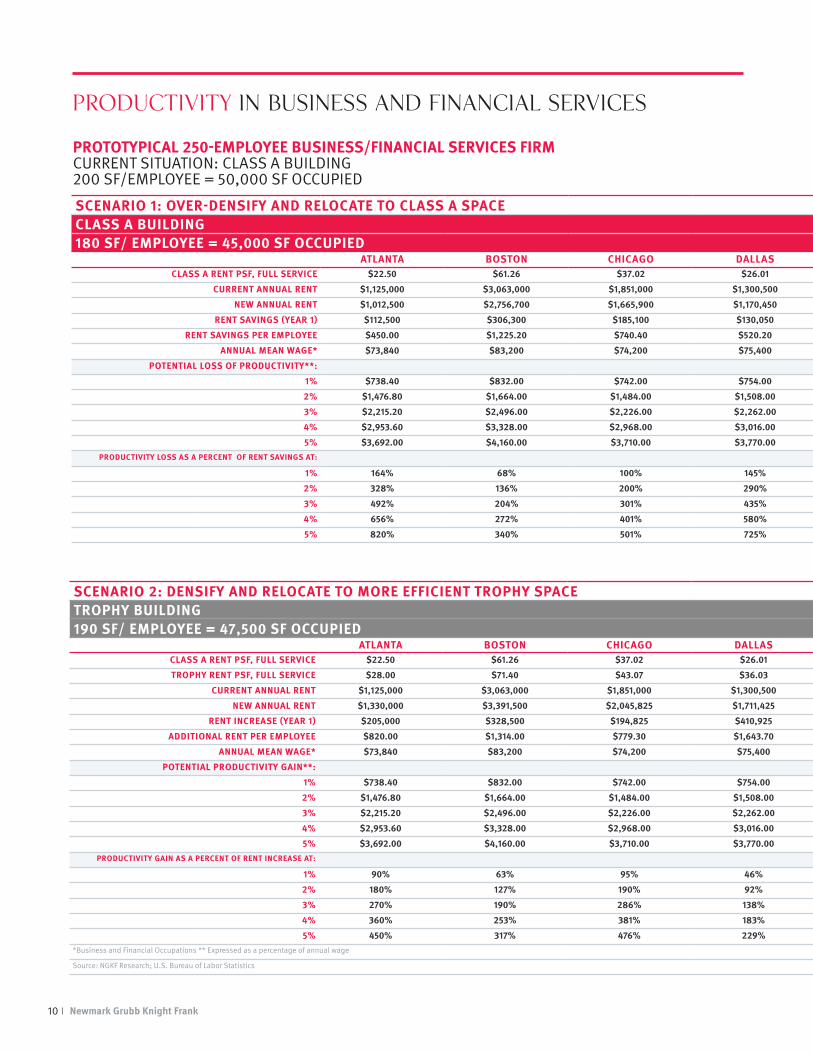
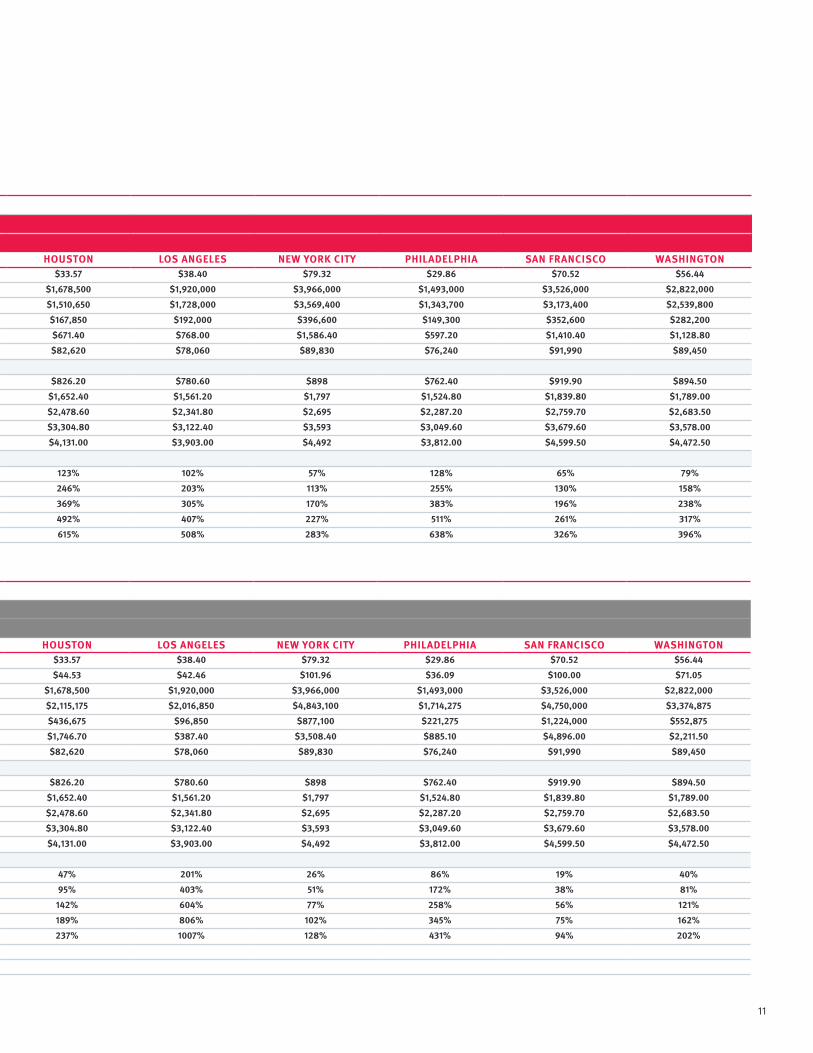
PROTOTYPICAL 250-EMPLOYEE BUSINESS/FINANCIAL SERVICES FIRM CURRENT SITUATION: CLASS A BUILDING 200 SF/EMPLOYEE = 50,000 SF OCCUPIED
PRODUCTIVITY IN BUSINESS AND FINANCIAL SERVICES
SCENARIO 1: OVER-DENSIFY AND RELOCATE TO CLASS A SPACECLASS A BUILDING180 SF/ EMPLOYEE = 45,000 SF OCCUPIED
ATLANTA BOSTON CHICAGO DALLAS HOUSTON LOS ANGELES NEW YORK CITY PHILADELPHIA SAN FRANCISCO WASHINGTONCLASS A RENT PSF, FULL SERVICE $22.50 $61.26 $37.02 $26.01 $33.57 $38.40 $79.32 $29.86 $70.52 $56.44
CURRENT ANNUAL RENT $1,125,000 $3,063,000 $1,851,000 $1,300,500 $1,678,500 $1,920,000 $3,966,000 $1,493,000 $3,526,000 $2,822,000
NEW ANNUAL RENT $1,012,500 $2,756,700 $1,665,900 $1,170,450 $1,510,650 $1,728,000 $3,569,400 $1,343,700 $3,173,400 $2,539,800
RENT SAVINGS (YEAR 1) $112,500 $306,300 $185,100 $130,050 $167,850 $192,000 $396,600 $149,300 $352,600 $282,200
RENT SAVINGS PER EMPLOYEE $450.00 $1,225.20 $740.40 $520.20 $671.40 $768.00 $1,586.40 $597.20 $1,410.40 $1,128.80
ANNUAL MEAN WAGE* $73,840 $83,200 $74,200 $75,400 $82,620 $78,060 $89,830 $76,240 $91,990 $89,450
POTENTIAL LOSS OF PRODUCTIVITY**:
1% $738.40 $832.00 $742.00 $754.00 $826.20 $780.60 $898 $762.40 $919.90 $894.50
2% $1,476.80 $1,664.00 $1,484.00 $1,508.00 $1,652.40 $1,561.20 $1,797 $1,524.80 $1,839.80 $1,789.00
3% $2,215.20 $2,496.00 $2,226.00 $2,262.00 $2,478.60 $2,341.80 $2,695 $2,287.20 $2,759.70 $2,683.50
4% $2,953.60 $3,328.00 $2,968.00 $3,016.00 $3,304.80 $3,122.40 $3,593 $3,049.60 $3,679.60 $3,578.00
5% $3,692.00 $4,160.00 $3,710.00 $3,770.00 $4,131.00 $3,903.00 $4,492 $3,812.00 $4,599.50 $4,472.50PRODUCTIVITY LOSS AS A PERCENT OF RENT SAVINGS AT:
1% 164% 68% 100% 145% 123% 102% 57% 128% 65% 79%
2% 328% 136% 200% 290% 246% 203% 113% 255% 130% 158%
3% 492% 204% 301% 435% 369% 305% 170% 383% 196% 238%
4% 656% 272% 401% 580% 492% 407% 227% 511% 261% 317%
5% 820% 340% 501% 725% 615% 508% 283% 638% 326% 396%
SCENARIO 2: DENSIFY AND RELOCATE TO MORE EFFICIENT TROPHY SPACETROPHY BUILDING190 SF/ EMPLOYEE = 47,500 SF OCCUPIED
ATLANTA BOSTON CHICAGO DALLAS HOUSTON LOS ANGELES NEW YORK CITY PHILADELPHIA SAN FRANCISCO WASHINGTONCLASS A RENT PSF, FULL SERVICE $22.50 $61.26 $37.02 $26.01 $33.57 $38.40 $79.32 $29.86 $70.52 $56.44
TROPHY RENT PSF, FULL SERVICE $28.00 $71.40 $43.07 $36.03 $44.53 $42.46 $101.96 $36.09 $100.00 $71.05
CURRENT ANNUAL RENT $1,125,000 $3,063,000 $1,851,000 $1,300,500 $1,678,500 $1,920,000 $3,966,000 $1,493,000 $3,526,000 $2,822,000
NEW ANNUAL RENT $1,330,000 $3,391,500 $2,045,825 $1,711,425 $2,115,175 $2,016,850 $4,843,100 $1,714,275 $4,750,000 $3,374,875
RENT INCREASE (YEAR 1) $205,000 $328,500 $194,825 $410,925 $436,675 $96,850 $877,100 $221,275 $1,224,000 $552,875
ADDITIONAL RENT PER EMPLOYEE $820.00 $1,314.00 $779.30 $1,643.70 $1,746.70 $387.40 $3,508.40 $885.10 $4,896.00 $2,211.50
ANNUAL MEAN WAGE* $73,840 $83,200 $74,200 $75,400 $82,620 $78,060 $89,830 $76,240 $91,990 $89,450
POTENTIAL PRODUCTIVITY GAIN**:
1% $738.40 $832.00 $742.00 $754.00 $826.20 $780.60 $898 $762.40 $919.90 $894.50
2% $1,476.80 $1,664.00 $1,484.00 $1,508.00 $1,652.40 $1,561.20 $1,797 $1,524.80 $1,839.80 $1,789.00
3% $2,215.20 $2,496.00 $2,226.00 $2,262.00 $2,478.60 $2,341.80 $2,695 $2,287.20 $2,759.70 $2,683.50
4% $2,953.60 $3,328.00 $2,968.00 $3,016.00 $3,304.80 $3,122.40 $3,593 $3,049.60 $3,679.60 $3,578.00
5% $3,692.00 $4,160.00 $3,710.00 $3,770.00 $4,131.00 $3,903.00 $4,492 $3,812.00 $4,599.50 $4,472.50PRODUCTIVITY GAIN AS A PERCENT OF RENT INCREASE AT:
1% 90% 63% 95% 46% 47% 201% 26% 86% 19% 40%
2% 180% 127% 190% 92% 95% 403% 51% 172% 38% 81%
3% 270% 190% 286% 138% 142% 604% 77% 258% 56% 121%
4% 360% 253% 381% 183% 189% 806% 102% 345% 75% 162%
5% 450% 317% 476% 229% 237% 1007% 128% 431% 94% 202%*Business and Financial Occupations ** Expressed as a percentage of annual wage
Source: NGKF Research; U.S. Bureau of Labor Statistics
11
Prototypical 250-Employee Business/Financial Services Firm. Current situation: Class A building. 200 SF/Employee = 50,000 sf occupied
SCENARIO 1: OVER-DENSIFY AND RELOCATE TO CLASS A SPACECLASS A BUILDING180 SF/ EMPLOYEE = 45,000 SF OCCUPIED
ATLANTA BOSTON CHICAGO DALLAS HOUSTON LOS ANGELES NEW YORK CITY PHILADELPHIA SAN FRANCISCO WASHINGTONCLASS A RENT PSF, FULL SERVICE $22.50 $61.26 $37.02 $26.01 $33.57 $38.40 $79.32 $29.86 $70.52 $56.44
CURRENT ANNUAL RENT $1,125,000 $3,063,000 $1,851,000 $1,300,500 $1,678,500 $1,920,000 $3,966,000 $1,493,000 $3,526,000 $2,822,000
NEW ANNUAL RENT $1,012,500 $2,756,700 $1,665,900 $1,170,450 $1,510,650 $1,728,000 $3,569,400 $1,343,700 $3,173,400 $2,539,800
RENT SAVINGS (YEAR 1) $112,500 $306,300 $185,100 $130,050 $167,850 $192,000 $396,600 $149,300 $352,600 $282,200
RENT SAVINGS PER EMPLOYEE $450.00 $1,225.20 $740.40 $520.20 $671.40 $768.00 $1,586.40 $597.20 $1,410.40 $1,128.80
ANNUAL MEAN WAGE* $73,840 $83,200 $74,200 $75,400 $82,620 $78,060 $89,830 $76,240 $91,990 $89,450
POTENTIAL LOSS OF PRODUCTIVITY**:
1% $738.40 $832.00 $742.00 $754.00 $826.20 $780.60 $898 $762.40 $919.90 $894.50
2% $1,476.80 $1,664.00 $1,484.00 $1,508.00 $1,652.40 $1,561.20 $1,797 $1,524.80 $1,839.80 $1,789.00
3% $2,215.20 $2,496.00 $2,226.00 $2,262.00 $2,478.60 $2,341.80 $2,695 $2,287.20 $2,759.70 $2,683.50
4% $2,953.60 $3,328.00 $2,968.00 $3,016.00 $3,304.80 $3,122.40 $3,593 $3,049.60 $3,679.60 $3,578.00
5% $3,692.00 $4,160.00 $3,710.00 $3,770.00 $4,131.00 $3,903.00 $4,492 $3,812.00 $4,599.50 $4,472.50PRODUCTIVITY LOSS AS A PERCENT OF RENT SAVINGS AT:
1% 164% 68% 100% 145% 123% 102% 57% 128% 65% 79%
2% 328% 136% 200% 290% 246% 203% 113% 255% 130% 158%
3% 492% 204% 301% 435% 369% 305% 170% 383% 196% 238%
4% 656% 272% 401% 580% 492% 407% 227% 511% 261% 317%
5% 820% 340% 501% 725% 615% 508% 283% 638% 326% 396%
SCENARIO 2: DENSIFY AND RELOCATE TO MORE EFFICIENT TROPHY SPACETROPHY BUILDING190 SF/ EMPLOYEE = 47,500 SF OCCUPIED
ATLANTA BOSTON CHICAGO DALLAS HOUSTON LOS ANGELES NEW YORK CITY PHILADELPHIA SAN FRANCISCO WASHINGTONCLASS A RENT PSF, FULL SERVICE $22.50 $61.26 $37.02 $26.01 $33.57 $38.40 $79.32 $29.86 $70.52 $56.44
TROPHY RENT PSF, FULL SERVICE $28.00 $71.40 $43.07 $36.03 $44.53 $42.46 $101.96 $36.09 $100.00 $71.05
CURRENT ANNUAL RENT $1,125,000 $3,063,000 $1,851,000 $1,300,500 $1,678,500 $1,920,000 $3,966,000 $1,493,000 $3,526,000 $2,822,000
NEW ANNUAL RENT $1,330,000 $3,391,500 $2,045,825 $1,711,425 $2,115,175 $2,016,850 $4,843,100 $1,714,275 $4,750,000 $3,374,875
RENT INCREASE (YEAR 1) $205,000 $328,500 $194,825 $410,925 $436,675 $96,850 $877,100 $221,275 $1,224,000 $552,875
ADDITIONAL RENT PER EMPLOYEE $820.00 $1,314.00 $779.30 $1,643.70 $1,746.70 $387.40 $3,508.40 $885.10 $4,896.00 $2,211.50
ANNUAL MEAN WAGE* $73,840 $83,200 $74,200 $75,400 $82,620 $78,060 $89,830 $76,240 $91,990 $89,450
POTENTIAL PRODUCTIVITY GAIN**:
1% $738.40 $832.00 $742.00 $754.00 $826.20 $780.60 $898 $762.40 $919.90 $894.50
2% $1,476.80 $1,664.00 $1,484.00 $1,508.00 $1,652.40 $1,561.20 $1,797 $1,524.80 $1,839.80 $1,789.00
3% $2,215.20 $2,496.00 $2,226.00 $2,262.00 $2,478.60 $2,341.80 $2,695 $2,287.20 $2,759.70 $2,683.50
4% $2,953.60 $3,328.00 $2,968.00 $3,016.00 $3,304.80 $3,122.40 $3,593 $3,049.60 $3,679.60 $3,578.00
5% $3,692.00 $4,160.00 $3,710.00 $3,770.00 $4,131.00 $3,903.00 $4,492 $3,812.00 $4,599.50 $4,472.50PRODUCTIVITY GAIN AS A PERCENT OF RENT INCREASE AT:
1% 90% 63% 95% 46% 47% 201% 26% 86% 19% 40%
2% 180% 127% 190% 92% 95% 403% 51% 172% 38% 81%
3% 270% 190% 286% 138% 142% 604% 77% 258% 56% 121%
4% 360% 253% 381% 183% 189% 806% 102% 345% 75% 162%
5% 450% 317% 476% 229% 237% 1007% 128% 431% 94% 202%*Business and Financial Occupations ** Expressed as a percentage of annual wage
Source: NGKF Research; U.S. Bureau of Labor Statistics
12 Newmark Grubb Knight Frank
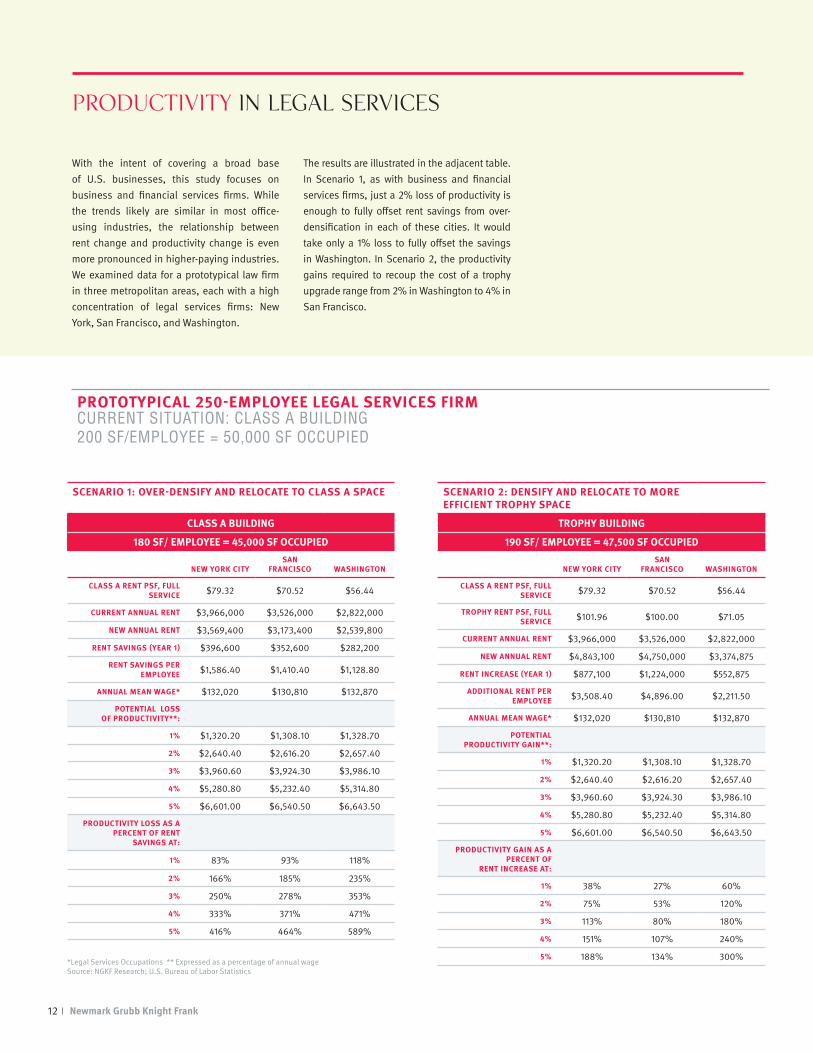
With the intent of covering a broad base of U.S. businesses, this study focuses on business and financial services firms. While the trends likely are similar in most office-using industries, the relationship between rent change and productivity change is even more pronounced in higher-paying industries. We examined data for a prototypical law firm in three metropolitan areas, each with a high concentration of legal services firms: New York, San Francisco, and Washington.
The results are illustrated in the adjacent table. In Scenario 1, as with business and financial services firms, just a 2% loss of productivity is enough to fully offset rent savings from over- densification in each of these cities. It would take only a 1% loss to fully offset the savings in Washington. In Scenario 2, the productivity gains required to recoup the cost of a trophy upgrade range from 2% in Washington to 4% in San Francisco.
SCENARIO 1: OVER-DENSIFY AND RELOCATE TO CLASS A SPACE
CLASS A BUILDING
180 SF/ EMPLOYEE = 45,000 SF OCCUPIED
NEW YORK CITYSAN
FRANCISCO WASHINGTON
CLASS A RENT PSF, FULL SERVICE $79.32 $70.52 $56.44
CURRENT ANNUAL RENT $3,966,000 $3,526,000 $2,822,000
NEW ANNUAL RENT $3,569,400 $3,173,400 $2,539,800
RENT SAVINGS (YEAR 1) $396,600 $352,600 $282,200
RENT SAVINGS PER EMPLOYEE $1,586.40 $1,410.40 $1,128.80
ANNUAL MEAN WAGE* $132,020 $130,810 $132,870
POTENTIAL LOSS OF PRODUCTIVITY**:
1% $1,320.20 $1,308.10 $1,328.70
2% $2,640.40 $2,616.20 $2,657.40
3% $3,960.60 $3,924.30 $3,986.10
4% $5,280.80 $5,232.40 $5,314.80
5% $6,601.00 $6,540.50 $6,643.50
PRODUCTIVITY LOSS AS A PERCENT OF RENT
SAVINGS AT:
1% 83% 93% 118%
2% 166% 185% 235%
3% 250% 278% 353%
4% 333% 371% 471%
5% 416% 464% 589%
SCENARIO 2: DENSIFY AND RELOCATE TO MORE EFFICIENT TROPHY SPACE
TROPHY BUILDING
190 SF/ EMPLOYEE = 47,500 SF OCCUPIED
NEW YORK CITYSAN
FRANCISCO WASHINGTON
CLASS A RENT PSF, FULL SERVICE $79.32 $70.52 $56.44
TROPHY RENT PSF, FULL SERVICE $101.96 $100.00 $71.05
CURRENT ANNUAL RENT $3,966,000 $3,526,000 $2,822,000
NEW ANNUAL RENT $4,843,100 $4,750,000 $3,374,875
RENT INCREASE (YEAR 1) $877,100 $1,224,000 $552,875
ADDITIONAL RENT PER EMPLOYEE $3,508.40 $4,896.00 $2,211.50
ANNUAL MEAN WAGE* $132,020 $130,810 $132,870
POTENTIAL PRODUCTIVITY GAIN**:
1% $1,320.20 $1,308.10 $1,328.70
2% $2,640.40 $2,616.20 $2,657.40
3% $3,960.60 $3,924.30 $3,986.10
4% $5,280.80 $5,232.40 $5,314.80
5% $6,601.00 $6,540.50 $6,643.50
PRODUCTIVITY GAIN AS A PERCENT OF
RENT INCREASE AT:
1% 38% 27% 60%
2% 75% 53% 120%
3% 113% 80% 180%
4% 151% 107% 240%
5% 188% 134% 300%*Legal Services Occupations ** Expressed as a percentage of annual wageSource: NGKF Research; U.S. Bureau of Labor Statistics
PROTOTYPICAL 250-EMPLOYEE LEGAL SERVICES FIRMCURRENT SITUATION: CLASS A BUILDING 200 SF/EMPLOYEE = 50,000 SF OCCUPIED
PRODUCTIVITY IN LEGAL SERVICES
SOURCES
In addition to NGKF’s proprietary database of office market transactions and data from the U.S. Bureau of Labor Statistics, the following sources were used in this analysis:
Boushey, H., & Glynn, S. (2012, November 16). There Are Significant Business Costs to Replacing Employees. Retrieved January 13, 2016, from https://www.americanprogress.org/
DeMarco, T., & Lister, T. (1987). Peopleware: Productive projects and teams. New York, NY: Dorset House Pub.
Gensler. (n.d.). The 2013 US Workplace Survey. Retrieved January 13, 2016, from http://www.gensler.com/
Kim, J., & Dear, R. (n.d.). Workspace satisfaction: The privacy-communication trade-off in open-plan offices. Journal of Environmental Psychology, 18-26.
Moloney, C. (n.d.). Workplace Productivity: Are LEED Buildings the Key? Retrieved January 13, 2016, from https://www.green-buildings.com/articles/
Pejtersen, J., Feveile, H., Christensen, K., & Burr, H. (2011). Sickness absence associated with shared and open-plan offices – a national cross sectional questionnaire survey. Scandinavian Journal of Work, Environment & Health, 376-382.
Vogel, J. (2013, April 19). Is the Corner Office Worth It? Retrieved January 13, 2016, from http://www.usnews.com/
Wong, V. (2013, July 1). Ending the Tyranny of the Open-Plan Office. Retrieved January 12, 2016, from http://www.bloomberg.com/
All information contained in this publication is derived from sources that are deemed to be reliable. However, Newmark Grubb Knight Frank (NGKF) has not verified any such information, and the
same constitutes the statements and representations only of the source thereof, and not of NGKF. Any recipient of this publication should independently verify such information and all other
information that may be material to any decision that recipient may make in response to this publication, and should consult with professionals of the recipient’s choice with regard to all aspects
of that decision, including its legal, financial, and tax aspects and implications. Any recipient of this publication may not, without the prior written approval of NGKF, distribute, disseminate,
publish, transmit, copy, broadcast, upload, download, or in any other way reproduce this publication or any of the information it contains.
NEWMARK GRUBB KNIGHT FRANK RESEARCH REPORTS ARE ALSO AVAILABLE AT WWW.NGKF.COM/RESEARCH.
www.ngkf.com/research
Gregory H. Leisch, CRESenior Managing DirectorMarket [email protected]
Alexander (Sandy) Paul, CREManaging DirectorNational Market [email protected]
Marianne (Swearingen) SkorupskiResearch [email protected]
Bethany SchneiderSenior Research [email protected]
Washington, DC 1899 Pennsylvania Avenue, NW Suite 300 Washington, DC 20006 202.331.7000
Tysons Corner 1410 Spring Hill Road Suite 600 McLean, VA 22102 703.448.2000
Baltimore 400 East Pratt Street Suite 710 Baltimore, MD 21202 410.625.4200
USA Alabama Mobile Arizona Phoenix Arkansas Bentonville Little Rock California Bakersfield Emeryville Fresno Hayward Los Angeles Newport Beach Ontario Palo Alto Pleasanton Roseville Sacramento San Diego San Francisco San Mateo San Rafael Santa Ana Santa Clara Santa Rosa Visalia Walnut Creek Colorado Colorado Springs Denver Connecticut Hartford Stamford
Delaware Wilmington District of Columbia Washington, DC Florida Boca Raton Jacksonville Miami Orlando Sarasota Tampa Georgia Atlanta St. Simons Island Hawaii Honolulu Illinois Chicago Indiana Indianapolis Mishawaka Maryland Baltimore Massachusetts Boston Michigan Detroit Grand Rapids Missouri Kansas City St. Louis Nevada Las Vegas
New Jersey Central, East Brunswick Northern, Rutherford Southern, Marlton New York New York Long Island Westchester North Carolina Charlotte Raleigh North Dakota Fargo Ohio Cleveland Columbus Oklahoma Oklahoma City Tulsa Oregon Portland Pennsylvania Philadelphia Pittsburgh Wayne South Carolina Charleston Columbia Greenville Myrtle Beach Tennessee Memphis
Texas Austin Dallas Houston McAllen Utah American Fork Clearfield Salt Lake City Virginia Tysons Corner Washington Seattle Wisconsin Appleton Green Bay Madison Wausau CANADA Calgary Edmonton Halifax Moncton Montreal Ottawa Québec City Toronto Vancouver MEXICO Ciudad Juarez Guanajuato Mexico City Monterrey Queretaro Saltillo San Luis Potosi