Embed Size (px)
Citation preview
Ruiz Avilés et al. EURASIP Journal onWireless Communications andNetworking (2015) 2015:38 DOI 10.1186/s13638-015-0246-0
RESEARCH Open Access
A femtocell location strategy for improvingadaptive traffic sharing in heterogeneous LTEnetworksJosé María Ruiz Avilés*†, Matías Toril† and Salvador Luna-Ramírez†
Abstract
Femtocells have been suggested as a promising solution for the provision of indoor coverage and capacity. In thispaper, a new planning strategy for placing femtocell access points so as to make the most of automatic traffic sharingalgorithms is proposed for a long-term evolution (LTE) heterogeneous network. The aim of the proposed method is toincrease overlapping between femtocells by increasing the percentage of area with low dominance of the servingfemtocell. Method assessment is carried out by simulating classical traffic sharing algorithms in a three-dimensionaloffice scenario with femtocell location plans designed based on different network performance criteria. Results showthat location plans with a larger low dominance ratio achieve better network performance after sharing traffic thanplans designed for maximum coverage or connection quality.
Keywords: Femtocell; Antenna; Placement; Overlapping
1 IntroductionRecent advances in radio access technologies have pavedthe way for mobile broadband services. In parallel, oper-ator revenues keep decreasing as a result of flat ratesubscriptions. Thus, the success of future mobile com-munication systems will largely depend on their ability toprovide an adequate quality of service at a lower cost perbit. In this context, amajor challenge for cost-effectivenessin mobile networks is the provision of indoor coverage.Recent surveys have shown that more than 80% of mobiletraffic is originated at home or work, but nearly half of thehouses and premises have poor indoor coverage [1,2]. Thisproblem was solved in the past by increasing the num-ber of base stations, but such an approach is not viableanymore due to lack of scalability.Alternatively, massive femtocell deployment has been
proposed to deal with indoor traffic [2]. Femtocells sup-ply indoor coverage following an easy-to-install paradigmwith limited network planning (e.g., no site location orpower planning) in contrast to macro/micro cellular net-work deployments. However, such a limited planning is
*Correspondence: [email protected]†Equal contributorsCommunications Engineering Department, University of Málaga, 29071Málaga, Spain
also a potential source of problems, namely, poor cover-age, poor signal quality, or traffic congestion [3,4]. In sucha complex heterogeneous structure, self-organizing net-work (SON) [5] techniques must be used to solve theseproblems without human intervention.Mobility (or handover-based) load balancing has been
identified as a relevant SON use case by the industry [6,7]and standardization bodies [8]. Load balancing capabilityis included to deal with uneven and/or changing traf-fic distribution, which might cause network congestionproblems. These congestion problems are commonplacein femtocell networks due to a high user concentrationand the lack of a careful analysis of user trends. There-fore, improving load sharing capabilities is key to ensuringadequate performance in these heterogeneous scenarios.In the literature, many advanced radio resource man-
agement (RRM) algorithms can be found for redistribut-ing traffic between neighbor cells to solve localizedcongestion problems. Some of them reallocate usersby changing antenna settings (e.g., remote electricaltilt [9]), while others adjust RRM parameters in traf-fic management schemes (e.g., cell re-selection offsetsand/or handover (HO) margins [10]). Initial studies onload sharing are focused on macrocellular scenarios indifferent radio access technologies (e.g., time division
© 2015 Ruiz Avilés et al.; licensee Springer. This is an Open Access article distributed under the terms of the Creative CommonsAttribution License (http://creativecommons.org/licenses/by/4.0), which permits unrestricted use, distribution, and reproductionin any medium, provided the original work is properly credited.
Ruiz Avilés et al. EURASIP Journal onWireless Communications and Networking (2015) 2015:38 Page 2 of 13
multiple access/frequency division multiple access -TDMA/FDMA [10], wideband code division multipleaccess -WCDMA [11], and orthogonal frequency divisionmultiple access - OFDMA [12,13]). Recently, the analy-sis has been extended to heterogeneous office scenarioswith open-access femtocells [14]. Results presented thereshowed that traffic sharing in OFDMA femtocell net-works is a challenging task due to the full frequency reusecurrently used by operators.Any traffic sharing algorithm relies on the existence
of some overlapping between adjacent cells. The degreeof cell overlapping depends on propagation conditionsand site locations. Thus, a good load sharing capabilityin a heterogeneous network can be reached by a carefuldesign of femtocell locations that ensures an appropriateoverlapping between cells. However, femtocell locationsare usually designed for purposes other than maximiz-ing load sharing capabilities. Several works have studiedthe impact of site locations on cellular network perfor-mance in terms of coverage and/or signal-to-interferenceplus noise ratio (SINR). Thus, many different methodshave been proposed to find the best location for macrocel-lular sites to improve network coverage, user connectionquality, and/or network capacity [15-21]. Similar methodshave been used for optimal location of wireless accesspoints (APs) in indoor environments [22-30]. All theseapproaches construct a systemmodel, over which a classi-cal optimization algorithm is applied to find the positionof base stations that maximize some overall network per-formance indicator. However, to the authors’ knowledge,no study has evaluated the influence of positions of basestations on the effectiveness of traffic sharing schemes. Inthis paper, the problem of locating femtocell access pointsto aid automatic traffic sharing algorithms in long-termevolution (LTE) is studied. A preliminary analysis, basedon static system-level simulations, aims to find some basicrules to locate femtocells in an office building in termsof different network performance criteria. Unlike previ-ous studies, cell overlapping is also considered as a designcriterion. Then, a comprehensive performance analysisof classical traffic sharing algorithms with different fem-tocell locations is carried out in a dynamic system-levelsimulator. Such an analysis shows the positive impact ofincreasing cell overlapping in traffic sharing in LTE.
1.1 Previous workThe antenna placement problem (APP) can be formulatedas a discrete optimization problem, where the design vari-ables are the (discrete) base station coordinates and theobjective function may be any combination of differentoverall network performance indicators. For computa-tional reasons, this combinatorial optimization problem isoften solved by heuristic approaches. Previous contribu-tions can be classified by the scenario under analysis, the
design criteria for the site location, and the algorithm usedto solve the optimization problem.A first group of references try to find the best site
locations in outdoor scenarios. Anderson et al. [15]use simulated annealing to solve the base station loca-tion problem in a TDMA/FDMA microcell environment,based on SINR and pathloss indicators. In [16], WCDMAsite selection is formulated as an integer linear program-ming problem, which is solved by tabu search. In [17],the APP is formulated so as to find the minimum numberof antennas for a desired coverage level. In [18], severalgenetic algorithms are proposed for the APP to maximizecoverage in Global System for Mobile communication(GSM) while still satisfying a minimum SINR require-ment. In [20] and [21], a performance sensitivity analysisis carried out to investigate the impact of site locationand antenna tilt angles on the pole capacity in a WCDMAnetwork with uneven traffic distribution. In [19], two ran-domized greedy procedures and a tabu search algorithmare proposed to solve the APP in order to jointly opti-mize installation costs, signal quality, and traffic coveragein WCDMA.A second group of references apply the previous
methods to indoor scenarios. In some of them, the APP isformulated to minimize pathloss (or maximize coverage)and later solved by a general-purpose optimization algo-rithm (e.g., genetic algorithm [22], direct search method[23], simulated annealing [31], or heuristic algorithm[32]). Similarly to [17], [24] proposes a binary integer pro-gramming approach to find the minimum number of APsguaranteeing a minimum SINR in the scenario. In [25], aheuristic method is proposed to place APs in a WCDMAindoor scenario with constraints on iplink (UL) and down-link (DL) SINR performance. All recent studies focuson SINR optimization by different methods (e.g., bruteforce enumeration inWCDMA [33] and LTE [34], particleswarm in WCDMA [28], and reduction approximation inWCDMA [29]).In [35], a method for femtocell base station placement
is proposed to minimize transmit power of mobile users.Alternatively, [36,37] propose methods to find the bestWi-Fi AP placement for optimal localization of mobileusers in indoor environments.
1.2 Contribution of this workIn most of the abovementioned references, the focus hasbeen on the computational efficiency of the method usedto find the optimal locations of base stations. However, theproperties of the site location plan resulting from the opti-mization process have not been analyzed in detail. Thus,no basic rules have been proposed to build near-optimalsolutions without the need for the optimization processin real scenarios. Moreover, to the authors’ knowledge, nostudy has evaluated the impact of femtocell positions on
Ruiz Avilés et al. EURASIP Journal onWireless Communications and Networking (2015) 2015:38 Page 3 of 13
the performance of automatic traffic sharing algorithms ina heterogeneous LTE network.The main contributions of this work are a) the def-
inition of a network performance indicator to quantifycell overlapping, easy to measure and interpret, fromwhich to estimate a priori the effectiveness of traffic shar-ing in LTE femtocell scenarios, b) the identification ofsome basic rules for placing femtocells in a building tomaximize cell overlapping, or some other network perfor-mance indicator (e.g., coverage or connection quality), andc) a performance comparison of different femtocell place-ment strategies with classical traffic sharing schemes in aheterogeneous LTE office scenario with congestion prob-lems due to uneven traffic distribution. Results prove thevalue of the proposed overlapping indicator and femtocelllocation technique, since the femtocell layout designed formaximizing that indicator boosts femtocell traffic sharingcapability and, as a consequence, network performance,even for slightly uneven spatial traffic distributions. Alsoimportantly, the analysis presented here explains whytraffic sharing schemes modifying both transmit powerand HO margins outperform those that only change HOmargins.The rest of the paper is organized as follows. Section 2
formulates the different design criteria that can be usedfor placing femtocells. Section 3 presents a preliminaryanalysis showing the properties of femtocell location plansconstructed by solving the APP with different designcriteria in an office building. Section 4 outlines sev-eral classical traffic sharing schemes proposed in theliterature. Section 5 presents a comprehensive perfor-mance analysis of the traffic sharing schemes intro-duced in Section 4 with the femtocell locations plansdesigned in Section 3. Finally, conclusions are presented inSection 6.
2 Formulation of design criteria for placingfemtocells
In this work, four design criteria are used to select femto-cells positions in the network planning stage. A first cri-terion is based on pathloss, as proposed in [22,23,31,32].Two other criteria are based on SINR statistics, taken from[24,25,28,29,33,34]. A fourth new criterion based on celloverlapping is proposed in this paper.
2.1 Minimum average pathlossThe average pathloss, PL, is used as a measure of networkcoverage obtained by a femtocell location plan. Such anindicator is calculated by averaging the minimum pathlossprovided by the serving femtocell in each point of thescenario, as
PL = Avgj
(mini
(PL
(i, j
))), (1)
where PL(i, j) is the pathloss (in dB) from femtocell ito point j in the scenario, which depends on femtocellpositions and propagation environment.
2.2 Maximumworst connection qualityThe tenth percentile of the overall DL SINR distributionis used as a measure of network connection quality prob-lems with a femtocell location plan. Assuming that all cellshave the same transmit power and system bandwidth, andnoise floor is negligible, the DL SINR for each point j inthe scenario (in dB) can be approximated as:
SINRDL(j) � − PL
(s(j), j) + 10 · log
∑∀i�=s(j)
Pcol(s(j), i
) · 10− PL(i,j)10 ,
(2)
where s(j)is the serving cell in point j (i.e., that provid-
ing minimum pathloss) and Pcol(s(j), i
)is the probability
that cell s(j)collides in the air interface with cell i. In most
network planning tools, Pcol(s(j), i
)is approximated by
the estimated physical resource block (PRB) utilizationratio. Once the overall SINR distribution is constructed byaggregating all points in the scenario, the tenth percentileof DL SINR, L10%,DLSINR, is the SINR value exceeded by90% of points in the scenario. Such a value depends onfemtocell positions, propagation environment, and PRButilization ratios.
2.3 Maximum average connection qualityThe average DL SINR in the scenario, SINRDL, is used as ameasure of average network connection quality obtainedby a femtocell location plan. Such an indicator is calcu-lated by averaging the DL SINR value in all points in thescenario provided by (2), which is also given by femtocellpositions, propagation environment and PRB utilizationratios.
2.4 Maximum cell overlappingThe size of low dominance areas is used to quantify thedegree of cell overlapping with a femtocell location plan.A point j is in a low dominance area when:
mink
(PL
(k, j
) − PL(s(j), j)) ≤ �PL ∀ k �= s
(j), (3)
where s(j)is the serving cell in point j and �PL is the low
dominance threshold. Thus, cell overlapping is quantifiedby the low dominance ratio, LDR, defined as the share ofpoints in low dominance areas. In this work, �PL = 3 dB.Maximum cell overlapping is obtained by maximizing lowdominance ratios, which is only influenced by femtocellpositions and propagation conditions.

Ruiz Avilés et al. EURASIP Journal onWireless Communications and Networking (2015) 2015:38 Page 4 of 13
3 Preliminary analysis of femtocell locationstrategies
The aim of this section is to build several femtocell loca-tion plans in a three-dimensional office scenario with thedesign criteria described in the previous section. Theselocation plans are used later in Section 5 to check theimpact of femtocell locations on traffic sharing algo-rithms. This preliminary analysis is carried out in a staticsystem-level simulator that computes pathloss, DL SINR,and low dominance ratios in a grid of points. For clarity,the analysis setup is described first, and the results arepresented later.
3.1 Analysis setupFigure 1 shows the layout of the considered heterogeneousscenario, which is the one presented in [14]. The simu-lation scenario covers an area of 3 × 2.6 km served bythree co-sited trisectorized macrocells (black hexagons).An office building (blue square) is included in one of themacrocells, 500 m away from the macrocellular site. Toavoid border effects, a wrap-around technique is usedto create multiple replicas of the main scenario (bluehexagons). The building consists of five floors of 50 × 50m, each with four symmetrical offices. As a constraint ofthe femtocell location plan, 1 femtocell is included peroffice (i.e., 4 femtocells per floor, for a total of 20 femto-cells in the building). Figure 2 shows the floor layout. Linesin the figure represent walls. Blue circles reflect femtocellpositions for a specific layout used as benchmark (here-after referred to as original layout, OrL). Other layoutsmay have different femtocell locations.
Figure 1 Layout of macrocell scenario.
Figure 2 Layout of one floor in the office building.
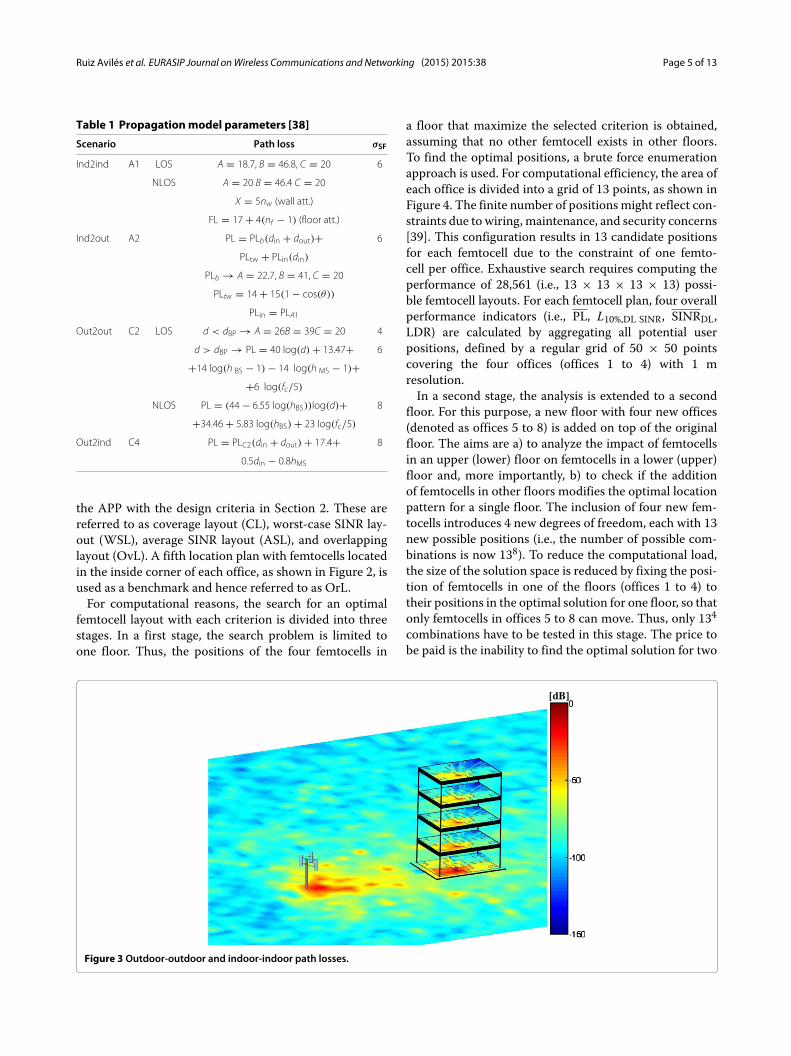
Propagation models in the scenario are those proposedin the WINNER II project [38]. Different models are useddepending on the transmitter and receiver environments,including indoor-indoor, indoor-outdoor, outdoor-indoor,and outdoor-outdoor cases and also depending on theirline-of-sight (LOS) or non-LOS conditions. In all cases,PL is calculated as:
PL [dB] = A·log (d [m])+B+C ·log (f [GHz]/5
)+X ,(4)
where A, B, and C values depend on the propagation envi-ronment andX includes the attenuation effect of walls anddiffraction. Table 1 details the WINNER II propagationmodels [38], where hBS and hMS are macrocell and mobilestation heights, respectively, FL is the attenuation due topropagation across different floors, nf is the number offloors between transmitter and receiver, � is the anglebetween the outdoor path and the normal of the externalwall, and σSF is the standard deviation of the log-normalslow-fading attenuation component. For illustrating pur-poses, Figure 3 (not to scale) shows a colormap with PLvalues from one of the macrocells to all outdoor pointsand from one of the femtocells in the first floor to allindoor points in the five floors of the building.Since the aim is to derive some basic rules to locate fem-
tocells, slow fading is disabled in this preliminary analysisto ensure that optimal femtocell layouts only depend onthe scenario geometry and not on the specific realizationof slow fading.A uniform spatial user distribution is considered. To
compute SINR values, it is assumed that all cells are fullyloaded, so that the PRB utilization factor is 100% (i.e.,Pcol(i, j) = 1 ∀ i, j).In the above-described scenario, five femtocell location
plans are evaluated. Four of them are obtained by solving
Ruiz Avilés et al. EURASIP Journal onWireless Communications and Networking (2015) 2015:38 Page 5 of 13
Table 1 Propagationmodel parameters [38]
Scenario Path loss σSF
Ind2ind A1 LOS A = 18.7, B = 46.8, C = 20 6
NLOS A = 20 B = 46.4 C = 20
X = 5nw (wall att.)
FL = 17 + 4(nf − 1) (floor att.)
Ind2out A2 PL = PLb(din + dout)+ 6
PLtw + PLin(din)
PLb → A = 22.7, B = 41, C = 20
PLtw = 14 + 15(1 − cos(θ))
PLin = PLA1
Out2out C2 LOS d < dBP → A = 26B = 39C = 20 4
d > dBP → PL = 40 log(d) + 13.47+ 6
+14 log(h BS − 1) − 14 log(h MS − 1)++6 log(fc/5)
NLOS PL = (44 − 6.55 log(hBS))log(d)+ 8
+34.46 + 5.83 log(hBS) + 23 log(fc/5)
Out2ind C4 PL = PLC2(din + dout) + 17.4+ 8
0.5din − 0.8hMS
the APP with the design criteria in Section 2. These arereferred to as coverage layout (CL), worst-case SINR lay-out (WSL), average SINR layout (ASL), and overlappinglayout (OvL). A fifth location plan with femtocells locatedin the inside corner of each office, as shown in Figure 2, isused as a benchmark and hence referred to as OrL.For computational reasons, the search for an optimal
femtocell layout with each criterion is divided into threestages. In a first stage, the search problem is limited toone floor. Thus, the positions of the four femtocells in
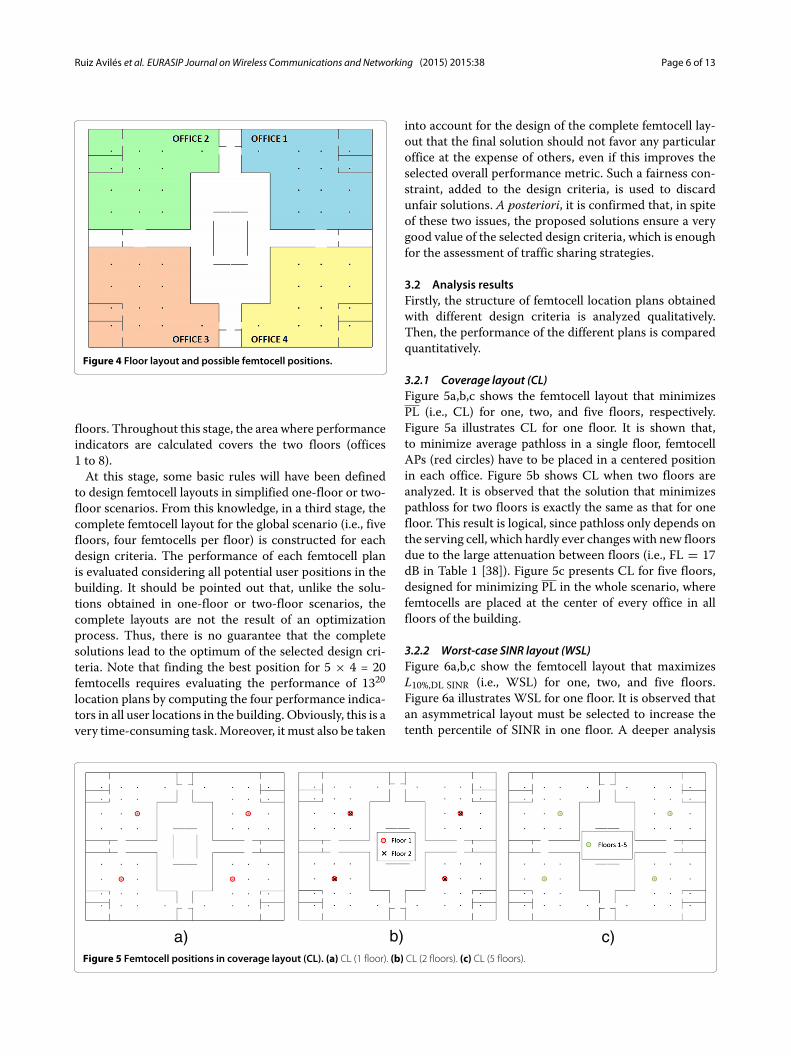
a floor that maximize the selected criterion is obtained,assuming that no other femtocell exists in other floors.To find the optimal positions, a brute force enumerationapproach is used. For computational efficiency, the area ofeach office is divided into a grid of 13 points, as shown inFigure 4. The finite number of positions might reflect con-straints due to wiring, maintenance, and security concerns[39]. This configuration results in 13 candidate positionsfor each femtocell due to the constraint of one femto-cell per office. Exhaustive search requires computing theperformance of 28,561 (i.e., 13 × 13 × 13 × 13) possi-ble femtocell layouts. For each femtocell plan, four overallperformance indicators (i.e., PL, L10%,DL SINR, SINRDL,LDR) are calculated by aggregating all potential userpositions, defined by a regular grid of 50 × 50 pointscovering the four offices (offices 1 to 4) with 1 mresolution.In a second stage, the analysis is extended to a second
floor. For this purpose, a new floor with four new offices(denoted as offices 5 to 8) is added on top of the originalfloor. The aims are a) to analyze the impact of femtocellsin an upper (lower) floor on femtocells in a lower (upper)floor and, more importantly, b) to check if the additionof femtocells in other floors modifies the optimal locationpattern for a single floor. The inclusion of four new fem-tocells introduces 4 new degrees of freedom, each with 13new possible positions (i.e., the number of possible com-binations is now 138). To reduce the computational load,the size of the solution space is reduced by fixing the posi-tion of femtocells in one of the floors (offices 1 to 4) totheir positions in the optimal solution for one floor, so thatonly femtocells in offices 5 to 8 can move. Thus, only 134combinations have to be tested in this stage. The price tobe paid is the inability to find the optimal solution for two
[dB]
Figure 3 Outdoor-outdoor and indoor-indoor path losses.
Ruiz Avilés et al. EURASIP Journal onWireless Communications and Networking (2015) 2015:38 Page 6 of 13
Figure 4 Floor layout and possible femtocell positions.
floors. Throughout this stage, the area where performanceindicators are calculated covers the two floors (offices1 to 8).At this stage, some basic rules will have been defined
to design femtocell layouts in simplified one-floor or two-floor scenarios. From this knowledge, in a third stage, thecomplete femtocell layout for the global scenario (i.e., fivefloors, four femtocells per floor) is constructed for eachdesign criteria. The performance of each femtocell planis evaluated considering all potential user positions in thebuilding. It should be pointed out that, unlike the solu-tions obtained in one-floor or two-floor scenarios, thecomplete layouts are not the result of an optimizationprocess. Thus, there is no guarantee that the completesolutions lead to the optimum of the selected design cri-teria. Note that finding the best position for 5 × 4 = 20femtocells requires evaluating the performance of 1320location plans by computing the four performance indica-tors in all user locations in the building. Obviously, this is avery time-consuming task.Moreover, it must also be taken
into account for the design of the complete femtocell lay-out that the final solution should not favor any particularoffice at the expense of others, even if this improves theselected overall performance metric. Such a fairness con-straint, added to the design criteria, is used to discardunfair solutions. A posteriori, it is confirmed that, in spiteof these two issues, the proposed solutions ensure a verygood value of the selected design criteria, which is enoughfor the assessment of traffic sharing strategies.
3.2 Analysis resultsFirstly, the structure of femtocell location plans obtainedwith different design criteria is analyzed qualitatively.Then, the performance of the different plans is comparedquantitatively.
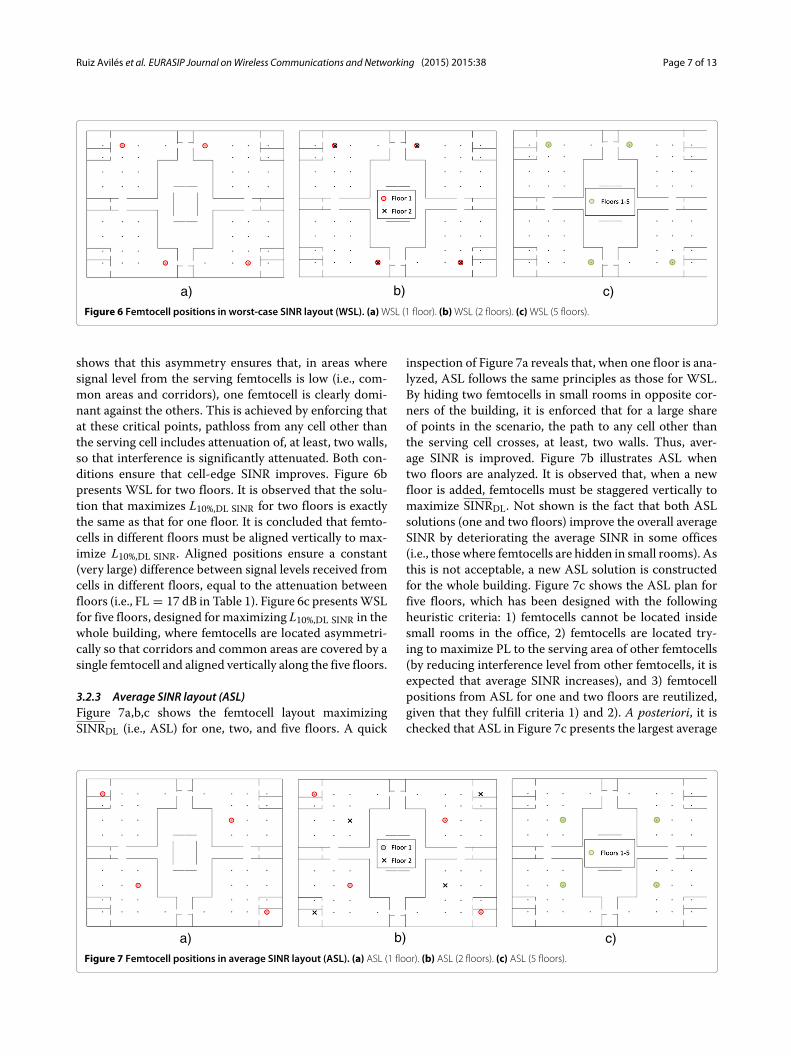
3.2.1 Coverage layout (CL)Figure 5a,b,c shows the femtocell layout that minimizesPL (i.e., CL) for one, two, and five floors, respectively.Figure 5a illustrates CL for one floor. It is shown that,to minimize average pathloss in a single floor, femtocellAPs (red circles) have to be placed in a centered positionin each office. Figure 5b shows CL when two floors areanalyzed. It is observed that the solution that minimizespathloss for two floors is exactly the same as that for onefloor. This result is logical, since pathloss only depends onthe serving cell, which hardly ever changes with new floorsdue to the large attenuation between floors (i.e., FL = 17dB in Table 1 [38]). Figure 5c presents CL for five floors,designed for minimizing PL in the whole scenario, wherefemtocells are placed at the center of every office in allfloors of the building.
3.2.2 Worst-case SINR layout (WSL)Figure 6a,b,c show the femtocell layout that maximizesL10%,DL SINR (i.e., WSL) for one, two, and five floors.Figure 6a illustrates WSL for one floor. It is observed thatan asymmetrical layout must be selected to increase thetenth percentile of SINR in one floor. A deeper analysis
a) b) c) Figure 5 Femtocell positions in coverage layout (CL). (a) CL (1 floor). (b) CL (2 floors). (c) CL (5 floors).
Ruiz Avilés et al. EURASIP Journal onWireless Communications and Networking (2015) 2015:38 Page 7 of 13
a) b) c) Figure 6 Femtocell positions in worst-case SINR layout (WSL). (a)WSL (1 floor). (b)WSL (2 floors). (c)WSL (5 floors).
shows that this asymmetry ensures that, in areas wheresignal level from the serving femtocells is low (i.e., com-mon areas and corridors), one femtocell is clearly domi-nant against the others. This is achieved by enforcing thatat these critical points, pathloss from any cell other thanthe serving cell includes attenuation of, at least, two walls,so that interference is significantly attenuated. Both con-ditions ensure that cell-edge SINR improves. Figure 6bpresents WSL for two floors. It is observed that the solu-tion that maximizes L10%,DL SINR for two floors is exactlythe same as that for one floor. It is concluded that femto-cells in different floors must be aligned vertically to max-imize L10%,DL SINR. Aligned positions ensure a constant(very large) difference between signal levels received fromcells in different floors, equal to the attenuation betweenfloors (i.e., FL = 17 dB in Table 1). Figure 6c presentsWSLfor five floors, designed for maximizing L10%,DL SINR in thewhole building, where femtocells are located asymmetri-cally so that corridors and common areas are covered by asingle femtocell and aligned vertically along the five floors.
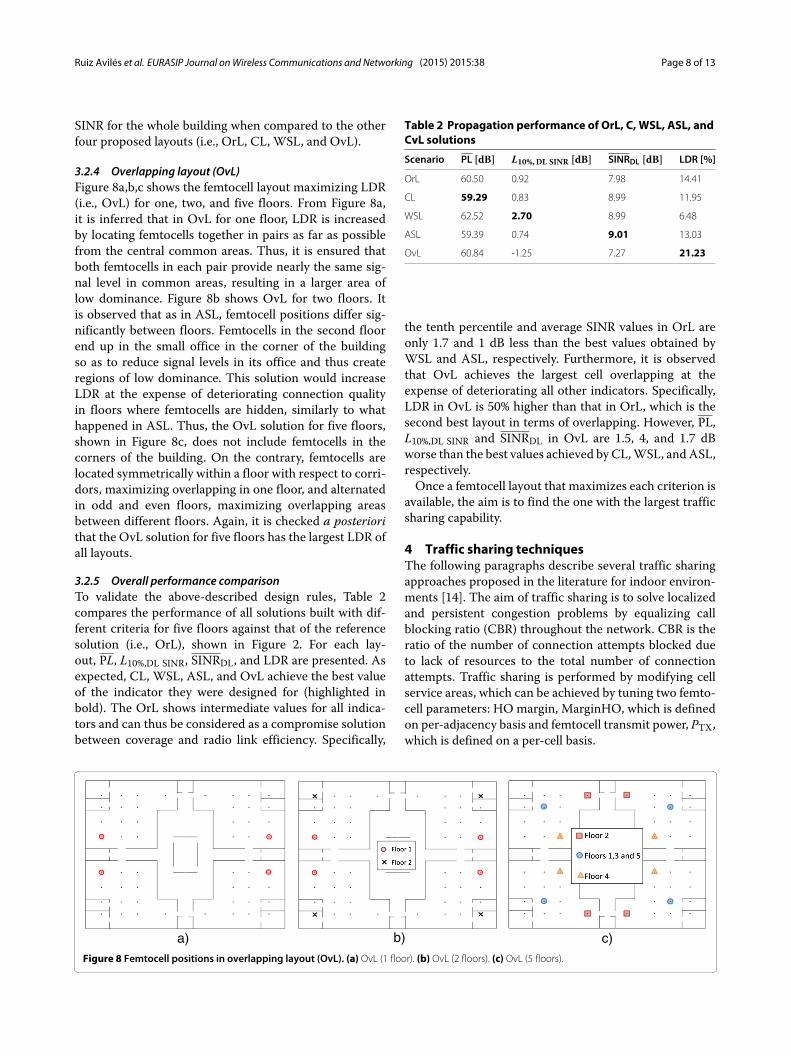
3.2.3 Average SINR layout (ASL)Figure 7a,b,c shows the femtocell layout maximizingSINRDL (i.e., ASL) for one, two, and five floors. A quick
inspection of Figure 7a reveals that, when one floor is ana-lyzed, ASL follows the same principles as those for WSL.By hiding two femtocells in small rooms in opposite cor-ners of the building, it is enforced that for a large shareof points in the scenario, the path to any cell other thanthe serving cell crosses, at least, two walls. Thus, aver-age SINR is improved. Figure 7b illustrates ASL whentwo floors are analyzed. It is observed that, when a newfloor is added, femtocells must be staggered vertically tomaximize SINRDL. Not shown is the fact that both ASLsolutions (one and two floors) improve the overall averageSINR by deteriorating the average SINR in some offices(i.e., those where femtocells are hidden in small rooms). Asthis is not acceptable, a new ASL solution is constructedfor the whole building. Figure 7c shows the ASL plan forfive floors, which has been designed with the followingheuristic criteria: 1) femtocells cannot be located insidesmall rooms in the office, 2) femtocells are located try-ing to maximize PL to the serving area of other femtocells(by reducing interference level from other femtocells, it isexpected that average SINR increases), and 3) femtocellpositions from ASL for one and two floors are reutilized,given that they fulfill criteria 1) and 2). A posteriori, it ischecked that ASL in Figure 7c presents the largest average
a) b) c) Figure 7 Femtocell positions in average SINR layout (ASL). (a) ASL (1 floor). (b) ASL (2 floors). (c) ASL (5 floors).
Ruiz Avilés et al. EURASIP Journal onWireless Communications and Networking (2015) 2015:38 Page 8 of 13
SINR for the whole building when compared to the otherfour proposed layouts (i.e., OrL, CL, WSL, and OvL).
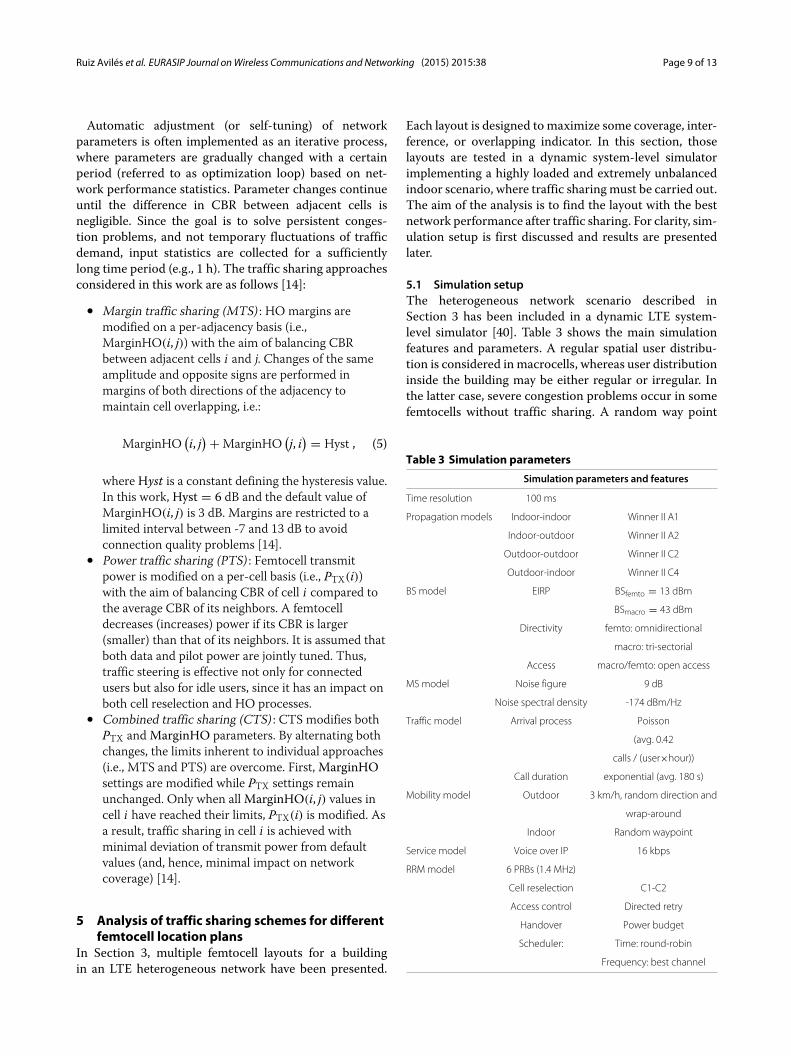
3.2.4 Overlapping layout (OvL)Figure 8a,b,c shows the femtocell layout maximizing LDR(i.e., OvL) for one, two, and five floors. From Figure 8a,it is inferred that in OvL for one floor, LDR is increasedby locating femtocells together in pairs as far as possiblefrom the central common areas. Thus, it is ensured thatboth femtocells in each pair provide nearly the same sig-nal level in common areas, resulting in a larger area oflow dominance. Figure 8b shows OvL for two floors. Itis observed that as in ASL, femtocell positions differ sig-nificantly between floors. Femtocells in the second floorend up in the small office in the corner of the buildingso as to reduce signal levels in its office and thus createregions of low dominance. This solution would increaseLDR at the expense of deteriorating connection qualityin floors where femtocells are hidden, similarly to whathappened in ASL. Thus, the OvL solution for five floors,shown in Figure 8c, does not include femtocells in thecorners of the building. On the contrary, femtocells arelocated symmetrically within a floor with respect to corri-dors, maximizing overlapping in one floor, and alternatedin odd and even floors, maximizing overlapping areasbetween different floors. Again, it is checked a posteriorithat the OvL solution for five floors has the largest LDR ofall layouts.
3.2.5 Overall performance comparisonTo validate the above-described design rules, Table 2compares the performance of all solutions built with dif-ferent criteria for five floors against that of the referencesolution (i.e., OrL), shown in Figure 2. For each lay-out, PL, L10%,DL SINR, SINRDL, and LDR are presented. Asexpected, CL, WSL, ASL, and OvL achieve the best valueof the indicator they were designed for (highlighted inbold). The OrL shows intermediate values for all indica-tors and can thus be considered as a compromise solutionbetween coverage and radio link efficiency. Specifically,
Table 2 Propagation performance of OrL, C, WSL, ASL, andCvL solutions
Scenario PL [dB] L10%,DL SINR [dB] SINRDL [dB] LDR [%]
OrL 60.50 0.92 7.98 14.41
CL 59.29 0.83 8.99 11.95
WSL 62.52 2.70 8.99 6.48
ASL 59.39 0.74 9.01 13.03
OvL 60.84 -1.25 7.27 21.23
the tenth percentile and average SINR values in OrL areonly 1.7 and 1 dB less than the best values obtained byWSL and ASL, respectively. Furthermore, it is observedthat OvL achieves the largest cell overlapping at theexpense of deteriorating all other indicators. Specifically,LDR in OvL is 50% higher than that in OrL, which is thesecond best layout in terms of overlapping. However, PL,L10%,DL SINR and SINRDL in OvL are 1.5, 4, and 1.7 dBworse than the best values achieved by CL,WSL, andASL,respectively.Once a femtocell layout that maximizes each criterion is
available, the aim is to find the one with the largest trafficsharing capability.
4 Traffic sharing techniquesThe following paragraphs describe several traffic sharingapproaches proposed in the literature for indoor environ-ments [14]. The aim of traffic sharing is to solve localizedand persistent congestion problems by equalizing callblocking ratio (CBR) throughout the network. CBR is theratio of the number of connection attempts blocked dueto lack of resources to the total number of connectionattempts. Traffic sharing is performed by modifying cellservice areas, which can be achieved by tuning two femto-cell parameters: HO margin, MarginHO, which is definedon per-adjacency basis and femtocell transmit power, PTX,which is defined on a per-cell basis.
a) b) c) Figure 8 Femtocell positions in overlapping layout (OvL). (a) OvL (1 floor). (b) OvL (2 floors). (c) OvL (5 floors).
Ruiz Avilés et al. EURASIP Journal onWireless Communications and Networking (2015) 2015:38 Page 9 of 13
Automatic adjustment (or self-tuning) of networkparameters is often implemented as an iterative process,where parameters are gradually changed with a certainperiod (referred to as optimization loop) based on net-work performance statistics. Parameter changes continueuntil the difference in CBR between adjacent cells isnegligible. Since the goal is to solve persistent conges-tion problems, and not temporary fluctuations of trafficdemand, input statistics are collected for a sufficientlylong time period (e.g., 1 h). The traffic sharing approachesconsidered in this work are as follows [14]:
• Margin traffic sharing (MTS) : HO margins aremodified on a per-adjacency basis (i.e.,MarginHO(i, j)) with the aim of balancing CBRbetween adjacent cells i and j. Changes of the sameamplitude and opposite signs are performed inmargins of both directions of the adjacency tomaintain cell overlapping, i.e.:
MarginHO(i, j
) + MarginHO(j, i
) = Hyst , (5)
whereHyst is a constant defining the hysteresis value.In this work, Hyst = 6 dB and the default value ofMarginHO(i, j) is 3 dB. Margins are restricted to alimited interval between -7 and 13 dB to avoidconnection quality problems [14].
• Power traffic sharing (PTS) : Femtocell transmitpower is modified on a per-cell basis (i.e., PTX(i))with the aim of balancing CBR of cell i compared tothe average CBR of its neighbors. A femtocelldecreases (increases) power if its CBR is larger(smaller) than that of its neighbors. It is assumed thatboth data and pilot power are jointly tuned. Thus,traffic steering is effective not only for connectedusers but also for idle users, since it has an impact onboth cell reselection and HO processes.
• Combined traffic sharing (CTS) : CTS modifies bothPTX andMarginHO parameters. By alternating bothchanges, the limits inherent to individual approaches(i.e., MTS and PTS) are overcome. First,MarginHOsettings are modified while PTX settings remainunchanged. Only when allMarginHO(i, j) values incell i have reached their limits, PTX(i) is modified. Asa result, traffic sharing in cell i is achieved withminimal deviation of transmit power from defaultvalues (and, hence, minimal impact on networkcoverage) [14].
5 Analysis of traffic sharing schemes for differentfemtocell location plans
In Section 3, multiple femtocell layouts for a buildingin an LTE heterogeneous network have been presented.
Each layout is designed to maximize some coverage, inter-ference, or overlapping indicator. In this section, thoselayouts are tested in a dynamic system-level simulatorimplementing a highly loaded and extremely unbalancedindoor scenario, where traffic sharingmust be carried out.The aim of the analysis is to find the layout with the bestnetwork performance after traffic sharing. For clarity, sim-ulation setup is first discussed and results are presentedlater.
5.1 Simulation setupThe heterogeneous network scenario described inSection 3 has been included in a dynamic LTE system-level simulator [40]. Table 3 shows the main simulationfeatures and parameters. A regular spatial user distribu-tion is considered inmacrocells, whereas user distributioninside the building may be either regular or irregular. Inthe latter case, severe congestion problems occur in somefemtocells without traffic sharing. A random way point
Table 3 Simulation parameters
Simulation parameters and features
Time resolution 100 ms
Propagation models Indoor-indoor Winner II A1
Indoor-outdoor Winner II A2
Outdoor-outdoor Winner II C2
Outdoor-indoor Winner II C4
BS model EIRP BSfemto = 13 dBm
BSmacro = 43 dBm
Directivity femto: omnidirectional
macro: tri-sectorial
Access macro/femto: open access
MS model Noise figure 9 dB
Noise spectral density -174 dBm/Hz
Traffic model Arrival process Poisson
(avg. 0.42
calls / (user×hour))
Call duration exponential (avg. 180 s)
Mobility model Outdoor 3 km/h, random direction and
wrap-around
Indoor Random waypoint
Service model Voice over IP 16 kbps
RRM model 6 PRBs (1.4 MHz)
Cell reselection C1-C2
Access control Directed retry
Handover Power budget
Scheduler: Time: round-robin
Frequency: best channel
Ruiz Avilés et al. EURASIP Journal onWireless Communications and Networking (2015) 2015:38 Page 10 of 13
mobility model is used for indoor users. Changes of floorare not considered. For simplicity, voice-over-IP service issimulated.Two experiments are carried out. In a first experiment,
all femtocell layouts (OrL, CL, WSL, ASL, and OvL) aretested with a uniform user spatial distribution. The aimis to evaluate the performance of femtocell layouts inan interference-limited indoor scenario under uniformtraffic distribution. For this purpose, user population isconfigured so that average PRB utilization ratio is 50% inall cells. Due to the uniform user distribution, there is nopoint in sharing traffic between femtocells, and only oneoptimization loop is simulated.In a second experiment, an extremely uneven user spa-
tial distribution is configured in the scenario. The distri-bution is designed to model a worst-case scenario, where:a) most users are located in one office, causing severecongestion problems in the corresponding femtocell (andhence the need for sharing traffic with other cells) and b)the remaining users are concentrated on adjacent femto-cells, either on the same floor or in the upper/lower floor,which makes traffic sharing more difficult and increasesinterference levels. Specifically, 87% of users start theirconnections in one office of the middle floor, 12% inother offices of the middle floor and the other 1% aredistributed in other floors. With this uneven user spa-tial distribution, PRB utilization varies from less than 1%(femtocells of floors 1 and 5) up to 85% (femtocell in office3, floor 3) with the default network parameter settings.Traffic sharing is therefore needed to reduce congestionin overloaded femtocells. To check the impact of femtocellpositions on traffic sharing, 25 optimization loops of MTSare simulated with each femtocell layout.Having identified in previous experiments that cell over-
lapping improves traffic sharing, in a third experiment, itis shown that cell overlapping of an existing femtocell lay-out can be modified in the operational stage by changingnetwork parameters. Note that an already existing layoutmight have not been designed with the overlapping cri-terion, and thus, any traffic sharing technique increasingcell overlapping is of interest. MTS does not modify celloverlapping, and it is therefore limited by the quality ofthe femtocell location plan. In contrast, PTS dynamicallychanges femtocell transmit power, which has an impacton the overlapping between femtocells and, consequently,on traffic sharing. For this purpose, 50 loops of CTS (i.e.,combination of MTS and PTS) are simulated in the refer-ence layout (i.e., OrL, which is not designed for maximumoverlapping) with the uneven user distribution.Two key performance indicators are used to assess fem-
tocell layouts and traffic sharing schemes: a) CBR, as ameasure of network capacity and b) outage ratio, OR,defined as the ratio of unserved connection time due totemporary lack of resources or bad SINR of users, as a
measure of network connection quality. For ease of anal-ysis, CBR and OR are aggregated into a single figureof merit, the unsatisfied user ratio, UUR, computed asUUR = CBR + OR · (1 − CBR). All these indicatorsare collected in each optimization loop, consisting of 1h of network time. Also for simplicity, dropped calls aredisabled in the simulation.
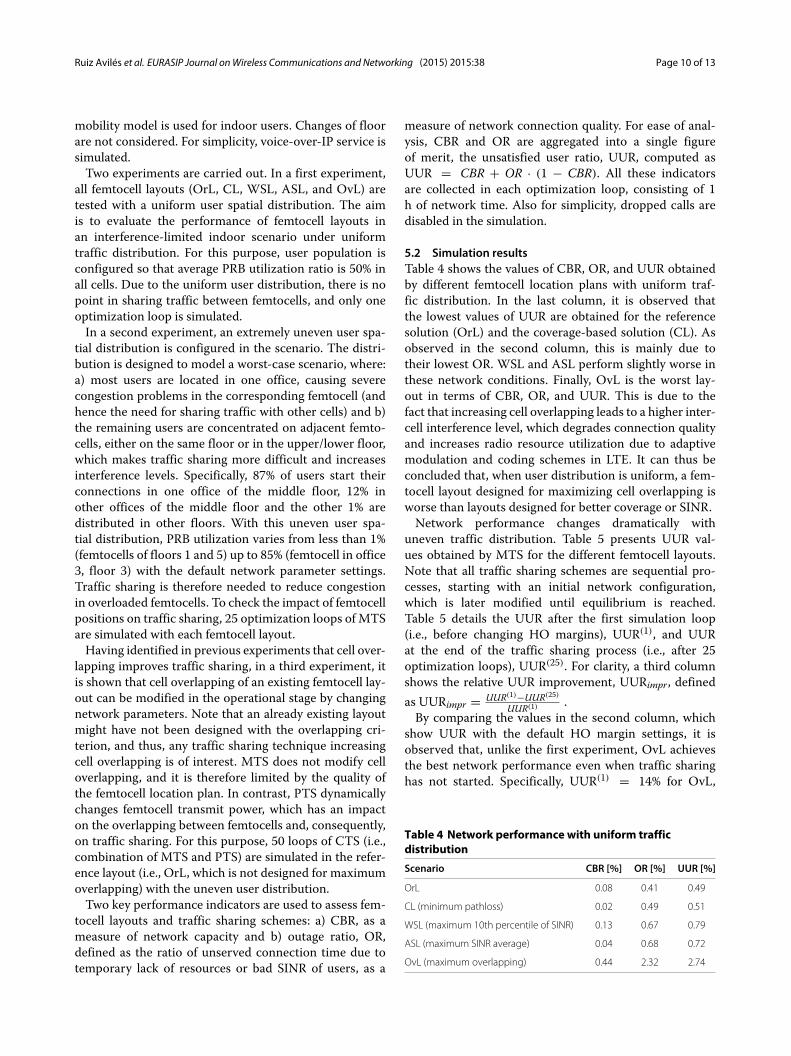
5.2 Simulation resultsTable 4 shows the values of CBR, OR, and UUR obtainedby different femtocell location plans with uniform traf-fic distribution. In the last column, it is observed thatthe lowest values of UUR are obtained for the referencesolution (OrL) and the coverage-based solution (CL). Asobserved in the second column, this is mainly due totheir lowest OR. WSL and ASL perform slightly worse inthese network conditions. Finally, OvL is the worst lay-out in terms of CBR, OR, and UUR. This is due to thefact that increasing cell overlapping leads to a higher inter-cell interference level, which degrades connection qualityand increases radio resource utilization due to adaptivemodulation and coding schemes in LTE. It can thus beconcluded that, when user distribution is uniform, a fem-tocell layout designed for maximizing cell overlapping isworse than layouts designed for better coverage or SINR.Network performance changes dramatically with
uneven traffic distribution. Table 5 presents UUR val-ues obtained by MTS for the different femtocell layouts.Note that all traffic sharing schemes are sequential pro-cesses, starting with an initial network configuration,which is later modified until equilibrium is reached.Table 5 details the UUR after the first simulation loop(i.e., before changing HO margins), UUR(1), and UURat the end of the traffic sharing process (i.e., after 25optimization loops), UUR(25). For clarity, a third columnshows the relative UUR improvement, UURimpr , definedas UURimpr = UUR(1)−UUR(25)
UUR(1) .By comparing the values in the second column, which
show UUR with the default HO margin settings, it isobserved that, unlike the first experiment, OvL achievesthe best network performance even when traffic sharinghas not started. Specifically, UUR(1) = 14% for OvL,
Table 4 Network performance with uniform trafficdistribution
Scenario CBR [%] OR [%] UUR [%]
OrL 0.08 0.41 0.49
CL (minimum pathloss) 0.02 0.49 0.51
WSL (maximum 10th percentile of SINR) 0.13 0.67 0.79
ASL (maximum SINR average) 0.04 0.68 0.72
OvL (maximum overlapping) 0.44 2.32 2.74
Ruiz Avilés et al. EURASIP Journal onWireless Communications and Networking (2015) 2015:38 Page 11 of 13
Table 5 Performance ofmargin traffic sharing with uneventraffic distribution
Scenario UUR(1) [%] UUR(25) [%] UURimpr [%]
OrL 17.20 12.30 28.48
CL (minimum pathloss) 15.55 10.55 32.14
WSL (maximum 10th-percentile 18.18 12.86 29.27of SINR)
ASL (maximum SINR average) 17.68 12.45 29.54
OvL (maximum overlapping) 14.00 5.67 59.49
whereas UUR(1) = 15.55% for the best of the other meth-ods (i.e., OrL). More importantly, MTS provides the bestresults for OvL at the end of the tuning process. Specif-ically, UUR(25) = 5.67% for OvL, which is nearly halfthat achieved by MTS in the best of other layouts (i.e.,10.55% for CL). From these results, it can be concludedthat, even if OvL performs slightly worse than the otherlayouts for a uniform traffic distribution, OvL performssignificantly better than the other layouts with uneventraffic distribution.Results presented so far are obtained for an extremely
uneven spatial user distribution. An important issue iswhether OvL also outperforms the other techniques forless uneven distributions. A simulation campaign hasbeen run for the same scenario and different spatial userdistributions according to a non-uniformity parameter, x.For x = 0 , the spatial user distribution is the regular oneused in the first experiment. For x = 1, the spatial userdistribution is the extreme one simulated in the secondexperiment. For other values of x, the number of users ineach office is a weighted average between the values in
the regular and extremely irregular distributions. Results(not shown here for brevity) prove that OvL is the besttechnique for x ≥ 0.2. It can thus be concluded that OvLhas the best results even for slightly uneven distributions.Having identified that cell overlapping is a desirable
property in indoor scenarios with congestion problems, itmakes sense to investigate other traffic sharing strategiesthat increase cell overlapping in an already existing fem-tocell layout. Again, recall that MTS does not change celloverlapping. In contrast, PTS (and CTS) modifies cover-age areas by changing PTX values, which has an impacton cell overlapping that could overcome the limitationsof an existing femtocell layout. At the same time, PTSchanges cell service areas, sending users from congestedcells (whose power is increased) to empty cells (whosepower is decreased).To check the capability of PTS to improve traffic shar-
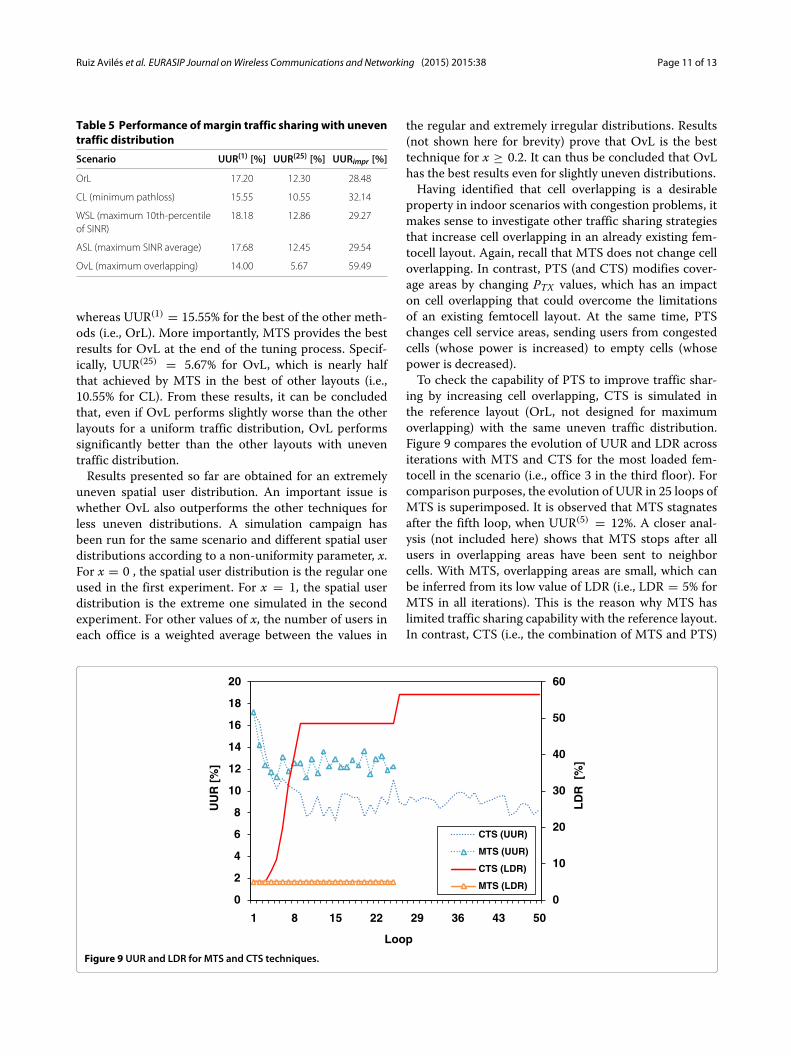
ing by increasing cell overlapping, CTS is simulated inthe reference layout (OrL, not designed for maximumoverlapping) with the same uneven traffic distribution.Figure 9 compares the evolution of UUR and LDR acrossiterations with MTS and CTS for the most loaded fem-tocell in the scenario (i.e., office 3 in the third floor). Forcomparison purposes, the evolution of UUR in 25 loops ofMTS is superimposed. It is observed that MTS stagnatesafter the fifth loop, when UUR(5) = 12%. A closer anal-ysis (not included here) shows that MTS stops after allusers in overlapping areas have been sent to neighborcells. With MTS, overlapping areas are small, which canbe inferred from its low value of LDR (i.e., LDR = 5% forMTS in all iterations). This is the reason why MTS haslimited traffic sharing capability with the reference layout.In contrast, CTS (i.e., the combination of MTS and PTS)
0
10
20
30
40
50
60
0
2
4
6
8
10
12
14
16
18
20
1 8 15 22 29 36 43 50
LD
R [
%]
UU
R [
%]
Loop
CTS (UUR)
MTS (UUR)
CTS (LDR)
MTS (LDR)
Figure 9 UUR and LDR for MTS and CTS techniques.
Ruiz Avilés et al. EURASIP Journal onWireless Communications and Networking (2015) 2015:38 Page 12 of 13
decreases UUR from 17.2% up to 8%. In CTS, changes offemtocell transmit power performed by PTS (loops 5, 6, 7,and 27) cause that LDR increases in this scenario. Specif-ically, LDR increases from 5% up to 57% with CTS. Thus,PTS creates new overlapping areas in the reference layoutwhere traffic can be shared between neighbor cells. Thus,the ability of MTS to steer traffic is enhanced by PTS inCTS. A deeper analysis proves that abrupt changes in LDRcoincide with changes in PTX.
6 ConclusionsIn this paper, a new strategy for placing femtocell accesspoints based on a cell overlapping indicator has been pro-posed for LTE heterogeneous scenarios. The aim of thestrategy is to make the most of traffic sharing schemesused to deal with irregular user distribution. It has beenshown here that this can be achieved by increasing thepercentage of areas with low dominance of the servingcell.A preliminary analysis has been carried out to find
some basic rules to locate femtocells in an office buildingso as to maximize different network performance crite-ria, amongst which is the proposed novel criterion basedon cell overlapping. With these rules, a set of femtocelllocation plans have been constructed. Then, a compre-hensive performance analysis of classical traffic sharingalgorithms with the different location plans has beenperformed in a dynamic system-level simulator.Results have shown that, with uniform traffic, location
plans designed for maximum low dominance ratios haveworse call blocking and outage ratios. Specifically, a four-fold increase in both key performance indicators has beenobserved in the simulated scenario with uniform traf-fic when compared to the worse values obtained withcoverage-based and interference-based femtocell locationplans. However, with uneven spatial user distribution, thelocation plan designed to increase low dominance ratiosobtains the best results before and after executing the traf-fic sharing process. In the simulated extreme scenario, theunsatisfied user ratio obtained by handover-based traf-fic sharing with the overlapping-based location plan is40% smaller than that of the best of the other locationplans.Likewise, it has been shown that increasing low domi-
nance ratios in an existing femtocell layout by tuning fem-tocell power settings helps to improve the performanceof handover-based traffic sharing schemes. This has beenused to explain the benefit of jointly tuning HO marginsand femtocell transmit power for sharing traffic in LTEindoor scenarios.The proposed femtocell location approach is conceived
for office scenarios where traffic is unevenly distributedand femtocells can share traffic, although it is also appli-cable to more general scenarios. Since the novel design
criterion relies on signal level predictions, it must beused together with propagation prediction models andoptimization engines in network planning tools.AbbreviationsAP: access point; APP: antenna placement problem; ASL: average SINR layout;BS: base station; CBR: call blocking ratio; CL: coverage layout; CTS: combinedtraffic sharing; DL: downLink; EIRP: effective isotropic radiated power; FDMA:frequency division multiple access; FL: floor losses; GSM: global system formobile communication; HO: handOver; IP: internet protocol; LDR: lowdominance ratio; LOS: line-of-sight; LTE: long-term evolution; MS: mobilestation; MTS: margin traffic sharing; NLOS: non line-of-sight; OFDMA:orthogonal frequency division multiple access; OR: outage ratio; OrL: originallayout; OvL: overlapping layout; PL: pathloss; PRB: physical resource block; PTS:power traffic sharing; RRM: radio resource management; SINR: signal tointerference plus noise ratio; SON: self-organizing network; TDMA: timedivision multiple access; UL: upLink; UUR: unsatisfied user ratio; WCDMA:wideband code division multiple access; WSL: worst-case SINR layout.
Competing interestsThe authors declare that they have no competing interests.
AcknowledgementsThis work has been funded by the Spanish Ministries of Science andInnovation (grant TEC2009-13413) and Economy and Competitiveness (grantTIN2012-36455).
Received: 30 June 2014 Accepted: 6 January 2015
References1. S Saunders, in 2nd Intl. Conference on Home Access Points and Femtocells.
London. The role of cooperation in establishing an efficient femtoeconomy, (2007), pp. 1–5
2. V Chandrasekhar, J Andrews, A Gatherer, Femtocell networks: a survey.IEEE Commun. Mag. 46(9), 59–67 (2008)
3. M Bennis, L Giupponi, EM Diaz, M Lalam, M Maqbool, EC Strinati, ADe Domenico, M Latva-aho, in 2nd International Conference onWirelessCommunication, Vehicular Technology, Information Theory and AerospaceElectronic Systems Technology (Wireless VITAE). Interference managementin self-organized femtocell networks: the BeFEMTO approach, (2011),pp. 1–6
4. H Claussen, F Pivit, LTW Ho, Self-optimization of femtocell coverage tominimize the increase in core network mobility signalling. Bell Labs Tech.J. 14(2), 155–183 (2009)
5. J Ramiro, K Hamied, Self-Organizing Networks: Self-Planning,Self-Optimization and Self-Healing for GSM, UMTS and LTE (John Wiley &Sons, UK, 2011)
6. 4G Americas, The benefits of SON in LTE: self-optimizing andself-organizing networks. Technical report (Dec 2009)
7. Next Generation Mobile Networks Recommendation on SON and O&Mrequirements. Technical report, NGMN (2008)
8. 3GPP, in TS 36.521. E-UTRA; UE conformance specification; Self-configuringand self-optimizing network (SON) use cases and solutions
9. J-S Wu, J-K Chung, C-C Wen, Hot-spot traffic relief with a tilted antenna inCDMA cellular networks. Vehicular Technol. IEEE Trans. on 47(1), 1–9(1998)
10. M Toril, V Wille, Optimization of handover parameters for traffic sharing inGERAN. Wireless Personal Commun. 47(3), 315–336 (2008)
11. J Li, C Fan, D Yang, J Gu, in Proc. IEEE 62nd Vehicular Technology Conference(VTC). UMTS soft handover algorithm with adaptive thresholds for loadbalancing, vol. 4, (2005), pp. 2508–2512
12. A Lobinger, S Stefanski, T Jansen, I Balan, in Proc. IEEE 71st VehicularTechnology Conference (VTC). Load balancing in downlink LTEself-optimizing networks, (2010), pp. 1–5
13. R Kwan, R Arnott, R Paterson, R Trivisonno, M Kubota, in Proc. IEEE 72ndVehicular Technology Conference (VTC). On mobility load balancing for LTEsystems, (2010), pp. 1–5
14. JM Ruiz-Aviles, S Luna-Ramirez, M Toril, F Ruiz, Traffic steering byself-tuning controllers in enterprise LTE femtocells. EURASIP J. WirelessCommun. Networking 2012(1), 337 (2012)
Ruiz Avilés et al. EURASIP Journal onWireless Communications and Networking (2015) 2015:38 Page 13 of 13
15. HR Anderson, JP McGeehan, in Proc. IEEE 44th Vehicular Technol.Conference (VTC). Optimizing microcell base station locations usingsimulated annealing techniques, vol. 2, (1994), pp. 858–862
16. CY Lee, HG Kang, Cell planning with capacity expansion in mobilecommunications: a tabu search approach. IEEE Trans. Vehicular Technol.49(5), 1678–1691 (2000)
17. AJ Nebro, F Chicano, F Luna, in Numerical Methods and Applications: 6thInternational Conference. Optimal antenna placement using a newmulti-objective CHC algorithm, (2007)
18. L Raisanen, R Whitaker, Comparison and evaluation of multiple objectivegenetic algorithms for the antenna placement problem. Mobile NetworksApp. 10(1-2), 79–88 (2005)
19. E Amaldi, A Capone, F Malucelli, Planning UMTS base station location:optimization models with power control and algorithms. IEEE Trans.Wireless Commun. 2(5), 939–952 (2003)
20. MJ Nawrocki, TW Wieckowski, in 14th International Conference onMicrowaves, Radar andWireless Communications. Optimal site andantenna location for UMTS output results of 3G network simulationsoftware, vol. 3, (2002), pp. 890–893
21. Niemelä, J Lempiäinen, in IEEE 6th Int. Symp. onWireless PersonalMultimedia Communications Conf. Impact of base station locations andantenna orientations on UMTS radio network capacity and coverageevolution, vol. 2 (Yokosuka, 2003), pp. 82–86
22. L Nagy, L Farkas, in The 11th IEEE International Symposium on Personal,Indoor andMobile Radio Communications. Indoor base station locationoptimization using genetic algorithms, vol. 2, (2000), pp. 843–846
23. Z Ji, TK Sarkar, B-H Li, Methods for optimizing the location of base stationsfor indoor wireless communications. IEEE Trans. Antennas Propagation50(10), 1481–1483 (2002)
24. JKL Wong, AJ Mason, MJ Neve, KW Sowerby, Base station placement inindoor wireless systems using binary integer programming. IEE Proc.Commun. 153(5), 771–778 (2006)
25. Y Ngadiman, YH Chew, BS Yeo, in IEEE 16th International Symposium onPersonal, Indoor andMobile Radio Communications. A new approach forfinding optimal base stations configuration for CDMA systems jointlywith uplink and downlink constraints, vol. 4, (2005), pp. 2751–2755
26. T Fruhwirth, P Brisset, Placing base stations in wireless indoorcommunication networks. Intell. Syst. Appl. IEEE 15(1), 49–53 (2000)
27. SJ Fortune, DM Gay, BW Kernighan, O Landron, RA Valenzuela, MH Wright,Wise design of indoor wireless systems: practical computation andoptimization. Comput. Sci. Eng. IEEE 2(1), 58–68 (1995)
28. M Talau, ECG Wille, HS Lopes, in 2013 IEEE Symposium on ComputationalIntelligence for Communication Systems and Networks. Solving the basestation placement problem by means of swarm intelligence, (2013),pp. 39–44
29. L Pujji, K Sowerby, M Neve, Development of a hybrid algorithm forefficient optimisation of base station placement for indoor wirelesscommunication systems. Wireless Personal Commun. 69(1), 471–486(2013)
30. MA Abd Rahman, M Dashti, J Zhang, in International Conference onLocalization and GNSS. Localization of unknown indoor wirelesstransmitter, (2013), pp. 1–6
31. L Nagy, Z Szalay, in Conference Proceedings ICECom. Global optimization ofindoor radio coverage, (2010), pp. 1–4
32. SF Rodd, A Prof, AH Kulkarni, Optimization algorithms for access pointdeployment in wireless networks. J. Comput. Appl. 2(1), 2–2 (2009)
33. LK Pujji, KW Sowerby, MJ Neve, in Communication Networks and ServicesResearch Conference, 2009. A new algorithm for efficient optimisation ofbase station placement in indoor wireless communication systems,(2009), pp. 425–427
34. S Wang, W Guo, T O’Farrell, in IEEE 76th Vehicular Technology Conference(VTC). Optimising femtocell placement in an interference limited network:theory and simulation, (2012), pp. 1–6
35. J Liu, Q Chen, HD Sherali, in Proceedings IEEE INFOCOM. Algorithm designfor femtocell base station placement in commercial buildingenvironments, (2012), pp. 2951–2955
36. C Sharma, Y-F Wong, W-S Soh, W-C Wong, in IEEE International Conferenceon Communication Systems. Access point placement for fingerprint-basedlocalization, (2010), pp. 238–243
37. K Farkas, A Huszák, G Gódor, Optimization of Wi-Fi access pointplacement for indoor localization. IEEE 6th Symp. On Wireless PersonalMultimedia Com. Conference 1, 28–33 (2013)
38. D1.1.2. WINNER II channel models. part II. radio channel measurementand analysis results. v1.0. Technical report, WINNER II IST project (2007)
39. JKL Wong, MJ Neve, KW Sowerby, in Proc. IEEE 63rd Vehicular TechnologyConference (VTC). Optimisation of a multi-code CDMA in-buildingcommunication system, vol. 2, (2006), pp. 846–850
40. JM Ruiz-Aviles, S Luna-Ramirez, M Toril, F Ruiz, I de laBandera Cascales,P Muñoz, R Barco, P Lazaro, V Buenestado, Design of a computationallyefficient dynamic system-level simulator for enterprise LTE femtocellscenarios. J. Electrical Comput. Eng. 2012(1), 14 (2012)
Submit your manuscript to a journal and benefi t from:
7 Convenient online submission
7 Rigorous peer review
7 Immediate publication on acceptance
7 Open access: articles freely available online
7 High visibility within the fi eld
7 Retaining the copyright to your article
Submit your next manuscript at 7 springeropen.com