Embed Size (px)
Citation preview
Applied Acoustics 79 (2014) 75–80
Contents lists available at ScienceDirect
Applied Acoustics
journal homepage: www.elsevier .com/locate /apacoust
Research on the procedure for analyzing the sound quality contributionof sound sources and its application
0003-682X/$ - see front matter � 2013 Elsevier Ltd. All rights reserved.http://dx.doi.org/10.1016/j.apacoust.2013.12.008
⇑ Corresponding author. Tel.: +86 21 34206332; fax: +86 21 34206664 206.E-mail address: [email protected] (W. Jiang).
Li Yan, Weikang Jiang ⇑State Key Lab of Mechanical System and Vibration, Shanghai Jiao Tong University, 800 Dongchuan Road, Shanghai, China
a r t i c l e i n f o a b s t r a c t
Article history:Received 9 February 2013Received in revised form 21 October 2013Accepted 10 December 2013
Keywords:Sound qualityPanel contribution analysisOperational path analysisPartial singular value decomposition
Transfer path analysis (TPA) plays an important role for identifying and quantifying the contribution byairborne and structure-borne in the automotive industry. The main bottleneck of the TPA method is thetest time consumption and complex procedure. It becomes a key target in many applications to find outthe source with dominant contribution to overall noise rather than to identify each source. In recent yearsthe contribution pattern of sources to the vehicle overall interior noise has changed with the reduction ofengine noise, which masks all other sources. The panel radiation noise of vehicle body could not beignored. There is an increasing demand for analyzing the sound quality contribution of sound sourcesin simple ways. The procedure for analyzing sound quality contribution of panel radiation noise is sug-gested in this study, in which an operational path analysis (OPA) method combined with partial singularvalue decomposition (PSVD) analysis is applied and sound quality objective assessment is introduced.The experimental research for verifying the procedure is finished, from which the source with largestsound quality contribution is picked up from three sources. For engineering application, the sound qualitycontributions of panels to the interior noise of a micro commercial vehicle are analyzed by using the pro-cedure. By investigating the contributions of sound sources to each sound quality attribute, the dominantsound source is determined.
� 2013 Elsevier Ltd. All rights reserved.
1. Introduction
Transfer path analysis (TPA) is an experimental technique foridentifying the vibro-acoustic transfer paths in a system, beingthe expression of a problem noise or vibration response as a sumof the contribution due to individual paths and/or sources [1].The bottleneck of the technique is test time and complex proce-dure. There is a demand for simpler and faster methods in industry.In many applications, a first and key question is to identify whichof the different subsystems are the main contributors to the noiserather than identifying each of the sources in detail [2]. For thispurpose, some fast testing procedures are developed complement-ing the traditional troubleshooting in-operation measurements bya limited number of additional frequency response function (FRF)test [1], such as fast TPA, operational path analysis (OPA) [3,4]and TPA synthesis [5,6].
In recent years the contribution pattern of noise sources to thevehicle overall interior noise has changed with the reduction of en-gine noise, which is a source of masking for all other sources. A
large number of secondary sound sources, such as compressor,electric seat adjustment or electric power windows, what are pre-viously masked, have become perceptible to passengers with thereduction principally of engine noise [7]. In general, the isolationof the passenger cabin from the engine has been improved signif-icantly over years. Therefore, the issue now is more about thesound quality of the engine than its noisiness. Many acoustic engi-neers have done researches on sound quality of powertrain fromthe mid ‘80s. The sound quality of vehicle powertrain is oftenobjectively assessed using loudness, roughness and fluctuationstrength [8–11]. The contribution of tire/road noise to interiornoise is the maximum between 40 km/h and 60 km/h. It has be-come increasingly important for sound quality due to the reduc-tion of powertrain noise. This is another research aspectespecially when there is an increased need for good speech intelli-gibility inside vehicles [12,13]. Speech intelligibility is one of met-rics used for evaluating road noise. Wind noise is the predominantcomponent of vehicle interior noise at the speeds above 100 km/h.Perception of steady-state wind noise was well characterized byZwicker loudness [14].
The key step in the OPA method is the calculation of the MIMOtransmissibility matrix H which is defined as the relation betweenan input and output. The procedure to obtain such transmissibility
76 L. Yan, W. Jiang / Applied Acoustics 79 (2014) 75–80
matrix from response measurements was extensively studied inreference [15]. The procedure for analyzing sound quality contri-bution of sources is suggested in this study, in which an OPA meth-od combined with partial singular value decomposition (PSVD) isapplied and sound quality objective assessment is introduced.The paper starts with a general introduction of the OPA methodand PSVD analysis in Section 2. Based on the method, an experi-ment for identifying sound sources is finished, from which thesource with largest sound quality contribution is picked up. Forengineering application, the sound quality contributions of panelradiation noise to a micro commercial vehicle interior noise areanalyzed according to the presented procedure in Section 4. Byinvestigating the contribution of body panels to each sound qualityattributes, the main sound source is determined.
2. Contribution analysis of sound sources
2.1. OPA method
The OPA algorithm has the same basis as the multi-inputs mul-ti-outputs (MIMO) or multi-inputs single-output (MISO) method[3]. Assume that u(t) = [u1,. . ., uK]T are independent sound sources,x(t) = [x1,. . ., xN]T are measured signals near sources and y(t) is themeasured output signal. The MISO system diagram is shown inFig. 1.
The system is defined by the transform relation
Yðf Þ ¼ H1ðf ÞX1ðf Þ þ H2ðf ÞX2ðf Þ þ � � � þ HNðf ÞXNðf Þ ð1Þ
where Y(f), Fourier spectrum of y(t); Xi(f), Fourier spectrum of xi(t);Hi(f), frequency response function
Sij ¼ Sijðf Þ ð2Þ
where i = j, auto-spectrum of xi(t); i – j, cross-spectrum of xi(t) andxj(t)
Sy ¼ Syyðf Þ; auto-spectrum of yðtÞ ð3Þ
The cross-spectral functions from input to output will be
Siy ¼ H1Si1 þ H2Si2 þ � � � þ HNSiN ð4Þ
where Siy = Siy(f), cross-spectrum of xi(t) and y(t)
S1y
..
.
SNy
26643775 ¼
S11 � � � S1N
..
. . .. ..
.
SN1 � � � SNN
26643775
H1
..
.
HN
26643775 ð5Þ
In practical measurement the input signals are coherent, so a singu-lar value decomposition (SVD) technique is required to matrix Sij.
Sij ¼ UKV� ð6Þ
The number of non-zero elements in the singular value matrixK diagonal is equal to K, which is the number of independentsound sources. The diagonal element of the singular value matrixK is donated by kið1 6 i 6 NÞ and can be used to represent eachindependent sound source’s power.
Fig. 1. MISO system.
2.2. PSVD analysis
In order to identify the main inputs, the partial singular valuedecomposition (PSVD) analysis proposed by Jiang [16] was applied.
Assume that signal xq1 measured by the q1ð1 6 q1 6 NÞ sensor iseliminated from signals x(t), the signal x�q1
is denated to
x�q1¼ ½x1�q1
; x2�q1; . . . ; xq1�1�q1
;0; xq1þ1�q1; . . . ; xN�q1
�T ð7Þ
The singular value matrix K�q1 of the auto-spectrum and cross-spectrum matrix Sij�q1
is defined as 1st order partial singular valuematrix, and its diagonal element ki�q1
ð1 6 i 6 NÞ can be used toevaluate the system power after xq1
is eliminated. The element ofmatrix Sij�q1
can be calculated as:
sij�q1¼ sij �
siq1sq1 j
sq1q1
ð8Þ
Sij�q1¼ U1K�q1
V�1 ð9Þ
Assume that xq2�q1ð1 6 q2 6 N; q2–q1Þ is eliminated from
x�q1 ;K�q1 �q2 is defined as 2nd order partial singular value matrix
Sij�q1 �q2¼ U2K�q1 �q2
V�2 q2 ¼ 1;2; � � � ;N q2–q1 ð10Þ
TrðKÞ ¼ k1 þ k2 þ � � � þ kN ¼ s11 þ s22 þ � � � þ sNN ð11Þ
TrðK�q1Þ ¼ k1�q1
þ k2�q1þ � � � þ kN�q1
¼ s11 �s1q1
sq11
sq1q1
� �þ � � � þ s22 �
s2q1sq12
sq1q1
� �þ � � �
þ sNN �sNq1
sq1N
sq1q1
� �ð12Þ
Defining Dk�q1 as:
Dk�q1¼ TrðKÞ � TrðK�q1
Þ ¼ c21q1
s11 þ c22q1
s22 þ � � � þ c2Nq1
sNN
1 6 q1 6 N ð13Þ
The parameter of c2iq1
is correlation coefficient between xi and xq1 .Dk�q1
can be used to evaluate the decreased power due to xq1.
If Dk�q1 corresponding to the p1 sensor is the maximum of allDk�qið1 6 qi 6 NÞ; the position of p1 sensor located in is considered
to be a main source. Another position of p2 sensor located in whereDk�p1 �q2
ð1 6 q2 6 N; q2–p1Þ is the maximum is considered to be an-other main input. And so on, all main sources locationsxp ¼ ½xp1
; . . . ; xpK�T can be identified successively.
2.3. Characterization of main source
The spectrum matrix Spij of xp ¼ ½xp1 ; xp2 ; . . . ; xpK
�T can be decom-posed as following:
Spij ¼ UpKpVp� ð14Þ
The estimate of transfer vector H:eH ¼ VpKp�1Up�Sp
iy ð15Þ
The diagonal elements in Kp arrange descending and cannot de-scribe the character of each independent source. A procedure toanalyze the spectrum of independent sources is presented here.
� Step1: An temporal matrix B is introduce for calculating rear-rangement matrix R, the element bij is the norm of vp
ij, the ele-ments of Kp as below
bij ¼ vpij
��� ���� Step2: If br1c1 is the maximum elements in matrix B, the r1th
row and the c1th column elements in matrix R and matrix Bare defined as below
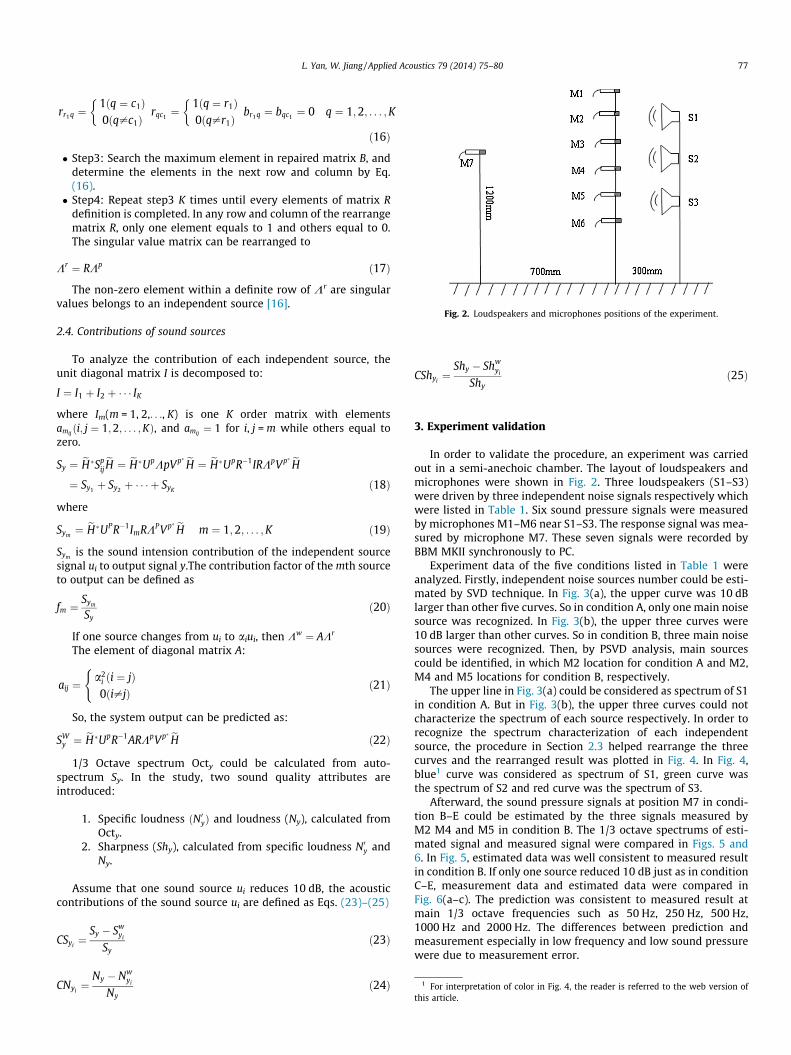
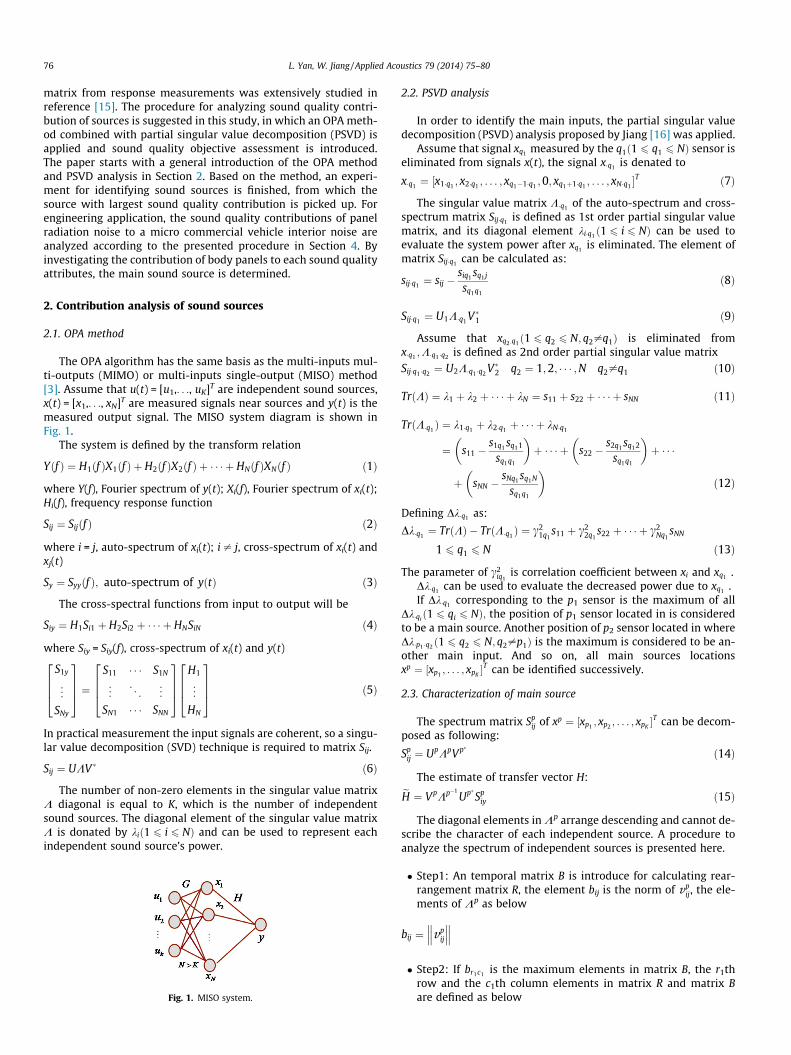
Fig. 2. Loudspeakers and microphones positions of the experiment.
1 For interpretation of color in Fig. 4, the reader is referred to the web version ofthis article.
L. Yan, W. Jiang / Applied Acoustics 79 (2014) 75–80 77
rr1q ¼1ðq ¼ c1Þ0ðq–c1Þ
�rqc1¼
1ðq ¼ r1Þ0ðq–r1Þ
�br1q ¼ bqc1
¼ 0 q ¼ 1;2; . . . ;K
ð16Þ
� Step3: Search the maximum element in repaired matrix B, anddetermine the elements in the next row and column by Eq.(16).� Step4: Repeat step3 K times until every elements of matrix R
definition is completed. In any row and column of the rearrangematrix R, only one element equals to 1 and others equal to 0.The singular value matrix can be rearranged to
Kr ¼ RKp ð17Þ
The non-zero element within a definite row of Kr are singularvalues belongs to an independent source [16].
2.4. Contributions of sound sources
To analyze the contribution of each independent source, theunit diagonal matrix I is decomposed to:
I ¼ I1 þ I2 þ � � � IK
where Im(m = 1, 2,. . ., K) is one K order matrix with elementsamijði; j ¼ 1;2; . . . ;KÞ, and amij
¼ 1 for i, j = m while others equal tozero.
Sy ¼ eH�SpijeH ¼ eH�UpKpVp� eH ¼ eH�UpR�1IRKpVp� eH
¼ Sy1þ Sy2
þ � � � þ SyKð18Þ
where
Sym¼ eH�UPR�1ImRKPVp� eH m ¼ 1;2; . . . ;K ð19Þ
Symis the sound intension contribution of the independent source
signal ui to output signal y.The contribution factor of the mth sourceto output can be defined as
fm ¼Sym
Syð20Þ
If one source changes from ui to aiui, then Kw ¼ AKr
The element of diagonal matrix A:
aij ¼a2
i ði ¼ jÞ0ði–jÞ
(ð21Þ
So, the system output can be predicted as:
SWy ¼ eH�UpR�1ARKpVp� eH ð22Þ
1/3 Octave spectrum Octy could be calculated from auto-spectrum Sy. In the study, two sound quality attributes areintroduced:
1. Specific loudness ðN0yÞ and loudness (Ny), calculated fromOcty.
2. Sharpness (Shy), calculated from specific loudness N0y andNy.
Assume that one sound source ui reduces 10 dB, the acousticcontributions of the sound source ui are defined as Eqs. (23)–(25)
CSyi¼
Sy � Swyi
Syð23Þ
CNyi¼
Ny � Nwyi
Nyð24Þ
CShyi¼
Shy � Shwyi
Shyð25Þ
3. Experiment validation
In order to validate the procedure, an experiment was carriedout in a semi-anechoic chamber. The layout of loudspeakers andmicrophones were shown in Fig. 2. Three loudspeakers (S1–S3)were driven by three independent noise signals respectively whichwere listed in Table 1. Six sound pressure signals were measuredby microphones M1–M6 near S1–S3. The response signal was mea-sured by microphone M7. These seven signals were recorded byBBM MKII synchronously to PC.
Experiment data of the five conditions listed in Table 1 wereanalyzed. Firstly, independent noise sources number could be esti-mated by SVD technique. In Fig. 3(a), the upper curve was 10 dBlarger than other five curves. So in condition A, only one main noisesource was recognized. In Fig. 3(b), the upper three curves were10 dB larger than other curves. So in condition B, three main noisesources were recognized. Then, by PSVD analysis, main sourcescould be identified, in which M2 location for condition A and M2,M4 and M5 locations for condition B, respectively.
The upper line in Fig. 3(a) could be considered as spectrum of S1in condition A. But in Fig. 3(b), the upper three curves could notcharacterize the spectrum of each source respectively. In order torecognize the spectrum characterization of each independentsource, the procedure in Section 2.3 helped rearrange the threecurves and the rearranged result was plotted in Fig. 4. In Fig. 4,blue1 curve was considered as spectrum of S1, green curve wasthe spectrum of S2 and red curve was the spectrum of S3.
Afterward, the sound pressure signals at position M7 in condi-tion B–E could be estimated by the three signals measured byM2 M4 and M5 in condition B. The 1/3 octave spectrums of esti-mated signal and measured signal were compared in Figs. 5 and6. In Fig. 5, estimated data was well consistent to measured resultin condition B. If only one source reduced 10 dB just as in conditionC–E, measurement data and estimated data were compared inFig. 6(a–c). The prediction was consistent to measured result atmain 1/3 octave frequencies such as 50 Hz, 250 Hz, 500 Hz,1000 Hz and 2000 Hz. The differences between prediction andmeasurement especially in low frequency and low sound pressurewere due to measurement error.
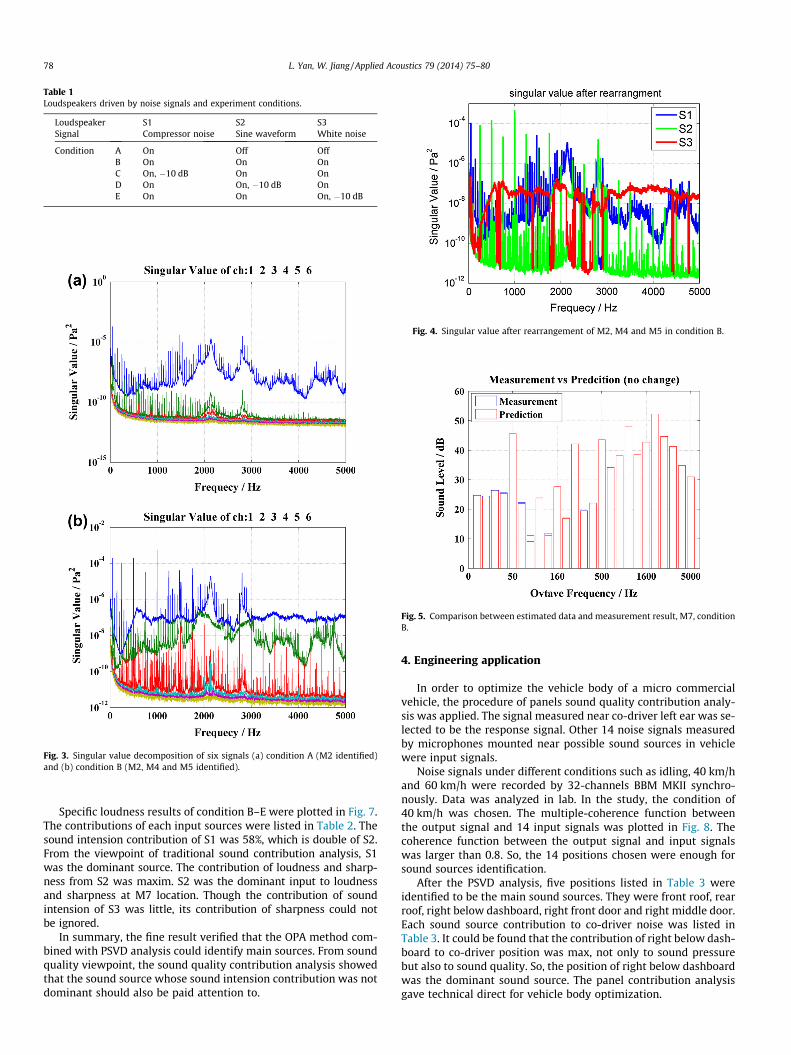
Table 1Loudspeakers driven by noise signals and experiment conditions.
Loudspeaker S1 S2 S3Signal Compressor noise Sine waveform White noise
Condition A On Off OffB On On OnC On, �10 dB On OnD On On, �10 dB OnE On On On, �10 dB
Fig. 3. Singular value decomposition of six signals (a) condition A (M2 identified)and (b) condition B (M2, M4 and M5 identified).
Fig. 4. Singular value after rearrangement of M2, M4 and M5 in condition B.
Fig. 5. Comparison between estimated data and measurement result, M7, conditionB.
78 L. Yan, W. Jiang / Applied Acoustics 79 (2014) 75–80
Specific loudness results of condition B–E were plotted in Fig. 7.The contributions of each input sources were listed in Table 2. Thesound intension contribution of S1 was 58%, which is double of S2.From the viewpoint of traditional sound contribution analysis, S1was the dominant source. The contribution of loudness and sharp-ness from S2 was maxim. S2 was the dominant input to loudnessand sharpness at M7 location. Though the contribution of soundintension of S3 was little, its contribution of sharpness could notbe ignored.
In summary, the fine result verified that the OPA method com-bined with PSVD analysis could identify main sources. From soundquality viewpoint, the sound quality contribution analysis showedthat the sound source whose sound intension contribution was notdominant should also be paid attention to.
4. Engineering application
In order to optimize the vehicle body of a micro commercialvehicle, the procedure of panels sound quality contribution analy-sis was applied. The signal measured near co-driver left ear was se-lected to be the response signal. Other 14 noise signals measuredby microphones mounted near possible sound sources in vehiclewere input signals.
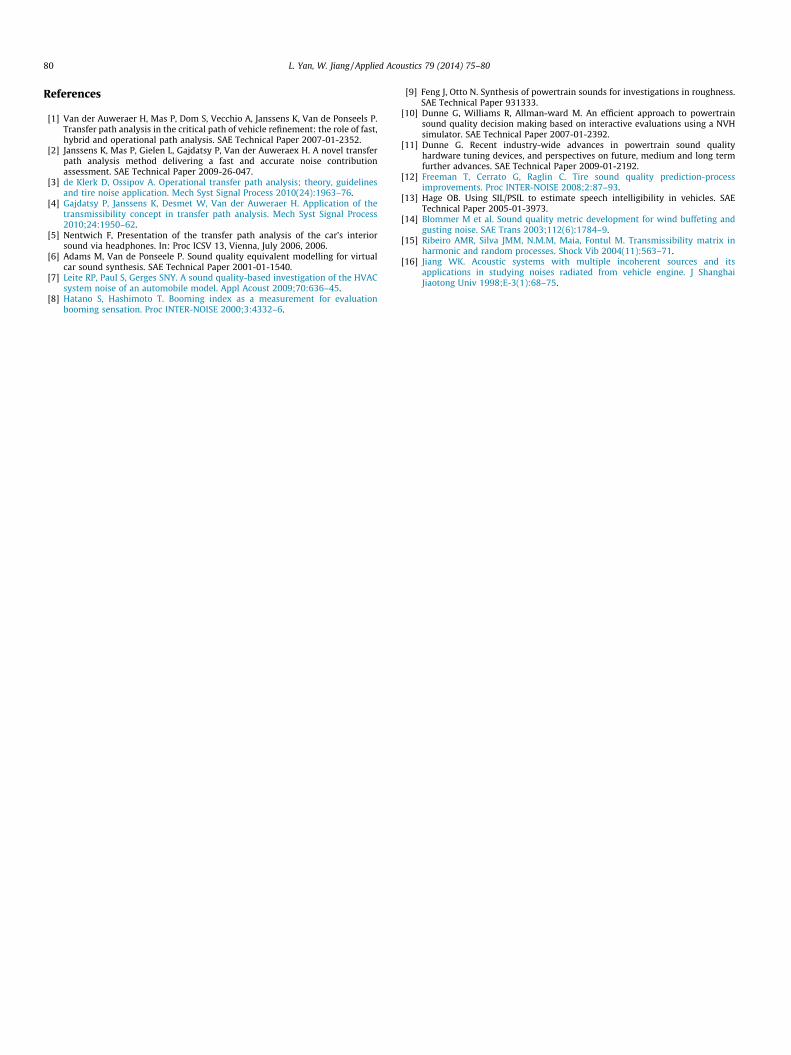
Noise signals under different conditions such as idling, 40 km/hand 60 km/h were recorded by 32-channels BBM MKII synchro-nously. Data was analyzed in lab. In the study, the condition of40 km/h was chosen. The multiple-coherence function betweenthe output signal and 14 input signals was plotted in Fig. 8. Thecoherence function between the output signal and input signalswas larger than 0.8. So, the 14 positions chosen were enough forsound sources identification.
After the PSVD analysis, five positions listed in Table 3 wereidentified to be the main sound sources. They were front roof, rearroof, right below dashboard, right front door and right middle door.Each sound source contribution to co-driver noise was listed inTable 3. It could be found that the contribution of right below dash-board to co-driver position was max, not only to sound pressurebut also to sound quality. So, the position of right below dashboardwas the dominant sound source. The panel contribution analysisgave technical direct for vehicle body optimization.
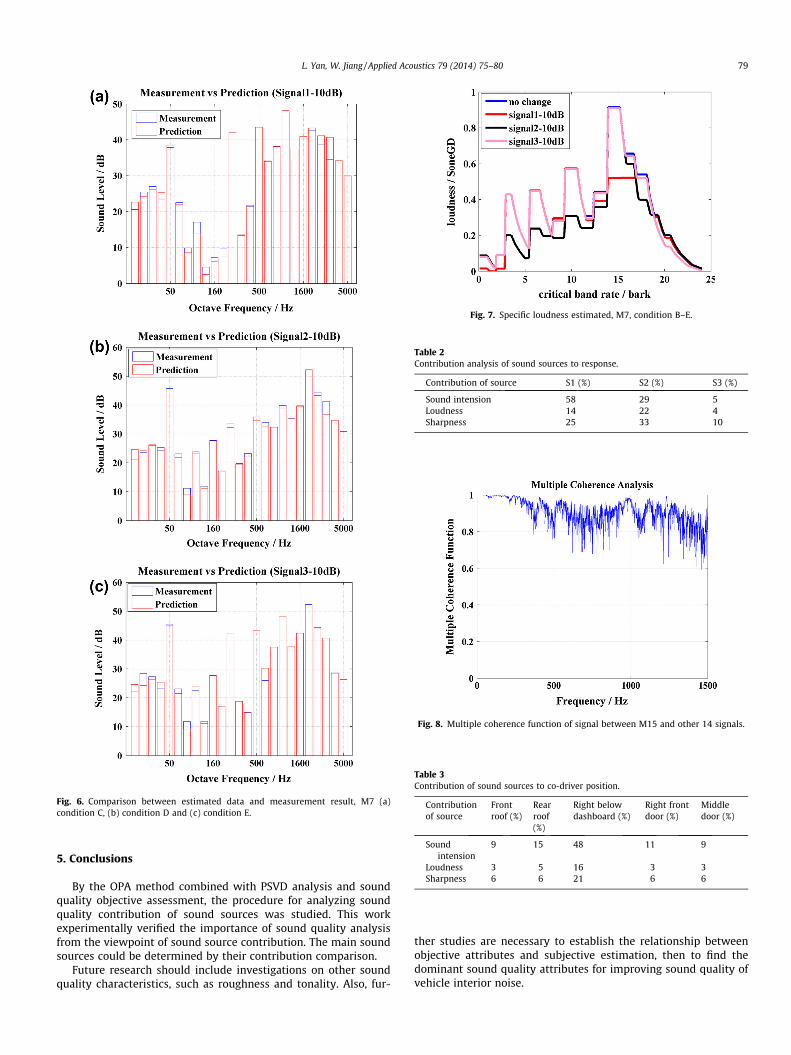
Fig. 6. Comparison between estimated data and measurement result, M7 (a)condition C, (b) condition D and (c) condition E.
Fig. 7. Specific loudness estimated, M7, condition B–E.
Table 2Contribution analysis of sound sources to response.
Contribution of source S1 (%) S2 (%) S3 (%)
Sound intension 58 29 5Loudness 14 22 4Sharpness 25 33 10
Fig. 8. Multiple coherence function of signal between M15 and other 14 signals.
Table 3Contribution of sound sources to co-driver position.
Contributionof source
Frontroof (%)
Rearroof(%)
Right belowdashboard (%)
Right frontdoor (%)
Middledoor (%)
Soundintension
9 15 48 11 9
Loudness 3 5 16 3 3Sharpness 6 6 21 6 6
L. Yan, W. Jiang / Applied Acoustics 79 (2014) 75–80 79
5. Conclusions
By the OPA method combined with PSVD analysis and soundquality objective assessment, the procedure for analyzing soundquality contribution of sound sources was studied. This workexperimentally verified the importance of sound quality analysisfrom the viewpoint of sound source contribution. The main soundsources could be determined by their contribution comparison.
Future research should include investigations on other soundquality characteristics, such as roughness and tonality. Also, fur-
ther studies are necessary to establish the relationship betweenobjective attributes and subjective estimation, then to find thedominant sound quality attributes for improving sound quality ofvehicle interior noise.
80 L. Yan, W. Jiang / Applied Acoustics 79 (2014) 75–80
References
[1] Van der Auweraer H, Mas P, Dom S, Vecchio A, Janssens K, Van de Ponseels P.Transfer path analysis in the critical path of vehicle refinement: the role of fast,hybrid and operational path analysis. SAE Technical Paper 2007-01-2352.
[2] Janssens K, Mas P, Gielen L, Gajdatsy P, Van der Auweraex H. A novel transferpath analysis method delivering a fast and accurate noise contributionassessment. SAE Technical Paper 2009-26-047.
[3] de Klerk D, Ossipov A. Operational transfer path analysis; theory, guidelinesand tire noise application. Mech Syst Signal Process 2010(24):1963–76.
[4] Gajdatsy P, Janssens K, Desmet W, Van der Auweraer H. Application of thetransmissibility concept in transfer path analysis. Mech Syst Signal Process2010;24:1950–62.
[5] Nentwich F, Presentation of the transfer path analysis of the car’s interiorsound via headphones. In: Proc ICSV 13, Vienna, July 2006, 2006.
[6] Adams M, Van de Ponseele P. Sound quality equivalent modelling for virtualcar sound synthesis. SAE Technical Paper 2001-01-1540.
[7] Leite RP, Paul S, Gerges SNY. A sound quality-based investigation of the HVACsystem noise of an automobile model. Appl Acoust 2009;70:636–45.
[8] Hatano S, Hashimoto T. Booming index as a measurement for evaluationbooming sensation. Proc INTER-NOISE 2000;3:4332–6.
[9] Feng J, Otto N. Synthesis of powertrain sounds for investigations in roughness.SAE Technical Paper 931333.
[10] Dunne G, Williams R, Allman-ward M. An efficient approach to powertrainsound quality decision making based on interactive evaluations using a NVHsimulator. SAE Technical Paper 2007-01-2392.
[11] Dunne G. Recent industry-wide advances in powertrain sound qualityhardware tuning devices, and perspectives on future, medium and long termfurther advances. SAE Technical Paper 2009-01-2192.
[12] Freeman T, Cerrato G, Raglin C. Tire sound quality prediction-processimprovements. Proc INTER-NOISE 2008;2:87–93.
[13] Hage OB. Using SIL/PSIL to estimate speech intelligibility in vehicles. SAETechnical Paper 2005-01-3973.
[14] Blommer M et al. Sound quality metric development for wind buffeting andgusting noise. SAE Trans 2003;112(6):1784–9.
[15] Ribeiro AMR, Silva JMM, N.M.M, Maia, Fontul M. Transmissibility matrix inharmonic and random processes. Shock Vib 2004(11):563–71.
[16] Jiang WK. Acoustic systems with multiple incoherent sources and itsapplications in studying noises radiated from vehicle engine. J ShanghaiJiaotong Univ 1998;E-3(1):68–75.