Embed Size (px)
Citation preview

Document TDR/TDF/ComDT/98.2
Research onRapid Geographical Assessment
of Bancroftian Filariasis
prepared during a protocol development workshopheld from 22-25 July 1997
in James Cook University, Townsville, Australia
UNDP/World Bank/WHO Special Programme for Research and Training in Tropical Diseases (TDR)
and
WHO/UNICEF Joint Programme for Health Mapping (HealthMap)WHO Division of Control of Tropical Diseases (CTD)
CONTENT
Introduction . . . . . . . . . . . . . . . . . . . . . . . . . . . . . . . . . . . . . . . . . . . . . . . . . . . . . . . . . . . . 1
Geographical distribution patterns of filariasis . . . . . . . . . . . . . . . . . . . . . . . . . . . . . . . . . . . 2Size of filariasis foci . . . . . . . . . . . . . . . . . . . . . . . . . . . . . . . . . . . . . . . . . . . . . . . . . 2
Ghana . . . . . . . . . . . . . . . . . . . . . . . . . . . . . . . . . . . . . . . . . . . . . . . . . . . . . . 2Vellore district in India . . . . . . . . . . . . . . . . . . . . . . . . . . . . . . . . . . . . . . . . . 3Myanmar . . . . . . . . . . . . . . . . . . . . . . . . . . . . . . . . . . . . . . . . . . . . . . . . . . . 4Gulbarga district in India . . . . . . . . . . . . . . . . . . . . . . . . . . . . . . . . . . . . . . . 4
Preliminary spatial analysis . . . . . . . . . . . . . . . . . . . . . . . . . . . . . . . . . . . . . . . . . . . . 5Myanmar . . . . . . . . . . . . . . . . . . . . . . . . . . . . . . . . . . . . . . . . . . . . . . . . . . . 5Gulbarga district in India . . . . . . . . . . . . . . . . . . . . . . . . . . . . . . . . . . . . . . . 6
Proposed methods for Rapid Geographical Assessment of Bancroftian Filariasis . . . . . . . . . 8Exclusion of areas . . . . . . . . . . . . . . . . . . . . . . . . . . . . . . . . . . . . . . . . . . . . . . . . . . 8Mapping of distribution of filariasis in remaining areas . . . . . . . . . . . . . . . . . . . . . . . 8
Indirect questionnaire . . . . . . . . . . . . . . . . . . . . . . . . . . . . . . . . . . . . . . . . . . 9RAP survey in a sample of communities . . . . . . . . . . . . . . . . . . . . . . . . . . . . 9
Field testing of the different methods . . . . . . . . . . . . . . . . . . . . . . . . . . . . . . . . . . . . . . . . . 11Study objectives . . . . . . . . . . . . . . . . . . . . . . . . . . . . . . . . . . . . . . . . . . . . . . . . . . . 11Study design . . . . . . . . . . . . . . . . . . . . . . . . . . . . . . . . . . . . . . . . . . . . . . . . . . . . . 11Spatial analysis of endemicity patterns . . . . . . . . . . . . . . . . . . . . . . . . . . . . . . . . . . 11Analysis of costs and other resource requirements . . . . . . . . . . . . . . . . . . . . . . . . . 12
References . . . . . . . . . . . . . . . . . . . . . . . . . . . . . . . . . . . . . . . . . . . . . . . . . . . . . . . . . . . . . 15
Annex I: list of participants . . . . . . . . . . . . . . . . . . . . . . . . . . . . . . . . . . . . . . . . . . . . . . . . 16
Annex II: Interview of Key Informants . . . . . . . . . . . . . . . . . . . . . . . . . . . . . . . . . . . . . . . 17

-1-
1 Introduction
Lymphatic filariasis is a major public health problem in tropical countries. Recent estimates suggestthat some 120 million persons are infected world-wide; 107 million with Wuchereria bancrofti and13 million with Brugia malayi. The number of people with physical disabilities due either tolymphoedema and hydrocele or the newly recognised sub-clinical abnormalities of lymphatic andrenal function are currently estimated at 43 million, with Bancroftian filariasis accounting foralmost 40 million of these cases (Michael 1996).
The International Task Force on disease eradication identified lymphatic filariasis as one of sixpotentially eradicable disease since there are now good enough tools to combat the disease (CDC,1993). The World Health Assembly at its meeting in May 1997, passed a resolution on theelimination of the disease as a public health problem through mass treatment of affectedpopulations and appropriate management of clinical cases.
In order to initiate any disease control programme based on mass drug distribution, one needs tounderstand the geographical distribution of the disease in the affected countries in order to knowwhere to target mass treatment. Unfortunately, data on the distribution of lymphatic filariasis arenot widely available primarily because the standard procedures for determining which communitiesare affected are cumbersome, time-consuming, expensive and very intrusive. In areas where theparasite exhibits a nocturnal periodicity, parasitological examinations need to be done at night. Thisbecomes logistically cumbersome to organize, and communities often refuse to co-operate.
Recent epidemiological studies in Ghana suggested that clinical filarial disease is a good proxymeasure of the levels of endemicity of filariasis.(Gyapong et al, 1996). This findings has since beenvalidated in a WHO coordinated multi-country study (WHO 1998a). On the basis of the results,the study participants recommended the use of clinical examinations of a sample of adults as arapid method to assess the community burden of the disease.
Even with these new rapid assessment methods, it would be very time-consuming and expensiveto do filariasis surveys in all potentially endemic communities in order to determine thegeographical distribution of lymphatic filariasis. However, given the clustered distribution offilariasis in most parts of the world, it may be possible to develop methods which allow theestimation of the distribution of filariasis on the basis of surveys in a limited spatial sample ofcommunities. Such a method has already proven very valuable for onchocerciasis control in Africa(Ngoumou et al 1994, WHO 1998b).
Building on this idea, the participants in the workshop reviewed spatial patterns of lymphaticfilariasis, designed different methods for rapid geographical assessment of Bancroftian filariasis,and formulated a plan for field-testing of the proposed methods.

-2-
2 Geographical distribution patterns of filariasis
2.1 Size of filariasis foci
Data on the prevalence of filariasis infection from selected areas in three countries (Ghana, Indiaand Myanmar) were analysed geographically in an attempt to better understand the spatial patternsof Bancroftian filariasis infection.
2.1.1 Ghana
The prevalence of microfilariae for 17 communities from Ahanta West District was visualised ona map. Initially, night blood surveys were done in two communities following reports that therewere cases of lymphatic filariasis. The surveys confirmed that the two communities were endemicfor lymphatic filariasis. Subsequently, surveys were done in sample communities selected at regularintervals along the coast to the East and West in order to determine the extent of the distributionof the disease. All 17 surveyed communities were shown to be endemic, suggesting that this areacontains a homogeneous filariasis focus with a East-West diameter of at least 50 km (Map 1). Asall the sample communities were from coastal areas, it is not known how far the focus extendsinland.

-3-
2.1.2 Vellore district in India
Data on the prevalence of microfilariae for 33 communities from Vellore district of Tamil NaduState were examined to assess the spatial pattern of filariasis in this district. All 33 communitieswere endemic for filariasis and the results suggest that these communities are part of a largefilariasis focus with a size of at least 50 km x 150 km (Map 2). In the absence of non-endemicsample villages it was not possible to determine the boundary of the focus. It was noted that thesurveys had been done by the district health office and that it was not known to the workshopparticipants how the sample communities had been selected. It is possible that the data had beenbiased towards communities which were suspected to be endemic.
Map2: Prevalence of microfilaraemia in sample villages in Vellore district, India

94.00 96.00 98.00 100.00
10.00
12.00
14.00
16.00
18.00
20.00
22.00
24.00
26.00
28.00
Prevalence of mf
0% to 0% 0% to 2% 2% to 5% 5% to 10% 10% to 15% 15% to 25% 25% to 99%
-4-
Map 3: Prevalence of filarial antigen in sampletownships in Myanmar
2.1.3 Myanmar
Filarial antigen prevalence data from 70 randomly selected Townships spread over the 14 Districtsof the country were analysed. The prevalence of antigenaemia was determined using the ICT filarialantigen detection kit on blood samples from 100 blood donors from each site. The majority of theblood donors were residents of the main towns in the selected Townships. The map of theprevalence data suggests that the central dry zone is highly endemic (20-30 %) and that thenorthern, eastern and southern areas are less endemic or free from filariasis. (Map 3)
2.1.4 Gulbarga district in India
After the workshop, an analysis was done of microfilarial prevalence data for the district ofGulbarga in Karnataka State in India. These data were the result of a night blood filariasis surveyundertaken in Gulbarga district between 1985 and 1988. The sampling was done following theguidelines of the National Filariasis Control Programme (NFCP). Of the villages sampled, 262villages whose geographical coordinates were available were plotted on a map using GIS. Theresults are given in Map 4. They show that filariasis in endemic throughout the study area exceptin the West where there the prevalence of microfilaraemia was zero in most sample villages.

76.0 76.2 76.4 76.6 76.8 77.0 77.2 77.4 77.6
Longitude
16.6
16.8
17.0
17.2
17.4
17.6
Latit
ude
0% to 0% 0% to 2% 2% to 5% 5% to 10% 10% to 15% 15% to 25% 25% to 99%
Prevalence of mfin sample villages
-5-
Map 4: prevalence of microfilaraemia in sample villages in Gulbarga district in India
2.2 Preliminary spatial analysis
2.2.1 Myanmar
A preliminary spatial analysis of the Myanmar data indicates that there exists a spatialautocorrelation between the prevalence data, with the semivariance being smallest for villages whichare located closest to each other (see Figure 1). An exponential model was fitted to thesemivariance data and this model was used in so-called kriging to estimate the prevalence of antigenfor each point of a grid overlaying the country. In kriging, the prevalence at a grid point is estimatedby a weighted average of the observed prevalences, with the weighting factor depending on distanceand spatial autocorrelation as defined by the semivariance model. The results of this estimation aregiven in Map 5 which shows the contour lines for the estimated prevalence of antigen.
Figure 1: An omnidirectionalsemivariogram showing increasingsemivariance, (, of antigen prevalencewith distance till a distance of 2 when( levels off. (the units of distance, h,are in degrees; 50 km is approximately0.48 degrees). The fitted curverepresents an exponential model withnugget 45, range 2.5 and sill 59.
94.00 96.00 98.00 100.00
10.00
12.00
14.00
16.00
18.00
20.00
22.00
24.00
26.00
28.00
94.00 96.00 98.00 100.00
10.00
12.00
14.00
16.00
18.00
20.00
22.00
24.00
26.00
28.00
Prevalence of mf
0% to 0% 0% to 2% 2% to 5% 5% to 10% 10% to 15% 15% to 25% 25% to 99%
0%
2%
4%
6%
8%
10%
12%
14%
16%
18%
-6-
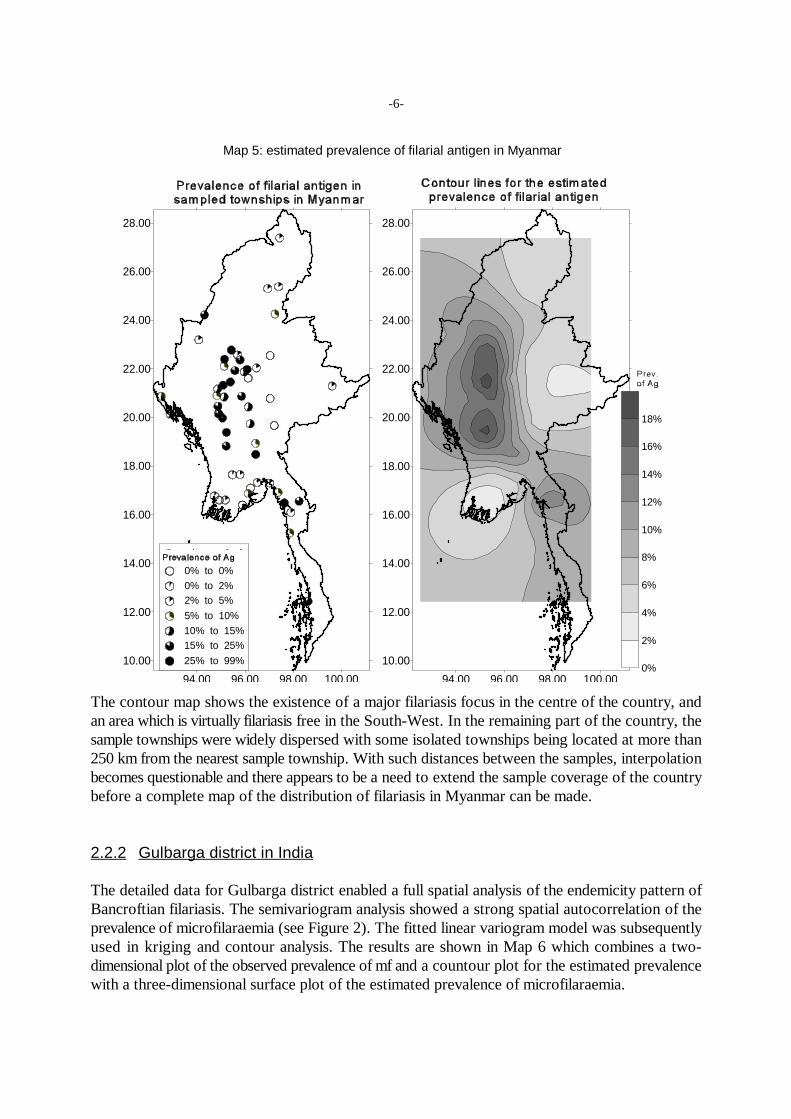
Map 5: estimated prevalence of filarial antigen in Myanmar
The contour map shows the existence of a major filariasis focus in the centre of the country, andan area which is virtually filariasis free in the South-West. In the remaining part of the country, thesample townships were widely dispersed with some isolated townships being located at more than250 km from the nearest sample township. With such distances between the samples, interpolationbecomes questionable and there appears to be a need to extend the sample coverage of the countrybefore a complete map of the distribution of filariasis in Myanmar can be made.
2.2.2 Gulbarga district in India
The detailed data for Gulbarga district enabled a full spatial analysis of the endemicity pattern ofBancroftian filariasis. The semivariogram analysis showed a strong spatial autocorrelation of theprevalence of microfilaraemia (see Figure 2). The fitted linear variogram model was subsequentlyused in kriging and contour analysis. The results are shown in Map 6 which combines a two-dimensional plot of the observed prevalence of mf and a countour plot for the estimated prevalencewith a three-dimensional surface plot of the estimated prevalence of microfilaraemia.

-7-
Map 6: Distribution of Bancroftian filariasis in Gulbarga district, India
Figure 2: An omnidirectional semivariogramfor Gulbarga district showing an increasingsemivariance, (, between village MF prevalencewith distance, h. This pattern indicates a strongspatial autocorrelation between the prevalencedata. The fitted linear model has a nugget of14.56 and a slope of 21.336
The pattern for this district is very clear, with high endemicity in the centre and the East, a peakprevalence around 77.2 E and 17.3 N, and a gradually declining prevalence of microfilaraemia too o
the West. Large scale treatment appears indicated for most of the district. These prevalence contour

-8-
maps should be very useful to control managers by clearly indicating priority areas for control andby facilitating objective decision making on the boundaries of treatment areas.
3 Proposed methods for Rapid GeographicalAssessment of Bancroftian Filariasis
Although the available data from the above countries was limited, it was noted that in all cases thefilariasis foci were fairly homogeneous and quite large with a diameter of at least 50 km. Thispreliminary finding was used in the design of proposed methods for Rapid Geographical Assessmentof Bancroftian Filariasis (RAGFIL). These methods and the steps involved are described below.
3.1 Exclusion of areas
The first step is to evaluate regions of endemic countries, defined by ecological or otherfeatures, in order to identify areas where there is no filariasis or where there are only sporadicinfections which are unlikely to be significant for control. Such regions will be excluded fromfurther rapid assessments. Although it is important not to exclude endemic areas for which controlis appropriate, criteria should be specified for each country to exclude regions where the chance ofsignificant lymphatic filariasis is acceptably low. Criteria for exclusion may include negative resultsin prior screening, and demographic and ecological features that are incompatible with the parasite,vector, and disease (e.g. uninhabited areas, deserts, national parks, very high mountain ranges etc).
Historical survey data may be sufficient for inclusion of an area. Such data may includeeither published literature or data from national programme activities. The latter may be obtainedfrom national health documents, reports from international sources (eg, sources from WHO; TDRdocuments currently under review; South Pacific Commission Reports in New Caledonia, andrelevant published literature, such as Sasa’s Human Filariasis). Older sources (eg, before 1950)should be sufficient for classifying regions as possibly endemic, and recent epidemiological datafrom proper studies may be acceptable as community survey data.
3.2 Mapping of distribution of filariasis in remaining areas
In known endemic or possibly endemic regions (ie, those not excluded), Rapid GeographicalAssessment of Bancroftian Filariasis (RAGFIL) will be done. Two different RAGFIL methods areproposed:
(i) a method in which a large sample of villages will be surveyed indirectly usingquestionnaires directed at key informants, and
(ii) a method based on surveys using rapid assessment techniques (viz, health workerexamination for hydrocele and lymphoedema, or possibly antigen screening with theICT card) in a small sample of communities selected on the basis of a geographicalgrid (grid spacing 50 km, subject to validation).

-9-
3.2.1 Indirect questionnaire
With this method, questionnaires will be sent to specified local key informants. Thequestionnaires are based on the instruments developed for rapid assessment and which wereevaluated at the RAP workshop in July 1997 (WHO 1998a). An example of the questionnaire isgiven in Annex II.
In the study districts or townships, initial contact will be made with district (or block/township)-level authorities (eg, district medical officer, DMO, or other district leaders, asappropriate for that setting). At this meeting, an effort will be made to identify villages and theirgeographical coordinates on a map. A random sample of communities will be taken to whichquestionnaires will be send. For this sampling, a grid with grid distance of 50 km will be used, anda random sample of not more than 25 communities will be taken for each cell of 50x50 km on thegrid. Only those villages for which map coordinates can be assigned, either from a 1:250,000 orbetter map or from other sources, will be included.
Key informants from the selected communities and means of contacting them will beascertained from these meetings with district-level authorities. Key informants may include villageheads, teachers, health system personnel, or other leaders in the community capable of respondingto the questionnaire.
The questionnaires will be sent to these key informants through the post or some otherexisting means suggested by the district-level authorities. The research team will decide whetherthe completed questionnaires should be returned directly to the investigators by post, or sent to thedistrict headquarters for retrieval by the investigators. If the questionnaires have not been receivedwithin a specified period of time (eg, 1 month), then one reminder will be sent. If the questionnairesare not received after that, then no further efforts to recover them will be made.
The questionnaires will be evaluated according to the analytic framework developed at theRAP workshop in July 1998 (eg, presence or absence of LF, number of cases, prominence as ahealth problem). A spatial analysis of the results should then be undertaken using the techniquesdescribed in chapter 2.
3.2.2 RAP survey in a sample of communities
An area-stratified random sampling design is to be carried out for the mapping. Consideringexperience and available data, mapping will be based on rapid assessment for villages located ona 50 km x 50 km grid, subject to validation in the current study. Steps for the proposed mappingare as follows:
C Overlay a grid of 50 km X 50 km on the map of the country.
C Calculate the geographical coordinates at each intersection of the X and Y lines. Identifythe community nearest to each of the identified intersection points of the grid falling withinthe country to identify the spatial random sample of communities for rapid assessment(clinical survey by a health worker, and possible antigen testing after validation of the test).The name and coordinates of the communities will be entered on a spreadsheet with

-10-
population, area, and other relevant variables, set up with field names for a uniformdatabase.
C Exclude regions declared as non-endemic in the initial screening from further evaluation.
C Train health workers to screen a random sample of 50-100 adult males for hydrocele andlymphoedema. If there are less than 50 adult males in the selected community, the screeningshould be extended to include males from the nearest community till a total of at least 50adult males has been examined. Only males who have been at least 10 years resident in thecommunity should be included in the examination. Only obvious lymphoedema andhydroceles greater than a tennis ball should be recorded as positive. The examination shoulduse the principle of “if in doubt, leave it out”. (Once the technique is validated, clinicalexamination could be supplemented or replaced by antigen screening with the ICT card.)
C Years of residency in the community, age, and clinical findings will be entered for eachsubject.
C The prevalence of filarial disease (hydrocele or lymphoedema) in adult males should beplotted for each sample community on a map using GIS software.
C Each surveyed community will be classified as endemic or non-endemic based on thefindings of the examination. For the purpose of the testing of the method (see section 4) thepresence of a single adult male with filarial disease will be regarded sufficient for classifyinga community as endemic. This criterion may need to be revised later.
C The region bounded by endemic communities is considered endemic. The region boundedby non-endemic communities is considered non-endemic. The region bounded by bothendemic and non-endemic communities is considered a fuzzy zone. To better define theboundary between a endemic and non-endemic zone, a further sample will be taken fromthe fuzzy zone using a more refined grid of 25x25 km.
C RAP surveys will be done in the sampled villages in the fuzzy zones and the results will beplotted on the same epidemiological map.
Alternatively, and based on local policy, all communities in fuzzy zones could be included in a masstreatment programme for lymphatic filariasis.

-11-
4 Field testing of the different methods
4.1 Study objectives
C To test the feasibility and effectiveness of a RAGFIL method based on the use of indirectquestionnaires, which will be completed by key informants in a large sample of potentiallyendemic communities for which coordinates from district level officials are available.
C To test the feasibility and effectiveness of a RAGFIL method based on rapid clinicalassessment of lymphatic filariasis by health workers in a sample of communities selectedusing a 50 km grid sampling strategy. Antigen screening may also be included among theassessment methods.
C Compare the feasibility and effectiveness of the two methods..
4.2 Study design
The RAGFIL methods will be tested in areas known to have both endemic filariasis foci and non-endemic zones. In each study site, a rectangular testing area with a size of 200 x 200 km will beselected. All communities in the testing area should be accessible during the study period.
Questionnaires will be sent to a large sample of communities in the study area for which coordinatescan be identified at the district level. A total of 25 communities will be selected for every 50 km .2
Time required for assigning map coordinates and a subjective assessment of the process at thedistrict level will be recorded in the study data base
The study area of 200x200 km with a grid of 25x25 km will have 81 communities to be surveyed.RAP surveys will be carried out in all the 81 communities which also includes the 25 communitiesobtained from the 50x50 km grid classification of the study area, thus allowing a comparison of thetwo types of grid sampling strategies.
In each of the 81 selected villages, both a clinical RAP survey and ICT testing will be doneaccording to the methodology described in section 3.2.2.
To ensure reliable results, the clinical examination should be done by clinicians from the surveyteam. Standardization and quality control of the clinical classification should be ensured throughspecial training per site and assessment of intra-observer variation.
4.3 Spatial analysis of endemicity patterns
The endemicity patterns of the study area will first be classified using the results of the 50x50 kmgrid sample (including the 25x25 km sub-sample in fuzzy zones) and, as a completely separateexercise, using the results of the indirect questionnaire. For this classification the spatial analysistechniques mentioned in chapter 2.2 will be used in order to ensure an objective and reproducibleinterpretation of the results. Other classification methods, such as classification by a panel of experts

(h'1
2Nj (zh&zh%1)2
-12-
with a good understanding of the geographical and socio-demographic characteristics of the studyarea, will also be tried.
The identified patterns based on the 50x50 grid will then be compared with the epidemiological mapbased on the 25x25 sample and on the results of previous surveys. Two maps will be drawn: onebased on the clinical data and one on the results of the antigen detection test. On the basis of thiscomparison, the adequacy of the 50x50km sampling strategy will be assessed.
The analysis should also involve an evaluation of the spatial sample of villages collected on a 50 kmx 50 km on the basis of the sample of villages produced on the grid of 25 km x 25 km. At leastthree important comparisons can be made, 1) descriptive statistics of the two samples, 2) the shapeof the sample distributions and 3) their spatial autocorrelative structure. If the first two comparisonsshow the fine and coarse grid samples to be similar, a third comparison using a semivariogram maybe attempted.
The semivariogram “tool” is a graphical representation of spatial autocorrelation, i.e. the degree towhich a variable is related to itself over space.
Semivariance, (, is defined as
h lag distance between two villagesz the mf prevalence at a villageh
z the mf prevalence at a second village some distance from the firsth+1
A comparison of every possible pair of villages is undertaken, i.e. if there are 100 villages then 4950village pairs are generated using the following relationship,
village pairs = [n x (n-1)]/2,
where n is the number of villages. There is a sizeable literature on the variogram tool and its use inspatial estimation using the kriging interpolator (e.g. Isaaks and Srivastava 1989, Cressie 1991).A number of software packages are available for the calculation of the semivariogram, includingGeoEas and VarioWin (both are available on the Internet). Software packages for kriging andcontour mapping include GeoEas and SURFER.
4.4 Analysis of costs and other resource requirements
A cost analysis of the resource requirements necessary to undertake each of these methods isessential in determining the affordability and feasibility of these approaches in different endemicsettings.
The direct costs of each approach to the provider, including opportunity costs (costs for divertingexisting resources, such as personnel) will be assessed. The cost analysis will provide information

-13-
on:
C the total financial costs of the approach, which can give an indication of affordability. C the distribution of costs with respect to input items, which can indicate those inputs which
constitute a disproportionately large proportion of costs and thus those in which there is alarge potential for savings if only small reductions in these resource items can be made.
C predictions on the cost of the approaches at scale, and in different endemic settings.
The requirement for other resources, such as trained personnel (such as geographers) andequipment (GIS hardware and software), are also important in exploring the feasibility of eachstrategy.
The cost analysis will be undertaken by constructing itemized cost frameworks which include allvariables explicitly. The first step is to identify all resource inputs for each each activity of theapproach. These are usually categorised under Personnel, Materials & Supplies, Operating &Maintenance and Capital inputs, and by activities which for the questionnaires and grid samplingmethods may be as follows.
Questionnaires:
C Setting up and meeting with DMO to locate villages and key informantsC Producing and delivering questionnaires to key informants in selected villagesC Recovery of questionnairesC Databasing and creation of digital maps using the questionnaire results
Grid sampling
C Grid creation and village selection at national centreC Sensitize DMOsC Training of Health worker teamsC Data collection by health worker physical examination from selected villagesC Data collection by ICT cardsC Databasing and creation of digital maps
The resource inputs for costing under the various categories for each approach (and activity) willbe listed as follows.
Personnel (All full-time and part-time personnel connected with the programme, including all clerical andmaintenance staff, volunteers and consultants)C The amount of time that each person spends on the programme. C The compensation paid to each worker. Gross earnings should include all overheads
including special incentives, overtime or hardship bonus, holiday and sick pay, uniform,housing and travel allowances.

-14-
Materials and supplies (All materials used up in the course of a year as direct inputs into the principle activities of theproject)C The amounts of materials used (quantities consumed, not amounts ordered or budgeted).
These figures should also include waste due to spoilage, breakage, theft and misuse sincethese costs are directly attributable to the programme.
C The full cost of supplies should include the cost of transportation to the point of use (i.e.including any freight charges as a result of importing materials and any internal distributioncosts).
Operating and maintenance(All those items used in operating, maintaining and repairing capital inputs) e.g. For vehicles, these will include fuel, lubricants, insurance and registration fees, tyres, batteriesand spare parts. If the capital inputs are used for more than one programme, the operating andmaintenance costs should be apportioned according to use.
Capital inputsCapital inputs include buildings, vehicles and equipment. Many of these inputs will already exist,and will only be used part-time in the programme. If the capital inputs are to be shared amongst anumber of projects, only the time used in the programme should be costed.

-15-
5 References
CDC (1993). Recommendations of the International Task Force for Disease Eradication.Morbidity and Mortality Weekly Reports, 42: 1-38.
Cressie N. (1991). Statistics for Spatial Data, John Wiley & Sons, New York, 900 pp.
Gyapong JO, Adjei S, Gyapong M, and Asamoah EG (1996). Rapid community diagnosisof lymphatic filariasis. Acta Tropica, 61: 65-74.
Isaaks EH. and Srivastava RM. (1989). An Introduction to Applied Geostatistics, OxfordUniversity Press, Oxford, 561 pp.
Kegler D. (1997). Surfer for Windows; Version 6 user’s guide. Golden Software Inc, Golden.
Michael E, Bundy DA. and Grenfell BT. (1996). Re-assessing the global prevalence anddistribution of lymphatic filariasis. Parasitology, 112: 409-428.
Ngoumou P. and Walsh JF. (1993). A manual for Rapid Epidemiological Mapping ofOnchocerciasis. Doc. no. TDR/TDE/ONCHO/93.4. World Health Organization. Geneva
Ngoumou P, Walsh JF. et al. (1994). “A rapid mapping technique for the prevalence anddistribution of onchocerciasis: a Cameroon case study.” Ann Trop Med Parasitol 88: 463-74.
Panatier Y. (1996). VARIOWIN: Software for spatial data analysis in 2D. Springer-Verlag. NewYork, 91 pp.
Sasa, M. (1976). Human filariasis. A global survey of epidemiology and control. Univ Park PressTokyo, 819 pp.
World Health Organization (1992). “Lymphatic filariasis: the disease and its control. Fifth reportof the WHO Expert Committee on Filariasis.” World Health Organ Tech Rep Ser 821: 1-71.
World Health Organization (1995). Supplemental guidelines for rapid epidemiological mapping ofonchocerciasis. Doc.no. TDR/TDF/ONCHO/95.1. World Health Organization. Geneva
World Health Organization (1998a). Rapid Assessment Procedures for Lymphatic Filariasis. Reporton a multi-country study. Doc.no. TDR/TDF/ComDT/98.1.World Health Organization.Geneva
World Health Organization (1998b). Guidelines for analysis of REMO data using GIS. Doc. no.TDR/TDF/ComDT/98.3.World Health Organization. Geneva

-16-
Annex I: list of participants
Dr G. Biswas, Division of Helminthology, National Institute of Communicable Diseases, NewDelhi, India
Dr. P.K. Das, Vector Control Research Centre, Indian Council of Medical Research, Pondicherry,India
Dr J. Gyapong, Health Research Unit, Ministry of Health, Accra, Ghana
Dr. Manoharan, Vector Control Research Centre, Indian Council of Medical Research,Pondicherry, India
Dr Nay Soe Maung, Department of Public Health Laboratory and Health Research, Health andDisease Control Unit, Directorate of Medical Services, Yangon, Union of Myanmar
Dr D. Merisowitch, Department of Pathology and Immunology, Danish Bilharziasis Laboratory,Charlottenlund, Denmark
Dr J. Metu, Misima Mines Medical Section, Misima Island, Papua New Guinea
Dr A. Lewis, Spatial Analysis Program, Dept. Tropical Environment Studies & Geography, JamesCook University of North Queensland, Townsville, Australia
Dr E. Michael, University of Oxford, Department of Zoology, Oxford, UK
Dr. S. Pani, Vector Control Research Centre, Indian Council of Medical Research, Pondicherry,India
Dr C. Skelly, Spatial Analysis Program, Dept. Tropical Environment Studies & Geography, JamesCook University of North Queensland, Townsville, Australia
Dr R. Speare, James Cook University of North Queensland, Townsville, Australia
Dr P. F. Turner, Department of Public Health and Tropical Medicine, James Cook University ofNorth Queensland, Townsville, Australia
Dr M. Weiss, Department of Tropical Health & Epidemiology, Swiss Tropical Institute, Basel,Switzerland
Secretariat:
Dr I. Nuttall, HealthMap, Division for Control of Tropical Diseases, World Health Organization,Geneva, Switzerland
Dr J.H.F. Remme, Special Programme for Research and Training in Tropical Diseases, WorldHealth Organization, Geneva, Switzerland

-17-
Annex II: Interview of Key InformantsRapid Assessment of Community Burden of Disease
1. Name of District ______________________Name of Village_________________________
Village Latitude __________ Longitude ___________ Population_________
2. Name of interviewee __________________________________ Age__________ Sex____
Occupation___________________________
3a. What are the six commonest diseases of adults in this village (rank).
a.____________________b.____________________c.____________________
d.____________________e.____________________f._____________________
3b. If there was enough money to control only THREE of these diseases, list in order of preference, the onesyou would choose.
a.____________________b.____________________c.____________________
4. Specific Disease Information
4.1 Do you know of people in this village with goitre? Yes____ No____
How many people in the village have goitre _____
4.2 Do you know people in this village with elephantiasis of the leg? Yes____ No___
How many people in the village have elephantiasis _____
4.3 Do you know of people in this village with hydrocele? Yes____ No____
How many people in the village have hydrocele _____
4.4 Do you know of people in this village with guinea worm? Yes____ No____
How many people in the village have guinea worm _____
4.5 Do you know of people in this village with leprosy? Yes____ No____
How many people in the village have leprosy _____
4.6 Do you know of people in this village with tuberculosis? Yes____ No____
How many people in the village have tuberculosis _____