Embed Size (px)
Citation preview
. . .-
RESEARCH MEMORANDUM
TRANSONIC WIPJD-TUNNEL INVESTIGATION OF TIE EFFECTS OF
TAPER RATIO AND BODY INDENTATION OM THE AERODYNAMIC
. .
" v 6 COPY R,M L54L28
4
-
IR NACA RM ~54x8
NATIONAL LDVISOKY COMMmTEE FOR AERCBTAUTICS
TRANSONIC WIND-TUNMEL INVESTIGA!TION OF TBE EFJ?ECTS OF
WEZR RATIO AND BODY I N D ~ O X ON THE -c
LOADING CHARACTERISTICS OF A 4.5(' SWEETRACK WING
IN TBE PRFSENCE OF A BODY
By J-s B. Delano and John P. Mugler, Jr.
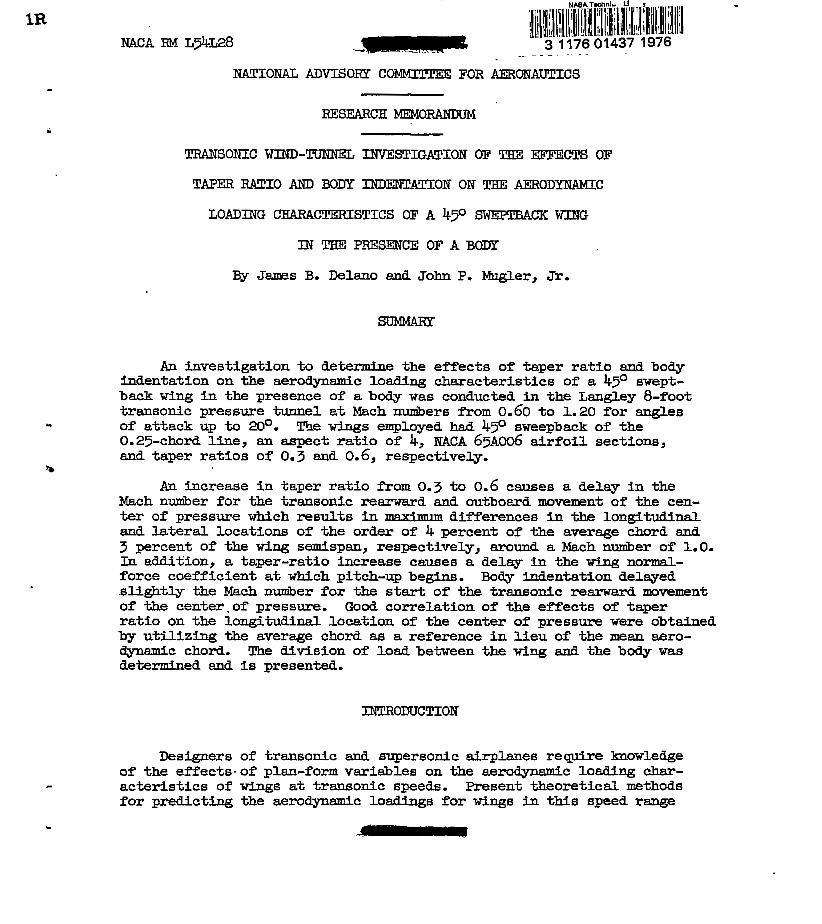
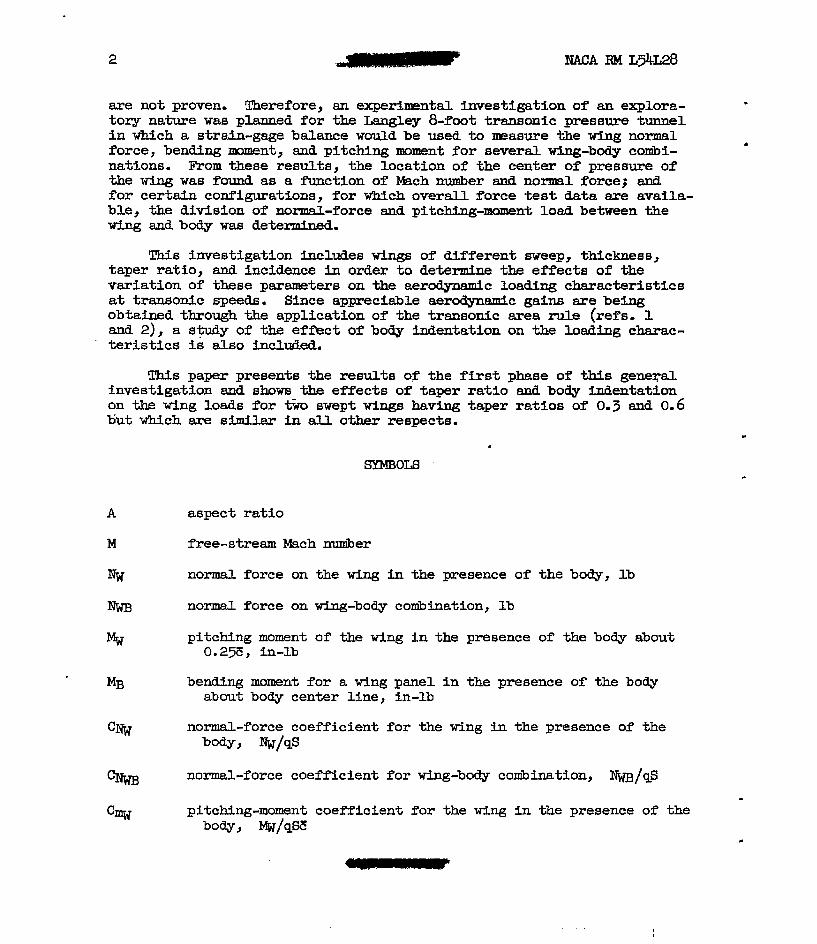
An investigation to determine the effects of taper ratio and body indentation on the aerodynamic 10- characteristics of a 450 swept- back wing in the presence of a body was conducted in the Langley 8-foot transonic pressure tunnel at Mach nunhers f r o m 0.60 to 1.20 for angles
O.25-chord line, an aspect ratio of 4, WCA 65Aoo6 airfoil sections, and taper ratios of 0.3 and 0.6, respectively.
.. of attack up to 200. Tbe w3ngs enrployed had 450 sweepback of the
An increase in taper ratio f r o m 0.3 to 0.6 canses a delay in the Mach rider for the transonic rearward and outboard movement of the ten- ter of pressure which results in maximLllll differences in the longitudinal and lateral locations of the order of 4 percent of the average chord and 3 percent of the wlng semispan, respectively, mound a Mach n&er of 1.0. In addit'ion, a taper-ratio increase cau~e8 a delay in the wing normal" force coefficient at w h i c h pitch-up begins. Bow indentation delayed .sli&tly the Mach rider for the st& of the transonic rearward "b of the centeraof pressure. Good correlation of the effects of taper ratio on the longitudinal location of the center of pressure were obtained by utilizing the average chord as a reference in lieu of the mean aero- dynmnic chord. The division of load between the wing and the body was determined and is presented.
Designers of transonic and errpersonic a i rp lanes reqdre knowledge of the effects- of plan-form variables on the aerodynamic loading char-
for predicting the aerodynamic loadings for wings in this speed range - acteristics of wings at transonic speeds. Present theoretical methods
2
are not proven. Therefore, an experfm=ntal investigation of an explora- tory nature was planned f o r the hngley 8-foot transonic pressure tunnel i n W c h a strain-gage balance would be used to measure the wing normal force, bending moment, and pitching mollaent for several wing-body conibi- nations. From these results, the location of the center of pressure of the was found as a ftmction of Mach number and normal force; a d for certain configurations, for which overdl force test data are availa- ble, the division of normal-force and pitching-moment load between the wing and body was determined.
.
This investigation includes wings of different sweep, thickness, taper ratio, and incidence in order t o determine the effects of the variation of a s e parameters on the aerodynamic loading characteristics a t transonic speeds. Since appreciable aerodynamic gains are being obtained through the application of the traneonic area rule (refs. 1 and 21, a study of the effect of body indentation on the loading charac- te r i s t ics is &so included.
This paper presents the results o f the first phase of t h i s general fnvestigation and shows the effects of taper r a t i o and body indentation on the wing loads f o r two swept wings pla~ing taper ratios of 0.3 and 0.6 'tiut which a.re similar fn all other respects.
SYMBOLS
A
M
Nw Nws
%
MB
aspect ra t io
free-stream Mach nlzniber
normal force on the wing i n the presence of the body, l b
nomad force on wing-body coniblnation, Ib
pitching moment of the wing i n the presence of the body about 0.25E, in-lb
bending moment f o r a wing panel i n the presence of the body about body center line, in-lb
normal-force coefficient fo r the wing in the presence of the body, w/ss
normal-force coefficient for wing-body conibination, m / q S
pitching-moment coefficient for the wing i n the presence of the body, m/s=
NACA RM ~ 5 4 ~ 2 8 - 3
C
Cav
Ct
S
Se
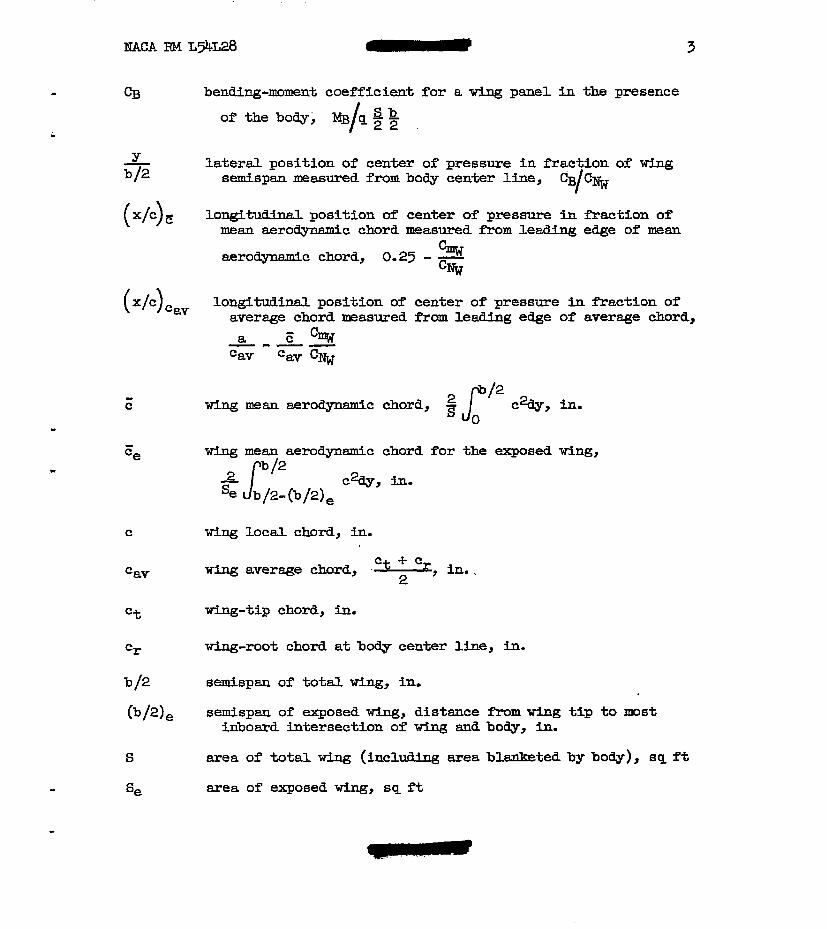
bending-moment coefficient for a wing panel in the presence
of the body, m/q
lateral position of center of pressure in fraction of wing semispan measured f r o m body center line, %/C%
longitudinal position of center of pressure in fraction of mean aerodynamic chord measured from leading edge of mean
aerodynamic chord, 0.25 - - cmw cNw
longitudinal position of center of pressure in fraction of average chord measured f r o m leading edge of average chord,
wlng mean aemdymamic chord for the exposed wlng,
wing local chord, in.
fig-tip chord, in. wing-root chord at body center line, in. semispan of total wing, in. semispan of exposed wing, distance f r o m wing tip to most inboard intersection of wing and body, in.
area of total wing (includhg area blanketed by body) , sq f t
area of exposed wing, sq ft
4 NACA RM L 9 U 8
a
X
Y
a
A
P
9
V
R
longitudinal distance From leading edge of Cay to E/4 (positive when mvFng downstream), in.
longitudinal distance parallel to model center line, in. lateral distance measured perpendicular to model center line, in.
angle of attack of body center line, deg
taper ratio, ct/cr
free-stream density, slugs/cu ft
free-stream aynamic pressure, pV2/2, lb/sq ft
free-etream velocity, ft/sec
Reynolds number based on wing average chord
Tunnel
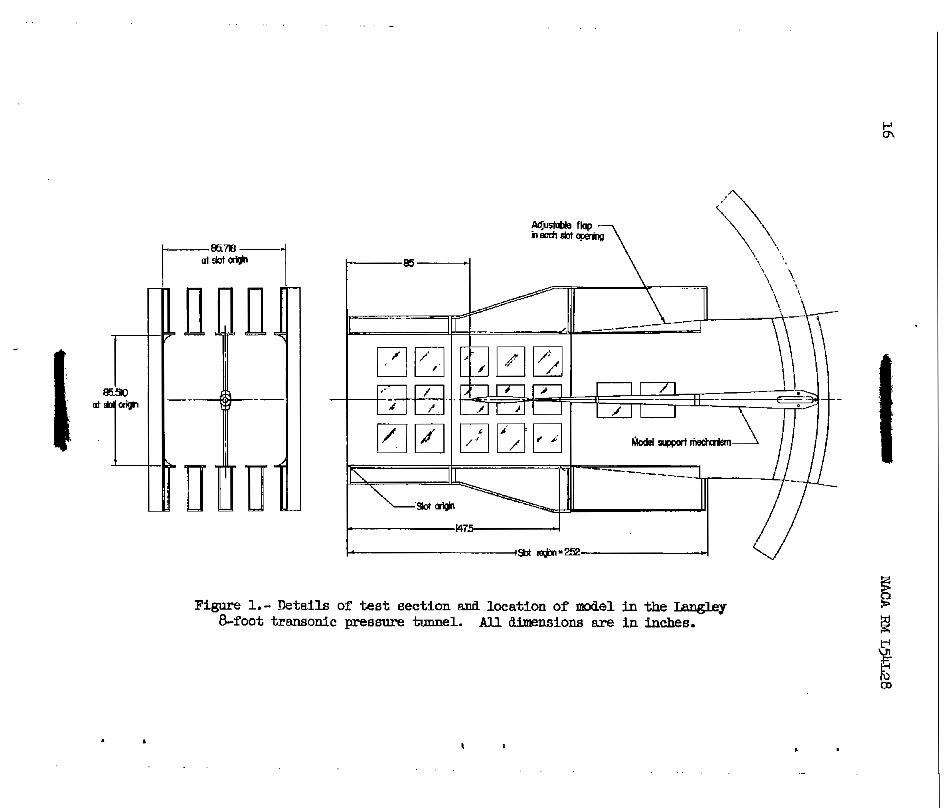
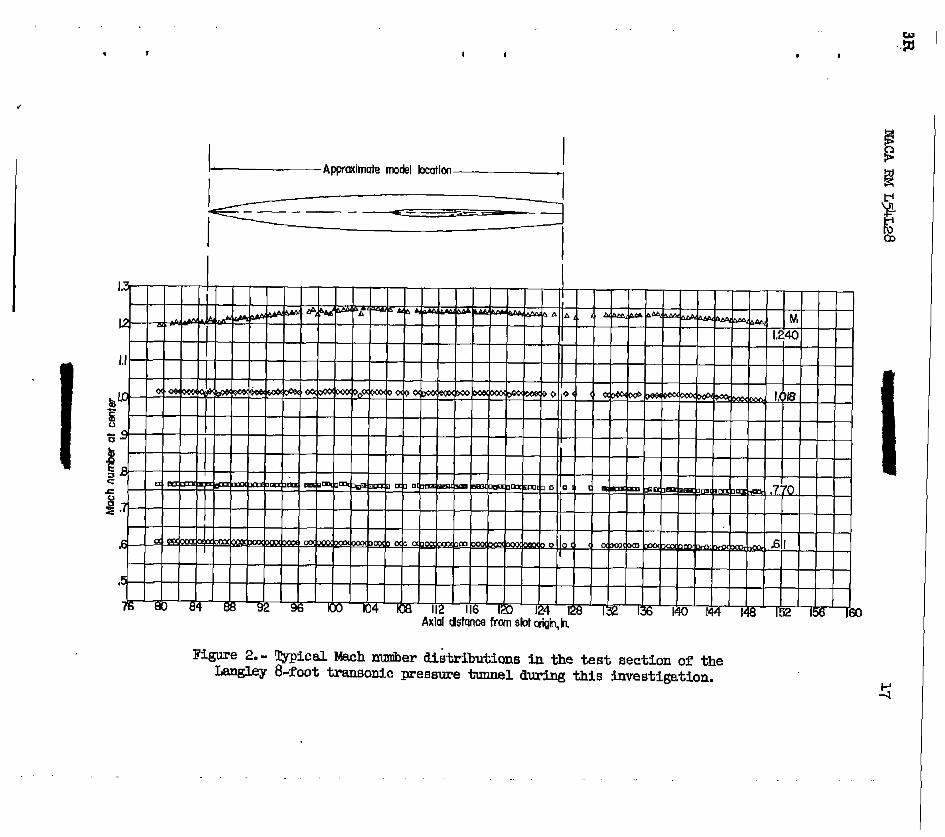
The present investigation was conducted in the -ley 8-foot transonic pressure tunnel, The test section of this tunnel is rectan- gular in cross section and has a cross-sectional area of approx5matel.y 50 square feet. The upper and lower walls of the test section are slotted to permit contirnzous operation through the transonfc speed range. Some details of the,test section are shown in figure 1. During t h i s investigation, the tunnel was operated at approximately atmospheric stagnation pressure. The dewpoint of the tunnel air was controlled and was kept at approximately 00 F. The stagnation temperature of the b- ne1 air was automatically controlled and was kept constant and uniform across the tunnel at 1200 F. Control of both dewpoint and stagnation temperature in thig m e r minimized humLdity effects. The axial di.8- tribution of Mach number in the v i c i r d t y of the model was satisfactorily uniform at all test Wch nunibers. Local deviations from the average stream Mach auniber were no larger than 0.005 at sdmonic speeds. With increases in Mach nuniber above 1.0, these deviations increased but did not exceed 0.010 in the region of the King at the highest test Mach num- ber of 1.20. Tests reported in reference 3 indicate that local flow nonuniformities of this magnitude have no effect on the masurea force data. Some representative Mach n&er distributions at the center of the test section are presented in figure 2.
NACA FU4 L54U8
Models
5
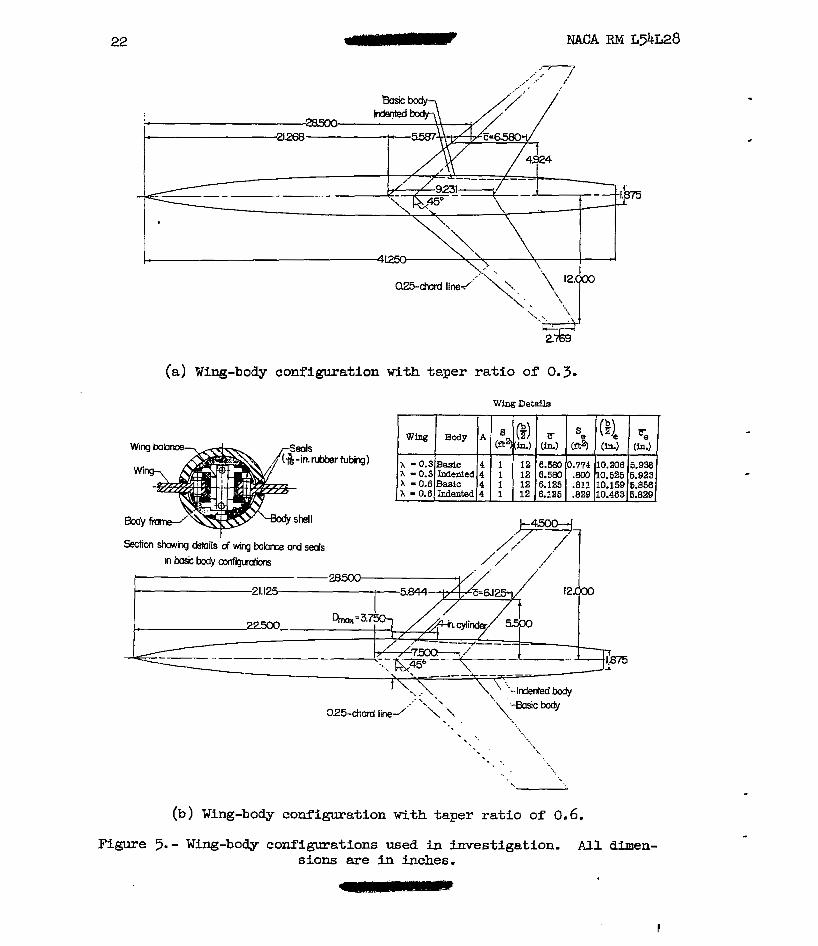
The 0.3-taper-ratio wing tested has 450 sweepback of the 0.25-chord line, an aspect ra t io of 4, end NACA 65.~006 a i r f o i l sections paral le l t o the mctel plane of syrrmhetry. m e 0.6-taper-ratio w t n g has the s a m geo- metric characteristics as the afor"tioned wing wfth the exception of the ta;per ra t io . Both wings were of solid-steel construction, and both were tested as midwing configurations.
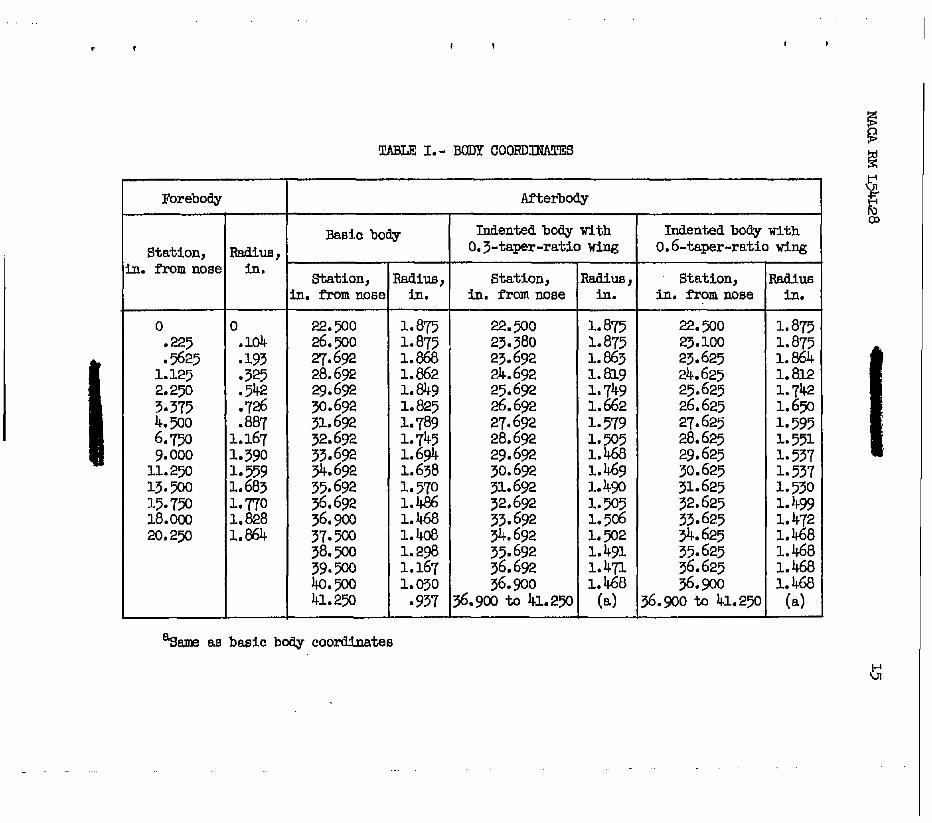
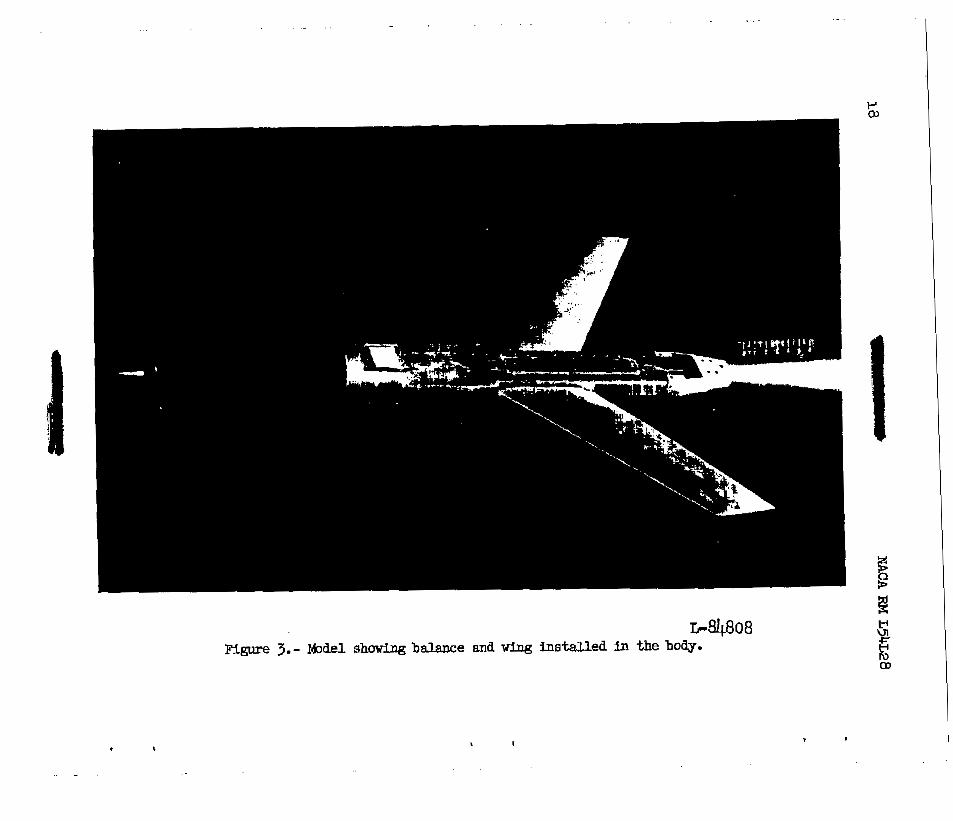
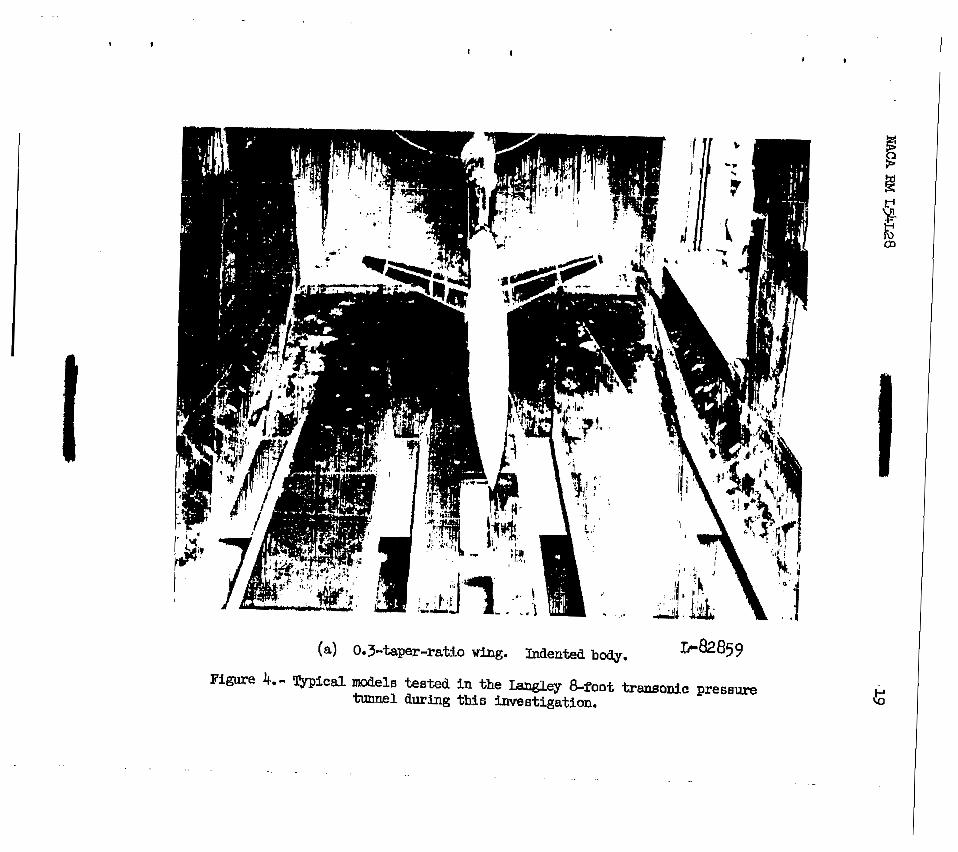
The body frame w a s constructed of steel and housed 871 internal strain-gage wing balance. The balance supported both l e f t and right KLngs independent of the body. The balance measured bending moment on each wing and normal force and pitching moment f o r both wings. A photo- graph of the balance in the body i s presented i n figure 3. The outer shell of the body was constructed of plastic and fiber-glass-coated wood between body stations of 22.5 inches and 36.9 inches. The different body configurations were obtained by fnterchanging these outer plastic shells t o form the desired contour. The shapes of the Mentea body configurations were obtained by application of the transonic area rule of references 1 and 2 for a Mach number of 1.0. The ax ia l cross-sectional- 8xea developmnts f o r the tes t configurations covered by this paper are presented as a portion of figure 2 of reference 4, since the &ape of the bodies used f o r both tes t s was identical. photographs and dimensional details of the wing-body COIobinatione are presented i n figures 4 and 5, respectively. Ordinates f o r the body configurations are preeen-bed in table I.
When the body shells were put into place, a gap of approximately 0.030 Fnch was l e f t between the wing md the body ehel l i n order that there would be no physical. interference. To prevent any flow from entering the body through this gap, a rubber seal wa8 provided a t the wing-body juncture. ( S e e fig. 5. ) The effect of this seal on the b-ce-calibration constants was el-lm-lnated by balance calXbrations w t t h the seals i n place. When the Fndented body configurations were tested, the thinner body shells did not allow enough th ichess t o pro- vide an adequate seal. Therefore, the basic body configurations were tested with and without seals t o evaluate the effect of the seals. The base of the bodies f o r both the basic and indented body configurations was closed t o prevent any flow of a i r aut of the base of the body.
A n electrical system t o determine if the body fouled the wing a t high angles of attack was provided by painting the wing cutout i n the body shell with a conductive silver paint. When the body fouled the wing, the circuit was made t o an indicator limt on the tunnel control panel. Data were not recorded under fouling condltions.
The model w a s connected to the tunnel central support system by maus of a tapered s t i n g attached a t the base of the body (figs. 1 and 4(a)).
6 NACA FtM L54L28
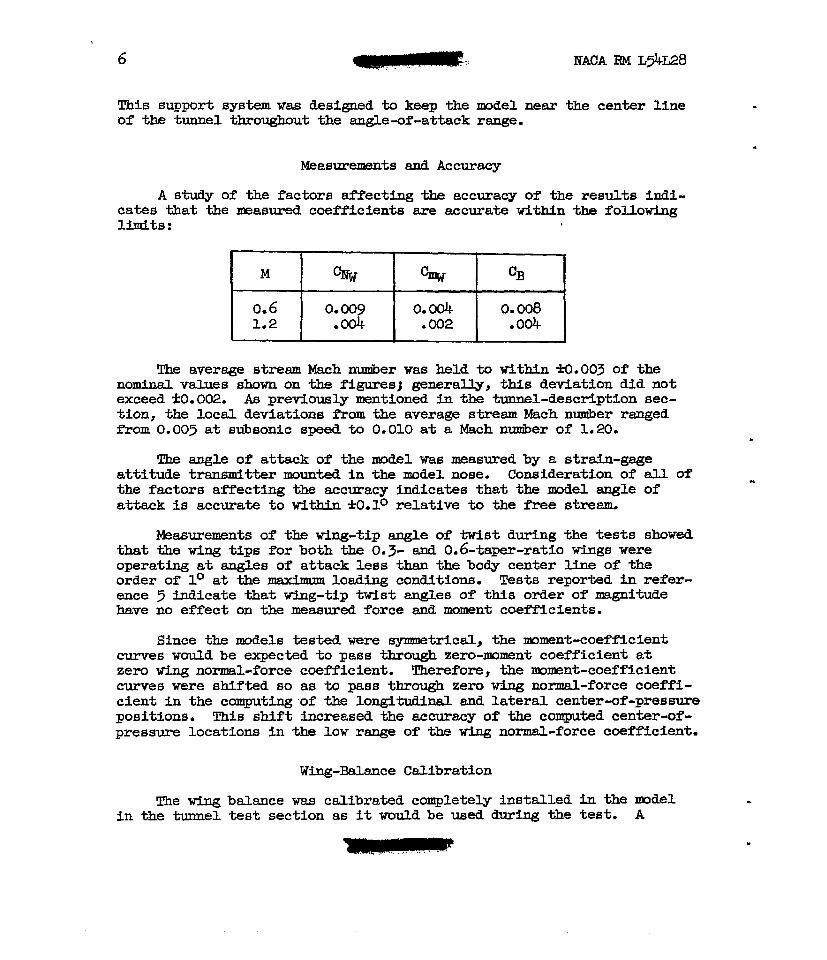
This support system was designed to keep the model near the center line of the tunnel throughout the angle-of-attack range.
Measuremmts and Accuracy
A study of the factors affecting the accuracy of the results indi- cates that the measured coefficients are accurate within the following limits:
0.6 . 004 0002 0 0 0 4 1.2 0.008 0.004 0.oog
The average stream Mach number was held to vithin W.003 of the nominal va lues shown on the flg~res; generally, this deviation did not exceed f0.002. As previously mentioned in the tunnel-description sec- tion, the local deviations from the average stream Mach nlDltber ranged from 0.005 at sul~sonic speed to 0.010 at a Mach n-er of 1.20.
The augle of attack of the model was measured by a strain-gege attitude transndtter mounted in the =del nose. Consideration of aL1 of the factors affecting the accuracy indicates that the model angle of attack is accurate to within -k0.10 relative to the free stream,
Measurmnts of the wing-tip angle of twist during the tests showed that the wing tips for both the 0.3- and 0.6-taper-ratio wlngs were operating at angles of attack less than the body center line of the order of lo at the mxinum loading conditiom. Tests reported in refer- ence 3 indicate that wing-tip twist angles of this order of mgnitude have no effect on the raeaaured force and moment coefficients.
Since the mdels tested were synnnetrical, the moment-coeff'icient curves would be expected to pass through zero-mommb coefficient a t zero wing nornal-force coefficient. Therefore, the mment-coefficient curves were shifted so as to pass through zero wing normal-force coeffi- cient in the computing.of the longitudinal and lateral center-of-pressure positions. This shift increased the accuracy of the computed center-of- pressure locations in the low range of the wing normal-force coefficient.
Wing-Balance Calibration
The wing balance was calibrated completely installed in the model in the tunnel test section as it would be used during the test. A
NACA RM L54L28 7
separate calibration was made for each model configuration. Examination of the calibration data revealed that the addition of seals to the basic --body configurations decreased the balance sensitivity by the order of 5 percent.
Configurations and Test Conditions
Four configurations were tested during this investigation. The specific configurations and teat conditione are as follows :
(1) 0.3-taper-ratio wing in -the presence of the b-asic (Imindented) body. Angle-of -attack range, 00 to 200; Madh muiber range, 0.60 to 1.12.
(2) 0.6-taper-ratio wing in the presence of the basic (urdndented) body. Angle-of -attack range, -20 to 20°; Mach nunher range, 0.60 to 1.20.
(3) 0.3-taper-ratio w2ng in the presence of the indented body. Angle-of -attack range, 0' to 200; Mach muiber range, 0.60 to 1.20.
(4) 0.6-taper-ratio wing in the presence of the indented body. Angle-of-attack range, Oo to 200; Mach rider range, 0.60 to 1.20.
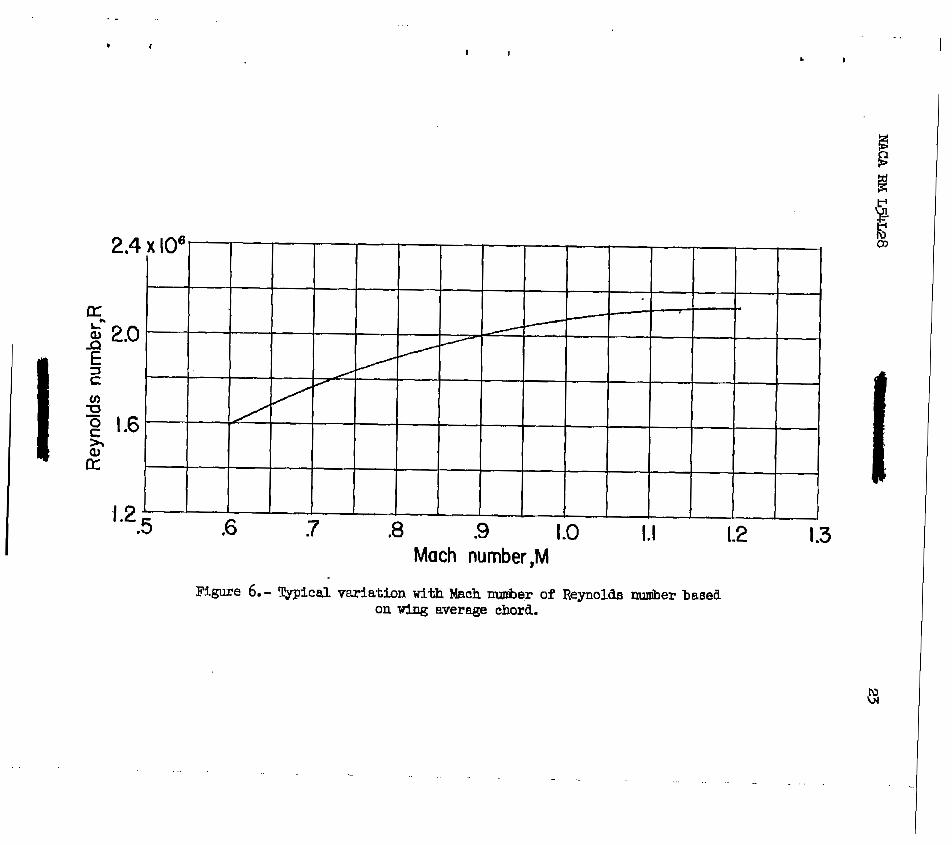
The Reynolds mniber based on the average w h g chord was of the order of 2 x 10⁶ (fig. 6) .
Test points were recorded with increases in as@;le of attack through 20° in every case where buffeting or balance load restrictions did not limit the testing range. In several instances where EL slightly differ- ent model-support configuration was utilized to obtain the high-angle- of-attack data, repeat angles w i t h both configurations w e r e recorded to establish the correlation between the data obtained f r o m both support configurations.
Force and moment coefficients for the 0.3- and 0.6-taper-ratio wings in the presence of the basic and indented bodies are presented. for the Mach nunher range in figures 7 to 10. From these faired c m 6 of force and moment coefficiente, the longitudinal and lateral center- of-pressure locations have been determined and they m e presented in figures ll to 14. The division of load between the wing and the body w a s determined by analysis of' the data presented W e b in conjunction wlth data. from reference 4 and uup3lished data anti is presented in f ig- ures 15 and 16. It was anticipated that utilization of the data from reference 4 along with force data for the body alone muld a l l o w the
8 t NACA RM L54~28
body interference to be isolated. However, the electrical strain-gw . balances utilized in these investigations were not sufficiently accurate to allow the relatively smal2 interference effects to be separated from .the overall effects.
In order to facilitate presentation of the- data, staggered scales have been used in maqy figures J and care should be taken in selecting the zero axis f o r each c m .
DISCUSSION
Effect of Wing-Body-Juncture Seals
The force and moment coefficient8 for the w i n g s in the presence of the basic body with and without the wlng-body- juncture seal (figs. 7 and 8) generally show good agreemnt with the exception of the pitching- moment coefffcients above pitch-yp.
General Effects
The foYowing general effects are applicable to each of the four configmations tested; the 0.3- and 0.6-taper-ratio wings are in the presence of the basic and indented bodies, except w h e r e otherwise noted.
Effect of wins: normal-force coefficient.- With increases in the wing normal-force coefficient at constant Mach n W e r (figs. 7 to lo), the slopes of the angle-of-attack,,pitching-nxment-coefficient, and bending-mment-coefficient curves experience no abrupt changes up to the pitch-up wing normal-force coefficient. It is noteworthy that all the force- and mment-coefficient curves exhibited some change in slope at this pitch-up wiw nonml-force coefficient. Further increases in the wing norma;L-force coefficient generally caused additional changes in the slopes of these curves.
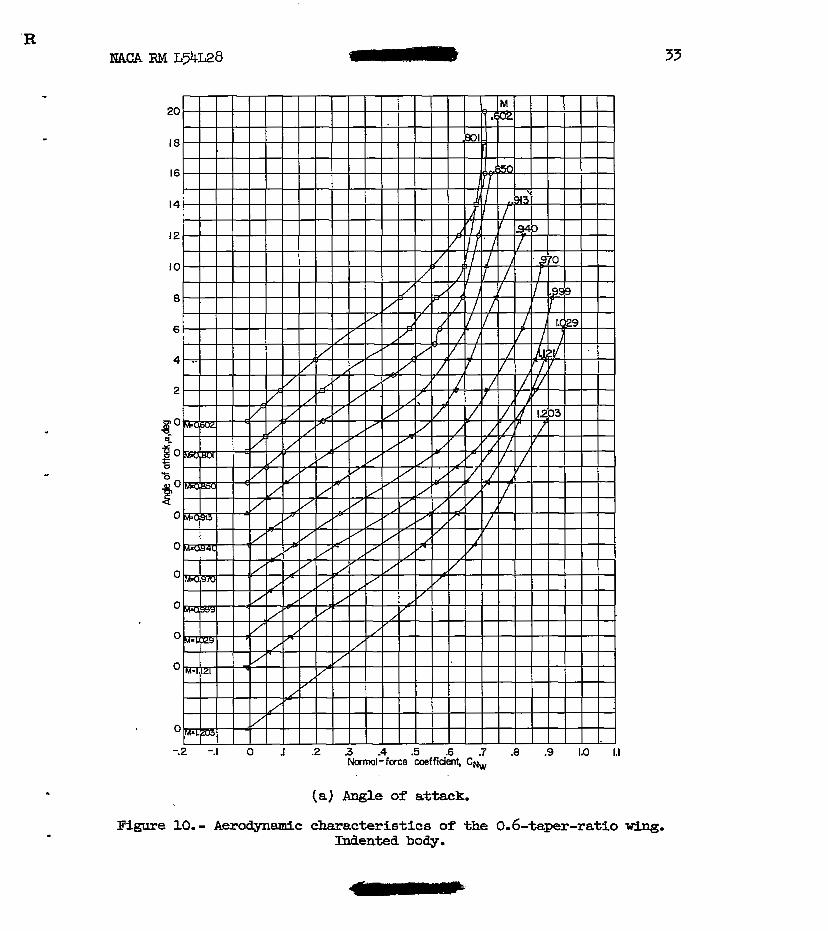
Effect of Mach nu&er.- With increases in Mach number from 0.60 to approxhtately 0.95, the slopes of the wing-normal-force-coefficient curyes increased signtficantly In the low wing-normal-force-coefficient range (figs. 7(a) 8(a), g(a), and lO(a)). n r increases in Mach nuniber to the maxirrmm tested caused gradual decreases in the slopes.
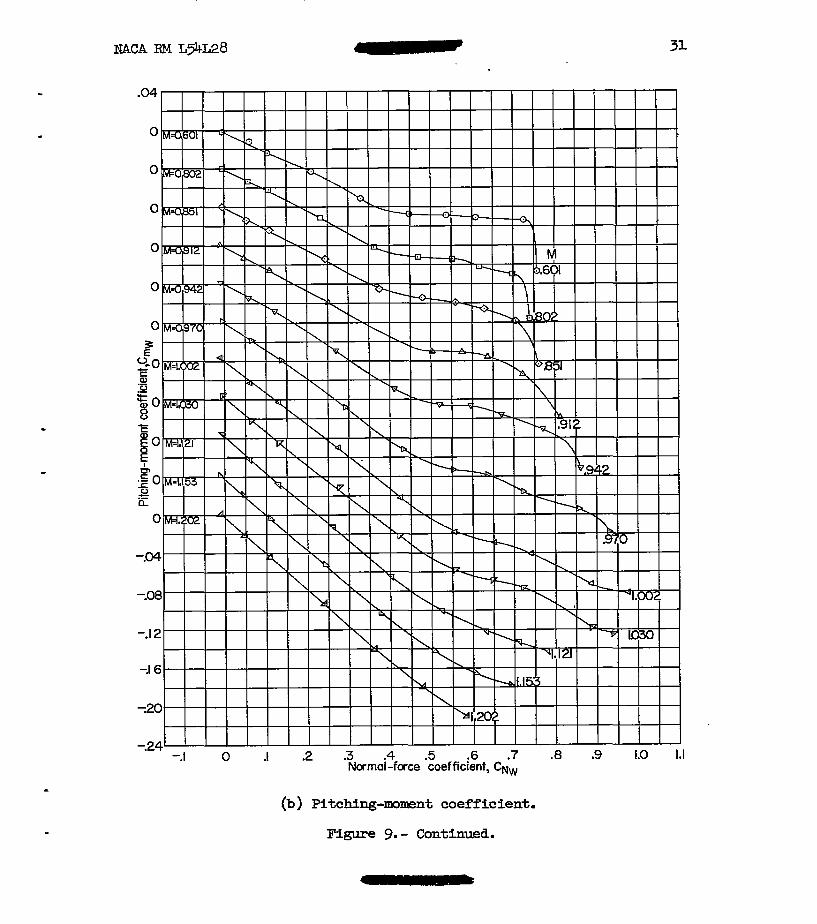
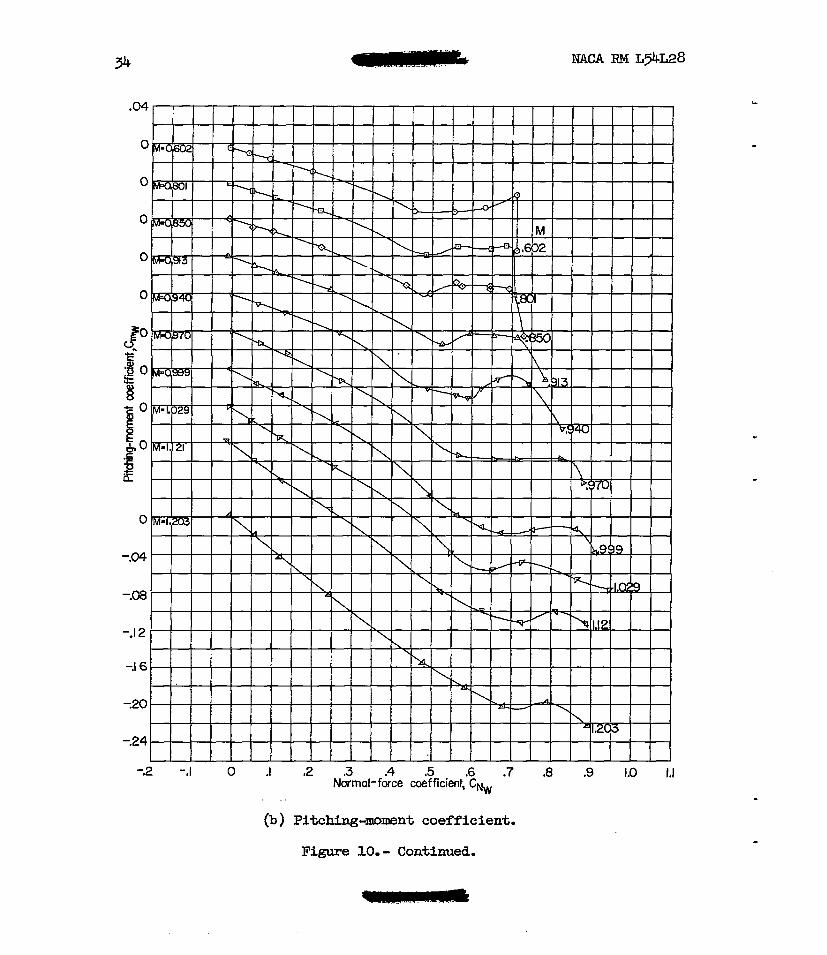
Mach nuniber increases f r o m 0.60 to the maximum t e s t e d caused increases in the slopes of that portion of the pitchbg-moment curves below the pitch-up wing normal-force coefficient (figs. 7(b), 8(b) , g(b), and 10 (li) ) . The pitch-up wing normal-force coefficient increases from approldmately 0.4 to 0.7 with increases in Mach rider f r o m 0.60 to 1.20.
2R 9
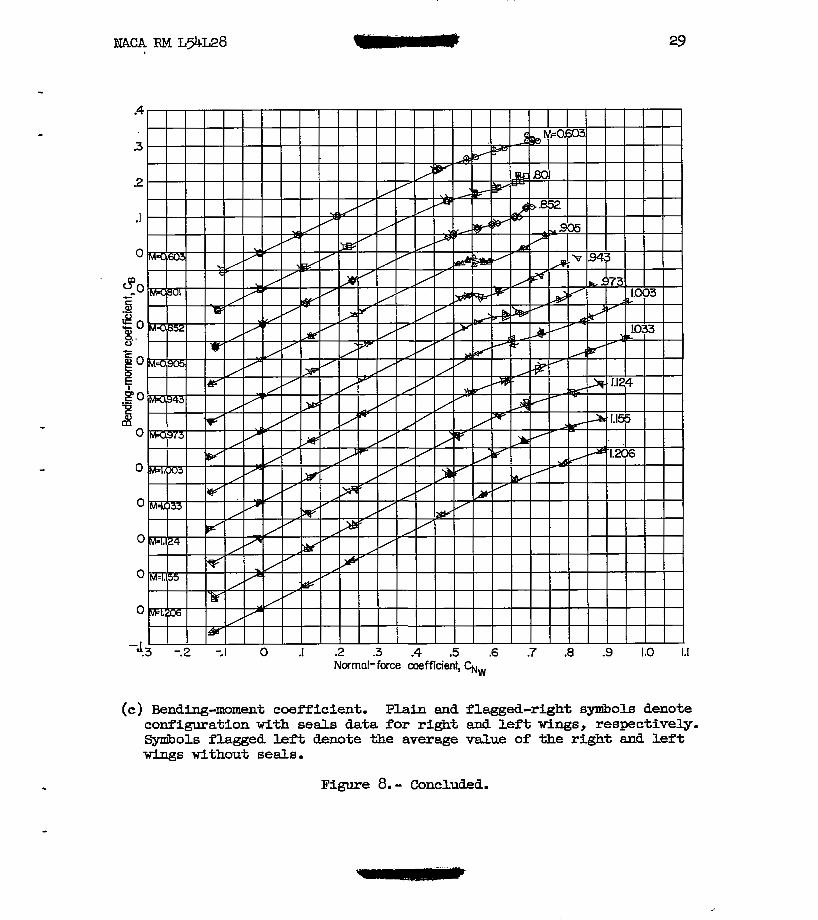
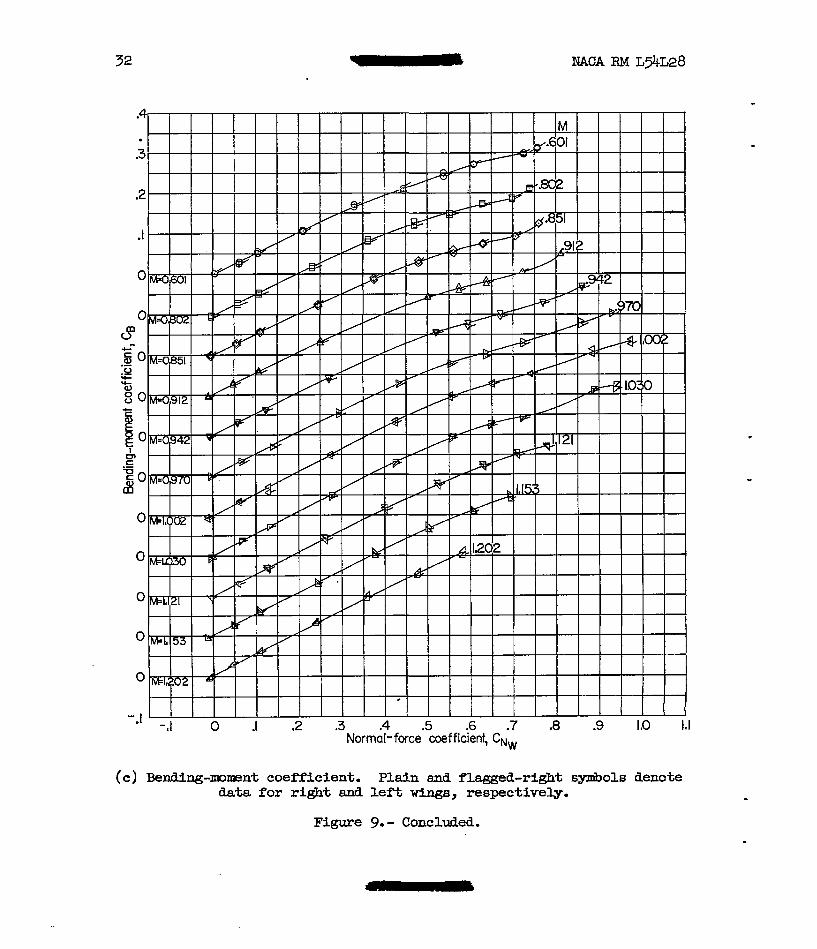
The slopes of the bending-mmnent-coefficient curves increase grad- ually wtth increases in Mach nuniber f r o m 0.60 to 1.20 in the low range of the win@: normal--force coefficient (figs. 7(c), 8(c), g(c) , and 10(c)).
Longitudinal and lateral locations of the center of pressure.- The effects of wing normal-force coefficient, taper ratio, and Wch m e r on the longitudinal and lateral location of the center of pressure for the wings are sham i n figures 11 and 12. The rapid f o r w d and inboard movements of the center of pressure for values of wing normal-force coef- ficients between approximately 0.4 and 0.7 (figs. U(a) and 12(a)) are associated with pitch-up. (See figs. 7(b), 8(b), g(b), and lO(b).) Before pltch-up occurs, there is generally a rearward mvement of the center of pressure of the order of 4 percent of the meas aeroaynamic chord and relatively little lateral movement for a constant Mach n-er.
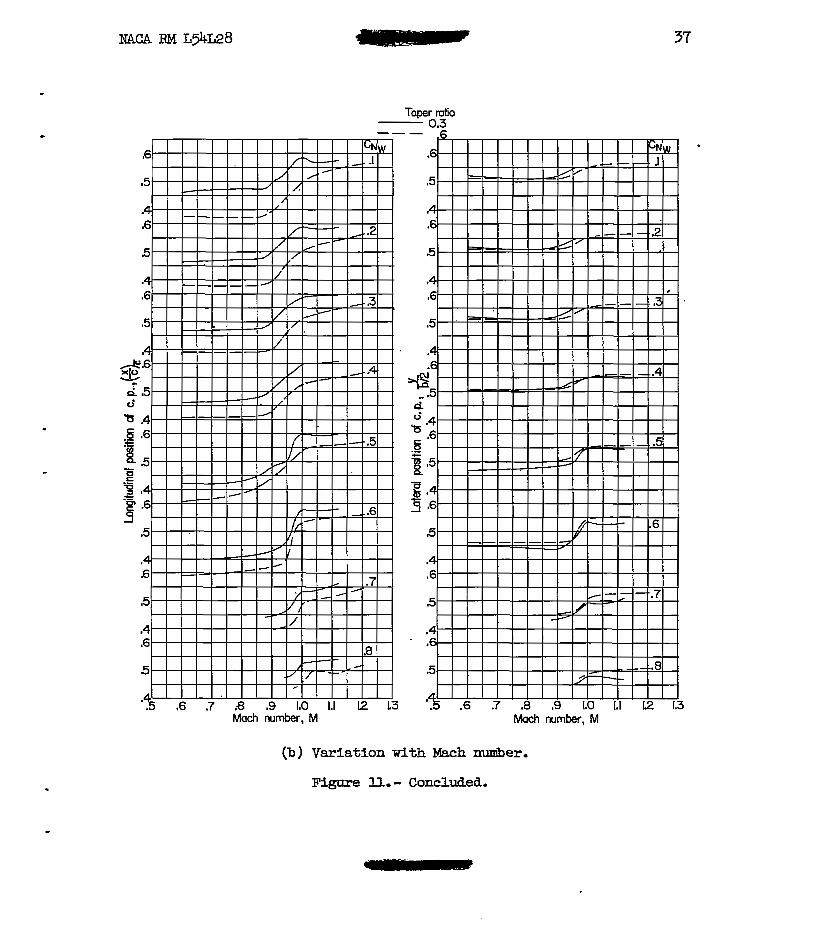
With increases i n Mach n&er from approxbmtely 0.60 to 0.85 at a constant wlng normal-force coefficient below pitch-up, the longitudinal and the lateral locations of the center of pressure experience no appre- ciable mveaent (figs. ll(b) and E ( b ) ) . Between Mach nunhers of 0.85 and 1.0, the onset of supersonic flow over the wing produced a major change in both the longitudinal and lateral location8 of the center of pressure for both uings, Rearward movements of the order of 15 percent of the mean aerodynamic chord Fn conjunction w i t h outboard shifts of the order of 5 percent of the wing sem€span were experienced. Above Mach nunher 1.0, the longitudinal center-of-pressure locations experienced additional reward movements at a reduced rate, whereas the lateral locations remained essentially constant.
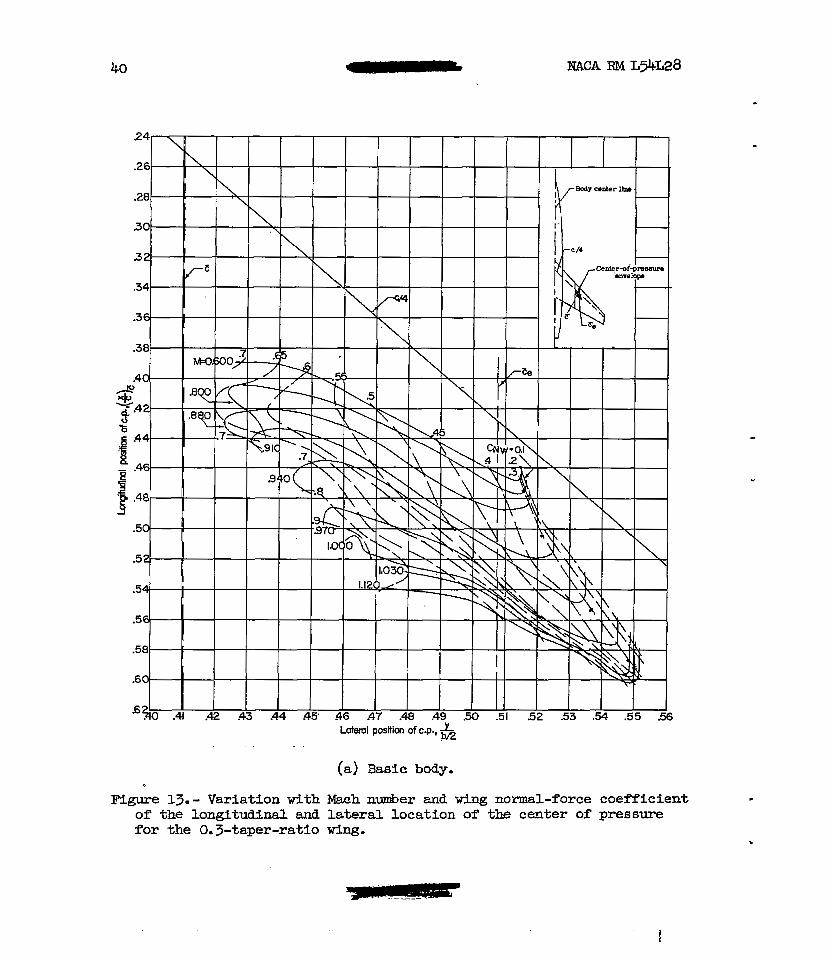
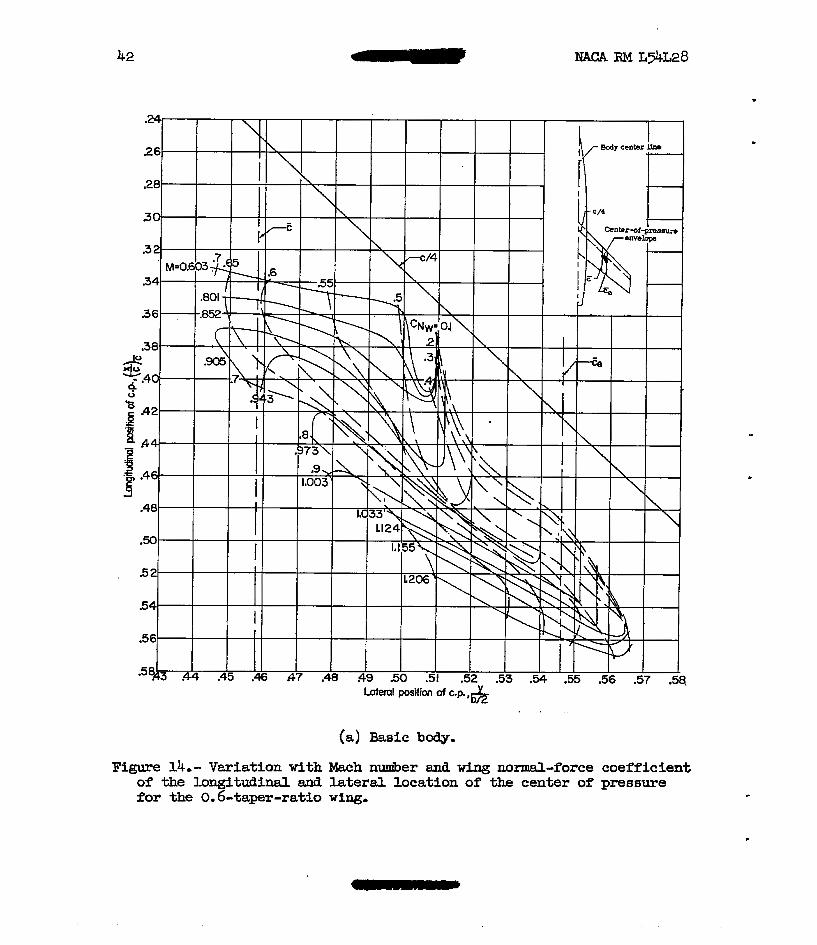
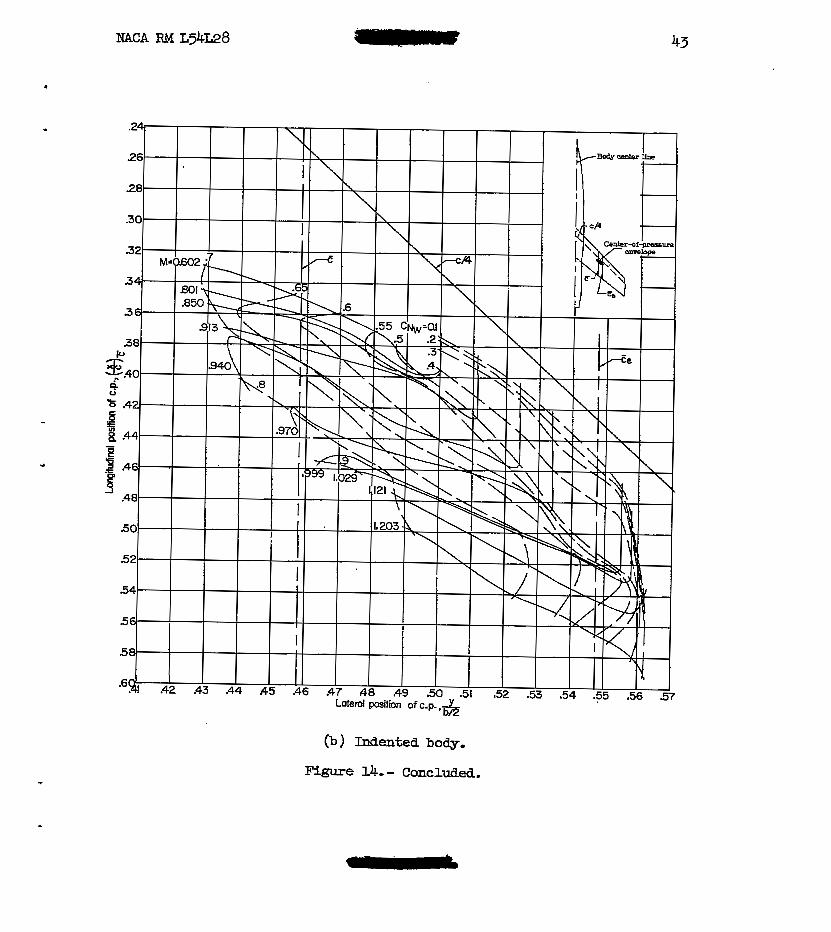
The center-of-preesure loci (f fgs. 13 and 14) show the conibined longitudinal and lateral center-of-pressure mvements throughout the range of Mach nuniber and wing normal-force coefficient tested. It should be emphasized here that the accuracy of the data presented does not Justie the large plotting scale used in figures lj and 14. 'This large scale was chosen to separate the data sufficiently to U o w the effects of Mach mmiber and Ksng norad-force coefficient to be evident and distinct, in addition to presenting the longitudinal and lateral movements in the proper proportion to each other. A n ingortant point to note is that the center-of-pressure mvement occurs within the same general boundaries f o r all the configurations. Also of interest is the fact that although the center of pressure mves generally f o m d with respect to a fixed poht on the wing with increase in wing normal-force coefficient, it is actually moving rearward ~5th respect to the lo& chord at the lateral position of the center of pressure. The mean aero- aynamic chord for both the total w i n g and exposed wing and the p t e r - chord line are shown for orientation.
outboard location of the center of pressure. These ou-bboard center-of- L
pressure locations occur at the ving normal-force coefficients up to pitch-up. For a given Mach numbert the decrease in the m m n t arm due to the inboard movement of the center-of-pressure location with increases in the wing normal-force coefficient above pitch-up is more than compen- sated for by increases in the w b g normal force. Consequently, the wing bending monent continues to increase as the center-of-pressure location .moves inboard.
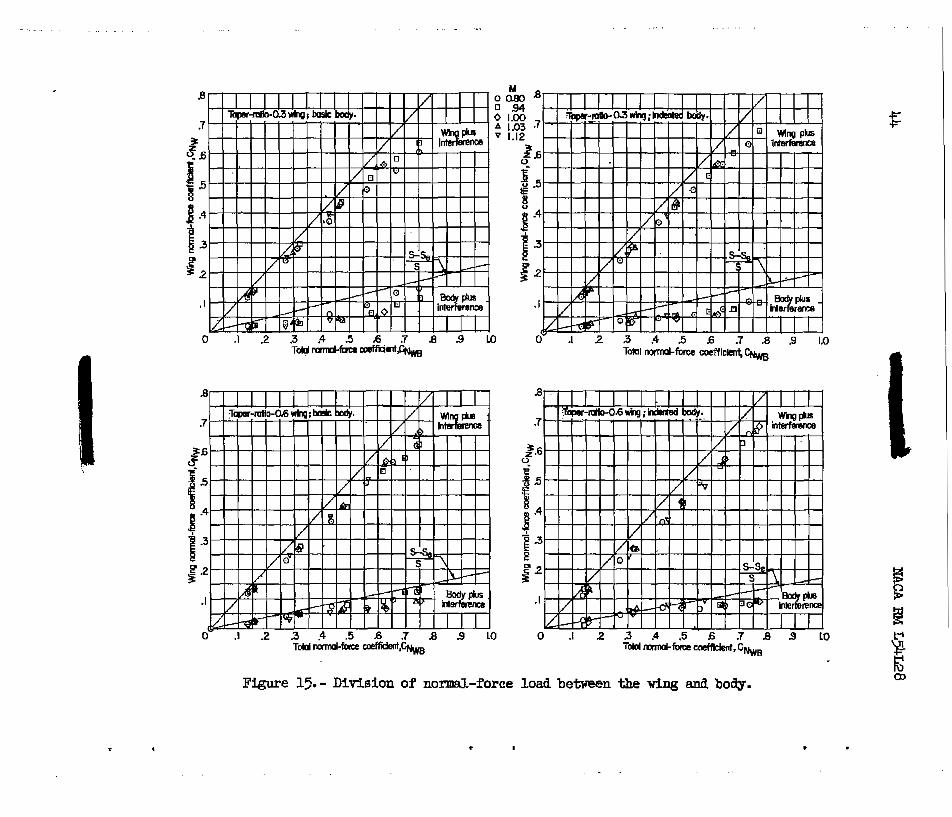
Division of load between the wing and body.- The division of normal- force and pitching-moment load between the wing and body is shown in
Figure 15 shows the division of normal-force load as.total normal- force coefficient against normal-force coefficient for the King in the presence of the body. Also shown in figure 15 is the difference between the total normal-force coefficient and the WinQI; normal-force coefficient. This difference is the normal-force coefficient for the body plus wing interference. In general, the normal-force load carried by the body is less than the ratio of wing ares blanketed by the b d y to the total w3ng
area muld indicate (" s, line on fig. 15 . Reference 6 points aut
that this shple mea ratio mey approximate the division of normal-force load under certain conditions. Hbwever, there are theoretical methods which give closer prediction. A slight Mach nuniber effect on the division of normal-force Load for the basic body configurations is apparent. This effect was diminished coneiderably by body indentation.
) - -
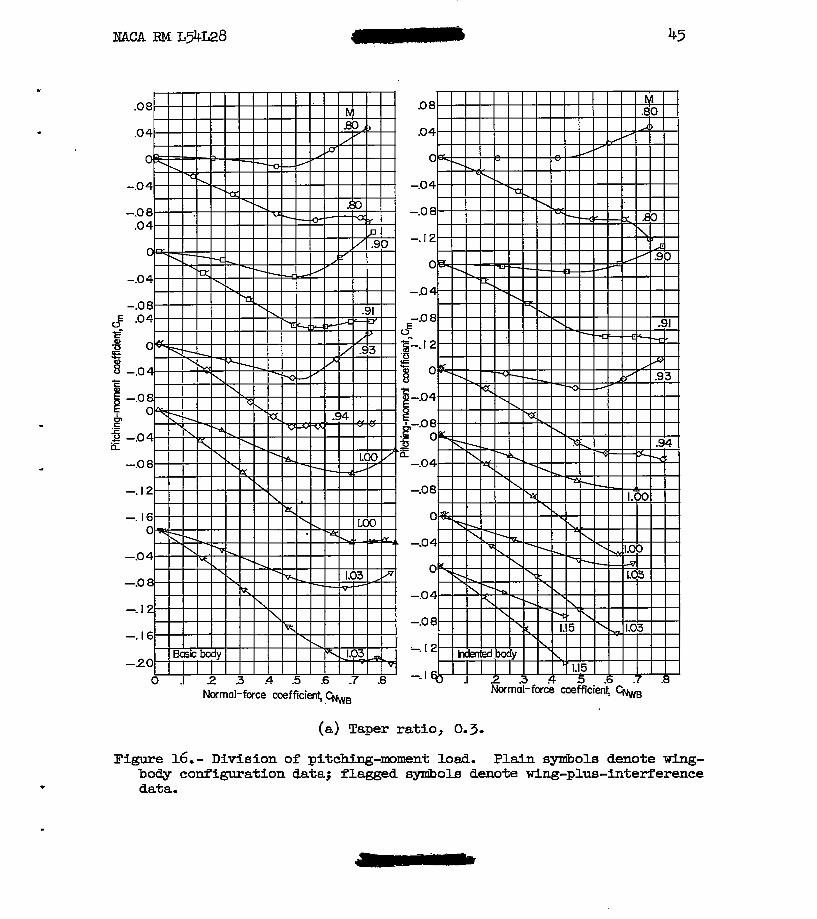
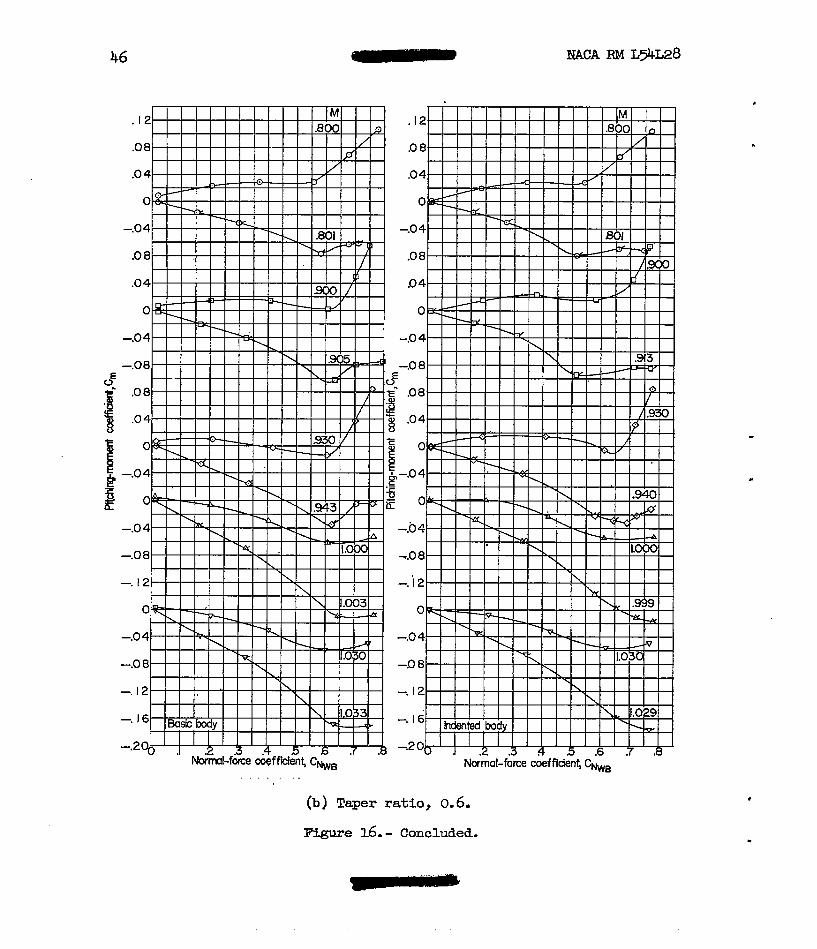
Figure 16 shows the division of pitching-moment load as pitching- monment coefficient for the wing-body combination and for the wing in the presence of the body against --body normal-force coefficient. For all the configurations, the pitching-mmznt curves for the wing in the pres- ence of the body are very sfmilar in shape up to pitch-up to the pitching- moment curves for the wing-body conibination except for a considerably mre negative slope. Both the --body collibination and the wing in the pres- ence of the body experience pitch-llp at approximately the same normal- force coefficient. Honever, the wing-body conibination exhibits mre exaggerated pitch-up characteristics because of the influence of t h e large positive pitching moment of the body in this normal-force-coefficient range .
Effect of Taper Ratio
At a constant Mach number, an increase in taper ratio increased the wing normal-force coefficient where pitch-up occurs (figs. 7(b), 8(b) 9 (b) and 1O(b ) ) . merefore the rapid forward and inboard movement of the center of pressure associated with pitch-up is delayed to a higher
- As previously mntioned, the onset of supersonic flow over the wings , between a Mach nllPiber of 0.85 and 1.0 causes a rapid rearward and out-
board mov-nt of the center of pressure (figs. l l ( b ) and 12(b)). The increase in taper ra t io f r a n 0.3 t o 0.6 delays sl ightly the Mach nuniber where this rearward and outboard mvement begins,
Ekamination of figures ll and 12 indicates that increases i n taper ra t io from 0.3 t o 0.6 cause the longit- center-of-pressure location to mve forwmd as nuch as ll percent of the man aerodynamic chord. It should be emphasized that the major portion of these differences can be attributed directly t o the differences in the length and spanKise loca- tion of the rean aerodynamic chords of the two win@. B e t t e r correlation between the data for the two win@;s can be obtained by uti l iz ing the average chord as a reference since it is the same length and a t the same spanwlse location f o r both Kings. A plo t showing a conparison i n this form is presented in figure 17 t o show the effect of taper ratio, wing normal-force coefficient, and Mach n-er. Since the correlation is much improved over the results us- E as a reference (figs. ll and E), it i s apparent that the increases in taper ratio from 0.3 to 0.6 M Httle effect on the 1ongitudim.l location of the center of pressure below pitch- up w h e n using the averege chord as a reference. Differences of a maxirmrm of only 4 percent were noted i n the transonic Mach rider range. The delay, due t o an increase in taper ratio, in the normal-force coef'ficient at which the forward movement of the location of the center of pressure associated with pitch-up begins is mre evident i n figure 17 than In f ig- ures ll and 12. Another effect of the increase i n taper ratio which is more evident than before is the slight delay in the Mach nunher a t which the rapid rearward movement of the center of pressure begins ( f ig . l7(b) ) .
Sn an attempt t o improve further the correlation, other parameters were utilized, Fnclud3ng replacing Cm w i t h a normal-force coefficient based on the exposed wing area. However, no substantial Further -rove- merit i n the correlation of the longitudinal location of the center of pressure was obtained.
In summarizing, the effects of taper ra t io on the longituainal and lateral locations of the center of pressure.are rather small. Below pitch-up the increase in taper ra t io was accountable f o r a maximcrm dif - ference in the longitudinal locations of 4 percent of the average chord and a maxbur~ difference in the lateral locations of 3 percent of the w i n g semispan.
12
Effects of Body Indentation
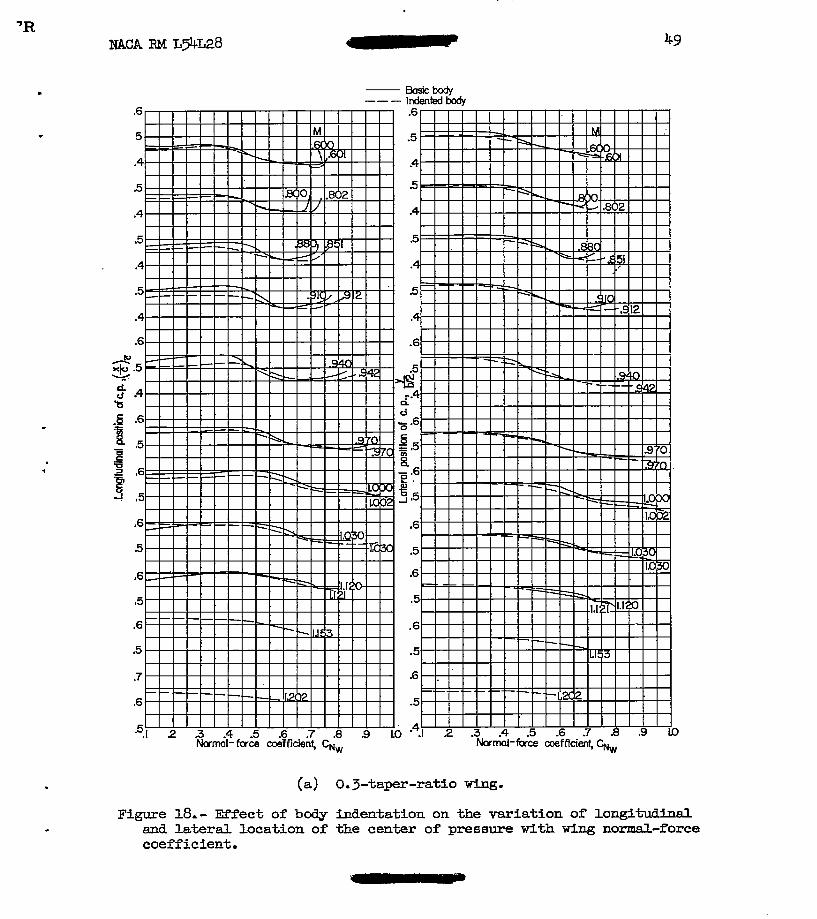
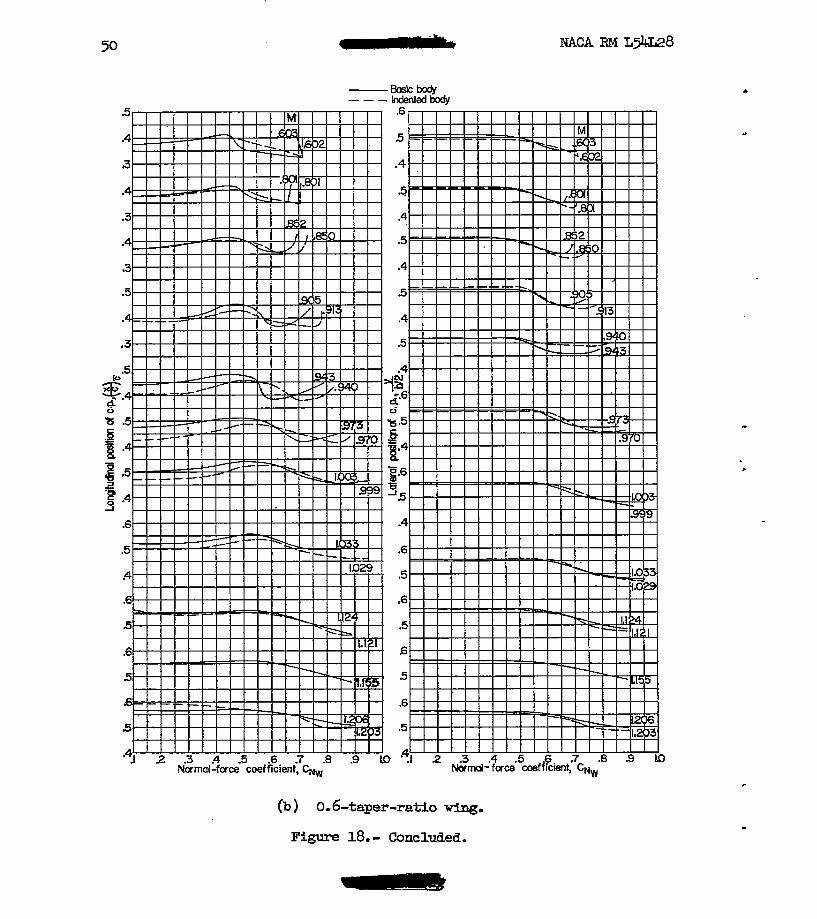
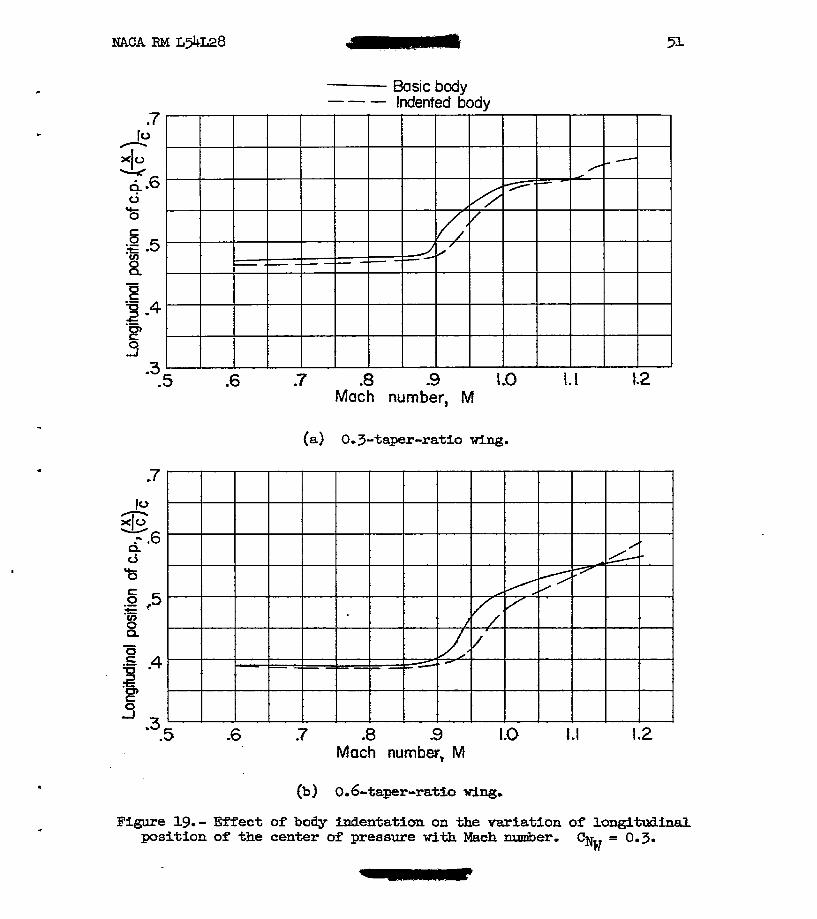
The effects of body indentation on the longitudinal and lateral loca- tions of the center of pressure are shown i n figures 18 esd lg. The rmjor effect of body indentation is to delay the Mach ntrmber at W c h the rapid rearward "t of the center of pressure begins (fig. 19). O t h e r effects of body indentation on the loading characteristics are negligible.
Comparisons With Other Data.
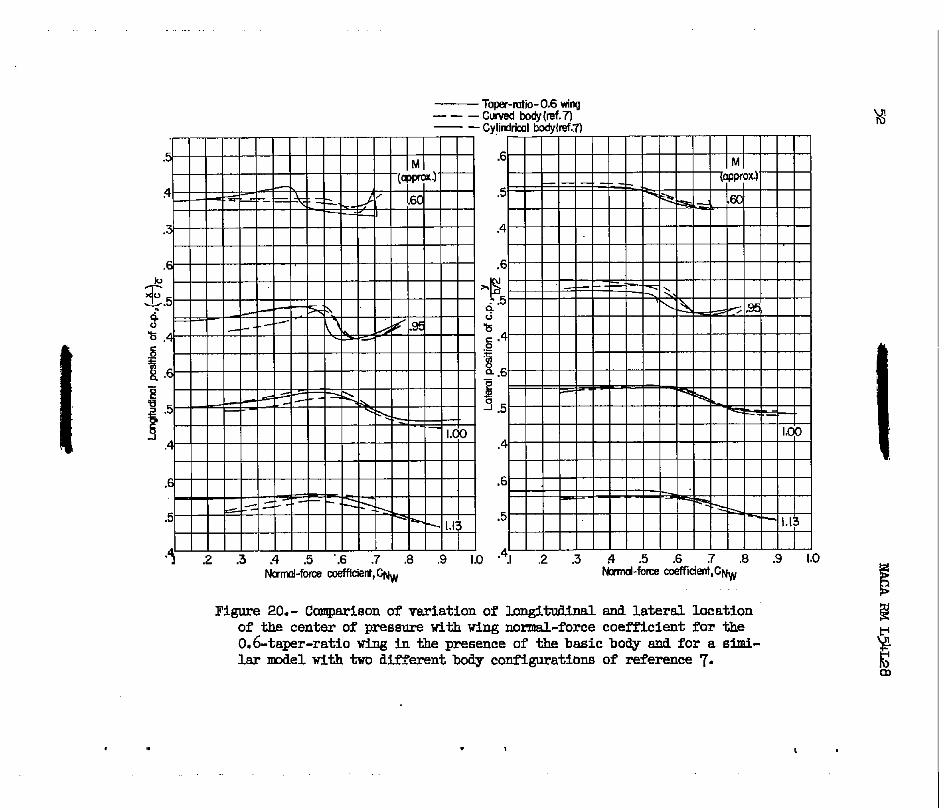
The longitudinal and lateral locations of the center of pressure obtained during this investigation are compared with results from a pressure-model investigation (ref. 7) in figure 20. TIE w~ng used in the investigation of reference 7 is similar to the 0.6-taper-ratio wing of this investigation. Hbwever, the body conf'iguratlons were different. Two different bodies were utilized and were designated the m d body and the cylindrical body, respectively. The curved body w a s a fineness- ratio-10 body having a curved profile f m m the nose to the base. The cylindrical body was a fineness-ratio-ll. 8 body having a curved profile f r o m the nose to the King le- edge and a cylindrical section from the WFng leading edge to the base of the model. The center-of-pressure locations from the two investigations are in generally good agreement. This egreem=nt indicates that changes in body shape of the nature ewe- rienced in these two investigations have no pronounced effects on the center-of -pressure locations.
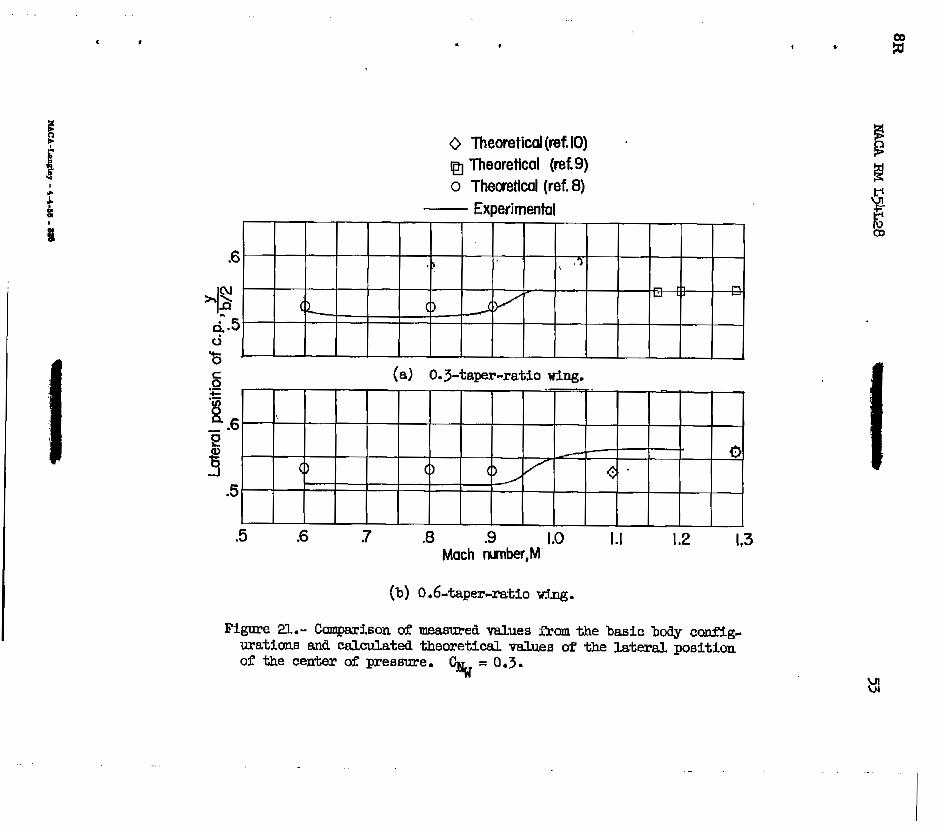
Calculated lateral locations of the center of pressure in accordance with references 8, 9, and 10 are compared with the experimental values obtained from the basic body configurations dur ing t h i s investigation in figure 21. Reference 8 is applicable at subsonic Mach nmibers. Refer-
' ence 9 is applicable in the, supersonic Mach nrmiber range from 1.163 and 1.288 for the 0.3- and 0.6-taper-ratio wings, respectively, to approxi- mately 1.5. Reference 10, however, is applicable at lower su;eersonic Mach numbers for these two wiags (approximately 1.02 to 1.5) . Since the computations in accordance with reference 10 axe v e q time consuming, this reference was utilized for only two points. Points were computed in accordance with references 8 and 9 for the 0.3-taper-ratio wing (fig. =(a)) and in accordance with references 8, 9, and 10 for the 0.6-taper-ratio wing. Body interference was not included in the calculations.
The comparison showed generally good mement. In the transonic speed range the experimental values show 8 smooth transition from the lateral center-of-pressure position for subso~Lc speeds to the position for low supersonic speeds. This transition is completed at a Mach num- ber ne= 1.0. The calculated values for the 0.6-taper-ratio .wing (fig. 2l(b)) show that both references 9 and 10 give the same result at a Mach m e r of 1.288; however, reference 10 appears to predict a
transition somewhere between a Mach n . e r of 1.092 and 1.288, which is a t a considerably higher Mach number than the exper-ntal transition. The good agreement a t d e r a t e supersonic speeds (M = 1.2) between the calculated and experimental. values and the characteristics of the exper- imental lateral position t o s tabi l ize a t its supersonic value around a Mach number of 1.0 indicates that the lateral center-of-pressure position a t low supersonic speeds could be predicted (below pitch-up) from the values calculated in accordance with reference 9 at the higher Mach num- ber where the theory becomes applicable (M 1.2).
CONCLUSIONS
Results obtained i n the Langley 8-foot transonic pressure tunnel t o determine the effects of taper ratio and bo@ indentation on the aero- dy-namic loading characteristics of a 45O sweptback wPng i n the presence of a body lead to the following conclusions:
1. An increase i n taper ratio from 0.3 to 0.6 through the Mach num- ber range from 0.6 to 1.2 with increases in wing normal-force coefficient up t o approximately 0.8 results in a delay in the Mach number for the transonic rearwad and outboard moverent of the center of pressure which causes differences of a maximcM of 4 percent of the average chord i n longitudinal. location and differences of a maximum of 3 percent of the wing semispan in the lateral location below pitch-up. Also, a delay results in the wing normal-force coefficient at which pitch-up occurs.
2. Body indentation delays slightly the Mach nunher a t which the transonic rem mvemMt of the center of pressure begins. Other effects of body indentation on the loading characteristics are negligible.
3. Good correlation of the effects of taper r a t i o on the longitudi- nal center-of-pressure location can be obtained by uti l izing the average chord as a reference in l ieu of the mean aerodynamic chord.
4. The smooth transition of the center of pressme a t transonic speea Etnd the characteristic of the lateral location to stabilize at i t s supersonic value around a Mach rider of 1.0 al lare the l a te ra l loca- t ion at low supersonic Mach mmkers t o be predicted from the theoretical value calculated f o r a higher Mach &era
Langley Aeronautical Laboratory, National Advisory Comrdttee f o r Aeronautics,
Langley Field, Va., December 10, 19%.
.
14 IaCA RM ~ 3 4 ~ 2 8
1. Whitconib, Rich& T.: A S t u d y of the Zero-Lift Drag-Rise Character- i s t i c s of Wing-Body Combinations Near the Speed of Sound. NACA RM L5m8, 1952.
2. Whitconib, Richard T., and Fischetti, Thomas L.: Development of a Supersonfc Area Rule and an Application t o the Design of a W i n g - Body Combination HEtving €Ugh Lift-to-Drag Ratios. NACA RM L53lij51a, 1953
3. Ritchie, Virgil S.: W e c t s of Certain Flow Nonuniformities on L i f t , Drag, and Pftching Moment for a Transonic-Airplane W e 1 Investi- gated a t a Mach N&er of 1.2 i n a Nozzle of Circular Cross Section. NACA RM LgEX)a, 1949.
4. Morgan, Francis G., and Carmel, Melvin M.: Wansonfc Wind-Tunnel Investigation of the Effects of Taper Ratio, Body Indentation, Fixed Transition, and Afterbody Shape on the Aerodynamic Charac- te r i s t ics of 8 45O Sweptback Wing-Body Combination. N X A RM L s A l 5 , 1954. -
5. Osborne, Robert S., and Mugler, John P., Jr.: Effects of Wing Elas- t i c i ty on the Aerodynamic Characteristics of a 45O Sweptback-Wing- ., Fuselage Combination Wasured i n the Langley &Foot Wansonic Tunnel. NACA RM ~ 5 2 ~ 2 3 , 1952.
6 . Gillis, Clazence L. : A Summary of Data on the Division of Loads for V a r i o u s Wing-Fuselage Combinations, MACA RM L53E08, 1953.
7. Loving, Donald L.: The Effect of a Change i n Ebdy Shape on the Loading of a 450 Sweptback Wing-Body Combination a t Transonic Speeds. NACA rn ~ 5 4 ~ 0 9 , 1954.
8. DeYoung, John, and Harper, Charles W.: Beoretical Synanetric Span Loading a t Subsonic Speeds f o r Wings Having Arbitrary Plan Form. NACA Rep. gU, 1948.
9. Hannah, Margery E., and m g o l i s , Kenneth: Span Load Dietribution Resulting From Constant Angle of Attack, Steady Rolling Velocity, SteaQ Pitching Velocity,'and Constant Ver-LicEtl Acceleration for Tapered Sweptback Wings With Streamwise Tips - Subsonic Leading Edges and Supersonic Palling Edges. W A TN 2831, 1932.
10. Cohen, Doris: Formulas for the Supersonic Loading, Lift, and Drag of - Flat Swept-Back Wings With Leading Eages Behind the Mach Lines. NACA Rep. low, 1-1.
I
I I
. .
i 1
Forebody I Afterbody
Station, n. f r o m nose
0 .225
1.125 2.250 3* 375 4.500 6.750 9.000 11.250 13- 500 159 7% 18.000 20.2y
$25
T I
Baeia body Inaented bcdy Kith 0.3-taper-ratio wing
miue, Station, =us, in. in. from nose I in. r
% m e as basic body coordinates
22.500
1.812 24.625 1.864 23.625 1.875 23.100 1.87’5
1 595 27.625 1,650 26.625 1.742 25.625
29.625 1.537 30.625 1.537 31.625 1- 530 32.625 1.459
28.625 1.551
33 625
1.468 $* 900 1.468 36.625 1.468 35- 625 1.468 9 + * 625 1.472
$.go0 .to 41.250 (a)
.... . ..
. .
Figure 1.- Details of t e s t sectlon ana location of model in the IangLey a f o o t transonic pressure tunnel. AU dimensions are in in~he~.
. .
I
,
I I
. .
. . . . .
L-94808 Figure 3.- Model showing balance and VFng i n a t d l l e d . in the body.
I
I I
. .. .. ..
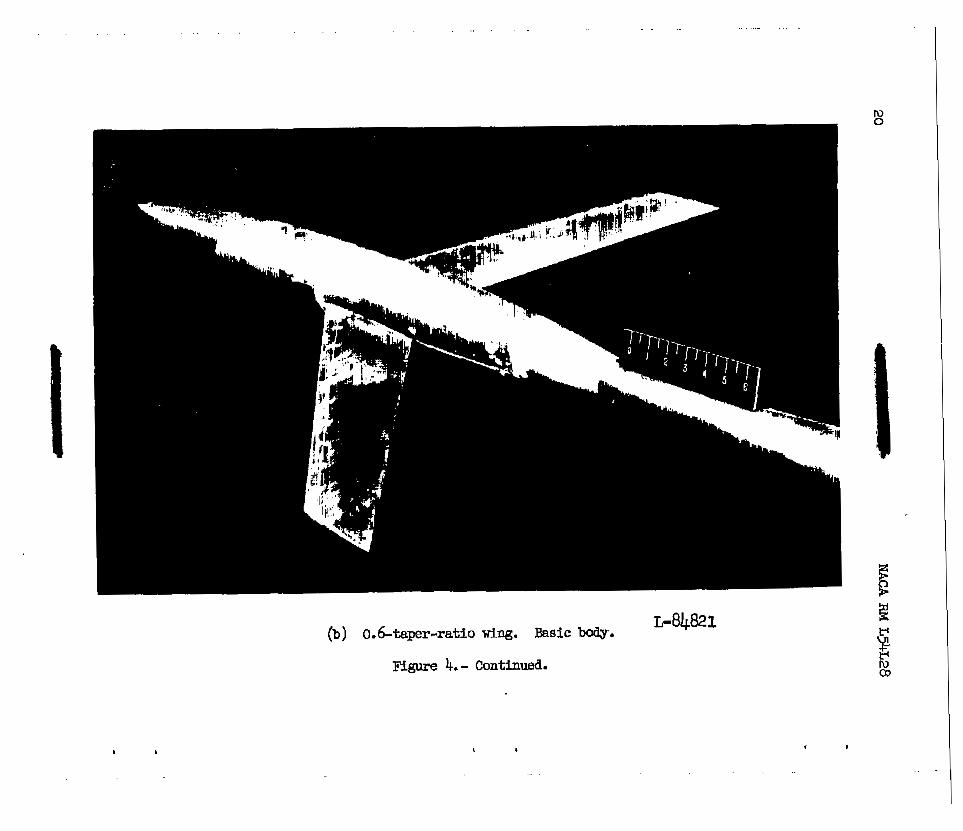
(b) 0.6-taper-ratlo dng. Basic body. L-84821
I I
I kqau
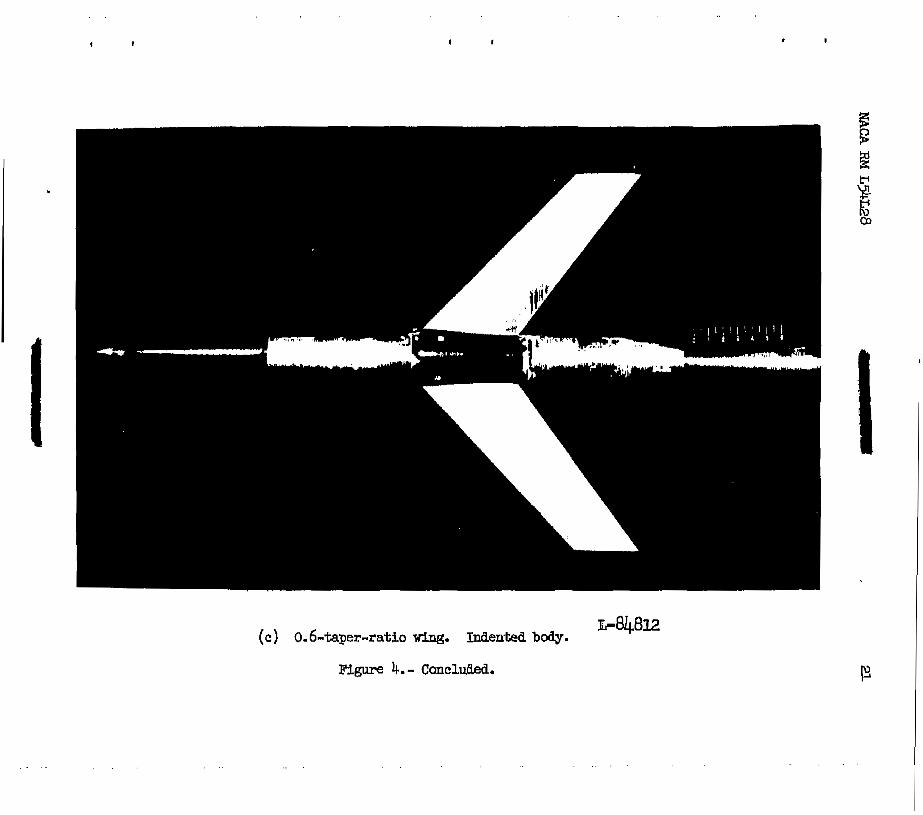
(c) 0.6-taper-ratio wing. Indental body.
~ l g u r e 4.- concluded.
22
(a) Wing-body configuration with taper ratio of 0.3.
(b) Wing-body conf'iguration with taper ra t io of 0.6.
Figure 5.- Wing-body configurations used in Investigation. All dimen- sfons are i n inches.
2.4
I I I
.6 .8 .9 1.0 Mach number ,M
1.1 1.2
Figure 6.- 'pypical val-iatloan. wit31 #ach M e , r of Reynolda number basea on wlng average chord.
. ..
. . .
24
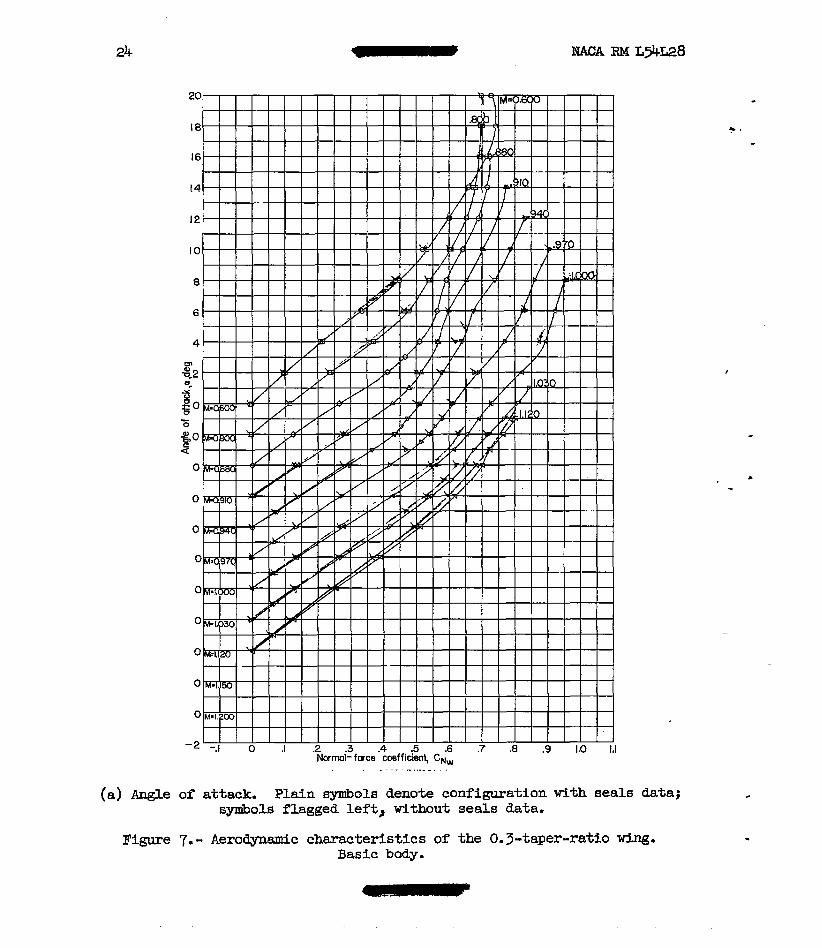
of attack. Plain symbols denote configuration wlth seals data; synibols flagged left , without seals data.
7.- Aerodynamic characteristics of the 0.3-taper-ratio wing. Basic body.
.
-.I 0 .I .2 .3 .4 .5 .6 .7 .8 .9 ID 1.1 Normal-force coefficient, C N ~
- - - . - ..
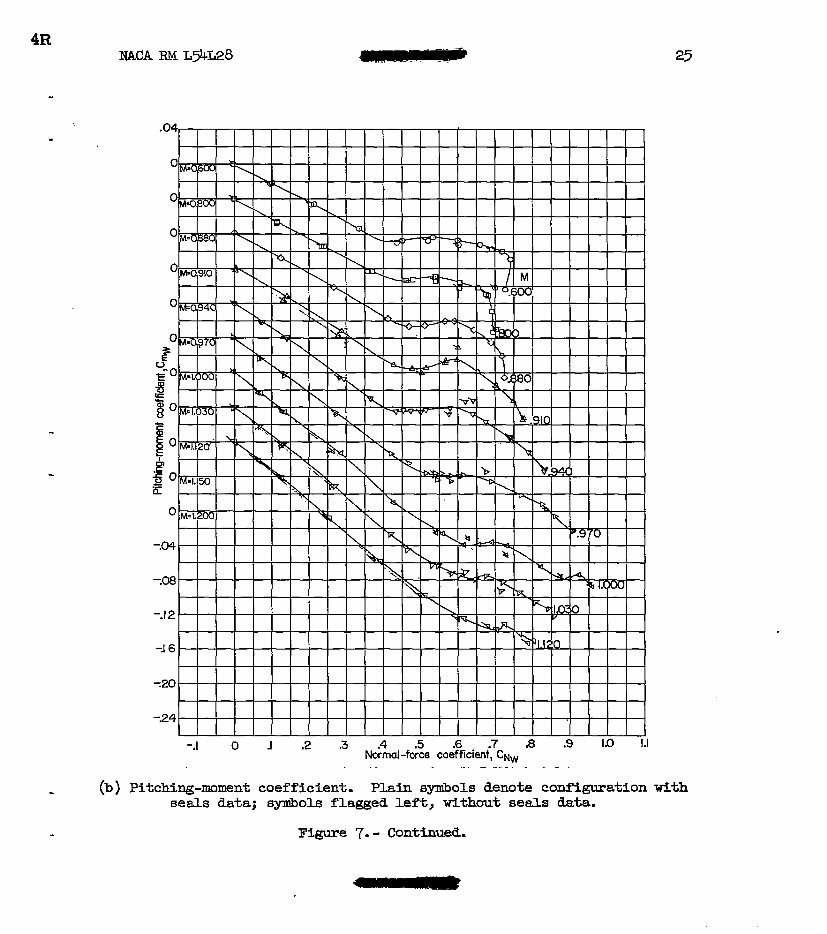
- (b) Pitching-moment coefficient. P h F n symbols denote configuration wlth
- Figure 7. - Continued. sea ls data; -01s flagged left, without seals data. -
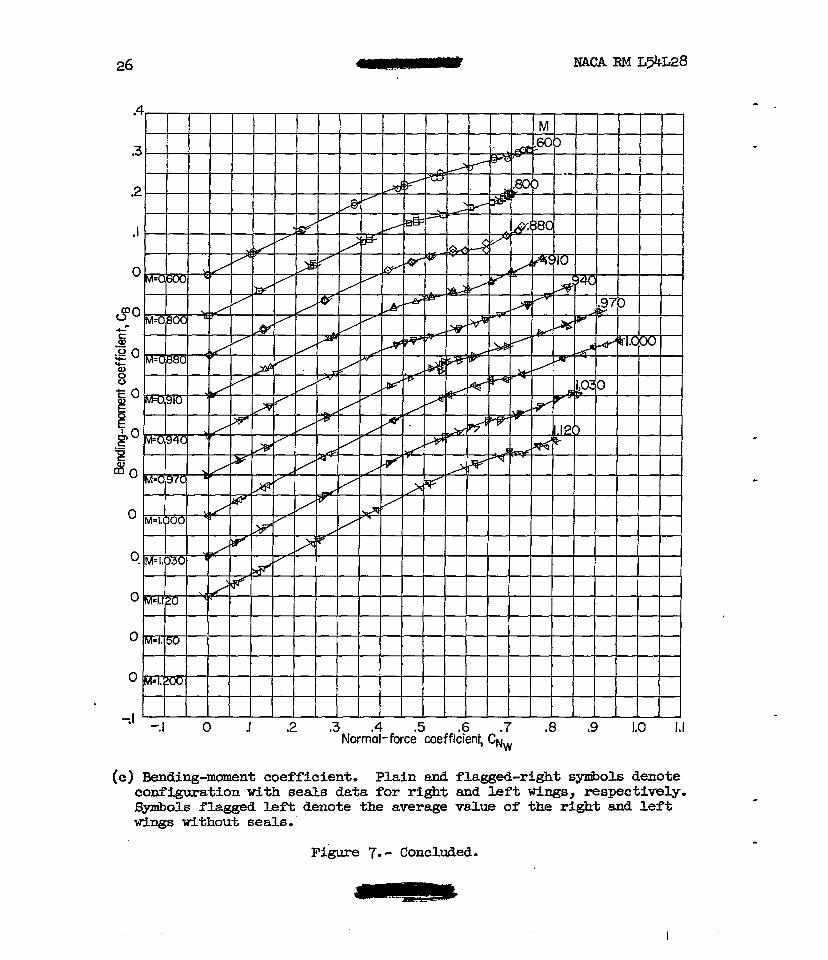
(c) Bending-moment coefficient, Plain and flagged-right synbols denote configuration wlth seals data for right and left wings, respectively. symbols flagged left denote the average value of the right and left wings without seals..
Figure 7.- Concluded.
I
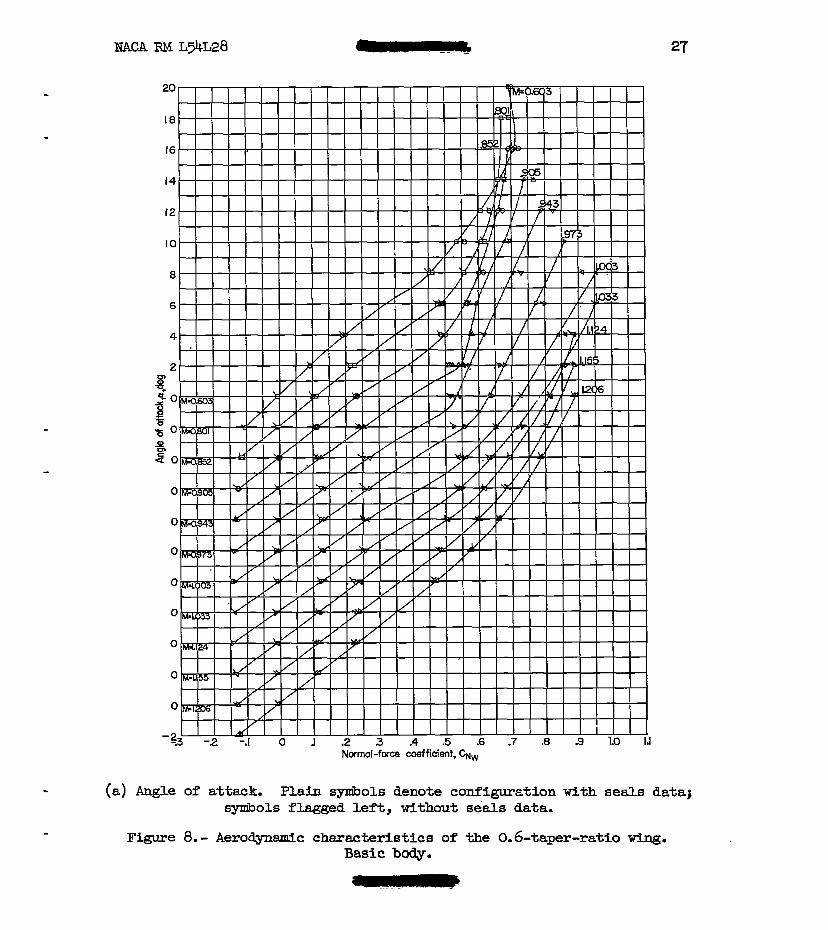
(a) Angle of attack. Plain syzkiols denote configuration with seals data; smols flagged left, without seals data.
Figure 8. - Aerodymmic chazacteristics of the 0.6-taper-ratio wing. Basic body.
." . .
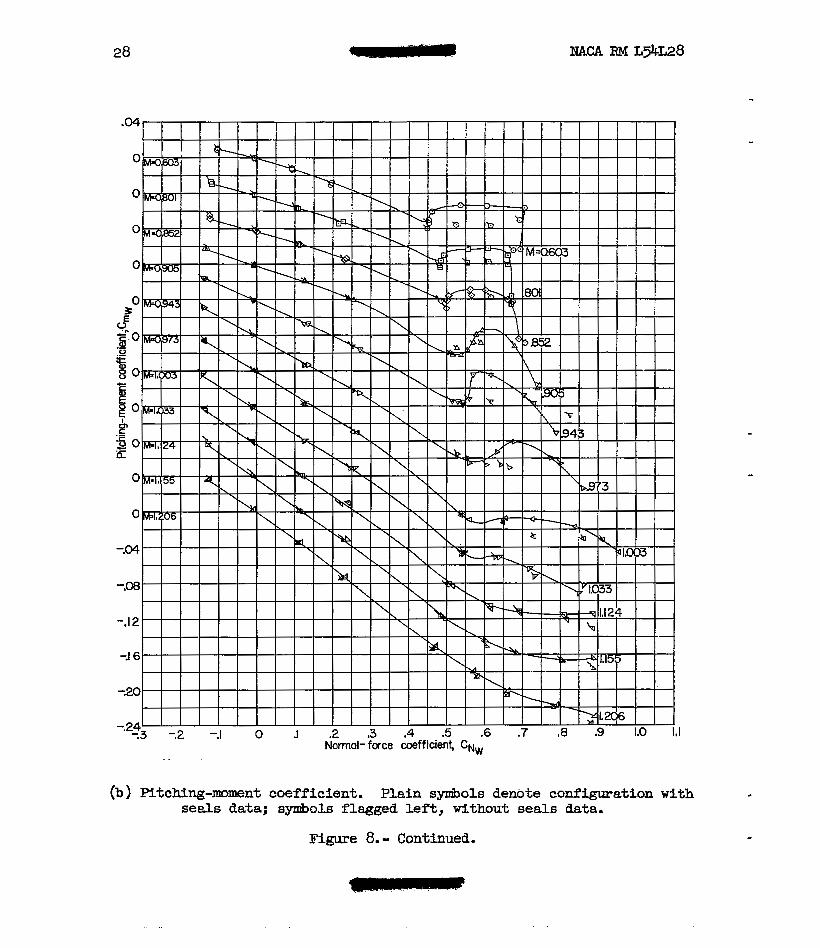
(b) Pitching-mment coefficient. Plain synibols denote configuration with s e d s data; symbols flagged lef t , without seals data.
Figure 8.- Continued.
Normal-force coefficient, Gw
(c) Bending-moment coefficient. Plain and flagged-right synibols denote configuration wfth seals data for right and left wings, respectively. -01s flagged left denote the average value of the right and left wings without seals.
Figure 8.- Concluded.
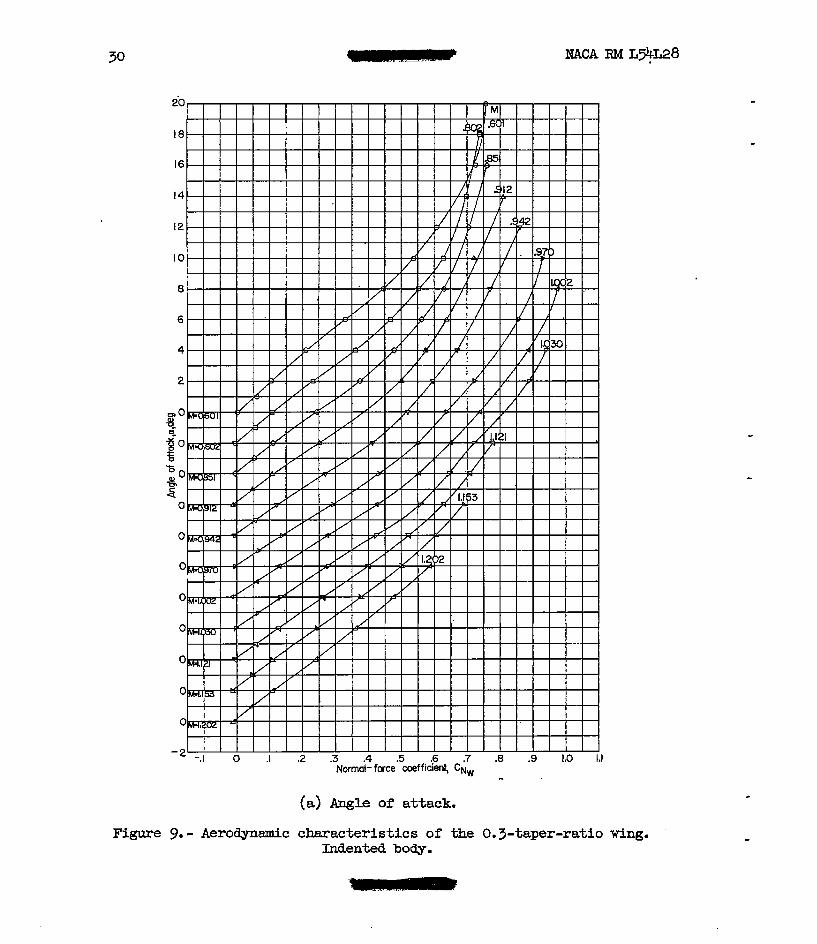
(a) Angle of attack.
Figure 9.- Aerodynamic characteristics of the 0.3-taper-ratio wing. Indented body.
Normal-face coefficient, C N ~
(b 1 Pitching-moment coefficient.
Figure 9.- Continued.
__5
32 .L NACA RM ~54.~28
(c) Bending-moment coefficient. Plain and flagged-right synibols denote data for right and left wings, respectively.
Figure 9.- Concluded.
'R NACA RM ~54128
..
(a) Angle of attack.
Figure 10.- Aerodynamic characteristics of the 0.6-taper-ratio Inaented body.
33
.04
0
0
0
0
0
ao + t p
1" er
Po 5 E
0
-.04
-.m
-.I 2
1 6
720
-.24 1 1 1 1 1 1 1 ' 1 1 ' 1 1 1 ' 1 1 1 1 1 1 1 ' 1 1 ." -
-2 -.I 0 J .2 .3 .4 .5 .6 .7 .8 .9 1.0 1,1 Normal-force coefficient, Ckw
(b) Pitching-moment coefficient.
Figure 10.- Contirmed.
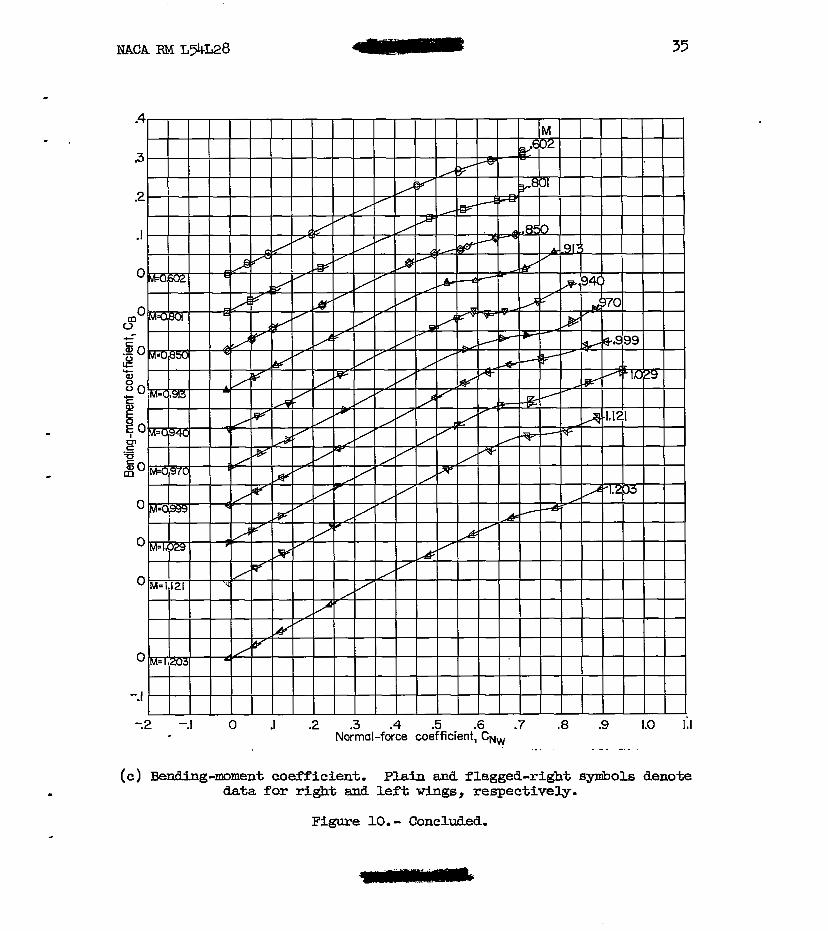
NACA RM ~54L28 - 35
(c) Bending-moment coefficient. Plain and f lagged-right synbols denote data for right and left wings, respectively.
Figure 10,- Concluded.
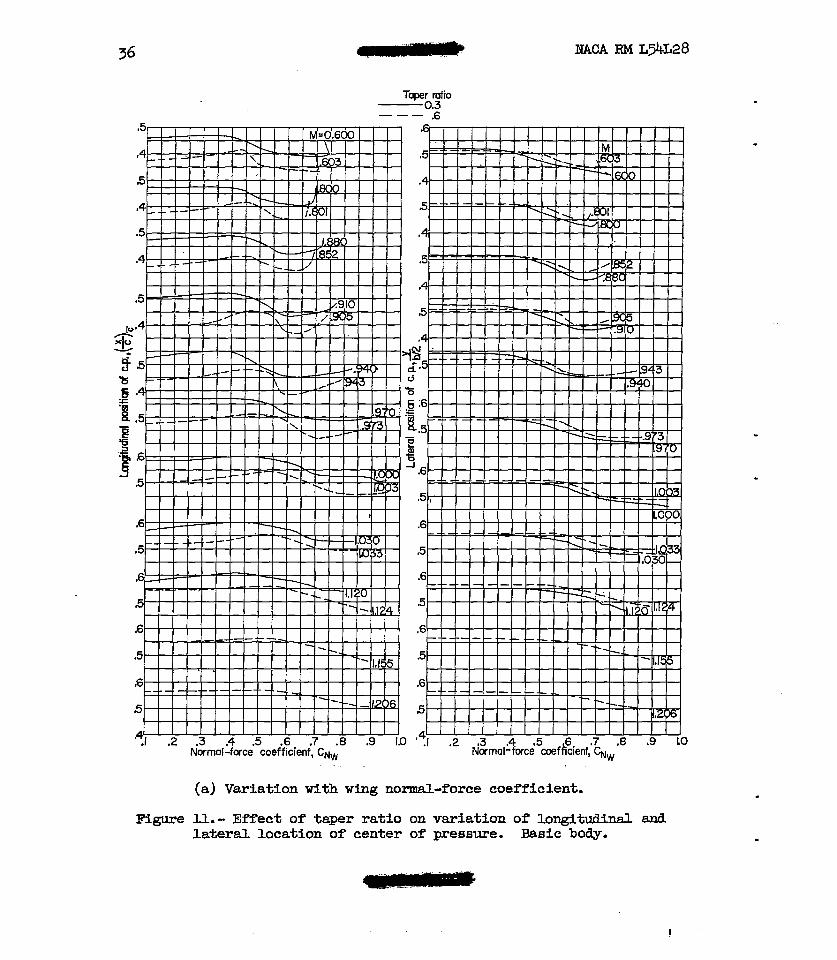
Taper mfio 0.3 .6 ”_
(a) Variation with w i n g normal-force coefficient.
Figure ll.- Effect of taper ratio on variation of longitudinal and lateral location of center of pressure. Basic body.
37
Taper tufa 0.3
Mach number, fvl
(b ) Variation with Mach nunher.
Figure 1l.- Concluded.
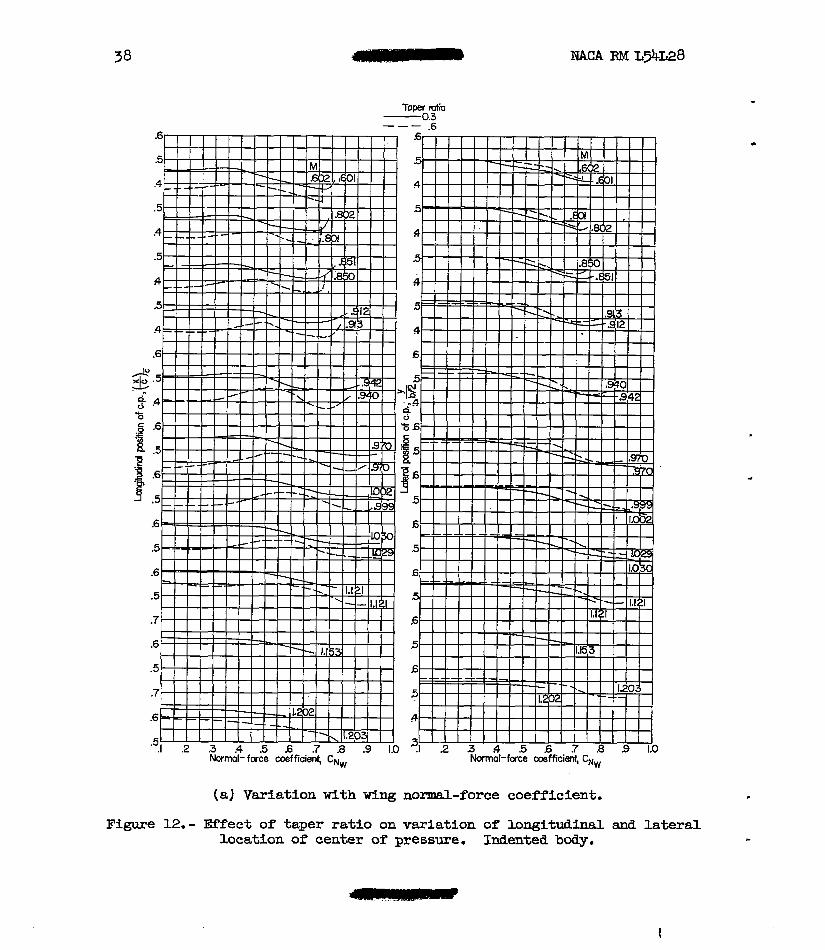
Toper roto 0.3 .6 "-
Normal- fwce coefficienf, CNw h a l - f a c e coafficient, Cprw
( 8 ) Variation with wing normal-force coefficient.
Figure 12.- Effect of taper ratio on variation of longitudinal and latere,l location of center of pressure. Indented body. -
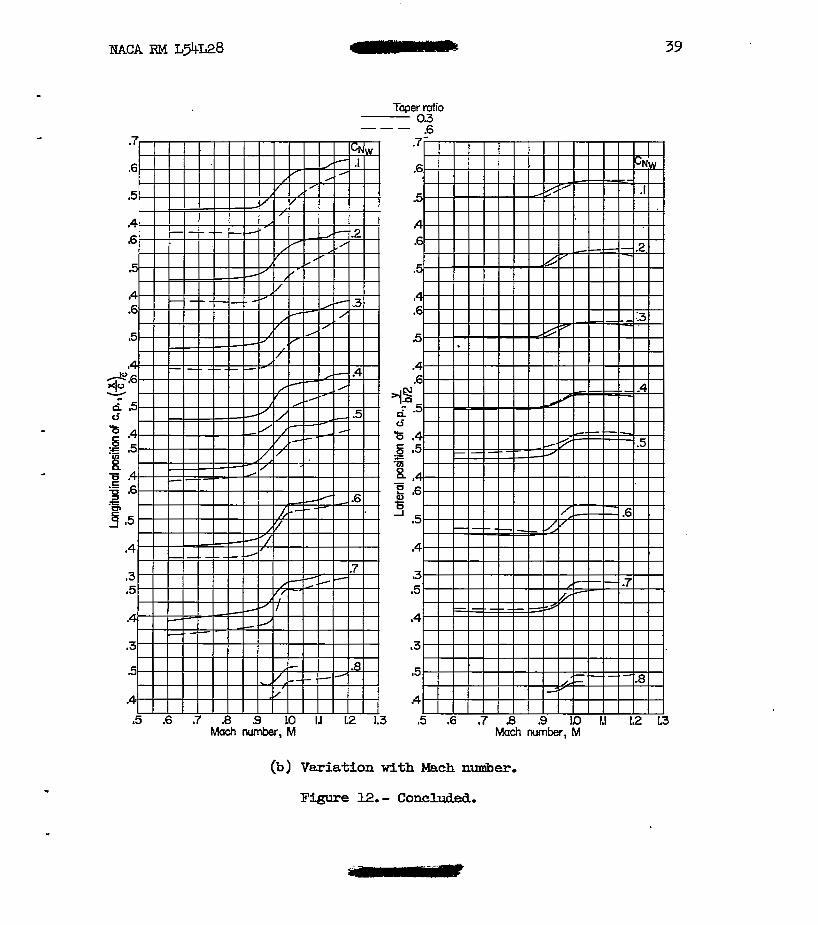
Toper ratio 0.3 .6 "_
.5 .6 .7 .8 .9 LO II 12 1.3 5 .6 .7 8 .9 ID 1.1: 1.2 13 Mach number, M Mach number, M
(b) Variation with Mach number.
Figure 12.- Concluded.
40 - EEACA RM ~ 9 ~ 2 8
. .
(a) Basic body.
Figure 13.- Variation with Maah number and wing normal-force coefficient of the longitudinal and lateral location of the center of pressure for the 0.3-taper-ratio wing.
*
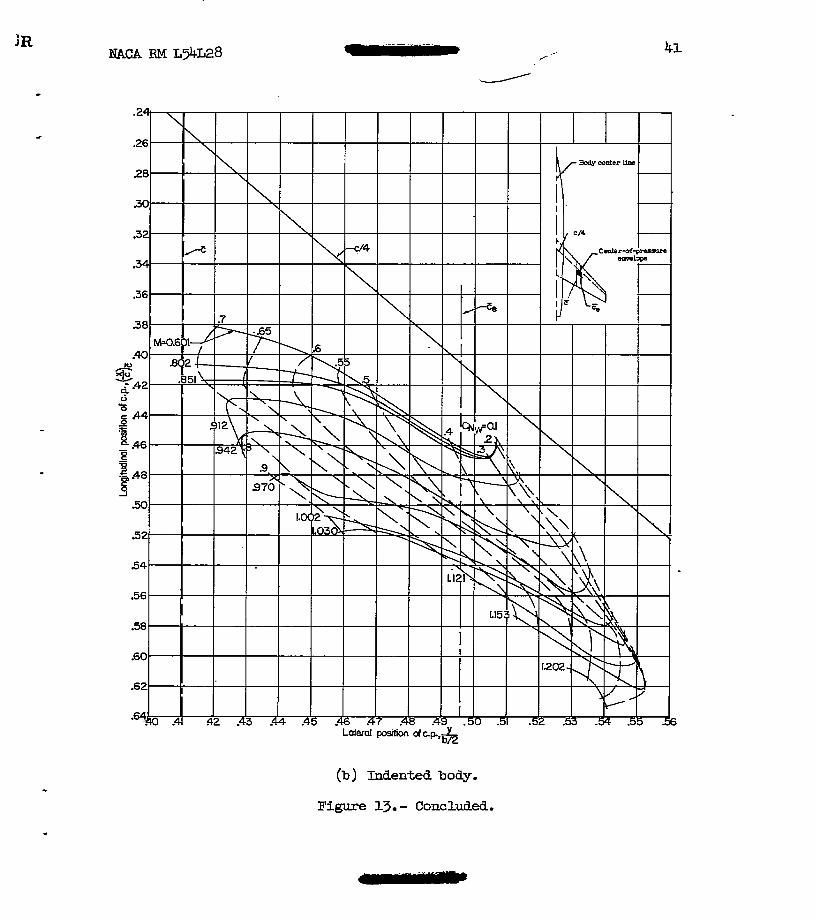
(b) Indented body.
~ ~ g u r e 13.- concluaed.
42
Lateral position of c.p ,
(a) Basic body.
Figure 14.- Variation with Mach nuuiber and wing normal-force coefficient of the Longitudinal and lateral location of the center of pressure for the 0.6-taper-ratio wfng. c
L
. .. . . . . .
Plgure 15.- Mvlsion of nonud-force load betmen the wing and body.
t
.
0 .I 2 3 -4 .5 .6 -7 .8 ” I Normal-force coefficienf Normol-force wfflcient, Cuuug
(a) Taper ratio, 0.3.
Figure 16.- Division of pitckbg-mment load. Plain Synib018 denote wing- body configuration data; flagged synibols denote wing-plus-interference data.
Normal-force coefficient, Cme . . . . . . .
(b) Taper ratio, 0.6.
Figure 16.- Concluded.
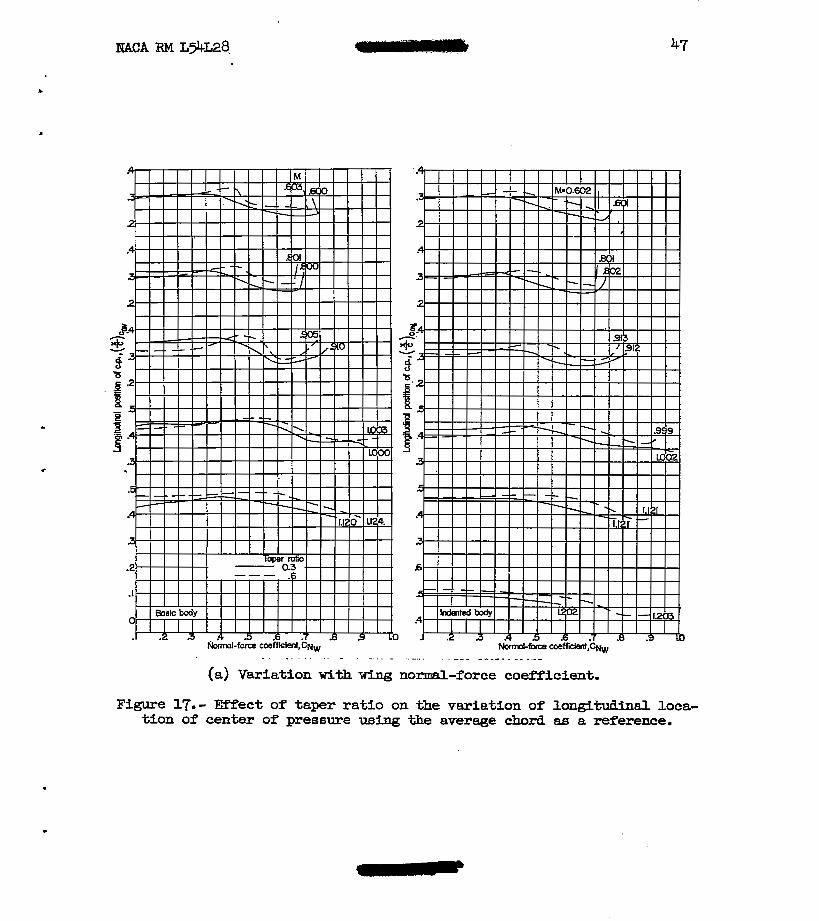
Figure 17.- Effect of taper ratio on the variation of langltudinal loca- tion of center of pressure using the average chord as a reference.
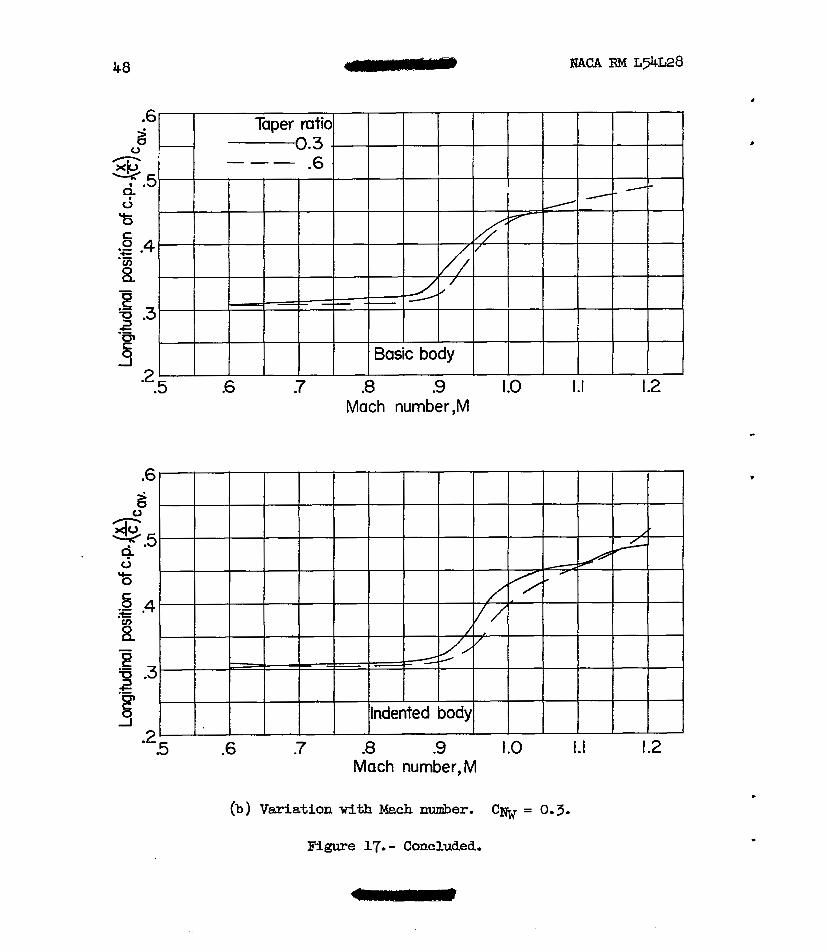
.2 5 .6 7 .8 .9 I .o 1.1 I .2 Mach number, M
(b) Variation with Mach m e r . Cw = 0.3.
Figure 17.- Concluded.
7R NACA RM ~ 3 4 ~ 2 8 49
(a) 0.3-taper-ratio e g .
Figure 18.- Effect of bcdy indentation on the variation of longi tud3nd and lateral location of the center of pressure with wlng norm&l-force coefficient.
c
(b) 0-6-taper-ratio wing. Figure 18.- Concluded.
..
Basic body Indented body -"
.e .5 .6 .7 .8 -9 I .o I . I 1.2
Moch number, M
(a} 0.3-taper-ratio wing.
(b> 0.6-taper-ratio wing,
Figure 19.- Effect of body indentation on the variation of longitudinal .? position of the center of pressure with Mach rimer. C N ~ = 0.3.
. . . . . .
Figure 20.- Comparison of variation of longltudlnd and lateral location of the center of pressure Kith vlng normal-force coefficient for the 0.6-taper-ratio wing in the presence of the basic body and for a 13”
Isr model w i t h two a m e n t bcdy configurations of reference 7.
Y
0 Theoretical (ref.10) Theoretical (ref-9)
0 Themtical (ref. 8) Experimental
I .5 .6 7 .8 .9 I .o 1.1 I .2
Mach runber,”
(b) 0.6-taper-mtio whg.
,
c