Embed Size (px)
Citation preview
SAMPLING FOR OBJECTIVE ESTIMATES OF APPLE YIELDS
VIllGINIA, 1969
Research and Deve1o~nt BranchResearch Division
Statistical Reporting ServiceU.S. Depart1lent of Agriculture
Washington D. C.
February, 1973
i! \
II
iI'
"Ii
i,I
('
SAMPLING101 OBJECTIVEESTIMATESOF APPLEYIELDS
VIRGINIA, 1969
By
Fred B. Warren
R.eMarch and Deve10pllent BranchResearch Division
Statistical R.eporting ServiceU.S. Depart_nt of Agriculture
Washington D. C.
February 1973
CONTENTS
Page
SUMMAR.Y ....•.•.•.•.•.•.•.•.••.•.•.•.•.•.••.•.•.•.•.•.•.•.•.•.••.••.•.••.•••.•.•••••.••.•••.••.•.•.•.•• _ • 1
INTRODUCTION ••.••.•...••.•••.••.•.•.•.••••.•.••.•.•••.•.•.•.•.•.•••.•.•.•.•.•.••.••.•.•.•.•.•••.• 1
SAMPLE SELECTION .•.•.•.••.•.•.•.•••.••.•.•.....•.•.•.••••.•.•.•.•.•.•.•...•.•...•.•.•.•.•...•.•.•.•..•.• 2
DATA COLLECTION .•.•.•...•.••.•.•.....•...••.•..•.•.•.••.•••..•.••••.•.•••..••.•.•.....•.•.....•.•• 4
"Procedures •••••Interpretation.
FieldPhoto
...•.............................................................................. 46
ANALYSIS .•.......•.....•.•...•.•.••.•.•...•...•.......•.••.•.•.•.•.•...•...•.•.....•••.......•.•.•.•.•.•.•.•...•...• 6
Sample Limb Selection ••••••••••••••••••••••••••••••••••••••••• 6Direct Exp8llsion Estimates ........••..•..•..••.........•.•..•. 9Double Sampling CSA's of Terminal Limbs ••••••••••••••••••••• 12Double Sampling Apple Counts From Photographs ••••••••••••••• 15Double Sampling CSA's of Primary Limbs •••••••••••••••••••••• 17Non-geographical Stratification ••••••••••••••••••••••••••••••• 20Proportion of Apples Remaining at Harve.t ••••••••••••••••••••• 23
RECOl-MENDATIONS •..•••••••••••••••••••••••••••••••••.•••••••••••••• 25
27Appendix A.Appendix B.
Survey Foras and Instructions ••••••••••••••••••••Probable Requirements, Costs, and Organization
of Future Surveys ..••••••.••••.•.•••.•••••••••• 38
SUMKAR.Y
A pilot survey in 30 different orchards in the Clarke County-Frederick Countyarea of Virginia was conducted in 1969 to deteraine if selected objective pro-cedures could be used operationally, and, if so, if their use would be econoa-ically practicable. Principal results from this survey were:
1. The correlation between counts of apples from photographs and thees timated nUJlber of apples on the same trees was quite high. How-ever, the cost of obtaining and interpreting the photography wasso high that, under present conditions, there is no economic advan-tage to using photography for this purpose.
2. Sample limbs can be selected from stereo photographs and identifiedin the field froa photographs of the bare trees. Fifty-nine percentof the selected limbs were in the desired size range of 0.8 to 2.5square inches cross sectional area (CSA). About 30 percent of theselected sample It.bs had CSA's larger than 2.5 square inches. About3 percent were larger than 7.5 square inches.
3. The size (CSA) of the primary U.bs can be used advantageously toreduce sampling error or survey costs or both in a double sampling-.odel where the CSA measure_nts are taken of the primary branchesof a "large" sample of trees per orchard and counts of apples onselected limbs are taken fro. a IIslUll" subsaaple of these trees.
This report also includes discU8sions of survey organization, of doublesampling within trees to reduce sampling errors caused by barren liBs orby saaple limbs of grossly unequal sizes, of non-geographic stratificationin reducing sampling errors, and of estiaating the proportion of applescounted in June which remain on the tree until harvest.
IKTRODUCTION
Previous studies in one orchard in Virginia !I resulted in:
1. Development of a prooedure for selecting ssaple lillbs from stereophotographs of the bare trees.
2. Discovery of a significantly high correlation between the nuaber ofapples on a tree and
(a) the nuaber of apples which can be counted froa projectedcolor transparencies of the tree, and
(b) the sua of the cros8-eectional areas (CSA's) of the priaary11•• 0f the tree.
1/ Warren, F. B. and WigtOD, W. H., "Saapling for Objective Yield. of Applesand Peaches, Virg1nia, 1967 and 1968," Statistical Reporting Service,u. S. DepartlleDt of Agriculture.
2
These developaents indicated that it should be possible to:
1. l1ap1ementa single-stage scheae of selecting tendnal limbs in theoffice where, presumably, it would be better controlled.
2. Reduce the sapling variance or cost or both in a double-samplingsense by counting fruit on photographs of a cOllparatively largenumber of trees and .correlating these counts with expanded countsof fruit on s_p1e terminals from a subsaaple of the same trees,or by using the CSA's of primary limbs of a large number of treesin the same .aoner.
The objectives then were to detemne from costs, variance cOllponents andcorrelations to be computed frea a pilot survey in a major apple-producingregion, whether these proce~ures can be used operationally and if they offereconomic advantages over previously adopted procedures.
SAMPLESELECTION
Blocks of apple trees used for this survey were selected from a list of treesreported on a census of growers in Clarke and Frederick Counties, Virginia.Blocks were selected with probabilities proportionate to the number of treesreported. Plantings reported to have been 1Il&dewithin the last five yearswere considered to be not of bearing age and were excluded from the'sample.
The list was arranged by age of planting within varieties. Thirty blockswere drawn systematica1l,. from this array. The distribution of these sampleblocks by age and by variety of tree is given in Table 1.
S8llp1e trees in tbe thirty blocks were selected, marked and photographed inApril 1969, before the trees had started to leaf out.
A letter explaining the purpose and general nature of the project was sentto the owners of the selected blocks by the State statistician's office inB.1cJ.ond, Virginia. A •• ber of the Research and Developaent staff contactedeach owner (or operator) to get pera1ssion to work in the selected planting,and to detera1ne its location. In several cues, the orchard had been leasedand the owner indicated the current operator. The block l,ocations were re-corded both on one-half inch to the aile county road maps and on 7-1/2 ainutegeological survey .ape. Written instructions for getting to the planting anda large scale sketch which shoved the approxiaate size and shape of the s8llp1eblock, the location of 8D1 pollinators in the saple block and the nature ofany adjacent p1antings were al80 prepared. If the selected planting contained.ore than one thousand trees, the planting was divided into sections of frOlRfive hundred to one tbousaDd trees and one of these was randoaly selected forsaapling.
Varieties (such •• Golden Delicious) which are often aaed as pollinators forother varieties presented particular probl_, both because they are usually
3
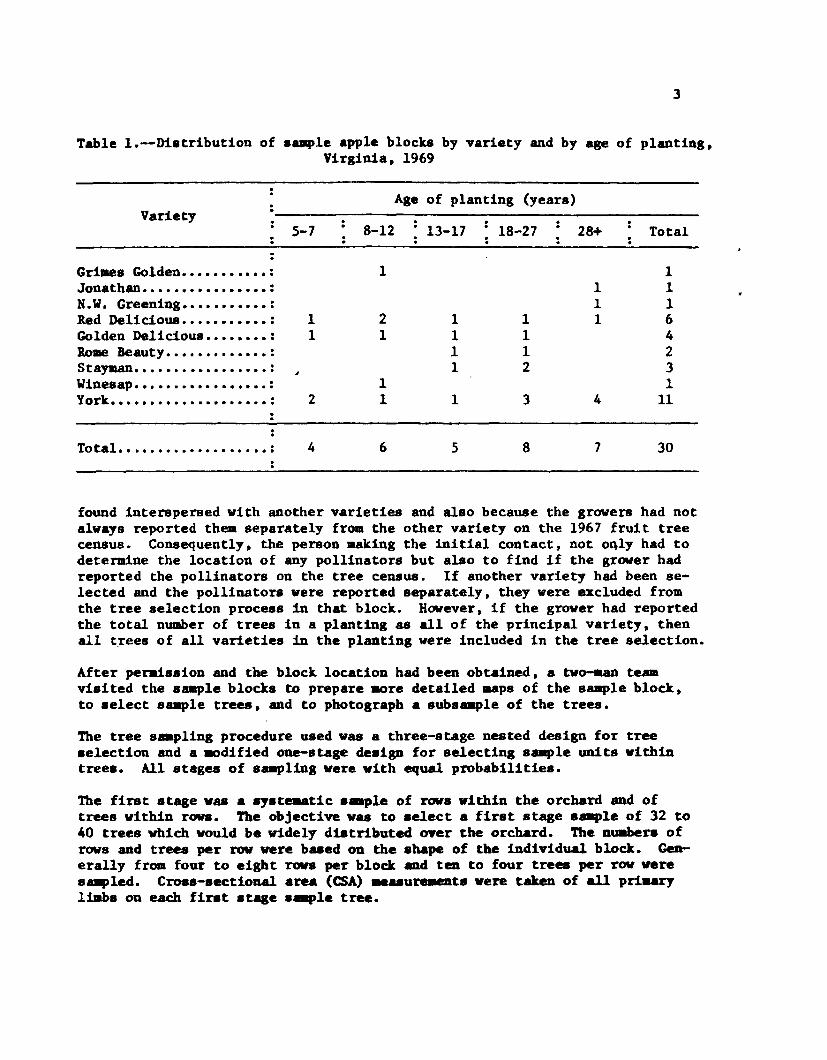
Table l.--Distribution of • .-ple apple blocks by variety and by age of planting,Virginia, 1969
· Age of planting (years )Variety ··· 5-7 8-12 13-17 18-27 28+ Total· .· .
:Griaes Golden ••.•••••••• : 1 1Jonathan ....•..•••....•• : 1 1N.W. Greening••••••••••• : 1 1Red Delicious ................... : 1 2 1 1 1 6Golden Delicious •••••••• : 1 1 1 1 4Roae Beauty ......•..........•...... : 1 1 2Stayaan •.•.•.•.•.•.•.•.•.•.•.•.•.•.•.•.•.: .. 1 2 3Winesap .................................. : 1 1York. •.•.•.•.•.•.•.•.•.•.••.•.•.•.•.•.•.•.•. : 2 1 1 3 4 11
Total ..................................... : 4 6 5 8 7 30
found interspersed with an!other varieties and also because the growers had notalways reported them separately from the other variety on the 1967 fruit treecensus. Consequently, the person aaking the initial contact, not ol\ly had todetermine the location of any pollinators but also to find 1£ t.he grower hadreported the pollinators on the tree census. If another variety had been se-lected and the pollinators were reported separa.tely, they were excluded fromthe tree selection process in that block. However, if the grower had reportedthe total number of trees in a planting as all of the principal variety, thenall t;rees of all varieties in the planting were included in the tree selection.
After peraission and the block location had been obtained, a tvo-aan tes.visited the s8Bple blocks to prepare ~re detailed aaps of the s.-ple block,to select smaple trees, and to photosraph a subssaple of the trees.
The tree s.-pling procedure used was a three-stage nested design for treeselection and a ~dified one-stase deaign for select ins s.-ple units withintreea. All stagea of smapling vere with equal probabilities.
The first stage va a ayat8118t.ic a•• 18 of rows within the orchard and oftrees within rowa. The objective V88 to select a first stage a..,le of 32 to40 trees which vould be widely diatributed oyer the orchard. The nuabera ofrows and trees per row were b•• ed on the shape of the individual block. Gen-erally from four to eight rOWllper bloc:k and tell to four trees per row weres.-pled. Cross-sectional area (CSA)•••• UrelleBt. were taken of all priaaryliabs on each fint stage • .-ple tree.
4
The second stage sample was a systematic subsample of nine trees from tllt'
list of 32 to 40 first stage sample trees. This subsample was taken aflprthe trees on the list had been arrayed by the relative size of the sum ,'fthe primary CSA's. The ranking by size of CSA ensured that a wide range nftree sizes was selected, so it would be possible to determine if size oftree was important in the estimation procedure. A third stage sample ofthree tr~es was selected systematically from the second stage sample.
The trees in the third stage sample were photographed from opposite sideswith a stereo camera and Kodachrome II film. The "sides" which were photo-graphed were those which gave the best views of the branches of the tree.
The stereo slides and black and white negative prints about 30 inches squaremade from the slides were used in the office to divide the tree into sampleunits. Sample units were defined as terminal limbs having CSA's of about1.0 to 2.5 square inches and associated non-terminal limb sections. A non-terminal (or path) limb section was defined as being a section of limbsabove one fork which were too thick to be classified as a terminal and whichdivided into at least two terminals and/or other path sections at the nexthighest fork. Each path section was uniquely assigned to the first terminallimb above it. The terminal limbs were numbered consecutively from onethrough t as they were identified. If two or more terminals emerged at thesame location, path section(s) was assigned to the first terminal to benumhered.
Two clusters of three consecutively numbered sample units were selectedsystematically from the circular array of sample units. With the circulararray, the sample unit having the largest number would be considered con-secutively lower than sample unit number 1. For example, if a tree had atotal of 26 sample units, there would be 26 possible clusters, including(25, 26, 1) and (26, I, 2).
DATA COLLECTION
Field Procedures
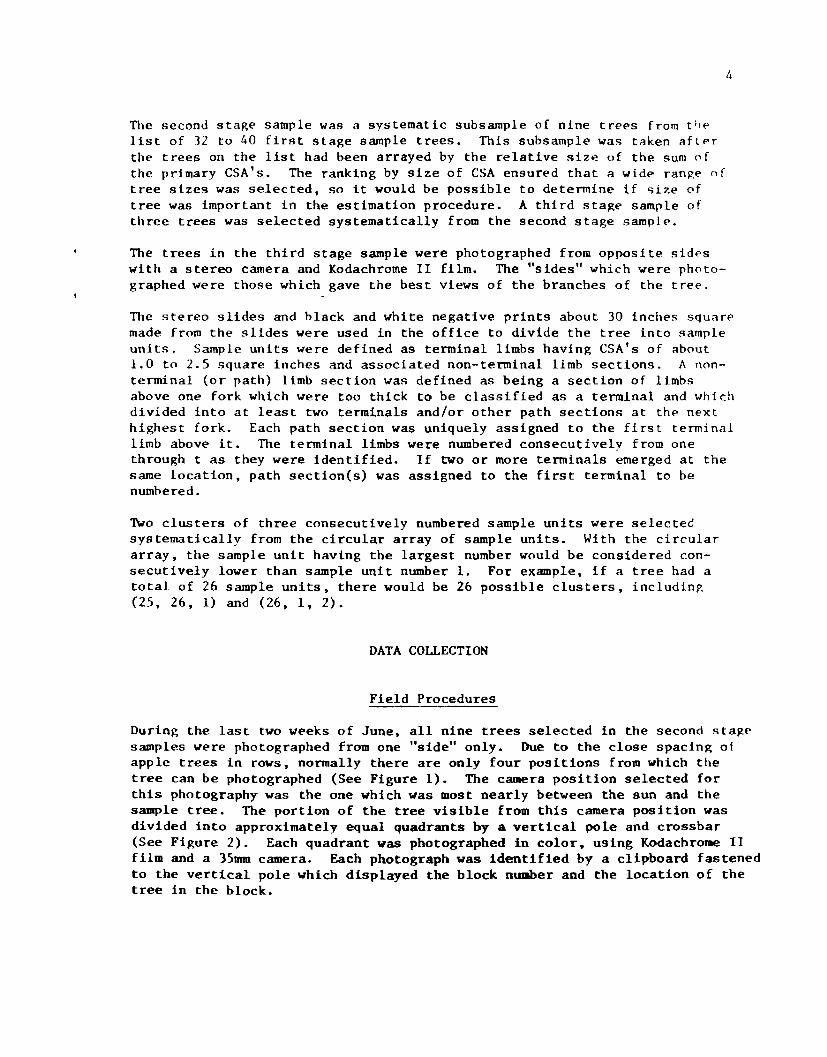
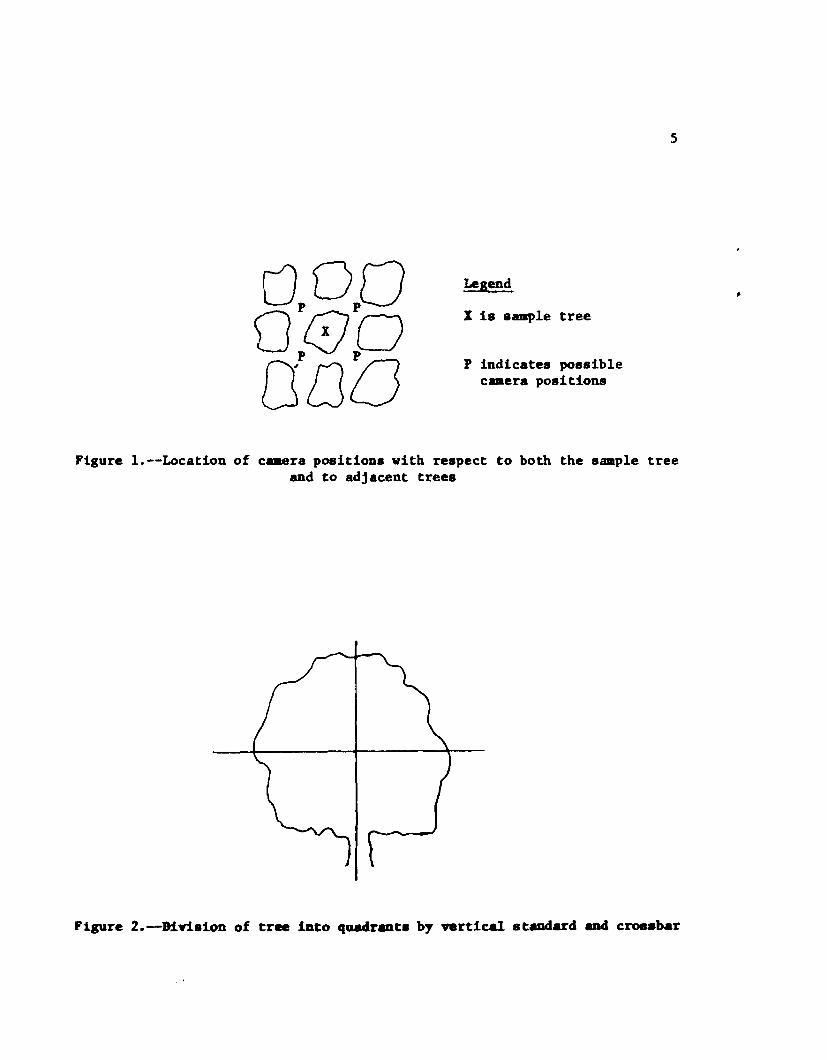
During the last two veeks of June, all nine trees selected in the second sta~~samples were photographed from one "side" only. Due to the close spacin~ ofapple trees in rows, normally there are only four positions from which thetree can be photographed (See Figure 1). The camera position selected forthis photography was the one which was most nearly between the sun and thesample tree. The portion of the tree visible from this camera position wasdivided into approximately equal quadrants by a vertical pole and crossbar(See Fi~ure 2). Each quadrant was photographed in color, using Kodachrome IIfilm and a 35mm camera. Each photograph was identified by a clipboard fastenedto the vertical pole which displayed the block number and the location of thetree in the block.
UpOpOOp0po000
Legend
X is sample tree
P indicates possiblecaaera positions
5
Figure 1.--Location of caaera positions with respect to both the sample treeand to adjacent trees
Figure 2.-D1:rision of tree into quadrants by •• rtical stadard and crossbar
6
The same day that the trees were photographed, the sample units selected fromeach third stage subs ample tree were examined to see if they had any apples.This information was used to estimate the proportion (p) of sample units onthe tree which had apples. CSA measurements were also taken of the terminallimbs included in these clusters. All a.pples on the "consecutively" lowestnumbered sample unit in each cluster were counted if that limb had any apples.{If the cluster included sample units 25, 26, and 1, sample unit 25 would becounted). If the consecutively lowest numbered sample unit had no apples,either on the terminal or on any assigned path sections, apples were countedon the next lowest consecutively numbered sample unit in the cluster whichhad any apples. If none of the three sample units in a cluster had any apples,the count for the cluster would be zero.
Additional apple counts were taken in September on two trees in each of theten Red Delicious or Golden Delicious saaple blocks. This was a recount ofthe two clusters observed in June plus observations on enough additionalclusters to bring the portion of the tree sampled up to about one-seventh toreduce the sampling error for the tree.
Photo Interpretation
Sets of photographs were assigned in a random sequence to one of four inter-preters. Each set was composed of photographs of diagonally opposite (upperleft and lower right, or lower left and upper right) quadrants on one sideof a tree. To estimate the degree of variability between interpreters, a por-tion of the photographs were recounted by another interpreter. The'assignmentof photographs for recounting followed a randomized incomplete block design.
The Kodachrome transparencies were projected to approximately a 27 inch by36 inch image on a viewing screen. This screen had been divided into a gridof 3 inch squares.
The counts from each slide were recorded on individual recording forms withthe tree identification data, starting and ending photo count times and thedate of the count. The count recording section of the form was laid out inthe same grid type pattem as the viewing screen. 'nle interpreter first re-corded the position of the vertical and horizontal poles (as seen on theviewing screen) on the record sheet. He then made a cell by cell record ofthe apples observed in the assigned quadrant. Any apples which appeared inmore than one cell were counted only in the lover or in the right hand cell.
AHALYSIS
Saaple Limb Selection
The first step in the analysis waa to determine if s.-ple limbs selected fromstereo photographs of the bare trees were of the desired size (0.8 to 2.5square inches, CSA). A total of 540 tenainal lhabs (6 limbs per tree) were
7
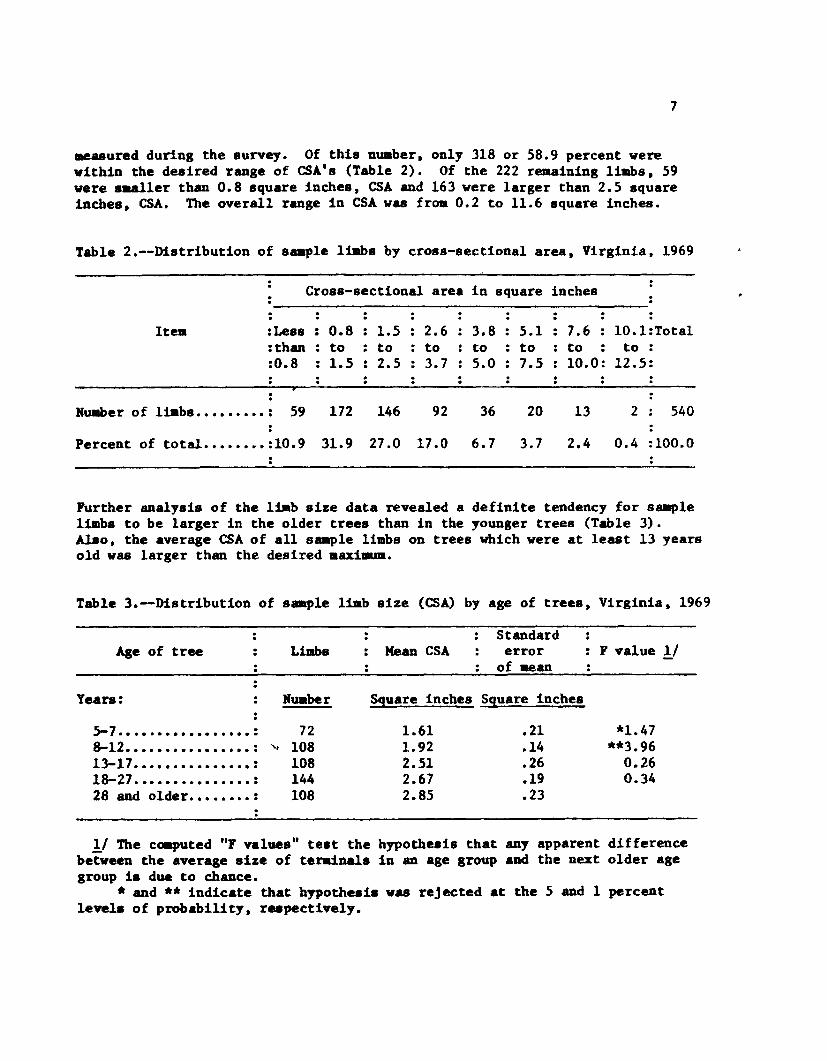
aeasured during the IUrvey. Of this nuaber, only 318 or 58.9 percent werewithin the desired range of CSA's (Table 2). Of the 222 remaining 1i.os, 59were ••• l1er than 0.8 square inches, CSA and 163 were larger than 2.5 squareinches, CSA. The overall range in CSA was froa 0.2 to 11.6 square inches.
Table 2.--D1stribution of saap1e 1t.bs by cross-sectional area, Virginia, 1969
. Cross-sectional area in square inches.lte. :Less 0.8 1.5 2.6 3.8 5.1 7.6 . 10.1:Tota1.
:than . to to to to to to to :.:0.8 1.5 2.5 3.7 5.0 7.5 10.0: 12.5:
I
NUliber of liabs "•••••••• : 59 172 146 92 36 20 13 2 540
Percent of total •••••••• :10.9 31.9 27.0 17.0 6.7 3.7 2.4 0.4 :100.0
Further analysis of the 1i1ab size data revealed a definite tendency for saap1elimbs to be larger in the older trees than in the younger trees (Table 3).Also, the average CSA of all ssaple limbs on trees which were at least 13 yearsold was larger than the desired aaximua.
Table 3.--Distribution of saaple 1iab size (CSA) by age of trees, Virginia, 1969
StandardAge of tree Limbs Mean CSA error . F value !/.
of aean
Years: Nuabe r Square incbes Square inches
5-7 ••••••••••••••••• : 728-12 •••••••••••••••• : ~ 10813-17 ••••••••••••••• : 10818-27 ••••••••••••••• : 14428 and older •••••••• : 108
1.611.922.512.672.85
.21
.14
.26
.19
.23
*1. 47**3.96
0.260.34
!I The coaputed II, va1ues" test the hypothesis that any apparent differencebetween the average size of terainals in an age group aad the next older agegroup is due to chance •
• and .* indicate that hypothesis vas rejected at the 5 and 1 percentlevels of probability, respectively.
8
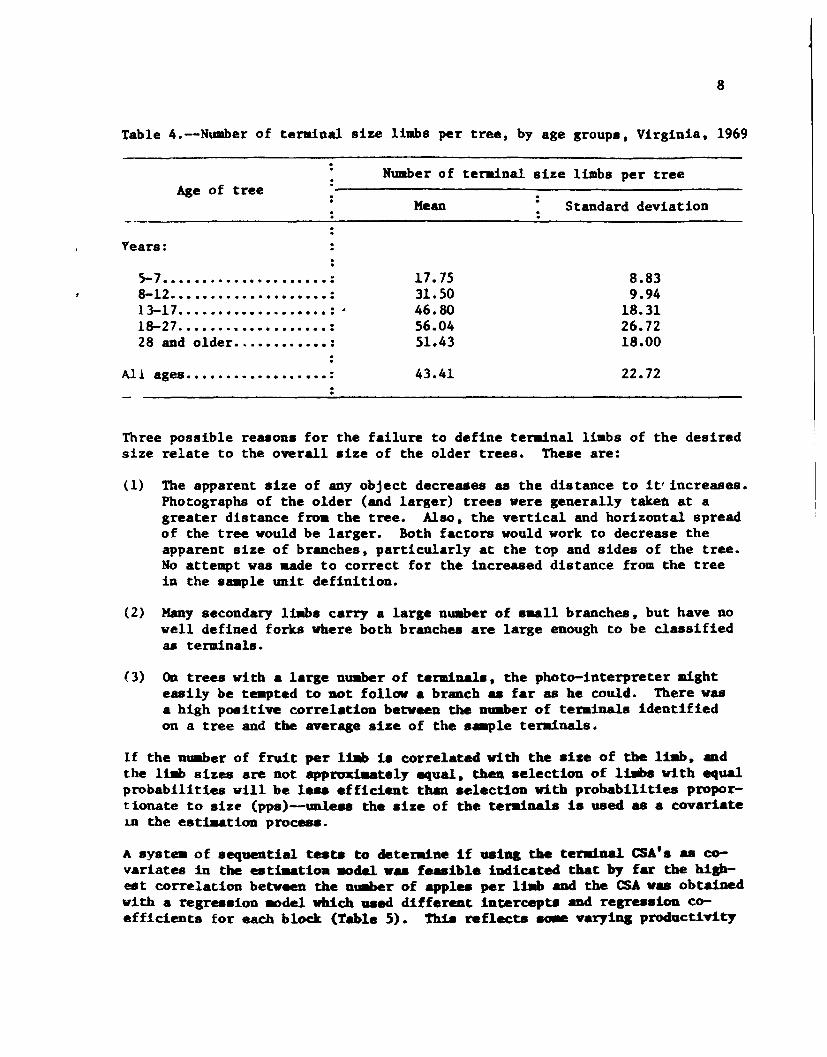
Table 4.--Number of terainal size limbs per tree, by age groups, Virginia, 1969
Numberof terainal size limbs per tree..
Ageof tree
Years:
5-7 .••••••.•.•.••.•.•••••.•.••.•• :8-12•..•...•.•....•..••••.•••.••• :1.3-17 ••••••••••••••••••• : ~18-27 ••••.•••.•••••.•.•••.••.• :28 and older._ •••••••••• :
All ages •••••••••••••••••• :
Mean
17.7531.5046. 8056.0451.43
43.41
.. Standard deviation
8.839.94
18.3126.7218.00
22. 72
Three possible reasODsfor the failure to define terainal li.bs of the desiredsize relate to the overall .ize of the older trees. These are:
(1) The apparent size of any object decreases as the distance to itl increases.Photographs of the older (and larger) trees were generally takea at agreater distance fro. the tree. Also, the vertical and horizontal spreadof the tree would be larger. Both factors wouldwork to decrease theapparent size of branches, particularly at the top and sides of the tree.No attempt was aade to correct for the increased distance from the treein the s-.ple unit definition.
(2) Manysecondary lillbs carry a large nUllberof ••• 11 branches. but have nowell defined forks where both branches are large enough to be classifiedas teminals.
(3) OIl trees with a large nuaber of tendnals, the photo-interpreter aighteasily be teapted to not follow a branch as far as he could. There wasa high positive correlation between the nuaber of teminals identifiedODa tree and the average .ize of the •.-ple terainals.
If the nuaber of fruit per liJlb is correlated with the .ize of the liab. 8D.dthe liab sizes are not appron.ately equal. then selection of 11.__ with equalprobabilities will be 1_ efficient than .election with probabilities propor-tionate to size (pps)-unleaa the size of the teraina1s i_ used as a covariate1.D the e_tiaation proc•••.
A systell of sequential tests to deteDline if 1I8i81the terainal CSA's as co-variates in the estiaatiOB aode1 ••• feasible indicated that by far the high-est correlation between the nu.ber of apples per li_ and the CSA.as obtainedwith a regression aodel wbJ.chused different intercepts ancl regression co-efficients for each block (Table 5). Thi. reflects SOlIe'Varyina productirlty
9
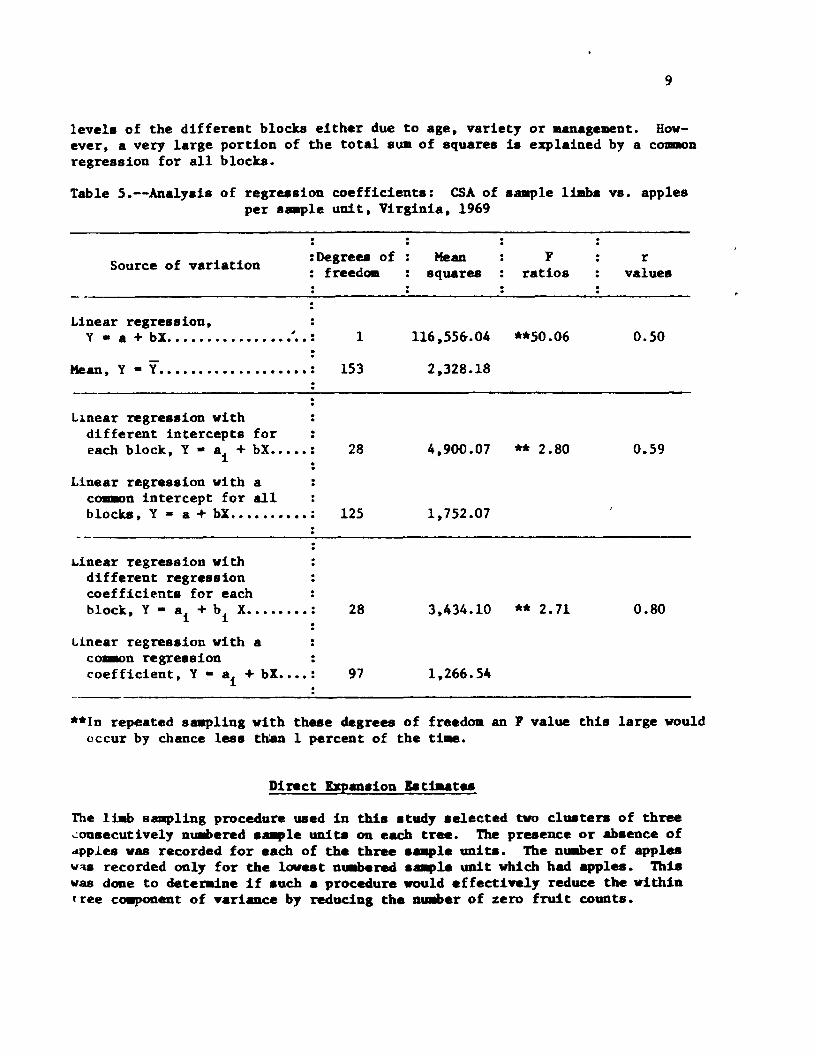
levels of the different blocks either due to age, variety or management. How-ever, a very large portion of the total sua of squares i. explained by a commonregression for all blocks.
Table 5.--Analysis of regression coefficienta: CSAof smap1e limbs vs. applesper saaple unit, Virginia, 1969
Source of variation :Degrees 0 ffreedOil
Meansquare.
Fratios
rvalues
Linear regression,Y • a + bX •••••••••••••••• ~.:
tte.an" Y - y ........•..•...•••• :
L~near regression withdifferent intercepts foreach block, Y - ai + bX••••• ~
Linear regression with ac~n intercept for allblocks, Y - a + bX•••••••••• :
1
153
28
125
116,55&.04
2,328.18
4,900.07
1,752.07
**50.06
** 2.80
0.50
0.59
Linear regression withdifferent regressioncoefficients for eachblock, Y - ai + bi x..•..... ~
Linear regression with ac~n regressioncoefficient, Y - a1 + bX•••• ~
28
97
3,434.10 ** 2.71
1,266.54
0.80
**In repeated s88Pling with these degrees of freedom an F value this large wouldoccur by chance less tb:an 1 percent of the U•••
Direct Expansion lat~t ••
The 1i11bsaap1ing procedure used in this study .elected two clusters of three..:.onsecutive1y n\mlbered s•• le unite on each tree. The presence or ab.ence ofdpples was recorded for each of the three •••• le unita. The nuaber of appleswu recorded only for the lowest n.-bered .-.pla unit which had apples. Thiswas done to deteraine if .uch a proceclure would effectively reduce the within(tee c~OI1ent of variance by reclucina the nUliber of zero fruit counts.
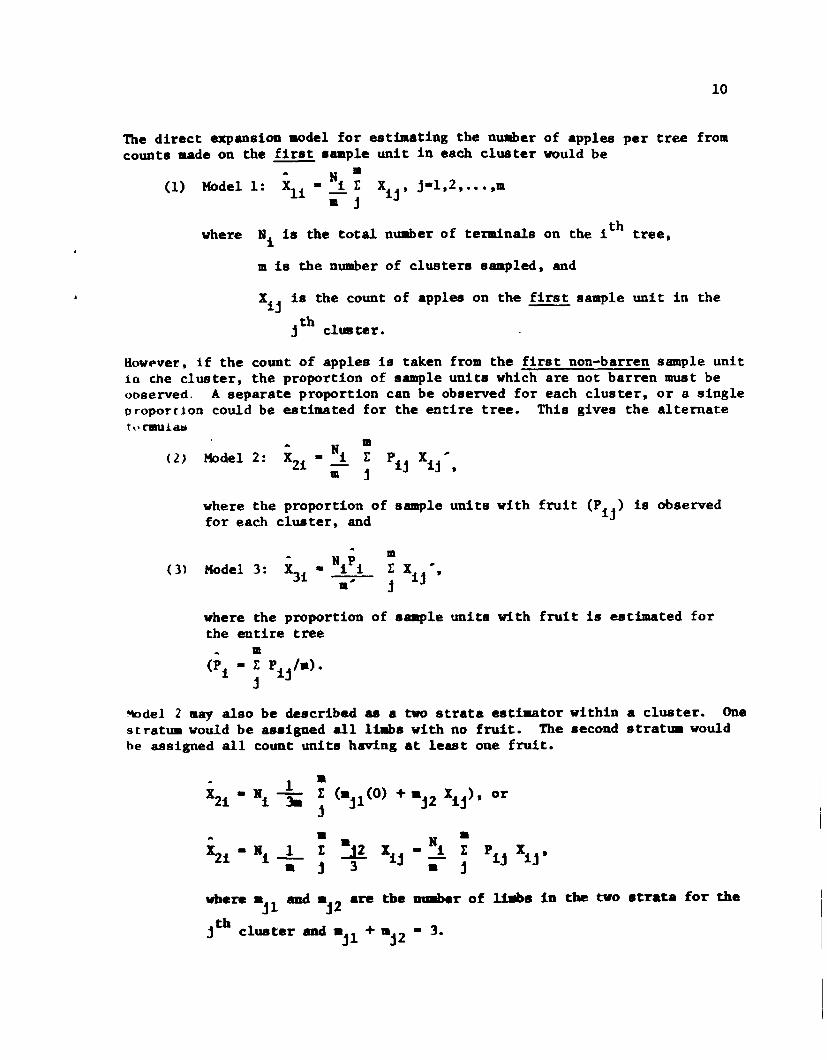
10
'nle direct expan.sion .odel for estimating the nuaber of apples per tree frollcounts sade on the first s••ple unit in each cluster would be
N 11(1) Modell: Xli - -! t Xij, j-I,2, ••• ,11
11 j
where thNi is the total nu.ber of terminals on the i tree,
• is the number of clusters ssapled, and
Xij is the count of apples on the first sample unit in thejth cluster.
Rowpver, 1f the count of apples is taken from the first non-barren sample unit10 che cluster, the proportion of sample units which are not barren must beobserved. A separate proportion can be observed for each cluster, or a singleproportion could be estimated for the entire tree. This gives the alternatet" raUl.a»
(2) Model 2:
where the proportion of sample units with fruit (Pij) is observedfor each clus ter. and
(31 Hodel 3: X3i - NiP i11'"
where the proportion of sample units with fruit is estimated forthe entire tree
Model 2 may also be described as a two strata estimator within a cluster. Oneat rat\Dlwould be ••signed all liES with no fruit. The second stratma wouldbe assigned all count units having at least one fruit.
1 -X2i -lit - I (ajl(O) + aj2 Xij), ori 311j
a lita
~i -lit 1 I -j2 Iij - -! t Pij Xij,i- a j 3 - j
vbere aj1 and aj2 are the lhIIIberof liIIba in the two atrata for thetbj cluster and aj1 + -j2 - 3.
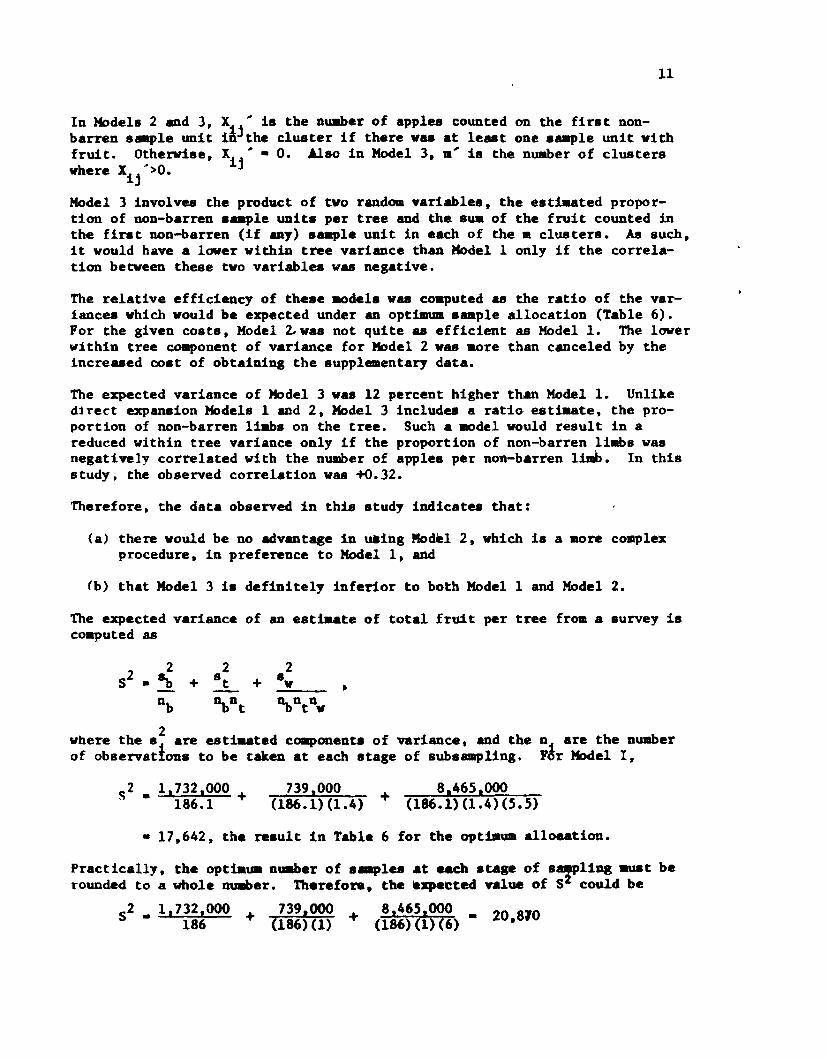
x .. is the nUllber of apples counted on the first non-i6j the cluster if there wa at least one 8..,le unit withXij" • O• .u80 in Hodel 3, •.. is the nuaber of clusters
11
In Hodels 2 and 3,barren s&Bple unitfruit. Otherwise,where Xij">O.
Hodel 3 involves the product of tvo randOlllvariables, the estillated propor-tion of non-barren a.-ple unit. per tree and the sua of the fruit counted inthe firSt non-barren (if any) 8..,le unit in each of the _ clusters. As such,it would have a lover within tree variance than Modell only if the correla-tion between these tvo variable. was negative.
The relative efficiency of these ~dels was co~uted &8 the ratio of the var-iances which would be expected under an opt~um s•• ple allocation (Table 6).For the given c08ts, Hodel :L V88 not quite 88 efficient as ModelL 'l1le lowerwithin tree co~onent of variance for Model 2 vas aore than canceled by theincreased cost of obtaining the supplementary data.
The expected variance of Hodel 3 vas 12 percent higher tbatt Model 1. Unliked:t rect expansion Models 1 and 2, Model 3 includes a ratio estiaate,. the pro-portion of non-barren liabs on the tree. Such a model vould result in areduced within tree variance only if the proportion of non-barren li.bs wasnegatively correlated vith the number of apple. per non-barren limb. In thisstudy. the observed correlation vas +0.32.
Therefore. the data observed in this study indicates that:
(a) there would be no advantage 111 ua1h.gModel 2. wbich is a lIOre complexprocedure, in preference to Modell, and
(b) that Model 3 ia definitely inferior to both Model 1 and Hodel 2.
The expected variance of an estaate of total fruit per tree froa a aurvey iscOllputed as
where the s~ are estiaated coaponenta of variance, and the Of are the numberof obsenatrona to be taken at each stage of aubsampliog. F6r Hodel 1,
r2 1,732,000 +. • 186.1
739,000(186.1)(1.4) + 8~465,OOO
(186.1)(1.4)(5.5)• 17,642, the result in Table 6 for the optillum allceation.
Practically, the opt1aua nuaber of aaplea at .-ch stage of _:!pIing auat berounded to a whole nu.ber. Therefore, the expeeted value of S coul.d be
S2 • 1,732,000 + 739,000 + 8,465,000 20 810186 (186)(1) (186)(1)(6)· ,
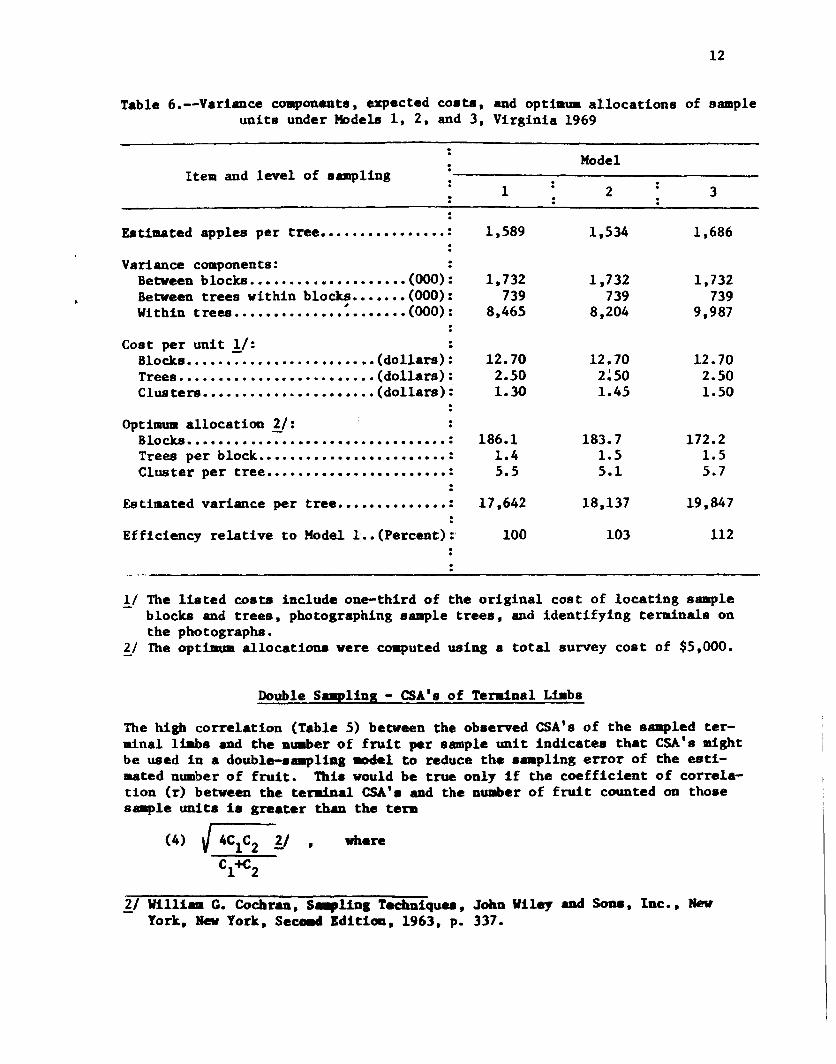
12
Table 6.--Variance coaponents. expected coata. and optiaua allocations of sampleunits under Models 1. 2. and 3. Virginia 1969
Item and level of s8llpling······ 1
Model
2 3
Estimated apples per tree •••••••••••••••• :
Variance components:Between blocks •••••••••••••••••••• (OOO):Between trees within blocks ••••••• (OOO):Within trees •.•.••••••.••• ~•••••.• (OOO):
Cost per unit 1/: :Blocks :-..........•...... (dollars) :Trees ....•••....•••.••..••••.. (dollars):C1usters •••••••••••••••••••••• (dollars):
··Opti.u. allocation ~:Blocks ............•.•.•.•. of •••••••••••• :
Trees per block •••••••.•••••••••••••••• :'Cluster per tree :
··Estimated variance per tree •••••••••••••• :··Efficiency relative to Model!.. (Percent):
1,589
1,732739
8,465
12.702.501.30
186.11.45.5
17,642
100
1,534
1,732739
8,204
12.702~501.45
183.71.55.1
18,137
103
1.686
1.732739
9,987
12.702.501.50
172.21.55.7
19,847
112
!I The listed coats include one-third of the original cost of locating s..pleblocks and trees. photographing sample trees, and identifying terminals onthe photographs.
?:../ The optiaua allocationa were coaputed using a total survey cost of $5,000.
Double S..,linl - CSA' a of Teratnal Lillbs
The high correlation (Table 5) between the observed CSA's of the sampled ter-aina1 liaba and the nuaber of fruit per sample unit indicates that CSA's Ddghtbe used in a double-a..,linB .odel to reduce the a•• pling error of the esti-aated number of fruit. naia would be true only if the coefficient of correla-tion (r) between the terainal CSA' a and the nuaber of fruit counted on thoaes88p1e unita i. greater than the ter.
(4) .J 4ClC2 1:..1, where
C1+C2
1:../ Villi_ G. Cochran, 5..,11nl Techniques, John Viley aDd Sons, Inc., HewYork, Hew York, Se~ Iditioa, 1963, p. 337.
13
Cl
is the average cost of counting fruit on a saaple unit, and
C2 18 the average cost of obtaining a CSAaeaaurement on a terainalliu.
WhenCSA_uurementa are obtained fro. three tenlina18 per cluster, C is $1.28and C
2is $0.15, so that the coefficient of correlation aust be greate~ than .61
if double 8•• pling for CSA's is to be effective.
Thh condition is aet only for the case where a different slope and a differentintercept is computed for each block (rable S). Since different intercepts arerequired, all of the intercepts cannot be zero. Therefore, the double samplingratio model would be biased ,nd we considered the regression aodel
•.(5) Model 4: X4ij - 0i (Xij + b (li - Yij», vbere
n1 and Xij are as defined for Modell,
Yi
is the average CSAof all terainal limbs in all sample clusterson the tree,
Yij is the CSAof the terainal li.ab in the first saaplinlg unit of thethj cluster, and
b 1. the coefficient of regression co.puted from the fruit counts(Xij) and the correspond inS te~nal CSA(Yij) aeasurements io
each block.
A second double sa:aplinS -.;)del comparable to Hodel 2 (2), would be.•. ,.
(6) ModelS: X5ij - niPi (Xij' + b'Cfi - Yij'), where
,.the ni, Pi' Xij', and Yi have been defined previously. Yij' is the
CSAof the terainal in the first aaple unit in
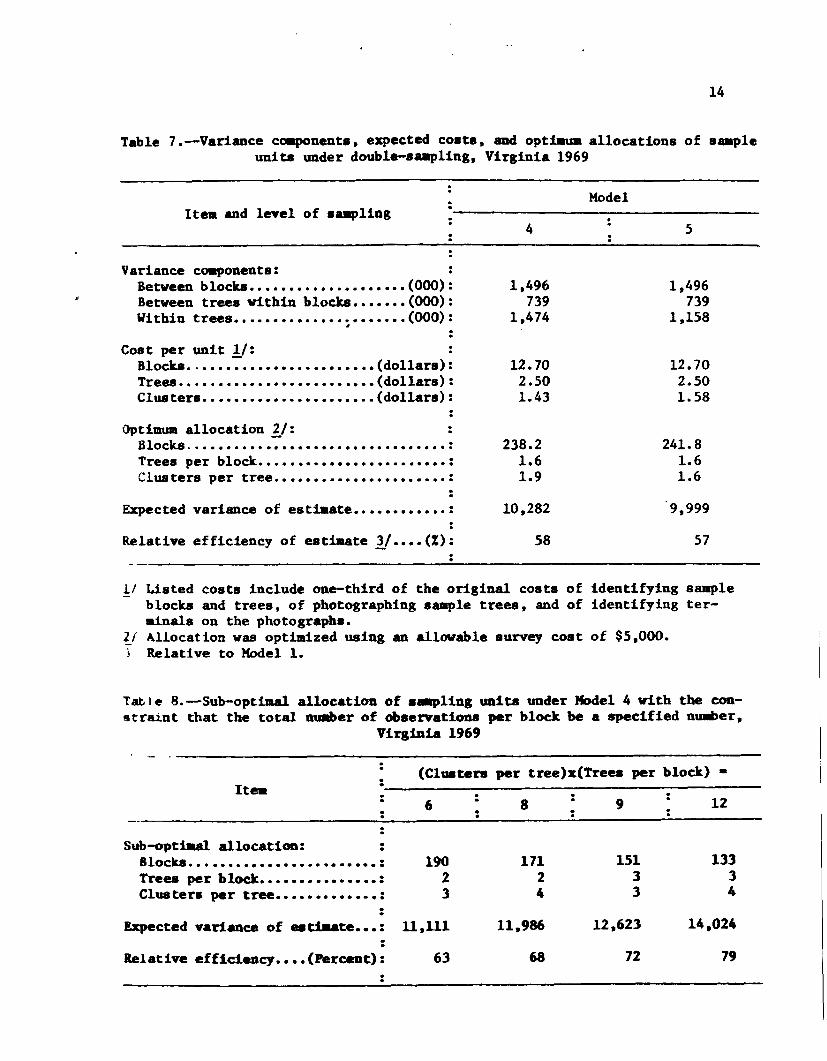
Variance coaponents, costa, and opttaua allocations of ••• pling units for these~ouble-sampling .odels gi.en in Table 7 indicate that Hodel I would be only 58percent •• efficient as Hodel 4 and 59 percent •• efficient as ModelS.
However, the opti .••• allocation would ruult in observing only 3 or 4 ssapleunits (clusters) in each block. Since a regression coefficient (b) ••.• t be('OIlputed for each block, a larger n1Dlberof obs.rvationa in each block •• y bedesirable. This would result in eo.e reduction in the efficiency of the double-saapling models. However, for .ode rate incre •••• in the nUllber of observationsper block, the double-aaaplina IIOdels would still be .ore efficient th.u Mociel1 (Table 8).
14
Table 7.-Variance c~nent8, expected costa, and optillua allocations of s_pleunita under double-saapling, Virginia 1969
Ite1l and level of sallpliog ··4
Model.. 5
Variance c~ooents:Between blocka •••••••••••••••••••• (OOO):Between trees within blocks ••••••• (OOO):Within trees •••••••••••••••••••••• (OOO):~
Cost per unit 1/: :Blocka •.••••7 (dol1ar.):Treea ••.•••••••••••••••••••••• (dollars):Clusters •••••••••••••••••••••• (dollars):
Optimumallocation 1/: :Blocks ..••••••••••••••••••••••••••••••• :Trees per block •••••••••••••••••••••••• :Clusters per tree •••••••••••••••••••••• :
··Expected variance of estiaate •••••••••••• :
Relative efficiency of estimate 3/ •••• (%):
1,496739
1,474
12.702.501.43
238.21.61.9
10,282
58
1,496739
1,158
12.702.501.58
241.81.61.6
9,999
57
11 Listed costs include one-third of the original costs of identifying sampleblocks and trees, of photographing saaple trees, and of identifying ter-ainals on the photographs.
21 Allocation was optimized using an allowable survey cost of $5,000.Relati ve to Model 1.
TabIeo 8.-Sub-optiJul allocation of s.-pling units under Model 4 with the con-straint that the total DUllberof observatiODa per block be a specified nUllber,
Virginia 1969
·· (Cl_ten per tree)x(Trees per block) -·Ite. ·· : · ·· 6 8 · 9 · 12: . · ·. · ···Sub-optiaal allocation: :
Blocks •••••••••••••••••••••••• : 190 171 151 133Trees per block ••••••••••••••• : 2 2 3 3Clusters per tree ••••••••••••• : .3 4 3 4
··Expected variance of _ u..te ••• : 11,111 11,986 12,623 14,024
··Relative efflc1.ncy •••• (Percent): 63 68 72 79:
15
Double s..pling - Apple Counta Pro. Photographs
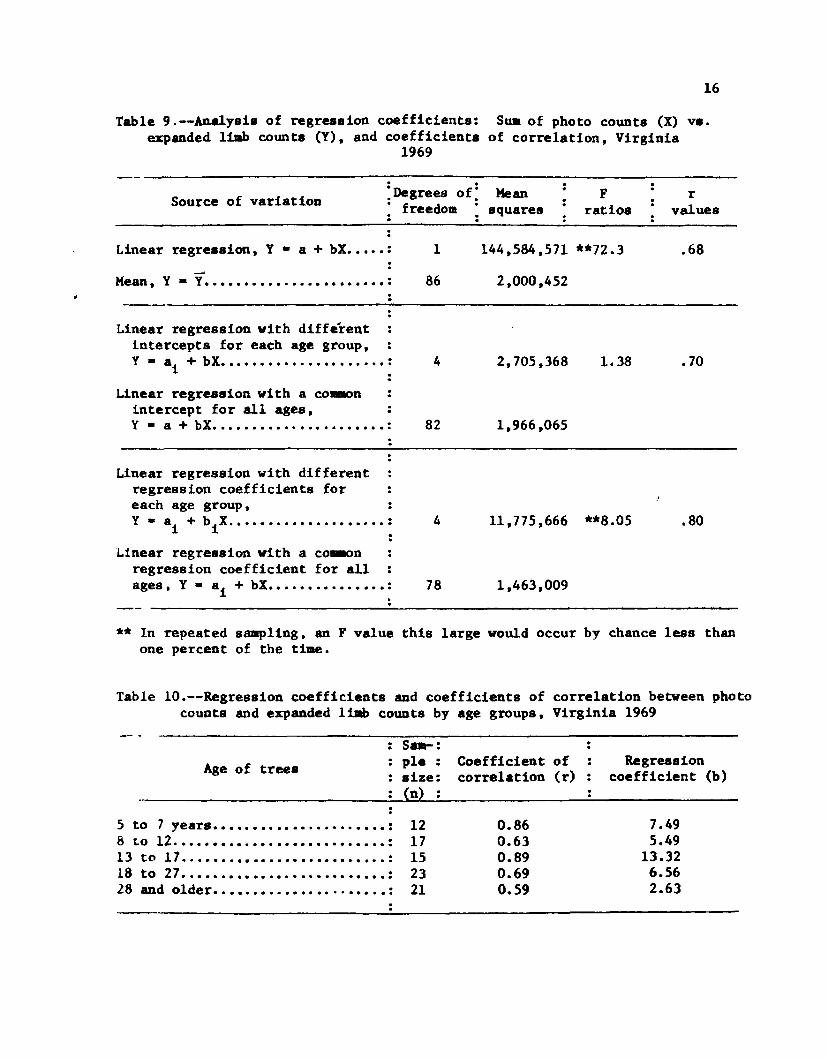
The coefficient of correlatioD (r) between the nu.ber of apples counted froacolor transparencies of diagonally opposite quadrants of one side of a treewith the expanded Ii_ counts (%5) frota the aame trees waa 0.68 when a 8ingleregression coefficient was used for all treles in all blocks (Table 9). A8equential analysis by age groups shoved that using different intercepts foreach age group did not iJaprove the correlation III&terially, but that using adifferent regression coefficient for each age group did increase the correla-tion 8ignificantly, to 0.80. The individual regreaaion coefficients variedfro. a llaXia•.••of 13.32 and to a low of 2.63 (Table 10). The difference inregre8sion coefficients aay be partially related to the relative density ofthe foliage for trees at different ages.
Even though the correlationa between photo count. and the expanded U.b countsare significantly different fro. zero, there ia still the question "Howlargeaust the coefficient of correlation be to offset the increased cost of obtain-ing the additional inforaation?" This quantity is computed as
r >
where Cl 18 the cost per tree of the photo counts, and
C2 is the cost per tree of the expanded 11mbcounta.
AsaUllingthat the expanded 1111b counts are est1aated using two clusters pertree, C would be $5.35. If photo counts were of two diagonally oppoaedquadranls on one side of the tree, CI, the coat of the photography and of theinterpretation would be $3.53. Theae values indicate that the coefficient ofcorrelation would need to be larger than 0.98 for a double saapling lDOdelusingphoto counta to be juat1fied.
It might be possible to sub.tantially reduce the cost of the photo counts in.OIM! way. If so, what is the aui ••.•• value that Cl can take? This can becoaputed by expanding and revritinl the above foJ:1lU1aas a quadratic in Cl
2 2 2Cl + (2-4/r ) C2Cl + C2 - 0Substituting for C2 and r, ve haft
2Cl -22.7375 Cl + 28.6225 • 0Solving the quadratic, C - $1.34. '!'his is 2 ceata less than the eatiaated costof aelectinl aaple t;.;l, taldDg pbotoarapbs and processing the fil. of $1.36.'Dlis indicates that the •• e of photOirapba in eatiJlatiBg apples will be iaprac-ticable under the stated coat cond1t1ona.
16
Table 9.--Analysi8 of regression coefficients: Sua of photo counts (X) v••expanded limb counts (Y), and coefficients of correlation, Virginia
1969
Source of variation :Degrees of:• freedom
Meansquares ..
Fratios
rvalues
Linear regression, Y • a + bX ••••• :
Mean, Y - Y ••••••••.••••.•••••••••• :··
1
86
144,584,571 **72.3
2,000,452
.68
Linear regression with differentintercepts for each age group,Y • a1 + bX •••••••••••••••••.•.• ~
Linear regression with a co-.on :intercept for all ages,Y - a + bX •..•..........•.....••....•..•..•..•.. :
4
82
2,705,368
1,966,065
1. 38 .70
Linear regression with differentregression coefficients foreach age group,Y • a1 + biX •••••••••••••••••••• :
Linear regression with a co.-onregression coefficient for allages, Y • ai + bX ••••••••••••••• :.
4
78
11,775,666 **8.05
1,463,009
.80
** In repeated sampling, an F value this large would occur by chance less thanone percent of the time.
Table 10.--Regression coefficients and coefficients of correlation between photocounts and expanded liJlb counts by age groups, Virginia 1969
Age of treesSua- :pIe :size:(n)
Coefficient ofcorrelation (r)
Regressioncoefficient (b)
5 to 7 years ........................................... : 12 0.86 7.498 LO 12 ...............•.................................. : 17 0.63 5.4913 to 17.....•.•......•.......•.•.: 15 0.89 13.3218 to 27 .................................................... : 23 0.69 6.5628 and older ...................................•....: 21 0.59 2.63
17
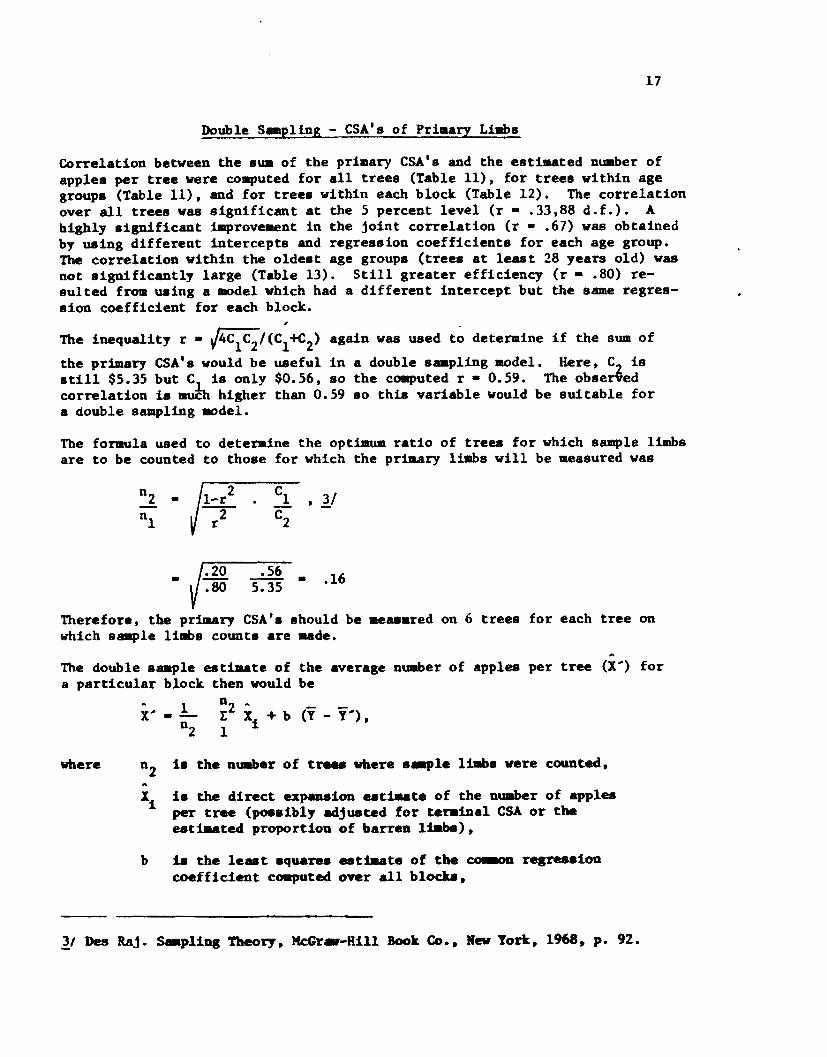
Double Sapling - CSA IS of Priaary Lillbs
Correlation between the sua of the primary CSA IS and the estiaated number ofapples per tree were coaputed for all trees (Table 11), for trees within agegroups (Table 11), and for trees within each block (Table 12). The correlationover all trees was significant at the 5 percent level (r - .33,88 d.f.). Ahighly significant t.proveaent in the joint correlation (r - .67) was obtainedby using different intercepts and regression coefficients for each age group.The correlation within the oldest age groups (trees at least 28 years old) wasnot significantly large (Table 13). Still greater efficiency (r • .80) re-sulted from using a 1IlOdelwhich had a different intercept but the same regres-sion coefficient for each block.
,The inequality r • 14Cl C21 (Cl+(;2) again was used to determine if the BU1Ilofthe primary CSA Is would be useful in a double saapling aodel. Here, C2 isstill $5.35 but C is only $0.5'6, so the cOilputed r - 0.59. The observedcorrelation is au!h higher than 0.59 so this variable would be suitable fora double sampling -.odel.
The formula used to determine the optiau.1llratio of trees for which sample limbsare to be counted to those for which the primary limbs will be measured was
•
• ~ • .165.35
Therefore, the primary CSAI•• hould be ••••• red on 6 trees for each tree on
which sample lillhs counts are aade.~
The double s.-ple estimate of the average nu.ber of apples per tree (X#) fora particular block then would be
1 n2 .•X# • - I Xi + b (Y - y#),
n2 1
where n2 i. the nUliber of treu where •..,le liJlb. were counted,
is the direct expansion eatiaate of the nU8ber of applesper tree (possibly adjusted for terainal CSA or theeatiaated proportion of barren lillbe),
b is the least squares eat1aate of tbe c~ regressioncoefficient co.puted over all blocks,
1/ Des Raj. Saapling Theory, KcGr_-Hill Book Co .•, Mev York, 1968, p. 92.
18
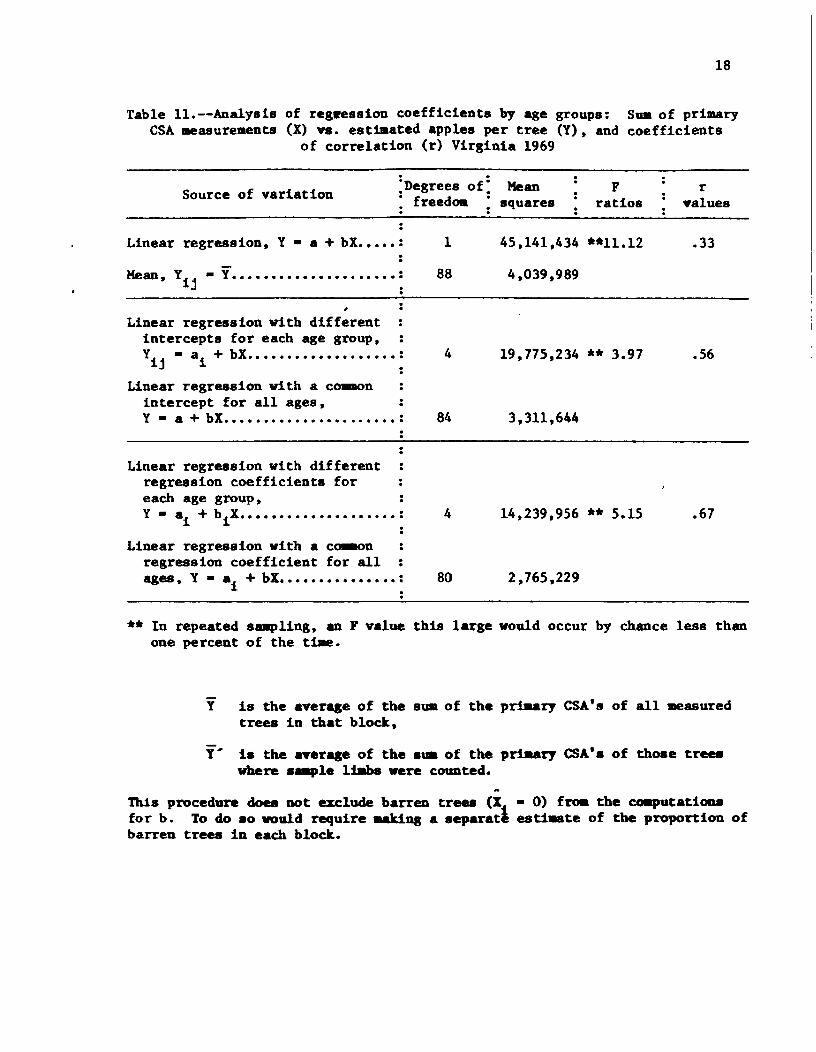
Table 11.--Analyais of regwesaion coefficients by age groups: Sua of primaryCSA measurements (X) vs. estiaated apples per tree (Y), and coefficients
of correlation (r) Virginia 1969
Source of variation :Degrees of: Mean• freedoa • squares
Fratios
rvalues
Linear regression, Y • a + bX ••••• ::
Mean, Yij • Y ••••••••••••••••••••• ~
Linear regression with differentintercepta for each age group,Yij • ai + bX ••••••••••••••••••• ~
Linear regression with a co.monintercept for all ages,Y - a + bX ••••••••••••••••.•••••:
Linear regression with differentregression coefficients foreach age group,Y· ai +biX •••••••••••••••••••• :.
Linear regression with a co.monregression coefficient for allages, Y - ai + bX ••••••••••••••• ~
1
88
4
84
4
80
45,141,434 **11.12
4,039,989
19,775,234 ** 3.97
3,311,644
14,239,956 ** 5.15
2,765,229
.33
.56
.67
** In repeated s8llp11ng, an F value this large would occur by chance less thanone percent of the time.
Y is the average of tbe SUla of tbe prt.ary CSA'. of all measuredtrees in tbat block,
Y'" i8 tbe averqe of tbe .ua of the priaary CSA' 8 of those treesvbere 8••• 1e U.•b8 were counted.
Th1s procedure does DOt exclude barren trees (X • 0) frOll tbe caaputationsfor b. To do so would require aaJdng a separatl esti_te of the proportion ofbarren trees in each block.
19
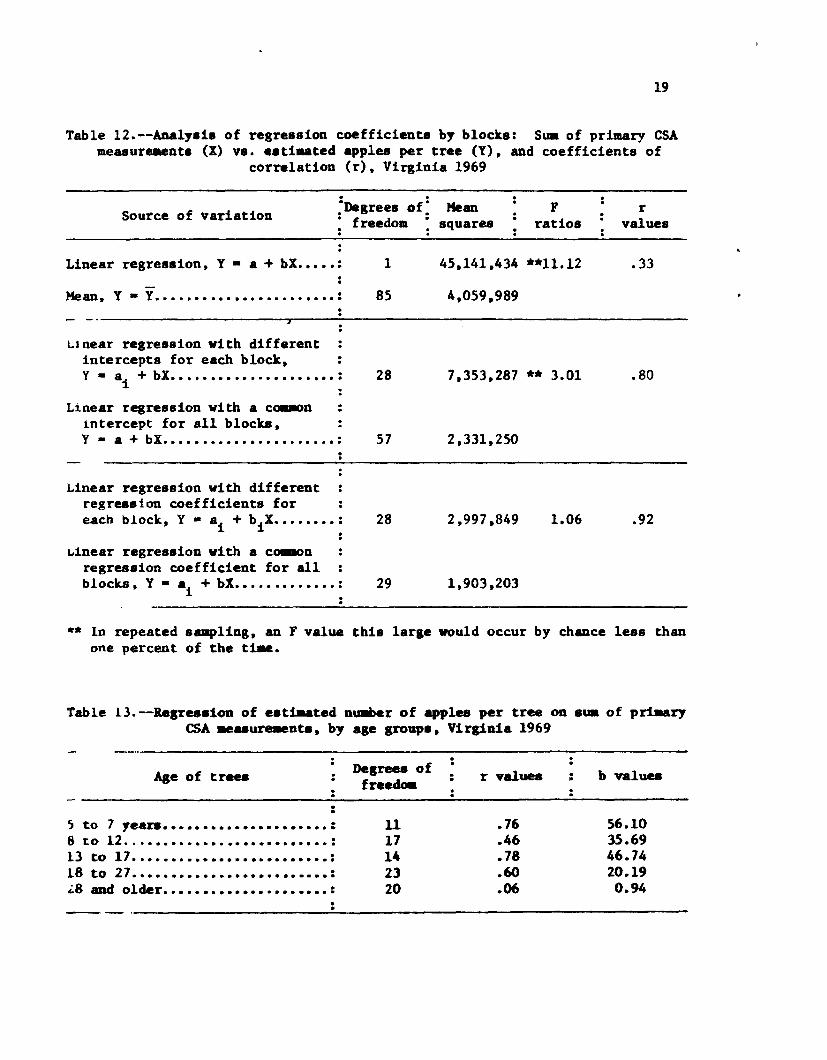
Table 12.--ADaly.b of regression eoefficients by bloeks: Sua of primary CSAmeasur.-ent. (X) v•••• tiaated apples per tree (Y), and eoeffieients of
correlation (r), Virginia 1969
Source of variation :Degrees of: Hean• freedom • squares
Fratios
rvalues
Linear regression, Y • a + bX ••••• :
Hean., Y - y •••••••.••.•..•.•.•.•.....••.•.•.•• :
1
85
45,141,434 **11.12
4,059,989
.33
------------,.-------------------------L1near regression with different
intercepts for each b1oek,Y • ai + bX •••••••••••••••••• • • • ~
Linear regression with a c~nlntercept for all blocks,Y • a + bX •.•.••.•••••••.••.••.•••••••. :..
28
57
7,353,287 ** 3.01
2,331,250
.80
Linear regression with differentregression coeffieients foreacb block, Y • ai + biX •••••••• :
:Linear regression with a co.mon
regression coefficient for allblocks. Y • ai + bX ••••••••••••• ~
28
29
2,997,849
1,903,203
1.06 .92
1Ir* In repeated sampling, an F value this large would occur by chance less thanone percent of the ti•••
Table lJ.--llelr••• ioll of e.tiaated nUliber of apples per tree on sua of priJlaryCSA •••• urellent., by a•• group., Virginia 1969
Age of trees ···.Delreea of
fr •• deJa
..r values .,. b values
~ to 7 ,e.£8 •••••••••••••••••••••: 11 .76 56.108 to 12. ".•..........................••..............: 17 .416 35.6913 to 17•••••••••••••••••••••••••: 14 .78 46.7418 to 27 ••••••••••••••••••••••••• : 23 .60 20.19,8 and older ••••••••••••••••••••• : 20 .06 0.94
:-'-'
20
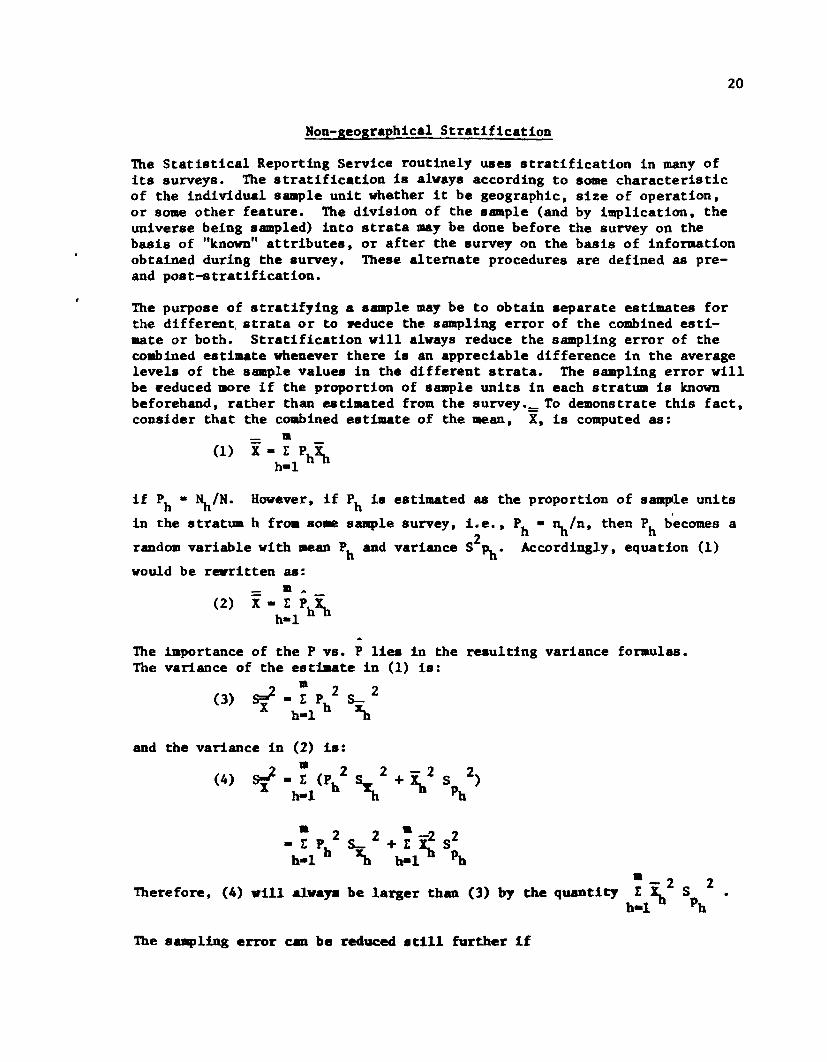
Non-geographical Stratification
The Statistical Reporting Service routinely uses stratification in many ofits surveys. The stratification is always according to some characteristicof the individual sample unit whether it be geographic, size of operation,or SOlie other feature. The division of the s8llple (and by implication, theuniverse being s8llpled) into strata may be done before the survey on thebasis of "known" attributes, or after the survey on the basis of informationobtained during the survey. These alternate procedures are defined as pre-and post-stratification.
The purpose of stratifying a sample may be to obtain separate estimates forthe different, strata or to Hduce the sampling error of the combined esti-mate or both. Stratification will always reduce the sampling error of thecollbined estimate whenever there is an appreciable difference in the averagelevels of the sample values in the different strata. The sampling error willbe e-educed 1IIOreif the proportion of sample units in each stratum is knownbeforehand, rather than estimated from the survey.= To demonstrate this fact,consider that the combined estimate of the mean, X, is computed as:
•-(1) X - t Ph~
h-l
if Ph - ~/N. However, if Ph is estimated as the proportion of sample unitsin the stratua h from SOlie sample survey, i.e., Ph - ~/n, then Ph b'ecomes a
2random variable with mean Ph and variance S Ph. Accordingly, equation (1)
would be rewritten as:
The importance of the P vs. P lies in the reaulting variance formulas.The variance of the estimate in (1) is:
_2 m 2 2(3) SX - t Ph S-
h-l ~
and the variance in (2) ia:•(4) ~X - t (P 2
11-1 h
• - 2 2Therefore, (4) will alwaye be larger than (3) by the quantity I ~ Sh-l Ph
The saJlpling error can be recluced atill further if
21
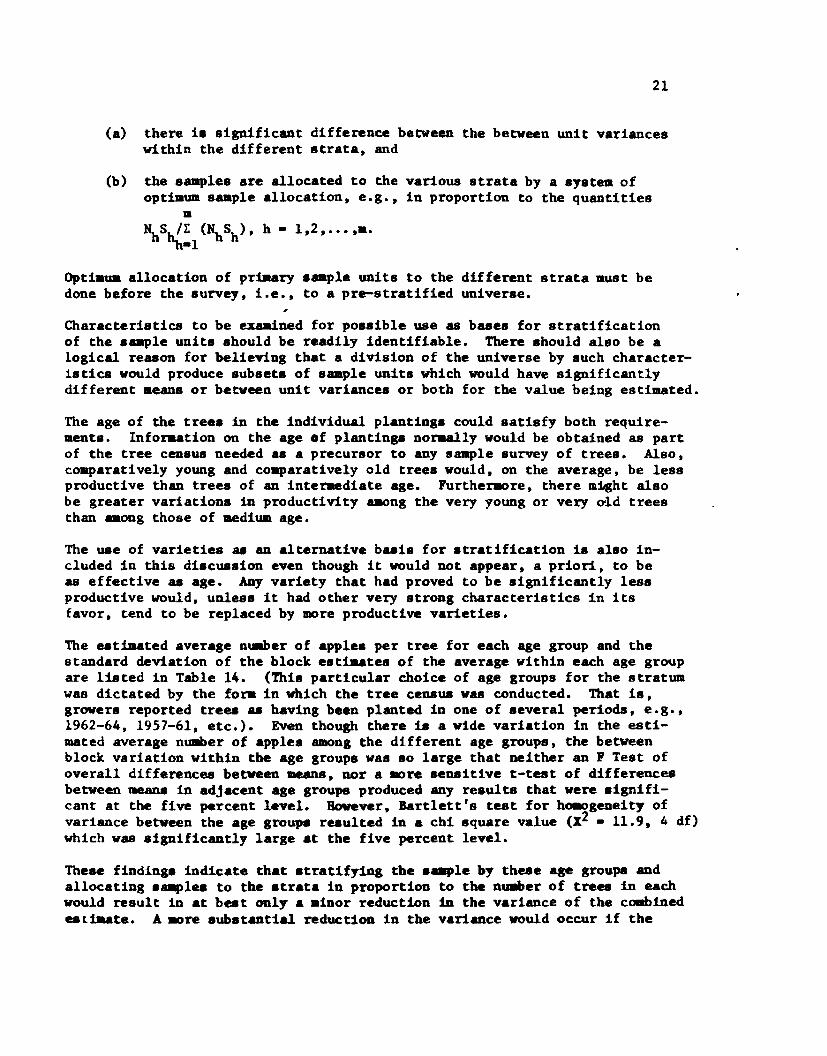
(a) there is sign.ificant difference between the between unit varianceswithin the different strata, and
(b) the samples are allocated to the various strata by a system ofoptimumsasple allocation, e.g., in proportion to the quantities
11
~Sh!t (~Sh)' h - 1.2,.••,•.-0-1
Optiaua allocation of priaary s.-ple units to the different strata must bedone before the survey, i.e., to a pre-stratified universe.
Characteristics to be exaained for possible use as bases for stratificationof the saaple units should be readily identifiable. There should also be alogical reason for believing that a division of the universe by such character-istics would produce subsets of sample units which would have significantlydifferent means or between unit variances or both for the value being estimated.
The age of the trees in the individual plantings could satisfy both require-ments. Inforaation on the age of plantinge noraally would be obtained as partof the tree census needed as a precursor to any sample survey of trees. Also,comparatively young and comparatively old trees would, on the average, be lessproductive than trees of an intermediate age. Purthermore, there m~t alsobe greater variations in productivity amongthe very young or very ~ld treesthan •• ang those of mediumage.
The use of varieties as an alternative basis for stratification is also in-cluded in this discussion even though it would not appear, a priori, to beas effective as age. Anyvariety that had proved to be significantly lessproductive would, unless it had other very strong characteristics in itsfavor, tend to be replaced by more productive varieties.
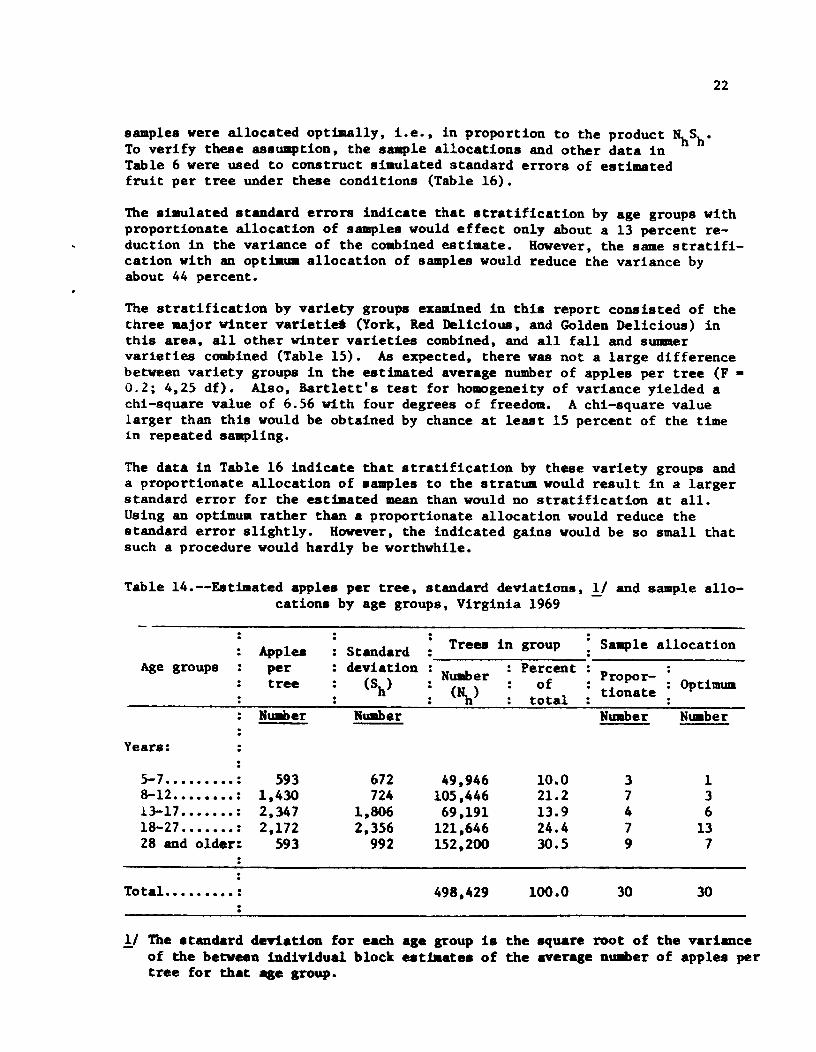
The estimated average nUliber of apples per tree for each age group and thestandard deviation of the block estimates of the average within each age groupare listed in Table 14. (This particular choice of age groups for the stratumwas dictated by the fora in which the tree census was conducted. That is,growers reported trees as having been planted in one of several periods, e.g.,1962-64, 1957-61, etc.). Even though there is a wide variation in the esti-mated average nUBberof apples amongthe different age groups, the betweenblock variation within tbe age groups was so large that neither an P Test ofoverall differences between .eaIlS, nor a .,re sensitive t-test rOfdifferencesbetween means in adjacent age groups produced any results that were signifi-cant at the five percent level. However, Bartlett's test for tw.Dgeneity ofvariance between the age groups resulted in a chi square value (X2 - 11.9, 4 df)which was significantly large at the five percent level.
These findings indicate that stratifying the s&llple by these ase groups andallocating sDipI•• to the strata in proportion to the nUilber of tre •• in eachwould result in at best only a minor reduction in the variance of the cOlllbinedestiaate. A.,re substantial reduction in the variance would occur if the
22
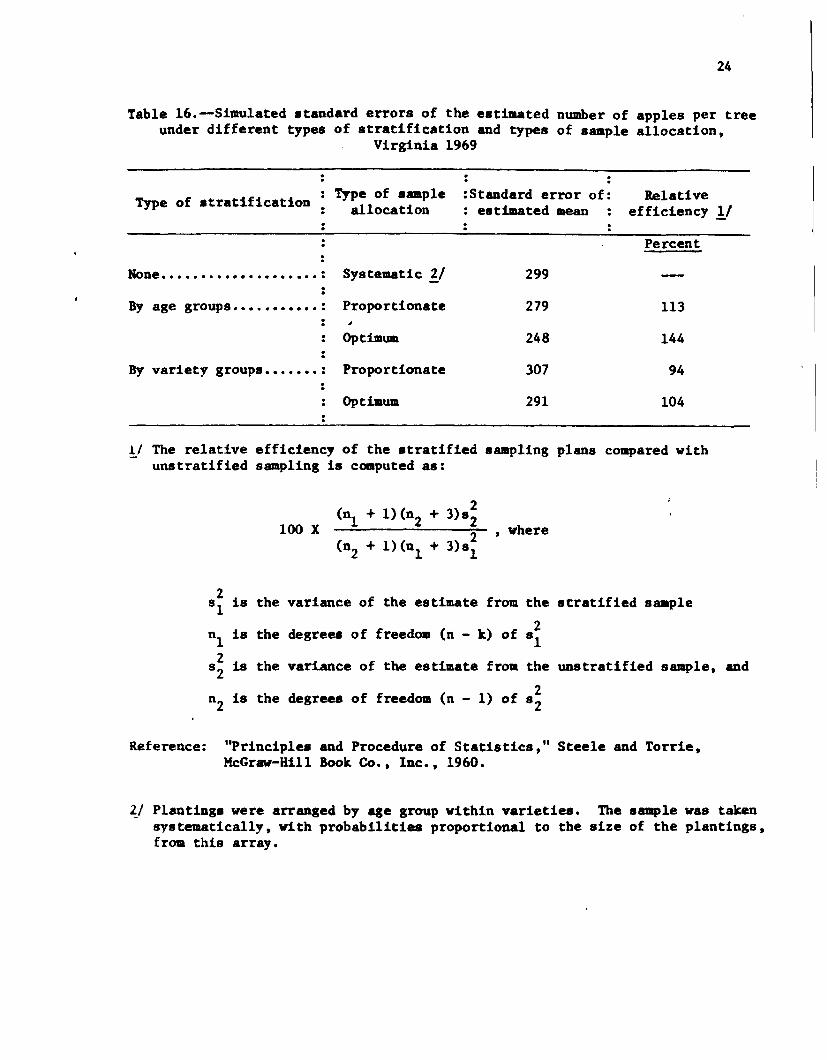
samples were allocated optimally, Le., in proportion to the product ~Sh'To verify these assu.ption, the s.-ple allocations and other data inTable 6 were used to construct simulated standard errors of estimatedfruit per tree under these conditions (Table 16).
The siaulated standard errors indicate that stratification by age groups withproportionate allocation of samples would effect only about a 13 percent re-duction in the variance of the combined estiaate. However, the same stratifi-cation with an optfaua allocation of samples would reduce the variance byabout 44 percent.
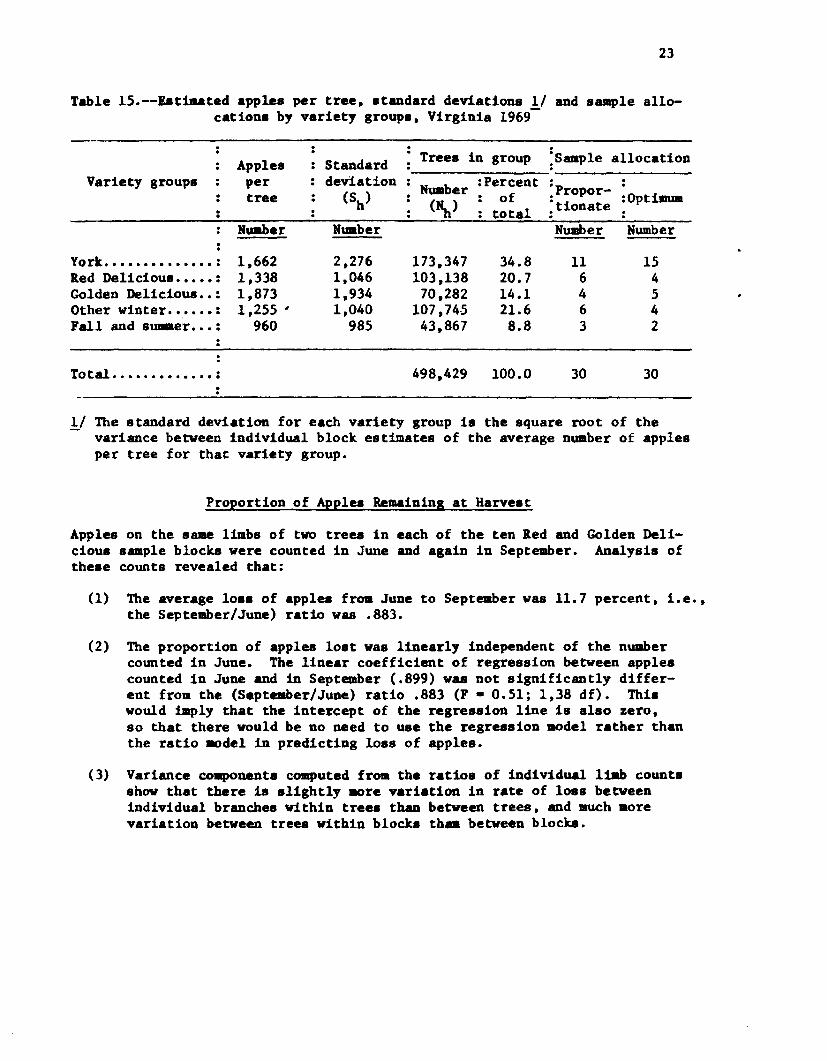
The stratification by variety groups examined in this report consisted of thethree •• jor winter varietie6 (York, Red Delicious, and Golden Delicious) inthis area, all other winter varieties combined, and all fall and stJDlllervarteties combined (Table 15). As expected, there was not a large differencebetween variety groups in the estimated average number of apples per tree (F -0.2; 4,25 df). Also, Bartlett's test for homogeneity of variance yielded achi-square value of 6.56 with four degrees of freedom. A chi-square valuelarger than this would be obtained by chance at least 15 percent of the time1n repe.ted sampling.
The data in Table 16 indicate that stratification by these variety groups anda proportionate allocation of samples to the stratum would result in a largerstandard error for the estimated mean than would no stratification at all.Using an optimum rather than a proportionate allocation would reduce thestandard error slightly. However, the indicated gains would be so small thatsuch a procedure would hardly be worthwhile.
Table l4.--Eatfaated apple.s per tree, standard deviations, !I and sample allo-cations by age groups, Virginia 1969
·· Trees in group Sa.ple allocation. Apples Standard · .. · .Age groups per deviation . PercentNumber . Propor-tree (Sh) (1\) of tionate Optimum
totalNUliber Nuaber Nuaber Nuaber
Years:
5-7 ......... : 593 612 49,946 10.0 3 18-12 .....•.. : 1 ,430 724 105,446 21.2 7 3i3-17 ....... : 2,347 1,806 69,191 13.9 4 618-27 ••••••• : 2,172 2,356 121,646 24.4 7 1328 and older: 593 992 152,200 30.5 9 7
Total ••...•••• : 498,429 100.0 30 30:
!I The stanclard den.ation for each age group i. the square root of the varianceof the between individual block esttaates of the aver ••e nUllber of apples pertree for that age group.
23
Table l5.--Eatiaated apples per tree, standard deviationa 1/ and sasaple allo-cations by variety groups, Virginia 1969-
: Tree. in group ~saaple allocationApple. StandardVariety groups per deviation :Percent .
tree (Sh) NUliber of :Propor- :Optimua(1\) : total ;tionateNuaber NUlRber Number Number
York. •••••••••••••• : 1,662 2,276 173,347 34.8 11 15Red Deliciou •••••• : 1,338 1,046 103,138 20.7 6 4Golden Delicious ••: 1,873 1,934 70,282 14.1 4 5Other winter •••••• : 1 .255 I 1,040 107,74-5 21.6 6 4Fall and s~er ••• : 960 985 43,8,67 8.8 3 2
Total ......••..... : 498,429 100.0 30 30..1/ The standard deviation for each vadety group i. the square root of the
variance between individual block estimates of the average number of applesper tree for that variety group.
Proportion of Apples Remaining at Harvest
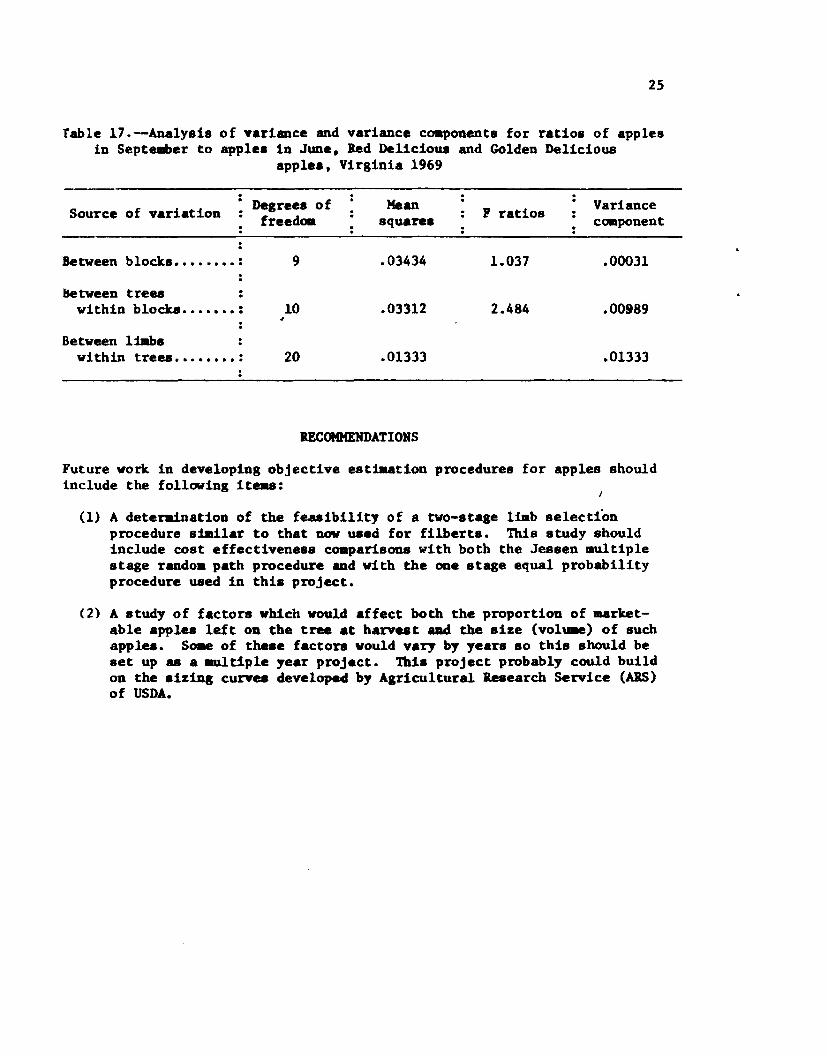
Apples on the saae limbs of two trees in each of the ten Red and Golden Deli-cious sample blocks were counted in June and again in September. Analysis ofthese counts revealed that:
(1) The average loss of apples froa June to September was 11.7 percent, i.e.,the September/June) ratio was .883.
(2) The proportion of apples lo.t was linearly independent of the numbercounted in June. The linear coefficient of regression between applescounted in June and in September (.899) was not 8ignificantly differ-ent from the (Septe.ber/June) ratio .883 (F • 0.51; 1,38 df). Thi8would taply that the intercept of the regres8ion line is a180 zero,so that there would be no need to use the regres.ion IIOdel rather thanthe ratio ~del in predicting loss of apples.
(3) Variance co.ponent. computed fro. the ratios of individual liab countsshow that there is slightly 1IOre variation in rate of loss betweenindividual branches within tree. than between trees, and auch aorevariation between trees within blocks th•• between blocks.
24
Table l6.--Simulated standard errors of the estiaated number of apples per treeunder different types of stratification and types of sample allocation,
Virginia 1969
··Type of stratification : Type of s_ple
allocation:Standard error of:
estillated meanRelative
efficiency 11
Percent··None •••••••••••••••••••• : Systematic '1:..1 299
By age groups .........••. : Proportionate 279
· Op tbum 248···By variety groups ••••••• : Proportionate 307·· Optimum 291
113
14494
104
11 The relative efficiency of the stratified s••pling plans compared withunstratified sampling is computed as:
100 X(nl + 1)(n2 +(n2 + l)(nl +
, where
2 is the variance of the estimate from the stratified saaple912Dl is the degrees of freedom (n - k) of sl
2 is the variance of the estimate from the unstratified sample, and922D2 is the degrees of freedom (n - 1) of s2
Reference: "Principles and Procedure of Statistics," Steele and Torrie,McGraw-Hill Book Co., Inc., 1960.
2../ Plantings were arranged by age group within varieties. The sSllple was taken8Ystema.tically, with probabilities proportional to the size of the plantings,from this array.
25
Table 17.-Analysie of variance and variance cOllponent. for ratios of applesin Septellber to apples in June, led Delicious and Golden Delicious
apple., Virginia 1969
Source of variation Degree. of Mean P ratios Variancefreedom square. cOllponent
Between bloCk••••••••• : 9 .03434 1.037 .00031
between t reawithin blocks ••••••• : 10 .03312 2.484 .00989
Between Uabswithin trau ........ : 20 .01333 .01333
RECOMMENDATIONSFuture work in developing objective estimation procedures for apples shouldinclude the following it ••• :
(1) A deteraination of the fe,uibility of a two-.tage liab selectionprocedure sill1lar to that now used for filberts. 'l11is study shouldinclude cost effectiveness coapar1s0D8 with both the Jessen multiplestage randoa path procedure and with the one stage equal probabilityprocedure used in this project.
(2) A study of factors which would affect both the proportion of market-able apples left on the tree at harvest ~ the size (voIUlle) of 8uchapples. SOlIeof these fact on would vary by years 80 thi8 should beset up as a IIUltiple year project. '!bi8 project probably could buildon the 8izing curves developed by Agricultural Ileaearch Service (ABS)of USDA.
26
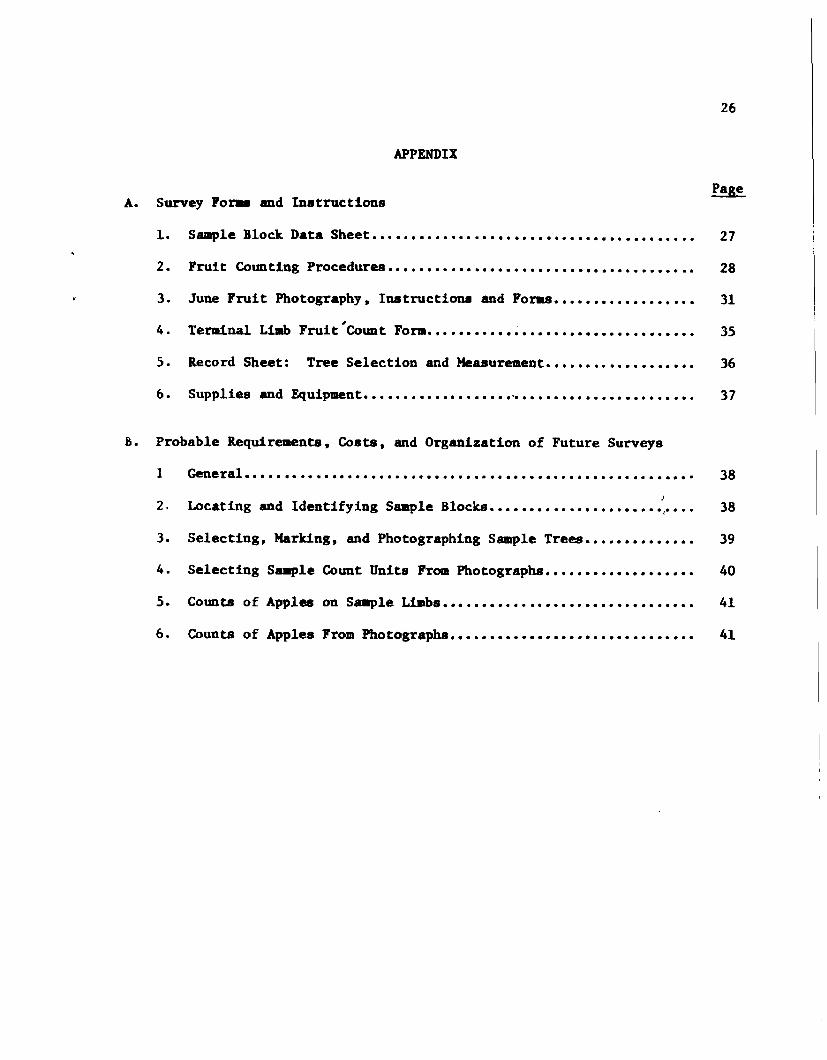
APPENDIX
A. Survey lo~ and InstructionsPage
.'
1.
2.
3•
S8lllple Block Data Sheet ...•..•...............••.................
Fruit Counting Procedures ••••••••••••••••••••••••••••.••••••••.•June Fruit Photography, Instructions and Foras ••••••••••••••••••
27
28
314.
5.
Terminal Limb
Record Sheet:
,'rui t Co\lllt Fara ....•.•..•• ; •...••••••...•.•.....•
Tree Selection and Measurement •••••••••••••••••••35
366. Suppl iea and Equip1lM!n t •••.•..•••••••••..•..•••...•.•••.••••••••••. 37
B. Probable Requireaents, Coats, and Organization of Future Surveys
1' General ....•.•.•.....•...•......••......•........•...•......••.. 38!2. Locating and Identifying Sample Blocks •••••••••••••••••••••• ,•••• 38
3. Selecting, Marking, and Photographing Sample Trees •••••••••••••• 39
4. Selecting S.-ple Count Units From Photographs ••••••••••••••••••• 40
5.
6.
Counts of Apples on Sample Liabs ••••••••••••••••••••••••••••••••
Counts of Apples From Photographs •••••••••••••••••••••••••••••••
41
41
27
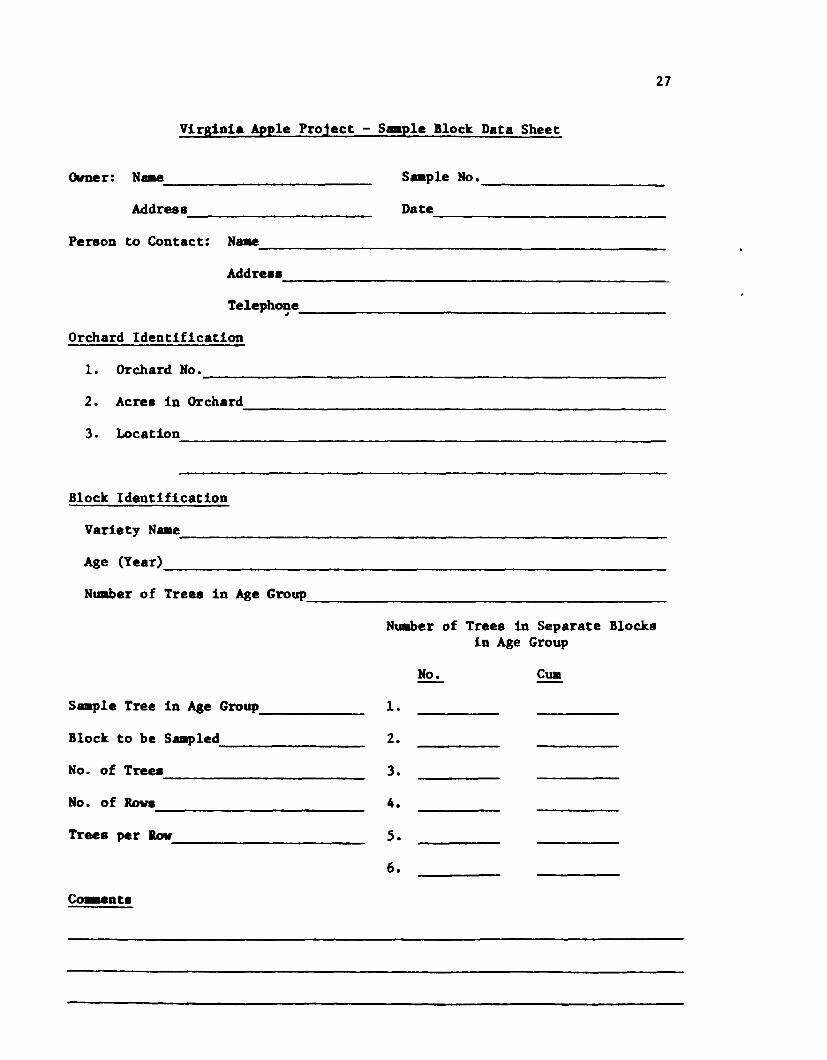
Virginia Apple Project - S••p1e Block Data Sheet
Owner: Naae------------ S••p1e No.-----------Address Date----------- --------------
Person to Contact: Naae------------------------Address -----------------------Telephone,,---------------------
Orchard Identification
1. Orchard No.---------------------------2. Acres in Orchard -------------------------3. Location ----------------------------
Block Identification
Variety Naae----------------------------Age (Year) _
NUllber of Trees in Age Group---------------------NUllber of Trees in Separate Blocks
in Age Group
Sup1e Tree in Age Group _
Block to be Supled ---------No. of Treea------------No. of Row.------------Trees per Ilov-----------C~nt8
1.2.
3.4.5.6.
No. CUll
28
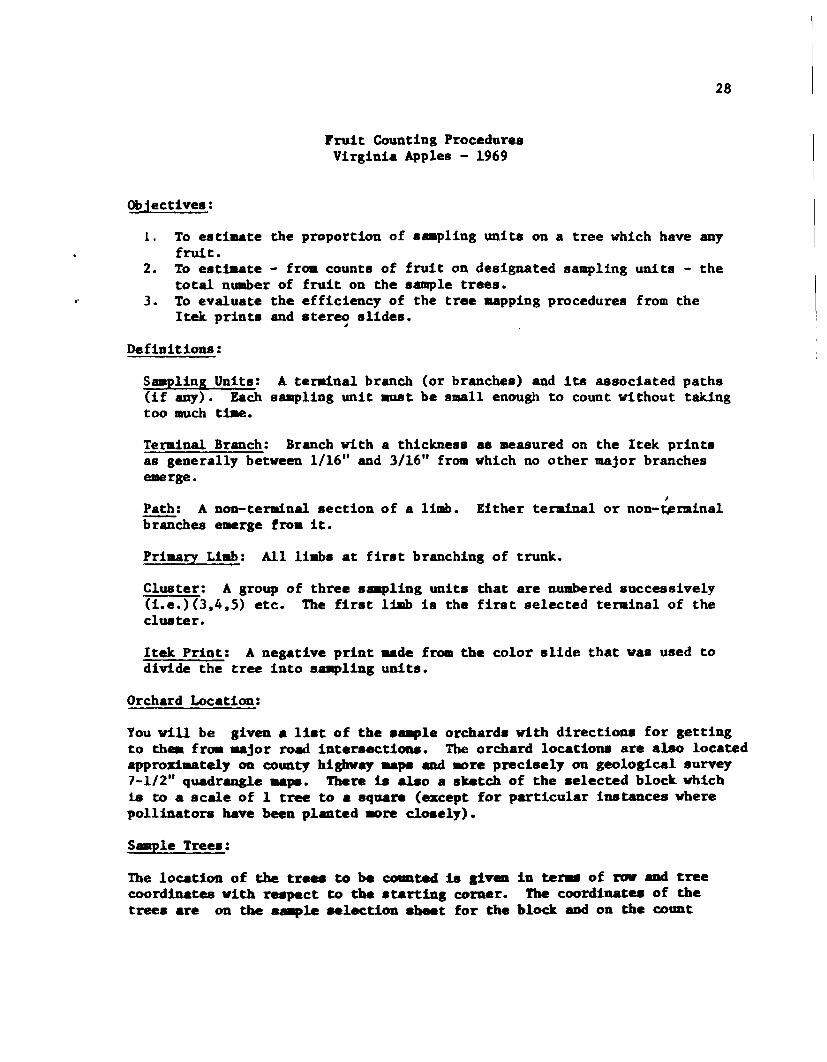
lruit Counting Procedure.Virginia Apples - 1969
Objectives:
1. To estimate the proportion of s.-p1ing units on a tree which have anyfruit.
2. To esttaate - fr~ counts of fruit on designated sampling units - thetotal nuaber of fruit on the sample trees •
.' 3. To evaluate the efficiency of the tree aapping procedures from theltek prints and stereo slides.
#
Definitions:
Saap1ing Units: A teratna1 branch (or branches) and its associated paths(1f any). Each saap1ing unit 1IU8tbe small enough to count without takingtoo much tiae.
Terminal Branch: Branch with a thickness as measured on the ltek printsas generally between 1/16" and 3/16" from which no other major branchesemerge.
A
Path: A non-te1'llinal section of a limb. Either teraina1 or non-t,enaina1branches emerge fro. it.
Priaary Li.b: All liabs at first branching of trunk.
Cluster: A group of three sapling units that are nwabered successively(i.e.)(3,4,5) etc. The first limb is the first selected terminal of thecluster.
ltek Print: A negative print _de fro. the color slide that was used todivide the tree into a.-p1ing unita.
Orchard Location:
Youwill be given a list of tbe s..,le orchards with directions for gettingto th_ fr~ •• jor ro~ intersecti0D8. The orchard locations are also locatedapproxiaately on COUDtyhighway "JNI and .ore precisely on geological survey1-1/2" quadrangle aa1'8. There is alao a sketch of the selected block. whichis to a scale of 1 tree to a square (except for particular instances wherepollinators have been planted .ore closely).
Sa.p1e Tree.:
The location of the tr ••• to be coaated is &iVeIl in telWS of row aDd treecoordinates witb rupact to the starting corner. The coordinates of tbetree. are on tbe 8..,le •• lection 8bMt for tbe bloc:k.aDdon the count
29
sbeet. for the individual tree •• Nine tree. in each s.-ple block bave been•• rked with red or yellow ribbon around the trunk of the tree. Only three oftbese trees are to be counted 80 you will need to count the trees and rowscarefully to aake certain that the counts are •• de on the proper tree.
The ti •• that you arrive at each s.-ple tree is to be recorded in the spaceprovided in the upper left-band corner of the count record fora.
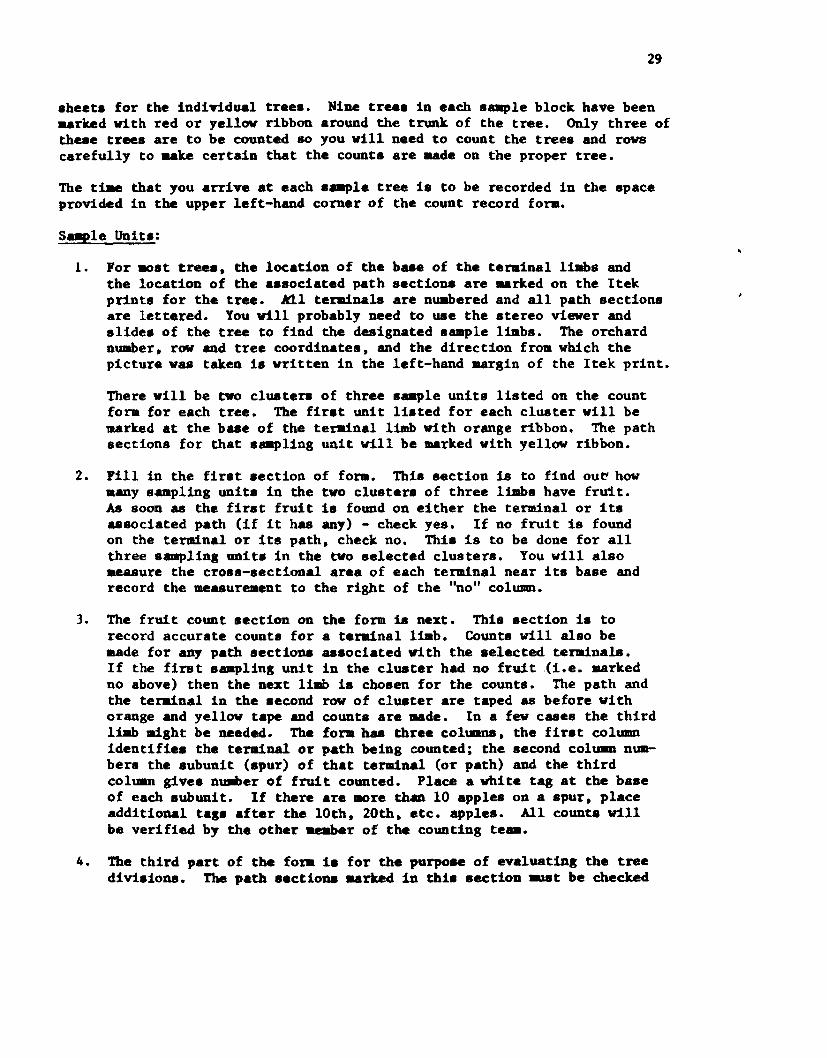
SaJaple Unite:
1. For .:)st tree., the location of the bue of the terainal liBS andtbe location of the associated path ssctions are •• rked on the Itekprints for the tree. kil tera1nals are n~ered and all path sectionsare lettered. Youwill probably need to use the stereo viewer andslides of tbe tree to find the designated sample limbs. The orchardnumber, row and tree coordinates, and the direction from which thepicture was taken is written in tbe left-hand margin of the Itek print.
There will be two clusters of three saaple units listed on the countforaa for each tree. The first unit listed for each cluster will bemarked at the base of the tendn&! limb with orange ribbon. The pathsections for that s.-pling unit will be marked with yellow ribbon.
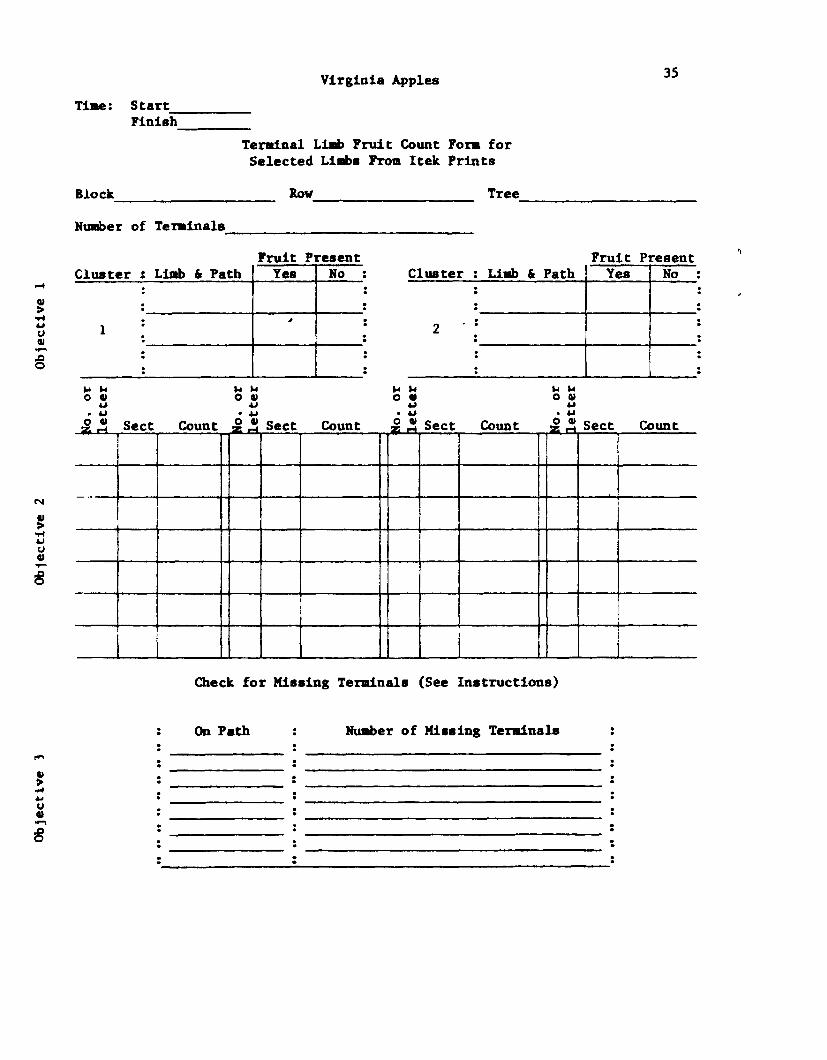
2. Fill in the first section of fora. This section is to find ou~ howaany saapling units in the two clusters of three lillbs have fruit.As soon as the first fruit is found on either the terminal or itsassociated path (if it has any) - check yes. If no fruit is foundon the terminal or its path, check no. This is to be done for allthree sampling unit. in the two selected clusters. Youwill alsomeasure the cross-sectional area of each terainal near its base andrecord the measureaent to the right of the tlno" column.
3. The fruit count section on the form is next. This section is torecord accurate counU for a tendnal lab. Counts will also beaede for any path sectiona •• sociated with the selected terainalB.If the first s.-pling unit in the cluster had no fruit (i.e ••• rkedno above) then the next liwabis chosen for the counts. The path andtbe tendnal in tbe second row of cluster are taped as before withorange and yellow tape and counts are made. In a few cases the thirdliJlb tight be needed. The fora has three COlUlllD8,the first columnidentifies the terainal or path being counted; the second colu.n num-bers the subunit (spur) of that terainal (or path) and the thirdcollan gives nUllber of fruit counted. Place a white tag at tbe baseof each subunit. If there are IIOre than 10 apples on a spur, placeadditional tass after the 10th, 20th, etc. apples. All count. willbe verified by the other llellber of the counting team.
4. The third part of the foxa is for the purpose of evaluating the treedivisions. The path sectioDS •• rk.ed in this section .ust be checked
for terainal li.bs aissed in the mapping. If a priaary lie isvisible fro•• ore than one Itek print, both !lUStbe checked if aterminal lillb is not shownon the one print. At this point, ourdefinition of a terainal limb is a liab of greater size than theterainal to which it has been assigned.
30
31
JUDe Photography Instructions
Objectives:
To photograph one aide of nine .elected apple trees in each block.
Field Procedure8:
1. The nine tree. to be photographed for each block are identified byblock nullber, row nuaber, and tree nUllber in the row. They are alsomarked with red or red and yellow ribbon. Photographs will be takenfrom the side of the eTee which (a) is specified on the fora. (b)keep8 the sun to your back as much as possible.
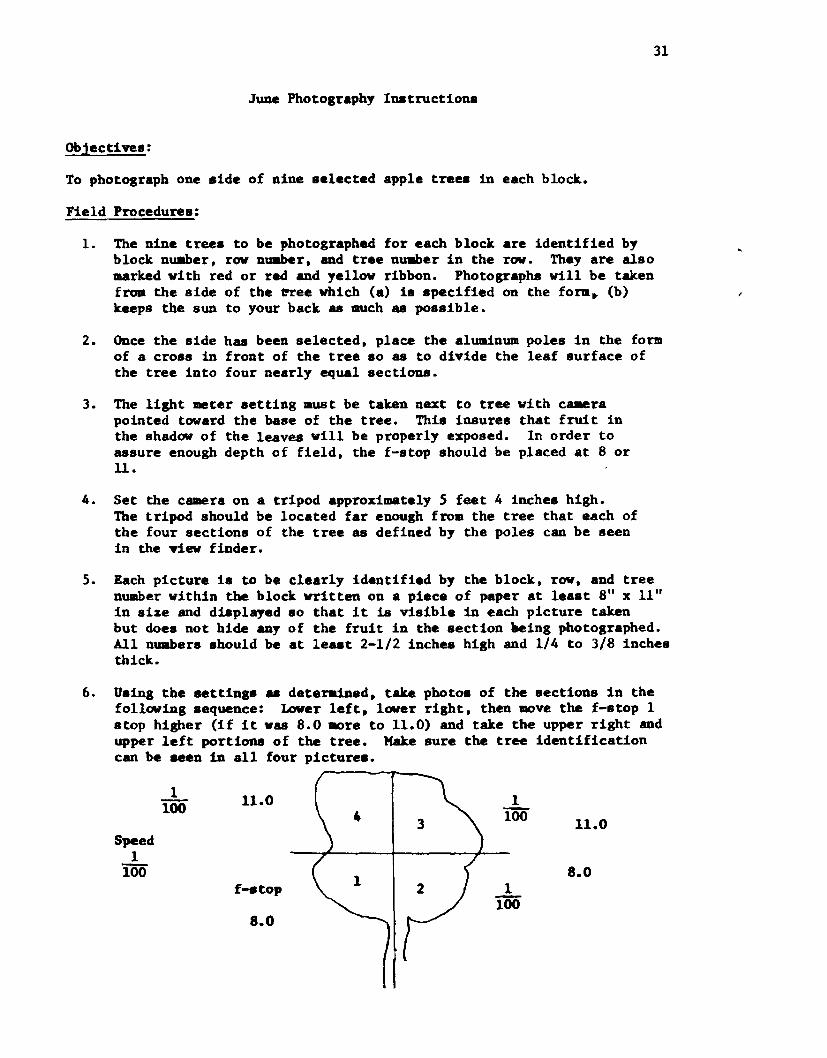
2. Once the side has been selected, place the aluminum poles in the formof a cross in front of the tree so as to divide the leaf surface ofthe tree into four nearly equal sections.
3. The light meter setting .ust be taken next to tree with caaerapointed toward the base of the tree. This insures that fruit inthe shadow of the leaves will be properly exposed. In order toassure enough depth of field, the f-stop should be placed at 8 or11.
4. Set the camera on a tripod approximately 5 feet 4 inches high.The tripod should be located far enough fro. the tree that each ofthe four sections of the tree a8 defined by the poles can be seenin the new finder.
5. Each picture is to be clearly identified by the block, row, and treenumber within the block written on a piece of paper at leut 8" x 11"in size and diaplayed so that it i8 visible in each picture takenbut does not hide any of the fruit in the section ~ing photographed.All nnabers should be at leaat 2-1/2 inch •• high and 1/4 to 3/8 inchesthick.
6. Using the settings •• deterained, take photos of the section8 in thefollowing sequence: Lover left, lower right, then IDOve the f-stop 1stop higher (if it vas 8.0 IIOre to 11.0) and take the upper right andupper left portions of the tree. Make sure the tree identificationcan be Hen in all four picture ••
1 11.0 1100 roo 11.0Speed
1100 8.0f__ top 1
1008.0
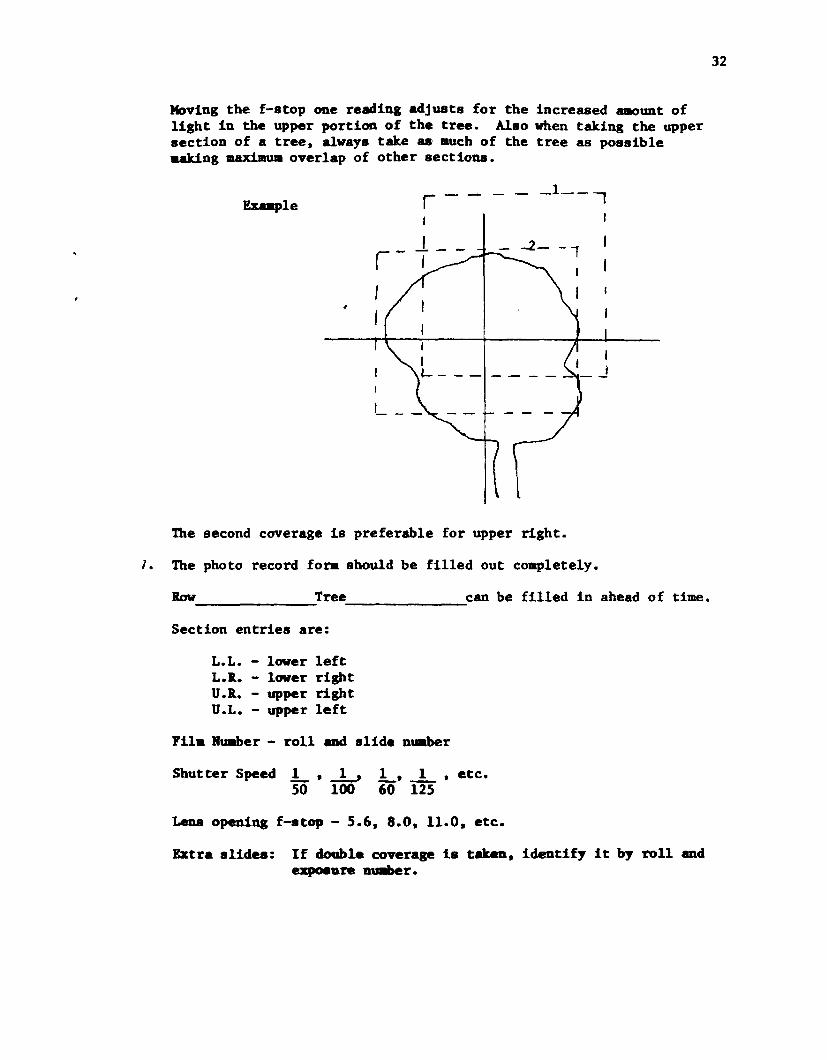
Moving the f-stop one reading adjusts for the increased 8IIlOuntoflight in the upper portion of the tree. Also when taking the uppersection of a tree. always take as auch of the tree as possible-.king maximumoverlap of other sections.
32
EXUlple_1__ 1
I
The second coverage 18 preferable for upper right.
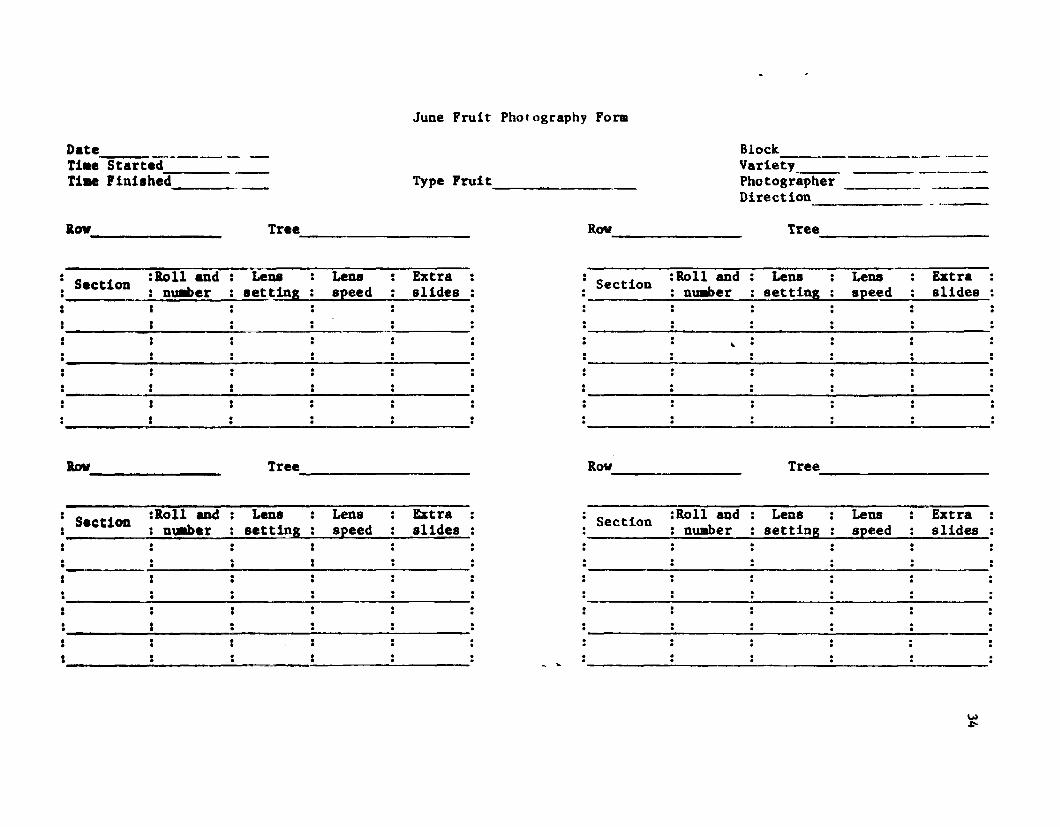
I. The photo record fo~ should be filled out completely.
Row Tree can be filled in ahead of time.------- -------Section entries are:
L.L. - lover leftL.I.. - lover rightU.I.. - upper rightU.L. - upper left
Fil. Huaber - roll and elide nuaber
Shutter Speed L. --L., L,...L,etc.50 100 60 125
Lens opening f-stop - 5.6, 8.0, 11.0, etc.
Extra slides: If doable coverage is taken, identify it by roll and~llre nUliber.
All rolls of fila, both the can in which the fila comes and thecas.ettes, are to be numbered consecutively starting with 20.Atteapt to expose them in numerical order. If a roll is lost oraisplaced before being exposed, use the next roll. If a roll islost or .isplaced after being exposed, retake those trees ifpossible.
33
DateTi.e-S-t-a-r-t-.'-d---- - -
Ti•• Pinished ----
June Fruit Photography Form
~peFroit _Block~~ _VarietyPhotographer _Direction --------
Iow_~ _ Tree---------- Row-------- 'Iree----------Section :1011 and
I nUliber
II
Leusetting
Lensspeed
..
Extraslides ·· Section :Roll and
nser
..
Lenasetting
Lensspeed
Extraslides
'Iree---------- Row 'Iree----------Section :1011 and
u\llber
..
Lenssetting ·•
•.
Lensspeed
Extraslides
··
Section :1011 andnuaber
Lenssetting
Lensspeed
Extraslides
••-------------------------
Virginia ApplesTille: Start-----Finish
Terainal Lilib Frui t Count Fora forSelected Li.s From Itek Prints
35
Block---------- RoW'---------- Tree -----------N\DIber of Terainals _
Fruit Present Fruit PresentCluster • LiJIb,Path Yes No ·. ·:
· ·· ·: I
1 ·· :····
Cluster · Lillb & Path Yes No······2 ·······..
Z.-4 '::II! ••• 7. ••• !:/Ill ••••
I
- .~,
II
-
II
I
N
"" ""o 1II~. ~o 1II Sect Count
••• •••o QI~. ~o QI Sect Coun t
••••••o 1II~. ~o 1II Sect Coun t
••• •••o 1II~. ..,o 1II Sect Count
Check for Missing Terminals (See Instructions)
On Path
: :-------····· .· .-------
Nullber of Missing Terainala:-------------------··-------------------···· ·.
36
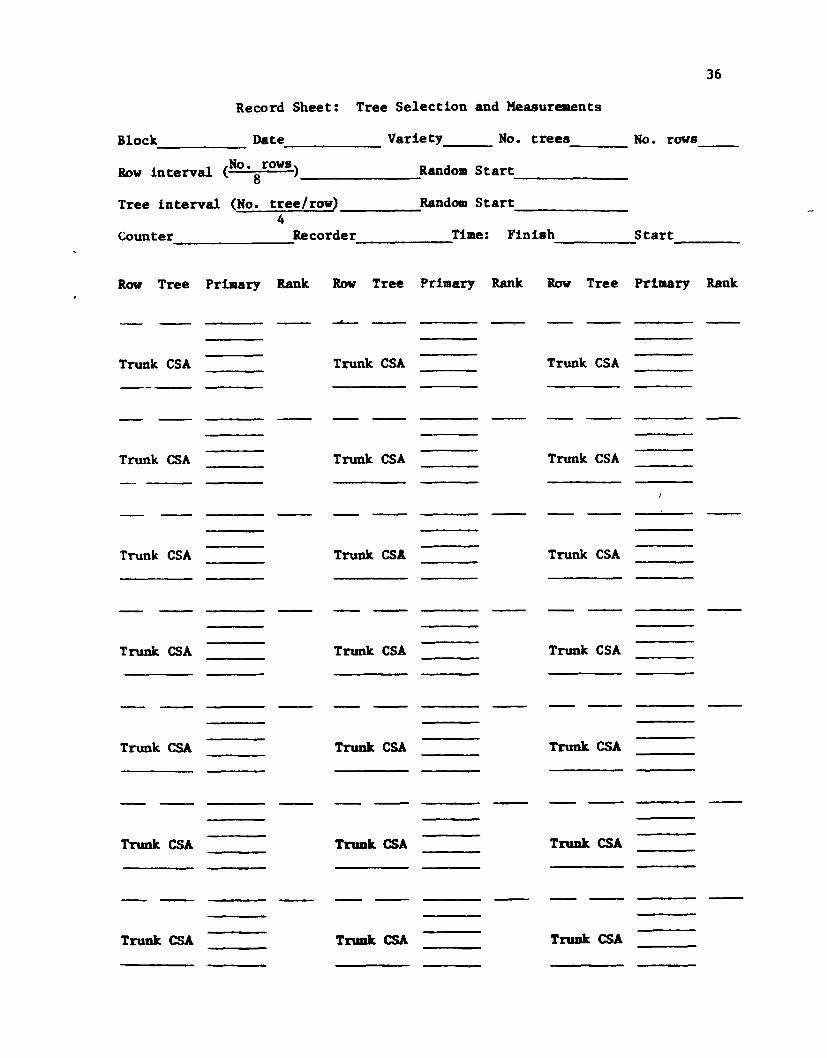
Record Sheet: Tree Selection and Measurements
Block. Date Variety No. trees No. rows _
Row interval (No. rows) Random Start8 ------- -------
Tree interval (No. tree/rov) RandOlll Start _4
Counter Recorder Tiae: Finish Start------- ------ ----- ----Row Tree Primary Rank Row Tree Primary Rank Row Tree Primary Rank
Trunk CSA
Trunk CSA
Trunk CSA
Trunk CSA
Trunk CSA
Trunk. CSA
Trunk C5A
Trunk CSA
Trunk CSA
Trunk. CSA
Trunk. CSA
Trunk CSA
Trunk. CSA
Trualt CSA
Trunk CSA
Trunk CSA
Trunk CSA
Trunk CSA
Trunk. CSA
Trunk. CSA
Truuk CSA
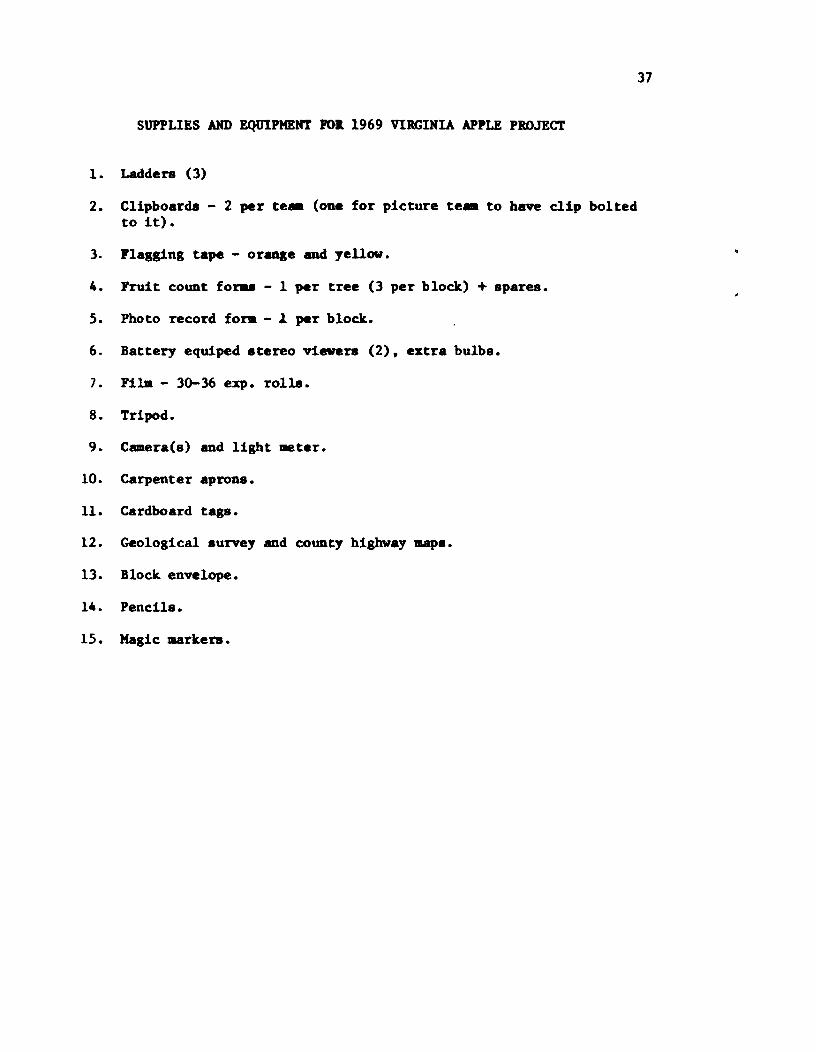
SUPPLIES AND EQUIPMENT ro•. 1969 VIRGINIA APPLE PROJECT
1. Ladders (3)
37
2. Clipboards - 2 per te_ (one for picture te_ to have clip bol tedto it).
3. Flascing tape - oraae and yellow.
4. Fruit count fonu - I per tree (3 per block) + spares.
5. Photo record fora - ~ per block.
6. Battery equiped stereo viewers (2). extra bulbs.
7. Fila - 30-36 expo rolls.
8. Tripod.
9. Caaera(s) and light meter.
10. Carpenter aprons.
11. Cardboard tass.
12. Geological survey and county highway map••
13. Block envelope.
14. Pencil ••
15. Magic markers.
38
Appendix B
Probable R.equire_nu, C08t8, and Organization of Future Surveys
General
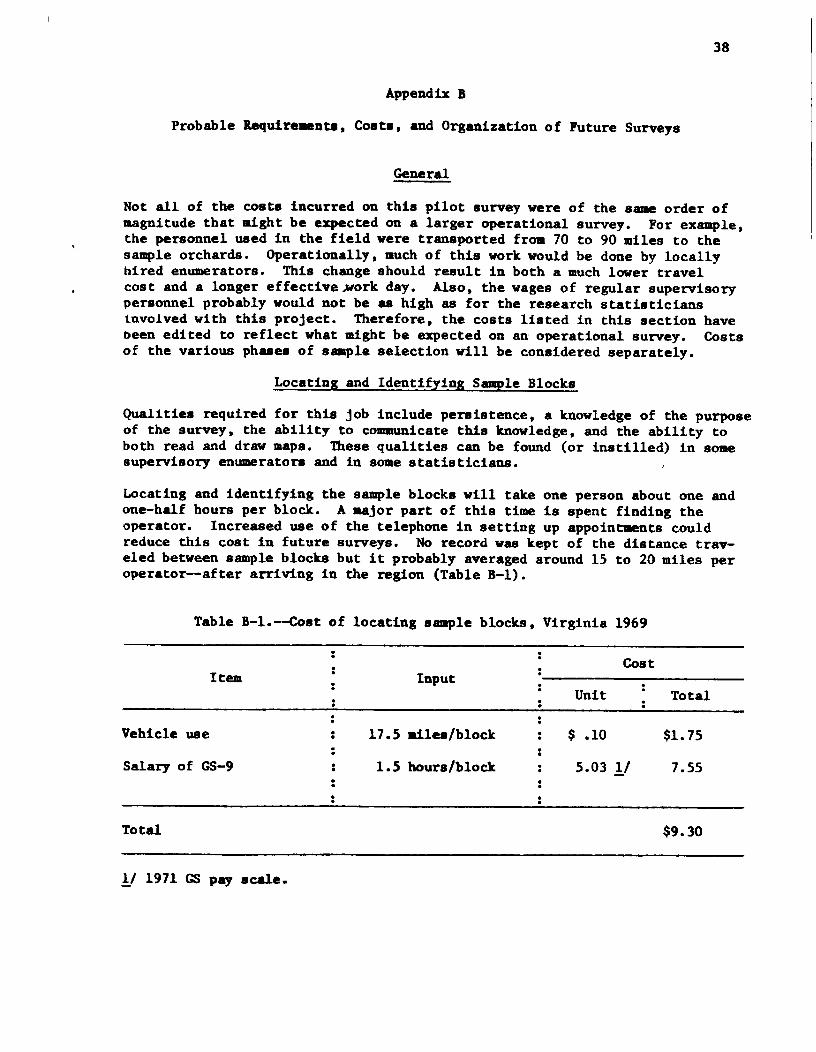
Not all of the coste incurred on this pilot aurvey were of the same order ofmagnitude that tight be expected on a larger operational survey. For example,the personnel used in the field vere transported fro. 70 to 90 miles to thesample orchards. Operationally, muchof this work would be done by locallyhired enumerators. This change should result in both a much lower travelcost and a longer effective ..workday. Also, the wages of regular supervisorypersonnel probably would not be as high as for the research statisticiansinvolved with this project. Therefore, the costs listed in this section havebeen edited to reflect what might be expected on an operational survey. Costsof the various phases of saRple selection viII be considered separately.
Locating and Identifying Sample Blocks
Qualitiu required for this job include persistence, a knowledge of the purposeof the survey, the ability to communicate this knowledge, and the ability toboth read and draw maps. 'lb.ese qualities can be found (or instilled) in somesupervisory enumerators and in some statisticians.
Locating and identifying the sample blocks will take one person about one andone-half hours per block. A aajor part of this time is spent finding theoperator. Increased use of the telephone in setting up appointments couldreduce this cost in future surveys. No record was kept of the distance tray-e1ed between sample blocks but it probably averaged around 15 to 20 miles peroperator--after arriving in the region (Table B-1).
Table B-l.--COst of locating sample blocks, Virginia 1969
Item
Vehicle use
Salary of GS-9
Total
· ·· · Cost
· Input· Unit Total··17.5 ailes/block · $ .10 $1.75··· 1. 5 hours/block 5.03 1/ 7.55··
$9.30
!J 1971 GSpay scale.
39
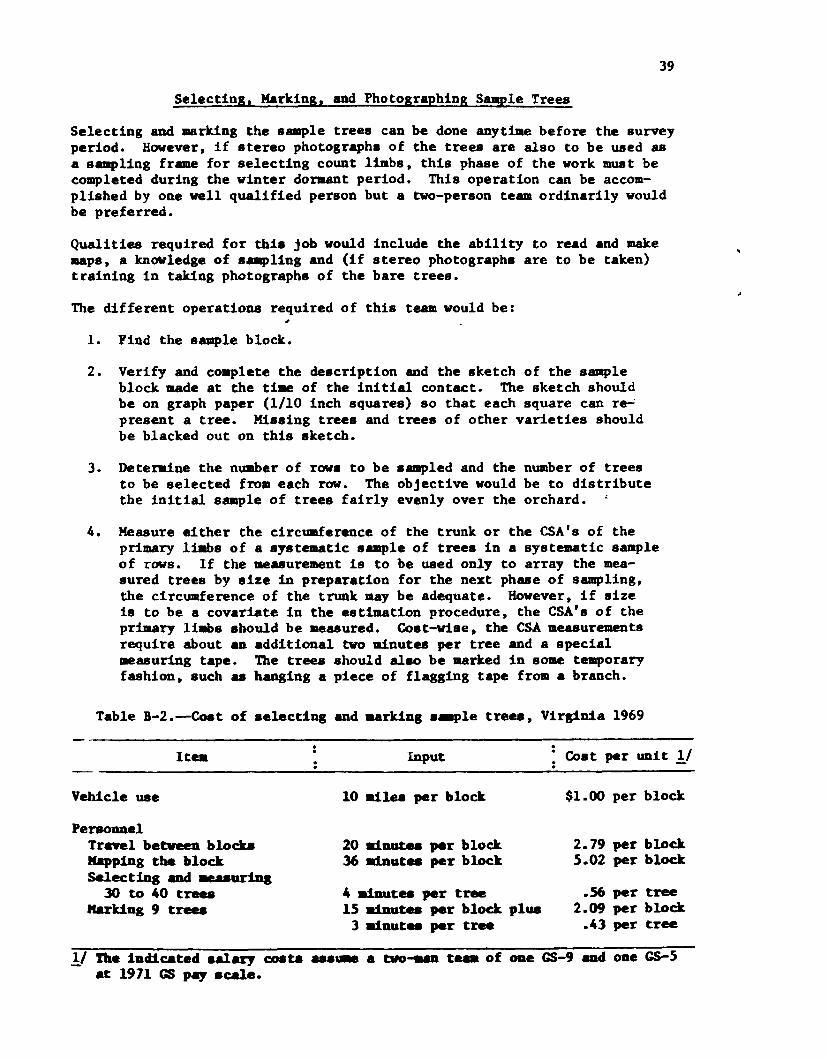
Selecting, Marking, and Photographing Sample Trees
Selecting and •• rking the sample trees can be done anytfae before the surveyperiod. However, if stereo photographs of the trees are also to be used asa sampling frame for selecting count limbs, this phase of the work must becompleted during the winter doraant period. This operation can be accom-plished by one well qualified person but a two-person team ordinarily wouldbe preferred.
Qualities required for this job would include the ability to read and make•• ps, a knwledge of s.-pling and (if stereo photographs are to be taken)training in taking photographs of the bare trees.
The different operations required of this team would be:
1. Find the sample block.
2. Verify and coaplete the description and the sketch of the sampleblock made at the ti •• of the initial contact. The sketch shouldbe on graph paper (1/10 inch squares) so that each square can re-present a tree. Missing trees and trees of other varieties shouldbe blacked out on this sketch.
3. Deteraine the nuaber of rows to be sampled and the number of treesto be selected from each row. The objective would be to distributethe initial s8llple of trees fairly evenly over the orchard.
4. Measure either the circumference of the trunk or the CSA's of theprimary li~s of a systematic sample of trees in a systematic sampleof rows. If the measurement is to be used only to array the mea-sured trees by size in preparation for the next phase of sampling.the circwaference of the trunk may be adequate. However. if size18 to be a covariate in the estimation procedure. the CSA's of thepriJury lillb8 should be ae&Bured. Cost-wise, the CSAmeasurementsrequire about an additional two minutes per tree and a special_asuring tape. The trees should also be marked in SOIl8 tewaporaryfashion, such as hanging a piece of flagging tape from a branch.
Table B-2.-Cost of s.lecting and marking s.-ple treea. Virginia 1969
It••
VehJ.cle use
PersoDDelTravel betveeD. bloc:kaMapp1ngthe blockSelecting and ••.•• urinA
30 to 40 treesMarking 9 treea
: Input
10 ail •• per block
20 mnut_ per block36 ainut •• per block
4 a1Dutea per tree15 a:l.Jwtea per block plus3 maut •• per tree
.• Cost per unit 1/
$1. 00 per block
2.79 per block5.02 per block
•.56per tree2.09 per block
.43 per tree
1/ The illcl1cated salary C08t:au•••• a two•.•••• t_ of ODeGS-9 and olle GS-5at 1971 GSpay .cale.
• 1
40
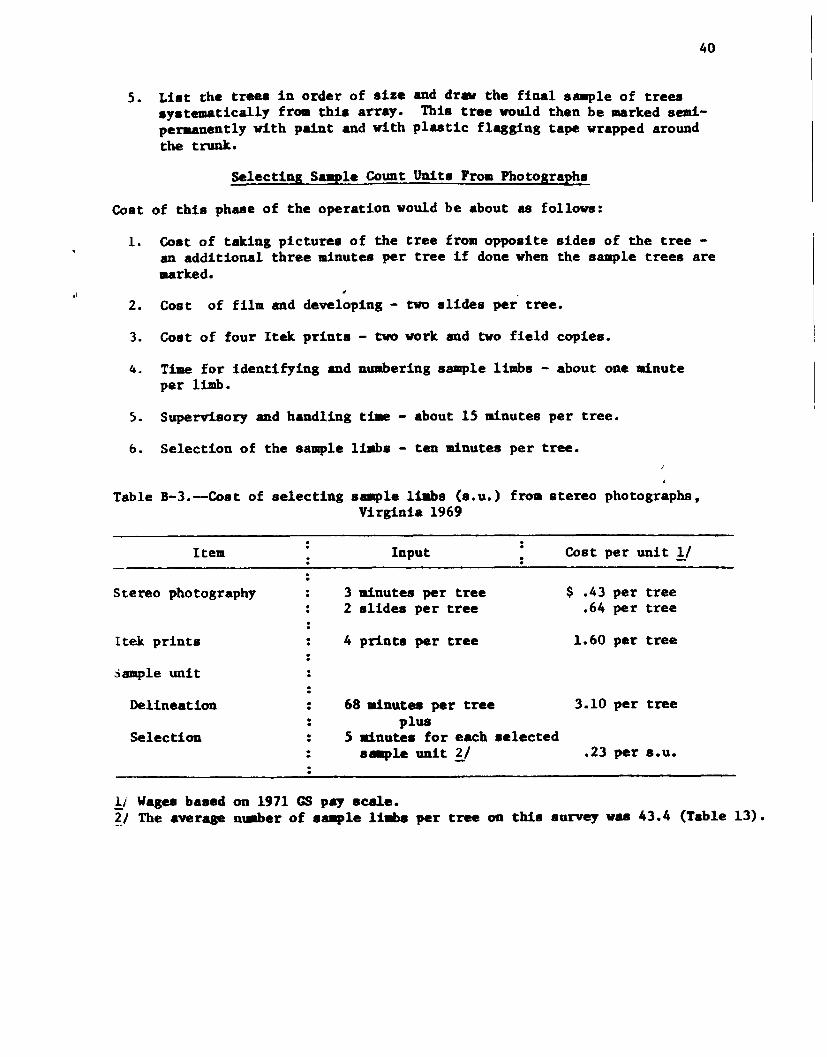
5. List the trees in order of size and dr. the final s.-ple of treessystematically froa this array. This tree would then be urked seai-peraanently with paint and with plastic flagging tape wrapped aroundthe trunk.
Selecting Saaple Count Units Fro. Pbotogra~hs
Cost of this phase of the operation would be about as follows:
1. Cost of talt1ng pictures of the tree from opposite sides of the tree -an additional three ainutes per tree if done when the sample trees aremarked•
2. Cost of fil. and developing - two slides per tree.
3. Cost of four Itek prints - two work and two field copies.
4. Time for identifying and nuabering sPlple limbs - about one 1Iinuteper limb.
s. Supervisory and handling tille - about 15 ldnutes per tree.
b. Selection of the sample li1lbs - ten 1Il1nutesper tree.
Table B-3.-Cost of selecting ssaple l1llbs (s.u.) fro. stereo photographs,Virginia 1969
Item
Stereo photography
Itek prints
:)8Dlpleunit
··
··:
Input
3 1Iinutes per tree2 slides per tree
4 prints per tree
Cost per unit !!
$ .43 per tree.64 per tree
1.60 per tree
Delineation
Selection
·····.
68 llinutes per tree 3.10 per treeplus
5 1Iinutes for each selecteds.-ple unit Y .23 per s.u.
1:.1 Wagesbased on 1911 GSpay scale.?I The averap nWlber of s&llp1eli1lbs per tree on this survey vas 43.4 (Table 13).
41
Counts of Apples on Suple Liabs
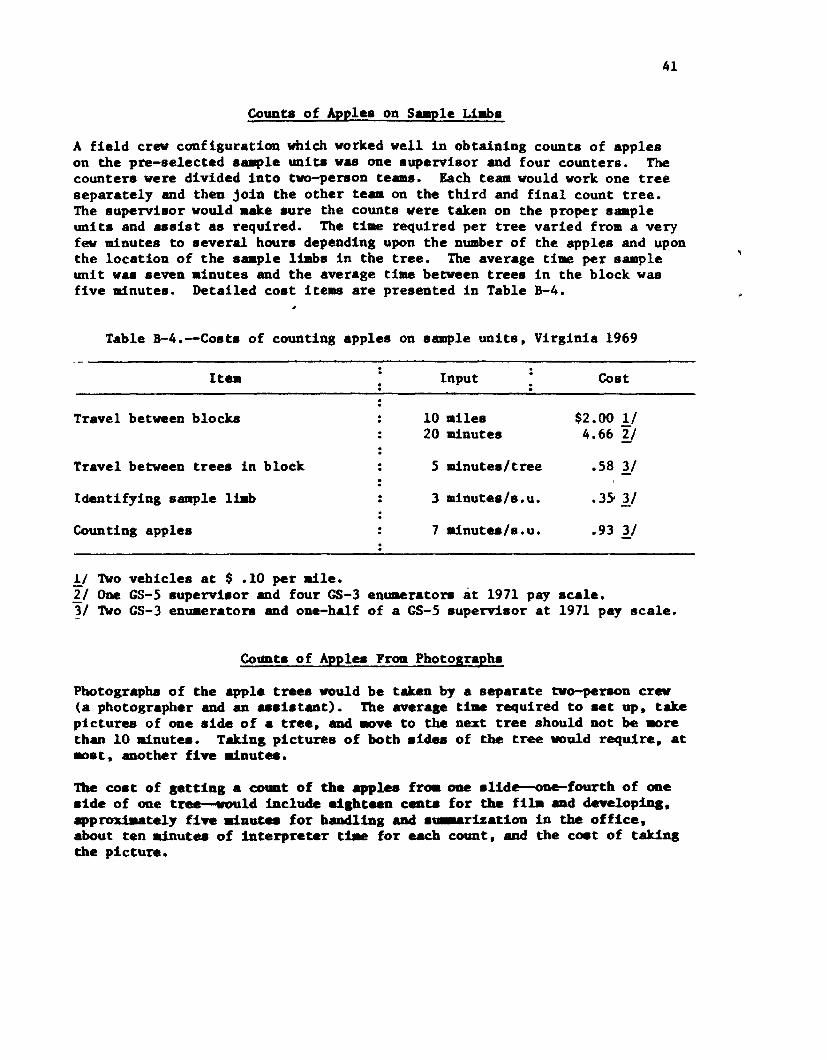
A field crew configuration which worked well in obtaining counts of appleson the pre-selected s8llple units was one superviBor and four counters. Thecounters were divided into two-person te ••••• Each team would work one treeseparately and then join the other team on the third and final count tree.The supervisor would lUke sure the counts were taken on the proper sampleunits and 88sist as required. The ti •• required per tree varied from a veryfew minutes to several bours depending upon the number of the apples and uponthe location of tbe s•• ple ltabs in the tree. The average time per sampleunit was seven ainutes and the average time between trees in the block wasfive minutes. Detailed cost items are presented in Table 8-4.
Table B-4.--Costs of counting apples on sample units. Virginia 1969
It •• Input Cost
Travel between blocks 10 .iles $2.00 1/20 minutes 4.66 y
Travel between trees in block 5 mnutes/tree .58 yldentifying sample liab 3 minutes/s.u • • 3S. 1/Counting apples 7 ainutes/s.u • •93 1/
1/ Twovehicles at $ .10 per ~le.2/ One GS-5 supervisor and four GS-3 enumerators at 1971 pay scale.3/ 'lWoGS-3 enuaerators and one-half of a GS-5 supervisor at 1971 pay scale.
Cou.ntaof Apples FrOll Photographs
Photographs of the apple trees would be taken by a separate two-person crew(a photographer and an •• shtant). The average U•• required to set UP. takepictures of one side of a tree. and IIOveto the next tree should not be IIOrethan 10 ainutes. Taking pictures of both sides of the tree would require t atIIOst. another five mnut •••
The C08 t of getting a COURtof the apples frOll ODe slide--one-fourth of oneside of one tree--vould include e1pteen CeDe. for the fila and clevelopill8.approxillately five mnutes for handling and s.-ar1.zation in the office.about ten ainutes of interpreter t:1Jle for each count. and the coat of taJdl18the picture.
42
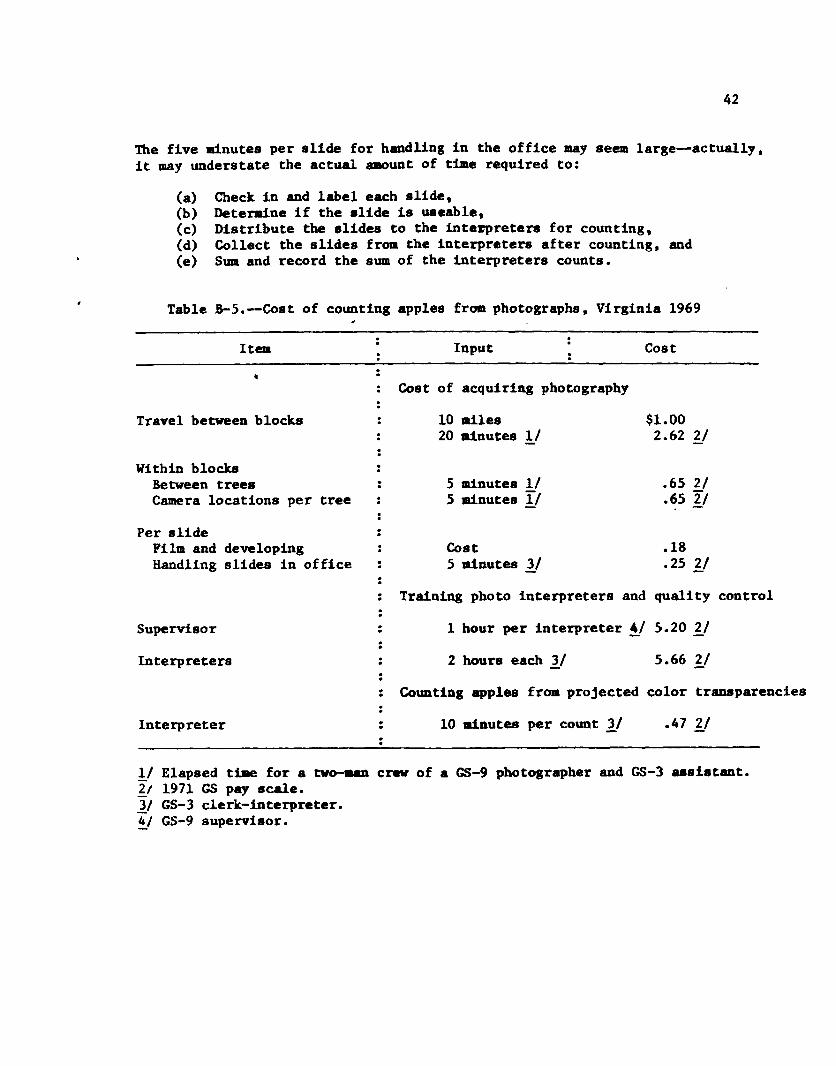
The five .tnutes per slide for handling in the office may seem large--actually,it may understate the actual amount of time required to:
(a) Check in and label each slide,(b) Determine if the slide is useable,(c) Distribute the slides to the inte~reters for counting,(d) Collect the slides from the interpreters after counting, and(e) Sum and record the sum of the interpreters counts.
Table B-5.--Cost of counting apples from photographs, Virginia 1969
Item
Travel between blocks
Wi thin blocksBetween treesCamera locations per tree
Per slideFilm and developingHandling slides in office
··
Input
Cost of acquiring photography
10 ailes20 ainutes 11
5 ainutes 115 IIinutes II
Cost5 ainutes 31
Cost
$1.002.62 Y
.65 21
.65 21, -
.18
.25 11
Supervisor
Interpreters
Interpreter
· Training photo interpreters and quality control·1 hour per interpreter !! 5.20 Y
··· 2 hours each 1/ 5.66 Y·Counting apples frOll projected color transparencies
· 10 mnutes per count 31 .47 Y·!I Elapsed tiJle for a two-aan crew of a GS-9 photographer and GS-3 usistant.'!:...I 1971 GS pay scale.1/ GS-3 clerk-interpreter.!!.,I GS-9 supervisor.
43
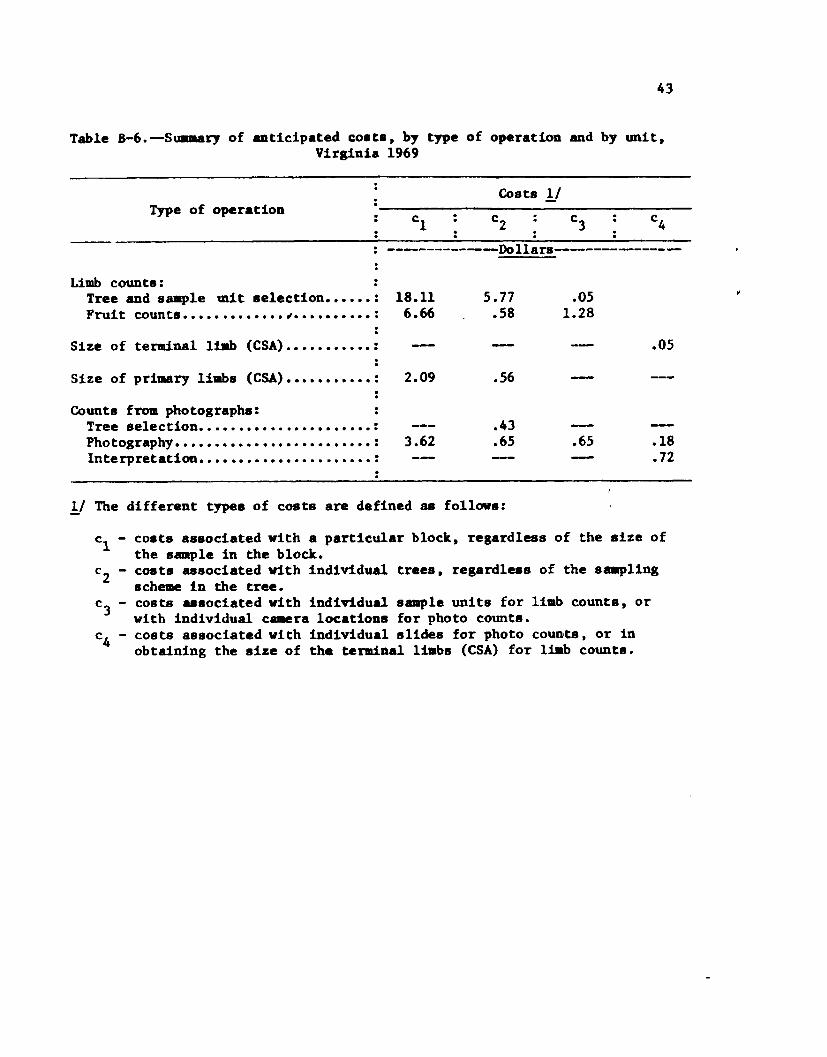
Table 8-6.-S •••• ry of anticipated costs, by type of operation and by unit,Virginia 1969
Type of operation
-------------Dollars----------------
Limb counts:Tree and saaple mit selection •••••• :Fruit count•••••••••••••• ~•••••••••• :
Size of terminal ltab (CSA) ••••••••••• :
Size of primary limbs (CSA) ••••••••••• :
Counts from photographs:Tree 8election •.••.••••••••••••••••• :Photogr.phy ••••••••••••••••••••••••• :Interpretation •••••••••••••••••••••• :
18.116.66
2.09
3.62
5.77.58
.56
.43
.65
.051.28
.65
.05
.18
.72
Y The different types of costs are defined as follows:
cl - costs associated with a particular block, regardless of the size ofthe sample in the block.
c2 - coats associated with individual trees, regardless of the s.-plingscheme in the tree.
c3 - costs 88sociated with individual s8llple units for limb counts, orwith individual camera locations for photo counts.
c4 - costs associated with individual slides for photo coun,u, or inobtaining the size of the terminal li.bs (CSA) for ltab counts.