Embed Size (px)
Citation preview
The world’s leading sustainability consultancy
General Electric Company
Request for Groundwater Reclassification General Electric Aviation Plant 1 210 Columbian Avenue Rutland, Vermont 05701 30 September 2013
ERM Project No. 0209887.004
www.erm.com
ii
TABLE OF CONTENTS
1.0 INTRODUCTION 1-1
2.0 GROUNDWATER RECLASSIFICATION ADMINISTRATIVE INFORMATION 2-1
2.1 SITE DESCRIPTION 2-1
2.2 SITE HISTORY 2-1
2.3 SHORT- AND LONG-TERM MANAGEMENT OF THE SITE 2-3
2.3.1 Site Characterization Activities 2-3
2.3.2 Residential Abatement 2-4
2.3.3 Indoor Air Sampling Program 2-4
2.3.4 MNA of Groundwater 2-5
3.0 TECHNICAL INFORMATION 3-1
3.1 REGIONAL & SITE GEOLOGY 3-1
3.2 REGIONAL & SITE HYDROGEOLOGY 3-2
3.3 SOURCE AREAS 3-4
3.4 NATURE OF CONTAMINATION 3-4
3.5 EXTENT OF IMPACT 3-4
3.5.1 Soil 3-4
3.5.2 Groundwater 3-5
3.5.3 Surface Water 3-6
3.6 ENVIRONMENTAL FATE & TRANSPORT OF SITE COCS 3-6
3.6.1 Overview 3-6
3.6.2 Physical and Chemical Properties of COCs 3-6
3.6.3 Existing and Potential Migration Pathways 3-10
iii
3.6.4 Environmental Fate 3-11
3.7 CONCEPTUAL SITE MODEL 3-12
3.8 DESCRIPTION OF BOUNDARY DELINEATION METHODOLOGY 3-13
4.0 GROUNDWATER RECLASSIFICATION EVALUATION CRITERIA 4-1
4.1 POTENTIAL FUTURE USE AS A PUBLIC WATER SUPPLY SOURCE 4-1
4.2 EXTENT OF ACTIVITY WHICH POSES A RISK TO GROUNDWATER 4-1
4.3 CURRENT QUALITY OF GROUNDWATER 4-1
4.4 AVAILABILITY OF GROUNDWATER IN QUANTITIES NEEDED FOR BENEFICIAL USE 4-1
4.5 CONSEQUENCES OF GROUNDWATER POTENTIAL CONTAMINATION AND AVAILABILITY OF ALTERNATE SOURCE OF WATER 4-2
4.6 CLASSIFICATION OF ADJACENT SURFACE WATERS 4-2
4.7 PROBABILITY FOR USE AS A PUBLIC WATER SUPPLY SOURCE 4-2
4.8 OTHER FACTORS RELEVANT TO DETERMINE THE MAXIMUM BENEFICIAL USE OF THE GROUNDWATER 4-3
5.0 REFERENCES 5-1
LIST OF FIGURES
Figure 1 Site Locus Map
Figure 2 Site Plan
Figure 3 Cross Section Plan Map
Figure 4 Cross Section A – A’
Figure 5 Cross Section B – B’
iv
Figure 6 Cross Section C – C’
Figure 7 Shallow Groundwater Elevation Contour Map – June 2013
Figure 8 Deep Groundwater Elevation Contour Map – June 2013
Figure 9 Tetrochloroethene Contour Map – June 2013
Figure 10 Trichloroethene Contour Map – June 2013
Figure 11 Cis-Dichloroethene Contour Map – June 2013
Figure 12 Conceptual Site Model
Figure 13 Proposed Area for Groundwater Reclassification
Figure B-1 Properties Within Groundwater Reclassification Area
Figure B-2 Properties Abutting Groundwater Reclassification Area
LIST OF TABLES
Table 1 Groundwater Gauging Summary
Table 2 Groundwater Vertical Gradient Data
Table 3 Hydraulic Conductivity Data
Table 4 Groundwater Analytical Results
Table 5 Summary of Physical and Chemical Properties of COCs
Table B-1 Groundwater Reclassification Property List
Table B-2 Abutter Property List
LIST OF APPENDICES
Appendix A Signed Petition Letter
Appendix B Landowner Information
Appendix C PCE, TCE & cDCE Time Series Plots
Appendx D Stagnation Point Calculation
v
LIST OF ACRONYMS
bgs below ground surface
CAFI Corrective Action Feasibility Investigation
CAP Corrective Action Plan
cDCE cis-1,2-dichloroethene
CO2 carbon dioxide
COC constituent of concern
DNAPL dense non-aqueous phase liquid
EPA Environmental Protection Agency
ERM Environmental Resources Management
GE General Electric
Hg mercury
Koc organic carbon partition coefficient
mm milimeter
MNA monitored natural attenuation
MSL mean sea level
PCE tetrachloroethene
SARA Superfund Amendments and Reauthorization Act
SIR Site Investigation Report
TCA 1,1,1-trichloroethane
UST underground storage tank
VOC volatile organic compound
VSA Vermont Statutes Annotated
VT DEC Vermont Department of Environmental Conservation
vi
VT GWQSs Vermont Primary Groundwater Quality Enforcement Standards
ERM 1-1 GE AVIATION/0209887
1.0 INTRODUCTION
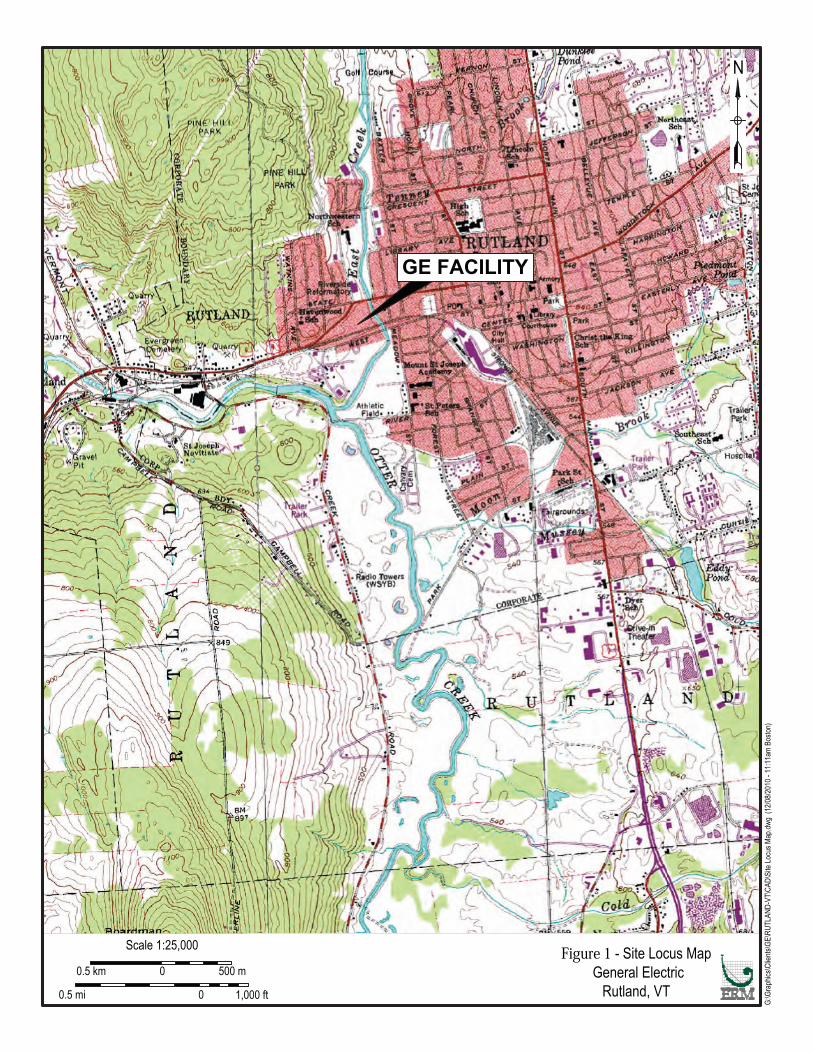
Pursuant to Chapter 12 of the Environmental Protection Rules: Vermont Groundwater Protection Rule and Strategy (Groundwater Protection Rule) (VT DEC, 2005), Environmental Resources Management (ERM) has prepared this document in support of the General Electric Company’s (GE’s) request that groundwater beneath and in the vicinity of GE Plant #1 located at 210 Columbian Avenue in Rutland, VT (the Facility) (Figure 1) be reclassified from Class III to Class IV. In accordance with the Groundwater Protection Rule, subchapter 4, 12-401(1), all groundwater of the state is classified as Class III unless reclassified by the Secretary.
Vermont Statutes Annotated (VSA) 1394(a) defines Class III groundwater as “suitable as a source of water for individual domestic water supply, irrigation, agricultural use and general industrial and commercial use.” Class IV groundwater is defined as “Not suitable as a source of potable water but suitable for some agricultural, industrial and commercial use.” Determinations made by Vermont Department of Environmental Conservation (VT DEC) would consider current groundwater quality and the potential future use of groundwater in a particular area as a public water supply source.
The remainder of this document presents the following information to support the VT DEC’s review of GE’s groundwater reclassification petition:
A brief Site (hereinafter defined) description and history; A summary of ongoing environmental management activities at the
Site; Site geology and hydrogeology; A summary of the source, nature, and extent of impacts to
environmental media at the Site; A summary of fate and transport processes; The conceptual site model (CSM); and A summary of additional information required to satisfy the
Procedures for Class IV Groundwater Reclassification (VT DEC, 2000).
ERM 2-1 GE AVIATION/0209887
2.0 GROUNDWATER RECLASSIFICATION ADMINISTRATIVE INFORMATION
In accordance with the Procedure for Class IV Groundwater Reclassification (VT DEC, 2000), a signed petition requesting reclassification is included in Appendix A. The names and addresses of all owners of parcels proposed for reclassification are included Appendix B, Table 1 and Figure B-1. The names and addresses of all landowners abutting the parcels proposed for reclassification are included in Appendix B, Table 2 and Figure B-2.
2.1 SITE DESCRIPTION
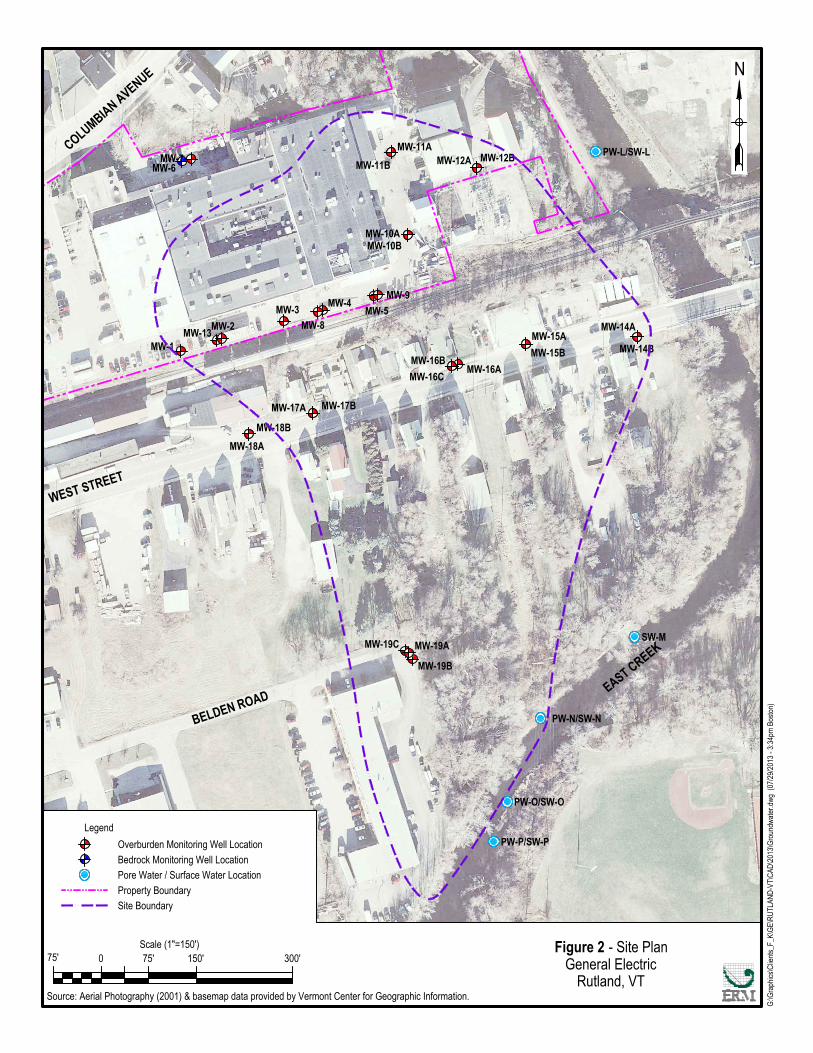
The Site is defined to include the Facility at 210 Columbian Avenue in Rutland and various properties located to the south terminating at the north bank of East Creek. The Site boundary and GE property boundary are presented on Figure 2.
The Facility is currently operational and consists of one main building (Plant #1) and several support buildings on an 8-acre parcel. The main building footprint comprises 105,466 square feet with the supporting buildings covering an additional 11,846 square feet in total. The majority of the remainder of the property is paved.
The Facility is located in an industrial zone and is abutted by residential properties to the north and west, railroad tracks to the immediate south, with residential and commercial properties located farther to the south. East Creek is located to the east, with a vacant lot and industrial/commercial properties located farther to the east.
Based on information obtained from the Clerk’s Office of the City of Rutland, the property was owned by United/Columbian Marble Corporation until 1943. The property was then sold to Champlain Valley Fruit Company in 1943, Great American Industries in 1944, Cineflex Corporation in 1946 and Tambrands (formerly Tampax, Inc.) in 1947. Tampax, Inc. sold the property to GE in 1957.
2.2 SITE HISTORY
Based on a review of available property ownership records, the Facility was used until 1943 for performing final marble cuts for the United/Columbian Marble Company. It is not clear what types of
ERM 2-2 GE AVIATION/0209887
operations occurred at the property between 1943 and 1957. GE has owned and occupied the Facility since 1957. ERM was informed that since occupation of the Facility, GE has used the property to manufacture jet engine blades. Manufacturing operations include metal forging, milling and grinding.
Historical hazardous waste usage prior to GE ownership in 1957 is unknown. During past GE operations, 1,1,1-trichloroethane (TCA) was used at the Facility in wiping applications and in emulsions used during metal forging. TCA has been detected in soil and groundwater, but has not been identified as a constituent of concern (COC). TCA use was discontinued in approximately 2002 and water-based solvents are currently in use. The COCs detected in soil and groundwater at the Site are tetrachloroethene (PCE), trichloroethene (TCE) and cis-1,2-dichloroethene (cDCE). Based on discussions with GE personnel, there is no knowledge or records of PCE, TCE or cDCE having been used at the Facility during GE’s ownership history.
Hazardous materials used in manufacturing or other processes at the Facility are stored at point of use locations and in the designated hazardous waste storage areas. Hazardous waste, bulk waste oil and bulk chemical storage areas are located in three separate buildings to the east of the main building.
Hazardous waste streams for the Facility are documented in the following reports and permits:
Superfund Amendments and Reauthorization Act (SARA) Form R updated annually for the Facility every July;
Tier 2 Community Right to Know updated annually for the Facility every February;
Water Discharge Permit issued by the Environmental Protection Agency (EPA)/ VT DEC on 1 April 2007, and;
Air Construction Permit issued by the VT DEC on 18 January 2005.
ERM 2-3 GE AVIATION/0209887
2.3 SHORT- AND LONG-TERM MANAGEMENT OF THE SITE
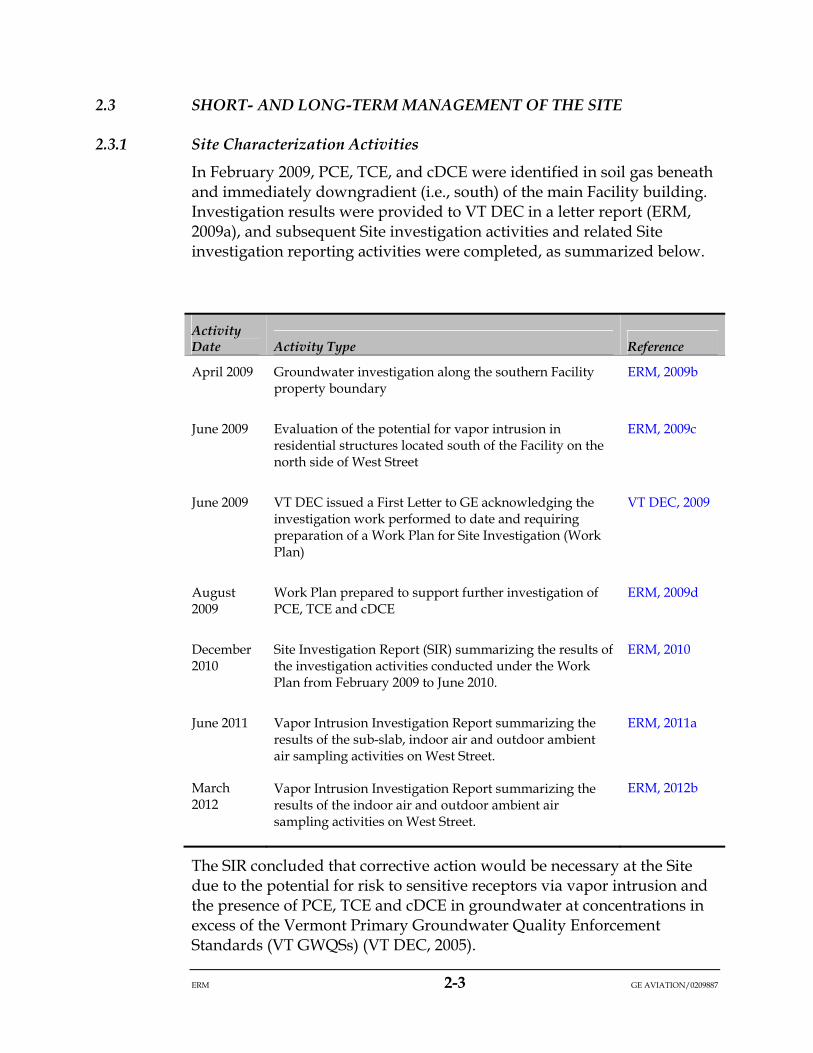
2.3.1 Site Characterization Activities
In February 2009, PCE, TCE, and cDCE were identified in soil gas beneath and immediately downgradient (i.e., south) of the main Facility building. Investigation results were provided to VT DEC in a letter report (ERM, 2009a), and subsequent Site investigation activities and related Site investigation reporting activities were completed, as summarized below.
Activity Date Activity Type Reference
April 2009 Groundwater investigation along the southern Facility property boundary
ERM, 2009b
June 2009 Evaluation of the potential for vapor intrusion in residential structures located south of the Facility on the north side of West Street
ERM, 2009c
June 2009 VT DEC issued a First Letter to GE acknowledging the investigation work performed to date and requiring preparation of a Work Plan for Site Investigation (Work Plan)
VT DEC, 2009
August 2009
Work Plan prepared to support further investigation of PCE, TCE and cDCE
ERM, 2009d
December 2010
Site Investigation Report (SIR) summarizing the results of the investigation activities conducted under the Work Plan from February 2009 to June 2010.
ERM, 2010
June 2011
March 2012
Vapor Intrusion Investigation Report summarizing the results of the sub-slab, indoor air and outdoor ambient air sampling activities on West Street.
Vapor Intrusion Investigation Report summarizing the results of the indoor air and outdoor ambient air sampling activities on West Street.
ERM, 2011a
ERM, 2012b
The SIR concluded that corrective action would be necessary at the Site due to the potential for risk to sensitive receptors via vapor intrusion and the presence of PCE, TCE and cDCE in groundwater at concentrations in excess of the Vermont Primary Groundwater Quality Enforcement Standards (VT GWQSs) (VT DEC, 2005).
ERM 2-4 GE AVIATION/0209887
Following the SIR, a Corrective Action Feasibility Investigation (CAFI) was completed and submitted to VT DEC in July 2011 (ERM, 2011b). The CAFI Report was approved by the VT DEC in an email dated 26 July 2011. The CAFI recommended implementation of the following remedial alternatives:
Abatement in selected residential structures to mitigate the potential for vapor intrusion downgradient of the Facility;
Indoor air monitoring in selected residential structures to evaluate temporal changes in the potential for vapor intrusion downgradient of the Facility; and
Monitored natural attenuation (MNA) to address PCE, TCE and cDCE impacts to groundwater over the entire Site.
A Corrective Action Plan (CAP), dated 25 July 2012 (ERM, 2012c) and amended on 20 June 2013 (ERM, 2013a), documents the design of the remedial measures to be implemented at the Site to achieve a condition of No Significant Risk. The CAP and CAP Addendum were approved by VT DEC on 13 June 2012 and 28 June 2013, respectively.
2.3.2 Residential Abatement
Residential abatement via installation of vapor mitigation systems will mitigate the potential risk of vapor intrusion by reducing the ability of sub-slab soil gas to enter the basement and first-floor indoor air. With property owner approval, vapor mitigation systems will be installed in residential structures on each of the following four properties in September and October 2013:
300 West Street;
301 West Street;
303 West Street; and
305 West Street.
2.3.3 Indoor Air Sampling Program
Indoor air monitoring will continue in winter 2014 at 299, 308 and 311 West Street to further assess the potential vapor intrusion pathway and potential for risk to receptors (current and future residents) from exposure to PCE, TCE and cDCE. Following completion of each vapor intrusion sampling event for each of these properties, a decision will be made in
ERM 2-5 GE AVIATION/0209887
conjunction with the VT DEC to (a) mitigate, (b) discontinue monitoring (i.e., no further action) or (c) continue to monitor.
2.3.4 MNA of Groundwater
Groundwater monitoring activities are currently ongoing and will continue as part of the MNA remedy. Currently, groundwater samples are being collected quarterly and submitted for laboratory analysis of VOCs via EPA Method 8260. Groundwater sampling results are submitted to VT DEC following each sampling event as well as summarized in a report on a biannual basis. The groundwater monitoring plan will be updated, as necessary, with approval from VT DEC.
ERM 3-1 GE AVIATION/0209887
3.0 TECHNICAL INFORMATION
Site characterization activities have been conducted since 2009. The majority of these activities and their associated results are presented in the SIR (ERM, 2010) as well as in the subsequent groundwater monitoring reports (ERM, 2011c, 2011d, 2011e, 2012a, 2012d, 2012e, 2012f, 2013b). A summary of pertinent information from these reports is presented below.
3.1 REGIONAL & SITE GEOLOGY
The Vermont Geological Survey bedrock map of the Rutland Quadrangle (Ratcliffe, 1998) and the Vermont Center for Geographic Information website indicate that the Facility property is underlain by medium- to dark-grey dolostone of the Lower Cambrian Dunham Dolomite. Dolostone was observed beneath the Facility during bedrock drilling activities.
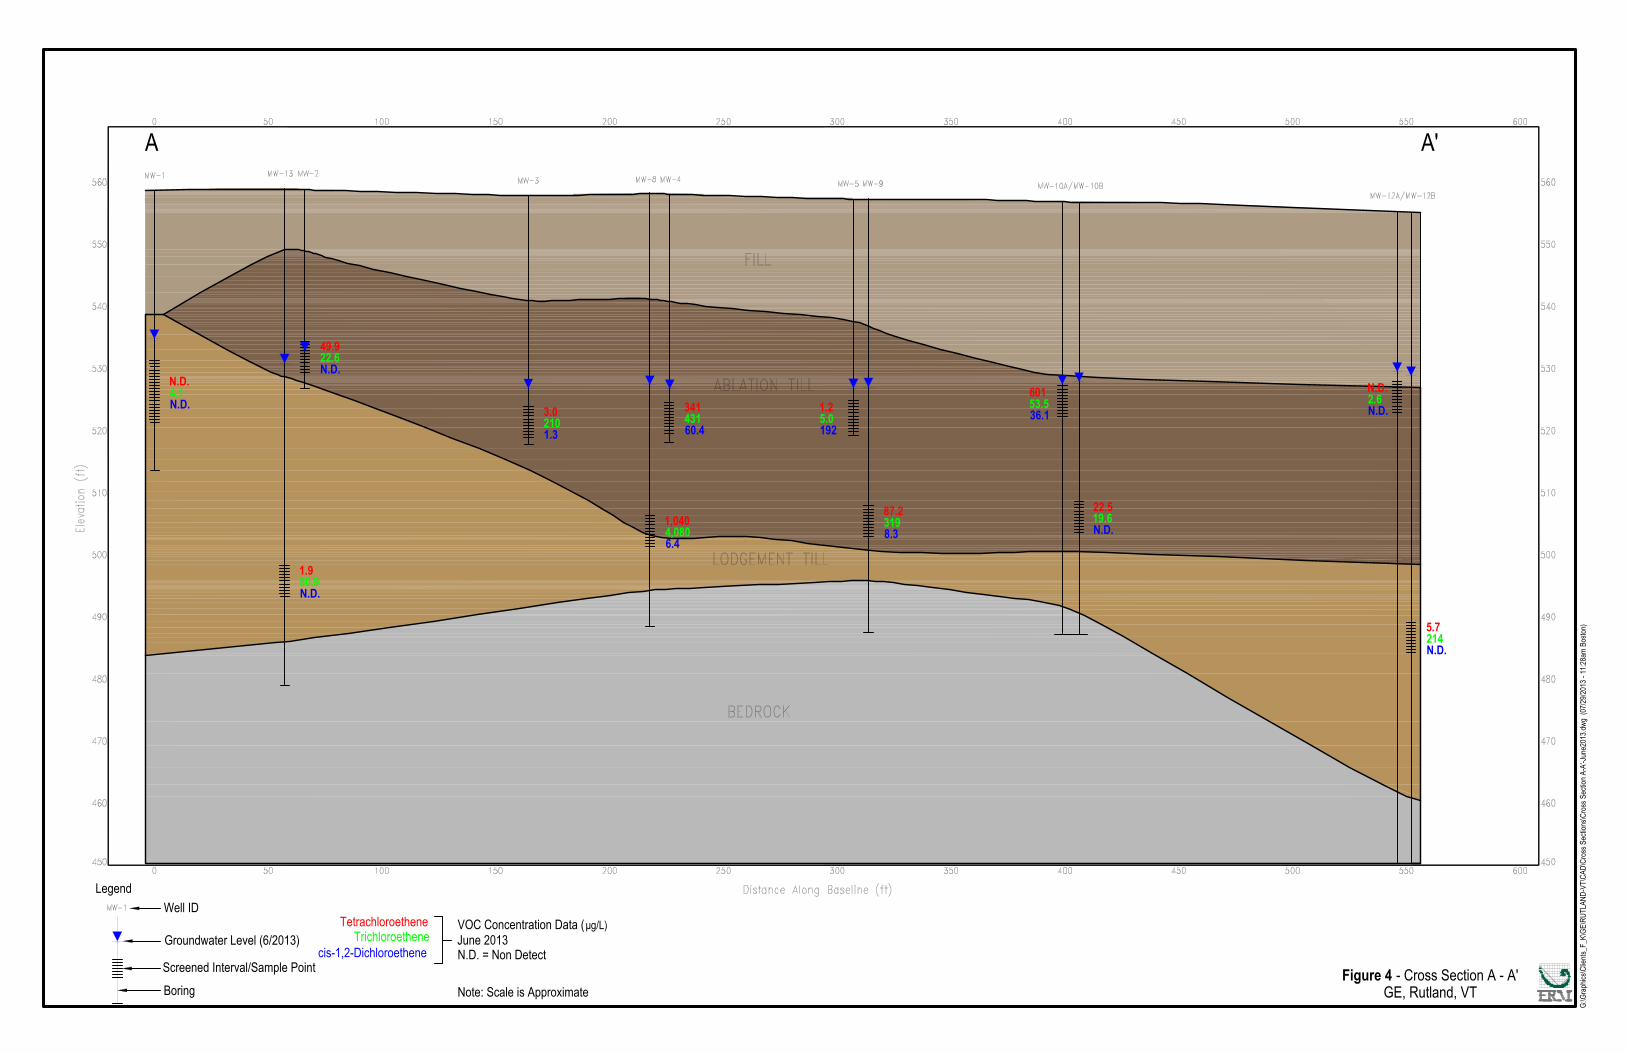
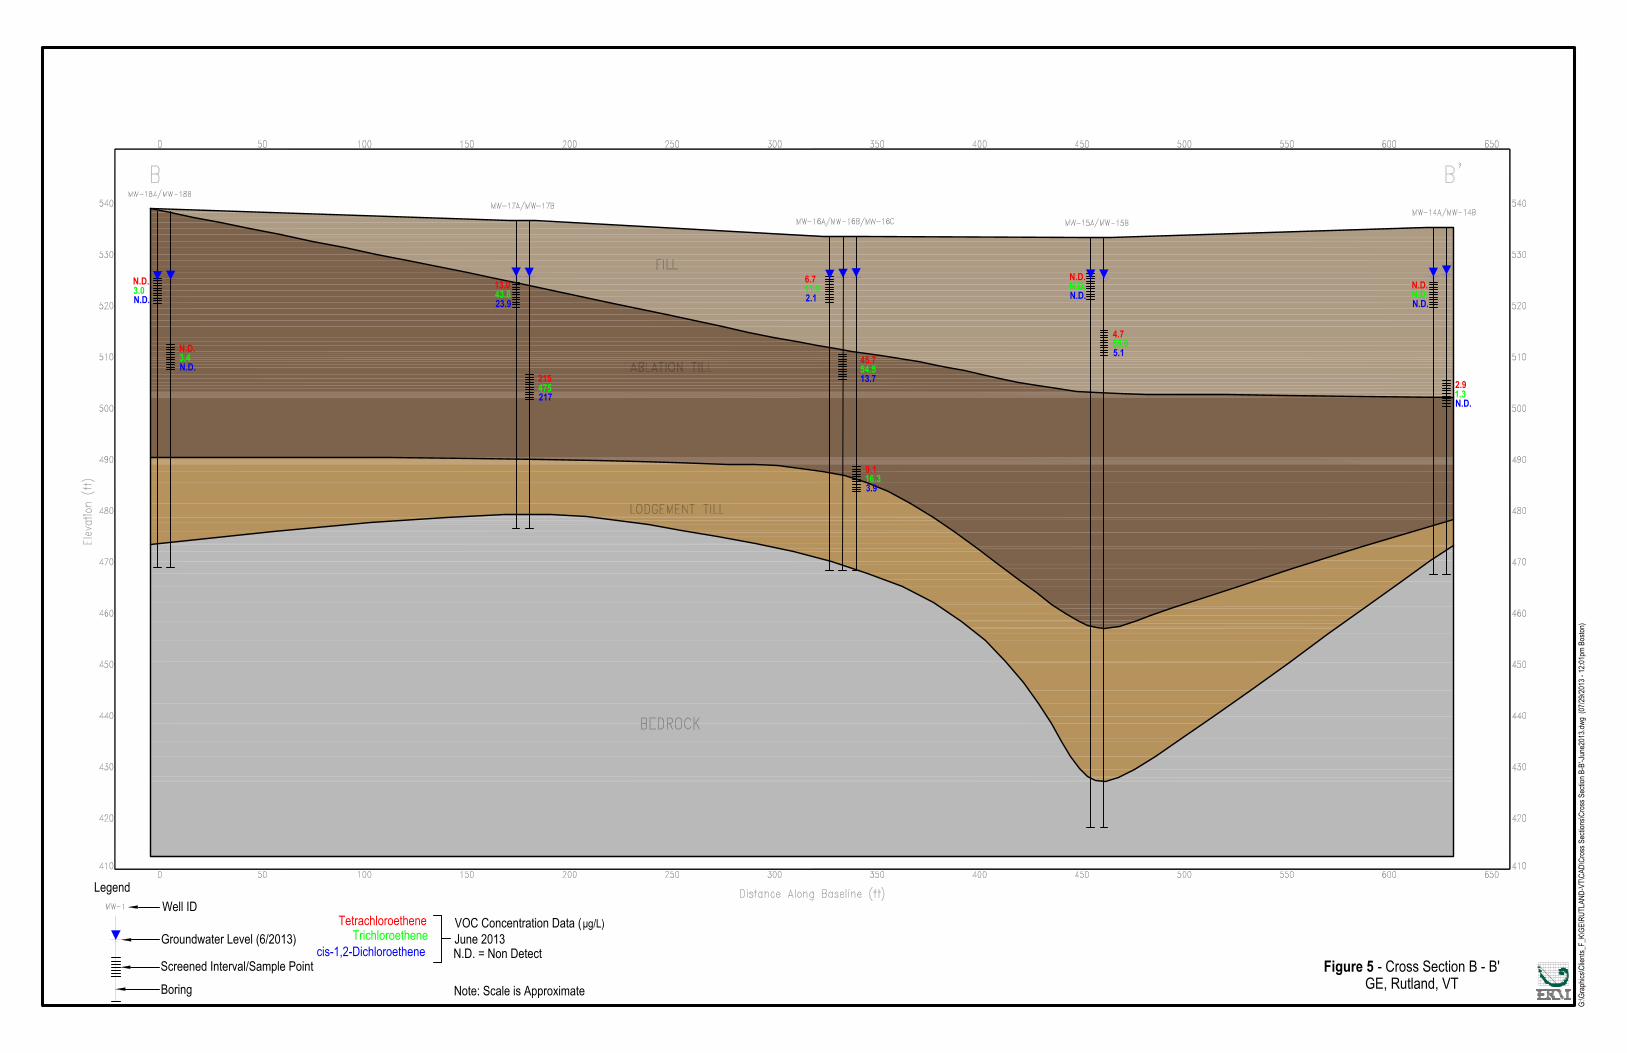
Interpretation of overburden geology is based on geologic data from soil borings advanced at the Facility and along West Street. The Facility property is located on an upland area that has been leveled using various types of fill. South of the Facility property boundary, the topography abruptly drops approximately 10 feet to railroad tracks and then an additional 20 feet to the elevation of West Street. As a result of this topographic change, observed shallow subsurface conditions beneath the Facility are moderately different than conditions observed beneath West Street. The deeper geologic sequence is similar in both areas. Surficial geology consists of the following geologic units, from shallowest to deepest:
Facility shallow subsurface: Fine to medium sand with gravel and cobbles, poorly sorted with fragments of machined marble from historical activities (approximately 12 to 28 feet thick). At some locations, the man-made fill is underlain by a silt or silty sand approximately 1 to 14 feet thick.
West Street shallow subsurface: Poorly sorted medium- to coarse-grained sand with some gravel in the vicinity of East Creek. This unit fines to a poorly sorted silty sand in the westernmost boring along West Street. This layer ranged from approximately 12 to 31 feet thick, but was not observed at MW-18.
ERM 3-2 GE AVIATION/0209887
Ablation Till: Medium brown, poorly sorted, loose sand and gravel with some silt. This layer ranged from approximately 20 to 48 feet thick, but was not observed at MW-1.
Lodgement Till: Light brown to light grey, poorly sorted, medium dense silt and sand with gravel and cobbles (including quartzite cobbles). This layer ranged from approximately 2.5 to 43 feet thick.
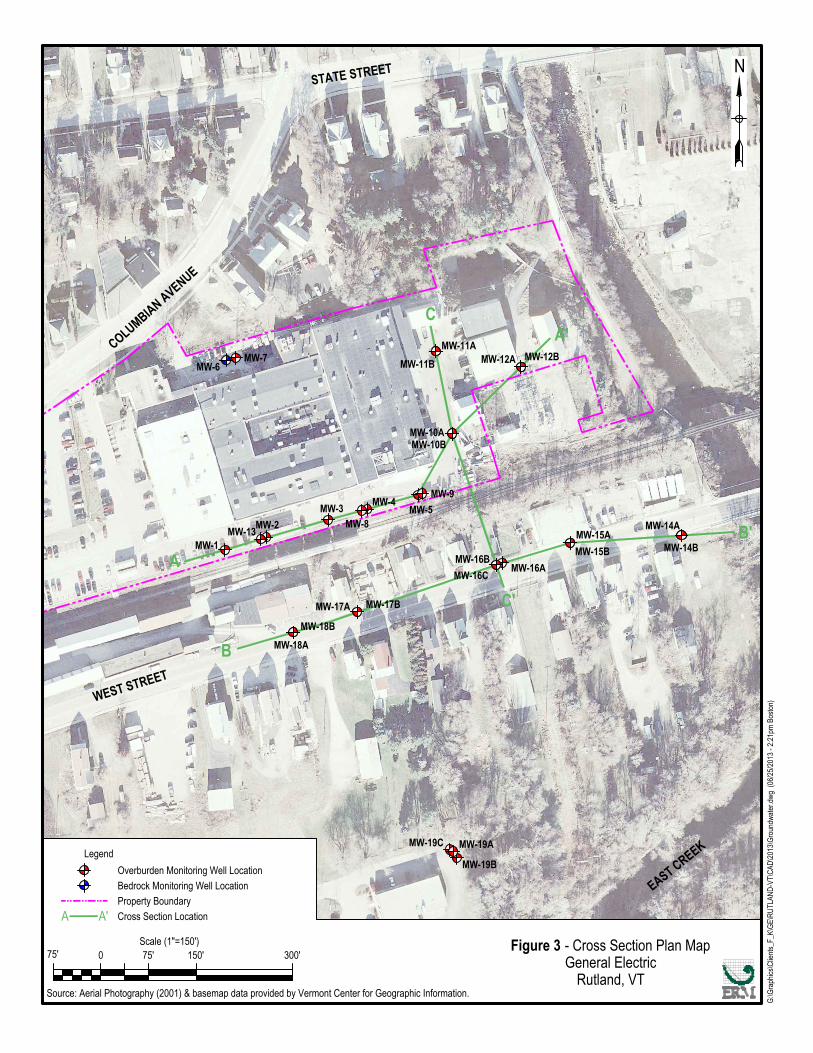
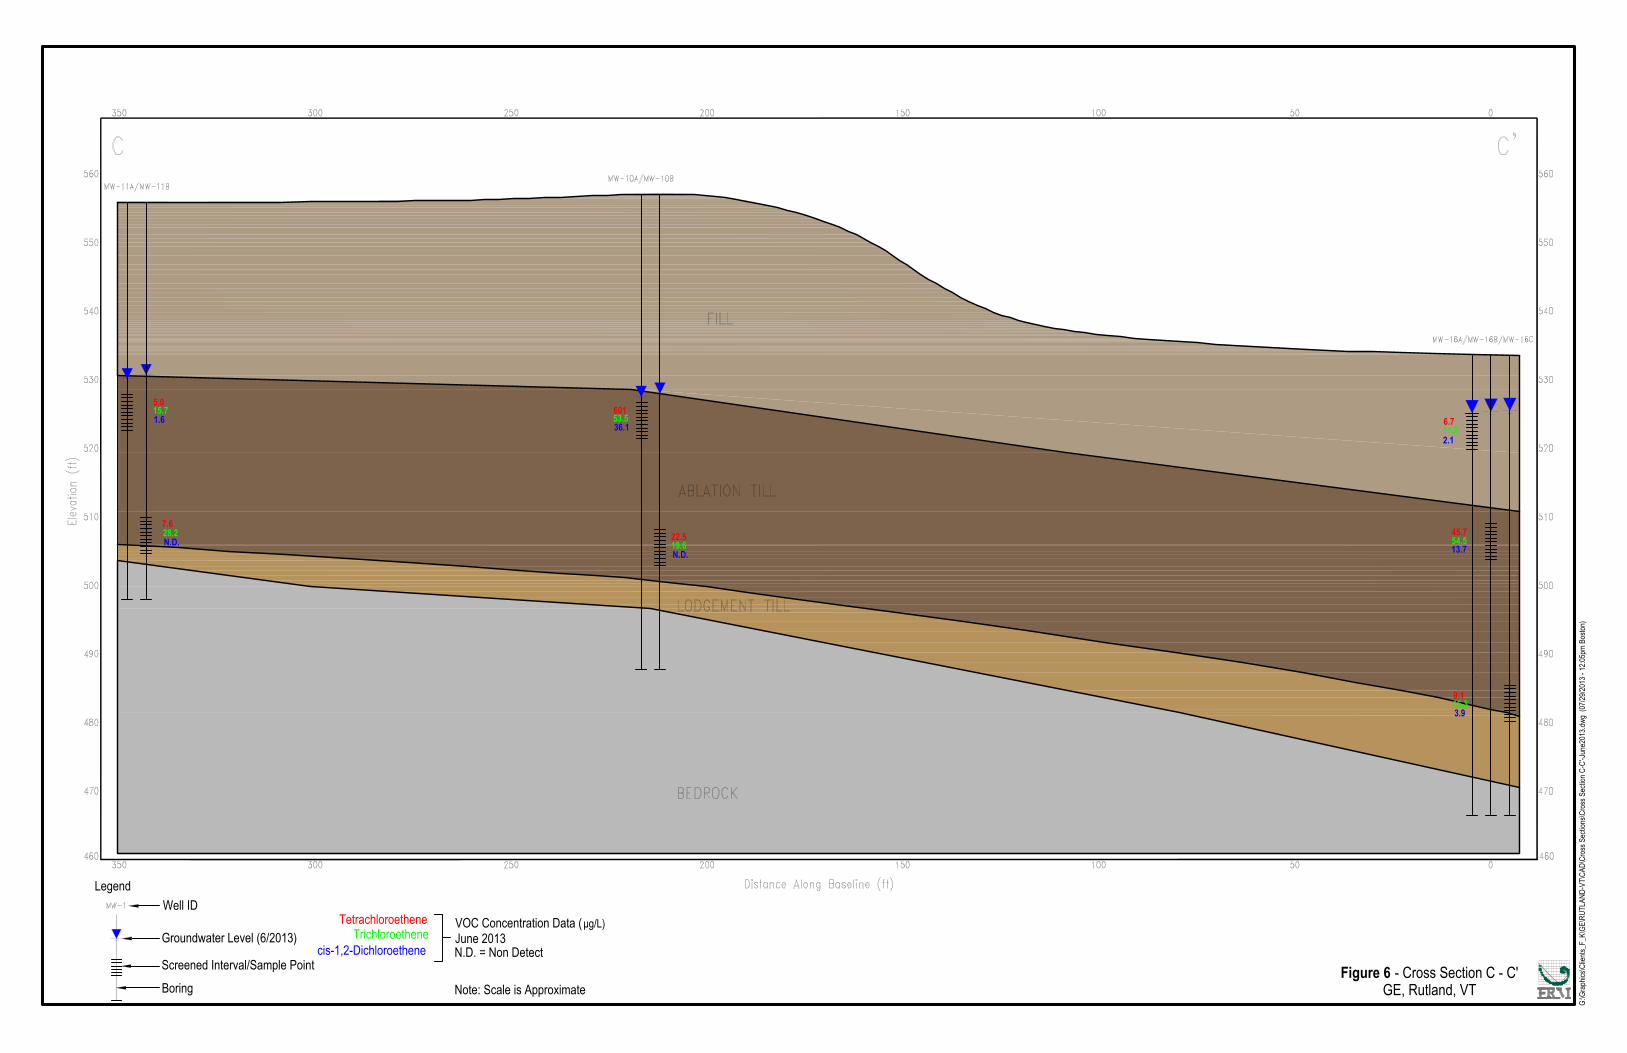
The lodgement till is thickest in an apparent incised paleochannel, which roughly parallels East Creek near the eastern Facility property boundary. A geologic cross section location map is presented as Figure 3 and three geologic cross sections with the most recent groundwater analytical results (June 2013) are shown in Figure 4 through Figure 6.
3.2 REGIONAL & SITE HYDROGEOLOGY
An interpretation of regional groundwater flow direction in the overburden was developed based on review of the applicable topographic map. As shown on Figure 1, topography in the vicinity of the Site generally slopes from the uplands northwest of the Facility to the river valley south and east of the Facility. Thus, the direction of regional groundwater flow is expected to be towards the south-southeast in the vicinity of the Site.
East Creek is located approximately 30 feet east of the Facility’s eastern boundary and flows from the north to the south and then turns to the southwest. East Creek flows into Otter Creek approximately 2,000 feet south of the Facility, where Otter Creek flows to the west.
Stone Environmental, Inc. (SEI, 2008a) conducted a mini-piezometer study in East Creek, including locations ranging from east of the Facility to approximately 600 feet north of the confluence of East Creek with Otter Creek. The results of this study indicated that the reach of East Creek located east of the Facility is a “losing” stream (i.e., surface water recharges groundwater) and that the reach of East Creek located to the south of the Facility is a “gaining” stream (i.e., groundwater recharges surface water). Thus, East Creek is a recharge boundary east of the Facility and a discharge boundary south of the Facility.
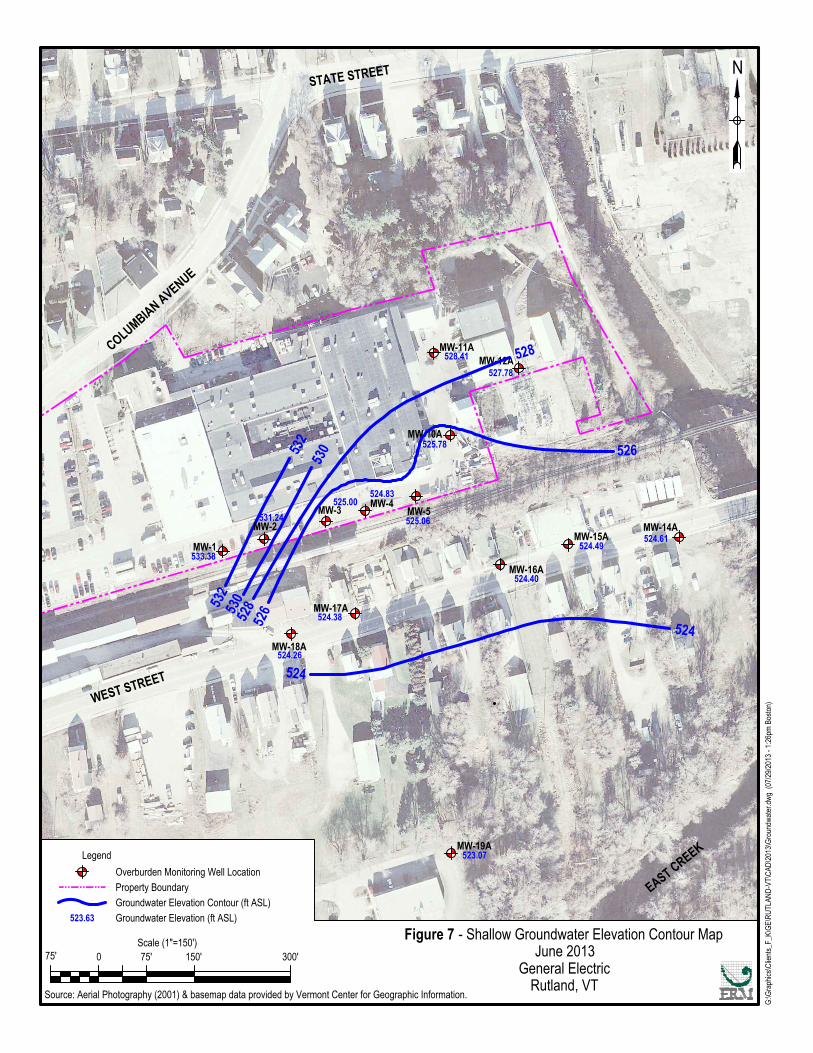
Groundwater elevations in Site wells have been gauged multiple times since April 2009. A summary of groundwater monitoring well gauging data is provided in Table 1. Figure 7 depicts the shallow groundwater surface across the Site, based on groundwater elevation data collected in June 2013 from monitoring wells screened across the water table. As
ERM 3-3 GE AVIATION/0209887
shown on this figure, shallow groundwater flows generally to the south-southeast.
During June 2013, the shallow groundwater elevations ranged from 533.38 feet above mean sea level (MSL) in MW-1 to 523.07 feet above MSL in MW-19A (Figure 7). The change in groundwater elevation of 10.31 feet over a distance of 560 feet yields a hydraulic gradient of approximately 0.02 feet per foot (ft/ft) for groundwater in shallow overburden. The horizontal hydraulic gradient for shallow groundwater has remained relatively consistent since 2009.
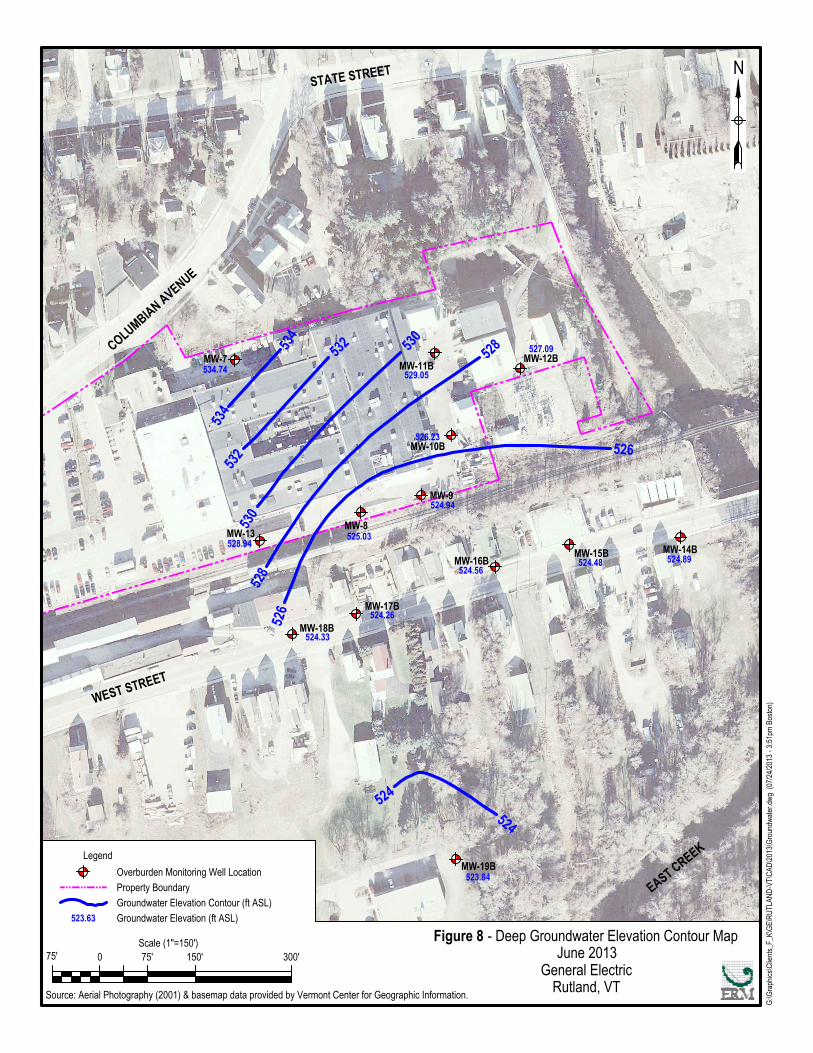
Figure 8 depicts the groundwater elevation contours from June 2013 for deeper wells screened at elevations in the overburden similar to each other. As shown on this figure, deeper groundwater flows generally to the south. The groundwater elevations in deeper overburden ranged from 534.74 feet above MSL at MW-7 to 523.84 feet above MSL at MW-19B. The change in elevation of 10.90 feet over a distance of 860 feet yields a hydraulic gradient of approximately 0.01 ft/ft for groundwater in deeper overburden. The horizontal hydraulic gradient for deeper groundwater has remained relatively consistent since 2009.
Eleven well couplets and two well clusters were installed at the Site. Groundwater gauging data for shallow and deep groundwater wells were used to determine vertical hydraulic gradients (Table 2). Evaluation of vertical hydraulic gradient data indicates a general downward groundwater flow gradient at the following well couplet locations: MW-7/MW-6, MW-12A/MW-12B, MW-2/MW-13, MW-5/MW-9, and MW-17A/17B. A general upward vertical hydraulic gradient was noted at the following monitoring well couplets and clusters: MW-4/MW-8, MW-10A/MW-10B, MW-11A/MW-11B, MW-14A/MW-14B, MW-15A/MW-15B, MW-16A/MW-16B/MW-16C, MW-18A/MW-18B and MW-19A/MW-19B/MW-19C.
Hydraulic conductivity values range from 2.8 x 10⁻⁵ centimeters per second (cm/s) to 2.1 X 10⁻² cm/s (8.0 x 10⁻² feet per day [ft/day] to 59 ft/day), with a geometric mean hydraulic conductivity of 2.5 x 10⁻³ cm/s (7.1 ft/day) (Table 3). Using Darcy’s Law, the calculated average groundwater flow velocity is approximately 3.8 x 10⁻⁴ cm/s (1.1 ft/day). The velocity was calculated using the following equation:
v = (K (dh / dl) / ne
Where: dh/dl = 0.02 (unitless)
ERM 3-4 GE AVIATION/0209887
ne = arithmetic mean of 0.13 (unitless)
K = geometric mean of 2.5 x 10⁻³ cm/s (7.1 ft/day)
Due to the subsurface heterogeneity of the till units, there will be localized areas where groundwater velocities will be higher or lower than the average velocity calculated above.
3.3 SOURCE AREAS
No specific release mechanisms have been identified at the Facility. PCE, TCE and cDCE are not currently used at the Facility, nor have they been used in the recent past. Therefore, there is a low likelihood of an ongoing source of release at the Facility. The source(s) of COC impacts to subsurface media is likely attributable to localized use, storage, and/or spilling of PCE and TCE at the Facility in the mid- to late-twentieth century. No specific areas of concern have been identified.
3.4 NATURE OF CONTAMINATION
The COCs at the Site are PCE, TCE and cDCE. PCE and TCE are primary solvents commonly used in manufacturing activities. The constituent cDCE is a biological degradation product of TCE. TCE is also a biological degradation product of PCE, in addition to being a primary solvent.
3.5 EXTENT OF IMPACT
3.5.1 Soil
An extensive soil sampling and analysis program was conducted to support delineation of COC impacts to soil and groundwater at the Site. Soil analytical results are presented in the SIR (ERM, 2010). PCE and TCE impacts to soil exist at the Facility outside the southern and eastern portions of the main building (no soil sampling has been conducted beneath the Facility buildings due to facility operations and access constraints). cDCE impacts to soil were only present outside the southeastern corner of the main Facility building. PCE and TCE were detected in soil samples collected from borings located along West Street. The majority, if not all, of these samples were collected from within the saturated zone and are reflective of impacts to groundwater. PCE and TCE were not detected in the shallowest soil samples collected along West Street (5.5 to 9 feet below ground surface [bgs]; i.e., within the vadose zone). PCE, TCE and cDCE were not detected in soil samples collected
ERM 3-5 GE AVIATION/0209887
from borings B-14 and B-18, which are the eastern- and western-most borings located on West Street.
3.5.2 Groundwater
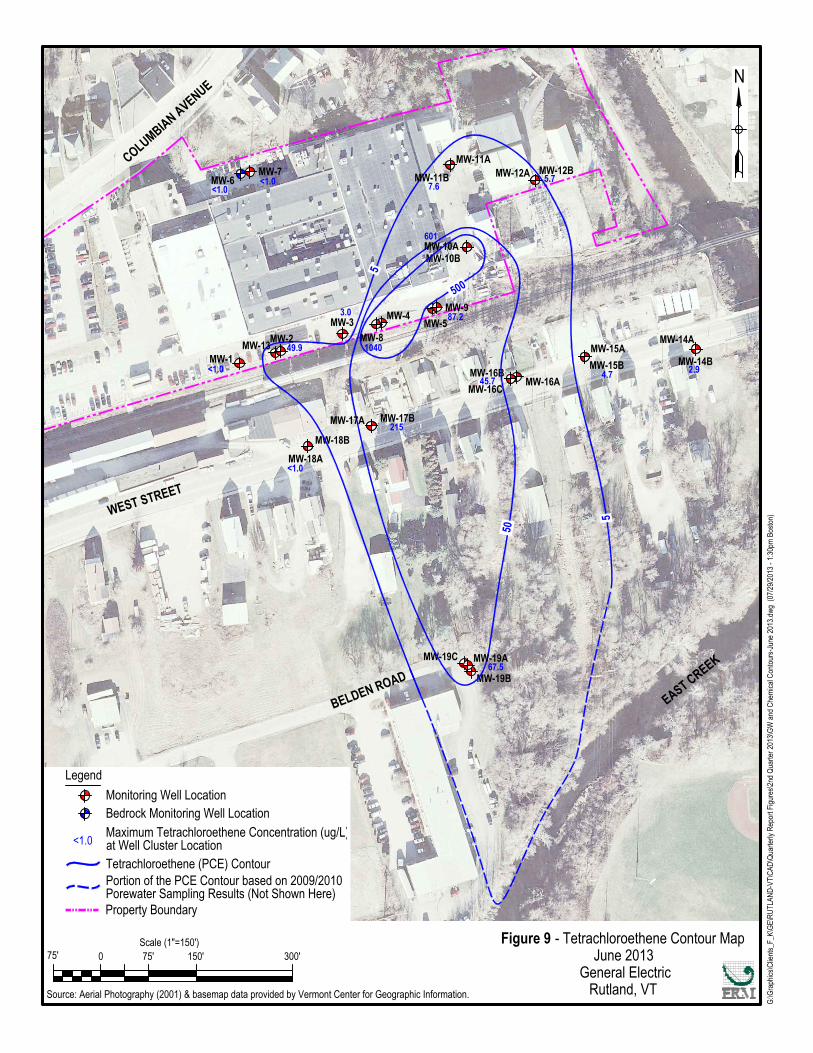
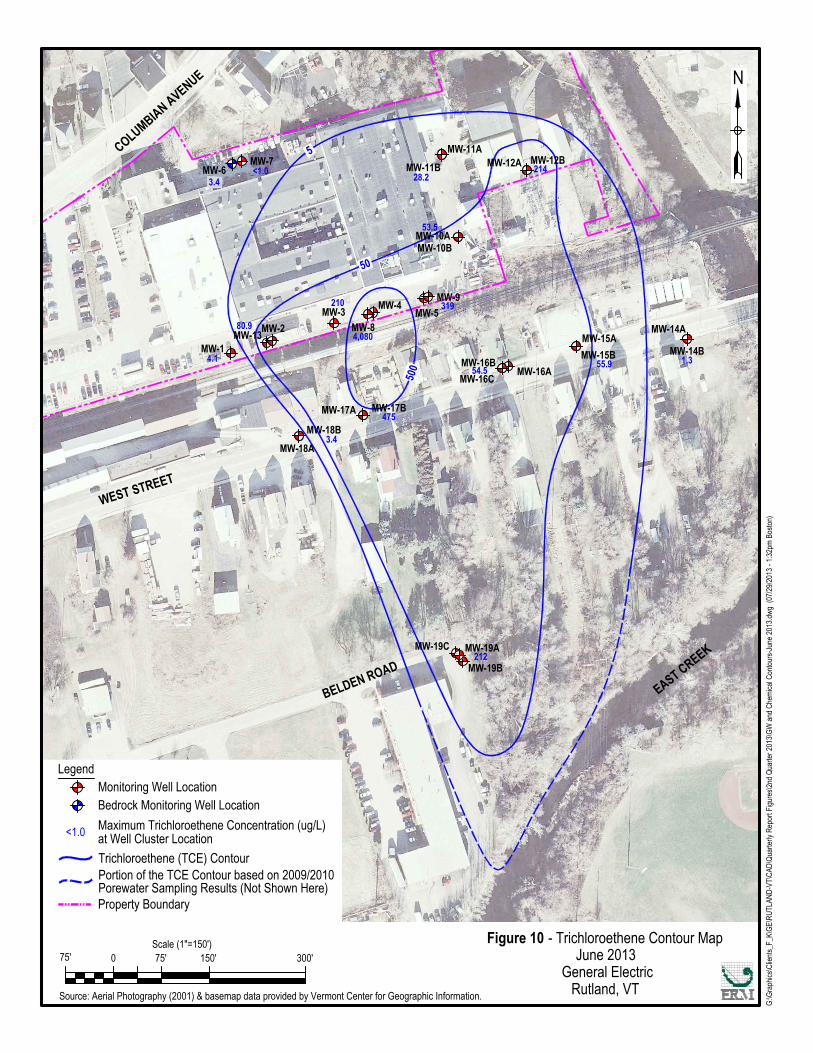
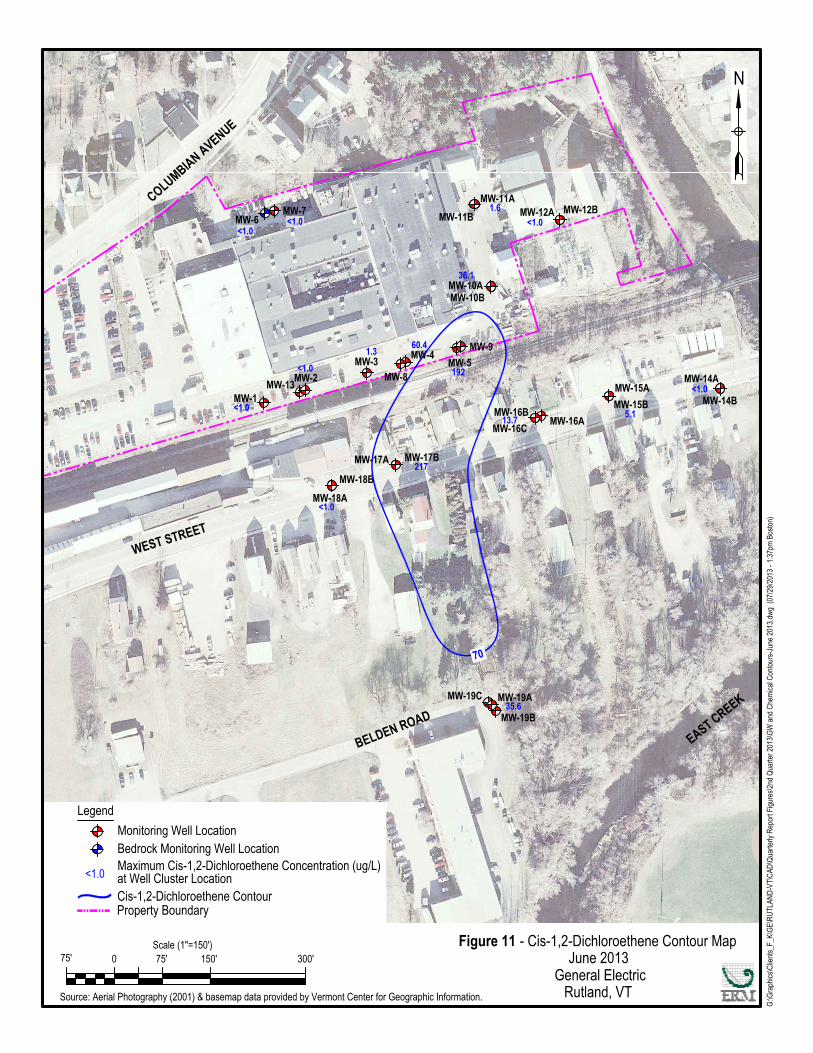
Groundwater analytical results indicate that a dissolved-phase plume containing PCE, TCE and cDCE migrates from the Facility in a southerly direction to East Creek. Concentration contour maps illustrating the lateral distribution of PCE, TCE and cDCE in groundwater at the Site in June 2013 are provided in Figures 9, 10 and 11, respectively. Maximum concentrations at each well couplet or cluster were used to create conservative lateral distribution of COCs. Groundwater analytical results are presented in Table 4.
COC impacts to groundwater are generally present throughout the overburden deposits. The lateral extent of COC impacts to groundwater was defined using groundwater samples collected from the existing monitoring well network. The vertical extent of impacts to groundwater in overburden was defined using the saturated zone soil analytical results generated during borehole advancement (ERM, 2010).
Based on analysis of time-series data plots presented in Appendix C, increasing, decreasing and stable COC concentration trends have been observed in various Site wells. In general, wells exhibiting increasing concentration trends are located adjacent to wells exhibiting decreasing concentration trends, suggesting that the plume core may be shifting due to temporal fluctuations in the groundwater flow regime. However, evaluation of COC concentration data over time demonstrates that the lateral extent of the plume has not changed and that the COC concentrations are generally consistent with historical data.
Statistical Analysis of Groundwater Data
The lateral extent of COC impacts in groundwater has been used to determine the boundary of the reclassification area included in this petition. The Procedure for Class IV Groundwater Reclassification (VT DEC, 2000) references the Groundwater Protection Rule and Strategy (VT DEC, 2005), section 12-706(2) regarding use of the 95% statistical confidence level to determine exceedance of the VT GWQSs. This section also states that if “sampling clearly indicates the [VT GWQSs] have been or will be met or exceeded, the Secretary may determine that the standard has been reached or exceeded without calculating a 95% confidence level.” Review of groundwater analytical results presented in Table 4 indicates that PCE, TCE and cDCE concentrations in groundwater have consistently exceeded the VT GWQSs in several Site wells since monitoring was
ERM 3-6 GE AVIATION/0209887
initiated in 2009. As such, statistical analysis of the data was not conducted to determine monitoring wells in exceedance of the VT GWQSs.
3.5.3 Surface Water
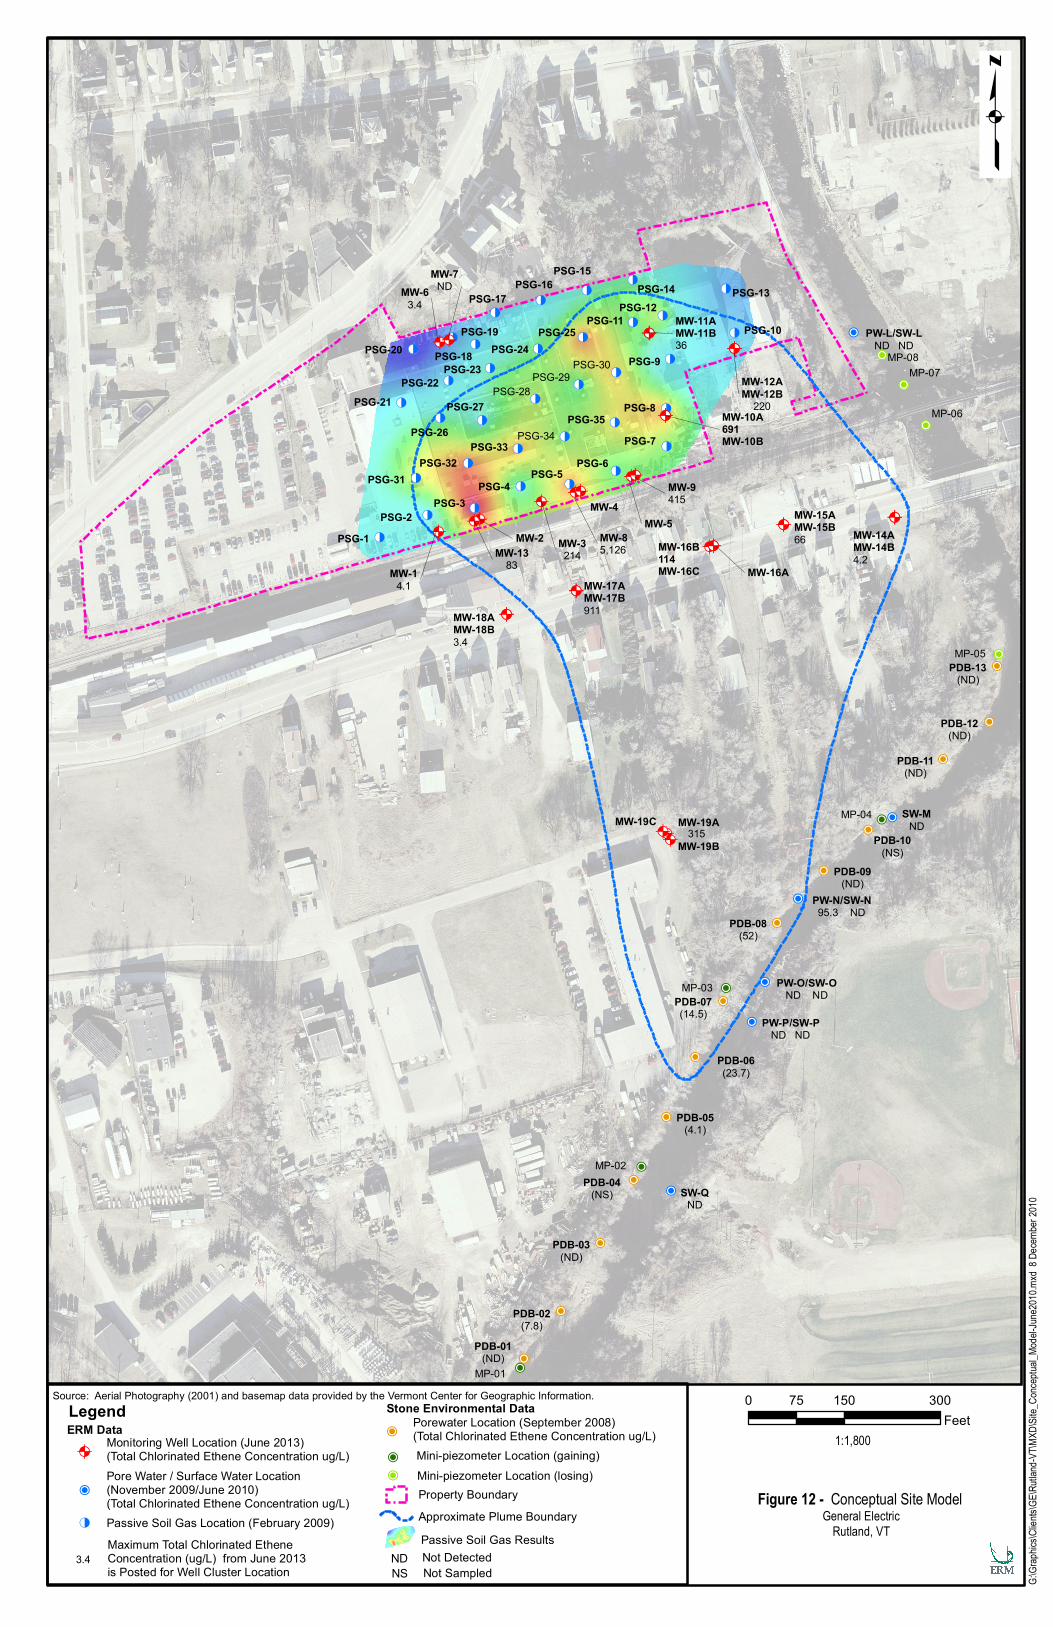
No VOCs were detected in surface water samples collected from East Creek (Figure 12). However, PCE, TCE and cDCE were detected in one of the pore water samples collected from beneath East Creek, at a location south of the Facility, confirming that the COCs in groundwater discharge to East Creek south of the Facility (Figure 12).
3.6 ENVIRONMENTAL FATE & TRANSPORT OF SITE COCS
3.6.1 Overview
The principal COCs detected in soil, groundwater, soil gas, and indoor air at the Site are PCE, TCE and cDCE. Therefore, assessment of environmental fate and transport will focus on PCE, TCE and cDCE in these media.
An evaluation of the environmental fate and transport is important to understanding the current distribution of COCs in various media, the migration of constituents between various media, and potential migration pathways and exposure routes. This evaluation considers both the chemical and physical properties of the COCs and how Site-specific physical and chemical factors impact the fate and transport of COCs in the environment.
3.6.2 Physical and Chemical Properties of COCs
The key parameters impacting fate and transport of constituents in the environment include their physical and chemical properties, and degradation pathways, which in turn affect the persistence and mobility of the constituents.
The physical and chemical properties that may affect the relative mobility, retardation, and persistence of constituents detected on the Site include:
Aqueous solubility,
Vapor pressure,
Henry’s Law constant,
ERM 3-7 GE AVIATION/0209887
Viscosity and density, and
Organic carbon partition coefficient (Koc).
Table 5 presents a summary of these properties for PCE, TCE and cDCE.
Aqueous Solubility
The solubility of a compound in water is the maximum concentration of that constituent that will dissolve in water at neutral pH at a given temperature. Higher solubility generally indicates a greater potential for constituent mobility in water. Soluble compounds may be leached from wastes and soils and thereby become mobile in groundwater. The solubility of a constituent may be altered by the presence of other constituents. For example, the presence of high concentrations (e.g., several percent) of a very soluble compound such as acetone or ethanol will increase the effective solubility of less soluble compounds through a process called “co-solvency.” The process of co-solvency is not occurring at the Site.
The Site COCs have solubilities (at 25°C) of 200 milligrams per liter (mg/L) for PCE, 1,100 mg/L for TCE and 3,500 mg/L for cDCE. There is no direct or indirect evidence of the current or historical presence of dense non-aqueous phase liquid (DNAPL) at the Site.
Vapor Pressure
The ability of a compound to volatilize into air is dependent on its vapor pressure. Vapor pressure is an indicator of volatility and is based on the pure constituent partitioning into air at a given temperature. Constituents with low vapor pressure tend to remain in the liquid or solid state, whereas constituents with very high vapor pressures are primarily gaseous at ambient temperatures. PCE, TCE and cDCE, with vapor pressures (at 25°C) ranging from 18.6 millimeters (mm) mercury (Hg) to 201 mm Hg, are highly volatile compounds.
Henry’s Law Constant
Henry's Law constant, which is derived from vapor pressure, solubility, and molecular weight, is a measure of the partitioning of a compound across the liquid-gas interface at equilibrium. A compound with a low Henry's Law constant will tend to remain dissolved in water while a compound with a high Henry's Law constant will have a tendency to partition from water into the vapor phase. The Site COCs have Henry’s Law constants ranging from 4.08 x 10⁻³ atmospheres*cubic meter per mole
ERM 3-8 GE AVIATION/0209887
(atm*m3/mole) for cDCE to 1.77 x 10⁻² atm*m3/mole for PCE. According to these values, PCE has the highest potential to volatilize from groundwater into soil vapor.
Viscosity and Density
Viscosity and density are two physical properties that will affect fluid flow of a free-phase liquid. Viscosity is a measure of a liquid’s resistance to flow. A liquid that is more viscous than water will tend to migrate more slowly than water. A liquid with high viscosity will generally be less mobile than a liquid with low viscosity. Density may counteract the influence of viscosity on mobility. For example, denser separate-phase constituents, such as chlorinated solvents, will migrate downward in an aquifer faster than less dense separate-phase constituents with equivalent viscosity. In the liquid phase, PCE and TCE would be less viscous than water. The densities of PCE and TCE are greater than water, with densities ranging from 1.46 g/cm3 to 1.62 g/cm3, respectively. The viscosity and density of cDCE is not applicable as cDCE will not exist as a separate non-aqueous phase liquid. As there is no evidence of PCE or TCE present as DNAPL, viscosity and density will not affect contaminant migration at the Site.
Organic Carbon Partition Coefficient
The Koc, or soil adsorption coefficient, reflects the mobility of organic constituents in groundwater relative to adsorption onto organic carbon present in the aquifer material. Lower Koc values indicate lower potential for adsorption, and therefore greater mobility. PCE and TCE have moderate Koc values of 263 milliliters per gram (mL/g) and 107 mL/g, respectively. cDCE has a relatively high mobility due to its lower Koc value of 35.5 mL/g.
Degradation Processes
Chlorinated ethenes, such as PCE and TCE, are degraded in soil and groundwater through a number of biological and chemical processes. Under anaerobic reducing conditions, the primary biological degradation process for PCE and TCE is reductive dechlorination in which the chlorinated compounds serve as electron acceptors with other organic compounds, such as naturally occurring organics, serving as sources of electron donors and carbon substrates. The process of reductive dechlorination involves the sequential removal of chlorine atoms resulting in the production of lesser chlorinated daughter products (i.e., cDCE and vinyl chloride) and ultimately innocuous non-chlorinated end products
ERM 3-9 GE AVIATION/0209887
(i.e., ethene and ethane) and inorganic chloride. For PCE and TCE, the sequence of this degradation process is:
PCE TCE cDCE vinyl chloride ethene, ethane, chloride
In addition to reductive dechlorination, the daughter products (cDCE and vinyl chloride) can also be biodegraded through a second type of anaerobic biological process, reductive oxidation, in which these compounds are cometabolically degraded in the presence of other organic compounds with nitrate, sulfate and iron as electron acceptors.
Under aerobic conditions, TCE, cDCE and vinyl chloride can be degraded by cometabolic oxidation by methanotrophic bacteria that use methane as their sole source of carbon. The intermediates of this process are aldehydes and acids, which are formed transiently and are ultimately metabolized to carbon dioxide and inorganic chloride. Other aerobic cometabolic bacteria that degrade TCE, cDCE and vinyl chloride are ammonia-oxidizing bacteria and toluene-degrading bacteria. PCE, however, is not known to be degraded by any of these cometabolic processes.
Vinyl chloride is also readily biologically degraded through simple aerobic oxidation to carbon dioxide (CO2) and inorganic chloride.
PCE, TCE, cDCE and vinyl chloride are also degraded abiotically by processes that are mediated by reduced-iron mineralogy such as amorphous iron sulfildes and/or pyrite. Degradation occurs without the production of the typical lesser chlorinated daughter products, and acetylene is produced, but is readily degraded.
Abiotically, PCE, TCE, cDCE and vinyl chloride also undergo hydrolysis. However, the rates are too slow to be significant under typical ambient subsurface temperatures.
Persistence
Persistence refers to a constituent's ability to resist physical, chemical, and biological processes that tend to reduce its presence in the environment. The persistence of constituents is influenced by the properties described above, as well as Site-specific factors such as the characteristics of soil, groundwater, and other media in which COCs occur, the hydrogeological characteristics, and climatic conditions.
In general, PCE, TCE and cDCE are persistent constituents in soil and groundwater, but do attenuate slowly over time. These constituents will
ERM 3-10 GE AVIATION/0209887
leach from soil to groundwater due to infiltration of precipitation and volatilize from soil and groundwater into soil gas. In soil and groundwater, PCE, TCE and cDCE may be transformed through the biological and abiotic processes discussed above. The end-product(s) of the transformation is (are) dependent on many factors including pH, temperature, dissolved oxygen content, nutrient levels, mineralogy, and intrinsic microbial populations.
Mobility
PCE, TCE and cDCE are likely to be mobile in aquifer environments that have low organic carbon content. Typical foc values for the subsurface conditions present at the Site range from <0.1% to 0.2% (Wiedemeier et al., 1999), which are low and will result in limited adsorption to soil. PCE, TCE and cDCE are relatively volatile, and have moderate solubilities in groundwater. cDCE will have the highest mobility in soil as it has the lowest Koc value of the three COCs.
3.6.3 Existing and Potential Migration Pathways
Migration from Soil to Groundwater
COCs are present in vadose zone soil in the area surrounding the Facility’s main and auxiliary buildings. Given that the majority of this footprint is covered with buildings or pavement, minimal migration of PCE and TCE from vadose zone soil to groundwater via precipitation recharge is anticipated. It is possible for PCE and TCE impacts in vadose zone soil to partition from the vapor phase to the aqueous phase at the water table.
Migration in Groundwater
Dissolved PCE, TCE, and cDCE have migrated in groundwater from the Facility to the discharge boundary (i.e., East Creek), located approximately 750 feet south of the Facility boundary. Migration of PCE, TCE, and cDCE in groundwater is largely controlled by the advective flow of groundwater through the ablation and lodgement till units at a rate of approximately 1.1 ft/d. Transverse dispersion of PCE, TCE, and cDCE is caused by the highly heterogeneous, anisotropic nature of the till deposits.
Migration in Groundwater to Surface Water
The reach of East Creek south of the Site is “gaining,” as discussed above; therefore, groundwater discharges to this reach of the stream. COC concentrations in pore water samples collected within the stream bed
ERM 3-11 GE AVIATION/0209887
confirm discharge of impacted groundwater in this section of the stream. The reach of East Creek directly east of the Site is a “losing” stream and pore water samples confirm the absence of COC impacts in the stream bed in this section of the creek.
Surface water samples were collected at locations co-located with the pore water sample locations in both the losing and gaining reaches of the creek. COC impacts were not detected in any of the surface water samples, indicating that groundwater is not adversely impacting surface water quality.
Migration in Groundwater to Soil Gas
PCE, TCE and cDCE impacts to soil gas have been detected under residential structures south of the Facility. Sub-slab soil gas concentrations on residential properties are elevated under structures located over the core of the PCE, TCE and cDCE plumes migrating in groundwater (ERM, 2011a). The presence of PCE, TCE and cDCE in soil gas south of the Facility could, in part or in whole, be attributed to the partitioning of these COCs from groundwater to soil gas.
3.6.4 Environmental Fate
The most likely mechanisms affecting the fate of impacted groundwater from the Site are:
1. Dispersion and groundwater recharge via precipitation (over the plume downgradient of the Facility) result in dilution of COCs along the groundwater flow path from the Facility to the discharge boundary. These natural processes have reduced COC concentrations by up to two orders of magnitude prior to groundwater discharging to surface water in East Creek. When COC-impacted groundwater discharges to East Creek, surface water dilution results in further reduction in COC concentrations to levels below laboratory detection limits.
2. Biological degradation of PCE and TCE to cDCE is occurring, most notably in the southeast corner of the Facility property, resulting in the attenuation of PCE and TCE. However, there is no evidence of biological degradation of cDCE because vinyl chloride is not detected. It is possible that cDCE is being degraded via pathways other than biological reductive dechlorination, but these pathways have not been evaluated at this Site.
ERM 3-12 GE AVIATION/0209887
3.7 CONCEPTUAL SITE MODEL
A conceptual site model (CSM) for the Site was presented in the SIR (ERM, 2010) and has not changed significantly since that time. A plan view summary of the CSM is presented as Figure 12 and the CSM is discussed below.
Geologic conditions beneath the Facility consist of relatively high permeability deposits, consisting of sandy fill overlying an interpreted ablation till, which is a loosely compacted, heterogeneous, anisotropic geologic deposit. The ablation till overlies relatively low permeability lodgment till, which is a relatively compacted, heterogeneous, anisotropic geologic deposit. Lodgment till overlies the dolostone bedrock. Downgradient of the Facility, the cross section suggests similar geologic sequencing with a slightly thicker higher-permeability zone, consisting of sandy fill and ablation till.
Interpretation of topographic and groundwater elevation data, combined with evaluation of the distribution of PCE, TCE and cDCE concentrations in groundwater, indicate that regional groundwater flow is generally to the south. COC-impacted groundwater flows through both the shallower higher permeability and the deeper lower permeability overburden units. Evaluation of vertical hydraulic gradient data suggests that a general downward groundwater flow gradient exists in the upgradient portion of the Facility. Vertical hydraulic gradients become generally horizontal near the southern Facility property boundary, where a mixture of upward and downward vertical gradients was observed. Vertical hydraulic gradients then become generally upward in areas downgradient of the Facility.
The Facility is located immediately west of East Creek. The reach of East Creek adjacent to the Facility is a losing stream. East Creek flows to the south and then to the southwest converging with Otter Creek approximately 2,000 feet southwest of the Facility. East Creek becomes a gaining stream at a point between 600 and 800 feet south-southeast of the Facility. Detections of COCs in pore water samples collected in East Creek confirmed groundwater recharge to surface water within the reach of the creek located south of the Facility. Groundwater recharge to surface water within this reach of East Creek is further confirmed by the general upward vertical hydraulic gradients observed in the monitoring well clusters located to the south of the Facility.
PCE, TCE, and cDCE are the COCs detected in soil, groundwater and soil gas at and immediately downgradient of the Facility. No specific release mechanisms have been identified and PCE, TCE and cDCE are not
ERM 3-13 GE AVIATION/0209887
currently used at the Facility, nor have they been used there over the last decade. Therefore, there is a low likelihood of an ongoing source of release at the Facility. There is no direct or indirect evidence of the current or historical presence of DNAPL in soil or groundwater. The source(s) of COC impacts to subsurface media is likely attributable to localized use, storage, and/or spilling of PCE and TCE at the Facility in the mid- to late-twentieth century.
COCs are migrating within the groundwater via advective transport. Interpretation of COC concentrations over time indicates that the plume core has migrated laterally over time. Additional plumes containing COCs could be contributing to the COC mass within this plume. Based on previous investigations in the areas surrounding the Facility, possible additional COC plumes could exist to the north (Dennison, 1992; SEI, 2009) and to the southeast of the Facility at the former Suburban Propane facility (SEI, 2007, 2008a, 2008b and 2009). Evidence of transverse dispersivity has been observed based on the generally increasing width of the plume downgradient from the Facility property.
Evidence of intrinsic biological degradation of the COCs has been noted, based on elevated concentrations of cDCE, most notably in the southeastern portion of the Facility property.
COCs present at the water table appear to be partitioning to the vapor phase producing a COC soil gas plume beneath and immediately downgradient of the Facility. Review of groundwater and sub-slab soil gas COC distributions suggests that the soil gas plume is present above the core of the groundwater plume. The potential for vapor intrusion into residential structures located above the dissolved-phase plume was evaluated and cannot be ruled out as an exposure pathway. Information related to the evaluation of the vapor intrusion pathway can be found in CAFI (ERM, 2011b), CAP (ERM, 2012c), and Vapor Intrusion Investigation Reports (ERM, 2011a, ERM, 2012b).
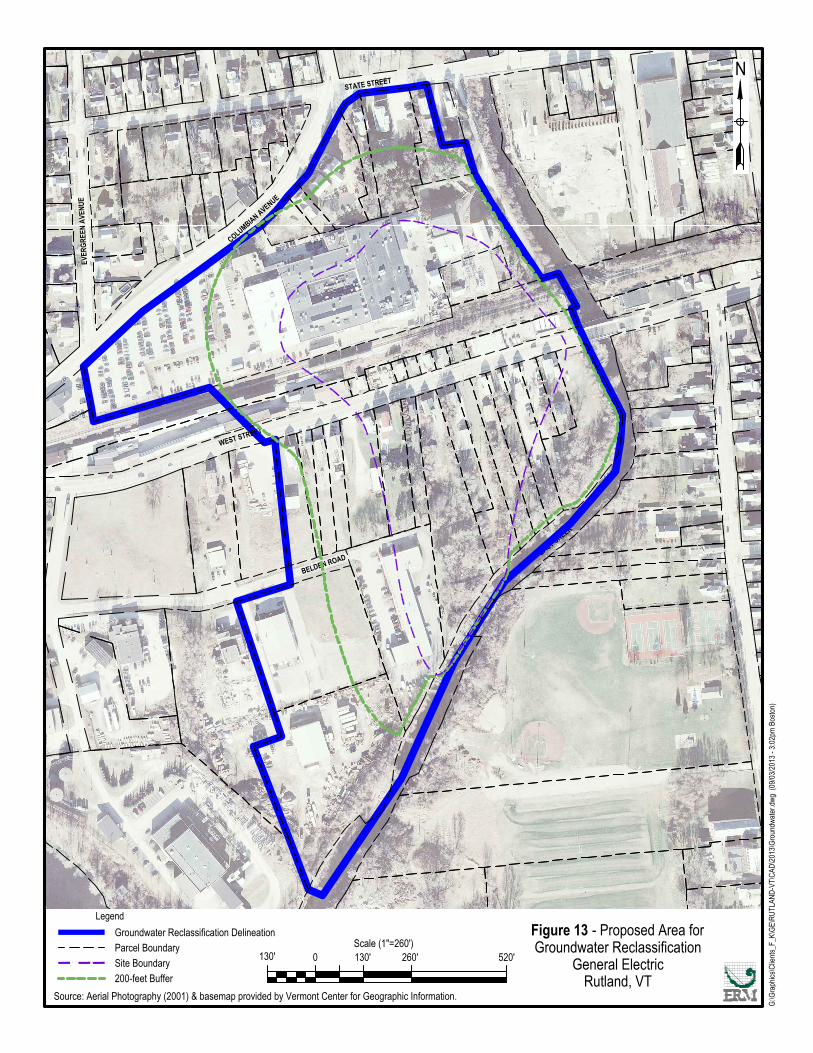
3.8 DESCRIPTION OF BOUNDARY DELINEATION METHODOLOGY
The boundary of the groundwater reclassification petition is shown in Figure 13. The methodology outlined in the Procedure for Class IV Groundwater Reclassification (VT DEC, 2000) was used to perform the boundary delineation and the details are presented below.
1. Groundwater COC concentration data were compared with applicable VT GWQSs and a map showing COC concentrations
ERM 3-14 GE AVIATION/0209887
greater than the VT GWQSs was developed to identify the lateral extent of COC impacts in groundwater (Figure 12).
2. A 200-foot buffer was then added along the cross-gradient (western) and up-gradient (northern) boundaries, as required. This buffer was not applied to the eastern cross-gradient boundary because it is bounded by a hydrogeologic boundary (i.e., East Creek). The downgradient boundary was placed at the midpoint of East Creek, which is a major surface water body. A larger buffer in the upgradient and cross gradient directions was determined to be unnecessary based on stagnation point calculations for a theoretical pumping well required by the delineation methodology. Stagnation point calculations were performed using the Javandal and Tsang method (Javandal, 1986) and are presented in Appendix D.
3. If COCs were detected on a portion of a property at concentrations greater than VT GWQSs or if the 200-foot buffer incorporated a portion of a property, then the entire property was included within the proposed groundwater reclassification area.
ERM 4-1 GE AVIATION/0209887
4.0 GROUNDWATER RECLASSIFICATION EVALUATION CRITERIA
As detailed in the Groundwater Protection Rule, subchapter 4, 12-403(1), the petition must address the Site with respect to each of the following evaluation criteria.
4.1 POTENTIAL FUTURE USE AS A PUBLIC WATER SUPPLY SOURCE
Properties located within the proposed reclassification boundary are currently zoned for residential, industrial or gateway business use. There currently are no private residential supply wells located in or in close proximity to the area proposed for groundwater reclassification and no groundwater in or in close proximity has been reclassified as Class I or Class II groundwater (i.e., suitable for public water supply) by the Secretary. The Facility and surrounding properties are currently serviced by municipal water and sanitary sewer. Further, given the limited yield of the saturated geologic media beneath the Site, it is not likely that water supply wells would be installed within the proposed groundwater reclassification area in the future.
4.2 EXTENT OF ACTIVITY WHICH POSES A RISK TO GROUNDWATER
The Facility does not use or store the COCs identified in Site groundwater. Therefore, there are no known or suspected ongoing sources of groundwater contamination at the Site. Historical releases of COCs to the subsurface during the mid to late twentieth century have resulted in impacts to groundwater at concentrations greater than the applicable VT GWQSs as described above.
4.3 CURRENT QUALITY OF GROUNDWATER
Groundwater at the Site has been monitored since 2009, as discussed above. Since that time, PCE, TCE and cDCE have consistently been detected in groundwater at concentrations greater than the applicable VT GWQSs.
4.4 AVAILABILITY OF GROUNDWATER IN QUANTITIES NEEDED FOR BENEFICIAL USE
The Site is underlain by overburden deposits consisting of ablation and lodgment tills. To date, no pumping tests have been conducted at the Site
ERM 4-2 GE AVIATION/0209887
to evaluate the sustainable yield of the aquifer; however, hydraulic conductivity testing has been conducted. As detailed above, hydraulic conductivity values range from 2.8 x 10⁻⁵ cm/s to 2.1 x 10⁻² cm/s (8.0 x 10⁻² ft/day to 59 ft/day), with a geometric mean hydraulic conductivity of 2.5 x 10⁻³ cm/s (7.1 ft/day). These hydraulic conductivity values are moderate to low, suggesting that the aquifer beneath the Site would exhibit a moderate to low yield, which is not ideal for development as a public water supply. However, the aquifer could be used to provide groundwater for residential purposes (e.g., irrigation or private drinking water).
4.5 CONSEQUENCES OF GROUNDWATER POTENTIAL CONTAMINATION AND AVAILABILITY OF ALTERNATE SOURCE OF WATER
All properties located within the groundwater reclassification boundary are serviced by the Rutland City municipal water system. Currently, there are no groundwater users located within or in close proximity to the proposed groundwater reclassification boundary.
4.6 CLASSIFICATION OF ADJACENT SURFACE WATERS
The surface water body adjacent to the proposed reclassification area is East Creek located to the east and to the south of the proposed boundary. Classification of the surface water body was performed in accordance with 10 VSA 1253, which states that waters, unless otherwise classified, are designated as Class B waters. Vermont Water Quality Standards (VT DEC, 2011) lists all of the water bodies classified as Class A water bodies. East Creek is not listed as Class A, and therefore, a Class B designation is assumed. Class B waters indicates that waters are not used for public water supply and have not been classified as Class A in the public interest.
4.7 PROBABILITY FOR USE AS A PUBLIC WATER SUPPLY SOURCE
There is a very low probability that groundwater in and around the Site will be utilized as a public water supply source for the following reasons:
The Facility and surrounding properties are currently serviced by Rutland City municipal water service; and
The aquifer could not sustain a public water supply system.
ERM 4-3 GE AVIATION/0209887
4.8 OTHER FACTORS RELEVANT TO DETERMINE THE MAXIMUM BENEFICIAL USE OF THE GROUNDWATER
No other factors have been identified.
ERM 5-1 GE AVIATION/0209887
5.0 REFERENCES
Dennison, 1992. Columbian Avenue Soil Sampling. Dennison Environmental Services, Inc. 4 August 1992.
ERM, 2009a. Passive Soil Gas Survey Report, Environmental Resources Management. 31 March 2009.
ERM, 2009b. Initial Groundwater Investigation Report, Environmental Resources Management. 23 June 2009
ERM, 2009c. Vapor Intrusion Investigation Report. Environmental Resources Management. 28 July 2009c.
ERM, 2009d. Dynamic Work Plan for Site Investigation, Environmental Resources Management. 21 August 2009.
ERM, 2010. Site Investigation Report, Environmental Resources Management. 15 December 2010
ERM, 2011a. Vapor Intrusion Investigation Report – 2011 Sampling Events. Environmental Resources Management. 9 June 2011.
ERM, 2011b. Corrective Action Feasibility Investigation. Environmental Resources Management. 12 July 2011.
ERM, 2011c. Groundwater Monitoring Report March 2011 Sampling Event, Environmental Resources Management. 9 June 2011
ERM, 2011d. Groundwater Monitoring Report June 2011 Sampling Event, Environmental Resources Management. 12 August 2011
ERM, 2011e. Groundwater Monitoring Report September 2011 Sampling Event, Environmental Resources Management. 17 November 2011
ERM, 2012a. Groundwater Monitoring Report December 2011 Sampling Event, Environmental Resources Management. 14 February 2012
ERM, 2012b. Vapor Intrusion Investigation Report - March 2012 Sampling Event. Environmental Resources Management. 11 May 2012.
ERM, 2012c. Corrective Action Plan. Environmental Resources Management. 25 July 2012.
ERM 5-2 GE AVIATION/0209887
ERM, 2012d. Groundwater Monitoring Report March 2012 Sampling Event, Environmental Resources Management. 11 May 2012
ERM, 2012e. Groundwater Monitoring Report June 2012 Sampling Event, Environmental Resources Management. 30 August 2012
ERM, 2012f. Groundwater Monitoring Report October 2012 Sampling Event, Environmental Resources Management. 06 December 2012d
ERM, 2013a. Corrective Action Plan Addendum. Environmental Resources Management. 20 June 2013.
ERM, 2013b. Groundwater Monitoring Report December 2012 Sampling Event. Environmental Resources Management. 26 February 2013.
Javandal, 1986. Javandal, I., and Tsang, C. Capture-zone type curves: A tool for aquifer cleanup. Groundwater, v. 24, no. 5 pages 616-625. 1986.
Ratcliffe, N.M., 1998. Digital and Preliminary Geologic Map of the Rutland Quadrangle, Vermont. Vermont Geological Survey, 1998.
SEI, 2007. Letter Report for Desktop Review and Windshield Survey of the Suburban VT Property Acquisitions LLC/Former Agway Facility, Rutland, Vermont. Stone Environmental Inc. 2 July 2007.
SEI, 2008a. Phase II Site Investigation of the Suburban Propane Site. Stone Environmental Inc. 6 October 2008.
SEI, 2008b. Supplemental Site Investigation of the Suburban Propane Site. Stone Environmental Inc. 7 August 2008.
SEI, 2009. Letter Report on Site Investigation Services on Columbian Avenue in Rutland, Vermont. Stone Environmental Inc. 4 June 2009.
VT DEC, 2000. Procedures for Class IV Groundwater Reclassification. State of Vermont, Agency of Natural Resources. Department of Environmental Conservation, 12 November 2000.
VT DEC, 2005. Chapter 12 of the Environmental Protection Rules: Groundwater Protection Rule and Strategy. State of Vermont, Agency of Natural Resources. Department of Environmental Conservation, 14 February 2005.
VT DEC, 2009. First Letter to General Electric. State of Vermont, Agency of Natural Resources. Department of Environmental Conservation, 10 June 2009.
ERM 5-3 GE AVIATION/0209887
VT DEC 2011. Vermont Water Quality Standards, State of Vermont, Agency of Natural Resources. Department of Environmental Conservation, 30 December 2011.
Wiedemeier et al., 1999. Technical protocol for implementing intrinsic remediation with long-term monitoring for natural attenuation of fuel contamination dissolved in groundwater. Volume I. Air Force Center for Environmental Excellence. 8 March 1999.

Figures
GE FACILITY
G:\G
raph
ics\
Clie
nts\
GE
\RU
TLA
ND
-VT
\CA
D\S
ite L
ocus
Map
.dw
g (
12/0
8/20
10 -
11:
11am
Bos
ton)
0.5 mi 0 1,000 ft
500 m00.5 km
Scale 1:25,000 Figure 1 - Site Locus Map
General Electric
Rutland, VT
N
PW-L/SW-L
PW-O/SW-O
PW-P/SW-P
SW-M
PW-N/SW-N
COLUMBIAN AVENUE
EAST CREEK
BELDEN ROAD
MW-19B
MW-16A
MW-18B
MW-14A
MW-14B
MW-3 MW-5MW-9
MW-11AMW-11B
MW-1
MW-18A
MW-16CMW-16B
MW-19C
MW-17B
MW-15BMW-15AMW-13
MW-12BMW-12A
MW-10BMW-10A
MW-17A
MW-19A
MW-4
MW-8
MW-6MW-7
WEST STREET
MW-2
LegendOverburden Monitoring Well LocationBedrock Monitoring Well LocationPore Water / Surface Water LocationPassive Soil Gas Location
Cross Section Location
Property Boundary
Cross Section LocationA A'Site Boundary
Figure 2 - Site PlanGeneral Electric
Rutland, VT75'
Scale (1"=150')75' 300'150'0
G:\G
raph
ics\C
lients
_F_K
\GE\
RUTL
AND-
VT\C
AD\20
13\G
roun
dwate
r.dwg
(07
/29/20
13 -
3:34p
m Bo
ston)
Source: Aerial Photography (2001) & basemap data provided by Vermont Center for Geographic Information.
N
A
A'C
C'
B
B'
STATE STREET
COLUMBIAN AVENUE
WEST STREET
EAST CREEK
BELDEN ROAD
MW-19B
MW-16A
MW-18B
MW-2 MW-14A
MW-14B
MW-3 MW-5MW-9
MW-7MW-11A
MW-11B
MW-1
MW-18A
MW-16CMW-16B
MW-19C
MW-17B
MW-15BMW-15AMW-13
MW-12BMW-12A
MW-10BMW-10A
MW-17A
MW-19A
MW-4
MW-8
MW-6
LegendOverburden Monitoring Well Location
Property BoundaryBedrock Monitoring Well Location
Pore Water / Surface Water LocationCross Section LocationA A'
Figure 3 - Cross Section Plan MapGeneral Electric
Rutland, VT75'
Scale (1"=150')75' 300'150'0
G:\G
raph
ics\C
lients
_F_K
\GE\
RUTL
AND-
VT\C
AD\20
13\G
roun
dwate
r.dwg
(06
/25/20
13 -
2:21p
m Bo
ston)
Source: Aerial Photography (2001) & basemap data provided by Vermont Center for Geographic Information.
N
A A'
N.D.4.1N.D.
49.922.6N.D.
1.980.9N.D.
3.02101.3
1,0404,0806.4
34143160.4
87.23198.3
1.25.0192
22.519.6N.D.
5.7214N.D.
60153.536.1
N.D.2.6N.D.
G:\G
raph
ics\C
lients
_F_K
\GE\
RUTL
AND-
VT\C
AD\C
ross
Sec
tions
\Cro
ss S
ectio
n A-A
'-Jun
e201
3.dwg
(07
/29/20
13 -
11:28
am B
oston
)
Figure 4 - Cross Section A - A'GE, Rutland, VT
Screened Interval/Sample Point
Boring
LegendWell ID
June 2013Trichloroethenecis-1,2-Dichloroethene
Tetrachloroethene
N.D. = Non DetectGroundwater Level (6/2013)
Note: Scale is Approximate
VOC Concentration Data (μg/L)
N.D.3.4N.D.
215475217
6.711.22.1
4.755.95.1
2.91.3N.D.
N.D.N.D.N.D.
N.D.N.D.N.D.
45.754.513.7
13.043.823.9
N.D.3.0N.D.
9.116.33.9
G:\G
raph
ics\C
lients
_F_K
\GE\
RUTL
AND-
VT\C
AD\C
ross
Sec
tions
\Cro
ss S
ectio
n B-B
'-Jun
e201
3.dwg
(07
/29/20
13 -
12:01
pm B
oston
)
Figure 5 - Cross Section B - B'GE, Rutland, VT
Screened Interval/Sample Point
Boring
LegendWell ID
June 2013Trichloroethenecis-1,2-Dichloroethene
Tetrachloroethene
N.D. = Non DetectGroundwater Level (6/2013)
Note: Scale is Approximate
VOC Concentration Data (μg/L)
6.711.22.1
9.116.33.9
45.754.513.7
22.519.6N.D.
60153.536.1
5.015.71.6
7.628.2N.D.
G:\G
raph
ics\C
lients
_F_K
\GE\
RUTL
AND-
VT\C
AD\C
ross
Sec
tions
\Cro
ss S
ectio
n C-C
'-Jun
e201
3.dwg
(07
/29/20
13 -
12:05
pm B
oston
)
Figure 6 - Cross Section C - C'GE, Rutland, VT
Screened Interval/Sample Point
Boring
LegendWell ID
June 2013Trichloroethenecis-1,2-Dichloroethene
Tetrachloroethene
N.D. = Non DetectGroundwater Level (6/2013)
Note: Scale is Approximate
VOC Concentration Data (μg/L)
STATE STREET
COLUMBIAN AVENUE
EAST CREEK
BELDEN ROAD
MW-16A
MW-14AMW-3 MW-5
MW-11A
MW-1
MW-18A
MW-15A
MW-12A
MW-10A
MW-17A
MW-19A
MW-4
524.26
524.40
524.49
528.41527.78
525.78
525.06
524.83
533.38
524.38
524.61
530
528
526
524
530
528
526
524
525.00531.24
523.07
532
532
WEST STREET
MW-2
LegendOverburden Monitoring Well LocationBedrock Monitoring Well LocationGroundwater Reclassification Delineation
523.63Groundwater Elevation Contour (ft ASL)Groundwater Elevation (ft ASL)
Property Boundary
Figure 7 - Shallow Groundwater Elevation Contour MapJune 2013
General ElectricRutland, VT
75'Scale (1"=150')
75' 300'150'0
G:\G
raph
ics\C
lients
_F_K
\GE\
RUTL
AND-
VT\C
AD\20
13\G
roun
dwate
r.dwg
(07
/29/20
13 -
1:26p
m Bo
ston)
Source: Aerial Photography (2001) & basemap data provided by Vermont Center for Geographic Information.
N
STATE STREET
COLUMBIAN AVENUE
WEST STREET
EAST CREEK
BELDEN ROAD
MW-19B
MW-18B
MW-14B
MW-9
MW-11B
MW-16B
MW-17B
MW-15B
MW-13
MW-12B
MW-10B
MW-8
524.33
524.26
524.48 524.89
534.74
526.23
524.56
527.09
528.94
528
526
530
528
526
530
532
532
525.03
523.84
524.94
529.05
524524
534
534
MW-7
LegendOverburden Monitoring Well LocationBedrock Monitoring Well LocationGroundwater Reclassification Delineation
523.63Groundwater Elevation Contour (ft ASL)Groundwater Elevation (ft ASL)
Property Boundary
Figure 8 - Deep Groundwater Elevation Contour MapJune 2013
General ElectricRutland, VT
75'Scale (1"=150')
75' 300'150'0
G:\G
raph
ics\C
lients
_F_K
\GE\
RUTL
AND-
VT\C
AD\20
13\G
roun
dwate
r.dwg
(07
/24/20
13 -
3:51p
m Bo
ston)
Source: Aerial Photography (2001) & basemap data provided by Vermont Center for Geographic Information.
N
COLUMBIAN AVENUE
WEST STREET
EAST CREEK67.5
<1.0
49.9
45.7
215
<1.0
2.94.7
3.0
1040
87.2
7.65.7
601
BELDEN ROAD MW-19B
MW-16A
MW-18B
MW-14A
MW-14B
MW-3 MW-5MW-9
MW-7MW-11A
5
5
MW-11B
MW-1
MW-18A
MW-16CMW-16B
MW-19C
MW-17B
MW-15BMW-15AMW-13
MW-12BMW-12A
MW-10B
50
MW-17A
MW-19A
MW-4
<1.0MW-6
500
MW-8
MW-10A
MW-2
<1.0
Legend
Maximum Tetrachloroethene Concentration (ug/L)<1.0
Monitoring Well Location Bedrock Monitoring Well Location
Not Sampledat Well Cluster Location
Tetrachloroethene (PCE) Contour
Property Boundary
Portion of the PCE Contour based on 2009/2010 Porewater Sampling Results (Not Shown Here)
Not Sampled
Not Sampled NS
N
Figure 9 - Tetrachloroethene Contour MapJune 2013
General ElectricRutland, VT
75'Scale (1"=150')
75' 300'150'0
Source: Aerial Photography (2001) & basemap data provided by Vermont Center for Geographic Information.
G:\G
raph
ics\C
lients
_F_K
\GE\
RUTL
AND-
VT\C
AD\Q
uarte
rly R
epor
t Figu
res\2
nd Q
uarte
r 201
3\GW
and C
hemi
cal C
ontou
rs-Ju
ne 20
13.dw
g (0
7/29/2
013 -
1:30
pm B
oston
)
COLUMBIAN AVENUE
WEST STREET
EAST CREEK
BELDEN ROAD MW-19B
MW-16A
MW-18B
MW-14A
MW-14B
MW-3 MW-5MW-9
4.1
210
80.9
3.4
55.9
475
54.5
212
319
4,080
28.23.4214
MW-7MW-11A
53.5
1.3
MW-11B
500
5
MW-1
MW-18A
MW-16CMW-16B
50
MW-19C
MW-17B
MW-15BMW-15AMW-13
MW-12BMW-12A
MW-10B
MW-17A
MW-19A
MW-4
MW-6
MW-8
MW-10A
MW-2
<1.0
<1.0
Legend Monitoring Well Location
Maximum Trichloroethene Concentration (ug/L) Bedrock Monitoring Well Location
Not Sampled at Well Cluster Location Trichloroethene (TCE) Contour
Property Boundary
Portion of the TCE Contour based on 2009/2010 Porewater Sampling Results (Not Shown Here)
Not Sampled NS
75'Scale (1"=150')
75' 300'150'0
Source: Aerial Photography (2001) & basemap data provided by Vermont Center for Geographic Information.
Figure 10 - Trichloroethene Contour MapJune 2013
General ElectricRutland, VT
G:\G
raph
ics\C
lients
_F_K
\GE\
RUTL
AND-
VT\C
AD\Q
uarte
rly R
epor
t Figu
res\2
nd Q
uarte
r 201
3\GW
and C
hemi
cal C
ontou
rs-Ju
ne 20
13.dw
g (0
7/29/2
013 -
1:32
pm B
oston
)
N
1.6
<1.0
<1.0
35.6
1.3
<1.0
192
5.1
<1.0
COLUMBIAN AVENUE
WEST STREET
EAST CREEK
BELDEN ROAD MW-19B
MW-16A
MW-18B
MW-14A
MW-14B
MW-3 MW-5MW-9
MW-7MW-11A
60.4
36.1
13.7
217
MW-11B
MW-1
MW-18A
MW-16CMW-16B
<1.0
MW-19C
MW-17B
MW-15BMW-15AMW-13
MW-12BMW-12A
MW-10B
70
MW-17A
MW-19A
MW-4
<1.0MW-6
MW-8
MW-10A
MW-2
<1.0
<1.0
Legend Monitoring Well Location
Maximum Cis-1,2-Dichloroethene Concentration (ug/L) Bedrock Monitoring Well Location
Not SampledN.S.at Well Cluster Location
Cis-1,2-Dichloroethene Contour Property Boundary
Not Sampled
Not Sampled NS
75'Scale (1"=150')
75' 300'150'0
Source: Aerial Photography (2001) & basemap data provided by Vermont Center for Geographic Information.
Figure 11 - Cis-1,2-Dichloroethene Contour MapJune 2013
General ElectricRutland, VT
N
G:\G
raph
ics\C
lients
_F_K
\GE\
RUTL
AND-
VT\C
AD\Q
uarte
rly R
epor
t Figu
res\2
nd Q
uarte
r 201
3\GW
and C
hemi
cal C
ontou
rs-Ju
ne 20
13.dw
g (0
7/29/2
013 -
1:37
pm B
oston
)
!P
!P
!P
!P
!P
!P
!P
!P
!P
!P
!P
!P
!P
!P
!P
!P
!P
!P
!P
!P
!P
!<
!<
!<
!<
!<
!<
!<!<
!<!<
!<!<
!<!<
!< !<!<
!<!<
!<
!<!<
!<
!<
!<
!<!<
!<
!<
!<
!<!<
!<!<
!< !A!A
!A!A
!A
!A!A
!A
!A
!A!A
!A!A!A!A
!A !A!A!A!A
!A!A!A
!A!A
!A!A
!P
!P
!P
!P
!P
!P
"!A"!A"!A
MW-19AMW-19B
MW-19C315
MW-7NDMW-6
3.4
MW-5MW-2
MW-14.1
MW-4
MW-16A
MW-14AMW-14B4.2MW-13
83
MW-9415
MW-15AMW-15B66
MW-11AMW-11B36
MW-17AMW-17B911
MW-16B114MW-16C
MW-3214
MW-18AMW-18B3.4
MW-12AMW-12B
220MW-10A691MW-10B
MW-85,126
SW-MND
PW-P/SW-PND ND
PW-O/SW-OND ND
PW-N/SW-N95.3 ND
SW-QND
PW-L/SW-LND ND
PDB-13(ND)
PDB-12(ND)
PDB-11(ND)
PDB-10(NS)
PDB-09(ND)
PDB-08(52)
PDB-07(14.5)
PDB-06(23.7)
PDB-04(NS)
PDB-01(ND)
PDB-02(7.8)
PDB-03(ND)
PDB-05(4.1)
PSG-1PSG-2
PSG-3PSG-4
PSG-5PSG-6
PSG-9
PSG-8
PSG-7
PSG-31PSG-32
PSG-33PSG-34
PSG-35PSG-27PSG-21
PSG-22PSG-23
PSG-28PSG-29
PSG-30
PSG-25PSG-24PSG-18
PSG-19PSG-20
PSG-17PSG-16
PSG-15PSG-14
PSG-11PSG-12
PSG-10
PSG-13
PSG-26
MP-03
MP-01
MP-02
MP-08MP-07
MP-04
MP-05
MP-06
Figure 12 - Conceptual Site Model
1:1,800
G:\Gra
phics\
Clients
\GE\Ru
tland-V
T\MXD
\Site_C
oncept
ual_M
odel-Ju
ne2010
.mxd 8
Decem
ber 20
10
Source: Aerial Photography (2001) and basemap data provided by the Vermont Center for Geographic Information.
General ElectricRutland, VT
0 150 30075Feet
q
3.4Maximum Total Chlorinated Ethene Concentration (ug/L) from June 2013 is Posted for Well Cluster Location
Legend Stone Environmental Data
!P
Pore Water / Surface Water Location (November 2009/June 2010)(Total Chlorinated Ethene Concentration ug/L)
"!AMonitoring Well Location (June 2013)(Total Chlorinated Ethene Concentration ug/L)
!< Passive Soil Gas Location (February 2009)
Not Detected
ERM Data
!P Mini-piezometer Location (gaining)!P Mini-piezometer Location (losing)
Passive Soil Gas Results
Property BoundaryApproximate Plume Boundary
!PPorewater Location (September 2008)(Total Chlorinated Ethene Concentration ug/L)
Not SampledNDNS
LegendOverburden Monitoring Well Location
STATE STREET
COLUMBIAN AVENUE
EAST CREEK
BELDEN ROAD
WEST STREET
EVER
GREE
N AV
ENUE
Groundwater Reclassification DelineationArea of Impacted GroundwaterParcel BoundaryGroundwater Reclassification DelineationCross Section LocationA A'Site Boundary200-feet Buffer
Figure 13 - Proposed Area forGroundwater Reclassification
General ElectricRutland, VT
130'Scale (1"=260')
130' 520'260'0
G:\G
raph
ics\C
lients
_F_K
\GE\
RUTL
AND-
VT\C
AD\20
13\G
roun
dwate
r.dwg
(09
/03/20
13 -
3:02p
m Bo
ston)
N
Source: Aerial Photography (2001) & basemap provided by Vermont Center for Geographic Information.

Tables
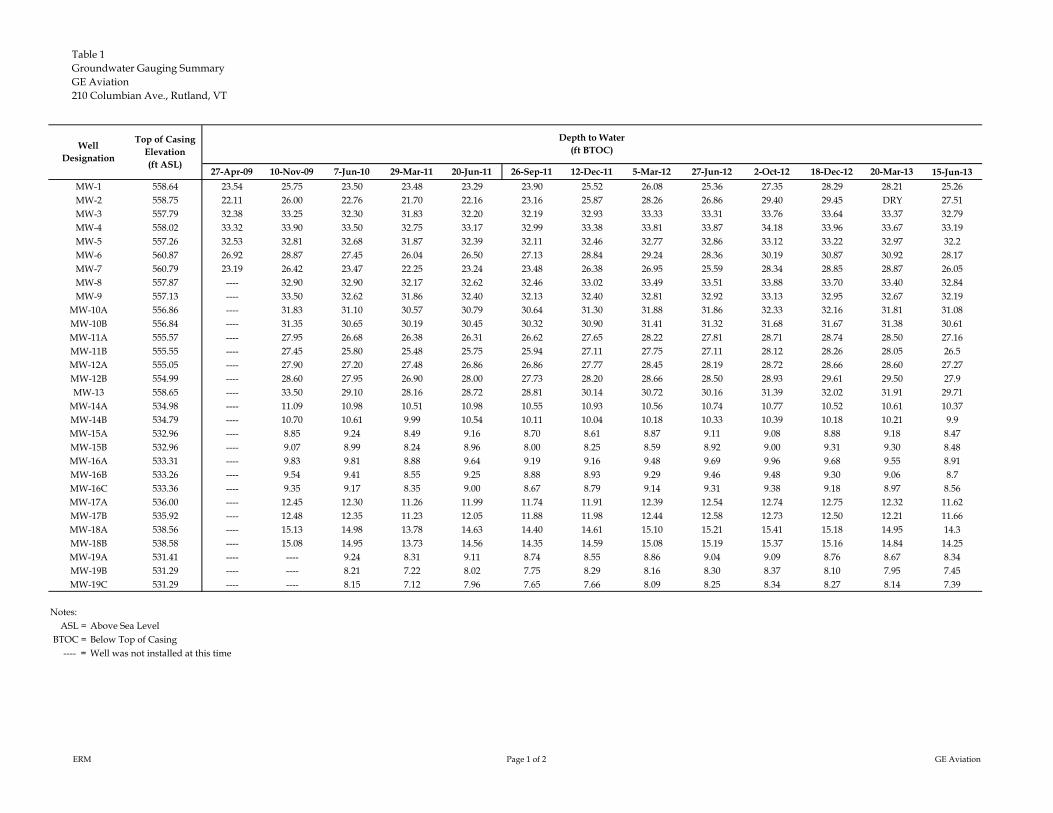
Table 1Groundwater Gauging SummaryGE Aviation210 Columbian Ave., Rutland, VT
27-Apr-09 10-Nov-09 7-Jun-10 29-Mar-11 20-Jun-11 26-Sep-11 12-Dec-11 5-Mar-12 27-Jun-12 2-Oct-12 18-Dec-12 20-Mar-13 15-Jun-13
558.64 23.54 25.75 23.50 23.48 23.29 23.90 25.52 26.08 25.36 27.35 28.29 28.21 25.26558.75 22.11 26.00 22.76 21.70 22.16 23.16 25.87 28.26 26.86 29.40 29.45 DRY 27.51557.79 32.38 33.25 32.30 31.83 32.20 32.19 32.93 33.33 33.31 33.76 33.64 33.37 32.79558.02 33.32 33.90 33.50 32.75 33.17 32.99 33.38 33.81 33.87 34.18 33.96 33.67 33.19557.26 32.53 32.81 32.68 31.87 32.39 32.11 32.46 32.77 32.86 33.12 33.22 32.97 32.2560.87 26.92 28.87 27.45 26.04 26.50 27.13 28.84 29.24 28.36 30.19 30.87 30.92 28.17560.79 23.19 26.42 23.47 22.25 23.24 23.48 26.38 26.95 25.59 28.34 28.85 28.87 26.05557.87 ---- 32.90 32.90 32.17 32.62 32.46 33.02 33.49 33.51 33.88 33.70 33.40 32.84557.13 ---- 33.50 32.62 31.86 32.40 32.13 32.40 32.81 32.92 33.13 32.95 32.67 32.19556.86 ---- 31.83 31.10 30.57 30.79 30.64 31.30 31.88 31.86 32.33 32.16 31.81 31.08556.84 ---- 31.35 30.65 30.19 30.45 30.32 30.90 31.41 31.32 31.68 31.67 31.38 30.61555.57 ---- 27.95 26.68 26.38 26.31 26.62 27.65 28.22 27.81 28.71 28.74 28.50 27.16555.55 ---- 27.45 25.80 25.48 25.75 25.94 27.11 27.75 27.11 28.12 28.26 28.05 26.5555.05 ---- 27.90 27.20 27.48 26.86 26.86 27.77 28.45 28.19 28.72 28.66 28.60 27.27554.99 ---- 28.60 27.95 26.90 28.00 27.73 28.20 28.66 28.50 28.93 29.61 29.50 27.9558.65 ---- 33.50 29.10 28.16 28.72 28.81 30.14 30.72 30.16 31.39 32.02 31.91 29.71534.98 ---- 11.09 10.98 10.51 10.98 10.55 10.93 10.56 10.74 10.77 10.52 10.61 10.37534.79 ---- 10.70 10.61 9.99 10.54 10.11 10.04 10.18 10.33 10.39 10.18 10.21 9.9532.96 ---- 8.85 9.24 8.49 9.16 8.70 8.61 8.87 9.11 9.08 8.88 9.18 8.47532.96 ---- 9.07 8.99 8.24 8.96 8.00 8.25 8.59 8.92 9.00 9.31 9.30 8.48533.31 ---- 9.83 9.81 8.88 9.64 9.19 9.16 9.48 9.69 9.96 9.68 9.55 8.91533.26 ---- 9.54 9.41 8.55 9.25 8.88 8.93 9.29 9.46 9.48 9.30 9.06 8.7533.36 ---- 9.35 9.17 8.35 9.00 8.67 8.79 9.14 9.31 9.38 9.18 8.97 8.56536.00 ---- 12.45 12.30 11.26 11.99 11.74 11.91 12.39 12.54 12.74 12.75 12.32 11.62535.92 ---- 12.48 12.35 11.23 12.05 11.88 11.98 12.44 12.58 12.73 12.50 12.21 11.66538.56 ---- 15.13 14.98 13.78 14.63 14.40 14.61 15.10 15.21 15.41 15.18 14.95 14.3538.58 ---- 15.08 14.95 13.73 14.56 14.35 14.59 15.08 15.19 15.37 15.16 14.84 14.25531.41 ---- ---- 9.24 8.31 9.11 8.74 8.55 8.86 9.04 9.09 8.76 8.67 8.34531.29 ---- ---- 8.21 7.22 8.02 7.75 8.29 8.16 8.30 8.37 8.10 7.95 7.45531.29 ---- ---- 8.15 7.12 7.96 7.65 7.66 8.09 8.25 8.34 8.27 8.14 7.39
Notes:ASL = Above Sea Level
BTOC = Below Top of Casing---- = Well was not installed at this time
MW-19CMW-19BMW-19AMW-18BMW-18AMW-17B
MW-10B
MW-13MW-12BMW-12A
MW-17A
MW-14A
MW-15AMW-14B
MW-16CMW-16BMW-16AMW-15B
MW-11BMW-11A
MW-10AMW-9
MW-6
MW-8
WellDesignation
MW-1
MW-5MW-4
MW-2
Top of CasingElevation(ft ASL)
MW-3
MW-7
Depth to Water(ft BTOC)
ERM Page 1 of 2 GE Aviation
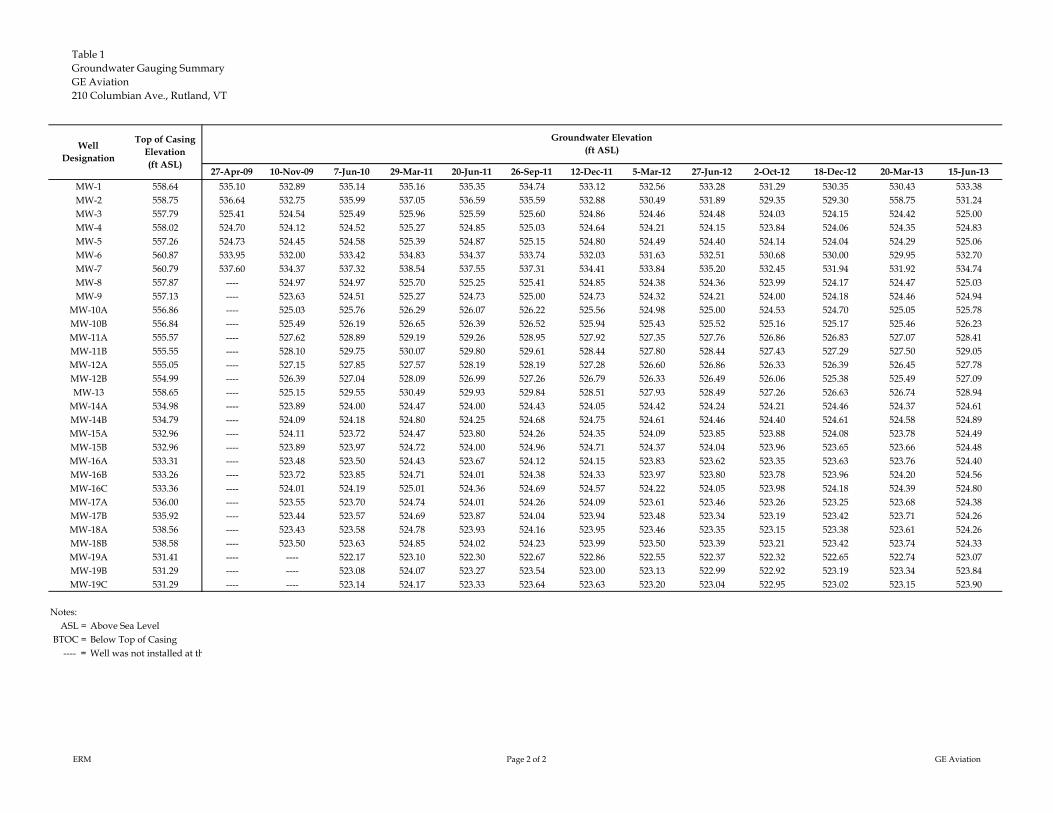
Table 1Groundwater Gauging SummaryGE Aviation210 Columbian Ave., Rutland, VT
558.64558.75557.79558.02557.26560.87560.79557.87557.13556.86556.84555.57555.55555.05554.99558.65534.98534.79532.96532.96533.31533.26533.36536.00535.92538.56538.58531.41531.29531.29
Notes:ASL = Above Sea Level
BTOC = Below Top of Casing---- = Well was not installed at th
MW-19CMW-19BMW-19AMW-18BMW-18AMW-17B
MW-10B
MW-13MW-12BMW-12A
MW-17A
MW-14A
MW-15AMW-14B
MW-16CMW-16BMW-16AMW-15B
MW-11BMW-11A
MW-10AMW-9
MW-6
MW-8
WellDesignation
MW-1
MW-5MW-4
MW-2
Top of CasingElevation(ft ASL)
MW-3
MW-7
27-Apr-09 10-Nov-09 7-Jun-10 29-Mar-11 20-Jun-11 26-Sep-11 12-Dec-11 5-Mar-12 27-Jun-12 2-Oct-12 18-Dec-12 20-Mar-13 15-Jun-13
535.10 532.89 535.14 535.16 535.35 534.74 533.12 532.56 533.28 531.29 530.35 530.43 533.38536.64 532.75 535.99 537.05 536.59 535.59 532.88 530.49 531.89 529.35 529.30 558.75 531.24525.41 524.54 525.49 525.96 525.59 525.60 524.86 524.46 524.48 524.03 524.15 524.42 525.00524.70 524.12 524.52 525.27 524.85 525.03 524.64 524.21 524.15 523.84 524.06 524.35 524.83524.73 524.45 524.58 525.39 524.87 525.15 524.80 524.49 524.40 524.14 524.04 524.29 525.06533.95 532.00 533.42 534.83 534.37 533.74 532.03 531.63 532.51 530.68 530.00 529.95 532.70537.60 534.37 537.32 538.54 537.55 537.31 534.41 533.84 535.20 532.45 531.94 531.92 534.74
---- 524.97 524.97 525.70 525.25 525.41 524.85 524.38 524.36 523.99 524.17 524.47 525.03---- 523.63 524.51 525.27 524.73 525.00 524.73 524.32 524.21 524.00 524.18 524.46 524.94---- 525.03 525.76 526.29 526.07 526.22 525.56 524.98 525.00 524.53 524.70 525.05 525.78---- 525.49 526.19 526.65 526.39 526.52 525.94 525.43 525.52 525.16 525.17 525.46 526.23---- 527.62 528.89 529.19 529.26 528.95 527.92 527.35 527.76 526.86 526.83 527.07 528.41---- 528.10 529.75 530.07 529.80 529.61 528.44 527.80 528.44 527.43 527.29 527.50 529.05---- 527.15 527.85 527.57 528.19 528.19 527.28 526.60 526.86 526.33 526.39 526.45 527.78---- 526.39 527.04 528.09 526.99 527.26 526.79 526.33 526.49 526.06 525.38 525.49 527.09---- 525.15 529.55 530.49 529.93 529.84 528.51 527.93 528.49 527.26 526.63 526.74 528.94---- 523.89 524.00 524.47 524.00 524.43 524.05 524.42 524.24 524.21 524.46 524.37 524.61---- 524.09 524.18 524.80 524.25 524.68 524.75 524.61 524.46 524.40 524.61 524.58 524.89---- 524.11 523.72 524.47 523.80 524.26 524.35 524.09 523.85 523.88 524.08 523.78 524.49---- 523.89 523.97 524.72 524.00 524.96 524.71 524.37 524.04 523.96 523.65 523.66 524.48---- 523.48 523.50 524.43 523.67 524.12 524.15 523.83 523.62 523.35 523.63 523.76 524.40---- 523.72 523.85 524.71 524.01 524.38 524.33 523.97 523.80 523.78 523.96 524.20 524.56---- 524.01 524.19 525.01 524.36 524.69 524.57 524.22 524.05 523.98 524.18 524.39 524.80---- 523.55 523.70 524.74 524.01 524.26 524.09 523.61 523.46 523.26 523.25 523.68 524.38---- 523.44 523.57 524.69 523.87 524.04 523.94 523.48 523.34 523.19 523.42 523.71 524.26---- 523.43 523.58 524.78 523.93 524.16 523.95 523.46 523.35 523.15 523.38 523.61 524.26---- 523.50 523.63 524.85 524.02 524.23 523.99 523.50 523.39 523.21 523.42 523.74 524.33---- ---- 522.17 523.10 522.30 522.67 522.86 522.55 522.37 522.32 522.65 522.74 523.07---- ---- 523.08 524.07 523.27 523.54 523.00 523.13 522.99 522.92 523.19 523.34 523.84---- ---- 523.14 524.17 523.33 523.64 523.63 523.20 523.04 522.95 523.02 523.15 523.90
Groundwater Elevation(ft ASL)
ERM Page 2 of 2 GE Aviation
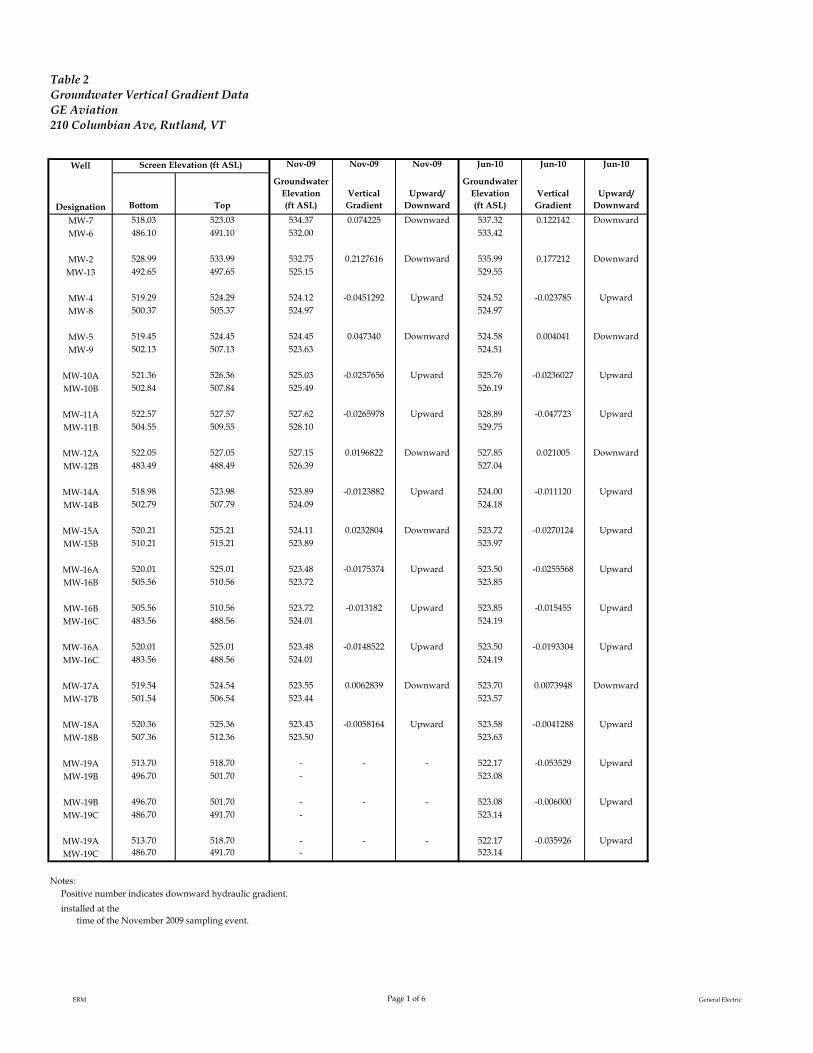
Table 2Groundwater Vertical Gradient DataGE Aviation210 Columbian Ave, Rutland, VT
Well Nov-09 Nov-09 Nov-09 Jun-10 Jun-10 Jun-10
Designation Bottom Top
Groundwater Elevation (ft ASL)
Vertical Gradient
Upward/Downward
Groundwater Elevation(ft ASL)
Vertical Gradient
Upward/Downward
MW-7 518.03 523.03 534.37 0.074225 Downward 537.32 0.122142 Downward
MW-6 486.10 491.10 532.00 533.42
MW-2 528.99 533.99 532.75 0.2127616 Downward 535.99 0.177212 Downward
MW-13 492.65 497.65 525.15 529.55
MW-4 519.29 524.29 524.12 -0.0451292 Upward 524.52 -0.023785 Upward
MW-8 500.37 505.37 524.97 524.97
MW-5 519.45 524.45 524.45 0.047340 Downward 524.58 0.004041 Downward
MW-9 502.13 507.13 523.63 524.51
MW-10A 521.36 526.36 525.03 -0.0257656 Upward 525.76 -0.0236027 Upward
MW-10B 502.84 507.84 525.49 526.19
MW-11A 522.57 527.57 527.62 -0.0265978 Upward 528.89 -0.047723 Upward
MW-11B 504.55 509.55 528.10 529.75
MW-12A 522.05 527.05 527.15 0.0196822 Downward 527.85 0.021005 Downward
MW-12B 483.49 488.49 526.39 527.04
MW-14A 518.98 523.98 523.89 -0.0123882 Upward 524.00 -0.011120 Upward
MW-14B 502.79 507.79 524.09 524.18
MW-15A 520.21 525.21 524.11 0.0232804 Downward 523.72 -0.0270124 Upward
MW-15B 510.21 515.21 523.89 523.97
MW-16A 520.01 525.01 523.48 -0.0175374 Upward 523.50 -0.0255568 Upward
MW-16B 505.56 510.56 523.72 523.85
MW-16B 505.56 510.56 523.72 -0.013182 Upward 523.85 -0.015455 Upward
MW-16C 483.56 488.56 524.01 524.19
MW-16A 520.01 525.01 523.48 -0.0148522 Upward 523.50 -0.0193304 Upward
MW-16C 483.56 488.56 524.01 524.19
MW-17A 519.54 524.54 523.55 0.0062839 Downward 523.70 0.0073948 Downward
MW-17B 501.54 506.54 523.44 523.57
MW-18A 520.36 525.36 523.43 -0.0058164 Upward 523.58 -0.0041288 Upward
MW-18B 507.36 512.36 523.50 523.63
MW-19A 513.70 518.70 - - - 522.17 -0.053529 Upward
MW-19B 496.70 501.70 - 523.08
MW-19B 496.70 501.70 - - - 523.08 -0.006000 Upward
MW-19C 486.70 491.70 - 523.14
MW-19A 513.70 518.70 - - - 522.17 -0.035926 UpwardMW-19C 486.70 491.70 - 523.14
Notes:Positive number indicates downward hydraulic gradient.
Screen Elevation (ft ASL)
,installed at the time of the November 2009 sampling event.
ERM Page 1 of 6 General Electric
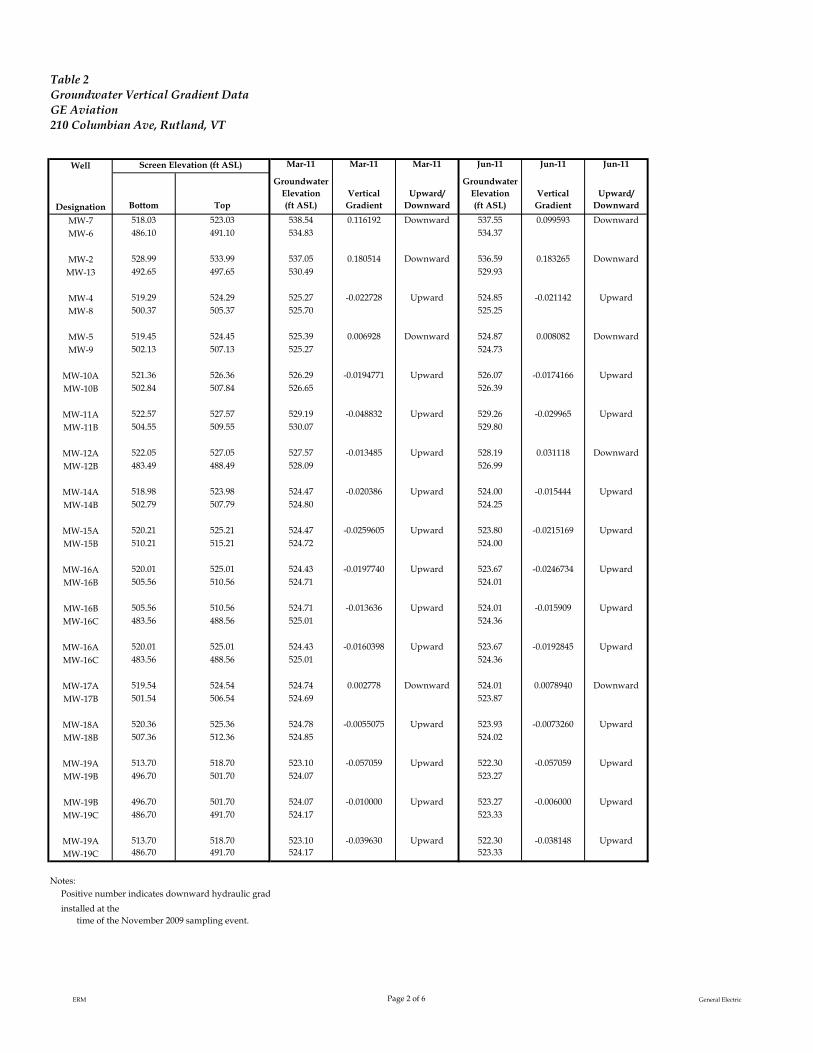
Table 2Groundwater Vertical Gradient DataGE Aviation210 Columbian Ave, Rutland, VT
Well
Designation Bottom Top
MW-7 518.03 523.03
MW-6 486.10 491.10
MW-2 528.99 533.99
MW-13 492.65 497.65
MW-4 519.29 524.29
MW-8 500.37 505.37
MW-5 519.45 524.45
MW-9 502.13 507.13
MW-10A 521.36 526.36
MW-10B 502.84 507.84
MW-11A 522.57 527.57
MW-11B 504.55 509.55
MW-12A 522.05 527.05
MW-12B 483.49 488.49
MW-14A 518.98 523.98
MW-14B 502.79 507.79
MW-15A 520.21 525.21
MW-15B 510.21 515.21
MW-16A 520.01 525.01
MW-16B 505.56 510.56
MW-16B 505.56 510.56
MW-16C 483.56 488.56
MW-16A 520.01 525.01
MW-16C 483.56 488.56
MW-17A 519.54 524.54
MW-17B 501.54 506.54
MW-18A 520.36 525.36
MW-18B 507.36 512.36
MW-19A 513.70 518.70
MW-19B 496.70 501.70
MW-19B 496.70 501.70
MW-19C 486.70 491.70
MW-19A 513.70 518.70MW-19C 486.70 491.70
Notes:Positive number indicates downward hydraulic grad
Screen Elevation (ft ASL)
,installed at the time of the November 2009 sampling event.
Mar-11 Mar-11 Mar-11 Jun-11 Jun-11 Jun-11
Groundwater Elevation(ft ASL)
Vertical Gradient
Upward/Downward
Groundwater Elevation(ft ASL)
Vertical Gradient
Upward/Downward
538.54 0.116192 Downward 537.55 0.099593 Downward534.83 534.37
537.05 0.180514 Downward 536.59 0.183265 Downward530.49 529.93
525.27 -0.022728 Upward 524.85 -0.021142 Upward525.70 525.25
525.39 0.006928 Downward 524.87 0.008082 Downward525.27 524.73
526.29 -0.0194771 Upward 526.07 -0.0174166 Upward526.65 526.39
529.19 -0.048832 Upward 529.26 -0.029965 Upward530.07 529.80
527.57 -0.013485 Upward 528.19 0.031118 Downward528.09 526.99
524.47 -0.020386 Upward 524.00 -0.015444 Upward524.80 524.25
524.47 -0.0259605 Upward 523.80 -0.0215169 Upward524.72 524.00
524.43 -0.0197740 Upward 523.67 -0.0246734 Upward524.71 524.01
524.71 -0.013636 Upward 524.01 -0.015909 Upward525.01 524.36
524.43 -0.0160398 Upward 523.67 -0.0192845 Upward525.01 524.36
524.74 0.002778 Downward 524.01 0.0078940 Downward524.69 523.87
524.78 -0.0055075 Upward 523.93 -0.0073260 Upward524.85 524.02
523.10 -0.057059 Upward 522.30 -0.057059 Upward524.07 523.27
524.07 -0.010000 Upward 523.27 -0.006000 Upward524.17 523.33
523.10 -0.039630 Upward 522.30 -0.038148 Upward524.17 523.33
ERM Page 2 of 6 General Electric
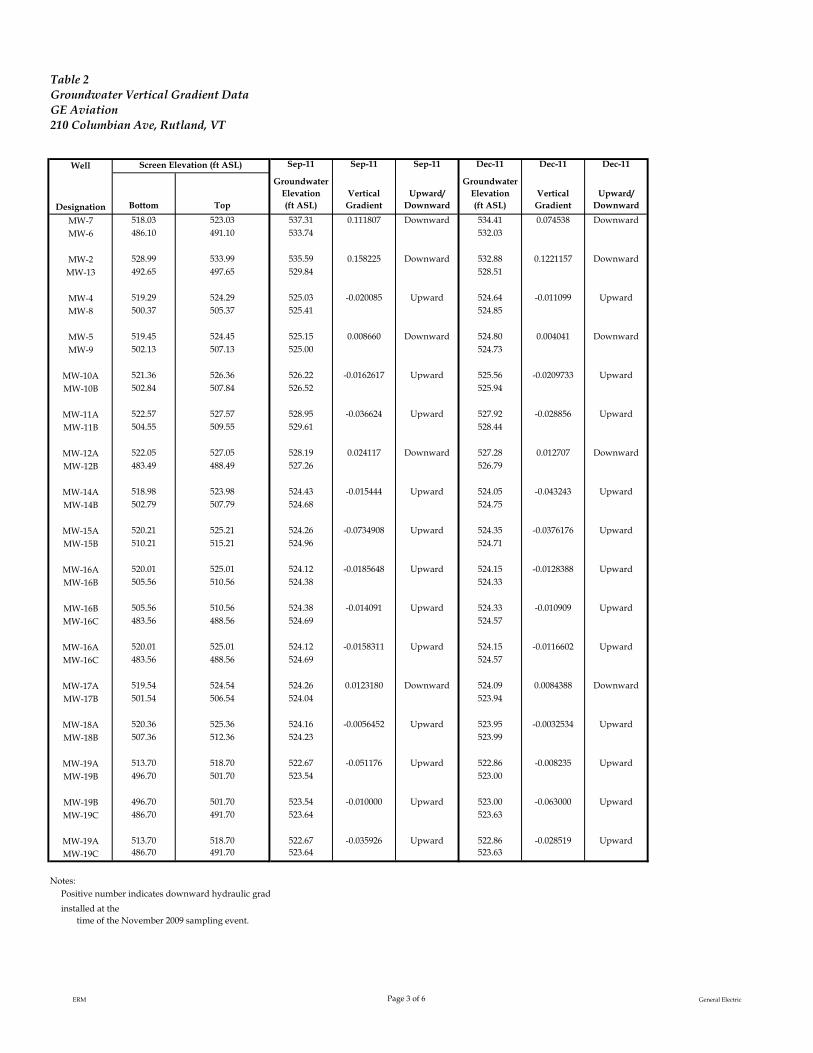
Table 2Groundwater Vertical Gradient DataGE Aviation210 Columbian Ave, Rutland, VT
Well
Designation Bottom Top
MW-7 518.03 523.03
MW-6 486.10 491.10
MW-2 528.99 533.99
MW-13 492.65 497.65
MW-4 519.29 524.29
MW-8 500.37 505.37
MW-5 519.45 524.45
MW-9 502.13 507.13
MW-10A 521.36 526.36
MW-10B 502.84 507.84
MW-11A 522.57 527.57
MW-11B 504.55 509.55
MW-12A 522.05 527.05
MW-12B 483.49 488.49
MW-14A 518.98 523.98
MW-14B 502.79 507.79
MW-15A 520.21 525.21
MW-15B 510.21 515.21
MW-16A 520.01 525.01
MW-16B 505.56 510.56
MW-16B 505.56 510.56
MW-16C 483.56 488.56
MW-16A 520.01 525.01
MW-16C 483.56 488.56
MW-17A 519.54 524.54
MW-17B 501.54 506.54
MW-18A 520.36 525.36
MW-18B 507.36 512.36
MW-19A 513.70 518.70
MW-19B 496.70 501.70
MW-19B 496.70 501.70
MW-19C 486.70 491.70
MW-19A 513.70 518.70MW-19C 486.70 491.70
Notes:Positive number indicates downward hydraulic grad
Screen Elevation (ft ASL)
,installed at the time of the November 2009 sampling event.
Sep-11 Sep-11 Sep-11 Dec-11 Dec-11 Dec-11
Groundwater Elevation(ft ASL)
Vertical Gradient
Upward/Downward
Groundwater Elevation(ft ASL)
Vertical Gradient
Upward/Downward
537.31 0.111807 Downward 534.41 0.074538 Downward533.74 532.03
535.59 0.158225 Downward 532.88 0.1221157 Downward529.84 528.51
525.03 -0.020085 Upward 524.64 -0.011099 Upward525.41 524.85
525.15 0.008660 Downward 524.80 0.004041 Downward525.00 524.73
526.22 -0.0162617 Upward 525.56 -0.0209733 Upward526.52 525.94
528.95 -0.036624 Upward 527.92 -0.028856 Upward529.61 528.44
528.19 0.024117 Downward 527.28 0.012707 Downward527.26 526.79
524.43 -0.015444 Upward 524.05 -0.043243 Upward524.68 524.75
524.26 -0.0734908 Upward 524.35 -0.0376176 Upward524.96 524.71
524.12 -0.0185648 Upward 524.15 -0.0128388 Upward524.38 524.33
524.38 -0.014091 Upward 524.33 -0.010909 Upward524.69 524.57
524.12 -0.0158311 Upward 524.15 -0.0116602 Upward524.69 524.57
524.26 0.0123180 Downward 524.09 0.0084388 Downward524.04 523.94
524.16 -0.0056452 Upward 523.95 -0.0032534 Upward524.23 523.99
522.67 -0.051176 Upward 522.86 -0.008235 Upward523.54 523.00
523.54 -0.010000 Upward 523.00 -0.063000 Upward523.64 523.63
522.67 -0.035926 Upward 522.86 -0.028519 Upward523.64 523.63
ERM Page 3 of 6 General Electric

Table 2Groundwater Vertical Gradient DataGE Aviation210 Columbian Ave, Rutland, VT
Well
Designation Bottom Top
MW-7 518.03 523.03
MW-6 486.10 491.10
MW-2 528.99 533.99
MW-13 492.65 497.65
MW-4 519.29 524.29
MW-8 500.37 505.37
MW-5 519.45 524.45
MW-9 502.13 507.13
MW-10A 521.36 526.36
MW-10B 502.84 507.84
MW-11A 522.57 527.57
MW-11B 504.55 509.55
MW-12A 522.05 527.05
MW-12B 483.49 488.49
MW-14A 518.98 523.98
MW-14B 502.79 507.79
MW-15A 520.21 525.21
MW-15B 510.21 515.21
MW-16A 520.01 525.01
MW-16B 505.56 510.56
MW-16B 505.56 510.56
MW-16C 483.56 488.56
MW-16A 520.01 525.01
MW-16C 483.56 488.56
MW-17A 519.54 524.54
MW-17B 501.54 506.54
MW-18A 520.36 525.36
MW-18B 507.36 512.36
MW-19A 513.70 518.70
MW-19B 496.70 501.70
MW-19B 496.70 501.70
MW-19C 486.70 491.70
MW-19A 513.70 518.70MW-19C 486.70 491.70
Notes:Positive number indicates downward hydraulic grad
Screen Elevation (ft ASL)
,installed at the time of the November 2009 sampling event.
Mar-12 Mar-12 Mar-12 Jun-12 Jun-12 Jun-12
Groundwater Elevation(ft ASL)
Vertical Gradient
Upward/Downward
Groundwater Elevation(ft ASL)
Vertical Gradient
Upward/Downward
533.84 0.069214 Downward 535.20 0.084247 Downward531.63 532.51
530.49 0.0740083 Downward 531.89 0.0963426 Downward527.93 528.49
524.21 -0.0090043 Upward 524.15 -0.0111407 Upward524.38 524.36
524.49 0.009814 Downward 524.40 0.0109848 Downward524.32 524.21
524.98 -0.0252408 Upward 525.00 -0.0291508 Upward525.43 525.52
527.35 -0.0251234 Upward 527.76 -0.037734 Upward527.80 528.44
526.60 0.0070425 Downward 526.86 0.0096182 Downward526.33 526.49
524.42 -0.011738 Upward 524.24 -0.013591 Upward524.61 524.46
524.09 -0.0296610 Upward 523.85 -0.0203863 Upward524.37 524.04
523.83 -0.0101010 Upward 523.62 -0.0130862 Upward523.97 523.80
523.97 -0.011364 Upward 523.80 -0.011364 Upward524.22 524.05
523.83 -0.0108756 Upward 523.62 -0.0120263 Upward524.22 524.05
523.61 0.0074137 Downward 523.46 0.0068729 Downward523.48 523.34
523.46 -0.0033195 Upward 523.35 -0.0033347 Upward523.50 523.39
522.55 -0.034118 Upward 522.37 -0.036471 Upward523.13 522.99
523.13 -0.007000 Upward 522.99 -0.005000 Upward523.20 523.04
522.55 -0.024074 Upward 522.37 -0.024815 Upward523.20 523.04
ERM Page 4 of 6 General Electric
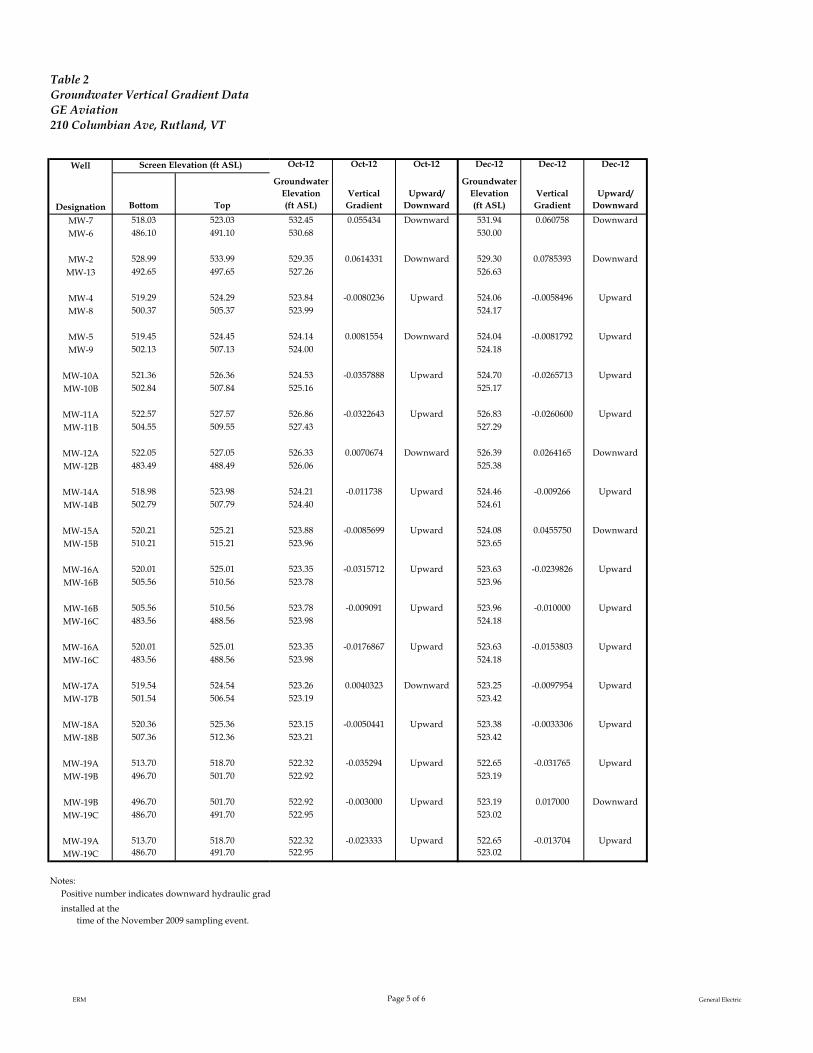
Table 2Groundwater Vertical Gradient DataGE Aviation210 Columbian Ave, Rutland, VT
Well
Designation Bottom Top
MW-7 518.03 523.03
MW-6 486.10 491.10
MW-2 528.99 533.99
MW-13 492.65 497.65
MW-4 519.29 524.29
MW-8 500.37 505.37
MW-5 519.45 524.45
MW-9 502.13 507.13
MW-10A 521.36 526.36
MW-10B 502.84 507.84
MW-11A 522.57 527.57
MW-11B 504.55 509.55
MW-12A 522.05 527.05
MW-12B 483.49 488.49
MW-14A 518.98 523.98
MW-14B 502.79 507.79
MW-15A 520.21 525.21
MW-15B 510.21 515.21
MW-16A 520.01 525.01
MW-16B 505.56 510.56
MW-16B 505.56 510.56
MW-16C 483.56 488.56
MW-16A 520.01 525.01
MW-16C 483.56 488.56
MW-17A 519.54 524.54
MW-17B 501.54 506.54
MW-18A 520.36 525.36
MW-18B 507.36 512.36
MW-19A 513.70 518.70
MW-19B 496.70 501.70
MW-19B 496.70 501.70
MW-19C 486.70 491.70
MW-19A 513.70 518.70MW-19C 486.70 491.70
Notes:Positive number indicates downward hydraulic grad
Screen Elevation (ft ASL)
,installed at the time of the November 2009 sampling event.
Oct-12 Oct-12 Oct-12 Dec-12 Dec-12 Dec-12
Groundwater Elevation(ft ASL)
Vertical Gradient
Upward/Downward
Groundwater Elevation(ft ASL)
Vertical Gradient
Upward/Downward
532.45 0.055434 Downward 531.94 0.060758 Downward530.68 530.00
529.35 0.0614331 Downward 529.30 0.0785393 Downward527.26 526.63
523.84 -0.0080236 Upward 524.06 -0.0058496 Upward523.99 524.17
524.14 0.0081554 Downward 524.04 -0.0081792 Upward524.00 524.18
524.53 -0.0357888 Upward 524.70 -0.0265713 Upward525.16 525.17
526.86 -0.0322643 Upward 526.83 -0.0260600 Upward527.43 527.29
526.33 0.0070674 Downward 526.39 0.0264165 Downward526.06 525.38
524.21 -0.011738 Upward 524.46 -0.009266 Upward524.40 524.61
523.88 -0.0085699 Upward 524.08 0.0455750 Downward523.96 523.65
523.35 -0.0315712 Upward 523.63 -0.0239826 Upward523.78 523.96
523.78 -0.009091 Upward 523.96 -0.010000 Upward523.98 524.18
523.35 -0.0176867 Upward 523.63 -0.0153803 Upward523.98 524.18
523.26 0.0040323 Downward 523.25 -0.0097954 Upward523.19 523.42
523.15 -0.0050441 Upward 523.38 -0.0033306 Upward523.21 523.42
522.32 -0.035294 Upward 522.65 -0.031765 Upward522.92 523.19
522.92 -0.003000 Upward 523.19 0.017000 Downward522.95 523.02
522.32 -0.023333 Upward 522.65 -0.013704 Upward522.95 523.02
ERM Page 5 of 6 General Electric

Table 2Groundwater Vertical Gradient DataGE Aviation210 Columbian Ave, Rutland, VT
Well
Designation Bottom Top
MW-7 518.03 523.03
MW-6 486.10 491.10
MW-2 528.99 533.99
MW-13 492.65 497.65
MW-4 519.29 524.29
MW-8 500.37 505.37
MW-5 519.45 524.45
MW-9 502.13 507.13
MW-10A 521.36 526.36
MW-10B 502.84 507.84
MW-11A 522.57 527.57
MW-11B 504.55 509.55
MW-12A 522.05 527.05
MW-12B 483.49 488.49
MW-14A 518.98 523.98
MW-14B 502.79 507.79
MW-15A 520.21 525.21
MW-15B 510.21 515.21
MW-16A 520.01 525.01
MW-16B 505.56 510.56
MW-16B 505.56 510.56
MW-16C 483.56 488.56
MW-16A 520.01 525.01
MW-16C 483.56 488.56
MW-17A 519.54 524.54
MW-17B 501.54 506.54
MW-18A 520.36 525.36
MW-18B 507.36 512.36
MW-19A 513.70 518.70
MW-19B 496.70 501.70
MW-19B 496.70 501.70
MW-19C 486.70 491.70
MW-19A 513.70 518.70MW-19C 486.70 491.70
Notes:Positive number indicates downward hydraulic grad
Screen Elevation (ft ASL)
,installed at the time of the November 2009 sampling event.
Mar-13 Mar-13 Mar-13 Jun-13 Jun-13 Jun-13
Groundwater Elevation(ft ASL)
Vertical Gradient
Upward/Downward
Groundwater Elevation(ft ASL)
Vertical Gradient
Upward/Downward
531.92 0.061697 Downward 534.74 0.063890 Downward529.95 532.70
558.75 0.6570099 Downward 531.24 0.0657787 Downward526.74 528.94
524.35 -0.006343 Upward 524.83 -0.010571 Upward524.47 525.03
524.29 -0.0098599 Upward 525.06 0.006928 Downward524.46 524.94
525.05 -0.0229521 Upward 525.78 -0.0246869 Upward525.46 526.23
527.07 -0.0241959 Upward 528.41 -0.035514 Upward527.50 529.05
526.45 0.0250891 Downward 527.78 0.017893 Downward525.49 527.09
524.37 -0.012973 Upward 524.61 -0.017297 Upward524.58 524.89
523.78 0.0129241 Downward 524.49 0.0010373 Downward523.66 524.48
523.76 -0.0318264 Upward 524.40 -0.0113114 Upward524.20 524.56
524.20 -0.008636 Upward 524.56 -0.010909 Upward524.39 524.80
523.76 -0.0175855 Upward 524.40 -0.0110665 Upward524.39 524.80
523.68 -0.0017075 Upward 524.38 0.0066964 Downward523.71 524.26
523.61 -0.0107216 Upward 524.26 -0.0056225 Upward523.74 524.33
522.74 -0.035294 Upward 523.07 -0.045294 Upward523.34 523.84
523.34 0.019000 Downward 523.84 -0.006000 Upward523.15 523.90
522.74 -0.015185 Upward 523.07 -0.030741 Upward523.15 523.90
ERM Page 6 of 6 General Electric
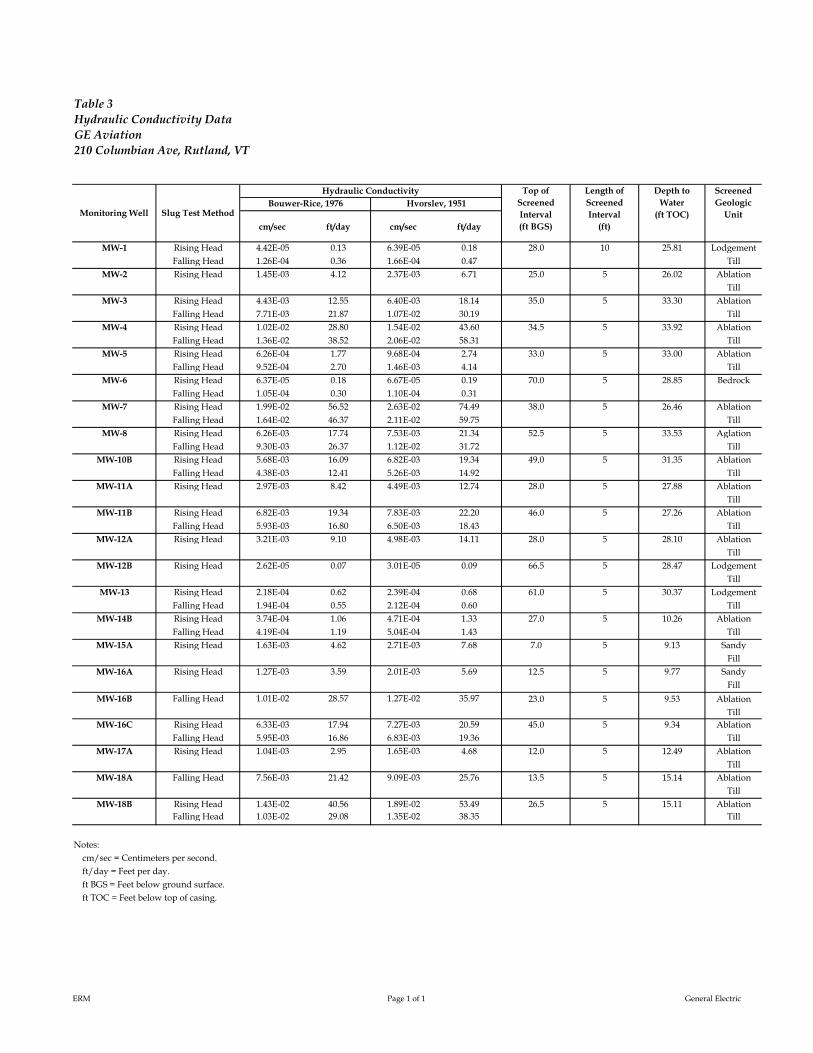
Table 3Hydraulic Conductivity DataGE Aviation210 Columbian Ave, Rutland, VT
cm/sec ft/day cm/sec ft/day
MW-1 Rising Head 4.42E-05 0.13 6.39E-05 0.18 28.0 10 25.81 LodgementFalling Head 1.26E-04 0.36 1.66E-04 0.47 Till
MW-2 Rising Head 1.45E-03 4.12 2.37E-03 6.71 25.0 5 26.02 AblationTill
MW-3 Rising Head 4.43E-03 12.55 6.40E-03 18.14 35.0 5 33.30 AblationFalling Head 7.71E-03 21.87 1.07E-02 30.19 Till
MW-4 Rising Head 1.02E-02 28.80 1.54E-02 43.60 34.5 5 33.92 AblationFalling Head 1.36E-02 38.52 2.06E-02 58.31 Till
MW-5 Rising Head 6.26E-04 1.77 9.68E-04 2.74 33.0 5 33.00 AblationFalling Head 9.52E-04 2.70 1.46E-03 4.14 Till
MW-6 Rising Head 6.37E-05 0.18 6.67E-05 0.19 70.0 5 28.85 BedrockFalling Head 1.05E-04 0.30 1.10E-04 0.31
MW-7 Rising Head 1.99E-02 56.52 2.63E-02 74.49 38.0 5 26.46 AblationFalling Head 1.64E-02 46.37 2.11E-02 59.75 Till
MW-8 Rising Head 6.26E-03 17.74 7.53E-03 21.34 52.5 5 33.53 AglationFalling Head 9.30E-03 26.37 1.12E-02 31.72 Till
MW-10B Rising Head 5.68E-03 16.09 6.82E-03 19.34 49.0 5 31.35 AblationFalling Head 4.38E-03 12.41 5.26E-03 14.92 Till
MW-11A Rising Head 2.97E-03 8.42 4.49E-03 12.74 28.0 5 27.88 AblationTill
MW-11B Rising Head 6.82E-03 19.34 7.83E-03 22.20 46.0 5 27.26 AblationFalling Head 5.93E-03 16.80 6.50E-03 18.43 Till
MW-12A Rising Head 3.21E-03 9.10 4.98E-03 14.11 28.0 5 28.10 AblationTill
MW-12B Rising Head 2.62E-05 0.07 3.01E-05 0.09 66.5 5 28.47 LodgementTill
MW-13 Rising Head 2.18E-04 0.62 2.39E-04 0.68 61.0 5 30.37 LodgementFalling Head 1.94E-04 0.55 2.12E-04 0.60 Till
MW-14B Rising Head 3.74E-04 1.06 4.71E-04 1.33 27.0 5 10.26 AblationFalling Head 4.19E-04 1.19 5.04E-04 1.43 Till
MW-15A Rising Head 1.63E-03 4.62 2.71E-03 7.68 7.0 5 9.13 SandyFill
MW-16A Rising Head 1.27E-03 3.59 2.01E-03 5.69 12.5 5 9.77 SandyFill
MW-16B Falling Head 1.01E-02 28.57 1.27E-02 35.97 23.0 5 9.53 AblationTill
MW-16C Rising Head 6.33E-03 17.94 7.27E-03 20.59 45.0 5 9.34 AblationFalling Head 5.95E-03 16.86 6.83E-03 19.36 Till
MW-17A Rising Head 1.04E-03 2.95 1.65E-03 4.68 12.0 5 12.49 AblationTill
MW-18A Falling Head 7.56E-03 21.42 9.09E-03 25.76 13.5 5 15.14 AblationTill
MW-18B Rising Head 1.43E-02 40.56 1.89E-02 53.49 26.5 5 15.11 AblationFalling Head 1.03E-02 29.08 1.35E-02 38.35 Till
Notes:cm/sec = Centimeters per second.ft/day = Feet per day.ft BGS = Feet below ground surface.ft TOC = Feet below top of casing.
Monitoring Well Slug Test Method
Screened Geologic
Unit
Length of Screened Interval
(ft)
Depth to Water
(ft TOC)
Hydraulic ConductivityBouwer-Rice, 1976 Hvorslev, 1951
Top of Screened Interval (ft BGS)
ERM Page 1 of 1 General Electric
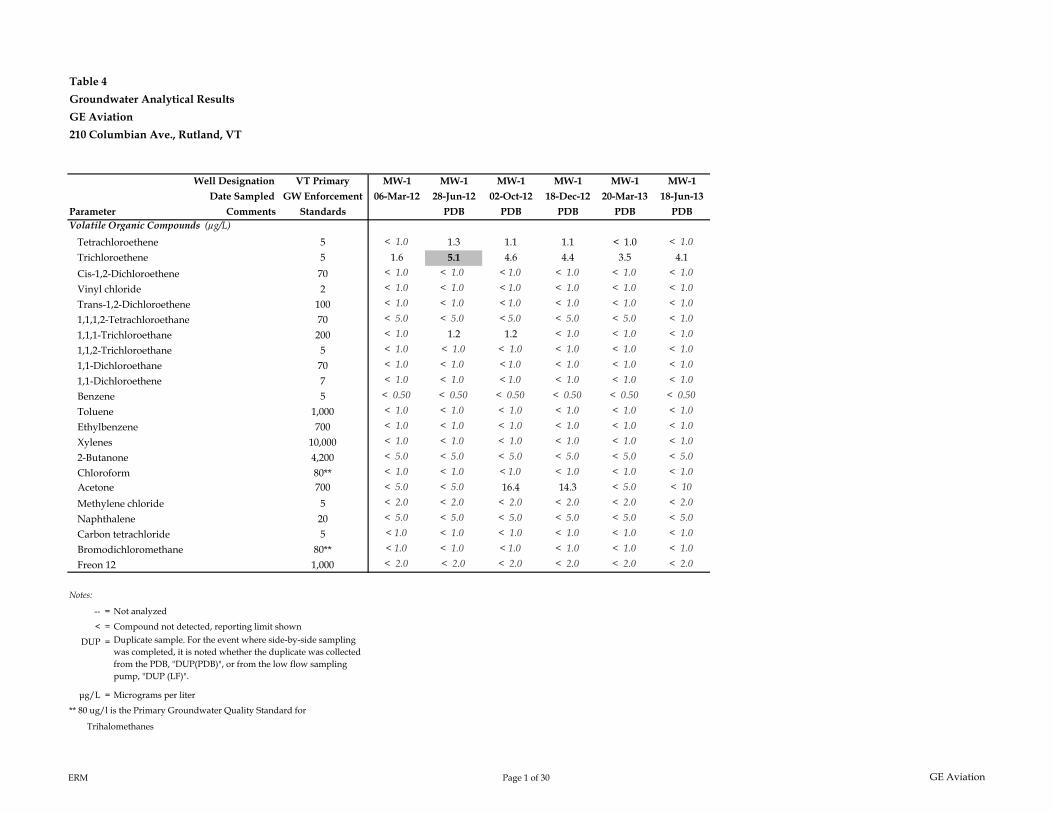
Table 4
Groundwater Analytical Results
GE Aviation
210 Columbian Ave., Rutland, VT
Well Designation VT Primary MW-1 MW-1 MW-1 MW-1 MW-1 MW-1
Date Sampled GW Enforcement 06-Mar-12 28-Jun-12 02-Oct-12 18-Dec-12 20-Mar-13 18-Jun-13
Standards PDB PDB PDB PDB PDBVolatile Organic Compounds (µg/L)
Tetrachloroethene 5 < 1.0 1.3 1.1 1.1 < 1.0 < 1.0
Trichloroethene 5 1.6 5.1 4.6 4.4 3.5 4.1
Cis-1,2-Dichloroethene 70 < 1.0 < 1.0 < 1.0 < 1.0 < 1.0 < 1.0
Vinyl chloride 2 < 1.0 < 1.0 < 1.0 < 1.0 < 1.0 < 1.0
Trans-1,2-Dichloroethene 100 < 1.0 < 1.0 < 1.0 < 1.0 < 1.0 < 1.0
1,1,1,2-Tetrachloroethane 70 < 5.0 < 5.0 < 5.0 < 5.0 < 5.0 < 1.0
1,1,1-Trichloroethane 200 < 1.0 1.2 1.2 < 1.0 < 1.0 < 1.0
1,1,2-Trichloroethane 5 < 1.0 < 1.0 < 1.0 < 1.0 < 1.0 < 1.0
1,1-Dichloroethane 70 < 1.0 < 1.0 < 1.0 < 1.0 < 1.0 < 1.0
1,1-Dichloroethene 7 < 1.0 < 1.0 < 1.0 < 1.0 < 1.0 < 1.0
Benzene 5 < 0.50 < 0.50 < 0.50 < 0.50 < 0.50 < 0.50
Toluene 1,000 < 1.0 < 1.0 < 1.0 < 1.0 < 1.0 < 1.0
Ethylbenzene 700 < 1.0 < 1.0 < 1.0 < 1.0 < 1.0 < 1.0
Xylenes 10,000 < 1.0 < 1.0 < 1.0 < 1.0 < 1.0 < 1.0
2-Butanone 4,200 < 5.0 < 5.0 < 5.0 < 5.0 < 5.0 < 5.0
Chloroform 80** < 1.0 < 1.0 < 1.0 < 1.0 < 1.0 < 1.0
Acetone 700 < 5.0 < 5.0 16.4 14.3 < 5.0 < 10
Methylene chloride 5 < 2.0 < 2.0 < 2.0 < 2.0 < 2.0 < 2.0
Naphthalene 20 < 5.0 < 5.0 < 5.0 < 5.0 < 5.0 < 5.0
Carbon tetrachloride 5 < 1.0 < 1.0 < 1.0 < 1.0 < 1.0 < 1.0
Bromodichloromethane 80** < 1.0 < 1.0 < 1.0 < 1.0 < 1.0 < 1.0
Freon 12 1,000 < 2.0 < 2.0 < 2.0 < 2.0 < 2.0 < 2.0
Notes:
-- =
< =
DUP =
μg/L =
Trihalomethanes
** 80 ug/l is the Primary Groundwater Quality Standard for
Parameter Comments
Compound not detected, reporting limit shown
Not analyzed
Micrograms per liter
Duplicate sample. For the event where side-by-side sampling was completed, it is noted whether the duplicate was collected from the PDB, "DUP(PDB)", or from the low flow sampling pump, "DUP (LF)".
ERM Page 1 of 30 GE Aviation
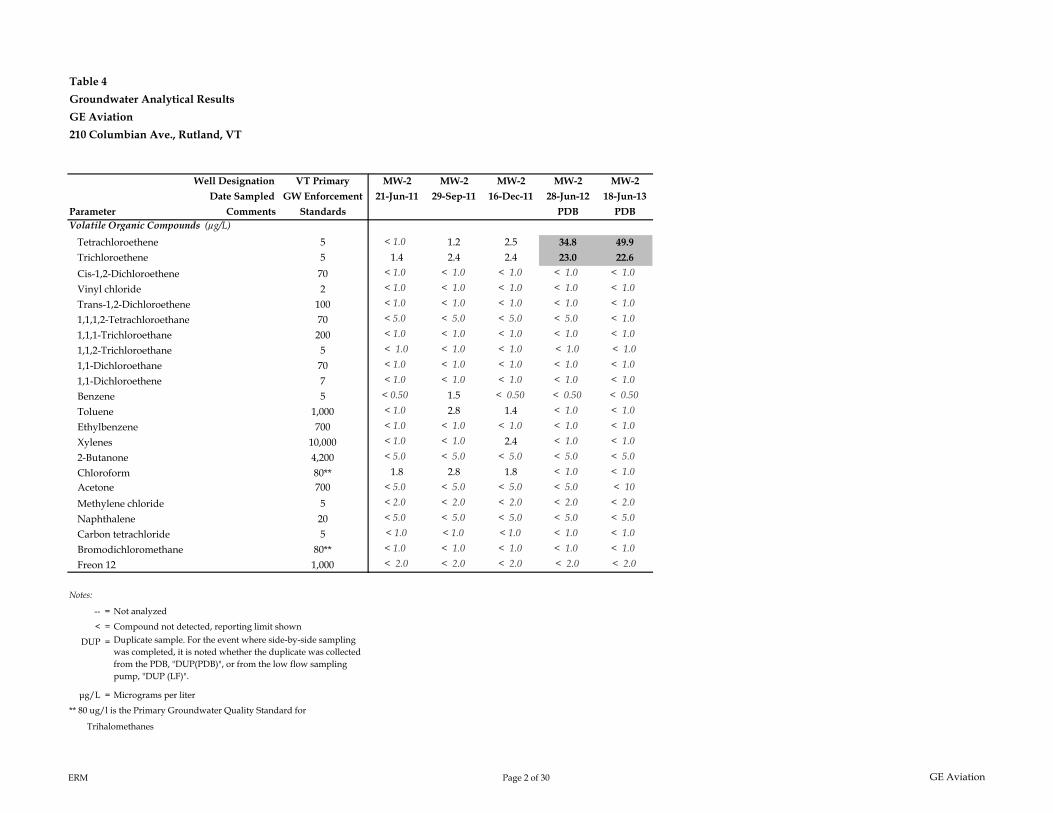
Table 4
Groundwater Analytical Results
GE Aviation
210 Columbian Ave., Rutland, VT
Well Designation VT Primary
Date Sampled GW Enforcement
StandardsVolatile Organic Compounds (µg/L)
Tetrachloroethene 5
Trichloroethene 5
Cis-1,2-Dichloroethene 70
Vinyl chloride 2
Trans-1,2-Dichloroethene 100
1,1,1,2-Tetrachloroethane 70
1,1,1-Trichloroethane 200
1,1,2-Trichloroethane 5
1,1-Dichloroethane 70
1,1-Dichloroethene 7
Benzene 5
Toluene 1,000
Ethylbenzene 700
Xylenes 10,000
2-Butanone 4,200
Chloroform 80**Acetone 700
Methylene chloride 5
Naphthalene 20
Carbon tetrachloride 5
Bromodichloromethane 80**
Freon 12 1,000
Notes:
-- =
< =
DUP =
μg/L =
Trihalomethanes
** 80 ug/l is the Primary Groundwater Quality Standard for
Parameter Comments
Compound not detected, reporting limit shown
Not analyzed
Micrograms per liter
Duplicate sample. For the event where side-by-side sampling was completed, it is noted whether the duplicate was collected from the PDB, "DUP(PDB)", or from the low flow sampling pump, "DUP (LF)".
MW-2 MW-2 MW-2 MW-2 MW-2
21-Jun-11 29-Sep-11 16-Dec-11 28-Jun-12 18-Jun-13
PDB PDB
< 1.0 1.2 2.5 34.8 49.9
1.4 2.4 2.4 23.0 22.6< 1.0 < 1.0 < 1.0 < 1.0 < 1.0
< 1.0 < 1.0 < 1.0 < 1.0 < 1.0
< 1.0 < 1.0 < 1.0 < 1.0 < 1.0
< 5.0 < 5.0 < 5.0 < 5.0 < 1.0
< 1.0 < 1.0 < 1.0 < 1.0 < 1.0
< 1.0 < 1.0 < 1.0 < 1.0 < 1.0
< 1.0 < 1.0 < 1.0 < 1.0 < 1.0
< 1.0 < 1.0 < 1.0 < 1.0 < 1.0
< 0.50 1.5 < 0.50 < 0.50 < 0.50
< 1.0 2.8 1.4 < 1.0 < 1.0
< 1.0 < 1.0 < 1.0 < 1.0 < 1.0
< 1.0 < 1.0 2.4 < 1.0 < 1.0
< 5.0 < 5.0 < 5.0 < 5.0 < 5.0
1.8 2.8 1.8 < 1.0 < 1.0
< 5.0 < 5.0 < 5.0 < 5.0 < 10
< 2.0 < 2.0 < 2.0 < 2.0 < 2.0
< 5.0 < 5.0 < 5.0 < 5.0 < 5.0
< 1.0 < 1.0 < 1.0 < 1.0 < 1.0
< 1.0 < 1.0 < 1.0 < 1.0 < 1.0
< 2.0 < 2.0 < 2.0 < 2.0 < 2.0
ERM Page 2 of 30 GE Aviation

Table 4
Groundwater Analytical Results
GE Aviation
210 Columbian Ave., Rutland, VT
Well Designation VT Primary
Date Sampled GW Enforcement
StandardsVolatile Organic Compounds (µg/L)
Tetrachloroethene 5
Trichloroethene 5
Cis-1,2-Dichloroethene 70
Vinyl chloride 2
Trans-1,2-Dichloroethene 100
1,1,1,2-Tetrachloroethane 70
1,1,1-Trichloroethane 200
1,1,2-Trichloroethane 5
1,1-Dichloroethane 70
1,1-Dichloroethene 7
Benzene 5
Toluene 1,000
Ethylbenzene 700
Xylenes 10,000
2-Butanone 4,200
Chloroform 80**Acetone 700
Methylene chloride 5
Naphthalene 20
Carbon tetrachloride 5
Bromodichloromethane 80**
Freon 12 1,000
Notes:
-- =
< =
DUP =
μg/L =
Trihalomethanes
** 80 ug/l is the Primary Groundwater Quality Standard for
Parameter Comments
Compound not detected, reporting limit shown
Not analyzed
Micrograms per liter
Duplicate sample. For the event where side-by-side sampling was completed, it is noted whether the duplicate was collected from the PDB, "DUP(PDB)", or from the low flow sampling pump, "DUP (LF)".
MW-3 MW-3 MW-3 MW-3 MW-3 MW-3
06-Mar-12 28-Jun-12 02-Oct-12 18-Dec-12 20-Mar-13 18-Jun-13
PDB PDB PDB PDB PDB
1.4 2.3 1.3 3.3 2.5 3.0
25.8 57.4 79.2 222 267 210< 1.0 < 1.0 < 1.0 < 1.0 < 1.0 1.3< 1.0 < 1.0 < 1.0 < 1.0 < 1.0 < 1.0
< 1.0 < 1.0 < 1.0 < 1.0 < 1.0 < 1.0
< 5.0 < 5.0 < 5.0 < 5.0 < 5.0 < 1.0
< 1.0 < 1.0 < 1.0 < 1.0 < 1.0 < 1.0
< 1.0 < 1.0 < 1.0 < 1.0 < 1.0 < 1.0
< 1.0 < 1.0 < 1.0 < 1.0 < 1.0 < 1.0
< 1.0 < 1.0 < 1.0 < 1.0 < 1.0 < 1.0
< 0.50 < 0.50 < 0.50 < 0.50 < 0.50 < 0.50
< 1.0 < 1.0 < 1.0 < 1.0 < 1.0 < 1.0
< 1.0 < 1.0 < 1.0 < 1.0 < 1.0 < 1.0
< 1.0 < 1.0 < 1.0 < 1.0 < 1.0 < 1.0
< 5.0 < 5.0 < 5.0 < 5.0 < 5.0 < 5.0
1.6 2.5 2.1 2.1 2.2 2.6< 5.0 < 5.0 9.0 7.2 < 5.0 < 10
< 2.0 < 2.0 < 2.0 < 2.0 < 2.0 < 2.0
< 5.0 < 5.0 < 5.0 < 5.0 < 5.0 < 5.0
< 1.0 < 1.0 < 1.0 < 1.0 < 1.0 < 1.0
< 1.0 < 1.0 < 1.0 < 1.0 < 1.0 < 1.0
< 2.0 < 2.0 < 2.0 < 2.0 < 2.0 < 2.0
ERM Page 3 of 30 GE Aviation
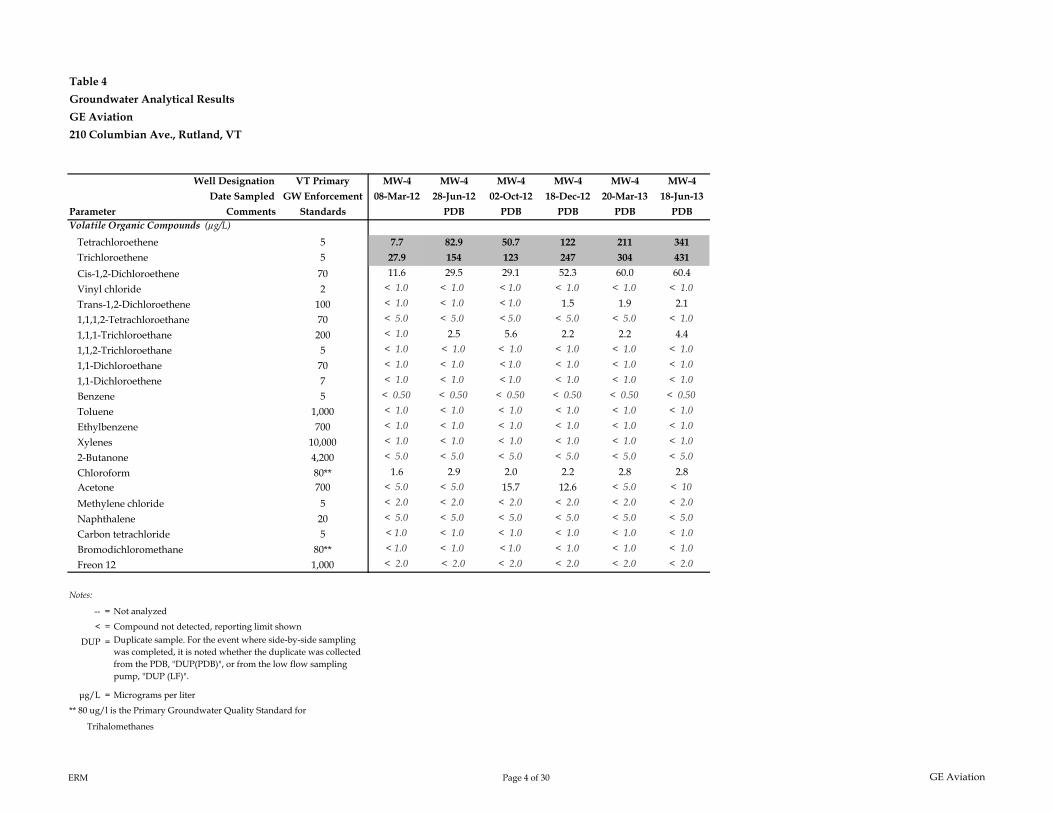
Table 4
Groundwater Analytical Results
GE Aviation
210 Columbian Ave., Rutland, VT
Well Designation VT Primary
Date Sampled GW Enforcement
StandardsVolatile Organic Compounds (µg/L)
Tetrachloroethene 5
Trichloroethene 5
Cis-1,2-Dichloroethene 70
Vinyl chloride 2
Trans-1,2-Dichloroethene 100
1,1,1,2-Tetrachloroethane 70
1,1,1-Trichloroethane 200
1,1,2-Trichloroethane 5
1,1-Dichloroethane 70
1,1-Dichloroethene 7
Benzene 5
Toluene 1,000
Ethylbenzene 700
Xylenes 10,000
2-Butanone 4,200
Chloroform 80**Acetone 700
Methylene chloride 5
Naphthalene 20
Carbon tetrachloride 5
Bromodichloromethane 80**
Freon 12 1,000
Notes:
-- =
< =
DUP =
μg/L =
Trihalomethanes
** 80 ug/l is the Primary Groundwater Quality Standard for
Parameter Comments
Compound not detected, reporting limit shown
Not analyzed
Micrograms per liter
Duplicate sample. For the event where side-by-side sampling was completed, it is noted whether the duplicate was collected from the PDB, "DUP(PDB)", or from the low flow sampling pump, "DUP (LF)".
MW-4 MW-4 MW-4 MW-4 MW-4 MW-4
08-Mar-12 28-Jun-12 02-Oct-12 18-Dec-12 20-Mar-13 18-Jun-13
PDB PDB PDB PDB PDB
7.7 82.9 50.7 122 211 341
27.9 154 123 247 304 431
11.6 29.5 29.1 52.3 60.0 60.4< 1.0 < 1.0 < 1.0 < 1.0 < 1.0 < 1.0
< 1.0 < 1.0 < 1.0 1.5 1.9 2.1< 5.0 < 5.0 < 5.0 < 5.0 < 5.0 < 1.0
< 1.0 2.5 5.6 2.2 2.2 4.4< 1.0 < 1.0 < 1.0 < 1.0 < 1.0 < 1.0
< 1.0 < 1.0 < 1.0 < 1.0 < 1.0 < 1.0
< 1.0 < 1.0 < 1.0 < 1.0 < 1.0 < 1.0
< 0.50 < 0.50 < 0.50 < 0.50 < 0.50 < 0.50
< 1.0 < 1.0 < 1.0 < 1.0 < 1.0 < 1.0
< 1.0 < 1.0 < 1.0 < 1.0 < 1.0 < 1.0
< 1.0 < 1.0 < 1.0 < 1.0 < 1.0 < 1.0
< 5.0 < 5.0 < 5.0 < 5.0 < 5.0 < 5.0
1.6 2.9 2.0 2.2 2.8 2.8< 5.0 < 5.0 15.7 12.6 < 5.0 < 10
< 2.0 < 2.0 < 2.0 < 2.0 < 2.0 < 2.0
< 5.0 < 5.0 < 5.0 < 5.0 < 5.0 < 5.0
< 1.0 < 1.0 < 1.0 < 1.0 < 1.0 < 1.0
< 1.0 < 1.0 < 1.0 < 1.0 < 1.0 < 1.0
< 2.0 < 2.0 < 2.0 < 2.0 < 2.0 < 2.0
ERM Page 4 of 30 GE Aviation
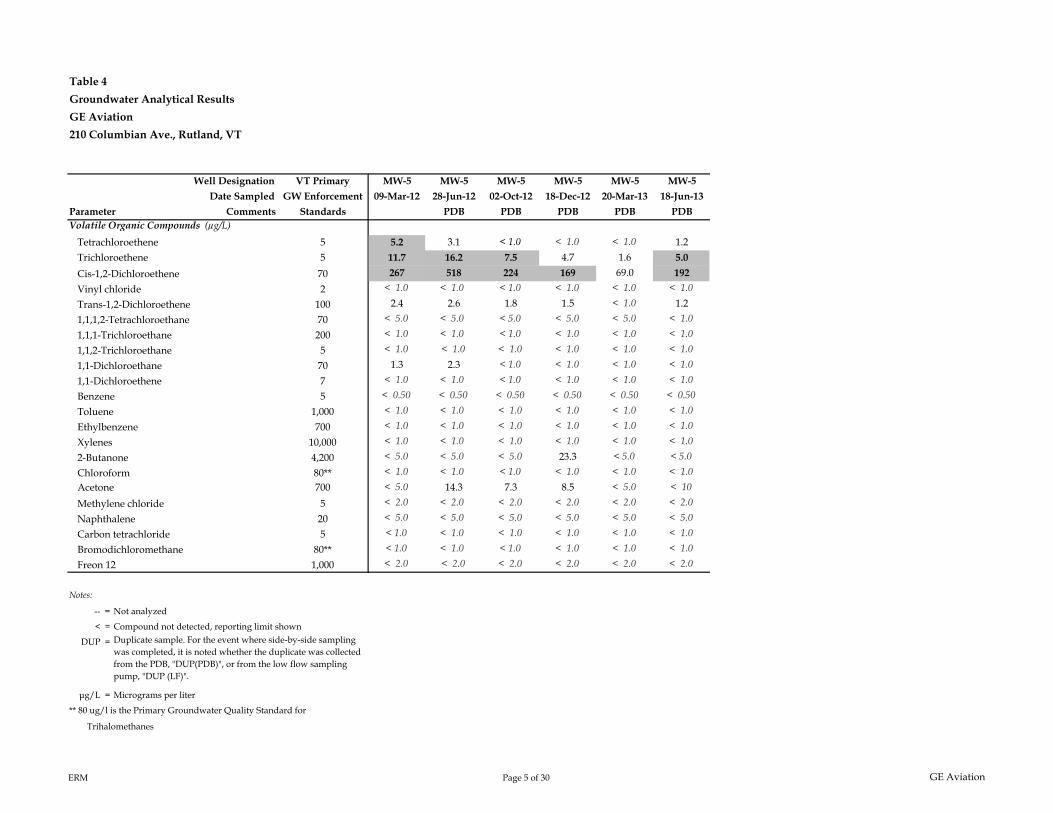
Table 4
Groundwater Analytical Results
GE Aviation
210 Columbian Ave., Rutland, VT
Well Designation VT Primary
Date Sampled GW Enforcement
StandardsVolatile Organic Compounds (µg/L)
Tetrachloroethene 5
Trichloroethene 5
Cis-1,2-Dichloroethene 70
Vinyl chloride 2
Trans-1,2-Dichloroethene 100
1,1,1,2-Tetrachloroethane 70
1,1,1-Trichloroethane 200
1,1,2-Trichloroethane 5
1,1-Dichloroethane 70
1,1-Dichloroethene 7
Benzene 5
Toluene 1,000
Ethylbenzene 700
Xylenes 10,000
2-Butanone 4,200
Chloroform 80**Acetone 700
Methylene chloride 5
Naphthalene 20
Carbon tetrachloride 5
Bromodichloromethane 80**
Freon 12 1,000
Notes:
-- =
< =
DUP =
μg/L =
Trihalomethanes
** 80 ug/l is the Primary Groundwater Quality Standard for
Parameter Comments
Compound not detected, reporting limit shown
Not analyzed
Micrograms per liter
Duplicate sample. For the event where side-by-side sampling was completed, it is noted whether the duplicate was collected from the PDB, "DUP(PDB)", or from the low flow sampling pump, "DUP (LF)".
MW-5 MW-5 MW-5 MW-5 MW-5 MW-5
09-Mar-12 28-Jun-12 02-Oct-12 18-Dec-12 20-Mar-13 18-Jun-13
PDB PDB PDB PDB PDB
5.2 3.1 < 1.0 < 1.0 < 1.0 1.2
11.7 16.2 7.5 4.7 1.6 5.0
267 518 224 169 69.0 192< 1.0 < 1.0 < 1.0 < 1.0 < 1.0 < 1.0
2.4 2.6 1.8 1.5 < 1.0 1.2< 5.0 < 5.0 < 5.0 < 5.0 < 5.0 < 1.0
< 1.0 < 1.0 < 1.0 < 1.0 < 1.0 < 1.0
< 1.0 < 1.0 < 1.0 < 1.0 < 1.0 < 1.0
1.3 2.3 < 1.0 < 1.0 < 1.0 < 1.0
< 1.0 < 1.0 < 1.0 < 1.0 < 1.0 < 1.0
< 0.50 < 0.50 < 0.50 < 0.50 < 0.50 < 0.50
< 1.0 < 1.0 < 1.0 < 1.0 < 1.0 < 1.0
< 1.0 < 1.0 < 1.0 < 1.0 < 1.0 < 1.0
< 1.0 < 1.0 < 1.0 < 1.0 < 1.0 < 1.0
< 5.0 < 5.0 < 5.0 23.3 < 5.0 < 5.0
< 1.0 < 1.0 < 1.0 < 1.0 < 1.0 < 1.0
< 5.0 14.3 7.3 8.5 < 5.0 < 10
< 2.0 < 2.0 < 2.0 < 2.0 < 2.0 < 2.0
< 5.0 < 5.0 < 5.0 < 5.0 < 5.0 < 5.0
< 1.0 < 1.0 < 1.0 < 1.0 < 1.0 < 1.0
< 1.0 < 1.0 < 1.0 < 1.0 < 1.0 < 1.0
< 2.0 < 2.0 < 2.0 < 2.0 < 2.0 < 2.0
ERM Page 5 of 30 GE Aviation
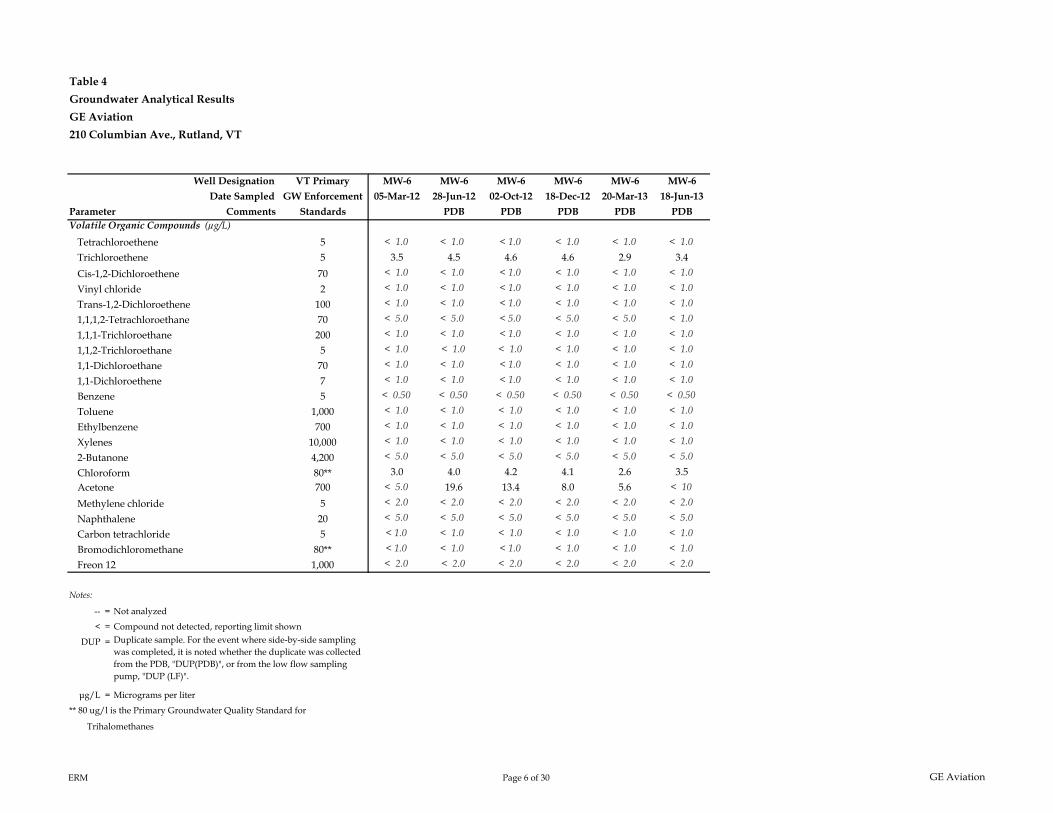
Table 4
Groundwater Analytical Results
GE Aviation
210 Columbian Ave., Rutland, VT
Well Designation VT Primary
Date Sampled GW Enforcement
StandardsVolatile Organic Compounds (µg/L)
Tetrachloroethene 5
Trichloroethene 5
Cis-1,2-Dichloroethene 70
Vinyl chloride 2
Trans-1,2-Dichloroethene 100
1,1,1,2-Tetrachloroethane 70
1,1,1-Trichloroethane 200
1,1,2-Trichloroethane 5
1,1-Dichloroethane 70
1,1-Dichloroethene 7
Benzene 5
Toluene 1,000
Ethylbenzene 700
Xylenes 10,000
2-Butanone 4,200
Chloroform 80**Acetone 700
Methylene chloride 5
Naphthalene 20
Carbon tetrachloride 5
Bromodichloromethane 80**
Freon 12 1,000
Notes:
-- =
< =
DUP =
μg/L =
Trihalomethanes
** 80 ug/l is the Primary Groundwater Quality Standard for
Parameter Comments
Compound not detected, reporting limit shown
Not analyzed
Micrograms per liter
Duplicate sample. For the event where side-by-side sampling was completed, it is noted whether the duplicate was collected from the PDB, "DUP(PDB)", or from the low flow sampling pump, "DUP (LF)".
MW-6 MW-6 MW-6 MW-6 MW-6 MW-6
05-Mar-12 28-Jun-12 02-Oct-12 18-Dec-12 20-Mar-13 18-Jun-13
PDB PDB PDB PDB PDB
< 1.0 < 1.0 < 1.0 < 1.0 < 1.0 < 1.0
3.5 4.5 4.6 4.6 2.9 3.4< 1.0 < 1.0 < 1.0 < 1.0 < 1.0 < 1.0
< 1.0 < 1.0 < 1.0 < 1.0 < 1.0 < 1.0
< 1.0 < 1.0 < 1.0 < 1.0 < 1.0 < 1.0
< 5.0 < 5.0 < 5.0 < 5.0 < 5.0 < 1.0
< 1.0 < 1.0 < 1.0 < 1.0 < 1.0 < 1.0
< 1.0 < 1.0 < 1.0 < 1.0 < 1.0 < 1.0
< 1.0 < 1.0 < 1.0 < 1.0 < 1.0 < 1.0
< 1.0 < 1.0 < 1.0 < 1.0 < 1.0 < 1.0
< 0.50 < 0.50 < 0.50 < 0.50 < 0.50 < 0.50
< 1.0 < 1.0 < 1.0 < 1.0 < 1.0 < 1.0
< 1.0 < 1.0 < 1.0 < 1.0 < 1.0 < 1.0
< 1.0 < 1.0 < 1.0 < 1.0 < 1.0 < 1.0
< 5.0 < 5.0 < 5.0 < 5.0 < 5.0 < 5.0
3.0 4.0 4.2 4.1 2.6 3.5< 5.0 19.6 13.4 8.0 5.6 < 10
< 2.0 < 2.0 < 2.0 < 2.0 < 2.0 < 2.0
< 5.0 < 5.0 < 5.0 < 5.0 < 5.0 < 5.0
< 1.0 < 1.0 < 1.0 < 1.0 < 1.0 < 1.0
< 1.0 < 1.0 < 1.0 < 1.0 < 1.0 < 1.0
< 2.0 < 2.0 < 2.0 < 2.0 < 2.0 < 2.0
ERM Page 6 of 30 GE Aviation
Table 4
Groundwater Analytical Results
GE Aviation
210 Columbian Ave., Rutland, VT
Well Designation VT Primary
Date Sampled GW Enforcement
StandardsVolatile Organic Compounds (µg/L)
Tetrachloroethene 5
Trichloroethene 5
Cis-1,2-Dichloroethene 70
Vinyl chloride 2
Trans-1,2-Dichloroethene 100
1,1,1,2-Tetrachloroethane 70
1,1,1-Trichloroethane 200
1,1,2-Trichloroethane 5
1,1-Dichloroethane 70
1,1-Dichloroethene 7
Benzene 5
Toluene 1,000
Ethylbenzene 700
Xylenes 10,000
2-Butanone 4,200
Chloroform 80**Acetone 700
Methylene chloride 5
Naphthalene 20
Carbon tetrachloride 5
Bromodichloromethane 80**
Freon 12 1,000
Notes:
-- =
< =
DUP =
μg/L =
Trihalomethanes
** 80 ug/l is the Primary Groundwater Quality Standard for
Parameter Comments
Compound not detected, reporting limit shown
Not analyzed
Micrograms per liter
Duplicate sample. For the event where side-by-side sampling was completed, it is noted whether the duplicate was collected from the PDB, "DUP(PDB)", or from the low flow sampling pump, "DUP (LF)".
MW-7 MW-7 MW-7 MW-7 MW-7 MW-7
21-Jun-11 27-Sep-11 15-Dec-11 28-Jun-12 28-Jun-12 18-Jun-13
PDB DUP PDB
< 1.0 < 1.0 < 1.0 < 1.0 < 1.0 < 1.0
< 1.0 < 1.0 < 1.0 < 1.0 < 1.0 < 1.0
< 1.0 < 1.0 < 1.0 < 1.0 < 1.0 < 1.0
< 1.0 < 1.0 < 1.0 < 1.0 < 1.0 < 1.0
< 1.0 < 1.0 < 1.0 < 1.0 < 1.0 < 1.0
< 5.0 < 5.0 < 5.0 < 5.0 < 5.0 < 1.0
< 1.0 < 1.0 < 1.0 < 1.0 < 1.0 < 1.0
< 1.0 < 1.0 < 1.0 < 1.0 < 1.0 < 1.0
< 1.0 < 1.0 < 1.0 < 1.0 < 1.0 < 1.0
< 1.0 < 1.0 < 1.0 < 1.0 < 1.0 < 1.0
< 0.50 < 0.50 < 0.50 < 0.50 < 0.50 < 0.50
< 1.0 < 1.0 1.6 < 1.0 < 1.0 < 1.0
< 1.0 < 1.0 < 1.0 < 1.0 < 1.0 < 1.0
< 1.0 < 1.0 < 1.0 < 1.0 < 1.0 < 1.0
< 5.0 < 5.0 < 5.0 < 5.0 < 5.0 < 5.0
6.7 4.0 1.8 1.0 < 1.0 1.0< 5.0 < 5.0 < 5.0 15.3 17.3 < 10
< 2.0 < 2.0 < 2.0 < 2.0 < 2.0 < 2.0
< 5.0 < 5.0 < 5.0 < 5.0 < 5.0 < 5.0
< 1.0 < 1.0 < 1.0 < 1.0 < 1.0 < 1.0
< 1.0 < 1.0 < 1.0 < 1.0 < 1.0 < 1.0
< 2.0 < 2.0 < 2.0 < 2.0 < 2.0 < 2.0
ERM Page 7 of 30 GE Aviation
Table 4
Groundwater Analytical Results
GE Aviation
210 Columbian Ave., Rutland, VT
Well Designation VT Primary
Date Sampled GW Enforcement
StandardsVolatile Organic Compounds (µg/L)
Tetrachloroethene 5
Trichloroethene 5
Cis-1,2-Dichloroethene 70
Vinyl chloride 2
Trans-1,2-Dichloroethene 100
1,1,1,2-Tetrachloroethane 70
1,1,1-Trichloroethane 200
1,1,2-Trichloroethane 5
1,1-Dichloroethane 70
1,1-Dichloroethene 7
Benzene 5
Toluene 1,000
Ethylbenzene 700
Xylenes 10,000
2-Butanone 4,200
Chloroform 80**Acetone 700
Methylene chloride 5
Naphthalene 20
Carbon tetrachloride 5
Bromodichloromethane 80**
Freon 12 1,000
Notes:
-- =
< =
DUP =
μg/L =
Trihalomethanes
** 80 ug/l is the Primary Groundwater Quality Standard for
Parameter Comments
Compound not detected, reporting limit shown
Not analyzed
Micrograms per liter
Duplicate sample. For the event where side-by-side sampling was completed, it is noted whether the duplicate was collected from the PDB, "DUP(PDB)", or from the low flow sampling pump, "DUP (LF)".
MW-8 MW-8 MW-8 MW-8 MW-8 MW-8 MW-8
08-Mar-12 28-Jun-12 02-Oct-12 18-Dec-12 18-Dec-12 20-Mar-13 18-Jun-13
PDB PDB PDB DUP PDB PDB
78.0 257 434 625 659 1,940 1,040
642 761 2,140 7,100 7,180 8,190 4,080
1.6 3.3 5.4 11.7 11.8 12.1 6.4< 1.0 < 1.0 < 1.0 < 1.0 < 1.0 < 1.0 < 1.0
< 1.0 < 1.0 < 1.0 < 1.0 < 1.0 < 1.0 < 1.0
< 5.0 < 5.0 < 5.0 < 5.0 < 5.0 < 5.0 < 1.0
< 1.0 < 1.0 < 1.0 < 1.0 < 1.0 < 1.0 < 1.0
< 1.0 < 1.0 < 1.0 1.8 1.8 < 1.0 < 1.0
< 1.0 < 1.0 < 1.0 < 1.0 < 1.0 < 1.0 < 1.0
< 1.0 < 1.0 1.4 2.6 2.6 2.0 1.2< 0.50 < 0.50 < 0.50 < 0.50 < 0.50 < 0.50 < 0.50
< 1.0 < 1.0 < 1.0 < 1.0 < 1.0 < 1.0 < 1.0
< 1.0 < 1.0 < 1.0 < 1.0 < 1.0 < 1.0 < 1.0
< 1.0 < 1.0 < 1.0 < 1.0 < 1.0 < 1.0 < 1.0
< 5.0 < 5.0 < 5.0 < 5.0 < 5.0 < 5.0 < 5.0
3.1 3.8 4.9 6.0 6.2 5.7 4.5< 5.0 < 5.0 8.3 8.1 7.0 17.6 < 10
< 2.0 < 2.0 < 2.0 < 2.0 < 2.0 < 2.0 < 2.0
< 5.0 < 5.0 < 5.0 < 5.0 < 5.0 < 5.0 < 5.0
< 1.0 < 1.0 < 1.0 < 1.0 < 1.0 < 1.0 < 1.0
< 1.0 < 1.0 < 1.0 < 1.0 < 1.0 < 1.0 < 1.0
< 2.0 < 2.0 < 2.0 < 2.0 < 2.0 < 2.0 < 2.0
ERM Page 8 of 30 GE Aviation
Table 4
Groundwater Analytical Results
GE Aviation
210 Columbian Ave., Rutland, VT
Well Designation VT Primary
Date Sampled GW Enforcement
StandardsVolatile Organic Compounds (µg/L)
Tetrachloroethene 5
Trichloroethene 5
Cis-1,2-Dichloroethene 70
Vinyl chloride 2
Trans-1,2-Dichloroethene 100
1,1,1,2-Tetrachloroethane 70
1,1,1-Trichloroethane 200
1,1,2-Trichloroethane 5
1,1-Dichloroethane 70
1,1-Dichloroethene 7
Benzene 5
Toluene 1,000
Ethylbenzene 700
Xylenes 10,000
2-Butanone 4,200
Chloroform 80**Acetone 700
Methylene chloride 5
Naphthalene 20
Carbon tetrachloride 5
Bromodichloromethane 80**
Freon 12 1,000
Notes:
-- =
< =
DUP =
μg/L =
Trihalomethanes
** 80 ug/l is the Primary Groundwater Quality Standard for
Parameter Comments
Compound not detected, reporting limit shown
Not analyzed
Micrograms per liter
Duplicate sample. For the event where side-by-side sampling was completed, it is noted whether the duplicate was collected from the PDB, "DUP(PDB)", or from the low flow sampling pump, "DUP (LF)".
MW-9 MW-9 MW-9 MW-9 MW-9 MW-9 MW-9 MW-9 MW-9 MW-9
08-Mar-12 08-Mar-12 27-Jun-12 27-Jun-12 27-Jun-12 02-Oct-12 18-Dec-12 20-Mar-13 20-Mar-13 18-Jun-13
DUP PDB DUP (PDB) PDB PDB PDB DUP PDB
105 128 238 143 152 107 55.8 36.3 37.5 87.2
370 445 437 399 384 283 228 178 180 319
8.8 9.6 12.5 8.6 8.4 4.4 4.6 6.0 5.8 8.3< 2.0 < 2.0 < 1.0 < 1.0 < 1.0 < 1.0 < 1.0 < 1.0 < 1.0 < 1.0
< 2.0 < 2.0 < 1.0 < 1.0 < 1.0 < 1.0 < 1.0 < 1.0 < 1.0 < 1.0
< 10 < 10 < 5.0 < 5.0 < 5.0 < 5.0 < 5.0 < 5.0 < 5.0 < 1.0
< 2.0 < 2.0 < 1.0 < 1.0 < 1.0 < 1.0 < 1.0 < 1.0 < 1.0 < 1.0
< 1.0 < 1.0 < 1.0 < 1.0 < 1.0 < 1.0 < 1.0 < 1.0 < 1.0 < 1.0
< 2.0 < 2.0 < 1.0 < 1.0 < 1.0 < 1.0 < 1.0 < 1.0 < 1.0 < 1.0
< 2.0 < 2.0 < 1.0 < 1.0 < 1.0 < 1.0 < 1.0 < 1.0 < 1.0 < 1.0
< 1.0 < 1.0 < 0.50 < 0.50 < 0.50 < 0.50 < 0.50 < 0.50 < 0.50 < 0.50
< 2.0 < 2.0 < 1.0 < 1.0 < 1.0 < 1.0 < 1.0 < 1.0 < 1.0 < 1.0
< 2.0 < 2.0 < 1.0 < 1.0 < 1.0 < 1.0 < 1.0 < 1.0 < 1.0 < 1.0
3.1 < 2.0 < 1.0 < 1.0 < 1.0 < 1.0 < 1.0 < 1.0 < 1.0 < 1.0
< 10 < 10 < 5.0 < 5.0 < 5.0 < 5.0 < 5.0 < 5.0 < 5.0 < 5.0
4.3 4.7 6.2 4.8 4.8 4.7 5.2 5.2 5.4 4.9< 10 < 10 < 5.0 < 5.0 < 5.0 9.1 10.6 < 5.0 < 5.0 < 10
< 4.0 < 4.0 < 2.0 < 2.0 < 2.0 < 2.0 < 2.0 < 2.0 < 2.0 < 2.0
< 10 < 10 < 5.0 < 5.0 < 5.0 < 5.0 < 5.0 < 5.0 < 5.0 < 5.0
< 2.0 < 2.0 < 1.0 < 1.0 < 1.0 < 1.0 < 1.0 < 1.0 < 1.0 < 1.0
< 2.0 < 2.0 < 1.0 < 1.0 < 1.0 < 1.0 < 1.0 < 1.0 < 1.0 < 1.0
< 2.0 < 2.0 < 2.0 < 2.0 < 2.0 < 2.0 < 2.0 < 2.0 < 2.0 < 2.0
ERM Page 9 of 30 GE Aviation
Table 4
Groundwater Analytical Results
GE Aviation
210 Columbian Ave., Rutland, VT
Well Designation VT Primary
Date Sampled GW Enforcement
StandardsVolatile Organic Compounds (µg/L)
Tetrachloroethene 5
Trichloroethene 5
Cis-1,2-Dichloroethene 70
Vinyl chloride 2
Trans-1,2-Dichloroethene 100
1,1,1,2-Tetrachloroethane 70
1,1,1-Trichloroethane 200
1,1,2-Trichloroethane 5
1,1-Dichloroethane 70
1,1-Dichloroethene 7
Benzene 5
Toluene 1,000
Ethylbenzene 700
Xylenes 10,000
2-Butanone 4,200
Chloroform 80**Acetone 700
Methylene chloride 5
Naphthalene 20
Carbon tetrachloride 5
Bromodichloromethane 80**
Freon 12 1,000
Notes:
-- =
< =
DUP =
μg/L =
Trihalomethanes
** 80 ug/l is the Primary Groundwater Quality Standard for
Parameter Comments
Compound not detected, reporting limit shown
Not analyzed
Micrograms per liter
Duplicate sample. For the event where side-by-side sampling was completed, it is noted whether the duplicate was collected from the PDB, "DUP(PDB)", or from the low flow sampling pump, "DUP (LF)".
MW-10A MW-10A MW-10A MW-10A MW-10A MW-10A MW-10A MW-10A
08-Mar-12 28-Jun-12 02-Oct-12 02-Oct-12 18-Dec-12 20-Mar-13 18-Jun-13 18-Jun-13
PDB PDB DUP PDB PDB PDB DUP
248 525 553 643 670 351 601 582
51.8 60.3 57.5 62.8 59.6 49.2 53.5 52.1
45.9 38.1 38.8 43.9 70.2 51.6 36.1 35.6< 1.0 < 1.0 < 1.0 < 1.0 < 1.0 < 1.0 < 1.0 < 1.0
1.0 < 1.0 < 1.0 < 1.0 1.2 < 1.0 < 1.0 < 1.0
< 5.0 < 5.0 < 5.0 < 5.0 < 5.0 < 5.0 < 1.0 < 1.0
5.0 1.5 1.8 1.9 1.8 1.7 3.5 3.4< 1.0 < 1.0 < 1.0 < 1.0 < 1.0 < 1.0 < 1.0 < 1.0
< 1.0 < 1.0 < 1.0 < 1.0 < 1.0 < 1.0 < 1.0 < 1.0
< 1.0 < 1.0 < 1.0 < 1.0 < 1.0 < 1.0 < 1.0 < 1.0
< 0.50 < 0.50 < 0.50 < 0.50 < 0.50 < 0.50 < 0.50 < 0.50
< 1.0 < 1.0 < 1.0 < 1.0 < 1.0 < 1.0 < 1.0 < 1.0
< 1.0 < 1.0 < 1.0 < 1.0 < 1.0 < 1.0 < 1.0 < 1.0
< 1.0 < 1.0 < 1.0 < 1.0 < 1.0 < 1.0 < 1.0 < 1.0
< 5.0 < 5.0 < 5.0 < 5.0 11.2 < 5.0 < 5.0 < 5.0
1.7 1.1 1.1 1.2 1.6 2.5 1.7 1.7< 5.0 9.4 12.0 13.1 8.0 < 5.0 < 10 < 10
< 2.0 < 2.0 < 2.0 < 2.0 < 2.0 < 2.0 < 2.0 < 2.0
< 5.0 < 5.0 < 5.0 < 5.0 < 5.0 < 5.0 < 5.0 < 5.0
< 1.0 < 1.0 < 1.0 < 1.0 < 1.0 < 1.0 < 1.0 < 1.0
< 1.0 < 1.0 < 1.0 < 1.0 < 1.0 < 1.0 < 1.0 < 1.0
< 2.0 < 2.0 < 2.0 < 2.0 < 2.0 < 2.0 < 2.0 < 2.0
ERM Page 10 of 30 GE Aviation

Table 4
Groundwater Analytical Results
GE Aviation
210 Columbian Ave., Rutland, VT
Well Designation VT Primary
Date Sampled GW Enforcement
StandardsVolatile Organic Compounds (µg/L)
Tetrachloroethene 5
Trichloroethene 5
Cis-1,2-Dichloroethene 70
Vinyl chloride 2
Trans-1,2-Dichloroethene 100
1,1,1,2-Tetrachloroethane 70
1,1,1-Trichloroethane 200
1,1,2-Trichloroethane 5
1,1-Dichloroethane 70
1,1-Dichloroethene 7
Benzene 5
Toluene 1,000
Ethylbenzene 700
Xylenes 10,000
2-Butanone 4,200
Chloroform 80**Acetone 700
Methylene chloride 5
Naphthalene 20
Carbon tetrachloride 5
Bromodichloromethane 80**
Freon 12 1,000
Notes:
-- =
< =
DUP =
μg/L =
Trihalomethanes
** 80 ug/l is the Primary Groundwater Quality Standard for
Parameter Comments
Compound not detected, reporting limit shown
Not analyzed
Micrograms per liter
Duplicate sample. For the event where side-by-side sampling was completed, it is noted whether the duplicate was collected from the PDB, "DUP(PDB)", or from the low flow sampling pump, "DUP (LF)".
MW-10B MW-10B MW-10B MW-10B MW-10B MW-10B
08-Mar-12 28-Jun-12 02-Oct-12 18-Dec-12 20-Mar-13 18-Jun-13
PDB PDB PDB PDB PDB
5.0 12.0 13.5 10.5 17.6 22.5
21.9 14.8 18.6 20.9 15.7 19.6
1.2 1.3 1.3 < 1.0 < 1.0 < 1.0
< 1.0 < 1.0 < 1.0 < 1.0 < 1.0 < 1.0
< 1.0 < 1.0 < 1.0 < 1.0 < 1.0 < 1.0
< 5.0 < 5.0 <5.0 < 5.0 < 5.0 < 5.0
< 1.0 < 1.0 < 1.0 < 1.0 < 1.0 < 1.0
< 1.0 < 1.0 < 1.0 < 1.0 < 1.0 < 1.0
< 1.0 < 1.0 < 1.0 < 1.0 < 1.0 < 1.0
< 1.0 < 1.0 < 1.0 < 1.0 < 1.0 < 1.0
< 0.50 < 0.50 < 0.50 < 0.50 < 0.50 < 0.50
< 1.0 < 1.0 < 1.0 < 1.0 < 1.0 < 1.0
< 1.0 < 1.0 < 1.0 < 1.0 < 1.0 < 1.0
< 1.0 < 1.0 < 1.0 < 1.0 < 1.0 < 1.0
< 5.0 < 5.0 < 5.0 < 5.0 < 5.0 < 5.0
7.4 2.1 3.3 4.7 3.2 2.6< 5.0 < 5.0 10.3 11.9 < 5.0 < 10
< 2.0 < 2.0 < 2.0 < 2.0 < 2.0 < 2.0
< 5.0 < 5.0 < 5.0 < 5.0 < 5.0 < 5.0
< 1.0 < 1.0 < 1.0 < 1.0 < 1.0 < 1.0
< 1.0 < 1.0 < 1.0 < 1.0 < 1.0 < 1.0
< 2.0 < 2.0 < 2.0 < 2.0 < 2.0 < 2.0
ERM Page 11 of 30 GE Aviation

Table 4
Groundwater Analytical Results
GE Aviation
210 Columbian Ave., Rutland, VT
Well Designation VT Primary
Date Sampled GW Enforcement
StandardsVolatile Organic Compounds (µg/L)
Tetrachloroethene 5
Trichloroethene 5
Cis-1,2-Dichloroethene 70
Vinyl chloride 2
Trans-1,2-Dichloroethene 100
1,1,1,2-Tetrachloroethane 70
1,1,1-Trichloroethane 200
1,1,2-Trichloroethane 5
1,1-Dichloroethane 70
1,1-Dichloroethene 7
Benzene 5
Toluene 1,000
Ethylbenzene 700
Xylenes 10,000
2-Butanone 4,200
Chloroform 80**Acetone 700
Methylene chloride 5
Naphthalene 20
Carbon tetrachloride 5
Bromodichloromethane 80**
Freon 12 1,000
Notes:
-- =
< =
DUP =
μg/L =
Trihalomethanes
** 80 ug/l is the Primary Groundwater Quality Standard for
Parameter Comments
Compound not detected, reporting limit shown
Not analyzed
Micrograms per liter
Duplicate sample. For the event where side-by-side sampling was completed, it is noted whether the duplicate was collected from the PDB, "DUP(PDB)", or from the low flow sampling pump, "DUP (LF)".
MW-11A MW-11A MW-11A MW-11A MW-11A MW-11A
07-Mar-12 28-Jun-12 02-Oct-12 18-Dec-12 20-Mar-13 18-Jun-13
PDB PDB PDB PDB PDB
< 1.0 2.9 5.5 5.2 3.4 5.0
10.6 11.1 15.5 19.6 12.8 15.7< 1.0 < 1.0 < 1.0 < 1.0 1.7 1.6< 1.0 < 1.0 < 1.0 < 1.0 2.9 1.8< 1.0 < 1.0 < 1.0 < 1.0 < 1.0 < 1.0
< 5.0 < 5.0 < 5.0 < 5.0 < 5.0 < 1.0
< 1.0 < 1.0 < 1.0 < 1.0 < 1.0 < 1.0
< 1.0 < 1.0 < 1.0 < 1.0 < 1.0 < 1.0
< 1.0 < 1.0 < 1.0 < 1.0 < 1.0 < 1.0
< 1.0 < 1.0 < 1.0 < 1.0 < 1.0 < 1.0
< 0.50 < 0.50 < 0.50 < 0.50 < 0.50 < 0.50
< 1.0 < 1.0 < 1.0 < 1.0 < 1.0 < 1.0
< 1.0 < 1.0 < 1.0 < 1.0 < 1.0 < 1.0
< 1.0 < 1.0 < 1.0 < 1.0 < 1.0 < 1.0
< 5.0 < 5.0 < 5.0 < 5.0 < 5.0 < 5.0
4.4 4.1 3.8 3.8 2.0 1.8< 5.0 16.2 8.2 8.8 25.2 < 10
< 2.0 < 2.0 < 2.0 < 2.0 < 2.0 < 2.0
< 5.0 < 5.0 < 5.0 < 5.0 < 5.0 < 5.0
< 1.0 < 1.0 < 1.0 < 1.0 < 1.0 < 1.0
< 1.0 < 1.0 < 1.0 < 1.0 < 1.0 < 1.0
< 2.0 < 2.0 < 2.0 < 2.0 < 2.0 < 2.0
ERM Page 12 of 30 GE Aviation
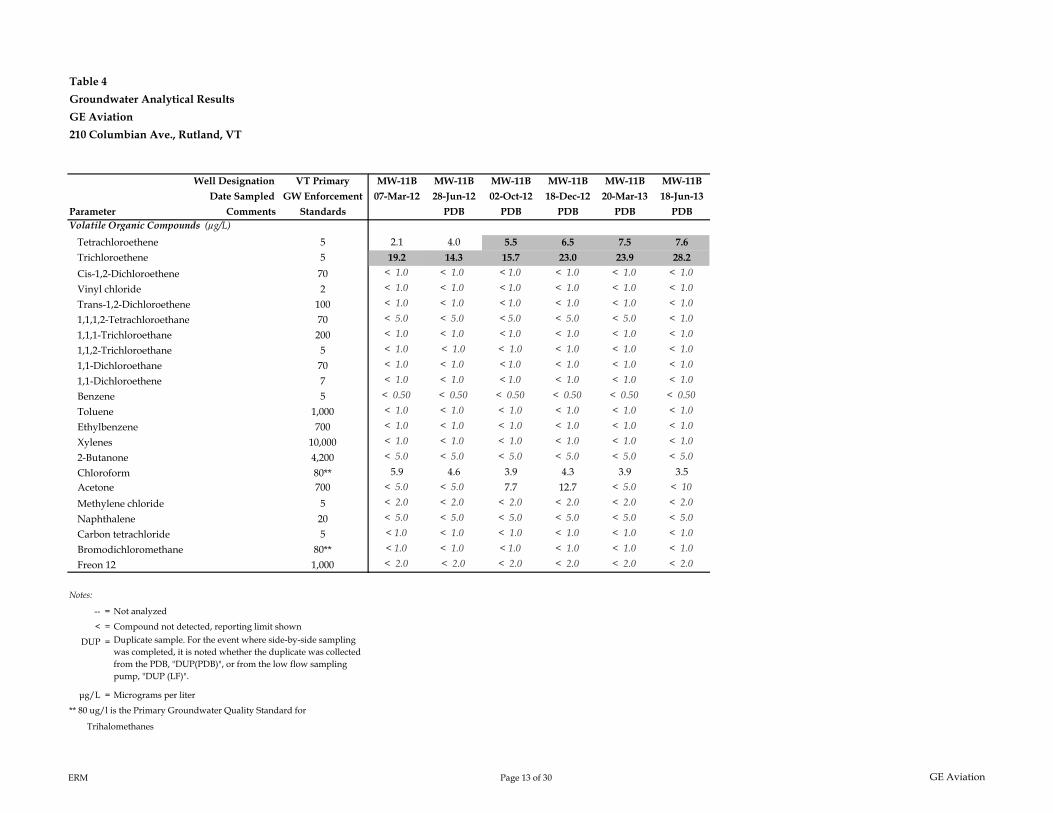
Table 4
Groundwater Analytical Results
GE Aviation
210 Columbian Ave., Rutland, VT
Well Designation VT Primary
Date Sampled GW Enforcement
StandardsVolatile Organic Compounds (µg/L)
Tetrachloroethene 5
Trichloroethene 5
Cis-1,2-Dichloroethene 70
Vinyl chloride 2
Trans-1,2-Dichloroethene 100
1,1,1,2-Tetrachloroethane 70
1,1,1-Trichloroethane 200
1,1,2-Trichloroethane 5
1,1-Dichloroethane 70
1,1-Dichloroethene 7
Benzene 5
Toluene 1,000
Ethylbenzene 700
Xylenes 10,000
2-Butanone 4,200
Chloroform 80**Acetone 700
Methylene chloride 5
Naphthalene 20
Carbon tetrachloride 5
Bromodichloromethane 80**
Freon 12 1,000
Notes:
-- =
< =
DUP =
μg/L =
Trihalomethanes
** 80 ug/l is the Primary Groundwater Quality Standard for
Parameter Comments
Compound not detected, reporting limit shown
Not analyzed
Micrograms per liter
Duplicate sample. For the event where side-by-side sampling was completed, it is noted whether the duplicate was collected from the PDB, "DUP(PDB)", or from the low flow sampling pump, "DUP (LF)".
MW-11B MW-11B MW-11B MW-11B MW-11B MW-11B
07-Mar-12 28-Jun-12 02-Oct-12 18-Dec-12 20-Mar-13 18-Jun-13
PDB PDB PDB PDB PDB
2.1 4.0 5.5 6.5 7.5 7.6
19.2 14.3 15.7 23.0 23.9 28.2< 1.0 < 1.0 < 1.0 < 1.0 < 1.0 < 1.0
< 1.0 < 1.0 < 1.0 < 1.0 < 1.0 < 1.0
< 1.0 < 1.0 < 1.0 < 1.0 < 1.0 < 1.0
< 5.0 < 5.0 < 5.0 < 5.0 < 5.0 < 1.0
< 1.0 < 1.0 < 1.0 < 1.0 < 1.0 < 1.0
< 1.0 < 1.0 < 1.0 < 1.0 < 1.0 < 1.0
< 1.0 < 1.0 < 1.0 < 1.0 < 1.0 < 1.0
< 1.0 < 1.0 < 1.0 < 1.0 < 1.0 < 1.0
< 0.50 < 0.50 < 0.50 < 0.50 < 0.50 < 0.50
< 1.0 < 1.0 < 1.0 < 1.0 < 1.0 < 1.0
< 1.0 < 1.0 < 1.0 < 1.0 < 1.0 < 1.0
< 1.0 < 1.0 < 1.0 < 1.0 < 1.0 < 1.0
< 5.0 < 5.0 < 5.0 < 5.0 < 5.0 < 5.0
5.9 4.6 3.9 4.3 3.9 3.5< 5.0 < 5.0 7.7 12.7 < 5.0 < 10
< 2.0 < 2.0 < 2.0 < 2.0 < 2.0 < 2.0
< 5.0 < 5.0 < 5.0 < 5.0 < 5.0 < 5.0
< 1.0 < 1.0 < 1.0 < 1.0 < 1.0 < 1.0
< 1.0 < 1.0 < 1.0 < 1.0 < 1.0 < 1.0
< 2.0 < 2.0 < 2.0 < 2.0 < 2.0 < 2.0
ERM Page 13 of 30 GE Aviation
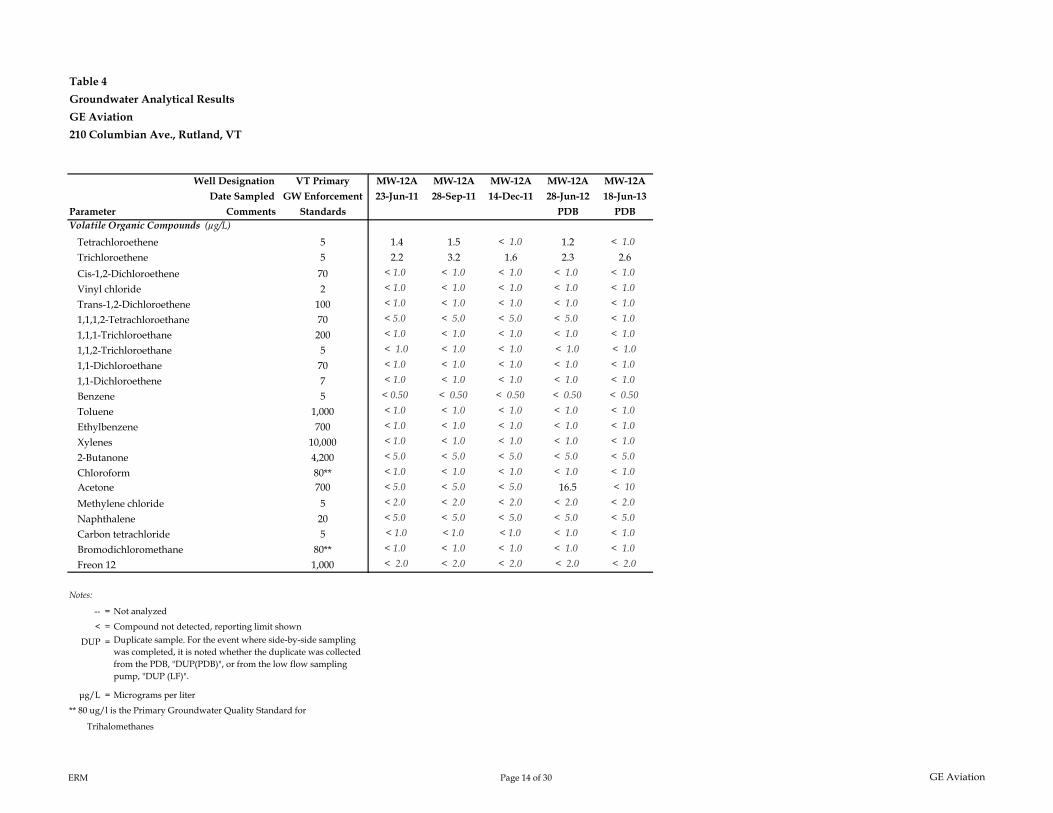
Table 4
Groundwater Analytical Results
GE Aviation
210 Columbian Ave., Rutland, VT
Well Designation VT Primary
Date Sampled GW Enforcement
StandardsVolatile Organic Compounds (µg/L)
Tetrachloroethene 5
Trichloroethene 5
Cis-1,2-Dichloroethene 70
Vinyl chloride 2
Trans-1,2-Dichloroethene 100
1,1,1,2-Tetrachloroethane 70
1,1,1-Trichloroethane 200
1,1,2-Trichloroethane 5
1,1-Dichloroethane 70
1,1-Dichloroethene 7
Benzene 5
Toluene 1,000
Ethylbenzene 700
Xylenes 10,000
2-Butanone 4,200
Chloroform 80**Acetone 700
Methylene chloride 5
Naphthalene 20
Carbon tetrachloride 5
Bromodichloromethane 80**
Freon 12 1,000
Notes:
-- =
< =
DUP =
μg/L =
Trihalomethanes
** 80 ug/l is the Primary Groundwater Quality Standard for
Parameter Comments
Compound not detected, reporting limit shown
Not analyzed
Micrograms per liter
Duplicate sample. For the event where side-by-side sampling was completed, it is noted whether the duplicate was collected from the PDB, "DUP(PDB)", or from the low flow sampling pump, "DUP (LF)".
MW-12A MW-12A MW-12A MW-12A MW-12A
23-Jun-11 28-Sep-11 14-Dec-11 28-Jun-12 18-Jun-13
PDB PDB
1.4 1.5 < 1.0 1.2 < 1.0
2.2 3.2 1.6 2.3 2.6< 1.0 < 1.0 < 1.0 < 1.0 < 1.0
< 1.0 < 1.0 < 1.0 < 1.0 < 1.0
< 1.0 < 1.0 < 1.0 < 1.0 < 1.0
< 5.0 < 5.0 < 5.0 < 5.0 < 1.0
< 1.0 < 1.0 < 1.0 < 1.0 < 1.0
< 1.0 < 1.0 < 1.0 < 1.0 < 1.0
< 1.0 < 1.0 < 1.0 < 1.0 < 1.0
< 1.0 < 1.0 < 1.0 < 1.0 < 1.0
< 0.50 < 0.50 < 0.50 < 0.50 < 0.50
< 1.0 < 1.0 < 1.0 < 1.0 < 1.0
< 1.0 < 1.0 < 1.0 < 1.0 < 1.0
< 1.0 < 1.0 < 1.0 < 1.0 < 1.0
< 5.0 < 5.0 < 5.0 < 5.0 < 5.0
< 1.0 < 1.0 < 1.0 < 1.0 < 1.0
< 5.0 < 5.0 < 5.0 16.5 < 10
< 2.0 < 2.0 < 2.0 < 2.0 < 2.0
< 5.0 < 5.0 < 5.0 < 5.0 < 5.0
< 1.0 < 1.0 < 1.0 < 1.0 < 1.0
< 1.0 < 1.0 < 1.0 < 1.0 < 1.0
< 2.0 < 2.0 < 2.0 < 2.0 < 2.0
ERM Page 14 of 30 GE Aviation

Table 4
Groundwater Analytical Results
GE Aviation
210 Columbian Ave., Rutland, VT
Well Designation VT Primary
Date Sampled GW Enforcement
StandardsVolatile Organic Compounds (µg/L)
Tetrachloroethene 5
Trichloroethene 5
Cis-1,2-Dichloroethene 70
Vinyl chloride 2
Trans-1,2-Dichloroethene 100
1,1,1,2-Tetrachloroethane 70
1,1,1-Trichloroethane 200
1,1,2-Trichloroethane 5
1,1-Dichloroethane 70
1,1-Dichloroethene 7
Benzene 5
Toluene 1,000
Ethylbenzene 700
Xylenes 10,000
2-Butanone 4,200
Chloroform 80**Acetone 700
Methylene chloride 5
Naphthalene 20
Carbon tetrachloride 5
Bromodichloromethane 80**
Freon 12 1,000
Notes:
-- =
< =
DUP =
μg/L =
Trihalomethanes
** 80 ug/l is the Primary Groundwater Quality Standard for
Parameter Comments
Compound not detected, reporting limit shown
Not analyzed
Micrograms per liter
Duplicate sample. For the event where side-by-side sampling was completed, it is noted whether the duplicate was collected from the PDB, "DUP(PDB)", or from the low flow sampling pump, "DUP (LF)".
MW-12B MW-12B MW-12B MW-12B MW-12B MW-12B
07-Mar-12 28-Jun-12 02-Oct-12 18-Dec-12 20-Mar-13 18-Jun-13
PDB PDB PDB PDB PDB
1.4 5.9 6.6 5.0 3.5 5.7
52.7 194 206 196 154 214< 1.0 < 1.0 < 1.0 < 1.0 < 1.0 < 1.0
< 1.0 < 1.0 < 1.0 < 1.0 < 1.0 < 1.0
< 1.0 < 1.0 < 1.0 < 1.0 < 1.0 < 1.0
< 5.0 < 5.0 < 5.0 < 5.0 < 5.0 < 1.0
< 1.0 < 1.0 < 1.0 < 1.0 < 1.0 < 1.0
< 1.0 < 1.0 < 1.0 < 1.0 < 1.0 < 1.0
< 1.0 < 1.0 < 1.0 < 1.0 < 1.0 < 1.0
< 1.0 < 1.0 < 1.0 < 1.0 < 1.0 < 1.0
< 0.50 < 0.50 < 0.50 < 0.50 < 0.50 < 0.50
< 1.0 < 1.0 < 1.0 < 1.0 < 1.0 < 1.0
< 1.0 < 1.0 < 1.0 < 1.0 < 1.0 < 1.0
< 1.0 < 1.0 < 1.0 < 1.0 < 1.0 < 1.0
< 5.0 < 5.0 < 5.0 < 5.0 < 5.0 < 5.0
2.7 5.9 6.3 6.2 5.5 6.9< 5.0 24.1 9.0 8.6 < 5.0 < 10
< 2.0 < 2.0 < 2.0 < 2.0 < 2.0 < 2.0
< 5.0 < 5.0 < 5.0 < 5.0 < 5.0 < 5.0
< 1.0 < 1.0 < 1.0 < 1.0 < 1.0 < 1.0
< 1.0 < 1.0 < 1.0 < 1.0 < 1.0 < 1.0
< 2.0 < 2.0 < 2.0 < 2.0 < 2.0 < 2.0
ERM Page 15 of 30 GE Aviation

Table 4
Groundwater Analytical Results
GE Aviation
210 Columbian Ave., Rutland, VT
Well Designation VT Primary
Date Sampled GW Enforcement
StandardsVolatile Organic Compounds (µg/L)
Tetrachloroethene 5
Trichloroethene 5
Cis-1,2-Dichloroethene 70
Vinyl chloride 2
Trans-1,2-Dichloroethene 100
1,1,1,2-Tetrachloroethane 70
1,1,1-Trichloroethane 200
1,1,2-Trichloroethane 5
1,1-Dichloroethane 70
1,1-Dichloroethene 7
Benzene 5
Toluene 1,000
Ethylbenzene 700
Xylenes 10,000
2-Butanone 4,200
Chloroform 80**Acetone 700
Methylene chloride 5
Naphthalene 20
Carbon tetrachloride 5
Bromodichloromethane 80**
Freon 12 1,000
Notes:
-- =
< =
DUP =
μg/L =
Trihalomethanes
** 80 ug/l is the Primary Groundwater Quality Standard for
Parameter Comments
Compound not detected, reporting limit shown
Not analyzed
Micrograms per liter
Duplicate sample. For the event where side-by-side sampling was completed, it is noted whether the duplicate was collected from the PDB, "DUP(PDB)", or from the low flow sampling pump, "DUP (LF)".
MW-13 MW-13 MW-13 MW-13 MW-13 MW-13
08-Mar-12 28-Jun-12 02-Oct-12 18-Dec-12 20-Mar-13 18-Jun-13
PDB PDB PDB PDB PDB
2.3 1.5 1.5 1.0 < 1.0 1.9
69.5 76.7 72.8 75.1 57.8 80.9< 1.0 < 1.0 < 1.0 < 1.0 < 1.0 < 1.0
< 1.0 < 1.0 < 1.0 < 1.0 < 1.0 < 1.0
< 1.0 < 1.0 < 1.0 < 1.0 < 1.0 < 1.0
< 5.0 < 5.0 < 5.0 < 5.0 < 5.0 < 1.0
< 1.0 < 1.0 < 1.0 < 1.0 < 1.0 < 1.0
< 1.0 < 1.0 < 1.0 < 1.0 < 1.0 < 1.0
< 1.0 < 1.0 < 1.0 < 1.0 < 1.0 < 1.0
< 1.0 < 1.0 < 1.0 < 1.0 < 1.0 < 1.0
< 0.50 < 0.50 < 0.50 < 0.50 < 0.50 < 0.50
< 1.0 < 1.0 < 1.0 < 1.0 < 1.0 < 1.0
< 1.0 < 1.0 < 1.0 < 1.0 < 1.0 < 1.0
< 1.0 < 1.0 < 1.0 < 1.0 < 1.0 < 1.0
< 5.0 < 5.0 < 5.0 < 5.0 < 5.0 < 5.0
4.8 4.6 4.5 4.6 4.3 4.9< 5.0 21.1 7.9 11.4 26.5 < 10
< 2.0 < 2.0 < 2.0 < 2.0 < 2.0 < 2.0
< 5.0 < 5.0 < 5.0 < 5.0 < 5.0 < 5.0
< 1.0 < 1.0 < 1.0 < 1.0 < 1.0 < 1.0
< 1.0 < 1.0 < 1.0 < 1.0 < 1.0 < 1.0
< 2.0 < 2.0 < 2.0 3.7 < 2.0 < 2.0
ERM Page 16 of 30 GE Aviation
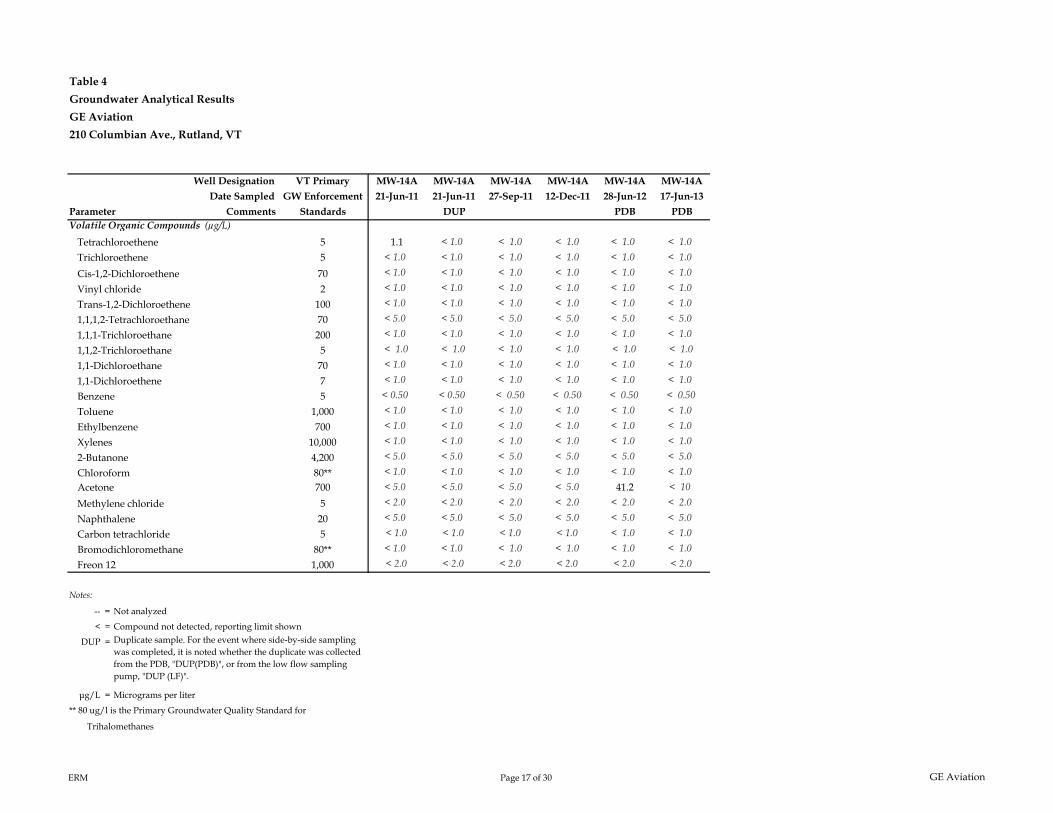
Table 4
Groundwater Analytical Results
GE Aviation
210 Columbian Ave., Rutland, VT
Well Designation VT Primary
Date Sampled GW Enforcement
StandardsVolatile Organic Compounds (µg/L)
Tetrachloroethene 5
Trichloroethene 5
Cis-1,2-Dichloroethene 70
Vinyl chloride 2
Trans-1,2-Dichloroethene 100
1,1,1,2-Tetrachloroethane 70
1,1,1-Trichloroethane 200
1,1,2-Trichloroethane 5
1,1-Dichloroethane 70
1,1-Dichloroethene 7
Benzene 5
Toluene 1,000
Ethylbenzene 700
Xylenes 10,000
2-Butanone 4,200
Chloroform 80**Acetone 700
Methylene chloride 5
Naphthalene 20
Carbon tetrachloride 5
Bromodichloromethane 80**
Freon 12 1,000
Notes:
-- =
< =
DUP =
μg/L =
Trihalomethanes
** 80 ug/l is the Primary Groundwater Quality Standard for
Parameter Comments
Compound not detected, reporting limit shown
Not analyzed
Micrograms per liter
Duplicate sample. For the event where side-by-side sampling was completed, it is noted whether the duplicate was collected from the PDB, "DUP(PDB)", or from the low flow sampling pump, "DUP (LF)".
MW-14A MW-14A MW-14A MW-14A MW-14A MW-14A
21-Jun-11 21-Jun-11 27-Sep-11 12-Dec-11 28-Jun-12 17-Jun-13
DUP PDB PDB
1.1 < 1.0 < 1.0 < 1.0 < 1.0 < 1.0
< 1.0 < 1.0 < 1.0 < 1.0 < 1.0 < 1.0
< 1.0 < 1.0 < 1.0 < 1.0 < 1.0 < 1.0
< 1.0 < 1.0 < 1.0 < 1.0 < 1.0 < 1.0
< 1.0 < 1.0 < 1.0 < 1.0 < 1.0 < 1.0
< 5.0 < 5.0 < 5.0 < 5.0 < 5.0 < 5.0
< 1.0 < 1.0 < 1.0 < 1.0 < 1.0 < 1.0
< 1.0 < 1.0 < 1.0 < 1.0 < 1.0 < 1.0
< 1.0 < 1.0 < 1.0 < 1.0 < 1.0 < 1.0
< 1.0 < 1.0 < 1.0 < 1.0 < 1.0 < 1.0
< 0.50 < 0.50 < 0.50 < 0.50 < 0.50 < 0.50
< 1.0 < 1.0 < 1.0 < 1.0 < 1.0 < 1.0
< 1.0 < 1.0 < 1.0 < 1.0 < 1.0 < 1.0
< 1.0 < 1.0 < 1.0 < 1.0 < 1.0 < 1.0
< 5.0 < 5.0 < 5.0 < 5.0 < 5.0 < 5.0
< 1.0 < 1.0 < 1.0 < 1.0 < 1.0 < 1.0
< 5.0 < 5.0 < 5.0 < 5.0 41.2 < 10
< 2.0 < 2.0 < 2.0 < 2.0 < 2.0 < 2.0
< 5.0 < 5.0 < 5.0 < 5.0 < 5.0 < 5.0
< 1.0 < 1.0 < 1.0 < 1.0 < 1.0 < 1.0
< 1.0 < 1.0 < 1.0 < 1.0 < 1.0 < 1.0
< 2.0 < 2.0 < 2.0 < 2.0 < 2.0 < 2.0
ERM Page 17 of 30 GE Aviation
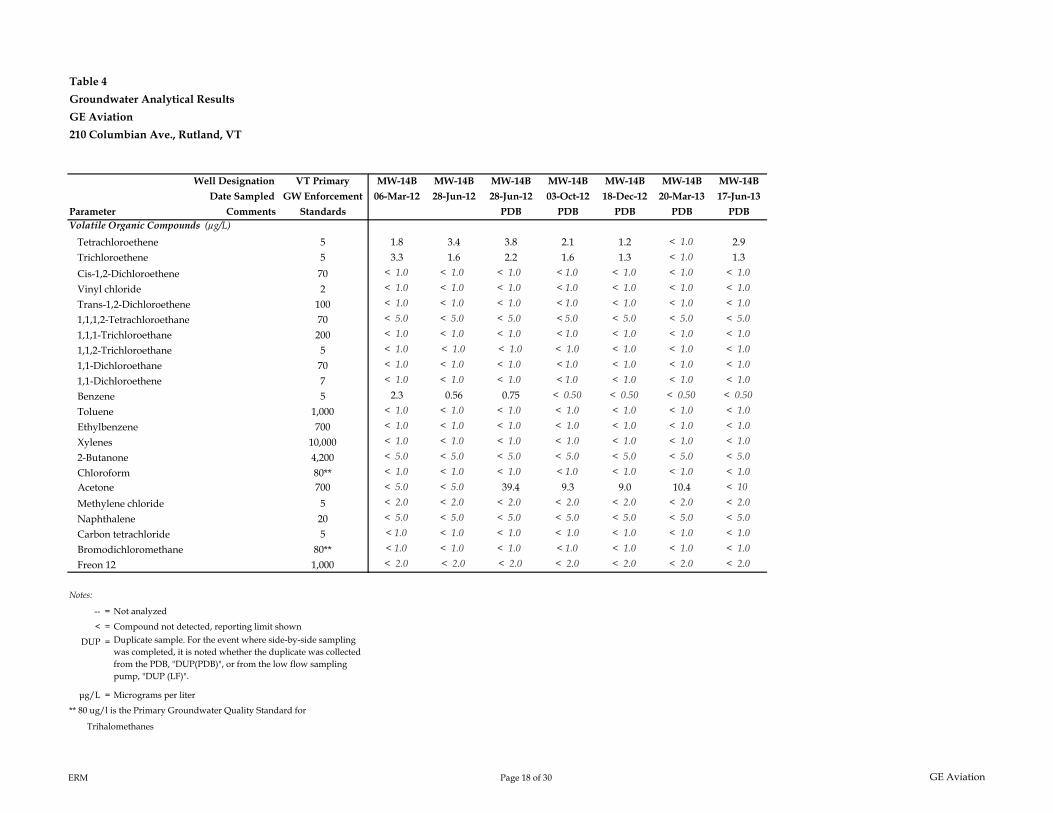
Table 4
Groundwater Analytical Results
GE Aviation
210 Columbian Ave., Rutland, VT
Well Designation VT Primary
Date Sampled GW Enforcement
StandardsVolatile Organic Compounds (µg/L)
Tetrachloroethene 5
Trichloroethene 5
Cis-1,2-Dichloroethene 70
Vinyl chloride 2
Trans-1,2-Dichloroethene 100
1,1,1,2-Tetrachloroethane 70
1,1,1-Trichloroethane 200
1,1,2-Trichloroethane 5
1,1-Dichloroethane 70
1,1-Dichloroethene 7
Benzene 5
Toluene 1,000
Ethylbenzene 700
Xylenes 10,000
2-Butanone 4,200
Chloroform 80**Acetone 700
Methylene chloride 5
Naphthalene 20
Carbon tetrachloride 5
Bromodichloromethane 80**
Freon 12 1,000
Notes:
-- =
< =
DUP =
μg/L =
Trihalomethanes
** 80 ug/l is the Primary Groundwater Quality Standard for
Parameter Comments
Compound not detected, reporting limit shown
Not analyzed
Micrograms per liter
Duplicate sample. For the event where side-by-side sampling was completed, it is noted whether the duplicate was collected from the PDB, "DUP(PDB)", or from the low flow sampling pump, "DUP (LF)".
MW-14B MW-14B MW-14B MW-14B MW-14B MW-14B MW-14B
06-Mar-12 28-Jun-12 28-Jun-12 03-Oct-12 18-Dec-12 20-Mar-13 17-Jun-13
PDB PDB PDB PDB PDB
1.8 3.4 3.8 2.1 1.2 < 1.0 2.9
3.3 1.6 2.2 1.6 1.3 < 1.0 1.3< 1.0 < 1.0 < 1.0 < 1.0 < 1.0 < 1.0 < 1.0
< 1.0 < 1.0 < 1.0 < 1.0 < 1.0 < 1.0 < 1.0
< 1.0 < 1.0 < 1.0 < 1.0 < 1.0 < 1.0 < 1.0
< 5.0 < 5.0 < 5.0 < 5.0 < 5.0 < 5.0 < 5.0
< 1.0 < 1.0 < 1.0 < 1.0 < 1.0 < 1.0 < 1.0
< 1.0 < 1.0 < 1.0 < 1.0 < 1.0 < 1.0 < 1.0
< 1.0 < 1.0 < 1.0 < 1.0 < 1.0 < 1.0 < 1.0
< 1.0 < 1.0 < 1.0 < 1.0 < 1.0 < 1.0 < 1.0
2.3 0.56 0.75 < 0.50 < 0.50 < 0.50 < 0.50
< 1.0 < 1.0 < 1.0 < 1.0 < 1.0 < 1.0 < 1.0
< 1.0 < 1.0 < 1.0 < 1.0 < 1.0 < 1.0 < 1.0
< 1.0 < 1.0 < 1.0 < 1.0 < 1.0 < 1.0 < 1.0
< 5.0 < 5.0 < 5.0 < 5.0 < 5.0 < 5.0 < 5.0
< 1.0 < 1.0 < 1.0 < 1.0 < 1.0 < 1.0 < 1.0
< 5.0 < 5.0 39.4 9.3 9.0 10.4 < 10
< 2.0 < 2.0 < 2.0 < 2.0 < 2.0 < 2.0 < 2.0
< 5.0 < 5.0 < 5.0 < 5.0 < 5.0 < 5.0 < 5.0
< 1.0 < 1.0 < 1.0 < 1.0 < 1.0 < 1.0 < 1.0
< 1.0 < 1.0 < 1.0 < 1.0 < 1.0 < 1.0 < 1.0
< 2.0 < 2.0 < 2.0 < 2.0 < 2.0 < 2.0 < 2.0
ERM Page 18 of 30 GE Aviation

Table 4
Groundwater Analytical Results
GE Aviation
210 Columbian Ave., Rutland, VT
Well Designation VT Primary
Date Sampled GW Enforcement
StandardsVolatile Organic Compounds (µg/L)
Tetrachloroethene 5
Trichloroethene 5
Cis-1,2-Dichloroethene 70
Vinyl chloride 2
Trans-1,2-Dichloroethene 100
1,1,1,2-Tetrachloroethane 70
1,1,1-Trichloroethane 200
1,1,2-Trichloroethane 5
1,1-Dichloroethane 70
1,1-Dichloroethene 7
Benzene 5
Toluene 1,000
Ethylbenzene 700
Xylenes 10,000
2-Butanone 4,200
Chloroform 80**Acetone 700
Methylene chloride 5
Naphthalene 20
Carbon tetrachloride 5
Bromodichloromethane 80**
Freon 12 1,000
Notes:
-- =
< =
DUP =
μg/L =
Trihalomethanes
** 80 ug/l is the Primary Groundwater Quality Standard for
Parameter Comments
Compound not detected, reporting limit shown
Not analyzed
Micrograms per liter
Duplicate sample. For the event where side-by-side sampling was completed, it is noted whether the duplicate was collected from the PDB, "DUP(PDB)", or from the low flow sampling pump, "DUP (LF)".
MW-15A MW-15A MW-15A MW-15A MW-15A
21-Jun-11 27-Sep-11 13-Dec-11 29-Jun-12 17-Jun-13
PDB PDB
< 1.0 < 1.0 < 1.0 < 1.0 < 1.0
< 1.0 < 1.0 < 1.0 < 1.0 < 1.0
< 1.0 < 1.0 < 1.0 < 1.0 < 1.0
< 1.0 < 1.0 < 1.0 < 1.0 < 1.0
< 1.0 < 1.0 < 1.0 < 1.0 < 1.0
< 5.0 < 5.0 < 5.0 < 5.0 < 5.0
< 1.0 < 1.0 < 1.0 < 1.0 < 1.0
< 1.0 < 1.0 < 1.0 < 1.0 < 1.0
< 1.0 < 1.0 < 1.0 < 1.0 < 1.0
< 1.0 < 1.0 < 1.0 < 1.0 < 1.0
< 0.50 < 0.50 < 0.50 < 0.50 < 0.50
< 1.0 < 1.0 < 1.0 < 1.0 < 1.0
< 1.0 < 1.0 < 1.0 < 1.0 < 1.0
< 1.0 < 1.0 < 1.0 < 1.0 < 1.0
< 5.0 < 5.0 < 5.0 < 5.0 < 5.0
< 1.0 < 1.0 < 1.0 < 1.0 < 1.0
< 5.0 < 5.0 < 5.0 26.4 < 10
< 2.0 < 2.0 < 2.0 < 2.0 < 2.0
< 5.0 < 5.0 < 5.0 < 5.0 < 5.0
< 1.0 < 1.0 < 1.0 < 1.0 < 1.0
< 1.0 < 1.0 < 1.0 < 1.0 < 1.0
< 2.0 < 2.0 < 2.0 < 2.0 < 2.0
ERM Page 19 of 30 GE Aviation
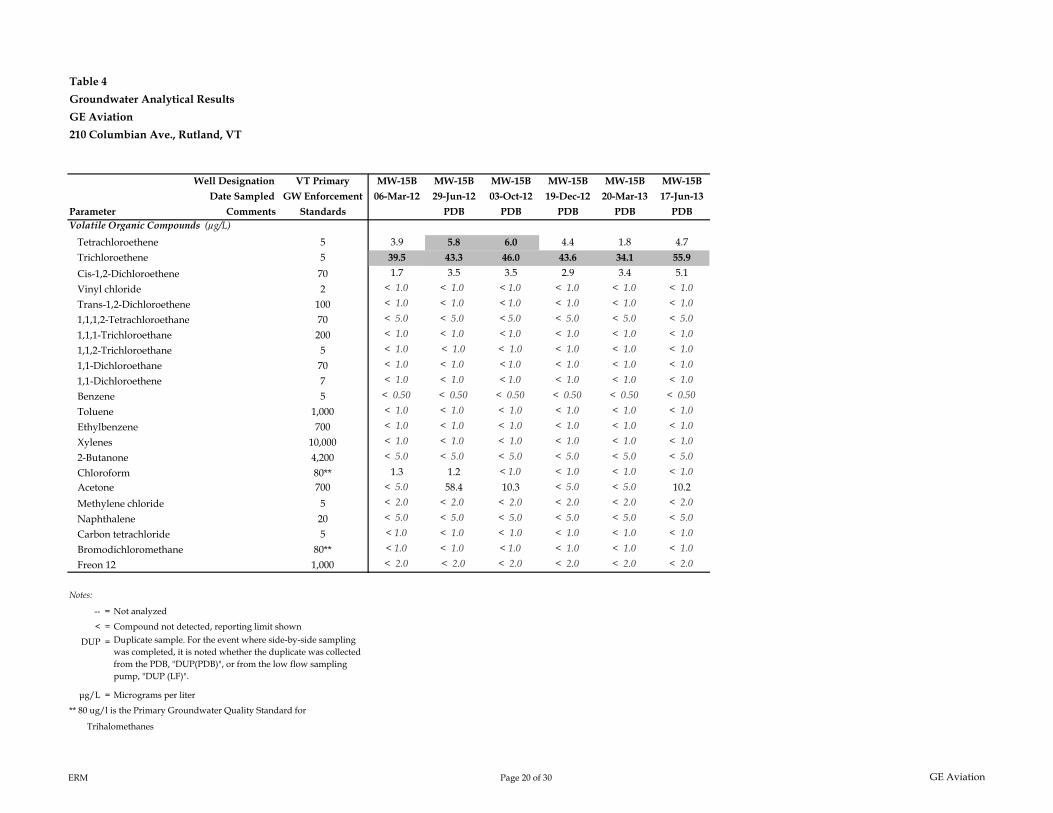
Table 4
Groundwater Analytical Results
GE Aviation
210 Columbian Ave., Rutland, VT
Well Designation VT Primary
Date Sampled GW Enforcement
StandardsVolatile Organic Compounds (µg/L)
Tetrachloroethene 5
Trichloroethene 5
Cis-1,2-Dichloroethene 70
Vinyl chloride 2
Trans-1,2-Dichloroethene 100
1,1,1,2-Tetrachloroethane 70
1,1,1-Trichloroethane 200
1,1,2-Trichloroethane 5
1,1-Dichloroethane 70
1,1-Dichloroethene 7
Benzene 5
Toluene 1,000
Ethylbenzene 700
Xylenes 10,000
2-Butanone 4,200
Chloroform 80**Acetone 700
Methylene chloride 5
Naphthalene 20
Carbon tetrachloride 5
Bromodichloromethane 80**
Freon 12 1,000
Notes:
-- =
< =
DUP =
μg/L =
Trihalomethanes
** 80 ug/l is the Primary Groundwater Quality Standard for
Parameter Comments
Compound not detected, reporting limit shown
Not analyzed
Micrograms per liter
Duplicate sample. For the event where side-by-side sampling was completed, it is noted whether the duplicate was collected from the PDB, "DUP(PDB)", or from the low flow sampling pump, "DUP (LF)".
MW-15B MW-15B MW-15B MW-15B MW-15B MW-15B
06-Mar-12 29-Jun-12 03-Oct-12 19-Dec-12 20-Mar-13 17-Jun-13
PDB PDB PDB PDB PDB
3.9 5.8 6.0 4.4 1.8 4.7
39.5 43.3 46.0 43.6 34.1 55.9
1.7 3.5 3.5 2.9 3.4 5.1< 1.0 < 1.0 < 1.0 < 1.0 < 1.0 < 1.0
< 1.0 < 1.0 < 1.0 < 1.0 < 1.0 < 1.0
< 5.0 < 5.0 < 5.0 < 5.0 < 5.0 < 5.0
< 1.0 < 1.0 < 1.0 < 1.0 < 1.0 < 1.0
< 1.0 < 1.0 < 1.0 < 1.0 < 1.0 < 1.0
< 1.0 < 1.0 < 1.0 < 1.0 < 1.0 < 1.0
< 1.0 < 1.0 < 1.0 < 1.0 < 1.0 < 1.0
< 0.50 < 0.50 < 0.50 < 0.50 < 0.50 < 0.50
< 1.0 < 1.0 < 1.0 < 1.0 < 1.0 < 1.0
< 1.0 < 1.0 < 1.0 < 1.0 < 1.0 < 1.0
< 1.0 < 1.0 < 1.0 < 1.0 < 1.0 < 1.0
< 5.0 < 5.0 < 5.0 < 5.0 < 5.0 < 5.0
1.3 1.2 < 1.0 < 1.0 < 1.0 < 1.0
< 5.0 58.4 10.3 < 5.0 < 5.0 10.2< 2.0 < 2.0 < 2.0 < 2.0 < 2.0 < 2.0
< 5.0 < 5.0 < 5.0 < 5.0 < 5.0 < 5.0
< 1.0 < 1.0 < 1.0 < 1.0 < 1.0 < 1.0
< 1.0 < 1.0 < 1.0 < 1.0 < 1.0 < 1.0
< 2.0 < 2.0 < 2.0 < 2.0 < 2.0 < 2.0
ERM Page 20 of 30 GE Aviation
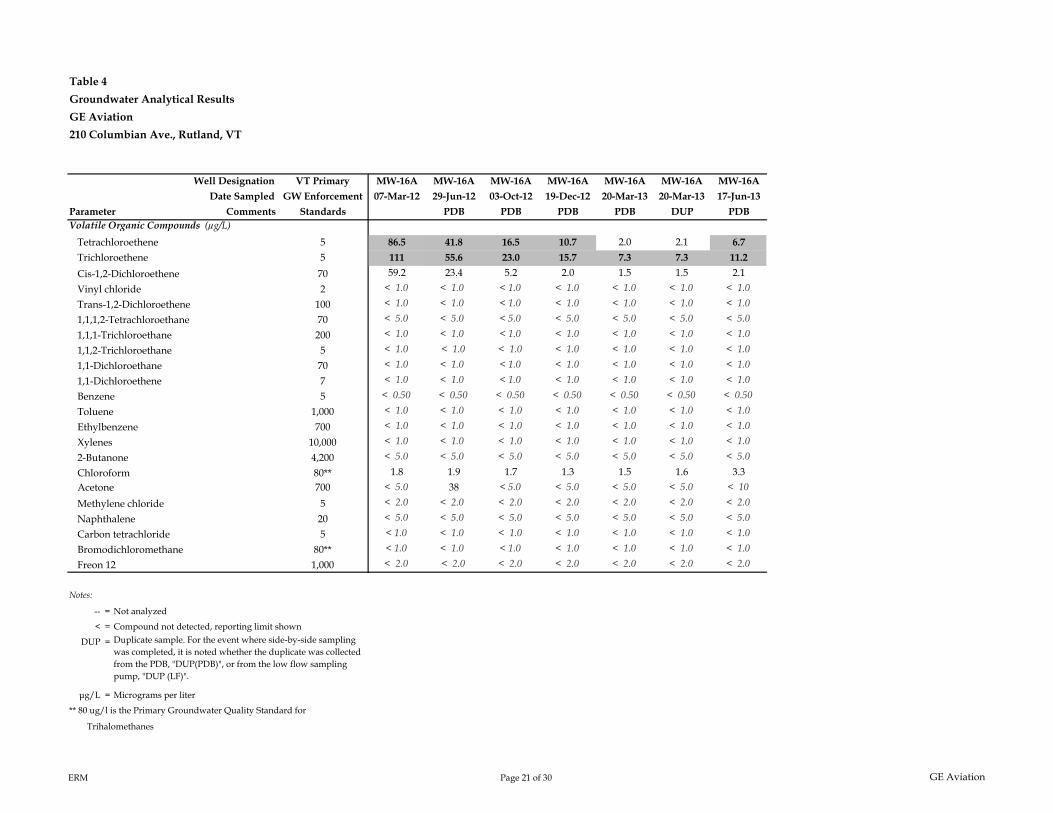
Table 4
Groundwater Analytical Results
GE Aviation
210 Columbian Ave., Rutland, VT
Well Designation VT Primary
Date Sampled GW Enforcement
StandardsVolatile Organic Compounds (µg/L)
Tetrachloroethene 5
Trichloroethene 5
Cis-1,2-Dichloroethene 70
Vinyl chloride 2
Trans-1,2-Dichloroethene 100
1,1,1,2-Tetrachloroethane 70
1,1,1-Trichloroethane 200
1,1,2-Trichloroethane 5
1,1-Dichloroethane 70
1,1-Dichloroethene 7
Benzene 5
Toluene 1,000
Ethylbenzene 700
Xylenes 10,000
2-Butanone 4,200
Chloroform 80**Acetone 700
Methylene chloride 5
Naphthalene 20
Carbon tetrachloride 5
Bromodichloromethane 80**
Freon 12 1,000
Notes:
-- =
< =
DUP =
μg/L =
Trihalomethanes
** 80 ug/l is the Primary Groundwater Quality Standard for
Parameter Comments
Compound not detected, reporting limit shown
Not analyzed
Micrograms per liter
Duplicate sample. For the event where side-by-side sampling was completed, it is noted whether the duplicate was collected from the PDB, "DUP(PDB)", or from the low flow sampling pump, "DUP (LF)".
MW-16A MW-16A MW-16A MW-16A MW-16A MW-16A MW-16A
07-Mar-12 29-Jun-12 03-Oct-12 19-Dec-12 20-Mar-13 20-Mar-13 17-Jun-13
PDB PDB PDB PDB DUP PDB
86.5 41.8 16.5 10.7 2.0 2.1 6.7
111 55.6 23.0 15.7 7.3 7.3 11.2
59.2 23.4 5.2 2.0 1.5 1.5 2.1< 1.0 < 1.0 < 1.0 < 1.0 < 1.0 < 1.0 < 1.0
< 1.0 < 1.0 < 1.0 < 1.0 < 1.0 < 1.0 < 1.0
< 5.0 < 5.0 < 5.0 < 5.0 < 5.0 < 5.0 < 5.0
< 1.0 < 1.0 < 1.0 < 1.0 < 1.0 < 1.0 < 1.0
< 1.0 < 1.0 < 1.0 < 1.0 < 1.0 < 1.0 < 1.0
< 1.0 < 1.0 < 1.0 < 1.0 < 1.0 < 1.0 < 1.0
< 1.0 < 1.0 < 1.0 < 1.0 < 1.0 < 1.0 < 1.0
< 0.50 < 0.50 < 0.50 < 0.50 < 0.50 < 0.50 < 0.50
< 1.0 < 1.0 < 1.0 < 1.0 < 1.0 < 1.0 < 1.0
< 1.0 < 1.0 < 1.0 < 1.0 < 1.0 < 1.0 < 1.0
< 1.0 < 1.0 < 1.0 < 1.0 < 1.0 < 1.0 < 1.0
< 5.0 < 5.0 < 5.0 < 5.0 < 5.0 < 5.0 < 5.0
1.8 1.9 1.7 1.3 1.5 1.6 3.3< 5.0 38 < 5.0 < 5.0 < 5.0 < 5.0 < 10
< 2.0 < 2.0 < 2.0 < 2.0 < 2.0 < 2.0 < 2.0
< 5.0 < 5.0 < 5.0 < 5.0 < 5.0 < 5.0 < 5.0
< 1.0 < 1.0 < 1.0 < 1.0 < 1.0 < 1.0 < 1.0
< 1.0 < 1.0 < 1.0 < 1.0 < 1.0 < 1.0 < 1.0
< 2.0 < 2.0 < 2.0 < 2.0 < 2.0 < 2.0 < 2.0
ERM Page 21 of 30 GE Aviation
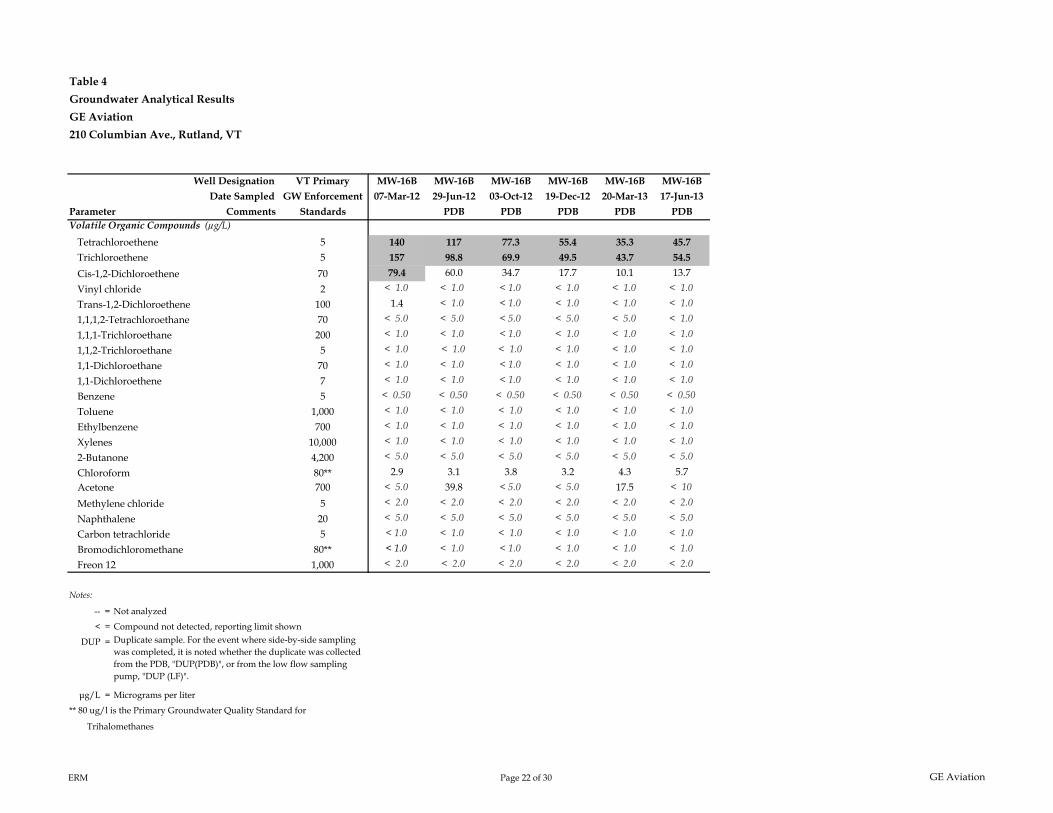
Table 4
Groundwater Analytical Results
GE Aviation
210 Columbian Ave., Rutland, VT
Well Designation VT Primary
Date Sampled GW Enforcement
StandardsVolatile Organic Compounds (µg/L)
Tetrachloroethene 5
Trichloroethene 5
Cis-1,2-Dichloroethene 70
Vinyl chloride 2
Trans-1,2-Dichloroethene 100
1,1,1,2-Tetrachloroethane 70
1,1,1-Trichloroethane 200
1,1,2-Trichloroethane 5
1,1-Dichloroethane 70
1,1-Dichloroethene 7
Benzene 5
Toluene 1,000
Ethylbenzene 700
Xylenes 10,000
2-Butanone 4,200
Chloroform 80**Acetone 700
Methylene chloride 5
Naphthalene 20
Carbon tetrachloride 5
Bromodichloromethane 80**
Freon 12 1,000
Notes:
-- =
< =
DUP =
μg/L =
Trihalomethanes
** 80 ug/l is the Primary Groundwater Quality Standard for
Parameter Comments
Compound not detected, reporting limit shown
Not analyzed
Micrograms per liter
Duplicate sample. For the event where side-by-side sampling was completed, it is noted whether the duplicate was collected from the PDB, "DUP(PDB)", or from the low flow sampling pump, "DUP (LF)".
MW-16B MW-16B MW-16B MW-16B MW-16B MW-16B
07-Mar-12 29-Jun-12 03-Oct-12 19-Dec-12 20-Mar-13 17-Jun-13
PDB PDB PDB PDB PDB
140 117 77.3 55.4 35.3 45.7
157 98.8 69.9 49.5 43.7 54.5
79.4 60.0 34.7 17.7 10.1 13.7< 1.0 < 1.0 < 1.0 < 1.0 < 1.0 < 1.0
1.4 < 1.0 < 1.0 < 1.0 < 1.0 < 1.0
< 5.0 < 5.0 < 5.0 < 5.0 < 5.0 < 1.0
< 1.0 < 1.0 < 1.0 < 1.0 < 1.0 < 1.0
< 1.0 < 1.0 < 1.0 < 1.0 < 1.0 < 1.0
< 1.0 < 1.0 < 1.0 < 1.0 < 1.0 < 1.0
< 1.0 < 1.0 < 1.0 < 1.0 < 1.0 < 1.0
< 0.50 < 0.50 < 0.50 < 0.50 < 0.50 < 0.50
< 1.0 < 1.0 < 1.0 < 1.0 < 1.0 < 1.0
< 1.0 < 1.0 < 1.0 < 1.0 < 1.0 < 1.0
< 1.0 < 1.0 < 1.0 < 1.0 < 1.0 < 1.0
< 5.0 < 5.0 < 5.0 < 5.0 < 5.0 < 5.0
2.9 3.1 3.8 3.2 4.3 5.7< 5.0 39.8 < 5.0 < 5.0 17.5 < 10
< 2.0 < 2.0 < 2.0 < 2.0 < 2.0 < 2.0
< 5.0 < 5.0 < 5.0 < 5.0 < 5.0 < 5.0
< 1.0 < 1.0 < 1.0 < 1.0 < 1.0 < 1.0
< 1.0 < 1.0 < 1.0 < 1.0 < 1.0 < 1.0
< 2.0 < 2.0 < 2.0 < 2.0 < 2.0 < 2.0
ERM Page 22 of 30 GE Aviation

Table 4
Groundwater Analytical Results
GE Aviation
210 Columbian Ave., Rutland, VT
Well Designation VT Primary
Date Sampled GW Enforcement
StandardsVolatile Organic Compounds (µg/L)
Tetrachloroethene 5
Trichloroethene 5
Cis-1,2-Dichloroethene 70
Vinyl chloride 2
Trans-1,2-Dichloroethene 100
1,1,1,2-Tetrachloroethane 70
1,1,1-Trichloroethane 200
1,1,2-Trichloroethane 5
1,1-Dichloroethane 70
1,1-Dichloroethene 7
Benzene 5
Toluene 1,000
Ethylbenzene 700
Xylenes 10,000
2-Butanone 4,200
Chloroform 80**Acetone 700
Methylene chloride 5
Naphthalene 20
Carbon tetrachloride 5
Bromodichloromethane 80**
Freon 12 1,000
Notes:
-- =
< =
DUP =
μg/L =
Trihalomethanes
** 80 ug/l is the Primary Groundwater Quality Standard for
Parameter Comments
Compound not detected, reporting limit shown
Not analyzed
Micrograms per liter
Duplicate sample. For the event where side-by-side sampling was completed, it is noted whether the duplicate was collected from the PDB, "DUP(PDB)", or from the low flow sampling pump, "DUP (LF)".
MW-16C MW-16C MW-16C MW-16C MW-16C MW-16C
07-Mar-12 29-Jun-12 03-Oct-12 19-Dec-12 20-Mar-13 17-Jun-13
PDB PDB PDB PDB PDB
50.2 39.3 28.6 16.4 8.2 9.1
30.5 22.7 18.9 14.5 13.4 16.3
41.0 23.6 15.7 6.2 3.4 3.9< 1.0 < 1.0 < 1.0 < 1.0 < 1.0 < 1.0
< 1.0 < 1.0 < 1.0 < 1.0 < 1.0 < 1.0
< 5.0 < 5.0 < 5.0 < 5.0 < 5.0 < 1.0
< 1.0 < 1.0 < 1.0 < 1.0 < 1.0 < 1.0
< 1.0 < 1.0 < 1.0 < 1.0 < 1.0 < 1.0
< 1.0 < 1.0 < 1.0 < 1.0 < 1.0 < 1.0
< 1.0 < 1.0 < 1.0 < 1.0 < 1.0 < 1.0
< 0.50 < 0.50 < 0.50 < 0.50 < 0.50 < 0.50
< 1.0 < 1.0 < 1.0 < 1.0 < 1.0 < 1.0
< 1.0 < 1.0 < 1.0 < 1.0 < 1.0 < 1.0
< 1.0 < 1.0 < 1.0 < 1.0 < 1.0 < 1.0
< 5.0 < 5.0 < 5.0 < 5.0 < 5.0 < 5.0
1.4 1.5 1.4 < 1.0 1.1 1.5< 5.0 18.7 < 5.0 18.2 28.8 < 10
< 2.0 < 2.0 < 2.0 < 2.0 < 2.0 < 2.0
< 5.0 < 5.0 < 5.0 < 5.0 < 5.0 < 5.0
< 1.0 < 1.0 < 1.0 < 1.0 < 1.0 < 1.0
< 1.0 < 1.0 < 1.0 < 1.0 < 1.0 < 1.0
< 2.0 < 2.0 < 2.0 < 2.0 < 2.0 < 2.0
ERM Page 23 of 30 GE Aviation
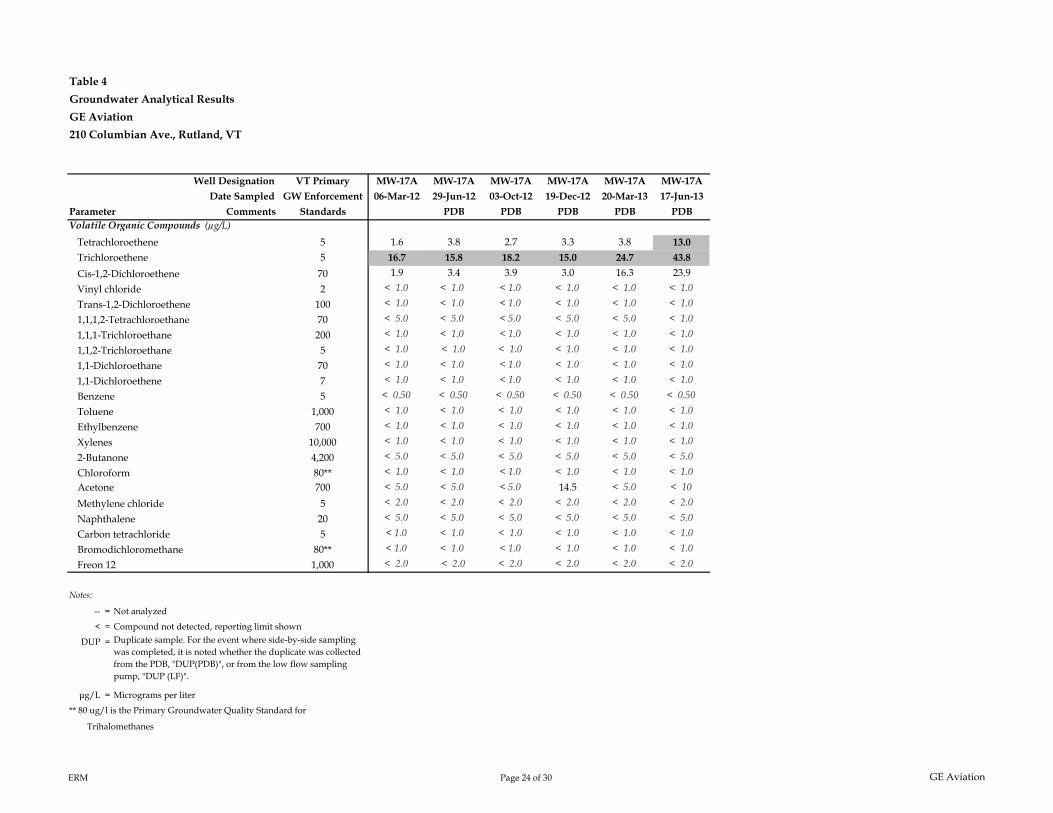
Table 4
Groundwater Analytical Results
GE Aviation
210 Columbian Ave., Rutland, VT
Well Designation VT Primary
Date Sampled GW Enforcement
StandardsVolatile Organic Compounds (µg/L)
Tetrachloroethene 5
Trichloroethene 5
Cis-1,2-Dichloroethene 70
Vinyl chloride 2
Trans-1,2-Dichloroethene 100
1,1,1,2-Tetrachloroethane 70
1,1,1-Trichloroethane 200
1,1,2-Trichloroethane 5
1,1-Dichloroethane 70
1,1-Dichloroethene 7
Benzene 5
Toluene 1,000
Ethylbenzene 700
Xylenes 10,000
2-Butanone 4,200
Chloroform 80**Acetone 700
Methylene chloride 5
Naphthalene 20
Carbon tetrachloride 5
Bromodichloromethane 80**
Freon 12 1,000
Notes:
-- =
< =
DUP =
μg/L =
Trihalomethanes
** 80 ug/l is the Primary Groundwater Quality Standard for
Parameter Comments
Compound not detected, reporting limit shown
Not analyzed
Micrograms per liter
Duplicate sample. For the event where side-by-side sampling was completed, it is noted whether the duplicate was collected from the PDB, "DUP(PDB)", or from the low flow sampling pump, "DUP (LF)".
MW-17A MW-17A MW-17A MW-17A MW-17A MW-17A
06-Mar-12 29-Jun-12 03-Oct-12 19-Dec-12 20-Mar-13 17-Jun-13
PDB PDB PDB PDB PDB
1.6 3.8 2.7 3.3 3.8 13.0
16.7 15.8 18.2 15.0 24.7 43.8
1.9 3.4 3.9 3.0 16.3 23.9< 1.0 < 1.0 < 1.0 < 1.0 < 1.0 < 1.0
< 1.0 < 1.0 < 1.0 < 1.0 < 1.0 < 1.0
< 5.0 < 5.0 < 5.0 < 5.0 < 5.0 < 1.0
< 1.0 < 1.0 < 1.0 < 1.0 < 1.0 < 1.0
< 1.0 < 1.0 < 1.0 < 1.0 < 1.0 < 1.0
< 1.0 < 1.0 < 1.0 < 1.0 < 1.0 < 1.0
< 1.0 < 1.0 < 1.0 < 1.0 < 1.0 < 1.0
< 0.50 < 0.50 < 0.50 < 0.50 < 0.50 < 0.50
< 1.0 < 1.0 < 1.0 < 1.0 < 1.0 < 1.0
< 1.0 < 1.0 < 1.0 < 1.0 < 1.0 < 1.0
< 1.0 < 1.0 < 1.0 < 1.0 < 1.0 < 1.0
< 5.0 < 5.0 < 5.0 < 5.0 < 5.0 < 5.0
< 1.0 < 1.0 < 1.0 < 1.0 < 1.0 < 1.0
< 5.0 < 5.0 < 5.0 14.5 < 5.0 < 10
< 2.0 < 2.0 < 2.0 < 2.0 < 2.0 < 2.0
< 5.0 < 5.0 < 5.0 < 5.0 < 5.0 < 5.0
< 1.0 < 1.0 < 1.0 < 1.0 < 1.0 < 1.0
< 1.0 < 1.0 < 1.0 < 1.0 < 1.0 < 1.0
< 2.0 < 2.0 < 2.0 < 2.0 < 2.0 < 2.0
ERM Page 24 of 30 GE Aviation
Table 4
Groundwater Analytical Results
GE Aviation
210 Columbian Ave., Rutland, VT
Well Designation VT Primary
Date Sampled GW Enforcement
StandardsVolatile Organic Compounds (µg/L)
Tetrachloroethene 5
Trichloroethene 5
Cis-1,2-Dichloroethene 70
Vinyl chloride 2
Trans-1,2-Dichloroethene 100
1,1,1,2-Tetrachloroethane 70
1,1,1-Trichloroethane 200
1,1,2-Trichloroethane 5
1,1-Dichloroethane 70
1,1-Dichloroethene 7
Benzene 5
Toluene 1,000
Ethylbenzene 700
Xylenes 10,000
2-Butanone 4,200
Chloroform 80**Acetone 700
Methylene chloride 5
Naphthalene 20
Carbon tetrachloride 5
Bromodichloromethane 80**
Freon 12 1,000
Notes:
-- =
< =
DUP =
μg/L =
Trihalomethanes
** 80 ug/l is the Primary Groundwater Quality Standard for
Parameter Comments
Compound not detected, reporting limit shown
Not analyzed
Micrograms per liter
Duplicate sample. For the event where side-by-side sampling was completed, it is noted whether the duplicate was collected from the PDB, "DUP(PDB)", or from the low flow sampling pump, "DUP (LF)".
MW-17B MW-17B MW-17B MW-17B MW-17B MW-17B MW-17B MW-17B
06-Mar-12 29-Jun-12 03-Oct-12 03-Oct-12 19-Dec-12 19-Dec-12 20-Mar-13 17-Jun-13
PDB PDB DUP PDB DUP PDB PDB
159 104 193 191 171 168 128 215
304 260 657 694 356 341 309 475
29.9 65.9 94.4 95.8 129 121 151 217< 1.0 < 1.0 < 1.0 < 1.0 < 1.0 < 1.0 < 1.0 < 1.0
< 1.0 < 1.0 1.3 1.2 1.9 2.0 1.9 3.5< 5.0 < 5.0 < 5.0 < 5.0 < 5.0 < 5.0 < 5.0 < 1.0
< 1.0 < 1.0 < 1.0 < 1.0 1.1 1.1 < 1.0 < 1.0
< 1.0 < 1.0 < 1.0 < 1.0 < 1.0 < 1.0 < 1.0 < 1.0
< 1.0 < 1.0 < 1.0 < 1.0 < 1.0 < 1.0 < 1.0 < 1.0
< 1.0 < 1.0 < 1.0 < 1.0 < 1.0 < 1.0 < 1.0 < 1.0
< 0.50 < 0.50 < 0.50 < 0.50 < 0.50 < 0.50 < 0.50 < 0.50
< 1.0 < 1.0 < 1.0 < 1.0 < 1.0 < 1.0 < 1.0 < 1.0
< 1.0 < 1.0 < 1.0 < 1.0 < 1.0 < 1.0 < 1.0 < 1.0
< 1.0 < 1.0 < 1.0 < 1.0 < 1.0 < 1.0 < 1.0 < 1.0
< 5.0 < 5.0 < 5.0 < 5.0 < 5.0 < 5.0 < 5.0 < 5.0
3.9 2.9 3.6 3.7 2.4 2.3 2.6 3.3< 5.0 9.5 < 5.0 < 5.0 < 5.0 < 5.0 27.5 < 10
< 2.0 < 2.0 < 2.0 < 2.0 < 2.0 < 2.0 < 2.0 < 2.0
< 5.0 < 5.0 < 5.0 < 5.0 < 5.0 < 5.0 < 5.0 < 5.0
< 1.0 < 1.0 < 1.0 < 1.0 < 1.0 < 1.0 < 1.0 < 1.0
< 1.0 < 1.0 < 1.0 9.3 < 1.0 < 1.0 < 1.0 < 1.0
< 2.0 < 2.0 < 2.0 < 2.0 < 2.0 < 2.0 < 2.0 < 2.0
ERM Page 25 of 30 GE Aviation
Table 4
Groundwater Analytical Results
GE Aviation
210 Columbian Ave., Rutland, VT
Well Designation VT Primary
Date Sampled GW Enforcement
StandardsVolatile Organic Compounds (µg/L)
Tetrachloroethene 5
Trichloroethene 5
Cis-1,2-Dichloroethene 70
Vinyl chloride 2
Trans-1,2-Dichloroethene 100
1,1,1,2-Tetrachloroethane 70
1,1,1-Trichloroethane 200
1,1,2-Trichloroethane 5
1,1-Dichloroethane 70
1,1-Dichloroethene 7
Benzene 5
Toluene 1,000
Ethylbenzene 700
Xylenes 10,000
2-Butanone 4,200
Chloroform 80**Acetone 700
Methylene chloride 5
Naphthalene 20
Carbon tetrachloride 5
Bromodichloromethane 80**
Freon 12 1,000
Notes:
-- =
< =
DUP =
μg/L =
Trihalomethanes
** 80 ug/l is the Primary Groundwater Quality Standard for
Parameter Comments
Compound not detected, reporting limit shown
Not analyzed
Micrograms per liter
Duplicate sample. For the event where side-by-side sampling was completed, it is noted whether the duplicate was collected from the PDB, "DUP(PDB)", or from the low flow sampling pump, "DUP (LF)".
MW-18A MW-18A MW-18A MW-18A MW-18A
22-Jun-11 28-Sep-11 12-Dec-11 29-Jun-12 17-Jun-13
PDB PDB
< 1.0 < 1.0 < 1.0 < 1.0 < 1.0
< 1.0 1.3 1.1 2.1 3.0< 1.0 < 1.0 < 1.0 < 1.0 < 1.0
< 1.0 < 1.0 < 1.0 < 1.0 < 1.0
< 1.0 < 1.0 < 1.0 < 1.0 < 1.0
< 5.0 < 5.0 < 5.0 < 5.0 < 1.0
< 1.0 < 1.0 < 1.0 < 1.0 < 1.0
< 1.0 < 1.0 < 1.0 < 1.0 < 1.0
< 1.0 < 1.0 < 1.0 < 1.0 < 1.0
< 1.0 < 1.0 < 1.0 < 1.0 < 1.0
< 0.50 < 0.50 < 0.50 < 0.50 < 0.50
< 1.0 < 1.0 < 1.0 < 1.0 < 1.0
< 1.0 < 1.0 < 1.0 < 1.0 < 1.0
< 1.0 < 1.0 < 1.0 < 1.0 < 1.0
< 5.0 < 5.0 < 5.0 < 5.0 < 5.0
< 1.0 < 1.0 < 1.0 1.2 1.5< 5.0 < 5.0 < 5.0 17.1 < 10
< 2.0 < 2.0 < 2.0 < 2.0 < 2.0
< 5.0 < 5.0 < 5.0 < 5.0 < 5.0
< 1.0 < 1.0 < 1.0 < 1.0 < 1.0
< 1.0 < 1.0 < 1.0 < 1.0 < 1.0
< 2.0 < 2.0 < 2.0 < 2.0 < 2.0
ERM Page 26 of 30 GE Aviation
Table 4
Groundwater Analytical Results
GE Aviation
210 Columbian Ave., Rutland, VT
Well Designation VT Primary
Date Sampled GW Enforcement
StandardsVolatile Organic Compounds (µg/L)
Tetrachloroethene 5
Trichloroethene 5
Cis-1,2-Dichloroethene 70
Vinyl chloride 2
Trans-1,2-Dichloroethene 100
1,1,1,2-Tetrachloroethane 70
1,1,1-Trichloroethane 200
1,1,2-Trichloroethane 5
1,1-Dichloroethane 70
1,1-Dichloroethene 7
Benzene 5
Toluene 1,000
Ethylbenzene 700
Xylenes 10,000
2-Butanone 4,200
Chloroform 80**Acetone 700
Methylene chloride 5
Naphthalene 20
Carbon tetrachloride 5
Bromodichloromethane 80**
Freon 12 1,000
Notes:
-- =
< =
DUP =
μg/L =
Trihalomethanes
** 80 ug/l is the Primary Groundwater Quality Standard for
Parameter Comments
Compound not detected, reporting limit shown
Not analyzed
Micrograms per liter
Duplicate sample. For the event where side-by-side sampling was completed, it is noted whether the duplicate was collected from the PDB, "DUP(PDB)", or from the low flow sampling pump, "DUP (LF)".
MW-18B MW-18B MW-18B MW-18B MW-18B
22-Jun-11 28-Sep-11 12-Dec-11 29-Jun-12 17-Jun-13
PDB PDB
< 1.0 < 1.0 < 1.0 < 1.0 < 1.0
1.0 1.5 2.2 3.5 3.4< 1.0 < 1.0 < 1.0 < 1.0 < 1.0
< 1.0 < 1.0 < 1.0 < 1.0 < 1.0
< 1.0 < 1.0 < 1.0 < 1.0 < 1.0
< 5.0 < 5.0 < 5.0 < 5.0 < 1.0
< 1.0 < 1.0 < 1.0 < 1.0 < 1.0
< 1.0 < 1.0 < 1.0 < 1.0 < 1.0
< 1.0 < 1.0 < 1.0 < 1.0 < 1.0
< 1.0 < 1.0 < 1.0 < 1.0 < 1.0
< 0.50 < 0.50 < 0.50 < 0.50 < 0.50
< 1.0 < 1.0 < 1.0 < 1.0 < 1.0
< 1.0 < 1.0 < 1.0 < 1.0 < 1.0
< 1.0 < 1.0 < 1.0 < 1.0 < 1.0
< 5.0 < 5.0 < 5.0 < 5.0 < 5.0
< 1.0 1.0 1.2 1.7 1.6< 5.0 < 5.0 < 5.0 < 5.0 24.1< 2.0 < 2.0 < 2.0 < 2.0 < 2.0
< 5.0 < 5.0 < 5.0 < 5.0 < 5.0
< 1.0 < 1.0 < 1.0 < 1.0 < 1.0
< 1.0 < 1.0 < 1.0 < 1.0 < 1.0
< 2.0 < 2.0 < 2.0 < 2.0 < 2.0
ERM Page 27 of 30 GE Aviation

Table 4
Groundwater Analytical Results
GE Aviation
210 Columbian Ave., Rutland, VT
Well Designation VT Primary
Date Sampled GW Enforcement
StandardsVolatile Organic Compounds (µg/L)
Tetrachloroethene 5
Trichloroethene 5
Cis-1,2-Dichloroethene 70
Vinyl chloride 2
Trans-1,2-Dichloroethene 100
1,1,1,2-Tetrachloroethane 70
1,1,1-Trichloroethane 200
1,1,2-Trichloroethane 5
1,1-Dichloroethane 70
1,1-Dichloroethene 7
Benzene 5
Toluene 1,000
Ethylbenzene 700
Xylenes 10,000
2-Butanone 4,200
Chloroform 80**Acetone 700
Methylene chloride 5
Naphthalene 20
Carbon tetrachloride 5
Bromodichloromethane 80**
Freon 12 1,000
Notes:
-- =
< =
DUP =
μg/L =
Trihalomethanes
** 80 ug/l is the Primary Groundwater Quality Standard for
Parameter Comments
Compound not detected, reporting limit shown
Not analyzed
Micrograms per liter
Duplicate sample. For the event where side-by-side sampling was completed, it is noted whether the duplicate was collected from the PDB, "DUP(PDB)", or from the low flow sampling pump, "DUP (LF)".
MW-19A MW-19A MW-19A MW-19A MW-19A MW-19A
05-Mar-12 28-Jun-12 03-Oct-12 19-Dec-12 20-Mar-13 17-Jun-13
PDB PDB PDB PDB PDB
29.6 45.7 49.3 57.2 39.4 67.5
119 147 155 120 121 212
20.4 28.3 49.8 39.9 38.9 35.6< 1.0 < 1.0 < 1.0 < 1.0 < 1.0 < 1.0
< 1.0 < 1.0 < 1.0 < 1.0 < 1.0 < 1.0
< 5.0 < 5.0 < 5.0 < 5.0 < 5.0 < 1.0
< 1.0 < 1.0 < 1.0 < 1.0 < 1.0 < 1.0
< 1.0 < 1.0 < 1.0 < 1.0 < 1.0 < 1.0
< 1.0 < 1.0 < 1.0 < 1.0 < 1.0 < 1.0
< 1.0 < 1.0 < 1.0 < 1.0 < 1.0 < 1.0
< 0.50 < 0.50 < 0.50 < 0.50 < 0.50 < 0.50
< 1.0 < 1.0 < 1.0 < 1.0 < 1.0 < 1.0
< 1.0 < 1.0 < 1.0 < 1.0 < 1.0 < 1.0
< 1.0 < 1.0 < 1.0 < 1.0 < 1.0 < 1.0
< 5.0 < 5.0 < 5.0 < 5.0 < 5.0 < 5.0
2.5 2.3 2.2 1.4 1.4 2.2< 5.0 < 5.0 < 5.0 19.4 < 5.0 < 10
< 2.0 < 2.0 < 2.0 < 2.0 < 2.0 < 2.0
< 5.0 < 5.0 < 5.0 < 5.0 < 5.0 < 5.0
< 1.0 < 1.0 < 1.0 < 1.0 < 1.0 < 1.0
< 1.0 < 1.0 < 1.0 < 1.0 < 1.0 < 1.0
< 2.0 < 2.0 < 2.0 < 2.0 < 2.0 < 2.0
ERM Page 28 of 30 GE Aviation

Table 4
Groundwater Analytical Results
GE Aviation
210 Columbian Ave., Rutland, VT
Well Designation VT Primary
Date Sampled GW Enforcement
StandardsVolatile Organic Compounds (µg/L)
Tetrachloroethene 5
Trichloroethene 5
Cis-1,2-Dichloroethene 70
Vinyl chloride 2
Trans-1,2-Dichloroethene 100
1,1,1,2-Tetrachloroethane 70
1,1,1-Trichloroethane 200
1,1,2-Trichloroethane 5
1,1-Dichloroethane 70
1,1-Dichloroethene 7
Benzene 5
Toluene 1,000
Ethylbenzene 700
Xylenes 10,000
2-Butanone 4,200
Chloroform 80**Acetone 700
Methylene chloride 5
Naphthalene 20
Carbon tetrachloride 5
Bromodichloromethane 80**
Freon 12 1,000
Notes:
-- =
< =
DUP =
μg/L =
Trihalomethanes
** 80 ug/l is the Primary Groundwater Quality Standard for
Parameter Comments
Compound not detected, reporting limit shown
Not analyzed
Micrograms per liter
Duplicate sample. For the event where side-by-side sampling was completed, it is noted whether the duplicate was collected from the PDB, "DUP(PDB)", or from the low flow sampling pump, "DUP (LF)".
MW-19B MW-19B MW-19B MW-19B MW-19B MW-19B
06-Mar-12 28-Jun-12 03-Oct-12 19-Dec-12 20-Mar-13 17-Jun-13
PDB PDB PDB PDB PDB
17.1 15.9 11.5 12.7 6.0 15.0
42.2 38.8 37.0 32.6 30.7 42.8< 1.0 < 1.0 < 1.0 < 1.0 < 1.0 2.7< 1.0 < 1.0 < 1.0 < 1.0 < 1.0 < 1.0
< 1.0 < 1.0 < 1.0 < 1.0 < 1.0 < 1.0
< 5.0 < 5.0 < 5.0 < 5.0 < 5.0 < 1.0
< 1.0 < 1.0 < 1.0 < 1.0 < 1.0 < 1.0
< 1.0 < 1.0 < 1.0 < 1.0 < 1.0 < 1.0
< 1.0 < 1.0 < 1.0 < 1.0 < 1.0 < 1.0
< 1.0 < 1.0 < 1.0 < 1.0 < 1.0 < 1.0
< 0.50 < 0.50 < 0.50 < 0.50 < 0.50 < 0.50
< 1.0 < 1.0 < 1.0 < 1.0 < 1.0 < 1.0
< 1.0 < 1.0 < 1.0 < 1.0 < 1.0 < 1.0
< 1.0 < 1.0 < 1.0 < 1.0 < 1.0 < 1.0
< 5.0 < 5.0 < 5.0 < 5.0 < 5.0 < 5.0
< 1.0 < 1.0 < 1.0 < 1.0 < 1.0 < 1.0
< 5.0 35.2 16.7 < 5.0 < 5.0 < 10
< 2.0 < 2.0 < 2.0 < 2.0 < 2.0 < 2.0
< 5.0 < 5.0 < 5.0 < 5.0 < 5.0 < 5.0
10.7 < 1.0 < 1.0 < 1.0 < 1.0 < 1.0
< 1.0 < 1.0 < 1.0 < 1.0 < 1.0 < 1.0
< 2.0 < 2.0 < 2.0 < 2.0 < 2.0 < 2.0
ERM Page 29 of 30 GE Aviation
Table 4
Groundwater Analytical Results
GE Aviation
210 Columbian Ave., Rutland, VT
Well Designation VT Primary
Date Sampled GW Enforcement
StandardsVolatile Organic Compounds (µg/L)
Tetrachloroethene 5
Trichloroethene 5
Cis-1,2-Dichloroethene 70
Vinyl chloride 2
Trans-1,2-Dichloroethene 100
1,1,1,2-Tetrachloroethane 70
1,1,1-Trichloroethane 200
1,1,2-Trichloroethane 5
1,1-Dichloroethane 70
1,1-Dichloroethene 7
Benzene 5
Toluene 1,000
Ethylbenzene 700
Xylenes 10,000
2-Butanone 4,200
Chloroform 80**Acetone 700
Methylene chloride 5
Naphthalene 20
Carbon tetrachloride 5
Bromodichloromethane 80**
Freon 12 1,000
Notes:
-- =
< =
DUP =
μg/L =
Trihalomethanes
** 80 ug/l is the Primary Groundwater Quality Standard for
Parameter Comments
Compound not detected, reporting limit shown
Not analyzed
Micrograms per liter
Duplicate sample. For the event where side-by-side sampling was completed, it is noted whether the duplicate was collected from the PDB, "DUP(PDB)", or from the low flow sampling pump, "DUP (LF)".
MW-19C MW-19C MW-19C MW-19C MW-19C MW-19C MW-19C MW-19C MW-19C
05-Mar-12 28-Jun-12 28-Jun-12 28-Jun-12 03-Oct-12 19-Dec-12 20-Mar-13 17-Jun-13 17-Jun-13
PDB DUP (LF) PDB PDB PDB PDB DUP
11.3 10.8 8.7 10.9 5.7 5.1 2.6 7.3 7.1
15.0 14.0 14.0 13.3 9.5 7.2 7.0 9.2 8.8
27.2 16.8 23.0 16.6 11.3 4.4 3.1 3.4 3.9< 1.0 < 1.0 < 1.0 < 1.0 < 1.0 < 1.0 < 1.0 < 1.0 < 1.0
< 1.0 < 1.0 < 1.0 < 1.0 < 1.0 < 1.0 < 1.0 < 1.0 < 1.0
< 5.0 < 5.0 < 5.0 < 5.0 < 5.0 < 5.0 < 5.0 < 1.0 < 1.0
< 1.0 < 1.0 < 1.0 < 1.0 < 1.0 < 1.0 < 1.0 < 1.0 < 1.0
< 1.0 < 1.0 < 1.0 < 1.0 < 1.0 < 1.0 < 1.0 < 1.0 < 1.0
< 1.0 < 1.0 < 1.0 < 1.0 < 1.0 < 1.0 < 1.0 < 1.0 < 1.0
< 1.0 < 1.0 < 1.0 < 1.0 < 1.0 < 1.0 < 1.0 < 1.0 < 1.0
< 0.50 < 0.50 < 0.50 < 0.50 < 0.50 < 0.50 < 0.50 < 0.50 < 0.50
< 1.0 < 1.0 < 1.0 < 1.0 < 1.0 < 1.0 < 1.0 < 1.0 < 1.0
< 1.0 < 1.0 < 1.0 < 1.0 < 1.0 < 1.0 < 1.0 < 1.0 < 1.0
< 1.0 < 1.0 < 1.0 < 1.0 < 1.0 < 1.0 < 1.0 < 1.0 < 1.0
< 5.0 < 5.0 < 5.0 < 5.0 < 5.0 < 5.0 < 5.0 < 5.0 < 5.0
< 1.0 < 1.0 < 1.0 < 1.0 < 1.0 < 1.0 < 1.0 < 1.0 < 1.0
< 5.0 < 5.0 23.5 < 5.0 < 5.0 17.4 < 5.0 < 10 < 10< 2.0 < 2.0 < 2.0 < 2.0 < 2.0 < 2.0 < 2.0 < 2.0 < 2.0
< 5.0 < 5.0 < 5.0 < 5.0 < 5.0 < 5.0 < 5.0 < 5.0 < 5.0
< 1.0 < 1.0 < 1.0 < 1.0 < 1.0 < 1.0 < 1.0 < 1.0 < 1.0
< 1.0 < 1.0 < 1.0 < 1.0 < 1.0 < 1.0 < 1.0 < 1.0 < 1.0
< 2.0 < 2.0 < 2.0 < 2.0 < 2.0 < 2.0 < 2.0 < 2.0 < 2.0
ERM Page 30 of 30 GE Aviation
Table 5Summary of Physical and Chemical Properties of COCsGE Aviation210 Columbian Ave, Rutland, VT
Site Compounds CAS#
Aqueous
Solubility2
(mg/L @ 25oC)
Vapor
Pressure2 (mm
Hg @ 25oC)
Henry's
Constant2
(atm*m3/mol)
Viscosity (centiPoise @
25oC)
Density1
(g/cm3)Koc
3
(mL/g)
Volatile Organics (VOCs)
Tetrachloroethene 127-18-4 200 18.6 1.77 x 10⁻² 0.90 1.623 263
Trichloroethene 79-01-6 1100 69 9.85 x 10⁻³ 0.57 1.462 107
Cis-1,2-Dichloroethene 156-59-2 3500 201 4.08 x 10⁻³ 0.47 4 1.284 35.5
Footnotes:1. CRC Handbook of Chemistry and Physics, The Chemical Rubber Co., Cleveland, Ohio.2. Handbook of Physical Properties of Organic Chemicals. eds. P. Howard and W. Meylan, 1997, Lewis Publishers, NY, NY.3. Illustrated Handbook of Physical-chemical Properties and Environemntal Fate of Organic Chemicals Vol. 3 Volatile Organic ChemicalsMackay et al., 1993.4. Estimation of the Liquid Viscosity of Organic Compounds with a Quantitative Structure - Property Model, Journal of Chemical Information and Computer Sciences, 1999, vol 39.
Notes:CAS# - Chemical Abstract Service number.mg/L - Milligrams per liter.
g/cm3 - Grams per cubic centimeter.
mm Hg - Millimeters mercury.
atm*m3/mol - Atmosphere * cubic meter per mole
Koc = Organic carbon partition coefficient.
ERM Page 1 of 1 GE Aviation
Appendix A – Signed Petition Letter
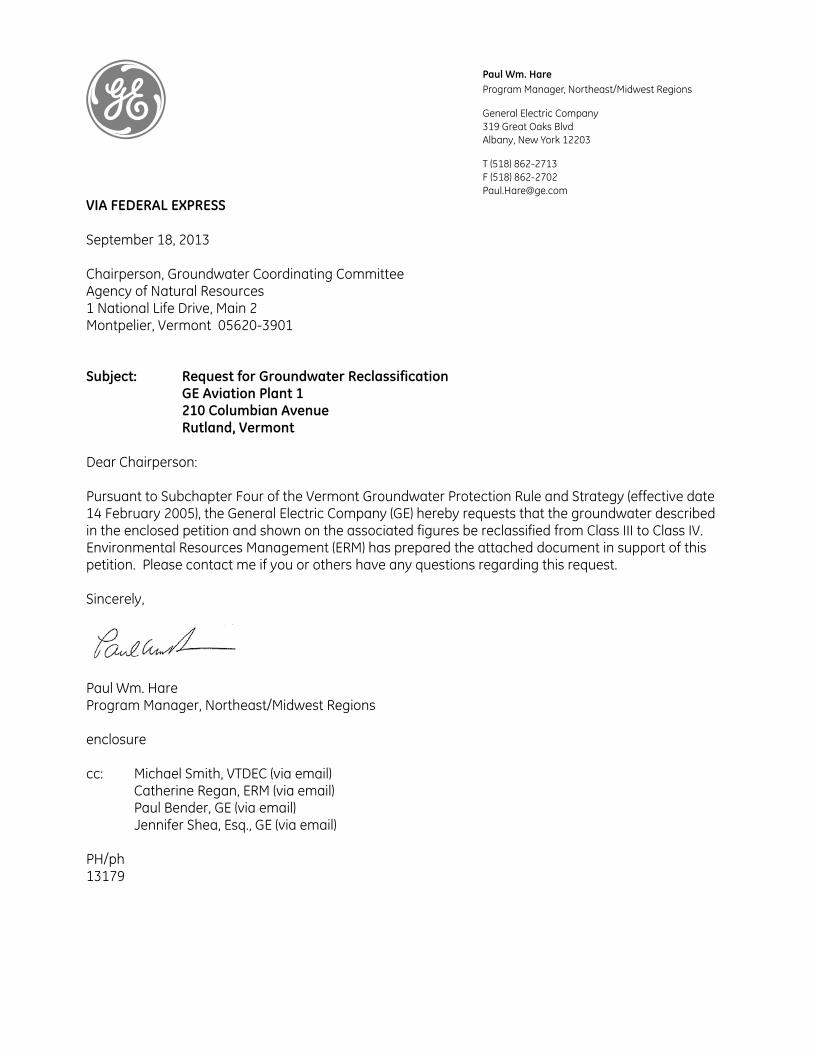
g
VIA FEDERAL EXPRESS September 18, 2013 Chairperson, Groundwater Coordinating Committee Agency of Natural Resources 1 National Life Drive, Main 2 Montpelier, Vermont 05620-3901 Subject: Request for Groundwater Reclassification
GE Aviation Plant 1 210 Columbian Avenue
Rutland, Vermont Dear Chairperson: Pursuant to Subchapter Four of the Vermont Groundwater Protection Rule and Strategy (effective date 14 February 2005), the General Electric Company (GE) hereby requests that the groundwater described in the enclosed petition and shown on the associated figures be reclassified from Class III to Class IV. Environmental Resources Management (ERM) has prepared the attached document in support of this petition. Please contact me if you or others have any questions regarding this request. Sincerely,
Paul Wm. Hare Program Manager, Northeast/Midwest Regions enclosure cc: Michael Smith, VTDEC (via email) Catherine Regan, ERM (via email) Paul Bender, GE (via email)
Jennifer Shea, Esq., GE (via email) PH/ph 13179
Paul Wm. Hare Program Manager, Northeast/Midwest Regions General Electric Company 319 Great Oaks Blvd Albany, New York 12203 T (518) 862-2713 F (518) 862-2702 [email protected]
Appendix B – Landowner Information
Table B-1
Groundwater Reclassification Property List
General Electric
Rutland, VT
Property Address Parcel Number Property Owner Owner's Address
182 State Street 14709 Rogers, Charles M.Rogers, Rosemary
57 Ormsbee AvenueProctor, VT 05765-1229
182A State Street 14710 Rogers, Charles M. 57 Ormsbee AvenueProctor, VT 05765-1229
186 State Street 17686 186 State Street, LLC. P.O. Box 1064Manchester, VT 05254-1064
188 State Street 10077 Russel, Herbert 188 State StreetRutland, VT 05701-2739
194-198 Columbian Avenue 11146 Housing Trust of Rutland County, Inc.
13 Center Street, 2nd FloorRutland, VT 05701-4016
20 Belden Road 10373 Belden Company, Inc. 20 Belden RoadRutland, VT 05701-2631
200 Columbian Avenue 14387 Wood, Stanley A. 2 Pine Brook LaneApt A-2North Springfield, VT 05150-9609
202 Columbian Avenue 15039 Ruggiers, John P.O. Box 691Rutland, VT 05702-0691
210-216 Columbian Avenue 12097 General Electric Company P.O. Box 4900Scottsdale, AZ 85261-4900
286 West Street 20047 City of Rutland P.O. Box 969 Rutland, VT 05701-0969
288 West Street 17864 Temple, Thomas Temple, Wayne D.
288 West Street, Rutland, VT 05701-3937
290 West Street 10065 Agway Petroluem Corpc/o Suburban Propane LP
P.O. Box 206240 Route 10 WestWhippany, NJ 07981-0206
292 West Street 14178 Patorti, Pasquale A.Patorti, Paula S.
646 Rice Willis Road, Castleton, VT 05735-9344
298 West Street 10912 Central Vermont Public ServiceGreen Mountain Power
45 Union StreetRutland, VT 05701
294 West Street 16082 Zullo, Victor Zullo, Joseph 294 West Street, Rutland, VT 05701-2746
295 West Street 10064 Agway Petroluem Corpc/o Suburban Propane LP
P.O. Box 206240 Route 10 WestWhippany, NJ 07981-0206
296 West Street 12638 Elias, S. Alan 56.5 Merchants Row, Rutland, VT 05701-5902
299 West Street 11704 Valente, Bernardo J.Valente, Andrea S.
1364 Pond Hill RoadCastleton, VT 05735-9303
300 West Street 12901 Kelly, John 10 Rachel Drive, Rutland, VT 05701-3770
Table B-1
Groundwater Reclassification Property List
General Electric
Rutland, VT
Property Address Parcel Number Property Owner Owner's Address
301 West Street 14283 Peters, Tabitha Loso, Ryan
301 West StreetRutland, VT 05701-2743
302 West Street 11472 West Street Self Storage, LLC C/O Derosia, James
RR1 - Box 543, Woodstock, VT 05091-9734
303 West Street 14441 Simonsen, Lindsay D. Simonsen, Thelma
844 Creighton DriveFort Myers, FL 33919-5015
304 West Street 13306 Lynch, Thomas M. Lynch, Nancy J.
304 West Street, Rutland, VT 05701-2746
305 West Street 15676 Valente, Nancy A. 305 West StreetRutland, VT 05701-2743
308 West Street 12024 Fusco, Ronay J. Fusco, Herminia M.
Rutland, VT 05701-2746
309 West Street 17464 Rotella Group, Inc. 14 Southern Blvd.Rutland, VT 05701-4532
311 West Street 11703 Rollins, Laurie A. 311 West StreetRutland, VT 05701-2743
312 West Street 13359 Carpenter, Carol A. 312 West StreetRutland, VT 05701-2743
316 West Street 14765 Rotella Group, Inc. 14 Southern Blvd.Rutland, VT 05701-4532
317 West Street 14763 Rotella Group, Inc. 14 Southern Blvd.Rutland, VT 05701-4532
318 West Street 14763 Rotella Group, Inc. 14 Southern Blvd.Rutland, VT 05701-4532
320 West Street 14763 Rotella Group, Inc. 14 Southern Blvd.Rutland, VT 05701-4532
321 West Street 14754 Rotella Group, Inc. 14 Southern Blvd.Rutland, VT 05701-4532
322 West Street 11016 Cioffi, Alice 322 West StreetRutland, VT 05701-2746
332 West Street 13360 Medlin, Gregory S. Medlin, Laura A.
48 Crescent StreetRutland, VT 05701-3126
50 Belden Road 11977 Casella Waste Management, Inc. C/O Harding Carbone, Inc.
3903 Bellaire BlvdHouston, TX 77025-1119
80 Belden Road 10372 Belden Company, Inc. 20 Belden RoadRutland, VT 05701-2631
80-3 Belden 13628 Mclaughlin, Timothy Welch, Peter
765 Gleason RoadRutland, VT 05701-2631
STATE STREET
COLUMBIAN AVENUE
EAST CREEK
BELDEN ROAD
WEST STREET
10373
11977
10372
1101
6
1476
5
1335
9
1202
4
1330
6
1476
514
765
12901
11472
1091212638
16082
178641006514178
20047
12097
20555
17464
10064
14754/14763
1170315676
14441
1428311704
SITE(12097)
15039
14387
11146
17686
14709/14710
10077
EVER
GREE
N AV
ENUE
Groundwater Reclassification DelineationGroundwater Elevation Contour (ft ASL)Area of Impacted GroundwaterParcel BoundaryGroundwater Reclassification DelineationCross Section LocationA A'Site Boundary200-feet Buffer
LegendOverburden Monitoring Well Location
Figure B-1 - Properties WithinGroundwater Reclassification Area
General ElectricRutland, VT
130'Scale (1"=260')
130' 520'260'0
G:\G
raph
ics\C
lients
_F_K
\GE\
RUTL
AND-
VT\C
AD\20
13\G
roun
dwate
r.dwg
(09
/09/20
13 -
9:27a
m Bo
ston)
N
Source: Aerial Photography (2001) & basemap provided by Vermont Center for Geographic Information.
Table B-2Abutter Property ListGeneral ElectricRutland, VT
Property Address Parcel Number Property Owner Owner's Address
1 Evergreen Avenue 10574 Boynton, David J. 65 Belock DriveCenter Rutland, VT 05736-9604
10 Evergreen Avenue 11230 Dulli, Mary Anne 10 Evergreen AvenueRutland, VT 05701-2607
11 Meadow Street 14097 Rutland Investments, LLC. P.O. Box 569Pittsfield, VT 05762-0569
12 Evergreen Avenue 11229 Courcelle, Raymond E.Courcelle, Winona S.
12 Evergreen AvenueRutland, VT 05701-2607
15 Meadow Street 11542 Investments of Rutland, LLC 610 Lower Michigan RoadPittsfield, VT 05762
159 River Street 12315 Granger Enterprises, Ltd. 140 Granger StRutland, VT 05701-4406
17 Meadow Street 17472 Classen, David K. P.O. Box 358Williston, VT 05495-0358
180 State Street 14458 Poremski, Bernard W.Poremski, Barbara
7 Newton StreetRutland, VT 05701-3344
189 State Street 20164 Marble Valley Regional Correctional Facility
167 State StreetRutland, VT 05701
191 Columbian Avenue 20139 Community Cupboard Exempt Food Shelf
101 Columbian AveRutland, VT 05701
State Street 10913 Central Vermont Public ServiceGreen Mountain Power
45 Union StreetRutland, VT 05701
191 State Street 14389 Paz, Nelson R. 402 Cole StreetSeekonk, MA 02771-5812
2 Greens Hill Lane 10910 Central Vermont Public ServiceGreen Mountain Power
45 Union StreetRutland, VT 05701-3956
20 Belden Road 10373 Belden Company, Inc. 20 Belden RoadRutland, VT 05701-2631
205 Columbian Avenue 11484 Mooney, Kathleen M. 205 Columbian AvenueRutland, VT 05701-2720
207 Columbian Avenue 10920 Ellison, Brandy J. 207 Columbian AvenueRutland, VT 05701-2720
209 Columbian Avenue 10044 Patch, Edward L.Patch, Denise L.
308 W. Tinmouth RoadW. Rutland, VT 05777-9657
21 Meadow Street 12606 Horton, Carol A. 21 Meadow StreetRutland, VT 05701-3948
213 Columbian Avenue 12068 Hopp, George L. Jr. & Sarah J. 213 Columbian AvenueRutland, VT 05701-2720
215 Columbian Avenue 14460 Porter, Susan & Dillon & Sylv.c/o Delliveneri, Mary
215 Columbian AvenueRutland, VT 05701-2720
217 Columbian Avenue 12993 Kraby, Paul - Living Trust P.O. Box 226Killington, VT 05751-0226
234 Columbian Avenue 11786 Edwards, RussellEdwards, Karen L.
P.O. Box 1637Rutland, VT 05701
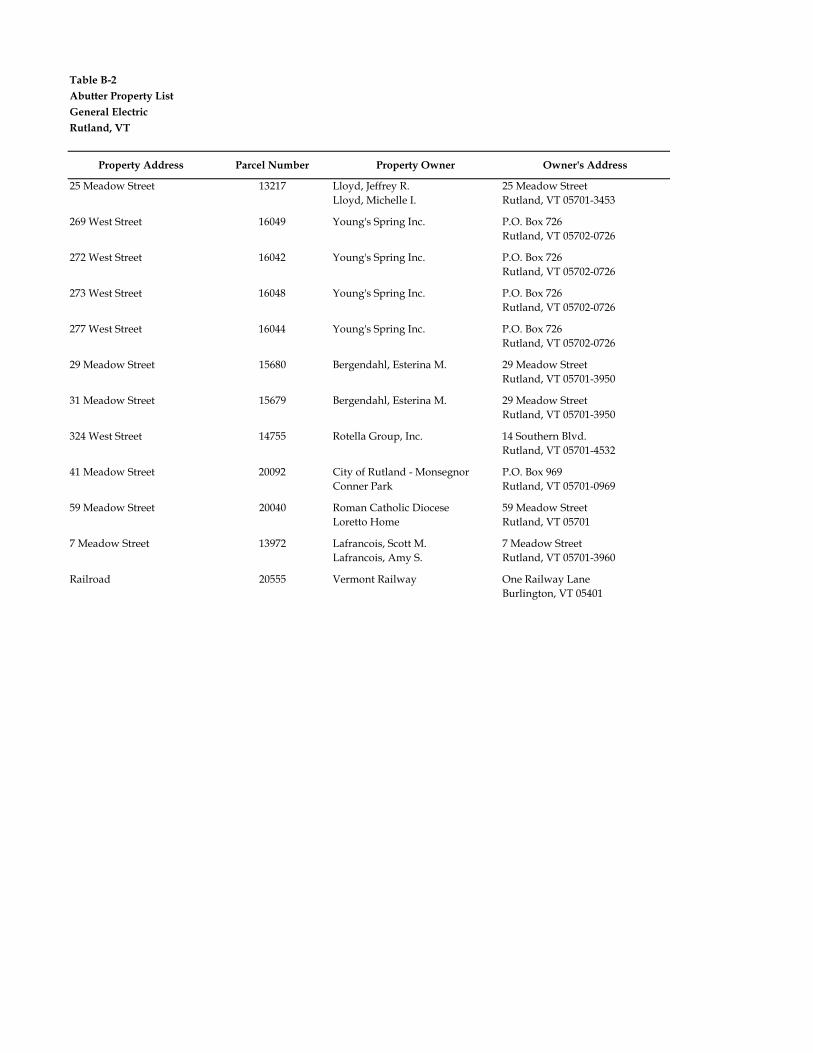
Table B-2Abutter Property ListGeneral ElectricRutland, VT
Property Address Parcel Number Property Owner Owner's Address
25 Meadow Street 13217 Lloyd, Jeffrey R. Lloyd, Michelle I.
25 Meadow StreetRutland, VT 05701-3453
269 West Street 16049 Young's Spring Inc. P.O. Box 726Rutland, VT 05702-0726
272 West Street 16042 Young's Spring Inc. P.O. Box 726Rutland, VT 05702-0726
273 West Street 16048 Young's Spring Inc. P.O. Box 726Rutland, VT 05702-0726
277 West Street 16044 Young's Spring Inc. P.O. Box 726Rutland, VT 05702-0726
29 Meadow Street 15680 Bergendahl, Esterina M. 29 Meadow StreetRutland, VT 05701-3950
31 Meadow Street 15679 Bergendahl, Esterina M. 29 Meadow StreetRutland, VT 05701-3950
324 West Street 14755 Rotella Group, Inc. 14 Southern Blvd.Rutland, VT 05701-4532
41 Meadow Street 20092 City of Rutland - Monsegnor Conner Park
P.O. Box 969Rutland, VT 05701-0969
59 Meadow Street 20040 Roman Catholic DioceseLoretto Home
59 Meadow StreetRutland, VT 05701
7 Meadow Street 13972 Lafrancois, Scott M.Lafrancois, Amy S.
7 Meadow StreetRutland, VT 05701-3960
Railroad 20555 Vermont Railway One Railway LaneBurlington, VT 05401
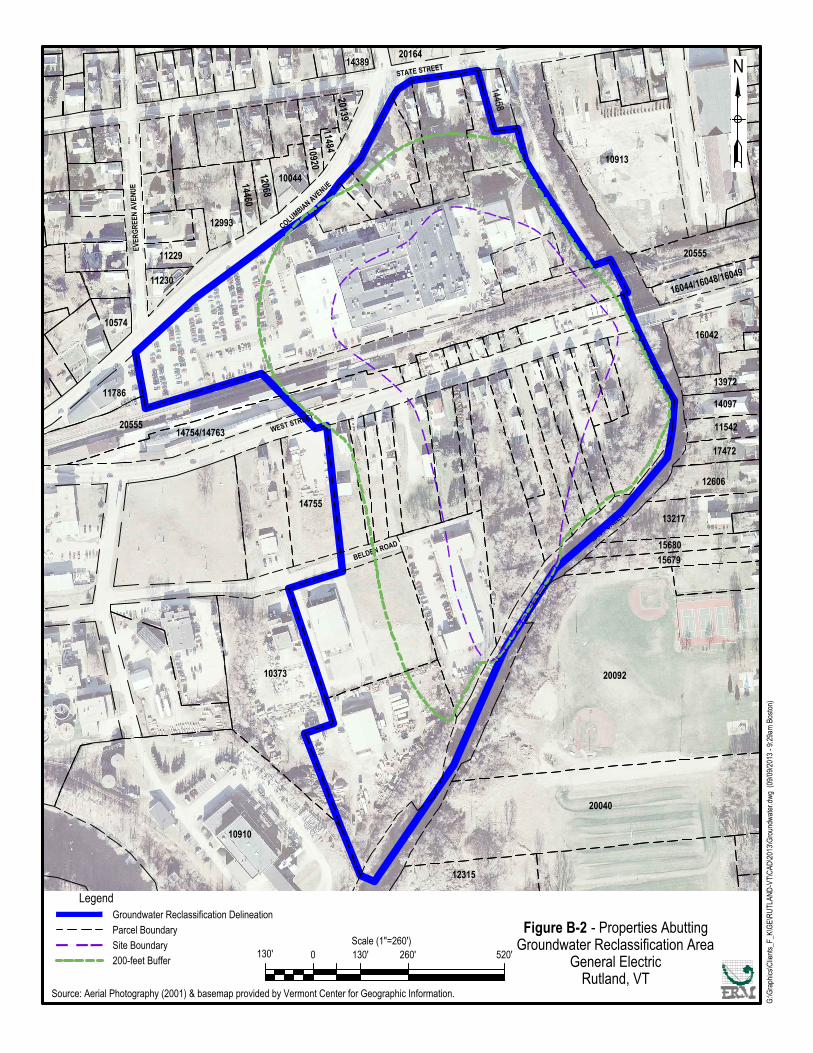
STATE STREET
COLUMBIAN AVENUE
EAST CREEK
BELDEN ROAD
WEST STREET
20040
12315
20092
1567915680
13217
12606
17472
11542
14097
13972
16042
16044/16048/16049
20555
10913
20164
14458
14389
201391148410920
1004412068
14460
12993
11229
11230
11786
20555
10574
14754/14763
14755
10373
10910
EVER
GREE
N AV
ENUE
Groundwater Reclassification DelineationGroundwater Elevation Contour (ft ASL)Area of Impacted GroundwaterParcel BoundaryGroundwater Reclassification DelineationCross Section LocationA A'Site Boundary200-feet Buffer
LegendOverburden Monitoring Well Location
Figure B-2 - Properties AbuttingGroundwater Reclassification Area
General ElectricRutland, VT
130'Scale (1"=260')
130' 520'260'0
G:\G
raph
ics\C
lients
_F_K
\GE\
RUTL
AND-
VT\C
AD\20
13\G
roun
dwate
r.dwg
(09
/09/20
13 -
9:29a
m Bo
ston)
N
Source: Aerial Photography (2001) & basemap provided by Vermont Center for Geographic Information.
Appendix C – PCE, TCE and cDCE Time Series Plots
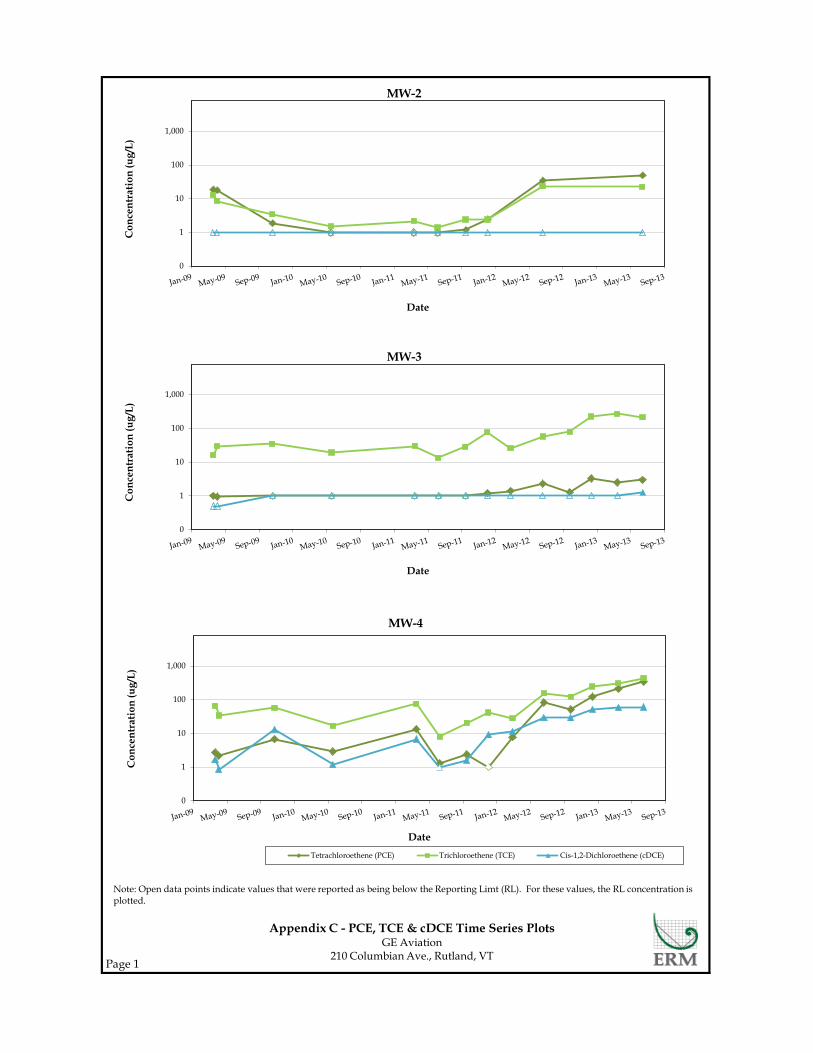
Page 1
0
1
10
100
1,000C
once
ntra
tion
(ug/
L)
Date
MW-2
0
1
10
100
1,000
Con
cent
rati
on (u
g/L)
Date
MW-4
Tetrachloroethene (PCE) Trichloroethene (TCE) Cis-1,2-Dichloroethene (cDCE)
0
1
10
100
1,000
Con
cent
rati
on (u
g/L)
Date
MW-3
Note: Open data points indicate values that were reported as being below the Reporting Limt (RL). For these values, the RL concentration is plotted.
Appendix C - PCE, TCE & cDCE Time Series Plots GE Aviation
210 Columbian Ave., Rutland, VT
Page 2
0
1
10
100
1,000C
once
ntra
tion
(ug/
L)
Date
MW-5
0
1
10
100
1,000
Con
cent
rati
on (u
g/L)
Date
MW-6
0
1
10
100
1,000
10,000
Con
cent
rati
on (u
g/L)
Date
MW-8
Tetrachloroethene (PCE) Trichloroethene (TCE) Cis-1,2-Dichloroethene (cDCE)
Note: Open data points indicate values that were reported as being below the Reporting Limt (RL). For these values, the RL concentration is plotted.
Appendix C - PCE, TCE & cDCE Time Series Plots GE Aviation
210 Columbian Ave., Rutland, VT
Page 3
0
1
10
100
1,000C
once
ntra
tion
(ug/
L)
Date
MW-9
0
1
10
100
1,000
Con
cent
rati
on (u
g/L)
Date
MW-10A
0
1
10
100
Con
cent
rati
on (u
g/L)
Date
MW-10B
Tetrachloroethene (PCE) Trichloroethene (TCE) Cis-1,2-Dichloroethene (cDCE)
Note: Open data points indicate values that were reported as being below the Reporting Limt (RL). For these values, the RL concentration is plotted.
Appendix C - PCE, TCE & cDCE Time Series Plots GE Aviation
210 Columbian Ave., Rutland, VT
Page 4
0
1
10
100
1,000
Con
cent
rati
on (u
g/L)
Date
MW-11B
0
1
10
100
1,000
Con
cent
rati
on (u
g/L)
Date
MW-12B
Tetrachloroethene (PCE) Trichloroethene (TCE) Cis-1,2-Dichloroethene (cDCE)
0
1
10
100
1,000C
once
ntra
tion
(ug/
L)
Date
MW-11A
Note: Open data points indicate values that were reported as being below the Reporting Limt (RL). For these values, the RL concentration is plotted.
Appendix C - PCE, TCE & cDCE Time Series Plots GE Aviation
210 Columbian Ave., Rutland, VT
Page 5
0
1
10
100
1,000
Con
cent
rati
on (u
g/L)
Date
MW-13
0
1
10
100
1,000
Con
cent
rati
on (u
g/L)
Date
MW-15B
Tetrachloroethene (PCE) Trichloroethene (TCE) Cis-1,2-Dichloroethene (cDCE)
Note: Open data points indicate values that were reported as being below the Reporting Limt (RL). For these values, the RL concentration is plotted.
Appendix C - PCE, TCE & cDCE Time Series Plots GE Aviation
210 Columbian Ave., Rutland, VT
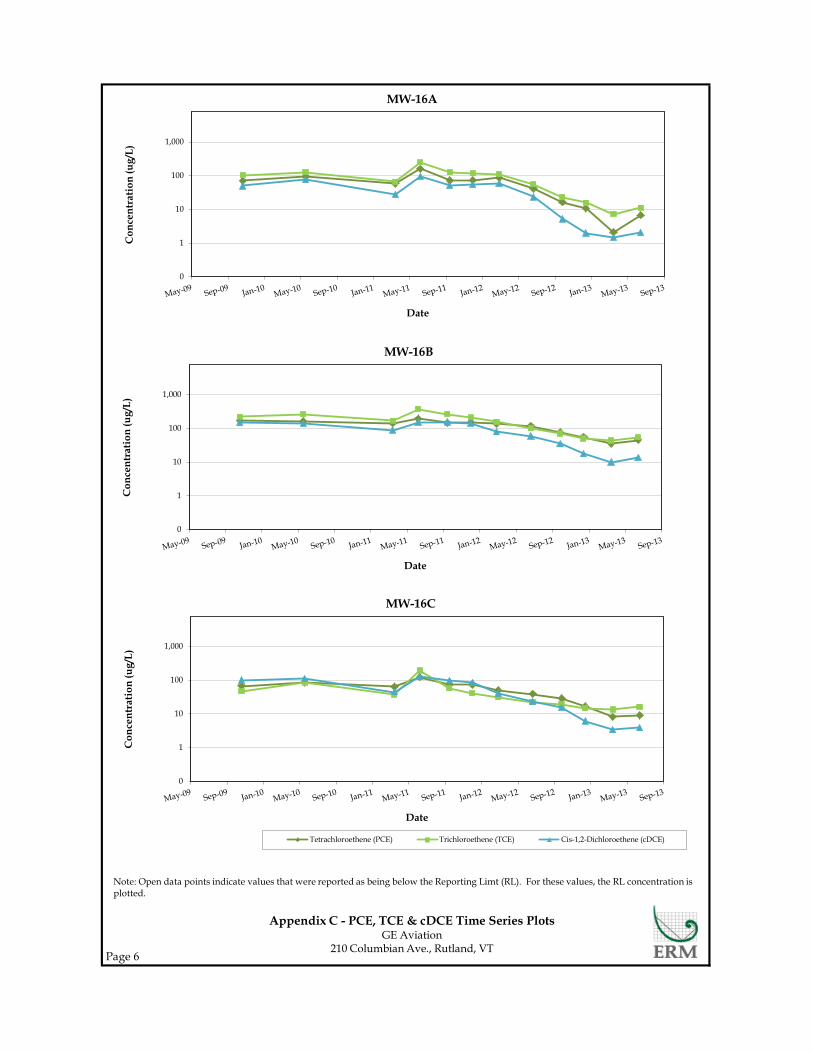
Page 6
Appendix C - PCE, TCE & cDCE Time Series Plots GE Aviation
210 Columbian Ave., Rutland, VT
0
1
10
100
1,000C
once
ntra
tion
(ug/
L)
Date
MW-16A
0
1
10
100
1,000
Con
cent
rati
on (u
g/L)
Date
MW-16B
0
1
10
100
1,000
Con
cent
rati
on (u
g/L)
Date
MW-16C
Tetrachloroethene (PCE) Trichloroethene (TCE) Cis-1,2-Dichloroethene (cDCE)
Note: Open data points indicate values that were reported as being below the Reporting Limt (RL). For these values, the RL concentration is plotted.
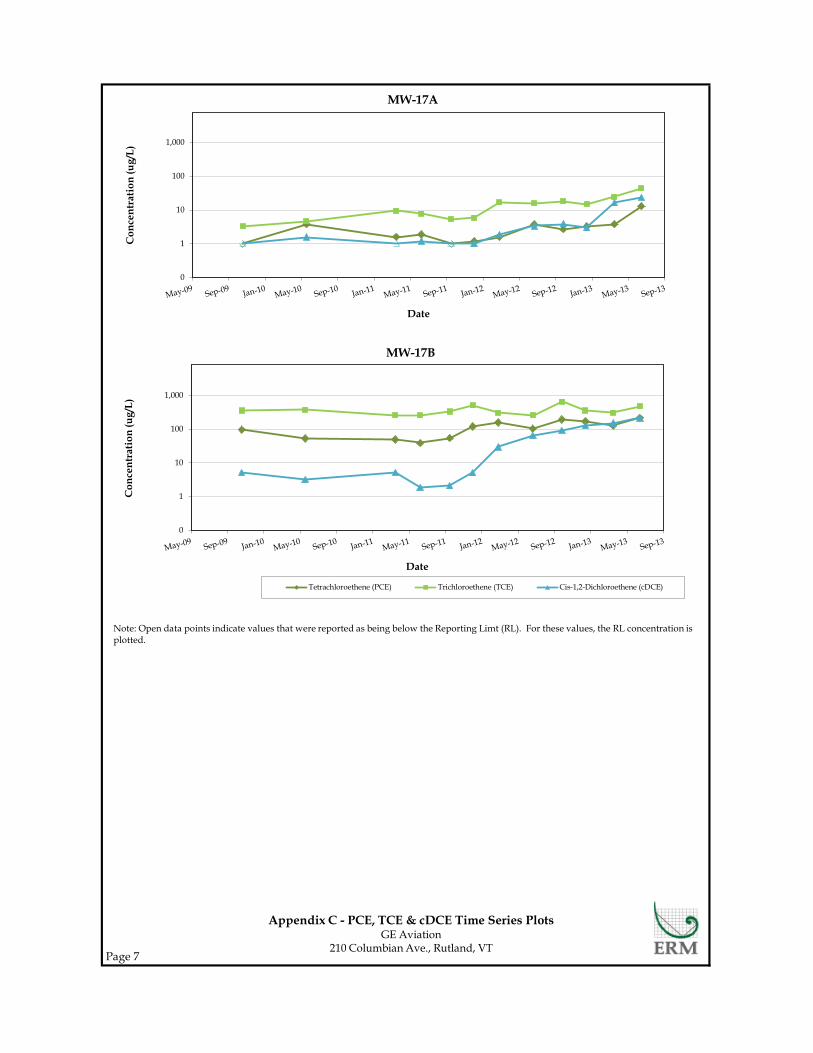
Page 7
Appendix C - PCE, TCE & cDCE Time Series Plots GE Aviation
210 Columbian Ave., Rutland, VT
0
1
10
100
1,000C
once
ntra
tion
(ug/
L)
Date
MW-17A
0
1
10
100
1,000
Con
cent
rati
on (u
g/L)
Date
MW-17B
Tetrachloroethene (PCE) Trichloroethene (TCE) Cis-1,2-Dichloroethene (cDCE)
Note: Open data points indicate values that were reported as being below the Reporting Limt (RL). For these values, the RL concentration is plotted.
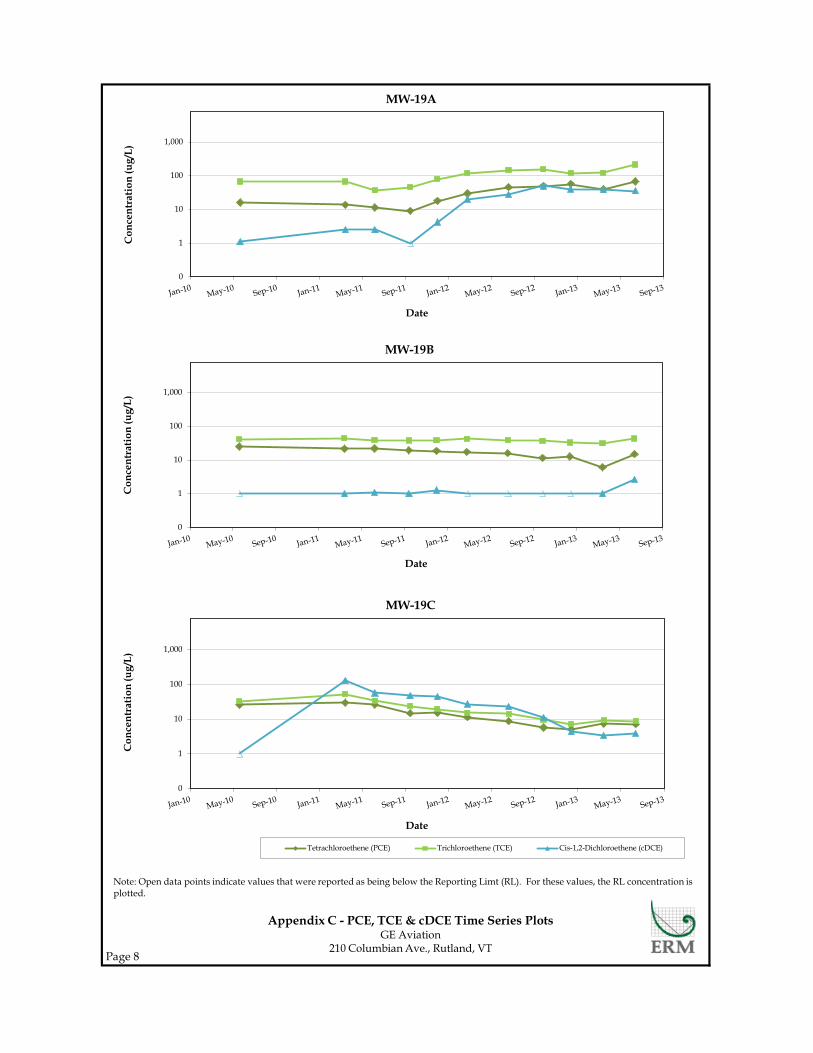
Page 8
Appendix C - PCE, TCE & cDCE Time Series Plots GE Aviation
210 Columbian Ave., Rutland, VT
0
1
10
100
1,000C
once
ntra
tion
(ug/
L)
Date
MW-19A
0
1
10
100
1,000
Con
cent
rati
on (u
g/L)
Date
MW-19B
0
1
10
100
1,000
Con
cent
rati
on (u
g/L)
Date
MW-19C
Tetrachloroethene (PCE) Trichloroethene (TCE) Cis-1,2-Dichloroethene (cDCE)
Note: Open data points indicate values that were reported as being below the Reporting Limt (RL). For these values, the RL concentration is plotted.
Appendix D – Stagnation Point Calculation
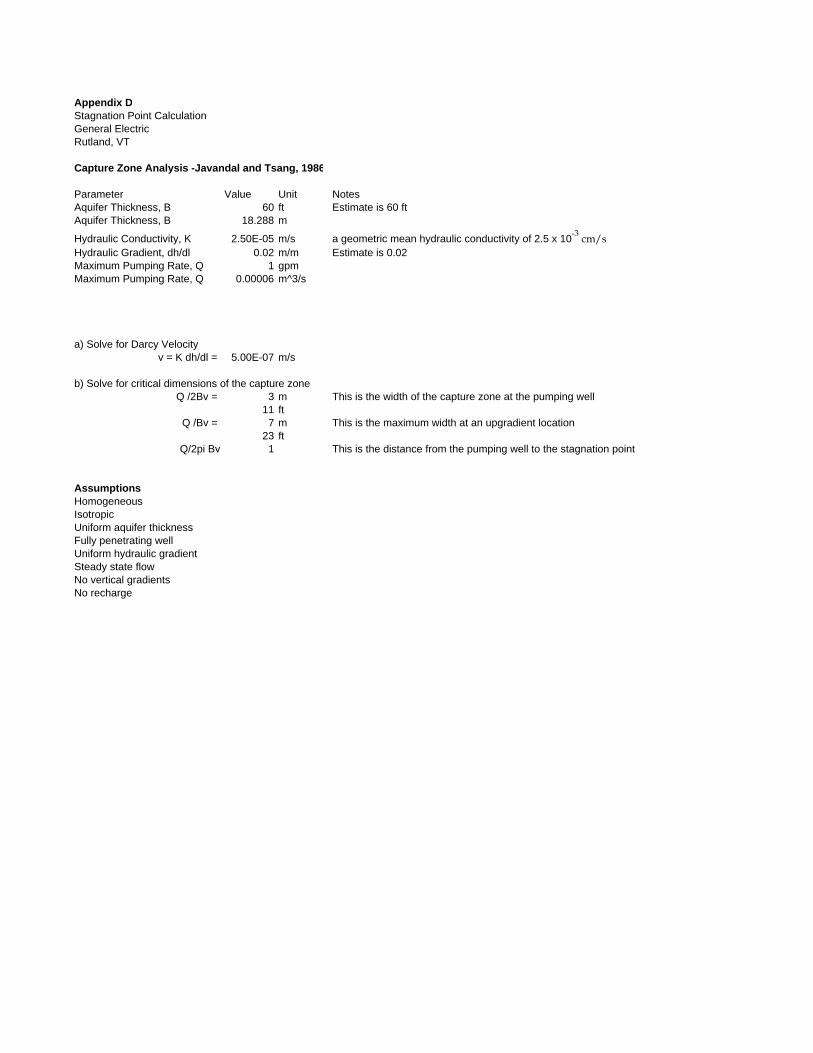
Appendix DStagnation Point CalculationGeneral ElectricRutland, VT
Capture Zone Analysis -Javandal and Tsang, 1986
Parameter Value Unit NotesAquifer Thickness, B 60 ft Estimate is 60 ft Aquifer Thickness, B 18.288 m
Hydraulic Conductivity, K 2.50E-05 m/s a geometric mean hydraulic conductivity of 2.5 x 10⁻³ cm/s
Hydraulic Gradient, dh/dl 0.02 m/m Estimate is 0.02Maximum Pumping Rate, Q 1 gpmMaximum Pumping Rate, Q 0.00006 m^3/s
a) Solve for Darcy Velocityv = K dh/dl = 5.00E-07 m/s
b) Solve for critical dimensions of the capture zoneQ /2Bv = 3 m This is the width of the capture zone at the pumping well
11 ftQ /Bv = 7 m This is the maximum width at an upgradient location
23 ftQ/2pi Bv 1 This is the distance from the pumping well to the stagnation point
AssumptionsHomogeneousIsotropicUniform aquifer thicknessFully penetrating wellUniform hydraulic gradientSteady state flowNo vertical gradientsNo recharge