Embed Size (px)
Citation preview
Reputation and Quality E�ects on Wine Prices: A Comparison Between
En Primeur and Bottled Bordeaux Wine
Héla Hadj AliMAIA-INRA
Unité ESR
BP 27
31326 Castanet Tolosan Cedex, France
Tel: +33 (0)5 61 28 53 63
Fax: +33 (0)5 61 28 53 72
Céline NaugesLEERNA-INRA
Université des Sciences Sociales
Manufacture des Tabacs
21 Allée de Brienne
31000 Toulouse, France
Tel: +33 (0)5 61 12 88 76
Fax: +33 (0)5 61 12 85 20
Date of submission: April 2003
Corresponding author: Céline Nauges - email address: [email protected]
Reputation and Quality E�ects on Wine Price: A Comparison Between
En Primeur and Bottled Bordeaux Wine
Introduction
The International O�ce of Vine and Wine reports that the world total viticultural area reached
19.55 millions acres in 2000. Two-thirds of this surface is located in Europe (mainly in France,
Greece, Italy, Portugal and Spain) and represent 56% of the overall wine growing. France remains
a leading actor in the world wine market despite the sharp competition following the emergence
of new-world producers (South Africa, Chile, New Zealand among others) of high quality wine.
Even if the market share of France in the global wine production in volume has decreased from
38% in 1990 to 26% today,1 the most prestigious Bordeaux wines,2 namely the ones with a long-
time established reputation like the Grands Crus Classés, remain the most famous and among
the most expensive wines worldwide. Could it be that reputation is better valued than quality
in the Bordeaux wine region? We propose to address this question by analyzing two distinct
Bordeaux wine markets: the `en primeur' market and the more traditional market for bottled
wine.
The en primeur market, which is a kind of `future market' speci�c to the Bordeaux wine
region, occurs every year in spring. En primeur refers to the process of buying new wine several
months after the grape harvest while it is still in barrel. This market allows producers to get
liquidity before the wine is bottled,3 but it also allows buyers to get rare wine at potential bargain
prices, hence attracting more and more �nancial speculators (see Hadj Ali and Nauges, 2002).
The en primeur market in Bordeaux region may generate up to 600 million euros a year.4
1
The opening of the en primeur market constitutes one of the most important events on the
Bordeaux market place. The new vintage is o�ered for the �rst time and the prices, set by the
producers themselves, are revealed. Little is known about the way producers choose these prices.
If prices are expected to vary with objective characteristics such as appellation and rank,5 there
is however a large uncertainty still attached to future quality as the wine is not yet matured.
Indeed, information regarding future quality of the wine mainly come from the observation of
the climatic conditions that prevailed during the growing year.6 When the wine has been bottled
and released on the traditional (competitive) market, some additional information regarding
quality may be obtained through personal or experts' tasting. Is there any signi�cant e�ect of
the introduction of competition and the new information on quality?
Using panel data, we show that reputation and quality have very similar impacts on the en
primeur price and on the price of bottled wine. Reputation, that we choose to measure by the
classi�cation of wine (both in terms of rank and appellation), is found highly correlated with the
en primeur price chosen by the producers but ranks and appellation are also highly priced by
the consumers in their purchase of bottled wine. Reputation is highly valued in particular for
the wines belonging to the most famous groups namely the Premiers Grands Crus Classés inside
both the 1855 and the Saint Emilion classi�cations. Furthermore, the vintage year (a proxy for
climatic conditions of the growing year) is found to be a signi�cant determinant of both prices
(en primeur price and the price of bottled wine) while the current quality of each bottled wine
as measured by experts' ratings is not highly valued by consumers.
Results about en primeur price are new in this literature, while our results on bottled
wine con�rm the �ndings of Ginsburgh, Monzak and Monzak (1994), Combris, Lecocq and
Visser (1997) and Landon and Smith (1998), who also analyze price data from the Bordeaux
wine region. These three studies agree on the signi�cant impact of objective characteristics (vin-
tage, region etc.) and reputation (as measured by the rank) on wine price on the one hand,
2
and �nd a moderate in�uence of current quality (as measured by experts' grades or sensory
characteristics) on the other hand.
The paper is organized as follows. In the next section, we de�ne precisely what we call
reputation and quality. Then we present the data and make some descriptive analysis of wine
price on the en primeur market and on the market for bottled wine. It follows the econometric
analysis addressing the issue of reputation and quality impacts on wine price for the en primeur
market and for the market for bottled wine. The last section summarizes the main results and
concludes.
Reputation and quality
The impact of the characteristics of a good on its price is commonly addressed through the
estimation of a hedonic function. If the good is traded on a competitive market, the estimated
coe�cients from the regression of price on characteristics can be interpreted as the valuation of
the good attributes by the consumers. This interpretation is obviously erroneous in the case of
en primeur wine as the price is set by the producers themselves. The estimated parameters will
instead measure the correlation between the price set by the château and the characteristics of
the wine.
In the Rosen (1974) framework, the characteristics used in the hedonic function should be the
ones for which consumers have perfect information. Objective characteristics such as appellation,
rank and vintage (or harvest) year are good candidates as they are easily accessible to the
consumers through the label.
In the present paper, we call reputation the combination of appellation, rank and name
of the château. We do not follow the approach used by Landon and Smith (1997, 1998) and
Oczkowski (2001), who measure reputation through lagged quality scores, because we are pri-
marily interested in measuring the impact of the long-time established fame of Bordeaux châteaux
3
on the price of wine.
Indeed, the �rst system of ranking in the Bordeaux region dates back to 1855. It was
during the Exposition Universelle that Napoléon III, the Emperor of France at the time, invited
Bordeaux's wine brokers to rank the region's wines according to price. They eventually agreed
upon a �ve-tier, Classed Growths or Crus Classés (CC), classi�cation system ranging from
Premiers Crus (1CC, First Growth) to Cinquièmes Crus (5CC, Fifth Growth). The �nal list
consisted of 61 leading châteaux. Nearly all the selections came from the Médoc region,7 with the
exception of the most prominent Graves château Haut-Brion (Pessac Léognan appellation), and
the highly rated sweet wines of Sauternes and Barsac. Sweet wines are classi�ed in Premiers Crus
Classés (1CC, First Growth) or Deuxièmes Crus Classés (2CC, Second Growth), the château
Yquem being the only one classi�ed in Premier Cru Supérieur (1CS, First Superior Growth).
This Classi�cation System of 1855, largely unchanged to this day, is more and more contested
because, as explained by Combris, Lecocq and Visser (1997), �Many châteaux have changed
ownership, certain châteaux have doubled even tripled their cultivation surface, new vini�cation
methods have been introduced�. The Crus Bourgeois (CB), which are the châteaux from the
Médoc region that were not originally ranked, were not classi�ed until 1920. By 1932, there were
444 châteaux listed and numbers have �uctuated ever since. A new classi�cation of the Crus
Bourgeois (CB) of the Médoc and Haut Médoc appellations is currently in process and should
be displayed around June 2003.
Saint Emilion wines (Saint Emilion Grand Cru appellation) were not formally classi�ed until
1955 (subsequently revised in 1969, 1985/86 and 1996), with a distinction between Premiers
Grands Crus Classés A (C1A, First Top Growth A), Premiers Grands Crus Classés B (C1B,
First Top Growth B) and Grands Crus Classés (C, Top Growth). Similarly, some of the wines
of Graves (Pessac Léognan appellation) were not o�cially classi�ed (CC, Classed Growth) until
1953 with others following in 1959. The Pomerol wines always refused being classi�ed. Thus
4
the non-classi�ed (NC) wines in the sample are the Pomerol wines and those wines that are not
classi�ed while belonging to classi�ed appellation groups.
Apart from reputation, quality is expected to be another determinant of the price of wine.
The debate on the price-quality relationship has always been controversial (see Lecocq and Visser,
2003 for a good survey and some illustrative examples). The quality of a wine depends on many
factors. We may distinguish two stages in the wine-making process. First stage would be the
growing of grapes until the harvest. It is well known that the quality of the grapes (aromatic
intensity, level of acidity and sugar, quantity of tannins, etc.), for a given grape variety, is highly
in�uenced by the climatic conditions of the growing year, but also by decisions taken by the
producer such as the clearing of grapes, the date of harvest, the type of harvest (manual or
mechanical). The second stage would be the so-called making-process of the wine, which takes
place after the harvest. The cellar master (maître de chai) has to take decisions (grape mixing,
type of barrels, duration of fermentation and maturation processes, temperature, etc.) during
the whole making-process (which lasts often eighteen months in the Bordeaux region) that will
be determinant for the future quality of the wine. These decisions are not observable neither
by the econometrician, nor by the consumer in general. Some additional information on quality
will be publicly known and easily accessible to the consumer through wine guides or magazines
when the wine is bottled. Note that the en primeur sales take place before the second stage is
completed so the main information available to the consumers (and to the econometrician) at
the opening of the en primeur market is the expected overall quality of the wine based on the
information on the climatic conditions that prevailed before the harvest. Some experts might
also evaluate the wine still in barrel but these judgments are not available in our data set.
Climatic conditions have been included in the hedonic price equation by Ashenfelter, Ashmore
and Lalonde (1995), Byron and Ashenfelter (1995) and Ginsburgh, Monzak and Monzak (1994)
and have been proved highly signi�cant. In the present study, we will use vintage dummies to
5
control for the climatic conditions of the growing year, both in the model of en primeur price
and in the model of the price for bottled wine. The information on the quality of each particular
wine, as provided by the experts (Robert Parker here) during tasting sessions, will be available
only when the wine is in bottle and thus will be included in the hedonic equation for bottled
wine only. We argue that it is better to use a single and publicly available measure of quality
such as experts' ratings8 instead of sensory attributes (such as the wine's aroma, body, �rmness
etc.) or chemical characteristics (such as the wine's sugar and acid level) as done in Combris,
Lecocq and Visser (1997, 2000) or Nerlove (1995) because these latter characteristics are not
easily observable by the consumer.9
Descriptive analysis
The data record white and red wine produced by 185 châteaux between 1982 and 1998, except
for the 1984 vintage,10 belonging to 15 di�erent appellation groups and to 11 di�erent ranks.
Prices vary considerably across the wines in the data set. En primeur price and the price of
bottled wine are known for every wine that we de�ne as the production of one château and one
vintage. They correspond to the price of a 75cl bottle in euro equivalent (base 1990). The price
of the bottled wine is observed every quarter between June 1996 and July 2000, which amounts
to 16,586 observations in all. As our data were provided by one of the most famous broker house
in Bordeaux they can be considered as fairly representative of the market for Bordeaux wine
on the Bordeaux place.11 For quality measures, we will refer in the present study to the overall
vintage judgement as given by Wine Spectator (see Appendix), the largest circulation U.S. wine
magazine, and the grade attributed to each wine by Robert Parker's famous guide.12
The en primeur price
We report in Table 1 the average en primeur prices inside each ranking for the whole period
covering vintage years from 1982 to 1998 (1,454 observations in all).
6
Table 1 here
These statistics show that en primeur prices match the hierarchy of ranking: inside each
ranking, the greater the rank, the higher the en primeur price. In the 1855 classi�cation for
example, prices of wine belonging to the group of Premiers Crus Classés (1CC) lie largely above
the price of those being classed from Deuxièmes Crus Classés (2CC) to Cinquièmes Crus Classés
(5CC).
Table 2, which gives some descriptive statistics on en primeur prices as observed for each
vintage year, shows the �uctuation of en primeur prices between 1982 and 1998.
Table 2 here
Three sub-periods may be distinguished: in the �rst sub-period (82-91 vintage) the en primeur
price does not vary much from one vintage year to another. Between 1992 and 1994 the average
en primeur price decreased and increased after 1995 until 1998. Indeed, the wine of the 1991
to 1994 vintages was not recognized by Wine Spectator as a `good' wine, as was also the case
for the 1997 vintage. However the latter was sold at the highest en primeur price for the period
considered. So if the trend of the en primeur prices matches the tasters judgement (price increases
when overall quality of the vintage is much more appreciated) at the beginning of the period,
this seems no longer true at the end as illustrated in Figure 1.
Figure 1 here
In addition to the average en primeur price for all wines and the grade attributed by Wine
Spectator, we graph separately average en primeur prices of the Premiers Grands Crus Classés
from the Médoc region13 and from the Saint Emilion region (C1A). We set apart these two groups
of châteaux as they are the most famous coming from the Bordeaux wine region and they may
be traded at prohibitive prices in auction markets when getting old, as luxuries. Saint Emilion
7
Premiers Grands Crus Classés A are sold at the highest price on the en primeur market, followed
by the Médoc Cinq Grands Crus (5GC). They follow a similar trend all along the period except
for the 1998 vintage (the châteaux from Saint Emilion increased the en primeur price whereas the
ones from Médoc lowered it). We clearly see from the picture that a structural change occurred
in the mid-nineties. This e�ect can also be illustrated by computing the correlation coe�cients
between the overall grade attributed to the vintage byWine Spectator and the average en primeur
price (see Table 3).
Table 3 here
These simple statistics give interesting insights: on the whole period the correlation coe�cient
between en primeur price and grade is moderate (0.21 when considering all wines). The results are
much di�erent if correlation coe�cients are computed before and after 1994. When considering
the wine from the 1982 to 1993 vintages, en primeur price and grade are positively correlated, this
correlation being quite strong especially for the Premiers Grands Crus Classés: 0.84 and 0.86
respectively for the Cinq Grands Crus from Médoc and the Premiers Crus Classés A from Saint
Emilion. However, for the 1994 to 1998 vintages, the correlation coe�cient becomes negative,
showing clearly that the trend of en primeur prices no longer matches the experts' judgement.14
The price of bottled wine
Prices of bottled wine from 1982 to 1998 vintages are observed between June 1996 and July
2000. During this period, the market for Bordeaux wine experienced feverish activity following
the entry on the market of wealthy buyers, namely multi-millionaires from emerging market
economies (Taïwan, Singapore, Brasil, Russia...). The `French paradox' assessing health bene�ts
of wine consumption also contributed to the success of the wine market. This wealth e�ect
generated an extraordinary in�ation which is illustrated by our data (see Table 4).
Table 4 here
8
The average price (all wines) per quarter almost doubled between the �rst quarter (6-7/96)
and the sixth quarter (8-10/97). Because of large market �uctuations we consider from now on a
detrended price in order to correctly assess the impact of the wine's characteristics on its price.
A quarterly price index is built from the regression of the log of price on quarter dummies.
Figures reported in Table 5 show that the price of bottled wine also matches the hierarchy
of ranking.
Table 5 here
We clearly see that the Premiers Crus Classés (1CC and C1A groups) are priced signi�cantly
above the others. Furthermore, it is shown from Table 6 that prices embody simultaneously an
`age' e�ect and a `vintage' e�ect.
Table 6 here
On the one hand, quality varies between vintages: `very good' ones (1982, 1990, 1995) as
well as `bad' ones (1987, 1991 to 1994) are easily identi�able. On the other hand, the price gets
higher when a bottle gets older: not only the wine gets better (up to a certain limit) but it also
becomes even more di�cult to �nd it on the market.
The `age' e�ect is more emphasized in Figure 2 where we graph the average price of bottled
wine at di�erent ages (as measured in quarters).15
Figure 2 here
We draw three separate curves: the average price for wines belonging to the Cinq Grands
Crus group (5GC), the Premiers Crus Classés A group (C1A) and average price for all wines. We
clearly see that the average price per bottle increases with age. Prices of wines belonging to 5GC
and C1A groups are pretty close to each other but lie largely above average price of all wines.
Note from the picture that the price starts to increase after the age of �ve years (20 quarters).
9
The trend in prices of the top growth wines is similar to the trend in prices of the whole average
until the age of around 15 years (60 quarters). Later, the price of the Premiers Grands Crus
Classés (5GC and C1A) experiences a sharper increase, probably due to the scarcity of these
most famous bottles.
Econometric analysis of the en primeur price
The descriptive analysis shows that en primeur price varies with the rank and the overall quality
of the vintage as assessed by Wine Spectator. We propose to measure more precisely the relative
impact of reputation and quality by regressing en primeur price on wine's objective characteristics
(rank, appellation), and its vintage year. The year dummies will act as a proxy for climatic
conditions of the growing year and thus for the overall quality of the vintage. These are the only
variables that will be used to measure the impact of quality in this model as the grades that might
be attributed to the wine during tasting sessions are not observed in our data set. We distinguish
the group of the Cinq Grands Crus (5GC), the �ve red wines of the Premiers Crus Classés (1CC)
group, by including a zero-one dummy variable. We take advantage of the panel form of the
data by allowing for a random individual e�ect accounting for an unobserved château e�ect.
Note that this e�ect might include the unobservable decisions taken by the producer during the
growing process.
The model �tting the logarithm of the en primeur price is estimated using Generalized Least
Squares. The overall regression is made on 1,454 wines produced by 163 di�erent châteaux. Rank
dummies have to be interpreted with respect to the group Premiers Crus Classés including white
wine from 1CC and 1CS (we will call this group 1CC-white from now on);16 Barsac is chosen as
the base case of appellation dummies and 1982 is the base year. Results are reported in Table 7.
Table 7 here
Almost all vintage dummies are signi�cant at a 95% con�dence level. Note �rst that estimated
10
coe�cients are found negative for those years in which wine was said (see Wine Spectator grades)
of `low' quality (1987, 1991 to 1994) and positive for `good' years, the only exception being the
1997 vintage (this vintage gets the highest coe�cient even if experts disliked it). Thus the
vintage dummies partly capture the impact of climatic conditions on the overall quality of the
vintage. Second, the coe�cients of vintage dummies corresponding to the years 1996 to 1998
are larger than the others in magnitude. As noted earlier, the post-1995 period corresponds to
an exceptional boom in the Bordeaux wine market. So it might be the case that, after 1995,
producers choose en primeur price considering not only the expected quality of the vintage but
also the increased number of (wealthy) buyers on the market.
Note the signi�cant e�ect of the rank on the en primeur price with respect to the group of
Premiers Crus Classés (1CC-white) (most dummies are signi�cant at a 95% con�dence level),
even for the old 1855 classi�cation which is today more and more contested: the lower the rank,
the lower the en primeur price. We �nd in particular a large premium for those wines which
belong to the top groups: Cinq Grands Crus and the best-classi�ed Saint Emilion wines (C1A
group).
Any of the appellation dummies are signi�cant at the 95% con�dence level.
These results show that reputation (here the appellation and above all the rank) has a higher
correlation than quality (as measured through vintage e�ects) with en primeur price. However,
quality in this model is measured only by vintage dummies and, as mentioned in the �rst section,
quality might also be determined by some unobservable decisions taken by the producer. These
unobservable e�ects have been speci�ed in our model as random château e�ects and estimations
show that they account for 81% of the total unexplained variance.
Another possible approach to weigh the relative impact of reputation and quality is to com-
pare the model �tting the en primeur price using `quality' variables only (i.e. the model that
includes as explanatory variables the vintage dummies only) with the overall model including
11
also `reputation' variables (i.e. rank and appellation groups). The R-square of the latter reaches
0.62 whereas the former has an overall �t equal to 0.12 only, which shows that the introduction of
`reputation' variables improves to a large extent the explanation of en primeur price variations.
Finally, to get a more precise idea of the impact of reputation and quality we compute the
marginal e�ect of each of the variables in the full model (see Table 8).
Table 8 here
As the dependent variable has been transformed in logarithm, taking the exponential of
each estimated coe�cient gives the `multiplicative' marginal e�ect of the corresponding variable
(relative to the base case when looking at dummy variables). As an example the marginal e�ect
of being classi�ed in the Cinquièmes Crus Classés (5CC) group is equal to 0.50; it means that,
all other characteristics being equal, a wine belonging to this group will be priced 0.50 times the
price of a wine classi�ed in the Premiers Crus Classés (1CC-white) group (the base case). Ranks
exhibit marginal e�ects ranging from 0.41 for the Crus Bourgeois (CB) to 3.14 for the Premiers
Grands Crus Classés A from the Saint Emilion region, which means that a wine classi�ed C1A is
priced around eight times a wine ranked CB, all others things equal. The magnitude of reputation
e�ects (as measured by the marginal e�ects of the rank) is much larger than the magnitude of
quality: the marginal e�ects corresponding to vintage dummies vary from 0.69 (1992 vintage) to
1.69 (1997 vintage).
The price of bottled wine
On the competitive market for bottled wine, wines of di�erent ages are traded between a high
number of sellers and buyers. As already spotted in the descriptive analysis, the impact of age
on price is quite complex and as this relationship could be non-linear we include as covariates in
the model the age of the wine both in level and in squares.
12
The model �ts the logarithm of the detrended price of bottled wine, using Generalized Least
Squares on a panel data set of 185 châteaux. Unobserved heterogeneity is, as in the previous
model, accounted for by introducing a random château e�ect. Estimation results (see Table 9)
show that 70% of price variability is explained by the model.
Table 9 here
The overall quality of the vintage as measured by Wine Spectator is highly valued by the
consumers. Low quality wines such as the ones from the 1987, 1991, 1992 and more particular the
1997 vintages exhibit large negative estimated parameters. Indeed the vintage dummies capture
almost exclusively the vintage ratings attributed by Wine Spectator as the correlation coe�cient
between estimated parameters and grade is equal to 0.81. The quality of the wine in particular, as
evaluated by Robert Parker 's grade, is found a signi�cant but moderate determinant of price. The
positive coe�cient associated with the variable AGE con�rms the intuition that a wine getting
older will be higher priced. Furthermore, the signi�cant and negative coe�cient associated with
the age squared con�rms that the relationship between price and age is not linear. It is however
di�cult to be more precise as age impacts prices simultaneously through a scarcity e�ect (mainly
for the good vintages) and a quality e�ect. It is important to know that this quality e�ect is not
straightforward as the time before a wine reaches maturity can vary from a wine to another (it
depends among others on the degree of tannin).17
Reputation in�uences the price of bottled wine as was the case for the en primeur price.
However, unlike the en primeur model most of the appellation dummies are signi�cant relative
to the base case (Barsac). The highest coe�cient associated with the Pomerol appellation group
could be explained because of the presence of prestigious wines such as Petrus in this non-
classi�ed appellation group.
We repeat the same exercises as before, �tting �rst the model of bottled wine price using
variables in�uencing quality only (vintage year, Parker's grade, and age of the wine18). The
13
overall R-square is found equal to 0.42 (0.12 in the en primeur price model), that we have to
compare to 0.70 which is the R-square obtained when `reputation' variables are incorporated.
Second, we measure that the unobservable château e�ects represent 71% (88% in the en primeur
price model) of total unexplained variance of the whole model. These two results might suggest
that there is more information on quality while the wine has been bottled and that quality has
a stronger impact on the price of bottled wine than on the en primeur price.
As in the previous section we compute the marginal e�ect of each variable (see Table 10).
Table 10 here
This table shows that the marginal e�ects of the ranking are large, ranging from 0.36 for
the Crus Bourgeois (CB) group to 3.04 for wines from Saint Emilion belonging to the group
of Premiers Grands Crus Classés A (C1A). Note that the ordering as well as the magnitude of
the marginal e�ects of the ranks are very similar in both models. As for the en primeur price,
there is a large price premium associated with the groups of the Premiers Grands Crus Classés
(5GC and C1A). For bottled wine, appellation e�ects are also quite important as shown by the
magnitude of the marginal e�ects. Relative to Barsac, these e�ects range from a minimum of
0.46 for Bordeaux Blanc to a maximum of 2.83 for Pomerol. In contrast, age and Parker 's
ratings have a much smaller impact on price. An additional quarter in age increases the price
by a factor of 1.01 or, equivalently, an additional one year for a bottle drives the price up by a
factor of 1.06. The marginal impact of the quality as announced by Parker is the following: �ve
additional points would push the price up by 14%.
Reputation and quality as judged by the experts might not be independent. This may
be checked by including the cross-product of wine ranking and Parker's rating as explanatory
variables in the model. To avoid multicollinearity, we only keep in the model the cross-products
and we remove the rank dummies and Parker 's rating as variables in level. Marginal e�ects of
variables crossing Parker's rating and ranks are reported in column 2 of Table 11.
14
Table 11 here
We also propose to compare the ratings attributed by Robert Parker to the ones given by the
Wine Spectator magazine. As we do not observe Wine Spectator ratings for all the wines, we
estimate the model and compute the marginal e�ects on the sub-sample of the 6,383 wines for
which we have both Parker and Wine Spectator grades. Marginal e�ects are found in columns 3
and 4 of the same table.
The marginal e�ect is larger for those wines belonging to top ranks (1CC and C1A) which
would mean that consumers value more a better judgement for top quality wines than for wines
belonging to lower ranks. From columns 3 and 4, we see that marginal e�ects are always larger
when Parker is the advisor, which may show the stronger in�uence of Robert Parker on con-
sumers' choices.
Conclusion
This paper addresses the issue of measuring the relative impact of reputation and quality on the
price of wine, where the reputation of a wine is de�ned through its appellation and its rank.
The analysis is made on a panel data set of châteaux from the Bordeaux wine region, covering
sixteen vintages and including time-series observations of prices representative of the Bordeaux
region. The analysis of reputation is highly relevant as the old system of classi�cation dates
back to the nineteenth century. The well-established reputation of the châteaux is found to be
determinant in the setting of en primeur price by the producers but also to be highly valued by
the consumers when they purchase bottled wine. Reputation is highly priced, in particular when
the wine belongs to the most famous groups namely the Premiers Grands Crus Classés inside
both the 1855 and the Saint Emilion classi�cations.
The overall quality of the vintage, as measured in the present study by Wine Spectator 's
grade, is signi�cantly valued by the consumers on the market for bottled wine, but this impact
15

is much smaller than the impact of reputation. On the en primeur market it seems that during
the last four years of our sample (1995-1998) the way the producers choose the en primeur prices
have changed. Producers' behaviour might have been in�uenced by the boom experienced by
the wine market during the second part of the decade.
The impact of Robert Parker 's ratings is found to have a small even if signi�cant impact on
the price of bottled wine.
We also show that reputation and quality e�ects are not independent and that a better grade
is more highly valued by the consumers when they consider top quality wines. Furthermore, our
results emphasize the dominant in�uence of Robert Parker on consumers' choices.
In addition to pioneering results on en primeur price, this analysis con�rms previous �ndings
that reputation is a major determinant of the price of bottled wine and that present quality as
measured by experts' ratings has a much smaller impact. Thus despite the criticism that the
ranking system should be updated, we show that consumers still highly value the rank of the
wine in the Bordeaux region.
16
References
Ashenfelter, O., D. Ashmore, and R. Lalonde (1995): �Bordeaux Wine Vintage Quality
and the Weather,� Chance, 8, 7�14.
Byron, P. R., and O. Ashenfelter (1995): �Predicting the Quality of an Unborn Grange,�
Economic Record, 71, 40�53.
Combris, P., S. Lecocq, and M. Visser (1997): �Estimation of a Hedonic Price Equation
for Bordeaux Wine: Does Quality Matter?,� Economic Journal, 107, 309�402.
(2000): �Estimation of a Hedonic Price Equation for Burgundy Wine,� Applied Eco-
nomics, (32), 961�967.
Gergaud, O. (1998): �Estimation d'une Fonction de Prix Hédonistiques Pour le Vin de Cham-
pagne,� Economie et Prévision, 136, 93�105.
Ginsburgh, V., M. Monzak, and A. Monzak (1994): �Red Wines of Medoc: What is Wine
Tasting Worth,� Verona: Vineyard Data Quanti�cation Society.
HadjAli, H., and C. Nauges (2002): �Vente en Primeur et Investissement : une Etude sur
les Grands Crus de Bordeaux,� LEERNA-INRA Working Paper 02.16.091, in revision for
Economie et Prévision.
Jones, G., and K. Storchmann (2001): �Wine Market Prices and Investment under Un-
certainty: an Econometric Model for Bordeaux Crus Classés,� Agricultural Economics, 26,
115�133.
Landon, S., and C. Smith (1997): �The Use of Quality and Reputation Indicators by Con-
sumers: The Case of Bordeaux Wine,� Journal of Consumer Policy, 20, 289�323.
17
(1998): �Quality Expectations, Reputation and Price,� Southern Economic Journal, 64,
628�647.
Lecocq, S., and M. Visser (2003): �What Determines Wine Prices: Objective vs. Sensory
Characteristics,� Prepared for The Economics of Wine, edited by O. Ashenfelter and V. Gins-
burgh.
Nerlove, M. (1995): �Hedonic Price Functions and the Measurement of Preferences: The Case
of Swedish Wine Consumers,� European Economic Review, 39, 1697�1716.
Oczkowski, E. (1994): �A Hedonic Price Function for Australian Premium Table Wine,� Aus-
tralian Journal of Agricultural Economics, 38, 93�110.
(2001): �Hedonic Wine Price Functions and Measurement Error,� The Economic Record,
77, 374�382.
Rosen, S. (1974): �Hedonic Prices and Implicit Markets: Product Di�erenciation in Pure Com-
petition,� Journal of Political Economy, 82, 34�55.
Schamel, G., and K. Anderson (2001): �Wine Quality and Varietal, Regional and Winery
Reputations: Hedonic Prices for Australia and New Zealand,� CIES Discussion Paper 0103,
Adelaide University.
18
Footnotes
1 La revue du vin de France n�451, May 2001.
2 From a total value of sales of 3.1 billion euros in 2001, 1.2 billion come from wine sold on foreign
markets corresponding to a volume of 2.5 million of hectolitres (source: Conseil Interprofessionnel
du Vin de Bordeaux).
3 Payment occurs at the time of the en primeur sales and bottled wine is delivered one to two
years after.
4 Le Monde, 2001.
5 The appellation is a regional designation and the rank is a system of classi�cation speci�c to
the Bordeaux region.
6 Tasting sessions involving wine experts may also occur before the opening of the en primeur
market.
7 Haut Médoc, Margaux, Médoc, Moulis, Pauillac, Saint Estèphe, Saint Julien are the appellation
groups found in our sample.
8 Oczkowski (1994, 2001), Gergaud (1998), Jones and Storchmann (2001), and Schamel and
Anderson (2001) also use grades as a measure of the quality of the wine.
9 To some extent, this has been con�rmed by Combris, Lecocq and Visser (1997, 2000) who show
that sensory traits are statistically insigni�cant for Bordeaux and Burgundy wine.
10 This vintage has been removed from the catalogue by the broker.
11 The broker's catalogue contains market values for wine computed from the prices proposed
by all the wholesale wine merchants on the Bordeaux place.
12 Both quality indices rise by unit intervals from a minimum of 50 to a maximum of 100.
13 The Cinq Grands Crus (5GC) are the �ve châteaux inside the 1CC group that produce red
wine: château Haut-Brion, château La�te-Rothschild, château Latour, château Margaux and
château Mouton-Rothschild.
19
14 The correlation coe�cients in the column Overall of the table remain almost the same if we
exclude the 5GC and C1A wines.
15 The average e�ect of age is computed with wine from di�erent vintage years and so of di�erent
quality.
16 The Premier Cru Supérieur (1CS) group includes the château Yquem only.
17 The tannin, which is a major component in the structure of red wine, depends on grape variety.
A structure involving more tannin will bene�t more from a long stay in the cellar.
18 The R-square of the sub-model is unchanged whether the age of wine is included or not.
20
Appendix: Overall Wine Spectator ratings for vintage years
Wine Spectator magazine makes a four-tier classi�cation: Classic, Outstanding, Good to very
good and Average; the Classic gathering the best wines.
Table A1 here
21
Tables
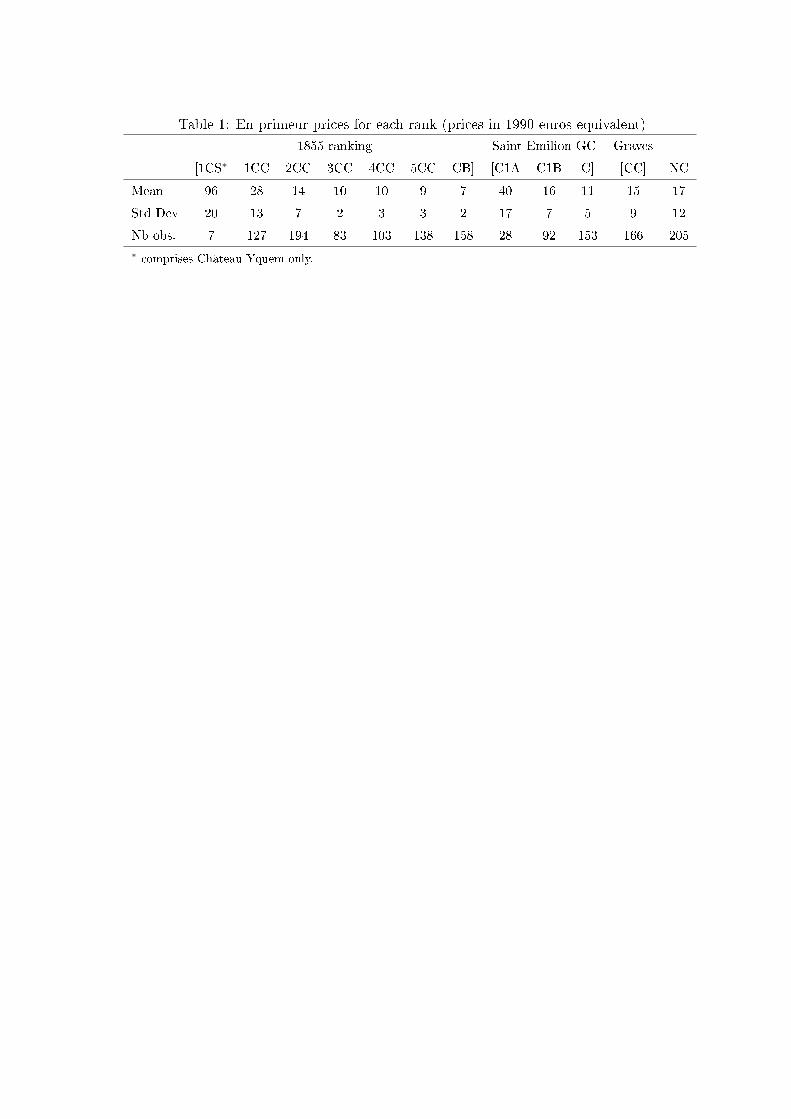
Table 1: En primeur prices for each rank (prices in 1990 euros equivalent)
1855 ranking Saint Emilion GC Graves
[1CS∗ 1CC 2CC 3CC 4CC 5CC CB] [C1A C1B C] [CC] NC
Mean 96 28 14 10 10 9 7 40 16 11 15 17
Std Dev 20 13 7 2 3 3 2 17 7 5 9 12
Nb obs. 7 127 194 83 103 138 158 28 92 153 166 205
∗ comprises Château Yquem only.

Table 2: En primeur prices for each vintage year (prices in 1990 euros equivalent)
82 83 85 86 87 88 89 90 91 92 93 94 95 96 97 98
Mean 15 17 19 15 17 13 16 14 14 9 9 10 13 17 20 17
Std Dev 16 15 15 14 13 7 10 11 15 5 5 7 8 12 15 13
Nb obs. 68 59 68 76 17 87 98 102 33 85 115 118 127 129 145 127
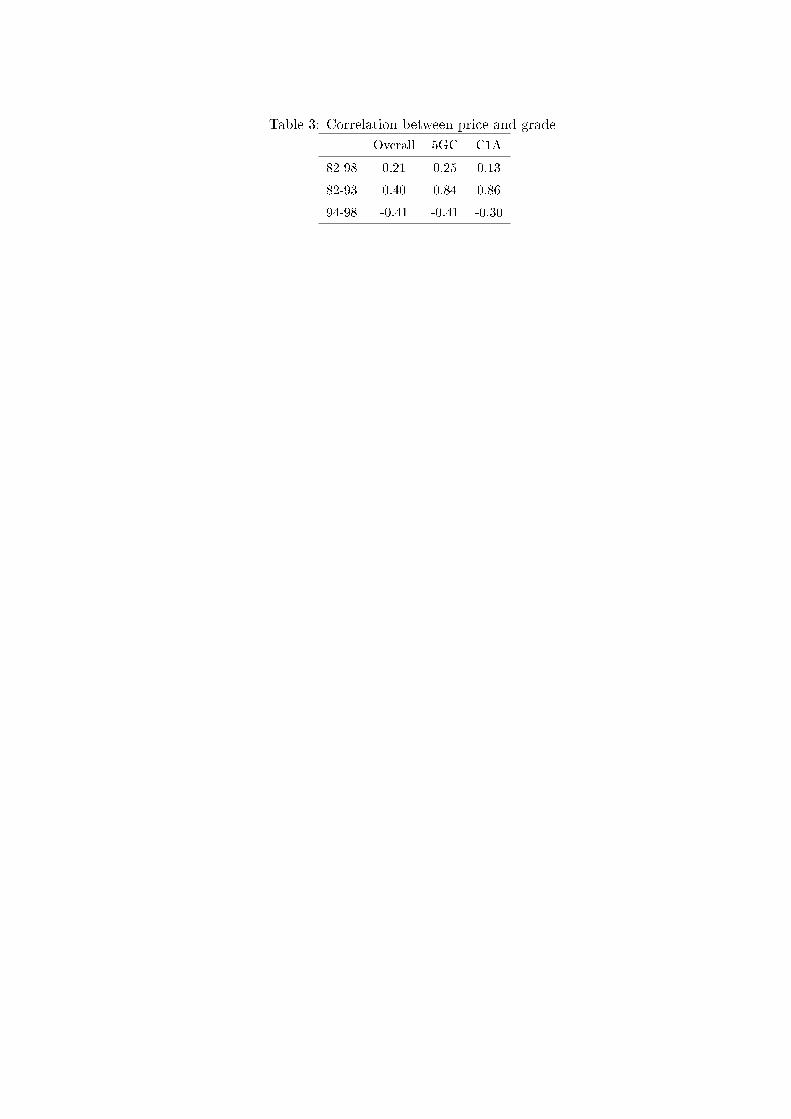
Table 3: Correlation between price and grade
Overall 5GC C1A
82-98 0.21 0.25 0.13
82-93 0.40 0.84 0.86
94-98 -0.41 -0.41 -0.30
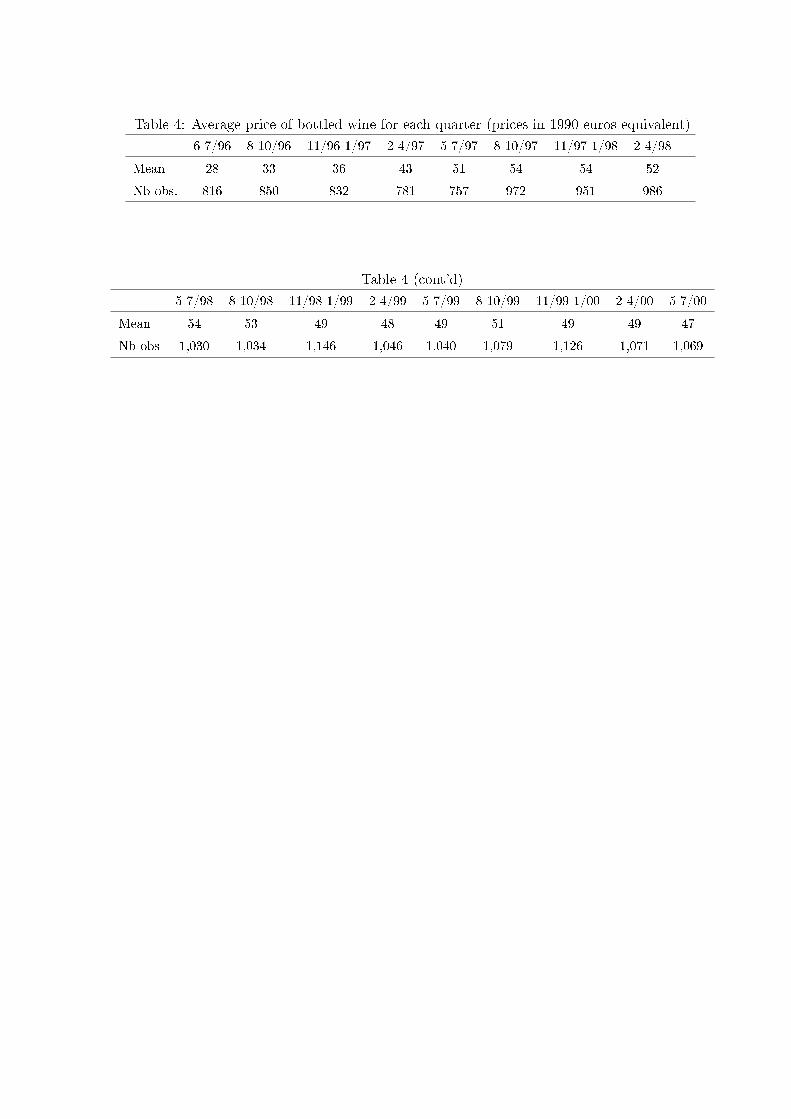
Table 4: Average price of bottled wine for each quarter (prices in 1990 euros equivalent)
6-7/96 8-10/96 11/96-1/97 2-4/97 5-7/97 8-10/97 11/97-1/98 2-4/98
Mean 28 33 36 43 51 54 54 52
Nb obs. 816 850 832 781 757 972 951 986
Table 4 (cont'd)
5-7/98 8-10/98 11/98-1/99 2-4/99 5-7/99 8-10/99 11/99-1/00 2-4/00 5-7/00
Mean 54 53 49 48 49 51 49 49 47
Nb obs 1,030 1,034 1,146 1,046 1,040 1,079 1,126 1,071 1,069
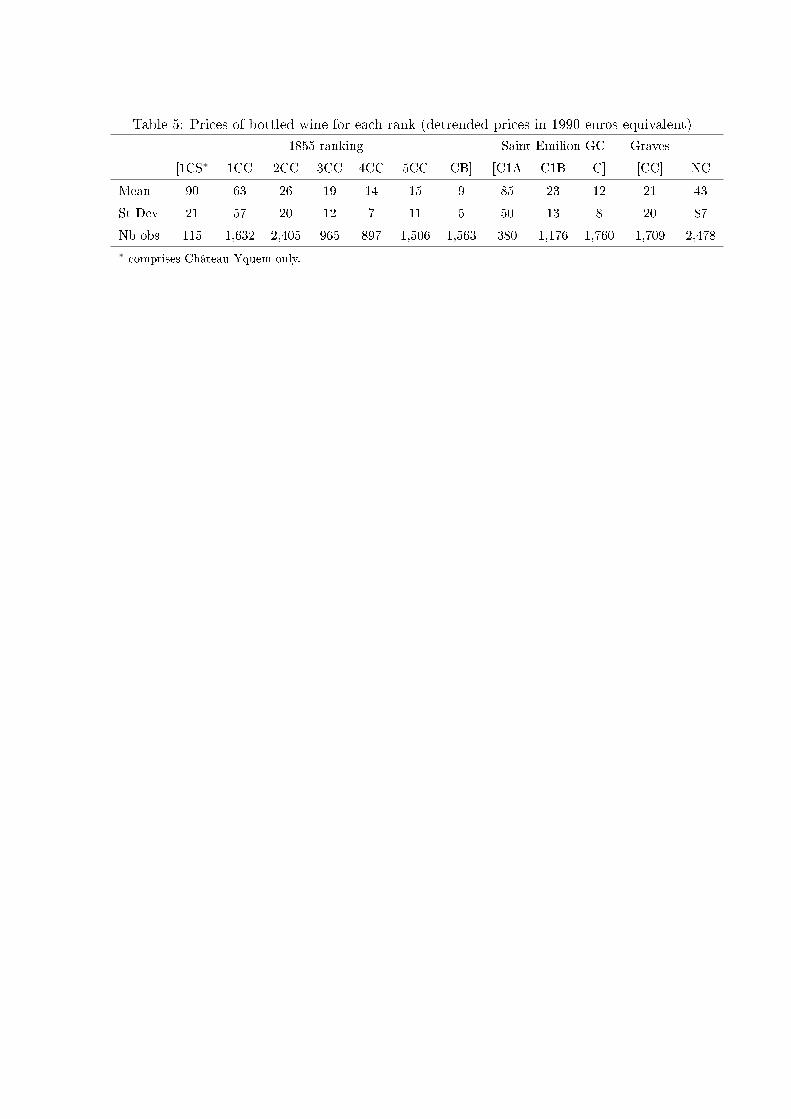
Table 5: Prices of bottled wine for each rank (detrended prices in 1990 euros equivalent)
1855 ranking Saint Emilion GC Graves
[1CS∗ 1CC 2CC 3CC 4CC 5CC CB] [C1A C1B C] [CC] NC
Mean 90 63 26 19 14 15 9 85 23 12 21 43
St Dev 21 57 20 12 7 11 5 50 13 8 20 87
Nb obs 115 1,632 2,405 965 897 1,506 1,563 380 1,176 1,760 1,709 2,478
∗ comprises Château Yquem only.
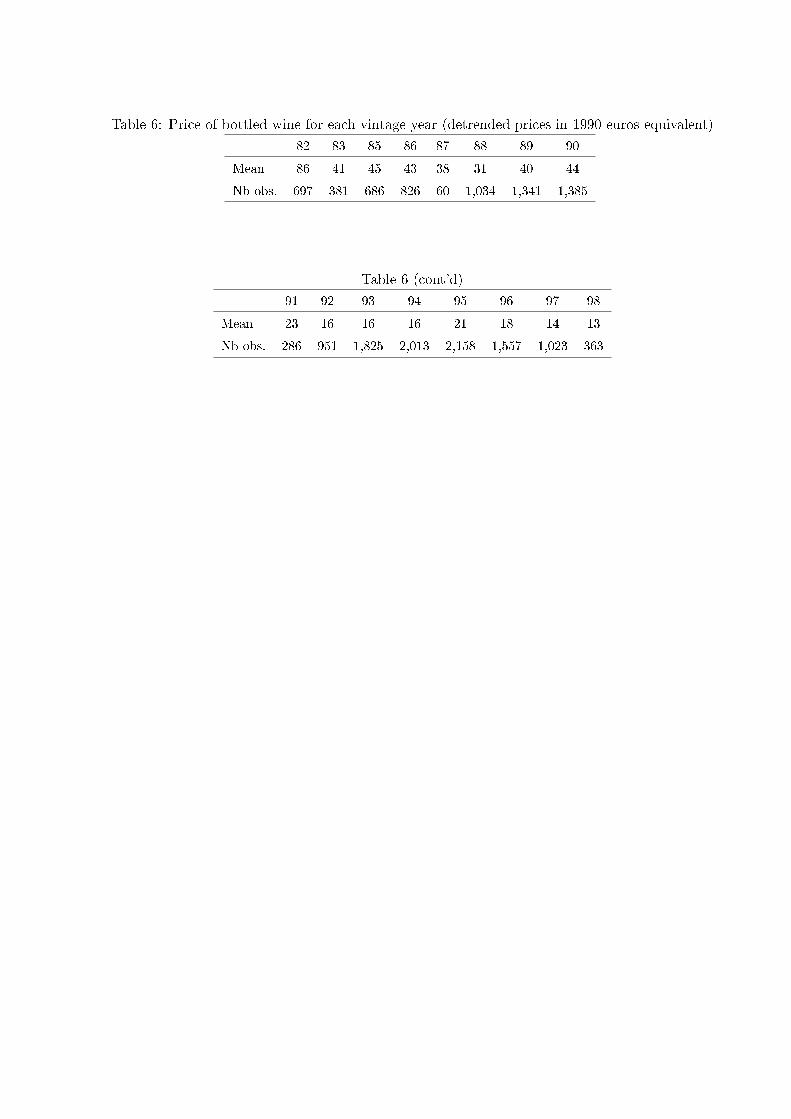
Table 6: Price of bottled wine for each vintage year (detrended prices in 1990 euros equivalent)
82 83 85 86 87 88 89 90
Mean 86 41 45 43 38 31 40 44
Nb obs. 697 381 686 826 60 1,034 1,341 1,385
Table 6 (cont'd)
91 92 93 94 95 96 97 98
Mean 23 16 16 16 21 18 14 13
Nb obs. 286 951 1,825 2,013 2,158 1,557 1,023 363
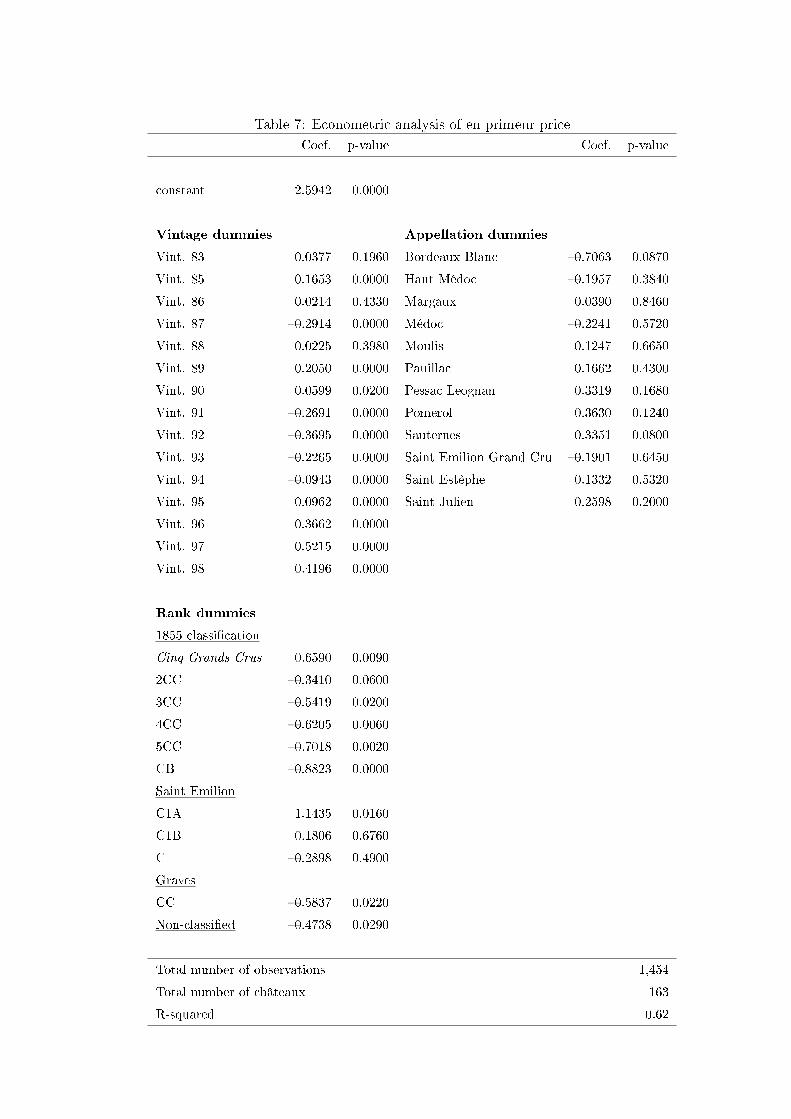
Table 7: Econometric analysis of en primeur price
Coef. p-value Coef. p-value
constant 2.5942 0.0000
Vintage dummies Appellation dummies
Vint. 83 0.0377 0.1960 Bordeaux Blanc �0.7063 0.0870
Vint. 85 0.1653 0.0000 Haut Médoc �0.1957 0.3840
Vint. 86 0.0214 0.4330 Margaux 0.0390 0.8460
Vint. 87 �0.2914 0.0000 Médoc �0.2241 0.5720
Vint. 88 0.0225 0.3980 Moulis 0.1247 0.6650
Vint. 89 0.2050 0.0000 Pauillac 0.1662 0.4300
Vint. 90 0.0599 0.0200 Pessac Leognan 0.3319 0.1680
Vint. 91 �0.2691 0.0000 Pomerol 0.3630 0.1240
Vint. 92 �0.3695 0.0000 Sauternes 0.3351 0.0800
Vint. 93 �0.2265 0.0000 Saint Emilion Grand Cru �0.1901 0.6450
Vint. 94 �0.0943 0.0000 Saint Estèphe 0.1332 0.5320
Vint. 95 0.0962 0.0000 Saint Julien 0.2598 0.2000
Vint. 96 0.3662 0.0000
Vint. 97 0.5215 0.0000
Vint. 98 0.4196 0.0000
Rank dummies
1855 classi�cation
Cinq Grands Crus 0.6590 0.0090
2CC �0.3410 0.0600
3CC �0.5419 0.0200
4CC �0.6205 0.0060
5CC �0.7018 0.0020
CB �0.8823 0.0000
Saint Emilion
C1A 1.1435 0.0160
C1B 0.1806 0.6760
C �0.2898 0.4900
Graves
CC �0.5837 0.0220
Non-classi�ed �0.4738 0.0290
Total number of observations 1,454
Total number of châteaux 163
R-squared 0.62
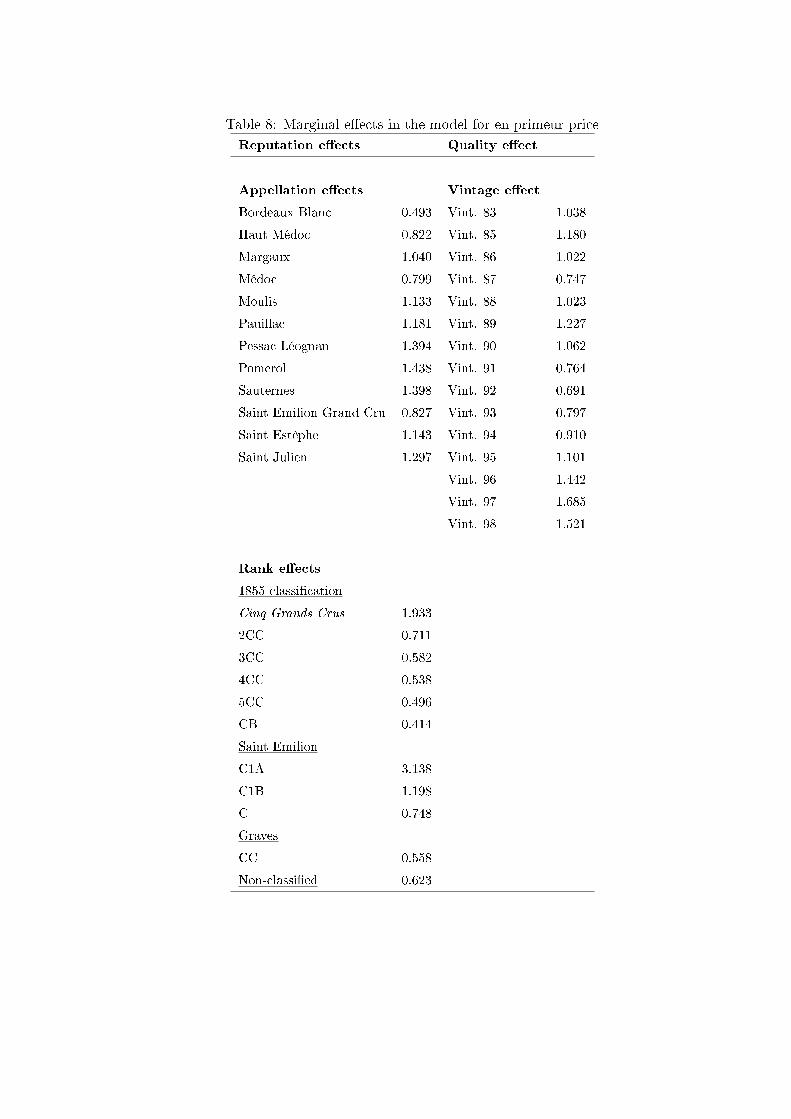
Table 8: Marginal e�ects in the model for en primeur price
Reputation e�ects Quality e�ect
Appellation e�ects Vintage e�ect
Bordeaux Blanc 0.493 Vint. 83 1.038
Haut Médoc 0.822 Vint. 85 1.180
Margaux 1.040 Vint. 86 1.022
Médoc 0.799 Vint. 87 0.747
Moulis 1.133 Vint. 88 1.023
Pauillac 1.181 Vint. 89 1.227
Pessac Léognan 1.394 Vint. 90 1.062
Pomerol 1.438 Vint. 91 0.764
Sauternes 1.398 Vint. 92 0.691
Saint Emilion Grand Cru 0.827 Vint. 93 0.797
Saint Estèphe 1.143 Vint. 94 0.910
Saint Julien 1.297 Vint. 95 1.101
Vint. 96 1.442
Vint. 97 1.685
Vint. 98 1.521
Rank e�ects
1855 classi�cation
Cinq Grands Crus 1.933
2CC 0.711
3CC 0.582
4CC 0.538
5CC 0.496
CB 0.414
Saint Emilion
C1A 3.138
C1B 1.198
C 0.748
Graves
CC 0.558
Non-classi�ed 0.623
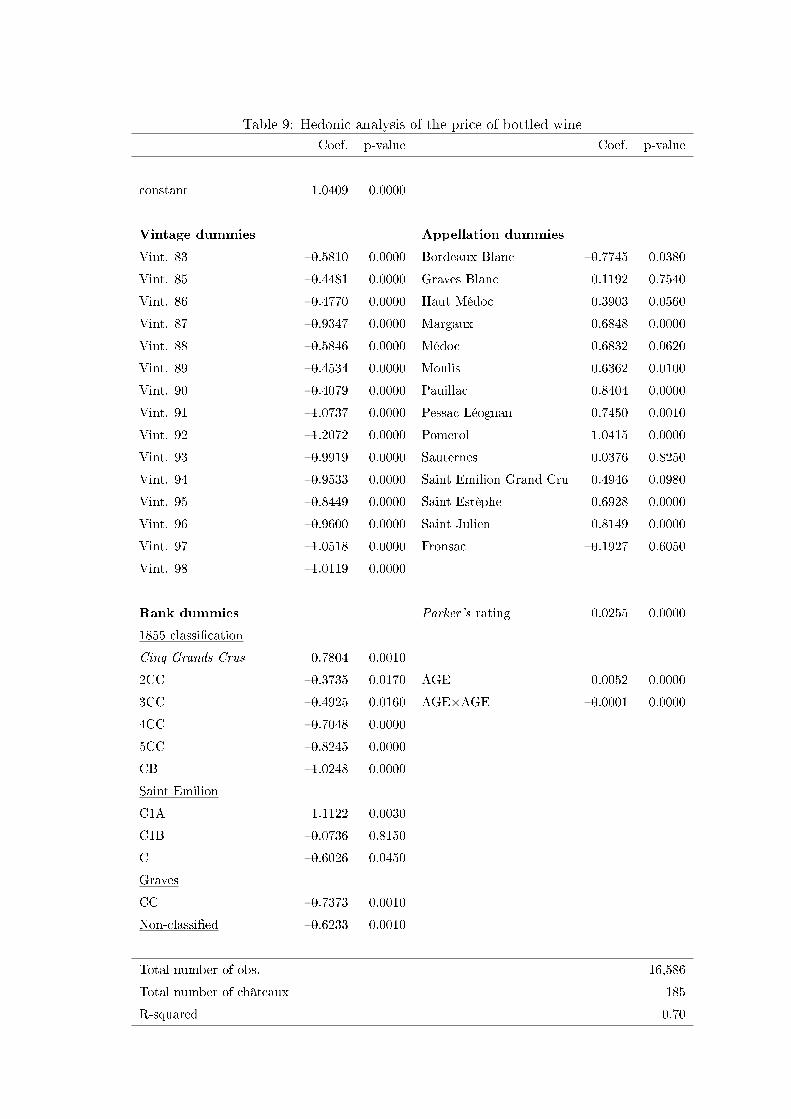
Table 9: Hedonic analysis of the price of bottled wine
Coef. p-value Coef. p-value
constant 1.0409 0.0000
Vintage dummies Appellation dummies
Vint. 83 �0.5810 0.0000 Bordeaux Blanc �0.7745 0.0380
Vint. 85 �0.4481 0.0000 Graves Blanc 0.1192 0.7540
Vint. 86 �0.4770 0.0000 Haut Médoc 0.3903 0.0560
Vint. 87 �0.9347 0.0000 Margaux 0.6848 0.0000
Vint. 88 �0.5846 0.0000 Médoc 0.6832 0.0620
Vint. 89 �0.4534 0.0000 Moulis 0.6362 0.0100
Vint. 90 �0.4079 0.0000 Pauillac 0.8404 0.0000
Vint. 91 �1.0737 0.0000 Pessac Léognan 0.7450 0.0010
Vint. 92 �1.2072 0.0000 Pomerol 1.0415 0.0000
Vint. 93 �0.9919 0.0000 Sauternes 0.0376 0.8250
Vint. 94 �0.9533 0.0000 Saint Emilion Grand Cru 0.4946 0.0980
Vint. 95 �0.8449 0.0000 Saint Estèphe 0.6928 0.0000
Vint. 96 �0.9600 0.0000 Saint Julien 0.8149 0.0000
Vint. 97 �1.0518 0.0000 Fronsac �0.1927 0.6050
Vint. 98 �1.0119 0.0000
Rank dummies Parker's rating 0.0255 0.0000
1855 classi�cation
Cinq Grands Crus 0.7804 0.0010
2CC �0.3735 0.0170 AGE 0.0052 0.0000
3CC �0.4925 0.0160 AGE×AGE �0.0001 0.0000
4CC �0.7048 0.0000
5CC �0.8245 0.0000
CB �1.0248 0.0000
Saint Emilion
C1A 1.1122 0.0030
C1B �0.0736 0.8150
C �0.6026 0.0450
Graves
CC �0.7373 0.0010
Non-classi�ed �0.6233 0.0010
Total number of obs. 16,586
Total number of châteaux 185
R-squared 0.70
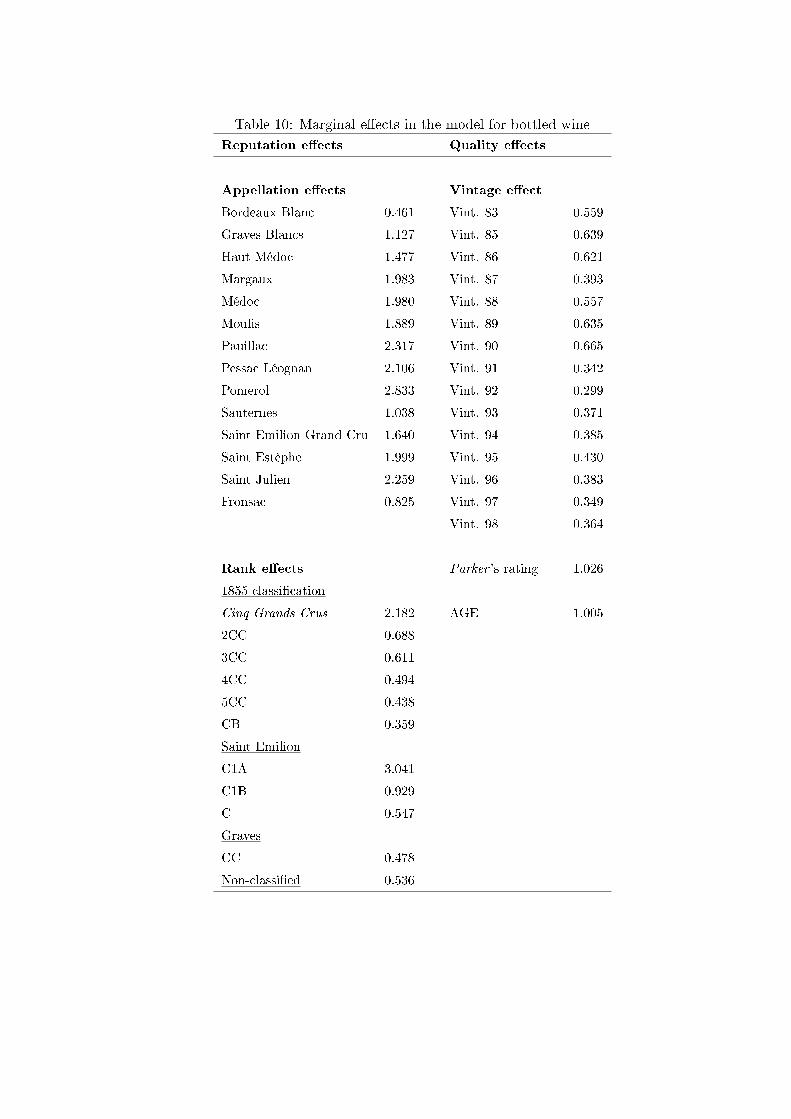
Table 10: Marginal e�ects in the model for bottled wine
Reputation e�ects Quality e�ects
Appellation e�ects Vintage e�ect
Bordeaux Blanc 0.461 Vint. 83 0.559
Graves Blancs 1.127 Vint. 85 0.639
Haut Médoc 1.477 Vint. 86 0.621
Margaux 1.983 Vint. 87 0.393
Médoc 1.980 Vint. 88 0.557
Moulis 1.889 Vint. 89 0.635
Pauillac 2.317 Vint. 90 0.665
Pessac Léognan 2.106 Vint. 91 0.342
Pomerol 2.833 Vint. 92 0.299
Sauternes 1.038 Vint. 93 0.371
Saint Emilion Grand Cru 1.640 Vint. 94 0.385
Saint Estèphe 1.999 Vint. 95 0.430
Saint Julien 2.259 Vint. 96 0.383
Fronsac 0.825 Vint. 97 0.349
Vint. 98 0.364
Rank e�ects Parker 's rating 1.026
1855 classi�cation
Cinq Grands Crus 2.182 AGE 1.005
2CC 0.688
3CC 0.611
4CC 0.494
5CC 0.438
CB 0.359
Saint Emilion
C1A 3.041
C1B 0.929
C 0.547
Graves
CC 0.478
Non-classi�ed 0.536
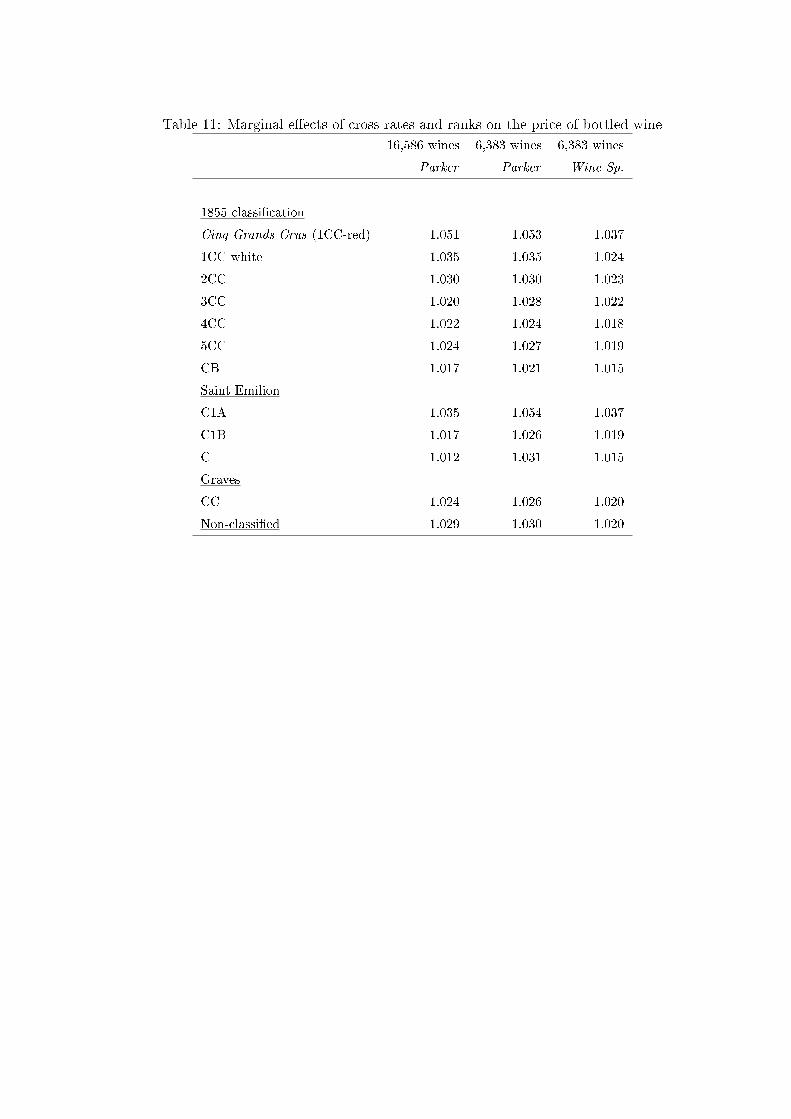
Table 11: Marginal e�ects of cross rates and ranks on the price of bottled wine
16,586 wines 6,383 wines 6,383 wines
Parker Parker Wine Sp.
1855 classi�cation
Cinq Grands Crus (1CC-red) 1.051 1.053 1.037
1CC-white 1.035 1.035 1.024
2CC 1.030 1.030 1.023
3CC 1.020 1.028 1.022
4CC 1.022 1.024 1.018
5CC 1.024 1.027 1.019
CB 1.017 1.021 1.015
Saint Emilion
C1A 1.035 1.054 1.037
C1B 1.017 1.026 1.019
C 1.012 1.031 1.015
Graves
CC 1.024 1.026 1.020
Non-classi�ed 1.029 1.030 1.020
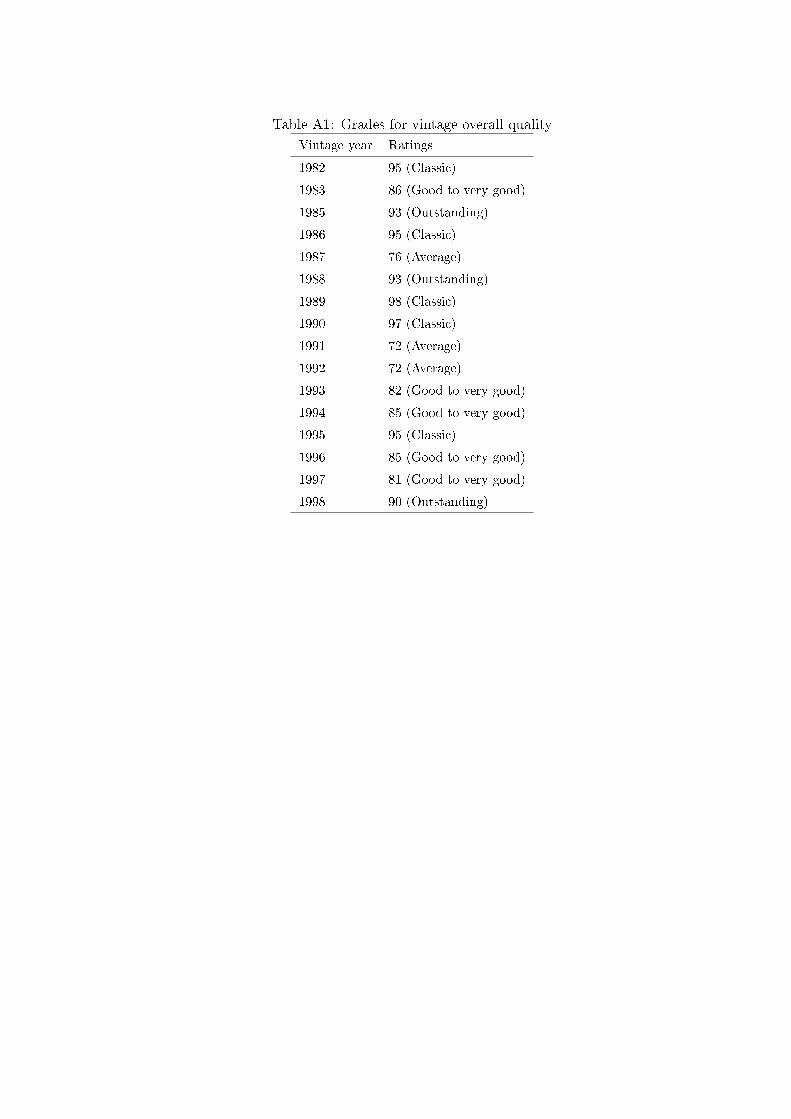
Table A1: Grades for vintage overall quality
Vintage year Ratings
1982 95 (Classic)
1983 86 (Good to very good)
1985 93 (Outstanding)
1986 95 (Classic)
1987 76 (Average)
1988 93 (Outstanding)
1989 98 (Classic)
1990 97 (Classic)
1991 72 (Average)
1992 72 (Average)
1993 82 (Good to very good)
1994 85 (Good to very good)
1995 95 (Classic)
1996 85 (Good to very good)
1997 81 (Good to very good)
1998 90 (Outstanding)
Figures
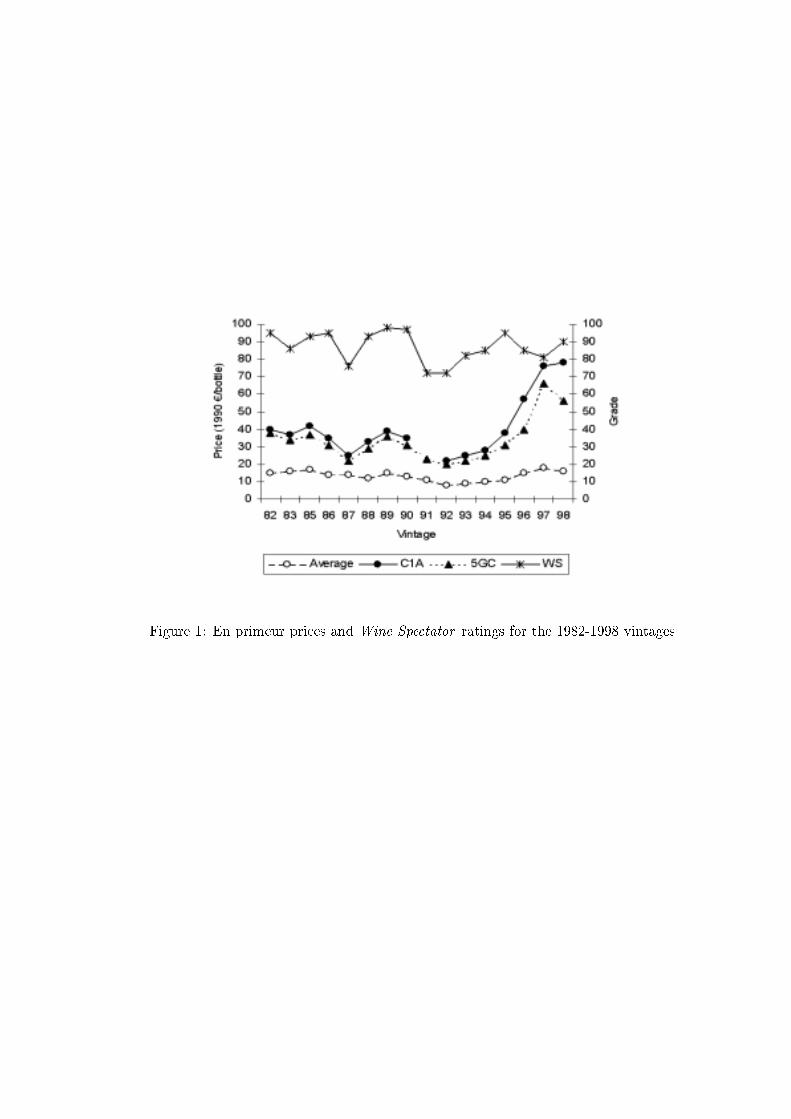
Figure 1: En primeur prices and Wine Spectator ratings for the 1982-1998 vintages
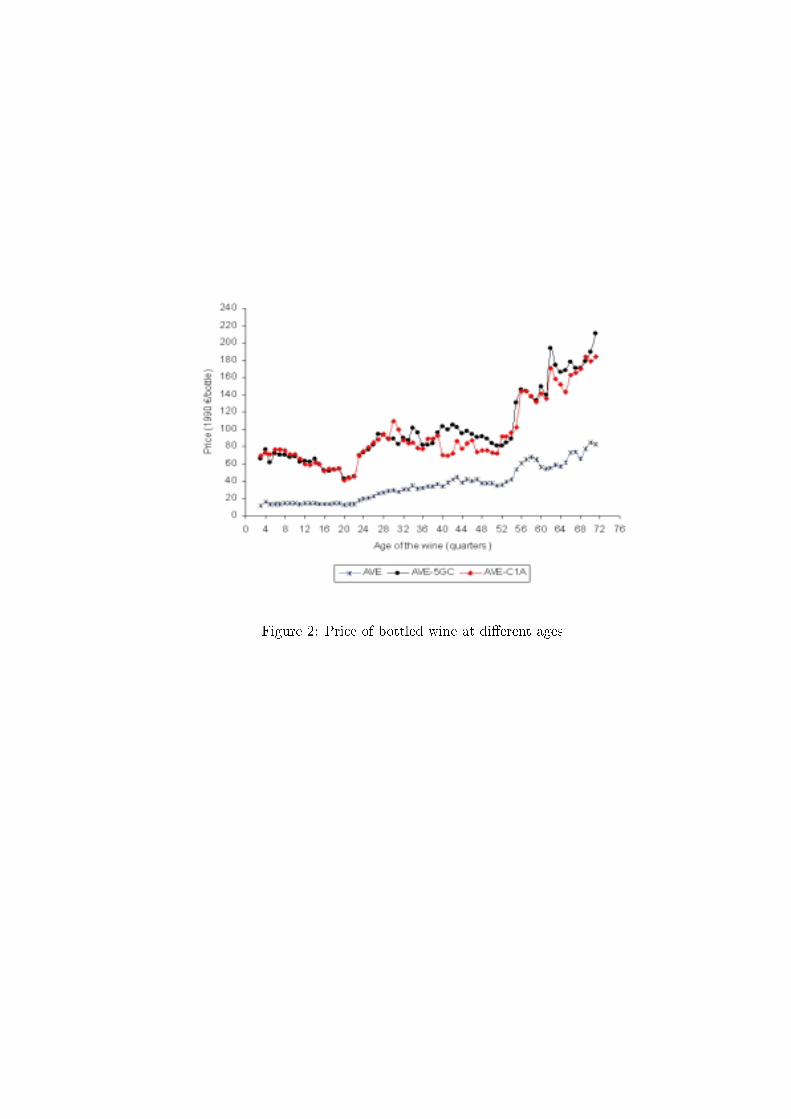
Figure 2: Price of bottled wine at di�erent ages