Embed Size (px)
Citation preview
Reproducibility of the online Food4Me foodfrequency questionnaire for estimating dietary intakes across Europe Article
Accepted Version
Marshall, S. J., Livingstone, K. M., CelisMorales, C., Forster, H., Fallaize, R., O’Donovan, C. B., Woolhead, C., Marsaux, C. F. M., Macready, A. L., NavasCarretero, S., SanCristobal, R., Kolossa, S., Tsirigoti, L., Lambrinou, C. P., Moschonis, G., Godlewska, M., Surwillo, A., Drevon, C. A., Manios, Y., Traczyk, I., Martınez, J. A., Saris, W. H. M., Daniel, H., Gibney, E. R., Brennan, L., Walsh, M. C., Lovegrove, J. A., Gibney, M. and Mathers, J. C. (2016) Reproducibility of the online Food4Me foodfrequency questionnaire for estimating dietary intakes across Europe. Journal of Nutrition, 146 (5). pp. 10681075. ISSN 00223166 doi: https://doi.org/10.3945/jn.115.225078 Available at http://centaur.reading.ac.uk/62842/
It is advisable to refer to the publisher’s version if you intend to cite from the work. See Guidance on citing .Published version at: http://jn.nutrition.org/content/early/2016/04/05/jn.115.225078.abstract
To link to this article DOI: http://dx.doi.org/10.3945/jn.115.225078
Publisher: American Society for Nutrition

All outputs in CentAUR are protected by Intellectual Property Rights law, including copyright law. Copyright and IPR is retained by the creators or other copyright holders. Terms and conditions for use of this material are defined in the End User Agreement .
www.reading.ac.uk/centaur
CentAUR
Central Archive at the University of Reading
Reading’s research outputs online
1
Title
Reproducibility of the online Food4Me food frequency questionnaire for estimating
dietary intakes across Europe1,2,3
Footnotes
1, This work was supported by the European Commission under the Food, Agriculture,
Fisheries and Biotechnology Theme of the 7th Framework Programme for Research and
Technological Development [265494].
2, Author disclosures: None of the authors had a personal or financial conflict of interest.
3, Supplemental Tables and Figures are available from the ‘‘Online Supporting Material’’
link in the online posting of the article and from the same link in the online table of contents
at http://jn.nutrition.org.
Author names
Steven J. Marshall*1, Katherine M. Livingstone*
1, Carlos Celis-Morales
1, Hannah Forster
2,
Rosalind Fallaize3, Clare B. O’Donovan
2, Clara Woolhead
2, Cyril F.M. Marsaux
4, Anna L.
Macready3, Santiago Navas-Carretero
5, Rodrigo San-Cristobal
5, Silvia Kolossa
6, Lydia
Tsirigoti7, Christina P. Lambrinou
7, George Moschonis
7, Magdalena Godlewska
8, Agnieszka
Surwiłło8, Christian A. Drevon
9, Yannis Manios
7, Iwona Traczyk
8, J. Alfredo Martinez
5,
Wim H. Saris4, Hannelore Daniel
6, Eileen R. Gibney
2, Lorraine Brennan
2, Marianne C.
Walsh2, Julie A. Lovegrove
3, Mike Gibney
2, John C. Mathers
1, on behalf of the Food4Me
Study.
2
Author affiliations
1, Human Nutrition Research Centre, Institute of Cellular Medicine, Newcastle University,
Newcastle Upon Tyne, UK (KML, [email protected]; CCM,
[email protected]; JCM, [email protected]; SJM
2, UCD Institute of Food and Health, University College Dublin, Belfield, Dublin 4, Republic
of Ireland (CBD, [email protected]; HF, [email protected]; CW,
[email protected]; ERG, [email protected]; LB, [email protected];
MCW, [email protected]; MG, [email protected])
3, Hugh Sinclair Unit of Human Nutrition and Institute for Cardiovascular and Metabolic
Research, University of Reading, Reading, UK (ALM, [email protected]; RF,
[email protected]; JAL, [email protected])
4, Department of Human Biology, NUTRIM School of Nutrition and Translational Research
in Metabolism, Maastricht University Medical Centre, Maastricht, The Netherlands (CFMM,
[email protected]; WHS, [email protected])
5, Center for Nutrition Research, University of Navarra, Pamplona, Spain; CIBER
Fisiopatología Obesidad y Nutrición (CIBERobn), Instituto de Salud Carlos III, Madrid,
Spain (SNC, [email protected]; RSC, [email protected]; JAM, [email protected])
6, ZIEL Research Center of Nutrition and Food Sciences, Biochemistry Unit, Technical
University of Munich, Germany (SK, [email protected]; HD, [email protected])
7, Department of Nutrition and Dietetics, Harokopio University, Athens, Greece (LT,
[email protected]; CPL, [email protected]; GM, [email protected]; YM,
8, National Food & Nutrition Institute (IZZ), Poland (MG, [email protected]; AS,
3
9, Department of Nutrition, Institute of Basic Medical Sciences, Faculty of Medicine,
University of Oslo, Oslo, Norway (CAD, [email protected])
*SJM and KML are joint first authors
Pubmed indexing: Marshall; Livingstone; Celis-Morales; Foster; Fallaize; O’Donovan;
Woolhead; Marsaux; Macready; Navas-Carretero; San-Cristobal; Kolossa; Tsirigoti;
Lambrinou; Moschonis; Godlewska; Surwiłło; Drevon; Manios; Traczyk; Martinez; Saris;
Daniel; Gibney; Brennan; Walsh; Lovegrove; Gibney; Mathers
Corresponding author; request for reprints
Professor John C. Mathers
Human Nutrition Research Centre
Institute of Cellular Medicine
Newcastle University
Biomedical Research Building
Campus for Ageing and Vitality
Newcastle upon Tyne
NE4 5PL
Tel: +44 (0) 1912081133 Fax: +44 (0) 1912481101
Word Count - 5303
Number of figures - 1
Number of tables - 3
Running title: Online food frequency questionnaire reproducibility

4
OSM available
Abbreviations
Food frequency questionnaire (FFQ); Limits of agreement (LOA); Monounsaturated fatty
acid (MUFA); Omega-3 fatty acid (n-3 FA); Pearson’s correlation coefficient (PCC);
Physical activity level (PAL); Polyunsaturated fatty acid (PUFA); Randomized controlled
trial (RCT); Saturated fatty acid (SFA); Sedentary behavior (SB); Spearman’s correlation
coefficient (SCC, rho)
5
5
Abstract 1
Background: Accurate dietary assessment is key to understanding nutrition-related outcomes 2
and is essential for estimating dietary change in nutrition-based interventions. 3
Objective: The objective of this study was to assess the pan-European reproducibility of the 4
Food4Me FFQ in assessing the habitual diet of adults. 5
Methods: Participants were included from the Food4Me study, a 6-mo, internet-based, 6
randomized controlled trial of personalized nutrition conducted in the UK, Ireland, Spain, the 7
Netherlands, Germany, Greece and Poland. Screening and baseline data (both prior to 8
commencement of the intervention) were used in the present analyses and participants were 9
only included if they completed FFQs at screening and at baseline within a one-month 10
timeframe prior to the commencement of the intervention. Socio-demographic (e.g. sex and 11
country) and lifestyle (e.g. BMI and physical activity) characteristics were collected. Linear 12
regression, correlation coefficients, concordance (%) in quartile classification and Bland-13
Altman plots for daily intakes were used to assess reproducibility. 14
Results: 567 participants (age 38.7 ± 13.4 y; 59% female; BMI 25.4 ± 4.8 kg/m2) completed 15
both FFQs within one-month (mean 19.2 ± 6.2 d). Exact plus adjacent classification of total 16
energy intake in participants was highest in Ireland (94%) and lowest in Poland (81%). 17
Spearman Correlation Coefficients (rho) in total energy intake between FFQs ranged from 18
0.50 for obese participants to 0.68 and 0.60 in normal and overweight participants 19
respectively. Bland-Altman plots showed a mean difference between FFQs of 210 kcal/d, 20
with the agreement deteriorating as energy intakes increased. There was little variation in 21
reproducibility of total energy intakes between sex and age groups. 22
6
6
Conclusions: The online Food4Me FFQ was shown to be reproducible across 7 European 23
countries when administered within a one month period to a large number of participants. 24
The results support the utility of the online Food4Me FFQ as a reproducible tool across 25
multiple European populations. 26
Trial registration – Clinicaltrials.gov NCT01530139 27
Key words: Food frequency questionnaire; reproducibility; online; dietary intakes; European 28
7
7
Introduction 29
Given that poor diet is a predominant cause of the growing burden of non-communicable 30
diseases, more effective strategies for improving diet are of increasing importance (1) . In 31
tandem, accurate dietary assessment tools are essential for evaluating the efficacy of lifestyle 32
interventions (2) but all current methods of assessing habitual dietary intakes (including 33
weighed-dietary intakes, 24-hour dietary recall and food frequency questionnaires (FFQ)) are 34
subjective (3). Although weighed dietary recalls are considered the most accurate of the three 35
(4), retrospective recalls (24-hour recalls and FFQs) offer the advantages of lower costs and 36
lower-respondent burden (5) and are therefore widely used in large scale epidemiological and 37
intervention studies. 38
With more than 70% of Europeans now Internet users (6), Internet-based diet and lifestyle 39
interventions, including Internet-based FFQs, are an attractive, cost-effective and scalable 40
alternative to face-to-face interventions (7). However, self-reported dietary assessment is 41
prone to respondent bias (8), which may limit reproducibility of the FFQ, resulting in poor 42
measures of dietary change and in chance associations with disease outcomes (9, 10). It is 43
therefore essential to evaluate the measurement error and reproducibility of FFQs to ensure 44
confidence in the precision of any diet-related outcomes. 45
The online Food4Me FFQ used in this study was validated previously against a weighed food 46
record over a 4-wk period (n=49) and showed moderate agreement (correlation coefficient 47
0.47) for assessing energy and nutrient intake (11), and a good agreement (0.60) against the 48
EPIC-Norfolk printed FFQ (n=113) (12). Furthermore the reproducibility of the online 49
Food4Me FFQ was assessed in the UK (n=100) and showed good agreement, with mean 50
cross-classification into "exact agreement plus adjacent" at 92% for both nutrient and food 51
group intakes (11). The aim of our present investigation was to verify that the online 52
8
8
Food4Me FFQ was reproducible across 7 European countries by comparing estimated intakes 53
of foods, energy and nutrients between screening and baseline in the Food4Me study. 54
55
Methods 56
Study design 57
The Food4Me study was a 6-mo, internet-based, randomized controlled trial (RCT) of 58
personalized nutrition designed to improve diet and PA behaviors, which was conducted 59
across 7 European countries (n=1607). Recruitment was via the Food4Me website (13) from 60
the following sites: University College Dublin (Ireland), Maastricht University (The 61
Netherlands), University of Navarra (Spain), Harokopio University (Greece), University of 62
Reading (United Kingdom, UK) and National Food and Nutrition Institute (Poland), 63
Technical University of Munich (Germany). Individuals with ill-health, food intolerances, or 64
special nutritional requirements (e.g. pregnancy) were ineligible to participate. Body mass 65
index (BMI) was estimated from self-reported body weight and height (14). Participants self-66
reported smoking habits and occupation. Physical activity level (ratio between total energy 67
expenditure and basal metabolic rate; PAL) and sedentary behavior (SB; min/d) were 68
estimated from tri-axial accelerometers (TracmorD, Philips Consumer Lifestyle, The 69
Netherlands). The Research Ethics Committees at each University or Research Centre 70
granted ethical approval for the study. All participants signed online consent forms. The 71
Food4Me trial was registered as a RCT (NCT01530139) at Clinicaltrials.gov. Full details on 72
the study design are available elsewhere (14). 73
74
Food4Me FFQ 75
9
9
The Food4Me FFQ is an online, semi-quantitative FFQ, which was administered to 76
individuals at screening, baseline and at follow-up timepoints following randomization. For 77
the purposes of this reproducibility study, screening and baseline were used, as no change in 78
diet was expected. FFQs were available in the language of the country, with respondents 79
asked to report mean consumption over the previous month for 157 items in the UK and 80
Ireland (based on the 130-item printed EPIC-Norfolk FFQ (version CAMB/PQ/6/1205) (12, 81
15)), with additional country-specific foods added to capture intakes in the other 5 82
recruitment countries (e.g. “stroopwafels” was added to the Dutch FFQ). A total of 11 food 83
categories were included: 1) cereal, 2) bread and savory biscuits, 3) potatoes, rice and pasta, 84
4) meat and fish, 5) dairy products, 6) fats and spreads, 7) sweets and snacks, 8) soups, sauces 85
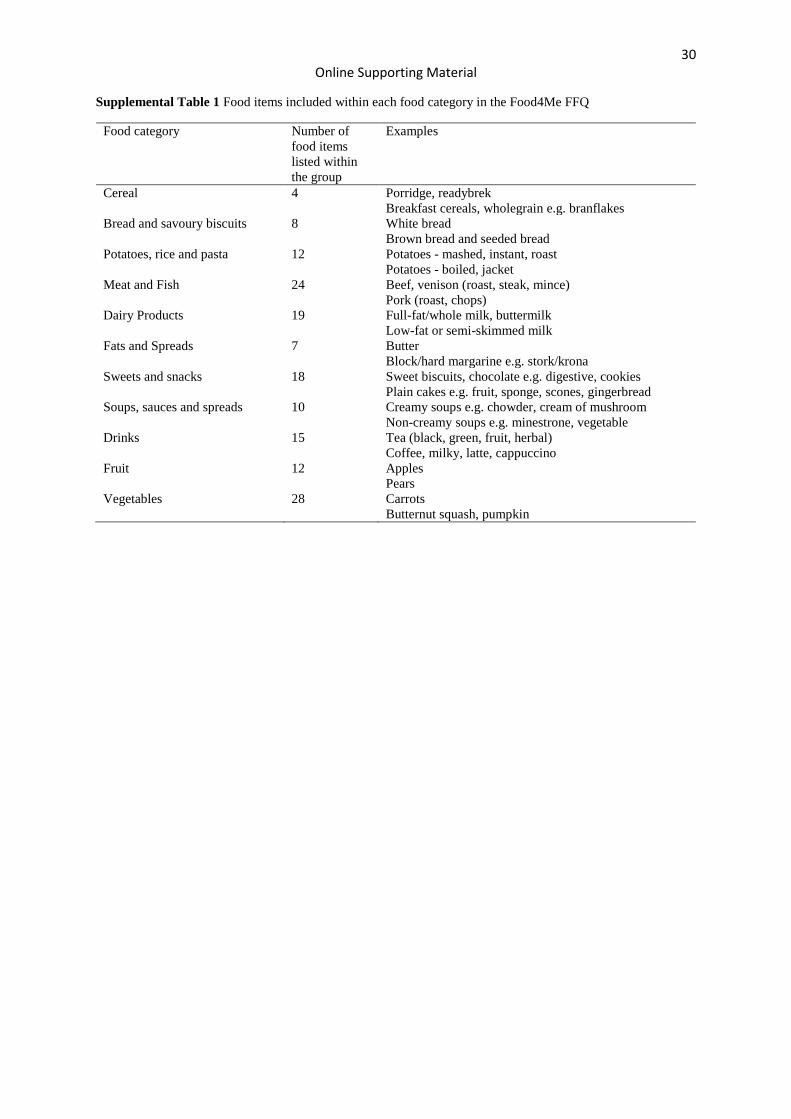
and spreads, 9) drinks, 10) fruit and 11) vegetables (Table S1). Frequency of consumption of 86
each food item was estimated by selecting one of the following options: never or less than 87
once/mo, 1-3 times/mo, once/wk, 2-4 times/wk, 5-6 times/wk, once/d, 2-3 times/d, 5-6 88
times/d or >6 times/d. The online Food4Me FFQ included photographs of the foods and 89
participant selected the appropriate portion size from the following options: very small, small, 90
small/medium, medium, medium/large, large or very large. Food intake (g/d) was then 91
calculated by multiplying portion size by frequency of consumption. For the purpose of 92
comparing food group intakes, the 11 food categories were subdivided into 35 food groups 93
based on previous validation by Forster et al. (12). Further details on the Food4Me FFQ are 94
provided elsewhere (14). 95
96
Statistical Analysis 97
Statistical analysis was performed using STATA (version 12; StataCorp, College Station, TX, 98
USA) and MedCalc Statistical Software (version 12.2.1.0; Medcalc, Mariakerke, Belgium). 99
10
10
ANOVA (continuous data) and logistic regression (categorical) tested for overall differences 100
in anthropometric and socio-demographic characteristics (dependent variable) between 101
countries (independent variable) and were adjusted for age and sex. Post hoc Tukey’s tests 102
and logistic regression (adjusted for age and sex) investigated differences in characteristics 103
(dependent variable) between a given country and the overall mean for all countries 104
(independent variable) (Table 1). FFQ reproducibility was determined by comparing dietary 105
intakes at screening and baseline (mean 2.7 ± 0.9 wk apart). As the FFQ was designed to 106
assess dietary intakes over a 1-month period, participants were excluded from the current 107
analysis if the time period between completion of FFQs was > 1 month (16). Participants 108
with implausible energy intakes were excluded based on the upper limit of sustained energy 109
expenditure defined by the Scientific Advisory Committee for Nutrition: energy intake > 2.5 110
x Basal Metabolic Rate (17). Multiple linear regression was used to determine differences in 111
total energy, nutrient and food group intakes (dependent variable) between FFQs 112
(independent variable) and were adjusted for age, sex, country, time of FFQ completion and 113
total energy intake at screening. Normality of data was assessed using the Shapiro-Wilk test 114
and, depending on the outcome, comparison of energy, nutrients and food group intake was 115
assessed using Pearson’s product moment correlation coefficients (PCC) or Spearman’s 116
correlation coefficient (SCC, rho). Energy-adjusted correlation coefficients were estimated 117
using the residual method (18). Briefly, residuals from the regression analysis (energy intake 118
as independent variable and nutrient intake as dependent) were added to the expected nutrient 119
value for the mean energy intake of the sample (Table 2 and Table 3). The coefficient of 120
reproducibility between methods was calculated (19). Concordance (%) in quartile 121
classification estimated the relative agreements between FFQs. Quartiles of intakes of 122
nutrients and food groups were used to determine changes in classification between 123
timepoints. The percentages of participants classified into the correct quartile (exact 124
11
11
classification), adjacent quartile (exact classification plus adjacent), two quartiles apart 125
(misclassification) or three quartiles apart (extreme misclassification) were estimated 126
(Supplemental Table 2 and Supplemental Table 3). Bland-Altman plots determined 127
clinical relevance of any difference in total energy and nutrients between methods based on 128
the mean difference between methods (bias), trends, variability and widths of the limits of 129
agreement (LOA; Figure 1). Reproducibility of total energy intakes was assessed according 130
to age (<45 y and ≥45 y), sex, country, completion period between FFQs (short: 0-15.6 d; 131
medium: 15.6-22.6 d; long: 22.6-31 d) and BMI at screening (underweight: BMI <18.5 132
kg/m2; normal weight: 18.5 to 24.9 kg/m
2; overweight: 25 to 29.9 kg/m
2; obese: ≥30 kg/m
2) 133
using regression analyses, SCC and concordance (%) in quartile classification 134
(Supplemental Table 4). 135
136
Sensitivity analysis 137
Sensitivity analyses excluded participants who over- or under-reported energy intakes 138
(Supplemental Fig. 1). Under-reporting was operationalized as an energy intake < 1.1 139
multiplied by predicted basal metabolic rate (using the Henry equation (20)) (21), and energy 140
intakes > 4500 kcal/d were classified as over-reporting (22). 141
142
Results 143
Of the 1607 randomized participants, 1480 completed the FFQ at screening and at baseline 144
and 665 completed the FFQs within one month of each other. Spain was excluded from all 145
analyses due to insufficient numbers completing the FFQs within the 1-month timeframe 146
(n=5). A further 93 participants were excluded based on implausible energy intakes. 147
12
12
Individuals from Greece had higher BMI, WC, more participants in routine and manual work, 148
less students and more participants not currently working than the overall mean across all 149
countries. Less Polish participants were in routine and manual employment and more Polish 150
participants were females, while more Dutch were leaner, than the overall mean. Less 151
participants from the United Kingdom were Caucasian, while there were less female 152
participants from Ireland than the overall mean. No significant differences in PAL, BW or SB 153
were identified (Table 1). 154
155
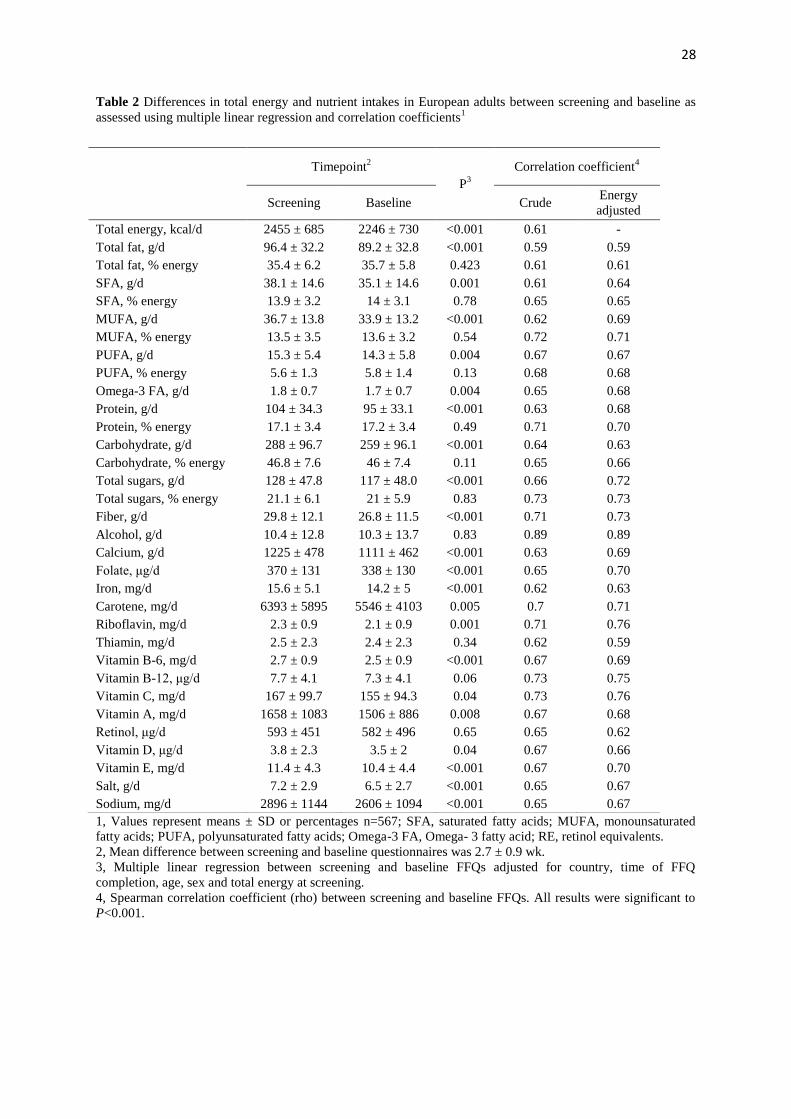
Reproducibility of nutrient intakes 156
Total energy intakes and intakes of protein, carbohydrate, total fat, saturated (SFA), mono- 157
(MUFA) and polyunsaturated fatty acids (PUFA), omega-3 (n-3 FA), sugar, salt, calcium, 158
folate, iron, carotene, riboflavin, fiber, sodium and vitamins B-6, C, A, D and E were lower at 159
baseline than at screening (P<0.05; Table 2). There were no significant differences between 160
timepoints for percentage energy intakes from total fat, MUFAs, PUFAs, protein, 161
carbohydrate and sugars or for intakes of alcohol, vitamin B-12, thiamine and retinol. 162
Shapiro-Wilk tests revealed that data were not normally distributed therefore SCC was used 163
to examine correlations. Unadjusted SCCs ranged from 0.59 for total fat (g/d) to 0.89 for 164
alcohol (mean 0.67; P<0.001), while energy adjusted SCCs ranged from 0.59 for total fat to 165
0.89 for alcohol (0.69; P<0.001; Table 2). 166
The percentage of participants whose dietary intakes were classified exactly at baseline, 167
compared with screening, ranged from lowest for total fat to highest for alcohol (mean 50%; 168
Supplemental Table 2). In total, 88% of participants were classified into the same or adjacent 169
quartile, 10% were misclassified and 2% were extremely misclassified. 170

13
13
Bland-Altman plots comparing intakes of energy, total fat, protein and carbohydrate between 171
timepoints are shown in Figure 1. The bias (mean difference) for total energy, carbohydrate, 172
protein and fat intake was 210 kcal/d, 11.4%, 9.1% and 9.0% respectively. A positive trend 173
indicated a lower agreement in intakes between timepoints for those who reported higher 174
energy intakes (>4500 kcal/d) and who were classified as over-reporters in the sensitivity 175
analyses. The amount consumed did not affect the agreement between intakes of 176
carbohydrate, protein and fat. 177
178
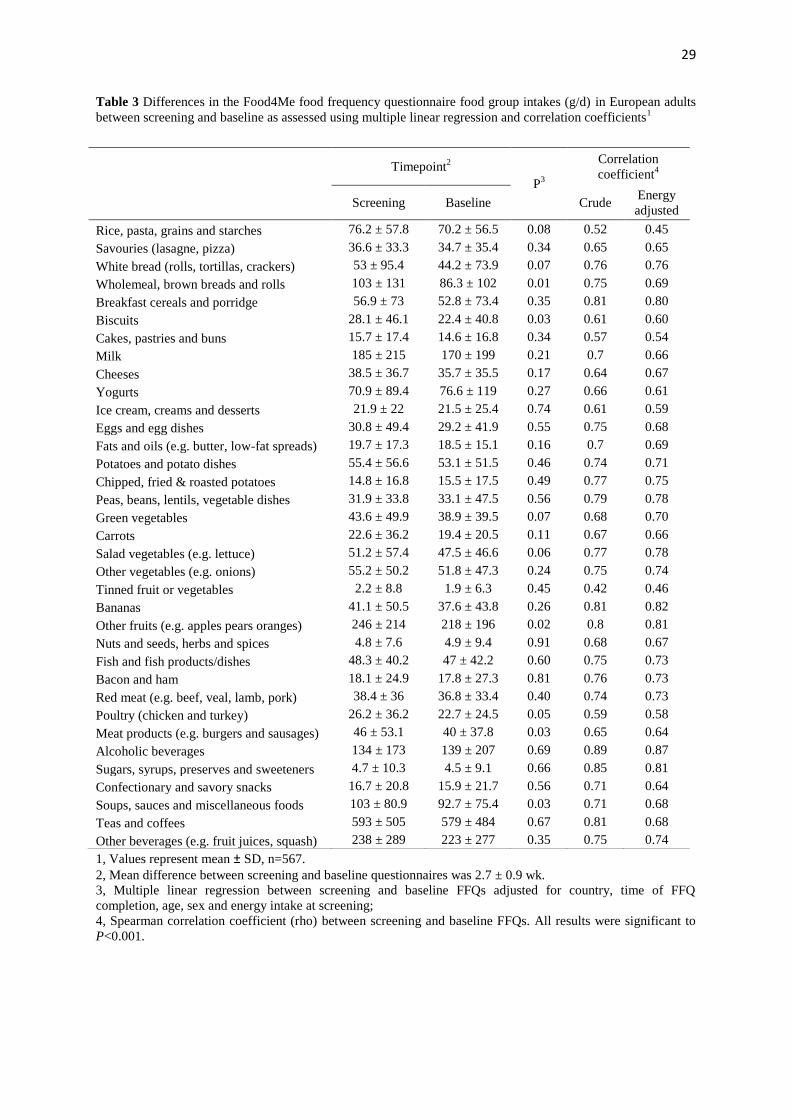
Reproducibility of food group intakes 179
Reported intakes of wholemeal bread, biscuits, other fruits, meat products and soups, sauces 180
and miscellaneous foods were lower at baseline compared with screening (P<0.05; Table 3). 181
Unadjusted SCC ranged from 0.42 for tinned fruit or vegetables to 0.89 for alcoholic 182
beverages (mean 0.71, P<0.001), while energy adjusted SCCs ranged from 0.45 for rice, 183
pasta, grains and starches to 0.87 for alcoholic beverages (mean 0.69; P<0.001). 184
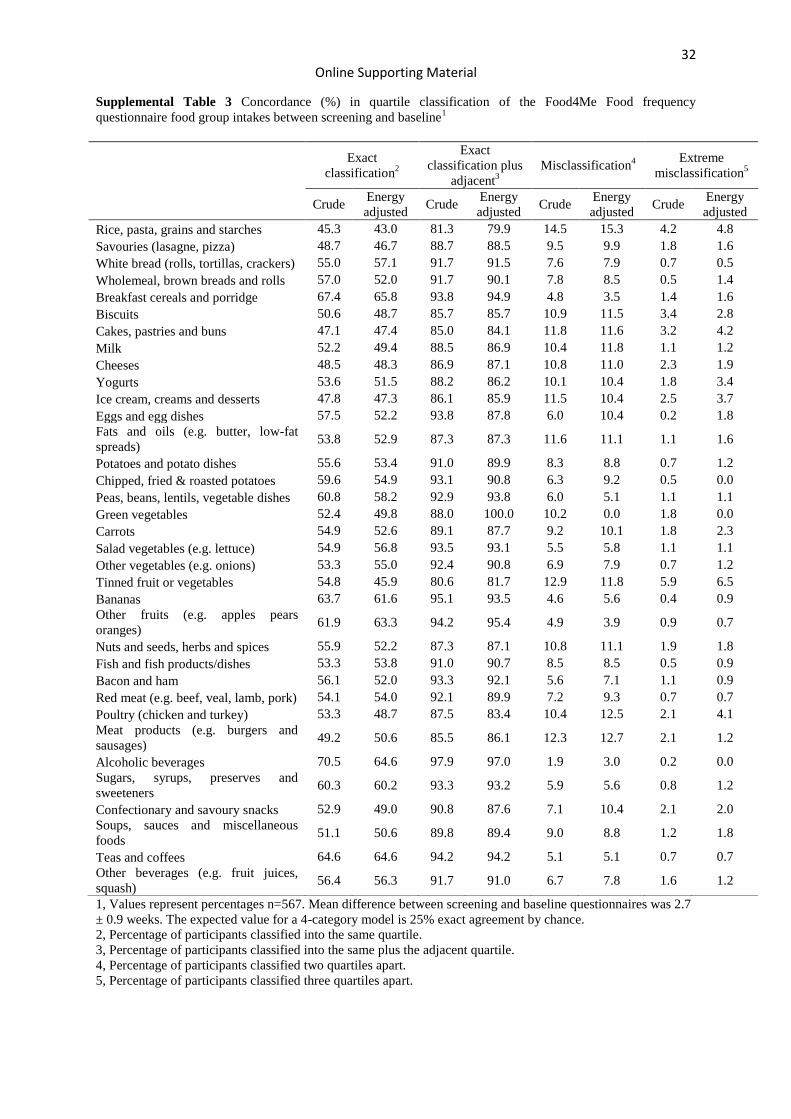
As shown in Supplemental Table 3, the percentage of participants correctly classified into the 185
same quartile for food group intakes was lowest for rice, pasta, grains and starches and 186
highest for alcoholic beverages. For all food groups, the mean percentages of participants 187
who were misclassified and extremely misclassified were 8% and 2% respectively. 188
189
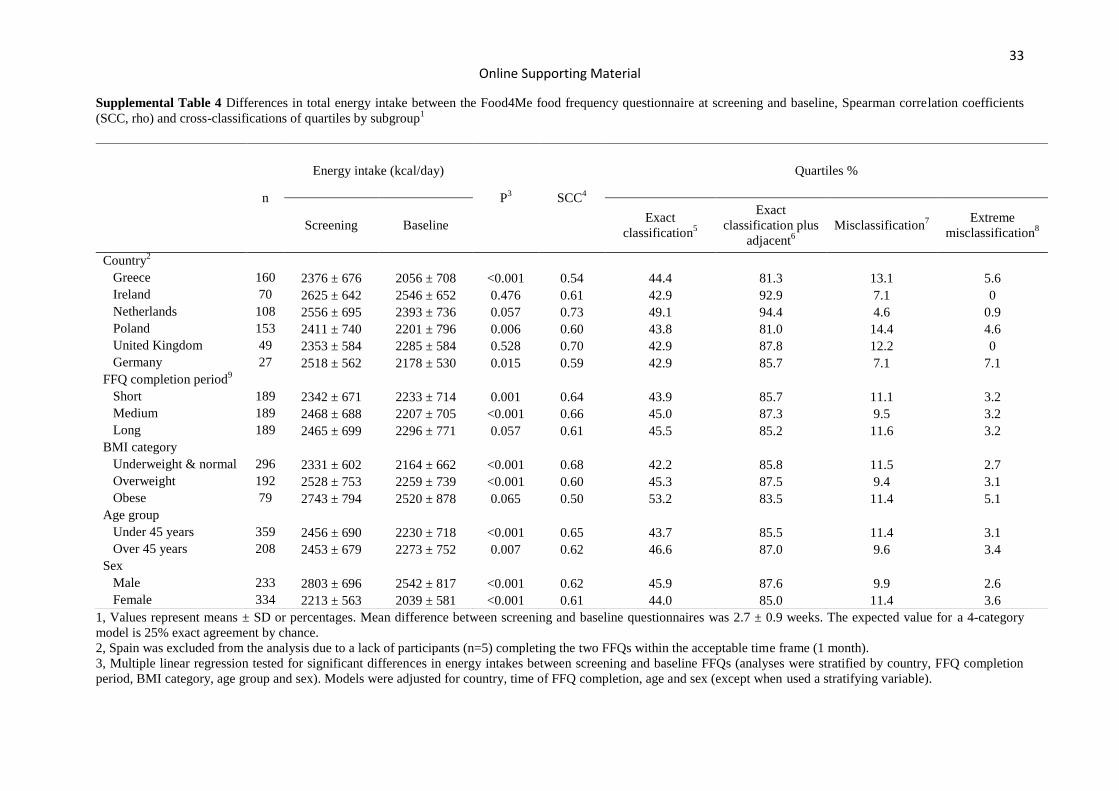
Sub group analysis: reproducibility of total energy intakes 190
As summarized in Supplemental Table 4, energy intake was lower at baseline than at 191
screening for Greece, Poland and Germany. Correlations in energy intakes between 192
timepoints were highest for the Netherlands and lowest for Greece, while the percentage 193
14
14
energy intakes correctly classified was lowest in Germany and the United Kingdom and 194
highest in the Netherlands. Energy intake was lower at baseline compared with screening for 195
those with short and medium time between assessments but not for the longest. For 196
participants with the longest period of time between completing FFQs, SCC of energy intakes 197
were poorest (Table S3). Energy intake was lower at baseline than at screening for normal 198
and overweight participants but not for obese participants. SCCs were lower and the 199
percentage of individuals misclassified was higher in overweight and obese participants than 200
normal weight participants (Table S3). Energy intake was lower at baseline than at screening 201
for participants both ≥ and < 45 y. SCCs for energy intakes between timepoints were higher 202
for participants ≥ 45 y, with similar proportions of individuals correctly classified and 203
extremely misclassified. Energy intakes at baseline were lower than at screening for both 204
male and females. Although more females than males were correctly classified into the same 205
quartile, more females than males were misclassified (Table S3). 206
207
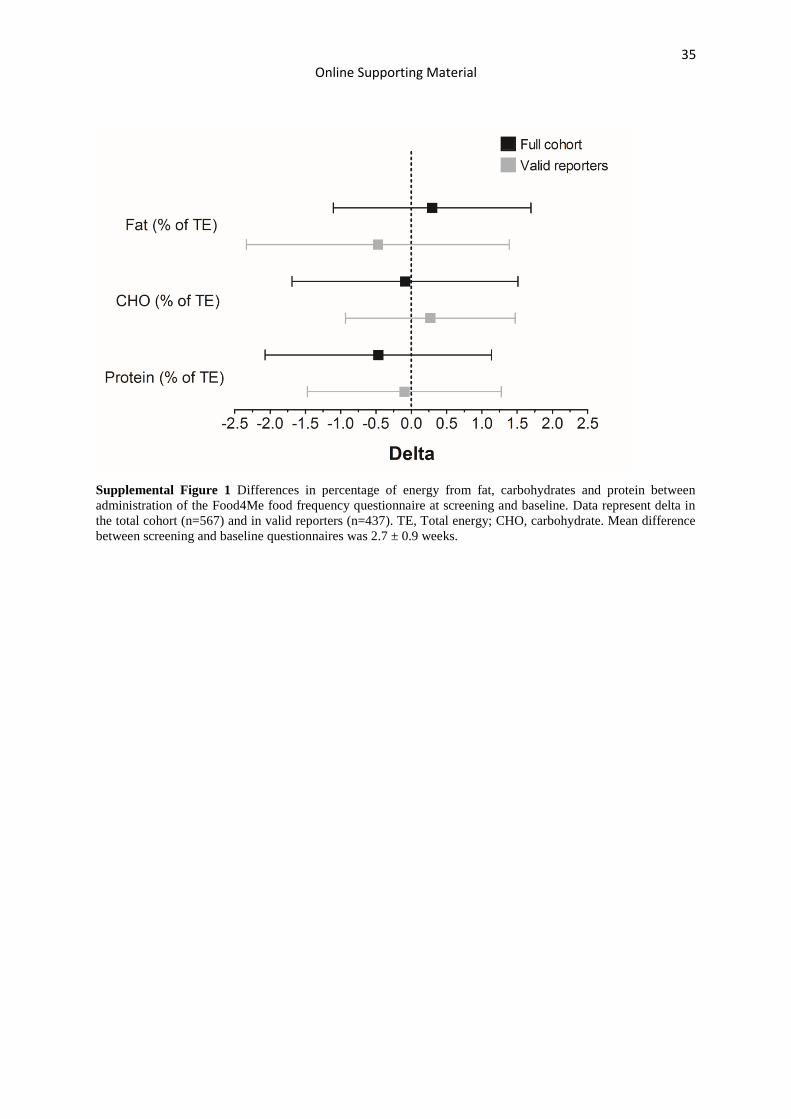
Sensitivity Analysis 208
Analyses were repeated in valid reports (n=437) after the removal of over- (n=8) and under-209
reporters (n=122). Supplemental Fig. 1 summarizes the delta between timepoints for 210
percentage energy from fat, carbohydrates and protein in the total cohort and in valid 211
reporters. This difference between timepoints is consistently smaller for the valid reporters in 212
comparison with the whole cohort. After exclusion of mis-reporters, differences between 213
timepoints in reported intakes of total fat, SFAs, MUFAs, PUFAs, n-3 FA, protein, calcium, 214
carotene, riboflavin and vitamins C, A, biscuits, other fruits and soups, sauces and 215
miscellaneous foods were not significant. For nutrients, SCC ranged from 0.60 for total fat 216
and SFA g/day to 0.91 for alcohol and for food groups from 0.52 for rice, pasta, grains and 217
15
15
starches to 0.91 for alcoholic beverages (P<0.001). Bland-Altman analysis on valid reports 218
produced a higher agreement between timepoints for total energy intake (bias reduced from 219
210 kcal/d to 88.5 kcal/d), carbohydrate (11.4% to 5.3%), protein (9.2% to 2.3%) and fat 220
(9.5% to 2.4%). The coefficient of reproducibility in valid reports was reduced by 780kcal/d 221
for energy intake, 14.4% for percentage energy from carbohydrate, 12.7% for protein intake 222
and 13.3% for fat intake. 223
224
Discussion 225
Main findings 226
Our main findings indicate that the online Food4Me FFQ is reproducible for estimation of 227
nutrient and food group intakes by adults across 7 European countries. 228
229
Comparison with other studies 230
An earlier study investigated the reproducibility of the online Food4Me FFQ by asking 100 231
participants within a single country (UK) to complete the FFQ on two occasions 4 wk apart. 232
In that study, Fallaize et al. (11) reported higher mean correlation coefficients than in the 233
present study for total energy intake (0.77 vs 0.61), nutrients (0.75 vs 0.67) and food group 234
intakes (0.75 vs 0.71). Cross classification analysis for nutrients was also higher, with 92% of 235
participants classified into the same or adjacent quartile, compared with 88% in the current 236
paper. Bland-Altman analysis indicated a lower mean difference for total energy intake in the 237
study by Fallaize et al. (11) compared with ours (135 kcal/d vs 210 kcal/d), however, the 238
removal of mis-reporters lowered the mean difference in the current study to 89kcal/d. In the 239
current study, the online Food4Me FFQ was administered to a much larger and more diverse 240
16
16
group of participants across 7 European countries who, in addition to completing the FFQ, 241
were responding to a wider range of questionnaires. Furthermore, FFQ reproducibility in the 242
study by Fallaize et al. (11) was assessed in conjunction with validation against a 4-day 243
weighed food diary, which may have increased the participants awareness of their habitual 244
intake and, thus, they may have been more likely to report similar intakes. The observed 245
lower agreement between repeated administrations of the FFQ in the current study may be 246
because the participants were less focused on the FFQ per se. Previous studies of the 247
reproducibility of FFQs have reported correlation coefficients for total energy intake of 0.66 248
and 0.65 (8, 23, 24), which are very similar to our observations. The much higher correlation 249
of 0.82 reported by Beasley et al. (25) was for an internet-based FFQ repeated within a short 250
time interval (one wk) and thus subject to less variation (26). The shortest interval between 251
FFQ administrations in the current study (0-15.65 d) produced a correlation of 0.64, lower 252
than the 0.82 reported by Beasley et al. (25). However reproducibility in Beasley et al. (25) 253
was also accompanied by a validation study against a 4-d weighed food diary, which may 254
have improved correlations by increasing the participants awareness of their diet. Cross-255
classification analyses in the current study showed agreements that were comparable with 256
previous studies for energy, nutrients and food groups (27-29). We observed that reported 257
energy intakes were lower in the second FFQ, which confirms findings from other 258
reproducibility studies (11, 25, 28, 30) and may be attributed to the learning effect of repeated 259
measure. Alternatively, this observation may be due to fatigue caused by overburdening 260
participants who had recently completed the initial FFQ (31). However, when mis-reporters 261
were excluded, most differences between screening and baseline were no longer significant. 262
Previous FFQ reproducibility studies using repeated assessments within one month have 263
reported coefficient ranges of 0.58-0.86 for energy intake between several countries (11, 23, 264
25, 28, 29, 32). Inter-country variations in SCCs in the Food4Me FFQ were similar, 265
17
17
suggesting that this dietary assessment tool has wide applicability across several European 266
countries. The disparity between the cross-classifications and SCC in the UK may have been 267
due to the presence of dietary mis-reporters and following exclusion of mis-reporters, these 268
measures of reproducibility were more closely aligned. Our gender-dependent findings are 269
consistent with a previous study (33), reporting higher reproducibility for a 240-item FFQ in 270
males than in females (PCC 0.70 and 0.65, respectively). The reproducibility of the online 271
Food4Me FFQ was similar for both older and younger participants. The lower reported 272
energy intake at baseline compared with screening was significant for both normal weight 273
and overweight participants but not for obese participants. This is probably due to a smaller 274
sample size of obese individuals (n=79) compared with
normal weight (n=296) and 275
overweight (n=192) individuals as when assessed by SCC, reproducibility was lowest in the 276
obese group. These findings confirm previous results, where obese individuals are more 277
likely to mis-report their dietary intakes (34, 35). Self-administered dietary assessment tools 278
should thus be interpreted with caution when applied to a population of predominantly obese 279
subjects. 280
Previous studies on the validation and reproducibility of the Food4Me FFQ excluded under- 281
and over-reporters prior to the main analysis (11, 12). The current study included the whole 282
cohort. The percentage of people under-reporting (21.5%) was higher than that of over-283
reporters (1.4%), a common occurrence that has been previously reported (36). A sensitivity 284
analysis following removal of misreports improved the reproducibility of the Food4Me FFQ. 285
286
Strengths and limitations 287
The main strength of this study is large number of participants from 7 European countries, 288
which enabled stratification according to country, age, sex, obesity status and time interval 289
18
18
between FFQs. However, by excluding participants who did not complete FFQs within a 1-290
month period, we had too few participants from Spain (n=5) to allow comparisons with this 291
country. Nonetheless, another strength of this study is that it was possible to assess the FFQ 292
reproducibility between valid and mis-reporters in a European population. As recommended 293
by Cade et al. (16), we applied the cut off of < 1 month between repeated FFQs to avoid 294
confounding by real temporal changes in food intake. With a short time between the FFQs, it 295
is conceivable that participants might remember and, therefore replicate, their previous FFQ 296
responses (16). However, the comprehensive nature of the online Food4Me FFQ would make 297
this unlikely and a 1-month period is considered an optimal time-period to assess 298
reproducibility (16), whilst minimizing any influence of dietary change over time (11). 299
300
Conclusion 301
The Food4Me FFQ is moderately reproducible when administered to a large cohort of 302
European adults. Variations in reproducibility between countries were small, thus providing 303
confidence in the utility of the method for reporting intakes of energy, nutrients and food 304
groups across multiple European countries. 305
306
307
Authors’ contributions 308
The authors’ responsibilities were as follows: YM, IT, CAD, ERG, LB, JAL, JAM, WHS, 309
HD, MG and JCM contributed to the research design. JCM was the Proof of Principle study 310
leader. CCM, CFMM, HF, CBO, CW, ALM, RF, SNC, RSC, SK, LT, CPL, MG, AS, MCW, 311
ERG, LB and JCM contributed to the developing the Standardised Operating Procedure for 312
19
19
the study. CCM, SNC, RSC, CW, CBO, HF, CFMM, ALM, RF, SK, LT, CPL, MG, AS, 313
MCW and JCM conducted the intervention. CCM, CFMM and WHS contributed to physical 314
activity measurements. SJM and KML drafted the paper and performed the statistical 315
analysis for the manuscript and are joint first authors. All authors contributed to a critical 316
review of the manuscript during the writing process. All authors approved the final version to 317
be published. 318
20
20
Figure Legends 319
Figure 1. Bland-Altman plots for reproducibility between screening and baseline intakes of 320
A. total energy, B. fat, C. protein and D. carbohydrate (n=567) in European adults. The solid 321
line represents the mean difference, the dashed line represents the limits of agreement and the 322
dotted line represents the trend in agreement.323
21
References
1. Beaglehole R, Bonita R, Horton R, Adams C, Alleyne G, Asaria P, Baugh V,
Bekedam H, Billo N, Casswell S, et al. Priority actions for the non-communicable
disease crisis. Lancet. 2011;377:1438-47.
2. Adamson AJ, Mathers JC. Effecting dietary change. Proc Nutr Soc. 2004;63:537-47.
3. Dhurandhar NV, Schoeller D, Brown AW, Heymsfield SB, Thomas D, Sorensen TI,
Speakman JR, Jeansonne M, Allison DB. Energy balance measurement: When
something is not better than nothing. Int J Obes. 2015;39:1109-13.
4. Boushey C, Coulston AM. Nutrition in the prevention and treatment of disease.
Amsterdam: Academic Press; 2008.
5. Subar AF. Developing dietary assessment tools. J Am Diet Assoc. 2004;104:769-70.
6. Miniwatts Marketing Group. World internet usage and population statistics [cited
2015 April 11]. Available from: http://www.internetworldstats.com/stats.htm.
7. Steele RM, Mummery WK, Dwyer T. A comparison of face-to-face or internet-
delivered physical activity intervention on targeted determinants. Health Educ Behav.
2009;36:1051-64.
8. Fernandez-Ballarth JD, Lluis Pinol J, Zazpe I, Corella D, Carrasco P, Toledo E,
Perez-Bauer M, Angel Martinez-Gonzalez M, Salas-Salvado J, Martin-Moreno JM.
Relative validity of a semi-quantitative food-frequency questionnaire in an elderly
mediterranean population of spain. Br J Nutr. 2010;103:1808-16.
9. Marks GC, Hughes MC, van der Pols JC. Relative validity of food intake estimates
using a food frequency questionnaire is associated with sex, age, and other personal
characteristics. J Nutr. 2006;136:459-65.
10. Schatzkin A, Kipnis V, Carroll RJ, Midthune D, Subar AF, Bingham S, Schoeller
DA, Troiano RP, Freedman LS. A comparison of a food frequency questionnaire with
22
a 24-hour recall for use in an epidemiological cohort study: Results from the
biomarker-based observing protein and energy nutrition (open) study. Int J Epidemiol.
2003;32:1054-62.
11. Fallaize R, Forster H, Macready AL, Walsh MC, Mathers JC, Brennan L, Gibney ER,
Gibney MJ, Lovegrove JA. Online dietary intake estimation: Reproducibility and
validity of the food4me food frequency questionnaire against a 4-day weighed food
record. J Med Internet Res. 2014;16:e190.
12. Forster H, Fallaize R, Gallagher C, O'Donovan CB, Woolhead C, Walsh MC,
Macready AL, Lovegrove JA, Mathers JC, Gibney MJ, et al. Online dietary intake
estimation: The food4me food frequency questionnaire. J Med Internet Res.
2014;16:e150.
13. Food4Me. An integrated analysis of opportunities and challenges for personalised
nutrition [cited 2015 December 12]. Available from: http://www.food4me.org/.
14. Celis-Morales C, Livingstone KM, Marsaux CFM, Forster H, O'Donovan CB,
Woolhead C, Macready AL, Fallaize R, Navas-Carretero S, San-Cristobal R, et al.
Design and baseline characteristics of the food4me study: A web-based randomised
controlled trial of personalised nutrition in seven european countries. Genes Nutr.
2015;10:450.
15. Bingham SA, Gill C, Welch A, Cassidy A, Runswick SA, Oakes S, Lubin R,
Thurnham DI, Key TJA, Roe L, et al. Validation of dietary assessment methods in the
uk arm of epic using weighed records, and 24-hour urinary nitrogen and potassium
and serum vitamin c and carotenoids as biomarkers. Int J Epidemiol. 1997;26:S137-
S51.
16. Cade J, Thompson R, Burley V, Warm D. Development, validation and utilisation of
food-frequency questionnaires - a review. Public Health Nutr. 2002;5:567-87.
23
17. Scientific Advisory Committee on Nutrition. Dietary reference values for energy 2011
[cited 2016 19 February]. Available from:
https://www.gov.uk/government/uploads/system/uploads/attachment_data/file/339317
/SACN_Dietary_Reference_Values_for_Energy.pdf.
18. Willett WC, Howe GR, Kushi LH. Adjustment for total energy intake in
epidemiologic studies. Am J Clin Nutr. 1997;65:1220-8.
19. Bland JM, Altman DG. Statistical methods for assessing agreement between two
methods of clinical measurement. Lancet. 1986;1:307-10.
20. Henry CJK. Basal metabolic rate studies in humans: Measurement and development
of new equations. Public Health Nutr. 2005;8:1133-52.
21. Goldberg GR, Black AE, Jebb SA, Cole TJ, Murgatroyd PR, Coward WA, Prentice
AM. Critical-evaluation of energy-intake data using fundamental principles of energy
physiology: 1. Derivation of cutoff limits to identify under-recording. Eur J Clin Nutr.
1991;45:569-81.
22. Hebert JR, Peterson KE, Hurley TG, Stoddard AM, Cohen N, Field AE, Sorensen G.
The effect of social desirability trait on self-reported dietary measures among multi-
ethnic female health center employees. Ann Epidemiol. 2001;11:417-27.
23. Vereecken CA, De Bourdeaudhuij I, Maes L, Grp HS. The helena online food
frequency questionnaire: Reproducibility and comparison with four 24-h recalls in
belgian-flemish adolescents. Eur J Clin Nutr. 2010;64:541-8.
24. Johansson L, Solvoll K, Opdahl S, Bjorneboe GEA, Drevon CA. Response rates with
different distribution methods and reward, and reproducibility of a quantitative food
frequency questionnaire. Eur J Clin Nutr. 1997;51:346-53.
25. Beasley JM, Davis A, Riley WT. Evaluation of a web-based, pictorial diet history
questionnaire. Public Health Nutr. 2009;12:651-9.
24
26. Tsubono Y, Nishino Y, Fukao A, Hisamichi S, Tsugane S. Temporal change in the
reproducibility of a self-administered food frequency questionnaire. Am J Epidemiol.
1995;142:1231-5.
27. Filippi AR, Amodio E, Napoli G, Breda J, Bianco A, Jemni M, Censi L, Mammina C,
Tabacchi G. The web-based asso-food frequency questionnaire for adolescents:
Relative and absolute reproducibility assessment. Nutr J. 2014;13:
28. Labonte ME, Cyr A, Baril-Gravel L, Royer MM, Lamarche B. Validity and
reproducibility of a web-based, self-administered food frequency questionnaire. Eur J
Clin Nutr. 2012;66:166-73.
29. Nurul-Fadhilah A, Teo PS, Foo LH. Validity and reproducibility of a food frequency
questionnaire (ffq) for dietary assessment in malay adolescents in malaysia. Asia Pac
J Clin Nutr. 2012;21:97-103.
30. Zhao W-H, Huang Z-P, Zhang X, He L, Willett W, Wang J-L, Hasegawa K, Chen J-
S. Reproducibility and validity of a chinese food frequency questionnaire. Biomed
Environ Sci. 2010;23:1-38.
31. Wong JE, Parnell WR, Black KE, Skidmore PML. Reliability and relative validity of
a food frequency questionnaire to assess food group intakes in new zealand
adolescents. Nutr J. 2012;11:
32. Sarmento RA, Antonio JP, Riboldi BP, Montenegro KR, Friedman R, de Azevedo
MJ, de Almeida JC. Reproducibility and validity of a quantitative ffq designed for
patients with type 2 diabetes mellitus from southern brazil. Public Health Nutr.
2014;17:2237-45.
33. Kesse-Guyot E, Castetbon K, Touvier M, Hercberg S, Galan P. Relative validity and
reproducibility of a food frequency questionnaire designed for french adults. Ann
Nutr Metab. 2011;57:153-62.
25
34. Johansson L, Solvoll K, Bjorneboe GEA, Drevon CA. Under- and overreporting of
energy intake related to weight status and lifestyle in a nationwide sample. Am J Clin
Nutr. 1998;68:266-74.
35. Pfrimer K, Vilela M, Resende CM, Scagliusi FB, Marchini JS, Lima NKC, Moriguti
JC, Ferriolli E. Under-reporting of food intake and body fatness in independent older
people: A doubly labelled water study. Age Ageing. 2015;44:103-8.
36. Lutomski JE, van den Broeck J, Harrington J, Shiely F, Perry IJ. Sociodemographic,
lifestyle, mental health and dietary factors associated with direction of misreporting of
energy intake. Public Health Nutr. 2011;14:532-41.

26
A
B
C
D
Figure 1.

27
Table 1 Anthropometric and soc
io-demographic characteristics of European adults by country at the time of completing the screening Food4Me food frequency questionnaire1
1, Values represent means ± SD or percentages; PAL, physical activity level (ratio between total energy expenditure and basal metabolic rate); SB, sedentary behavior.
2, ANOVA and logistic regression were used to test for significant differences across countries in continuous and categorical variables, respectively. Analyses were adjusted
for age and sex; * Post hoc Tukey tests (continuous data) and logistic regression (categorical) were used to test for significant differences between a given country and the
overall study mean across all countries, P<0.05.
Total
(n=567)
Country P2
Greece
(n=160)
Ireland
(n=70)
Netherlands
(n=108)
Poland
(n=153)
UK
(n=49)
Germany
(n=27)
Age, y 38.7 ± 13.4 38.3 ± 11.2 39.6 ± 13.2 42.7 ± 16.6 35.0 ± 12.1 38.4 ± 12.6 43.4 ± 15.4 <0.001
Sex, Female, % 58.9 58.1 41.4* 50.9 70.1* 67.4 59.3 0.03
Ethnicity, Caucasian, % 97.5 99.4 97.1 95.4 100 87.8* 100 0.04
Occupation, %
Professional and managerial 31.2 31.3 40.0 36.1 19.0 46.9 29.6 0.98
Intermediate occupations 29.1 28.1 21.4 17.6 46.4 12.2 33.3 0.47
Routine and manual 11.6 18.1* 14.3 8.3 5.9* 14.3 7.4 0.02
Student 17.1 7.5* 15.7 24.1 22.9 18.4 14.8 0.048
Not currently working 10.9 15.0* 8.6 13.9 5.9 8.2 14.8 0.04
Anthropometrics
BMI, kg/m2 25.4 ± 4.8 26.7 ± 5.5* 26.0 ± 4.6 24.4 ± 3.9* 24.7 ± 4.7 25.3 ± 4.3 24.5 ± 3.0 <0.001
Waist circumference, cm 85.5 ± 14.1 89.3 ± 14.8* 87.5 ± 14.1 84.6 ± 12.5 81.6 ± 14.2 84.2 ± 11.7 85.4 ± 13.0 <0.001
Body weight, kg 75.0 ± 15.4 76.9 ± 15.7 78.3 ± 16.3 74.7 ± 13.5 71.1 ± 16.2 72.7 ± 14.1 75.0 ± 12.1 0.13
Physical activity
PAL 1.7 ± 0.2 1.7 ± 0.1 1.8 ± 0.2 1.7 ± 0.2 1.7 ± 0.2 1.7 ± 0.2 1.7 ± 0.2 0.07
SB, min/d 745 ± 78.0 744 ± 89.4 755 ± 72.1 753 ± 72.1 741 ± 79.2 725 ± 59.2 762 ± 66.7 0.36
28
Table 2 Differences in total energy and nutrient intakes in European adults between screening and baseline as
assessed using multiple linear regression and correlation coefficients1
1, Values represent means ± SD or percentages n=567; SFA, saturated fatty acids; MUFA, monounsaturated
fatty acids; PUFA, polyunsaturated fatty acids; Omega-3 FA, Omega- 3 fatty acid; RE, retinol equivalents.
2, Mean difference between screening and baseline questionnaires was 2.7 ± 0.9 wk.
3, Multiple linear regression between screening and baseline FFQs adjusted for country, time of FFQ
completion, age, sex and total energy at screening.
4, Spearman correlation coefficient (rho) between screening and baseline FFQs. All results were significant to
P<0.001.
Timepoint2
P3
Correlation coefficient4
Screening Baseline Crude Energy
adjusted
Total energy, kcal/d 2455 ± 685 2246 ± 730 <0.001 0.61 -
Total fat, g/d 96.4 ± 32.2 89.2 ± 32.8 <0.001 0.59 0.59
Total fat, % energy 35.4 ± 6.2 35.7 ± 5.8 0.423 0.61 0.61
SFA, g/d 38.1 ± 14.6 35.1 ± 14.6 0.001 0.61 0.64
SFA, % energy 13.9 ± 3.2 14 ± 3.1 0.78 0.65 0.65
MUFA, g/d 36.7 ± 13.8 33.9 ± 13.2 <0.001 0.62 0.69
MUFA, % energy 13.5 ± 3.5 13.6 ± 3.2 0.54 0.72 0.71
PUFA, g/d 15.3 ± 5.4 14.3 ± 5.8 0.004 0.67 0.67
PUFA, % energy 5.6 ± 1.3 5.8 ± 1.4 0.13 0.68 0.68
Omega-3 FA, g/d 1.8 ± 0.7 1.7 ± 0.7 0.004 0.65 0.68
Protein, g/d 104 ± 34.3 95 ± 33.1 <0.001 0.63 0.68
Protein, % energy 17.1 ± 3.4 17.2 ± 3.4 0.49 0.71 0.70
Carbohydrate, g/d 288 ± 96.7 259 ± 96.1 <0.001 0.64 0.63
Carbohydrate, % energy 46.8 ± 7.6 46 ± 7.4 0.11 0.65 0.66
Total sugars, g/d 128 ± 47.8 117 ± 48.0 <0.001 0.66 0.72
Total sugars, % energy 21.1 ± 6.1 21 ± 5.9 0.83 0.73 0.73
Fiber, g/d 29.8 ± 12.1 26.8 ± 11.5 <0.001 0.71 0.73
Alcohol, g/d 10.4 ± 12.8 10.3 ± 13.7 0.83 0.89 0.89
Calcium, g/d 1225 ± 478 1111 ± 462 <0.001 0.63 0.69
Folate, μg/d 370 ± 131 338 ± 130 <0.001 0.65 0.70
Iron, mg/d 15.6 ± 5.1 14.2 ± 5 <0.001 0.62 0.63
Carotene, mg/d 6393 ± 5895 5546 ± 4103 0.005 0.7 0.71
Riboflavin, mg/d 2.3 ± 0.9 2.1 ± 0.9 0.001 0.71 0.76
Thiamin, mg/d 2.5 ± 2.3 2.4 ± 2.3 0.34 0.62 0.59
Vitamin B-6, mg/d 2.7 ± 0.9 2.5 ± 0.9 <0.001 0.67 0.69
Vitamin B-12, μg/d 7.7 ± 4.1 7.3 ± 4.1 0.06 0.73 0.75
Vitamin C, mg/d 167 ± 99.7 155 ± 94.3 0.04 0.73 0.76
Vitamin A, mg/d 1658 ± 1083 1506 ± 886 0.008 0.67 0.68
Retinol, μg/d 593 ± 451 582 ± 496 0.65 0.65 0.62
Vitamin D, μg/d 3.8 ± 2.3 3.5 ± 2 0.04 0.67 0.66
Vitamin E, mg/d 11.4 ± 4.3 10.4 ± 4.4 <0.001 0.67 0.70
Salt, g/d 7.2 ± 2.9 6.5 ± 2.7 <0.001 0.65 0.67
Sodium, mg/d 2896 ± 1144 2606 ± 1094 <0.001 0.65 0.67
29
Table 3 Differences in the Food4Me food frequency questionnaire food group intakes (g/d) in European adults
between screening and baseline as assessed using multiple linear regression and correlation coefficients1
1, Values represent mean ± SD, n=567.
2, Mean difference between screening and baseline questionnaires was 2.7 ± 0.9 wk.
3, Multiple linear regression between screening and baseline FFQs adjusted for country, time of FFQ
completion, age, sex and energy intake at screening;
4, Spearman correlation coefficient (rho) between screening and baseline FFQs. All results were significant to
P<0.001.
Timepoint2
P3
Correlation
coefficient4
Screening Baseline Crude Energy
adjusted
Rice, pasta, grains and starches 76.2 ± 57.8 70.2 ± 56.5 0.08 0.52 0.45
Savouries (lasagne, pizza) 36.6 ± 33.3 34.7 ± 35.4 0.34 0.65 0.65
White bread (rolls, tortillas, crackers) 53 ± 95.4 44.2 ± 73.9 0.07 0.76 0.76
Wholemeal, brown breads and rolls 103 ± 131 86.3 ± 102 0.01 0.75 0.69
Breakfast cereals and porridge 56.9 ± 73 52.8 ± 73.4 0.35 0.81 0.80
Biscuits 28.1 ± 46.1 22.4 ± 40.8 0.03 0.61 0.60
Cakes, pastries and buns 15.7 ± 17.4 14.6 ± 16.8 0.34 0.57 0.54
Milk 185 ± 215 170 ± 199 0.21 0.7 0.66
Cheeses 38.5 ± 36.7 35.7 ± 35.5 0.17 0.64 0.67
Yogurts 70.9 ± 89.4 76.6 ± 119 0.27 0.66 0.61
Ice cream, creams and desserts 21.9 ± 22 21.5 ± 25.4 0.74 0.61 0.59
Eggs and egg dishes 30.8 ± 49.4 29.2 ± 41.9 0.55 0.75 0.68
Fats and oils (e.g. butter, low-fat spreads) 19.7 ± 17.3 18.5 ± 15.1 0.16 0.7 0.69
Potatoes and potato dishes 55.4 ± 56.6 53.1 ± 51.5 0.46 0.74 0.71
Chipped, fried & roasted potatoes 14.8 ± 16.8 15.5 ± 17.5 0.49 0.77 0.75
Peas, beans, lentils, vegetable dishes 31.9 ± 33.8 33.1 ± 47.5 0.56 0.79 0.78
Green vegetables 43.6 ± 49.9 38.9 ± 39.5 0.07 0.68 0.70
Carrots 22.6 ± 36.2 19.4 ± 20.5 0.11 0.67 0.66
Salad vegetables (e.g. lettuce) 51.2 ± 57.4 47.5 ± 46.6 0.06 0.77 0.78
Other vegetables (e.g. onions) 55.2 ± 50.2 51.8 ± 47.3 0.24 0.75 0.74
Tinned fruit or vegetables 2.2 ± 8.8 1.9 ± 6.3 0.45 0.42 0.46
Bananas 41.1 ± 50.5 37.6 ± 43.8 0.26 0.81 0.82
Other fruits (e.g. apples pears oranges) 246 ± 214 218 ± 196 0.02 0.8 0.81
Nuts and seeds, herbs and spices 4.8 ± 7.6 4.9 ± 9.4 0.91 0.68 0.67
Fish and fish products/dishes 48.3 ± 40.2 47 ± 42.2 0.60 0.75 0.73
Bacon and ham 18.1 ± 24.9 17.8 ± 27.3 0.81 0.76 0.73
Red meat (e.g. beef, veal, lamb, pork) 38.4 ± 36 36.8 ± 33.4 0.40 0.74 0.73
Poultry (chicken and turkey) 26.2 ± 36.2 22.7 ± 24.5 0.05 0.59 0.58
Meat products (e.g. burgers and sausages) 46 ± 53.1 40 ± 37.8 0.03 0.65 0.64
Alcoholic beverages 134 ± 173 139 ± 207 0.69 0.89 0.87
Sugars, syrups, preserves and sweeteners 4.7 ± 10.3 4.5 ± 9.1 0.66 0.85 0.81
Confectionary and savory snacks 16.7 ± 20.8 15.9 ± 21.7 0.56 0.71 0.64
Soups, sauces and miscellaneous foods 103 ± 80.9 92.7 ± 75.4 0.03 0.71 0.68
Teas and coffees 593 ± 505 579 ± 484 0.67 0.81 0.68
Other beverages (e.g. fruit juices, squash) 238 ± 289 223 ± 277 0.35 0.75 0.74
30 Online Supporting Material
Supplemental Table 1 Food items included within each food category in the Food4Me FFQ
Food category Number of
food items
listed within
the group
Examples
Cereal 4 Porridge, readybrek
Breakfast cereals, wholegrain e.g. branflakes
Bread and savoury biscuits 8 White bread
Brown bread and seeded bread
Potatoes, rice and pasta 12 Potatoes - mashed, instant, roast
Potatoes - boiled, jacket
Meat and Fish 24 Beef, venison (roast, steak, mince)
Pork (roast, chops)
Dairy Products 19 Full-fat/whole milk, buttermilk
Low-fat or semi-skimmed milk
Fats and Spreads 7 Butter
Block/hard margarine e.g. stork/krona
Sweets and snacks 18 Sweet biscuits, chocolate e.g. digestive, cookies
Plain cakes e.g. fruit, sponge, scones, gingerbread
Soups, sauces and spreads 10 Creamy soups e.g. chowder, cream of mushroom
Non-creamy soups e.g. minestrone, vegetable
Drinks 15 Tea (black, green, fruit, herbal)
Coffee, milky, latte, cappuccino
Fruit 12 Apples
Pears
Vegetables 28 Carrots
Butternut squash, pumpkin
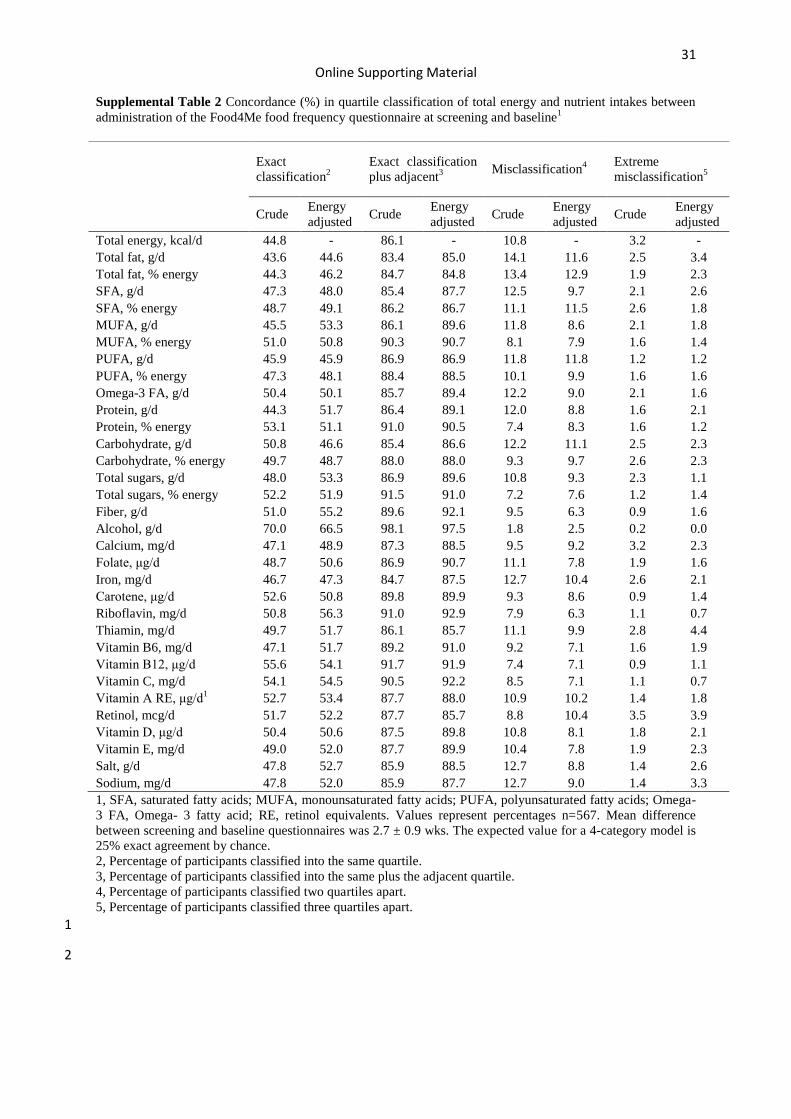
31 Online Supporting Material
Supplemental Table 2 Concordance (%) in quartile classification of total energy and nutrient intakes between
administration of the Food4Me food frequency questionnaire at screening and baseline1
1, SFA, saturated fatty acids; MUFA, monounsaturated fatty acids; PUFA, polyunsaturated fatty acids; Omega-
3 FA, Omega- 3 fatty acid; RE, retinol equivalents. Values represent percentages n=567. Mean difference
between screening and baseline questionnaires was 2.7 ± 0.9 wks. The expected value for a 4-category model is
25% exact agreement by chance.
2, Percentage of participants classified into the same quartile.
3, Percentage of participants classified into the same plus the adjacent quartile.
4, Percentage of participants classified two quartiles apart.
5, Percentage of participants classified three quartiles apart.
1
2
Exact
classification2
Exact classification
plus adjacent3
Misclassification4
Extreme
misclassification5
Crude Energy
adjusted Crude
Energy
adjusted Crude
Energy
adjusted Crude
Energy
adjusted
Total energy, kcal/d 44.8 - 86.1 - 10.8 - 3.2 -
Total fat, g/d 43.6 44.6 83.4 85.0 14.1 11.6 2.5 3.4
Total fat, % energy 44.3 46.2 84.7 84.8 13.4 12.9 1.9 2.3
SFA, g/d 47.3 48.0 85.4 87.7 12.5 9.7 2.1 2.6
SFA, % energy 48.7 49.1 86.2 86.7 11.1 11.5 2.6 1.8
MUFA, g/d 45.5 53.3 86.1 89.6 11.8 8.6 2.1 1.8
MUFA, % energy 51.0 50.8 90.3 90.7 8.1 7.9 1.6 1.4
PUFA, g/d 45.9 45.9 86.9 86.9 11.8 11.8 1.2 1.2
PUFA, % energy 47.3 48.1 88.4 88.5 10.1 9.9 1.6 1.6
Omega-3 FA, g/d 50.4 50.1 85.7 89.4 12.2 9.0 2.1 1.6
Protein, g/d 44.3 51.7 86.4 89.1 12.0 8.8 1.6 2.1
Protein, % energy 53.1 51.1 91.0 90.5 7.4 8.3 1.6 1.2
Carbohydrate, g/d 50.8 46.6 85.4 86.6 12.2 11.1 2.5 2.3
Carbohydrate, % energy 49.7 48.7 88.0 88.0 9.3 9.7 2.6 2.3
Total sugars, g/d 48.0 53.3 86.9 89.6 10.8 9.3 2.3 1.1
Total sugars, % energy 52.2 51.9 91.5 91.0 7.2 7.6 1.2 1.4
Fiber, g/d 51.0 55.2 89.6 92.1 9.5 6.3 0.9 1.6
Alcohol, g/d 70.0 66.5 98.1 97.5 1.8 2.5 0.2 0.0
Calcium, mg/d 47.1 48.9 87.3 88.5 9.5 9.2 3.2 2.3
Folate, μg/d 48.7 50.6 86.9 90.7 11.1 7.8 1.9 1.6
Iron, mg/d 46.7 47.3 84.7 87.5 12.7 10.4 2.6 2.1
Carotene, μg/d 52.6 50.8 89.8 89.9 9.3 8.6 0.9 1.4
Riboflavin, mg/d 50.8 56.3 91.0 92.9 7.9 6.3 1.1 0.7
Thiamin, mg/d 49.7 51.7 86.1 85.7 11.1 9.9 2.8 4.4
Vitamin B6, mg/d 47.1 51.7 89.2 91.0 9.2 7.1 1.6 1.9
Vitamin B12, μg/d 55.6 54.1 91.7 91.9 7.4 7.1 0.9 1.1
Vitamin C, mg/d 54.1 54.5 90.5 92.2 8.5 7.1 1.1 0.7
Vitamin A RE, μg/d1 52.7 53.4 87.7 88.0 10.9 10.2 1.4 1.8
Retinol, mcg/d 51.7 52.2 87.7 85.7 8.8 10.4 3.5 3.9
Vitamin D, μg/d 50.4 50.6 87.5 89.8 10.8 8.1 1.8 2.1
Vitamin E, mg/d 49.0 52.0 87.7 89.9 10.4 7.8 1.9 2.3
Salt, g/d 47.8 52.7 85.9 88.5 12.7 8.8 1.4 2.6
Sodium, mg/d 47.8 52.0 85.9 87.7 12.7 9.0 1.4 3.3
32 Online Supporting Material
Supplemental Table 3 Concordance (%) in quartile classification of the Food4Me Food frequency
questionnaire food group intakes between screening and baseline1
1, Values represent percentages n=567. Mean difference between screening and baseline questionnaires was 2.7
± 0.9 weeks. The expected value for a 4-category model is 25% exact agreement by chance.
2, Percentage of participants classified into the same quartile.
3, Percentage of participants classified into the same plus the adjacent quartile.
4, Percentage of participants classified two quartiles apart.
5, Percentage of participants classified three quartiles apart.
Exact
classification2
Exact
classification plus
adjacent3
Misclassification4
Extreme
misclassification5
Crude Energy
adjusted Crude
Energy
adjusted Crude
Energy
adjusted Crude
Energy
adjusted
Rice, pasta, grains and starches 45.3 43.0 81.3 79.9 14.5 15.3 4.2 4.8
Savouries (lasagne, pizza) 48.7 46.7 88.7 88.5 9.5 9.9 1.8 1.6
White bread (rolls, tortillas, crackers) 55.0 57.1 91.7 91.5 7.6 7.9 0.7 0.5
Wholemeal, brown breads and rolls 57.0 52.0 91.7 90.1 7.8 8.5 0.5 1.4
Breakfast cereals and porridge 67.4 65.8 93.8 94.9 4.8 3.5 1.4 1.6
Biscuits 50.6 48.7 85.7 85.7 10.9 11.5 3.4 2.8
Cakes, pastries and buns 47.1 47.4 85.0 84.1 11.8 11.6 3.2 4.2
Milk 52.2 49.4 88.5 86.9 10.4 11.8 1.1 1.2
Cheeses 48.5 48.3 86.9 87.1 10.8 11.0 2.3 1.9
Yogurts 53.6 51.5 88.2 86.2 10.1 10.4 1.8 3.4
Ice cream, creams and desserts 47.8 47.3 86.1 85.9 11.5 10.4 2.5 3.7
Eggs and egg dishes 57.5 52.2 93.8 87.8 6.0 10.4 0.2 1.8
Fats and oils (e.g. butter, low-fat
spreads) 53.8 52.9 87.3 87.3 11.6 11.1 1.1 1.6
Potatoes and potato dishes 55.6 53.4 91.0 89.9 8.3 8.8 0.7 1.2
Chipped, fried & roasted potatoes 59.6 54.9 93.1 90.8 6.3 9.2 0.5 0.0
Peas, beans, lentils, vegetable dishes 60.8 58.2 92.9 93.8 6.0 5.1 1.1 1.1
Green vegetables 52.4 49.8 88.0 100.0 10.2 0.0 1.8 0.0
Carrots 54.9 52.6 89.1 87.7 9.2 10.1 1.8 2.3
Salad vegetables (e.g. lettuce) 54.9 56.8 93.5 93.1 5.5 5.8 1.1 1.1
Other vegetables (e.g. onions) 53.3 55.0 92.4 90.8 6.9 7.9 0.7 1.2
Tinned fruit or vegetables 54.8 45.9 80.6 81.7 12.9 11.8 5.9 6.5
Bananas 63.7 61.6 95.1 93.5 4.6 5.6 0.4 0.9
Other fruits (e.g. apples pears
oranges) 61.9 63.3 94.2 95.4 4.9 3.9 0.9 0.7
Nuts and seeds, herbs and spices 55.9 52.2 87.3 87.1 10.8 11.1 1.9 1.8
Fish and fish products/dishes 53.3 53.8 91.0 90.7 8.5 8.5 0.5 0.9
Bacon and ham 56.1 52.0 93.3 92.1 5.6 7.1 1.1 0.9
Red meat (e.g. beef, veal, lamb, pork) 54.1 54.0 92.1 89.9 7.2 9.3 0.7 0.7
Poultry (chicken and turkey) 53.3 48.7 87.5 83.4 10.4 12.5 2.1 4.1
Meat products (e.g. burgers and
sausages) 49.2 50.6 85.5 86.1 12.3 12.7 2.1 1.2
Alcoholic beverages 70.5 64.6 97.9 97.0 1.9 3.0 0.2 0.0
Sugars, syrups, preserves and
sweeteners 60.3 60.2 93.3 93.2 5.9 5.6 0.8 1.2
Confectionary and savoury snacks 52.9 49.0 90.8 87.6 7.1 10.4 2.1 2.0
Soups, sauces and miscellaneous
foods 51.1 50.6 89.8 89.4 9.0 8.8 1.2 1.8
Teas and coffees 64.6 64.6 94.2 94.2 5.1 5.1 0.7 0.7
Other beverages (e.g. fruit juices,
squash) 56.4 56.3 91.7 91.0 6.7 7.8 1.6 1.2
33 Online Supporting Material
Supplemental Table 4 Differences in total energy intake between the Food4Me food frequency questionnaire at screening and baseline, Spearman correlation coefficients
(SCC, rho) and cross-classifications of quartiles by subgroup1
1, Values represent means ± SD or percentages. Mean difference between screening and baseline questionnaires was 2.7 ± 0.9 weeks. The expected value for a 4-category
model is 25% exact agreement by chance.
2, Spain was excluded from the analysis due to a lack of participants (n=5) completing the two FFQs within the acceptable time frame (1 month).
3, Multiple linear regression tested for significant differences in energy intakes between screening and baseline FFQs (analyses were stratified by country, FFQ completion
period, BMI category, age group and sex). Models were adjusted for country, time of FFQ completion, age and sex (except when used a stratifying variable).
n
Energy intake (kcal/day)
P3 SCC
4
Quartiles %
Screening Baseline Exact
classification5
Exact
classification plus
adjacent6
Misclassification7
Extreme
misclassification8
Country2
Greece 160 2376 ± 676 2056 ± 708 <0.001 0.54 44.4 81.3 13.1 5.6
Ireland 70 2625 ± 642 2546 ± 652 0.476 0.61 42.9 92.9 7.1 0
Netherlands 108 2556 ± 695 2393 ± 736 0.057 0.73 49.1 94.4 4.6 0.9
Poland 153 2411 ± 740 2201 ± 796 0.006 0.60 43.8 81.0 14.4 4.6
United Kingdom 49 2353 ± 584 2285 ± 584 0.528 0.70 42.9 87.8 12.2 0
Germany 27 2518 ± 562 2178 ± 530 0.015 0.59 42.9 85.7 7.1 7.1
FFQ completion period9
Short 189 2342 ± 671 2233 ± 714 0.001 0.64 43.9 85.7 11.1 3.2
Medium 189 2468 ± 688 2207 ± 705 <0.001 0.66 45.0 87.3 9.5 3.2
Long 189 2465 ± 699 2296 ± 771 0.057 0.61 45.5 85.2 11.6 3.2
BMI category
Underweight & normal 296 2331 ± 602 2164 ± 662 <0.001 0.68 42.2 85.8 11.5 2.7
Overweight 192 2528 ± 753 2259 ± 739 <0.001 0.60 45.3 87.5 9.4 3.1
Obese 79 2743 ± 794 2520 ± 878 0.065 0.50 53.2 83.5 11.4 5.1
Age group
Under 45 years 359 2456 ± 690 2230 ± 718 <0.001 0.65 43.7 85.5 11.4 3.1
Over 45 years 208 2453 ± 679 2273 ± 752 0.007 0.62 46.6 87.0 9.6 3.4
Sex
Male 233 2803 ± 696 2542 ± 817 <0.001 0.62 45.9 87.6 9.9 2.6
Female 334 2213 ± 563 2039 ± 581 <0.001 0.61 44.0 85.0 11.4 3.6

34 Online Supporting Material
4, Unadjusted Spearman correlation coefficients (rho) between screening and baseline FFQs. All results were significant to P<0.001.
5, Percentage of participants classified into the same quartile.
6, Percentage of participants classified into the same plus the adjacent quartile.
7, Percentage of participants classified two quartiles apart.
8, Percentage of participants classified three quartiles apart.
9, Short: 0-15.65 days; Medium: 15.66 – 22.63 days; Long: 22.64 – 31 days.
35 Online Supporting Material
Supplemental Figure 1 Differences in percentage of energy from fat, carbohydrates and protein between
administration of the Food4Me food frequency questionnaire at screening and baseline. Data represent delta in
the total cohort (n=567) and in valid reporters (n=437). TE, Total energy; CHO, carbohydrate. Mean difference
between screening and baseline questionnaires was 2.7 ± 0.9 weeks.


![Service Manual - daikinac.com · Service Manual Inverter Pair Ceiling Mounted Cassette Type FFQ-Q Series SiUS091628EA [Applied Models] z Inverter Pair : Heat Pump](https://img.pdfslide.us/doc/110x75/5eb5747ee09e503fd6266a1c/service-manual-service-manual-inverter-pair-ceiling-mounted-cassette-type-ffq-q.jpg)