Embed Size (px)
Citation preview
Hindawi Publishing CorporationJournal of ObesityVolume 2012, Article ID 597924, 8 pagesdoi:10.1155/2012/597924
Research Article
Fast Food Consumption, Quality of Diet, and Obesity amongIsfahanian Adolescent Girls
Mohammad Hossein Rouhani,1, 2 Maryam Mirseifinezhad,1, 2 Nasrin Omrani,1, 2
Ahmad Esmaillzadeh,1, 2 and Leila Azadbakht1, 2
1 Food Security Research Center, Isfahan University of Medical Sciences, Isfahan, Iran2 Department of Community Nutrition, School of Nutrition and Food Science, Isfahan University of Medical Sciences, Isfahan, Iran
Correspondence should be addressed to Leila Azadbakht, [email protected]
Received 2 January 2012; Revised 11 March 2012; Accepted 19 March 2012
Academic Editor: Jack A. Yanovski
Copyright © 2012 Mohammad Hossein Rouhani et al. This is an open access article distributed under the Creative CommonsAttribution License, which permits unrestricted use, distribution, and reproduction in any medium, provided the original work isproperly cited.
Background and Objective. Few data are available linking fast food intake to diet quality in developing countries. This study wasconducted to determine the association between fast food consumption and diet quality as well as obesity among Isfahani girls.Methods. This cross-sectional study was done among 140 Iranian adolescents selected by the use of systematic cluster randomsampling. Dietary intakes were assessed using a validated food frequency questionnaire. Diet quality was defined based on energydensity and nutrient adequacy ratios (NARs). Results. Individuals in the highest quartile of fast food intake had significantly lowerNARs for vitamin B1 (P = 0.008), phosphorus (P = 0.0250), selenium (P < 0.001) and vitamin B2 (P = 0.012) compared withthose in the lowest quartile. Those in top quartile of fast food intake consumed more energy-dense diets than those in the bottomquartile (P = 0.022). High intakes of fast foods were significantly associated with overweight (top quartile: 40% versus bottomquartile: 0%, P = 0.0001) and obesity (11.4% versus 2.9%, P = 0.0001). Conclusion. Fast food consumption is associated with poordiet quality and high prevalence of overweight and obesity among Isfahani adolescents. Prospective data are required to confirmthese findings.
1. Introduction
Obesity is a worldwide chronic disease which may lead totype 2 diabetes and cardiovascular diseases [1]. It is reportedthat 400 million adults are obese and 1.6 billion are over-weight worldwide [2]. The prevalence of obesity and over-weight among Iranian population was estimated to be 67%for women and 29% for men [3]. Besides the high prevalenceof obesity among adults, the prevalence of childhood obesityis also growing in an alarming rate. During three past de-cades, the prevalence of obesity among children and ado-lescents was doubled in the United States [4]. According tothe results of a national study in Iran, the prevalence of over-weight and obesity among Iranian children was 10.1% and4.7%, respectively, and approximately 10% of adolescentswere overweight [5]. A recent report revealed that skippingbreakfast, consuming unhealthy and high energy densesnack during school time, low level of physical activity, low
socioeconomic status, and familial history of obesity wereproposed factors regarding high prevalence of obesity amongIranian adolescent [6].
Nutrition transition is an important factor which can af-fect dietary intakes, particularly in developing countries [7].The rate of processed foods consumption (e.g., fast foods) isgoing to be increased due to nutrition transition [8].
Fast foods are rich sources of saturated fatty acids andtrans fatty acids [9]. Fast food consumption can lead to hy-perinsulinemia and development of insulin resistance. Highenergy density, high glycemic index, and fatty acid composi-tion of fast foods may increase the prevalence of obesity andcardiovascular risk factors [10]. Previous studies showed thatfast food outlets availability particularly in school neighbor-hood is related to increased body mass index in students[11]. The rate of fast food consumption has been increasedin past years specially among children and adolescents [12].
2 Journal of Obesity
Previous studies revealed that fast food consumption accom-panied with lower dietary quality [13]. According to the pub-lished papers, the diet quality of Iranian’s needs to be im-proved [14]. Iranian traditional dietary pattern has high con-tent of saturated fatty acids and refined carbohydrates [15].Therefore, considering the associated factors to diet qualityof Iranians is an important factor in the field of dietary re-searches in Iran.
The combination of traditional Iranian dietary patternand nutritional transition provides a specific opportunity formore researches in the field of dietary intake in this country.There were some investigations in this topic among westernpopulation but epidemiological studies should be run in eachpopulation separately especially among the population of theMiddle Eastern countries because of unique dietary habits[2].
Few studies were conducted to investigate the relation-ship between fast food consumption, dietary quality, andchronic disease in Middle Eastern region especially amongIranians.
So, in this study, we evaluated the relationship betweenfast food consumption, quality of diet, obesity, and centraladiposity in a sample of Isfahani (the second big city of Iran)adolescents.
2. Subjects and Methods
2.1. Subjects. In this cross-sectional study, one hundred fortyIsfahanian female students aged 11 to 13 years old are sel-ected by the use of systematic cluster random sampling. Inthis study we randomly selected some regions from among allthe regions of Isfahan. We tried to include different regionswith different socioeconomic status in the present study.Then some schools were randomly chosen from selective reg-ions. The list of students’ records was obtained from eachschool and the students were randomly selected according toa computer-based random sequencing program.
All students were eligible to enter to this study unless theywere on a specific diet. Finally, 140 adolescents completed thestudy. Written informed consent was taken from each stud-ent and one of her parents.
2.2. Dietary Assessment. Usual dietary intake was evaluatedby self-administered semiquantitative FFQ which included53 food items. The FFQ contained 8 fast foods items and itcovered food intakes during last year. The reliability of thissemiquantitative FFQ was evaluated in a randomly chosensubgroup of 92 adolescents by comparing nutrient consum-ption ascertained by FFQ responses on 2 occasions. The cor-relation coefficients for the repeatability of white bread,pizza, French fries, and red meat were 0.60, 0.59, 0.55, and0.57, respectively. The FFQ also had high reliability fornutrients. For example, the correlation coefficients were 0.61for dietary protein, 0.60 for riboflavin, 0.61 for selenium,0.53 for sodium, 0.64 for energy intake, and 0.63 for dietaryfat. Comparative validity was determined by comparison ofthe values resulting from FFQ with intakes estimated fromthe average of three 24-h dietary records (one for weekendand two for week days). Preliminary analysis of the validation
study showed that nutrients were moderately correlated (allcorrelation coefficients were >0.5) between these 2 methodsafter control for total energy intake. For example, it was 0.54for protein, 0.53 for fat, 0.57 for vitamin C, and 0.52 forselenium. The performance of the FFQ in assessing the fastfood intake also was fair. For example, between FFQ anddetailed dietary recalls, correlation coefficients were 0.57 forpizza, 0.56 for French fries, and 0.60 for white bread. Overall,these data indicate that the FFQ provides reasonably validmeasures of the average long-term dietary intake. A completeguideline along with several samples and descriptions wereprepared and attached to the questionnaires. Trained nutri-tionists educated all the students and one of their parentsin specific educational sessions to fill the FFQ. Parents wererequested to help students in filling the FFQ. The reportedamounts for each food was converted to a daily amount andmentioned as grams per day.
Fast foods were defined as following items: “conveniencefood” or prepared foods such as hamburger, sausage, cheeseburger, other burgers, hot dogs, rusk fish, rusk poultry,French fries, and pizza.
Nutrient adequacy ratio (NAR) was calculated by divid-ing daily individual intake to dietary recommended intake(DRI) [16] for each nutrient.
To calculate dietary energy density we divided daily indi-vidual energy intake to total weight of foods (excluding be-verages) consumed (g/kcal). Some data showed that theweight of drank beverages had not any role in the relation-ship between dietary energy density and body weight [17].
2.3. Anthropometric Assessment. Height was measured to thenearest 1 cm by meter in condition of standing position nearto the wall, paired feet, removed shoes, and four contactedpoints of the body (shoulder, hip, heel, and head) to wall.Body weight was measured to the nearest 0.1 kg by standardscale in lightweight-clothed and no-shoes-using subjects.Waist circumference was measured to the nearest 0.1 cm byan inelastic tape, tangent to skin, and without any pressure.This measurement was conducted in narrowest girth, after anormal exhalation and with relaxed abdominal muscles. Instanding position and paired feet, widest hip diagonal wasmeasured [18]. Calculation of body mass index was per-formed as body weight in kilogram divided by height squarein meters. Overweight and obesity were defined based onWorld Health Organization guidelines as BMI = 85th−95thpercentile and >95th, respectively.
2.3.1. Assessment of Other Factors. data on general informa-tion including age, sex, history of diseases, and different me-dications use were collected by the use of questionnaires. Theparticipants were asked to write their activities and durationof each activity within 3 days in a week (two working daysand one holiday). Then the mean of physical activity wascalculated using the following equation:
PAmean =∑(
Timeactivity ×MET
72
), (1)
where PAmeans is the mean of physical activity, Timeactivity isthe total time (h) of each activity within 3 days (72 hours),
Journal of Obesity 3
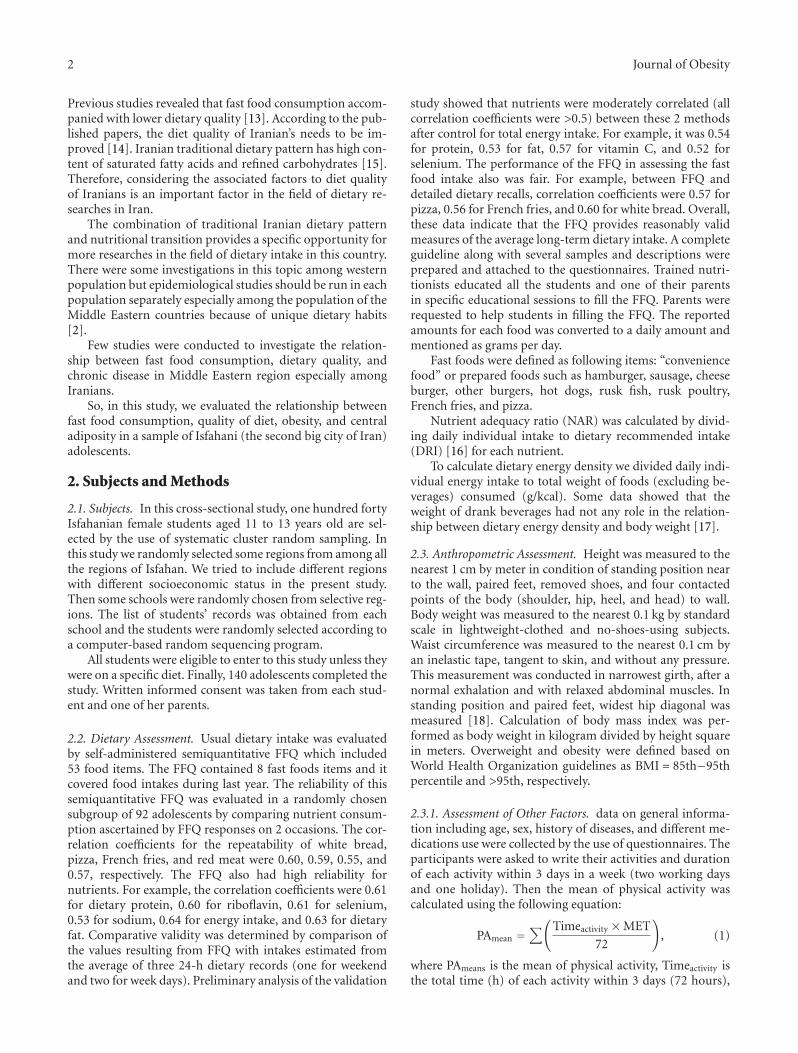
Table 1: Demographic characteristics across the quartiles of fast food consumption.
VariablesQuartiles of fast food intake
P2Q1 Q2 Q3 Q4
[<51.8 g/week] n = 35[51.9–100.7 g/week]
n = 34[100.8–214.9 g/week]
n = 36[>215 g/week] n = 35
Age (y) 12.32± 1.0881 12.58± 0.89 12.33± 1.01 12.42± 0.88 0.677
Height (cm) 150.58± 8.71 154.77± 8.39 153.00± 6.91 152.92± 7.78 0.157
Physical Activity (METh/day) 12.22± 0.84 12.61± 0.85 14.01± 0.83 14.01± 0.84 0.303
85th < BMI3 < 95th (%) 0 17.6 16.7 40.0 0.0001
BMI > 95th (%) 2.9 0 5.6 11.4 0.0001
WC3 > 75th (%) 22.9 38.2 44.4 54.3 0.0551Values are mean ± SD unless indicated.
2P values resulted from analysis of variance for quantitative variables and χ2 for qualitative variables.3BMI: body mass index; WC: waist circumference.
and MET is the metabolic equivalent extracted from refer-ence table [19]
3. Statistical Analysis
We used Nutritionist IV to analyze dietary intakes. SPSS soft-ware (version 12) was used to conduct the statistical analysis.Normal distribution was evaluated by Kolmogorov-Smirnovtest, histogram graph, and p-p plot graph.
Fast food consumption was reported in quartiles. Cutpoints for fast food quartiles were 1st: <51.8, 2nd: 51.9–100.7, 3rd: 100.8–214.9, 4th: >215 g/week. Chi-square testwas used for evaluating the prevalence of overweight, obesity,and abdominal obesity across fast food quartiles.
To compare the variations of continuous variables acrossquartiles of fast food intake, we used analysis of covariance(ANCOVA) which was adjusted for energy intake. Then esti-mated marginal means were gathered as energy-adjustedmeans. Partial correlation was used to assess the associationbetween fast food intake, blood pressure, and anthropomet-ric measurements. Energy intake was adjusted in the models.
4. Results
Demographic characteristics of adolescents across the quar-tiles of fast food consumption are shown in Table 1. Therewere no significant differences in age, height, physical activi-ty, and abdominal obesity between quartiles of fast food con-sumption. The prevalence of overweight and obesity washigher in the upper quartiles of fast food intake.
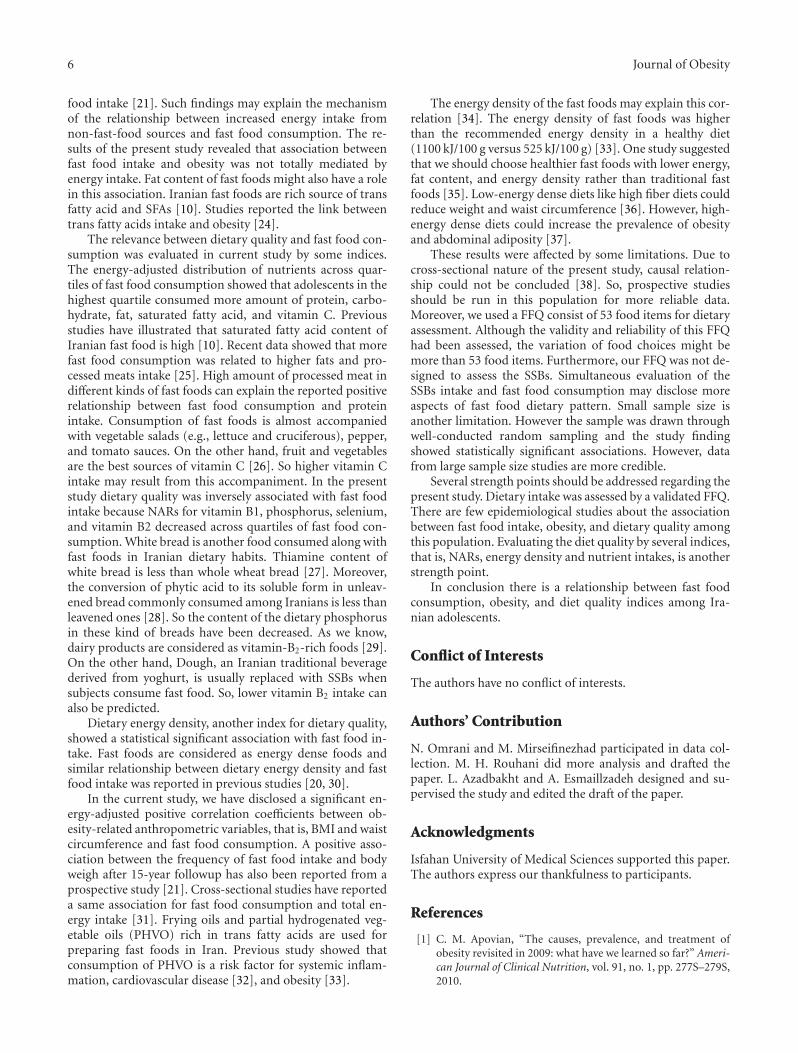
Table 2 shows the energy-adjusted (except for energy in-take) distribution of nutrients intake across the quartiles ofthe fast food consumption. Those in the highest quartile offast food consumption had more energy intake and consum-ed more amount of protein, carbohydrate, fat, saturated fattyacid, and vitamin C. There were no significant differencesregarding other nutrient intakes across quartiles of fast foodintake.
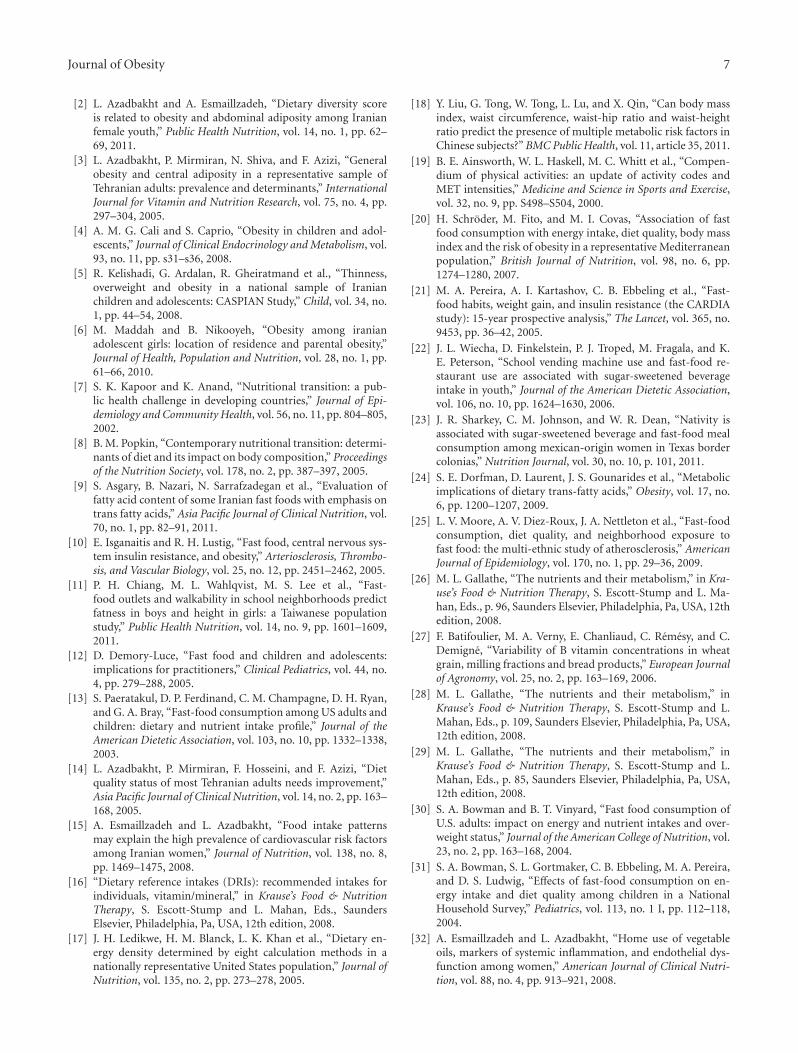
Values regarding the energy-adjusted NARs were demon-strated in Table 3. The results showed that individuals in thehighest quartiles of fast food intake had significantly lowerNARs for vitamin B1, phosphorus, selenium, and vitamin B2
(P = 0.008, P = 0.025, P < 0.001, P = 0.012 resp.) andhigher NAR for vitamin C (P = 0.018). There was no signi-ficant association between fast food consumption and otherNARs.
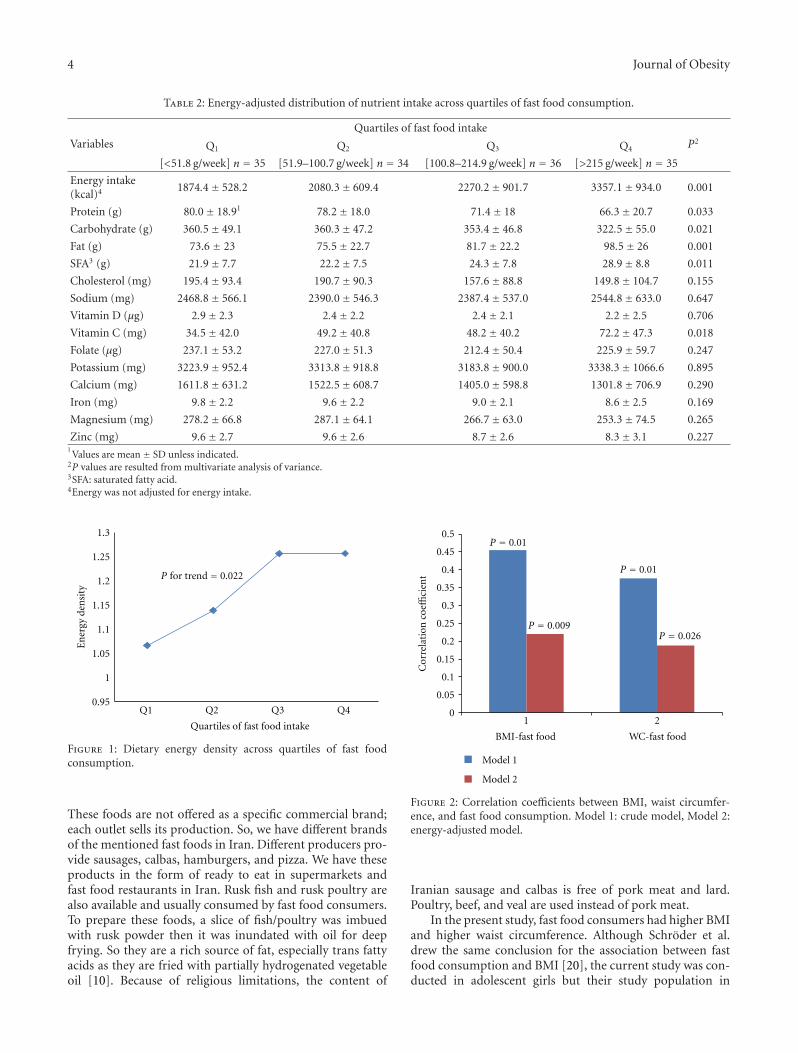
The mean of energy density among quartiles of fast foodconsumption is provided in Figure 1. The energy density inthe upper quartiles of fast food intake was significantly higherthan lower quartiles (P = 0.022).
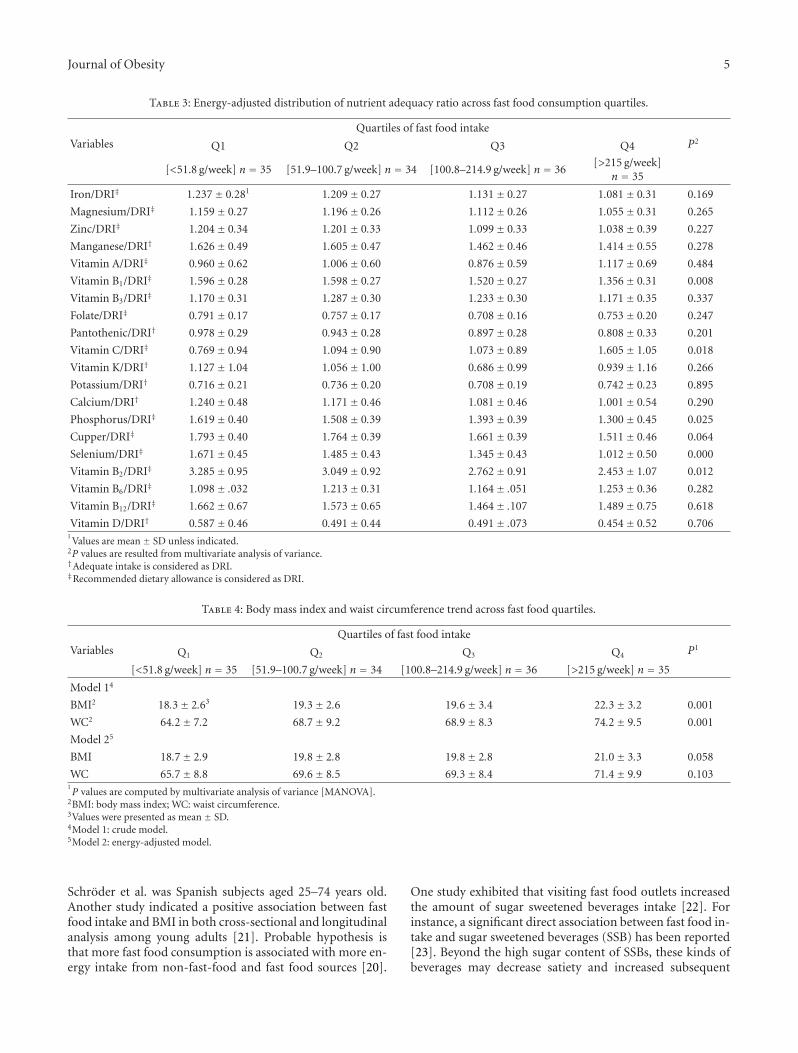
The correlation between BMI, waist circumference, andfast food consumption are shown in Figure 2. In the crudemodel (model 1), there were significant positive correlationsbetween BMI/waist circumference and fast food intake (P =0.01 for both). Although energy adjustment (model 2) at-tenuated correlation coefficients, the correlations remainedstatistically significant.
The mean of the BMI and waist circumference across fastfood quartiles are shown in Table 4. Those in the highestquartile of fast food intake had higher BMI and waist cir-cumference in crude model (model 1) (P = 0.001 for both).Although the relationships between waist circumference andfast food consumption were disappeared after energy adjust-ment (model 2) (P = 0.103), the association between BMIand fast food intake was marginally significant (P = 0.058).
5. Discussion
The results of the present study, which was conducted amongIranian adolescents, showed a significant association betweenfast food consumption and higher BMI and waist circumfer-ence. The relationship between some nutrients intake suchas protein, carbohydrate, SFA, and vitamin C and fast foodconsumption was also significant. According to the results,NARs for vitamin B1, phosphorus, selenium, and vitamin B2
were lower among those in the highest quartile of fast foodconsumption compared to lowest quartile. Adolescents in thehighest quartile of fast food intake had the highest dietaryenergy density.
The general concept of fast food may be different in Iranin comparison to western countries. Some Iranian fast foodsmay be similar to US fast foods like hamburgers, but othersmay be different. Sausage, calbas, hamburger, and pizza arethe most popular consumed fast food among Iranians [10].
4 Journal of Obesity
Table 2: Energy-adjusted distribution of nutrient intake across quartiles of fast food consumption.
Variables
Quartiles of fast food intake
P2Q1 Q2 Q3 Q4
[<51.8 g/week] n = 35 [51.9–100.7 g/week] n = 34 [100.8–214.9 g/week] n = 36 [>215 g/week] n = 35
Energy intake(kcal)4 1874.4± 528.2 2080.3± 609.4 2270.2± 901.7 3357.1± 934.0 0.001
Protein (g) 80.0± 18.91 78.2± 18.0 71.4± 18 66.3± 20.7 0.033
Carbohydrate (g) 360.5± 49.1 360.3± 47.2 353.4± 46.8 322.5± 55.0 0.021
Fat (g) 73.6 ± 23 75.5± 22.7 81.7± 22.2 98.5± 26 0.001
SFA3 (g) 21.9± 7.7 22.2± 7.5 24.3± 7.8 28.9± 8.8 0.011
Cholesterol (mg) 195.4± 93.4 190.7± 90.3 157.6± 88.8 149.8± 104.7 0.155
Sodium (mg) 2468.8± 566.1 2390.0± 546.3 2387.4± 537.0 2544.8± 633.0 0.647
Vitamin D (μg) 2.9± 2.3 2.4± 2.2 2.4± 2.1 2.2± 2.5 0.706
Vitamin C (mg) 34.5± 42.0 49.2± 40.8 48.2± 40.2 72.2± 47.3 0.018
Folate (μg) 237.1± 53.2 227.0± 51.3 212.4± 50.4 225.9± 59.7 0.247
Potassium (mg) 3223.9± 952.4 3313.8± 918.8 3183.8± 900.0 3338.3± 1066.6 0.895
Calcium (mg) 1611.8± 631.2 1522.5± 608.7 1405.0± 598.8 1301.8± 706.9 0.290
Iron (mg) 9.8± 2.2 9.6± 2.2 9.0± 2.1 8.6± 2.5 0.169
Magnesium (mg) 278.2± 66.8 287.1± 64.1 266.7± 63.0 253.3± 74.5 0.265
Zinc (mg) 9.6± 2.7 9.6± 2.6 8.7± 2.6 8.3± 3.1 0.2271Values are mean ± SD unless indicated.
2P values are resulted from multivariate analysis of variance.3SFA: saturated fatty acid.4Energy was not adjusted for energy intake.
0.95
1
1.05
1.1
1.15
1.2
1.25
1.3
Q1 Q2 Q3 Q4
En
ergy
den
sity
Quartiles of fast food intake
P for trend = 0.022
Figure 1: Dietary energy density across quartiles of fast foodconsumption.
These foods are not offered as a specific commercial brand;each outlet sells its production. So, we have different brandsof the mentioned fast foods in Iran. Different producers pro-vide sausages, calbas, hamburgers, and pizza. We have theseproducts in the form of ready to eat in supermarkets andfast food restaurants in Iran. Rusk fish and rusk poultry arealso available and usually consumed by fast food consumers.To prepare these foods, a slice of fish/poultry was imbuedwith rusk powder then it was inundated with oil for deepfrying. So they are a rich source of fat, especially trans fattyacids as they are fried with partially hydrogenated vegetableoil [10]. Because of religious limitations, the content of
P = 0.01
P = 0.01
P = 0.009P = 0.026
0
0.05
0.1
0.15
0.2
0.25
0.3
0.35
0.4
0.45
0.5
1 2
Cor
rela
tion
coe
ffici
ent
BMI-fast food WC-fast food
Model 1
Model 2
Figure 2: Correlation coefficients between BMI, waist circumfer-ence, and fast food consumption. Model 1: crude model, Model 2:energy-adjusted model.
Iranian sausage and calbas is free of pork meat and lard.Poultry, beef, and veal are used instead of pork meat.
In the present study, fast food consumers had higher BMIand higher waist circumference. Although Schroder et al.drew the same conclusion for the association between fastfood consumption and BMI [20], the current study was con-ducted in adolescent girls but their study population in
Journal of Obesity 5
Table 3: Energy-adjusted distribution of nutrient adequacy ratio across fast food consumption quartiles.
Variables
Quartiles of fast food intake
P2Q1 Q2 Q3 Q4
[<51.8 g/week] n = 35 [51.9–100.7 g/week] n = 34 [100.8–214.9 g/week] n = 36[>215 g/week]
n = 35
Iron/DRI‡ 1.237± 0.281 1.209± 0.27 1.131± 0.27 1.081± 0.31 0.169
Magnesium/DRI‡ 1.159± 0.27 1.196± 0.26 1.112± 0.26 1.055± 0.31 0.265
Zinc/DRI‡ 1.204± 0.34 1.201± 0.33 1.099± 0.33 1.038± 0.39 0.227
Manganese/DRI† 1.626± 0.49 1.605± 0.47 1.462± 0.46 1.414± 0.55 0.278
Vitamin A/DRI‡ 0.960± 0.62 1.006± 0.60 0.876± 0.59 1.117± 0.69 0.484
Vitamin B1/DRI‡ 1.596± 0.28 1.598± 0.27 1.520± 0.27 1.356± 0.31 0.008
Vitamin B3/DRI‡ 1.170± 0.31 1.287± 0.30 1.233± 0.30 1.171± 0.35 0.337
Folate/DRI‡ 0.791± 0.17 0.757± 0.17 0.708± 0.16 0.753± 0.20 0.247
Pantothenic/DRI† 0.978± 0.29 0.943± 0.28 0.897± 0.28 0.808± 0.33 0.201
Vitamin C/DRI‡ 0.769± 0.94 1.094± 0.90 1.073± 0.89 1.605± 1.05 0.018
Vitamin K/DRI† 1.127± 1.04 1.056± 1.00 0.686± 0.99 0.939± 1.16 0.266
Potassium/DRI† 0.716± 0.21 0.736± 0.20 0.708± 0.19 0.742± 0.23 0.895
Calcium/DRI† 1.240± 0.48 1.171± 0.46 1.081± 0.46 1.001± 0.54 0.290
Phosphorus/DRI‡ 1.619± 0.40 1.508± 0.39 1.393± 0.39 1.300± 0.45 0.025
Cupper/DRI‡ 1.793± 0.40 1.764± 0.39 1.661± 0.39 1.511± 0.46 0.064
Selenium/DRI‡ 1.671± 0.45 1.485± 0.43 1.345± 0.43 1.012± 0.50 0.000
Vitamin B2/DRI‡ 3.285± 0.95 3.049± 0.92 2.762± 0.91 2.453± 1.07 0.012
Vitamin B6/DRI‡ 1.098± .032 1.213± 0.31 1.164± .051 1.253± 0.36 0.282
Vitamin B12/DRI‡ 1.662± 0.67 1.573± 0.65 1.464± .107 1.489± 0.75 0.618
Vitamin D/DRI† 0.587± 0.46 0.491± 0.44 0.491± .073 0.454± 0.52 0.7061Values are mean ± SD unless indicated.
2P values are resulted from multivariate analysis of variance.†Adequate intake is considered as DRI.‡Recommended dietary allowance is considered as DRI.
Table 4: Body mass index and waist circumference trend across fast food quartiles.
Variables
Quartiles of fast food intake
P1Q1 Q2 Q3 Q4
[<51.8 g/week] n = 35 [51.9–100.7 g/week] n = 34 [100.8–214.9 g/week] n = 36 [>215 g/week] n = 35
Model 14
BMI2 18.3± 2.63 19.3± 2.6 19.6± 3.4 22.3± 3.2 0.001
WC2 64.2± 7.2 68.7± 9.2 68.9± 8.3 74.2± 9.5 0.001
Model 25
BMI 18.7± 2.9 19.8± 2.8 19.8± 2.8 21.0± 3.3 0.058
WC 65.7± 8.8 69.6± 8.5 69.3± 8.4 71.4± 9.9 0.1031P values are computed by multivariate analysis of variance [MANOVA].
2BMI: body mass index; WC: waist circumference.3Values were presented as mean ± SD.4Model 1: crude model.5Model 2: energy-adjusted model.
Schroder et al. was Spanish subjects aged 25–74 years old.Another study indicated a positive association between fastfood intake and BMI in both cross-sectional and longitudinalanalysis among young adults [21]. Probable hypothesis isthat more fast food consumption is associated with more en-ergy intake from non-fast-food and fast food sources [20].
One study exhibited that visiting fast food outlets increasedthe amount of sugar sweetened beverages intake [22]. Forinstance, a significant direct association between fast food in-take and sugar sweetened beverages (SSB) has been reported[23]. Beyond the high sugar content of SSBs, these kinds ofbeverages may decrease satiety and increased subsequent
6 Journal of Obesity
food intake [21]. Such findings may explain the mechanismof the relationship between increased energy intake fromnon-fast-food sources and fast food consumption. The re-sults of the present study revealed that association betweenfast food intake and obesity was not totally mediated byenergy intake. Fat content of fast foods might also have a rolein this association. Iranian fast foods are rich source of transfatty acid and SFAs [10]. Studies reported the link betweentrans fatty acids intake and obesity [24].
The relevance between dietary quality and fast food con-sumption was evaluated in current study by some indices.The energy-adjusted distribution of nutrients across quar-tiles of fast food consumption showed that adolescents in thehighest quartile consumed more amount of protein, carbo-hydrate, fat, saturated fatty acid, and vitamin C. Previousstudies have illustrated that saturated fatty acid content ofIranian fast food is high [10]. Recent data showed that morefast food consumption was related to higher fats and pro-cessed meats intake [25]. High amount of processed meat indifferent kinds of fast foods can explain the reported positiverelationship between fast food consumption and proteinintake. Consumption of fast foods is almost accompaniedwith vegetable salads (e.g., lettuce and cruciferous), pepper,and tomato sauces. On the other hand, fruit and vegetablesare the best sources of vitamin C [26]. So higher vitamin Cintake may result from this accompaniment. In the presentstudy dietary quality was inversely associated with fast foodintake because NARs for vitamin B1, phosphorus, selenium,and vitamin B2 decreased across quartiles of fast food con-sumption. White bread is another food consumed along withfast foods in Iranian dietary habits. Thiamine content ofwhite bread is less than whole wheat bread [27]. Moreover,the conversion of phytic acid to its soluble form in unleav-ened bread commonly consumed among Iranians is less thanleavened ones [28]. So the content of the dietary phosphorusin these kind of breads have been decreased. As we know,dairy products are considered as vitamin-B2-rich foods [29].On the other hand, Dough, an Iranian traditional beveragederived from yoghurt, is usually replaced with SSBs whensubjects consume fast food. So, lower vitamin B2 intake canalso be predicted.
Dietary energy density, another index for dietary quality,showed a statistical significant association with fast food in-take. Fast foods are considered as energy dense foods andsimilar relationship between dietary energy density and fastfood intake was reported in previous studies [20, 30].
In the current study, we have disclosed a significant en-ergy-adjusted positive correlation coefficients between ob-esity-related anthropometric variables, that is, BMI and waistcircumference and fast food consumption. A positive asso-ciation between the frequency of fast food intake and bodyweigh after 15-year followup has also been reported from aprospective study [21]. Cross-sectional studies have reporteda same association for fast food consumption and total en-ergy intake [31]. Frying oils and partial hydrogenated veg-etable oils (PHVO) rich in trans fatty acids are used forpreparing fast foods in Iran. Previous study showed thatconsumption of PHVO is a risk factor for systemic inflam-mation, cardiovascular disease [32], and obesity [33].
The energy density of the fast foods may explain this cor-relation [34]. The energy density of fast foods was higherthan the recommended energy density in a healthy diet(1100 kJ/100 g versus 525 kJ/100 g) [33]. One study suggestedthat we should choose healthier fast foods with lower energy,fat content, and energy density rather than traditional fastfoods [35]. Low-energy dense diets like high fiber diets couldreduce weight and waist circumference [36]. However, high-energy dense diets could increase the prevalence of obesityand abdominal adiposity [37].
These results were affected by some limitations. Due tocross-sectional nature of the present study, causal relation-ship could not be concluded [38]. So, prospective studiesshould be run in this population for more reliable data.Moreover, we used a FFQ consist of 53 food items for dietaryassessment. Although the validity and reliability of this FFQhad been assessed, the variation of food choices might bemore than 53 food items. Furthermore, our FFQ was not de-signed to assess the SSBs. Simultaneous evaluation of theSSBs intake and fast food consumption may disclose moreaspects of fast food dietary pattern. Small sample size isanother limitation. However the sample was drawn throughwell-conducted random sampling and the study findingshowed statistically significant associations. However, datafrom large sample size studies are more credible.
Several strength points should be addressed regarding thepresent study. Dietary intake was assessed by a validated FFQ.There are few epidemiological studies about the associationbetween fast food intake, obesity, and dietary quality amongthis population. Evaluating the diet quality by several indices,that is, NARs, energy density and nutrient intakes, is anotherstrength point.
In conclusion there is a relationship between fast foodconsumption, obesity, and diet quality indices among Ira-nian adolescents.
Conflict of Interests
The authors have no conflict of interests.
Authors’ Contribution
N. Omrani and M. Mirseifinezhad participated in data col-lection. M. H. Rouhani did more analysis and drafted thepaper. L. Azadbakht and A. Esmaillzadeh designed and su-pervised the study and edited the draft of the paper.
Acknowledgments
Isfahan University of Medical Sciences supported this paper.The authors express our thankfulness to participants.
References
[1] C. M. Apovian, “The causes, prevalence, and treatment ofobesity revisited in 2009: what have we learned so far?” Ameri-can Journal of Clinical Nutrition, vol. 91, no. 1, pp. 277S–279S,2010.
Journal of Obesity 7
[2] L. Azadbakht and A. Esmaillzadeh, “Dietary diversity scoreis related to obesity and abdominal adiposity among Iranianfemale youth,” Public Health Nutrition, vol. 14, no. 1, pp. 62–69, 2011.
[3] L. Azadbakht, P. Mirmiran, N. Shiva, and F. Azizi, “Generalobesity and central adiposity in a representative sample ofTehranian adults: prevalence and determinants,” InternationalJournal for Vitamin and Nutrition Research, vol. 75, no. 4, pp.297–304, 2005.
[4] A. M. G. Cali and S. Caprio, “Obesity in children and adol-escents,” Journal of Clinical Endocrinology and Metabolism, vol.93, no. 11, pp. s31–s36, 2008.
[5] R. Kelishadi, G. Ardalan, R. Gheiratmand et al., “Thinness,overweight and obesity in a national sample of Iranianchildren and adolescents: CASPIAN Study,” Child, vol. 34, no.1, pp. 44–54, 2008.
[6] M. Maddah and B. Nikooyeh, “Obesity among iranianadolescent girls: location of residence and parental obesity,”Journal of Health, Population and Nutrition, vol. 28, no. 1, pp.61–66, 2010.
[7] S. K. Kapoor and K. Anand, “Nutritional transition: a pub-lic health challenge in developing countries,” Journal of Epi-demiology and Community Health, vol. 56, no. 11, pp. 804–805,2002.
[8] B. M. Popkin, “Contemporary nutritional transition: determi-nants of diet and its impact on body composition,” Proceedingsof the Nutrition Society, vol. 178, no. 2, pp. 387–397, 2005.
[9] S. Asgary, B. Nazari, N. Sarrafzadegan et al., “Evaluation offatty acid content of some Iranian fast foods with emphasis ontrans fatty acids,” Asia Pacific Journal of Clinical Nutrition, vol.70, no. 1, pp. 82–91, 2011.
[10] E. Isganaitis and R. H. Lustig, “Fast food, central nervous sys-tem insulin resistance, and obesity,” Arteriosclerosis, Thrombo-sis, and Vascular Biology, vol. 25, no. 12, pp. 2451–2462, 2005.
[11] P. H. Chiang, M. L. Wahlqvist, M. S. Lee et al., “Fast-food outlets and walkability in school neighborhoods predictfatness in boys and height in girls: a Taiwanese populationstudy,” Public Health Nutrition, vol. 14, no. 9, pp. 1601–1609,2011.
[12] D. Demory-Luce, “Fast food and children and adolescents:implications for practitioners,” Clinical Pediatrics, vol. 44, no.4, pp. 279–288, 2005.
[13] S. Paeratakul, D. P. Ferdinand, C. M. Champagne, D. H. Ryan,and G. A. Bray, “Fast-food consumption among US adults andchildren: dietary and nutrient intake profile,” Journal of theAmerican Dietetic Association, vol. 103, no. 10, pp. 1332–1338,2003.
[14] L. Azadbakht, P. Mirmiran, F. Hosseini, and F. Azizi, “Dietquality status of most Tehranian adults needs improvement,”Asia Pacific Journal of Clinical Nutrition, vol. 14, no. 2, pp. 163–168, 2005.
[15] A. Esmaillzadeh and L. Azadbakht, “Food intake patternsmay explain the high prevalence of cardiovascular risk factorsamong Iranian women,” Journal of Nutrition, vol. 138, no. 8,pp. 1469–1475, 2008.
[16] “Dietary reference intakes (DRIs): recommended intakes forindividuals, vitamin/mineral,” in Krause’s Food & NutritionTherapy, S. Escott-Stump and L. Mahan, Eds., SaundersElsevier, Philadelphia, Pa, USA, 12th edition, 2008.
[17] J. H. Ledikwe, H. M. Blanck, L. K. Khan et al., “Dietary en-ergy density determined by eight calculation methods in anationally representative United States population,” Journal ofNutrition, vol. 135, no. 2, pp. 273–278, 2005.
[18] Y. Liu, G. Tong, W. Tong, L. Lu, and X. Qin, “Can body massindex, waist circumference, waist-hip ratio and waist-heightratio predict the presence of multiple metabolic risk factors inChinese subjects?” BMC Public Health, vol. 11, article 35, 2011.
[19] B. E. Ainsworth, W. L. Haskell, M. C. Whitt et al., “Compen-dium of physical activities: an update of activity codes andMET intensities,” Medicine and Science in Sports and Exercise,vol. 32, no. 9, pp. S498–S504, 2000.
[20] H. Schroder, M. Fito, and M. I. Covas, “Association of fastfood consumption with energy intake, diet quality, body massindex and the risk of obesity in a representative Mediterraneanpopulation,” British Journal of Nutrition, vol. 98, no. 6, pp.1274–1280, 2007.
[21] M. A. Pereira, A. I. Kartashov, C. B. Ebbeling et al., “Fast-food habits, weight gain, and insulin resistance (the CARDIAstudy): 15-year prospective analysis,” The Lancet, vol. 365, no.9453, pp. 36–42, 2005.
[22] J. L. Wiecha, D. Finkelstein, P. J. Troped, M. Fragala, and K.E. Peterson, “School vending machine use and fast-food re-staurant use are associated with sugar-sweetened beverageintake in youth,” Journal of the American Dietetic Association,vol. 106, no. 10, pp. 1624–1630, 2006.
[23] J. R. Sharkey, C. M. Johnson, and W. R. Dean, “Nativity isassociated with sugar-sweetened beverage and fast-food mealconsumption among mexican-origin women in Texas bordercolonias,” Nutrition Journal, vol. 30, no. 10, p. 101, 2011.
[24] S. E. Dorfman, D. Laurent, J. S. Gounarides et al., “Metabolicimplications of dietary trans-fatty acids,” Obesity, vol. 17, no.6, pp. 1200–1207, 2009.
[25] L. V. Moore, A. V. Diez-Roux, J. A. Nettleton et al., “Fast-foodconsumption, diet quality, and neighborhood exposure tofast food: the multi-ethnic study of atherosclerosis,” AmericanJournal of Epidemiology, vol. 170, no. 1, pp. 29–36, 2009.
[26] M. L. Gallathe, “The nutrients and their metabolism,” in Kra-use’s Food & Nutrition Therapy, S. Escott-Stump and L. Ma-han, Eds., p. 96, Saunders Elsevier, Philadelphia, Pa, USA, 12thedition, 2008.
[27] F. Batifoulier, M. A. Verny, E. Chanliaud, C. Remesy, and C.Demigne, “Variability of B vitamin concentrations in wheatgrain, milling fractions and bread products,” European Journalof Agronomy, vol. 25, no. 2, pp. 163–169, 2006.
[28] M. L. Gallathe, “The nutrients and their metabolism,” inKrause’s Food & Nutrition Therapy, S. Escott-Stump and L.Mahan, Eds., p. 109, Saunders Elsevier, Philadelphia, Pa, USA,12th edition, 2008.
[29] M. L. Gallathe, “The nutrients and their metabolism,” inKrause’s Food & Nutrition Therapy, S. Escott-Stump and L.Mahan, Eds., p. 85, Saunders Elsevier, Philadelphia, Pa, USA,12th edition, 2008.
[30] S. A. Bowman and B. T. Vinyard, “Fast food consumption ofU.S. adults: impact on energy and nutrient intakes and over-weight status,” Journal of the American College of Nutrition, vol.23, no. 2, pp. 163–168, 2004.
[31] S. A. Bowman, S. L. Gortmaker, C. B. Ebbeling, M. A. Pereira,and D. S. Ludwig, “Effects of fast-food consumption on en-ergy intake and diet quality among children in a NationalHousehold Survey,” Pediatrics, vol. 113, no. 1 I, pp. 112–118,2004.
[32] A. Esmaillzadeh and L. Azadbakht, “Home use of vegetableoils, markers of systemic inflammation, and endothelial dys-function among women,” American Journal of Clinical Nutri-tion, vol. 88, no. 4, pp. 913–921, 2008.
8 Journal of Obesity
[33] K. Kavanagh, K. L. Jones, J. Sawyer et al., “Trans fat diet in-duces abdominal obesity and changes in insulin sensitivity inmonkeys,” Obesity, vol. 15, no. 7, pp. 1675–1684, 2007.
[34] A. M. Prentice and S. A. Jebb, “Fast foods, energy density andobesity: a possible mechanistic link,” Obesity Reviews, vol. 4,no. 4, pp. 187–194, 2003.
[35] E. Brindal, P. Mohr, C. Wilson, and G. Wittert, “Obesity andthe effects of choice at a fast food restaurant,” Obesity Researchand Clinical Practice, vol. 2, no. 2, pp. 111–117, 2008.
[36] A. Esmaillzadeh and L. Azadbakht, “Dietary energy densityand the metabolic syndrome among Iranian women,” Euro-pean Journal of Clinical Nutrition, vol. 65, no. 5, pp. 598–605,2011.
[37] L. Azadbakht, P. J. Surkan, A. Esmaillzadeh, and W. C. Will-ett, “The dietary approaches to stop hypertension eating planaffects C-reactive protein, coagulation abnormalities, and he-patic function tests among type 2 diabetic patients,” Journal ofNutrition, vol. 141, no. 6, pp. 1083–1088, 2011.
[38] C. J. Mann, “Observational research methods. Research de-sign II: cohort, cross sectional, and case-control studies,” Em-ergency Medicine Journal, vol. 20, no. 1, pp. 54–60, 2003.

Submit your manuscripts athttp://www.hindawi.com
Hindawi Publishing Corporationhttp://www.hindawi.com Volume 2013
Oxidative Medicine and Cellular Longevity
Hindawi Publishing Corporation http://www.hindawi.com Volume 2013Hindawi Publishing Corporation http://www.hindawi.com Volume 2013
The Scientific World Journal
International Journal of
EndocrinologyHindawi Publishing Corporationhttp://www.hindawi.com
Volume 2013
ISRN Anesthesiology
Hindawi Publishing Corporationhttp://www.hindawi.com Volume 2013
OncologyJournal of
Hindawi Publishing Corporationhttp://www.hindawi.com Volume 2013
PPARRe sea rch
Hindawi Publishing Corporationhttp://www.hindawi.com Volume 2013
OphthalmologyJournal of
Hindawi Publishing Corporationhttp://www.hindawi.com Volume 2013
ISRN Allergy
Hindawi Publishing Corporationhttp://www.hindawi.com Volume 2013
BioMed Research International
Hindawi Publishing Corporationhttp://www.hindawi.com Volume 2013
ObesityJournal of
Hindawi Publishing Corporationhttp://www.hindawi.com Volume 2013
ISRN Addiction
Hindawi Publishing Corporationhttp://www.hindawi.com Volume 2013
Hindawi Publishing Corporationhttp://www.hindawi.com Volume 2013
Computational and Mathematical Methods in Medicine
ISRN AIDS
Hindawi Publishing Corporationhttp://www.hindawi.com Volume 2013
Clinical &DevelopmentalImmunology
Hindawi Publishing Corporationhttp://www.hindawi.com
Volume 2013
Diabetes ResearchJournal of
Hindawi Publishing Corporationhttp://www.hindawi.com Volume 2013
Evidence-Based Complementary and Alternative Medicine
Volume 2013Hindawi Publishing Corporationhttp://www.hindawi.com
Hindawi Publishing Corporationhttp://www.hindawi.com Volume 2013
Gastroenterology Research and Practice
Hindawi Publishing Corporationhttp://www.hindawi.com Volume 2013
ISRN Biomarkers
Hindawi Publishing Corporationhttp://www.hindawi.com Volume 2013
MEDIATORSINFLAMMATION
of