Embed Size (px)
DESCRIPTION
Reporte de Mercado 1er Trimestre de 2015 OFICINAS de las Principales ciudades del país.
Citation preview
Research & Forecast Report | Quarter 2014 | Sector | Colliers International

Research & Forecast Report | Quarter 2014 | Sector | Colliers International
Tabla de Contenido
2

Research & Forecast Report | Quarter 2014 | Sector | Colliers International3
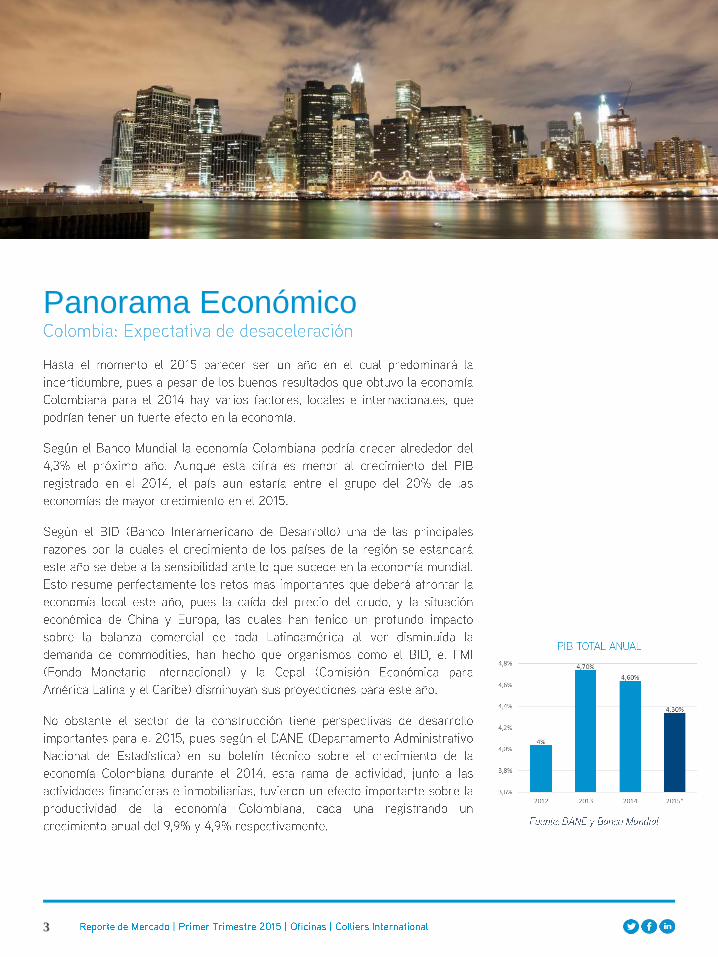
Panorama Económico

Research & Forecast Report | Quarter 2014 | Sector | Colliers International4
Panorama Bogotá
Reporte de Mercado | Primer Trimestre 2015 | Oficinas | Colliers International

Research & Forecast Report | Quarter 2014 | Sector | Colliers International5
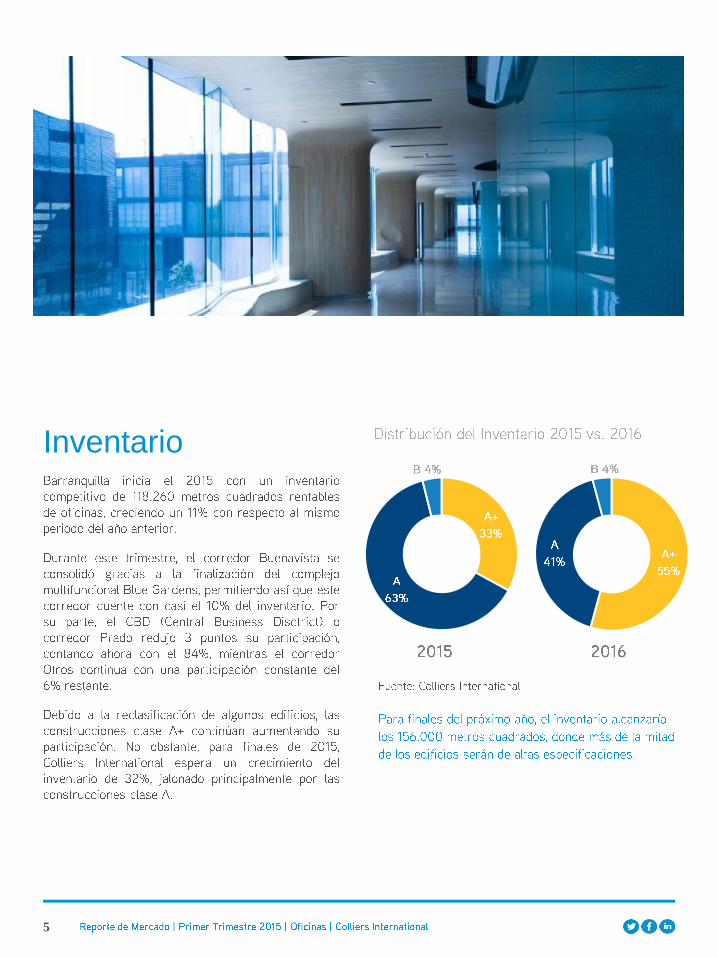
Inventario
Reporte de Mercado | Primer Trimestre 2015 | Oficinas | Colliers International

Research & Forecast Report | Quarter 2014 | Sector | Colliers International6
Oferta
Reporte de Mercado | Primer Trimestre 2015 | Oficinas | Colliers International

Research & Forecast Report | Quarter 2014 | Sector | Colliers International7
Nueva Oferta
Reporte de Mercado | Primer Trimestre 2015 | Oficinas | Colliers International

Research & Forecast Report | Quarter 2014 | Sector | Colliers International8
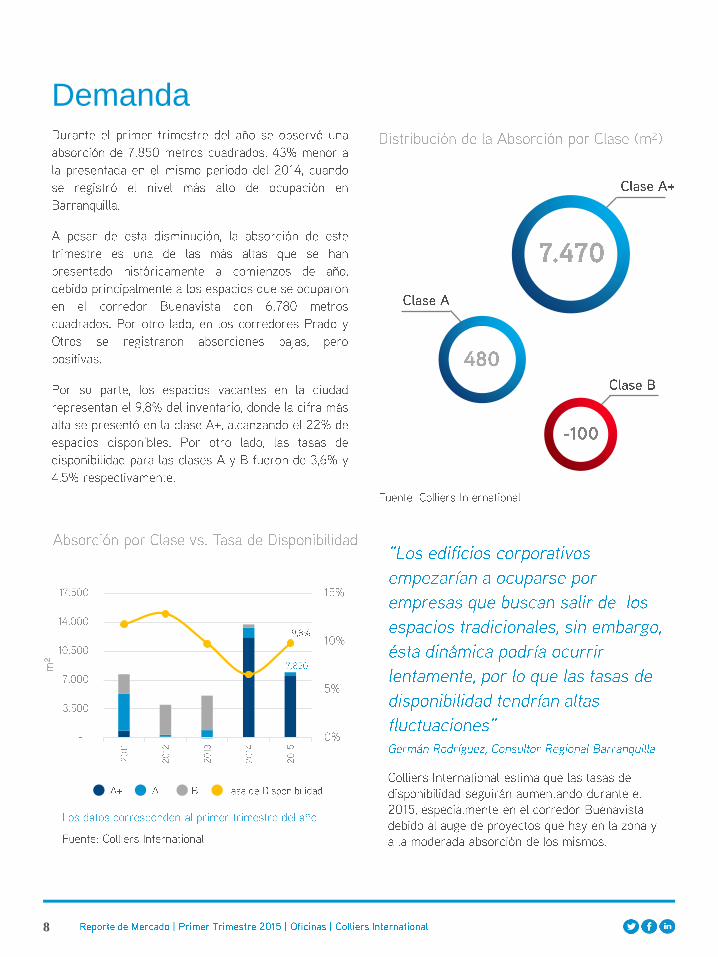
Demanda

Research & Forecast Report | Quarter 2014 | Sector | Colliers International9
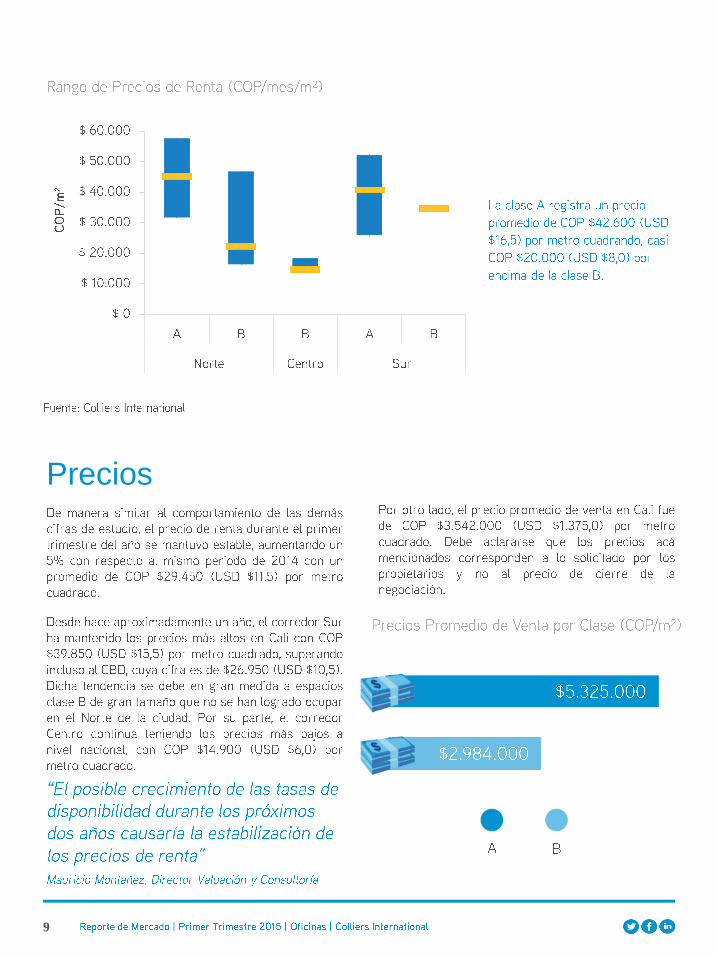
Precios
“
Reporte de Mercado | Primer Trimestre 2015 | Oficinas | Colliers International

Research & Forecast Report | Quarter 2014 | Sector | Colliers International10 Reporte de Mercado | Primer Trimestre 2015 | Oficinas | Colliers International
ACTUALIZACIÓN REPORTE DE MERCADOS
Precios de Renta
(COP/m²)
Corredor ClaseEdificios
Analizados
Inventario
(m²)
Disponibilidad
(m²)Mínimo Promedio Máximo
Precio
Promedio de
Venta
(COP/m2)
Tasa de
Disponibilidad
(%)
Absorción
Neta (m²)
Diez
Corredores
A+ 61 860.825 122.410 $50.600 $75.500 $99.300 $11.540.450 14,2% 13.551
A 95 711.990 51.743 $42.800 $67.550 $90.000 $9.737.400 7,3% 17.547
B 119 652.765 20.458 $29.400 $59.150 $77.100 $6.849.600 3,1% -3.284
Total 275 2.225.581 194.611 $29.400 $71.950 $99.300 $9.502.300 8,7% 27.813
OFICINAS – Comparación por tipo de Corredor
CBD 199 1.387.047 98.114 $40.650 $74.000 $99.300 $11.025.100 7,1% 12.262
Corredores
Periféricos76 838.534 96.497 $29.400 $69.900 $95.100 $5.794.950 11,5% 15.551

Research & Forecast Report | Quarter 2014 | Sector | Colliers International11
.
Reporte de Mercado | Primer Trimestre 2015 | Oficinas | Colliers International
•
•
•
•
•
•
•
•
•

Research & Forecast Report | Quarter 2014 | Sector | Colliers International

Research & Forecast Report | Quarter 2014 | Sector | Colliers International
Tabla de Contenido
2

Research & Forecast Report | Quarter 2014 | Sector | Colliers International3
Panorama Económico

Research & Forecast Report | Quarter 2014 | Sector | Colliers International4
Panorama Barranquilla
Image Source
Research & Forecast Report | Quarter 2014 | Sector | Colliers International5
Inventario

Research & Forecast Report | Quarter 2014 | Sector | Colliers International6
Oferta
“

Research & Forecast Report | Quarter 2014 | Sector | Colliers International7
Nueva Oferta
Research & Forecast Report | Quarter 2014 | Sector | Colliers International8
Demanda

Research & Forecast Report | Quarter 2014 | Sector | Colliers International9
Precios
“
Research & Forecast Report | Quarter 2014 | Sector | Colliers International10
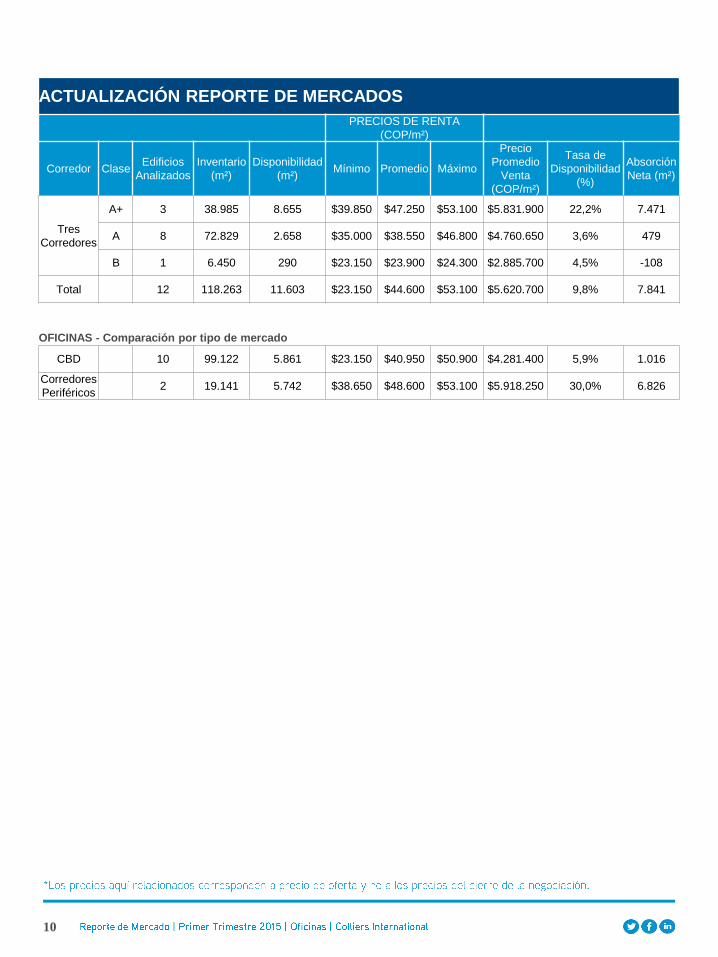
ACTUALIZACIÓN REPORTE DE MERCADOS
PRECIOS DE RENTA
(COP/m²)
Corredor ClaseEdificios
Analizados
Inventario
(m²)
Disponibilidad
(m²)Mínimo Promedio Máximo
Precio
Promedio
Venta
(COP/m²)
Tasa de
Disponibilidad
(%)
Absorción
Neta (m²)
Tres
Corredores
A+ 3 38.985 8.655 $39.850 $47.250 $53.100 $5.831.900 22,2% 7.471
A 8 72.829 2.658 $35.000 $38.550 $46.800 $4.760.650 3,6% 479
B 1 6.450 290 $23.150 $23.900 $24.300 $2.885.700 4,5% -108
Total 12 118.263 11.603 $23.150 $44.600 $53.100 $5.620.700 9,8% 7.841
OFICINAS - Comparación por tipo de mercado
CBD 10 99.122 5.861 $23.150 $40.950 $50.900 $4.281.400 5,9% 1.016
Corredores
Periféricos2 19.141 5.742 $38.650 $48.600 $53.100 $5.918.250 30,0% 6.826

Research & Forecast Report | Quarter 2014 | Sector | Colliers International11
.
•
•
•
•
•
•
•


Tabla de Contenido
2

3
Panorama Económico

4
Panorama Cali
Reporte de Mercado | Primer Semestre 2015 | Centros Comerciales | Colliers International

5
Inventario
Reporte de Mercado | Primer Trimestre 2015 | Oficinas | Colliers International

6
Oferta
Reporte de Mercado | Primer Trimestre 2015 | Oficinas | Colliers International

7
Nueva Oferta
Reporte de Mercado | Primer Trimestre 2015 | Oficinas | Colliers International

8 Reporte de Mercado | Primer Trimestre 2015 | Oficinas | Colliers International
Demanda
9
Precios
“
Reporte de Mercado | Primer Trimestre 2015 | Oficinas | Colliers International
10 Reporte de Mercado | Primer Trimestre 2015 | Oficinas | Colliers International
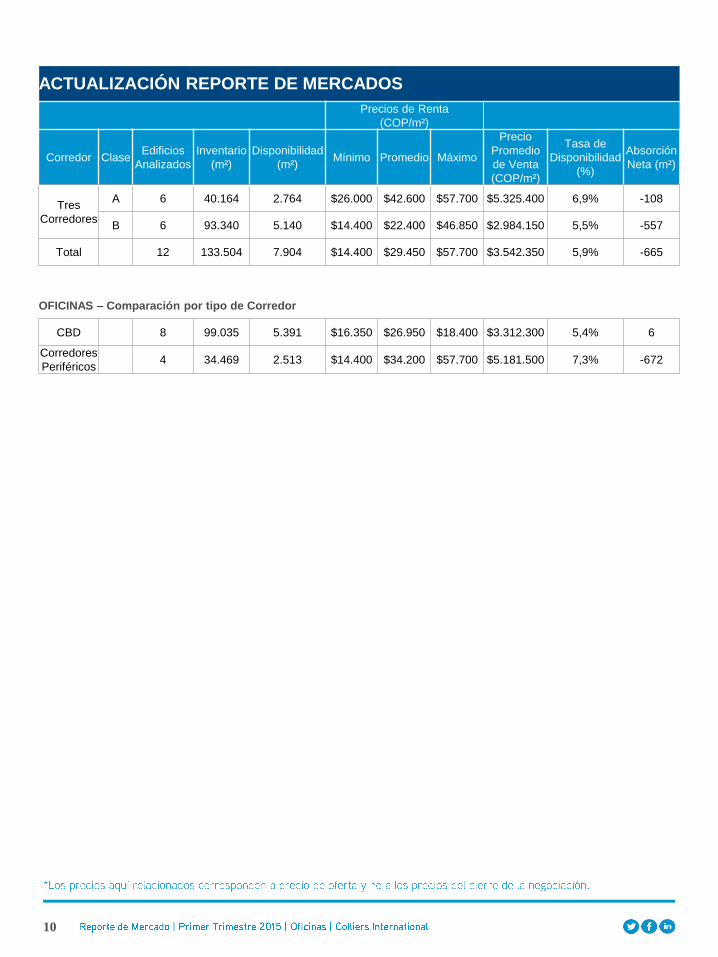
ACTUALIZACIÓN REPORTE DE MERCADOS
Precios de Renta
(COP/m²)
Corredor ClaseEdificios
Analizados
Inventario
(m²)
Disponibilidad
(m²)Mínimo Promedio Máximo
Precio
Promedio
de Venta
(COP/m²)
Tasa de
Disponibilidad
(%)
Absorción
Neta (m²)
Tres
Corredores
A 6 40.164 2.764 $26.000 $42.600 $57.700 $5.325.400 6,9% -108
B 6 93.340 5.140 $14.400 $22.400 $46.850 $2.984.150 5,5% -557
Total 12 133.504 7.904 $14.400 $29.450 $57.700 $3.542.350 5,9% -665
OFICINAS – Comparación por tipo de Corredor
CBD 8 99.035 5.391 $16.350 $26.950 $18.400 $3.312.300 5,4% 6
Corredores
Periféricos4 34.469 2.513 $14.400 $34.200 $57.700 $5.181.500 7,3% -672

11
.
Reporte de Mercado | Primer Trimestre 2015 | Oficinas | Colliers International
•
•
•
•
•
•
•
•
•
•

Research & Forecast Report | Quarter 2014 | Sector | Colliers International

Research & Forecast Report | Quarter 2014 | Sector | Colliers International
Tabla de Contenido
2
Research & Forecast Report | Quarter 2014 | Sector | Colliers International3
Panorama Económico

Research & Forecast Report | Quarter 2014 | Sector | Colliers International4
Panorama Medellín
Reporte de Mercado | Primer Trimestre 2015 | Industrial | Colliers International

Research & Forecast Report | Quarter 2014 | Sector | Colliers International5
Inventario
Reporte de Mercado | Primer Trimestre 2015 | Oficinas | Colliers International

Research & Forecast Report | Quarter 2014 | Sector | Colliers International6
Oferta
Reporte de Mercado | Primer Trimestre 2015 | Oficinas | Colliers International
16.690
4.200

Research & Forecast Report | Quarter 2014 | Sector | Colliers International7
Nueva Oferta
Reporte de Mercado | Primer Trimestre 2015 | Oficinas | Colliers International

Research & Forecast Report | Quarter 2014 | Sector | Colliers International8 Reporte de Mercado | Primer Trimestre 2015 | Oficinas | Colliers International
Demanda

Research & Forecast Report | Quarter 2014 | Sector | Colliers International9
Precios
“
Reporte de Mercado | Primer Trimestre 2015 | Oficinas | Colliers International

Research & Forecast Report | Quarter 2014 | Sector | Colliers International10 Reporte de Mercado | Primer Trimestre 2015 | Oficinas | Colliers International
ACTUALIZACIÓN REPORTE DE MERCADOS
Precios de Renta (COP/m²)
Corredor ClaseEdificios
Analizados
Inventario
(m²)
Disponibilidad
(m²)Mínimo Promedio Máximo
Precio
Promedio
Venta
(COP/m²)
Tasa de
Disponibilidad
(%)
Absorción
Neta (m²)
Cuatro
Corredores
A 19 216.128 16.685 $25.800 $37.450 $59.800 $5.596.900 7,7% 23.711
B 37 256.269 4.195 $15.000 $32.450 $48.450 $4.175.200 1,6% - 673
Total 56 472.397 20.880 $15.000 $36.550 $59.800 $4.760.300 4,4% 23.038
OFICINAS – Comparación por tipo de Corredor
CBD 36 249.810 9.083 $24.800 $43.600 $59.800 $4.793.700 3,6% 17.141
Corredores
Periféricos20 222.587 11.797 $15.000 $31.600 $52.200 $4.611.200 5,3% 5.897

Research & Forecast Report | Quarter 2014 | Sector | Colliers International11
.
Reporte de Mercado | Primer Trimestre 2015 | Oficinas | Colliers International
•
•
•
•
•
•
•

Research & Forecast Report | Quarter 2014 | Sector | Colliers International