Embed Size (px)
Citation preview

Old age saving among low-income South Africans Report prepared for FinMark Trust and the South African Savings Institute 14 March 2008

14/03/2008: VERSION 1.0
Authors:
Hennie Bester
Simon Hendrie
Timothy Hobden
Christine Hougaard
Richard Ketley
Omoneka Musa
Genesis Analytics (Pty) Ltd
Office 3, 50 Sixth Road, Hyde Park, Johannesburg
South Africa, 2196.
Post to: P.O. Box 413431, Craighall, Johannesburg, South Africa, 2024.
Tel: +27 11 994 7000, Fax: +27 11 994 7099
www.genesis-analytics.com

i
TABLE OF CONTENTS
List of Figures iii
List of Tables iii
Executive Summary iv
1. INTRODUCTION 1
2. THE MEANING OF OLD AGE SAVING 6
3. LSM 1-5 SAVINGS BEHAVIOUR 11
4. THE HURDLES TO LONG-TERM VOLUNTARY SAVINGS 15
4.1. Behavioural insights 16
4.2. Affordability 18
4.3. Other prior and automatic sources of income 23
4.4. Features of formal long-term voluntary savings vehicles 28
4.4.1. Evaluation of products on selected criteria 31
4.4.2. Alternative long-term savings channels 34
4.4.3. Conclusion 40
4.5. Application of hurdles to LSM1-5 41
4.6. Conclusion 45
5. RECOMMENDATIONS & STRATEGIES 47
5.1. Introduction 47
5.2. Recommendations 51
5.2.1. Public sector recommendations and design considerations 51
5.2.2. Design considerations for private, voluntary, savings vehicles 53
ii
5.2.3. Housing financing vehicles 54
5.3. Postscript: The role of FinMark Trust and SASI 56
Bibliography 59
Meeting list 68
Appendix 1: Overview of old age savings channels 69
Introduction 69
Pillar 0 69
Pillar 1 73
Pillar 2/3 75
Pillar 4 95
Appendix 2: Fundisa as a long term savings intrument for education 99
Appendix 3: LSM1-5 residence 101
Appendix 3: Pension Backed Loans In South Africa 104

iii
LIST OF FIGURES
Figure 1. Labour force participation among LSM 1-5 individuals over the age profile 7 Figure 2. Life expectancy trend for South African males and females: 1985 to 2007 8 Figure 3. LSM1-5 savings goals 11 Figure 4. LSM1-5 financial product usage 13 Figure 5. Sources of income for the elderly. 14 Figure 6. Proportion of 20-year old males surviving into old age. 17 Figure 7. Percentage of LSM1-5 population relying on various main sources of income 19 Figure 8. Average personal income of the LSM1-5 working age population. 20 Figure 9. LSM1-5 income comparison: working age vs. retired 24 Figure 10. The interplay between the SOAG level and personal income according to
the means test. 26 Figure 11. Illustrative income profiles of the various LSM1-5 market segments. 43 Figure 12. The income-smoothing effect of old age saving on the various income
profiles. 45 Figure 13. The extent to which the hurdles to long-term savings constrain the various
LSM1-5 market segments. 47 Figure 14. The retirement savings regulatory scheme. 77 Figure 15. Rural vs. urban split: working age LSM1-5 population. 101 Figure 16. Rural vs. urban split: retired LSM1-5 population. 102 Figure 17. Comparing formal vs. informal dwellings for the retired and working age
LSM1-5 market. 103
LIST OF TABLES
Table 1. Some feature of the LSM1-5 market. 2 Table 2. Summary of the 5 Pillars of old age provision. 2 Table 3. Employment status of the LSM1-5 population. 18 Table 4. Rebecca’s monthly income 21 Table 5. Rebecca’s monthly expenditures. 22 Table 6. Meeting list 68 Table 7. The 5 old age provision pillars applied to the South African context. 69 Table 8: Normal commission payable on group and fund policies 92 Table 9. Comparison of charges between different types of occupational funds. 94

iv
EXECUTIVE SUMMARY
Introduction
This study investigates old age savings among the low-income population in South
Africa. It determines the levels of saving and the constraints experienced in the
take up of private, voluntary long-term savings products through desktop research,
analysis, interviews and focus groups with working age and elderly LSM1-5
individuals. The research was prompted chiefly by the current low levels of
household savings in SA, as well as recent social security and retirement fund
reform initiatives by National Treasury and the Department of Social Development.
The aim of this study is therefore to inform policy decisions in this regard,
particularly around design features of savings channels to meet the needs of this
LSM group. It is important to note that this study does not explore the impact of
compulsory or incentivised savings on labour markets, the fiscus or institutional
arrangements for provision – these need to be evaluated after the appropriate
design of a savings channel is determined.
The research focuses on voluntary, private vehicles which could be used by
individuals to provide for their own old-age. As such, it concentrates on long-term
savings and provision for future consumption rather than expenses associated with
death, such as funerals. At the same time it recognises that older people continue
to have rights and obligations in their households, and so provision cannot be
analysed at a purely personal level. It is recognised that older people often
continue to support their children and grandchildren. For example, we find that
while average household size for this group is 3.8, in households where the State
Old Age Grant (SOAG) is received the average size is 4.6, suggesting a reversal of
traditional dependency directions. We also find that in some cases elderly people
may also be supported by their children, although this is not a preferred source of
provision for them.
The period of ‘old-age’ is widely regarded as starting at a certain point, usually
around age of receipt of the SOAG, i.e. 60 for woman and 65 for men. For this LSM
group the start of old age is usually later than the age of departure from the formal
labour force, which starts around age 50. While average life expectancies have
been dropping in South Africa, to below 60, there are still increasing numbers of
people expected to survive into old age and require provision for this life stage.

v
LSM 1-5 Savings behaviour
LSM1-5 constitute about 74% of South African households. Of these, only about a
third report that they save, and of this only around 5% say that they save for
retirement. Most of their saving is of a short-term nature, for emergencies like
funerals, or predictable expenses such as school fees, groceries, asset purchase
or for Christmas. The Finscope survey confirms that over 30% of LSMs1-5 use
short term savings or transaction products, and about 20% use funeral insurance
or risk pooling arrangements. However, participation in occupational schemes is
low (probably less than 8%) and there is negligible take up of long-term, voluntary
savings products. These saving habits are reflected in the circumstances of those
currently in retirement, where 90% of elderly people rely mainly on the SOAG and
then supplement this with remittances, and some paid work.
The savings decision and hurdles to saving
The savings decision made by individuals depends on three major factors:
• Their own expectations and priorities around old age
• The resource constraints they face in deciding whether to sacrifice current
consumption
• The supply and features of the savings channels available to them
In explaining the savings decision we develop a typology consisting of four hurdles
to voluntary savings which are faced by working age people in LSM1-5.
Behavioural insights. Contrary to neo-classical economic theories about how
people plan rationally to smooth their income over their lifetime, people often do not
think about old age. When they do they tend to overdiscount their future needs in
favour of current consumption. It is however important to note that heavy
discounting itself is not necessarily irrational, for example when life expectancy is
low and reducing.
Affordability. Heavy discounting of future needs is also rational when people are
facing severe, immediate resource constraints. It is difficult to save for the long
term when spending is required on basic necessities such as food, emergencies or

vi
transport. Only about 20% of working age people in these LSMs have any kind of
formal or semi-formal employment, while 22% are reliant on state grants, and the
remainder move between unemployment and the informal sector. This results in
low and unstable personal incomes, usually less than R1000 per month.
Other prior and automatic sources of old income can make it irrational to save
privately. For most people in LSMs1-4 the SOAG of R820 per month (in 2006)
exceeds average incomes earned during their working life. Private saving for
retirement would widen this gap further rather than smooth income over the life
span. Focus groups showed little conscious appreciation of the relativities involved,
but this seems to be mainly because the prior affordability hurdle has not yet been
cleared. Furthermore, the means-test which has to be passed to receive the Grant
theoretically disincentivises saving. This is because for every rand of additional
income a grant recipient has for themselves, the SOAG is reduced by fifty cents,
effectively representing a 50% tax on additional old age income While there was
some evidence of awareness of this effect, there was little evidence that it was
actually changing people’s saving decisions – again largely because the prior
affordability hurdle had not been cleared.
Features of formal long-term voluntary savings products make them unattractive
relative to other savings channels. To be attractive to poor people, a savings
channel has to have the following characteristics:
• It needs to be accessible to people in respect of physical proximity and
convenience to obtain, make contributions and withdrawals.
• It needs to have appropriate design features, including flexibility in respect
of being able to make contributions and withdrawals in response to
emergencies, and it should provide guarantees or have relatively low risk
returns.
• Charges need to be low as a proportion of contributions or investment
returns, to ensure that the channel provides value for money.
On these characteristics, most individual savings products in the market are
unattractive. Minimum premiums for those available constitute around 10% of the
average personal income for these LSMs, which is particularly high given other
demands on their finances. Most products require regular contributions and make
emergency access to funds difficult. The charge ratios for individual products
(charges as a proportion of contributions) sit between 20 and 40%, which again is
vii
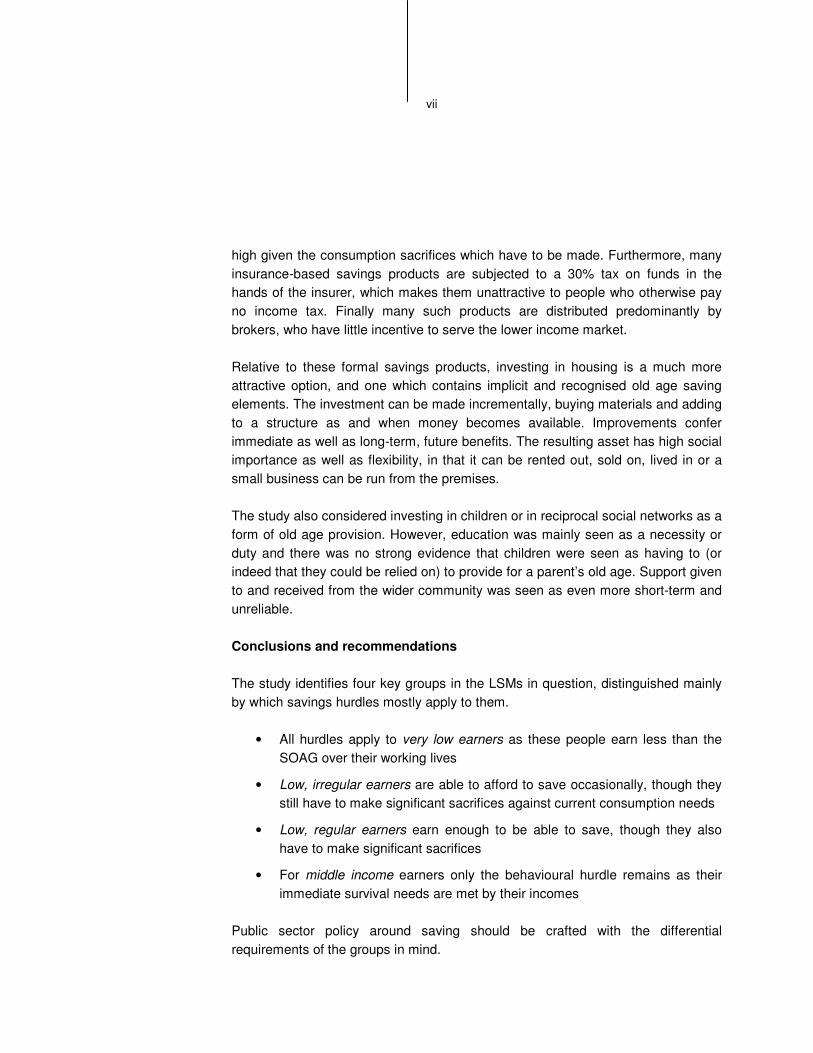
high given the consumption sacrifices which have to be made. Furthermore, many
insurance-based savings products are subjected to a 30% tax on funds in the
hands of the insurer, which makes them unattractive to people who otherwise pay
no income tax. Finally many such products are distributed predominantly by
brokers, who have little incentive to serve the lower income market.
Relative to these formal savings products, investing in housing is a much more
attractive option, and one which contains implicit and recognised old age saving
elements. The investment can be made incrementally, buying materials and adding
to a structure as and when money becomes available. Improvements confer
immediate as well as long-term, future benefits. The resulting asset has high social
importance as well as flexibility, in that it can be rented out, sold on, lived in or a
small business can be run from the premises.
The study also considered investing in children or in reciprocal social networks as a
form of old age provision. However, education was mainly seen as a necessity or
duty and there was no strong evidence that children were seen as having to (or
indeed that they could be relied on) to provide for a parent’s old age. Support given
to and received from the wider community was seen as even more short-term and
unreliable.
Conclusions and recommendations
The study identifies four key groups in the LSMs in question, distinguished mainly
by which savings hurdles mostly apply to them.
• All hurdles apply to very low earners as these people earn less than the
SOAG over their working lives
• Low, irregular earners are able to afford to save occasionally, though they
still have to make significant sacrifices against current consumption needs
• Low, regular earners earn enough to be able to save, though they also
have to make significant sacrifices
• For middle income earners only the behavioural hurdle remains as their
immediate survival needs are met by their incomes
Public sector policy around saving should be crafted with the differential
requirements of the groups in mind.

viii
• For middle income people earning above a certain level, there seems to be
some room for compulsory savings. This needs to be tested for impact on
the labour market.
• For low, regular earners there is room for incentivised savings (perhaps
where savings by people are matched with subsidies up to a cap), or
perhaps automatic enrolment in a savings vehicle, though with an opt-out
to allow them to cope with emergencies.
• For low, irregular earners and even for very low income earners there is
similarly room to make incentivised savings should they wish to use them.
• For all groups, the facilitation of access to housing, or access to finance
dedicated to building or improving houses would also appear to assist in
old age provision.
The study finally identifies design considerations which would need to apply to
private savings vehicles to make them more attractive. While because of the prior
hurdles outlined above, these instruments are still unlikely to find much traction in
LSMs1-5, they may result in better products for the higher LSMs where use of
individual savings products is still low.
• There needs to be some flexibility in contributions to allow for periods of
unemployment or other emergencies which reduce income. This needs to
be combined with some discipline in contributing (for instance via
automatic deductions into a savings vehicle) to overcome behavioural
disinclination to save.
• There also needs to be some flexibility to allow for some withdrawal of
funds to allow for emergencies such as periods of unemployment. (This
should not extend to withdrawal of any matched or subsidised amounts.)
• There is demand for guaranteed or relatively low risk and low cost products
as market fluctuations and charges have a disproportionately negative
effect in absolute terms on people with relatively small amounts saved.
• Distribution channels have to be low in cost, accessible and trusted.

ix
• Targeting of products could potentially productively be aimed at females,
and emphasise household, not just personal benefits.

1
1. INTRODUCTION
This study investigates old age savings among the low-income population in South
Africa and explores the constraints experienced in the take up of private, voluntary
long-term savings products. Savings in this sense refers to the voluntary diversion
of current income into a financial vehicle to provide for future consumption. The
low-income population is defined as individuals1 in the LSM1-5 categories. The
research is based on industry, government and other stakeholder consultations, as
well as desktop research and, importantly, qualitative focus group sessions to test
the target market’s perceptions of old age saving. The aim is to develop
recommendations for encouraging and enabling the low income population in
South Africa to adequately provide for their old age. This work is undertaken in the
context of government’s ongoing research and consultative process around the
proposed introduction of a national social security system in South Africa.
The LSM1-5 market represents the majority of South Africans. LSM1-5 represents
a large proportion of the South African population. The 2006 GHS indicates that it
is comprised of around 20m adults in 8.3m households – 74% of all households in
South Africa. 54% of the group is female and the majority reside in non-
metropolitan areas (70% or 13.8m people). The average LSM1-5 household has
3.8 members, only slightly higher than the national average of 3.7. Significantly, as
discussed in Appendix 12 , household size rises to 4.6 for LSM1-5 households
receiving the social old age grant (SOAG).
For LSM 1 – 5 households the average dependency ratio is 1.2, which means that
for every income or grant earner in the household there are 1.2 people living in the
household who need to be supported. The degree to which grant income supports
households in the face of unemployment is further illustrated by the fact that
average household income from employment for LSM 1 – 5 is R1029-69, while the
average household income from employment and grants is R1498-86 - almost
50% higher (GHS, 2006).
Some additional features of the market are contained in the table below:
1 Note that, while we conduct our analysis at the level of the individual, we acknowledge that often households, rather
than individuals, are relevant from an income and expenditure point of view. We will therefore refer to household
spending and income patterns where appropriate, always rooting the individual’s income pattern and savings decision
within the broader context of financial obligations and rights within the household. 2 See the overview of Pillar 0 – the Social Old Age Grant and its impact on household structure.

2
Table 1. Some feature of the LSM1-5 market.3
Source: FinScope, 2006; GHS, 2006
Saving is one channel for old age provision. Saving happens within a broader
context of old age provision made by the individual, her/his family and community,
her/his employer and the state. The universe of old age savings provision
mechanisms can be captured by the World Bank’s Pillars framework summarised
in Table 2 below.
Pillar Description
0 Government assistance
Non-contributory government cash provision, in South Africa provided through the State Old Age Grant.
1
Social Security
This pillar does not currently exist in South Africa, though the creation of such a pillar is suggested in the national social security proposals. It is expected to be supported by mandatory contributions of the working populations to provide them with more generous benefits than Pillar 0, along the lines of social security systems in the USA or the UK..
2
Occupational funds
In South Africa, this consists of mandatory contributions by all employed persons towards a pension fund. Employer pension/provident fund arrangements in South Africa are quasi-mandatory. The compulsion is however enforced from the employer level, rather than by the state. The proposed Social Security and Retirement Reform process will seek to more explicitly make provision for this pillar in South Africa.
3 Voluntary provision
In South Africa this consists of voluntary additional savings through various private contractual savings vehicles, such as retirement annuities.
4
Family Networks; Housing
This broad pillar includes any old age provision not covered by pillars 0 to 3, such as family inter-generational commitments, as well as informal savings mechanisms. It also includes non-cash benefits provided to the elderly, like government-funded medical care, water, sanitation, etc. It can furthermore cover the accumulation of fixed assets, such as building a house.
Table 2. Summary of the 5 Pillars of old age provision4.
Source: Based on World Bank (2005)
3 Note that LSM6 is included for comparative purposes. The total and average figures however exclude LSM6. More
detail on the characteristics of the LSM1-5 market is contained in Appendix 2. 4 An overview of the coverage of the 5 pillars not covered by the discussion in the main text is provided in Appendix 1.
LSM 1 2 3 4 5 6 Total
Number of people ('000) 269 5931 4121 4438 4916 4891 19675Average number of income earners in household 1.3 2.7 2.9 2.2 2.3 2.1 2.5Percent of LSM composed of men over 65, women over 60 8 15 10 11 7 6 11

3
South Africans do not save enough for retirement. Saving for old age is an
important tool for smoothing consumption over a person’s lifetime. In addition, it is
important macro-economically as it provides long-term funds for investment.
However, at 13% of GDP in 2006 (SASI, 2006), South Africa has a low savings
rate5 relative to other emerging markets, and even among SADC peer countries.
Within this figure, household saving is low, in part suggesting overall possibly
insufficient provision for retirement. Many low and middle-income South Africans
reach retirement with insufficient savings to enable them to maintain their standard
of living. The Department of Social Development (2006) estimates that across the
population incomes on average drop by 50% or more as people move into
retirement6. Though South Africa has a strong private occupational pension and
individual savings market7, less than 8% of formally employed people in LSM1-5
are estimated to be members of pension funds and as little as 0.6% of the LSM1-5
market has an endowment savings product (Eighty20, 2007, based on FinScope
2005 data). The Financial Diaries results show that many low-income people do
save through informal and community-based mechanisms, but that this is for short-
term goals, rather than on a long-term contractual basis.
Dependence on the Social Old Age Grant. The result is that more than two-thirds of
South Africans reach retirement age without a funded pension benefit and rely
mainly on the social old age grant (SOAG), which provides basic, means-tested
income to those without own savings in old age (National Treasury, 2007). The
SOAG is received by 90% of the LSM 1-5 population that are eligible for it on age
criteria (GHS, 2006) the rest being excluded mainly by the means-test applied to
the benefit8. Government, through both the National Treasury and Department of
Social Development proposals on social security, seeks to fill the gap by
introducing a state-wide social security system, which will include a mandatory
contributory savings system that will initially only be applicable to those in formal
employment.
5 Gross saving as % of GDP. Gross saving, in turn, is defined as the sum of household, corporate and government
saving. 6 The drop can appear less marked for those in lower incomes because of the State Old Age Grant, but the absolute
level of retirement income remains low. 7 South Africa’s pension fund asset to GDP ratio is about 63%. This compares favourably with countries such as the
United Kingdom, Australia, Singapore, Chile and Malaysia (National Treasury, 2007). 8 A means test based on income and asset thresholds is applied prior to the provision of government assistance to
ascertain the ability of an applicant to support him/herself and thereby effectively target those most in need of
government assistance. For single persons the asset and income thresholds are R313 200 and R21 612 respectively,
while for married persons the asset and income thresholds are R626 400 and R40 092 respectively.

4
Developing recommendations to increase private savings. Is there room for further,
voluntary retirement saving by the poor? Can the private market play a bigger role?
In line with FinMark Trust’s mission of making financial markets work for the poor,
this study determines the extent to which old age savings markets are working for
the poor, as well as the reasons behind the phenomenon and the possible
strategies to address it. We highlight the features of long term products which
would go towards meeting the needs of the LSM 1-5 population, and outline
recommendations for overcoming the various prior hurdles they face to saving. It is
important to note that these recommendations would themselves then be subject to
evaluation on other criteria, such as broader institutional, fiscal and labour market
implications. Such an evaluation will be necessary before any recommendations
are implemented, but does not form part of the scope of this study.
The main findings of the study can be summarised as follows:
Box 1. Main findings
1) LSM1-5 saving behaviour shows almost no private, voluntary, long-term provision for old age
2) Low savings behaviour among the poor can be explained by the fact that various, roughly sequential
hurdles need to be to overcome before private long-term saving is prioritised:
a) Behavioural economics and focus group insights indicate that people do not adequately
anticipate and assess their financial needs in old age
b) LSM1-5 people have to make greater sacrifices to put money aside for long-term savings:
immediate and short-term needs are a priority, for instance spending on education, food and
transport
c) Automatic provision by the state can make additional saving irrational, particularly when the
SOAG exceeds their average working age income
d) The features of voluntary long-term saving products are generally not suitable for the poor,
relative to the features of investment in housing for example, which has critical personal and
social importance, as well as containing an implicit long-term savings element
3) Conclusion - the market in private, voluntary, long-term savings cannot be made to work significantly
better for the poor (though it can be made to work better for richer customers for whom use of these
products is more feasible). There are many preceding hurdles which will not necessarily be overcome
by improving the voluntary savings market and these hurdles need to be addressed in different ways.
The study points out though that improving access particularly to housing finance can contain an implicit
savings element relevant to this group.

5
The document consists of the following sections:
• Section 2 defines the scope of the old age savings problem, looking at what
old age means for people in LSMs1-5, and the impact this has on their
decisions around retirement provision
• Section 3 details actual LSM1-5 savings behaviour in South Africa
• Section 4 investigates the various hurdles to long-term savings among the
target market
• Notwithstanding these hurdles, Section 5 concludes with policy
recommendations and strategies for making the private voluntary market
work incrementally better for the poor. It also contains some insights to inform
the other approaches to old age provision under discussion, such as the
national social security system
• Reference is made throughout the document to the Appendix, which contains
further information or background on the current pillars of provision in South
Africa, housing used by LSM1-5 members and pension-backed mortgages.
.
6
2. THE MEANING OF OLD AGE SAVING
To understand the extent and drivers of savings for old age in LSMs1-5 one needs
to understand and define what is meant by savings, and secondly, the life period
and the financial behaviour that ‘old age’ refers to.
Firstly, in the analysis to follow it is important to demarcate private old age savings
from savings and old age provision more generally. This we do firstly by defining
the type of saving in question:
• We focus on savings by an individual, aimed at providing for an individual’s
own wellbeing and those of their dependents, rather than state provision or
provision on their behalf by an employer.
• We focus on provision by individuals out of current consumption for future
consumption needs. This implies that funeral insurance and credit purchases
are excluded.
• We focus on long-term savings, taken here as 10 years or more, rather than
savings for short-term goals or transactions, such as through stokvels or
bank accounts.
The second important aspect to define is old age. Only once it is clear what is
meant by old age can one analyse old age savings behaviour, the need for old age
provision and the various hurdles to it. It is therefore important to root our
understanding of old age in its meaning for the poor. We put forward three
alternative ways of considering old age:
1. Old age can refer to departure from permanent participation in the labour force
– i.e. retirement in the traditional sense.
2. Alternatively, it could be considered as the last portion of a person’s life, say
the final 15 years.
3. Finally it could be regarded as a period that starts at a specific age, as defined
for example by the eligibility age for the receipt of a pension. For instance, in
South Africa, females older than 60 and males older than 659 are eligible for
the SOAG and that has defined the meaning of old age for many.
9 Note that the Minister of Finance, in his budget speech of 20 February 2008, proposed that the eligibility age for
males be reduced to 60 by 2010 to bring it in line with that of females.

7
Finally in this section, we recognise that older people tend to be embedded in
mixed generation households or relationships, so that provision for one’s own old
age is difficult to separate from ongoing contributions to others in the household.
Old age as departure from the labour force
Departure from the labour force is not an appropriate definition of old age. Data
shows that while there is no definite exit point from the labour market, LSM1-5
labour force participation10
starts to reduce from the mid-40s, before showing a
drastic reduction after the age of 60. Though some irregular piece work does
continue into old age, this is the period where economic inactivity peaks:
Figure 1. Labour force participation among LSM 1-5 individuals over the age profile
Source: Compiled from data contained in the General Household Survey, 2006
According to Lam, Leibbrandt & Ranchod (2005) this decline in participation is
mainly the result of poor health and an inability to perform manual work at older
10
Labour force participation is defined as all individuals having done any activity (even part-time) for financial reward
within the past 7 days (broad definition of employment), plus people who are unemployed (i.e. have not done any work
in the last 7 days) but are looking for employment. The rest of the population will be regarded as economically inactive.
0%
10%
20%
30%
40%
50%
60%
70%
80%
90%
100%
20
-24
25
-29
30
-34
35
-39
40
-44
45
-49
50
-54
55
-59
60
-64
65
-69
70
-74
75
-79
80
-84
85
+
Age Categories
Broadly unemployed
Employed
Economically inactive
0%
10%
20%
30%
40%
50%
60%
70%
80%
90%
100%
20
-24
25
-29
30
-34
35
-39
40
-44
45
-49
50
-54
55
-59
60
-64
65
-69
70
-74
75
-79
80
-84
85
+
Age Categories
Broadly unemployed
Employed
Economically inactive

8
ages. For the period between 45 and 65, it can however be regarded as a
structural unemployment issue, with older people less likely to hold on to a steady
job, rather than an indication of the onset of “old age” per se. This suggests that
departure from the labour force in and of itself is not a sufficient criterion for
defining old age.
Old age as the last part of life
Despite declining life expectancy, it is problematic to define old age as the latter
part of the average individual’s life. Looking at old age from the second
perspective, that of the last part of a person’s life, mortality projections show that
the average life expectancy of males and females alike have been reducing
drastically over the past few decades11
. This effectively brings forward the last
proportion of a person’s life:
Figure 2. Life expectancy trend for South African males and females: 1985 to 2007
Source: ASSA2003lite AIDS and demographic model, standard assumptions. Note that the projection refers to
whole South African population and not just LSM1-5, whose life expectancies would tend to be slightly lower
than average
11
This is mainly due to HIV/AIDS.
40
45
50
55
60
65
70
75
19
85
19
86
19
87
19
88
19
89
19
90
19
91
19
92
19
93
19
94
19
95
19
96
19
97
19
98
19
99
20
00
20
01
20
02
20
03
20
04
20
05
20
06
20
07
Male age 20
Female age 20
Expected age at death

9
Focus group responses12
also throw some light on the way in which the poor
regard old age. Some respondents did not think that they would reach old age; for
many, what came to mind when asked to think about old age is: “I think of death”.
One respondent remarked: “My main worry is HIV and sugar diabetes, but I don’t
think I will reach the age of 70” (35-45 year old female). This could suggest that
people’s view of when old age starts should shift from around the 60s (traditionally)
to the 40s or 50s. Focus group research however failed to support this – even
though some do not think that they will reach old age, they still regard it as the
period beyond the age of 60.
Furthermore, despite the reducing life expectancy of 20 year olds, the life
expectancy of 50 or 60 year olds has been and is expected to be stable. In fact,
despite HIV/AIDS, people over the age of 65 will still make up an increasing
proportion of the total population in future years. It is expected to double in the next
35 years to 10% of the population13
. This means that while much of the population
will not reach typical old ages, a substantial part of the population will do so and will
therefore have old age provision requirements.
It is therefore difficult to argue that the onset of “old age” happens at a younger age
due to declining life expectancy. At most, the population is polarised between those
expected to live a long life and those expected not to reach old age.
Old age as starting from a particular age
The traditional retirement age remains the best way of defining old age for the
purpose of this study. The third and ultimately most appropriate way of defining old
age is by using the customary retirement age of around 60. This method is
supported by the focus group findings and an HSRC (2004) survey among the low-
income population in Mpumalanga. When asked when old age starts, it was widely
regarded as “60 for women, 65 for men”, i.e. the eligibility ages for the SOAG. This
definition is broadly consistent with a time of significant departure from the labour
force. Given these perspectives on the meaning of old age, we therefore regard old
age provision as provision in working life up to about the age of 60, for life
thereafter.
12
Note that we conducted focus group sessions as part of this study, outsourced to market research house African
Response. The focus group insights form a core part of the findings. The focus group report (including a description of
the sampling and group composition) is available upon request. 13
ASSA2003lite AIDS and demographic model, standard assumptions

10
Rights and obligations in old age
Old age provision to be regarded within the household context. Traditionally, the
norm has been for older people to be supported by their children, and this
sometimes continues to happen when children earn sufficient income to support
their parents. However, the impact of HIV/AIDS and unemployment has meant that
frequently older people continue to have to support their children and
grandchildren14
. Emerging from the focus groups, it is clear that the meaning of old
age includes consideration for ones broader rights and obligations within the
household, and the direction of support will depend substantially on the relative
wealth of the elderly and their children.
On balance, the focus groups indicated that old age provision was not just about
the individual, but also about providing for family and the community more broadly.
Thus, while respondents mentioned their “rights” to be looked after by their children
in old age and to “enjoy your money after working hard for so many years” (35-45
year old male/female), they are realistic about the fact that they may still have the
obligation to support others in old age:
• “It’s that there is no one that provides for me, and I must look after the kids no
matter how difficult it is” (50-60 year old female)
Thus, even though the individual rather than the household is the unit of analysis in
the current study, it is important to acknowledge the fact that individuals who make
old age savings decisions are embedded within households and face broader
obligations than just providing for their own expenditure needs.
• “I earn pension and this money is not enough for all of us...” (60+ female
respondent)
Critically then, old age provision should be regarded within a portfolio of broader
household income and expenditure needs that do not necessarily decrease in old
age. Provision an old person makes for themselves or is made on their behalf is
applied to a whole household. Old age provision forms another income source into
the broader household unit which includes the old person.
14
See the discussion on Pillar 4 in the Appendix.

11
3. LSM 1-5 SAVINGS BEHAVIOUR
Long-term saving is limited among the poor. While the poor do save, this saving
often takes the form of small, irregular lump sums that are drawn down for
immediate or short-term purposes. Therefore, among those saving in the LSM 1-5
groups, saving directed to old-age income security enjoys limited priority. The
figure below indicates that retirement was quoted as a reason for saving for only
5% of the already small proportion of the LSM1-5 population that is saving for any
reason.
Figure 3. LSM1-5 savings goals15
Source: Eighty20, 2007. The Savings Market for the Poor (based on Finscope, 2006)
People save mostly for short-term goals. These FinScope findings are confirmed
by focus group research and the Financial Diaries study. Among focus group
respondents, the three most cited reasons for saving were funeral society
15
Note that saving for housing-related purposes was not included in the questions which produced this data

12
contributions, school fees and bills, which may include utility payments or debts
incurred at local spaza shops. The Financial Diaries highlighted saving for a
deposit on an asset, Christmas groceries or school fees. These studies show that
such short-term savings instruments rarely contribute to the build-up of net worth
over time, thereby impacting on old age provision. This is further reflected in
product usage figures. Long-term savings products and insurance, including
funeral and life policies and even informal burial societies, show lower usage
compared to short-term savings products such as savings/transaction accounts.
Shorter-term savings/transaction products are taken up by about 41% of the LSM 5
population and 28% for the LSM 4 population. Retirement vehicles such as
retirement annuities and occupational funds, on the other hand, are hardly used by
this group. The figure below shows that usage for retirement annuities and
occupational funds is less than 5% even for LSM 516
. This is explained by the fact
that few in LSM 1-5 are formally employed or participate in an occupational
pension scheme.
16
Note that industry estimates the proportion to be up to 10%, while Meltzer (2007) estimates a figure of 8%. There is
likely to be a degree of under-reporting in FinScope, and the true figure is probably an approximation of all three.

13
Figure 4. LSM1-5 financial product usage
Source: FinScope South Africa 2006
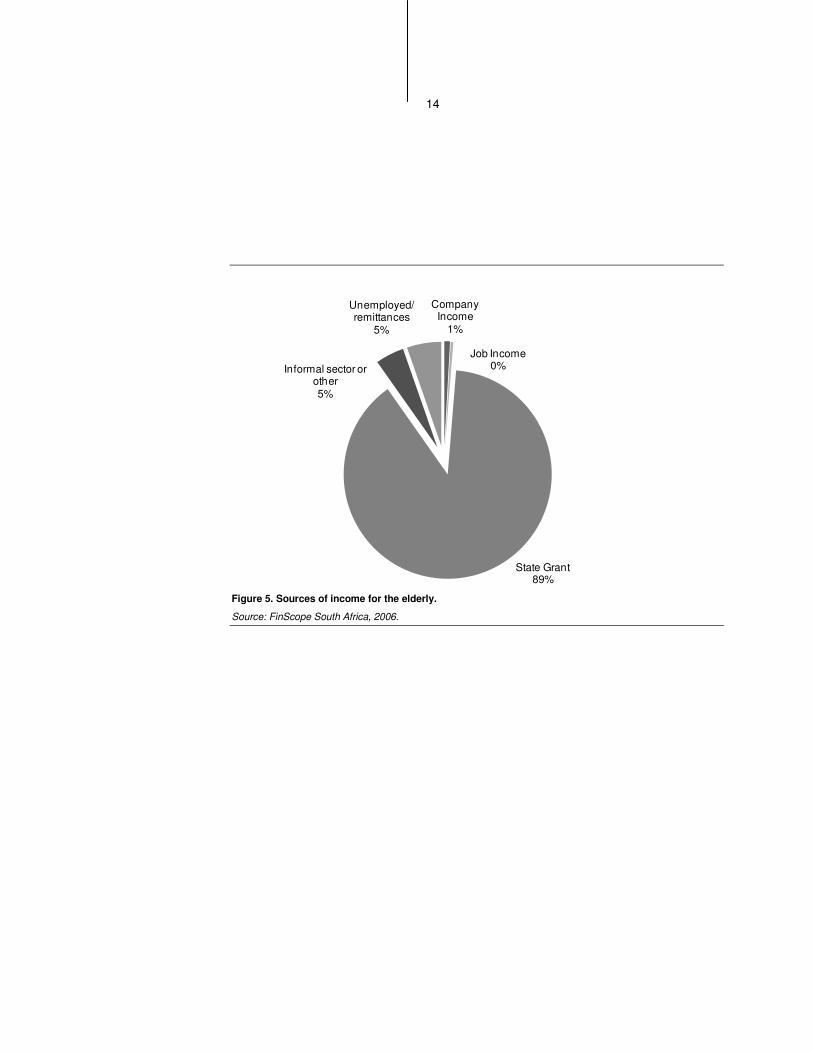
State grants and transfers are the main sources of income in retirement for the
LSM1-5 market. The result of the low priority afforded to retirement savings and the
subsequent low usage of retirement products is that state grants and private
transfers are the main sources of income for the LSM 1-5 population in old age. In
2006, 89% of the elderly in LSM 1-5, representing 2.1 million people, relied
principally on the social old age grant and other grants for old age income (See
Figure 5). 5% of this population cited remittances as their main source of income,
while another 5% engaged in some form of informal work as main income source.
As focus group responses showed, these categories are certainly not mutually
exclusive. Elderly respondents often claimed to have a diversified portfolio of
income provision, which included the social old age grant, some child grants,
income from irregular piece jobs such as gardening or roof repairs, as well as
income-generation from the infrequent production and sale of homemade goods.
14
Figure 5. Sources of income for the elderly.
Source: FinScope South Africa, 2006.
Company Income
1%
Job Income0%
State Grant89%
Informal sector or other 5%
Unemployed/remittances
5%

15
4. THE HURDLES TO LONG-TERM
VOLUNTARY SAVINGS
The savings decision is driven by a number of factors. A fundamental finding
emerging from the focus groups, consultations and desktop research conducted is
that the LSM1-5 old age savings decision is multi-faceted. Put differently, it is not
simply a rational “yes or no” decision based on an assessment of old age income
needs. The individual’s marginal propensity to save a part of his/her disposable
income is rather affected by various factors, including:
• demand-side factors such as individual expectations, priorities,
knowledge/financial literacy;
• context-specific factors, including resource constraints and reciprocal financial
obligations; and
• the available supply of savings products and alternatives.
Low-income people need to overcome sequential “hurdles” before saving for old
age. Our hypothesis is that the factors impacting on the savings decision can be
regarded as sequential hurdles that need to be overcome before a low-income
individual reaches the point at which he/she can make a decision to put aside
money for old age. At that stage, the features of the formal voluntary market come
into play in determining the savings decision. In the sub-sections to follow, we
highlight the following conclusions:
1. Theoretical and empirical insights from behavioural economics, as well as
focus group findings indicate that most people do not actively consider old
age. Some of this is “irrational” over-discounting of future needs, and some
is the quite rational, heavy discounting of future needs in the face of low life
expectancy.
2. Affordability constraints increase the opportunity cost of diverting current
consumption of necessities like food, education and transport. This reflects
in heavy discounting of future needs.

16
3. Other prior and automatic sources of income in retirement (such as the
State Old Age Grant) in many cases exceed working age income, which
may make further diversion of working age income irrational17
.
4. Finally, features of existing formal long-term voluntary savings products
make them unappealing to potential low-income users, relative to
alternatives such as investing in housing.
4.1. BEHAVIOURAL INSIGHTS
Rationally, people should smooth income over their lifetime by saving for
retirement, but this is often not supported by actual behaviour. Neoclassical
theories such as the Permanent Income Hypothesis and the Life Cycle Hypothesis
suggests that people plan for future needs rationally and well in advance. People
take stock of their expected needs for old age and their likely income profile over
their lives and plan for old age accordingly, seeking to smooth income over time by
foregoing current for future consumption. However, the discussion of LSM1-5
savings behaviour above has shown that, while the poor do save via stokvels and
in bank accounts, this saving tends to be geared toward short-term goals and will
rarely be kept until retirement.
This type of savings behaviour is in large part driven by low incomes, which we will
consider in more detail in Section 4.30 below. However, it is our hypothesis, borne
out by theory and focus group findings, as well as the state of the voluntary long-
term saving market, that people often do not actively consider old age in the first
place. That is, even before affordability issues come into play, the tendency to
spend in the present rather than save for the future is a hurdle that needs to be
overcome. And this statement holds for all individuals, not just the poor.
People tend to over-discount future needs heavily in favour of current needs.
Behavioural economic theory questions the hypotheses of neoclassical theory. The
hyperbolic discounting theory argues that people often do not even consider the
long-term implications of current financial decisions. When they do, they tend to
over-discount future needs in favour of current consumption (Deaton, 2005), as
they tend not to perceive future risks to be as real as current risks (Weber, 2003).
17
This argument will be explained below. It is not our contention that the SOAG in practice disincentivises savings and
that savings would rise in the absence of the SOAG or decrease if the SOAG is increased. Rather, the hypothesis is
that, given the opportunity cost of long-term saving, it would be irrational to do so in the presence of the SOAG.

17
This is supported by focus group findings:
• If a person is young, “they are not thinking of old age”
• “When you’re young you think that’s [old age] far-fetched” (60+ female)
This phenomenon can be exacerbated by low levels of financial literacy (Mitchell,
2007), a phenomenon more closely associated with the poor than with the rich.
High discounting of future needs can also be perfectly rational. This is driven firstly
by relatively low chances of survival to old age, which can make it rational to
discount future financial needs heavily in favour of immediate survival needs,
should people have a sense that their chance of survival is low:
Figure 6. Proportion of 20-year old males surviving into old age.
Source: ASSA2003 model, whole SA population, standard assumptions
The high take up enjoyed by funeral related insurance arrangements and seen in
Figure 4 is a further indication of this rationality.
Secondly, rational but heavy discounting is driven by poverty, alternatively, limited
current resources relative to pressing current expenditure needs. This increases
the opportunity cost of dedicating current income to saving and may change the
decision making balance. The poor are also generally more vulnerable to shocks
such as deaths and illnesses as well as juggle a host of competing priorities like
education, rent and transportation. These shocks and competing priorities compel
0%
20%
40%
60%
80%
100%
20 40 60 80Age
Proportion of 20-year old males surviving to age

18
low-income earners to focus on immediate, present needs at the expense of fuure
needs. We explore this in more detail in the next section.
4.2. AFFORDABILITY
Affordability is a primary obstacle to sustained, long-term saving. As stated by one
rural focus group participant “we can’t save if we are hungry”. Many LSM1-5
individuals are unemployed, and those that are in some kind of employment have
low and volatile incomes. There is a high opportunity cost to diverting some of this
income to savings, and emergencies, like funeral expenditures, quickly exhaust
any savings built up.
High unemployment constrains the ability of individuals to make regular savings
contributions. At most a third of the LSM1-5 adult population in South Africa is
employed18
:
Category % of all individuals in LSM 1 - 5
Economically inactive 38% (7.5m)
Employed 33% (6.6m)
Unemployed 29% (5.8m)
Table 3. Employment status of the LSM1-5 population.
Source: General Household Survey (2006)
In fact, more than 40% of the LSM 1-5 working age population rely on private
transfers, unemployment insurance or earn no income at all. This represents 8.4
million people for which saving for retirement is clearly not an option:
18
The term employed as used here refers to salaried workers in the formal sector

19
Figure 7. Percentage of LSM1-5 population relying on various main sources of income19
Source: compiled from FinScope (2006) data.
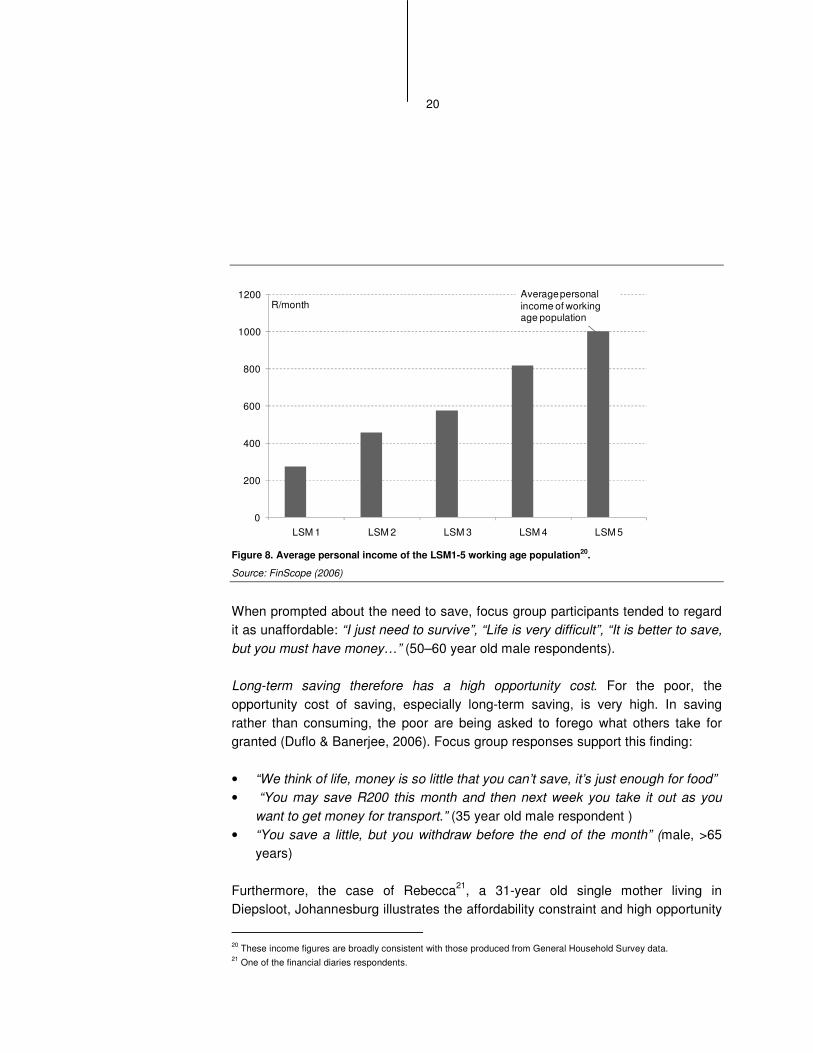
Low and volatile incomes constrain long-term savings even for the employed. Even
for those that are employed, incomes tend to be low and volatile. Few in LSM1-5
have a sustainable income that would be sufficient for long-term saving:
19
Definitions used: Company income � work for a salary/wage from a company; Job income � work for a
salary/wage from an individual; State grant � child ,disability grant, SOAG, other; Informal sector or self-
employment � Informal or irregular income, self-employed, pension/investment; Unemployed /remittances � rely
on family or friends, unemployment insurance, gambling, no income.
Company Income
13%
Job Income8%
State Grant22%
Informal sector or other
13%
Unemployed /remittances
44%
20
Figure 8. Average personal income of the LSM1-5 working age population20.
Source: FinScope (2006)
When prompted about the need to save, focus group participants tended to regard
it as unaffordable: “I just need to survive”, “Life is very difficult”, “It is better to save,
but you must have money…” (50–60 year old male respondents).
Long-term saving therefore has a high opportunity cost. For the poor, the
opportunity cost of saving, especially long-term saving, is very high. In saving
rather than consuming, the poor are being asked to forego what others take for
granted (Duflo & Banerjee, 2006). Focus group responses support this finding:
• “We think of life, money is so little that you can’t save, it’s just enough for food”
• “You may save R200 this month and then next week you take it out as you
want to get money for transport.” (35 year old male respondent )
• “You save a little, but you withdraw before the end of the month” (male, >65
years)
Furthermore, the case of Rebecca21
, a 31-year old single mother living in
Diepsloot, Johannesburg illustrates the affordability constraint and high opportunity
20
These income figures are broadly consistent with those produced from General Household Survey data. 21
One of the financial diaries respondents.
0
200
400
600
800
1000
1200
LSM 1 LSM 2 LSM 3 LSM 4 LSM 5
R/monthAverage personal income of working age population

21
cost of long-term saving for the poor. Rebecca had an average monthly income of
just more than R700 in 2005:
Income
Average per month
over the year % of income
Casual work R 3.76 0.5%
Child grant R 162.41 22.9%
Regular wages R 342.86 48.3%
Remittances received R 200.53 28.3%
Total income received R 709.55 100%
Table 4. Rebecca’s monthly income
Source: Financial Diaries (2005)
Her average monthly expenditure is as follows:

22
Expenditure Average per month % of income
Cell phone (rental, airtime) R 2.26 0.3%
Clothing R 41.12 6.1%
Crèche R 56.39 8.4%
Domestic workers R 7.52 1.1%
Entertainment (cinema, etc.) R 11.65 1.7%
Food R 186.43 27.8%
Household products R 39.78 5.9%
Other energy forms R 14.83 2.2%
Outside phone R 1.11 0.2%
Remittances given R 51.13 7.6%
Rent R 136.84 20.4%
Shoes R 18.49 2.8%
Transport to shopping R 7.07 1.1%
Transport to work R 42.56 6.4%
Total credit payment R 52.33 7.8%
Total expenditure R 669.51 100.0%
Balance remaining R 40.04
Table 5. Rebecca’s monthly expenditures.
Source: Financial Diaries (2005)
The amount “left over” will differ from month to month, and it is expected that she
would need to use built up savings in some months to meet unexpected
expenditures, thereby depleting what little savings she has managed to
accumulate. To divert current income towards long-term savings would mean
cutting into amounts spent on very basic survival necessities.
Life and other emergencies further constrain the ability of the poor to save. In
addition to the constraints described above, emergencies have a disproportionate
financial impact on low income people. Such emergencies tend to deplete
accumulated savings and further undermine the ability to save. The Financial
Diaries indicate that the death of a family member and the associated funeral costs
present a financial shock that often causes households to delve into savings and

23
take out loans, even if the deceased had been covered by funeral insurance. A
focus group respondent indicated that:
• “If for example somebody dies, the neighbours have to jump in and help” (50-
60 year old female)
Other emergencies include the loss of a job (emphasised by focus group
participants as a risk), the impact of disasters such as fires or floods in informal
settlements, or simply the need to provide for fairly predictable needs such as
school fees/uniforms at a time when sufficient disposable income is not available.
4.3. OTHER PRIOR AND AUTOMATIC SOURCES OF INCOME
The presence of the SOAG theoretically implies that it can be irrational for very
low-income people to forego current consumption in favour of additional retirement
provision22
. As the figure below indicates, individual income in LSMs1-5 is on
average higher in old age than during working age:
22
See the discussion in Appendix 1 for more details on the SOAG, its impact on poverty and household structure, as
well as the means test.

24
Figure 9. LSM1-5 income comparison: working age vs. retired23
Source: FinScope (2006)
At a level of R820 per month in 2006 (R870 per month for 2007), the SOAG
guarantees the LSM1-4 market a higher income in retirement than they earn on
average during their working lives. Probably for most people in this market any
current income sacrifices in favour of retirement would generally be irrational
(irrespective of any impact of the means test). By rather consuming their income
now, people are still better off in retirement. Returning to our earlier example:
Rebecca’s total income of R710 is R70 less than the maximum amount of the
social old age grant at the time of the study. This implies that it would probably
make more sense for her to not save now and simply apply for the social old age
grant upon retirement24
.
23 Data comments: a sampling error most likely accounts for reduction in LSM1 to 2 post-retirement income.
Remittances and private transfers account for retired income above SOAG in LSMs 3-5. 24
Note that we compare personal income pre and post-retirement, as it would not make sense to consider the notion of
pre and post-retirement for an entire household. Furthermore, it is at the individual level that decisions are made about
how much to contribute to household income.
0
200
400
600
800
1000
1200
LSM 1 LSM 2 LSM 3 LSM 4 LSM 5
R/monthPersonal income of retired population
Personal income of working age population
SOAG 2006 level:R820/month

25
The “crowding out” effect on private saving of state pensions has been the subject
of many studies internationally. Dominitz, Manski and Heinz (2002) find that, in the
USA, retirement savings decisions depend on expectations of social security
retirement income. A World Bank (2002) study on a Chilean dataset finds several
crowding out factors preventing private retirement provision. This includes the
expectation of care from children in old age (Pillar 4 as discussed in Appendix 1).
Importantly, it also finds that workers who have met the contributory requirements
to qualify for the minimum pension guaranteed by the government are significantly
less likely to continue making contributions to a retirement fund. Bertrand et al
(2000) find that the SOAG may serve as a disincentive to work for family members
and increases consumption of leisure of especially male relatives. It can be argued
that this implies that the presence of the SOAG leads to an overall tendency to
save less. While this is a “post-the-fact” study on the impact of the SOAG, it does
suggest that the SOAG and the expectation thereof may impact on financial
decisions.
There is however little evidence that the SOAG presents a consciously appreciated
disincentive to old age saving disincentive in practice. Though the argument above
logically entails that it would be irrational or unnecessary for the poor to save for
old age in light of the SOAG, this does not imply that private savings would soar if
the SOAG were removed, or would decline if the SOAG were increased. In
practice, the focus groups indicated that little conscious weighing up takes place –
most people do not make an active retirement savings decision as they either
discount the future or find sustained savings unaffordable. The Financial Diaries
supports this: respondents tend to save for short-term goals only, regardless of the
SOAG.
The SOAG means-test reinforces any theoretical disincentive effect. The
“irrationality” of saving for old age in the presence of the SOAG is exacerbated by
the means test. The SOAG means test is equivalent to a 50% tax on additional
income: every increase in personal provision of R100 results in a net increase in
total income of only R50:

26
Figure 10. The interplay between the SOAG level and personal income according to the means test.
Source: drawn up based on SOAG means test rules, as contained in Section 12 of “Grants and Financial Awards to Welfare Organisations and to Persons in Need of Social Relief Of Distress25”
The means test therefore implies that, logically, there is no incentive to top-up the
expected SOAG income by private savings as one is in effect taxed for any private
savings. Internationally, various studies point to the disincentive effect of means-
tested state pensions. According to Hurst and Ziliak (2001), the fact that
households are subject to a means test to receive government assistance can to
some extent explain the low saving rate in the USA.
However, the means test is difficult to enforce in practice, which reduces the
disincentive effect suggested by theory. There are several practical difficulties
surrounding the means test and questioning its ability to sort deserving recipients
of the SOAG from the undeserving. The average SOAG payment is close to the
maximum level (Wilmore, 2006, quoting the results of the Taylor Committee
Report, 2002). This suggests that few grants are in practice affected by the means
test.
25
First published in the SA Government Gazette 18771 of 31 March 1998 under the Social Assistance Act of 1992 and
subsequently amended.
0
500
1000
1500
2000
2500
3000
3500
To
tal p
rovis
ion
: gra
nt a
nd
pe
rso
na
l
Personal provision in old age
SOAG paid
Monthly income

27
This could imply that people either fail the test outright (by being too wealthy) and
thus receive no grant, or simply that they do not have additional qualifying income
or assets, which would generate a reduced grant. It is however more likely that
there is a failure to properly apply the means test, because it is in practice very
difficult to administer. In administering the test, some basic background checks are
done: people are required to submit 3 months’ bank statements, if available, and
SASSA26
consults with the deeds office to find out whether people own any
property, as well as to ascertain a rough value for such property. However, the
information collected is very much dependent on the integrity of the individual.
Furthermore, the application of the means test may be undermined by intra-
household transfers or the fact that additional income tends to be based on
piecework and to be low and variable, therefore not being picked up by the means
test.
The disincentive effect of the means test does not appear significant in practice.
Van der Berg & Bredenkamp (2002) find that “the means tested nature of the old
age pension [clearly] reduces the incentive for low income earners to belong to a
retirement fund.” But does this hold in practice? The disincentive effect of the
means-test was mentioned a few times in focus groups:
• If you still receive an income from work, even if you are 70, SOAG is not
available for this person” (female, 35-45 years).
• If someone has “got money at the bank”, or if “husband is still working”, the
SOAG is not available to them – “they stop it” – or is reduced (various
responses, females, 50-60 years)
• “If you have money in the bank you do not get it” or “if spouse is working, they
will receive less money” or you may not qualify (various responses, male 65+)
• “They give me half because I am married and husband is earning R6000”
(female, 60+)
The impact of the means test was perceived as unfair by some, as:
• “some people that have worked all their lives do not receive grant” yet “those
who were not working, get it” (various responses, male 65+)
26
The SA Social Security Agency – the body which administers the SOAG.

28
• “unfair because some people get the grant and others who also need it, do not
receive the grant” (female, 35 to 45 years; male 50-60 years)
Various others however thought that “every old person gets it”. Overall, despite the
apparent awareness of the means test, it would not seem from the focus groups
that the means test is consciously taken into account as part of a rational decision
whether or not to save for old age.
Conclusion. The SOAG makes additional private provision theoretically irrational
for most low-income people, though there is little conscious appreciation of this
among these people, mainly because they have not cleared the affordability hurdle
and are therefore in a position to meaningfully make this evaluation. The means
test also makes further saving irrational to an extent, though practical difficulties in
applying the means test imply that saving in some form could be achieved if
affordability permitted. The implication is that if incomes permitted greater saving
then these theoretical effects would probably become more pronounced in practice.
4.4. FEATURES OF FORMAL LONG-TERM VOLUNTARY SAVINGS
VEHICLES
In this section we evaluate the main categories of formal financial instruments
available for long-term savings to the poor. These include what we call products,
that is, retirement annuities, unit trusts and endowment products. We also include
evaluation of alternative vehicles like investment in housing, children and family,
which could produce value and income in the future for an elderly person.
Formal products may not be suitable for long-term saving among the poor, even if
prior hurdles are overcome. Once prior hurdles of affordability have been overcome
and other long-term priorities have been seen to, the individual can begin to divert
some disposable income towards old age savings using voluntary, private vehicles.
Unfortunately, the nature of long-term savings products imply that many of them
are not accessible, are inflexible, and offer a poor rate of return or limited
guarantees to this type of consumer. This is partly because flexibility and
guarantees come at a cost (impacting on affordability), while the need to invest in
low-risk instruments when dealing with the savings of the poor tends to imply a low
return. In addition, management fees, performance fees, switching fees, exit fees,
intermediary fees, distribution costs and early termination fees can apply that are
passed onto the client. For low-income products, such fees can be high relative to
the value of monthly contributions. There are therefore few private and voluntary

29
long-term retirement savings products that are well suited to the needs of this
particular market.
Nevertheless, the use of private voluntary products remains an aspiration for LSM
1-5, especially for the working population. Focus group studies revealed some
familiarity with “big name” providers as well as a handful of retirement savings
products such as unit trusts or ‘stocks’ and retirement annuities. Overall, there
appeared to be a real need for information on the value of these products, as well
as information related to risk, returns and costs.
Evaluation of suitability of retirement annuities, endowment products and unit
trusts. In evaluating the suitability of these types of products to the LSM 1-5
market, we focus on three main types of products, namely retirement annuities,
endowments and unit trusts. These products are the most widely used private long-
term savings products in the South African market. Below, we provide a brief
description of these products and analyse their suitability to the LSM 1-5 market.
This is done through the application of the broad criteria of accessibility,
appropriateness and affordability. Note that we do not conduct detailed product
comparisons on the basis of product features, fees, reduction in yield27
, etc, but
rather aim to give a high level overview based on a number of projects considered
and consultations.
Retirement Annuities have the following features:
• Contractual monthly contributions deducted from pre-tax income
• Fixed term limits
• Diversified investment options in equity, bonds and life policies
• Withdrawals not allowed until retirement, with a minimum retirement age of
55
• Payment options: a third of accumulated capital may be paid out as a lump
sum and the remaining two-thirds must be used to purchase an annuity
(under the Income Tax Act, 196228
)
27
See Rusconi (2004) for an in depth analysis. 28
More information on retirement annuities and their regulation, including an overview of the Income Tax Act as it
pertains to retirement saving, is contained in Appendix 1.

30
• Income tax is deferred until maturity of the annuity as retirement annuity
contributions are tax-deductible up to 15% of income, though most people
in these low LSMs do not pay income tax
Endowments have the following features:
• Contractual monthly contributions that can be deducted from pre-tax
income
• Fixed term limits of up to five, ten or fifteen years
• Diversified investment options in equity, bond and other markets
• Limited withdrawals, usually one or two per year, after an initial contribution
period of five years
• Accumulated balance paid out as a lump sum at the end of the term
• Policy holder fund’s tax of 30 percent29
applied to income earned by the
provider
Collective Investment Schemes have the following features:
• Flexible contributions that can be deducted from pre-tax income in the form
of regular or irregular monthly payments or one-time lump sum payments
• Term limits are not imposed, but the investments tend to be most
appropriate for the long-term
• There are diversified investment options in equity, bonds and property
• Withdrawals are allowed at any time and for any amount
• Capital gains tax of 10 percent is applied when units are sold
29
Note that all tax rates quoted in this report are the prevailing rates for 2007 (the time of writing for this report) and do
not take account of subsequent changes in income or company tax, if any.

31
4.4.1. EVALUATION OF PRODUCTS ON SELECTED CRITERIA
Accessibility
Definition of accessibility as applied in this analysis entails both proximity ad
convenience. This term combines proximity and convenience, namely the ready
availability of the product in the areas in which the target population lives, as well
as the ease with which the target population can obtain the product.
The distribution model applied is a good indicator of both proximity and
convenience. We found that the distribution models used by providers of retirement
savings relied heavily on commissioned brokers or advisors. Interviews with
product providers revealed that few agents were willing to expend time and energy
on the LSM 1-5 population because of the small transactions involved, leading to
low commissions30
. Given that savings products tend to be ‘sold, not bought’, low
take-up of these products is partly a reflection of limited broker/advisor activity.
Furthermore, while these products are usually also obtainable at bank branches,
insurance company branches or over the internet, most of these avenues are
difficult and costly for the LSM 1-5 population to access and, therefore, highly
inconvenient. This holds for all three product categories under consideration.
Although providers expressed interest in using alternative models of distribution,
such as retail centers and mobile phones, the administration fees demanded by
these outlets were reported to be in some cases higher than broker commissions.
In one extreme case, it was cited that the retail company approached demanded
up to 50 percent of the monthly premium. However, some providers have found
ways to target the low-income market, for example by changing the commission
structure of advisors or by encouraging on-the-spot sign up for a product. For
instance, advisors can be remunerated based on the number of policies sold,
rather than the Rand value of the policy sold.
Appropriateness
Definition of appropriateness as applied in this analysis entails flexibility,
encouraged preservation, and guaranteed returns or low-risk investments.
Appropriateness deals with the question of how well the product features address
30
More details on commission structures and levels are contained in the regulatory overview which forms part of the
Pillar 2/3 discussion in Appendix 1.

32
the needs of the target market. The LSM 1-5 market is characterised by low,
irregular incomes that are sensitive to exogenous economic and financial shocks.
This population is therefore highly risk averse. Based on this characterisation and
from focus group insights, we deduce that the following product features are
attractive to this target market:
• Flexibility in the number of contributions and withdrawals to account for
irregular income or unforeseen emergencies
• Ability for people to impose on themselves some discipline to encourage the
preservation of accumulated savings
• A guaranteed return, or diversified and low-risk investment options, to ensure
an acceptable return in the long-term
Weights can certainly be applied to these criteria, although we have not suggested
these in our research. However, flexibility seems to carry the most weight, followed
by the returns and the enforced discipline. The three different retirement savings
options meet these criteria in different ways:
• Retirement Annuities. Mandatory monthly contributions (though some are
starting to allow skipped contributions), fixed term limits, limited withdrawals
and low to moderate risk investment options make this a highly inflexible, yet
disciplined savings vehicle that can offer acceptable returns, depending on
cost structures. However, its tax incentives do not apply to this market, whose
income is not taxed, and therefore offers no significant gains over other
alternatives.
• Endowments. A few endowments allow for a limited number of skipped
contributions and some withdrawals after a specified period making this a more
flexible option than the retirement annuity. It does offer preservation through
enforced savings discipline, although accumulated savings can be eroded by
low returns from less diversified investment portfolios and high cost structures.
• Unit Trusts. A plethora of contribution options, investment options and
unlimited withdrawals makes this a highly flexible, high return instrument. Its
main disadvantages are the risk involved in fluctuating market values and the
lack of a preservation element as it does not enforce savings discipline.

33
Unit trusts may be more appropriate then the rest. Applying the indicators of
flexibility, risk and discipline to our three product options, we suggest that collective
investment units may be better suited to the needs of the LSM 1-5 population. With
some modifications, such products can also provide some discipline and therefore
better preservation of accumulated interest income.
Affordability
Definition of affordability as applied in this analysis includes level of monthly
premium as well as value for money. Our final evaluation criterion, affordability, not
only includes the price of the product but also the value for money as determined
by costs and fees. Keeping in mind that we are focusing on individuals who have
overcome all other hurdles, there are some affordable products currently available
on the market, with monthly premiums starting from as low as R50 per month.
• Retirement Annuity Policies. With minimum premiums starting at R80 per
month, for instance, retirement annuities can be affordable. Most retirement
annuities also offer poor value for money as interest income is eroded by high
fees and high cost structures. Rusconi (2004) finds that individual policies are
generally speaking an expensive way to save for retirement and that most of
the policies he considered exhibit an annual reduction in yield of between 1.5%
and 2.8%31
(equivalent to a charge ratio32
of 26.7% to 43.2%). For the low-
income market (small policies) the effect is more pronounced.
• Endowments. The smallest premium we could find started at R80. There is
limited risk, except by inflation, but as with retirement annuities, commission
costs and fees erode already small returns, generated by the need to invest in
low-risk instruments. Early termination penalties also often reduce value for
those not completing the term of the product (this is partly linked to the
commission restructuring process discussed in Appendix 1). An additional
factor is that a 30% tax is levied on the policyholder funds of insurers (as
explained in the regulatory overview in Appendix 1). This means that
endowment policy holders are effectively taxed at 30% of their policy income,
even though most low-income individuals fall under the tax threshold. The tax
31 With reduction in yield defined as “the percentage point reduction in annual return over the period of saving that is
equivalent in overall impact to the erosion of value due to all charges”. 32 The cost ratio is calculated by dividing the total reported administration cost, including actuarial fees by the total
employer and member contributions, net of risk benefit contribution costs.
34
levied on insurers therefore removes the value proposition for the low-income
client. Rusconi (2007) finds the reduction in yield on a 10 year, R100/month
endowment product to range between 4.32% and 10.83%, whereas the range
for R200/month products is 4.04% to 7.69%.
• Unit Trusts. Options including a minimum monthly premium of R50 or a one-
time lump sum of R500 (for a specimen low income product in the market)
make this product type a flexible one. However, returns can be volatile in the
short-run, though they can be high in the long term, if invested in higher risk
vehicles. A relatively lean cost structure, with less broker intermediation and
minimum fees can make this option the best value for money out of the three
vehicles. The detailed analysis of Rusconi (2004) finds that unit trusts offer fair
value for money to retirement savers. For a substantial proportion of South
African unit trust funds, reduction in yield ranges between 1.2% and 1.95%
(equivalent to charge ratios of between 22.3% and 32.5%). He suggests that
there is little reason to suggest that unit trust funds earmarked for retirement
deviate significantly from this range.
Unit trusts best value for money. Based on an assessment of affordability, we
suggest that unit trusts offer the most value for money, as they have the lowest
fees and the investments offer higher returns net of fees than retirement annuities
and endowments. However, the low cost structure of unit trusts is based on a
distribution model that does not rely heavily on brokers or advisors and requires a
moderate to high level of financial sophistication on the part of unit holders. While
most do not tend to offer guarantees, low-risk investments are possible. The
suitability of these features for the LSM 1-5 market, as this is a market that is
characterized by individuals who need substantial consumer education.
4.4.2. ALTERNATIVE LONG-TERM SAVINGS CHANNELS
Insights from focus groups suggests that when the LSM 1-5 individual does
overcome the affordability hurdle, and might have a little extra money at the end of
the month for longer-term financial and other goals, the relatively small amount
available means that needs have to be prioritised. Amongst these needs, housing
features strongly, with investment in education and reliance on family support
featuring to a lesser extent.

35
HOUSING
An important area of expenditure which contains an implicit savings element is
investment in housing. Evidence from the Financial Diaries indicates that housing
is a key focus of saving and borrowing activity. This type of investment is generally
on an incremental basis, with nearly half of respondents reporting that they
acquired their houses by gradually buying building supplies. The reasons behind
this investment are not immediately apparent and are difficult to distil. However, in
the context of provision for old age, investment in housing can be viewed in two
ways:
Housing has an immediate usage value. Accumulating a housing asset has an
immediate benefit as the house can be lived in. In old age, the house provides a
place for you to live comfortably and rent free. It also provides a place for extended
family to live should they need to, a common occurrence in South Africa where
unemployment rates are high and household arrangements have to respond to
deaths or illness. A strong inter-generational aspect to housing was also observed.
Focus groups revealed that leaving a house to your children was an important
consideration. A house also has a significant social value, especially as a centre for
family activities such as funerals and weddings. The importance of owning your
own house should not be underestimated.
• “You can get buried in your own house when you die” (35-45 year old female)
Housing assets are also productive economic assets. A housing asset can also be
viewed in a second way, as an economic asset which can provide an income
stream in retirement, and possibly even before then. In some cases the house
could be sold and a smaller property purchased, leaving a residual amount of
money which can be used to live. This is becoming a more viable option, especially
as property markets in townships become increasingly active. By way of example,
a housing microfinance organization in the Western Cape recently valued the RDP
houses owned by their clients, most of whom have typically borrowed between R10
000 and R20 000 to spend on improving their houses. Whilst the ‘rule of thumb’ for
RDP houses is that they are worth R50 000, the houses owned by loan recipients
were valued between R120 000 and R280 000.
More commonly, the house is used as an economically productive asset, either by
renting out a room or by engaging in home based economic activity. In fact, a

36
recent study found that most small scale, informal landlords in township areas were
older woman (Shisaka, 2006). The income from rental can then be used to
supplement the SOAG. Focus group participants expressed strong entrepreneurial
interests based around their house. This included renting rooms and using the
house as a base for a spaza shop or food outlet.
• “I can have a tenant and they can pay rent to me. I can buy food with the
money.” (50-60 year old male)
• “You have financial security if you own a house”
For LSM 1-5, the usage value and future economic value of the house are
significant, and can represent an excellent return on the initial investment. The
house can be used immediately, and the incremental nature of housing
construction means that irregular and flexible investments are easily
accommodated. Interestingly, investment in housing was explicitly seen as a long
term investment by focus group respondents:
• “It is a lifetime investment” (35 - 45 year old male and female respondents)
Investment in housing should be seen as an alternative savings channel. In light of
the severe budget constraints faced by LSM 1-5 households, it seems possible that
investing in housing “crowds out” saving for old age. Instead of investing small,
incremental savings in a savings product, they are invested in a housing asset.
Given that owning a house can be a significant productive and social asset both in
the present and in old age, this should not necessarily be viewed as a negative. In
fact, there is a strong argument to be made that housing represents an alternative
savings channel, and that investment in housing should be seen more as a savings
decision than an investment decision. Investing in a housing asset should be
regarded as a Pillar 4 investment which is preferable to alternative channels for
many rational reasons as quoted above.
Housing as an asset was not a feature of focus group discussions. It is important to
note that while housing appears to be a valuable alternative savings vehicle, this
did not come through strongly in the focus groups (rather unexpectedly). This was
particularly striking when considering a house as an economic asset that can be
sold to generate capital. Whilst many participants owned houses that would
probably sell for over R200 000, this was not mentioned once as an asset that
might help them in their old age. The reasons for this are likely complex, but it may

37
be that selling the house in which you have lived and invested is simply not an
option that people consider. Issues of independence are likely to feature, as is the
intergenerational aspect of housing. If a house is sold then there is often very little
to leave to your children. A house is a tangible asset which can be passed down
from generation to generation. It is also possible that the relatively recent
emergence of a vibrant property market in the townships means that the concept of
investing in a housing asset and selling it to upgrade or perhaps downsize in
retirement is a foreign one to many in LSM 1 - 5. Another interesting hypothesis
which received no support in focus group discussions was that individuals in LSM 1
– 5 may own or build houses in rural areas, to which they will retire. Only one
person indicated that they have such a house. The phenomenon of retiring to a
rural area was likely driven by apartheid planning, and the lack of support for this
notion suggests that a growing number of people are now living their whole lives in
urban areas.
It is worth noting that the value of housing in old age provision is recognised even
in the formal retirement fund sector. The Pension Funds Act allows accumulated
retirement savings to be used as a guarantee for a loan, as long as that loan is
used for housing purposes. The logic underlying this is that even if the borrower
defaults and the loan is re-paid from accumulated retirement savings, the loan has
been invested in an asset which will either provide a return or at the very least have
a usage value.
INVESTMENT IN EDUCATION
Education was another potential candidate as an indirect way of providing for old
age. The argument is that children can be seen as a form of income security,
enhanced by education. Both conventional wisdom and focus groups suggest that
children in South Africa can serve as a form of income security during their parents’
elderly years. This makes intuitive sense; a child who is educated has a better
chance of finding employment, earning a higher income, and thus supporting you in
your old age when you can no longer work.
The conventional wisdom that children serve as a form of income security during
their parents’ elderly years is widely acknowledged. Yet there are almost no studies
available that set out to prove this. Nauck & Klaus (2007) use data from the
2002/03 “Value of Children” study to weigh up three possible reasons (both within a

38
country and cross-country) for why people choose to have children. The findings
include:
• Affection. There is an intergenerational relationship within the family. People
have an emotional need for children, feel affection for their children and want to
give them opportunities.
• Social esteem. Family is regarded as an important social good and having
children is regarded as important, socially.
• Comfort. Children can be regarded as a support structure to parents in old age
Of the three motivations, comfort displays the greatest cross-country variation. Its
prevalence in certain countries is ascribed to low income and education levels in
such countries, as well as the absence of social security systems. South Africa is
among the countries where comfort is found to be the most prevalent reason. The
importance of “comfort” is given some support by the focus group findings. This
theoretical “return” on investing in education (support from children in old age) had
some support in focus group responses:
• “My kids are going to make sure that I am taken care of and I have taken care
of my own parents and I have done that in front of them.” (35-45 year old male)
• “That (education) is an investment because this child will improve the status of
the family, and be of help” (60+ female)
• “God will give me one to look after me”.
• “I will make sure that my kids will take care of me” (males, 35-45 years)
However, conclusions from the focus groups was that this was overall not
unambiguously regarded as way of providing for old age, for reasons outlined
below.
The obligation to continue to be able to provide for the family even in old age
seems stronger than the right to support from the family. While many focus group
participants expressed the expectation that their children will provide for them in old
age, they at the same time expressed an unwillingness to be a burden to their
family. Focus groups revealed a preference for independence in old age, coupled
with a desire to be able to support grandchildren if necessary.
39
• Male and female respondents aged 35-45 alike indicated that the SOAG is
used for basic needs, to buy groceries, pay rent, pay children’s/ grandchildren’s
school fees, and to take care of “people in the family that are not working”. The
need to pay fees for grandchildren was supported by the responses of females
over the age of 60.
Investment in education should not be seen as a choice. Investment in education is
something which is felt to be a responsibility, something which is incumbent upon
parents to do for their children rather than a choice. The importance of education is
such that the opportunity cost of diverting money away from education and into
saving is simply too high to even feature as an option.
The possibility that possible benefits from investing in a child’s education may
extend to a means of support in old age is therefore largely irrelevant as a factor in
the savings decision, as the cost of education would have been incurred regardless
of the benefits. However, investment in education does contain an implicit savings
element which is recognised and understood by the low income population, and it
is worth exploring this in more detail.
There is a risk element to investing in children. As with any investment, there is a
risk element to investing in your child’s education as a means of providing security
in your old age. It is entirely possible that you will have to continue to support your
child in your own old age, as in South Africa the traditional direction of dependency
in old age (children supporting an elderly parent) may be complicated and is often
reversed. High unemployment and HIV infection rates means that often an elderly
person is obliged to support their unemployed children or orphaned grandchildren,
instead of the other way around. This social phenomenon is partly generated, and
the obligation partially assisted with, by the presence of the SOAG; in many cases
the only income in a household is from the SOAG. This income has to be used to
support all members of the household.
Another risk is that your child will choose not to support you when you can no
longer work. As one focus group participant put it “kids of these days just do not
care”:
• “These kids are selfish once they have their jobs they buy cars and live their
lives” (65+ male)

40
• You must “leave room for disappointment” (male, 50-60 years), because it
“depends on the child’s personality”: while some children “take care of their
parents”, others “don’t even care” (female, 50-60 years); others “want to but
they do not have the means” (female, 60+ years).
• Males aged 65 and above indicated that sometimes: “kids do not care for you”;
“they take you to an old age home”.
• “Sometimes you are left alone because all your children get married then you
become lonely” (female, 35-45)
Investment in education is inflexible and does not support incremental or irregular
savings. The difference between paying government school fees and paying for a
private or semi-private school’s fees is significant. Fees have to be paid at fixed
times and in full. There are few channels available which allow small amounts to be
put towards investment in education. An exception may be a formal savings policy
designed to pay for tertiary education, where savings are accumulated over a
significant period of time and then used as a lump sum payment towards
education. The recently launched Fundisa family of products is designed to meet
this kind of need33
.
Our conclusion is therefore that investment in children is not usually undertaken for
reasons of old age support, and even if this is an objective this is a risky and
unreliable strategy.
4.4.3. CONCLUSION
Based on our analysis, it appears that most voluntary savings products available to
low income savers have features which make them unattractive, whether these are
unfavourable tax treatment, lack of guarantees, high charges, unaffordable
minimum contributions, or inflexibility in contribution or withdrawal. There are
obviously trade-offs between these features. For instance, greater flexibility will
tend to impose higher costs on providers. However the current products on offer do
not seem to offer a package that is attractive to low-income people.
The returns currently available from long-term savings products imply that
significant current expenditure sacrifices would have to be made to save the
equivalent amount to the SOAG using private savings products. Estimates based
33
For more information, please refer to the Fundisa website http://www.fundisa.org.za/

41
on some low-income savings product examples in the market indicate that
someone would need to save at least R200 per month, for 30 years or more in a
standard smoothed bonus fund to achieve an income stream in retirement
equivalent to the SOAG. To put it into perspective: a person like Rebecca in
Section 4.3 would need to spend almost 30% of her monthly income on a savings
product, or more than she spends on rent, to ensure an equivalent starting income
in retirement to the current SOAG34
.
However, with some modifications for risk and savings discipline, unit trusts would
seem to be the least unsuitable vehicles for the segment of the LSM 1-5 market
that has overcome obstacles of behavioral psychology, affordability and other long-
term priorities and is ready to start saving for old age. Such instruments however
require discipline and consistency to achieve acceptable results.
Other savings channels, in particular housing, appear to be valid and important
ways of accumulating assets which may be of use in old age. These are not
currently considered as explicit long term savings vehicles, but our evaluation
points to the possibility that this should change in the minds of policy makers and
private providers.
4.5. APPLICATION OF HURDLES TO LSM1-5
The various hurdles will tend to apply differently to different people in LSM1-5 and
four market segments can be identified. Various LSM groups have different income
and employment profiles, different household structures and different assets and
indebtedness levels. Since optimal savings behaviour for the individual will differ
depending on these features, we identify four broad segments of the market.
Consideration of the hurdles faced by each segment will shed light on what policy
approaches may be beneficial for them.
1. Very low earners – those for whom it is likely to be irrational to save because of
immediate survival priorities or the grant. This segment does not pass any of
the hurdles to private saving. Most of LSM1-5 fall in this group.
34
In the absence of the means test, this could still be rational, as she would ensure an income double that of the
SOAG in retirement by also saving privately. The means test however in effect removes the incentive to top up SOAG
income with private provision.

42
2. Low, irregular earners – those with irregular incomes for whom some saving is
possible, but at a high opportunity cost. Individuals in this segment are just
clearing the affordability hurdle and earning above the level of the SOAG from
time to time, and at other times do not. However current product offerings are
unattractive relative to housing investment for example.
3. Low, regular earners – those with regular incomes for whom some saving is
possible, but still at a relatively high opportunity cost. Individuals in this group
are just clearing the affordability hurdle and earning more than the SOAG.
Again, current formal savings offerings are unattractive.
4. Middle income – those who pass most of the hurdles, except for the tendency
to over-discount old age needs. They are able to save for retirement through
voluntary products, but do not do so. It is likely that only a small proportion of
LSM 5 falls into this group. The current products on offer may be less
unattractive than they are to most members of LSM1-5.
Each of these segments has a corresponding income profile which, for illustrative
purposes, we represent as follows:

43
Figure 11. Illustrative income profiles of the various LSM1-5 market segments.
Source: Genesis Analytics
Figure 11 shows that:
1. Those for whom it is irrational to save will have variable, but generally low
income over their working age, which will plateau to a higher level in old age
due to the SOAG. As Figure 9 on page 24 suggests, at least LSMs1-3 and
probably much of 4 are included in this segment.
2. The second scenario represents irregular periods of somewhat higher working
age income, followed by troughs in income and stabilising at the SOAG level in
old age. For these people, disciplined long-term saving seems difficult given
the irregularity of income and the high opportunity cost of foregoing short-term
income smoothing in favour of long-term saving. These people are likely to sit
in LSMs 4, 5 and above.
3. The third group has a regular yet low income. Such income tends to increase
over the working life of a person. Retirement on only the SOAG therefore
represents a decrease in income at the time of retirement. Nevertheless, the
opportunity cost in working age of saving for old age remains high as incomes
0
1000
2000
3000
4000
5000
6000
20 30 40 50 60 70 80 20 30 40 50 60 70 80 20 30 40 50 60 70 80 20 30 40 50 60 70 80
Monthly
income
Age
1. Very low income
2. Informal, irregular
income
3. Formal, low
income
4. Middle income

44
are still quite low and average income over the person’s working life is unlikely
to be much higher than the SOAG. This is exacerbated by the means test.
These people are also likely to be in LSMs 4, 5 and above.
4. The final group is probably mostly limited to those above LSM5, or at most the
most affluent among LSM5. It is represented by those who earn enough in
working age to save for retirement without making unreasonable sacrifices. For
such individuals the SOAG evidently represents a lower standard of living in
retirement than what they were used to in working age and saving for old age
would therefore make sense (even more so, should the means test be
removed).
It can be argued that the aim of old-age provision is to smooth these income
profiles. In Figure 12, the darker lines indicate the income profiles with some level
of private old age provision during working life, producing an enhanced income in
retirement:

45
Figure 12. The income-smoothing effect of old age saving on the various income profiles.
Source: Genesis Analytics
In the Section 5 below, we consider the policy and product recommendations
applicable to each group.
4.6. CONCLUSION
Long-term savings, and more specifically savings for retirement, are very low
among the LSM1-5 population in South Africa. In economic terms, savings can
almost be regarded as a luxury good rather than a normal good for such
individuals. When they do save, they tend to do so for short-term rather than long-
term goals as there are various hurdles to overcome before being in the position to
rationally weigh up long-term savings alternatives. The implication of these findings
is that the very small voluntary long-term saving market among the poor will likely
stay small regardless of any proposed interventions. This is not a market that can
easily be made to work better for the poor.
The recommendations we develop in the next section are aimed at suggesting
appropriate features of savings vehicles for people in each group. They address
the following issues:
0
1000
2000
3000
4000
5000
6000
20 30 40 50 60 70 80 20 30 40 50 60 70 80 20 30 40 50 60 70 80 20 30 40 50 60 70 80
Monthly income
Age
Verylow
income
Informal, irregular income
Formal, low income Middle income
46
• We argue that the different segments of the LSM1-5 market (and indeed,
higher LSMs) defined above succeed in passing different hurdles. In
developing policy aimed at modifying savings behaviour it is therefore
necessary to take account of the fact that such policy/strategies will have
different impacts on different segments of the target market. Though it is not
possible to tailor policy to specific groups, or even to exactly pin down/measure
such groups, it is important to inform any actions with the understanding that
the target market is not uniform.
• We acknowledge the important role that the SOAG plays and will continue to
play in the lives of the elderly. Any efforts to incentivise or develop the private
voluntary savings market need to be regarded within the broader context of the
proposed national social security system. Some of the recommendations will
therefore also have relevance for the design of this system.
• However, the core mandate of the study is to inform strategies for making the
market work better for the poor. For this purpose, we argue below towards
some strategies which could make this market work better. These would
probably be of incremental effect for LSM1-5, since so few people in this
market pass the required hurdles. The recommendations could be of more
relevance for higher LSM individuals, and we discuss them here as they may
be of interest to policymakers concerned about savings at these higher income
levels.
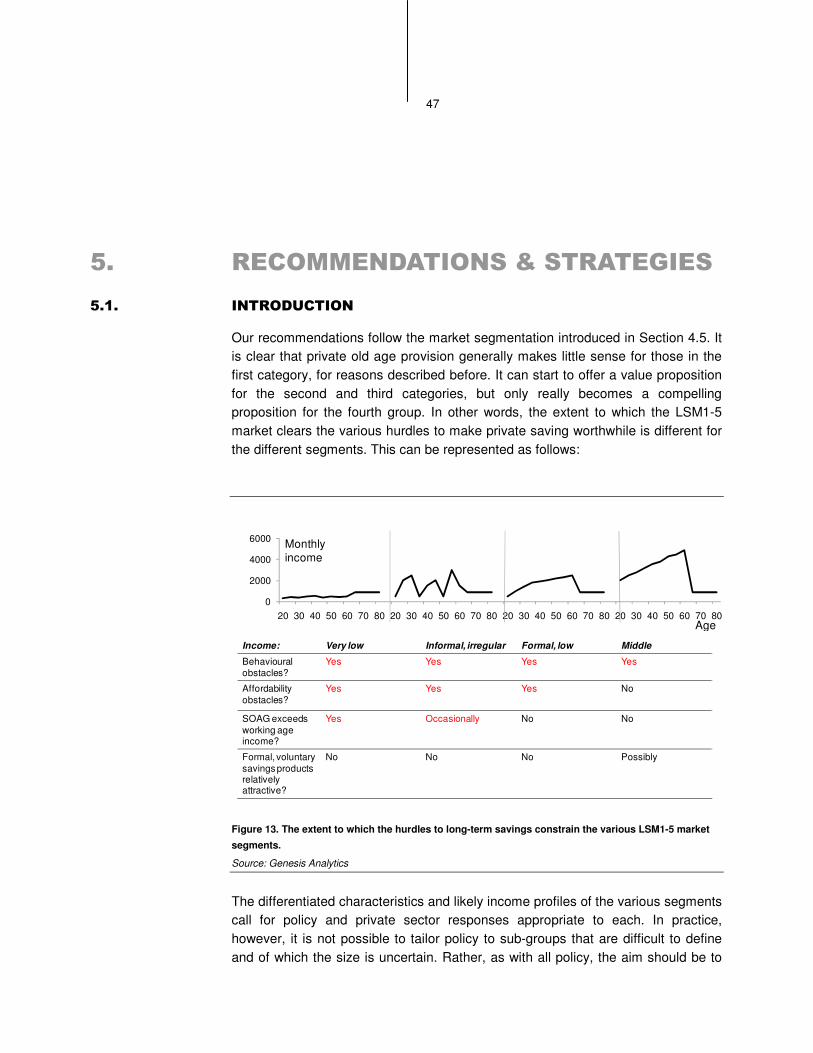
47
5. RECOMMENDATIONS & STRATEGIES
5.1. INTRODUCTION
Our recommendations follow the market segmentation introduced in Section 4.5. It
is clear that private old age provision generally makes little sense for those in the
first category, for reasons described before. It can start to offer a value proposition
for the second and third categories, but only really becomes a compelling
proposition for the fourth group. In other words, the extent to which the LSM1-5
market clears the various hurdles to make private saving worthwhile is different for
the different segments. This can be represented as follows:
Figure 13. The extent to which the hurdles to long-term savings constrain the various LSM1-5 market
segments.
Source: Genesis Analytics
The differentiated characteristics and likely income profiles of the various segments
call for policy and private sector responses appropriate to each. In practice,
however, it is not possible to tailor policy to sub-groups that are difficult to define
and of which the size is uncertain. Rather, as with all policy, the aim should be to
0
2000
4000
6000
20 30 40 50 60 70 80 20 30 40 50 60 70 80 20 30 40 50 60 70 80 20 30 40 50 60 70 80
Monthly income
Age
Income: Very low Informal, irregular Formal, low Middle
Behaviouralobstacles?
Yes Yes Yes Yes
Affordability obstacles?
Yes Yes Yes No
SOAG exceeds working age income?
Yes Occasionally No No
Formal, voluntary savings products relatively attractive?
No No No Possibly

48
design policies/products of general application that nevertheless are appropriate to
each sub-group and create the necessary opportunity for each to save. Policy
makers and private sector practitioners should also have a thorough grasp of the
likely impact of policy/products on various segments of the target market.
Below, we set out the implications that the characteristics of each group hold for
public and private sector recommendations. This forms the basis for a set of
recommendations of general application, but aimed at optimising saving among the
four groups, in Section 5.2.
Very low earners
No compulsion or encouragement to save is likely to have an impact for this group.
It is clear that especially the affordability obstacles facing the first group are
virtually insurmountable. This implies that no specific market-related solution is
likely to achieve take-up. Any attempt at compulsion or incentivisation of long-term
saving is unlikely to work. Such strategies will furthermore face enormous practical
constraints. As these people fall outside of the formal employment net, there is little
means of compulsion (as e.g. a payroll deduction would be). As they furthermore
generally fall outside of the tax net, incentivisation of long-term savings via the tax
system (as is currently the case for higher-income individuals) will have no effect.
The SOAG will remain the most important source of old age income. Should the
means test be abolished,35
it may create the incentive for some in this group to top
up expected SOAG income through private provision, as they will no longer be
penalised for doing so.
Low, irregular earners
Limited long-term saving may be possible on an incentivised, flexible and voluntary
basis. The characteristics of the very low earner group also hold to an extent for
the second group. Here, however, the fact that there is some irregular income may
mean that some savings could be channelled into a longer-term savings vehicle. A
compulsory vehicle (e.g. payroll deductions for a mandatory private or national
pension) would however probably not be applicable since income is not sufficiently
regular or received through a formal channel to support regular, compulsory
35
As the Department of Social Development Discussion Paper indicates, the cost of making the SOAG universal could
be recouped via the reform of the current retirements savings tax incentive applicable to the higher end of the market.

49
payments. The contractually binding nature, relatively penal early withdrawal terms,
and current tax structure36
undermines the value proposition of endowment
products for this market segment. The cost structure of insurance-linked formal
retirement annuity products is likely to make them unsuitable, unless very
innovatively designed with this segment in mind. Tax incentives can also not be
used to encourage saving, as incomes are too low – indeed most of the LSM1-5
population fall outside the tax net.
The characteristics of this group call for specific product features. Flexibility of
contributions will be a prerequisite: should income dry out for a while, a person may
need to cease contributions. A savings vehicle to meet the needs of this group
would therefore have to allow contributions on an as-and-when basis. Flexibility of
withdrawal is also required, so that in case of an emergency someone can access
at least a part of the savings accumulated. Subsidy or incentivisation, as well as
significant investment in marketing and financial education, are likely to be
necessary to overcome the behavioural and affordability hurdles for saving. For
example, those in the vehicle for a sufficiently long time can earn a subsidy or
matching component. Such a subsidy would have to be provided by the state and
would have to pass various other tests such as fiscal affordability, administrative
integrity, etc. People should also be permitted to withdraw at least a portion of
accumulated contributions as needed, though not to withdraw any matched,
subsidised or incentivised amounts. It is likely to be impractical to define
circumstances under which the individual can withdraw from the vehicle, as this will
significantly raise administrative cost and complexity.
It may not be financially sustainable for the private sector to offer products to this
market given the low and irregular contributions. The current minimum lump sums
which it is cost-effective for a provider to accept are unlikely to be accumulated by
people in this group. A public vehicle may produce reduced marketing costs,
relative to a competitive private marketplace for such products. A single public
vehicle is also likely to produce greater economies of scale. Voluntary and
incentivised participation in a large scale national savings system may be
preferable. This does not mean that the private sector should not be allowed to
compete and innovate to produce a product meeting the requirements of this
group. Investigation of banking models serving low-income clients may shed light
on what reductions are possible in terms of the minimum size and frequency of
36
The 30% tax on the fund means that these investments are especially unattractive to those individuals below the
income tax threshold.

50
contributions which are required to make longer term savings products sustainable
in low-income markets.
Low, regular earners
Participation in a long-term savings vehicle possible on an automatic but opt-out
basis. The likely income profile of this group means that they may be in a position
to afford a regular monthly contribution towards old age savings. They are likely to
have a steady though low income. However, saving will still come at a high
opportunity cost to current expenditure and may not be a voluntary priority, due to
more pressing long-term financial commitments such as the education of children
or acquiring a house. Depending on their level of income, number of dependents,
other circumstances and preferences, some may have enough money to save,
others may not. Absolute compulsion is therefore to be avoided. Individuals are
probably best left to judge for themselves - but then sufficient incentives and
financial education need to be provided to offset the behavioural disinclination to
save. Making annual inclusion in a savings vehicle the default, but allowing opt-out
every year, can help use people’s inertia with regard to savings decisions to keep
them in the savings vehicle.
Middle income
Participation in a compulsory long-term savings vehicle possible, as well as flexible
voluntary long-term savings. This group earns enough that, with some caveats (as
explained below), a compulsory contributory vehicle could feasibly be extended to
them. There is little justification for subsidy or incentivisation at this level as
affordability is no longer as much of a hurdle37
. Automatic enrolment with an opt-
out option, as described above, could still be an alternative. People in this segment
would have less incentive to opt out as the contributions would be more affordable
to them than to poorer people. Financial education about the importance of saving
for old age may also help.
Furthermore, this group will pass all previous hurdles and will likely be in a position
to weigh up the pros and cons of voluntary savings products, should such products
37
However, linking eligibility for incentivisation to income implies the application of some kind of means-test, with
associated administrative difficulties. A universal subsidy for savings up to a cap may be a more practical alternative to
achieve roughly the same targeting.

51
have features tailored to their needs. These are discussed further in Section 5.2.2
below where we consider design considerations for private voluntary products.
5.2. RECOMMENDATIONS
Given the unique and overlapping needs of the various groups as described above,
we make the follow set of policy and product design recommendations. These also
need to be evaluated against other criteria, as outlined in Box 2.
Box 2. The importance of evaluating the impact of the recommended actions
The design considerations and recommendations made here are grounded in the study of savings
needs and behaviour of low-income South Africans. They then relate specifically to design features that
meet these needs.
It is important to note, however, that many other criteria will subsequently influence the viability of the
policy decisions and designs recommended here. These criteria should include issues such as the
broader macro-economic effects of savings. Any recommendation involving a degree of state
involvement in provision furthermore needs to be assessed in terms of its fiscal impact. Any compulsory
system is also likely to have an impact on the labour market, and the exact effects in this space need to
be explored and quantified. Of particular importance to existing players in this market are the
institutional questions of relative public and private involvement in provision of savings vehicles. While
important to take these criteria into account in actual policy decisions and design processes, a detailed
assessment of these impacts is beyond the scope of this study. Many of these topics are being explored
in the context of the proposed national social security system.
As we consider each group in turn, outlining its requirements, the constraints it faces and the resulting
recommendations, it is important to keep in mind the criteria above, against which recommendations
eventually have to be tested.
5.2.1. PUBLIC SECTOR RECOMMENDATIONS AND DESIGN CONSIDERATIONS
1. Uphold the SOAG. It will continue to play an important role in old age provision
in the low-income market not able to save for retirement, or for whom working
age personal income is lower than the SOAG.
2. Abolish the means test. In the absence of the means test even the very poor
will at least not face any disincentives to save. Instead, the incentive will exist
to add to SOAG income by private provision for retirement. Abolishing the
means test furthermore ensures that any regressive tax implications, where
retirement savings are in effect taxed where a person is not otherwise eligible
for income tax, are removed.

52
3. Make available a voluntary, long-term, incentivised savings vehicle. Such a
fund would need to allow as-and-when contributions, be flexible in allowing
irregular contributions, and be successful at preserving funds to retirement
while at the same time allowing early withdrawal of some component of
accumulated funds. This fund is aimed at those for whom a compulsory opt-out
system as described below will not be feasible.
As the characteristics of the various groups have shown, affordability and
behavioural factors, as well as the presence of the SOAG, implies that people
will have to be incentivised via a subsidy to join such a fund. The subsidy can
be administered in the form of partly matched amounts deposited in the
person’s fund, rather than cash pay-outs (as applied in the education saving
sphere through the Association of Collective Investments’ Fundisa product). It
is desirable to target any subsidy at those who most need it, though it would be
impractical to administer a means-test to determine eligibility for subsidy. A
practical solution would be to give a rand-for-rand incentive for savings up to a
certain cap or to graduate the subsidy so that it is highest for the first amounts
contributed, and then reduces to zero as the amount being saved increases.
Significant marketing would also be required, and focus groups indicate that
targeting females and emphasising benefits for the whole household could
make these efforts more powerful.
4. Design a savings vehicle based on automatic inclusion, but on an opt-out
basis. For those individuals who are formally employed and have an income
above a certain level, automatic inclusion in a savings vehicle will be feasible,
provided that they are allowed the option to opt out of the system if they wish
or need to. Membership to such a fund would apply for those earning more
than a certain amount (for example the tax threshold, in which case SARS can
administer the premium deductions via the tax system) or who are formally
employed and earn beyond a certain amount (in which case premiums can be
collected via the payroll).
Inclusion in the vehicle could be renewed every year, giving the individual
correspondingly regular opportunities to exercise his/her opt-out option. This
approach deploys a person’s natural inertia to overcome the behavioural
hurdle – assuming that people will be less likely to opt out from automatic
membership, than of their own account to opt into a voluntary fund. It however

53
allows people the flexibility to withdraw from contributing to the vehicle if
affordability becomes a significant problem.
Further work is needed to determine the formal sector income cut-off below
which automatic inclusion may cause more harm than good. It would certainly
need to be substantially above the current SOAG level (of R870 per month).
The current income tax threshold (of around R3600 per month38
) would seem
to represent a practical level. The tax structure of the savings vehicle would
need to be carefully designed not to represent any disincentive or penalty for
saving. A subsidy or incentive up to a cap could usefully apply depending on
the precise income threshold chosen. A further threshold could be set above
which contribution is compulsory (with no opt-out) and no incentives apply.
Automatic inclusion could be arranged through a public vehicle or in
occupational pension arrangements. A public vehicle is likely to achieve
greater economies of scale than a set of private ones. However, many other
considerations will influence the choice between these alternatives. These
include the ability to generate and/or disguise cross-subsidies between groups,
integration with risk benefits provided alongside savings benefits, efficiencies
obtainable through competition in the private sector, etc. These considerations
fall beyond the scope of this project.
5.2.2. DESIGN CONSIDERATIONS FOR PRIVATE, VOLUNTARY, SAVINGS
VEHICLES
While the analysis has shown that improving the functioning of the market in
private, voluntary savings is unlikely to have much impact on saving in LSMs 1-5,
there are nevertheless incremental improvements which can be made. Such
improvements will predominantly benefit the higher LSMs for whom it is more
feasible to use these products. The following design considerations are therefore
worth noting:
• Permit more flexibility in contributions, for example, skipping contributions or
being able to save on an as-and-when basis. This flexibility has come at a
price in the past, though, as it causes administrative expense to the provider.
38
According to the 2007/08 SARS Guide for Tax Rates, Duties and Levies, the 2007/08 tax threshold for people
younger than 65 years is R43,000 per annum. This equates to roughly R3583 per month.

54
• Permit more flexibility in withdrawal of money, to deal with financial
emergencies. This flexibility can also increase costs and can also undermine
the long-term savings goal.
• Low-cost, accessible and trusted distribution of products. The need for trust
and accessible distribution emerged strongly from the focus groups. Emphasis
was placed on branding and marketing. Possible alternative distribution options
include retailer distribution, or the distribution of for example unit trusts through
stokvels, where a proportion of the stokvel pool is invested in a unit trust each
month. This however comes with its own internal trust and administrative
issues.
• Appropriate targeting. A last design feature to take into account is the targeting
of voluntary products within the LSM1-5 market. Focus group research has
shown that, within the household it may be more effective to target the
marketing campaign at females. It is also important to highlight the need for the
product by the household’s welfare, even though the product is sold to one
individual in the household.
5.2.3. HOUSING FINANCING VEHICLES
In addition to these specific savings products recommendations it seems important
to support Pillar 4 provision by facilitating access to housing finance for those who
can afford it. This has proven relevant for all groups.
In this way, savings vehicles can be aligned with individual savings priorities. This
is a matter that FinMark Trust can take up with the private sector, in line with and in
addition to the Financial Sector Charter targets, as well as with government,
advocating for a facilitative regulatory environment.
In particular, innovative products based on saving for housing are lacking in this
market. Traditional mortgage finance products are inaccessible to most of LSM 1-5,
who either do not earn a regular income or whose income is too small to qualify for
a loan (charter targets not withstanding). Whilst there are some housing micro-
finance organisations, these are far from prolific and could play a larger role in
supporting the development of savings products based on housing.

55
Despite the lack of formal products, it is clear that individuals are investing in
housing assets. The strong asset formation and economic use value of these
assets should not be underestimated, and policymakers and the formal sector
should direct their attention to this issue. Although more research needs to be
completed in this area, this study indicates clearly that investment in housing
should perhaps be viewed more as a savings channel than anything else.
Innovative products such as reverse mortgages39
are virtually non-existent in South
Africa, save for the highest end of the market. Products such as these need to be
investigated and an assessment made as to their suitability for the low income
market. Access to housing finance needs to be broadened beyond that envisaged
in the Financial Sector Charter, as many of those in LSM 1-5 will never qualify for
formal mortgage finance. The potential of micro-finance in this arena is significant.
For those in formal employment and who are members of a pension or provident
fund, the possibility of accessing pension backed mortgages exists. (The
mechanics, features and an assessment of this class of loan are discussed in the
Appendix 3). These fully guaranteed loans are only available for housing purposes.
Whilst evidence is that less than 8% of LSM 1-5 belong to a retirement fund, the
proposed national social security system may change this landscape. If a
significant number of people are brought under the umbrella of a state system
which makes provision for pension backed mortgage products, then this could
represent an opportunity to extend housing finance to a portion of the currently
excluded population. A full analysis of the experience in this market would need to
be done to finalise the desirability and features of such an initiative.
39
Simply put, a reverse mortgage is when a bank will provide someone with money based on a guarantee that when
that person passes away the house will be sold and the money re-paid

56
5.3. POSTSCRIPT: THE ROLE OF FINMARK TRUST AND SASI
We note that government is considering savings vehicle design aspects through its
national social security fund process. While FinMark Trust’s historical emphasis
has been on improving private sector markets, it could still play a constructive role
in this process. It can position itself as an independent and mediating voice in a
debate often polarised between private and public sector positions. It understands
well and can represent the financial services needs of low-income people to ensure
that any system design meets these needs (as described above.) And it could push
forward work to look at the further criteria any strategy must satisfy. This will
include the impact on labour markets and institutions, as well as the fiscal impact of
any recommendations.
Given that FinMark Trust’s emphasis is mainly on the functioning of private sector
markets, though, we focus the recommended strategy for FinMark Trust on the
private sector side.
In the recommendations and design considerations above, it was mentioned that
private sector innovations are needed to target products more specifically at the
relevant target markets. How can FinMark catalyse such innovation? This is not an
easy matter. Innovation generally comprises two elements: product innovation
and/or distribution innovation:
Challenges to product innovation. Given the small potential size of the market and
the difficulties faced in designing cost-effective yet flexible products suitable to the
needs of the market, there are few long-term contractual saving products targeted
specifically at the low-income market. The life offices, in recognition of the national
social security fund process and the fact that the largest proportion of this market is
simply better served by government provision (i.e. in access frontier terms fall in
the “market redistribution zone”), have decided not to develop a Charter product for
long-term savings. They have therefore opted to forego the Charter points offered
for such a product rather than overcome the barriers to finding an innovative,
lucrative solution. Nevertheless, there are a few instances where new product
models are being launched, aimed at better serving the middle to lower end of the
market. At this early stage it is not possible to tell whether such efforts are paying
off.
On the collective investment side, the Association of Collective Investments (ACI)
has developed a long-term savings product based on partially matched
57
contributions by the state targeted at the low-income market. It is however, tellingly,
an education savings product rather than one targeted at old age saving. Once
again, it is too early to tell whether significant take-up will be achieved.
It is therefore our recommendation that FinMark should carefully target product
innovation support, if at all, to companies showing an eagerness to tap into the low-
income market, or at the level of the industry association (in providing guidance
and innovation support). It must however be noted that the pay-offs in terms of
more voluntary old age saving are likely to be incremental at most in the target
LSMs.
Challenges to distribution innovation. Distribution innovation entails new ways of
selling products so as to make them more accessible to the target market. The
South African insurance industry has illustrated the potential of distribution
innovation through various initiatives involving retail distribution and even cell
phone distribution of especially funeral insurance. This is a way of reducing the
cost of serving the low-income market, thereby making it a viable market segment.
In the case of micro-insurance, such alternative distribution channels are facilitated
by the prevalence of non-advice based selling. This means that such products are
essentially commoditised and sold “off the shelf” without providing advice to the
customer on their financial needs and the most appropriate product offering. This is
possible due to the inherent demand for and familiarity of the market with e.g.
funeral insurance. Advice-less selling is allowed by regulation, though advice-
based selling is the preferred option highlighted by the Financial Advisory and
Intermediary Services Act (FAIS) of 200240
.
Focus group participants remarked on the need for alternative distribution for
savings products as well:
• “For an example when she goes to Shoprite to buy mealie meal, there must be
something like for instance you can put some money away, something like R20
at the Money market to save, at least it is something” (35-45 year old female)
In the case of long-term savings products, the case for alternative distribution is
however not that clear. This is a market where advice is clearly important, as it
40
For a more detailed discussion, see Genesis Analytics, 2006. The threats and opportunities to insurance
intermediation in South Africa. Available at www.finmarktrust.org.za

58
involves commitment of resources over a long period of time, often with penalties
for early withdrawal or other drawbacks. Products are more complex to understand
than in the micro-insurance market and the value proposition is often (as shown by
the hurdles discussion) less clear upfront. Active selling, entailing detailed verbal
disclosure and advice, is therefore important. This is illustrated by the fact that, to
our knowledge there are currently no examples of distribution innovation in this
market. However, recent developments using sophisticated web-based computer
tools have the potential to make the provision of advice cheaper (though such
initiatives have not yet been extended to the low-income market).
There is no clear recommendation for FinMark Trust in this regard. It can support
initiatives for distribution innovation still aimed at advice-based intermediation and
engage with private sector players and associations in this regard. Most
importantly, it can continue its role as catalyst for change through advocacy and by
raising awareness of the need for greater financial inclusion.
FinMark Trust should engage with government and the private sector on the matter
of housing and education finance products, and possibly commission further work
in these areas as few studies have as yet been undertaken.

59
BIBLIOGRAPHY
Actuarial Society of South Africa. (2003). ASSA 2003 AIDS & Demographic Model .
Retrieved September 25, 2007, from Actuarial Society of South Africa:
http://www.assa.org.za
Alexander Forbes. Member Watch Issue 2: What benefits should retirees expect on
retirement? August 2006. Available at:
http://www.alexanderforbes.com/News/OtherNews/2006/11/F_MWseries_vs2_02A
ug06-5178.pdf (Accessed 11 December 2007)
Asher, A., 2005. Pensions in Africa. Clark and Munnel / The Handbook of
Pensions. Chapter 41, 16.12.2005, pp.816-836
Ashraf, N., Karlan, D. & Yin, W., 2006. Household Decision Making and Savings
Impacts: Further Evidence from a Commitment Savings Product in the Philippines.
Working Paper. May.
Banerjee, A.V. & Duflo, E., 2006. The Economic Lives of the Poor. Massachusetts
Institute of Technology Department of Economics Working Paper Series, Working
Paper 06-29. October.
Bertrand, M., Miller, D., & Mullainathan, S., 2000. Public policy and extended
families: evidence from South Africa. NBER Working Paper, 7594. Available from:
www.nber.org/papers/w7594.
Bertrand, M.,Mullanathan, S. & Miller, D., 2001. Public policy and extended
families: Evidence from South Africa. Working Paper 01-31. March. Massachusetts
Institute of Technology: Cambridge, MA.
Bhorat, H. & Kanbur, R., 2005. Poverty and well-being in post-Apartheid in South
Africa: An overview of data, outcomes and policy. Development Policy Research
Unit (DPRU) Working Paper 05/10. October. Development Policy Research Unit.
Burger, R. & Grobler C., 2007. Have pro-poor health policies improved the
targeting of spending and effective delivery of health care in South Africa?
Development Policy Research Unit (DPRU) Working Paper 07/122. June.
Development Policy Research Unit.

60
Brait Management Co, quoted in “Long term returns”, on Equinox.co.za, Available
at http://www.equinox.co.za/plan/longtermreturns.asp (Accessed 11 December
2007)
Case, A. & Deaton, A., 1998. Large cash transfers to the elderly in South Africa.
Economic Journal. 108: 1330-1361. Blackwell Publishers: UK.
Collins, D., 2005a. Focus note: Stocks and flows – Quantifying the savings of the
poor. Available at: http://www.financialdiaries.com (accessed on 22 November
2007).
Collins, D., 2005b. Focus note: Debt and household finance. Available at:
http://www.financialdiaries.com (accessed on 22 November 2007).
Colllins, 2007. Social security and retirement funding: Perspectives from the
Financial Diaries. Working Draft, September 2007. Cape Town, mimeo.
Cox, D. & Fafchamps, M., 2006. Extended family and kinship networks: Economic
insights and evolutionary directions. Draft paper. Available at:
http://www.economics.ox.ac.uk/members/marcel.fafchamps/homepage/CoxFafcha
mps_FirstDraft.pdf (accessed on 2 November 2007)
Daniels, R., 2001. Consumer indebtedness among urban South African
households: A descriptive overview. Development Policy Research Unit (DPRU)
Working Paper No. 01/55. Development Policy Research Unit: University of Cape
Town.
De Koker, C., de Waal, L. & Vorster, J., 2006. A profile of social security
beneficiaries in South Africa. Volume I. Report prepared for the Department of
Social Development. Datadesk: University of Stellenbosch.
Deaton, A., & Case, A., 1998. Large cash transfers to the elderly in South Africa.
The Economic Journal, 108 (September): 1330-1361.
Deaton, A., 2005. Franco Modigliani and the Life Cycle Theory of Consumption.
Research Program in Development Studies and Center for Health and Wellbeing.
March. Princeton University.

61
Department of Social Development, 2007, Reform of Retirement Provisions:
discussion document. Available at: http://www.dsd.gov.za (accessed October
2007)
Dominitz, J., Manski, C.F. & Heinz, J., 2002. Social security expectations and
retirement savings decisions. NBER Working Paper 8718. Available from:
http://www.nber.org/papers/w8718 (accessed October 2007)
Duflo, E., 2000. Grandmothers and granddaughters: old age pension and intra-
household allocation in South Africa. NBER Working Paper, 8061. Available from:
www.nber.org/papers/w8061.
Edmonds, E., Mammen, K., & Miller, D.L., 2005. Rearranging the family? Income
support and elderly living arrangements in a low-income country. Journal of Human
Resources. XL(1): 186-207.
Financial Diaries, 2005. Findings in brief. Available at:
http://www.financialdiaries.com/files/Findings%20in%20brief.pdf (accessed on 21
November 2007).
Financial Sector Charter, 2003. Transformation Charter as contemplated in the
Broad-based Black Economic Empowerment Act, 53 of 2003.
Financial Services Board, 2003. FAIS Determination of Fit and Proper
Requirements for FSPs, Board Notice 91 of 2003. Available at: www.fsb.co.za
(accessed October 2007).
Financial Services Board, 2007. Proposal for addressing Fit and Proper beyond
2009. Article published on Insurance Times and Investments Online News
(www.itinews.co.za) on 30 May 2007
Green, C.D., 2000. Classics in the history of psychology. A theory of human
motivation: A.H. Maslow (1943). Originally published in Psychological Review, 50:
370-396. Available at: http://psychclassics.yorku.ca/ (Accessed October 2007).
HelpAge International, 2004. Forgotten Families: Supporting older carers of
orphans and vulnerable children. Available at: http://www1.worldbank.org/sp/-

62
safetynets/Training_Events/BBLs/AT%20WB%20paper_3-04.pdf (accessed
December 2007)
Inder, B. & Maitra, P., 2004. Social pensions, migration and household
composition: Evidence from South Africa. April. Draft.
International Social Security Association, 2007. Trends in Social Security. South
Africa: Toward the reform of retirement funds. Available at: http://www.issa.int/-
engl/publ/Trends/1-2007.htm (accessed October 2007)
Jensen, R.T., 2003. Do private transfers ‘displace’ the benefits of public transfers?
Evidence from South Africa? Journal of Public Economics. 88: 89-112.
Keller, S., 2002. Household formation, Poverty and Unemployment – the Case of
Rural Households in South Africa. Stellenbosch: Mimeo.
Leibbrandt, M. & Collins, D.L., 2006. The financial impact of HIV/AIDS on poor
households in South Africa. To be published in the journal AIDS. Forthcoming
LOA, 2006. Consumer Education Article: Retirement Annuities explained. Date: 26
July 2006. Available at: www.loa.co.za (accessed October 2007)
Maitra, P. & Ray, R., 2003. The effect of transfers on household expenditure
patterns and poverty in South Africa. Journal of Economic Development. 71: 23-49.
Makiwane, M., Schneider, M. & Gopane, M., 2004. Experiences and needs of older
persons in Mpumalanga. Report prepared for the Mpumalanga Provincial
Government. Human Sciences Research Council: Pretoria.
Mitchell, O. & Lusardi, A., 2007. Financial Literacy and Retirement Preparedness:
Evidence and Implications for Financial Education. Business Economics,
0007666X, 20070101, Vol. 42, Issue 1 National Treasury, 2007. Social Security
and Retirement Fund Reform. Second Discussion Paper. Released February 2007.
Available at: www.treasury.gov.za (accessed October 2007)
National Treasury, 2007. Social Security and Retirement Reform. Second
Discussion Paper. February. Available from: www.treasury.gov.za (accessed
February 2007).

63
Nauck, B. & Klaus, D., 2007. The varying value of children: Empirical results from
eleven societies in Asia, Africa and Europe. Current Sociology. July. 55(4):487-
503. International Sociological Association.
Packard, T.G., 2002. Pooling, Savings and Prevention: Mitigating the Risk of Old
Age Poverty in Chile. World Bank Policy Research Working Paper 2849, May
2002. Available at: ideas.repec.org/p/wbk/wbrwps/2849.html. Accessed October
2007
PWC, 2005. South Africa: international comparison of insurance taxation. Available
at: www.pwc.com/extweb/pwcpublications.nsf/docid/D0F9B818A9D597F9-
CA25730F0012F17E/$file/southafrica.pdf (accessed October 2007)
RSA, 1956. Pension Funds Act, 24 of 1956. As amended. Available at:
www.jutalaw.co.za (accessed October 2007).
RSA, 1962. Income Tax Act, 58 of 1962, as amended. Available at
www.jutalaw.co.za (accessed October 2007)
RSA, 1998. Grants and financial awards to welfare organisations and to persons in
need of social relief of distress. Published under GN R418 in GG 18771 of 31
March 1998 [with effect from 1 April 1998] under the Social Assistance Act of 1992.
As amended by GN R813 in GG 20235 of 25 June 1999; GN R460 in GG 24630 of
31 March 2003. Section 12.
RSA, 1998. Long-term Insurance Act, 1998. Available at: www.jutalaw.co.za
(accessed October 2007)
RSA, 1998. Regulations to the Long-term Insurance Act (52 of 1998), published as
GN R1492 in GG 19495 of 27 November 1998) ( with effect from 1 January 1999).
Available at: www.jutalaw.co.za (accessed October 2007)
RSA, 2002. Collective Investment Schemes Control Act, 45 of 2002. Available at:
ftp://ftp.fsb.co.za/public/documents/CIS.pdf (accessed December 2007)
RSA, 2002. Financial Advisory and Intermediary Services (FAIS) Act, 37 of 2002.
Available at: www.fsb.co.za (accessed October 2007).

64
RSA, 2004. Social Assistance Act, 13 of 2004. Available at:
www.info.gov.za/gazette/acts/2004/a13-04.pdf (accessed October 2007).
RSA, 2005. Regulations in terms of the social assistance act 13 of 2004. Published
under GN R162 in GG 27316 of 22 February 2005. Available at: www.jutalaw.co.za
(accessed October 2007)
Rusconi, R., 2007. Contractual Savings for Low-Income South Africans: policy
implications.
Rusconi, R., 2004. Costs of saving for retirement: options for South Africa.
Presented at the 2004 Convention of the Actuarial Society of South Africa, October
2004, Cape Town. Available at
http://www.assa.org.za/scripts/file_build.asp?id=100000357 (Accessed 10
December 2007)
Rutherford, S., 2000. The Economics of Poverty: How Poor People Manage Their
Money. Lecture based on Rutherford (1999). Available at: www.ruralfinance.co.uk/-
lesson1.3/resources/Economics_poverty_rutherford.pdf (accessed October 2007).
SARS, 2006. 2006/07 Budget tax proposals. Available at: www.sars.gov.za
(accessed October 2007).
SARS, 2007. 2007/08 Budget tax proposals. Available at: www.sars.gov.za
(accessed October 2007).
SARS, 2007. Annual Tax Deduction Tables, effective from 1 March 2007. Available
at: www.sars.gov.za (accessed October 2007).
SARS, 2007. Guide for Tax Rates, Duties and Levies. Issued Aug 2007. Available
at: www.sars.gov.za (accessed October 2007).
SARS, 2007. Guide on the taxation of lump sum benefits. October 2007
Schulz, T.P., 2005. Demographic determinants of savings: Estimating and
interpreting the aggregate association in Asia. IZA Discussion Paper No. 1479.
January. IZA Bonn: Bonn, Germany.

65
Scobie, G.M., & Gibson, J.K., 2003. Household saving behaviour in New Zealand:
Why do cohorts behave differently? New Zealand Treasury Working Paper, 03/32.
Available from: http://www.treasury.govt.nz/workingpapers/2001/twp01-18.pdf.
Shisaka Development Management Services in association with CSIR Building and
Construction Technology, 2006. Final Report: Small Scale Landlords: Research
findings and recommendations. Available at: ftp.shf.org.za/sl_report1.pdf.
(accessed 11 February 2008).
Sienaert, A., 2007. Migration, remittances and public transfers: Evidence from
South Africa. Discussion Paper 351, University of Oxford Discussion Paper Series.
September.
South African Institute of Race Relations, South Africa Survey , 2007,
http://www.sairr.org.za/wsc/, Accessed on 22 November 2007.
South African Savings Institute, 2006. National Savings Barometer, Quarter 1
2006. Available at: http://www.savingsinstitute.co.za/Barometer%20July%2006.doc
(accessed on 6 December 2007)
Statistics South Africa & National Treasury, 2007. A national poverty line for South
Africa. Discussion document. Available at: www.treasury.gov.za. Accessed
October 2007.
Surtees, 2007. South Africa: Taxation Laws Amendment Bills 2007. 6 July 2007.
Article by Peter Surtees, Deneys Reitz Attorneys. Available at:
http://www.mondaq.com/article.asp?article_id=49962
Taylor Committee, 2002. Committee Report No 8: Poverty, Social Assistance and
the Basic Income Grant. Pp. 275-354. Available at: www.sarpn.org.za/Country-
PovertyPapers/SouthAfrica/taylor/index.php (accessed October 2007)
Temkin, S., 2006. Calls to Release Plans on Pension Funds Tax. Global Aging,
February 7. Available at: http://www.globalaging.org/pension/world/2006/-
taxonpension.htm (accessed October 2007)

66
Theunissen, P., 2001. The equity premium in South Africa. Presented at the
Convention of the Actuarial Society of South Africa on 30 October 2001. Available
at http://www.actuarialsociety.org.za (accessed 11 February 2008.)
United Nations, 2007. World Economic and Social Survey 2007: Development in
an ageing world. Chapter V: Old-age income security. Available at: www.un-
ngls.org/site/article.php3?id_article=296 (accessed October 2007)
Van der Berg, S., & Bredenkamp, C., 2002. Devising Social security interventions
for maximum poverty impact. Stellenbosch: mimeo.
Van der Berg, S., 2005. Fiscal expenditure incidence in South Africa, 1995 and
2000. A Report for the National Treasury. University of Stellenbosch: Cape Town.
Washington University, 2000. Can the poor save? Theory, evidence and questions.
Available at: gwbweb.wustl.edu/csd/Publications/2000/ADDreport2000/Part3.pdf
(accessed October 2007)
Weber, E.U., 2003. Who’s Afraid of a Poor Old-Age? Risk Perception in Risk
Management Decisions. Pension Research Council Working Paper 2003 (8).
Available at: http://prc.wharton.upenn.edu/prc/prc/html. Accessed October 2007
Willmore, L., 2006. Universal Pensions for Developing Countries. International
Institute for Applied Systems Analysis (IIASA), Laxenburg, Austria. Accepted for
publication in World Development. Available at: ideas.repec.org/a/eee/wdevel/-
v35y2007i1p24-51.html. Accessed October 2007
World Bank, 2005. Old Age Income Support in the Twenty-first Century: An
International Perspective on Pension Systems and Reform, written by a World
Bank team lead by Robert Holzmann and Richard Hinz, February 2005
Woolard, I., 2003. Impact of government programmes using administrative data
sets: Social assistance grants. Project 6.2 of the Ten Year Review Research
Programme. Available at: http://www.sarpn.org.za/documents/d0000946/P1041-
Woolard_10year_June2003.pdf (accessed on 2 November 2007).

67
Zhan, M., 2003. Savings Outcomes of single Mothers in Individual Development
Accounts. Center for Social Development Working Paper, No. 03-07. Available
from: http://gwbweb.wustl.edu/csd/Publications/2003/WP03-07.pdf

68
MEETING LIST
Person(s) Organisation Date
John Solomon (Compliance), Theo Scheffler (Client Solutions, product design), Hailey (Marketing), Roland (Marketing), Trevor Susman (Distribution)
African Life 20/11/2007
Karen Meyer Age in Action 30/11/2007
Lia Dowds (Head of Operations: Homeplan)
Alexander Forbes 26/11/2007
Anton Geldenhuys (Sanlam Connect)
Sanlam 06/02/2008
Kathy Nicoleau South African Social Security Agency
01/11/2007
Sid Kaplan LOA Access Committee
29/11/2007
Cedric Bhagaloo (Marketing Manager: Sanlam Skye)
Sanlam 09/11/2007
Liam Monaghan (Product Development Actuary for the Foundation Market)
Old Mutual 20/11/2007
Gerhard Joubert (CEO) and Anna Rosenberg (Deputy CEO – Legal & Policy)
LOA 07/12/2007
Di Turpin (CEO) Association of Collective Investments
27/11/2007
Mientjie Botha (Director: Legislative Tax Design)
National Treasury 12/12/2007
Kecia Rust (Theme Champion: Housing Finance) FinMark Trust 14/11/2007
Motlatsi Gabaocwe National Treasury various
Table 6. Meeting list

69
APPENDIX 1: OVERVIEW OF OLD AGE SAVINGS CHANNELS
INTRODUCTION
In this Appendix, we discuss the various alternatives comprising the old age
provision landscape in South Africa. We do this according to the World Bank “5-
pillar” nomenclature as described in Section 1, with the exception of Pillar 3
(voluntary private products), which was evaluated in Section 4.4:
Table 7. The 5 old age provision pillars applied to the South African context.
Source: Genesis Analytics, based on World Bank (2005)
PILLAR 0
In South Africa, Pillar 0 is represented by the Social Old Age Grant (SOAG). The
SOAG is provided for under the Social Assistance Act, 13 of 2004. As of 1 April
2007, it was increased to R870 per month for females of 60 or older and men aged
65 and up (GN R253 in GG 29726 of 30 March 2007). Married couples may
receive up to twice the monthly individual amount, depending on their combined
income. The grant is subject to a means test, for which the formulae are set out in
Section 12 of “Grants and Financial Awards to Welfare Organisations and to
Pillar Contributory Provider Eligibility Examples
Pillar 0 No State Means test SOAG
Pillar 1 Yes State Compulsory for employed
(impending)
Pillar 2/3 Yes Private Often automatic with employment
Occupational
Pillar 3 Yes Private Voluntary Individual retirement products
Pillar 4 Some Mix N/A Household transfers, housing

70
Persons in Need of Social Relief Of Distress”41
. These formulae are contained in
Box 2:
Box 3. The social old age grant means test formula
12 Determining the amount of social grants
(1) The amount of a social grant shall be determined by the Minister with the concurrence of the Minister of Finance in the case of-
- an unmarried person, according to the formula
D = 1,15A - 0,5B
- a married person, according to the formula
D = 1,075A - 0,5B
where
(i) A = the maximum grant payable per annum as approved;
(ii) B = the annual income of the applicant in the case of an unmarried person, or half the applicant and his or her spouse's annual income in the case of a married person as prescribed in regulation 14(1) after all permissible deductions as prescribed in regulation 15 have been made. Income is taken to include actual income from assets as defined in regulation 14(1)(i);
(iii) D = annual grant amount payable.
(2) The maximum amount referred to in subregulation (1) shall not exceed an amount equal to A.
(3) No grant amounting to less than R100 per month shall be payable.
(4) No grant shall be paid to any unmarried person whose total assets exceed 30 times A, or to any married couple whose total assets exceed 60 times A.
(5) (a) The income of a married person and his or her spouse shall be taken into account when applying the formulae prescribed in subregulation (1), irrespective of whether the couple is married in or out of community of property.
[Reg. 12(5) (a) substituted by GN R704 of 27 July 2001 and by GN R1233 of 23 November 2001]
(b) The Director-General shall, if he or she is convinced that a married applicant was deserted by his or her spouse for a continuous period of at least three months, and the spouse is unable to support the applicant, grant approval for the applicant not to be regarded as a married person and disregard the means of the spouse.
The means test entails that the SOAG is phased out at a rate of 50% of other
income (Asher, 2005). In 2006, the means test implied that married couples with a
combined income of more than R3,126 per month or a single person with an
income of more than R1,686 per month would not be eligible to receive any grant.
Likewise, to have been eligible for a grant a single person may not have had assets
41
First published in the SA Government Gazette 18771 of 31 March 1998 under the Social Assistance Act of 1992 and
subsequently amended.

71
exceeding R295,000 in value (excluding the value of the house in which the person
resides), rising to R561,600 for a married couple42
.
According to the SA Social Security Agency (SASSA), which administers the grant,
the SOAG is the social grant to which the means test is most stringently applied
(versus, for example, the child support grant). As part of the grant application
process, applicants are required to state (and submit proof of) their income and
assets (excluding the house in which they dwell) (Regulation 10(2)(a) under the
Social Assistance Act, 13 of 2004). In practice, this implies that SASSA conducts
basic background checks: applicants are requested to submit three months’ bank
statements and SASSA checks with the deeds office out whether applicants or
their spouses own property and what the rough value of such property is. The
situation is re-evaluated after twelve months, when the means test is re-applied.
Impact on poverty and expenditure43
The current SOAG represents 202% of the proposed national poverty line44
of
R430/month and about 41% of GDP per capita (which is very high for the poor,
given the high Gini coefficient). Research has found that, in the absence of the
grant, 56% of the elderly would be defined as poor while about 39% would be
defined as “ultra-poor”. However, the presence of the grant brings these figures
down to respectively 23% and 2.5% (Woolard, 2003).
It must however be noted that these findings are likely to overstate the impact of
the grant on individual poverty, given that pensioners mostly live in multi-
generational households where they share their resources with the rest of the
household. The Financial Diaries data indicate that, where households receive a
social old age grant, that grant is the main source of income for the household as a
whole. The SOAG contributes as much as 66% of household income and
significantly exceeds the average per capita income in the household, implying that
it is used to subsidise other members of the household. An HSRC survey among
the elderly in Mpumalanga in 2004 found that the SOAG is used to subsidise
household expenditures to such an extent that elderly people have limited
resources available to spend on themselves. Deaton (1998) confirms that the
social pension scheme in South Africa is an effective means of “putting money into
42
http://www.capegateway.gov.za/eng/directories/services/11586/47491 43
Sources: Woolard (2003), Taylor Committee (2002), Keller (2002), Duflo (2000), Case & Deaton (1998) 44
Statistics South Africa & National Treasury (2007)
72
households where children live”. When received by a woman, it has been found
that the SOAG has an impact on child nutritional (anthropometric) status. This does
however not hold true when received by men.
Research has shown that money from the SOAG is spent differently from other
income in household, especially when the SOAG is received by a female – less is
spent on clothing, alcohol and tobacco, and more on education and transportation.
Impact on household structure, migration and labour participation45
To a certain degree, the presence of a consistent income flow targeted at the
elderly has contributed to household formation patterns. Statistics show that 75%
of pension-receiving households are third-generation or skip-generation
households (Case & Deaton, 1998) and that households with pension income tend
to be larger than the average household.
Almost a third of African children under the age of 16 live with a pensioner (Case &
Deaton, 1998) and according to a recent UN survey more than 60% of South
African orphans live with their grandparents. Research has also shown that the
receipt of a pension by a female-headed African household coincides with
increased presence of children (aged 0-5) and women aged 18-25 in the
household, but a decreased presence of prime working aged females (30-39)
(Edmonds, Mammen & Miller, 2005). This could imply that, knowing that the
grandparent has a stable income, a mother may leave her children in the
grandmother’s care while for example going to the city to seek employment. This is
a phenomenon that also extends to male pensions. In this case, however, both
male and female working-age individuals tend to migrate (Inder & Maitra, 2004).
A further finding is that a household member becoming eligible for a SOAG tends
to coincide with a decrease in the labour supply of prime-aged individuals in the
household. This finding, by Bertrand, Mulanaithan & Miller (2001), indicates that
the individual supply of labour may be impacted negatively by the presence of a
stable household income source in the form of a grant. This effect is much more
pronounced, especially among male household members, when the pensioner is
female.
45
Sources: Edmonds, Mammen & Miller (2005), Inder & Maitra (2004), Bertrand, Mullanaithan & Miller (2001), UN
(2007)
73
PILLAR 1
Pillar 1 is still at the proposal stage in South Africa. In recognition of the
inadequacies of the current old age savings system (regarded within the broader
framework of the various pillars of a retirement system), the South African
government is working towards the introduction of a comprehensive social security
system. In his State of the Nation Address of 2007, the President formally
announced the process of social security reform, which has its earliest roots in the
2002 Report of the Committee of Inquiry into a Comprehensive System of Social
Security for South Africa. An inter-ministerial committee has been formed to lead
the process. It is chaired by the Minister of Finance. Other members include the
Ministers of Social Development, Labour, and Health, as well as the Minister in the
Presidency. Progress is indicated by two discussion papers released in 2007, that
of the Department of Social Development, and that of National Treasury.
National Treasury Discussion Paper on Social Security & Retirement Reform
(2007). Given South Africa’s high levels of inequality, unemployment and poverty,
preventing destitution in old age or in case of catastrophic events such as the
death of a breadwinner is an important government goal. Though South Africa has
a sophisticated, tax incentivised private pension sector, private provision appears
to be outside the reach of most of the population. In an attempt to address this
disparity, National Treasury in February 2007 released a discussion paper on
Social Security and Retirement Reform (as a follow up to a first discussion paper
on Retirement Fund Reform that was released in December 2004). It sets out the
main proposals for a comprehensive contributory social security system, as well as
improvements to the private retirement fund industry:
• The intention is that a safety net be provided for those too poor to save by
means of social assistance grants, funded through government revenue, but
with the means test either abolished or the threshold significantly increased so
as not to disadvantage those that do want to save.
• For those with formal employment, it is proposed that it be made mandatory to
save for old age through payroll deductions to a national social security fund
(most probably managed by a government agency) up to an agreed earnings
threshold. The mandatory system is to be supported by a wage subsidy. Such
a subsidy is an attempt to incentivise participation in both formal employment
and the social security system, thereby preventing any distortionary impacts on
the labour market.

74
• Furthermore, additional mandatory contributions to either occupational or
individual retirement fund vehicles are proposed for those above the earnings
threshold and up to a certain monetary ceiling in terms of tax deductibility.
• Supplementary voluntary savings above the mandatory contribution level will
still be encouraged.
It is also proposed that measures be developed to incentivise those outside of the
formal sector to contribute to the national social security fund. It is stated that “the
feasibility of allowing for irregular, voluntary contributions to an individual savings
account within the national social security scheme should be examined”.
Furthermore, “provision for early withdrawal of accumulated voluntary savings may
need to be accommodated to take account of life crises, but with due consideration
for the need to encourage preservation”. There are no concrete proposals on how
to achieve such flexibility yet.
Department of Social Development Reform of Retirement Provisions Discussion
Document (2007). Like its National Treasury counterpart, the Department of Social
Development (DoSD) discussion document proposes the introduction of a
mandatory contributory system in the quest to achieve better coverage of old age
saving among the South African population. It acknowledges the role played by the
SOAG and proposes that the means test be dropped in favour of a universal non-
contributory old age grant. This, it is estimated, will come at an additional fiscal cost
of R9bn, an amount which it is claimed can be funded by reforming the current tax
incentive regime applicable to private retirement provision.
It is furthermore proposed that adequate minimum levels of contributory retirement
provision be ensured. To this end, a mandatory contributory system for individuals
aged 25 or older earning more than the income tax threshold is proposed. Under
such a system, eligible individuals will be compelled to save at least 15% of their
pre-tax income towards retirement. Of this contribution, 50% will potentially be on a
no opt-out, pay-as-you-go defined benefit basis. Over and above the defined
benefit, it is proposed that the remaining 50% be dedicated to a fully funded
defined contribution benefit. It is proposed that a government-sponsored retirement
fund be the default option for the implementation of this system. The employer may
however opt out of the default option in favour of another accredited fund.
Conditions for accreditation may include maximum charge ratios of 15% of the
contribution, as well as governance and other standards.

75
We will not attempt to provide a full analysis of the proposed national social
security system here, as the details have yet to be finalised and both departments
are conducting thorough research and consultation processes. It is sufficient to
note that both of the proposals will entail an expansion of the reach of formal
provision for retirement: at the bottom end via a state old age pension, but also
importantly via a mandatory contributory system for all those in formal employment
(and encouragement for the self-employed and informally employed to also
contribute towards retirement). This is likely to further undermine the value
proposition of private formal sector products, e.g. retirement annuities or
endowment products, for the lower end of the market.
PILLAR 2/3
There is of yet no formal pillar 2 in South Africa. The occupational contribution
aspects of the proposed national social security fund will constitute such a pillar.
However, occupational retirement funds can currently be effectively mandatory for
employees, should the employer have a pension or provident fund. Therefore, even
though no nation-wide mandatory system exists, this part of the market operates as
a quasi-Pillar 2 system, though strictly speaking it is part of Pillar 3.
Before we do that, it is however necessary to consider the regulatory framework
applicable to old age savings provision in South Africa, as this to a large extent
shapes the features of and defines the various retirement savings vehicles.
OVERVIEW OF MAIN LEGISLATION
The history of the South African retirement system dates back to 1928, with the
current law, the Pension Funds Act, being established in 1956 and followed by
numerous amendments (ISSA, 2007). Traditionally, the South African pension fund
industry was dominated by a defined contribution46
system. This was changed to
defined benefits in the 1960s but most funds changed back to a defined
contribution system in the 1980s.
Organisations in the formal sector providing savings for old age may either be:
46
Where each contributor is entitled to his/her own contributions made (plus any investment returns) upon retirement.
In a defined benefit system, on the other hand, each person joining a pension fund is promised a certain benefit upon
retirement, irrespective of the actual investment performance of the fund. Investment risk is therefore shifted from the
individual to the fund.

76
(1) a pension fund organisation, defined under the Pension Fund Acts and further
disaggregated by the Income Tax Act into pension funds, provident funds, or
retirement annuity funds
(2) a long-term insurer selling fund policies (i.e. underwriting pension or provident
funds), fund member policies (to retirement annuity funds), or sinking fund
policies (endowment products) sold directly to the public under the Long-term
Insurance Act
(3) A collective investment scheme (such as a unit trust) in which a retirement
annuity invests
As a rule of thumb, a pension or provident fund is provided through the employer
(via a payroll deduction), with the members of the fund comprised of the employees
(or pools of employees across employers) in a quasi-pillar 2 arrangement.
Retirement annuity funds, on the other hand, as well as endowment savings
products and collective investment schemes, are voluntary savings representing
Pillar 3 in the World Bank framework. A pension fund organisation is member-
based, but the insurer that underwrites it (by selling it a Fund Policy) is a public
company.
Retirement provision is regulated through various pieces of legislation. Together,
this legislation forms the following regulatory scheme:

77
Figure 14. The retirement savings regulatory scheme.
Source: Genesis Analytics, based on various pieces of legislation.
The Financial Sector Charter defines access targets, thereby committing the
private sector to the goal of expanding access to the LSM1-5 market. As the
financial inclusion regulation, it forms the backdrop against which the rest of the
regulatory framework should be regarded.
The two pillars of the scheme are prudential regulation and market conduct
regulation. Both seek to protect consumers, the first by ensuring the financial
soundness of providers, and the second by ensuring that products are sold in an
honest, fair way, with adequate disclosure of information and advice where
required:
• The Long-term Insurance Act and the Pension Funds Act both set prudential
requirements to ensure the stability of the system and the soundness of the
entities providing retirement savings products to their members/policy holders.
The Collective Investment Schemes Control Act does the same for the
management of collective investment schemes.
Market conduct•FAIS Act
•Long-term Insurance Act
regulations
Prudential• Long-term Insurance Act
• Pension Funds Act
• Collective Investment Schemes
Control Act
Institutional and corporate governance regulation•Pension Funds Act
•Long-term Insurance Act
•Collective Investment Schemes Control Act
Financial inclusion policy/regulation: •Financial Sector Charter
Other: Income Tax Act; Social Assistance Act; Treasury & Department of
Social Development discussion papers

78
• The Financial Advisory and Intermediary Services Act (FAIS), as well as the
regulations to the Long-term Insurance Act (which regulates commission
structures and levels in the insurance sphere) define the applicable market
conduct standards and requirements.
The foundation of the regulatory scheme is the institutional legislation governing
which organisations may provide various vehicles, namely: retirement funds
(Pension Funds Act), insurers (Long-term Insurance Act) and collective investment
schemes (Collective Investment Schemes Control Act).
Other legislation not directly part of the regulatory scheme but nevertheless
impacting on it is the Social Assistance Act (discussed as part of the Pillar 0
discussion above), the proposed new national social security system (discussed
under Pillar 1 above) and, importantly, tax legislation via the Income Tax Act. It is
of particular importance in the retirement savings landscape, as it directly impacts
on the incentives (or disincentives) for individuals to save for retirement, as well as
the definition of various retirement savings vehicles.
Below, an overview of each element of the scheme relevant to Pillar 2/3 is
provided.
Financial Sector Charter (2003)
The Financial Sector Charter (FSC) was released on October 17 2003 following
months of negotiation. The LOA, SAIA and the South African Reinsurance Offices’
Association are signatories to the Charter. It is part of the movement towards black
economic empowerment and is a Transformation Charter as contemplated in the
Broad-based BEE Act, 53 of 2003, which is aimed at levelling the playing field
skewed for decades by Apartheid. Though not directly part of the insurance
regulatory framework, the Charter impacts on the insurance market via the
obligations it places on insurers and other entities to serve the low-income market.
Commitment to broadening access to financial services by industry. Under Clause
8 of the Charter, the financial sector commits itself to substantially increase
“effective access to first-order retail financial services to a greater segment of the
population within LSM 1 to 5” This includes the provision of long-term contractual
savings products. The definition of effective access as relevant to long-term-
contractual savings products is:

79
• Physical access in terms of the availability of long-term insurance products and
services, and in terms of proximity or accessibility of financial advisers to
community-based infrastructure;
• a sufficiently wide range of first-order retail financial products and services to
meet first order market needs, which are aimed at and are appropriate for
individuals who fall into LSM 1 to 5;
• non-discriminatory practices;
• appropriate and affordably priced products and services for effective take up by
LSM 1 to 5; and
• structuring and describing financial products and services in a simple and easy
to understand manner.
The targets set for long-term insurance are:
• 23% of the LSM 1-5 adult population have effective access to long-term
insurance products by 2014 (LOA Circular No. 108/2005), which effectively
equates to 4.4m people in LSM 1-5 (FinScope, 2005).
For long-term savings, the target is for:
• 1% of LSM1-5 plus 250,000 to have effective access to formal collective
investment savings products and services. This is defined as: “a first order
basic and secure means of accumulating funds over time, e.g. savings
accounts, contractual savings products such as endowment policies, collective
investments and community-based savings schemes
In order to reach their Charter targets, many insurers have invested in product and
distribution innovation for the low-income market. This has however only to a
limited extent included long-term contractual savings (LTCS) products. In its
Access Interpretation for Life Insurers (LOA, 2005) the industry notes that an LOA
decision was made not to include a savings product in their FSC proposal (and that
the additional 4 Charter points for this product should be forfeited). This decision
was based on the 2004 National Treasury Discussion Paper proposals for the
creation of a National Savings Fund (NSF)47
. There was agreement within the
industry that the NSF would be the best solution for the LSM1-5 market and that
47
The NSF discussion paper has since been replaced by National Treasury’s second discussion paper on social
security and retirement fund reform as discussed above.

80
the life industry on its own could not develop a better savings product. Rather,
industry offered to work with National Treasury in developing the NSF.
The Association of Collective Investments (ACI), on the other hand, has launched a
Charter initiative targeted at the low-income market. This initiative is however not
aimed at old age savings, but rather at education saving, as discussed in Section
4.4.2.
Commitment to consumer education. Clause 8.4 of the Financial Sector Charter
requires all financial institutions to “annually invest a minimum of 0.2% of post tax
operating profits in consumer education.” Though the FSB, through its Consumer
Education Division, has the mandate to educate the market, insurers are now also
required to make a deliberate effort. From an international perspective this is an
interesting precedent and has spurred on efforts to enhance consumer education.
Industry organisations have taken the initiative to design programmes on behalf of
member companies, towards which the members then contribute.
Pension Funds Act, 24 of 1956 (as amended)
The Pension Funds Act allows for the registration of Pension Fund organisations
as juristic persons. No other entity may carry on the business of a pension fund.
The definition of a Pension Fund Organisation, as any association established to
provide annuities or lump sum payments to members upon reaching retirement or
upon death, encompasses pension funds, provident funds and retirement annuity
funds. The distinction between the three types of retirement funds are drawn by the
Income Tax Act (discussed below). The Pension Funds Registrar housed within the
Financial Services Board (FSB) is responsible for the supervision of all retirement
funds.
Various provisions to ensure the soundness of a Pension Fund. Pension Funds
may be required to submit various returns and documents to the Registrar for
monitoring purposes. The Act (S.15) also contains detailed provisions for how any
current and future surplus funds are to be apportioned. Each Fund must undergo a
valuation of its financial condition at least once every three years, to be submitted
to the Registrar (S.16(1)). It contains detailed provisions on how investments
should be made and what categories of investment are allowed. It furthermore
provides formulae for the calculation of the member’s individual account, minimum
individual reserve and minimum pension increase (S.14B). S.26 grants the

81
Registrar the power to intervene in the management of the Fund, should it be in the
interests of the members, and to change its Rules.
Third party administration and underwriting. A pension fund may be administered
by a third party approved by the Registrar (S.13B). A Fund may furthermore be
underwritten by an administrating insurer (which, in turn, will be subject to the
requirements of the Long-term Insurance Act). Private (not-underwritten) funds are
allowed to invest in any assets and must submit audited returns to the FSB.
Underwritten funds, on the other hand, are only allowed to invest in insurance
policies, such that their assets consist entirely of claims against one or more
insurers and the payment of benefits are made solely by such insurers.
Traditionally, underwritten funds were exempt from submitting audited returns to
the Pension Funds Registrar, as they were effectively regulated by the insurance
division of the FSB. This exemption has now been revoked and underwritten funds
are also required to submit audited results, although many have not yet done so.
Governance requirements. The Act contains various provisions relating to the
governance of Funds. The most important provisions are that all Funds must have
a set of rules and a board of management/trustees of which at least 50% is
comprised of members (S.7(a)(1)). An application for registration as a Pension
Fund must be accompanied by the Rules of the Fund, to be agreed by the
members. Amongst others, the rules must set out the objectives of the Fund, the
membership requirements, how contributions are calculated, the nature and extent
of benefits under different circumstances of retirement and the powers of
investment. It must also stipulate the constitution of the board, the election
procedures for members, voting rights of members, powers of the board, etc.
Furthermore, the Fund (via the Board) must report regularly to members and must
produce audited accounts and, if self-administered, actuarial valuations.
Complaints adjudication. The Office of the Pension Funds Adjudicator is
established by S. 30B of the Pension Funds Act to address complaints lodged
under the Act. The Adjudicator, according to Asher (2005), is a South African
innovation with the intention to empower members who could not use expensive
legal procedures to establish their rights. Hundreds of complaints have been
handled, thereby shifting the balance of power toward members (Asher, 2005).

82
Long-term Insurance Act, 52 of 1998
The retirement fund and long-term insurance industries are closely interlinked.
Most major insurers are active in the retirement funds space through provision of
group risk benefits, administration and investment management to retirement
funds. Underwritten funds hold assets in the form of insurance policies offered by
long term insurers, and these insurers also offer group risk benefits to retirement
funds or groups of employees. Other players in the industry, such as employee
benefits companies or administrators, interact with insurers on a number of levels.
Insurers themselves may also provide retirement annuity policies via their
retirement annuity funds.
Basic provisions. The Long-term Insurance Act, 1998, including the Regulations
passed under the Act and the Policy Holder Protection Rules of 2001 (collectively
referred to here as the Long-term Act) provides for the registration of long-term
insurers and for the control of their activities. No legal entity is allowed to carry on
any kind of long-term insurance business unless he or she is registered with the
Registrar of Long-term Insurance48
and is a public company49
. The Act requires
insurers to register for and report on each category of insurance provided. All long-
term insurers are required to at all times have a statutory actuary and to meet the
necessary capital adequacy requirements (for example, upfront capital of R10m is
required as a prerequisite for registration). Long-term insurers may not enter into
any particular kind of long-term policy unless the statutory actuary is satisfied that
the premiums paid, benefits and other values are actuarially sound.
The interaction between long-term insurance and old age savings. Long-term
insurance business is defined in the Act as the business of undertaking to provide
policy benefits under long-term policies50
. These policies are defined in the Act and
include: assistance policies51
, disability policies, fund policies, health policies, life
policies and sinking fund policies. Three of these categories are relevant for old
age savings:
48
Section 7 of the Long-term Insurance Act. 49
With a limited exception for Friendly Societies. Under Section 9 of the Long-term Act other institutional forms (e.g.
mutual societies) may act as insurers only if an act of parliament has been passed to authorise the specific
organisation to conduct insurance. This is the case for AVBOB. 50
Section 1 (1). 51
defined as life policies for which the benefits paid may not exceed R10,000
83
• A fund policy refers to an insurance policy where a fund (such as a pension
fund or medical scheme) is the policyholder. The policy transfers a portion of
the liabilities of the fund onto the insurer. Professional re-insurers are also
allowed to issue policies directly to funds.
• A sinking fund policy, in turn, is when the insurer conducts the long-term
contractual saving itself. That is, in return for a premium, the insurer
undertakes to provide one or more sums of money on a fixed or determinable
date, independent of a life event. This is essentially a savings policy where a
policyholder is insuring against investment risk, for example an endowment
product.
• Retirement Annuity policies are not classified as fund policies under the Long-
term Act, as the contract relates to each member individually rather than the
fund. Instead, a retirement annuity policy is defined under Part 3 of the
regulations to the Act as a Fund Member Policy, namely an individual policy
for which a fund is the policyholder, but a member is the life insured
Fund policies represent the bulk of insurers’ participation in this market.
Underwritten retirement funds, whose assets consist entirely of claims against an
insurer, hold fund policies from long-term insurers. In 2006, fund policies accounted
for just more than 50% of the total net premiums collected by the long-term
insurance industry, making it the single biggest class of long-term insurance
policies.
Retirement Annuities (RAs). Retirement Annuity Funds are an important part of the
voluntary retirement provision market in South Africa (pillar three). There are two
types of RA funds available to investors: the life linked RA fund or the unit trust
linked RA fund (LOA, 2006). The sponsor of the Fund (either a life insurance
company or a unit trust company) appoints trustees to manage the retirement
annuity, of which at least one must be independent (i.e. not employed by the
sponsor). A retirement annuity is therefore a fund which individuals join as
members. The fund, in turn, buys either an insurance policy from a life insurer (a
fund member policy) or it invests in unit trust funds on the members’ behalf. The
individual can choose the policy or the unit trust funds from the products available
through the particular RA fund. Fund contributions are paid to the insurer as
premiums under the policy or to the unit trust company (LOA, 2006).
Under the long-term insurance regime, the life insurer issues the RA fund with a
policy document, which sets out the term of the policy, the premiums payable, the

84
costs as well as the likely fund value reduction should premium payments be
ceased or reduced, or should the member retire before 55. The fund provides the
member with a certificate of membership, which usually includes a copy of the
policy documents (LOA, 2006).
Collective Investment Schemes Control Act (CISCA), 45 of 2002
CISCA provides for the administration of collective investment schemes such as
unit trusts. All collective investment schemes must be administered by a manager
licensed under CISCA. Such a manager must be a registered company. A
Collective Investment Scheme (CIS) is defined as any scheme inviting two or more
members of the public to invest money or other assets in a portfolio. The investors
must share the risk and the benefit of investment proportional to their interest in the
portfolio/scheme. Administration of a CIS entails any function performed in
connection with a CIS. This includes the management and control of the CIS, the
receipt, payment or investment of money in respect of a CIS, the sale, issue or
cancellation of a participatory interest in a CIS and the giving of advice or
disclosure of information on any of these matters to investors or potential investors.
Various principles apply to the administration of a CIS. The manager must
administer the CIS honestly and fairly, with skill, care and diligence, in the interests
of the investors and the CIS industry at large. The assets of the CIS must be
properly protected. Before entering into a transaction with an investor, the manager
must furthermore disclose the investment objectives of the CIS, how the net asset
value and dealing price are determined, as well as what the charges, risk factors
and distribution of income accruals are. Information that is necessary for the
investor to make an informed decision must be given to the investor timeously and
in a comprehensible manner.
Specific duties placed on CIS managers. It is the duty of the manager to ensure
that there are no conflicts of interest between itself and the investor. A manager
must furthermore maintain adequate financial resources to meet its commitments
and to manage the risks to which its CIS is exposed. It must: organise and control
the CIS in a proper manner; keep proper records; employ adequately trained,
properly supervised staff; have well-defined compliance procedures; maintain an
open and cooperative relationship with the office of the registrar, informing them of
anything that might reasonably be expected to be disclosed; and promote investor
education, either directly or via an association.
85
Governance, prudential and market conduct requirements. All CIS must appoint a
trustee or custodian to ensure compliance and good business practices. In
addition, the manager must appoint an auditor approved by the Registrar, maintain
accounting records, submit financial statements to the registrar, etc. Under
regulation 28 of the pension funds act, investment restrictions are placed on CIS
providing the investment vehicle for a retirement fund. There are also some
stipulations regarding permissible deductions from the portfolio in the form of fees,
charges, etc. Unlike for insurers, no commission regulations have been passed for
collective investment schemes. It is however common practice for unit trusts to pay
advisers an “as and when” commission.
Relevance to retirement savings. Unit trusts themselves are not contractual
savings mechanisms. A member can decide to sell her units in the collective
investment scheme at any time and there are no penalties for irregular payments. It
is simply an investment vehicle in which you invest lump sums or regular
contributions until such time as you wish to withdraw your investment. However,
unit trust products may be designed with term limits or limited withdrawals.
Therefore the CIS instrument lends itself to products designed with a specific goal
in mind. Furthermore, unit trusts/collective investments are one of the ways in
which a retirement annuity fund can invest. As explained in the discussion of the
long-term insurance act, a retirement annuity fund can buy an insurance policy
(thereby guaranteeing the return on the investment) and can then also be
administered by a long-term insurer, or it can be unit trust-linked. In the latter case,
the RA member can often choose from a portfolio of unit trusts in which to invest.
The RA itself may then be provided by the unit trust manager/administrator, or by a
third party administrator that invests in the unit trust on behalf of the RA members.
The RA fund will still have its own rules regarding regular contributions, retirement
age, etc, but the fund invests in a CIS.
There are three advantages to an individual of investing through a retirement
annuity rather than directly in a unit trust:
(i) Up to 15% of income can be deducted from taxable income if
contributed to an RA
(ii) The investment is protected from creditors should the individual be
declared insolvent; and
(iii) The capital cannot be accessed until a person reaches retirement age
(in which case at least 2/3 of the amount must be used to purchase a

86
so-called “life annuity”, which is a post-retirement annuity product that
provides the retiree with a monthly income).
Income Tax Act, 58 of 1962
Tax legislation defines various types of retirement funds. The Income Tax Act
defines pension funds, provident funds and retirement funds within the general
definition of a pension fund organisation as defined under the Pension Funds Act.
The main implication of the Income Tax Act for these various types of old age
saving relates to (i) the way in which benefits may be structured (lump sum vs.
annuity pay-outs); (ii) the level of income tax levied on the organisation; and (iii) the
income tax implications for individuals of saving through the various retirement
savings vehicles.
(i) Benefit structure
A pension fund or an approved52
retirement annuity fund may only pay out up to
one third of the pension benefits as a lump sum, with the remaining two thirds
used to provide a monthly annuity income until the member dies. The Second
Schedule of the Income Tax Act defines a provident fund (vs. other retirement
funds) as a fund for which the rules stipulate that more than one third of the
capitalised value may be paid out as a lump sum upon retirement. Therefore a
provident fund pays out the entire benefit as a cash lump sum when a member
leaves the fund53
. There is a tax incentive to convert the lump sum into an annuity
upon retirement, as lump sums are taxable (annuity payments are also taxable as
part of gross income, but the tax implications are more severe if payment is
received as a lump sum).
(ii) Corporate tax
Corporate tax is levied on long-term insurers but not (any more) on retirement
funds. Long-term insurers are taxed according to the types of funds held: individual
policyholder funds are subject to a corporate income tax rate of 30%, whereas
company policyholder funds are taxed at 29%. Policyholder funds comprised of
administered retirement annuity funds are not taxed (SARS Guide for Tax Rates,
Duties and Levies, 2007).
52
All funds are to be approved by the SARS commissioner. 53
SARS, 2007. Guide on the taxation of lump sum benefits. October 2007.
87
The impact and phase-out of the Retirement Fund Tax. Retirement Fund Tax,
levied on interest, net rental and foreign dividend income of all retirement funds,
was introduced in 1996. Initially set at 17%, it was increased to 25% in 1998,
before reducing to 18% in 200354
. It was a regressive tax, penalising those with
lower income tax rates, as their retirement savings were taxed at a higher rate than
their income would be taxed at. In reaction to these and other concerns, Treasury
in the 2006 budget announced that retirement income taxes would be halved to
9%. In the 2007 Budget, the retirement fund tax was abolished, with effect from 1
March 2007 (SARS, 2007, Tax Proposals released with the Budget).
Therefore retirement funds (including retirement annuities) are not taxed, whereas
insurers are taxed at 30%. Also, Capital Gains Tax does not apply to RA funds
(LOA, 2006), versus the 15% applicable to life insurers in general on investments
held on their capital account (PWC, 2005).
Corporate tax on insurers indirectly places a “tax penalty” on low-income
individuals saving through long-term contractual savings vehicles. The 30% tax
rate on insurers’ policyholder funds is indirectly passed onto policyholders via the
effect on the net return earned on retirement annuity and other long-term
contractual savings products. This implies, once again, a penalty or disincentive for
that part of the population whose personal income tax rate is less than 30%,
especially those who would not otherwise be liable for any income tax. This erodes
the value proposition of such products for the low-income market.
It is not clear to what extent the corporate tax on insurers and the corresponding
reduction in net return is actually taken into account by individuals in making their
savings decision.
(iii) Individual income tax implications
Tax legislation provides a strong incentive via a “tax subsidy” for those saving for
retirement. As contributions to pension, provident or retirement annuity funds are
tax deductible for individuals this in effect represents a “tax subsidy” for those able
to save for retirement. No such subsidy/incentive is available for those falling
outside of the tax net. This subsidy is at a cost of around R28 billion annually to the
fiscus – a benefit that is only reaped by middle and high-income earners
(Department of Social Development, 2007).
54
http://www.globalaging.org/pension/world/2006/taxonpension.htm

88
Both member and employer contributions to pension funds are tax deductible:
• The member may deduct his/her contributions up to the greater of R1,750 or
7.5% of his/her income for the year (Section 11(K) of the Income Tax Act,
1962).
• The employer may deduct additional contributions made by them on behalf of
the member – but if the total percentage exceeds 10% of the member’s
remuneration, the Commissioner may make a call on whether it is excessive
and may limit it to an amount not less than 10% of income (Section 11(l)(ii),
Income Tax Act, 1962). In practice, however, SARS allows employer
contributions of up to 20% towards pension, provident and medical schemes
contributions (National Treasury, 2007).
For provident funds, only employer contributions are tax deductible (Taylor
Committee Report 7, 2002; Section 11(l) of the Income Tax Act, 1962). Generally,
employer contributions of up to 15% of the individual’s income are deducted from
taxable income (with SARS likewise allowing up to 20% in total, including
contributions to a medical scheme).
For retirement annuity funds, an individual’s contributions are tax deductible
annually to a maximum of the greater of (National Treasury, 2007, based on
Section 11(n) of the Income Tax Act)55
:
• 15% of taxable non-retirement funding income or
• R3,500 less allowable pension fund contributions or
• R1,750
Retirement savings are taxed at withdrawal, but certain thresholds and
concessions apply.
Recent changes to lump sum benefit taxation. The Taxation Laws Amendment Act,
8 of 2007 introduced a new way of calculating the taxation on lump sum benefits,
effective as of 1 October 2007. It simplifies the calculation of the taxable portion of
lump sums from pension, provident and retirement annuity funds so as to make
55
RA contributions in excess of the annual tax-deductible amount may be rolled over to the next year (LOA, 2006).

89
them less heavily taxed than thus far (Surtees, 200756
). Under the new
dispensation a person will still be allowed to withdraw one third of any pension or
annuity fund lump sum and use the balance to purchase an annuity, unless the
balance after commuting one third is less than R50,000. In that case, the full
amount may be withdrawn as a lump sum. The reason for this provision is the fact
that the administration costs of buying an annuity with R50,000 or less are such as
to make it uneconomical.
Should the lump sum exceed R75,000, all retirees will be entitled to withdraw one
third (unless it is a provident fund, in which case the full sum may be withdrawn).
Of his lumpsum the first R300,000 will be tax-free. The next R300,000 (from
R300,001 through R600,000) will be subject to a flat 18 per cent tax rate. From
R600,001 to R900,000 a flat tax rate of 27% will be levied. All amounts above
R900,000 are subject to 35% tax (National Treasury, 2007). However, if the person
earned less than the tax threshold in the preceding year, no tax will be deducted
from the lump sum (Surtees, 2007; also see SARS Guide on Taxation of Lump
Sum Benefits, October 2007).
Tax legislation can be regarded as regressive in terms of the taxation of those over
65. Willmore (2006), quoting the findings of the Taylor Commission report of 2002,
argues that the current system is regressive: poor people do not qualify to pay
income tax, or pay very little, yet are in theory “taxed” at 50% on their state old age
pension by the means test. This is however not the case for high-income
individuals. They receive significant tax-related subsidies for saving for old age.
Furthermore, though annuities from pension and retirement annuity funds are
classified under gross income and therefore taxable, pensioners are afforded more
favourable tax treatment in some regards57
(SARS Annual Tax Reduction Tables,
effective from 1 March 2007).
56
In the past, the Second Schedule to the Act contained two linked formulas, A and B, which determined the taxable
portion of lump sums from funds. It was argued that these formulas were unfair to taxpayers at the lower end of the economic spectrum, a situation which the new amendments seek to rectify. This is done by introducing a “retirement fund lump sum benefit” in Section 1 of the Income Tax Act of 1962. A retirement fund lump sum is the aggregate of all lump sum benefits receivable upon retirement or death, minus allowable deductions. Source: Surtees, P. 2007. South Africa: Taxation Laws Amendment Bills 2007. 6 July 2007. Article by Deneys Reitz Attorneys. Available at: http://www.mondaq.com/article.asp?article_id=49962. 57
According to the SARS tax rate tables, an annual income threshold of R69,000 applies for persons over 65 years,
versus the threshold is R43,000 for those under 65 years of age. Income tax is therefore phased in from different
bases. For example, a person under 65 earning R200,000 a year will pay a total of R35,457.15 per year in income tax,
whereas a person over 65 years of age will only pay R30,777.15. Apart from the primary tax rebate of the R7740 in the
2007 financial year, persons over the age of 65 receive an additional rebate of R4680

90
Financial Advisory and Intermediary Services (FAIS) Act, 37 of 2002
The FAIS represents the core of market conduct regulation in the non-bank
financial services industry. Its aim is to protect consumers in the process of
acquiring financial products, to ensure that all relevant details are disclosed to them
and that they do not receive inappropriate or inadequate advice that may lead them
to purchase products not suited to their particular needs. This also extends to
individual retirement (long-term contractual savings) products sold by brokers, such
as retirement annuities.
Only authorised financial service providers allowed to provide intermediate financial
products. The FAIS Act limits the provision of intermediary services (with respect to
the distribution of any financial product – also long-term contractual saving
products) to authorised financial service providers (FSPs) and their
representatives. A representative is classified as any employee, agent or broker of
an FSP whose role is not limited to clerical, administrative, or another service in a
subordinate capacity, in turn defined as services that do not require judgment and
do not lead a client to any specific transaction. In essence, FAIS seeks to ensure
that every person authorised to render financial services to a client is fully qualified
and regarded “fit and proper” to discharge this responsibility, so as to improve the
flow and quality of information in the market and to ensure consumers enjoy full
disclosure and protection from unqualified intermediaries.
Financial service providers and agents must adhere to fit and proper requirements.
The fit and proper requirements (as contained in the FSB’s FAIS Determination of
Fit and Proper Requirements for FSPs, Board Notice 91 of 2003) include honesty
and integrity, but also that an intermediary selling long-term insurance policies
(including retirement annuity policies and all other policies excluding assistance
policies and single premium retirement annuities) must have at least 2 years of
experience or must have completed a relevant SETA learnership. In addition, the
person must have an education of NQF4 or Grade 11 and further education
requirements apply (Column 4). The FSB is currently reviewing the Fit and Proper
Determination under FAIS and, though no decisions have been reached yet, it is
(http://www.sars.gov.za/paye/PAYE%20Media/notice/2007/AS-CRL25%20%20NOTICE%20TO%20USERS%20OF%-
20THE%20STATUTORY%20RATES%20OF%20TAX%202008%20YEAR%20OF%20ASSESSMENT%20-%2023%2-
0February%202007.pdf)

91
likely that there will be a move away from scholastic requirements to a system
focused on training and accreditation examinations58
.
Requirements relating to advice. FAIS also stipulates how advice is to be provided
and structured (including conducting a financial needs analysis for the client),
though it does not prescribe that advice does indeed need to be provided. This
position is clarified in the FSB guidance note on Intermediary Services and
Representatives, where those services not entailing advice are more clearly
defined.
Implications for long-term savings market for the poor. By increasing the regulatory
costs for intermediaries, FAIS may increase the cost of selling products to the low-
income market relative to per-customer revenues. It may therefore lead to a
disincentive by intermediaries to serve this market segment. Alternatively, this may
lead to efforts to serve the market, but as cost-effectively as possible, which would
entail that no advice is provided. As discussed in the Recommendations section,
advice on long-term savings commitments is however important for this segment of
the market. All of this implies that the value proposition of private voluntary long-
term savings products for the low-income market is further undermined.
Commission Regulations (Part 3 of the Regulations to the Long-term
Insurance Act, 1998)
Another aspect of market conduct regulation is the regulation of commissions. As
this determines the remuneration received by intermediaries, it fundamentally
impacts on the incentives for serving clients in the long-term contractual savings
market.
The Pension Funds Act does not contain specific provisions for the payment of
commissions. Rather, an administration fee can be charged by a third party
administrator if the Fund is not self-administered. For an underwritten fund, the
underwriting fee or margin also represents an indirect “group commission”. There is
however no limit placed on such indirect commission by legislation. Section 14 (7)
holds that no commission or fees may be paid when a member decides to transfer
her/his business:
58
According to an FSB article titled “Proposal for addressing Fit and Proper beyond 2009” published on Insurance
Times and Investments Online News (www.itinews.co.za) on 30 May 2007.

92
For Fund and Sinking Fund policies provided by long-term insurers, commission is
governed by the Regulations to the Long-term Act of 1998. The regulations take
the form of a commission cap expressed as a percentage of the annualised
premium payable on the policy.
Maximum commission as percentage of annualised premium under a group scheme or fund policy
Annualised premium ®
7,5 0 -126 500
5,0 126 500 - 218 500
3,0 218 500 - 471 500
2,0 471 500 - 1 380 000
1,0 1 380 000 - Unlimited
Table 8: Normal commission payable on group and fund policies
Source: Regulations to the Long Term Insurance Act
For a retirement annuity policy (as a multiple premium policy which is not a fund or
sinking fund policy), the maximum commission is equal to 3% of the multiple
premium policy (2.1.1, Column 4, of Annexure 1 in Part 3 of the Regulations to the
Long-term Insurance Act, 1998). In addition to the normal commission outlined
above, the regulations also make provision for the payment of a special
commission, which is equal to the lesser of 7.5% of the annual premium or R5000.
This regime of commission capping is unique to South Africa, as most countries
have moved to deregulated commissions coupled with strict disclosure standards
(Rusconi, 2007).
The current regulations furthermore govern the structure of commission payments
and upfront incentive payments are emphasised. Annexure 1 of Part 3 of the
regulations to the Long-term Insurance Act of 1998 holds that 75% of commission
for a retirement annuity policy may be paid at policy inception59
and the remainder
may be paid at the end of the first year of the policy. For other individual long-term
59
Stated as the percentage of the total amount of the premium payable during the premium paying term, calculated as
if the premium payable during the first premium period were payable at that level throughout the premium paying term
of the policy, which commission may be paid and accepted in one or more amounts at the discretion of the long-term
insurer (Section 3.4(1)(b) of the Regulations to the Long-term Insurance Act, 1998

93
policies, the maximum upfront percentage is 85%. No upfront structuring applies to
fund and sinking fund policies, for which the commissions are structured as a
percentage of the annualised premiums as set out in Table 8 above.
There has been some controversy around the level and especially structure of
charges and commissions in individual retirement savings products, underpinned
by a series of rulings by the Pension Ombudsman (Rusconi, 2007) 60
. In reaction,
National Treasury is undertaking a review of the industry with the aim of
establishing revised commission scales and introducing the basis for minimum
early termination values. The first step in this direction was the release in 2006 of
the National Treasury Discussion Paper on Contractual Savings in the Life
Insurance Industry, published in 2006. It proposes a move to a hybrid commission
structure where part of the commission may be paid upfront, but at least half must
be paid over the term of the policy on an as-and-when basis. This is an attempt to
improve early termination values. Furthermore, it proposes that commission
payments be conditional upon ongoing support to policyholders on the part of the
intermediary, as well as disclosure of the relationship with the insurer.
OVERVIEW OF OCCUPATIONAL RETIREMENT FUNDS
As explained, occupational retirement funds are only available to those in formal
employment and cover a very small proportion of the LSM1-5 market. The
proposed national social security scheme will also extend to occupational
retirement provision, potentially making it mandatory for formally employed
individuals to save. The rationale for the revision of the retirement fund system as
contained in the national social security funds proposals relates partly to the
inability of the current system to ensure that the majority of employees are
adequately provided for in retirement.
Net return dependent on investment class. Private occupational funds tend to
deliver real long-term returns of about 5% per annum before tax (Theunissen,
2001). As with most investments, the risk is however that the return will not be as
expected over the period. When invested in lower-risk classes such as bonds and
cash, this risk is removed, though returns also decrease accordingly. Retirement
60
Also see: Rusconi, R (2004) Cost of Saving for Retirement: Options for South Africa, presented to the 2004
Convention of the Actuarial Society of South Africa, October

94
funds are able to lock in higher returns obtained from early equity investment by
shifting to lower risk assets as retirement liabilities mature (Brait, 2007)61
.
Charges erode returns. A comparison of charges between a small sample of
occupational retirement funds shows that large occupational retirement funds have
low charges relative to individual products or small funds:
Table 9. Comparison of charges between different types of occupational funds.
Source: FSB returns 2004; GEPF returns 2005; Genesis calculations; LOA submission on umbrella funds
Some providers are able to charge members as little as R10 per member per
month for administration alone, though the average is closer to R20. For someone
earning R2000 a month, this average administration charge could however amount
to over 10% of the contributions they make into their retirement fund.
Across the occupational pension market, average administration charges are 1-2%
of salary. This can be equivalent to up to 13% of the contribution. In fact, Rusconi
61
Brait Management Co, quoted on Equinox.co.za, 2007
Number of members in fund
Average R cost per member per month
Umbrella DC arrangement
0-20 44.21
20-40 20.07
40-100 15.67
100-500 10.78
>500 8.94
Union-sponsored DC umbrella arrangement
0-20 15.79
20-40 15.79
40-100 15.79
100-500 15.79
>500 15.79
Government Employees Pension Fund 1.3m 17.76
Average fund supervised by FSB - 17.91

95
(2004) finds that total charges including administration, asset management and
consulting costs, amount to between 17% and 27% of contributions.
Apart from high charges relative to contributions, the value proposition of
occupational retirement funds is also undermined by early withdrawal of funds.
Alexander Forbes (2006) finds that average pensionable service at retirement is
about 20 years. This, it is projected, is only sufficient to secure a net replacement
ratio of 28% of income, should pre-retirement age retirement be assumed. In
comparison, 40 years of pensionable service with retirement at 65 would provide a
net replacement ratio of 79% under the same assumptions. The main reason for
this low replacement ratio is non-preservation of benefits – employees tend to cash
in their pensions when leaving an employer instead of transferring their savings to
a new scheme (Alexander Forbes Member Watch, 2008) 62
Withdrawal of benefits from the fund incurs a tax penalty. Added to the tax
disincentive, a retirement asset is designed to have fairly low liquidity and generally
has limited flexibility (Alexander Forbes, 2006). The fact that so many pre-
retirement withdrawals occur despite these factors is therefore of concern.
PILLAR 4
Pillar four is intended to capture all forms of old age provision or support not
included in any of the other pillars – making it difficult to measure. It was
incorporated into the World Bank framework on the realisation that sometimes old
people survive even without income from one of the other pillars and that, in other
cases, Pillar 0 to 3 provision is often not the only source of income/livelihood in old
age. Pillar 4 may include family or community support, as well as non-cash benefits
provided by government to the elderly (for example, free or subsidised medical
care), or even an older person doing odd jobs to add to their income in retirement.
The discussion on education and housing in Section 4.4.2 highlighted the important
role of these two items in the minds and financial priorities of the poor. It was also
indicated that they represent important Pillar 4 elements in South Africa, especially
if it is implicitly regarded as an investment for the future (e.g. if it is expected that
children will better support parents in old age when well educated, or if one will be
able to generate income from a house by renting out a room or a backyard shack).
62
As quoted in a recent Financial Mail cover story: Retirement Undefined. Financial Mail, 8 February 2008. Available
at: http://secure.financialmail.co.za/08/0208/cover/coverstory.htm

96
Housing and education of children are however not the only Pillar 4 mechanisms.
For the purposes of our analysis, we consider the following other activities or
vehicles:
• Investing in children (excluding education, as that was already discussed in
Section 4.4.2), wider family and the community as an implicit means of saving
for old age (based on the expectation of reciprocal support in old age)
• Continued labour force participation as a means of adding to a person’s
livelihood in old age
• Non-cash state benefits to the elderly
Continued part-time labour force participation
Figure 1 (p.7) indicated that labour force participation drops sharply for individuals
older than 60 and even more so once the age of 65 has been reached. However, a
small proportion (less than 5%) of the LSM1-5 population remains economically
active into old age. The broad way in which “employment” is defined in the General
Household Survey (the data on which the figure is based) includes any income
earned from any activity in the past 7 days. This includes part-time and piece-work,
as well any entrepreneurial activity such as selling goods or any other source of
income earned. It is therefore likely that the labour force participation registered for
the elderly represents part-time and informal activities aimed at supplementing
retirement income (for example, renting out a room in a house).
Focus groups confirm that “retired” people in LSM 1-5 sometimes engage in
income-generating activities and odd jobs to support themselves. Such activities
may be discontinued once a person becomes eligible for the SOAG, but the focus
group research indicates that this is not necessarily the case. Males aged 65 and
above indicated that they still have to do odd jobs to supplement their income.
Females in the age groups 50-60 and 60+ indicated that owning property can be
used as an income source, e.g. by running a spaza shop from your house or
renting out a room.
The Financial Diaries also found that Pillar 4 retirement support, though present, is
not the primary source of income. No households were found to sell assets
(livestock) for retirement income; farming income was also not found to play a Pillar
4 role in retirement. Remittances from for example children did contribute between

97
10% and 17% of income, but nowhere was a retired person dependant on
remittances, as most of them received the social old age grant
The conclusion is that some Pillar 4 support is derived from continued economic
activity in old age. However, the majority of the old withdraw entirely from labour
force participation. Any income generated is regarded as supplementary (mostly to
the SOAG) rather than as a major source of income.
Non-cash state benefits
Our finding is that non-cash state benefits provided to the elderly, though available,
once again do not represent a significant Pillar 4 support mechanism in retirement.
This is because many of the elderly are not aware of or do not benefit from such
benefits.
Available research finds that government expenditure is pro-poor (amounts spent
on different income categories or quintiles decrease with a movement up the
income spectrum). Van der Berg (2005) as well as Bhorat & Kanbur (2005) find
that per capita social expenditure (including housing, health, education and social
expenditure63
) increased by between 21% and 38% for the last two deciles (bottom
40% of income spectrum) between 1995 and 2000, while decreasing for the top
two deciles. Likewise, per capita social spending on black people increased by
20%, while decreasing for all other races over the period. 60% of total social
expenditure was allocated to the bottom 40% of the income spectrum in 2000.
In the case of health services, all user fees for clinics were removed in 1996.
Health expenditure is found to be pro-poor. This is however to some extent driven
by the fact that higher-income individuals opt out of the public health sector system.
Furthermore, the poorest quintile does not receive the highest per capita subsidy.
This is indicative of the fact that usage of public health services is not only
dependent on the usage fee, but also on the travel costs and opportunity cost of
going to a clinic/hospital (Burger & Grobler, 2007).
There is no research available that quantifies the total amount received by the
elderly for different government expenditure categories (e.g. schooling, education,
housing, sanitation, healthcare). Focus group research shows that few people are
aware of the free or discounted services to which the elderly are entitled. A few
63
Note that social expenditure will include social assistance through the SOAG.

98
benefit from free water and medical services. Access to the latter is however
undermined by transport costs to reach a clinic or hospital.
Non-cash state benefits, while showing potential to improve the position of the
elderly, therefore appear to be underutilised due to a lack of awareness, as well as
due to physical constraints and the opportunity costs of accessing some services.
Free medical care and other services will remain an important part of Pillar 4
provision, but ways are needed to make it more effective at reaching the target
market.

99
APPENDIX 2: FUNDISA AS A LONG TERM SAVINGS INTRUMENT
FOR EDUCATION
The Fundisa product design launched as a three year pilot project by the
Association of Collective investments in partnership with the Department of
Education towards the end of 2007 is an example of a public-private initiative to
provide a savings product aimed at low income individuals. Stanlib was the first
company to launch a product under this brand – the Standard Bank Fundisa Fund.
Designed to provide a savings vehicle for education, Fundisa allows flexible
contributions towards a specific goal, with government making contributions
depending on how much is contributed by the individual. The high level product
features are64
:
• A minimum investment of R40 per month. No fixed term of contributions (even
once-off contributions are allowed and will be awarded with a bonus as
described below), though longer-term contributions are incentivised through the
bonus subsidy scheme.
• Government rewards savers by topping up their accounts by 25%. Therefore, if
a person commits the minimum amount each month, equivalent to R480 per
year, the account will be topped up to R600 with government’s 25% bonus.
The bonus accrues annually through the life of the product. However, only the
first R2400 saved each year will be eligible for the bonus.
• During the pilot phase, bonuses are awarded on a first-come-first-served basis,
as the total bonus pool is limited.
• An annual fee of 1.25% (excl. VAT) is deducted from the income earned in the
Fundisa Fund. Should a person invest with the assistance of a financial
advisor, the advisor may charge a fee of no more than 1% of the investment.
• Each saver designates a learner whose tertiary education costs will be met, in
full or in part, by their Fundisa fund build-up. More than one saver can name a
single beneficiary, but the bonus per beneficiary cannot exceed the maximum
per year.
64
As described on the Fundisa Fund website: www.fundisa.org. za, and as reported in the Mail & Guardian of 18
January 2008. Available at: http://www.mg.co.za/articlePage.aspx?articleid=331068&area=/the_teacher-
/teacher_features/.

100
• Any South African citizen can open a Fundisa account for the benefit of any
South African learner (not only their own children) and the beneficiary name
may be changed, should the original beneficiary decide no longer to pursue
tertiary education.
• Ultimately, capital is channelled to the college or university attended by the
learner, as long as the institution is covered by the National Student Financial
Aid Scheme. Therefore built up Fundisa funds are not available in cash to the
student.
• The saver may withdraw built-up funds at any time, but then foregoes the 25%
bonus.
• A prerequisite is that the saver must have a Mzanzi or other transaction bank
account. The bonus-subsidy is therefore also used to induce entry into the
banking system.
• Inflows are invested in bank deposits and government bonds. Investors are
sent an annual statement and may monitor unit trust prices in the press.
This kind of innovative product needs to be encouraged and a similar model could
possibly be employed towards other goals such as housing or retirement saving.
More research will be needed on the compatibility of such a product, including the
subsidy, to the retirement savings market, as well as the likely implications thereof.

101
APPENDIX 3: LSM1-5 RESIDENCE
As part of our understanding of the LSM1-5 target market, it is of interest to
compare the LSM1-5 market’s tendency to reside in rural vs. urban areas and how
that differs for working age and retired people. This is of relevance to the
discussion in Section 4.4.2, where we consider the importance of investment in
housing for this market segment.
Figure 15 shows that the LSM 1-5 market (with LSM6 included for comparative
purposes) tends to become more urban, the higher the LSM. Note that this is likely
to reflect an endogeneity problem, as the LSM measure amongst others includes
whether a person resides in an urban or rural area in determining their LSM status.
Figure 15. Rural vs. urban split: working age LSM1-5 population.
Source; FinScope 2006
For the retired LSM1-5 population the picture looks only slightly different, with
especially the bottom three groups showing a greater tendency to retire in rural
areas:
20%
85%
72%
50%
24%
9%
80%
15%
28%
50%
76%
91%
0%
10%
20%
30%
40%
50%
60%
70%
80%
90%
100%
LSM 1 LSM 2 LSM 3 LSM 4 LSM 5 LSM 6
Pe
rcen
tag
e o
f w
ork
ing
ag
e p
op
ula
tio
n liv
ing
in
ru
ral
are
as
% age working age(urban)
% working age (rural)

102
Figure 16. Rural vs. urban split: retired LSM1-5 population.
Source; FinScope 2006
Another aspect to consider is the proportion of LSM1-5 people living in formal vs.
informal dwellings and how that differs between working age and retirement. The
following two figures clearly show the correlation (once again partly through
endogeneity problem) between LSM status and the likelihood of living in a formal
dwelling. There is not much variation between working age and retirement. The
important finding is that, on average, the majority of the LSM1.5 population own
their own formal homes:
100%
92%
81%
50%
39%
2%
8%
19%
50%
61%
98%
0%
10%
20%
30%
40%
50%
60%
70%
80%
90%
100%
LSM 1 LSM 2 LSM 3 LSM 4 LSM 5 LSM 6
Perc
en
tag
e o
f re
tire
d p
op
ula
tio
n th
at liv
es i
n r
ura
l o
r u
rban
are
as
% retired (urban)
% retired(rural)

103
Figure 17. Comparing formal vs. informal dwellings for the retired and working age LSM1-5 market.
Source; FinScope 2006
38%
61%
90%86%
100%100%
62%
39%
10%14%
0%
10%
20%
30%
40%
50%
60%
70%
80%
90%
100%
LSM 1 LSM 2 LSM 3 LSM 4 LSM 5 LSM 6
Pe
rce
nta
ge
of
retire
d p
op
ula
tio
n liv
ing
in
a fo
rmal
or
info
rma
l d
wellin
g
% Retired in a formal dwelling
% Retired in informal dwelling
37%
63%
75%
84%
97%100%
63%
37%
25%
16%
3%
0%
10%
20%
30%
40%
50%
60%
70%
80%
90%
100%
LSM 1 LSM 2 LSM 3 LSM 4 LSM 5 LSM 6
Perc
en
tag
e o
f w
ork
ing
ag
e p
op
ula
tio
n liv
ing
in
a f
orm
al
or
info
rma
l d
we
llin
g
Working age pop. in a formal dwelling
Working age pop. in informal dwelling

104
APPENDIX 3: PENSION BACKED LOANS IN SOUTH AFRICA
The Pensions Funds Act (No. 24 of 1956) allows accumulated retirement savings
to be used as security for a loan, with the condition that the loan has to be used for
housing purposes. This stems from the belief that an investment in a housing asset
is likely to produce a positive return in the long run, as well as having a usage
value which can be realised immediately.
The mechanics of a pension backed loan are illustrated in the diagram below.
__________________________________________________________________
The mechanics of pension backed mortgages
Source: Genesis Analytics, based on industry interviews
As a housing finance vehicle pension backed loans are particularly attractive to
both financial institutions (as they are100% secured) and to the low income
“charter” market (as they are able to access loans which normally they might not
have been granted, especially given other problems evident in the low income
housing market). The Banking Associations unaudited figures indicate that more
Setup
• Retirement fund and employer sign agreement with loan provider• Members of fund can then apply for a loan of up to 80% of their ‘after tax’
accumulated retirement savings
Application process
• Members applying for a loan are subjected to a full affordability check in terms of the NCA
• Documentation proving the loan will be used for housing purposes has to be supplied (quotes etc)
After approval
• If approved, the loan amount is paid over to the member• Re-payments are via a salary deduction directly from the payroll of the
employer• If a member leaves the fund for any reason (death, moves to another
employer) then the outstanding amount on the loan is settled from the members accumulated savings

105
than 200 000 pension backed loans were originated between January 2004 and
September 2007.
The loans granted are generally small, with the Banking Association figures
revealing an average of slightly more than R19 000. Consultation with industry
indicates that these loans are mostly taken up by the Charter target market.
Although there are sometimes mechanisms in place to check whether the loans are
spent as they should, there is a widely held view that often these loans are used for
other purposes.
The National Credit Act is having an effect in this space by raising origination costs.
In terms of the act, a full affordability assessment has to be conducted to prevent
so called ‘reckless lending’. For the first time, applications for pension backed loans
are being rejected due to the negative outcomes of affordability assessments. Prior
to the act, no applications were rejected as the loan was fully guaranteed and
repayments occurred automatically as a payroll deduction.
Pension backed mortgages do not appear to affect the final value of retirement
savings – industry sources estimate very low default rates, with 70 – 80% of loans
settling by themselves. This is partly due to the fact that low income earners in
formal employment (those eligible for pension backed loans) do not change jobs
frequently. This can be a win-win situation, with the borrower ending up with their
full retirement savings and the benefit of the loan.
It is worth noting that very few people in LSM 1-5 have access to retirement funds
Meltzer (2007) estimates fund membership at 8%, although this may be under-
estimation given poor consumer education. In the context of this study therefore,
the pension backed loan does not play a significant role.
Social security reform may change this market significantly if provision is made for
pension backed loans. Given current estimates of expanded coverage, the possible
market will be drastically increased, which may lead to increased availability of this
housing finance vehicle. Whilst it is difficult to comment given the uncertainty
around the exact form of the system, preliminary indications are that pension
backed loans could begin to play a significant role in the housing finance space.
Individuals will be members of the state system throughout their working lives, and
even if employment is variable, the loans should settle through the compulsory
salary deductions for repayments. This will allow both access to housing finance

106
and result in accumulated savings for retirement. This however is an issue which
needs to be explored in some detail before concrete recommendations and
assessments can be made.