Embed Size (px)
Citation preview
health.wa.gov.au
Report on the Food Act 2008 (WA) 1 July 2010 – 30 June 2013
Appendices
Prepared by the WA Department of Health
Contact the Food Unit via:
Address PO Box 8172
PERTH BUSINESS CENTRE WA 6849
Email [email protected]
Phone +61 8 9388 4999
Fax +61 8 9382 8119
Website www.public.health.wa.gov.au
1
Contents
Appendix 1: Map of Kimberley, Pilbara, Midwest and Goldfields enforcement agencies 2
Appendix 2: Map of Wheatbelt, Great Southern and South West enforcement agencies 3
Appendix 3: Map of Metropolitan enforcement agencies 4
Appendix 4: Enforcement agencies by region 5
Appendix 5: 2010/11 proforma 7
Appendix 6: Summary of results from enforcement agencies on Food Act activities for 1 July 2010 to 30 June 2011 9
Appendix 7: 2011/12 proforma 14
Appendix 8: Summary of results from enforcement agencies on Food Act activities for 1 July 2011 to 30 June 2012 16
Appendix 9: 2012/13 Proforma 21
Appendix 10: Summary of results from enforcement agencies on Food Act activities for 1 July 2012 to 30 June 2013 24
Appendix 11: 2013/14 Proforma 30
2
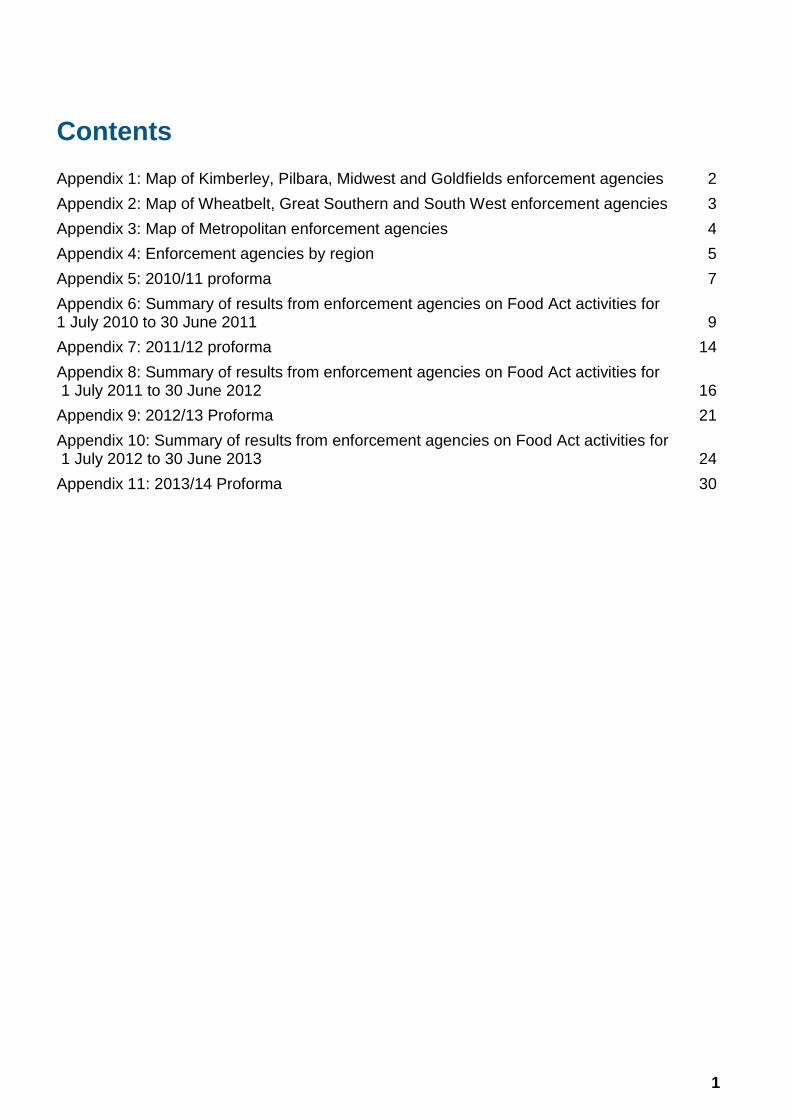
Appendix 1 Map of Kimberley, Pilbara, Midwest and Goldfields enforcement agencies
3
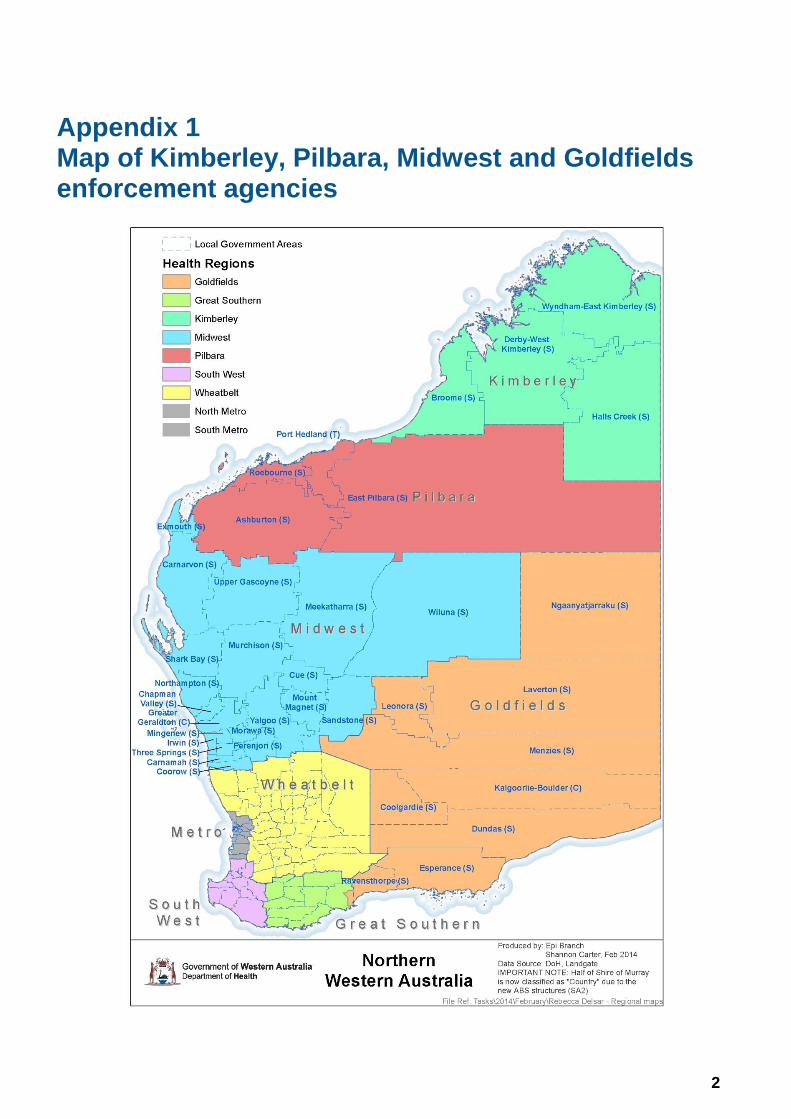
Appendix 2 Map of Wheatbelt, Great Southern and South West enforcement agencies
4
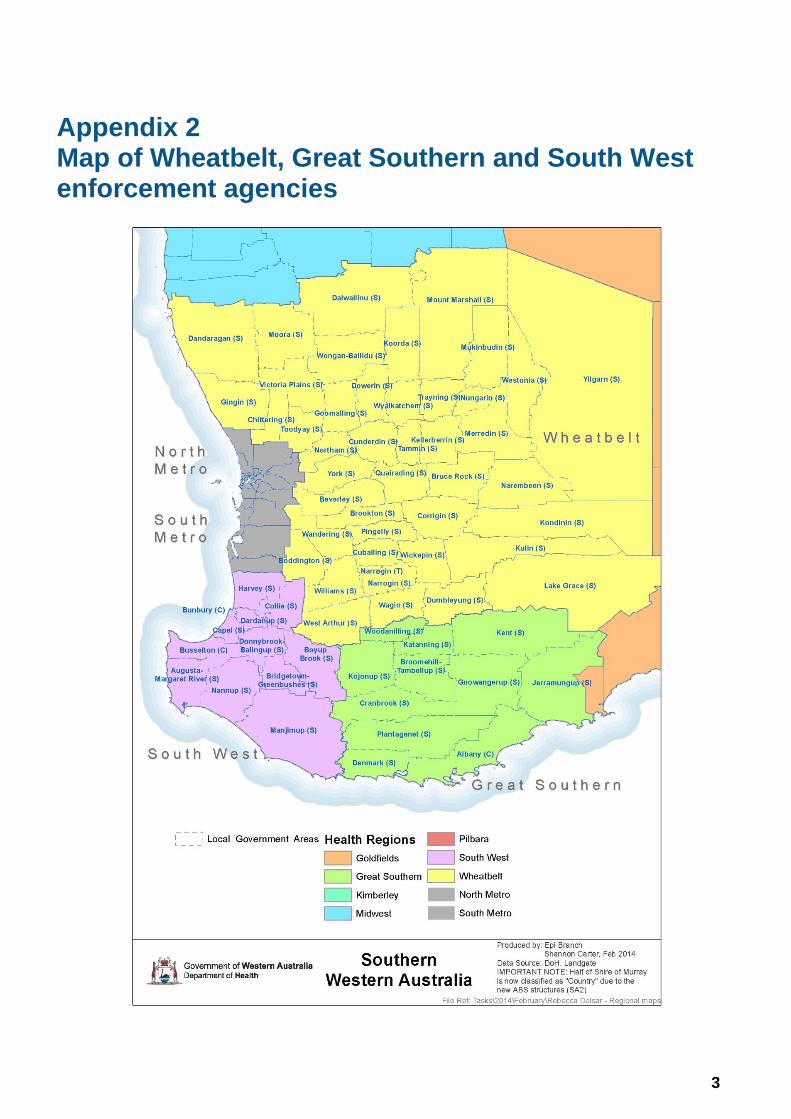
Appendix 3 Map of Metropolitan enforcement agencies
5
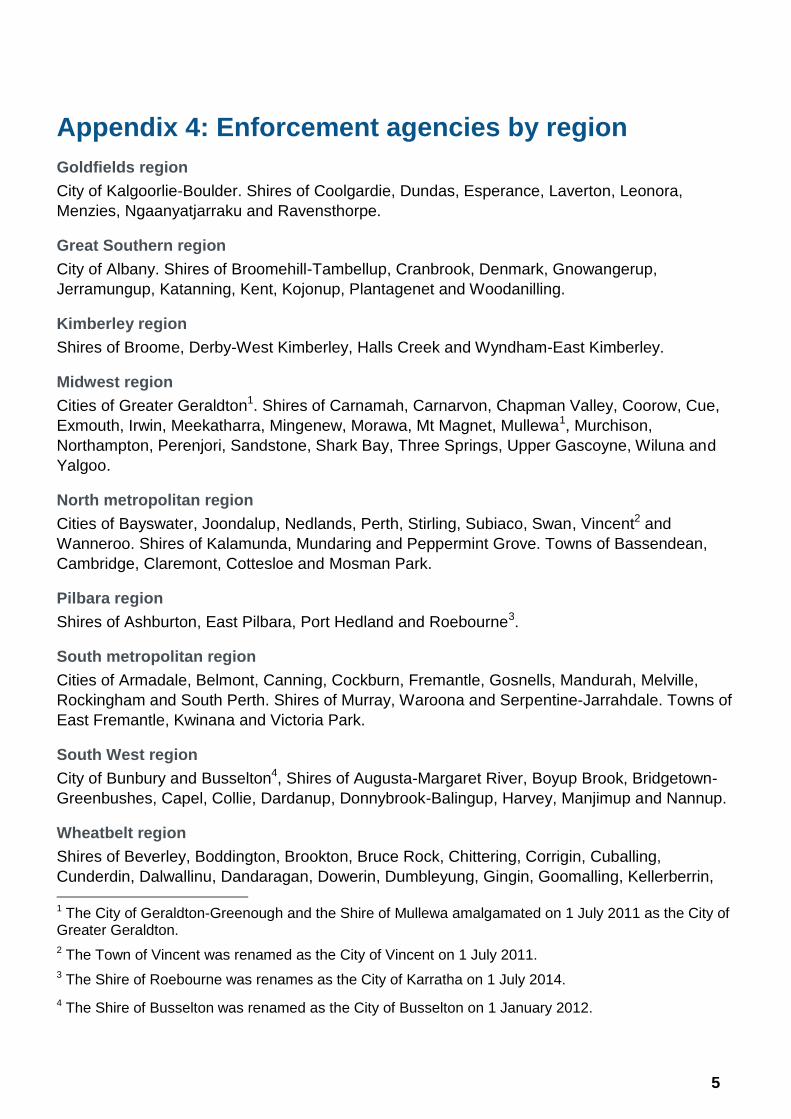
Appendix 4: Enforcement agencies by region
Goldfields region
City of Kalgoorlie-Boulder. Shires of Coolgardie, Dundas, Esperance, Laverton, Leonora,
Menzies, Ngaanyatjarraku and Ravensthorpe.
Great Southern region
City of Albany. Shires of Broomehill-Tambellup, Cranbrook, Denmark, Gnowangerup,
Jerramungup, Katanning, Kent, Kojonup, Plantagenet and Woodanilling.
Kimberley region
Shires of Broome, Derby-West Kimberley, Halls Creek and Wyndham-East Kimberley.
Midwest region
Cities of Greater Geraldton1. Shires of Carnamah, Carnarvon, Chapman Valley, Coorow, Cue,
Exmouth, Irwin, Meekatharra, Mingenew, Morawa, Mt Magnet, Mullewa1, Murchison,
Northampton, Perenjori, Sandstone, Shark Bay, Three Springs, Upper Gascoyne, Wiluna and
Yalgoo.
North metropolitan region
Cities of Bayswater, Joondalup, Nedlands, Perth, Stirling, Subiaco, Swan, Vincent2 and
Wanneroo. Shires of Kalamunda, Mundaring and Peppermint Grove. Towns of Bassendean,
Cambridge, Claremont, Cottesloe and Mosman Park.
Pilbara region
Shires of Ashburton, East Pilbara, Port Hedland and Roebourne3.
South metropolitan region
Cities of Armadale, Belmont, Canning, Cockburn, Fremantle, Gosnells, Mandurah, Melville,
Rockingham and South Perth. Shires of Murray, Waroona and Serpentine-Jarrahdale. Towns of
East Fremantle, Kwinana and Victoria Park.
South West region
City of Bunbury and Busselton4, Shires of Augusta-Margaret River, Boyup Brook, Bridgetown-
Greenbushes, Capel, Collie, Dardanup, Donnybrook-Balingup, Harvey, Manjimup and Nannup.
Wheatbelt region
Shires of Beverley, Boddington, Brookton, Bruce Rock, Chittering, Corrigin, Cuballing,
Cunderdin, Dalwallinu, Dandaragan, Dowerin, Dumbleyung, Gingin, Goomalling, Kellerberrin,
1 The City of Geraldton-Greenough and the Shire of Mullewa amalgamated on 1 July 2011 as the City of Greater Geraldton.
2 The Town of Vincent was renamed as the City of Vincent on 1 July 2011.
3 The Shire of Roebourne was renames as the City of Karratha on 1 July 2014.
4 The Shire of Busselton was renamed as the City of Busselton on 1 January 2012.
6
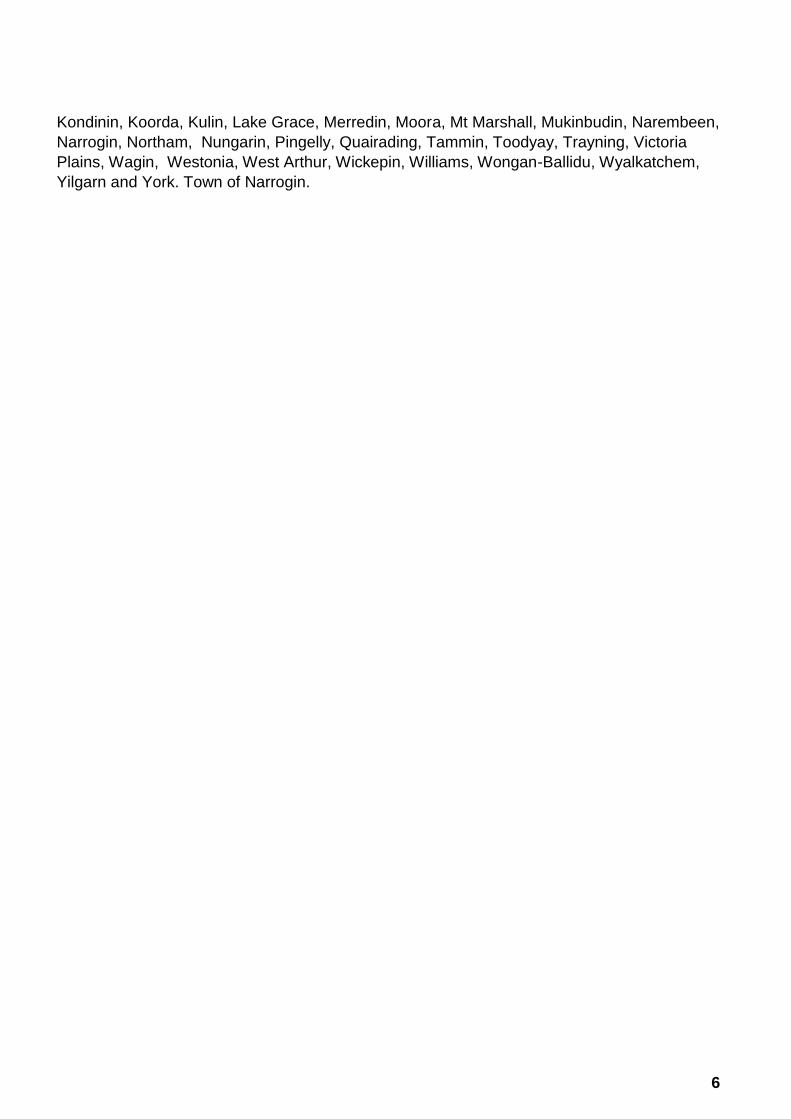
Kondinin, Koorda, Kulin, Lake Grace, Merredin, Moora, Mt Marshall, Mukinbudin, Narembeen,
Narrogin, Northam, Nungarin, Pingelly, Quairading, Tammin, Toodyay, Trayning, Victoria
Plains, Wagin, Westonia, West Arthur, Wickepin, Williams, Wongan-Ballidu, Wyalkatchem,
Yilgarn and York. Town of Narrogin.
7
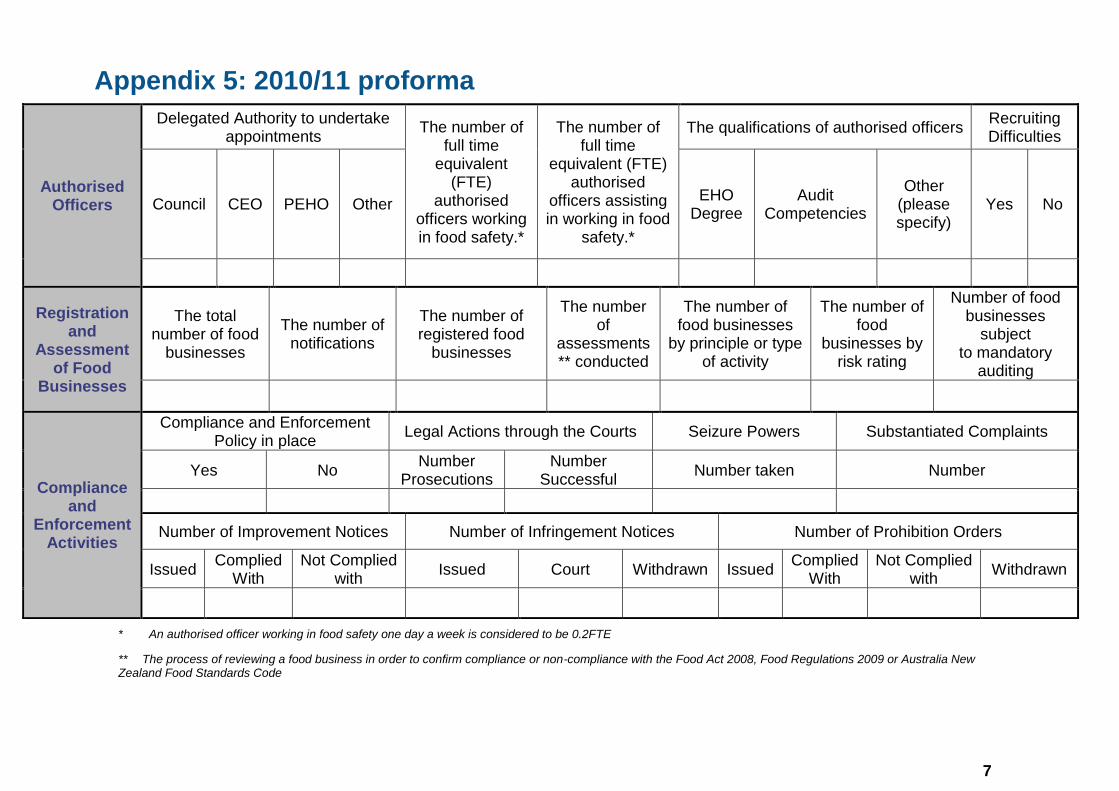
Appendix 5: 2010/11 proforma
Authorised Officers
Delegated Authority to undertake appointments
The number of full time
equivalent (FTE)
authorised officers working in food safety.*
The number of full time
equivalent (FTE) authorised
officers assisting in working in food
safety.*
The qualifications of authorised officers Recruiting Difficulties
Council CEO PEHO Other EHO
Degree Audit
Competencies
Other (please specify)
Yes No
Registration and
Assessment of Food
Businesses
The total number of food
businesses
The number of notifications
The number of registered food
businesses
The number of
assessments** conducted
The number of food businesses
by principle or type of activity
The number of food
businesses by risk rating
Number of food businesses
subject to mandatory
auditing
Compliance and
Enforcement Activities
Compliance and Enforcement Policy in place
Legal Actions through the Courts Seizure Powers Substantiated Complaints
Yes No Number
Prosecutions Number
Successful Number taken Number
Number of Improvement Notices Number of Infringement Notices Number of Prohibition Orders
Issued Complied
With Not Complied
with Issued Court Withdrawn Issued
Complied With
Not Complied with
Withdrawn
* An authorised officer working in food safety one day a week is considered to be 0.2FTE
** The process of reviewing a food business in order to confirm compliance or non-compliance with the Food Act 2008, Food Regulations 2009 or Australia New Zealand Food Standards Code
8
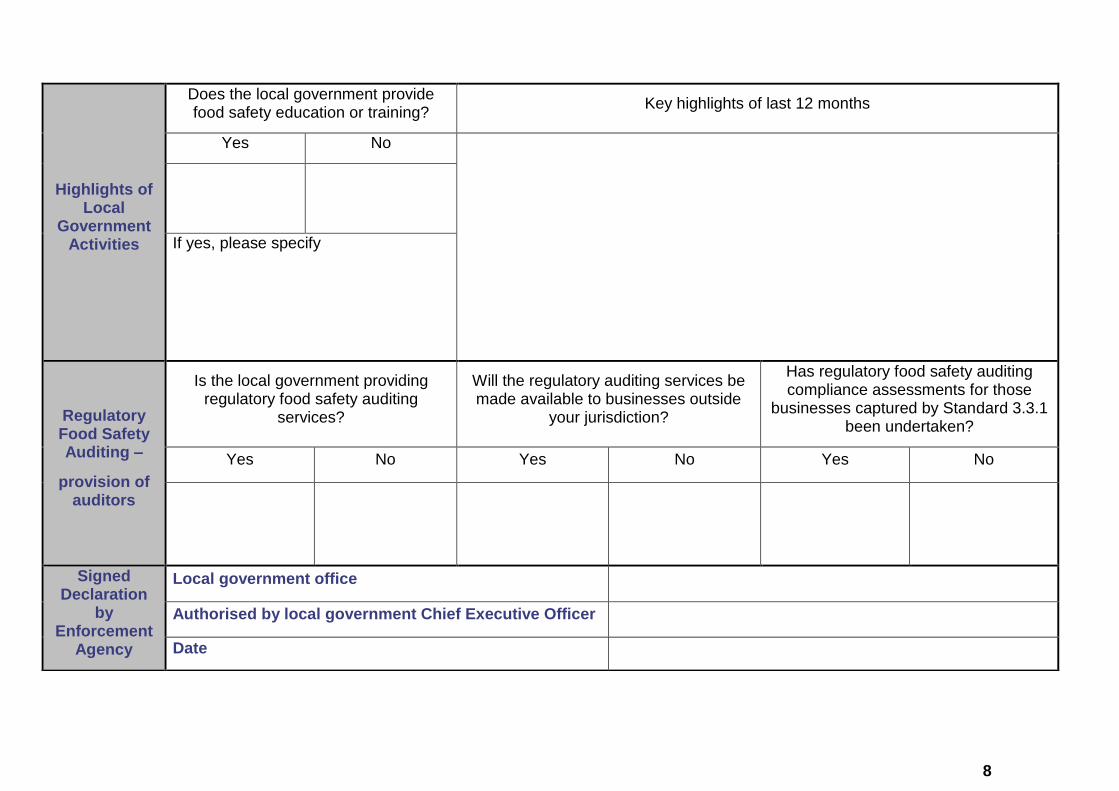
Highlights of Local
Government Activities
Does the local government provide food safety education or training?
Key highlights of last 12 months
Yes No
If yes, please specify
Regulatory Food Safety Auditing –
provision of auditors
Is the local government providing regulatory food safety auditing
services?
Will the regulatory auditing services be made available to businesses outside
your jurisdiction?
Has regulatory food safety auditing compliance assessments for those
businesses captured by Standard 3.3.1 been undertaken?
Yes No Yes No Yes No
Signed Declaration
by Enforcement
Agency
Local government office
Authorised by local government Chief Executive Officer
Date
9
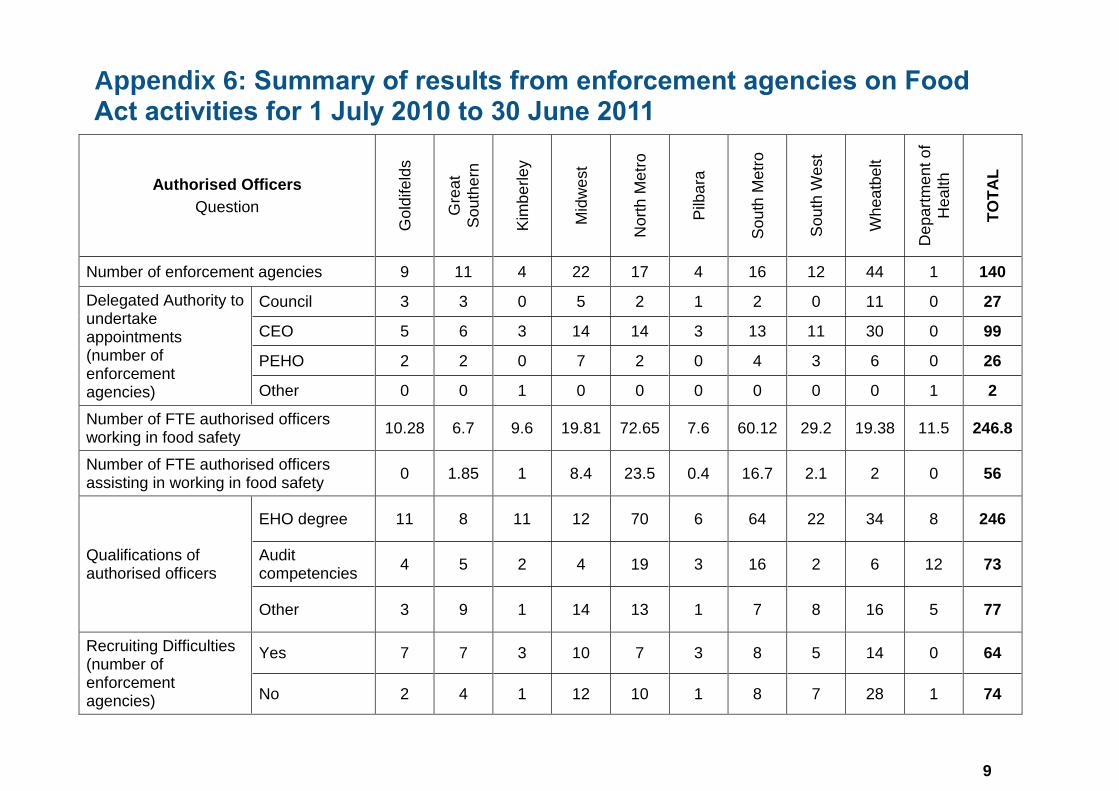
Appendix 6: Summary of results from enforcement agencies on Food Act activities for 1 July 2010 to 30 June 2011
Authorised Officers
Question
Go
ldife
lds
Gre
at
So
uth
ern
Kim
be
rle
y
Mid
we
st
Nort
h M
etr
o
Pilb
ara
So
uth
Metr
o
So
uth
West
Wh
ea
tbe
lt
Dep
art
me
nt o
f
Hea
lth
TO
TA
L
Number of enforcement agencies 9 11 4 22 17 4 16 12 44 1 140
Delegated Authority to undertake appointments (number of enforcement agencies)
Council 3 3 0 5 2 1 2 0 11 0 27
CEO 5 6 3 14 14 3 13 11 30 0 99
PEHO 2 2 0 7 2 0 4 3 6 0 26
Other 0 0 1 0 0 0 0 0 0 1 2
Number of FTE authorised officers working in food safety
10.28 6.7 9.6 19.81 72.65 7.6 60.12 29.2 19.38 11.5 246.8
Number of FTE authorised officers assisting in working in food safety
0 1.85 1 8.4 23.5 0.4 16.7 2.1 2 0 56
Qualifications of authorised officers
EHO degree 11 8 11 12 70 6 64 22 34 8 246
Audit competencies
4 5 2 4 19 3 16 2 6 12 73
Other 3 9 1 14 13 1 7 8 16 5 77
Recruiting Difficulties (number of enforcement agencies)
Yes 7 7 3 10 7 3 8 5 14 0 64
No 2 4 1 12 10 1 8 7 28 1 74
10
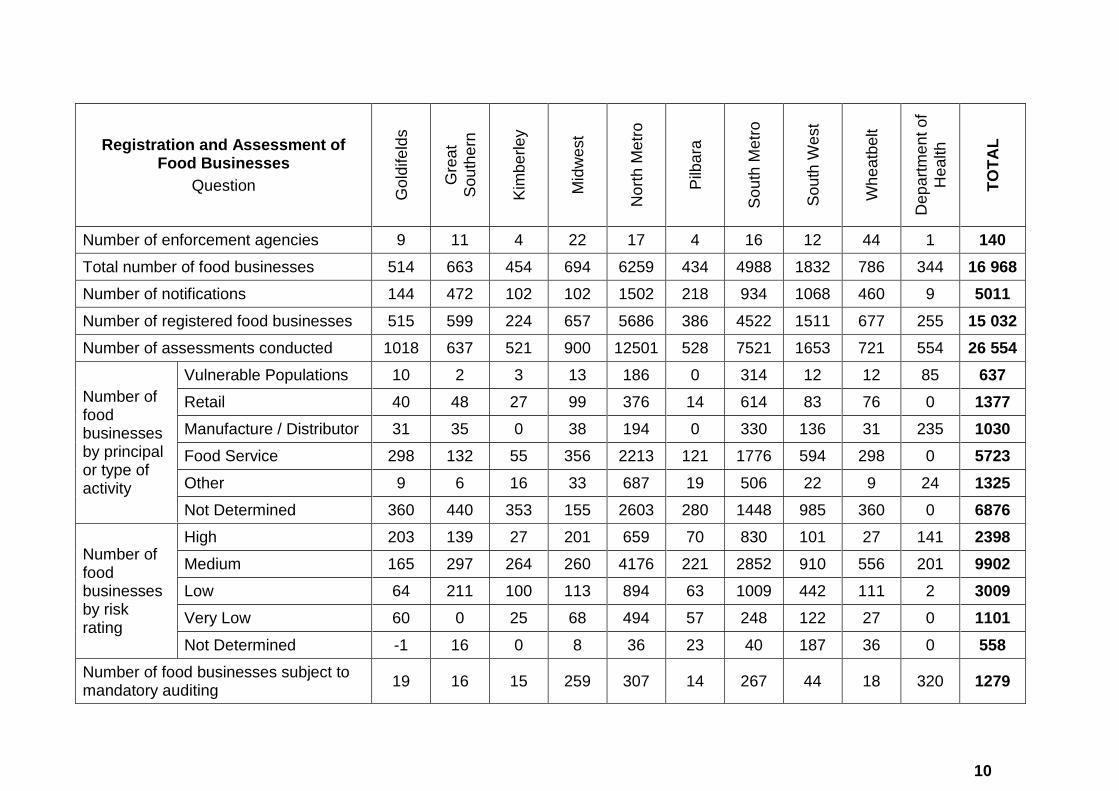
Registration and Assessment of Food Businesses
Question
Go
ldife
lds
Gre
at
So
uth
ern
Kim
be
rle
y
Mid
we
st
Nort
h M
etr
o
Pilb
ara
So
uth
Metr
o
So
uth
West
Wh
ea
tbe
lt
Dep
art
me
nt o
f
Hea
lth
TO
TA
L
Number of enforcement agencies 9 11 4 22 17 4 16 12 44 1 140
Total number of food businesses 514 663 454 694 6259 434 4988 1832 786 344 16 968
Number of notifications 144 472 102 102 1502 218 934 1068 460 9 5011
Number of registered food businesses 515 599 224 657 5686 386 4522 1511 677 255 15 032
Number of assessments conducted 1018 637 521 900 12501 528 7521 1653 721 554 26 554
Number of food businesses by principal or type of activity
Vulnerable Populations 10 2 3 13 186 0 314 12 12 85 637
Retail 40 48 27 99 376 14 614 83 76 0 1377
Manufacture / Distributor 31 35 0 38 194 0 330 136 31 235 1030
Food Service 298 132 55 356 2213 121 1776 594 298 0 5723
Other 9 6 16 33 687 19 506 22 9 24 1325
Not Determined 360 440 353 155 2603 280 1448 985 360 0 6876
Number of food businesses by risk rating
High 203 139 27 201 659 70 830 101 27 141 2398
Medium 165 297 264 260 4176 221 2852 910 556 201 9902
Low 64 211 100 113 894 63 1009 442 111 2 3009
Very Low 60 0 25 68 494 57 248 122 27 0 1101
Not Determined -1 16 0 8 36 23 40 187 36 0 558
Number of food businesses subject to mandatory auditing
19 16 15 259 307 14 267 44 18 320 1279
11
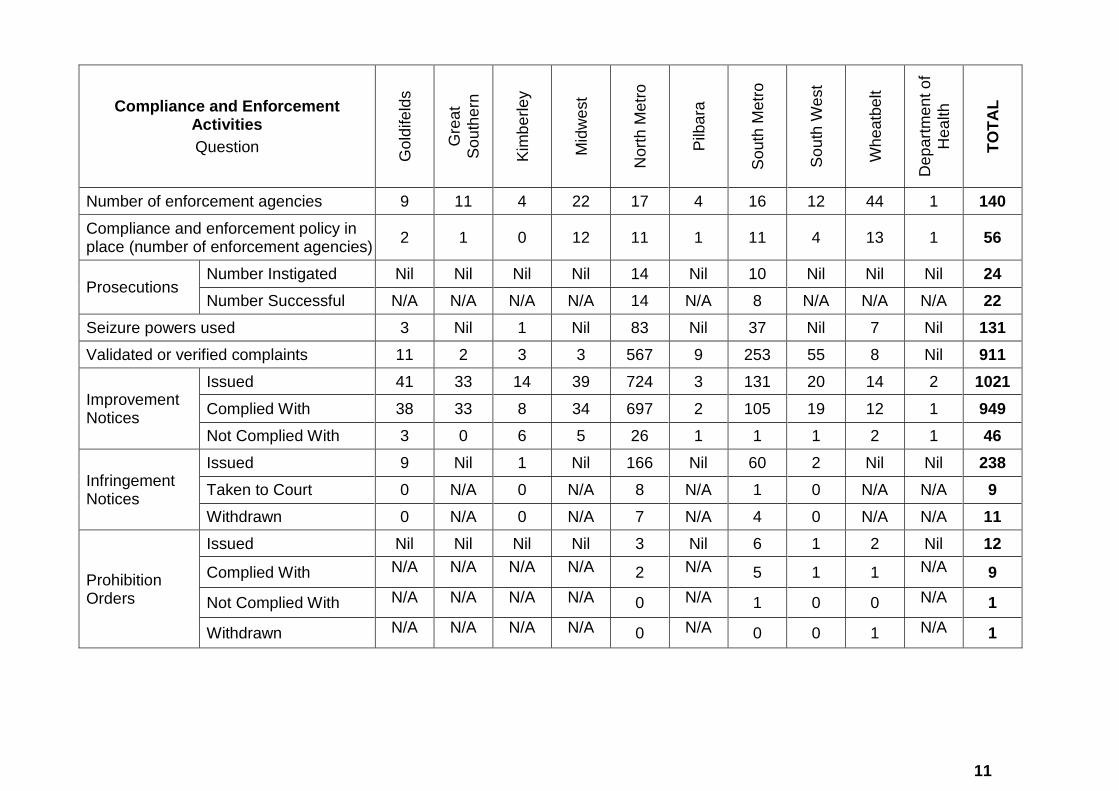
Compliance and Enforcement Activities
Question
Go
ldife
lds
Gre
at
So
uth
ern
Kim
be
rle
y
Mid
we
st
Nort
h M
etr
o
Pilb
ara
So
uth
Me
tro
So
uth
West
Wh
ea
tbe
lt
Dep
art
me
nt o
f
Hea
lth
TO
TA
L
Number of enforcement agencies 9 11 4 22 17 4 16 12 44 1 140
Compliance and enforcement policy in place (number of enforcement agencies)
2 1 0 12 11 1 11 4 13 1 56
Prosecutions Number Instigated Nil Nil Nil Nil 14 Nil 10 Nil Nil Nil 24
Number Successful N/A N/A N/A N/A 14 N/A 8 N/A N/A N/A 22
Seizure powers used 3 Nil 1 Nil 83 Nil 37 Nil 7 Nil 131
Validated or verified complaints 11 2 3 3 567 9 253 55 8 Nil 911
Improvement Notices
Issued 41 33 14 39 724 3 131 20 14 2 1021
Complied With 38 33 8 34 697 2 105 19 12 1 949
Not Complied With 3 0 6 5 26 1 1 1 2 1 46
Infringement Notices
Issued 9 Nil 1 Nil 166 Nil 60 2 Nil Nil 238
Taken to Court 0 N/A 0 N/A 8 N/A 1 0 N/A N/A 9
Withdrawn 0 N/A 0 N/A 7 N/A 4 0 N/A N/A 11
Prohibition Orders
Issued Nil Nil Nil Nil 3 Nil 6 1 2 Nil 12
Complied With N/A N/A N/A N/A 2 N/A 5 1 1 N/A 9
Not Complied With N/A N/A N/A N/A 0 N/A 1 0 0 N/A 1
Withdrawn N/A N/A N/A N/A 0 N/A 0 0 1 N/A 1
12
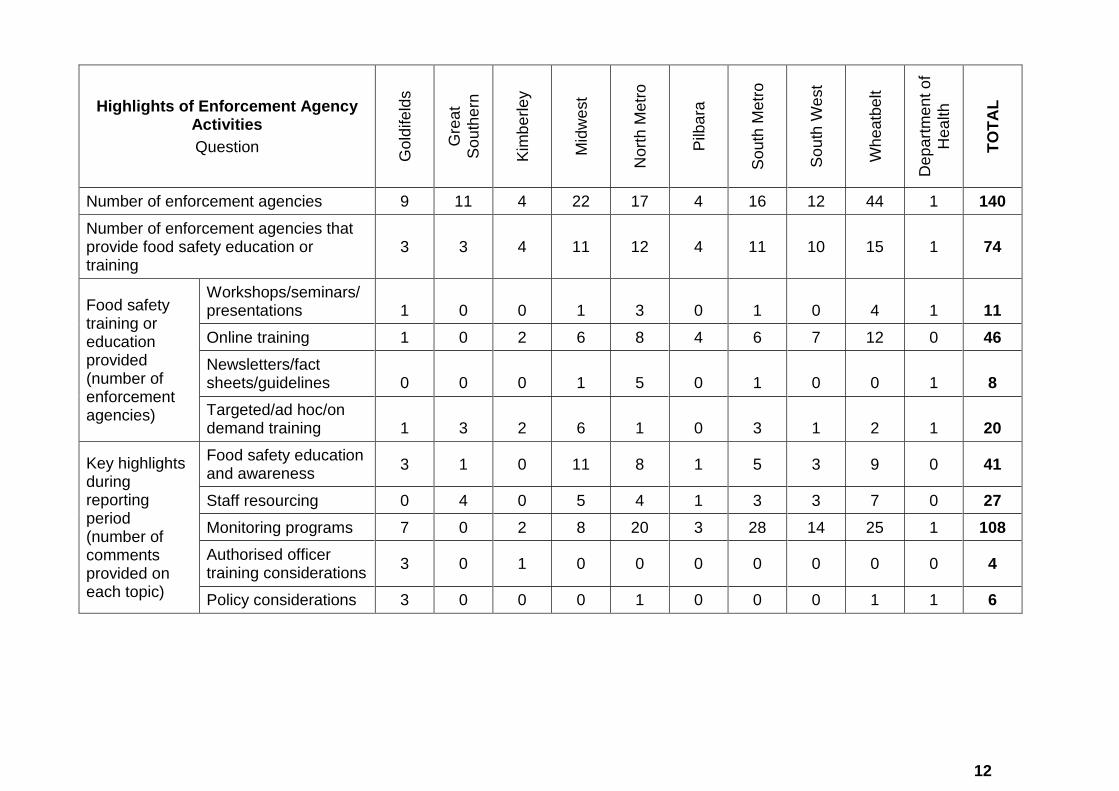
Highlights of Enforcement Agency Activities
Question
Go
ldife
lds
Gre
at
So
uth
ern
Kim
be
rle
y
Mid
we
st
Nort
h M
etr
o
Pilb
ara
So
uth
Me
tro
So
uth
We
st
Wh
ea
tbe
lt
Dep
art
me
nt o
f
Hea
lth
TO
TA
L
Number of enforcement agencies 9 11 4 22 17 4 16 12 44 1 140
Number of enforcement agencies that provide food safety education or training
3 3 4 11 12 4 11 10 15 1 74
Food safety training or education provided (number of enforcement agencies)
Workshops/seminars/presentations 1 0 0 1 3 0 1 0 4 1 11
Online training 1 0 2 6 8 4 6 7 12 0 46
Newsletters/fact sheets/guidelines 0 0 0 1 5 0 1 0 0 1 8
Targeted/ad hoc/on demand training 1 3 2 6 1 0 3 1 2 1 20
Key highlights during reporting period (number of comments provided on each topic)
Food safety education and awareness
3 1 0 11 8 1 5 3 9 0 41
Staff resourcing 0 4 0 5 4 1 3 3 7 0 27
Monitoring programs 7 0 2 8 20 3 28 14 25 1 108
Authorised officer training considerations
3 0 1 0 0 0 0 0 0 0 4
Policy considerations 3 0 0 0 1 0 0 0 1 1 6
13
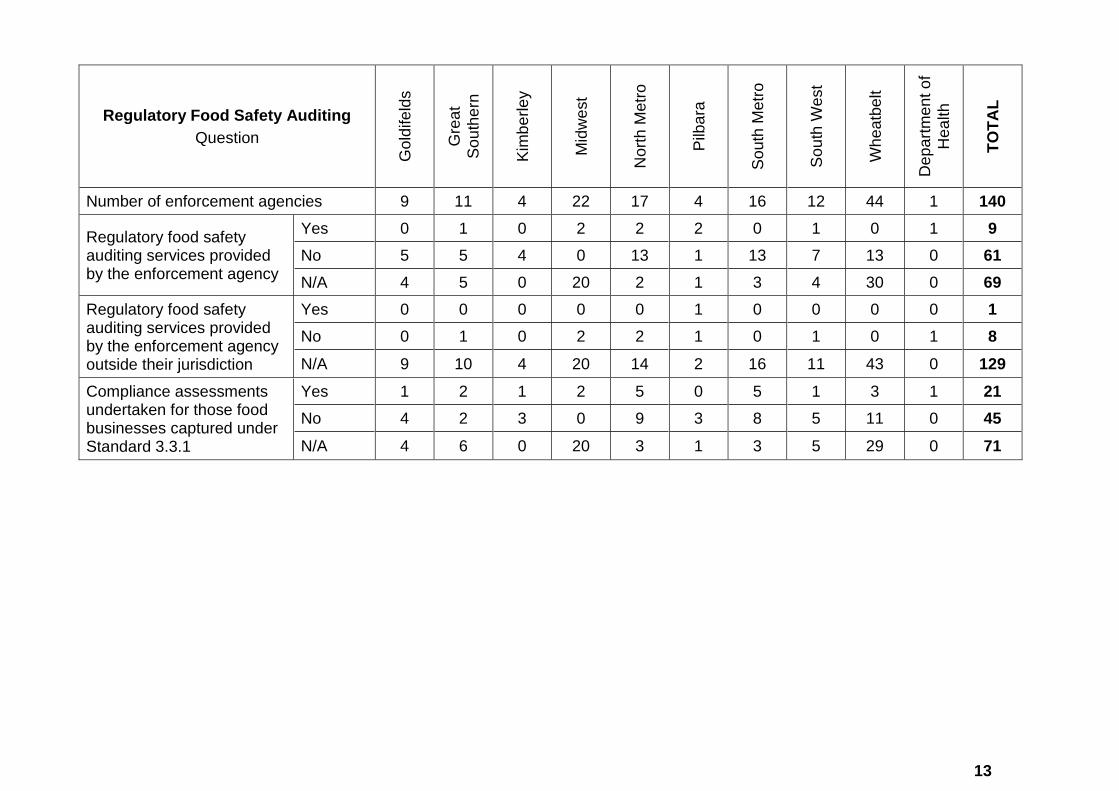
Regulatory Food Safety Auditing
Question
Go
ldife
lds
Gre
at
So
uth
ern
Kim
be
rle
y
Mid
we
st
Nort
h M
etr
o
Pilb
ara
So
uth
Me
tro
So
uth
West
Wh
ea
tbe
lt
Dep
art
me
nt o
f
Hea
lth
TO
TA
L
Number of enforcement agencies 9 11 4 22 17 4 16 12 44 1 140
Regulatory food safety auditing services provided by the enforcement agency
Yes 0 1 0 2 2 2 0 1 0 1 9
No 5 5 4 0 13 1 13 7 13 0 61
N/A 4 5 0 20 2 1 3 4 30 0 69
Regulatory food safety auditing services provided by the enforcement agency outside their jurisdiction
Yes 0 0 0 0 0 1 0 0 0 0 1
No 0 1 0 2 2 1 0 1 0 1 8
N/A 9 10 4 20 14 2 16 11 43 0 129
Compliance assessments undertaken for those food businesses captured under Standard 3.3.1
Yes 1 2 1 2 5 0 5 1 3 1 21
No 4 2 3 0 9 3 8 5 11 0 45
N/A 4 6 0 20 3 1 3 5 29 0 71
14
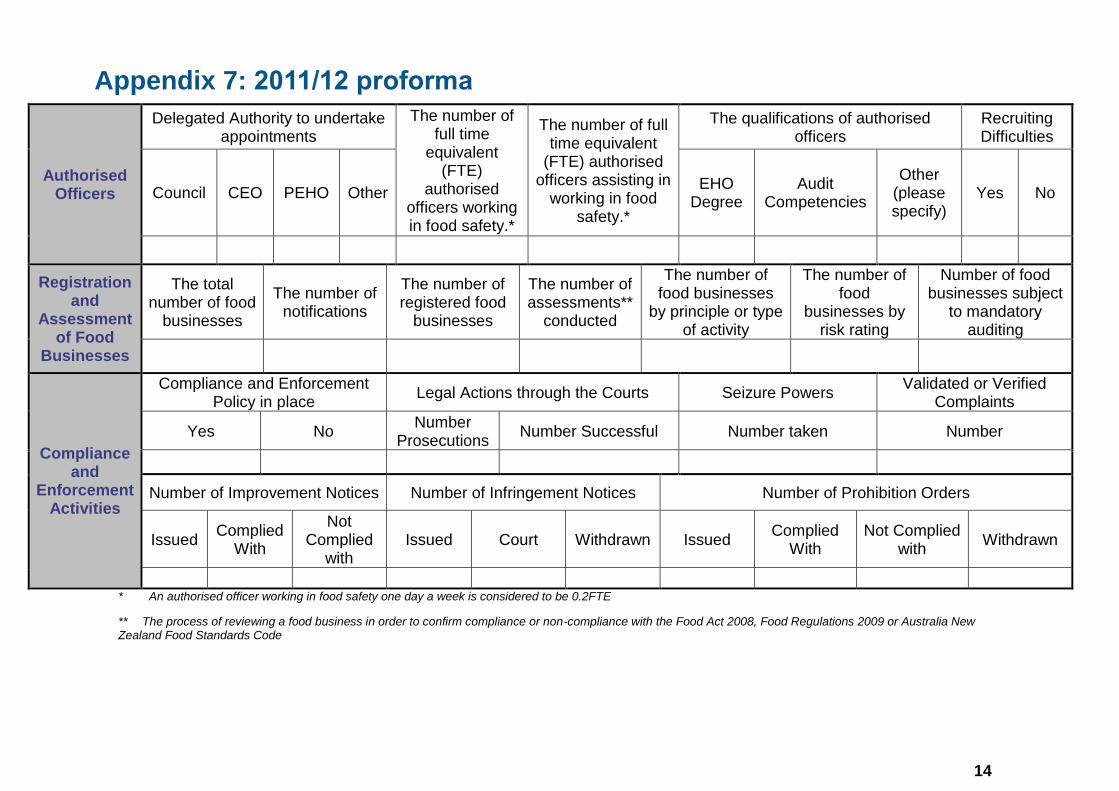
Appendix 7: 2011/12 proforma
Authorised Officers
Delegated Authority to undertake appointments
The number of full time
equivalent (FTE)
authorised officers working in food safety.*
The number of full time equivalent
(FTE) authorised officers assisting in
working in food safety.*
The qualifications of authorised officers
Recruiting Difficulties
Council CEO PEHO Other EHO
Degree Audit
Competencies
Other (please specify)
Yes No
Registration and
Assessment of Food
Businesses
The total number of food
businesses
The number of notifications
The number of registered food
businesses
The number of assessments**
conducted
The number of food businesses
by principle or type of activity
The number of food
businesses by risk rating
Number of food businesses subject
to mandatory auditing
Compliance and
Enforcement Activities
Compliance and Enforcement Policy in place
Legal Actions through the Courts Seizure Powers Validated or Verified
Complaints
Yes No Number
Prosecutions Number Successful Number taken Number
Number of Improvement Notices Number of Infringement Notices Number of Prohibition Orders
Issued Complied
With
Not Complied
with Issued Court Withdrawn Issued
Complied With
Not Complied with
Withdrawn
* An authorised officer working in food safety one day a week is considered to be 0.2FTE
** The process of reviewing a food business in order to confirm compliance or non-compliance with the Food Act 2008, Food Regulations 2009 or Australia New Zealand Food Standards Code
15
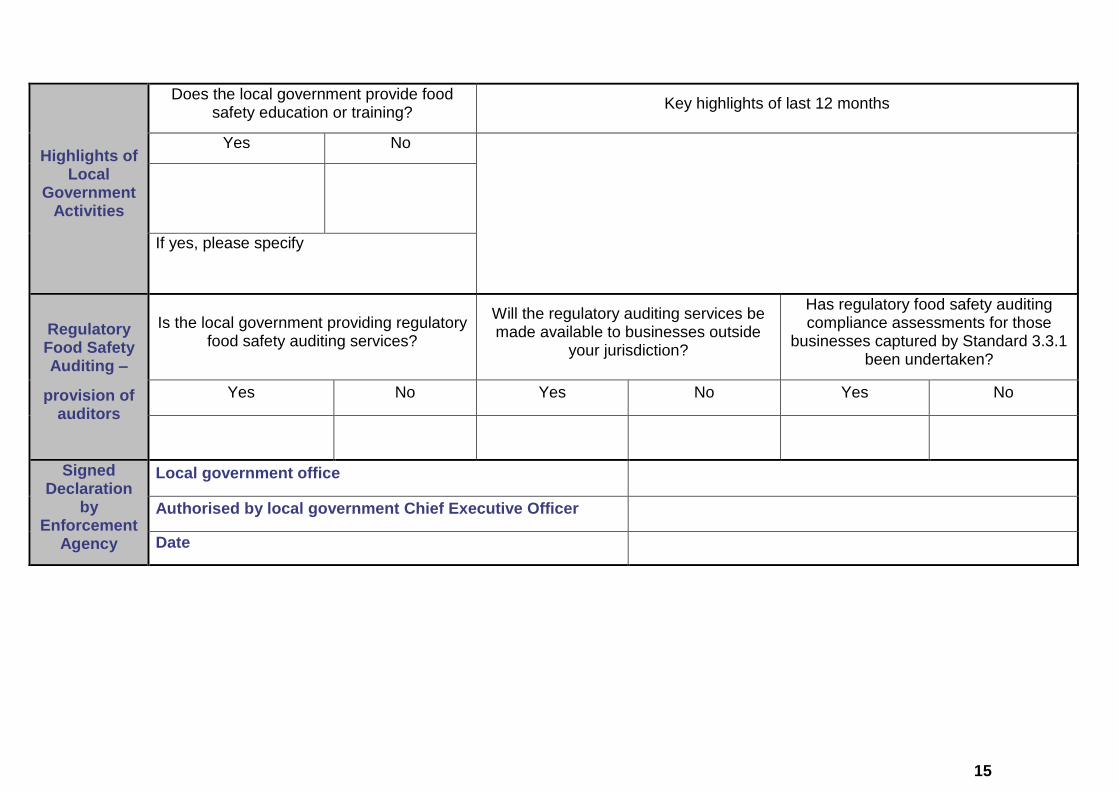
Highlights of Local
Government Activities
Does the local government provide food safety education or training?
Key highlights of last 12 months
Yes No
If yes, please specify
Regulatory Food Safety Auditing –
provision of auditors
Is the local government providing regulatory food safety auditing services?
Will the regulatory auditing services be made available to businesses outside
your jurisdiction?
Has regulatory food safety auditing compliance assessments for those
businesses captured by Standard 3.3.1 been undertaken?
Yes No Yes No Yes No
Signed Declaration
by Enforcement
Agency
Local government office
Authorised by local government Chief Executive Officer
Date
16
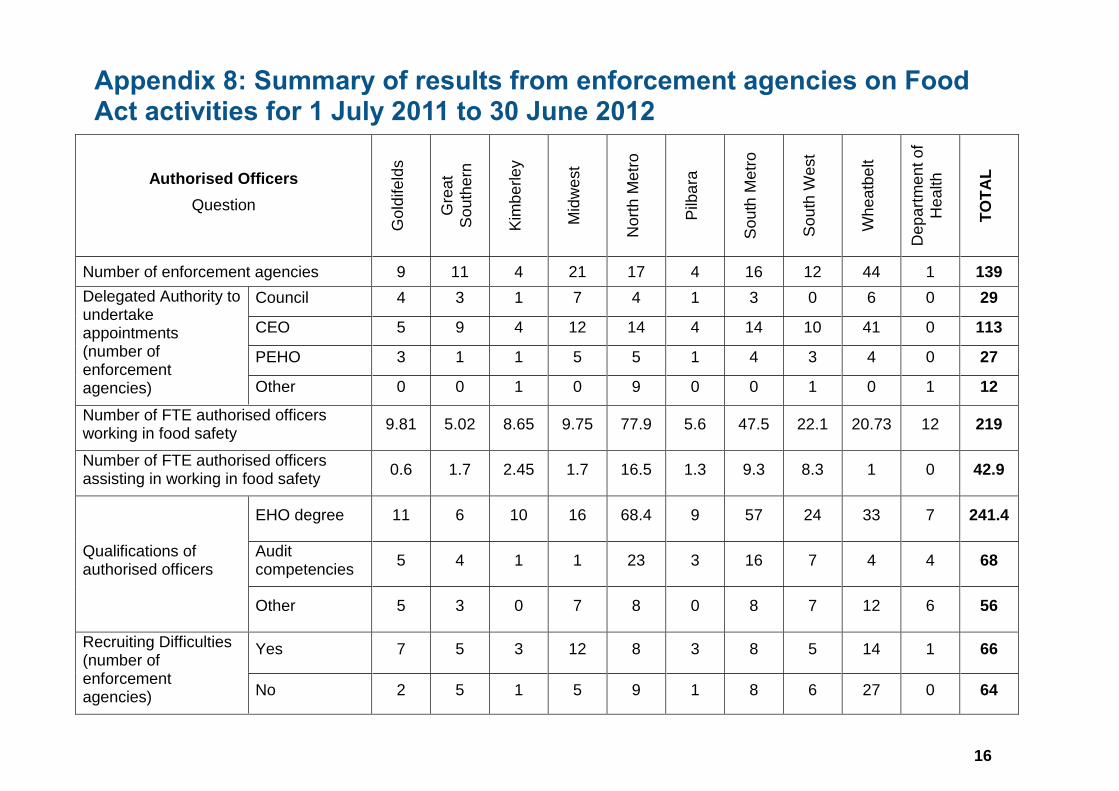
Appendix 8: Summary of results from enforcement agencies on Food Act activities for 1 July 2011 to 30 June 2012
Authorised Officers
Question
Go
ldife
lds
Gre
at
So
uth
ern
Kim
be
rle
y
Mid
we
st
Nort
h M
etr
o
Pilb
ara
So
uth
Metr
o
So
uth
West
Wh
ea
tbe
lt
Dep
art
me
nt o
f
Hea
lth
TO
TA
L
Number of enforcement agencies 9 11 4 21 17 4 16 12 44 1 139
Delegated Authority to undertake appointments (number of enforcement agencies)
Council 4 3 1 7 4 1 3 0 6 0 29
CEO 5 9 4 12 14 4 14 10 41 0 113
PEHO 3 1 1 5 5 1 4 3 4 0 27
Other 0 0 1 0 9 0 0 1 0 1 12
Number of FTE authorised officers working in food safety
9.81 5.02 8.65 9.75 77.9 5.6 47.5 22.1 20.73 12 219
Number of FTE authorised officers assisting in working in food safety
0.6 1.7 2.45 1.7 16.5 1.3 9.3 8.3 1 0 42.9
Qualifications of authorised officers
EHO degree 11 6 10 16 68.4 9 57 24 33 7 241.4
Audit competencies
5 4 1 1 23 3 16 7 4 4 68
Other 5 3 0 7 8 0 8 7 12 6 56
Recruiting Difficulties (number of enforcement agencies)
Yes 7 5 3 12 8 3 8 5 14 1 66
No 2 5 1 5 9 1 8 6 27 0 64
17
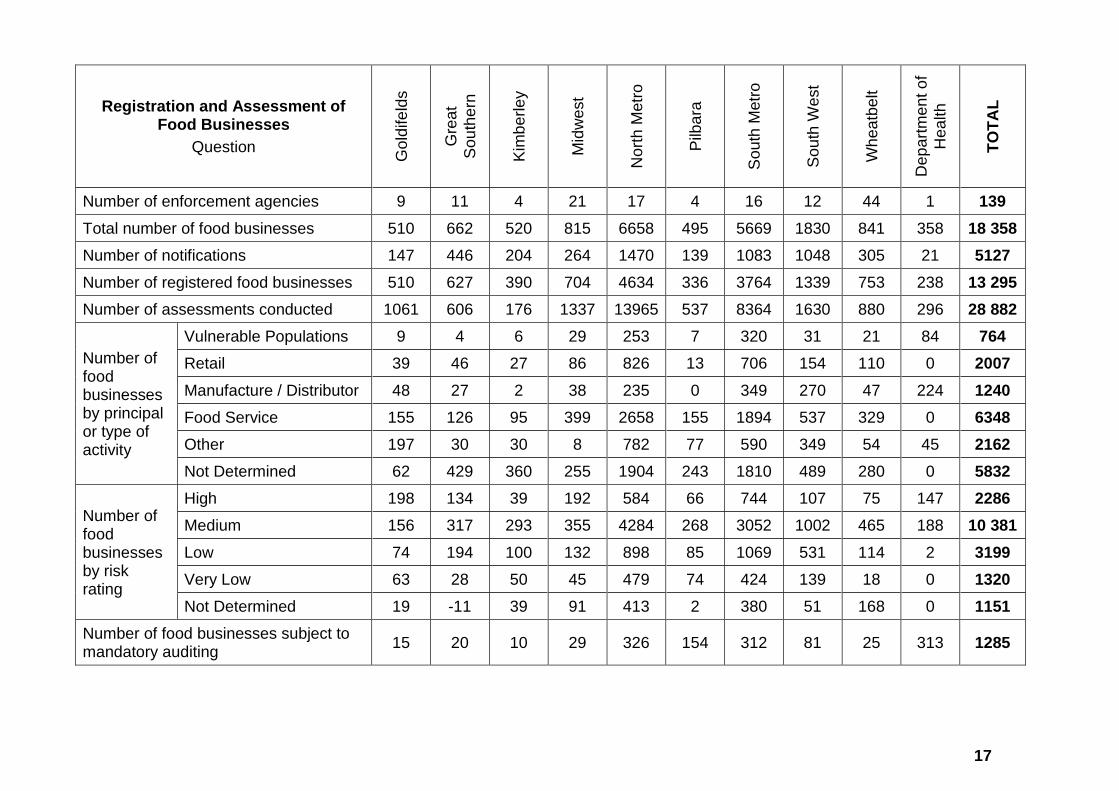
Registration and Assessment of Food Businesses
Question
Go
ldife
lds
Gre
at
So
uth
ern
Kim
be
rle
y
Mid
we
st
Nort
h M
etr
o
Pilb
ara
So
uth
Me
tro
So
uth
West
Wh
ea
tbe
lt
Dep
art
me
nt o
f
Hea
lth
TO
TA
L
Number of enforcement agencies 9 11 4 21 17 4 16 12 44 1 139
Total number of food businesses 510 662 520 815 6658 495 5669 1830 841 358 18 358
Number of notifications 147 446 204 264 1470 139 1083 1048 305 21 5127
Number of registered food businesses 510 627 390 704 4634 336 3764 1339 753 238 13 295
Number of assessments conducted 1061 606 176 1337 13965 537 8364 1630 880 296 28 882
Number of food businesses by principal or type of activity
Vulnerable Populations 9 4 6 29 253 7 320 31 21 84 764
Retail 39 46 27 86 826 13 706 154 110 0 2007
Manufacture / Distributor 48 27 2 38 235 0 349 270 47 224 1240
Food Service 155 126 95 399 2658 155 1894 537 329 0 6348
Other 197 30 30 8 782 77 590 349 54 45 2162
Not Determined 62 429 360 255 1904 243 1810 489 280 0 5832
Number of food businesses by risk rating
High 198 134 39 192 584 66 744 107 75 147 2286
Medium 156 317 293 355 4284 268 3052 1002 465 188 10 381
Low 74 194 100 132 898 85 1069 531 114 2 3199
Very Low 63 28 50 45 479 74 424 139 18 0 1320
Not Determined 19 -11 39 91 413 2 380 51 168 0 1151
Number of food businesses subject to mandatory auditing
15 20 10 29 326 154 312 81 25 313 1285
18
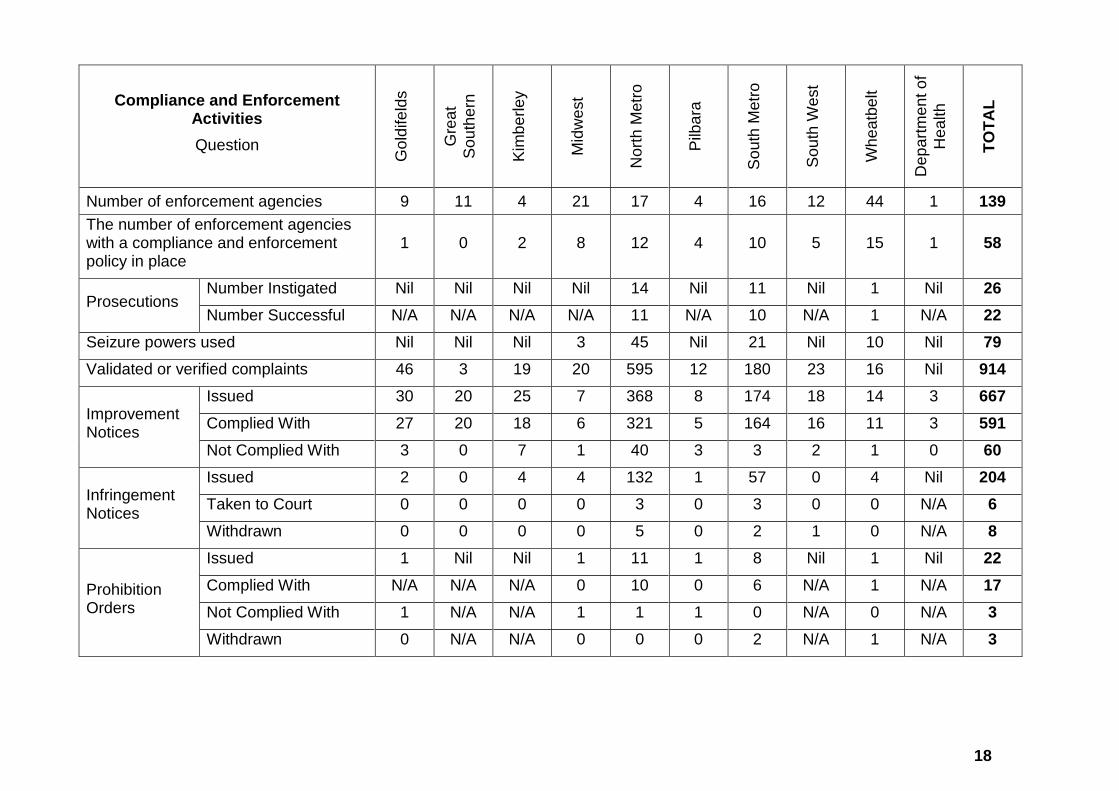
Compliance and Enforcement Activities
Question
Go
ldife
lds
Gre
at
So
uth
ern
Kim
be
rle
y
Mid
we
st
Nort
h M
etr
o
Pilb
ara
So
uth
Me
tro
So
uth
West
Wh
ea
tbe
lt
Dep
art
me
nt o
f
Hea
lth
TO
TA
L
Number of enforcement agencies 9 11 4 21 17 4 16 12 44 1 139
The number of enforcement agencies with a compliance and enforcement policy in place
1 0 2 8 12 4 10 5 15 1 58
Prosecutions Number Instigated Nil Nil Nil Nil 14 Nil 11 Nil 1 Nil 26
Number Successful N/A N/A N/A N/A 11 N/A 10 N/A 1 N/A 22
Seizure powers used Nil Nil Nil 3 45 Nil 21 Nil 10 Nil 79
Validated or verified complaints 46 3 19 20 595 12 180 23 16 Nil 914
Improvement Notices
Issued 30 20 25 7 368 8 174 18 14 3 667
Complied With 27 20 18 6 321 5 164 16 11 3 591
Not Complied With 3 0 7 1 40 3 3 2 1 0 60
Infringement Notices
Issued 2 0 4 4 132 1 57 0 4 Nil 204
Taken to Court 0 0 0 0 3 0 3 0 0 N/A 6
Withdrawn 0 0 0 0 5 0 2 1 0 N/A 8
Prohibition Orders
Issued 1 Nil Nil 1 11 1 8 Nil 1 Nil 22
Complied With N/A N/A N/A 0 10 0 6 N/A 1 N/A 17
Not Complied With 1 N/A N/A 1 1 1 0 N/A 0 N/A 3
Withdrawn 0 N/A N/A 0 0 0 2 N/A 1 N/A 3

19
Highlights of Enforcement Agency Activities
Question
Go
ldife
lds
Gre
at
So
uth
ern
Kim
be
rle
y
Mid
we
st
Nort
h M
etr
o
Pilb
ara
So
uth
Me
tro
So
uth
West
Wh
ea
tbe
lt
Dep
art
me
nt o
f
Hea
lth
TO
TA
L
Number of enforcement agencies 9 11 4 21 17 4 16 12 44 1 139
Number of enforcement agencies that provide food safety education or training
4 3 3 8 13 3 13 8 24 1 80
Food safety training or education provided (number of enforcement agencies)
Workshops/seminars/presentations
1 0 0 1 3 0 1 0 4 1 11
Online training 1 0 2 6 8 4 6 7 12 0 46
Newsletters/fact sheets/guidelines
0 0 0 1 5 0 1 0 0 1 8
Targeted/ad hoc/on demand training
1 3 2 6 1 0 3 1 2 1 20
Key highlights during reporting period (number of comments provided on each topic)
Food safety education and awareness
5 4 1 3 7 0 5 4 1 1 31
Staff resourcing 1 3 0 0 4 2 2 0 6 0 18
Monitoring programs 6 1 2 3 11 2 18 9 3 0 55
Authorised officer training considerations
0 0 0 0 0 0 0 0 0 1 1
Policy considerations 2 0 0 0 0 0 0 0 1 1 4
20
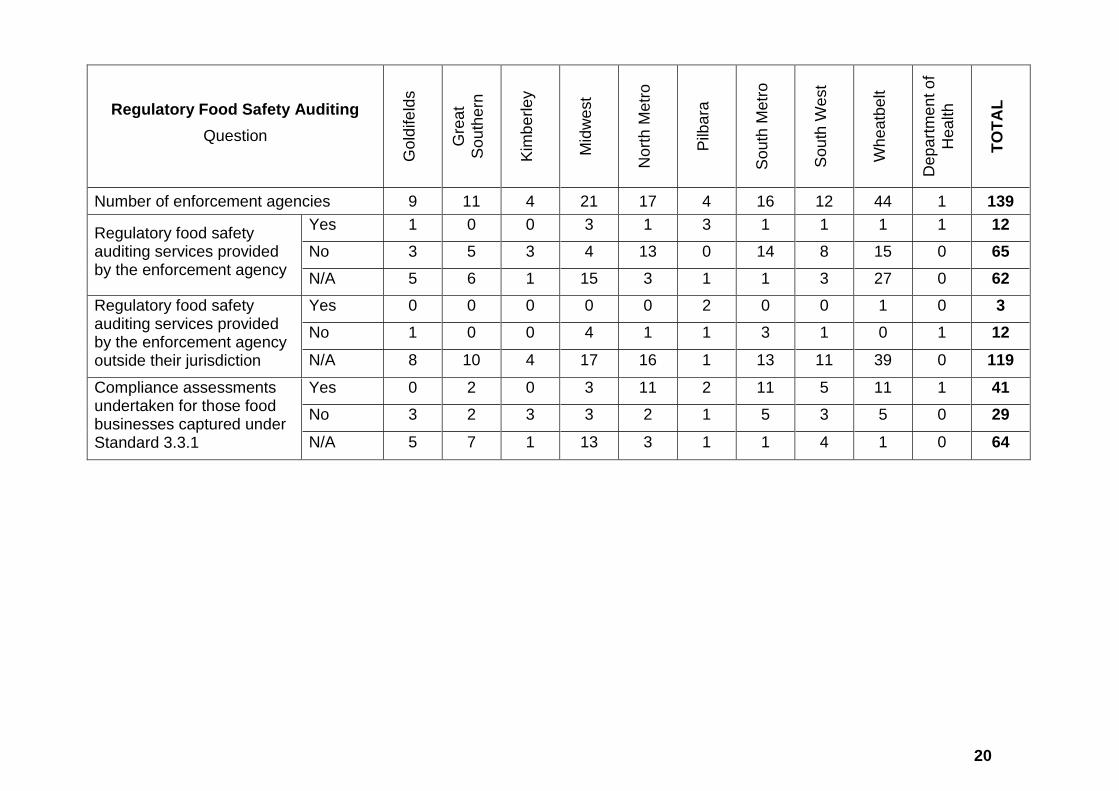
Regulatory Food Safety Auditing
Question
Go
ldife
lds
Gre
at
So
uth
ern
Kim
be
rle
y
Mid
we
st
Nort
h M
etr
o
Pilb
ara
So
uth
Me
tro
So
uth
West
Wh
ea
tbe
lt
Dep
art
me
nt o
f
Hea
lth
TO
TA
L
Number of enforcement agencies 9 11 4 21 17 4 16 12 44 1 139
Regulatory food safety auditing services provided by the enforcement agency
Yes 1 0 0 3 1 3 1 1 1 1 12
No 3 5 3 4 13 0 14 8 15 0 65
N/A 5 6 1 15 3 1 1 3 27 0 62
Regulatory food safety auditing services provided by the enforcement agency outside their jurisdiction
Yes 0 0 0 0 0 2 0 0 1 0 3
No 1 0 0 4 1 1 3 1 0 1 12
N/A 8 10 4 17 16 1 13 11 39 0 119
Compliance assessments undertaken for those food businesses captured under Standard 3.3.1
Yes 0 2 0 3 11 2 11 5 11 1 41
No 3 2 3 3 2 1 5 3 5 0 29
N/A 5 7 1 13 3 1 1 4 1 0 64
21
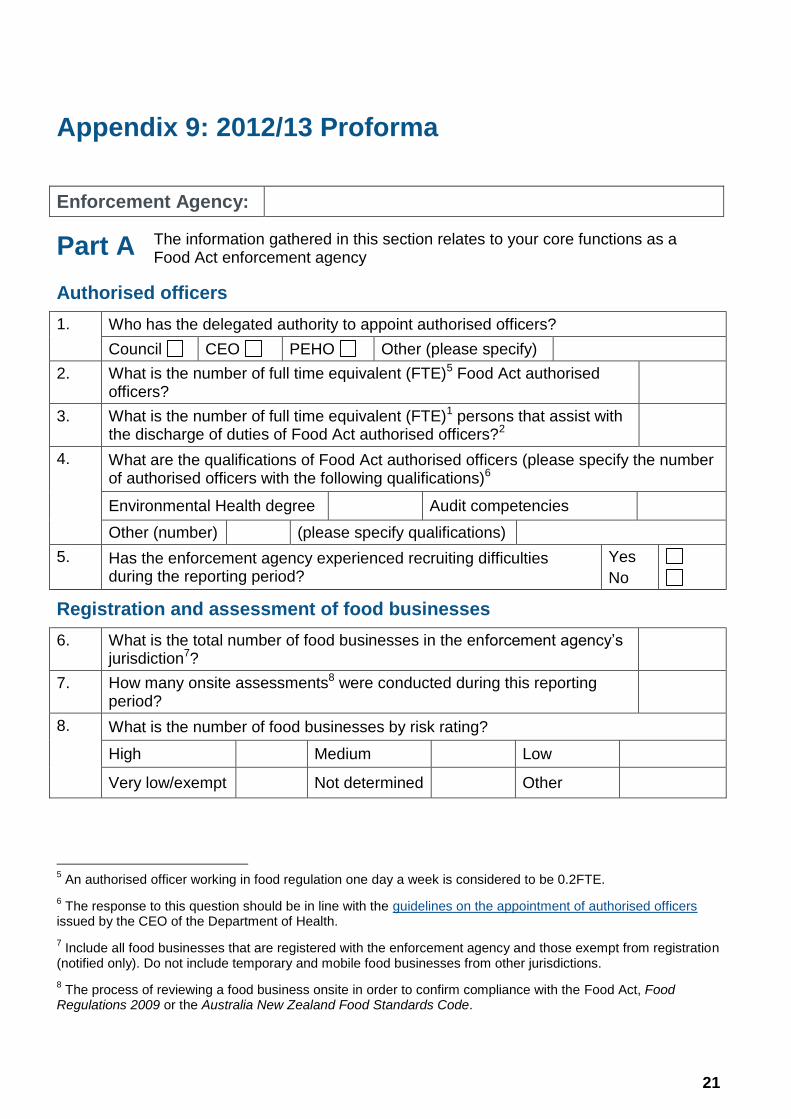
Appendix 9: 2012/13 Proforma
Enforcement Agency:
Part A
Authorised officers
1. Who has the delegated authority to appoint authorised officers?
Council CEO PEHO Other (please specify)
2. What is the number of full time equivalent (FTE)5 Food Act authorised officers?
3. What is the number of full time equivalent (FTE)1 persons that assist with the discharge of duties of Food Act authorised officers?2
4. What are the qualifications of Food Act authorised officers (please specify the number of authorised officers with the following qualifications)6
Environmental Health degree Audit competencies
Other (number) (please specify qualifications)
5. Has the enforcement agency experienced recruiting difficulties during the reporting period?
Yes
No
Registration and assessment of food businesses
6. What is the total number of food businesses in the enforcement agency’s jurisdiction7?
7. How many onsite assessments8 were conducted during this reporting period?
8. What is the number of food businesses by risk rating?
High Medium Low
Very low/exempt Not determined Other
5 An authorised officer working in food regulation one day a week is considered to be 0.2FTE.
6 The response to this question should be in line with the guidelines on the appointment of authorised officers
issued by the CEO of the Department of Health.
7 Include all food businesses that are registered with the enforcement agency and those exempt from registration
(notified only). Do not include temporary and mobile food businesses from other jurisdictions.
8 The process of reviewing a food business onsite in order to confirm compliance with the Food Act, Food
Regulations 2009 or the Australia New Zealand Food Standards Code.
The information gathered in this section relates to your core functions as a Food Act enforcement agency
22
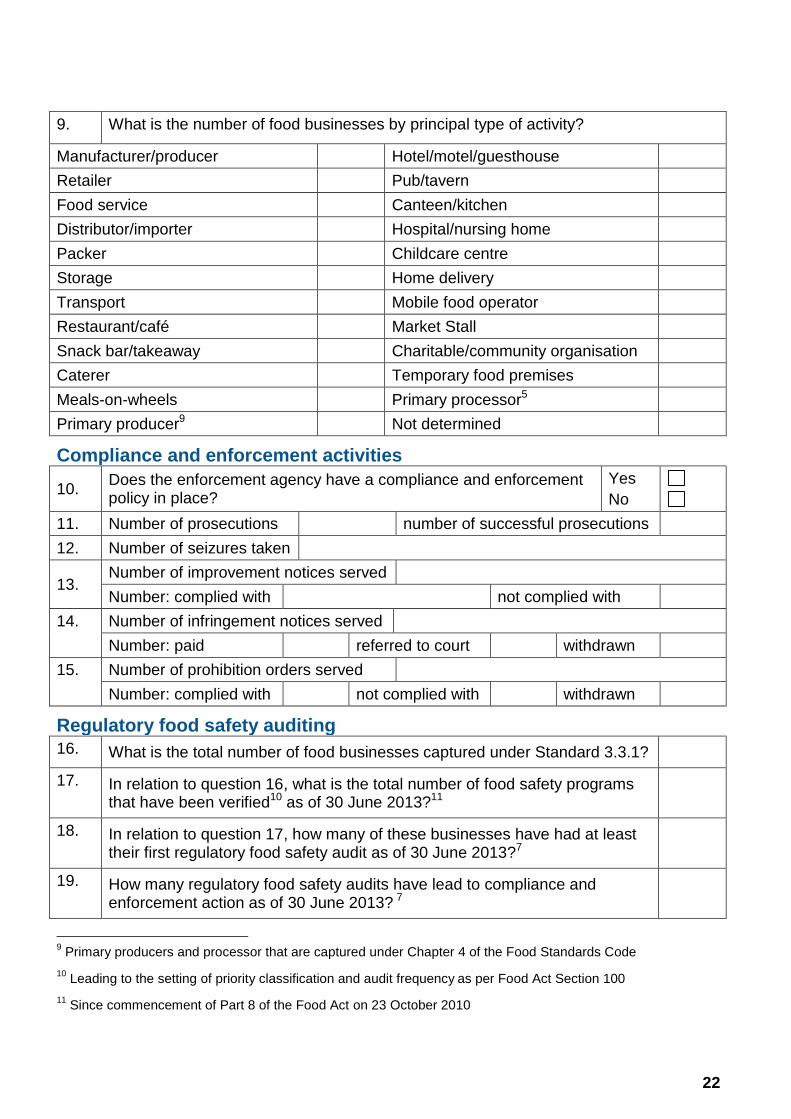
9. What is the number of food businesses by principal type of activity?
Manufacturer/producer Hotel/motel/guesthouse
Retailer Pub/tavern
Food service Canteen/kitchen
Distributor/importer Hospital/nursing home
Packer Childcare centre
Storage Home delivery
Transport Mobile food operator
Restaurant/café Market Stall
Snack bar/takeaway Charitable/community organisation
Caterer Temporary food premises
Meals-on-wheels Primary processor5
Primary producer9 Not determined
Compliance and enforcement activities
10. Does the enforcement agency have a compliance and enforcement policy in place?
Yes
No
11. Number of prosecutions number of successful prosecutions
12. Number of seizures taken
13. Number of improvement notices served
Number: complied with not complied with
14. Number of infringement notices served
Number: paid referred to court withdrawn
15. Number of prohibition orders served
Number: complied with not complied with withdrawn
Regulatory food safety auditing
16. What is the total number of food businesses captured under Standard 3.3.1?
17. In relation to question 16, what is the total number of food safety programs that have been verified10 as of 30 June 2013?11
18. In relation to question 17, how many of these businesses have had at least their first regulatory food safety audit as of 30 June 2013?7
19. How many regulatory food safety audits have lead to compliance and enforcement action as of 30 June 2013? 7
9 Primary producers and processor that are captured under Chapter 4 of the Food Standards Code
10 Leading to the setting of priority classification and audit frequency
as per Food Act Section 100
11 Since commencement of Part 8 of the Food Act on 23 October 2010
23
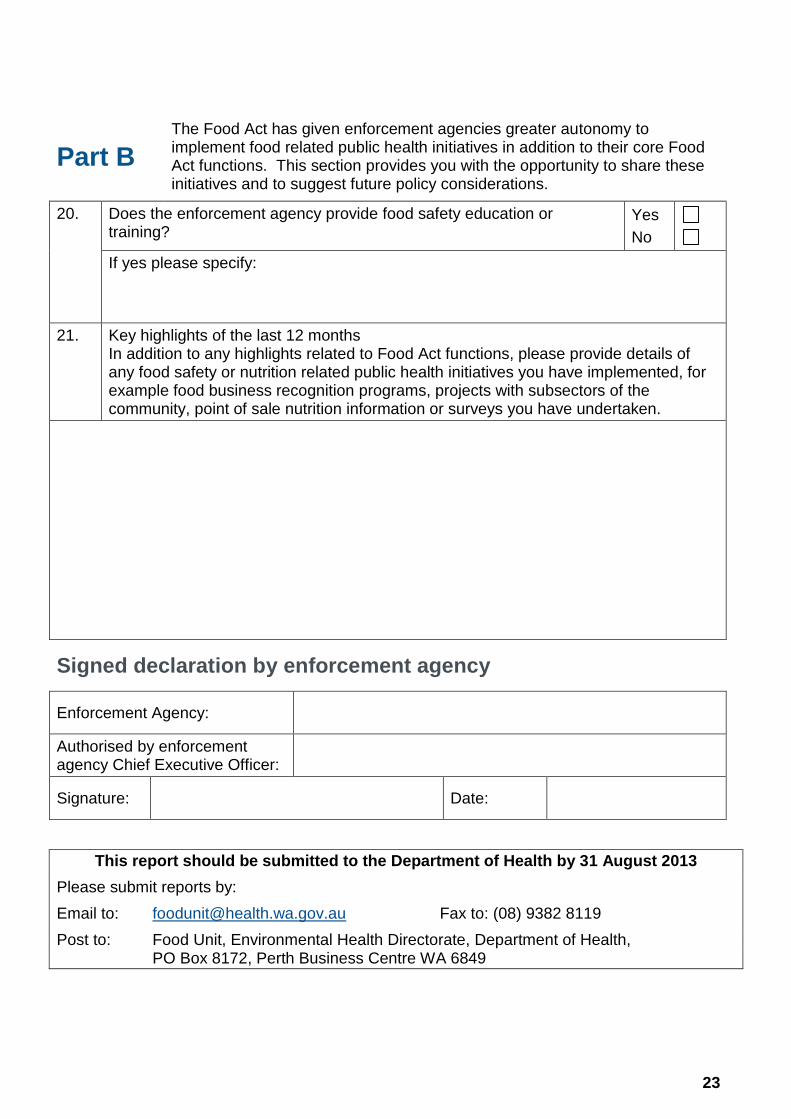
Part B
The Food Act has given enforcement agencies greater autonomy to implement food related public health initiatives in addition to their core Food Act functions. This section provides you with the opportunity to share these initiatives and to suggest future policy considerations.
20. Does the enforcement agency provide food safety education or training?
Yes
No
If yes please specify:
21. Key highlights of the last 12 months In addition to any highlights related to Food Act functions, please provide details of any food safety or nutrition related public health initiatives you have implemented, for example food business recognition programs, projects with subsectors of the community, point of sale nutrition information or surveys you have undertaken.
Signed declaration by enforcement agency
Enforcement Agency:
Authorised by enforcement agency Chief Executive Officer:
Signature: Date:
This report should be submitted to the Department of Health by 31 August 2013
Please submit reports by:
Email to: [email protected] Fax to: (08) 9382 8119
Post to: Food Unit, Environmental Health Directorate, Department of Health, PO Box 8172, Perth Business Centre WA 6849
24
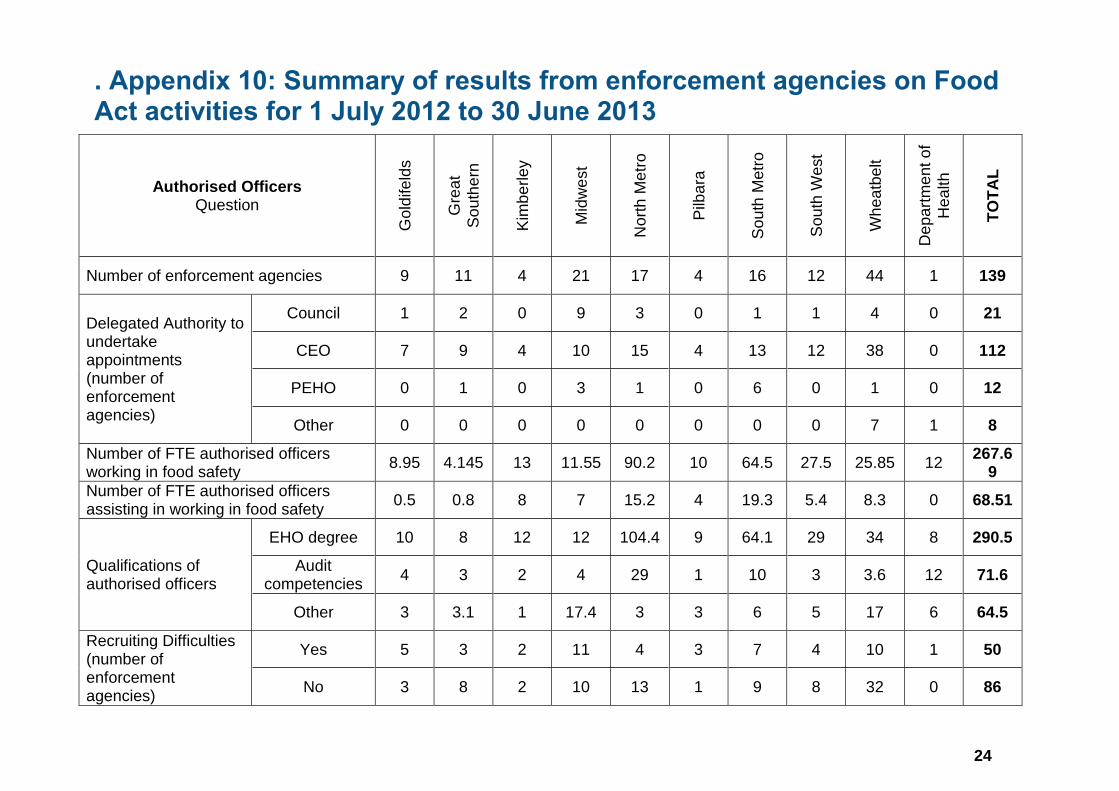
. Appendix 10: Summary of results from enforcement agencies on Food Act activities for 1 July 2012 to 30 June 2013
Authorised Officers Question
Go
ldife
lds
Gre
at
So
uth
ern
Kim
be
rle
y
Mid
we
st
Nort
h M
etr
o
Pilb
ara
So
uth
Metr
o
So
uth
West
Wh
ea
tbe
lt
Dep
art
me
nt o
f
Hea
lth
TO
TA
L
Number of enforcement agencies 9 11 4 21 17 4 16 12 44 1 139
Delegated Authority to undertake appointments (number of enforcement agencies)
Council 1 2 0 9 3 0 1 1 4 0 21
CEO 7 9 4 10 15 4 13 12 38 0 112
PEHO 0 1 0 3 1 0 6 0 1 0 12
Other 0 0 0 0 0 0 0 0 7 1 8
Number of FTE authorised officers working in food safety
8.95 4.145 13 11.55 90.2 10 64.5 27.5 25.85 12 267.6
9
Number of FTE authorised officers assisting in working in food safety
0.5 0.8 8 7 15.2 4 19.3 5.4 8.3 0 68.51
Qualifications of authorised officers
EHO degree 10 8 12 12 104.4 9 64.1 29 34 8 290.5
Audit competencies
4 3 2 4 29 1 10 3 3.6 12 71.6
Other 3 3.1 1 17.4 3 3 6 5 17 6 64.5
Recruiting Difficulties (number of enforcement agencies)
Yes 5 3 2 11 4 3 7 4 10 1 50
No 3 8 2 10 13 1 9 8 32 0 86
25
Registration and Assessment of Food Businesses
Question
Go
ldife
lds
Gre
at
So
uth
ern
Kim
be
rle
y
Mid
we
st
Nort
h M
etr
o
Pilb
ara
So
uth
Me
tro
So
uth
West
Wh
ea
tbe
lt
Dep
art
me
nt o
f
Hea
lth
TO
TA
L
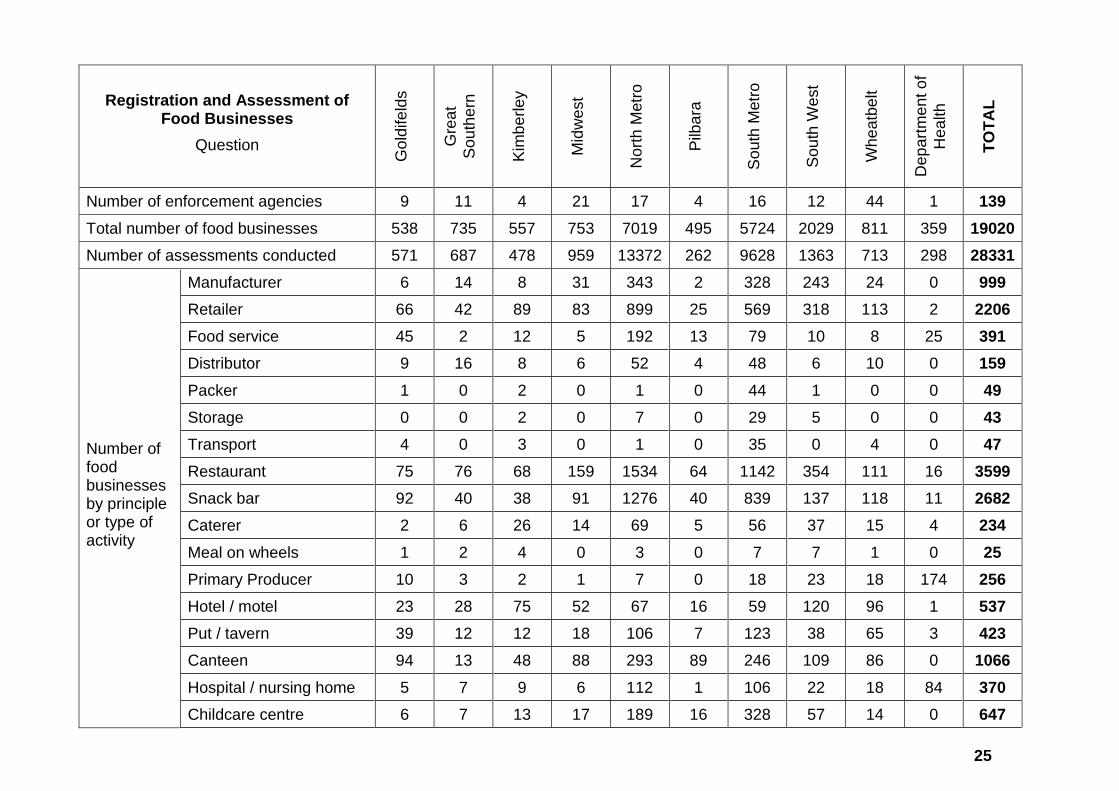
Number of enforcement agencies 9 11 4 21 17 4 16 12 44 1 139
Total number of food businesses 538 735 557 753 7019 495 5724 2029 811 359 19020
Number of assessments conducted 571 687 478 959 13372 262 9628 1363 713 298 28331
Number of food businesses by principle or type of activity
Manufacturer 6 14 8 31 343 2 328 243 24 0 999
Retailer 66 42 89 83 899 25 569 318 113 2 2206
Food service 45 2 12 5 192 13 79 10 8 25 391
Distributor 9 16 8 6 52 4 48 6 10 0 159
Packer 1 0 2 0 1 0 44 1 0 0 49
Storage 0 0 2 0 7 0 29 5 0 0 43
Transport 4 0 3 0 1 0 35 0 4 0 47
Restaurant 75 76 68 159 1534 64 1142 354 111 16 3599
Snack bar 92 40 38 91 1276 40 839 137 118 11 2682
Caterer 2 6 26 14 69 5 56 37 15 4 234
Meal on wheels 1 2 4 0 3 0 7 7 1 0 25
Primary Producer 10 3 2 1 7 0 18 23 18 174 256
Hotel / motel 23 28 75 52 67 16 59 120 96 1 537
Put / tavern 39 12 12 18 106 7 123 38 65 3 423
Canteen 94 13 48 88 293 89 246 109 86 0 1066
Hospital / nursing home 5 7 9 6 112 1 106 22 18 84 370
Childcare centre 6 7 13 17 189 16 328 57 14 0 647
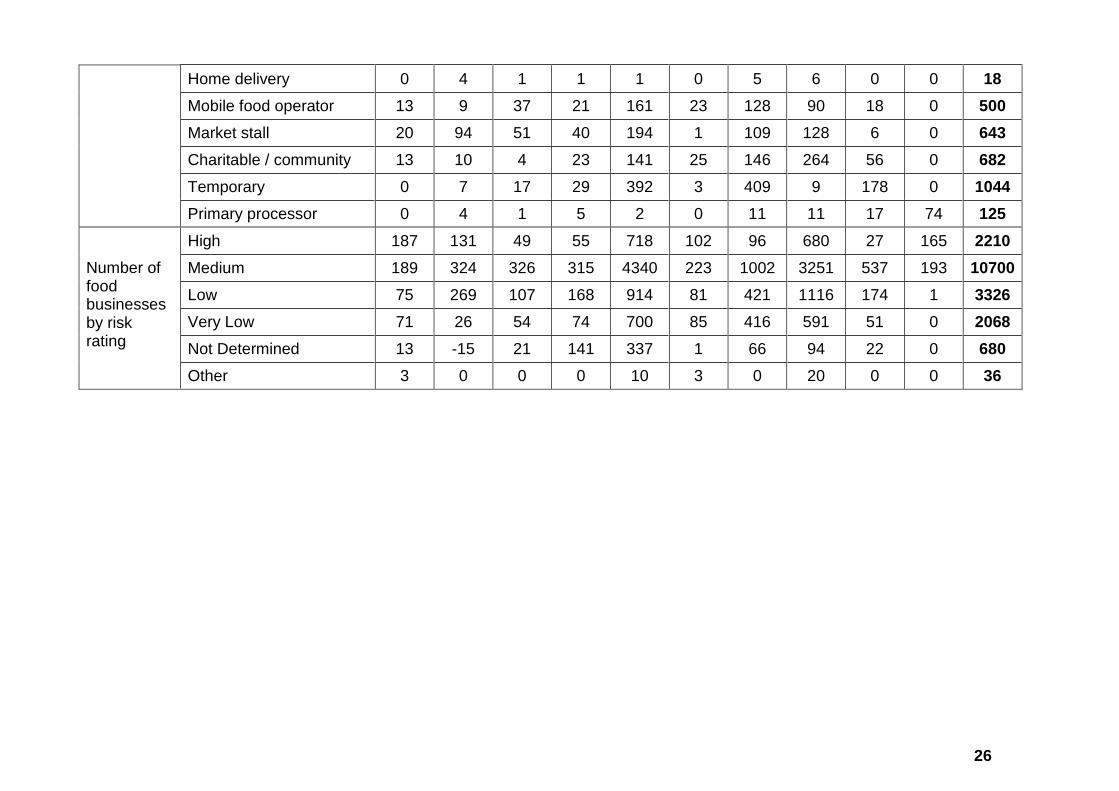
26
Home delivery 0 4 1 1 1 0 5 6 0 0 18
Mobile food operator 13 9 37 21 161 23 128 90 18 0 500
Market stall 20 94 51 40 194 1 109 128 6 0 643
Charitable / community 13 10 4 23 141 25 146 264 56 0 682
Temporary 0 7 17 29 392 3 409 9 178 0 1044
Primary processor 0 4 1 5 2 0 11 11 17 74 125
Number of food businesses by risk rating
High 187 131 49 55 718 102 96 680 27 165 2210
Medium 189 324 326 315 4340 223 1002 3251 537 193 10700
Low 75 269 107 168 914 81 421 1116 174 1 3326
Very Low 71 26 54 74 700 85 416 591 51 0 2068
Not Determined 13 -15 21 141 337 1 66 94 22 0 680
Other 3 0 0 0 10 3 0 20 0 0 36
27
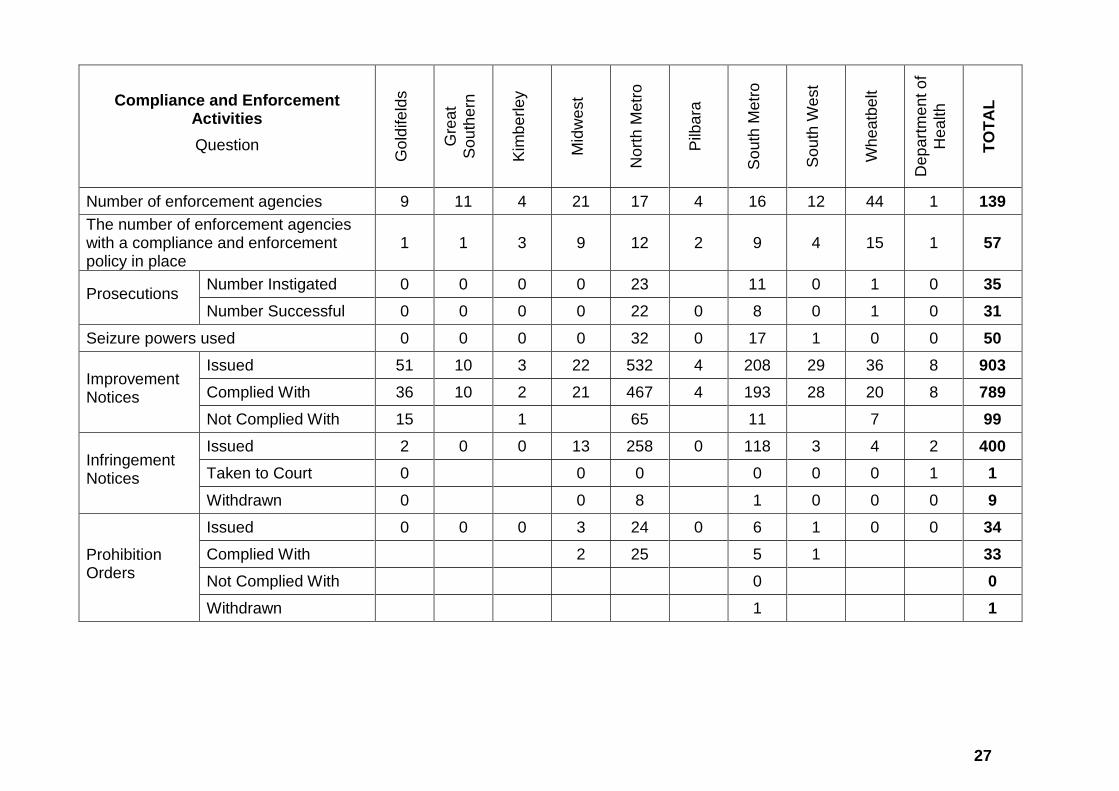
Compliance and Enforcement Activities
Question
Go
ldife
lds
Gre
at
So
uth
ern
Kim
be
rle
y
Mid
we
st
Nort
h M
etr
o
Pilb
ara
So
uth
Me
tro
So
uth
West
Wh
ea
tbe
lt
Dep
art
me
nt o
f
Hea
lth
TO
TA
L
Number of enforcement agencies 9 11 4 21 17 4 16 12 44 1 139
The number of enforcement agencies with a compliance and enforcement policy in place
1 1 3 9 12 2 9 4 15 1 57
Prosecutions Number Instigated 0 0 0 0 23 11 0 1 0 35
Number Successful 0 0 0 0 22 0 8 0 1 0 31
Seizure powers used 0 0 0 0 32 0 17 1 0 0 50
Improvement Notices
Issued 51 10 3 22 532 4 208 29 36 8 903
Complied With 36 10 2 21 467 4 193 28 20 8 789
Not Complied With 15 1 65 11 7 99
Infringement Notices
Issued 2 0 0 13 258 0 118 3 4 2 400
Taken to Court 0 0 0 0 0 0 1 1
Withdrawn 0 0 8 1 0 0 0 9
Prohibition Orders
Issued 0 0 0 3 24 0 6 1 0 0 34
Complied With 2 25 5 1 33
Not Complied With 0 0
Withdrawn 1 1
28
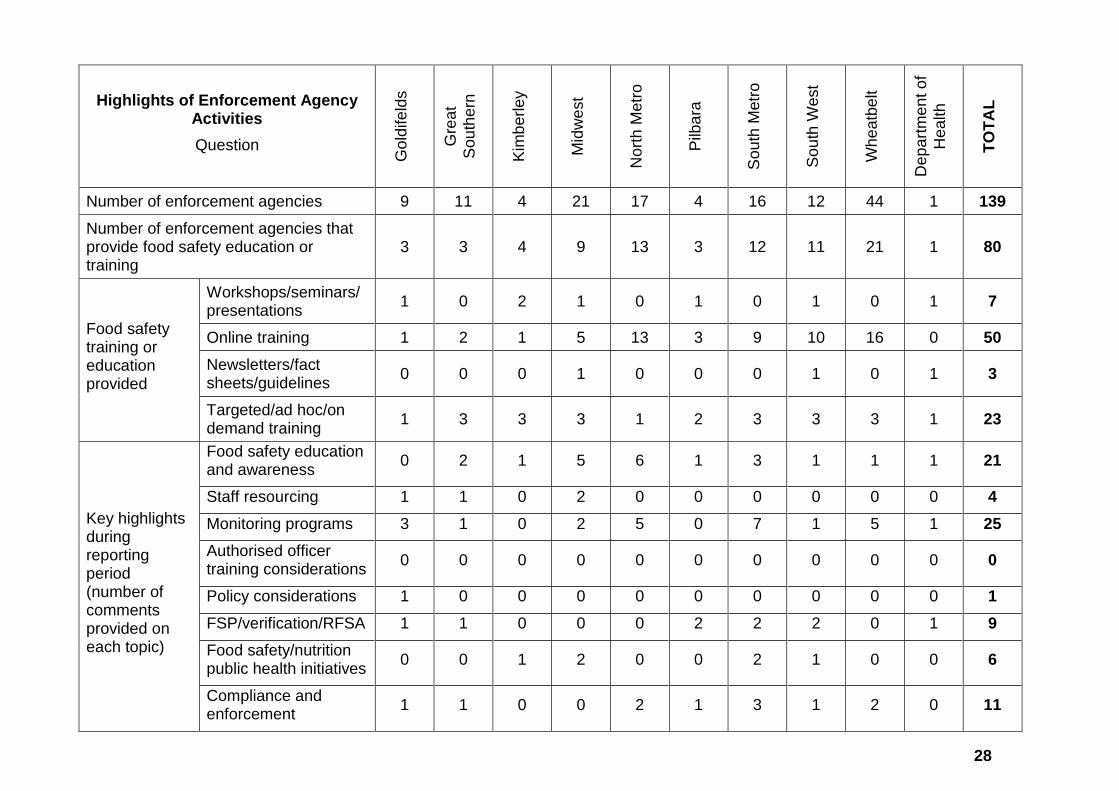
Highlights of Enforcement Agency Activities
Question
Go
ldife
lds
Gre
at
So
uth
ern
Kim
be
rle
y
Mid
we
st
Nort
h M
etr
o
Pilb
ara
So
uth
Me
tro
So
uth
West
Wh
ea
tbe
lt
Dep
art
me
nt o
f
Hea
lth
TO
TA
L
Number of enforcement agencies 9 11 4 21 17 4 16 12 44 1 139
Number of enforcement agencies that provide food safety education or training
3 3 4 9 13 3 12 11 21 1 80
Food safety training or education provided
Workshops/seminars/presentations
1 0 2 1 0 1 0 1 0 1 7
Online training 1 2 1 5 13 3 9 10 16 0 50
Newsletters/fact sheets/guidelines
0 0 0 1 0 0 0 1 0 1 3
Targeted/ad hoc/on demand training
1 3 3 3 1 2 3 3 3 1 23
Key highlights during reporting period (number of comments provided on each topic)
Food safety education and awareness
0 2 1 5 6 1 3 1 1 1 21
Staff resourcing 1 1 0 2 0 0 0 0 0 0 4
Monitoring programs 3 1 0 2 5 0 7 1 5 1 25
Authorised officer training considerations
0 0 0 0 0 0 0 0 0 0 0
Policy considerations 1 0 0 0 0 0 0 0 0 0 1
FSP/verification/RFSA 1 1 0 0 0 2 2 2 0 1 9
Food safety/nutrition public health initiatives
0 0 1 2 0 0 2 1 0 0 6
Compliance and enforcement
1 1 0 0 2 1 3 1 2 0 11
29
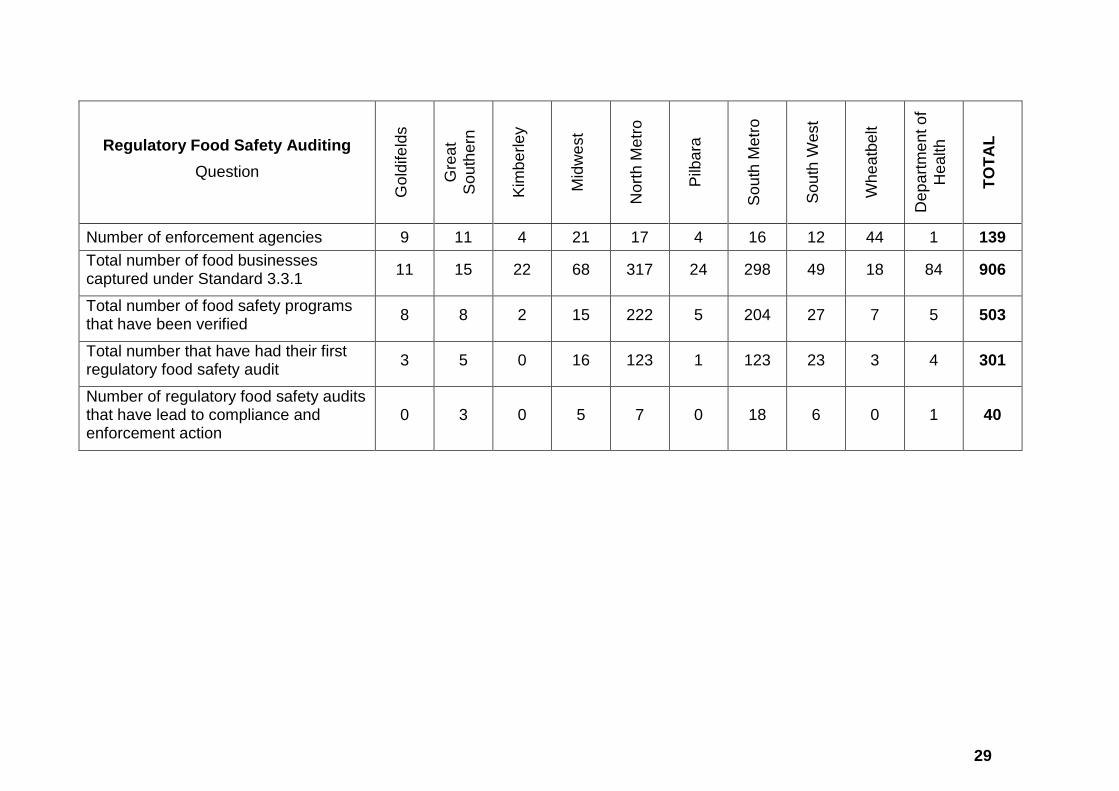
Regulatory Food Safety Auditing
Question
Go
ldife
lds
Gre
at
So
uth
ern
Kim
be
rle
y
Mid
we
st
Nort
h M
etr
o
Pilb
ara
So
uth
Metr
o
So
uth
West
Wh
ea
tbe
lt
Dep
art
me
nt o
f
Hea
lth
TO
TA
L
Number of enforcement agencies 9 11 4 21 17 4 16 12 44 1 139
Total number of food businesses captured under Standard 3.3.1
11 15 22 68 317 24 298 49 18 84 906
Total number of food safety programs that have been verified
8 8 2 15 222 5 204 27 7 5 503
Total number that have had their first regulatory food safety audit
3 5 0 16 123 1 123 23 3 4 301
Number of regulatory food safety audits that have lead to compliance and enforcement action
0 3 0 5 7 0 18 6 0 1 40
30
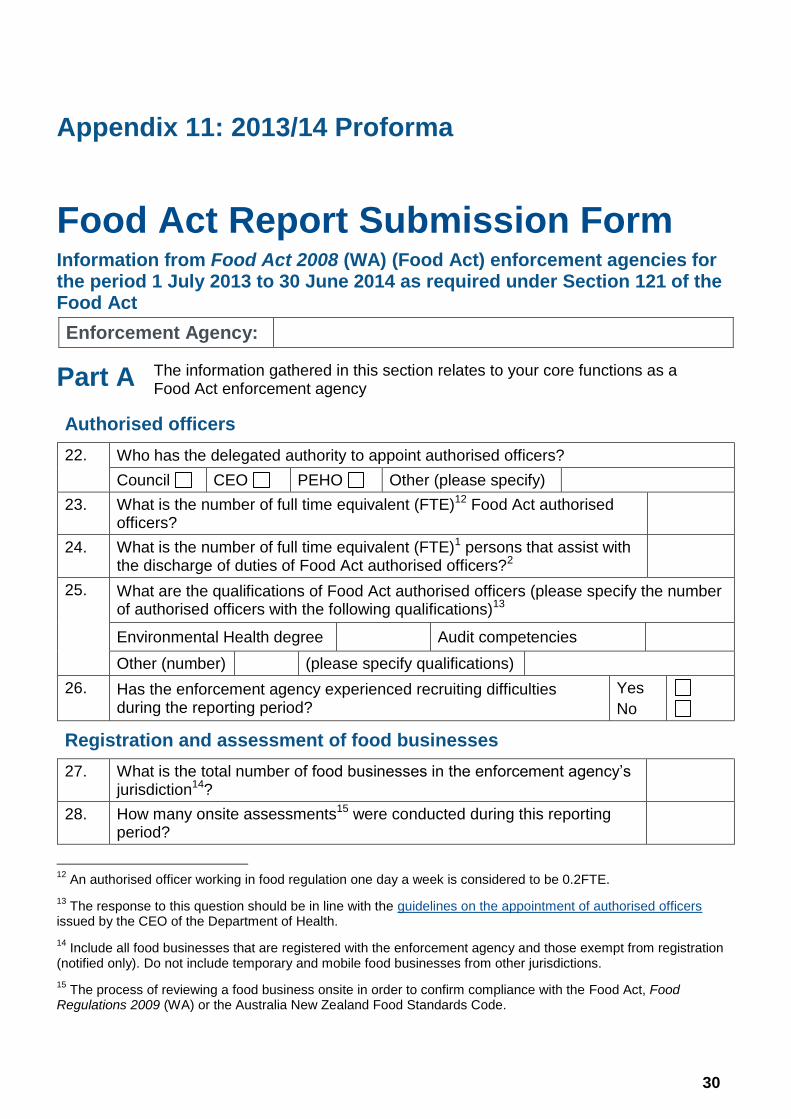
Appendix 11: 2013/14 Proforma
Food Act Report Submission Form Information from Food Act 2008 (WA) (Food Act) enforcement agencies for the period 1 July 2013 to 30 June 2014 as required under Section 121 of the Food Act
Enforcement Agency:
Part A
Authorised officers
22. Who has the delegated authority to appoint authorised officers?
Council CEO PEHO Other (please specify)
23. What is the number of full time equivalent (FTE)12 Food Act authorised officers?
24. What is the number of full time equivalent (FTE)1 persons that assist with the discharge of duties of Food Act authorised officers?2
25. What are the qualifications of Food Act authorised officers (please specify the number of authorised officers with the following qualifications)13
Environmental Health degree Audit competencies
Other (number) (please specify qualifications)
26. Has the enforcement agency experienced recruiting difficulties during the reporting period?
Yes
No
Registration and assessment of food businesses
27. What is the total number of food businesses in the enforcement agency’s jurisdiction14?
28. How many onsite assessments15 were conducted during this reporting period?
12
An authorised officer working in food regulation one day a week is considered to be 0.2FTE.
13 The response to this question should be in line with the guidelines on the appointment of authorised officers
issued by the CEO of the Department of Health.
14 Include all food businesses that are registered with the enforcement agency and those exempt from registration
(notified only). Do not include temporary and mobile food businesses from other jurisdictions.
15 The process of reviewing a food business onsite in order to confirm compliance with the Food Act, Food
Regulations 2009 (WA) or the Australia New Zealand Food Standards Code.
The information gathered in this section relates to your core functions as a Food Act enforcement agency
31
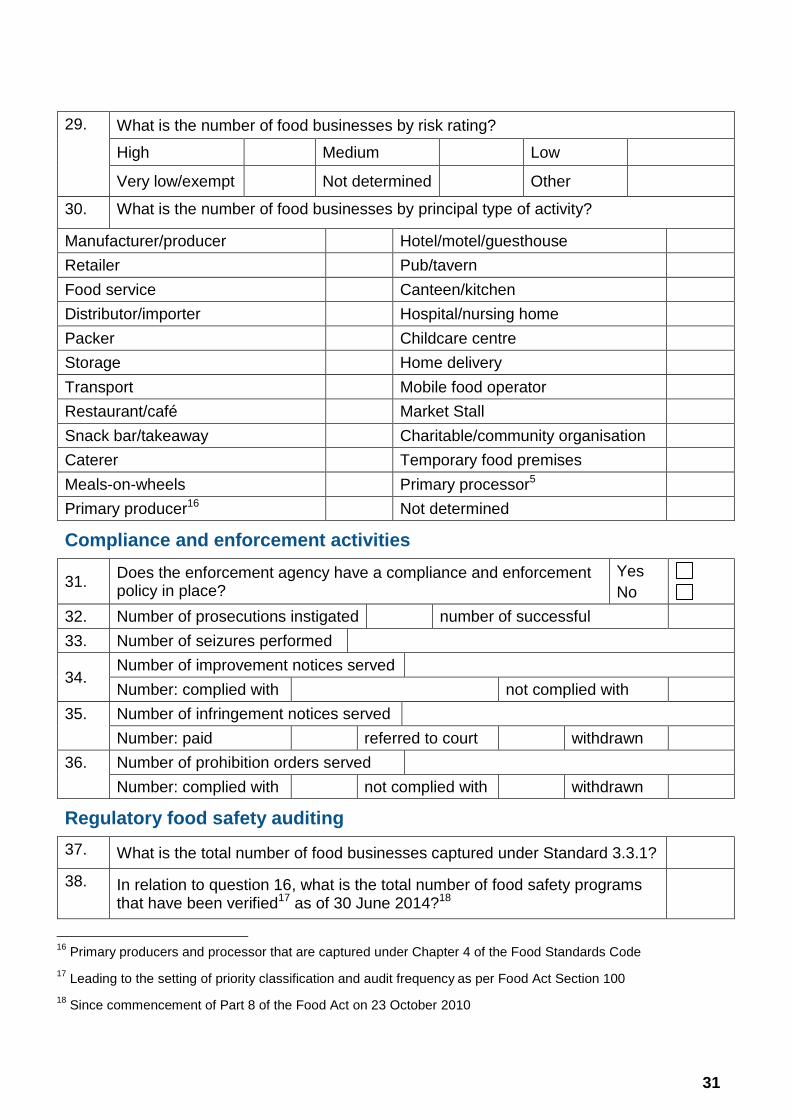
29. What is the number of food businesses by risk rating?
High Medium Low
Very low/exempt Not determined Other
30. What is the number of food businesses by principal type of activity?
Manufacturer/producer Hotel/motel/guesthouse
Retailer Pub/tavern
Food service Canteen/kitchen
Distributor/importer Hospital/nursing home
Packer Childcare centre
Storage Home delivery
Transport Mobile food operator
Restaurant/café Market Stall
Snack bar/takeaway Charitable/community organisation
Caterer Temporary food premises
Meals-on-wheels Primary processor5
Primary producer16 Not determined
Compliance and enforcement activities
31. Does the enforcement agency have a compliance and enforcement policy in place?
Yes
No
32. Number of prosecutions instigated number of successful
33. Number of seizures performed
34. Number of improvement notices served
Number: complied with not complied with
35. Number of infringement notices served
Number: paid referred to court withdrawn
36. Number of prohibition orders served
Number: complied with not complied with withdrawn
Regulatory food safety auditing
37. What is the total number of food businesses captured under Standard 3.3.1?
38. In relation to question 16, what is the total number of food safety programs that have been verified17 as of 30 June 2014?18
16
Primary producers and processor that are captured under Chapter 4 of the Food Standards Code
17 Leading to the setting of priority classification and audit frequency
as per Food Act Section 100
18 Since commencement of Part 8 of the Food Act on 23 October 2010
32
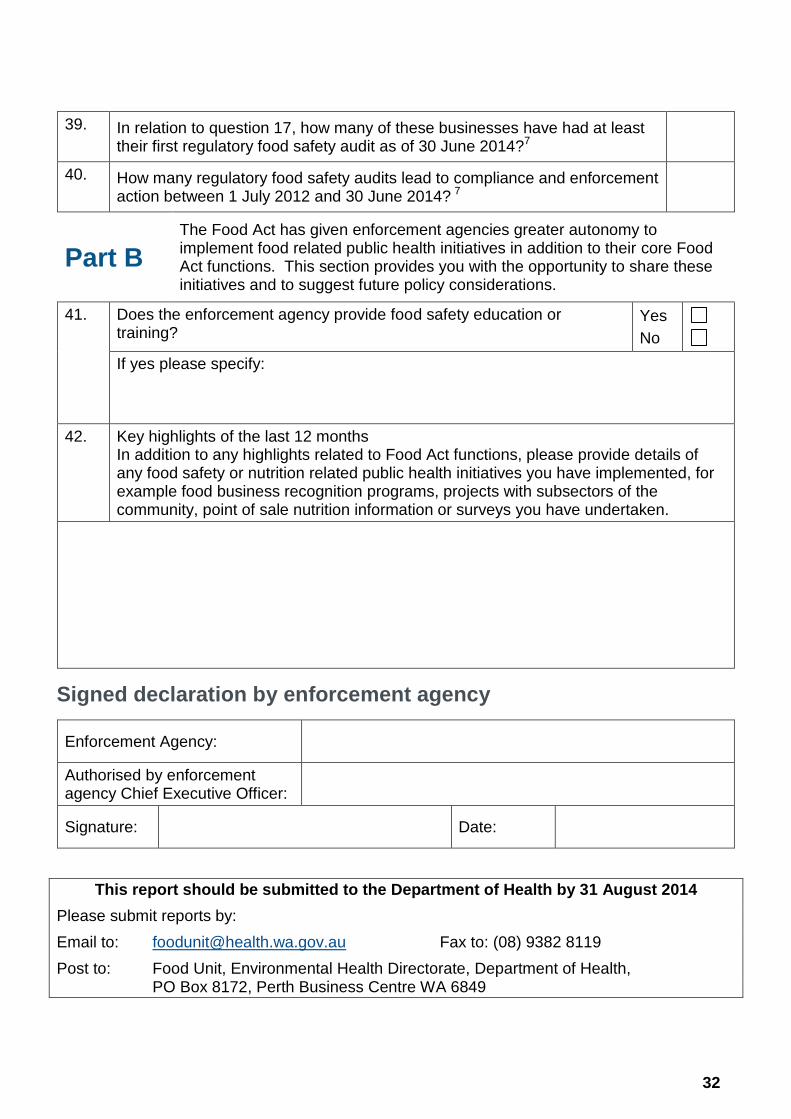
39. In relation to question 17, how many of these businesses have had at least their first regulatory food safety audit as of 30 June 2014?7
40. How many regulatory food safety audits lead to compliance and enforcement action between 1 July 2012 and 30 June 2014? 7
Part B
The Food Act has given enforcement agencies greater autonomy to implement food related public health initiatives in addition to their core Food Act functions. This section provides you with the opportunity to share these initiatives and to suggest future policy considerations.
41. Does the enforcement agency provide food safety education or training?
Yes
No
If yes please specify:
42. Key highlights of the last 12 months In addition to any highlights related to Food Act functions, please provide details of any food safety or nutrition related public health initiatives you have implemented, for example food business recognition programs, projects with subsectors of the community, point of sale nutrition information or surveys you have undertaken.
Signed declaration by enforcement agency
Enforcement Agency:
Authorised by enforcement agency Chief Executive Officer:
Signature: Date:
This report should be submitted to the Department of Health by 31 August 2014
Please submit reports by:
Email to: [email protected] Fax to: (08) 9382 8119
Post to: Food Unit, Environmental Health Directorate, Department of Health, PO Box 8172, Perth Business Centre WA 6849

This document can be made available in alternative formats on request for a person with a disability.
© Department of Health 2014
Copyright to this material is vested in the State of Western Australia unless otherwise indicated. Apart from any fair dealing for the purposes of private study, research, criticism or review, as permitted under the provisions of the Copyright Act 1968, no part may be reproduced or re-used for any purposes whatsoever without written permission of the State of Western Australia.