Embed Size (px)
Citation preview
better health * better care * better value
Incidence and costs of injury in Western Australia 2012Report prepared for the Chronic Disease Prevention Directorate Department of Health WA
Hendrie D, Miller TR, Randall S, Brameld K, Moorin RE
Acknowledgements
This report was funded by the Chronic Disease Prevention Directorate in the Public Health Division at the Department of Health WA. The authors would like to thank the Data Linkage Unit at the Department of Health WA, in particular Alex Godfrey and Peter Cosgrove, and those responsible for the collection and maintenance of the WA Hospital Morbidity Data System, the Emergency Department Data Collection and the Register of Deaths. Thanks also to Kristie Robinson from the Insurance Commission of WA for her guidance in using the personal injury claims data for the Motor Injury Insurance Scheme, to Jag Atrie from the Epidemiology Branch at the Department of Health WA for providing access to the Rates Calculator, and to Jan Lewis, Adjunct Associate Professor at the School of Public Health at Curtin University, for help in preparing the report.
Expert Review Team:
* Associate Professor Ian Li, School of Population Health, UWA
* Dr Laura Miller, Epidemiologist, Epidemiology Branch
* Denise Sullivan, Director, Chronic Disease Prevention
* Dr Erica Davison, Principal Policy Officer, Chronic Disease Prevention
* Russ Milner, Senior Policy Officer, Chronic Disease Prevention.
Incidence and costs of injury in Western Australia 2012 | i
Table of contents List of tables . . . . . . . . . . . . . . . . . . . . . . . . . . . . . . . . . . . . . . . . . . . . . . . . . . . . . . . . . . . . . . . . . . . . . . . . . . . . . . . . . . . . . . . . . . . . . . . . . . . . . . . . . . . . . . . . . . . . . . . . . . . . . . . . . . . . . . iii
List of figures . . . . . . . . . . . . . . . . . . . . . . . . . . . . . . . . . . . . . . . . . . . . . . . . . . . . . . . . . . . . . . . . . . . . . . . . . . . . . . . . . . . . . . . . . . . . . . . . . . . . . . . . . . . . . . . . . . . . . . . . . . . . . . . . . . . . . . iv
Foreword . . . . . . . . . . . . . . . . . . . . . . . . . . . . . . . . . . . . . . . . . . . . . . . . . . . . . . . . . . . . . . . . . . . . . . . . . . . . . . . . . . . . . . . . . . . . . . . . . . . . . . . . . . . . . . . . . . . . . . . . . . . . . . . . . . . . . . . . . . . . . v
Executive summary . . . . . . . . . . . . . . . . . . . . . . . . . . . . . . . . . . . . . . . . . . . . . . . . . . . . . . . . . . . . . . . . . . . . . . . . . . . . . . . . . . . . . . . . . . . . . . . . . . . . . . . . . . . . . . . . . . . . . . . . . . . . vi
1. Introduction . . . . . . . . . . . . . . . . . . . . . . . . . . . . . . . . . . . . . . . . . . . . . . . . . . . . . . . . . . . . . . . . . . . . . . . . . . . . . . . . . . . . . . . . . . . . . . . . . . . . . . . . . . . . . . . . . . . . . . . . . . . . . . . 1
2. Methodology . . . . . . . . . . . . . . . . . . . . . . . . . . . . . . . . . . . . . . . . . . . . . . . . . . . . . . . . . . . . . . . . . . . . . . . . . . . . . . . . . . . . . . . . . . . . . . . . . . . . . . . . . . . . . . . . . . . . . . . . . . . . . 2
2.1 Introduction . . . . . . . . . . . . . . . . . . . . . . . . . . . . . . . . . . . . . . . . . . . . . . . . . . . . . . . . . . . . . . . . . . . . . . . . . . . . . . . . . . . . . . . . . . . . . . . . . . . . . . . . . . . . . . . . . . . . . . 2
2.2 Injury incidence data . . . . . . . . . . . . . . . . . . . . . . . . . . . . . . . . . . . . . . . . . . . . . . . . . . . . . . . . . . . . . . . . . . . . . . . . . . . . . . . . . . . . . . . . . . . . . . . . . . . . . . . . . 2
2.3 Definition of injury events . . . . . . . . . . . . . . . . . . . . . . . . . . . . . . . . . . . . . . . . . . . . . . . . . . . . . . . . . . . . . . . . . . . . . . . . . . . . . . . . . . . . . . . . . . . . . . . . . . 3
2.3.1 Defining an ‘injury’ . . . . . . . . . . . . . . . . . . . . . . . . . . . . . . . . . . . . . . . . . . . . . . . . . . . . . . . . . . . . . . . . . . . . . . . . . . . . . . . . . . . . . . . . . . . . . . . . 3
2.3.2 Grouping records into episodes of care . . . . . . . . . . . . . . . . . . . . . . . . . . . . . . . . . . . . . . . . . . . . . . . . . . . . . . . . . . . . . . . . . . 4
2.3.3 Grouping episodes of care into a single injury event . . . . . . . . . . . . . . . . . . . . . . . . . . . . . . . . . . . . . . . . . . . . . . . 4
2.3.4 Sequelae of a previous injury . . . . . . . . . . . . . . . . . . . . . . . . . . . . . . . . . . . . . . . . . . . . . . . . . . . . . . . . . . . . . . . . . . . . . . . . . . . . . . . . . 5
2.3.5 Categories of injury severity . . . . . . . . . . . . . . . . . . . . . . . . . . . . . . . . . . . . . . . . . . . . . . . . . . . . . . . . . . . . . . . . . . . . . . . . . . . . . . . . . . 6
2.4 Costing injuries . . . . . . . . . . . . . . . . . . . . . . . . . . . . . . . . . . . . . . . . . . . . . . . . . . . . . . . . . . . . . . . . . . . . . . . . . . . . . . . . . . . . . . . . . . . . . . . . . . . . . . . . . . . . . . . . . 6
2.4.1 General approach . . . . . . . . . . . . . . . . . . . . . . . . . . . . . . . . . . . . . . . . . . . . . . . . . . . . . . . . . . . . . . . . . . . . . . . . . . . . . . . . . . . . . . . . . . . . . . . . . . 6
2.4.2 Hospital costs . . . . . . . . . . . . . . . . . . . . . . . . . . . . . . . . . . . . . . . . . . . . . . . . . . . . . . . . . . . . . . . . . . . . . . . . . . . . . . . . . . . . . . . . . . . . . . . . . . . . . . . 6
2.4.3 Emergency department costs . . . . . . . . . . . . . . . . . . . . . . . . . . . . . . . . . . . . . . . . . . . . . . . . . . . . . . . . . . . . . . . . . . . . . . . . . . . . . . . . 6
2.4.4 Costs derived from the Insurance Commission of WA . . . . . . . . . . . . . . . . . . . . . . . . . . . . . . . . . . . . . . . . . . . . 7
2.4.5 Loss of paid productivity . . . . . . . . . . . . . . . . . . . . . . . . . . . . . . . . . . . . . . . . . . . . . . . . . . . . . . . . . . . . . . . . . . . . . . . . . . . . . . . . . . . . . . . 9
2.4.6 Quality of life loss . . . . . . . . . . . . . . . . . . . . . . . . . . . . . . . . . . . . . . . . . . . . . . . . . . . . . . . . . . . . . . . . . . . . . . . . . . . . . . . . . . . . . . . . . . . . . . . . . 9
2.5 Variable definitions . . . . . . . . . . . . . . . . . . . . . . . . . . . . . . . . . . . . . . . . . . . . . . . . . . . . . . . . . . . . . . . . . . . . . . . . . . . . . . . . . . . . . . . . . . . . . . . . . . . . . . . . . . 10
2.5.1 Severity . . . . . . . . . . . . . . . . . . . . . . . . . . . . . . . . . . . . . . . . . . . . . . . . . . . . . . . . . . . . . . . . . . . . . . . . . . . . . . . . . . . . . . . . . . . . . . . . . . . . . . . . . . . . . . 10
2.5.2 Aboriginality . . . . . . . . . . . . . . . . . . . . . . . . . . . . . . . . . . . . . . . . . . . . . . . . . . . . . . . . . . . . . . . . . . . . . . . . . . . . . . . . . . . . . . . . . . . . . . . . . . . . . . . 10
2.5.3 Socioeconomic status . . . . . . . . . . . . . . . . . . . . . . . . . . . . . . . . . . . . . . . . . . . . . . . . . . . . . . . . . . . . . . . . . . . . . . . . . . . . . . . . . . . . . . . . . 10
2.5.4 Remoteness index . . . . . . . . . . . . . . . . . . . . . . . . . . . . . . . . . . . . . . . . . . . . . . . . . . . . . . . . . . . . . . . . . . . . . . . . . . . . . . . . . . . . . . . . . . . . . . . 10
2.5.5 Health region . . . . . . . . . . . . . . . . . . . . . . . . . . . . . . . . . . . . . . . . . . . . . . . . . . . . . . . . . . . . . . . . . . . . . . . . . . . . . . . . . . . . . . . . . . . . . . . . . . . . . . 10
2.5.6 Alcohol aetiological fraction. . . . . . . . . . . . . . . . . . . . . . . . . . . . . . . . . . . . . . . . . . . . . . . . . . . . . . . . . . . . . . . . . . . . . . . . . . . . . . . . . 10
2.5.7 Mechanism of injury . . . . . . . . . . . . . . . . . . . . . . . . . . . . . . . . . . . . . . . . . . . . . . . . . . . . . . . . . . . . . . . . . . . . . . . . . . . . . . . . . . . . . . . . . . . 11
2.5.8 Intent of injury . . . . . . . . . . . . . . . . . . . . . . . . . . . . . . . . . . . . . . . . . . . . . . . . . . . . . . . . . . . . . . . . . . . . . . . . . . . . . . . . . . . . . . . . . . . . . . . . . . . . 11
2.5.9 Injury diagnosis groups . . . . . . . . . . . . . . . . . . . . . . . . . . . . . . . . . . . . . . . . . . . . . . . . . . . . . . . . . . . . . . . . . . . . . . . . . . . . . . . . . . . . . . 11
2.5.10 Body region and nature of injury . . . . . . . . . . . . . . . . . . . . . . . . . . . . . . . . . . . . . . . . . . . . . . . . . . . . . . . . . . . . . . . . . . . . . . . . . . 11
2.6 Data analysis . . . . . . . . . . . . . . . . . . . . . . . . . . . . . . . . . . . . . . . . . . . . . . . . . . . . . . . . . . . . . . . . . . . . . . . . . . . . . . . . . . . . . . . . . . . . . . . . . . . . . . . . . . . . . . . . . . . 11
2.7 Strengths and limitations . . . . . . . . . . . . . . . . . . . . . . . . . . . . . . . . . . . . . . . . . . . . . . . . . . . . . . . . . . . . . . . . . . . . . . . . . . . . . . . . . . . . . . . . . . . . . . . . . 11
3. Incidence and costs of injury, 2012 . . . . . . . . . . . . . . . . . . . . . . . . . . . . . . . . . . . . . . . . . . . . . . . . . . . . . . . . . . . . . . . . . . . . . . . . . . . . . . . . . . . . . . . . . 14
3.1 Introduction . . . . . . . . . . . . . . . . . . . . . . . . . . . . . . . . . . . . . . . . . . . . . . . . . . . . . . . . . . . . . . . . . . . . . . . . . . . . . . . . . . . . . . . . . . . . . . . . . . . . . . . . . . . . . . . . . . . . 14
3.2 Incidence and costs by injury severity and sex . . . . . . . . . . . . . . . . . . . . . . . . . . . . . . . . . . . . . . . . . . . . . . . . . . . . . . . . . . . . . . . . . . 14
ii | Incidence and costs of injury in Western Australia 2012
3.3 Incidence and costs by age group and sex . . . . . . . . . . . . . . . . . . . . . . . . . . . . . . . . . . . . . . . . . . . . . . . . . . . . . . . . . . . . . . . . . . . . . . . . 15
3.4 Incidence and costs by Aboriginality. . . . . . . . . . . . . . . . . . . . . . . . . . . . . . . . . . . . . . . . . . . . . . . . . . . . . . . . . . . . . . . . . . . . . . . . . . . . . . . . . 17
3.5 Incidence and costs by socioeconomic status and severity . . . . . . . . . . . . . . . . . . . . . . . . . . . . . . . . . . . . . . . . . . . . . . . . 17
3.6 Incidence and costs by accessibility/remoteness of residence and severity . . . . . . . . . . . . . . . . . . . . . . . . . 18
3.7 Incidence and costs by health region and severity . . . . . . . . . . . . . . . . . . . . . . . . . . . . . . . . . . . . . . . . . . . . . . . . . . . . . . . . . . . . . 19
3.8 Incidence and costs by intent and mechanism of injury and severity . . . . . . . . . . . . . . . . . . . . . . . . . . . . . . . . . . 20
3.9 Incidence and costs by intent, mechanism and severity – fatalities and hospitalisations . . . . . . 21
3.10 Injuries and costs by alcohol-attributable status . . . . . . . . . . . . . . . . . . . . . . . . . . . . . . . . . . . . . . . . . . . . . . . . . . . . . . . . . . . . . . . . 24
4. Costs of injury by cost category, 2012 . . . . . . . . . . . . . . . . . . . . . . . . . . . . . . . . . . . . . . . . . . . . . . . . . . . . . . . . . . . . . . . . . . . . . . . . . . . . . . . . . . . . . 25
4.1 Introduction . . . . . . . . . . . . . . . . . . . . . . . . . . . . . . . . . . . . . . . . . . . . . . . . . . . . . . . . . . . . . . . . . . . . . . . . . . . . . . . . . . . . . . . . . . . . . . . . . . . . . . . . . . . . . . . . . . . . 25
4.2 Costs of Injury by cost category . . . . . . . . . . . . . . . . . . . . . . . . . . . . . . . . . . . . . . . . . . . . . . . . . . . . . . . . . . . . . . . . . . . . . . . . . . . . . . . . . . . . . . . 25
5. Injury trends and costs, 2003 to 2012 . . . . . . . . . . . . . . . . . . . . . . . . . . . . . . . . . . . . . . . . . . . . . . . . . . . . . . . . . . . . . . . . . . . . . . . . . . . . . . . . . . . . . . 28
5.1 Introduction . . . . . . . . . . . . . . . . . . . . . . . . . . . . . . . . . . . . . . . . . . . . . . . . . . . . . . . . . . . . . . . . . . . . . . . . . . . . . . . . . . . . . . . . . . . . . . . . . . . . . . . . . . . . . . . . . . . . 28
5.2 Trend in incidence and costs by severity . . . . . . . . . . . . . . . . . . . . . . . . . . . . . . . . . . . . . . . . . . . . . . . . . . . . . . . . . . . . . . . . . . . . . . . . . . . 28
5.3 Trend in incidence and costs by age group – fatalities and hospitalisations . . . . . . . . . . . . . . . . . . . . . . . . . 29
5.4 Trend in incidence and costs by Aboriginality – fatalities and hospitalisations . . . . . . . . . . . . . . . . . . . . . 31
5.5 Trend in incidence and costs by accessibility/remoteness – fatalities and hospitalisations . . . 32
5.6 Trend in incidence and costs by health region – fatalities and hospitalisations . . . . . . . . . . . . . . . . . . . . 32
5.7 Trend in incidence and costs by intent – fatalities and hospitalisations . . . . . . . . . . . . . . . . . . . . . . . . . . . . . . . 34
5.8 Trend in incidence and costs by mechanism – fatalities and hospitalisations . . . . . . . . . . . . . . . . . . . . . . 34
5.9 Trend in incidence and costs by mechanism and age group – fatalities and hospitalisations . . . 36
5.10 Trend in incidence and costs by alcohol-attributable status – fatalities and hospitalisations . . . . 39
6. Incidence and costs of injury by diagnosis group . . . . . . . . . . . . . . . . . . . . . . . . . . . . . . . . . . . . . . . . . . . . . . . . . . . . . . . . . . . . . . . . . . . . 40
6.1 Introduction . . . . . . . . . . . . . . . . . . . . . . . . . . . . . . . . . . . . . . . . . . . . . . . . . . . . . . . . . . . . . . . . . . . . . . . . . . . . . . . . . . . . . . . . . . . . . . . . . . . . . . . . . . . . . . . . . . . . 40
6.2 Injury costs by diagnosis group and severity – fatalities and hospitalisations . . . . . . . . . . . . . . . . . . . . . . 43
7. Discussion . . . . . . . . . . . . . . . . . . . . . . . . . . . . . . . . . . . . . . . . . . . . . . . . . . . . . . . . . . . . . . . . . . . . . . . . . . . . . . . . . . . . . . . . . . . . . . . . . . . . . . . . . . . . . . . . . . . . . . . . . . . . . . . 43
References . . . . . . . . . . . . . . . . . . . . . . . . . . . . . . . . . . . . . . . . . . . . . . . . . . . . . . . . . . . . . . . . . . . . . . . . . . . . . . . . . . . . . . . . . . . . . . . . . . . . . . . . . . . . . . . . . . . . . . . . . . . . . . . . . . . . . . . 46
Appendices
Incidence and costs of injury in health regions . . . . . . . . . . . . . . . . . . . . . . . . . . . . . . . . . . . . . . . . . . . . . . . . . . . . . . . . . . . . . . . . . . . . . . . . . . . . . . . . . . . 51
Appendix 1: North Metropolitan Health Region. . . . . . . . . . . . . . . . . . . . . . . . . . . . . . . . . . . . . . . . . . . . . . . . . . . . . . . . . . . . . . . . . . . . . . . . . . . 52
Appendix 2: South Metropolitan Health Region . . . . . . . . . . . . . . . . . . . . . . . . . . . . . . . . . . . . . . . . . . . . . . . . . . . . . . . . . . . . . . . . . . . . . . . . . . 58
Appendix 3: Goldfields Health Region . . . . . . . . . . . . . . . . . . . . . . . . . . . . . . . . . . . . . . . . . . . . . . . . . . . . . . . . . . . . . . . . . . . . . . . . . . . . . . . . . . . . . . . . 64
Appendix 4: Great Southern Health Region . . . . . . . . . . . . . . . . . . . . . . . . . . . . . . . . . . . . . . . . . . . . . . . . . . . . . . . . . . . . . . . . . . . . . . . . . . . . . . . . 71
Appendix 5: Kimberley Health Region . . . . . . . . . . . . . . . . . . . . . . . . . . . . . . . . . . . . . . . . . . . . . . . . . . . . . . . . . . . . . . . . . . . . . . . . . . . . . . . . . . . . . . . . 77
Appendix 6: Midwest Health Region . . . . . . . . . . . . . . . . . . . . . . . . . . . . . . . . . . . . . . . . . . . . . . . . . . . . . . . . . . . . . . . . . . . . . . . . . . . . . . . . . . . . . . . . . . 83
Appendix 7: Southwest Health Region . . . . . . . . . . . . . . . . . . . . . . . . . . . . . . . . . . . . . . . . . . . . . . . . . . . . . . . . . . . . . . . . . . . . . . . . . . . . . . . . . . . . . . . 89
Appendix 8: Wheatbelt Health Region . . . . . . . . . . . . . . . . . . . . . . . . . . . . . . . . . . . . . . . . . . . . . . . . . . . . . . . . . . . . . . . . . . . . . . . . . . . . . . . . . . . . . . . . 95
Appendix 9: Pilbara Health Region . . . . . . . . . . . . . . . . . . . . . . . . . . . . . . . . . . . . . . . . . . . . . . . . . . . . . . . . . . . . . . . . . . . . . . . . . . . . . . . . . . . . . . . . . . . 101
Incidence and costs of injury in Western Australia 2012 | iii
List of Tables
Table 2.1 Categories and cut-off points used to define an injury event . . . . . . . . . . . . . . . . . . . . . . . . . . . . . . . . . . . . . . . . . . . . . . . . 5Table 3.1 Incidence and costs of injury events by severity and sex, 2012 . . . . . . . . . . . . . . . . . . . . . . . . . . . . . . . . . . . . . . . . . . 15Table 3.2 Incidence and costs of injury events by age group and sex, 2012 . . . . . . . . . . . . . . . . . . . . . . . . . . . . . . . . . . . . . . . 16Table 3.3 Incidence and costs of injury events by Aboriginality and severity, 2012 . . . . . . . . . . . . . . . . . . . . . . . . . . . . 17Table 3.4 Incidence and costs of injury events by socioeconomic status and severity, 2012 . . . . . . . . . . . . . . . 18Table 3.5 Incidence and costs of injury events by accessibility/remoteness and severity, 2012 . . . . . . . . . . . 19Table 3.6 Incidence and costs of injury events by health region and severity, 2012 . . . . . . . . . . . . . . . . . . . . . . . . . . . . 20Table 3.7 Incidence and cost of injury events by intent of injury and severity, fatalities and hospitalisations, 2012 . . . . . . . . . . . . . . . . . . . . . . . . . . . . . . . . . . . . . . . . . . . . . . . . . . . . . . . . . . . . . . . . . . . . . . . . . . . . . . . . . . 21Table 3.8 Incidence and costs of injury events by intent and mechanism, fatalities and hospitalisations, 2012 . . . . . . . . . . . . . . . . . . . . . . . . . . . . . . . . . . . . . . . . . . . . . . . . . . . . . . . . . . . . . . . . . . . . . . . . . . . . . . . . . . 22Table 3.9 Incidence and costs of injury events by intent, mechanism and age group, fatalities and hospitalisations, 2012 . . . . . . . . . . . . . . . . . . . . . . . . . . . . . . . . . . . . . . . . . . . . . . . . . . . . . . . . . . . . . . . . . . . . . . . . . . . . . . . . . . 23Table 3.10 Incidence and costs of injury by alcohol-attributable status, 2012 . . . . . . . . . . . . . . . . . . . . . . . . . . . . . . . . . . . . . . 24Table 4.1 Costs of injury by cost component, 2012 . . . . . . . . . . . . . . . . . . . . . . . . . . . . . . . . . . . . . . . . . . . . . . . . . . . . . . . . . . . . . . . . . . . . . . . . . 25Table 4.2 Costs of injury by health region and cost category, 2012 . . . . . . . . . . . . . . . . . . . . . . . . . . . . . . . . . . . . . . . . . . . . . . . . . . . 26Table 4.3 Costs of injury by intent and mechanism of injury and cost category, fatalities and hospitalisations, 2012 . . . . . . . . . . . . . . . . . . . . . . . . . . . . . . . . . . . . . . . . . . . . . . . . . . . . . . . . . . . . . . . . . . . . . . . . . . . . . . . . . . 27Table 5.1 Trend in incidence and costs of injury by severity, all severity levels, 2003-2012 . . . . . . . . . . . . . . . . . 28Table 5.2 Trend in incidence and costs of injury by severity, fatalities and hospitalisations, 2003-2012 . . . . . . . . . . . . . . . . . . . . . . . . . . . . . . . . . . . . . . . . . . . . . . . . . . . . . . . . . . . . . . . . . . . . . . . . . . . . . . . . . . . . . . . . . . . . . . . . . . . . . . . . . . . . . . . . . . . . . . 29Table 5.3 Trend in incidence and costs by age group, fatalities and hospitalisations, 2003 and 2012 . . 30Table 5.4 Trend in incidence and costs of injury by age group, fatalities and hospitalisations, males, 2003 and 2012 . . . . . . . . . . . . . . . . . . . . . . . . . . . . . . . . . . . . . . . . . . . . . . . . . . . . . . . . . . . . . . . . . . . . . . . . . . . . . . . . . . . . . . . . . . . . . . . . . . . . . 30Table 5.5 Trend in incidence and costs of injury by age group, fatalities and hospitalisations, females, 2003 and 2012 . . . . . . . . . . . . . . . . . . . . . . . . . . . . . . . . . . . . . . . . . . . . . . . . . . . . . . . . . . . . . . . . . . . . . . . . . . . . . . . . . . . . . . . . . . . . . . . . . . . 31Table 5.6 Trend in incidence and costs of injury by Aboriginality, fatalities and hospitalisations, 2003 and 2012 . . . . . . . . . . . . . . . . . . . . . . . . . . . . . . . . . . . . . . . . . . . . . . . . . . . . . . . . . . . . . . . . . . . . . . . . . . . . . . . . . . . . . . . 31Table 5.7 Trend in incidence and costs of injury by ARIA, fatalities and hospitalisations, 2003 and 2012 . . . . . . . . . . . . . . . . . . . . . . . . . . . . . . . . . . . . . . . . . . . . . . . . . . . . . . . . . . . . . . . . . . . . . . . . . . . . . . . . . . . . . . . . . . . . . . . . . . . . . . . . . . . . . . . . 32Table 5.8 Trend in incidence and costs of injury by health region, fatalities and hospitalisations, 2003 and 2012 . . . . . . . . . . . . . . . . . . . . . . . . . . . . . . . . . . . . . . . . . . . . . . . . . . . . . . . . . . . . . . . . . . . . . . . . . . . . . . . . . . . . . . . . . . . . . . . . . . . . . . . . . . . . . . . . 33Table 5.9 Trend in incidence and costs of injury by intent, fatalities and hospitalisations, 2003 and 2012 . . . . . . . . . . . . . . . . . . . . . . . . . . . . . . . . . . . . . . . . . . . . . . . . . . . . . . . . . . . . . . . . . . . . . . . . . . . . . . . . . . . . . . . . . . . . . . . . . . . . . . . . . . . . . . . . 34Table 5.10 Trend in incidence and costs of injury by mechanism, fatalities and hospitalisations, 2003 and 2012 . . . . . . . . . . . . . . . . . . . . . . . . . . . . . . . . . . . . . . . . . . . . . . . . . . . . . . . . . . . . . . . . . . . . . . . . . . . . . . . . . . . . . . . . . . . . . . . . . . . . . . . . . . . . . . . . 35Table 5.11 Trend in incidence and costs of injury by mechanism and age group, fatalities and hospitalisations, 2003 and 2012 . . . . . . . . . . . . . . . . . . . . . . . . . . . . . . . . . . . . . . . . . . . . . . . . . . . . . . . . . . . . . . . . . . . 36Table 5.12 Trend in incidence and costs of injury by alcohol-attributable status, fatalities and hospitalisations, 2003 and 2012 . . . . . . . . . . . . . . . . . . . . . . . . . . . . . . . . . . . . . . . . . . . . . . . . . . . . . . . . . . . . . . . . . . . 39Table 6.1 Incidence and costs of injury by diagnosis group and severity, fatalities and hospitalisations, 2012 . . . . . . . . . . . . . . . . . . . . . . . . . . . . . . . . . . . . . . . . . . . . . . . . . . . . . . . . . . . . . . . . . . . . . . . . . . . . . . . . . . 41Table 6.2 Trend in incidence and mean costs of injury by diagnosis group, fatalities and hospitalisations, 2003 and 2012 . . . . . . . . . . . . . . . . . . . . . . . . . . . . . . . . . . . . . . . . . . . . . . . . . . . . . . . . . . . . . . . . . . . 42
iv | Incidence and costs of injury in Western Australia 2012
List of Figures
Figure 2.1 Records in the injury cost dataset . . . . . . . . . . . . . . . . . . . . . . . . . . . . . . . . . . . . . . . . . . . . . . . . . . . . . . . . . . . . . . . . . . . . . . . . . . . . . . . . . . . . . . 3
Figure 2.2 Example of an injury . . . . . . . . . . . . . . . . . . . . . . . . . . . . . . . . . . . . . . . . . . . . . . . . . . . . . . . . . . . . . . . . . . . . . . . . . . . . . . . . . . . . . . . . . . . . . . . . . . . . . . . . . . 4
Figure 2.3 Readmissions for fractures to the torso . . . . . . . . . . . . . . . . . . . . . . . . . . . . . . . . . . . . . . . . . . . . . . . . . . . . . . . . . . . . . . . . . . . . . . . . . . . . . . 5
Figure 2.4 Lapsed time from date of accident as recorded on ICWA record to a hospital admission or emergency department presentation . . . . . . . . . . . . . . . . . . . . . . . . . . . . . . . . . . . . . . . . . . . . . . . . . . . . . . . . . . . . . . . . . . . . . . . . . . . . . . . 7
Incidence and costs of injury in Western Australia 2012 | v
ForewordMessage from the Minister for Health
Every day in Western Australia our health services treat individuals who have been injured. A visit to any of the emergency departments across our hospitals will give a glimpse of the daily toll injuries take on the lives of individuals, their families and the people and systems that provide their care.
In 2012 there were 227,000 injury events with an associated total lifetime cost of $9.6 billion. The figures are staggering. Even more deeply disturbing are the hidden human stories behind the statistics; the hardship and pain, the courage and perseverance of individuals and their families.
This report builds on the findings of a 2003 study and provides a more comprehensive estimate of the frequency and costs of different types of injuries. It sets out in stark detail the human and financial costs of injury for this State. It provides compelling evidence of human frailty and for concerted action to protect and prevent the harms it quantifies.
This Government is committed to the prevention of injury and community safety. Injury remains a serious public health problem in Western Australia and nationally. It is also a problem that can be prevented through removal of the causes or people’s exposure to them.
The Incidence and Costs of Injury in Western Australia 2012 is an important and useful resource for governments and communities, providing the most up-to-date and complete information to help inform priorities and planning in our endeavours to address the high social and financial costs of injury.
John Day MINISTER FOR HEALTH; CULTURE AND THE ARTS
vi | Incidence and costs of injury in Western Australia 2012
Executive summaryThis report provides estimates of the incidence and costs of injury in Western Australia in 2012 with comparison made primarily with equivalent data for 2003. The incidence of injuries and corresponding costs are stratified across multiple dimensions including by sociodemographic factors, regions, types of injury and alcohol involvement. The study builds on a previous cost-of-injury report for WA and will inform government and non-government programs, policies and services to address this important public health problem.
Data were drawn from linked administrative health data and personal injury claims data for the Motor Injury Insurance Scheme administered by the Insurance Commission of WA. Incidence counts were based on injury events, with episodes of care relating to a specific injury combined into a single event. Injury costs included were health sector costs, costs relating to longer term care needs, loss of paid productivity and quality of life loss. The study excluded costs like property damage, workplace disruption, fire services, and criminal justice that result from injury incidents but are not injury costs. Costs were calculated using an incidence-based approach computed by assessing the lifetime costs of all injuries in a given year. Methods for allocating costs to injury events included direct mapping of unit costs drawn from relevant sources and cost modelling using regression analysis. All costs are expressed in 2014 Australian dollars. The study’s limitations, notably the assumption that costs modelled from the Motor Injury Insurance Scheme equalled costs for injuries with similar diagnoses and different causes, are detailed in the report.
Injury events were grouped as follows: (i) injury events resulting in death; (ii) injury events resulting in hospitalisation with survival to discharge; and (iii) injury events receiving treatment at an emergency department not resulting in hospitalisation or death.
Key findings of the study were as follows:
Incidence and costs by sociodemographic factors
* In 2012, the number of injury events in WA was 227,000 or 93 injuries per 1,000 population. The total costs were $9.6 billion.
* Health sector costs accounted for 12.3% of total costs, long term care costs for 3.2%, loss of paid productivity for 19.8%, and loss of quality of life for 64.7%.
* Fatal injuries comprised 0.6% of injury events, non-fatal injuries requiring hospitalisation 22.1%, and those only requiring emergency department presentations 77.3%. However, fatalities accounted for 61% of the total costs of injury.
* Males had a higher rate of injury events than females, and accounted for 63% of all injury costs.
* The injury rate was highest in the 85 years and above age group, with high rates also in the 10-14, 15-19 and 20-24 year age groups. Mean cost of injury increased with age, from around $11,000 per injury event for younger people to over $200,000 for the 85 years and above age group.
* Aboriginal people had more than double the rate of fatal injuries and more than triple the rate of non-fatal hospitalisations compared to non-Aboriginal people. Compared with a share of 3.6% of total population in WA, Aboriginal people accounted for 7.7% of total injury costs.
* Those in the most disadvantaged socioeconomic quintile had 2.3 times as many fatalities, and 1.6 times as many non-fatal hospitalisations and emergency presentations when compared to the least disadvantaged socioeconomic quintile. Total costs in the most disadvantaged quintile were 1.8 times higher than in the least disadvantaged quintile.
Incidence and costs of injury in Western Australia 2012 | vii
* Rates of injury were higher in non-metropolitan regions, with the Kimberley, Wheatbelt and Goldfields health regions having rates more than double those in the metropolitan region. Mean costs per injury event were generally lower in non-metropolitan regions.
Incidence and costs by intent and mechanism
* Intentional self-harm accounted for 24.2% of fatal injuries, 6.3% of non-fatal hospitalisations, and $1.6 billion in costs.
* Falls and transport injuries were the most common unintentional injuries. Falls accounted for 32.5% of fatal injuries, 32.5% of non-fatal hospitalisations, and $2.2 billion in costs. Transport injuries accounted for 13.6% of fatalities, 11.5% of non-fatal hospitalisations and $1.1 billion in costs.
Incidence and costs by alcohol-attributable status
* Alcohol was involved in 17.5% of fatalities, 11.8% of non-fatal hospitalisations, and 32% of emergency department presentations. The overall cost of injuries involving alcohol was $1.9 billion.
Trends in incidence and costs of injury
* Emergency department data were not included in the trend analyses as data were not available for all emergency departments outside of the metropolitan area prior to 2008. All comparisons reported in this section compare injury incidence and costs between 2003 and 2012.
* The age-standardised rate of fatal injury events remained stable, while the rate of non-fatal injury hospitalisations increased, along with the total cost of injury events. The mean cost per injury event declined over the period.
* The age-standardised rate of injury events increased most for people in the 65 years and above age group with the share of total costs for this age group increasing from 34.8% to 36.5%.
* Compared to 2003, the rate of fatal injury events in Aboriginal people decreased, while the hospitalisation rate remained stable. In contrast, the rate of injury events remained constant for non-Aboriginal people while their hospitalisation rate increased. The difference in mean cost of injury between Aboriginal and non-Aboriginal people was reduced.
* Age-standardised rates of falls and self-harm injury events increased over the period, while the trend for most other mechanisms of injury remained relatively constant. For falls, the most notable increase was in the 65 years and above age group. For self-harm injuries, the rate increased most in the 15-24 year age group. Mean costs decreased for all mechanisms of injury other than poisoning and self-harm.
Incidence and costs by diagnosis group
* Superficial injury/open wounds and upper extremity injuries were the most commonly occurring injury types, with injuries to internal organs and burns occurring least frequently. Mean costs per injury event were highest for hip fractures and skull/brain injuries, both exceeding $300,000. Mean costs per injury events decreased over time for all diagnosis groups other than skull/brain injuries.
Cost estimates reported in this study for 2003 are higher than reported for the same year in the previous cost-of-injury report. A major reason for this difference was the use in this study of a higher willingness-to-pay value of statistical life as recommended by the Office of Best Practice Regulation. Furthermore, using the linked health data to calculate injury events and applying more advanced techniques in allocating costs to injury events makes comparison of the costs of injury in the two studies inappropriate.
viii | Incidence and costs of injury in Western Australia 2012
These new estimates of the public health impact of injuries can improve injury prevention and planning, policy analysis, evaluation and advocacy. High quality data are important to provide an accurate reflection of how injuries affect society and the potential to reduce injuries cost-effectively. In comparing the incidence and costs of injury across multiple dimensions, this study provides information to policymakers, health professionals and other injury prevention stakeholders to identify areas where further prevention and care are most needed. Priority areas requiring targeted preventive interventions include injuries shown to have high incidence, high costs per injury event or a combination of both. In addition to the share in total burden of injury, other policy criteria may be required to direct preventive policy towards injuries, such as individual injury severity, or towards disadvantaged groups, to improve injury outcomes and reduce inequitable differences in the burden of injury.
Incidence and costs of injury in Western Australia 2012 | 1
1. Introduction Injuries are a leading cause of the burden of death and disability, internationally and in Australia. The Global Burden of Disease (GBD) 2013 study showed injuries accounting for 10.1% of the global burden of disease (1), consistent with an earlier estimate of 9.8% in 1990 (2). The corresponding contribution of injury in the burden of death and disability in Australia is 7.4% (1).
Injuries remain one of the most serious public health problems in Western Australia, ranking fourth as a cause of death, fourth as a specific cause of hospitalisation, second as a cause of potential years of life lost and fifth as a cause of disease burden (3). Leading causes of injury deaths and hospitalisations include injury from falls, interpersonal violence, suicide, transport, poisoning, burns and scalds, and drowning (4).
Recognition of injury prevention and control as one of nine national Health Priority Areas by the Australian Government resulted in the development of several national injury plans, including the National Injury Prevention and Safety Promotion Plan: 2004-2014, the National Aboriginal and Torres Strait Islander Safety Promotion Strategy, the National Falls Prevention for Older People Plan: 2004 Onwards and the National Road Safety Strategy 2011-2020 (5, 6). In WA, the Western Australian Health Promotion Strategic Framework 2012-2016 has identified the creation of safer communities as one of six strategic directions, the plan identifying several priority areas to reduce the occurrence of injuries (6).
Notwithstanding national and state efforts to reduce the incidence and severity of injuries, injury remains a common and costly affliction, with fatalities due to injuries occurring in all age groups and life years lost due to injuries exceeding those from many other causes. Moreover, injuries are more likely than many other conditions to have lasting effects that cause permanent losses in functional capacity and reduced quality of life and loss of productivity.
Quantifying the costs associated with injuries is important. Cost estimates reduce different types of injury to a common metric, thus enabling the relative size of various problems to be gauged and health priorities to be set. Measuring the benefits of interventions in monetary terms also helps planners and evaluators estimate the ‘net cost’ of a safety investment (that is, the total cost of the investment minus the benefits accrued), and as such may inform resource allocation. Moreover, cost as a measure of the burden of injury is easy to understand and can help to highlight the significance of the problem (7, 8).
Only three studies have produced detailed estimates of the cost of injury in Australia, with the latest one presenting costs of injury for Western Australia in 2003 (9-11). These reports provided cost-of-injury estimates that helped draw recognition of injury as a major public health issue. However, these cost estimates are outdated and may no longer portray accurately the burden injuries place on society. Moreover, improved administrative datasets, and the availability of linked health data connecting information across datasets for the same person, allow population-based study of health care usage for injury events and better assessment of longer term outcomes and their costs.
This report builds on the previous cost-of-injury report for WA and describes the overall burden of injury in Western Australia. Burden is defined to include incidence and costs, the latter including health sector costs, costs relating to longer term care needs, loss of paid productivity (or economic loss) and quality of life loss. The study covers injury events resulting in an emergency department presentation, hospital admission or a fatality, thus omitting less severe injuries treated by a general practitioner or other primary health care provider. The incidence of injuries and corresponding costs are stratified across multiple dimensions including by sociodemographic factors, regions, types of injury and alcohol involvement. Incidence and cost data are provided for 2012, and compared primarily with corresponding data for 2003. Differences in the costs of injury in 2003 presented in this report and the earlier one reflect methodological differences, with improved data and more current and advanced techniques adopted in this report.
2 | Incidence and costs of injury in Western Australia 2012
This study is a cost-of-illness analysis, specifically calculating the cost of injury in WA. Cost-of-illness studies can be either prevalence- or incidence-based (12). Prevalence-based estimates are cross-sectional estimates of costs that occur during a specified time period, typically a year, regardless of the date of onset of the illness. In contrast, incidence-based estimates measure lifetime costs of an illness from onset to conclusion for cases occurring within the period of study, usually a year (12). This study, as in the previous study, employs an incidence-based approach by quantifying the present value of lifetime costs that result from injuries occurring in a single year.
The report has been organised into chapters. Chapter 2 describes the methodology used in this study including a description of the data sources, definitions, analytical methods and strengths and limitations. Chapter 3 provides estimates of the incidence of injuries and corresponding costs in the year 2012, stratified by sociodemographic factors, regions, types of injury and alcohol involvement. Chapter 4 shows the composition of costs by cost component including to the health sector, other sectors, loss of productivity and quality of life loss. Chapter 5 compares the incidence of injuries and costs for the years 2003 and 2012 stratified across multiple dimensions. Chapter 6 presents the incidence of injuries and costs by broad diagnosis group. Chapter 7 provides an overview of the results and discusses implications for future injury prevention and research. The Appendices provide incidence and cost estimates in 2012 for each health region.
2. Methodology2.1 Introduction
This chapter outlines the research methodology used to measure the costs of injury in Western Australia. The next three sections discuss the data sources used to determine the incidence of injuries in WA, how injury events were defined and methods adopted to allocate cost components to injury events. In the following section, data analysis methods are described. In the final two sections, variable definitions are presented and strengths and limitations discussed.
2.2 Injury incidence data
Data were drawn from three core data collections from the Department of Health WA including the hospital morbidity data collection, the emergency department data collection and death registrations. Data were also obtained from the administrative personal injury claims data for the Motor Injury Insurance Scheme administered by the Insurance Commission WA (ICWA). The core health data collections and the injury claims data were linked by the Western Australian Data Linkage System (WADLS) after ethics clearance through the Department of Health WA Human Research Ethics Committee (HREC), the WA Aboriginal Health Ethics Committee (WAAHEC) and the Curtin University HREC. The WADLS is a validated, continuing, dynamic data linkage system that creates links between state-level health-related datasets and other data collections (13).
A de-identified extraction of all hospital morbidity records, emergency department records, death records and injury claims records belonging to all people who were injured between 1 January 2003 and 31 December 2012 was performed. Sociodemographic, diagnostic and external cause data from each data collection was included in the extraction with additional crash-related data obtained from the injury claims dataset.
Incidence and costs of injury in Western Australia 2012 | 3
A case was defined as any person who was injured or had an ICWA injury claims record indicating a road crash from 2003 to 2012. For the health and mortality datasets, injuries were classified using the International Classification of Diseases 10th Edition (ICD-10), Australian Modification diagnosis codes. Records were identified as being injury-based if the primary diagnosis was an injury. This included:
* Hospital records with primary diagnosis field as an injury
* Emergency presentation records with primary diagnosis field as an injury
* Emergency presentation records with major diagnostic category listed as 21 (Injuries, poisonings and toxic effects of drugs) or 22 (Burns)
* A mortality record with coded cause of death field as an injury.
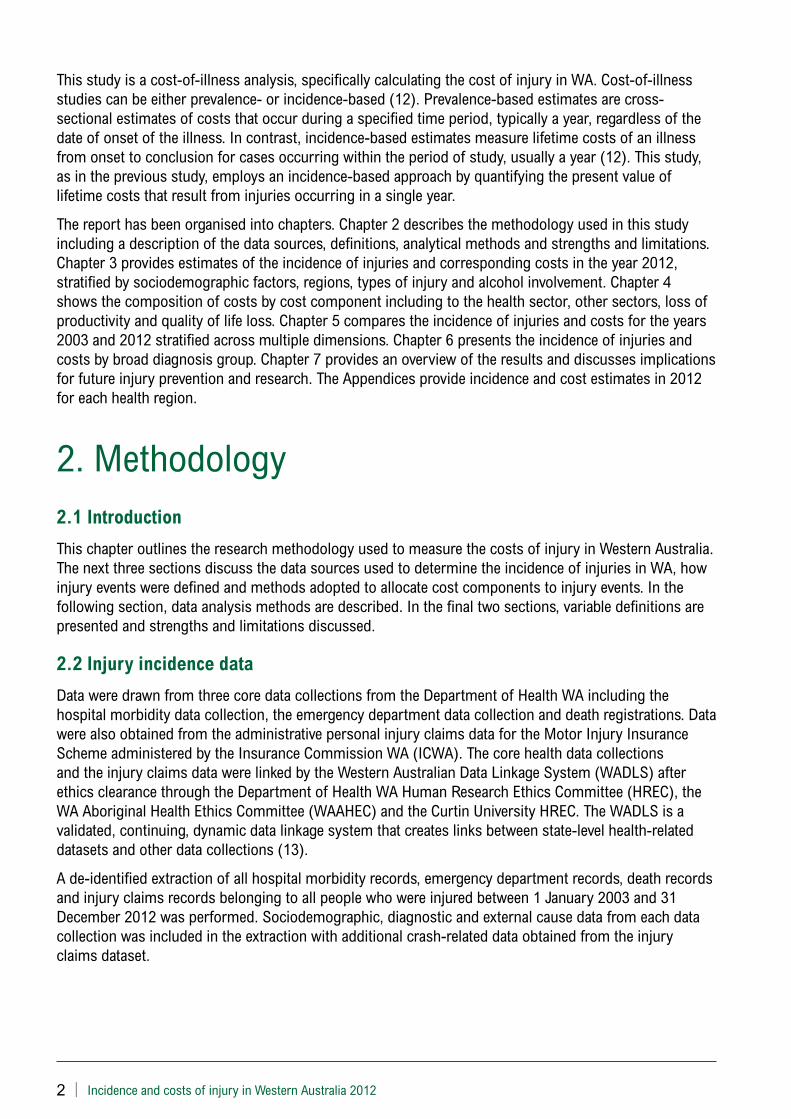
The following ICD codes were used to identify an injury: S00-S99, T00-T79, T89, T90-T99, V00-Y39. Injuries relating to complications of medical and surgical care were excluded (T80-T88, Y62-Y99). Including the injury claims data used in modelling costs, the number of records in the final injury cost dataset was 13,243,569, with records relating to 2,591,141 episodes of care and 2,454,144 injuries (Figure 2.1).
97,924 records
Total number of records: 13,243,569Total number of injury episodes of care: 2,591,141Total number of injuries: 2,454,144
A black line indicates files are joined by Root Number.A grey dashed line indicates files are joined by Accident Number.
Insurance commission data is joined internally by accident number. In addition, insurance commission datasets can contain multiple records per accident number.
Insurance Commission WA Crash
Cases Morbidity
Cases Emergency
Cases DeathCases Root
5,494,115 records
6,377,962 records
487,117 records
Insurance Commission WA Bed Days 487,117 records
Insurance Commission WA Payments 487,117 records
Figure 2.1: Records in the injury cost dataset
2.3 Definition of injury events
2.3.1 Defining an ‘injury’
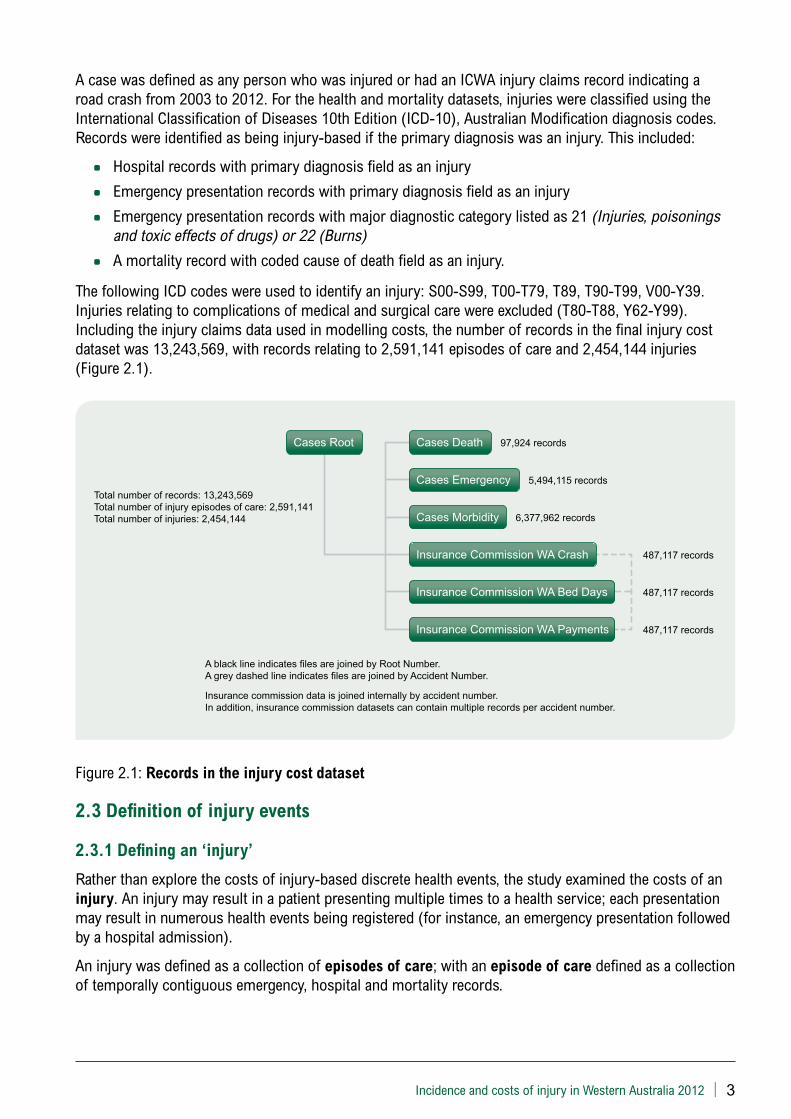
Rather than explore the costs of injury-based discrete health events, the study examined the costs of an injury. An injury may result in a patient presenting multiple times to a health service; each presentation may result in numerous health events being registered (for instance, an emergency presentation followed by a hospital admission).
An injury was defined as a collection of episodes of care; with an episode of care defined as a collection of temporally contiguous emergency, hospital and mortality records.
4 | Incidence and costs of injury in Western Australia 2012
ED Presentation − Car Crash − 1 August 2004 (admitted)
Injury
Hospital Admission − ICU − 1-3 August 2004 (transferred)
Hospital Admission − General Ward 3-10 August 2004(discharged home)
ED Presentation − Sequalae of Previous Injury − 29 August 2004 (discharged home)
Episode of care
Episode of care
Figure 2.2: Example of an injury
2.3.2 Grouping records into episodes of care
Hospital separation records with a mode of separation marked as a transfer to another hospital or a transfer to another ward were joined together with a second hospital separation record where the separation month and year of the first record matched the admission month and year of the second record (admission/separation day was not made available for this study). There was no limit on the number of hospital records which could be joined together in this way.
Emergency presentation records with a disposal code marked as an admission to hospital were joined with a hospital separation record marked as an admission from an emergency department, where the emergency presentation month and year were the same as the hospital admission month and year.
Finally, mortality records were joined to any hospital admission or emergency presentation where the patient was recorded as deceased.
2.3.3 Grouping episodes of care into a single injury event
Episodes of care with the same injury diagnosis category are more likely to relate to the same underlying injury (rather than a completely separate injury) when there is little temporal difference between them (14).
To identify when two episodes of care belonged to the same injury, a temporal cut-off point was used. Where two episodes of care occurred within a certain time frame, and both were for the same broad injury category, they were marked as belonging to the same injury. The cut-off used varied depending on the type of injury.
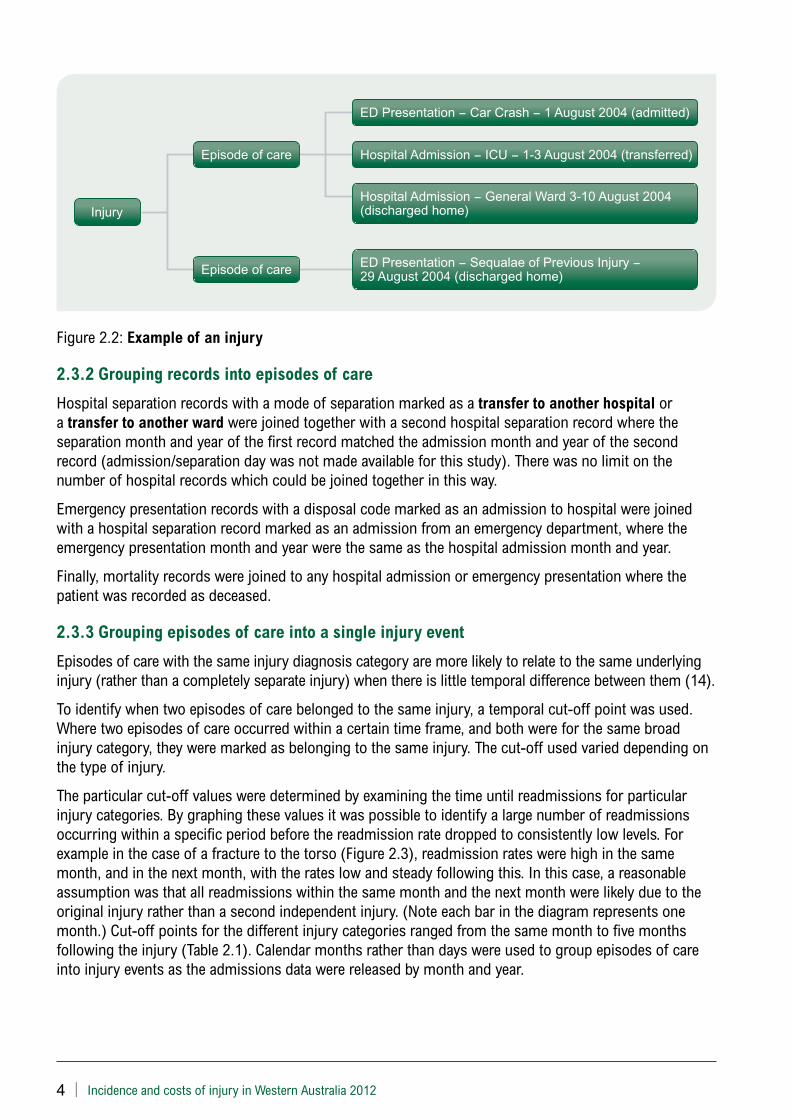
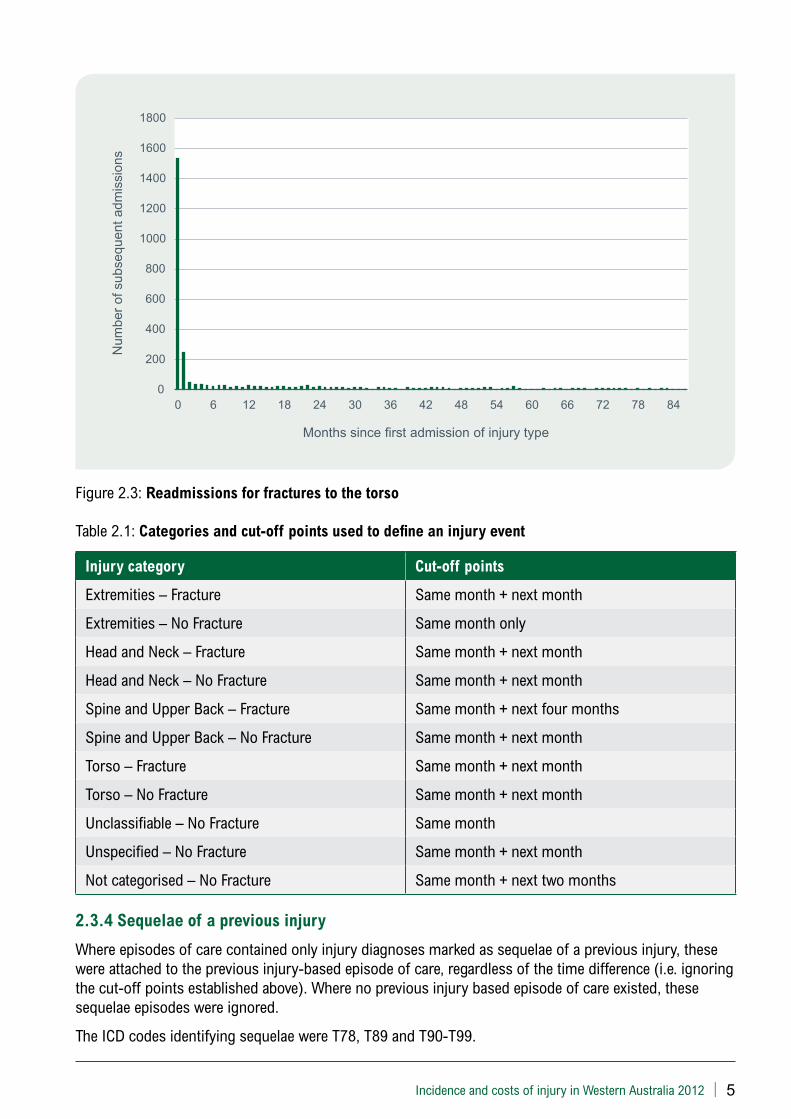
The particular cut-off values were determined by examining the time until readmissions for particular injury categories. By graphing these values it was possible to identify a large number of readmissions occurring within a specific period before the readmission rate dropped to consistently low levels. For example in the case of a fracture to the torso (Figure 2.3), readmission rates were high in the same month, and in the next month, with the rates low and steady following this. In this case, a reasonable assumption was that all readmissions within the same month and the next month were likely due to the original injury rather than a second independent injury. (Note each bar in the diagram represents one month.) Cut-off points for the different injury categories ranged from the same month to five months following the injury (Table 2.1). Calendar months rather than days were used to group episodes of care into injury events as the admissions data were released by month and year.
Incidence and costs of injury in Western Australia 2012 | 5
0
200
400
600
800
1000
1200
1400
1600
1800
0 6 12 18 24 30 36 42 48 54 60 66 72 78 84
Num
ber
of s
ubse
quen
t ad
mis
sion
s
Months since first admission of injury type
Figure 2.3: Readmissions for fractures to the torso
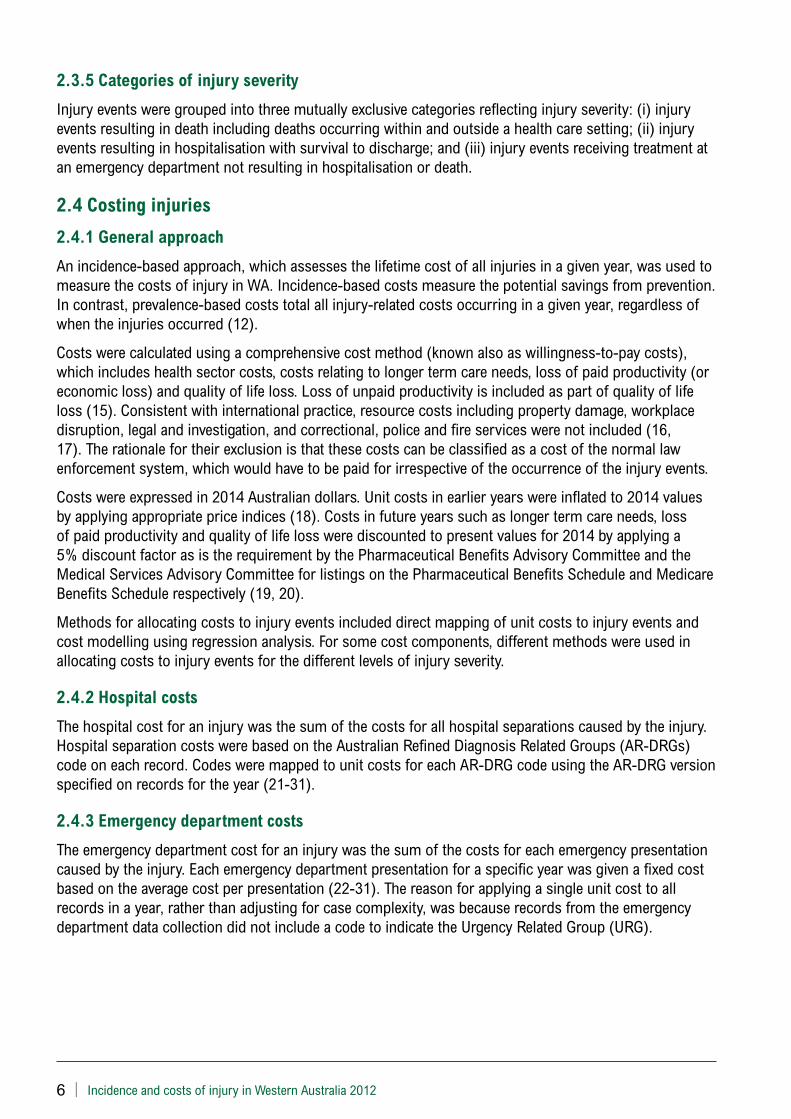
Table 2.1: Categories and cut-off points used to define an injury event
Injury category Cut-off points
Extremities – Fracture Same month + next month
Extremities – No Fracture Same month only
Head and Neck – Fracture Same month + next month
Head and Neck – No Fracture Same month + next month
Spine and Upper Back – Fracture Same month + next four months
Spine and Upper Back – No Fracture Same month + next month
Torso – Fracture Same month + next month
Torso – No Fracture Same month + next month
Unclassifiable – No Fracture Same month
Unspecified – No Fracture Same month + next month
Not categorised – No Fracture Same month + next two months
2.3.4 Sequelae of a previous injury
Where episodes of care contained only injury diagnoses marked as sequelae of a previous injury, these were attached to the previous injury-based episode of care, regardless of the time difference (i.e. ignoring the cut-off points established above). Where no previous injury based episode of care existed, these sequelae episodes were ignored.
The ICD codes identifying sequelae were T78, T89 and T90-T99.
6 | Incidence and costs of injury in Western Australia 2012
2.3.5 Categories of injury severity
Injury events were grouped into three mutually exclusive categories reflecting injury severity: (i) injury events resulting in death including deaths occurring within and outside a health care setting; (ii) injury events resulting in hospitalisation with survival to discharge; and (iii) injury events receiving treatment at an emergency department not resulting in hospitalisation or death.
2.4 Costing injuries
2.4.1 General approach
An incidence-based approach, which assesses the lifetime cost of all injuries in a given year, was used to measure the costs of injury in WA. Incidence-based costs measure the potential savings from prevention. In contrast, prevalence-based costs total all injury-related costs occurring in a given year, regardless of when the injuries occurred (12).
Costs were calculated using a comprehensive cost method (known also as willingness-to-pay costs), which includes health sector costs, costs relating to longer term care needs, loss of paid productivity (or economic loss) and quality of life loss. Loss of unpaid productivity is included as part of quality of life loss (15). Consistent with international practice, resource costs including property damage, workplace disruption, legal and investigation, and correctional, police and fire services were not included (16, 17). The rationale for their exclusion is that these costs can be classified as a cost of the normal law enforcement system, which would have to be paid for irrespective of the occurrence of the injury events.
Costs were expressed in 2014 Australian dollars. Unit costs in earlier years were inflated to 2014 values by applying appropriate price indices (18). Costs in future years such as longer term care needs, loss of paid productivity and quality of life loss were discounted to present values for 2014 by applying a 5% discount factor as is the requirement by the Pharmaceutical Benefits Advisory Committee and the Medical Services Advisory Committee for listings on the Pharmaceutical Benefits Schedule and Medicare Benefits Schedule respectively (19, 20).
Methods for allocating costs to injury events included direct mapping of unit costs to injury events and cost modelling using regression analysis. For some cost components, different methods were used in allocating costs to injury events for the different levels of injury severity.
2.4.2 Hospital costs
The hospital cost for an injury was the sum of the costs for all hospital separations caused by the injury. Hospital separation costs were based on the Australian Refined Diagnosis Related Groups (AR-DRGs) code on each record. Codes were mapped to unit costs for each AR-DRG code using the AR-DRG version specified on records for the year (21-31).
2.4.3 Emergency department costs
The emergency department cost for an injury was the sum of the costs for each emergency presentation caused by the injury. Each emergency department presentation for a specific year was given a fixed cost based on the average cost per presentation (22-31). The reason for applying a single unit cost to all records in a year, rather than adjusting for case complexity, was because records from the emergency department data collection did not include a code to indicate the Urgency Related Group (URG).
Incidence and costs of injury in Western Australia 2012 | 7
2.4.4 Costs derived from the Insurance Commission of WA
Injury claims data obtained from ICWA included payments to claimants for the following cost components: allied health, medical services, ambulance, aids, equipment and modifications, long term care, loss of paid productivity and loss of amenities. These payments were used to model costs for non-fatal injury events. Injury claims data used in modelling costs was included only for those claimants whose claims were finalised or could be assumed to be finalised given the time that had lapsed from the date of the crash.
Where insurance records linked up with an injury event recorded in the hospital morbidity data collection or emergency department data collection, the cost components in the personal injury claims data were directly attached to the injury event record.
Where an injury event did not have an insurance record (for instance, because the injury was not caused by a motor vehicle crash), these cost components were estimated using regression models developed from the injury claims data for similar types of injuries. This enabled these cost components to be estimated for all injuries in WA.
Joining insurance records to injuries
While the linking of insurance records to the health data indicated which insurance records belonged to which person, an additional process was required to determine whether a particular hospital admission, emergency presentation or mortality record was associated with a particular motor vehicle crash documented in the ICWA system.
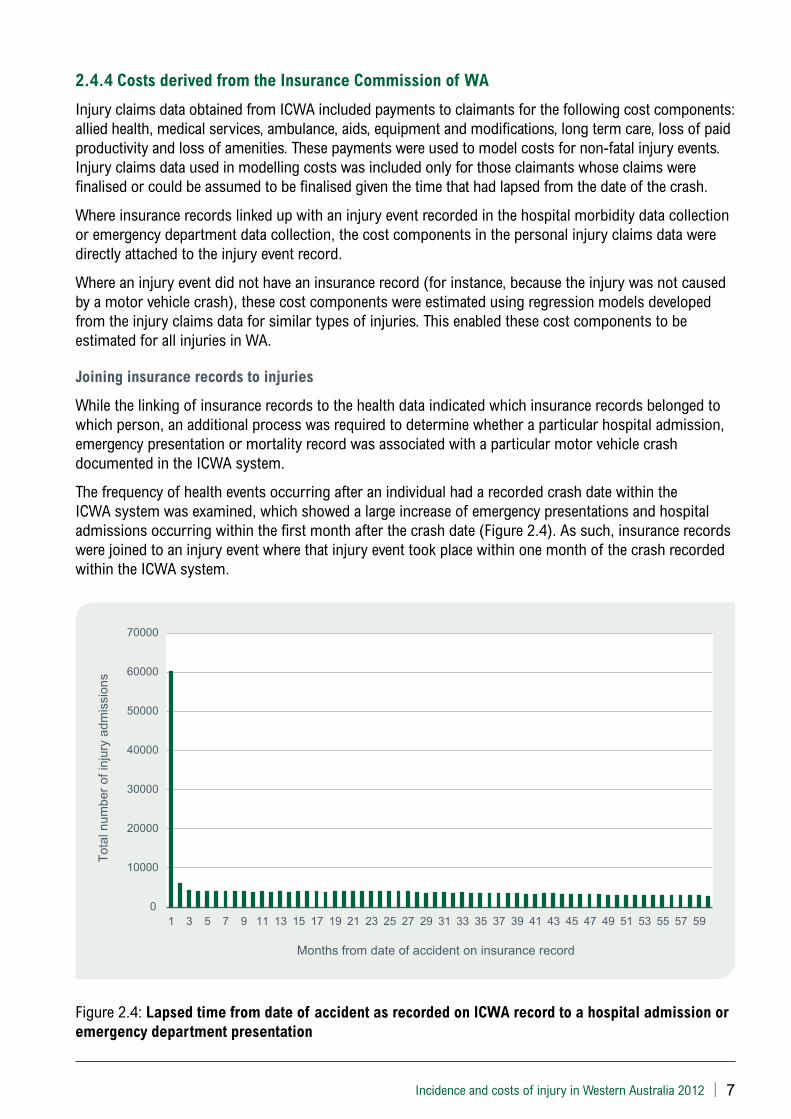
The frequency of health events occurring after an individual had a recorded crash date within the ICWA system was examined, which showed a large increase of emergency presentations and hospital admissions occurring within the first month after the crash date (Figure 2.4). As such, insurance records were joined to an injury event where that injury event took place within one month of the crash recorded within the ICWA system.
0
10000
20000
30000
40000
50000
60000
70000
1 3 5 7 9 11 13 15 17 19 21 23 25 27 29 31 33 35 37 39 41 43 45 47 49 51 53 55 57 59
Tot
al n
umbe
r of
inju
ry a
dmis
sion
s
Months from date of accident on insurance record
Figure 2.4: Lapsed time from date of accident as recorded on ICWA record to a hospital admission or emergency department presentation
8 | Incidence and costs of injury in Western Australia 2012
Estimating costs using insurance data
Using insurance claims linked to health events (hospital admissions and emergency department presentations), statistical models were developed which predicted the cost components listed above, using explanatory variables from the hospital admissions and emergency presentation records. These models were then applied to hospital admission and emergency presentation records which did not have an insurance claim, providing direct estimates of the additional cost components.
Each cost component (listed above) was modelled separately. In addition, those injuries resulting in a hospital admission were modelled separately to those involving only an emergency presentation.
Generalised linear modelling was used to estimate costs (32-34). Several varieties of this model were tested, using different link functions (log, identity, inverse) and distributions (gamma, negative binomial, Poisson). In addition, two-part models were also tested; these models use a logistic regression to account for a zero versus a positive value; the positive value is then fitted with an appropriate regression model (32, 35).
Sex, broad age category (<18, 18-65, 65+), nature of injury (e.g. open wound, fracture, etc.), body region of injury, length of stay and exposure time (survival time) were all tested as possible variables within the model. A small number of outlying insurance payment values were also removed. Values were considered outliers when they were both very large and were disconnected from the general distribution of costs (i.e. 30% larger than the next largest value). No more than 20 values (of approximately 370,000) were considered outliers for any particular cost.
Models were compared for goodness of fit using the Akaike Information Criterion (AIC) and the Bayesian Information Criterion (BIC). In addition, the data was split into a ‘training set’ and a ‘validation set’, with the model fitted on the training set and used to predict responses in the validation set, with the Pearson correlation between predicted and actual values used as a further measure of goodness of fit (36, 37).
The final chosen model used sex, age category, nature of injury, body region of injury and exposure time within a two-part model, using logistic regression for the first part, and a generalised linear model for the second, with a gamma distribution and a log-link function. A two-part model was selected because a substantial proportion of cases had zero costs for some components, and two-part models take account of this by distinguishing between a binary indicator, used to model the probability of any costs, and a conditional regression model for the positive costs (38). Zero costs reflected cases in the insurance records not having incurred costs for a particular component. Generalised linear models have been shown to perform well in the estimation of population means of healthcare costs (39), with the gamma model with a log link potentially providing more robust estimators (40).
For a given cost y and set of predictors x, the structure of the two-part model was as follows:
E(y|x) = Prob (y>0|x) ∙E (y|y>0,x)
That is, the estimated cost was modelled as the probability of a non-zero cost given the predictors, multiplied by the estimated cost given the predictors, assuming a non-zero cost.
Prob(y>0|x) was modelled using a standard logit regression:
logit (Prob (y>0|x)) = ß0 + ß1 X1 + ß2 X2 + ß3 X3 + ß4 X4
where X1 was a categorical coding for sex, X2 a categorical coding for nature of injury, X3 a categorical coding for body region of injury, and X4 the log of exposure time.
E(y|y > 0,x) was modelled using a generalised linear model with gamma distribution and a log-link function, with the linear predictors as above.
Incidence and costs of injury in Western Australia 2012 | 9
The chosen model was further validated by comparing predictive to actual values for each dependent variable, using bootstrapping to generate confidence intervals (37). Actual values fell within predictive confidence intervals consistently.
Actual or modelled costs from the injury claims data were used to estimate the costs of allied health, medical services, ambulance, aids, equipment and modifications, and long term care for injury events resulting in hospitalisation and those receiving treatment at an emergency department. Ambulance costs for injury events resulting in death were calculated based on the proportion of deaths that occurred in hospital as reported in the hospital morbidity data collection multiplied by the cost of urgent or life threatening ambulance trips for all callouts in the metropolitan region (41). Other costs including for allied health, medical services, aids, equipment and modifications, and long term care were not included for injury events resulting in deaths.
Actual or modelled costs from the injury claims data were also used to estimate loss of paid productivity for injury events resulting in hospitalisation and those receiving treatment at an emergency department and to estimate quality of life loss for injury events receiving treatment at an emergency department (see below).
2.4.5 Loss of paid productivity
Loss of paid productivity was calculated differently for injury events resulting in death and those resulting in hospitalisation or treatment at an emergency department.
Where the injury event resulted in death, the present value of loss of earnings was calculated by single ages and sex based on average weekly earnings, life expectancy and the productivity growth rate (17, 42-44). The present value of lost earnings represents loss of paid productivity for the death of an ‘average’ person at each age.
Where the injury event did not result in death, loss of paid productivity for each injury event was derived from estimates modelled from ICWA’s injury claims data.
2.4.6 Quality of life loss
Quality of life loss was calculated differently depending on the severity of the injury event.
For injury events resulting in treatment at an emergency department only, quality of life loss for each injury event was derived from actual or modelled costs from the injury claims data using loss of amenities as a proxy for quality of life loss.
Where the injury event resulted in a hospitalisation not resulting in death, quality of life loss was modelled from the Global Burden of Disease study 2013 based on disability weights (45). A disability weight is a weight factor reflecting the severity of a disease or injury on a scale from 0 (perfect health) to 1 (equivalent to death). Years lost to disability (YLD) for non-fatal cases are calculated by multiplying the disability weight by duration of disability (46). Injury events classified by ICD-10 diagnosis codes were mapped to Global Burden of Disease nature of injury codes using an adapted version of a crosswalk from the New Zealand Burden of Diseases, Injuries and Risk Factors Study 2006-2016 (47). Disability weights for injury in the short term and long term, and the probability of long-term outcomes, were obtained from the online Burden Calculator (a software tool for estimating the population burden of injuries), and these weights and probabilities used to estimate health loss measured in DALYs (44, 45). Health loss measured in DALYs was monetised based on the value of a statistical life of $4.2m as recommended by the Office of Best Practice Regulation, adjusted to exclude the after-tax value of loss of paid productivity and taking account of the age- and gender-adjusted present value of life expectancy for people surviving to that age relative to the present value of life expectancy for the population (44, 48, 49). The latter adjustment adjusts for the present value of length of time over which quality of life is lost.
10 | Incidence and costs of injury in Western Australia 2012
Quality of life loss for fatalities was valued using the estimate of the value of statistical life recommended by the Office of Best Practice Regulation, computed net of the after-tax value of loss of paid productivity (12, 48).
2.5 Variable definitions
2.5.1 Severity
Injuries resulting in death were defined as the most severe. Those injuries involving hospitalisation but not death are defined as ‘hospitalisations’ in terms of severity (regardless of whether they also presented to an emergency department). Those injuries only involving an emergency department presentation are regarded as the least severe, and are defined as ‘emergency department presentations’ within the report.
2.5.2 Aboriginality
An individual was defined as Aboriginal if they were marked as Aboriginal or Torres Strait Islander on any record within the hospital, emergency and mortality data collections.
2.5.3 Socioeconomic status
The Index of Relative Socioeconomic disadvantage, one of the Australian Bureau of Statistics’ Socio-Economic Indexes for Areas (SEIFA) indexes, was used to identify socioeconomic status. This index ranks areas in Australia as a whole and also for each State/Territory according to relative socioeconomic disadvantage. SEIFA deciles for Western Australia were provided on hospital, mortality and emergency records provided by the Department of Health WA. Where these were not available for a particular injury, other records available for that individual were examined for an appropriate SEIFA decile. These deciles were grouped into quintiles for the report.
2.5.4 Remoteness index
Remoteness is reported using the Accessibility/Remoteness Index of Australia (ARIA) which relies on road distance as a surrogate for remoteness and on the population size of a service centre as a surrogate for the availability of services. This index was provided on hospital, mortality and emergency records by the WA Data Linkage Unit. The Remoteness Index is a five point measure, where 1 = Major Cities, 2 = Inner Regional Australia, 3 = Outer Regional Australia, 4 = Remote Australia and 5 = Very Remote Australia. Where the Remoteness Index was not provided, the postcode of the individual was used to determine remoteness.
2.5.5 Health region
Health services in Western Australia are organised into nine regions: North Metropolitan, South Metropolitan, Goldfields, Great Southern, Kimberley, Midwest, Pilbara, South West and the Wheatbelt. Health region was calculated based on the postcode of the individual thus reflecting place of residence of the injured person rather than place of occurrence of the injury event.
2.5.6 Alcohol aetiological fraction
Alcohol aetiological fractions express the extent to which alcohol contributes to a health outcome. For injuries with only emergency department records, a set figure of 0.32 based on the population alcohol aetiological fraction for injury-related admissions to metropolitan emergency department was used (50). The population alcohol aetiological fraction indicates the proportion of a disease or injury that could be prevented if exposure to alcohol was eliminated (50). For injuries with hospital or mortality records, aetiological fractions based on broad external cause categories (from ICD codes) were used (51). Age, sex, Aboriginality, geographic region and broad external cause were used to identify the appropriate alcohol fraction.
Incidence and costs of injury in Western Australia 2012 | 11
2.5.7 Mechanism of injury
The mechanism categories (e.g. road injury, drowning, poisoning, etc.) were defined using the GBD Injury Expert Group External Cause broad categories (52). Available diagnosis codes from hospital, emergency and mortality records were used to determine the appropriate categories.
2.5.8 Intent of injury
Intent of injury (e.g. intentional or unintentional) was also defined using the GBD Injury Expert Group External Cause categories (52). Primary diagnosis codes from hospital, emergency and mortality records were used to determine the appropriate categories.
2.5.9 Injury diagnosis groups
Injuries were classified into injury diagnosis groups (e.g. skull/brain injury, facial fracture/eye injury, spine/vertebra, etc.) using a concise injury burden grouping that has been shown to predict disability outcomes as well as injury classification systems with many more health states (53, 54).
2.5.10 Body region and nature of injury
Categorisation of injury based on body region (e.g. head and neck, spine and upper back, torso, etc.) and nature of injury (e.g. fracture, dislocation, internal organ injury, etc.) was used for modelling injury claims data. Categories were taken from the ICD-10 Injury Mortality Diagnosis Matrix, a framework designed to organise injury diagnoses into meaningful groupings based on body region and nature of injury (55).
Categorisation used primary diagnosis from hospital, emergency and mortality records. If no body region was specified using these categories, additional diagnosis fields from hospital records were also searched.
2.6 Data analysis
Data were collated using Python 2.7 and analysed using Stata 12 and the Rates Calculator developed by the Epidemiology Branch at the Department of Health WA. Data were classified across multiple dimensions including by sociodemographic factors, regions, types of injury and alcohol involvement.
For 2012, the most recent year in the dataset, frequencies and rates per 1,000 population were calculated using incidence data for injury events and the Estimated Resident Population developed by the Australian Bureau of Statistics, which was downloaded from the Rates Calculator. Estimates for the Aboriginal population of WA were derived by the Epidemiology Branch and obtained from the Rates Calculator (3). Total costs and mean costs were calculated, with a breakdown into component costs presented in some instances.
To reflect change over time, incidence of injury events and cost data for 2012 was compared with 2003. Only hospitalisation and mortality data were included in this analysis as data for emergency presentations are not available for all hospitals prior to 2008 (56). Age-standardised rates were calculated using the Rates Calculator based on the direct method and the 2001 Australian Standard Population (3). Total costs and mean costs were calculated, with costs for both years expressed in 2014 Australian dollars. Mean costs rather than median costs are recommended in economic analysis as they permit a budgetary assessment of total costs, which is the statistic of interest for health care policy decisions (57).
2.7 Strengths and limitations
A major strength of the present study was the use of linked administrative hospital morbidity, emergency department and mortality data to obtain statewide population data on the incidence of these injuries in WA. Using linked health data allowed better estimates of injury events to be derived by enabling injury-based discrete health events likely to be for the same injury to be joined into a single incident cases.
12 | Incidence and costs of injury in Western Australia 2012
Cost data was drawn from a variety of sources, with direct mapping of unit costs to injury events possible for several cost components including hospitalisations, emergency department presentations, loss of paid productivity for fatalities, and quality of life loss for injury events resulting in hospitalisation and death. Additionally, linking the health data to injury claims data from ICWA allowed the cost of other components to be directly mapped when an injury event record linked with an insurance record. Where an injury event did not link with an insurance record, the cost of other components was modelled using the injury claims data for similar types of injuries.
Another strength of the study was the adoption of a comprehensive cost approach, which included health sector costs, resources required for long term care needs, loss of productivity and quality of life loss. Injury cost models do not always adopt this wider perspective, with some studies covering health sector costs only thus providing a more limited understanding of the burden of injuries to society (58, 59).
However, the study has several limitations. Excluding cases with relatively minor injuries who were fully treated by a general practitioner or other primary health care provider underestimates the incidence and costs of injury in WA. Also, in regard to injury incidence, in combining discrete health events into injury events, assumptions had to be made about which health events related to the same injury event and these assumptions may under- or over-estimate incident cases.
With the health administrative data not collected specifically for research, reliability issues can arise in the data collection process that might not be expected in research studies. In this study, using the GBD Injury Expert Group External Cause categories to define mechanism and intent of injury (52), one in eight injury events were classified in the undetermined intent category. Intent of injury provides useful information to interpret the nature of the problem and develop injury prevention programs.
The cost estimates presented in this study are also subject to several limitations. First, as emergency department data did not include a code to indicate the Urgency Related Group, all presentations for a specific year were allocated a set cost based on the average cost per presentation. In 2013-14, unit costs for a emergency department presentation for an admitted Triage 1 case was $2,198 compared with $265 for a non-admitted Triage 5 case (60).
Second, the use of insurance claims data from the Motor Injury Insurance Scheme to attribute costs to some cost components assumes similar resource use and costs for injuries sustained in motor vehicle crashes and injuries with similar diagnoses and different causes. No evidence was found to support or refute this asumption. This limitation was necessary as cost data for these components was not available for injuries sustained by other mechanisms. Although the model estimating costs could not control for mechanism of injury, factors adjusted for in the model included demographic factors and the nature and body region of injury. Also in attributing costs to fatalities, the unit cost of an ambulance trip was based on the unit cost of an urgent or life-threatening ambulance trip in the metropolitan region rather than the unit cost of injury-related trips throughout WA.
Third, ICWA’s injury claims data represent payments to motor vehicle occupants who have been injured in a crash. Personal injury insurers have policies to determine eligibility for compensation, permissible claims, reasonable payment levels and thresholds values (61). These policies determine payment to claimants, but payments may not represent actual costs of the injury event. Moreover, out-of-pocket payments by claimants are excluded. However, for injured cases not compensated by motor vehicle personal injury insurance, some costs compensated by ICWA to claimants would be paid out-of-pocket.
Fourth, quality of life loss for injury events resulting in hospitalisation was measured using disability weights, which reflect an average health state weight rather than a direct measure of each individual’s health state post-injury (62). Additionally, DALYs were calculated based on estimates of the the average short term duration of the disabling event and the proportion of cases likely to have permanent disability (45).
Incidence and costs of injury in Western Australia 2012 | 13
Fifth, quality of life loss measured in DALYs was converted to monetary values based on the value of a statistical life year. While monetising loss (or gain) of health measured in quality adjusted life years (QALYs) or DALYs is common practice, much debate exists in regard to applying a uniform value to a QALY/DALY in all situations given evidence supporting the value of a QALY/DALY being context specific (63-66).
Sixth, consistent with international practice (16, 17), resource costs relating to property damage, workplace disruption, legal and investigation, and correctional, police and fire services were excluded. To the extent that dealing with injury events increase the cost to government of law enforcement, excluding these costs will understimate the cost of injury reported in this study.
Finally, analysis of the cost of injury presented in this report was defined by the scope of the project. Additional analyses could have included a sensitivity analysis to test the sensitivity of cost estimates to changes in the value of key parameters, and the cost of injury was not presented by injury severity as measured by one of the internationally recognised injury severity scoring systems such as the Abbreviated Injury Scale (AIS) or the ICD-based Injury Severity Score (ICISS) (67).
14 | Incidence and costs of injury in Western Australia 2012
3. Incidence and costs of injury, 2012 3.1 Introduction
This section reports on the overall burden of injury in Western Australia. Burden includes both incidence and costs, with costs calculated using an incidence-based approach which quantifies the present value of lifetime costs resulting from all injuries occurring in the year 2012. Costs for this year have been inflated to represent 2014 Australian dollars.
The section is structured as follows. Sections 3.2 to 3.5 describe the number and cost of injury events by severity and sociodemographic characteristics including sex, age group, Aboriginality and socioeconomic status. The next two sections present the number and cost of injury events by severity and area-based measures, specifically the Accessibility/Remoteness Index (ARIA) and health regions. Following this, Section 3.8 discusses the number and cost of injury events by severity and intent and mechanism of injury. The final section addresses the extent to which prior alcohol use contributes to the burden of injury.
3.2 Incidence and costs by injury severity and sex
Incidence counts, rates and costs are presented for three mutually-exclusive categories that reflect severity of injury: (i) injury events resulting in death occurring within and outside a health care setting; (ii) injury events resulting in hospitalisation and not resulting in death; and (iii) injury events receiving treatment at an emergency department not resulting in hospitalisation or death.
In 2012, approximately 227,000 injury events occurred, the equivalent of 93 injury events per 1,000 population (Table 3.1). Fatal injury events accounted for 0.6% of the total, hospitalised injury events accounted for 22.1%, and emergency department presentations for injury accounted for 77.3%. Total lifetime costs associated with these injury events was $9.6 billion, with the cost of fatalities accounting for 61% of total costs. Mean cost per injury event was approximately $42,000, ranging from $4.2m for fatalities to $11,500 for emergency department presentations.
Males had a higher rate of injury events than females across all severity levels, and accounted for 63% of all injury costs. In addition to a higher incidence rate, mean cost per injury event was higher for males than females for injuries resulting in a fatality or hospitalisation.
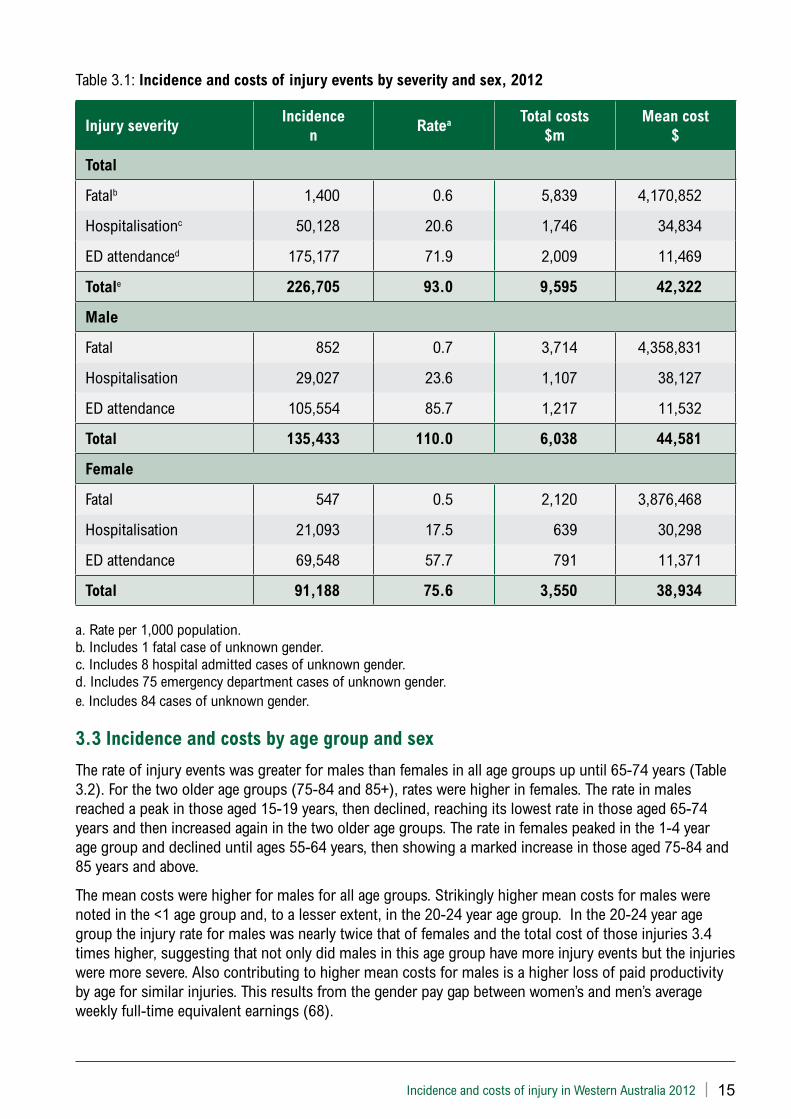
Incidence and costs of injury in Western Australia 2012 | 15
Table 3.1: Incidence and costs of injury events by severity and sex, 2012
Injury severityIncidence
nRatea Total costs
$mMean cost
$
Total
Fatalb 1,400 0.6 5,839 4,170,852
Hospitalisationc 50,128 20.6 1,746 34,834
ED attendanced 175,177 71.9 2,009 11,469
Totale 226,705 93.0 9,595 42,322
Male
Fatal 852 0.7 3,714 4,358,831
Hospitalisation 29,027 23.6 1,107 38,127
ED attendance 105,554 85.7 1,217 11,532
Total 135,433 110.0 6,038 44,581
Female
Fatal 547 0.5 2,120 3,876,468
Hospitalisation 21,093 17.5 639 30,298
ED attendance 69,548 57.7 791 11,371
Total 91,188 75.6 3,550 38,934
a. Rate per 1,000 population.b. Includes 1 fatal case of unknown gender.c. Includes 8 hospital admitted cases of unknown gender.d. Includes 75 emergency department cases of unknown gender. e. Includes 84 cases of unknown gender.
3.3 Incidence and costs by age group and sex
The rate of injury events was greater for males than females in all age groups up until 65-74 years (Table 3.2). For the two older age groups (75-84 and 85+), rates were higher in females. The rate in males reached a peak in those aged 15-19 years, then declined, reaching its lowest rate in those aged 65-74 years and then increased again in the two older age groups. The rate in females peaked in the 1-4 year age group and declined until ages 55-64 years, then showing a marked increase in those aged 75-84 and 85 years and above.
The mean costs were higher for males for all age groups. Strikingly higher mean costs for males were noted in the <1 age group and, to a lesser extent, in the 20-24 year age group. In the 20-24 year age group the injury rate for males was nearly twice that of females and the total cost of those injuries 3.4 times higher, suggesting that not only did males in this age group have more injury events but the injuries were more severe. Also contributing to higher mean costs for males is a higher loss of paid productivity by age for similar injuries. This results from the gender pay gap between women’s and men’s average weekly full-time equivalent earnings (68).
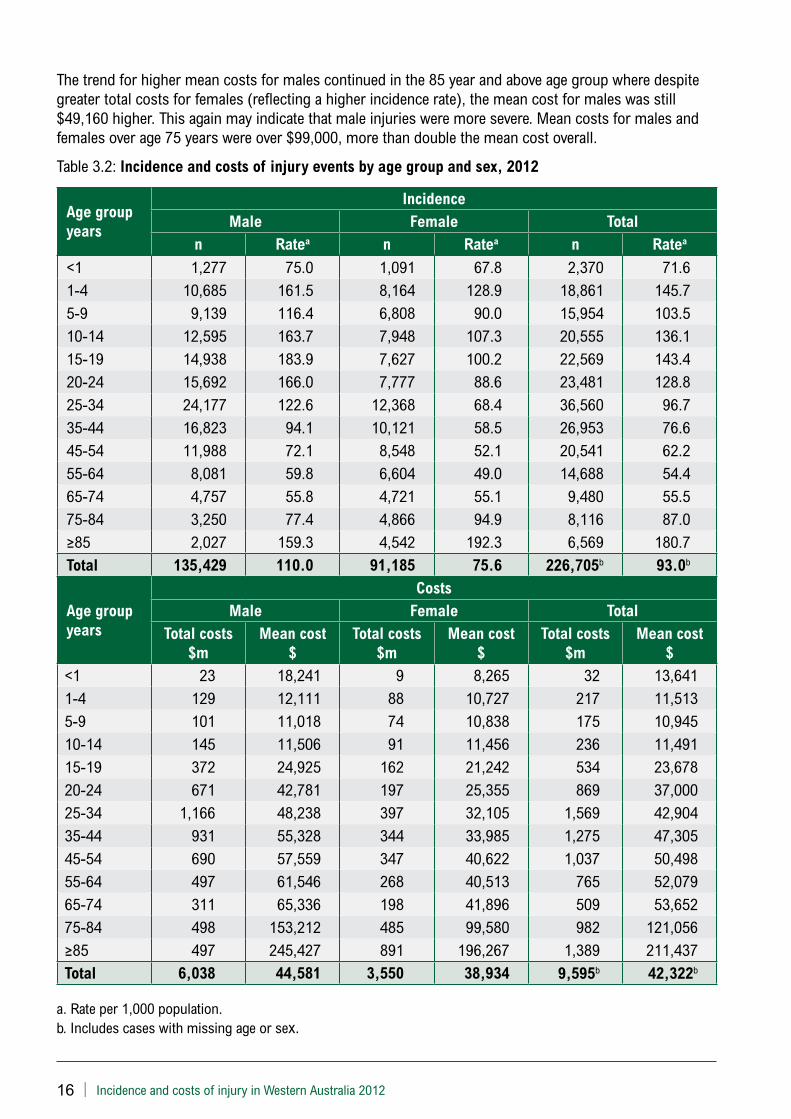
16 | Incidence and costs of injury in Western Australia 2012
The trend for higher mean costs for males continued in the 85 year and above age group where despite greater total costs for females (reflecting a higher incidence rate), the mean cost for males was still $49,160 higher. This again may indicate that male injuries were more severe. Mean costs for males and females over age 75 years were over $99,000, more than double the mean cost overall.
Table 3.2: Incidence and costs of injury events by age group and sex, 2012
Age group years
IncidenceMale Female Total
n Ratea n Ratea n Ratea
<1 1,277 75.0 1,091 67.8 2,370 71.61-4 10,685 161.5 8,164 128.9 18,861 145.75-9 9,139 116.4 6,808 90.0 15,954 103.510-14 12,595 163.7 7,948 107.3 20,555 136.115-19 14,938 183.9 7,627 100.2 22,569 143.420-24 15,692 166.0 7,777 88.6 23,481 128.825-34 24,177 122.6 12,368 68.4 36,560 96.735-44 16,823 94.1 10,121 58.5 26,953 76.645-54 11,988 72.1 8,548 52.1 20,541 62.255-64 8,081 59.8 6,604 49.0 14,688 54.465-74 4,757 55.8 4,721 55.1 9,480 55.575-84 3,250 77.4 4,866 94.9 8,116 87.0≥85 2,027 159.3 4,542 192.3 6,569 180.7Total 135,429 110.0 91,185 75.6 226,705b 93.0b
Age group years
CostsMale Female Total
Total costs $m
Mean cost $
Total costs $m
Mean cost $
Total costs $m
Mean cost $
<1 23 18,241 9 8,265 32 13,6411-4 129 12,111 88 10,727 217 11,5135-9 101 11,018 74 10,838 175 10,94510-14 145 11,506 91 11,456 236 11,49115-19 372 24,925 162 21,242 534 23,67820-24 671 42,781 197 25,355 869 37,00025-34 1,166 48,238 397 32,105 1,569 42,90435-44 931 55,328 344 33,985 1,275 47,30545-54 690 57,559 347 40,622 1,037 50,49855-64 497 61,546 268 40,513 765 52,07965-74 311 65,336 198 41,896 509 53,65275-84 498 153,212 485 99,580 982 121,056≥85 497 245,427 891 196,267 1,389 211,437Total 6,038 44,581 3,550 38,934 9,595b 42,322b
a. Rate per 1,000 population.b. Includes cases with missing age or sex.
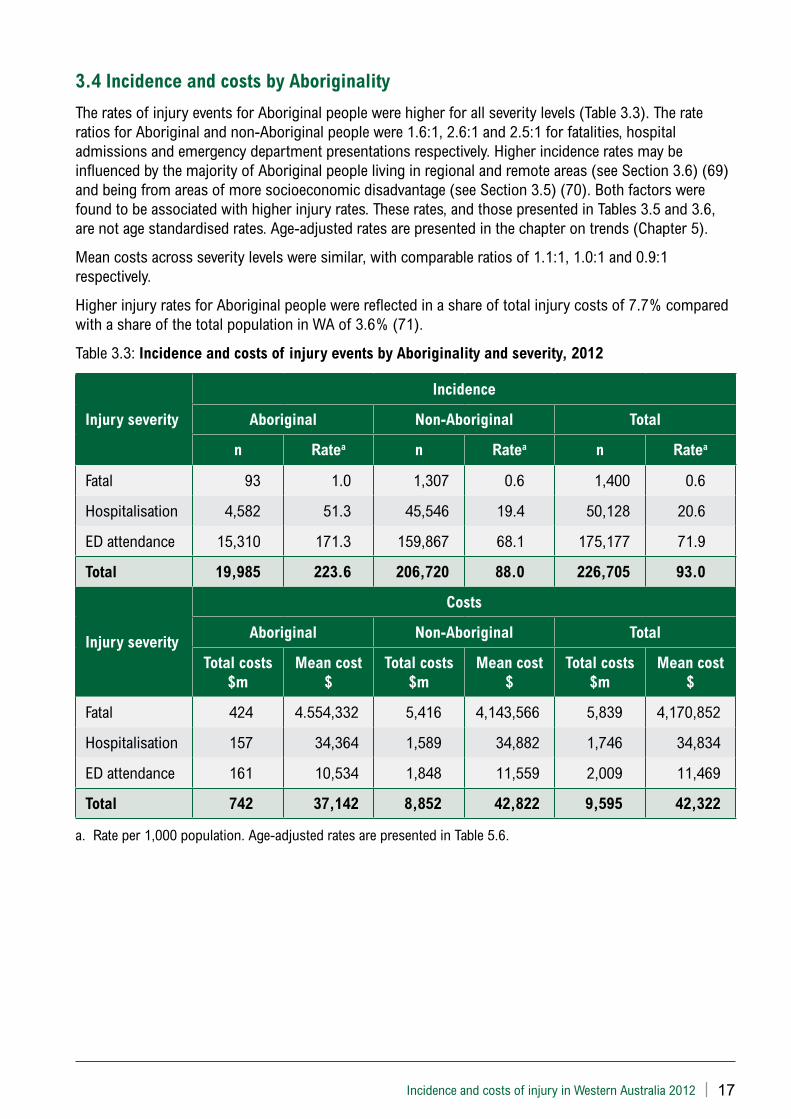
Incidence and costs of injury in Western Australia 2012 | 17
3.4 Incidence and costs by Aboriginality
The rates of injury events for Aboriginal people were higher for all severity levels (Table 3.3). The rate ratios for Aboriginal and non-Aboriginal people were 1.6:1, 2.6:1 and 2.5:1 for fatalities, hospital admissions and emergency department presentations respectively. Higher incidence rates may be influenced by the majority of Aboriginal people living in regional and remote areas (see Section 3.6) (69) and being from areas of more socioeconomic disadvantage (see Section 3.5) (70). Both factors were found to be associated with higher injury rates. These rates, and those presented in Tables 3.5 and 3.6, are not age standardised rates. Age-adjusted rates are presented in the chapter on trends (Chapter 5).
Mean costs across severity levels were similar, with comparable ratios of 1.1:1, 1.0:1 and 0.9:1 respectively.
Higher injury rates for Aboriginal people were reflected in a share of total injury costs of 7.7% compared with a share of the total population in WA of 3.6% (71).
Table 3.3: Incidence and costs of injury events by Aboriginality and severity, 2012
Injury severity
Incidence
Aboriginal Non-Aboriginal Total
n Ratea n Ratea n Ratea
Fatal 93 1.0 1,307 0.6 1,400 0.6
Hospitalisation 4,582 51.3 45,546 19.4 50,128 20.6
ED attendance 15,310 171.3 159,867 68.1 175,177 71.9
Total 19,985 223.6 206,720 88.0 226,705 93.0
Injury severity
Costs
Aboriginal Non-Aboriginal Total
Total costs $m
Mean cost $
Total costs $m
Mean cost $
Total costs $m
Mean cost $
Fatal 424 4.554,332 5,416 4,143,566 5,839 4,170,852
Hospitalisation 157 34,364 1,589 34,882 1,746 34,834
ED attendance 161 10,534 1,848 11,559 2,009 11,469
Total 742 37,142 8,852 42,822 9,595 42,322
a. Rate per 1,000 population. Age-adjusted rates are presented in Table 5.6.
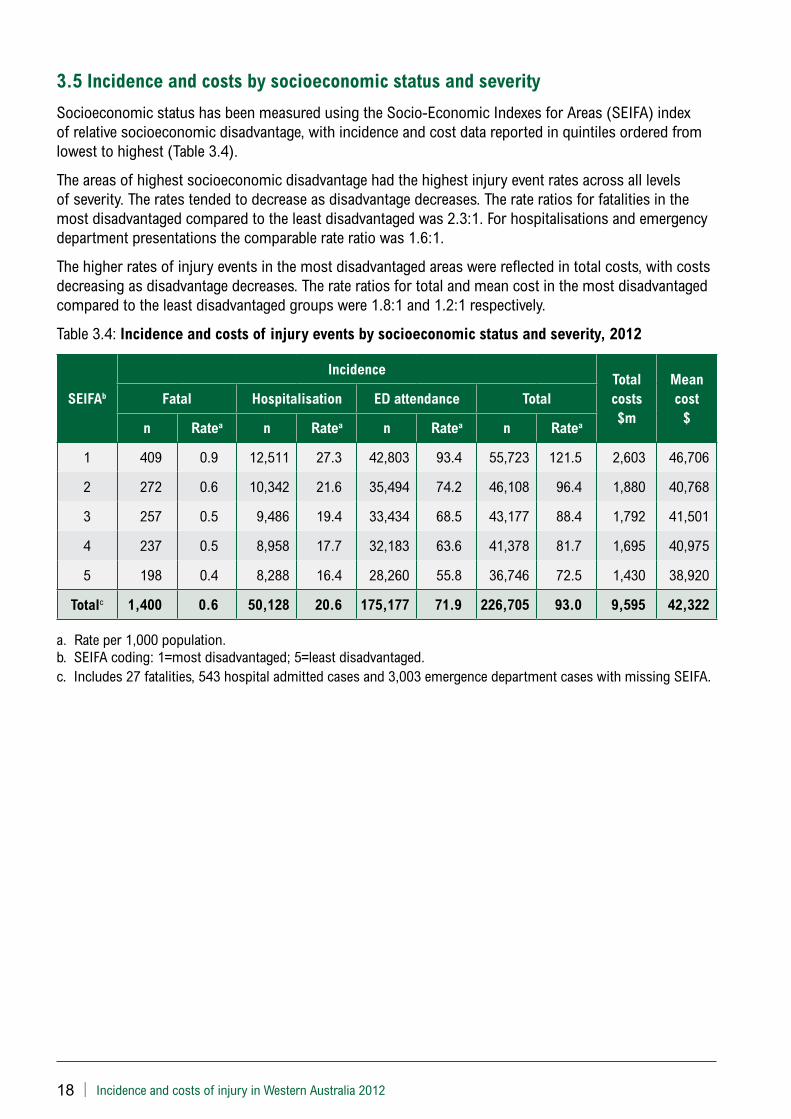
18 | Incidence and costs of injury in Western Australia 2012
3.5 Incidence and costs by socioeconomic status and severity
Socioeconomic status has been measured using the Socio-Economic Indexes for Areas (SEIFA) index of relative socioeconomic disadvantage, with incidence and cost data reported in quintiles ordered from lowest to highest (Table 3.4).
The areas of highest socioeconomic disadvantage had the highest injury event rates across all levels of severity. The rates tended to decrease as disadvantage decreases. The rate ratios for fatalities in the most disadvantaged compared to the least disadvantaged was 2.3:1. For hospitalisations and emergency department presentations the comparable rate ratio was 1.6:1.
The higher rates of injury events in the most disadvantaged areas were reflected in total costs, with costs decreasing as disadvantage decreases. The rate ratios for total and mean cost in the most disadvantaged compared to the least disadvantaged groups were 1.8:1 and 1.2:1 respectively.
Table 3.4: Incidence and costs of injury events by socioeconomic status and severity, 2012
SEIFAb
IncidenceTotal costs $m
Mean cost
$Fatal Hospitalisation ED attendance Total
n Ratea n Ratea n Ratea n Ratea
1 409 0.9 12,511 27.3 42,803 93.4 55,723 121.5 2,603 46,706
2 272 0.6 10,342 21.6 35,494 74.2 46,108 96.4 1,880 40,768
3 257 0.5 9,486 19.4 33,434 68.5 43,177 88.4 1,792 41,501
4 237 0.5 8,958 17.7 32,183 63.6 41,378 81.7 1,695 40,975
5 198 0.4 8,288 16.4 28,260 55.8 36,746 72.5 1,430 38,920
Totalc 1,400 0.6 50,128 20.6 175,177 71.9 226,705 93.0 9,595 42,322
a. Rate per 1,000 population.b. SEIFA coding: 1=most disadvantaged; 5=least disadvantaged.c. Includes 27 fatalities, 543 hospital admitted cases and 3,003 emergence department cases with missing SEIFA.
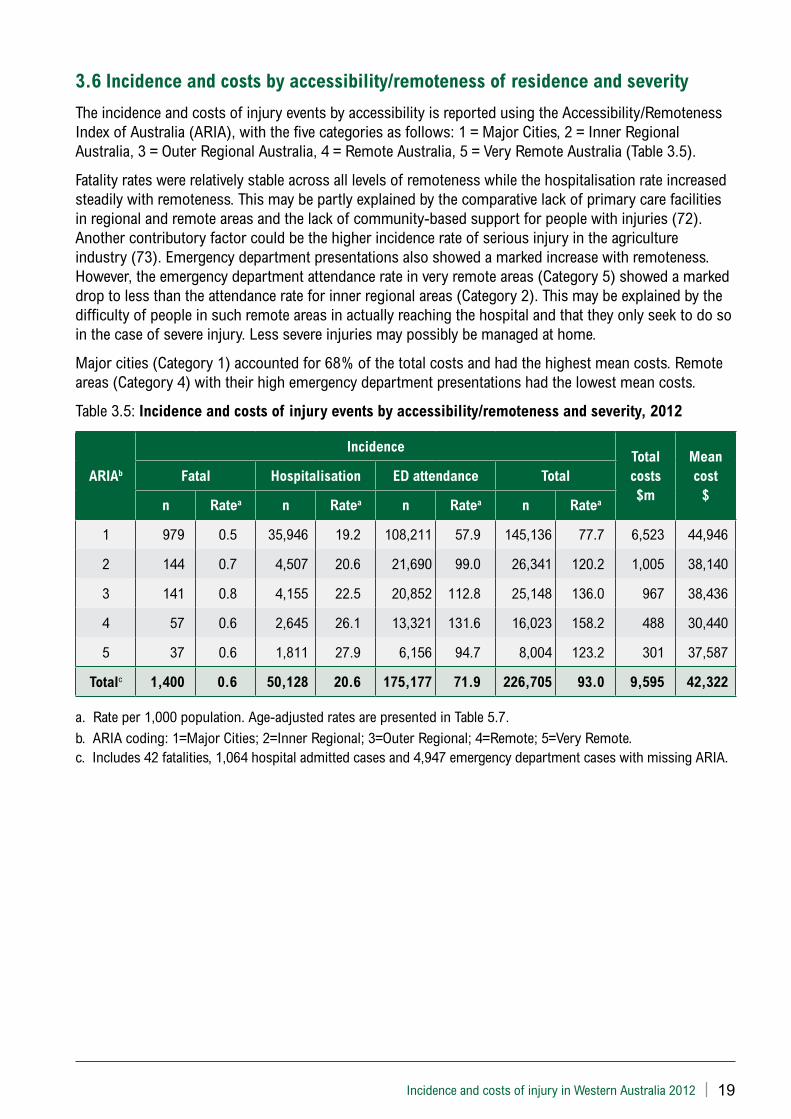
Incidence and costs of injury in Western Australia 2012 | 19
3.6 Incidence and costs by accessibility/remoteness of residence and severity
The incidence and costs of injury events by accessibility is reported using the Accessibility/Remoteness Index of Australia (ARIA), with the five categories as follows: 1 = Major Cities, 2 = Inner Regional Australia, 3 = Outer Regional Australia, 4 = Remote Australia, 5 = Very Remote Australia (Table 3.5).
Fatality rates were relatively stable across all levels of remoteness while the hospitalisation rate increased steadily with remoteness. This may be partly explained by the comparative lack of primary care facilities in regional and remote areas and the lack of community-based support for people with injuries (72). Another contributory factor could be the higher incidence rate of serious injury in the agriculture industry (73). Emergency department presentations also showed a marked increase with remoteness. However, the emergency department attendance rate in very remote areas (Category 5) showed a marked drop to less than the attendance rate for inner regional areas (Category 2). This may be explained by the difficulty of people in such remote areas in actually reaching the hospital and that they only seek to do so in the case of severe injury. Less severe injuries may possibly be managed at home.
Major cities (Category 1) accounted for 68% of the total costs and had the highest mean costs. Remote areas (Category 4) with their high emergency department presentations had the lowest mean costs.
Table 3.5: Incidence and costs of injury events by accessibility/remoteness and severity, 2012
ARIAb
IncidenceTotal costs $m
Mean cost
$Fatal Hospitalisation ED attendance Total
n Ratea n Ratea n Ratea n Ratea
1 979 0.5 35,946 19.2 108,211 57.9 145,136 77.7 6,523 44,946
2 144 0.7 4,507 20.6 21,690 99.0 26,341 120.2 1,005 38,140
3 141 0.8 4,155 22.5 20,852 112.8 25,148 136.0 967 38,436
4 57 0.6 2,645 26.1 13,321 131.6 16,023 158.2 488 30,440
5 37 0.6 1,811 27.9 6,156 94.7 8,004 123.2 301 37,587
Totalc 1,400 0.6 50,128 20.6 175,177 71.9 226,705 93.0 9,595 42,322
a. Rate per 1,000 population. Age-adjusted rates are presented in Table 5.7.b. ARIA coding: 1=Major Cities; 2=Inner Regional; 3=Outer Regional; 4=Remote; 5=Very Remote.c. Includes 42 fatalities, 1,064 hospital admitted cases and 4,947 emergency department cases with missing ARIA.
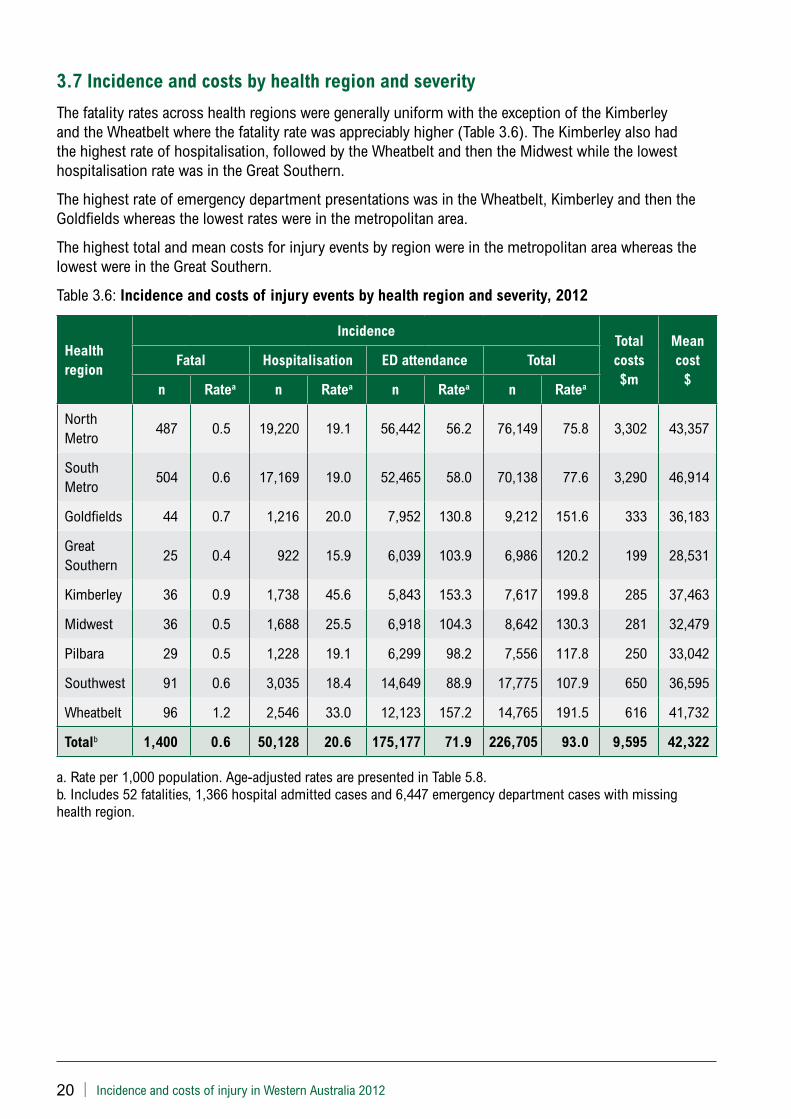
20 | Incidence and costs of injury in Western Australia 2012
3.7 Incidence and costs by health region and severity
The fatality rates across health regions were generally uniform with the exception of the Kimberley and the Wheatbelt where the fatality rate was appreciably higher (Table 3.6). The Kimberley also had the highest rate of hospitalisation, followed by the Wheatbelt and then the Midwest while the lowest hospitalisation rate was in the Great Southern.
The highest rate of emergency department presentations was in the Wheatbelt, Kimberley and then the Goldfields whereas the lowest rates were in the metropolitan area.
The highest total and mean costs for injury events by region were in the metropolitan area whereas the lowest were in the Great Southern.
Table 3.6: Incidence and costs of injury events by health region and severity, 2012
Health region
IncidenceTotal costs $m
Mean cost
$Fatal Hospitalisation ED attendance Total
n Ratea n Ratea n Ratea n Ratea
North Metro
487 0.5 19,220 19.1 56,442 56.2 76,149 75.8 3,302 43,357
South Metro
504 0.6 17,169 19.0 52,465 58.0 70,138 77.6 3,290 46,914
Goldfields 44 0.7 1,216 20.0 7,952 130.8 9,212 151.6 333 36,183
Great Southern
25 0.4 922 15.9 6,039 103.9 6,986 120.2 199 28,531
Kimberley 36 0.9 1,738 45.6 5,843 153.3 7,617 199.8 285 37,463
Midwest 36 0.5 1,688 25.5 6,918 104.3 8,642 130.3 281 32,479
Pilbara 29 0.5 1,228 19.1 6,299 98.2 7,556 117.8 250 33,042
Southwest 91 0.6 3,035 18.4 14,649 88.9 17,775 107.9 650 36,595
Wheatbelt 96 1.2 2,546 33.0 12,123 157.2 14,765 191.5 616 41,732
Totalb 1,400 0.6 50,128 20.6 175,177 71.9 226,705 93.0 9,595 42,322
a. Rate per 1,000 population. Age-adjusted rates are presented in Table 5.8.b. Includes 52 fatalities, 1,366 hospital admitted cases and 6,447 emergency department cases with missing health region.
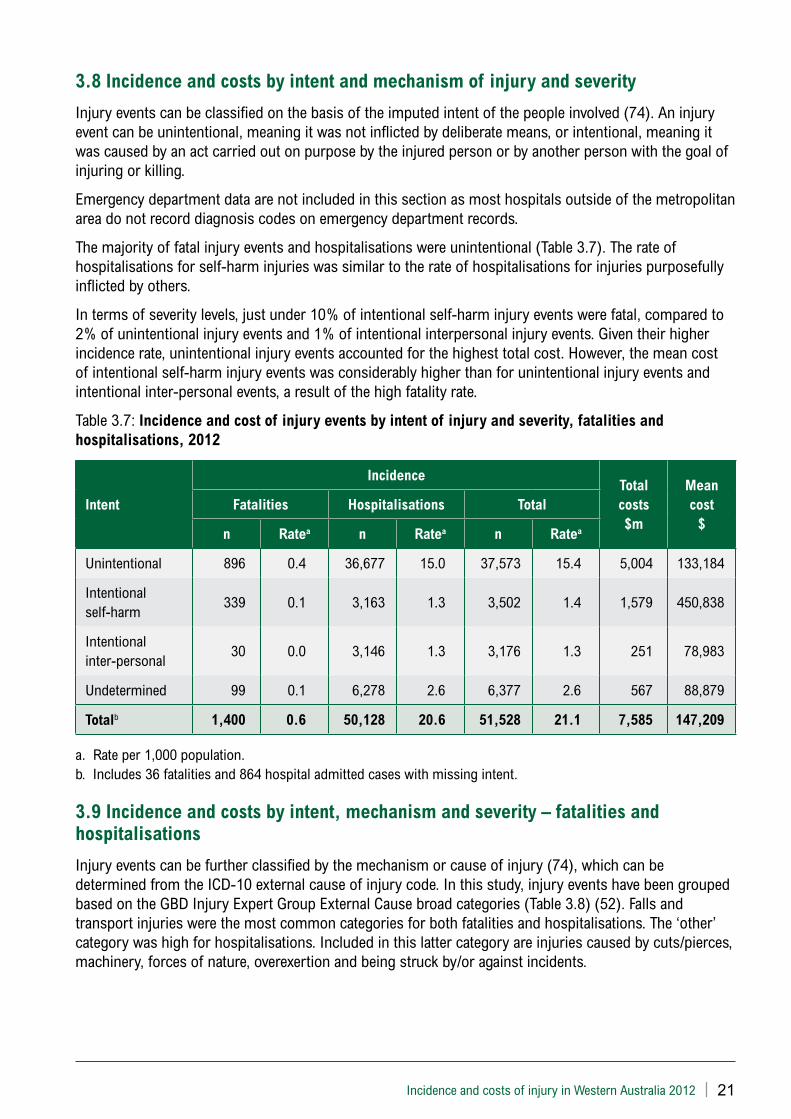
Incidence and costs of injury in Western Australia 2012 | 21
3.8 Incidence and costs by intent and mechanism of injury and severity
Injury events can be classified on the basis of the imputed intent of the people involved (74). An injury event can be unintentional, meaning it was not inflicted by deliberate means, or intentional, meaning it was caused by an act carried out on purpose by the injured person or by another person with the goal of injuring or killing.
Emergency department data are not included in this section as most hospitals outside of the metropolitan area do not record diagnosis codes on emergency department records.
The majority of fatal injury events and hospitalisations were unintentional (Table 3.7). The rate of hospitalisations for self-harm injuries was similar to the rate of hospitalisations for injuries purposefully inflicted by others.
In terms of severity levels, just under 10% of intentional self-harm injury events were fatal, compared to 2% of unintentional injury events and 1% of intentional interpersonal injury events. Given their higher incidence rate, unintentional injury events accounted for the highest total cost. However, the mean cost of intentional self-harm injury events was considerably higher than for unintentional injury events and intentional inter-personal events, a result of the high fatality rate.
Table 3.7: Incidence and cost of injury events by intent of injury and severity, fatalities and hospitalisations, 2012
Intent
IncidenceTotal costs $m
Mean cost
$Fatalities Hospitalisations Total
n Ratea n Ratea n Ratea
Unintentional 896 0.4 36,677 15.0 37,573 15.4 5,004 133,184
Intentional self-harm
339 0.1 3,163 1.3 3,502 1.4 1,579 450,838
Intentional inter-personal
30 0.0 3,146 1.3 3,176 1.3 251 78,983
Undetermined 99 0.1 6,278 2.6 6,377 2.6 567 88,879
Totalb 1,400 0.6 50,128 20.6 51,528 21.1 7,585 147,209
a. Rate per 1,000 population.b. Includes 36 fatalities and 864 hospital admitted cases with missing intent.
3.9 Incidence and costs by intent, mechanism and severity – fatalities and hospitalisations
Injury events can be further classified by the mechanism or cause of injury (74), which can be determined from the ICD-10 external cause of injury code. In this study, injury events have been grouped based on the GBD Injury Expert Group External Cause broad categories (Table 3.8) (52). Falls and transport injuries were the most common categories for both fatalities and hospitalisations. The ‘other’ category was high for hospitalisations. Included in this latter category are injuries caused by cuts/pierces, machinery, forces of nature, overexertion and being struck by/or against incidents.
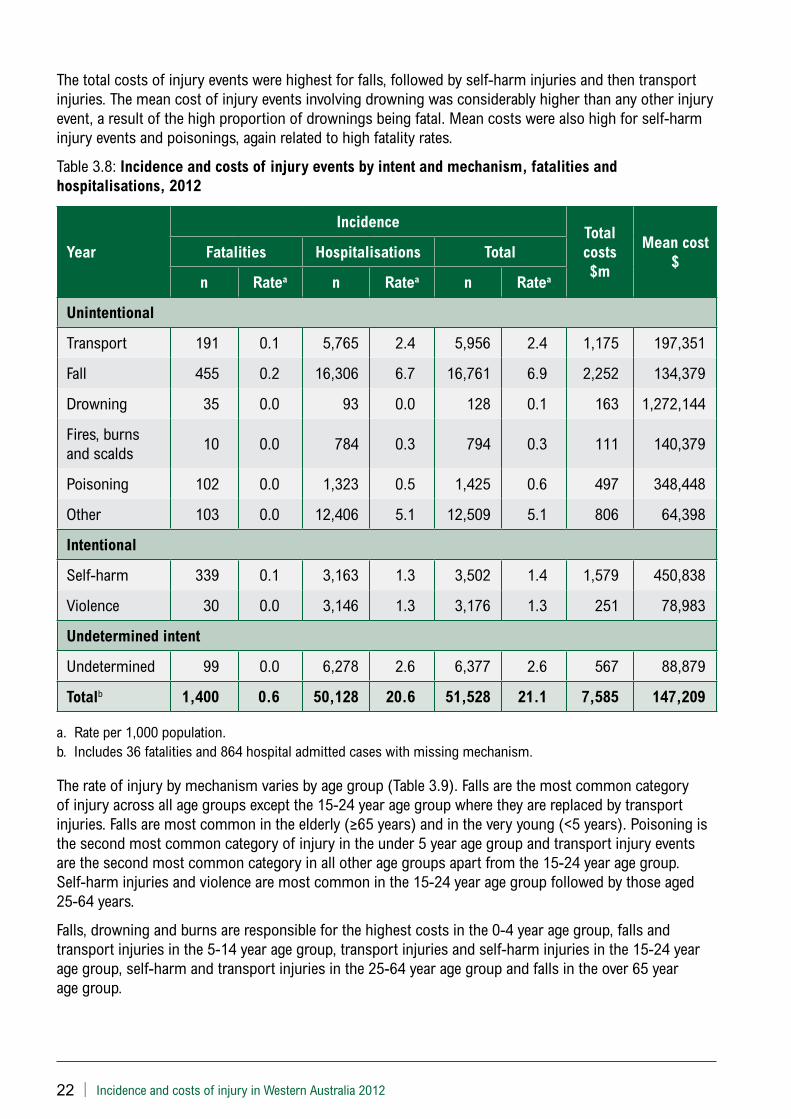
22 | Incidence and costs of injury in Western Australia 2012
The total costs of injury events were highest for falls, followed by self-harm injuries and then transport injuries. The mean cost of injury events involving drowning was considerably higher than any other injury event, a result of the high proportion of drownings being fatal. Mean costs were also high for self-harm injury events and poisonings, again related to high fatality rates.
Table 3.8: Incidence and costs of injury events by intent and mechanism, fatalities and hospitalisations, 2012
Year
IncidenceTotal costs $m
Mean cost $
Fatalities Hospitalisations Total
n Ratea n Ratea n Ratea
Unintentional
Transport 191 0.1 5,765 2.4 5,956 2.4 1,175 197,351
Fall 455 0.2 16,306 6.7 16,761 6.9 2,252 134,379
Drowning 35 0.0 93 0.0 128 0.1 163 1,272,144
Fires, burns and scalds
10 0.0 784 0.3 794 0.3 111 140,379
Poisoning 102 0.0 1,323 0.5 1,425 0.6 497 348,448
Other 103 0.0 12,406 5.1 12,509 5.1 806 64,398
Intentional
Self-harm 339 0.1 3,163 1.3 3,502 1.4 1,579 450,838
Violence 30 0.0 3,146 1.3 3,176 1.3 251 78,983
Undetermined intent
Undetermined 99 0.0 6,278 2.6 6,377 2.6 567 88,879
Totalb 1,400 0.6 50,128 20.6 51,528 21.1 7,585 147,209
a. Rate per 1,000 population. b. Includes 36 fatalities and 864 hospital admitted cases with missing mechanism.
The rate of injury by mechanism varies by age group (Table 3.9). Falls are the most common category of injury across all age groups except the 15-24 year age group where they are replaced by transport injuries. Falls are most common in the elderly (≥65 years) and in the very young (<5 years). Poisoning is the second most common category of injury in the under 5 year age group and transport injury events are the second most common category in all other age groups apart from the 15-24 year age group. Self-harm injuries and violence are most common in the 15-24 year age group followed by those aged 25-64 years.
Falls, drowning and burns are responsible for the highest costs in the 0-4 year age group, falls and transport injuries in the 5-14 year age group, transport injuries and self-harm injuries in the 15-24 year age group, self-harm and transport injuries in the 25-64 year age group and falls in the over 65 year age group.
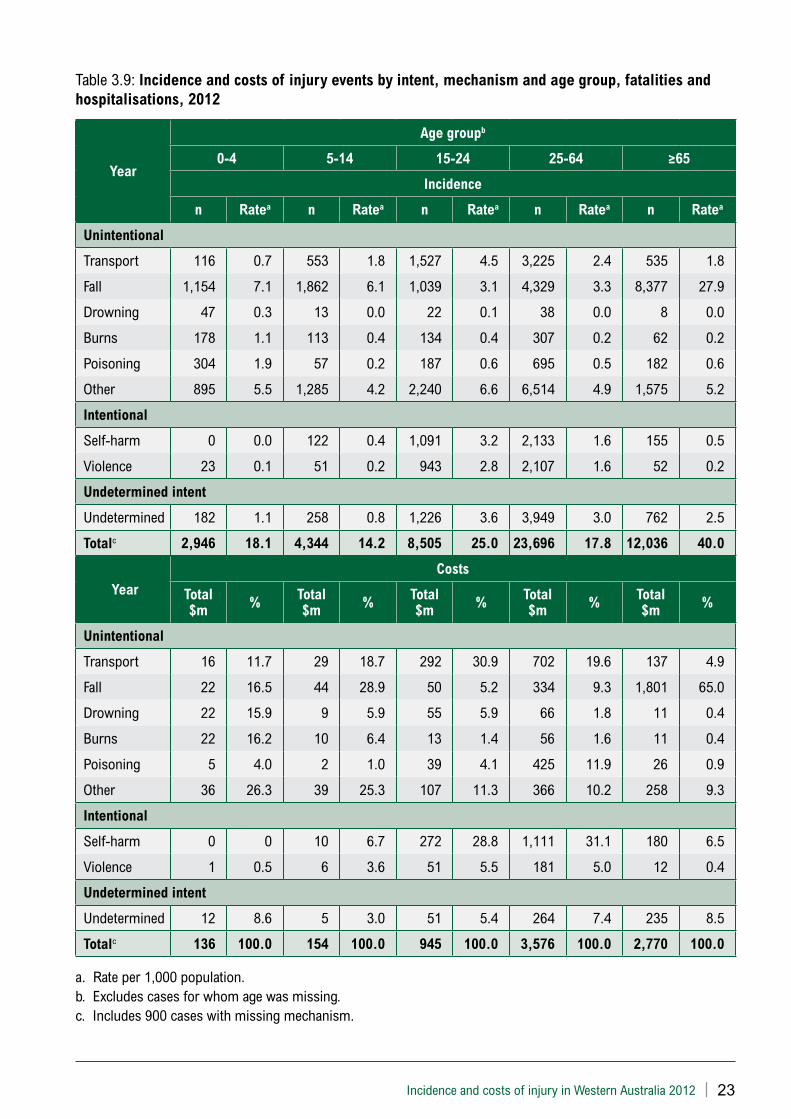
Incidence and costs of injury in Western Australia 2012 | 23
Table 3.9: Incidence and costs of injury events by intent, mechanism and age group, fatalities and hospitalisations, 2012
Year
Age groupb
0-4 5-14 15-24 25-64 ≥65
Incidence
n Ratea n Ratea n Ratea n Ratea n Ratea
Unintentional
Transport 116 0.7 553 1.8 1,527 4.5 3,225 2.4 535 1.8
Fall 1,154 7.1 1,862 6.1 1,039 3.1 4,329 3.3 8,377 27.9
Drowning 47 0.3 13 0.0 22 0.1 38 0.0 8 0.0
Burns 178 1.1 113 0.4 134 0.4 307 0.2 62 0.2
Poisoning 304 1.9 57 0.2 187 0.6 695 0.5 182 0.6
Other 895 5.5 1,285 4.2 2,240 6.6 6,514 4.9 1,575 5.2
Intentional
Self-harm 0 0.0 122 0.4 1,091 3.2 2,133 1.6 155 0.5
Violence 23 0.1 51 0.2 943 2.8 2,107 1.6 52 0.2
Undetermined intent
Undetermined 182 1.1 258 0.8 1,226 3.6 3,949 3.0 762 2.5
Totalc 2,946 18.1 4,344 14.2 8,505 25.0 23,696 17.8 12,036 40.0
YearCosts
Total $m % Total
$m % Total $m % Total
$m % Total $m %
Unintentional
Transport 16 11.7 29 18.7 292 30.9 702 19.6 137 4.9
Fall 22 16.5 44 28.9 50 5.2 334 9.3 1,801 65.0
Drowning 22 15.9 9 5.9 55 5.9 66 1.8 11 0.4
Burns 22 16.2 10 6.4 13 1.4 56 1.6 11 0.4
Poisoning 5 4.0 2 1.0 39 4.1 425 11.9 26 0.9
Other 36 26.3 39 25.3 107 11.3 366 10.2 258 9.3
Intentional
Self-harm 0 0 10 6.7 272 28.8 1,111 31.1 180 6.5
Violence 1 0.5 6 3.6 51 5.5 181 5.0 12 0.4
Undetermined intent
Undetermined 12 8.6 5 3.0 51 5.4 264 7.4 235 8.5
Totalc 136 100.0 154 100.0 945 100.0 3,576 100.0 2,770 100.0
a. Rate per 1,000 population.b. Excludes cases for whom age was missing.c. Includes 900 cases with missing mechanism.
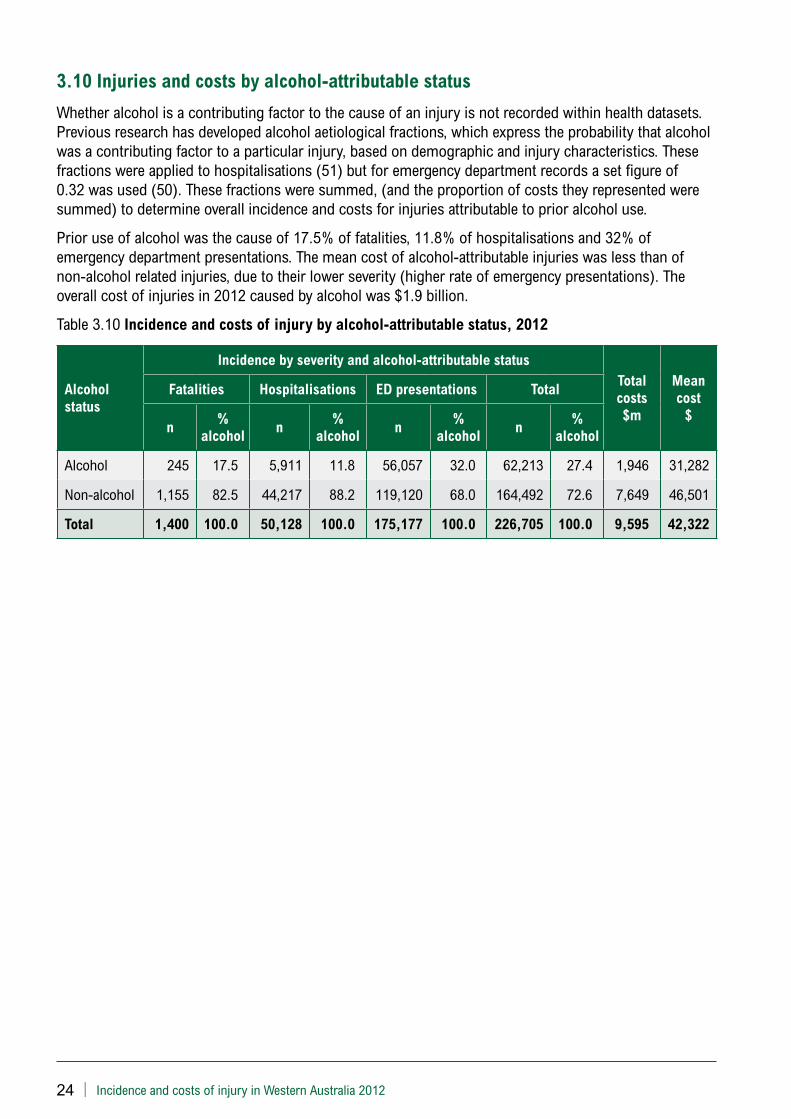
24 | Incidence and costs of injury in Western Australia 2012
3.10 Injuries and costs by alcohol-attributable status
Whether alcohol is a contributing factor to the cause of an injury is not recorded within health datasets. Previous research has developed alcohol aetiological fractions, which express the probability that alcohol was a contributing factor to a particular injury, based on demographic and injury characteristics. These fractions were applied to hospitalisations (51) but for emergency department records a set figure of 0.32 was used (50). These fractions were summed, (and the proportion of costs they represented were summed) to determine overall incidence and costs for injuries attributable to prior alcohol use.
Prior use of alcohol was the cause of 17.5% of fatalities, 11.8% of hospitalisations and 32% of emergency department presentations. The mean cost of alcohol-attributable injuries was less than of non-alcohol related injuries, due to their lower severity (higher rate of emergency presentations). The overall cost of injuries in 2012 caused by alcohol was $1.9 billion.
Table 3.10 Incidence and costs of injury by alcohol-attributable status, 2012
Alcohol status
Incidence by severity and alcohol-attributable statusTotal costs $m
Mean cost
$
Fatalities Hospitalisations ED presentations Total
n%
alcoholn
% alcohol
n%
alcoholn
% alcohol
Alcohol 245 17.5 5,911 11.8 56,057 32.0 62,213 27.4 1,946 31,282
Non-alcohol 1,155 82.5 44,217 88.2 119,120 68.0 164,492 72.6 7,649 46,501
Total 1,400 100.0 50,128 100.0 175,177 100.0 226,705 100.0 9,595 42,322
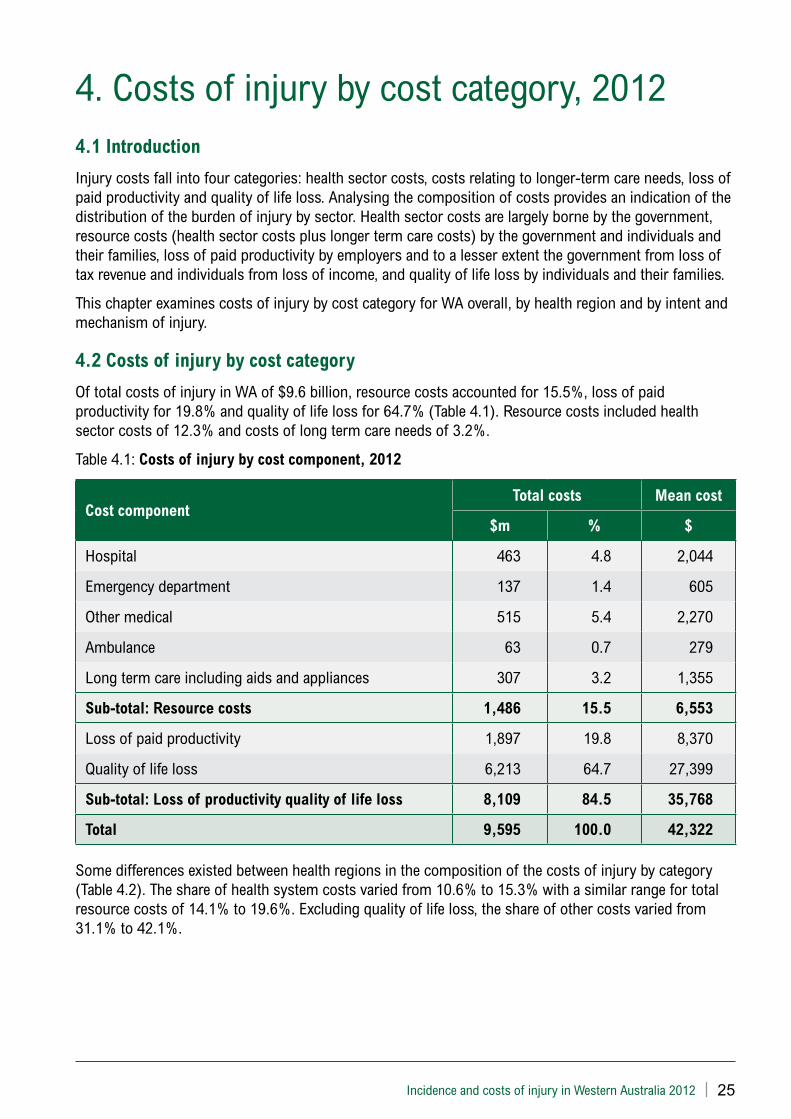
Incidence and costs of injury in Western Australia 2012 | 25
4. Costs of injury by cost category, 2012 4.1 Introduction
Injury costs fall into four categories: health sector costs, costs relating to longer-term care needs, loss of paid productivity and quality of life loss. Analysing the composition of costs provides an indication of the distribution of the burden of injury by sector. Health sector costs are largely borne by the government, resource costs (health sector costs plus longer term care costs) by the government and individuals and their families, loss of paid productivity by employers and to a lesser extent the government from loss of tax revenue and individuals from loss of income, and quality of life loss by individuals and their families.
This chapter examines costs of injury by cost category for WA overall, by health region and by intent and mechanism of injury.
4.2 Costs of injury by cost category
Of total costs of injury in WA of $9.6 billion, resource costs accounted for 15.5%, loss of paid productivity for 19.8% and quality of life loss for 64.7% (Table 4.1). Resource costs included health sector costs of 12.3% and costs of long term care needs of 3.2%.
Table 4.1: Costs of injury by cost component, 2012
Cost componentTotal costs Mean cost
$m % $
Hospital 463 4.8 2,044
Emergency department 137 1.4 605
Other medical 515 5.4 2,270
Ambulance 63 0.7 279
Long term care including aids and appliances 307 3.2 1,355
Sub-total: Resource costs 1,486 15.5 6,553
Loss of paid productivity 1,897 19.8 8,370
Quality of life loss 6,213 64.7 27,399
Sub-total: Loss of productivity quality of life loss 8,109 84.5 35,768
Total 9,595 100.0 42,322
Some differences existed between health regions in the composition of the costs of injury by category (Table 4.2). The share of health system costs varied from 10.6% to 15.3% with a similar range for total resource costs of 14.1% to 19.6%. Excluding quality of life loss, the share of other costs varied from 31.1% to 42.1%.
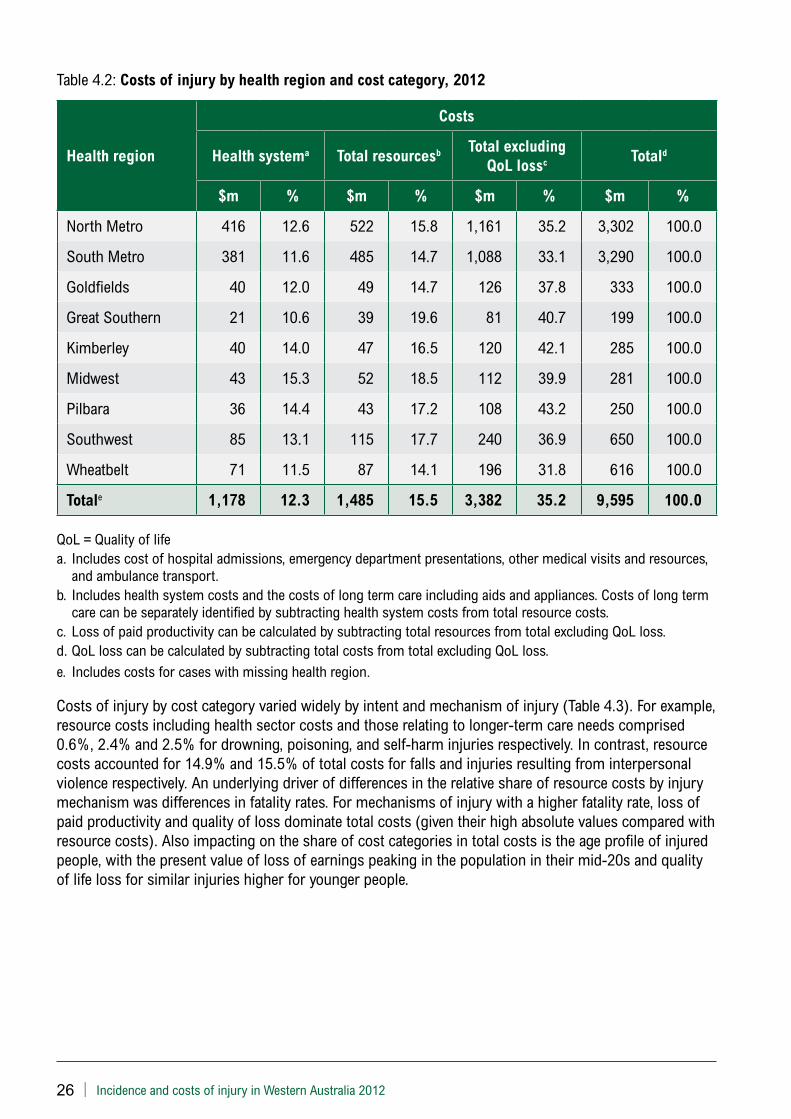
26 | Incidence and costs of injury in Western Australia 2012
Table 4.2: Costs of injury by health region and cost category, 2012
Health region
Costs
Health systema Total resourcesb Total excluding QoL lossc Totald
$m % $m % $m % $m %
North Metro 416 12.6 522 15.8 1,161 35.2 3,302 100.0
South Metro 381 11.6 485 14.7 1,088 33.1 3,290 100.0
Goldfields 40 12.0 49 14.7 126 37.8 333 100.0
Great Southern 21 10.6 39 19.6 81 40.7 199 100.0
Kimberley 40 14.0 47 16.5 120 42.1 285 100.0
Midwest 43 15.3 52 18.5 112 39.9 281 100.0
Pilbara 36 14.4 43 17.2 108 43.2 250 100.0
Southwest 85 13.1 115 17.7 240 36.9 650 100.0
Wheatbelt 71 11.5 87 14.1 196 31.8 616 100.0
Totale 1,178 12.3 1,485 15.5 3,382 35.2 9,595 100.0
QoL = Quality of life a. Includes cost of hospital admissions, emergency department presentations, other medical visits and resources,
and ambulance transport. b. Includes health system costs and the costs of long term care including aids and appliances. Costs of long term
care can be separately identified by subtracting health system costs from total resource costs.c. Loss of paid productivity can be calculated by subtracting total resources from total excluding QoL loss.d. QoL loss can be calculated by subtracting total costs from total excluding QoL loss.e. Includes costs for cases with missing health region.
Costs of injury by cost category varied widely by intent and mechanism of injury (Table 4.3). For example, resource costs including health sector costs and those relating to longer-term care needs comprised 0.6%, 2.4% and 2.5% for drowning, poisoning, and self-harm injuries respectively. In contrast, resource costs accounted for 14.9% and 15.5% of total costs for falls and injuries resulting from interpersonal violence respectively. An underlying driver of differences in the relative share of resource costs by injury mechanism was differences in fatality rates. For mechanisms of injury with a higher fatality rate, loss of paid productivity and quality of loss dominate total costs (given their high absolute values compared with resource costs). Also impacting on the share of cost categories in total costs is the age profile of injured people, with the present value of loss of earnings peaking in the population in their mid-20s and quality of life loss for similar injuries higher for younger people.
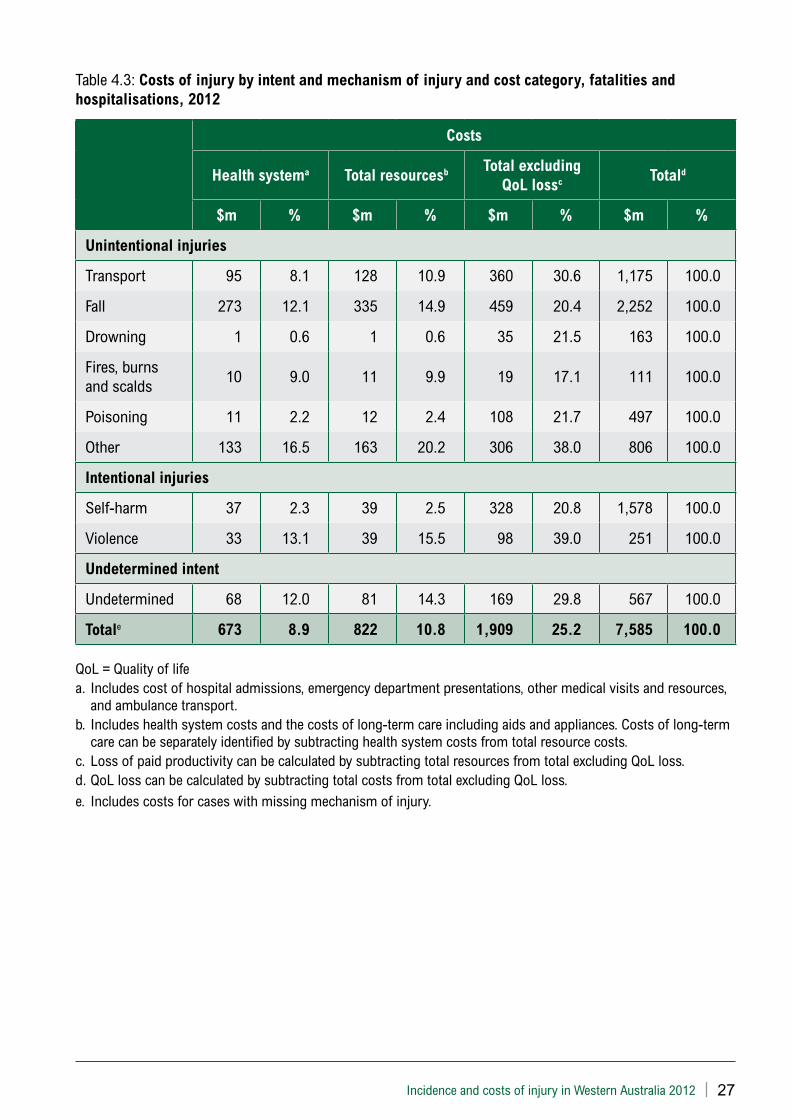
Incidence and costs of injury in Western Australia 2012 | 27
Table 4.3: Costs of injury by intent and mechanism of injury and cost category, fatalities and hospitalisations, 2012
Costs
Health systema Total resourcesb Total excluding QoL lossc Totald
$m % $m % $m % $m %
Unintentional injuries
Transport 95 8.1 128 10.9 360 30.6 1,175 100.0
Fall 273 12.1 335 14.9 459 20.4 2,252 100.0
Drowning 1 0.6 1 0.6 35 21.5 163 100.0
Fires, burns and scalds
10 9.0 11 9.9 19 17.1 111 100.0
Poisoning 11 2.2 12 2.4 108 21.7 497 100.0
Other 133 16.5 163 20.2 306 38.0 806 100.0
Intentional injuries
Self-harm 37 2.3 39 2.5 328 20.8 1,578 100.0
Violence 33 13.1 39 15.5 98 39.0 251 100.0
Undetermined intent
Undetermined 68 12.0 81 14.3 169 29.8 567 100.0
Totale 673 8.9 822 10.8 1,909 25.2 7,585 100.0
QoL = Quality of life a. Includes cost of hospital admissions, emergency department presentations, other medical visits and resources,
and ambulance transport. b. Includes health system costs and the costs of long-term care including aids and appliances. Costs of long-term
care can be separately identified by subtracting health system costs from total resource costs.c. Loss of paid productivity can be calculated by subtracting total resources from total excluding QoL loss.d. QoL loss can be calculated by subtracting total costs from total excluding QoL loss.e. Includes costs for cases with missing mechanism of injury.
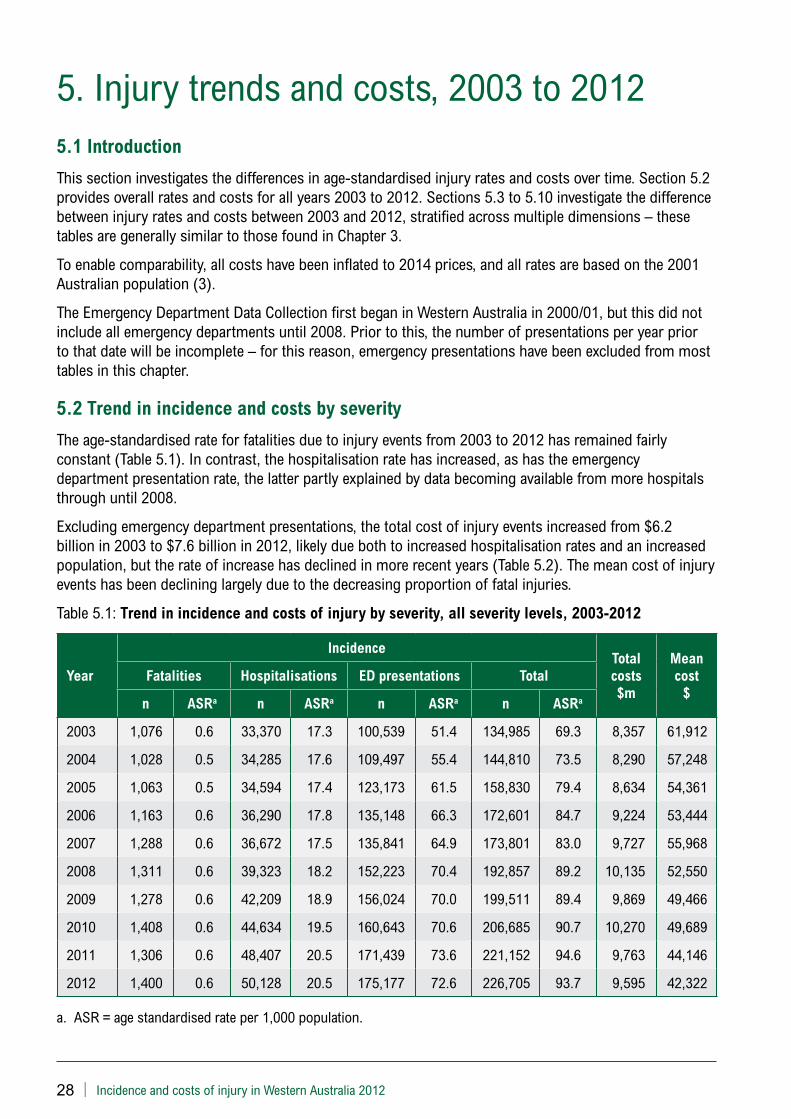
28 | Incidence and costs of injury in Western Australia 2012
5. Injury trends and costs, 2003 to 2012 5.1 Introduction
This section investigates the differences in age-standardised injury rates and costs over time. Section 5.2 provides overall rates and costs for all years 2003 to 2012. Sections 5.3 to 5.10 investigate the difference between injury rates and costs between 2003 and 2012, stratified across multiple dimensions – these tables are generally similar to those found in Chapter 3.
To enable comparability, all costs have been inflated to 2014 prices, and all rates are based on the 2001 Australian population (3).
The Emergency Department Data Collection first began in Western Australia in 2000/01, but this did not include all emergency departments until 2008. Prior to this, the number of presentations per year prior to that date will be incomplete – for this reason, emergency presentations have been excluded from most tables in this chapter.
5.2 Trend in incidence and costs by severity
The age-standardised rate for fatalities due to injury events from 2003 to 2012 has remained fairly constant (Table 5.1). In contrast, the hospitalisation rate has increased, as has the emergency department presentation rate, the latter partly explained by data becoming available from more hospitals through until 2008.
Excluding emergency department presentations, the total cost of injury events increased from $6.2 billion in 2003 to $7.6 billion in 2012, likely due both to increased hospitalisation rates and an increased population, but the rate of increase has declined in more recent years (Table 5.2). The mean cost of injury events has been declining largely due to the decreasing proportion of fatal injuries.
Table 5.1: Trend in incidence and costs of injury by severity, all severity levels, 2003-2012
Year
IncidenceTotal costs $m
Mean cost
$Fatalities Hospitalisations ED presentations Total
n ASRa n ASRa n ASRa n ASRa
2003 1,076 0.6 33,370 17.3 100,539 51.4 134,985 69.3 8,357 61,912
2004 1,028 0.5 34,285 17.6 109,497 55.4 144,810 73.5 8,290 57,248
2005 1,063 0.5 34,594 17.4 123,173 61.5 158,830 79.4 8,634 54,361
2006 1,163 0.6 36,290 17.8 135,148 66.3 172,601 84.7 9,224 53,444
2007 1,288 0.6 36,672 17.5 135,841 64.9 173,801 83.0 9,727 55,968
2008 1,311 0.6 39,323 18.2 152,223 70.4 192,857 89.2 10,135 52,550
2009 1,278 0.6 42,209 18.9 156,024 70.0 199,511 89.4 9,869 49,466
2010 1,408 0.6 44,634 19.5 160,643 70.6 206,685 90.7 10,270 49,689
2011 1,306 0.6 48,407 20.5 171,439 73.6 221,152 94.6 9,763 44,146
2012 1,400 0.6 50,128 20.5 175,177 72.6 226,705 93.7 9,595 42,322
a. ASR = age standardised rate per 1,000 population.
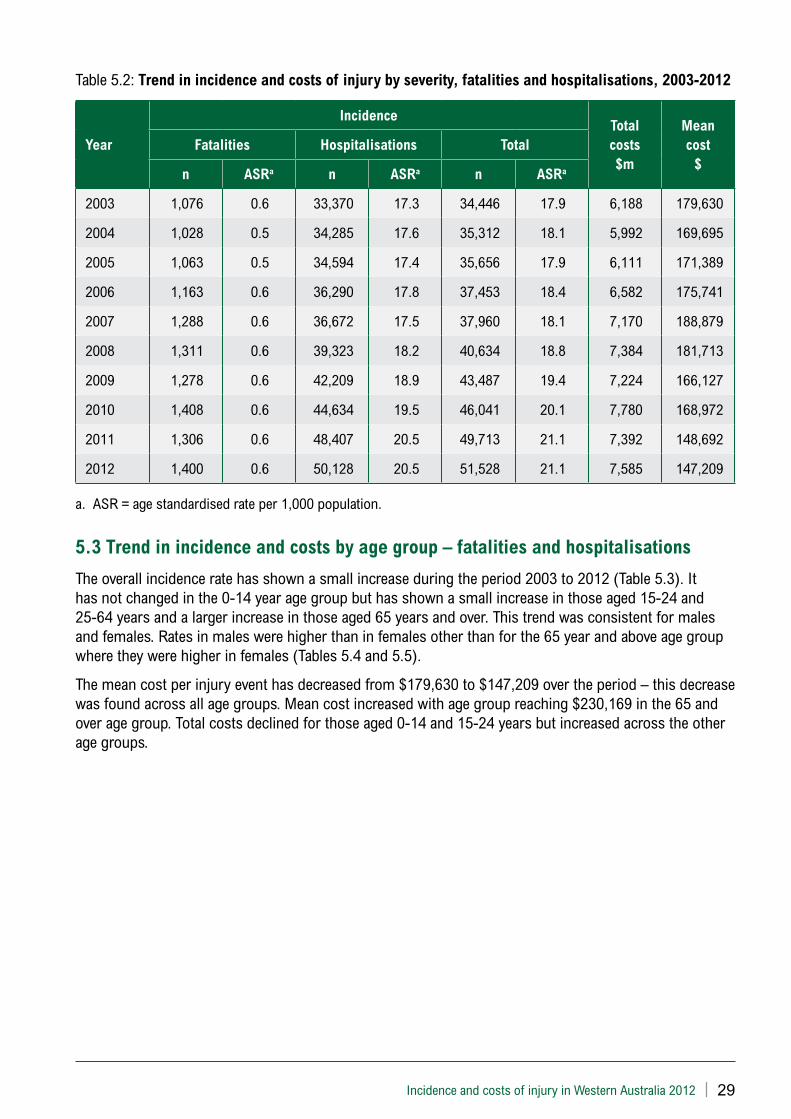
Incidence and costs of injury in Western Australia 2012 | 29
Table 5.2: Trend in incidence and costs of injury by severity, fatalities and hospitalisations, 2003-2012
Year
IncidenceTotal costs $m
Mean cost
$Fatalities Hospitalisations Total
n ASRa n ASRa n ASRa
2003 1,076 0.6 33,370 17.3 34,446 17.9 6,188 179,630
2004 1,028 0.5 34,285 17.6 35,312 18.1 5,992 169,695
2005 1,063 0.5 34,594 17.4 35,656 17.9 6,111 171,389
2006 1,163 0.6 36,290 17.8 37,453 18.4 6,582 175,741
2007 1,288 0.6 36,672 17.5 37,960 18.1 7,170 188,879
2008 1,311 0.6 39,323 18.2 40,634 18.8 7,384 181,713
2009 1,278 0.6 42,209 18.9 43,487 19.4 7,224 166,127
2010 1,408 0.6 44,634 19.5 46,041 20.1 7,780 168,972
2011 1,306 0.6 48,407 20.5 49,713 21.1 7,392 148,692
2012 1,400 0.6 50,128 20.5 51,528 21.1 7,585 147,209
a. ASR = age standardised rate per 1,000 population.
5.3 Trend in incidence and costs by age group – fatalities and hospitalisations
The overall incidence rate has shown a small increase during the period 2003 to 2012 (Table 5.3). It has not changed in the 0-14 year age group but has shown a small increase in those aged 15-24 and 25-64 years and a larger increase in those aged 65 years and over. This trend was consistent for males and females. Rates in males were higher than in females other than for the 65 year and above age group where they were higher in females (Tables 5.4 and 5.5).
The mean cost per injury event has decreased from $179,630 to $147,209 over the period – this decrease was found across all age groups. Mean cost increased with age group reaching $230,169 in the 65 and over age group. Total costs declined for those aged 0-14 and 15-24 years but increased across the other age groups.
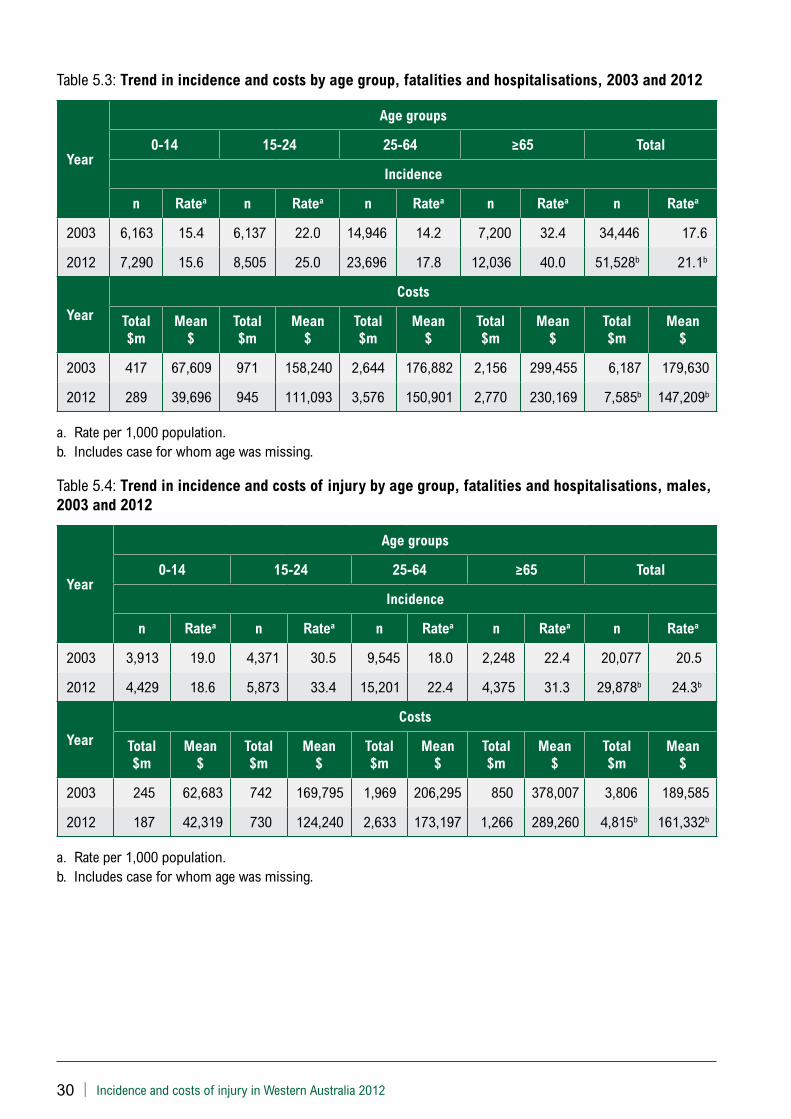
30 | Incidence and costs of injury in Western Australia 2012
Table 5.3: Trend in incidence and costs by age group, fatalities and hospitalisations, 2003 and 2012
Year
Age groups
0-14 15-24 25-64 ≥65 Total
Incidence
n Ratea n Ratea n Ratea n Ratea n Ratea
2003 6,163 15.4 6,137 22.0 14,946 14.2 7,200 32.4 34,446 17.6
2012 7,290 15.6 8,505 25.0 23,696 17.8 12,036 40.0 51,528b 21.1b
Year
Costs
Total $m
Mean $
Total $m
Mean $
Total $m
Mean $
Total $m
Mean $
Total $m
Mean $
2003 417 67,609 971 158,240 2,644 176,882 2,156 299,455 6,187 179,630
2012 289 39,696 945 111,093 3,576 150,901 2,770 230,169 7,585b 147,209b
a. Rate per 1,000 population.b. Includes case for whom age was missing.
Table 5.4: Trend in incidence and costs of injury by age group, fatalities and hospitalisations, males, 2003 and 2012
Year
Age groups
0-14 15-24 25-64 ≥65 Total
Incidence
n Ratea n Ratea n Ratea n Ratea n Ratea
2003 3,913 19.0 4,371 30.5 9,545 18.0 2,248 22.4 20,077 20.5
2012 4,429 18.6 5,873 33.4 15,201 22.4 4,375 31.3 29,878b 24.3b
Year
Costs
Total $m
Mean $
Total $m
Mean $
Total $m
Mean $
Total $m
Mean $
Total $m
Mean $
2003 245 62,683 742 169,795 1,969 206,295 850 378,007 3,806 189,585
2012 187 42,319 730 124,240 2,633 173,197 1,266 289,260 4,815b 161,332b
a. Rate per 1,000 population.b. Includes case for whom age was missing.
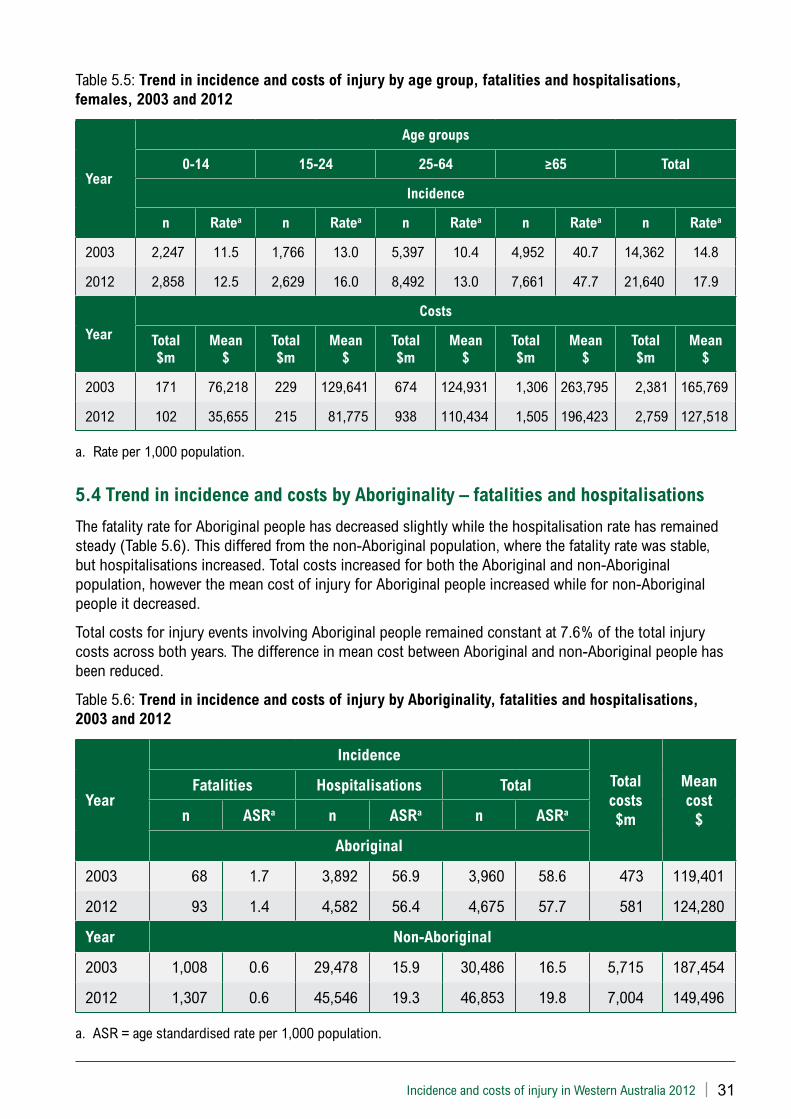
Incidence and costs of injury in Western Australia 2012 | 31
Table 5.5: Trend in incidence and costs of injury by age group, fatalities and hospitalisations, females, 2003 and 2012
Year
Age groups
0-14 15-24 25-64 ≥65 Total
Incidence
n Ratea n Ratea n Ratea n Ratea n Ratea
2003 2,247 11.5 1,766 13.0 5,397 10.4 4,952 40.7 14,362 14.8
2012 2,858 12.5 2,629 16.0 8,492 13.0 7,661 47.7 21,640 17.9
Year
Costs
Total $m
Mean $
Total $m
Mean $
Total $m
Mean $
Total $m
Mean $
Total $m
Mean $
2003 171 76,218 229 129,641 674 124,931 1,306 263,795 2,381 165,769
2012 102 35,655 215 81,775 938 110,434 1,505 196,423 2,759 127,518
a. Rate per 1,000 population.
5.4 Trend in incidence and costs by Aboriginality – fatalities and hospitalisations
The fatality rate for Aboriginal people has decreased slightly while the hospitalisation rate has remained steady (Table 5.6). This differed from the non-Aboriginal population, where the fatality rate was stable, but hospitalisations increased. Total costs increased for both the Aboriginal and non-Aboriginal population, however the mean cost of injury for Aboriginal people increased while for non-Aboriginal people it decreased.
Total costs for injury events involving Aboriginal people remained constant at 7.6% of the total injury costs across both years. The difference in mean cost between Aboriginal and non-Aboriginal people has been reduced.
Table 5.6: Trend in incidence and costs of injury by Aboriginality, fatalities and hospitalisations, 2003 and 2012
Year
Incidence
Total costs $m
Mean cost
$
Fatalities Hospitalisations Total
n ASRa n ASRa n ASRa
Aboriginal
2003 68 1.7 3,892 56.9 3,960 58.6 473 119,401
2012 93 1.4 4,582 56.4 4,675 57.7 581 124,280
Year Non-Aboriginal
2003 1,008 0.6 29,478 15.9 30,486 16.5 5,715 187,454
2012 1,307 0.6 45,546 19.3 46,853 19.8 7,004 149,496
a. ASR = age standardised rate per 1,000 population.
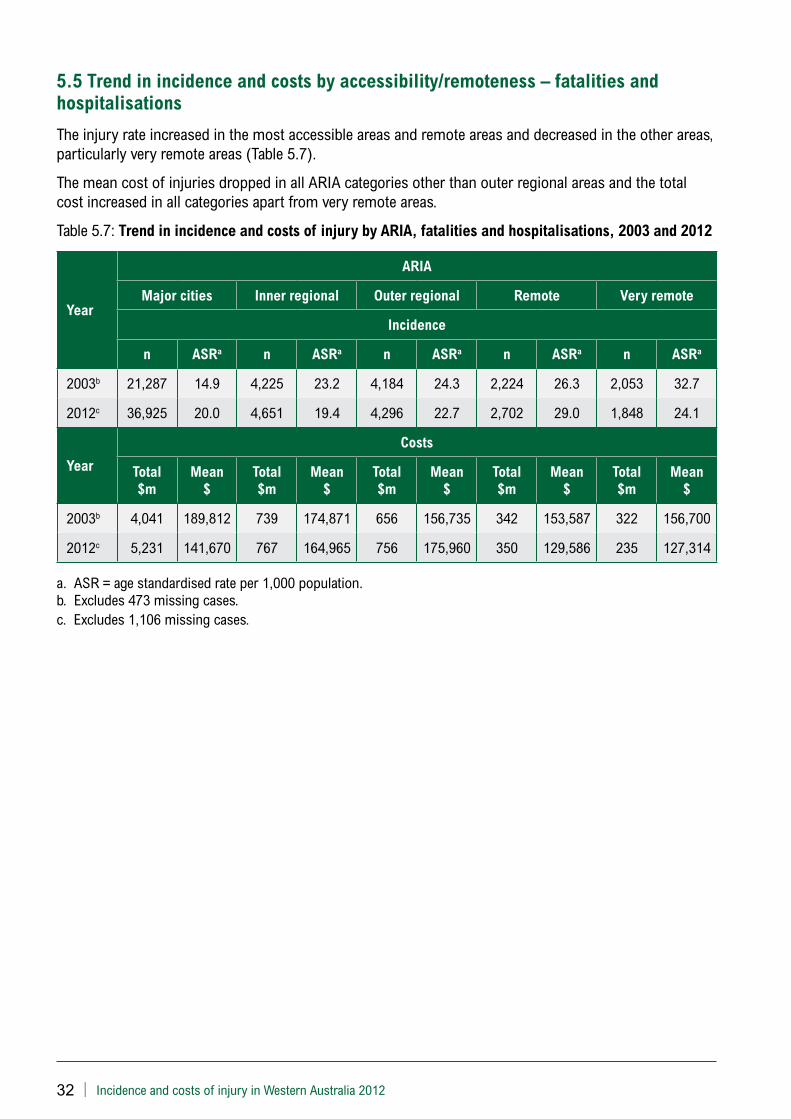
32 | Incidence and costs of injury in Western Australia 2012
5.5 Trend in incidence and costs by accessibility/remoteness – fatalities and hospitalisations
The injury rate increased in the most accessible areas and remote areas and decreased in the other areas, particularly very remote areas (Table 5.7).
The mean cost of injuries dropped in all ARIA categories other than outer regional areas and the total cost increased in all categories apart from very remote areas.
Table 5.7: Trend in incidence and costs of injury by ARIA, fatalities and hospitalisations, 2003 and 2012
Year
ARIA
Major cities Inner regional Outer regional Remote Very remote
Incidence
n ASRa n ASRa n ASRa n ASRa n ASRa
2003b 21,287 14.9 4,225 23.2 4,184 24.3 2,224 26.3 2,053 32.7
2012c 36,925 20.0 4,651 19.4 4,296 22.7 2,702 29.0 1,848 24.1
Year
Costs
Total $m
Mean $
Total $m
Mean $
Total $m
Mean $
Total $m
Mean $
Total $m
Mean $
2003b 4,041 189,812 739 174,871 656 156,735 342 153,587 322 156,700
2012c 5,231 141,670 767 164,965 756 175,960 350 129,586 235 127,314
a. ASR = age standardised rate per 1,000 population.b. Excludes 473 missing cases.c. Excludes 1,106 missing cases.
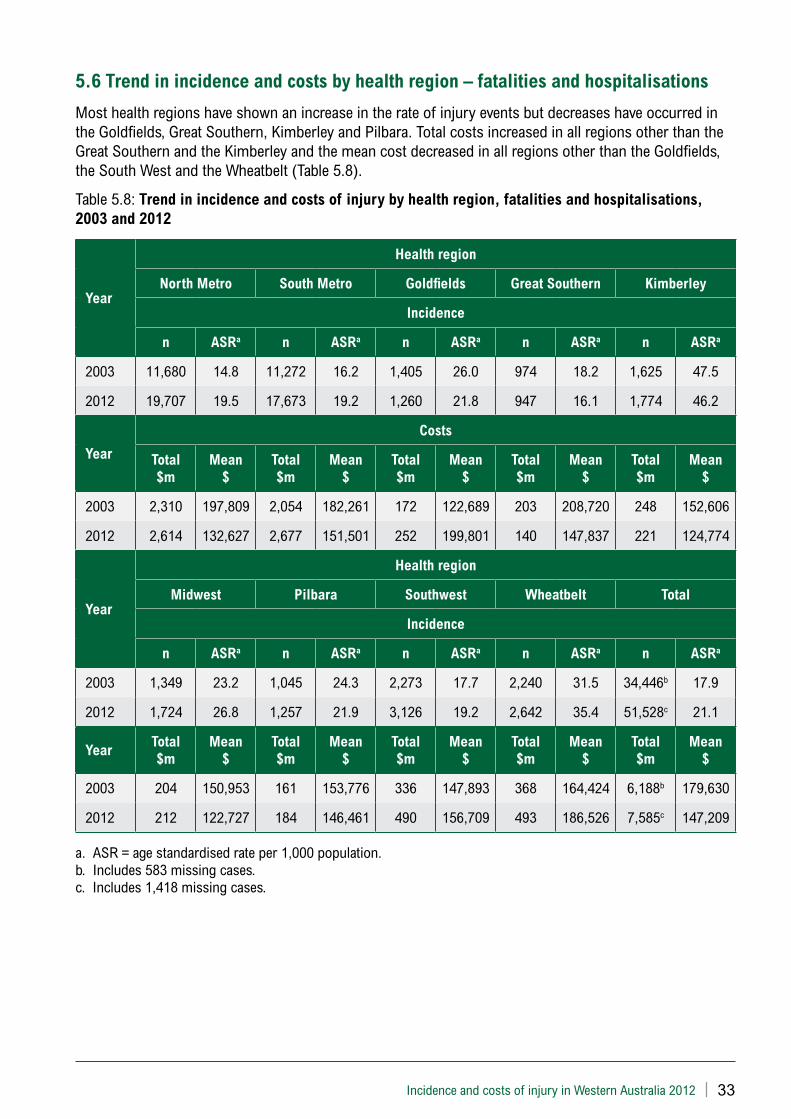
Incidence and costs of injury in Western Australia 2012 | 33
5.6 Trend in incidence and costs by health region – fatalities and hospitalisations
Most health regions have shown an increase in the rate of injury events but decreases have occurred in the Goldfields, Great Southern, Kimberley and Pilbara. Total costs increased in all regions other than the Great Southern and the Kimberley and the mean cost decreased in all regions other than the Goldfields, the South West and the Wheatbelt (Table 5.8).
Table 5.8: Trend in incidence and costs of injury by health region, fatalities and hospitalisations, 2003 and 2012
Year
Health region
North Metro South Metro Goldfields Great Southern Kimberley
Incidence
n ASRa n ASRa n ASRa n ASRa n ASRa
2003 11,680 14.8 11,272 16.2 1,405 26.0 974 18.2 1,625 47.5
2012 19,707 19.5 17,673 19.2 1,260 21.8 947 16.1 1,774 46.2
Year
Costs
Total $m
Mean $
Total $m
Mean $
Total $m
Mean $
Total $m
Mean $
Total $m
Mean $
2003 2,310 197,809 2,054 182,261 172 122,689 203 208,720 248 152,606
2012 2,614 132,627 2,677 151,501 252 199,801 140 147,837 221 124,774
Year
Health region
Midwest Pilbara Southwest Wheatbelt Total
Incidence
n ASRa n ASRa n ASRa n ASRa n ASRa
2003 1,349 23.2 1,045 24.3 2,273 17.7 2,240 31.5 34,446b 17.9
2012 1,724 26.8 1,257 21.9 3,126 19.2 2,642 35.4 51,528c 21.1
YearTotal $m
Mean $
Total $m
Mean $
Total $m
Mean $
Total $m
Mean $
Total $m
Mean $
2003 204 150,953 161 153,776 336 147,893 368 164,424 6,188b 179,630
2012 212 122,727 184 146,461 490 156,709 493 186,526 7,585c 147,209
a. ASR = age standardised rate per 1,000 population.b. Includes 583 missing cases.c. Includes 1,418 missing cases.
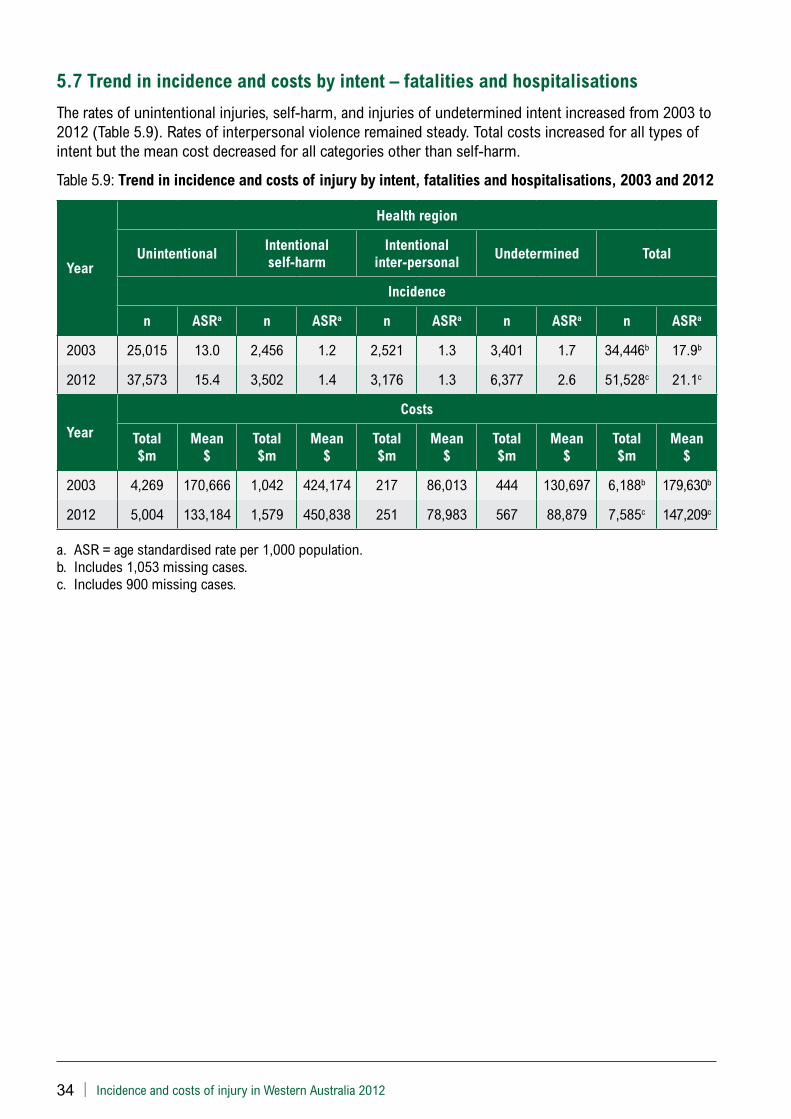
34 | Incidence and costs of injury in Western Australia 2012
5.7 Trend in incidence and costs by intent – fatalities and hospitalisations
The rates of unintentional injuries, self-harm, and injuries of undetermined intent increased from 2003 to 2012 (Table 5.9). Rates of interpersonal violence remained steady. Total costs increased for all types of intent but the mean cost decreased for all categories other than self-harm.
Table 5.9: Trend in incidence and costs of injury by intent, fatalities and hospitalisations, 2003 and 2012
Year
Health region
UnintentionalIntentional self-harm
Intentional inter-personal
Undetermined Total
Incidence
n ASRa n ASRa n ASRa n ASRa n ASRa
2003 25,015 13.0 2,456 1.2 2,521 1.3 3,401 1.7 34,446b 17.9b
2012 37,573 15.4 3,502 1.4 3,176 1.3 6,377 2.6 51,528c 21.1c
Year
Costs
Total $m
Mean $
Total $m
Mean $
Total $m
Mean $
Total $m
Mean $
Total $m
Mean $
2003 4,269 170,666 1,042 424,174 217 86,013 444 130,697 6,188b 179,630b
2012 5,004 133,184 1,579 450,838 251 78,983 567 88,879 7,585c 147,209c
a. ASR = age standardised rate per 1,000 population. b. Includes 1,053 missing cases. c. Includes 900 missing cases.
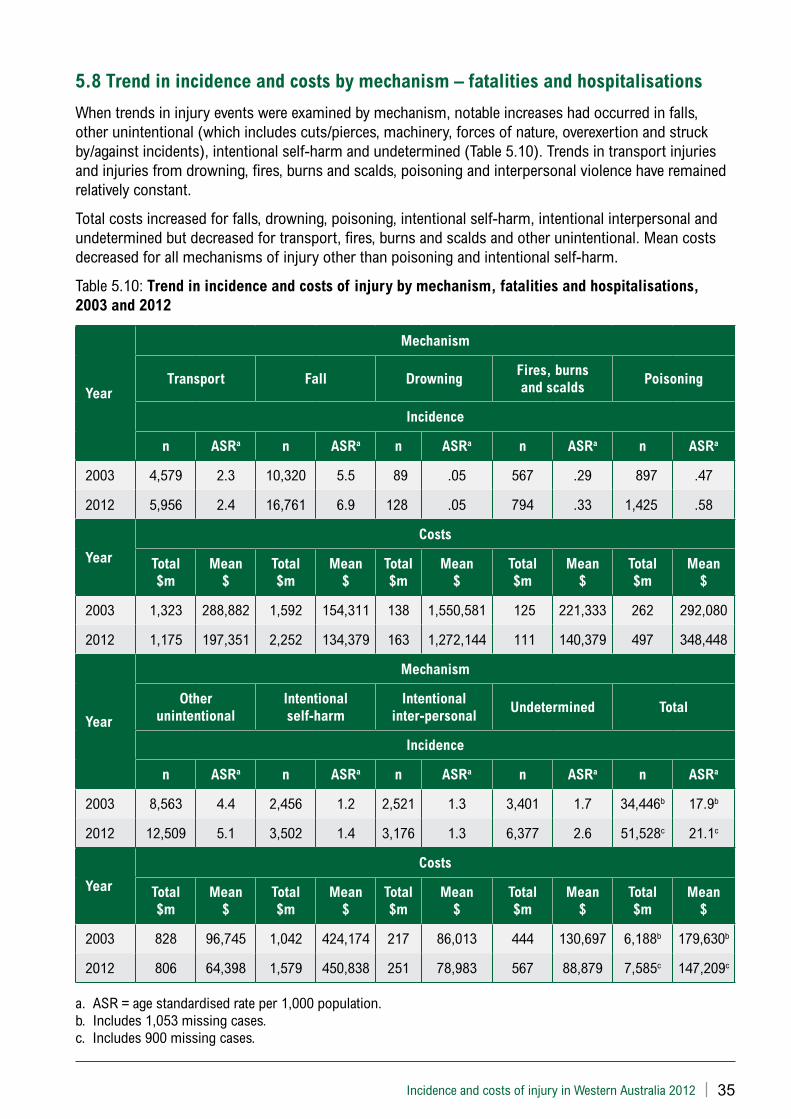
Incidence and costs of injury in Western Australia 2012 | 35
5.8 Trend in incidence and costs by mechanism – fatalities and hospitalisations
When trends in injury events were examined by mechanism, notable increases had occurred in falls, other unintentional (which includes cuts/pierces, machinery, forces of nature, overexertion and struck by/against incidents), intentional self-harm and undetermined (Table 5.10). Trends in transport injuries and injuries from drowning, fires, burns and scalds, poisoning and interpersonal violence have remained relatively constant.
Total costs increased for falls, drowning, poisoning, intentional self-harm, intentional interpersonal and undetermined but decreased for transport, fires, burns and scalds and other unintentional. Mean costs decreased for all mechanisms of injury other than poisoning and intentional self-harm.
Table 5.10: Trend in incidence and costs of injury by mechanism, fatalities and hospitalisations, 2003 and 2012
Year
Mechanism
Transport Fall DrowningFires, burns and scalds
Poisoning
Incidence
n ASRa n ASRa n ASRa n ASRa n ASRa
2003 4,579 2.3 10,320 5.5 89 .05 567 .29 897 .47
2012 5,956 2.4 16,761 6.9 128 .05 794 .33 1,425 .58
Year
Costs
Total $m
Mean $
Total $m
Mean $
Total $m
Mean $
Total $m
Mean $
Total $m
Mean $
2003 1,323 288,882 1,592 154,311 138 1,550,581 125 221,333 262 292,080
2012 1,175 197,351 2,252 134,379 163 1,272,144 111 140,379 497 348,448
Year
Mechanism
Other unintentional
Intentional self-harm
Intentional inter-personal
Undetermined Total
Incidence
n ASRa n ASRa n ASRa n ASRa n ASRa
2003 8,563 4.4 2,456 1.2 2,521 1.3 3,401 1.7 34,446b 17.9b
2012 12,509 5.1 3,502 1.4 3,176 1.3 6,377 2.6 51,528c 21.1c
Year
Costs
Total $m
Mean $
Total $m
Mean $
Total $m
Mean $
Total $m
Mean $
Total $m
Mean $
2003 828 96,745 1,042 424,174 217 86,013 444 130,697 6,188b 179,630b
2012 806 64,398 1,579 450,838 251 78,983 567 88,879 7,585c 147,209c
a. ASR = age standardised rate per 1,000 population.b. Includes 1,053 missing cases. c. Includes 900 missing cases.
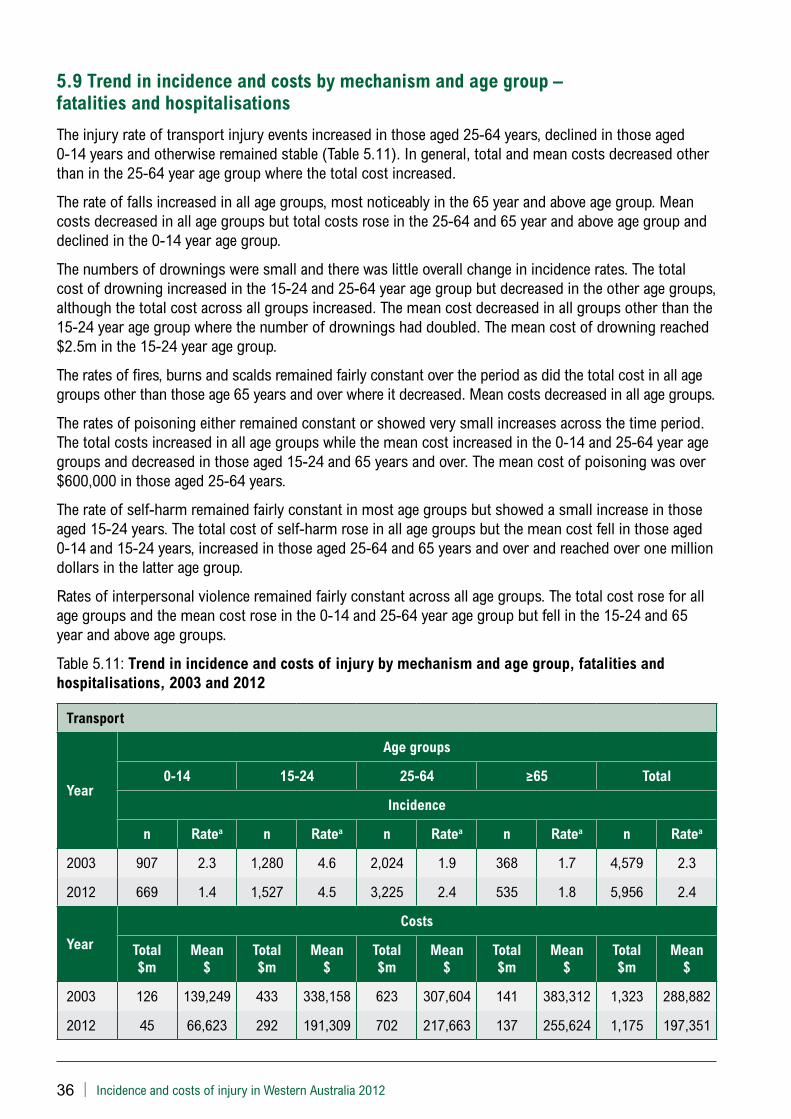
36 | Incidence and costs of injury in Western Australia 2012
5.9 Trend in incidence and costs by mechanism and age group – fatalities and hospitalisations
The injury rate of transport injury events increased in those aged 25-64 years, declined in those aged 0-14 years and otherwise remained stable (Table 5.11). In general, total and mean costs decreased other than in the 25-64 year age group where the total cost increased.
The rate of falls increased in all age groups, most noticeably in the 65 year and above age group. Mean costs decreased in all age groups but total costs rose in the 25-64 and 65 year and above age group and declined in the 0-14 year age group.
The numbers of drownings were small and there was little overall change in incidence rates. The total cost of drowning increased in the 15-24 and 25-64 year age group but decreased in the other age groups, although the total cost across all groups increased. The mean cost decreased in all groups other than the 15-24 year age group where the number of drownings had doubled. The mean cost of drowning reached $2.5m in the 15-24 year age group.
The rates of fires, burns and scalds remained fairly constant over the period as did the total cost in all age groups other than those age 65 years and over where it decreased. Mean costs decreased in all age groups.
The rates of poisoning either remained constant or showed very small increases across the time period. The total costs increased in all age groups while the mean cost increased in the 0-14 and 25-64 year age groups and decreased in those aged 15-24 and 65 years and over. The mean cost of poisoning was over $600,000 in those aged 25-64 years.
The rate of self-harm remained fairly constant in most age groups but showed a small increase in those aged 15-24 years. The total cost of self-harm rose in all age groups but the mean cost fell in those aged 0-14 and 15-24 years, increased in those aged 25-64 and 65 years and over and reached over one million dollars in the latter age group.
Rates of interpersonal violence remained fairly constant across all age groups. The total cost rose for all age groups and the mean cost rose in the 0-14 and 25-64 year age group but fell in the 15-24 and 65 year and above age groups.
Table 5.11: Trend in incidence and costs of injury by mechanism and age group, fatalities and hospitalisations, 2003 and 2012
Transport
Year
Age groups
0-14 15-24 25-64 ≥65 Total
Incidence
n Ratea n Ratea n Ratea n Ratea n Ratea
2003 907 2.3 1,280 4.6 2,024 1.9 368 1.7 4,579 2.3
2012 669 1.4 1,527 4.5 3,225 2.4 535 1.8 5,956 2.4
Year
Costs
Total $m
Mean $
Total $m
Mean $
Total $m
Mean $
Total $m
Mean $
Total $m
Mean $
2003 126 139,249 433 338,158 623 307,604 141 383,312 1,323 288,882
2012 45 66,623 292 191,309 702 217,663 137 255,624 1,175 197,351
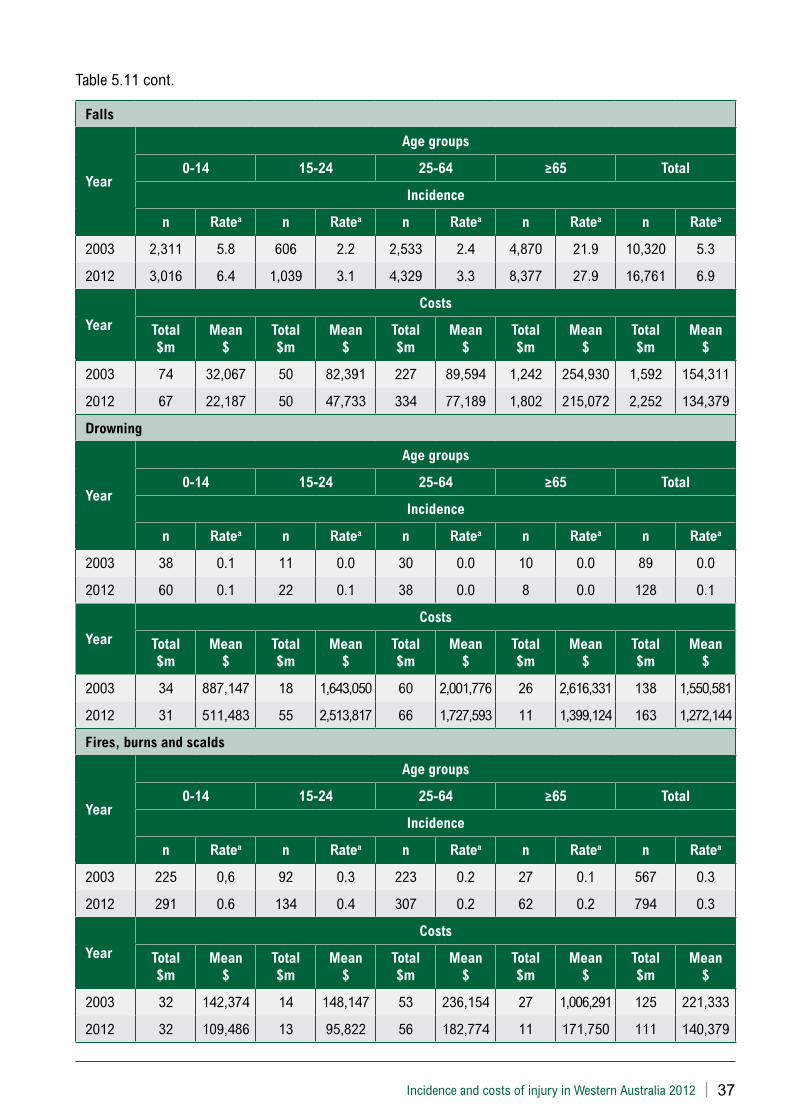
Incidence and costs of injury in Western Australia 2012 | 37
Table 5.11 cont.
Falls
Year
Age groups
0-14 15-24 25-64 ≥65 Total
Incidence
n Ratea n Ratea n Ratea n Ratea n Ratea
2003 2,311 5.8 606 2.2 2,533 2.4 4,870 21.9 10,320 5.3
2012 3,016 6.4 1,039 3.1 4,329 3.3 8,377 27.9 16,761 6.9
Year
Costs
Total $m
Mean $
Total $m
Mean $
Total $m
Mean $
Total $m
Mean $
Total $m
Mean $
2003 74 32,067 50 82,391 227 89,594 1,242 254,930 1,592 154,311
2012 67 22,187 50 47,733 334 77,189 1,802 215,072 2,252 134,379
Drowning
Year
Age groups
0-14 15-24 25-64 ≥65 Total
Incidence
n Ratea n Ratea n Ratea n Ratea n Ratea
2003 38 0.1 11 0.0 30 0.0 10 0.0 89 0.0
2012 60 0.1 22 0.1 38 0.0 8 0.0 128 0.1
Year
Costs
Total $m
Mean $
Total $m
Mean $
Total $m
Mean $
Total $m
Mean $
Total $m
Mean $
2003 34 887,147 18 1,643,050 60 2,001,776 26 2,616,331 138 1,550,581
2012 31 511,483 55 2,513,817 66 1,727,593 11 1,399,124 163 1,272,144
Fires, burns and scalds
Year
Age groups
0-14 15-24 25-64 ≥65 Total
Incidence
n Ratea n Ratea n Ratea n Ratea n Ratea
2003 225 0,6 92 0.3 223 0.2 27 0.1 567 0.3
2012 291 0.6 134 0.4 307 0.2 62 0.2 794 0.3
Year
Costs
Total $m
Mean $
Total $m
Mean $
Total $m
Mean $
Total $m
Mean $
Total $m
Mean $
2003 32 142,374 14 148,147 53 236,154 27 1,006,291 125 221,333
2012 32 109,486 13 95,822 56 182,774 11 171,750 111 140,379
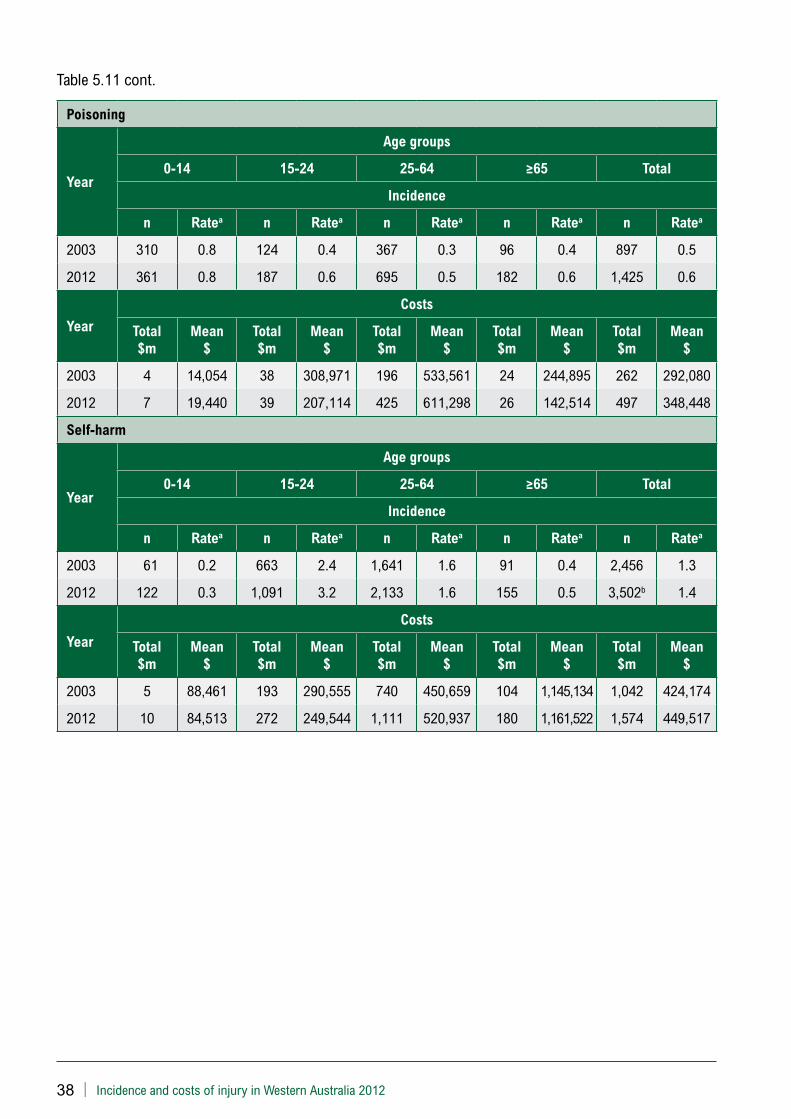
38 | Incidence and costs of injury in Western Australia 2012
Table 5.11 cont.
Poisoning
Year
Age groups
0-14 15-24 25-64 ≥65 Total
Incidence
n Ratea n Ratea n Ratea n Ratea n Ratea
2003 310 0.8 124 0.4 367 0.3 96 0.4 897 0.5
2012 361 0.8 187 0.6 695 0.5 182 0.6 1,425 0.6
Year
Costs
Total $m
Mean $
Total $m
Mean $
Total $m
Mean $
Total $m
Mean $
Total $m
Mean $
2003 4 14,054 38 308,971 196 533,561 24 244,895 262 292,080
2012 7 19,440 39 207,114 425 611,298 26 142,514 497 348,448
Self-harm
Year
Age groups
0-14 15-24 25-64 ≥65 Total
Incidence
n Ratea n Ratea n Ratea n Ratea n Ratea
2003 61 0.2 663 2.4 1,641 1.6 91 0.4 2,456 1.3
2012 122 0.3 1,091 3.2 2,133 1.6 155 0.5 3,502b 1.4
Year
Costs
Total $m
Mean $
Total $m
Mean $
Total $m
Mean $
Total $m
Mean $
Total $m
Mean $
2003 5 88,461 193 290,555 740 450,659 104 1,145,134 1,042 424,174
2012 10 84,513 272 249,544 1,111 520,937 180 1,161,522 1,574 449,517
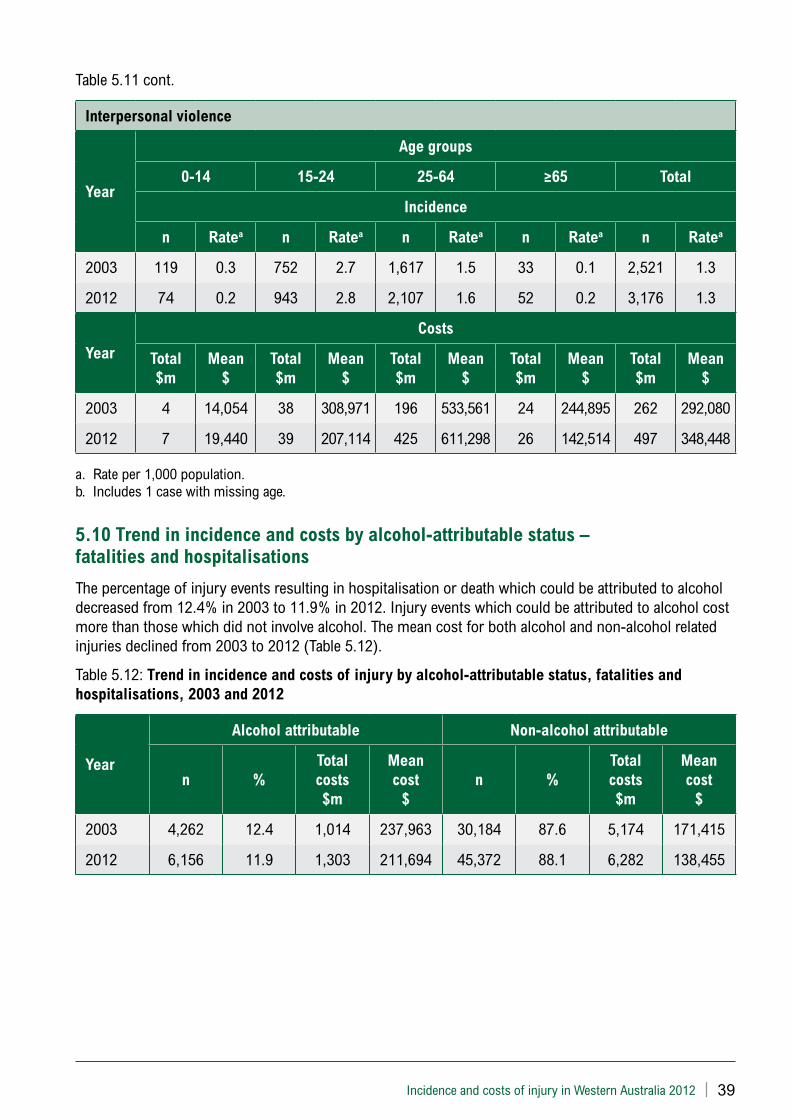
Incidence and costs of injury in Western Australia 2012 | 39
Table 5.11 cont.
Interpersonal violence
Year
Age groups
0-14 15-24 25-64 ≥65 Total
Incidence
n Ratea n Ratea n Ratea n Ratea n Ratea
2003 119 0.3 752 2.7 1,617 1.5 33 0.1 2,521 1.3
2012 74 0.2 943 2.8 2,107 1.6 52 0.2 3,176 1.3
Year
Costs
Total $m
Mean $
Total $m
Mean $
Total $m
Mean $
Total $m
Mean $
Total $m
Mean $
2003 4 14,054 38 308,971 196 533,561 24 244,895 262 292,080
2012 7 19,440 39 207,114 425 611,298 26 142,514 497 348,448
a. Rate per 1,000 population.b. Includes 1 case with missing age.
5.10 Trend in incidence and costs by alcohol-attributable status – fatalities and hospitalisations
The percentage of injury events resulting in hospitalisation or death which could be attributed to alcohol decreased from 12.4% in 2003 to 11.9% in 2012. Injury events which could be attributed to alcohol cost more than those which did not involve alcohol. The mean cost for both alcohol and non-alcohol related injuries declined from 2003 to 2012 (Table 5.12).
Table 5.12: Trend in incidence and costs of injury by alcohol-attributable status, fatalities and hospitalisations, 2003 and 2012
Year
Alcohol attributable Non-alcohol attributable
n %Total costs $m
Mean cost
$n %
Total costs $m
Mean cost
$
2003 4,262 12.4 1,014 237,963 30,184 87.6 5,174 171,415
2012 6,156 11.9 1,303 211,694 45,372 88.1 6,282 138,455
40 | Incidence and costs of injury in Western Australia 2012
6. Incidence and costs of injury by diagnosis group6.1 Introduction
Injury events were grouped into diagnosis groups using a classification system that combines body region and nature of injury into 13 categories (53). These categories have been shown to predict disability outcomes as well as diagnosis classifications that map to more detailed groupings such as the injury health states published by the 1990 and 2010 GBD studies and the EUROCOST classification system (54).
This chapter presents injury incidence and mean costs by diagnosis group and severity and shows the trend between 2003 and 2012. Incidence and costs of injury by diagnosis group are of interest to several parties involved in the treatment and longer term care of people with different types of injuries including medical specialists, rehabilitation services, support services, community organisations and carers. Moreover, patterns of injury incidence and corresponding costs by diagnosis can assist in prevention efforts, for example to establish potential cost savings that could be achieved through competing interventions.
Emergency department data are not included in this chapter as most hospitals outside of the metropolitan area do not record diagnosis codes on emergency department records.
6.2 Injury costs by diagnosis group and severity – fatalities and hospitalisations
Diagnosis groups recording the highest number of injury events were superficial injury/open wounds and upper extremity injuries. Injuries to internal organs and burns occurred least frequently (Table 6.1).
Mean costs per injury event were highest for hip fractures and skull/brain injuries, both exceeding $300,000. Relatively high mean costs exceeding $100,000 per injury event were also recorded for spine/vertebrae injuries, internal organ injuries and burns. Other diagnosis groups had substantially lower mean costs per injury event.
High mean costs per injury event partly reflected higher fatality rates. For example, the fatality rate for hip fractures, a diagnosis group dominated by the elderly, and skull/brain injuries were 6.9% and 5.1% respectively. The fatality rate for internal organ injuries and spine/vertebrae injuries were also relatively high at 2.1% and 1.8% respectively.
Also influencing mean costs per injury event were higher than average costs for injury events resulting in hospitalisation but not death. Injury events of this level of severity for which mean costs exceeded or were close to $100,000 included skull/brain injuries, burns and spine/vertebrae injuries.
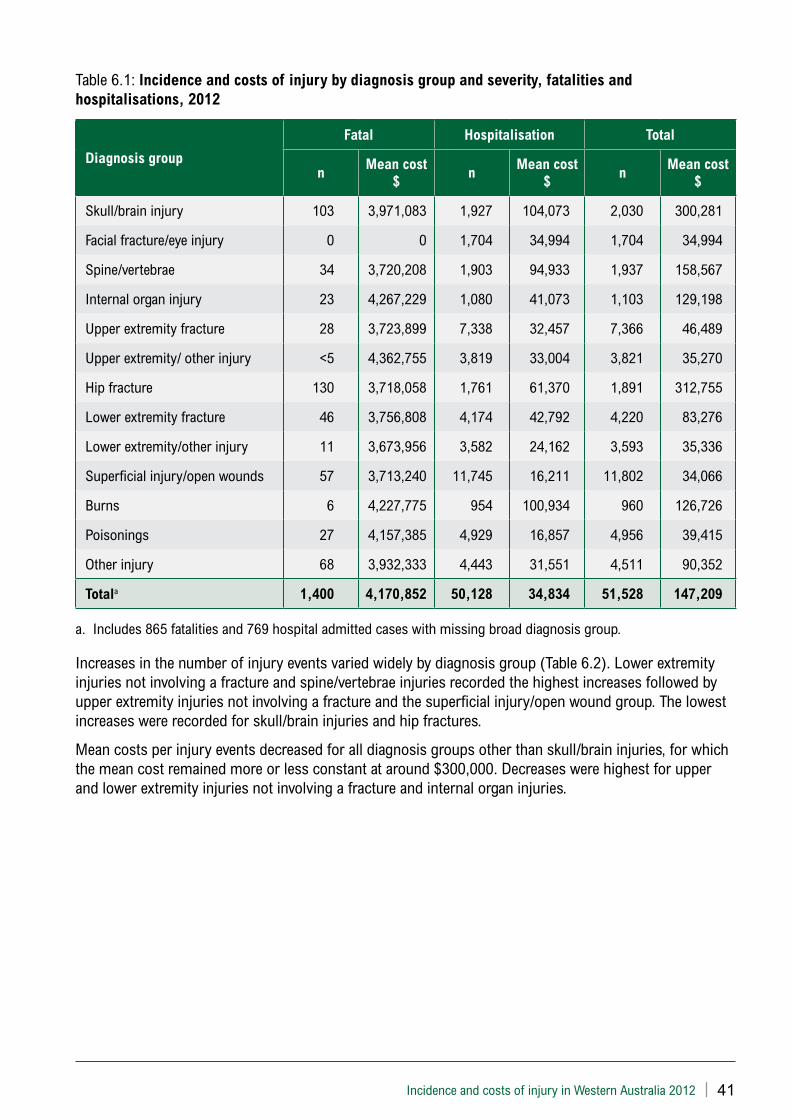
Incidence and costs of injury in Western Australia 2012 | 41
Table 6.1: Incidence and costs of injury by diagnosis group and severity, fatalities and hospitalisations, 2012
Diagnosis group
Fatal Hospitalisation Total
nMean cost
$n
Mean cost $
nMean cost
$
Skull/brain injury 103 3,971,083 1,927 104,073 2,030 300,281
Facial fracture/eye injury 0 0 1,704 34,994 1,704 34,994
Spine/vertebrae 34 3,720,208 1,903 94,933 1,937 158,567
Internal organ injury 23 4,267,229 1,080 41,073 1,103 129,198
Upper extremity fracture 28 3,723,899 7,338 32,457 7,366 46,489
Upper extremity/ other injury <5 4,362,755 3,819 33,004 3,821 35,270
Hip fracture 130 3,718,058 1,761 61,370 1,891 312,755
Lower extremity fracture 46 3,756,808 4,174 42,792 4,220 83,276
Lower extremity/other injury 11 3,673,956 3,582 24,162 3,593 35,336
Superficial injury/open wounds 57 3,713,240 11,745 16,211 11,802 34,066
Burns 6 4,227,775 954 100,934 960 126,726
Poisonings 27 4,157,385 4,929 16,857 4,956 39,415
Other injury 68 3,932,333 4,443 31,551 4,511 90,352
Totala 1,400 4,170,852 50,128 34,834 51,528 147,209
a. Includes 865 fatalities and 769 hospital admitted cases with missing broad diagnosis group.
Increases in the number of injury events varied widely by diagnosis group (Table 6.2). Lower extremity injuries not involving a fracture and spine/vertebrae injuries recorded the highest increases followed by upper extremity injuries not involving a fracture and the superficial injury/open wound group. The lowest increases were recorded for skull/brain injuries and hip fractures.
Mean costs per injury events decreased for all diagnosis groups other than skull/brain injuries, for which the mean cost remained more or less constant at around $300,000. Decreases were highest for upper and lower extremity injuries not involving a fracture and internal organ injuries.
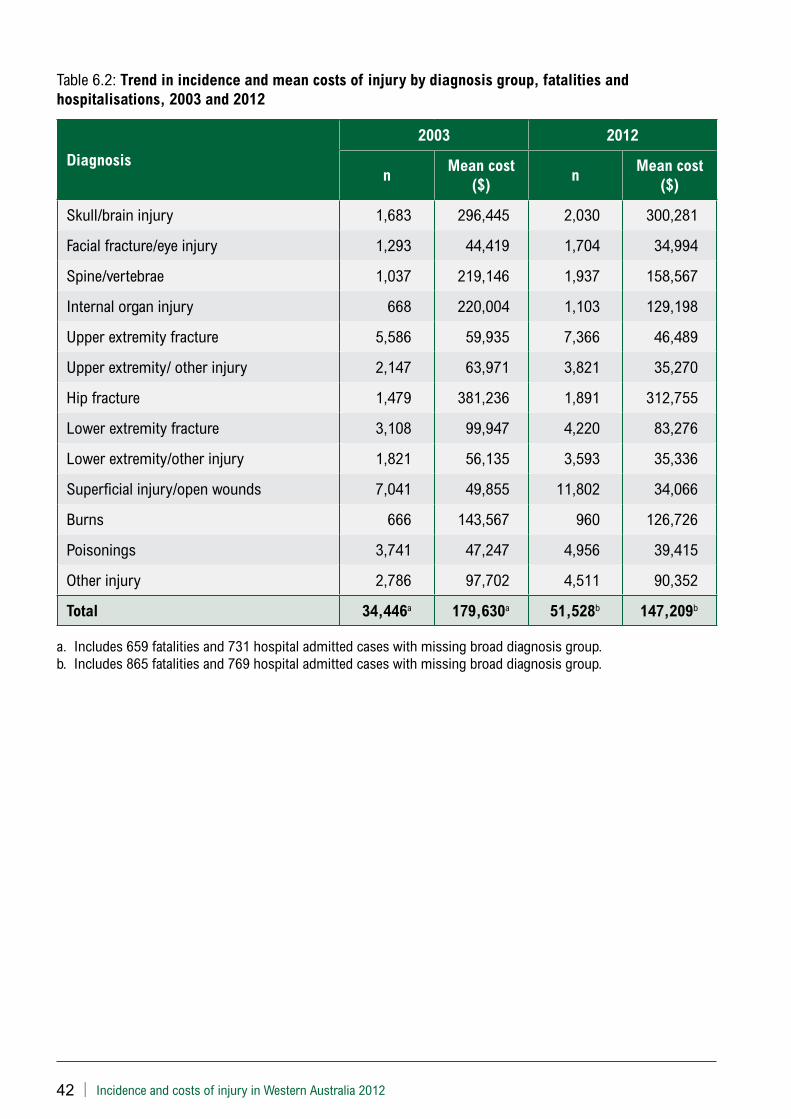
42 | Incidence and costs of injury in Western Australia 2012
Table 6.2: Trend in incidence and mean costs of injury by diagnosis group, fatalities and hospitalisations, 2003 and 2012
Diagnosis
2003 2012
nMean cost
($)n
Mean cost ($)
Skull/brain injury 1,683 296,445 2,030 300,281
Facial fracture/eye injury 1,293 44,419 1,704 34,994
Spine/vertebrae 1,037 219,146 1,937 158,567
Internal organ injury 668 220,004 1,103 129,198
Upper extremity fracture 5,586 59,935 7,366 46,489
Upper extremity/ other injury 2,147 63,971 3,821 35,270
Hip fracture 1,479 381,236 1,891 312,755
Lower extremity fracture 3,108 99,947 4,220 83,276
Lower extremity/other injury 1,821 56,135 3,593 35,336
Superficial injury/open wounds 7,041 49,855 11,802 34,066
Burns 666 143,567 960 126,726
Poisonings 3,741 47,247 4,956 39,415
Other injury 2,786 97,702 4,511 90,352
Total 34,446a 179,630a 51,528b 147,209b
a. Includes 659 fatalities and 731 hospital admitted cases with missing broad diagnosis group.b. Includes 865 fatalities and 769 hospital admitted cases with missing broad diagnosis group.
Incidence and costs of injury in Western Australia 2012 | 43
7. DiscussionThis report provides estimates of the incidence and costs of injury in Western Australia using linked administrative health data and personal injury claims data for the Motor Injury Insurance Scheme. Incidence counts were based on injury events, with episodes of care relating to a specific injury combined into a single event. Injury costs included were health sector costs, costs relating to longer term care needs, loss of paid productivity and quality of life loss. The study excluded costs like property damage, workplace disruption, fire services, and criminal justice that result from injury incidents but are not injury costs. Costs were calculated using an incidence-based approach computed by assessing the lifetime costs of all injuries in a given year. The study’s limitations, notably the assumption that costs modelled from the Motor Injury Insurance Scheme equalled costs for injuries with similar diagnoses and different causes, are detailed in the methods section.
Injury events were grouped as follows: (i) injury events resulting in death; (ii) injury events resulting in hospitalisation with survival to discharge; and (iii) injury events receiving treatment at an emergency department not resulting in hospitalisation or death.
Key findings of the study were as follows:
Incidence and costs by sociodemographic factors
* In 2012, the number of injury events in WA was 227,000 or 93 injuries per 1,000 population. The total costs were $9.6 billion.
* Health sector costs accounted for 12.3% of total costs, long term care costs for 3.2%, loss of paid productivity for 19.8%, and loss of quality of life for 64.7%.
* Fatal injuries comprised 0.6% of injury events, non-fatal injuries requiring hospitalisation 22.1%, and those only requiring emergency department presentations 77.3%. However, fatalities accounted for 61% of the total costs of injury.
* Males had a higher rate of injury events than females, and accounted for 63% of all injury costs.
* The injury rate was highest in the 85 years and above age group, with high rates also in the 10-14, 15-19 and 20-24 year age groups. Mean cost of injury increased with age, from around $11,000 per injury event for younger people to over $200,000 for the 85 years and above age group.
* Aboriginal people had more than double the rate of fatal injuries and more than triple the rate of non-fatal hospitalisations compared to non-Aboriginal people. Compared with a share of 3.6% of total population in WA, Aboriginal people accounted for 7.7% of total injury costs.
* Those in the most disadvantaged socioeconomic quintile had 2.3 times as many fatalities, and 1.6 times as many non-fatal hospitalisations and emergency presentations when compared to the least disadvantaged socioeconomic quintile. Total costs in the most disadvantaged quintile were 1.8 times higher than in the least disadvantaged quintile.
* Rates of injury were higher in non-metropolitan regions, with the Kimberley, Wheatbelt and Goldfields health regions having rates more than double those in the metropolitan region. Mean costs per injury event were generally lower in non-metropolitan regions.
44 | Incidence and costs of injury in Western Australia 2012
Incidence and costs by intent and mechanism
* Intentional self-harm accounted for 24.2% of fatal injuries, 6.3% of non-fatal hospitalisations, and $1.6 billion in costs.
* Falls and transport injuries were the most common unintentional injuries. Falls accounted for 32.5% of fatal injuries, 32.5% of non-fatal hospitalisations, and $2.2 billion in costs. Transport injuries accounted for 13.6% of fatalities, 11.5% of non-fatal hospitalisations and $1.1 billion in costs.
Incidence and costs by alcohol-attributable status
* Alcohol was involved in 17.5% of fatalities, 11.8% of non-fatal hospitalisations, and 32% of emergency department presentations. The overall cost of injuries involving alcohol was $1.9 billion.
Trends in incidence and costs of injury
* Emergency department data are not included in the trend analyses as data were not available for all emergency departments outside of the metropolitan area prior to 2008. All comparisons reported in this section compare injury incidence and costs between 2003 and 2012.
* The age-standardised rate of fatal injury events remained stable, while the rate of non-fatal injury hospitalisations increased, along with the total cost of injury events. The mean cost per injury event declined over the period.
* The age-standardised rate of injury events increased most for people in the 65 years and above age group with the share of total costs for this age group increasing from 34.8% to 36.5%.
* Compared to 2003, the rate of fatal injury events in Aboriginal people decreased, while the hospitalisation rate remained stable. In contrast, the rate of injury events remained constant for non-Aboriginal people while their hospitalisation rate increased. The difference in mean cost of injury between Aboriginal and non-Aboriginal people was reduced.
* Age-standardised rates of falls and self-harm injury events increased over the period, while the trend for most other mechanisms of injury remained relatively constant. For falls, the most notable increase was in the 65 years and above age group. For self-harm injuries, the rate increased most in the 15-24 year age group. Mean costs decreased for all mechanisms of injury other than poisoning and self-harm.
Incidence and costs by diagnosis group
* Superficial injury/open wounds and upper extremity injuries were the most commonly occurring injury types, with injuries to internal organs and burns occurring least frequently. Mean costs per injury event were highest for hip fractures and skull/brain injuries, both exceeding $300,000. Mean costs per injury events decreased over time for all diagnosis groups other than skull/brain injuries.
Incidence and costs of injury in Western Australia 2012 | 45
Cost estimates in this study for 2003 are higher than reported in the previous cost-of-injury report. The previous report, which excluded emergency department presentations, estimated the costs of injury in 2003 as $4.5 billion (adjusted from $2.9 billion to reflect 2014 dollar values (75)) compared to an equivalent figure for fatal and hospitalised injury events of $6.2 billion in this study. A major reason for this difference is the use in this study of a willingness-to-pay value of statistical life of $4.2m as recommended by the Office of Best Practice Regulation (48). In the previous report a value of statistical life of $2.2m (adjusted from $1.4m to reflect 2014 dollar values (75)) was adopted based on a mixed human capital and compensation payment approach used by the Bureau of Transport Economics to calculate the cost of road crashes in Australia (76). Furthermore, using the linked health data to calculate injury events in this study and applying more advanced techniques in allocating costs to injury events makes comparison of the total costs of injury in this study with the previous study inappropriate. However, some findings are similar. For instance, in both studies, metropolitan regions accounted for 65-70% of the total costs of injury and the three mechanisms of injury accounting for the highest total costs were falls, transport injuries and self-harm injuries.
Cost-of-illness estimates using comprehensive information on the burden of injuries include the physical, mental and social loss of wellbeing resulting from injury events and can be regarded as a summary measure of population health. Estimating the magnitude of the burden of injury can be used to assess the relative burden of injuries compared with other preventable health problems within a population and for determining the appropriate level of investment for specific injury prevention activities (77). In comparing the incidence and costs of injury across multiple dimensions, this study provides information to policy makers, health professionals and other injury prevention stakeholders to identify areas where further prevention and care are most needed. Moreover, when injury problem areas have been identified, cost-of-illness studies provide an estimate for determining savings that can be achieved through successful intervention programs and can be used in cost-effectiveness analyses for intervention efforts (17).
This study has highlighted the significance of the priorities for injury prevention identified in the Western Australian Health Promotion Strategic Framework 2012-2016, with several priority areas identified in the framework shown to have high incidence, high costs per injury event or a combination of both. By examining patterns and trends in the incidence and costs of injury across multiple dimensions this study has also put specific injury problems into perspective and facilitated more targeted preventive interventions.
46 | Incidence and costs of injury in Western Australia 2012
References1. Institute for Health Metrics and Evaluation. Global Health Data Exchange: Global Burden of
Disease Study 2013 (GBD 2013) Data Downloads Seattle, WA: IHME; [cited 2016 Feb 22]. Available from: http://ghdx.healthdata.org/global-burden-disease-study-2013-gbd-2013-data-downloads.
2. Murray C, Vos T, Lozane R, Naghavi M, Flaxman A, Michaud C, et al. Disability-adjusted life years (DALYs) for 291 diseases and injuries in 21 regions, 1990–2010: a systematic analysis for the Global Burden of Disease Study 2010. Lancet. 2012;380:2197-223.
3. Ballestas T, Xiao J, McEvoy S, Somerford P. The Epidemiology of injury in Western Australia, 2000-2008. Perth: Deartment of Health WA, 2011.
4. Department of Health WA. Injury prevention in Western Australia: A review of statewide activity Perth: Chronic Disease Prevention Directorate, Department of Health WA, 2015.
5. Commonwealth Department of Health and Family Services and Australian Institute of Health and Welfare. National Health Priority Areas report: injury prevention and control 1997. Canberra DHFS and AIHW, 1998.
6. Department of Health WA. WA Health Promotion Strategic Framework 2012-2016. Perth: Chronic Disease Prevention Directorate, Department of Health, WA, 2012.
7. Hendrie D, Miller T. Assessing the burden of injuries: competing measures. Injury Control and Safety Promotion. 2004;11(3):193-99.
8. Miller T, Romano E, Spicer R. The cost of childhood injuries and the value of prevention. The Future of Children. 2000;10(1):137-63.
9. Hendrie D. The cost of injury in Western Australia during 2003: an overview of total and health system costs. Perth: Western Australian Government, 2005.
10. Watson W, Ozanne-Smith J. The cost of injury to Victoria. Melbourne: Monash University Accident Research Centre, 1997.
11. Moller J. The cost of injury. Injury Issues Monitor. 1999;15(4).
12. Miller T, Pindus N, Douglass J, Rossman S. Databook on nonfatal injury: incidence, costs and consequences. Washington D.C.: The Urban Institute Press, 1995.
13. Holman C, Bass A, Rouse I, Hobbs M. Population-based linkage of health records in Western Australia: development of a health services research linked database. Australian and New Zealand Journal of Public Health. 1999;23(5):453-9.
14. Lestina D, Miller T, Smith G. Creating injury episodes using medical claims data. Journal of Trauma. 1998; 45(3):565-69.
15. Gold M, Siegel J, Russell L, Weinstein M. Cost-effectiveness in health and medicine. New York: Oxford University Press; 1996.
16. O’Dea D, Wren J. New Zealand estimates of the total social and economic cost of injuries. Wellington: New Zealand. Injury Prevention Strategy. 2012. Available at: www.acc.co.nz/PRD_EXT_CSMP/groups/external_ip/documents/guide/wpc133825.pdf
17. Finkelstein E, Corso P, Miller T. The incidence and economic burden of injuries in the United States New York: Oxford University Press; 2006.
18. Australian Institute of Health and Welfare. Health expenditure 2013-14. Canberra: AIHW, 2015.
Incidence and costs of injury in Western Australia 2012 | 47
19. Pharmaceutical Benefits Advisory Committee. Guidelines for preparing submissions to the Pharmaceutical Benefits Advisory Committee: Section D - Economic evaluation. Canberra: Department of Health, 2015.
20. Parkinson B, De Abreu Loutenco R. Discounting in economic evaluations in health care: a brief review. Sydney: Centre for Health Economics Research and Evaluation (CHERE) 2015 [cited 2016 Feb 22]. Available from: http://www.crest.uts.edu.au/pdfs/FactSheet_Discounting.pdf.
21. Commonwealth Department of Health. National Hospital Cost Data Collection: Round 14 (2009-10) National public cost weight tables - version 6.0x and version 5.2 2011. Available from: http://www.health.gov.au/internet/main/publishing.nsf/Content/Round_14-cost-reports.
22. Commonwealth Department of Health and Ageing. National Hospital Cost Data Collection: Cost report Round 7 (2002-03) AR-DRGv4.2. Canberra: Commonwealth Department of Health and Ageing, 2003.
23. Commonwealth Department of Health and Ageing. National Hospital Cost Data Collection: Cost report Round 8 (2003-04) AR-DRGv4.2. Canberra: Commonwealth Department of Health and Ageing, 2005.
24. Commonwealth Department of Health and Ageing. National Hospital Cost Data Collection: Cost report Round 9 (2004-05) AR-DRGv5.0. Canberra: Commonwealth Department of Health and Ageing, 2006.
25. Commonwealth Department of Health and Ageing. National Hospital Cost Data Collection: Cost report Round 10 (2005-06) AR-DRGv5.0. Canberra: Commonwealth Department of Health and Ageing, 2007.
26. Commonwealth Department of Health and Ageing. National Hospital Cost Data Collection: Cost report Round 11 (2006-07) AR-DRGv5.1. Canberra: Commonwealth Department of Health and Ageing, 2008.
27. Commonwealth Department of Health and Ageing. National Hospital Cost Data Collection: Cost report Round 12 (2007-08) AR-DRGv5.1. Canberra: Commonwealth Department of Health and Ageing, 2009.
28. Commonwealth Department of Health and Ageing. National Hospital Cost Data Collection: Cost report Round 13 (2008-09) AR-DRGv5.2. Canberra: Commonwealth Department of Health and Ageing, 2010.
29. Independent Hospital Pricing Authority. National Hospital Cost Data Collection: Cost report Round 15 (2010-11) AR-DRGv6.0. Canberra: Commonwealth Department of Health and Ageing, 2013.
30. Independent Hospital Pricing Authority. National Hospital Cost Data Collection: Cost report Round 16 (2011-12) AR-DRGv6.0. Sydney: IHPA, 2014.
31. Independent Hospital Pricing Authority. National Hospital Cost Data Collection: Cost report Round 17 (2012-13) AR-DRGv6.0. Sydney: IHPA, 2015.
32. Mihaylova B, Briggs A, O’Hagan A, Thompson S. Review of statistical methods for analysing healthcare resources and costs. Health Economics. 2011;20:897-916.
33. Dodd S, Bassi A, Bodger K, Williamson P. A comparison of multivariable regression models to analyse cost data. Journal of Evaluation in Clinical Practice. 2006;12(1):76-86.
34. Glick H, Doshi J, Sonnad S, Polsky D. Economic evaluation in clinical trials. Oxford: Oxford University Press; 2007.
48 | Incidence and costs of injury in Western Australia 2012
35. Gregori D, Petrinco M, Bo S, Desideri A, Merletti F, Pagano E. Regression models for analyzing costs and their determinants in health care: an introductory review. International Journal for Quality in Health Care 2011;23(3):331-41.
36. Maydeu-Olivares A, Garcia-Forero C. Goodness-of-fit testing. International Encyclopedia of Education. 2010;7:190-6.
37. Briggs A, O’Brien B, Blackhouse G. Thinking outside the box: recent advances in the analysis and presentation of uncertainty in cost-effectiveness studies. Annnual Review of Public Health. 2002;23:377-401.
38. Jones A. Health econometrics. In: Culyer A, Newhouse J, editors. Handbook of health economics. Amsterdam: Elsevier; 2000.
39. Malehi A, Pourmotahari F, Angali K. Statistical models for the analysis of skewed healthcare cost data: a simulation study. Health Economics Review.5(11). Available from: https://healtheconomicsreview.springeropen.com/articles/10.1186/s13561-015-0045-7
40. Manning W, Basu A, Mullahy J. Generalized modeling approaches to risk adjustment of skewed outcomes data. Journal of Health Economics. 2005;24(3):465-88.
41. St John Ambulance WA. Metro Ambulance Fees. Available from: http://www.stjohnambulance.com.au/st-john/ambulance-and-health-services/metro-ambulance-service/metro-ambulance-fees.
42. Australian Bureau of Statistics. Employee earnings and hours, Australia, May 2014. Canberra: ABS, 2015.
43. Productivity Commission. PC Productivity Update. Melbourne: Productivity Commission, 2015.
44. Australian Bureau of Statistics. Life tables, states, territories and Australia, 2012-2014. Canberra: ABS, 2015.
45. Bhalla K, Harrison J. Burden calculator: a simple and open analytical tool for estimating the population burden of injury. Injury Prevention. 2015;2015-041816:1-4.
46. World Health Organization. Disability weights, discounting and age weighting of DALYs: Health statistics and information systems; [cited 2016 Feb 25]. Available from: http://www.who.int/healthinfo/global_burden_disease/daly_disability_weight/en/.
47. Ministry of Health and Accident Compensation Corporation. Injury-related health loss: a report from New Zealand Burden of Diseases, Injuries and Risk Factors Study 1990-2013. Wellington: Ministry of Health, 2013.
48. Office of Best Practice Regulation. Best Practice Regulation Guidance Note: Value of statistical life. Canberra: Department of Prime Minister and Cabinet, 2014.
49. Australian Bureau of Statistics. Household income and wealth, Australia, 2013-14. Canberra: ABS, 2015.
50. Chikritzhs T, Evans M, Gardner C, Liang W, Pascal R, Stockwell T, et al. Australian alcohol aetiological fractions for injuries treated in emergency departments. Perth: National Drug Research Institute, 2011.
51. Xiao J, Rowe T, Somerford P, Draper G, Martin J. Impact of alcohol on the population of Western Australia. Perth: Epidemiology Branch, Department of Health WA, 2008.
52. Global Burden of Disease Expert Group. External cause categories [cited 2016 Feb 15]. Available from: https://docs.google.com/spreadsheets/d/1n0yy5DcCgBeTt483Yg4sNmU1xfC_P4xsC1s50RXs4lk/pub.
Incidence and costs of injury in Western Australia 2012 | 49
53. Meerding W, Looman C, Essink-Bot M, Toet H, Mulder S, van Beeck E. Distribution and determinants of health and work status in a comprehensive population of injury patients. Journal of Trauma. 2004;56(1):150-61.
54. Gabbe B, Simpson P, Lyons R, Polinder S, Rivara F, Ameratunga S, et al. How well do principal diagnosis classifications predict disability 12 months post injury? Injury Prevention. 2015;21:e120-e6.
55. Fingerhut L, Warner M. The ICD-10 injury mortality diagnosis matrix. Injury Prevention. 2006;12:24-9.
56. Information Management and Reporting Directorate. Emergency Department Data Collection, Data Dictionary, version 1.0. Perth: Health Department WA, 2007.
57. McGhan W, Al M, Doshi J, Kamae I, Marx S, Rindress D. The ISPOR Good Practices for Quality Improvement of Cost-Effectiveness Research Task Force Report. Value in Health. 2009;12(8):1086-99.
58. Polinder S, Meerding W, van Baar M, Toet H, Mulder S, van Beeck E, et al. Cost estimation of injury-related hospital admissions in 10 European countries. Journal of Trauma. 2005;59(6):1283-91.
59. Meerding W, Mulder S, van Beeck E. Incidence and costs of injuries in The Netherlands. European Journal of Public Health. 2006;16(3):271-7.
60. Independent Hospital Pricing Authority. National Public Hospitals Cost report 2013-14 Round 18 Sydney: IHPA, 2016.
61. Insurance Commission of Western Australia. A guide for people injured in a motor vehicle crash. Accessed Nov 2016, available at: https://www.icwa.wa.gov.au/__data/assets/pdf_file/0016/880/ctp_guide.pdf
62. Australian Institute of Health and Welfare. The burden of disease and injury in Australia – summary report. Canberra: AIHW, 1999.
63. Mortimer D, Segal L. Is the value of a life or life-year saved context specific? Further evidence from a discrete choice experiment. Cost Effectiveness and Resource Allocation. 2008;6:8.
64. Haninger K, Hammitt J. Diminishing willingness to pay per quality-adjusted life year: valuing acute foodborne illness Risk Analysis 2011;31(9):1363-80.
65. Johannesson M, Johansson P. Is the valuation of a QALY gained independent of age? Some empirical evidence. Journal of Health Economics. 1997;16(5):589-99.
66. Hammitt J. Valuing changes in mortality risk: lives saved versus life years saved. Review of Environmental Economics and Policy. 2007;1(2):228-40.
67. Henley G, Harrison J. Injury severity scaling: a comparison of methods for measurement of injury severity. Canberra: AIHW, 2009.
68. Workplace Gender Equality Agency. Gender pay gap statistics. Sydney: Workplace Gender Equality Agency, 2016.
69. Australian Bureau of Statistics. Population characteristics, Aboriginal and Torres Strait Islander Peoples. Canberra: ABS, 2006.
70. Australian Institute of Health and Welfare. Australia’s health 2014. Canberra: AIHW, 2014.
71. Australian Bureau of Statistics. Estimates of Aboriginal and Torres Strait Islander Australians, June 2011. Canberra: ABS, 2013.
72. Australian Institute of Health and Welfare. Medical workforce 2012. Canberra: AIHW, 2014.
50 | Incidence and costs of injury in Western Australia 2012
73. Safe Work Australia. Key work health and safety statistics, Australia. Canberra: Safe Work Australia, 2014.
74. Baker S, O’Neill B, Ginsburg M, Guohua L. The injury fact book, 2nd edn New York: Oxford University Press; 1992.
75. Australian Bureau of Statistics. Average weekly earnings, Australia, Nov 2015 Canberra: ABS; 2016 [cited Feb 25 2016]. Available from: http://www.abs.gov.au/AUSSTATS/[email protected]/DetailsPage/6302.0Nov%202015?OpenDocument.
76. Bureau of Transport Economics. Road crash costs in Australia. Canberra: BTE, 2000.
77. Corso P, Finkelstein E, Miller T, Fiebelkorn I, Zaloshnja E. Incidence and lifetime costs of injuries in the United States. Injury Prevention. 2006;12:212-8.
Incidence and costs of injury in Western Australia 2012 | 51
AppendicesIncidence and costs of injury in health regions
Appendix 1 North Metropolitan Health Region . . . . . . . . . . . . . . . . . . . . . . . . . . . . . . . . . . . . . . . . . . . . . . . . . . . . . . . . . . . . . . . . . . . . . . . . . . . . . . . 52
Appendix 2 South Metropolitan Health Region . . . . . . . . . . . . . . . . . . . . . . . . . . . . . . . . . . . . . . . . . . . . . . . . . . . . . . . . . . . . . . . . . . . . . . . . . . . . . . . 58
Appendix 3 Goldfields Health Region . . . . . . . . . . . . . . . . . . . . . . . . . . . . . . . . . . . . . . . . . . . . . . . . . . . . . . . . . . . . . . . . . . . . . . . . . . . . . . . . . . . . . . . . . . . . . 64
Appendix 4 Great Southern Health Region . . . . . . . . . . . . . . . . . . . . . . . . . . . . . . . . . . . . . . . . . . . . . . . . . . . . . . . . . . . . . . . . . . . . . . . . . . . . . . . . . . . . . 71
Appendix 5 Kimberley Health Region . . . . . . . . . . . . . . . . . . . . . . . . . . . . . . . . . . . . . . . . . . . . . . . . . . . . . . . . . . . . . . . . . . . . . . . . . . . . . . . . . . . . . . . . . . . . . 77
Appendix 6 Midwest Health Region . . . . . . . . . . . . . . . . . . . . . . . . . . . . . . . . . . . . . . . . . . . . . . . . . . . . . . . . . . . . . . . . . . . . . . . . . . . . . . . . . . . . . . . . . . . . . . . 83
Appendix 7 Southwest Health Region . . . . . . . . . . . . . . . . . . . . . . . . . . . . . . . . . . . . . . . . . . . . . . . . . . . . . . . . . . . . . . . . . . . . . . . . . . . . . . . . . . . . . . . . . . . . 89
Appendix 8 Wheatbelt Health Region . . . . . . . . . . . . . . . . . . . . . . . . . . . . . . . . . . . . . . . . . . . . . . . . . . . . . . . . . . . . . . . . . . . . . . . . . . . . . . . . . . . . . . . . . . . . . 95
Appendix 9 Pilbara Health Region . . . . . . . . . . . . . . . . . . . . . . . . . . . . . . . . . . . . . . . . . . . . . . . . . . . . . . . . . . . . . . . . . . . . . . . . . . . . . . . . . . . . . . . . . . . . . . . 101
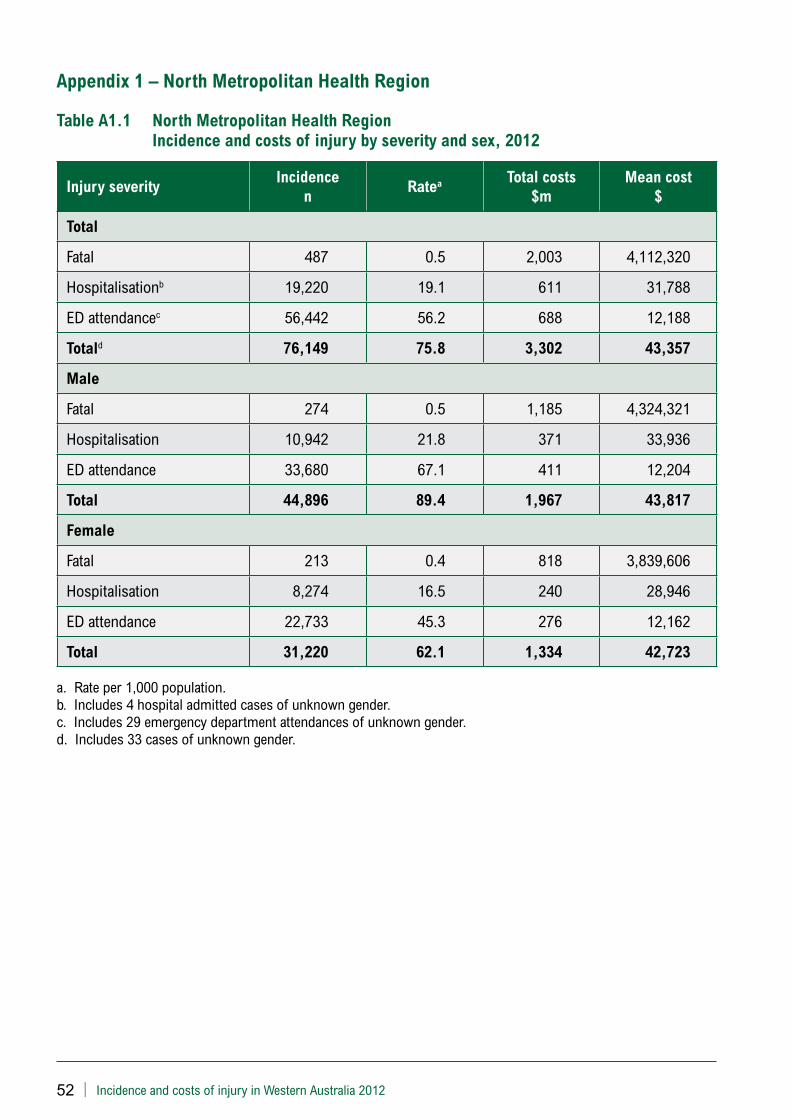
52 | Incidence and costs of injury in Western Australia 2012
Appendix 1 – North Metropolitan Health Region
Table A1.1 North Metropolitan Health Region Incidence and costs of injury by severity and sex, 2012
Injury severityIncidence
nRatea Total costs
$mMean cost
$
Total
Fatal 487 0.5 2,003 4,112,320
Hospitalisationb 19,220 19.1 611 31,788
ED attendancec 56,442 56.2 688 12,188
Totald 76,149 75.8 3,302 43,357
Male
Fatal 274 0.5 1,185 4,324,321
Hospitalisation 10,942 21.8 371 33,936
ED attendance 33,680 67.1 411 12,204
Total 44,896 89.4 1,967 43,817
Female
Fatal 213 0.4 818 3,839,606
Hospitalisation 8,274 16.5 240 28,946
ED attendance 22,733 45.3 276 12,162
Total 31,220 62.1 1,334 42,723
a. Rate per 1,000 population.b. Includes 4 hospital admitted cases of unknown gender.c. Includes 29 emergency department attendances of unknown gender.d. Includes 33 cases of unknown gender.
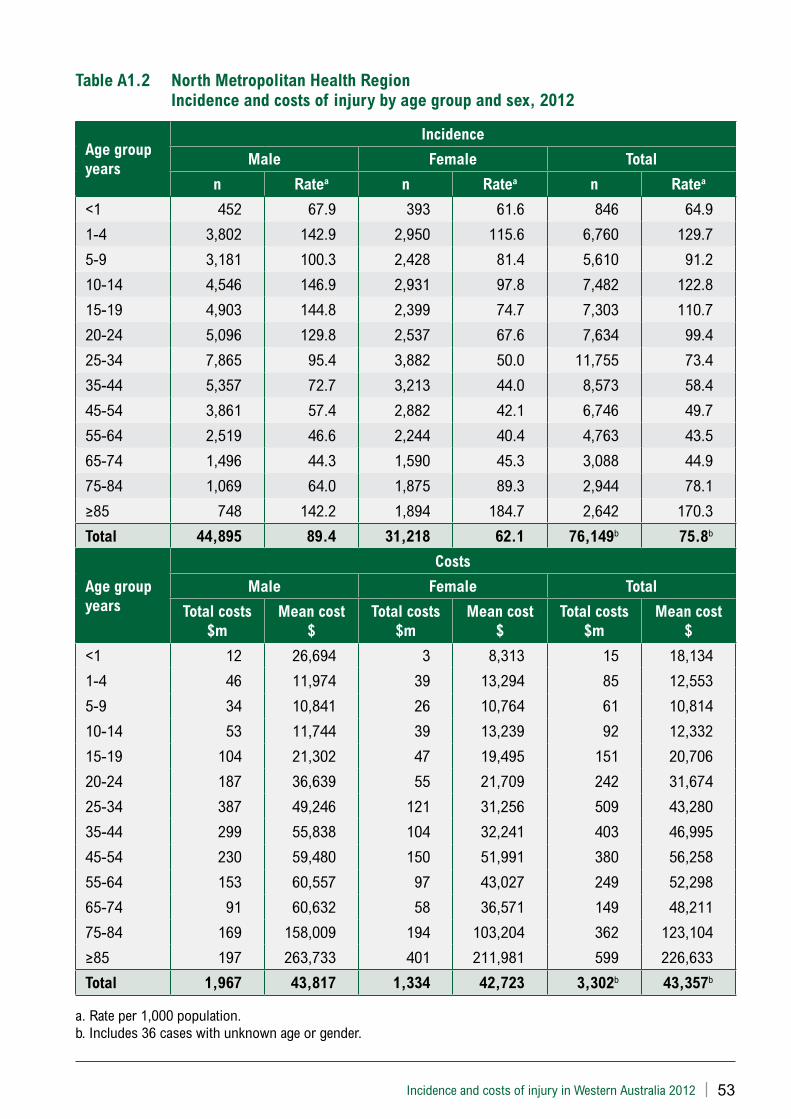
Incidence and costs of injury in Western Australia 2012 | 53
Table A1.2 North Metropolitan Health Region Incidence and costs of injury by age group and sex, 2012
Age group years
Incidence
Male Female Total
n Ratea n Ratea n Ratea
<1 452 67.9 393 61.6 846 64.9
1-4 3,802 142.9 2,950 115.6 6,760 129.7
5-9 3,181 100.3 2,428 81.4 5,610 91.2
10-14 4,546 146.9 2,931 97.8 7,482 122.8
15-19 4,903 144.8 2,399 74.7 7,303 110.7
20-24 5,096 129.8 2,537 67.6 7,634 99.4
25-34 7,865 95.4 3,882 50.0 11,755 73.4
35-44 5,357 72.7 3,213 44.0 8,573 58.4
45-54 3,861 57.4 2,882 42.1 6,746 49.7
55-64 2,519 46.6 2,244 40.4 4,763 43.5
65-74 1,496 44.3 1,590 45.3 3,088 44.9
75-84 1,069 64.0 1,875 89.3 2,944 78.1
≥85 748 142.2 1,894 184.7 2,642 170.3
Total 44,895 89.4 31,218 62.1 76,149b 75.8b
Age group years
Costs
Male Female Total
Total costs $m
Mean cost $
Total costs $m
Mean cost $
Total costs $m
Mean cost $
<1 12 26,694 3 8,313 15 18,134
1-4 46 11,974 39 13,294 85 12,553
5-9 34 10,841 26 10,764 61 10,814
10-14 53 11,744 39 13,239 92 12,332
15-19 104 21,302 47 19,495 151 20,706
20-24 187 36,639 55 21,709 242 31,674
25-34 387 49,246 121 31,256 509 43,280
35-44 299 55,838 104 32,241 403 46,995
45-54 230 59,480 150 51,991 380 56,258
55-64 153 60,557 97 43,027 249 52,298
65-74 91 60,632 58 36,571 149 48,211
75-84 169 158,009 194 103,204 362 123,104
≥85 197 263,733 401 211,981 599 226,633
Total 1,967 43,817 1,334 42,723 3,302b 43,357b
a. Rate per 1,000 population. b. Includes 36 cases with unknown age or gender.
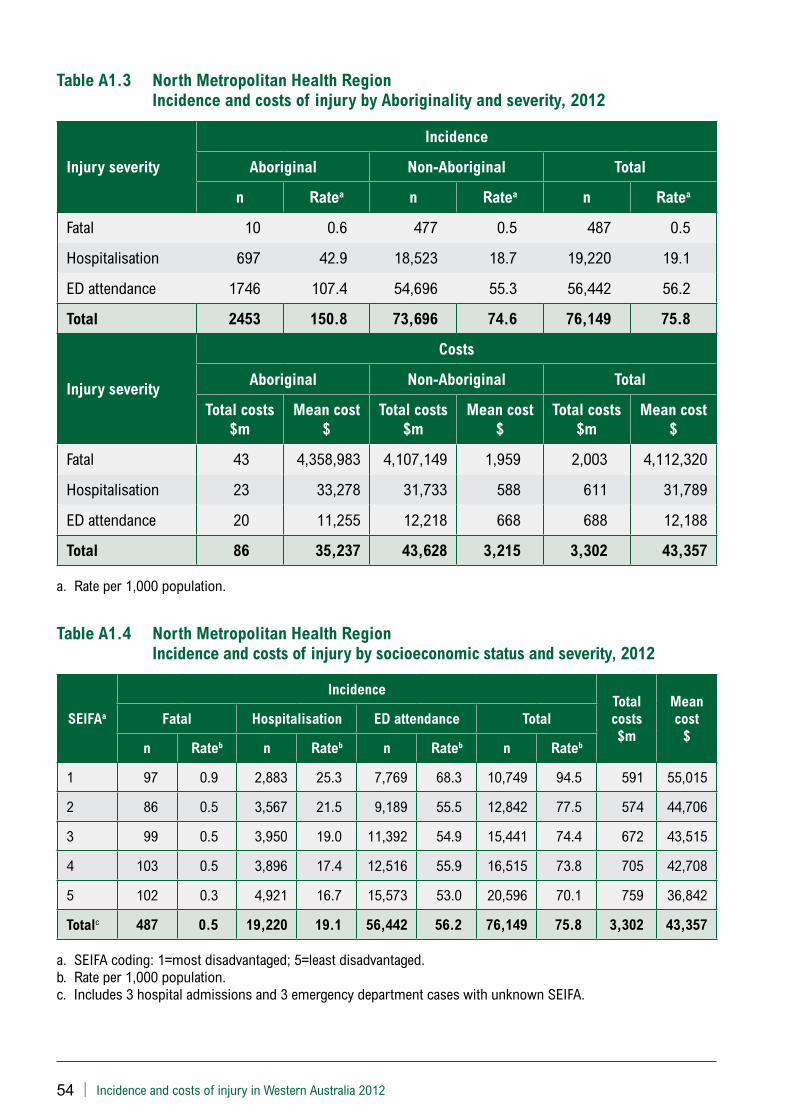
54 | Incidence and costs of injury in Western Australia 2012
Table A1.3 North Metropolitan Health Region Incidence and costs of injury by Aboriginality and severity, 2012
Injury severity
Incidence
Aboriginal Non-Aboriginal Total
n Ratea n Ratea n Ratea
Fatal 10 0.6 477 0.5 487 0.5
Hospitalisation 697 42.9 18,523 18.7 19,220 19.1
ED attendance 1746 107.4 54,696 55.3 56,442 56.2
Total 2453 150.8 73,696 74.6 76,149 75.8
Injury severity
Costs
Aboriginal Non-Aboriginal Total
Total costs $m
Mean cost $
Total costs $m
Mean cost $
Total costs $m
Mean cost $
Fatal 43 4,358,983 4,107,149 1,959 2,003 4,112,320
Hospitalisation 23 33,278 31,733 588 611 31,789
ED attendance 20 11,255 12,218 668 688 12,188
Total 86 35,237 43,628 3,215 3,302 43,357
a. Rate per 1,000 population.
Table A1.4 North Metropolitan Health Region Incidence and costs of injury by socioeconomic status and severity, 2012
SEIFAa
IncidenceTotal costs $m
Mean cost
$Fatal Hospitalisation ED attendance Total
n Rateb n Rateb n Rateb n Rateb
1 97 0.9 2,883 25.3 7,769 68.3 10,749 94.5 591 55,015
2 86 0.5 3,567 21.5 9,189 55.5 12,842 77.5 574 44,706
3 99 0.5 3,950 19.0 11,392 54.9 15,441 74.4 672 43,515
4 103 0.5 3,896 17.4 12,516 55.9 16,515 73.8 705 42,708
5 102 0.3 4,921 16.7 15,573 53.0 20,596 70.1 759 36,842
Totalc 487 0.5 19,220 19.1 56,442 56.2 76,149 75.8 3,302 43,357
a. SEIFA coding: 1=most disadvantaged; 5=least disadvantaged.b. Rate per 1,000 population.c. Includes 3 hospital admissions and 3 emergency department cases with unknown SEIFA.
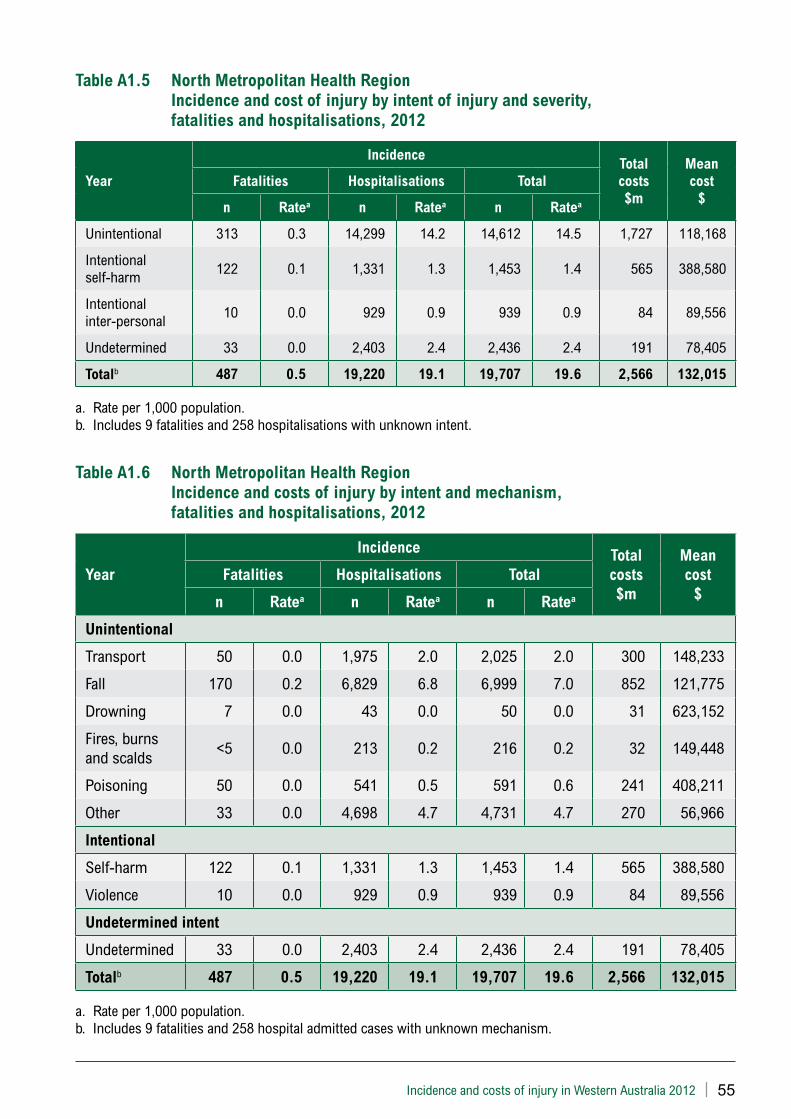
Incidence and costs of injury in Western Australia 2012 | 55
Table A1.5 North Metropolitan Health Region Incidence and cost of injury by intent of injury and severity, fatalities and hospitalisations, 2012
Year
IncidenceTotal costs $m
Mean cost
$Fatalities Hospitalisations Total
n Ratea n Ratea n Ratea
Unintentional 313 0.3 14,299 14.2 14,612 14.5 1,727 118,168
Intentional self-harm 122 0.1 1,331 1.3 1,453 1.4 565 388,580
Intentional inter-personal 10 0.0 929 0.9 939 0.9 84 89,556
Undetermined 33 0.0 2,403 2.4 2,436 2.4 191 78,405
Totalb 487 0.5 19,220 19.1 19,707 19.6 2,566 132,015
a. Rate per 1,000 population.b. Includes 9 fatalities and 258 hospitalisations with unknown intent.
Table A1.6 North Metropolitan Health Region Incidence and costs of injury by intent and mechanism, fatalities and hospitalisations, 2012
Year
Incidence Total costs $m
Mean cost
$Fatalities Hospitalisations Total
n Ratea n Ratea n Ratea
Unintentional
Transport 50 0.0 1,975 2.0 2,025 2.0 300 148,233
Fall 170 0.2 6,829 6.8 6,999 7.0 852 121,775
Drowning 7 0.0 43 0.0 50 0.0 31 623,152
Fires, burns and scalds
<5 0.0 213 0.2 216 0.2 32 149,448
Poisoning 50 0.0 541 0.5 591 0.6 241 408,211
Other 33 0.0 4,698 4.7 4,731 4.7 270 56,966
Intentional
Self-harm 122 0.1 1,331 1.3 1,453 1.4 565 388,580
Violence 10 0.0 929 0.9 939 0.9 84 89,556
Undetermined intent
Undetermined 33 0.0 2,403 2.4 2,436 2.4 191 78,405
Totalb 487 0.5 19,220 19.1 19,707 19.6 2,566 132,015
a. Rate per 1,000 population. b. Includes 9 fatalities and 258 hospital admitted cases with unknown mechanism.
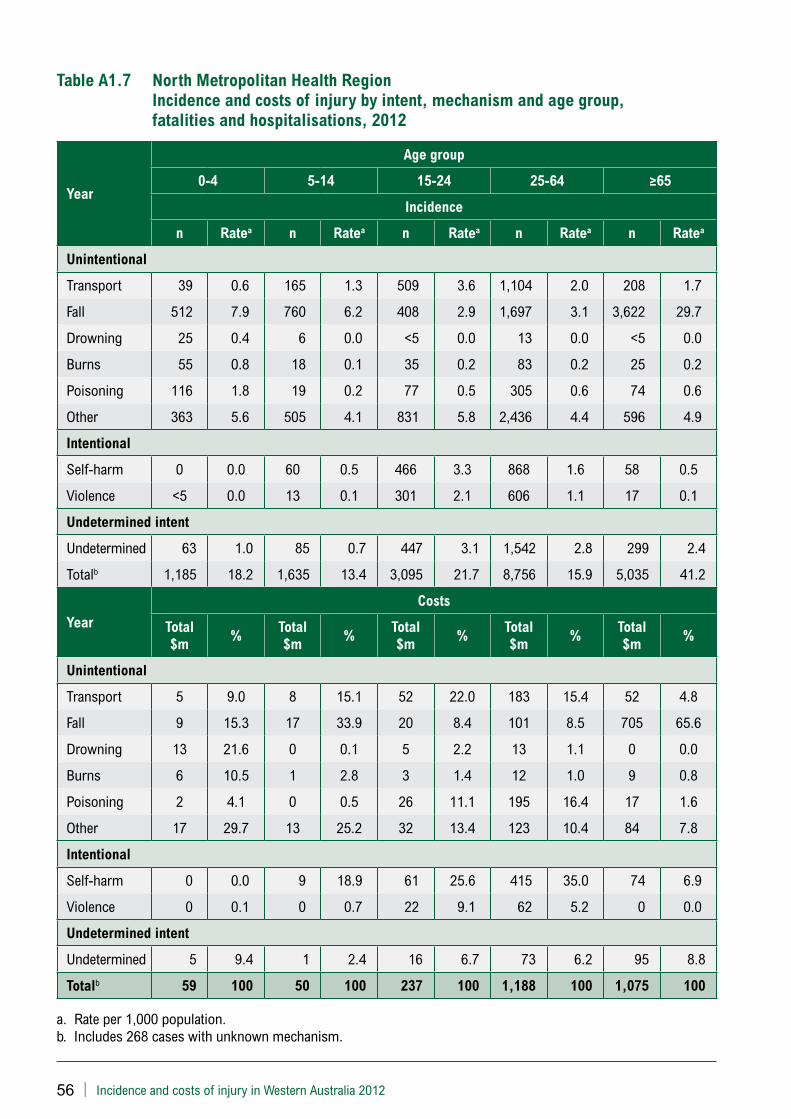
56 | Incidence and costs of injury in Western Australia 2012
Table A1.7 North Metropolitan Health Region Incidence and costs of injury by intent, mechanism and age group, fatalities and hospitalisations, 2012
Year
Age group
0-4 5-14 15-24 25-64 ≥65
Incidence
n Ratea n Ratea n Ratea n Ratea n Ratea
Unintentional
Transport 39 0.6 165 1.3 509 3.6 1,104 2.0 208 1.7
Fall 512 7.9 760 6.2 408 2.9 1,697 3.1 3,622 29.7
Drowning 25 0.4 6 0.0 <5 0.0 13 0.0 <5 0.0
Burns 55 0.8 18 0.1 35 0.2 83 0.2 25 0.2
Poisoning 116 1.8 19 0.2 77 0.5 305 0.6 74 0.6
Other 363 5.6 505 4.1 831 5.8 2,436 4.4 596 4.9
Intentional
Self-harm 0 0.0 60 0.5 466 3.3 868 1.6 58 0.5
Violence <5 0.0 13 0.1 301 2.1 606 1.1 17 0.1
Undetermined intent
Undetermined 63 1.0 85 0.7 447 3.1 1,542 2.8 299 2.4
Totalb 1,185 18.2 1,635 13.4 3,095 21.7 8,756 15.9 5,035 41.2
Year
Costs
Total $m
%Total $m
%Total $m
%Total $m
%Total $m
%
Unintentional
Transport 5 9.0 8 15.1 52 22.0 183 15.4 52 4.8
Fall 9 15.3 17 33.9 20 8.4 101 8.5 705 65.6
Drowning 13 21.6 0 0.1 5 2.2 13 1.1 0 0.0
Burns 6 10.5 1 2.8 3 1.4 12 1.0 9 0.8
Poisoning 2 4.1 0 0.5 26 11.1 195 16.4 17 1.6
Other 17 29.7 13 25.2 32 13.4 123 10.4 84 7.8
Intentional
Self-harm 0 0.0 9 18.9 61 25.6 415 35.0 74 6.9
Violence 0 0.1 0 0.7 22 9.1 62 5.2 0 0.0
Undetermined intent
Undetermined 5 9.4 1 2.4 16 6.7 73 6.2 95 8.8
Totalb 59 100 50 100 237 100 1,188 100 1,075 100
a. Rate per 1,000 population.b. Includes 268 cases with unknown mechanism.
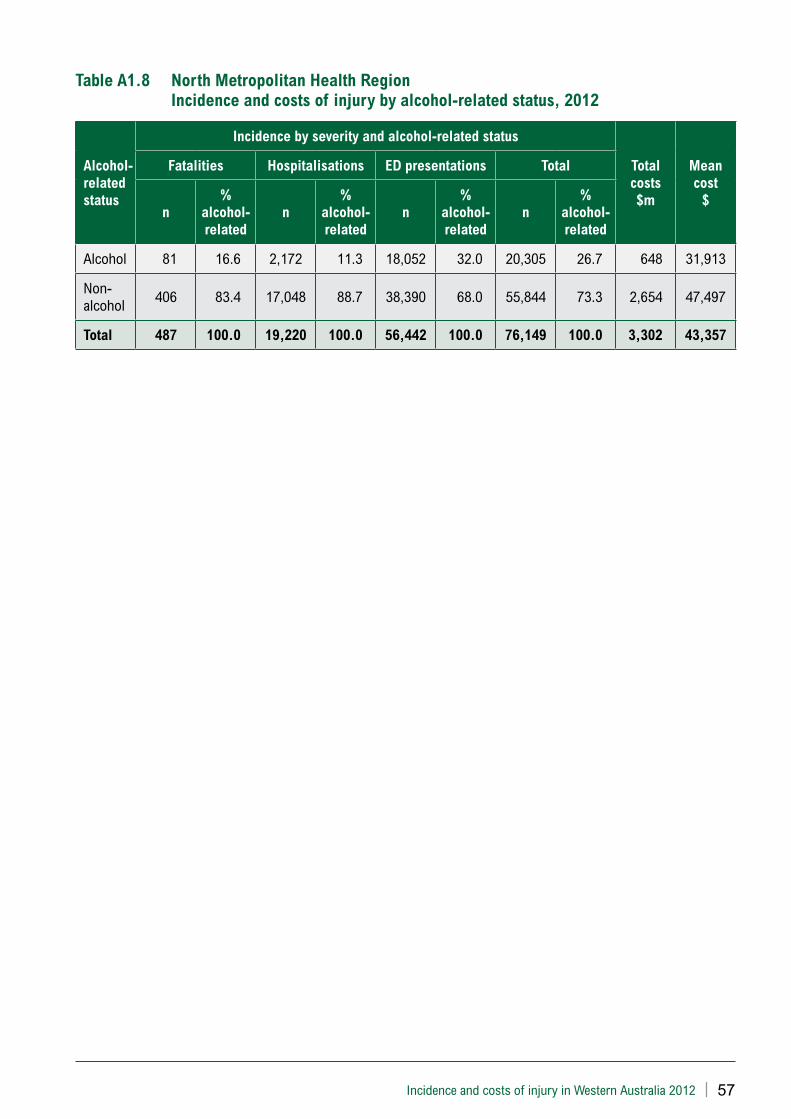
Incidence and costs of injury in Western Australia 2012 | 57
Table A1.8 North Metropolitan Health Region Incidence and costs of injury by alcohol-related status, 2012
Alcohol-related status
Incidence by severity and alcohol-related status
Total costs $m
Mean cost
$
Fatalities Hospitalisations ED presentations Total
n%
alcohol-related
n%
alcohol-related
n%
alcohol-related
n%
alcohol-related
Alcohol 81 16.6 2,172 11.3 18,052 32.0 20,305 26.7 648 31,913
Non-alcohol 406 83.4 17,048 88.7 38,390 68.0 55,844 73.3 2,654 47,497
Total 487 100.0 19,220 100.0 56,442 100.0 76,149 100.0 3,302 43,357

58 | Incidence and costs of injury in Western Australia 2012
Appendix 2 – South Metropolitan Health Region
Table A2.1 South Metropolitan Health Region Incidence and costs of injury by severity and sex, 2012
Injury severityIncidence
nRatea Total costs
$mMean cost
$
Fatal 504 0.6 2,075 4,117,507
Hospitalisationb 17,169 19.0 602 35,078
ED attendancec 52,465 58.0 613 11,683
Totald 70,138 77.6 3,290 46,914
Male
Fatal 305 0.7 1,306 4,282,882
Hospitalisation 9,899 21.9 377 38,057
ED attendance 31,311 69.2 371 11,865
Total 41,515 91.7 2,054 49,488
Female
Fatal 199 0.4 769 3,864,042
Hospitalisation 7,268 16.1 225 31,005
ED attendance 21,133 46.8 241 11,412
Total 28,600 63.4 1,235 43,198
a. Rate per 1,000 population.b. Includes 2 hospital admitted cases of unknown gender.c. Includes 21 emergency department cases of unknown gender.d. Includes 23 cases of unknown gender.
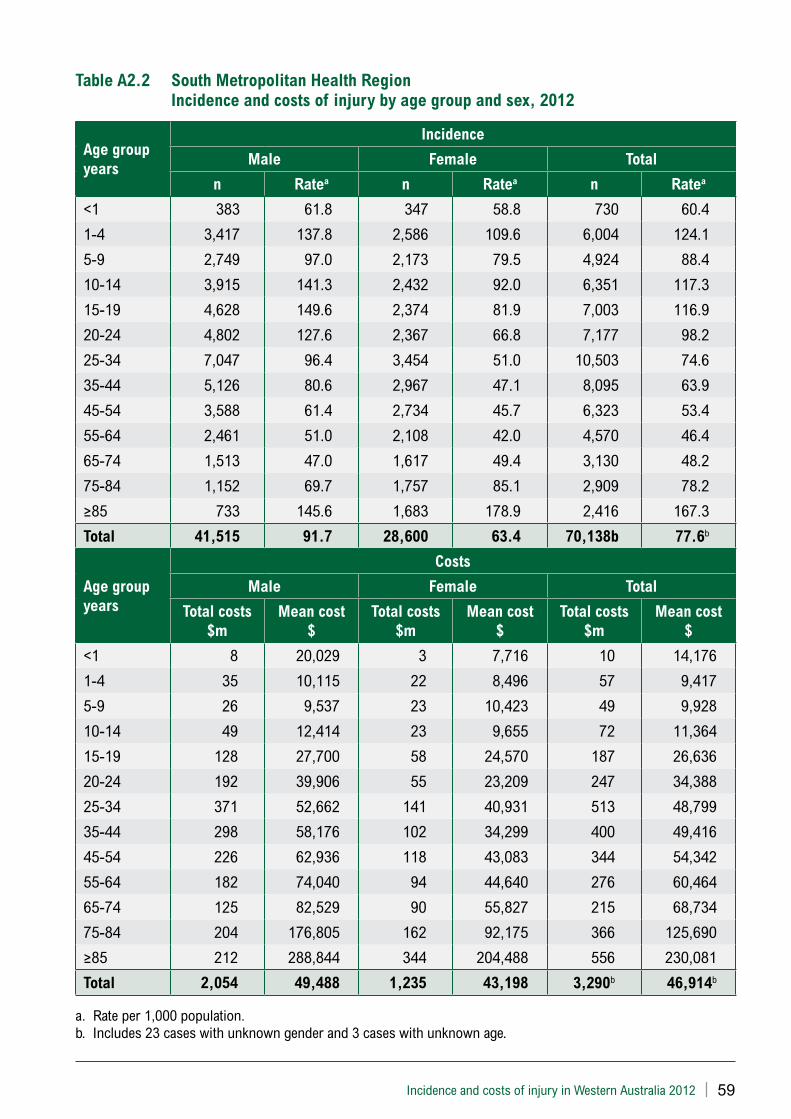
Incidence and costs of injury in Western Australia 2012 | 59
Table A2.2 South Metropolitan Health Region Incidence and costs of injury by age group and sex, 2012
Age group years
Incidence
Male Female Total
n Ratea n Ratea n Ratea
<1 383 61.8 347 58.8 730 60.4
1-4 3,417 137.8 2,586 109.6 6,004 124.1
5-9 2,749 97.0 2,173 79.5 4,924 88.4
10-14 3,915 141.3 2,432 92.0 6,351 117.3
15-19 4,628 149.6 2,374 81.9 7,003 116.9
20-24 4,802 127.6 2,367 66.8 7,177 98.2
25-34 7,047 96.4 3,454 51.0 10,503 74.6
35-44 5,126 80.6 2,967 47.1 8,095 63.9
45-54 3,588 61.4 2,734 45.7 6,323 53.4
55-64 2,461 51.0 2,108 42.0 4,570 46.4
65-74 1,513 47.0 1,617 49.4 3,130 48.2
75-84 1,152 69.7 1,757 85.1 2,909 78.2
≥85 733 145.6 1,683 178.9 2,416 167.3
Total 41,515 91.7 28,600 63.4 70,138b 77.6b
Age group years
Costs
Male Female Total
Total costs $m
Mean cost $
Total costs $m
Mean cost $
Total costs $m
Mean cost $
<1 8 20,029 3 7,716 10 14,176
1-4 35 10,115 22 8,496 57 9,417
5-9 26 9,537 23 10,423 49 9,928
10-14 49 12,414 23 9,655 72 11,364
15-19 128 27,700 58 24,570 187 26,636
20-24 192 39,906 55 23,209 247 34,388
25-34 371 52,662 141 40,931 513 48,799
35-44 298 58,176 102 34,299 400 49,416
45-54 226 62,936 118 43,083 344 54,342
55-64 182 74,040 94 44,640 276 60,464
65-74 125 82,529 90 55,827 215 68,734
75-84 204 176,805 162 92,175 366 125,690
≥85 212 288,844 344 204,488 556 230,081
Total 2,054 49,488 1,235 43,198 3,290b 46,914b
a. Rate per 1,000 population. b. Includes 23 cases with unknown gender and 3 cases with unknown age.
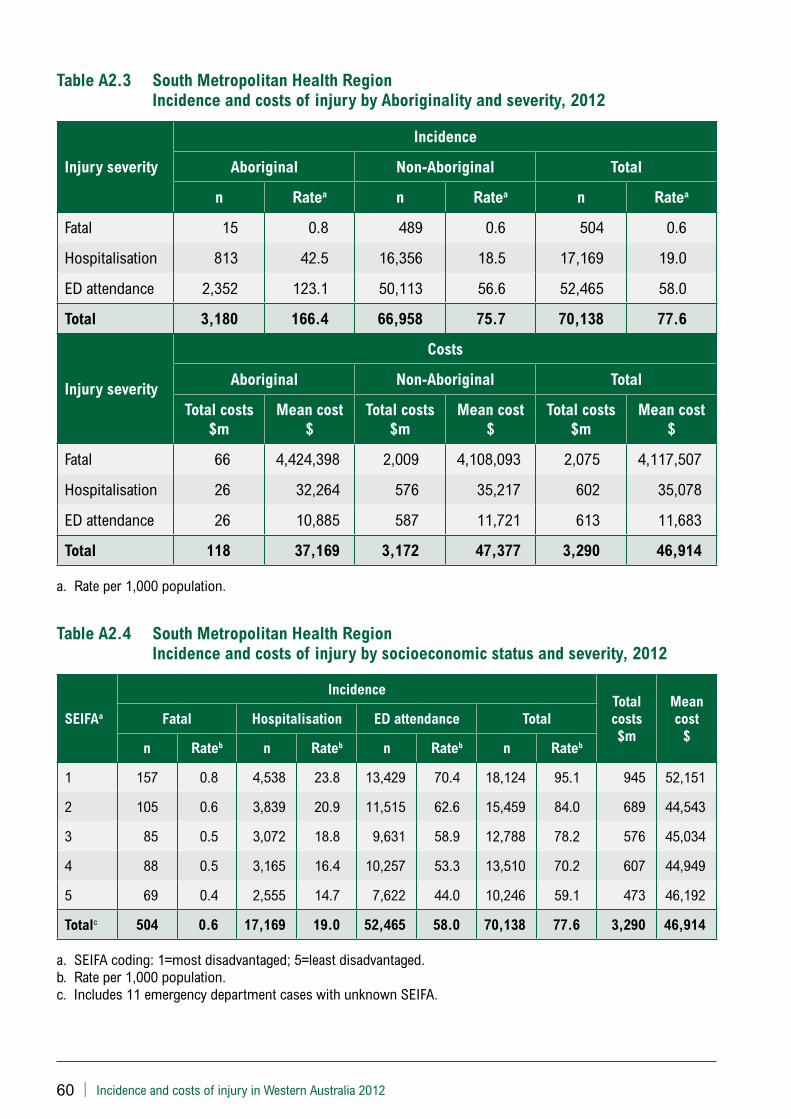
60 | Incidence and costs of injury in Western Australia 2012
Table A2.3 South Metropolitan Health Region Incidence and costs of injury by Aboriginality and severity, 2012
Injury severity
Incidence
Aboriginal Non-Aboriginal Total
n Ratea n Ratea n Ratea
Fatal 15 0.8 489 0.6 504 0.6
Hospitalisation 813 42.5 16,356 18.5 17,169 19.0
ED attendance 2,352 123.1 50,113 56.6 52,465 58.0
Total 3,180 166.4 66,958 75.7 70,138 77.6
Injury severity
Costs
Aboriginal Non-Aboriginal Total
Total costs $m
Mean cost $
Total costs $m
Mean cost $
Total costs $m
Mean cost $
Fatal 66 4,424,398 2,009 4,108,093 2,075 4,117,507
Hospitalisation 26 32,264 576 35,217 602 35,078
ED attendance 26 10,885 587 11,721 613 11,683
Total 118 37,169 3,172 47,377 3,290 46,914
a. Rate per 1,000 population.
Table A2.4 South Metropolitan Health Region Incidence and costs of injury by socioeconomic status and severity, 2012
SEIFAa
IncidenceTotal costs $m
Mean cost
$Fatal Hospitalisation ED attendance Total
n Rateb n Rateb n Rateb n Rateb
1 157 0.8 4,538 23.8 13,429 70.4 18,124 95.1 945 52,151
2 105 0.6 3,839 20.9 11,515 62.6 15,459 84.0 689 44,543
3 85 0.5 3,072 18.8 9,631 58.9 12,788 78.2 576 45,034
4 88 0.5 3,165 16.4 10,257 53.3 13,510 70.2 607 44,949
5 69 0.4 2,555 14.7 7,622 44.0 10,246 59.1 473 46,192
Totalc 504 0.6 17,169 19.0 52,465 58.0 70,138 77.6 3,290 46,914
a. SEIFA coding: 1=most disadvantaged; 5=least disadvantaged.b. Rate per 1,000 population.c. Includes 11 emergency department cases with unknown SEIFA.
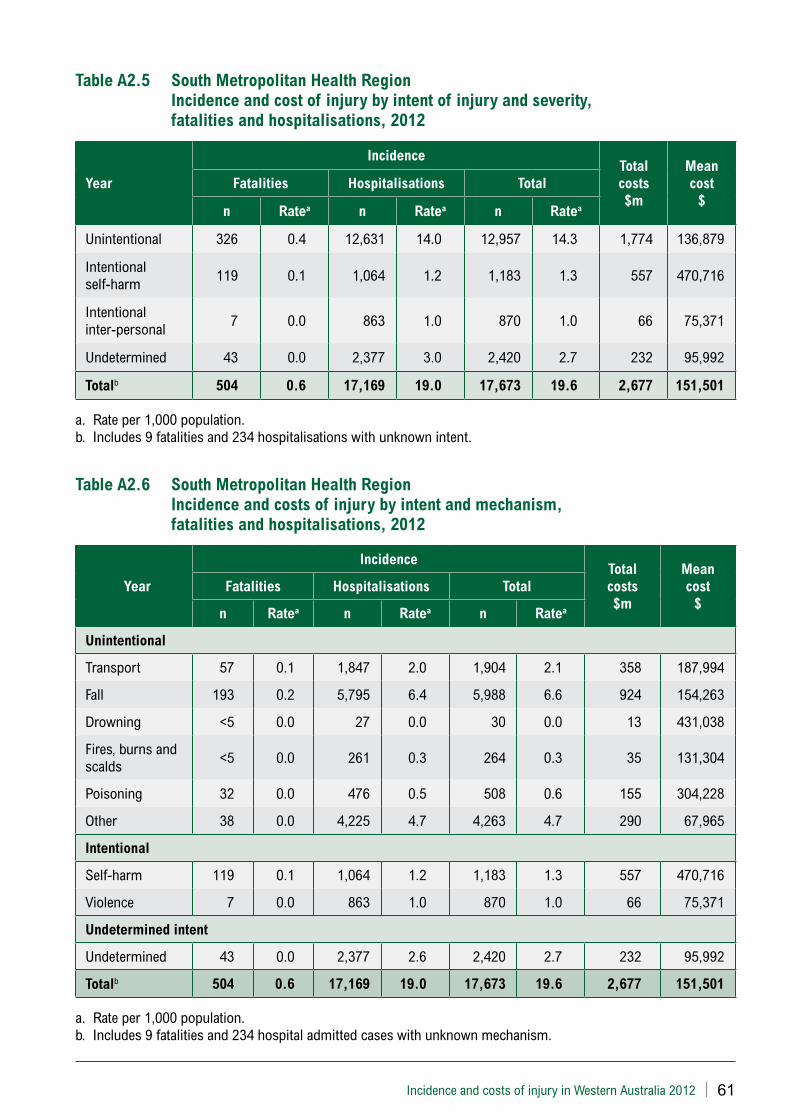
Incidence and costs of injury in Western Australia 2012 | 61
Table A2.5 South Metropolitan Health Region Incidence and cost of injury by intent of injury and severity, fatalities and hospitalisations, 2012
Year
IncidenceTotal costs $m
Mean cost
$Fatalities Hospitalisations Total
n Ratea n Ratea n Ratea
Unintentional 326 0.4 12,631 14.0 12,957 14.3 1,774 136,879
Intentional self-harm 119 0.1 1,064 1.2 1,183 1.3 557 470,716
Intentional inter-personal 7 0.0 863 1.0 870 1.0 66 75,371
Undetermined 43 0.0 2,377 3.0 2,420 2.7 232 95,992
Totalb 504 0.6 17,169 19.0 17,673 19.6 2,677 151,501
a. Rate per 1,000 population.b. Includes 9 fatalities and 234 hospitalisations with unknown intent.
Table A2.6 South Metropolitan Health Region Incidence and costs of injury by intent and mechanism, fatalities and hospitalisations, 2012
Year
IncidenceTotal costs $m
Mean cost
$Fatalities Hospitalisations Total
n Ratea n Ratea n Ratea
Unintentional
Transport 57 0.1 1,847 2.0 1,904 2.1 358 187,994
Fall 193 0.2 5,795 6.4 5,988 6.6 924 154,263
Drowning <5 0.0 27 0.0 30 0.0 13 431,038
Fires, burns and scalds <5 0.0 261 0.3 264 0.3 35 131,304
Poisoning 32 0.0 476 0.5 508 0.6 155 304,228
Other 38 0.0 4,225 4.7 4,263 4.7 290 67,965
Intentional
Self-harm 119 0.1 1,064 1.2 1,183 1.3 557 470,716
Violence 7 0.0 863 1.0 870 1.0 66 75,371
Undetermined intent
Undetermined 43 0.0 2,377 2.6 2,420 2.7 232 95,992
Totalb 504 0.6 17,169 19.0 17,673 19.6 2,677 151,501
a. Rate per 1,000 population.b. Includes 9 fatalities and 234 hospital admitted cases with unknown mechanism.
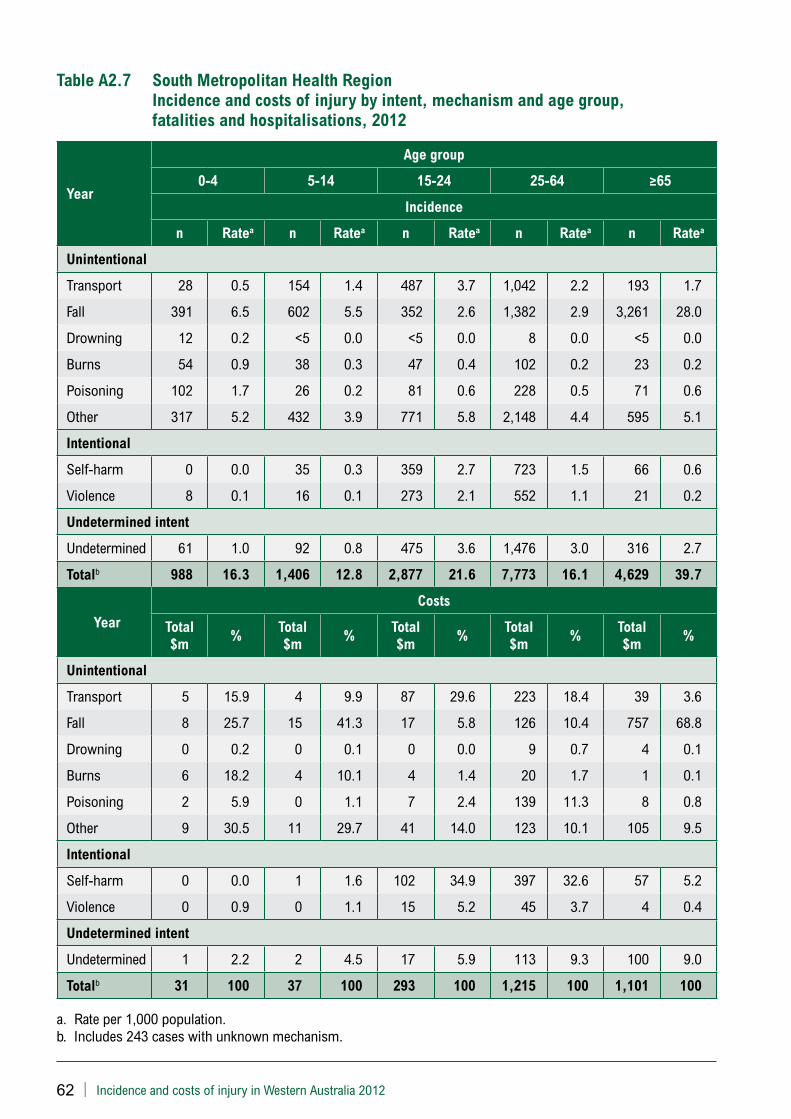
62 | Incidence and costs of injury in Western Australia 2012
Table A2.7 South Metropolitan Health Region Incidence and costs of injury by intent, mechanism and age group, fatalities and hospitalisations, 2012
Year
Age group
0-4 5-14 15-24 25-64 ≥65
Incidence
n Ratea n Ratea n Ratea n Ratea n Ratea
Unintentional
Transport 28 0.5 154 1.4 487 3.7 1,042 2.2 193 1.7
Fall 391 6.5 602 5.5 352 2.6 1,382 2.9 3,261 28.0
Drowning 12 0.2 <5 0.0 <5 0.0 8 0.0 <5 0.0
Burns 54 0.9 38 0.3 47 0.4 102 0.2 23 0.2
Poisoning 102 1.7 26 0.2 81 0.6 228 0.5 71 0.6
Other 317 5.2 432 3.9 771 5.8 2,148 4.4 595 5.1
Intentional
Self-harm 0 0.0 35 0.3 359 2.7 723 1.5 66 0.6
Violence 8 0.1 16 0.1 273 2.1 552 1.1 21 0.2
Undetermined intent
Undetermined 61 1.0 92 0.8 475 3.6 1,476 3.0 316 2.7
Totalb 988 16.3 1,406 12.8 2,877 21.6 7,773 16.1 4,629 39.7
Year
Costs
Total $m
%Total $m
%Total $m
%Total $m
%Total $m
%
Unintentional
Transport 5 15.9 4 9.9 87 29.6 223 18.4 39 3.6
Fall 8 25.7 15 41.3 17 5.8 126 10.4 757 68.8
Drowning 0 0.2 0 0.1 0 0.0 9 0.7 4 0.1
Burns 6 18.2 4 10.1 4 1.4 20 1.7 1 0.1
Poisoning 2 5.9 0 1.1 7 2.4 139 11.3 8 0.8
Other 9 30.5 11 29.7 41 14.0 123 10.1 105 9.5
Intentional
Self-harm 0 0.0 1 1.6 102 34.9 397 32.6 57 5.2
Violence 0 0.9 0 1.1 15 5.2 45 3.7 4 0.4
Undetermined intent
Undetermined 1 2.2 2 4.5 17 5.9 113 9.3 100 9.0
Totalb 31 100 37 100 293 100 1,215 100 1,101 100
a. Rate per 1,000 population.b. Includes 243 cases with unknown mechanism.
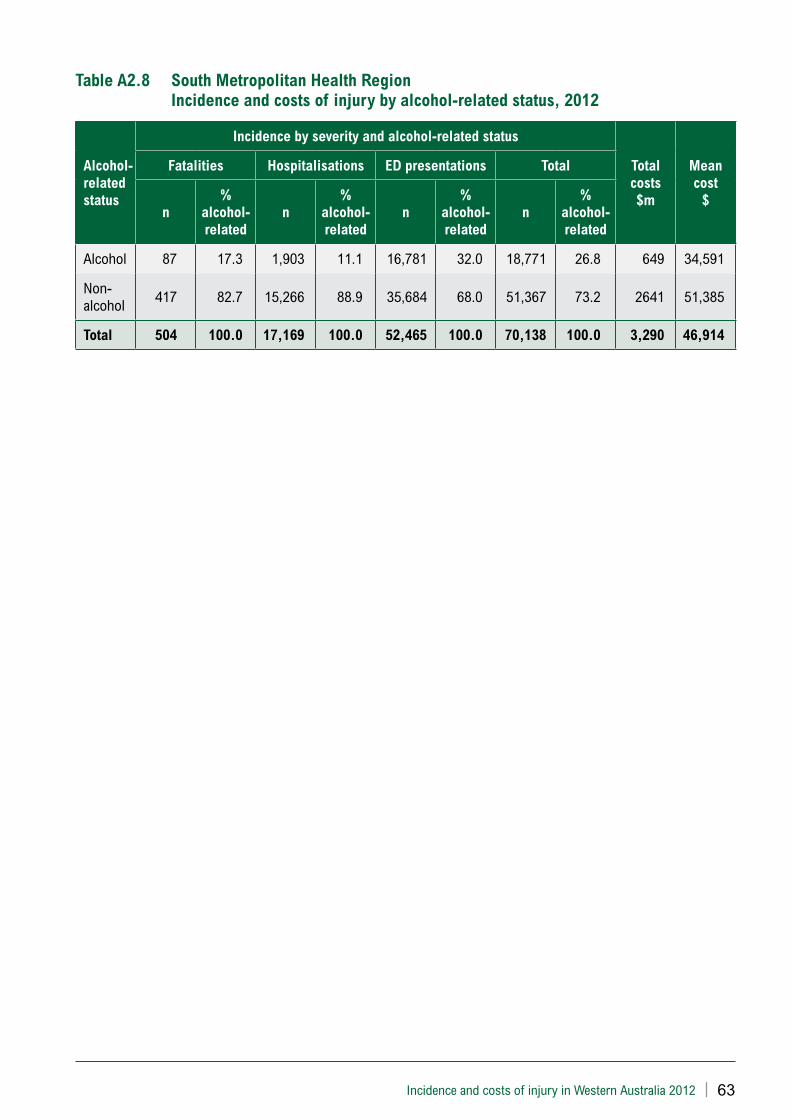
Incidence and costs of injury in Western Australia 2012 | 63
Table A2.8 South Metropolitan Health Region Incidence and costs of injury by alcohol-related status, 2012
Alcohol-related status
Incidence by severity and alcohol-related status
Total costs $m
Mean cost
$
Fatalities Hospitalisations ED presentations Total
n%
alcohol-related
n%
alcohol-related
n%
alcohol-related
n%
alcohol-related
Alcohol 87 17.3 1,903 11.1 16,781 32.0 18,771 26.8 649 34,591
Non-alcohol 417 82.7 15,266 88.9 35,684 68.0 51,367 73.2 2641 51,385
Total 504 100.0 17,169 100.0 52,465 100.0 70,138 100.0 3,290 46,914
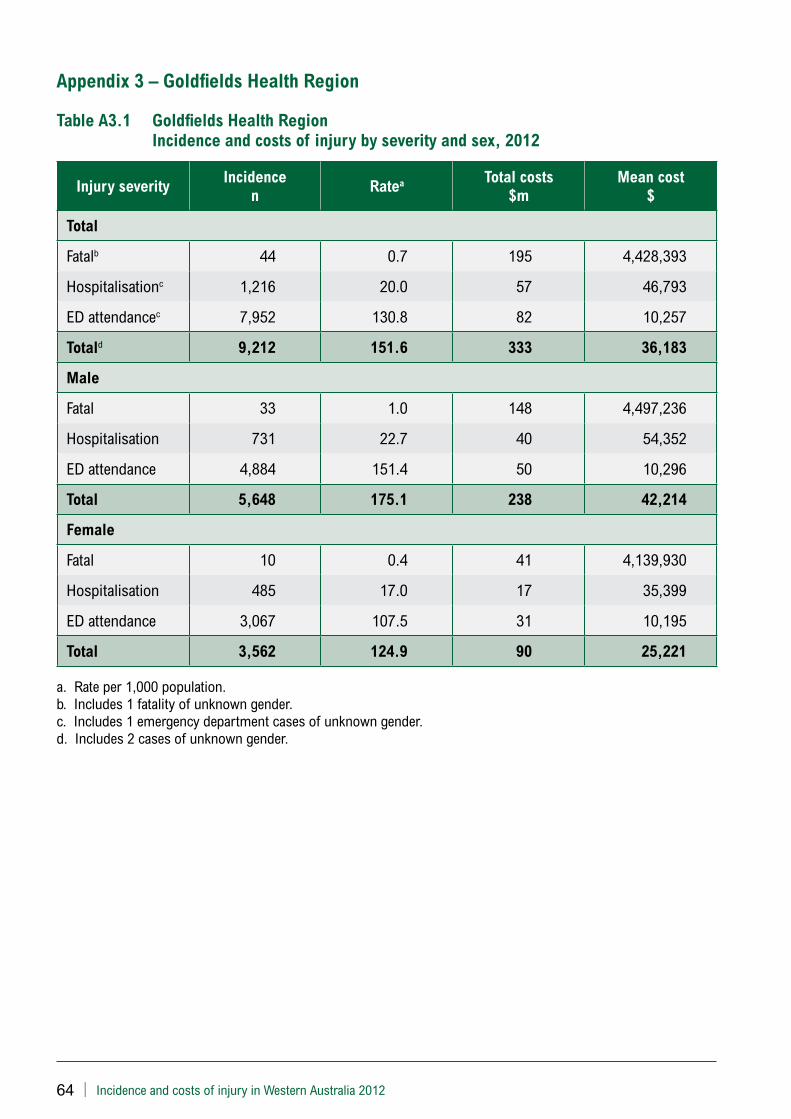
64 | Incidence and costs of injury in Western Australia 2012
Appendix 3 – Goldfields Health Region
Table A3.1 Goldfields Health Region Incidence and costs of injury by severity and sex, 2012
Injury severityIncidence
nRatea Total costs
$mMean cost
$
Total
Fatalb 44 0.7 195 4,428,393
Hospitalisationc 1,216 20.0 57 46,793
ED attendancec 7,952 130.8 82 10,257
Totald 9,212 151.6 333 36,183
Male
Fatal 33 1.0 148 4,497,236
Hospitalisation 731 22.7 40 54,352
ED attendance 4,884 151.4 50 10,296
Total 5,648 175.1 238 42,214
Female
Fatal 10 0.4 41 4,139,930
Hospitalisation 485 17.0 17 35,399
ED attendance 3,067 107.5 31 10,195
Total 3,562 124.9 90 25,221
a. Rate per 1,000 population.b. Includes 1 fatality of unknown gender.c. Includes 1 emergency department cases of unknown gender. d. Includes 2 cases of unknown gender.
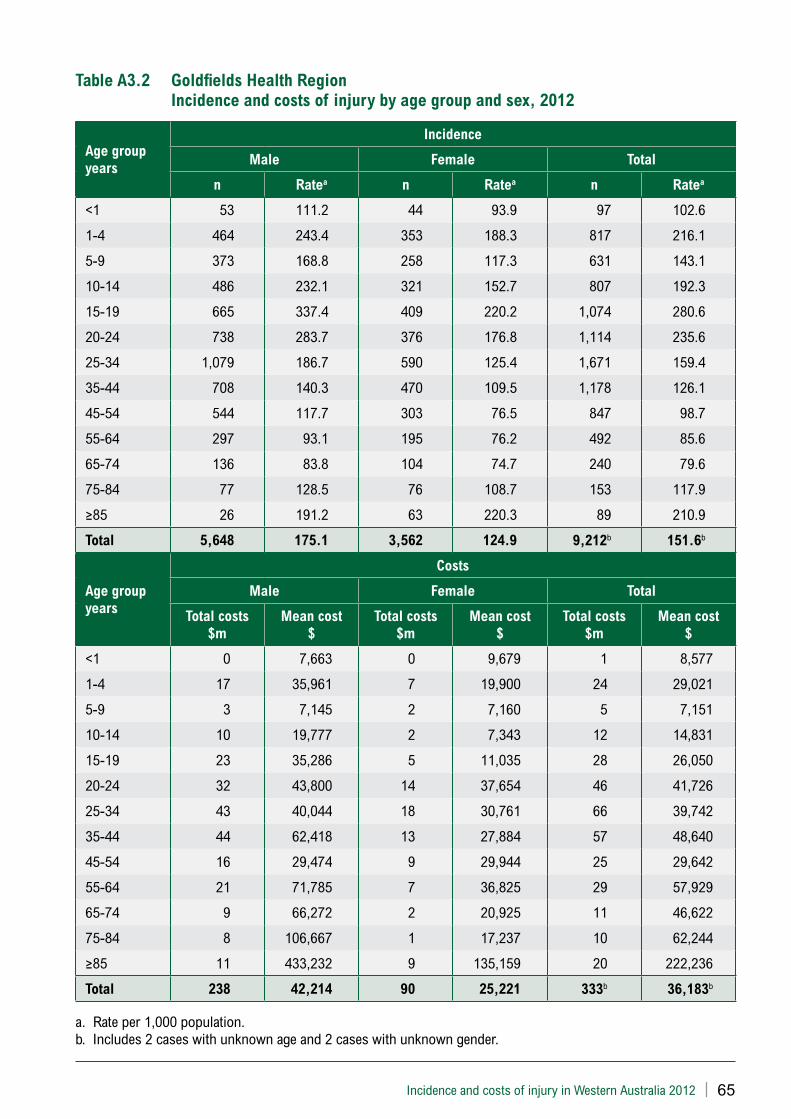
Incidence and costs of injury in Western Australia 2012 | 65
Table A3.2 Goldfields Health Region Incidence and costs of injury by age group and sex, 2012
Age group years
Incidence
Male Female Total
n Ratea n Ratea n Ratea
<1 53 111.2 44 93.9 97 102.6
1-4 464 243.4 353 188.3 817 216.1
5-9 373 168.8 258 117.3 631 143.1
10-14 486 232.1 321 152.7 807 192.3
15-19 665 337.4 409 220.2 1,074 280.6
20-24 738 283.7 376 176.8 1,114 235.6
25-34 1,079 186.7 590 125.4 1,671 159.4
35-44 708 140.3 470 109.5 1,178 126.1
45-54 544 117.7 303 76.5 847 98.7
55-64 297 93.1 195 76.2 492 85.6
65-74 136 83.8 104 74.7 240 79.6
75-84 77 128.5 76 108.7 153 117.9
≥85 26 191.2 63 220.3 89 210.9
Total 5,648 175.1 3,562 124.9 9,212b 151.6b
Age group years
Costs
Male Female Total
Total costs $m
Mean cost $
Total costs $m
Mean cost $
Total costs $m
Mean cost $
<1 0 7,663 0 9,679 1 8,577
1-4 17 35,961 7 19,900 24 29,021
5-9 3 7,145 2 7,160 5 7,151
10-14 10 19,777 2 7,343 12 14,831
15-19 23 35,286 5 11,035 28 26,050
20-24 32 43,800 14 37,654 46 41,726
25-34 43 40,044 18 30,761 66 39,742
35-44 44 62,418 13 27,884 57 48,640
45-54 16 29,474 9 29,944 25 29,642
55-64 21 71,785 7 36,825 29 57,929
65-74 9 66,272 2 20,925 11 46,622
75-84 8 106,667 1 17,237 10 62,244
≥85 11 433,232 9 135,159 20 222,236
Total 238 42,214 90 25,221 333b 36,183b
a. Rate per 1,000 population. b. Includes 2 cases with unknown age and 2 cases with unknown gender.
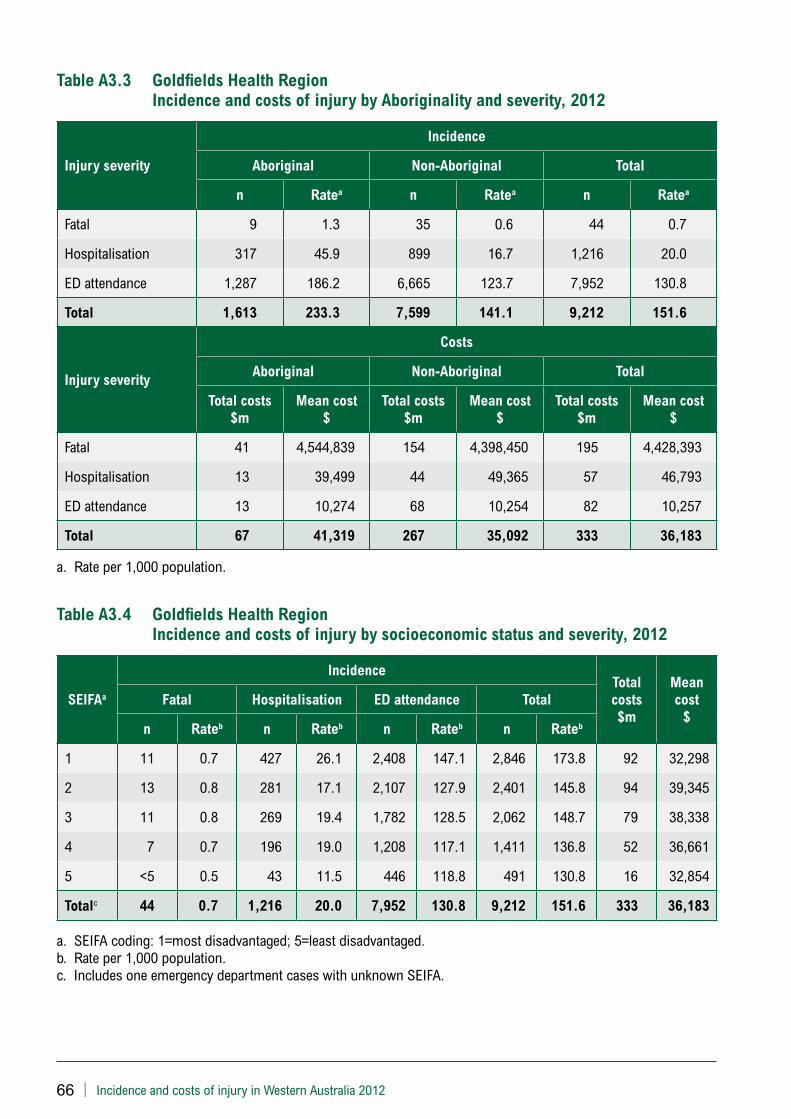
66 | Incidence and costs of injury in Western Australia 2012
Table A3.3 Goldfields Health Region Incidence and costs of injury by Aboriginality and severity, 2012
Injury severity
Incidence
Aboriginal Non-Aboriginal Total
n Ratea n Ratea n Ratea
Fatal 9 1.3 35 0.6 44 0.7
Hospitalisation 317 45.9 899 16.7 1,216 20.0
ED attendance 1,287 186.2 6,665 123.7 7,952 130.8
Total 1,613 233.3 7,599 141.1 9,212 151.6
Injury severity
Costs
Aboriginal Non-Aboriginal Total
Total costs $m
Mean cost $
Total costs $m
Mean cost $
Total costs $m
Mean cost $
Fatal 41 4,544,839 154 4,398,450 195 4,428,393
Hospitalisation 13 39,499 44 49,365 57 46,793
ED attendance 13 10,274 68 10,254 82 10,257
Total 67 41,319 267 35,092 333 36,183
a. Rate per 1,000 population.
Table A3.4 Goldfields Health Region Incidence and costs of injury by socioeconomic status and severity, 2012
SEIFAa
IncidenceTotal costs $m
Mean cost
$Fatal Hospitalisation ED attendance Total
n Rateb n Rateb n Rateb n Rateb
1 11 0.7 427 26.1 2,408 147.1 2,846 173.8 92 32,298
2 13 0.8 281 17.1 2,107 127.9 2,401 145.8 94 39,345
3 11 0.8 269 19.4 1,782 128.5 2,062 148.7 79 38,338
4 7 0.7 196 19.0 1,208 117.1 1,411 136.8 52 36,661
5 <5 0.5 43 11.5 446 118.8 491 130.8 16 32,854
Totalc 44 0.7 1,216 20.0 7,952 130.8 9,212 151.6 333 36,183
a. SEIFA coding: 1=most disadvantaged; 5=least disadvantaged.b. Rate per 1,000 population.c. Includes one emergency department cases with unknown SEIFA.
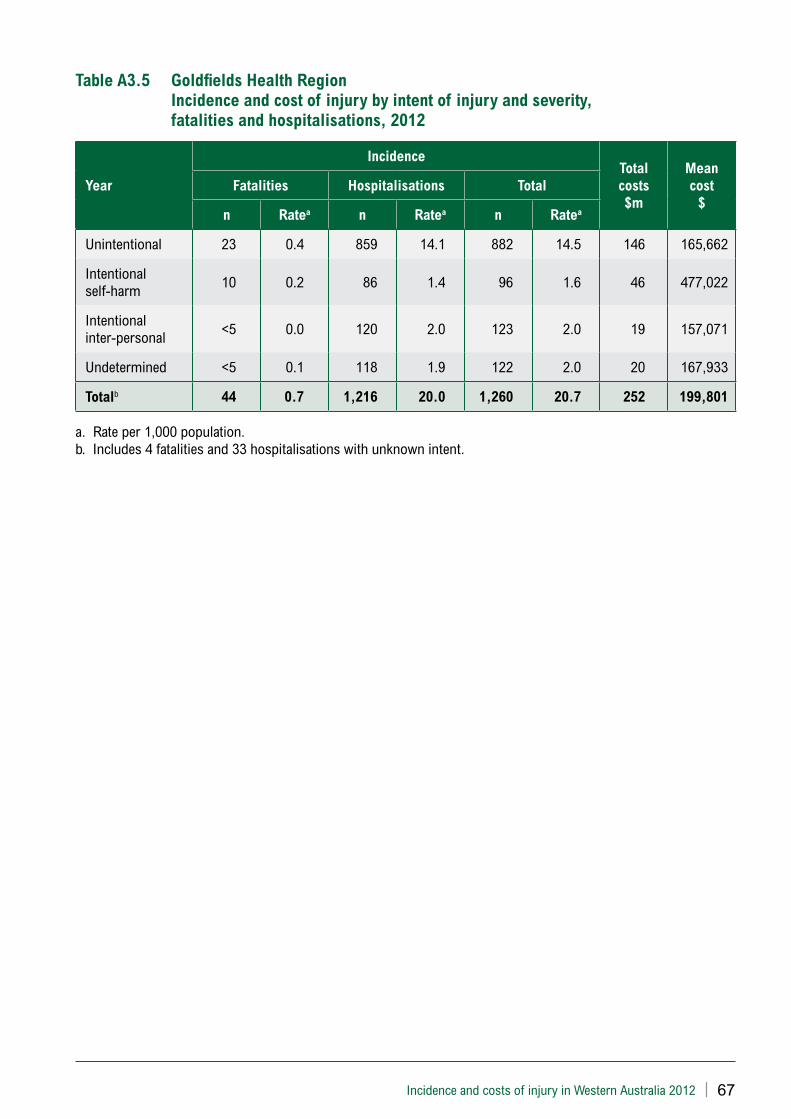
Incidence and costs of injury in Western Australia 2012 | 67
Table A3.5 Goldfields Health Region Incidence and cost of injury by intent of injury and severity, fatalities and hospitalisations, 2012
Year
IncidenceTotal costs $m
Mean cost
$Fatalities Hospitalisations Total
n Ratea n Ratea n Ratea
Unintentional 23 0.4 859 14.1 882 14.5 146 165,662
Intentional self-harm 10 0.2 86 1.4 96 1.6 46 477,022
Intentional inter-personal <5 0.0 120 2.0 123 2.0 19 157,071
Undetermined <5 0.1 118 1.9 122 2.0 20 167,933
Totalb 44 0.7 1,216 20.0 1,260 20.7 252 199,801
a. Rate per 1,000 population.b. Includes 4 fatalities and 33 hospitalisations with unknown intent.
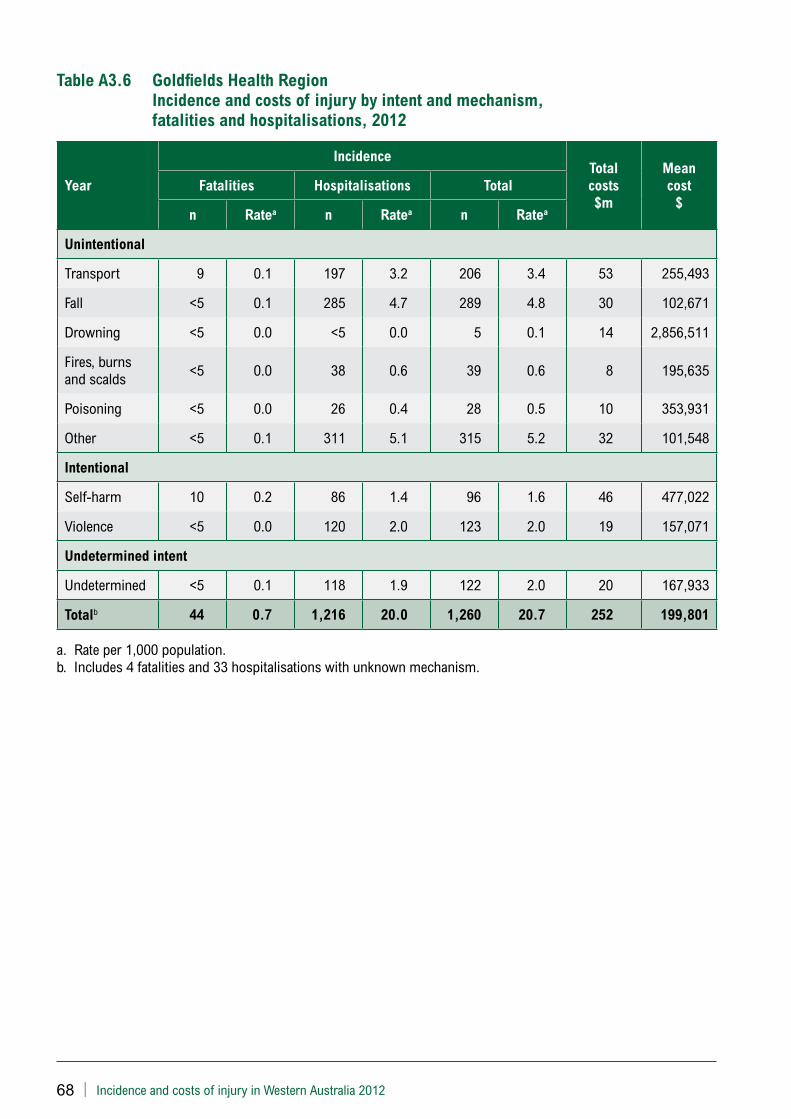
68 | Incidence and costs of injury in Western Australia 2012
Table A3.6 Goldfields Health Region Incidence and costs of injury by intent and mechanism, fatalities and hospitalisations, 2012
Year
IncidenceTotal costs $m
Mean cost
$Fatalities Hospitalisations Total
n Ratea n Ratea n Ratea
Unintentional
Transport 9 0.1 197 3.2 206 3.4 53 255,493
Fall <5 0.1 285 4.7 289 4.8 30 102,671
Drowning <5 0.0 <5 0.0 5 0.1 14 2,856,511
Fires, burns and scalds <5 0.0 38 0.6 39 0.6 8 195,635
Poisoning <5 0.0 26 0.4 28 0.5 10 353,931
Other <5 0.1 311 5.1 315 5.2 32 101,548
Intentional
Self-harm 10 0.2 86 1.4 96 1.6 46 477,022
Violence <5 0.0 120 2.0 123 2.0 19 157,071
Undetermined intent
Undetermined <5 0.1 118 1.9 122 2.0 20 167,933
Totalb 44 0.7 1,216 20.0 1,260 20.7 252 199,801
a. Rate per 1,000 population.b. Includes 4 fatalities and 33 hospitalisations with unknown mechanism.
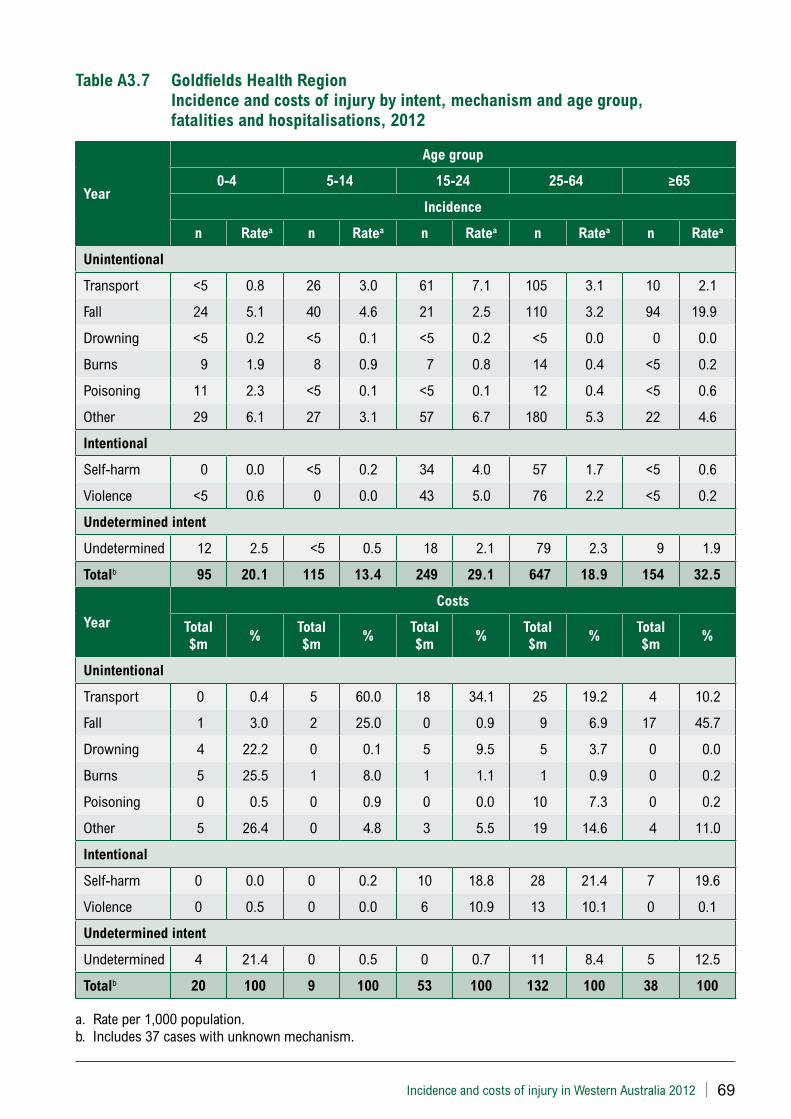
Incidence and costs of injury in Western Australia 2012 | 69
Table A3.7 Goldfields Health Region Incidence and costs of injury by intent, mechanism and age group, fatalities and hospitalisations, 2012
Year
Age group
0-4 5-14 15-24 25-64 ≥65
Incidence
n Ratea n Ratea n Ratea n Ratea n Ratea
Unintentional
Transport <5 0.8 26 3.0 61 7.1 105 3.1 10 2.1
Fall 24 5.1 40 4.6 21 2.5 110 3.2 94 19.9
Drowning <5 0.2 <5 0.1 <5 0.2 <5 0.0 0 0.0
Burns 9 1.9 8 0.9 7 0.8 14 0.4 <5 0.2
Poisoning 11 2.3 <5 0.1 <5 0.1 12 0.4 <5 0.6
Other 29 6.1 27 3.1 57 6.7 180 5.3 22 4.6
Intentional
Self-harm 0 0.0 <5 0.2 34 4.0 57 1.7 <5 0.6
Violence <5 0.6 0 0.0 43 5.0 76 2.2 <5 0.2
Undetermined intent
Undetermined 12 2.5 <5 0.5 18 2.1 79 2.3 9 1.9
Totalb 95 20.1 115 13.4 249 29.1 647 18.9 154 32.5
Year
Costs
Total $m
%Total $m
%Total $m
%Total $m
%Total $m
%
Unintentional
Transport 0 0.4 5 60.0 18 34.1 25 19.2 4 10.2
Fall 1 3.0 2 25.0 0 0.9 9 6.9 17 45.7
Drowning 4 22.2 0 0.1 5 9.5 5 3.7 0 0.0
Burns 5 25.5 1 8.0 1 1.1 1 0.9 0 0.2
Poisoning 0 0.5 0 0.9 0 0.0 10 7.3 0 0.2
Other 5 26.4 0 4.8 3 5.5 19 14.6 4 11.0
Intentional
Self-harm 0 0.0 0 0.2 10 18.8 28 21.4 7 19.6
Violence 0 0.5 0 0.0 6 10.9 13 10.1 0 0.1
Undetermined intent
Undetermined 4 21.4 0 0.5 0 0.7 11 8.4 5 12.5
Totalb 20 100 9 100 53 100 132 100 38 100
a. Rate per 1,000 population.b. Includes 37 cases with unknown mechanism.
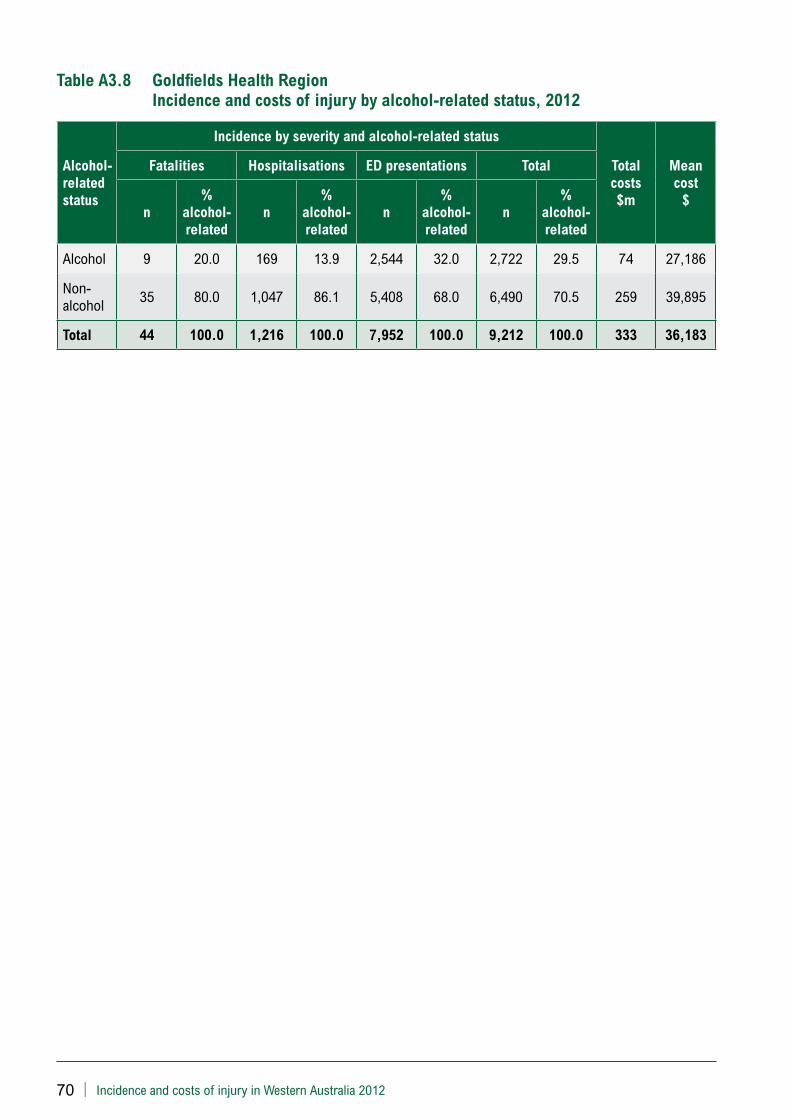
70 | Incidence and costs of injury in Western Australia 2012
Table A3.8 Goldfields Health Region Incidence and costs of injury by alcohol-related status, 2012
Alcohol-related status
Incidence by severity and alcohol-related status
Total costs $m
Mean cost
$
Fatalities Hospitalisations ED presentations Total
n%
alcohol-related
n%
alcohol-related
n%
alcohol-related
n%
alcohol-related
Alcohol 9 20.0 169 13.9 2,544 32.0 2,722 29.5 74 27,186
Non-alcohol 35 80.0 1,047 86.1 5,408 68.0 6,490 70.5 259 39,895
Total 44 100.0 1,216 100.0 7,952 100.0 9,212 100.0 333 36,183
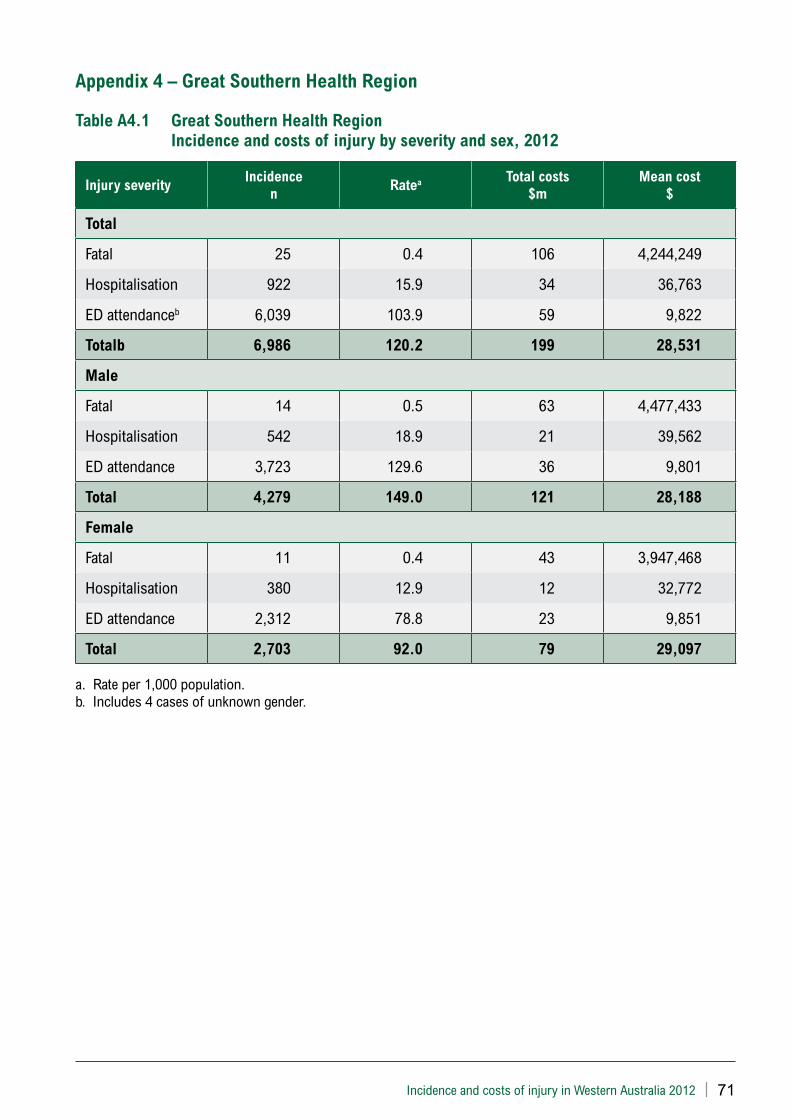
Incidence and costs of injury in Western Australia 2012 | 71
Appendix 4 – Great Southern Health Region
Table A4.1 Great Southern Health Region Incidence and costs of injury by severity and sex, 2012
Injury severityIncidence
nRatea Total costs
$mMean cost
$
Total
Fatal 25 0.4 106 4,244,249
Hospitalisation 922 15.9 34 36,763
ED attendanceb 6,039 103.9 59 9,822
Totalb 6,986 120.2 199 28,531
Male
Fatal 14 0.5 63 4,477,433
Hospitalisation 542 18.9 21 39,562
ED attendance 3,723 129.6 36 9,801
Total 4,279 149.0 121 28,188
Female
Fatal 11 0.4 43 3,947,468
Hospitalisation 380 12.9 12 32,772
ED attendance 2,312 78.8 23 9,851
Total 2,703 92.0 79 29,097
a. Rate per 1,000 population.b. Includes 4 cases of unknown gender.
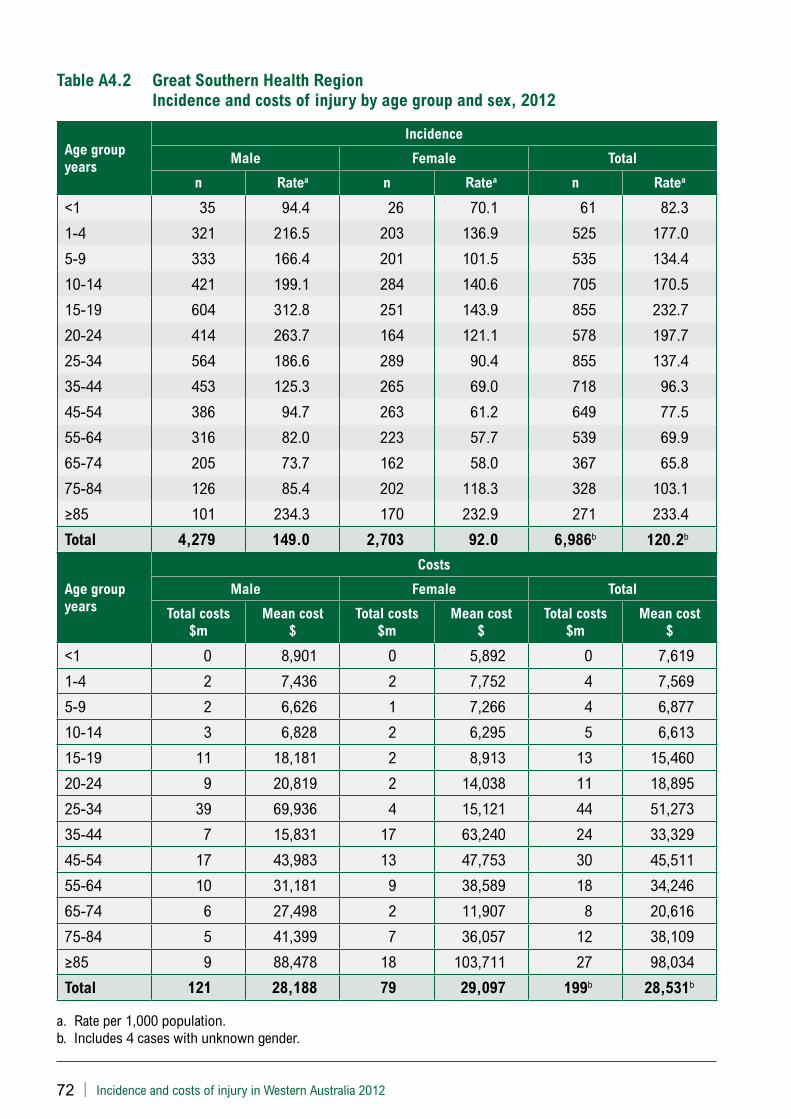
72 | Incidence and costs of injury in Western Australia 2012
Table A4.2 Great Southern Health Region Incidence and costs of injury by age group and sex, 2012
Age group years
Incidence
Male Female Total
n Ratea n Ratea n Ratea
<1 35 94.4 26 70.1 61 82.3
1-4 321 216.5 203 136.9 525 177.0
5-9 333 166.4 201 101.5 535 134.4
10-14 421 199.1 284 140.6 705 170.5
15-19 604 312.8 251 143.9 855 232.7
20-24 414 263.7 164 121.1 578 197.7
25-34 564 186.6 289 90.4 855 137.4
35-44 453 125.3 265 69.0 718 96.3
45-54 386 94.7 263 61.2 649 77.5
55-64 316 82.0 223 57.7 539 69.9
65-74 205 73.7 162 58.0 367 65.8
75-84 126 85.4 202 118.3 328 103.1
≥85 101 234.3 170 232.9 271 233.4
Total 4,279 149.0 2,703 92.0 6,986b 120.2b
Age group years
Costs
Male Female Total
Total costs $m
Mean cost $
Total costs $m
Mean cost $
Total costs $m
Mean cost $
<1 0 8,901 0 5,892 0 7,619
1-4 2 7,436 2 7,752 4 7,569
5-9 2 6,626 1 7,266 4 6,877
10-14 3 6,828 2 6,295 5 6,613
15-19 11 18,181 2 8,913 13 15,460
20-24 9 20,819 2 14,038 11 18,895
25-34 39 69,936 4 15,121 44 51,273
35-44 7 15,831 17 63,240 24 33,329
45-54 17 43,983 13 47,753 30 45,511
55-64 10 31,181 9 38,589 18 34,246
65-74 6 27,498 2 11,907 8 20,616
75-84 5 41,399 7 36,057 12 38,109
≥85 9 88,478 18 103,711 27 98,034
Total 121 28,188 79 29,097 199b 28,531b
a. Rate per 1,000 population. b. Includes 4 cases with unknown gender.

Incidence and costs of injury in Western Australia 2012 | 73
Table A4.3 Great Southern Health Region Incidence and costs of injury by Aboriginality and severity, 2012
Injury severity
Incidence
Aboriginal Non-Aboriginal Total
n Ratea n Ratea n Ratea
Fatal 0 0.0 25 0.5 25 0.4
Hospitalisation 56 21.4 866 15.6 922 15.9
ED attendance 422 161.5 5,617 101.2 6,039 103.9
Total 478 182.9 6,508 117.3 6,986 120.2
Injury severity
Costs
Aboriginal Non-Aboriginal Total
Total costs $m
Mean cost $
Total costs $m
Mean cost $
Total costs $m
Mean cost $
Fatal 0 - 106 4,244,249 106 4,244,249
Hospitalisation 4 64,280 30 34,984 34 36,763
ED attendance 4 10,142 55 9,798 59 9,822
Total 8 16,485 191 29,415 199 28,531
a. Rate per 1,000 population.
Table A4.4 Great Southern Health Region Incidence and costs of injury by socioeconomic status and severity, 2012
SEIFAa
IncidenceTotal costs $m
Mean cost
$Fatal Hospitalisation ED attendance Total
n Rateb n Rateb n Rateb n Rateb
1 12 0.7 277 15.8 1,803 103.1 2,092 119.6 77 36,845
2 6 0.3 292 15.2 1,962 102.2 2,260 117.7 57 25,094
3 <5 0.3 198 15.6 1,398 110.2 1,600 126.1 39 24,344
4 <5 0.3 104 13.9 607 81.2 713 95.3 18 25,604
5 <5 0.8 51 40.8 268 214.5 320 256.1 8 25,973
Totalc 25 0.4 922 15.9 6,039 103.9 6,986 120.2 199 28,531
a. SEIFA coding: 1=most disadvantaged; 5=least disadvantaged.b. Rate per 1,000 population.c. Includes 1 emergency department cases with unknown SEIFA.
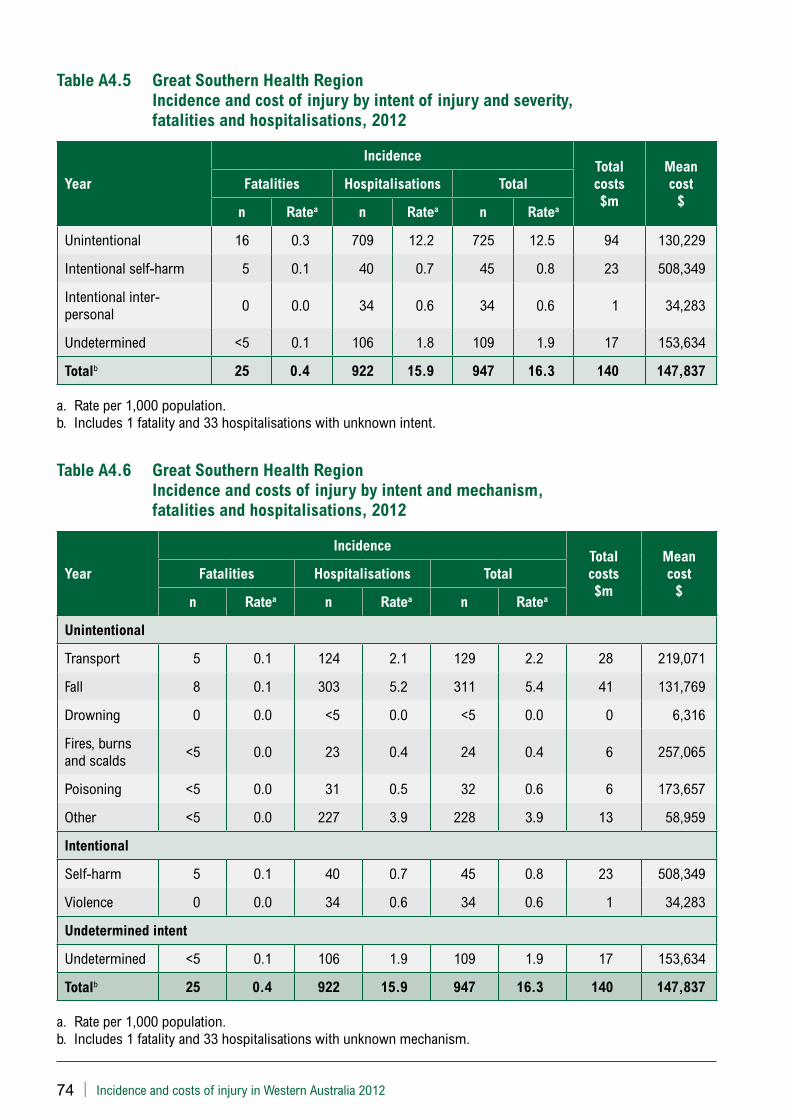
74 | Incidence and costs of injury in Western Australia 2012
Table A4.5 Great Southern Health Region Incidence and cost of injury by intent of injury and severity, fatalities and hospitalisations, 2012
Year
IncidenceTotal costs $m
Mean cost
$Fatalities Hospitalisations Total
n Ratea n Ratea n Ratea
Unintentional 16 0.3 709 12.2 725 12.5 94 130,229
Intentional self-harm 5 0.1 40 0.7 45 0.8 23 508,349
Intentional inter-personal 0 0.0 34 0.6 34 0.6 1 34,283
Undetermined <5 0.1 106 1.8 109 1.9 17 153,634
Totalb 25 0.4 922 15.9 947 16.3 140 147,837
a. Rate per 1,000 population.b. Includes 1 fatality and 33 hospitalisations with unknown intent.
Table A4.6 Great Southern Health Region Incidence and costs of injury by intent and mechanism, fatalities and hospitalisations, 2012
Year
IncidenceTotal costs $m
Mean cost
$Fatalities Hospitalisations Total
n Ratea n Ratea n Ratea
Unintentional
Transport 5 0.1 124 2.1 129 2.2 28 219,071
Fall 8 0.1 303 5.2 311 5.4 41 131,769
Drowning 0 0.0 <5 0.0 <5 0.0 0 6,316
Fires, burns and scalds <5 0.0 23 0.4 24 0.4 6 257,065
Poisoning <5 0.0 31 0.5 32 0.6 6 173,657
Other <5 0.0 227 3.9 228 3.9 13 58,959
Intentional
Self-harm 5 0.1 40 0.7 45 0.8 23 508,349
Violence 0 0.0 34 0.6 34 0.6 1 34,283
Undetermined intent
Undetermined <5 0.1 106 1.9 109 1.9 17 153,634
Totalb 25 0.4 922 15.9 947 16.3 140 147,837
a. Rate per 1,000 population.b. Includes 1 fatality and 33 hospitalisations with unknown mechanism.

Incidence and costs of injury in Western Australia 2012 | 75
Table A4.7 Great Southern Health Region Incidence and costs of injury by intent, mechanism and age group, fatalities and hospitalisations, 2012
Year
Age group
0-4 5-14 15-24 25-64 ≥65
Incidence
n Ratea n Ratea n Ratea n Ratea n Ratea
Unintentional
Transport <5 0.5 15 1.8 26 3.9 68 2.3 18 1.8
Fall 22 5.9 39 4.8 18 2.7 67 2.3 165 16.6
Drowning <5 0.3 0 0.0 0 0.0 0 0.0 0 0.0
Burns 7 1.9 0 0.0 <5 0.3 13 0.4 <5 0.2
Poisoning 7 1.9 <5 0.2 4 0.6 13 0.4 6 0.6
Other 11 3.0 24 3.0 38 5.8 109 3.7 46 4.6
Intentional
Self-harm 0 0.0 <5 0.1 9 1.4 32 1.1 <5 0.3
Violence <5 0.3 0 0.0 8 1.2 25 0.8 0 0.0
Undetermined intent
Undetermined <5 1.1 8 1.0 18 2.7 64 2.2 15 1.5
Totalb 57 15.4 89 11.0 124 18.8 409 13.7 268 27.0
Year
Costs
Total $m
%Total $m
%Total $m
%Total $m
%Total $m
%
Unintentional
Transport 0 2.6 0 17.3 1 8.1 27 31.1 1 1.3
Fall 0 33.5 1 42.4 1 7.0 8 9.6 31 75.8
Drowning 0 0.5 0 0.0 0 0.0 0 0.0 0 0.0
Burns 1 41.9 0 0.0 0 1.6 5 6.2 0 0.2
Poisoning 0 5.0 0 1.2 0 0.5 5 6.2 0 0.3
Other 0 6.3 0 31.4 8 74.9 4 4.2 1 2.7
Intentional
Self-harm 0 0.0 0 1.0 0 1.4 19 22.1 4 9.4
Violence 0 6.2 0 0.0 0 1.8 1 1.0 0 0.0
Undetermined intent
Undetermined 0 2.7 0 6.7 0 4.5 12 14.2 4 9.8
Totalb 1 100 2 100 11 100 85 100 41 100
a. Rate per 1,000 population.b. Includes 34 cases with unknown mechanism.
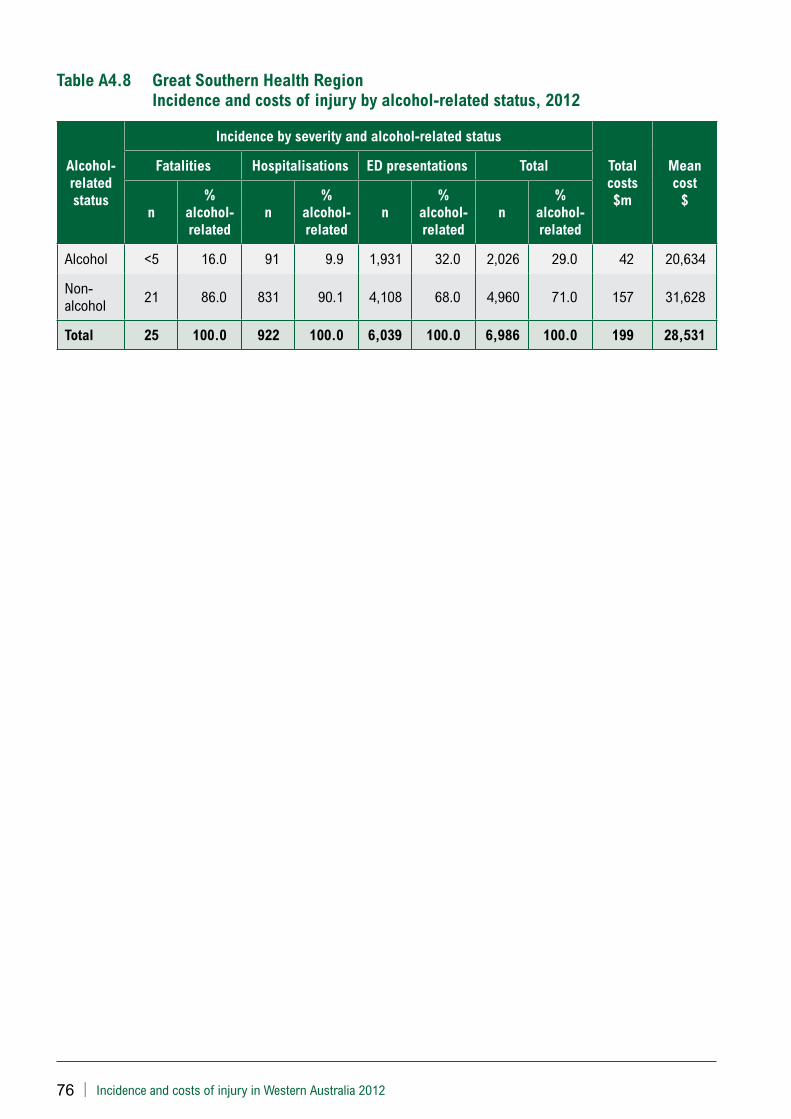
76 | Incidence and costs of injury in Western Australia 2012
Table A4.8 Great Southern Health Region Incidence and costs of injury by alcohol-related status, 2012
Alcohol-related status
Incidence by severity and alcohol-related status
Total costs $m
Mean cost
$
Fatalities Hospitalisations ED presentations Total
n%
alcohol-related
n%
alcohol-related
n%
alcohol-related
n%
alcohol-related
Alcohol <5 16.0 91 9.9 1,931 32.0 2,026 29.0 42 20,634
Non-alcohol 21 86.0 831 90.1 4,108 68.0 4,960 71.0 157 31,628
Total 25 100.0 922 100.0 6,039 100.0 6,986 100.0 199 28,531
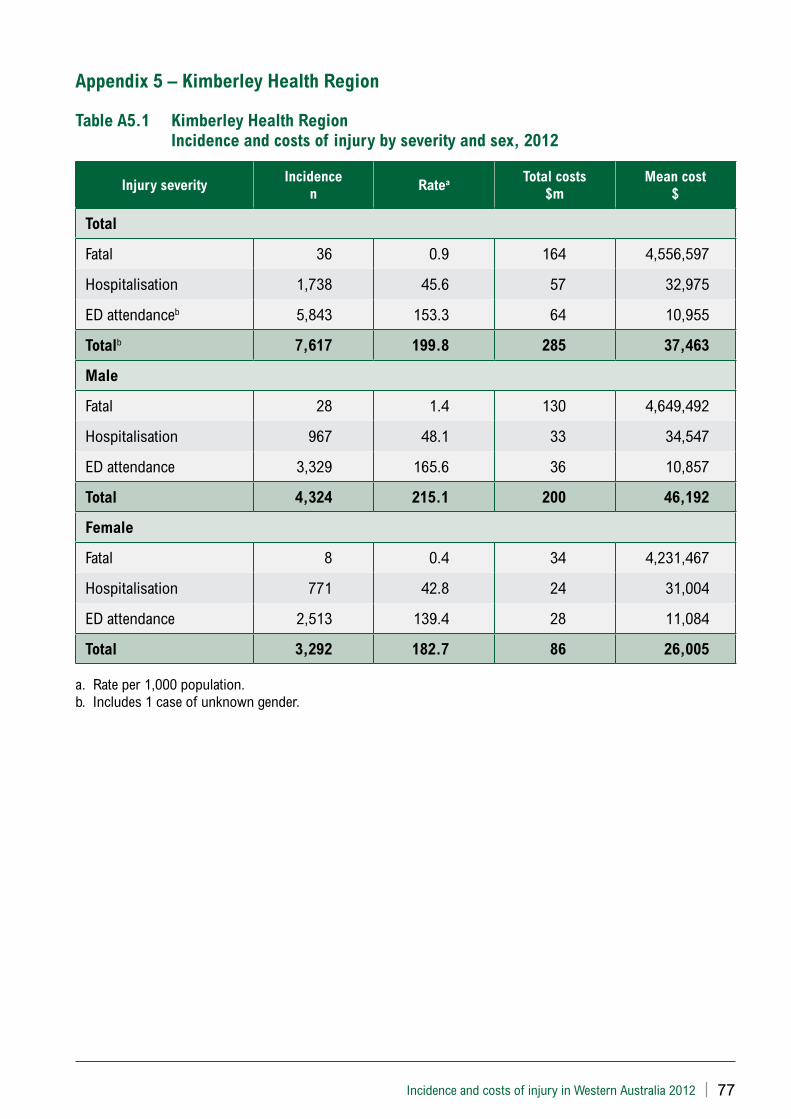
Incidence and costs of injury in Western Australia 2012 | 77
Appendix 5 – Kimberley Health Region
Table A5.1 Kimberley Health Region Incidence and costs of injury by severity and sex, 2012
Injury severityIncidence
nRatea Total costs
$mMean cost
$
Total
Fatal 36 0.9 164 4,556,597
Hospitalisation 1,738 45.6 57 32,975
ED attendanceb 5,843 153.3 64 10,955
Totalb 7,617 199.8 285 37,463
Male
Fatal 28 1.4 130 4,649,492
Hospitalisation 967 48.1 33 34,547
ED attendance 3,329 165.6 36 10,857
Total 4,324 215.1 200 46,192
Female
Fatal 8 0.4 34 4,231,467
Hospitalisation 771 42.8 24 31,004
ED attendance 2,513 139.4 28 11,084
Total 3,292 182.7 86 26,005
a. Rate per 1,000 population.b. Includes 1 case of unknown gender.
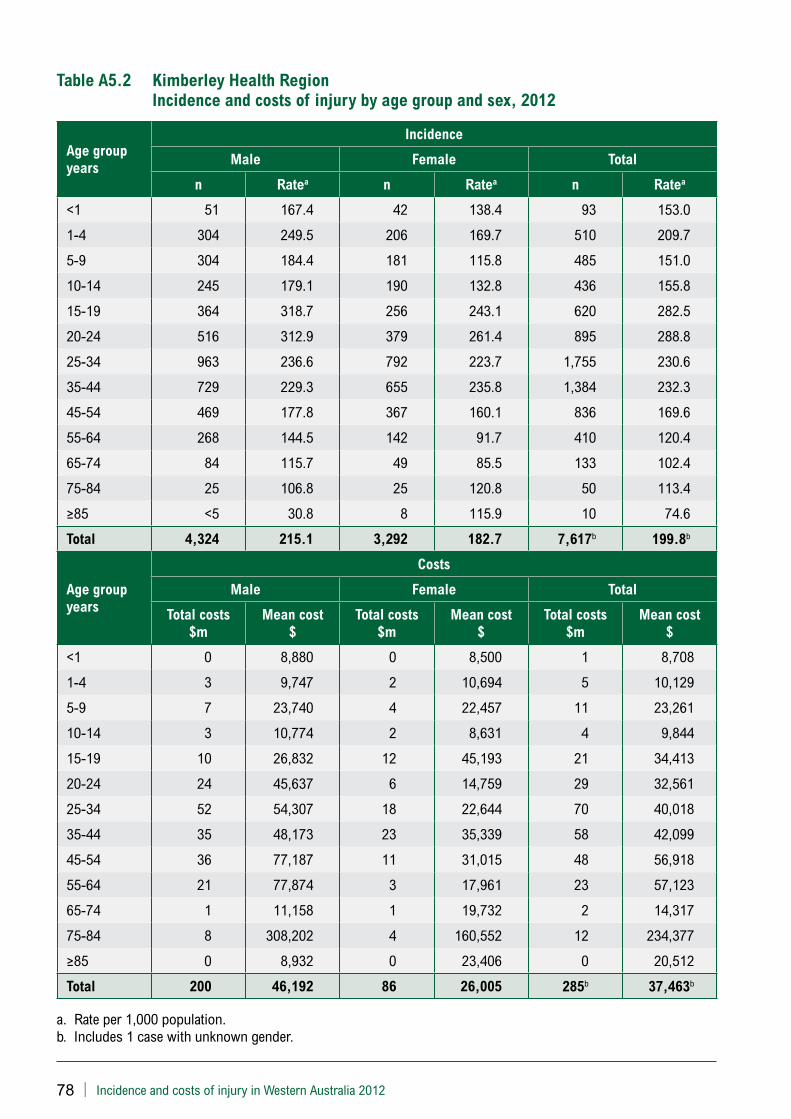
78 | Incidence and costs of injury in Western Australia 2012
Table A5.2 Kimberley Health Region Incidence and costs of injury by age group and sex, 2012
Age group years
Incidence
Male Female Total
n Ratea n Ratea n Ratea
<1 51 167.4 42 138.4 93 153.0
1-4 304 249.5 206 169.7 510 209.7
5-9 304 184.4 181 115.8 485 151.0
10-14 245 179.1 190 132.8 436 155.8
15-19 364 318.7 256 243.1 620 282.5
20-24 516 312.9 379 261.4 895 288.8
25-34 963 236.6 792 223.7 1,755 230.6
35-44 729 229.3 655 235.8 1,384 232.3
45-54 469 177.8 367 160.1 836 169.6
55-64 268 144.5 142 91.7 410 120.4
65-74 84 115.7 49 85.5 133 102.4
75-84 25 106.8 25 120.8 50 113.4
≥85 <5 30.8 8 115.9 10 74.6
Total 4,324 215.1 3,292 182.7 7,617b 199.8b
Age group years
Costs
Male Female Total
Total costs $m
Mean cost $
Total costs $m
Mean cost $
Total costs $m
Mean cost $
<1 0 8,880 0 8,500 1 8,708
1-4 3 9,747 2 10,694 5 10,129
5-9 7 23,740 4 22,457 11 23,261
10-14 3 10,774 2 8,631 4 9,844
15-19 10 26,832 12 45,193 21 34,413
20-24 24 45,637 6 14,759 29 32,561
25-34 52 54,307 18 22,644 70 40,018
35-44 35 48,173 23 35,339 58 42,099
45-54 36 77,187 11 31,015 48 56,918
55-64 21 77,874 3 17,961 23 57,123
65-74 1 11,158 1 19,732 2 14,317
75-84 8 308,202 4 160,552 12 234,377
≥85 0 8,932 0 23,406 0 20,512
Total 200 46,192 86 26,005 285b 37,463b
a. Rate per 1,000 population. b. Includes 1 case with unknown gender.
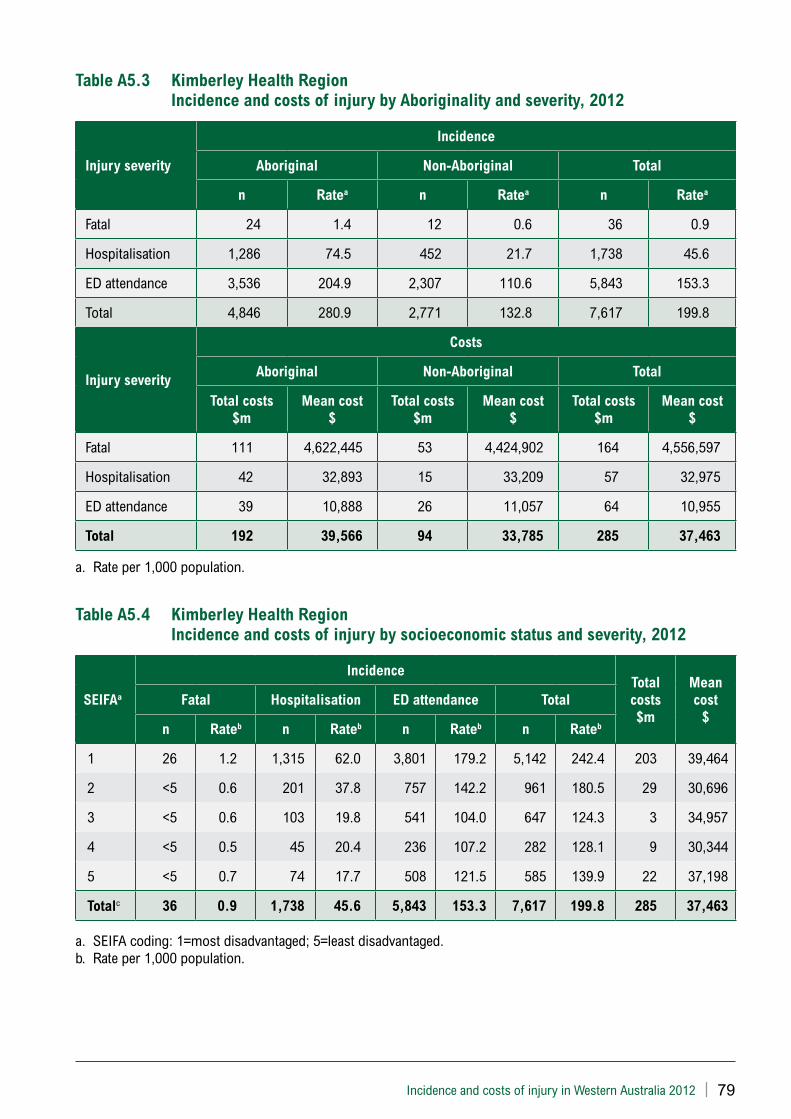
Incidence and costs of injury in Western Australia 2012 | 79
Table A5.3 Kimberley Health Region Incidence and costs of injury by Aboriginality and severity, 2012
Injury severity
Incidence
Aboriginal Non-Aboriginal Total
n Ratea n Ratea n Ratea
Fatal 24 1.4 12 0.6 36 0.9
Hospitalisation 1,286 74.5 452 21.7 1,738 45.6
ED attendance 3,536 204.9 2,307 110.6 5,843 153.3
Total 4,846 280.9 2,771 132.8 7,617 199.8
Injury severity
Costs
Aboriginal Non-Aboriginal Total
Total costs $m
Mean cost $
Total costs $m
Mean cost $
Total costs $m
Mean cost $
Fatal 111 4,622,445 53 4,424,902 164 4,556,597
Hospitalisation 42 32,893 15 33,209 57 32,975
ED attendance 39 10,888 26 11,057 64 10,955
Total 192 39,566 94 33,785 285 37,463
a. Rate per 1,000 population.
Table A5.4 Kimberley Health Region Incidence and costs of injury by socioeconomic status and severity, 2012
SEIFAa
IncidenceTotal costs $m
Mean cost
$Fatal Hospitalisation ED attendance Total
n Rateb n Rateb n Rateb n Rateb
1 26 1.2 1,315 62.0 3,801 179.2 5,142 242.4 203 39,464
2 <5 0.6 201 37.8 757 142.2 961 180.5 29 30,696
3 <5 0.6 103 19.8 541 104.0 647 124.3 3 34,957
4 <5 0.5 45 20.4 236 107.2 282 128.1 9 30,344
5 <5 0.7 74 17.7 508 121.5 585 139.9 22 37,198
Totalc 36 0.9 1,738 45.6 5,843 153.3 7,617 199.8 285 37,463
a. SEIFA coding: 1=most disadvantaged; 5=least disadvantaged.b. Rate per 1,000 population.
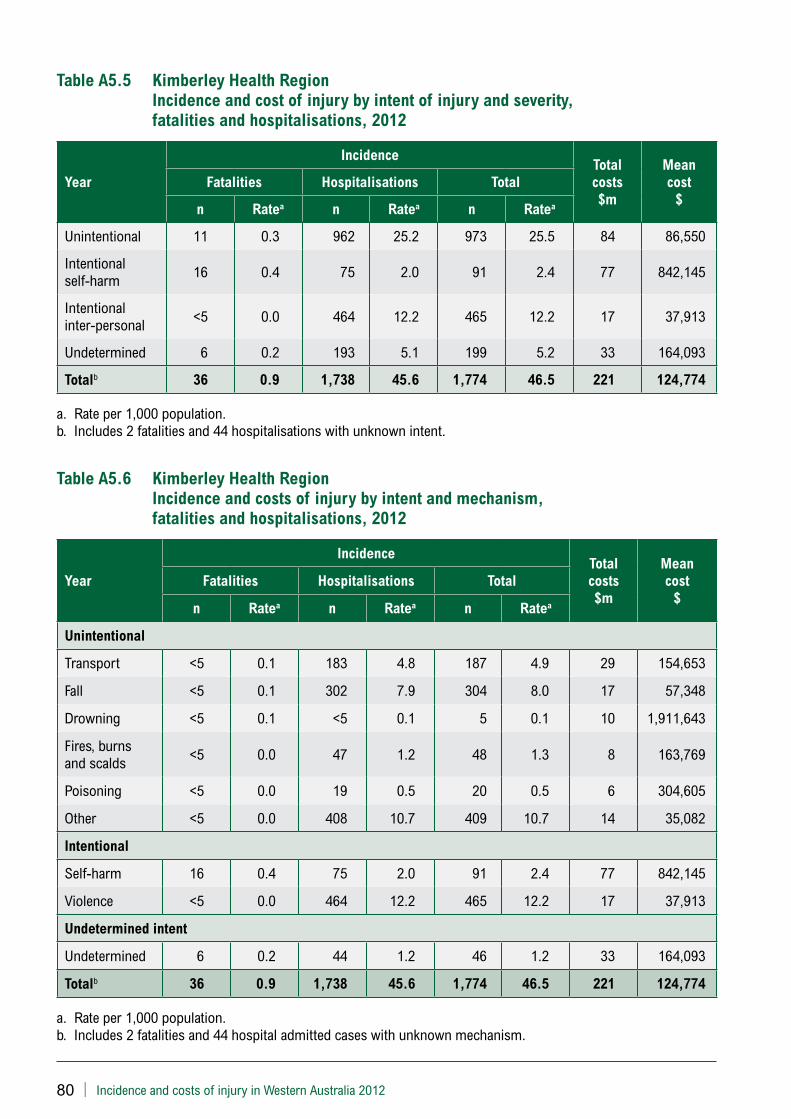
80 | Incidence and costs of injury in Western Australia 2012
Table A5.5 Kimberley Health Region Incidence and cost of injury by intent of injury and severity, fatalities and hospitalisations, 2012
Year
IncidenceTotal costs $m
Mean cost
$Fatalities Hospitalisations Total
n Ratea n Ratea n Ratea
Unintentional 11 0.3 962 25.2 973 25.5 84 86,550
Intentional self-harm 16 0.4 75 2.0 91 2.4 77 842,145
Intentional inter-personal <5 0.0 464 12.2 465 12.2 17 37,913
Undetermined 6 0.2 193 5.1 199 5.2 33 164,093
Totalb 36 0.9 1,738 45.6 1,774 46.5 221 124,774
a. Rate per 1,000 population.b. Includes 2 fatalities and 44 hospitalisations with unknown intent.
Table A5.6 Kimberley Health Region Incidence and costs of injury by intent and mechanism, fatalities and hospitalisations, 2012
Year
IncidenceTotal costs $m
Mean cost
$Fatalities Hospitalisations Total
n Ratea n Ratea n Ratea
Unintentional
Transport <5 0.1 183 4.8 187 4.9 29 154,653
Fall <5 0.1 302 7.9 304 8.0 17 57,348
Drowning <5 0.1 <5 0.1 5 0.1 10 1,911,643
Fires, burns and scalds <5 0.0 47 1.2 48 1.3 8 163,769
Poisoning <5 0.0 19 0.5 20 0.5 6 304,605
Other <5 0.0 408 10.7 409 10.7 14 35,082
Intentional
Self-harm 16 0.4 75 2.0 91 2.4 77 842,145
Violence <5 0.0 464 12.2 465 12.2 17 37,913
Undetermined intent
Undetermined 6 0.2 44 1.2 46 1.2 33 164,093
Totalb 36 0.9 1,738 45.6 1,774 46.5 221 124,774
a. Rate per 1,000 population.b. Includes 2 fatalities and 44 hospital admitted cases with unknown mechanism.
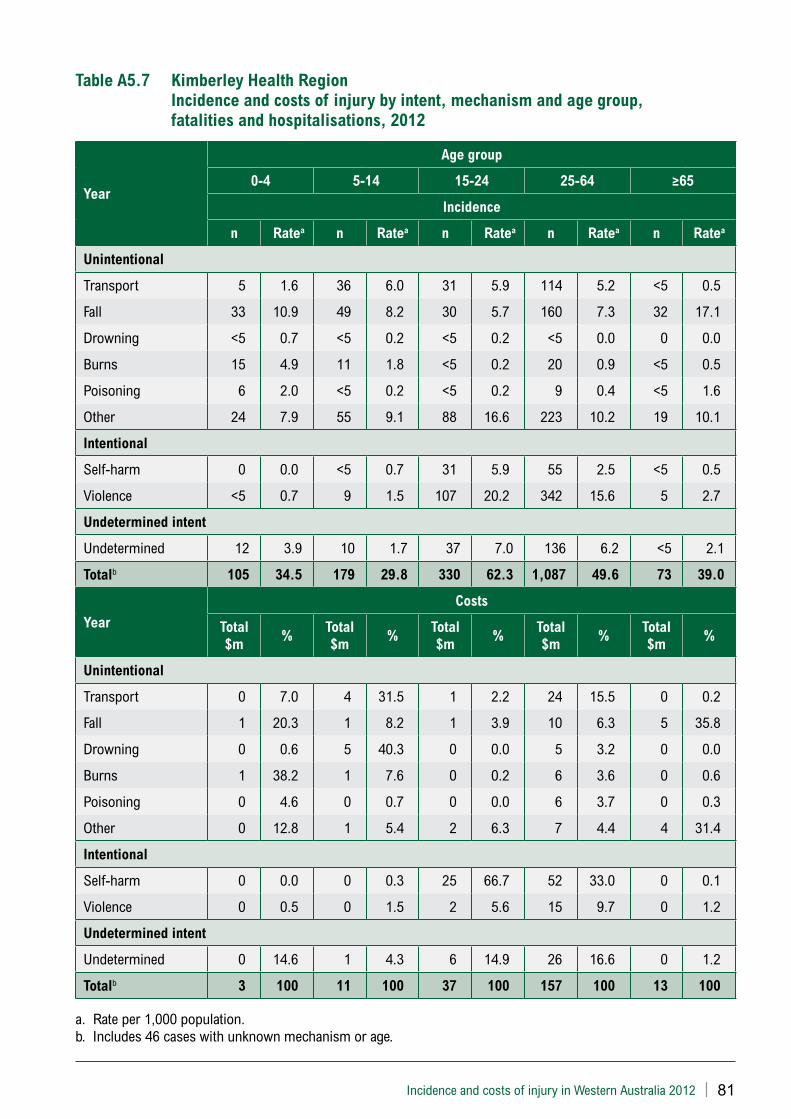
Incidence and costs of injury in Western Australia 2012 | 81
Table A5.7 Kimberley Health Region Incidence and costs of injury by intent, mechanism and age group, fatalities and hospitalisations, 2012
Year
Age group
0-4 5-14 15-24 25-64 ≥65
Incidence
n Ratea n Ratea n Ratea n Ratea n Ratea
Unintentional
Transport 5 1.6 36 6.0 31 5.9 114 5.2 <5 0.5
Fall 33 10.9 49 8.2 30 5.7 160 7.3 32 17.1
Drowning <5 0.7 <5 0.2 <5 0.2 <5 0.0 0 0.0
Burns 15 4.9 11 1.8 <5 0.2 20 0.9 <5 0.5
Poisoning 6 2.0 <5 0.2 <5 0.2 9 0.4 <5 1.6
Other 24 7.9 55 9.1 88 16.6 223 10.2 19 10.1
Intentional
Self-harm 0 0.0 <5 0.7 31 5.9 55 2.5 <5 0.5
Violence <5 0.7 9 1.5 107 20.2 342 15.6 5 2.7
Undetermined intent
Undetermined 12 3.9 10 1.7 37 7.0 136 6.2 <5 2.1
Totalb 105 34.5 179 29.8 330 62.3 1,087 49.6 73 39.0
Year
Costs
Total $m
%Total $m
%Total $m
%Total $m
%Total $m
%
Unintentional
Transport 0 7.0 4 31.5 1 2.2 24 15.5 0 0.2
Fall 1 20.3 1 8.2 1 3.9 10 6.3 5 35.8
Drowning 0 0.6 5 40.3 0 0.0 5 3.2 0 0.0
Burns 1 38.2 1 7.6 0 0.2 6 3.6 0 0.6
Poisoning 0 4.6 0 0.7 0 0.0 6 3.7 0 0.3
Other 0 12.8 1 5.4 2 6.3 7 4.4 4 31.4
Intentional
Self-harm 0 0.0 0 0.3 25 66.7 52 33.0 0 0.1
Violence 0 0.5 0 1.5 2 5.6 15 9.7 0 1.2
Undetermined intent
Undetermined 0 14.6 1 4.3 6 14.9 26 16.6 0 1.2
Totalb 3 100 11 100 37 100 157 100 13 100
a. Rate per 1,000 population.b. Includes 46 cases with unknown mechanism or age.
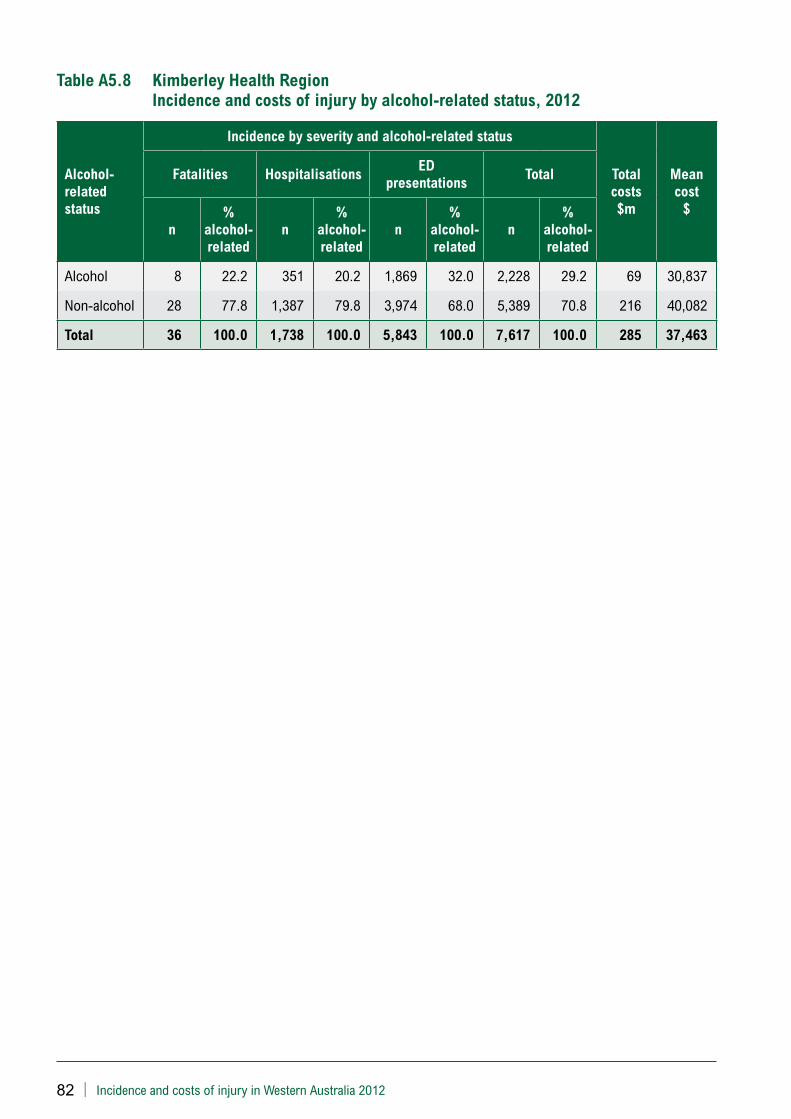
82 | Incidence and costs of injury in Western Australia 2012
Table A5.8 Kimberley Health Region Incidence and costs of injury by alcohol-related status, 2012
Alcohol-related status
Incidence by severity and alcohol-related status
Total costs $m
Mean cost
$
Fatalities HospitalisationsED
presentationsTotal
n%
alcohol-related
n%
alcohol-related
n%
alcohol-related
n%
alcohol-related
Alcohol 8 22.2 351 20.2 1,869 32.0 2,228 29.2 69 30,837
Non-alcohol 28 77.8 1,387 79.8 3,974 68.0 5,389 70.8 216 40,082
Total 36 100.0 1,738 100.0 5,843 100.0 7,617 100.0 285 37,463

Incidence and costs of injury in Western Australia 2012 | 83
Appendix 6 – Midwest Health Region
Table A6.1 Midwest Health Region Incidence and costs of injury by severity and sex, 2012
Injury severityIncidence
nRatea Total costs
$mMean cost
$
Total
Fatal 36 0.5 152 4,214,891
Hospitalisation 1,688 25.5 60 35,453
ED attendanceb 6,918 104.3 69 9,989
Totalb 8,642 130.3 281 32,479
Male
Fatal 22 0.6 100 4,452,153
Hospitalisation 994 29.1 39 39,600
ED attendance 4,222 123.8 42 9,967
Total 5,238 153.5 179 34,248
Female
Fatal 14 0.4 54 3,842,051
Hospitalisation 694 21.5 20 29,514
ED attendance 2,695 83.7 27 10,022
Total 3,403 105.7 101 29,762
a. Rate per 1,000 population.b. Includes 1 case of unknown gender.
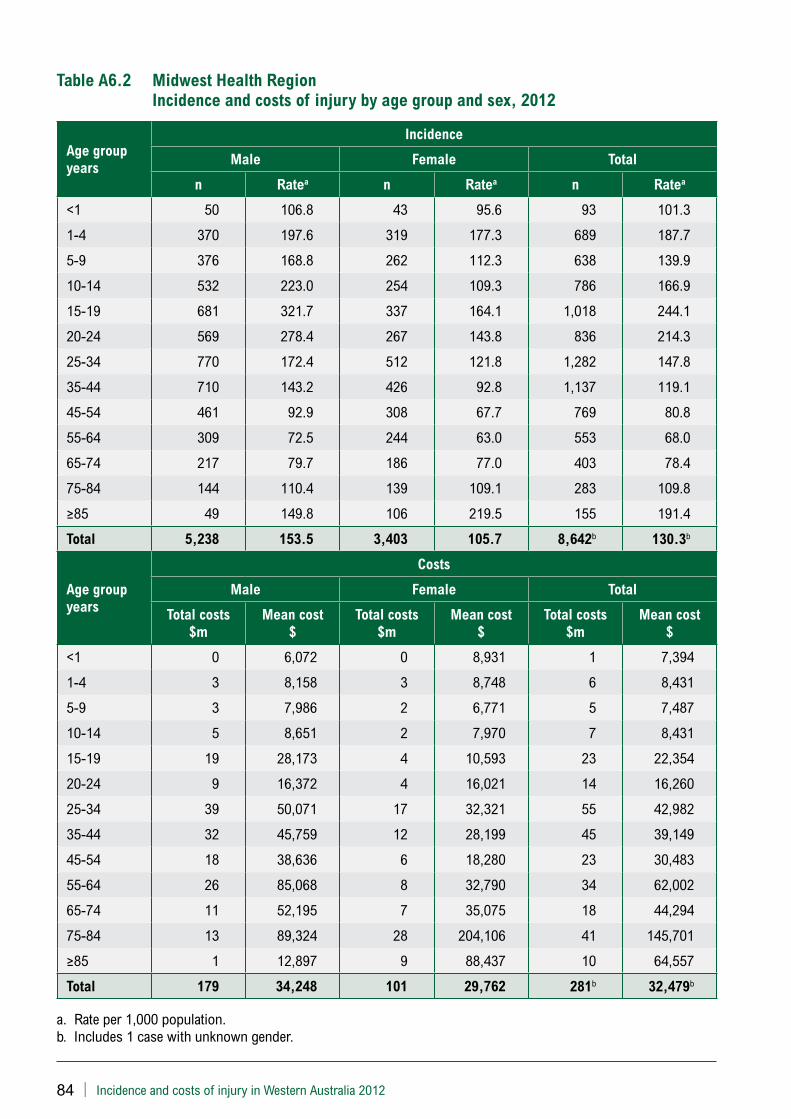
84 | Incidence and costs of injury in Western Australia 2012
Table A6.2 Midwest Health Region Incidence and costs of injury by age group and sex, 2012
Age group years
Incidence
Male Female Total
n Ratea n Ratea n Ratea
<1 50 106.8 43 95.6 93 101.3
1-4 370 197.6 319 177.3 689 187.7
5-9 376 168.8 262 112.3 638 139.9
10-14 532 223.0 254 109.3 786 166.9
15-19 681 321.7 337 164.1 1,018 244.1
20-24 569 278.4 267 143.8 836 214.3
25-34 770 172.4 512 121.8 1,282 147.8
35-44 710 143.2 426 92.8 1,137 119.1
45-54 461 92.9 308 67.7 769 80.8
55-64 309 72.5 244 63.0 553 68.0
65-74 217 79.7 186 77.0 403 78.4
75-84 144 110.4 139 109.1 283 109.8
≥85 49 149.8 106 219.5 155 191.4
Total 5,238 153.5 3,403 105.7 8,642b 130.3b
Age group years
Costs
Male Female Total
Total costs $m
Mean cost $
Total costs $m
Mean cost $
Total costs $m
Mean cost $
<1 0 6,072 0 8,931 1 7,394
1-4 3 8,158 3 8,748 6 8,431
5-9 3 7,986 2 6,771 5 7,487
10-14 5 8,651 2 7,970 7 8,431
15-19 19 28,173 4 10,593 23 22,354
20-24 9 16,372 4 16,021 14 16,260
25-34 39 50,071 17 32,321 55 42,982
35-44 32 45,759 12 28,199 45 39,149
45-54 18 38,636 6 18,280 23 30,483
55-64 26 85,068 8 32,790 34 62,002
65-74 11 52,195 7 35,075 18 44,294
75-84 13 89,324 28 204,106 41 145,701
≥85 1 12,897 9 88,437 10 64,557
Total 179 34,248 101 29,762 281b 32,479b
a. Rate per 1,000 population. b. Includes 1 case with unknown gender.
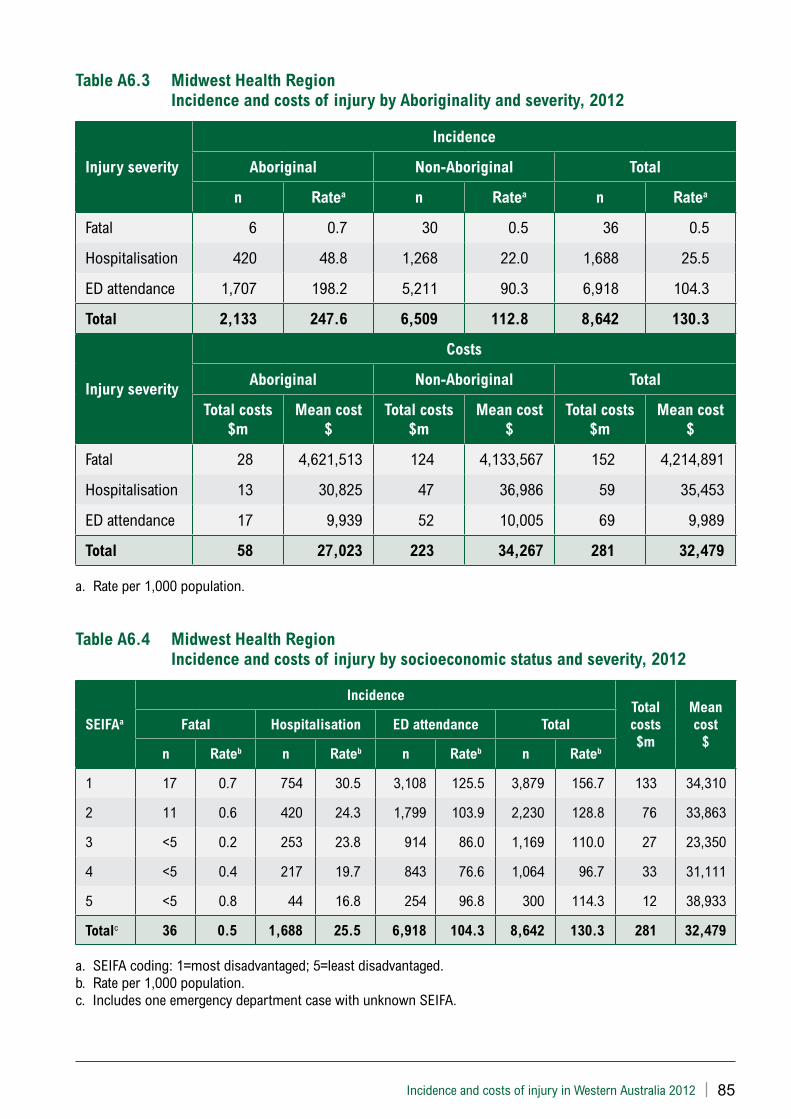
Incidence and costs of injury in Western Australia 2012 | 85
Table A6.3 Midwest Health Region Incidence and costs of injury by Aboriginality and severity, 2012
Injury severity
Incidence
Aboriginal Non-Aboriginal Total
n Ratea n Ratea n Ratea
Fatal 6 0.7 30 0.5 36 0.5
Hospitalisation 420 48.8 1,268 22.0 1,688 25.5
ED attendance 1,707 198.2 5,211 90.3 6,918 104.3
Total 2,133 247.6 6,509 112.8 8,642 130.3
Injury severity
Costs
Aboriginal Non-Aboriginal Total
Total costs $m
Mean cost $
Total costs $m
Mean cost $
Total costs $m
Mean cost $
Fatal 28 4,621,513 124 4,133,567 152 4,214,891
Hospitalisation 13 30,825 47 36,986 59 35,453
ED attendance 17 9,939 52 10,005 69 9,989
Total 58 27,023 223 34,267 281 32,479
a. Rate per 1,000 population.
Table A6.4 Midwest Health Region Incidence and costs of injury by socioeconomic status and severity, 2012
SEIFAa
IncidenceTotal costs $m
Mean cost
$Fatal Hospitalisation ED attendance Total
n Rateb n Rateb n Rateb n Rateb
1 17 0.7 754 30.5 3,108 125.5 3,879 156.7 133 34,310
2 11 0.6 420 24.3 1,799 103.9 2,230 128.8 76 33,863
3 <5 0.2 253 23.8 914 86.0 1,169 110.0 27 23,350
4 <5 0.4 217 19.7 843 76.6 1,064 96.7 33 31,111
5 <5 0.8 44 16.8 254 96.8 300 114.3 12 38,933
Totalc 36 0.5 1,688 25.5 6,918 104.3 8,642 130.3 281 32,479
a. SEIFA coding: 1=most disadvantaged; 5=least disadvantaged.b. Rate per 1,000 population.c. Includes one emergency department case with unknown SEIFA.
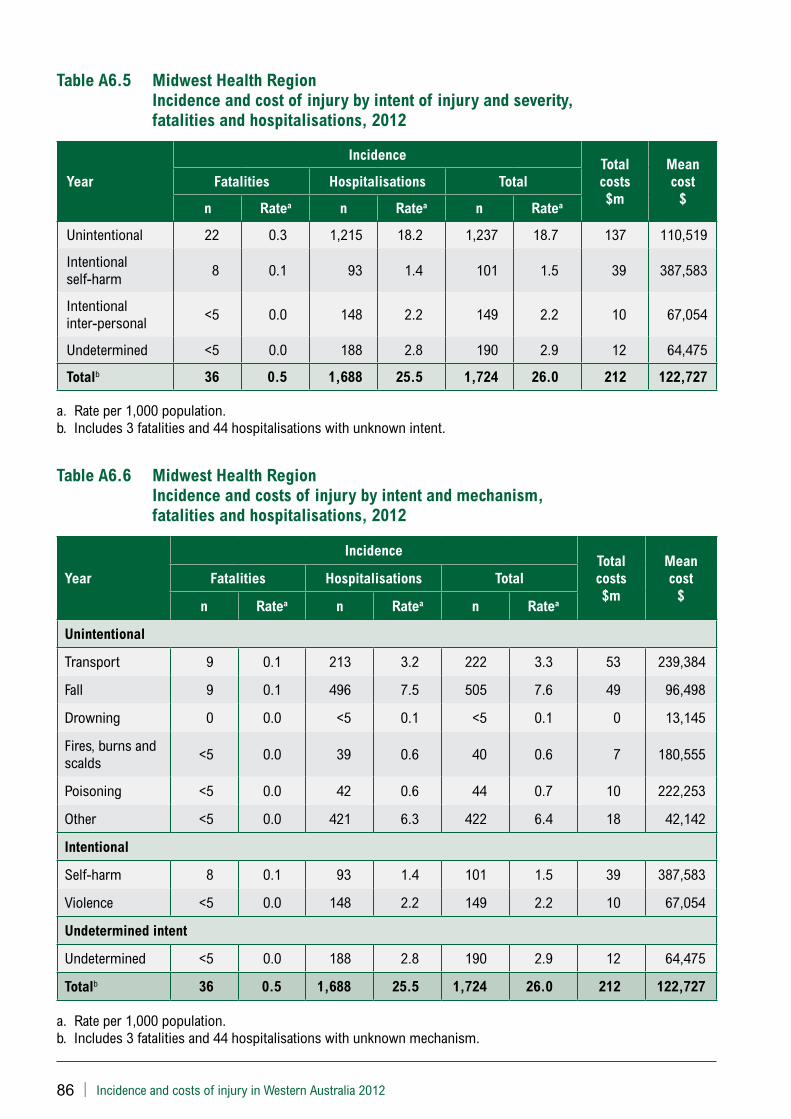
86 | Incidence and costs of injury in Western Australia 2012
Table A6.5 Midwest Health Region Incidence and cost of injury by intent of injury and severity, fatalities and hospitalisations, 2012
Year
IncidenceTotal costs $m
Mean cost
$Fatalities Hospitalisations Total
n Ratea n Ratea n Ratea
Unintentional 22 0.3 1,215 18.2 1,237 18.7 137 110,519
Intentional self-harm 8 0.1 93 1.4 101 1.5 39 387,583
Intentional inter-personal <5 0.0 148 2.2 149 2.2 10 67,054
Undetermined <5 0.0 188 2.8 190 2.9 12 64,475
Totalb 36 0.5 1,688 25.5 1,724 26.0 212 122,727
a. Rate per 1,000 population.b. Includes 3 fatalities and 44 hospitalisations with unknown intent.
Table A6.6 Midwest Health Region Incidence and costs of injury by intent and mechanism, fatalities and hospitalisations, 2012
Year
IncidenceTotal costs $m
Mean cost
$Fatalities Hospitalisations Total
n Ratea n Ratea n Ratea
Unintentional
Transport 9 0.1 213 3.2 222 3.3 53 239,384
Fall 9 0.1 496 7.5 505 7.6 49 96,498
Drowning 0 0.0 <5 0.1 <5 0.1 0 13,145
Fires, burns and scalds <5 0.0 39 0.6 40 0.6 7 180,555
Poisoning <5 0.0 42 0.6 44 0.7 10 222,253
Other <5 0.0 421 6.3 422 6.4 18 42,142
Intentional
Self-harm 8 0.1 93 1.4 101 1.5 39 387,583
Violence <5 0.0 148 2.2 149 2.2 10 67,054
Undetermined intent
Undetermined <5 0.0 188 2.8 190 2.9 12 64,475
Totalb 36 0.5 1,688 25.5 1,724 26.0 212 122,727
a. Rate per 1,000 population.b. Includes 3 fatalities and 44 hospitalisations with unknown mechanism.

Incidence and costs of injury in Western Australia 2012 | 87
Table A6.7 Midwest Health Region Incidence and costs of injury by intent, mechanism and age group, fatalities and hospitalisations, 2012
Year
Age group
0-4 5-14 15-24 25-64 ≥65
Incidence
n Ratea n Ratea n Ratea n Ratea n Ratea
Unintentional
Transport 7 1.5 27 2.9 49 6.1 131 3.7 8 3.7
Fall 32 7.0 57 6.2 41 5.1 153 4.3 222 4.3
Drowning <5 0.4 0 0.0 0 0.0 <5 0.0 <5 0.0
Burns 8 1.7 7 0.8 9 1.1 12 0.3 <5 0.3
Poisoning 14 3.1 <5 0.1 <5 0.1 21 0.6 7 0.6
Other 26 5.7 39 4.2 72 8.9 235 6.6 50 6.6
Intentional
Self-harm 0 0.0 6 0.6 24 3.0 67 1.9 <5 1.9
Violence <5 0.4 <5 0.1 42 5.2 102 2.8 <5 2.8
Undetermined intent
Undetermined <5 0.4 12 1.3 43 5.3 110 3.1 23 3.1
Totalb 94 20.5 150 16.2 291 36.1 854 23.8 335 39.3
Year
Costs
Total $m
%Total $m
%Total $m
%Total $m
%Total $m
%
Unintentional
Transport 0 9.6 1 16.6 6 31.6 42 35.0 4 6.0
Fall 1 27.9 1 32.3 2 8.1 6 5.1 39 60.0
Drowning 0 0.6 0 0.0 0 0.0 0 0.0 0 0.0
Burns 1 29.4 1 15.7 1 3.9 5 4.0 0 0.5
Poisoning 0 5.9 0 0.3 0 0.1 10 7.9 0 0.1
Other 1 25.1 1 28.6 2 10.7 8 6.5 6 9.5
Intentional
Self-harm 0 0.0 0 1.5 5 26.2 34 28.1 0 0.2
Violence 0 0.7 0 0.6 1 6.8 9 7.1 0 0.0
Undetermined intent
Undetermined 0 0.5 0 4.5 1 5.3 3 2.6 8 12.1
Totalb 2 100 4 100 20 100 120 100 65 100
a. Rate per 1,000 population.b. Includes 47 cases with unknown mechanism.
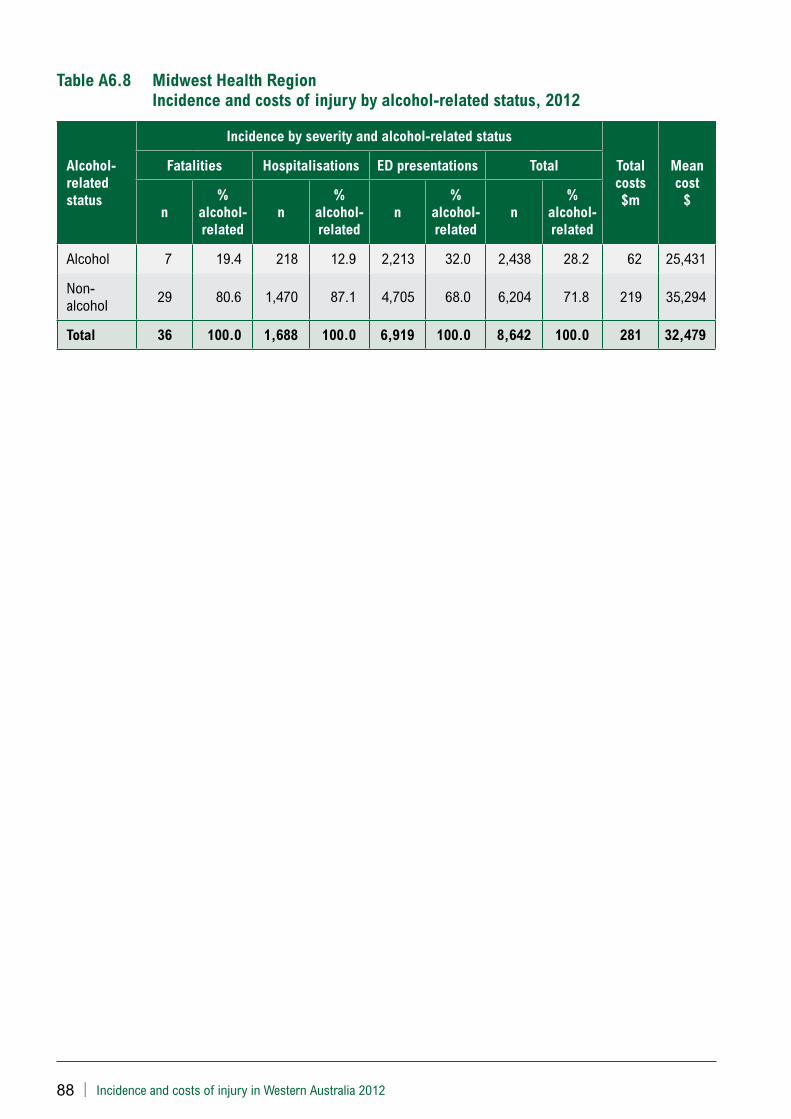
88 | Incidence and costs of injury in Western Australia 2012
Table A6.8 Midwest Health Region Incidence and costs of injury by alcohol-related status, 2012
Alcohol-related status
Incidence by severity and alcohol-related status
Total costs $m
Mean cost
$
Fatalities Hospitalisations ED presentations Total
n%
alcohol-related
n%
alcohol-related
n%
alcohol-related
n%
alcohol-related
Alcohol 7 19.4 218 12.9 2,213 32.0 2,438 28.2 62 25,431
Non-alcohol 29 80.6 1,470 87.1 4,705 68.0 6,204 71.8 219 35,294
Total 36 100.0 1,688 100.0 6,919 100.0 8,642 100.0 281 32,479
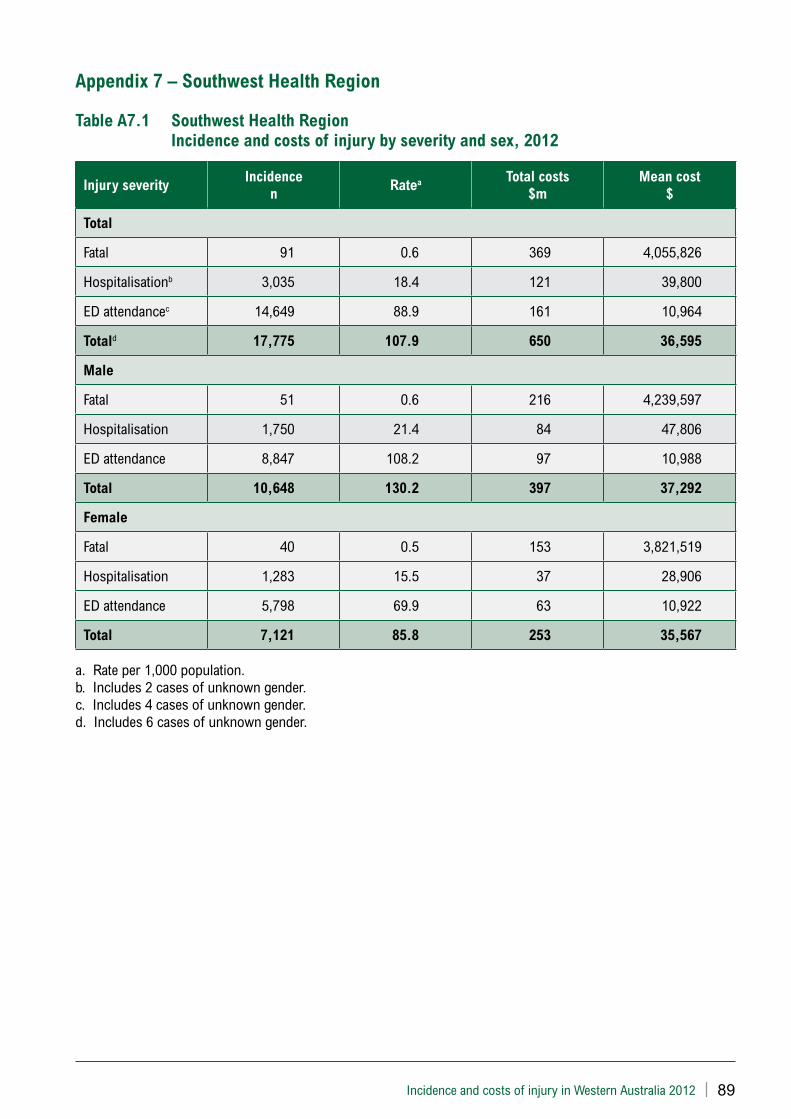
Incidence and costs of injury in Western Australia 2012 | 89
Appendix 7 – Southwest Health Region
Table A7.1 Southwest Health Region Incidence and costs of injury by severity and sex, 2012
Injury severityIncidence
nRatea Total costs
$mMean cost
$
Total
Fatal 91 0.6 369 4,055,826
Hospitalisationb 3,035 18.4 121 39,800
ED attendancec 14,649 88.9 161 10,964
Totald 17,775 107.9 650 36,595
Male
Fatal 51 0.6 216 4,239,597
Hospitalisation 1,750 21.4 84 47,806
ED attendance 8,847 108.2 97 10,988
Total 10,648 130.2 397 37,292
Female
Fatal 40 0.5 153 3,821,519
Hospitalisation 1,283 15.5 37 28,906
ED attendance 5,798 69.9 63 10,922
Total 7,121 85.8 253 35,567
a. Rate per 1,000 population.b. Includes 2 cases of unknown gender.c. Includes 4 cases of unknown gender.d. Includes 6 cases of unknown gender.
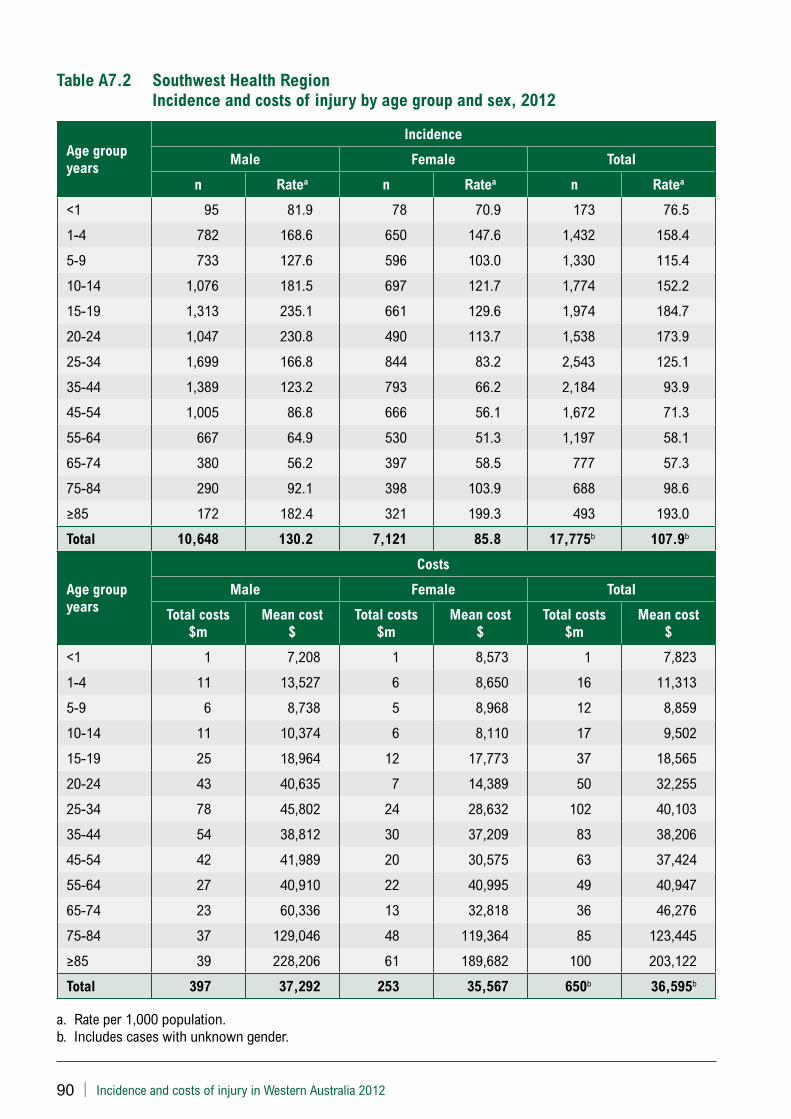
90 | Incidence and costs of injury in Western Australia 2012
Table A7.2 Southwest Health Region Incidence and costs of injury by age group and sex, 2012
Age group years
Incidence
Male Female Total
n Ratea n Ratea n Ratea
<1 95 81.9 78 70.9 173 76.5
1-4 782 168.6 650 147.6 1,432 158.4
5-9 733 127.6 596 103.0 1,330 115.4
10-14 1,076 181.5 697 121.7 1,774 152.2
15-19 1,313 235.1 661 129.6 1,974 184.7
20-24 1,047 230.8 490 113.7 1,538 173.9
25-34 1,699 166.8 844 83.2 2,543 125.1
35-44 1,389 123.2 793 66.2 2,184 93.9
45-54 1,005 86.8 666 56.1 1,672 71.3
55-64 667 64.9 530 51.3 1,197 58.1
65-74 380 56.2 397 58.5 777 57.3
75-84 290 92.1 398 103.9 688 98.6
≥85 172 182.4 321 199.3 493 193.0
Total 10,648 130.2 7,121 85.8 17,775b 107.9b
Age group years
Costs
Male Female Total
Total costs $m
Mean cost $
Total costs $m
Mean cost $
Total costs $m
Mean cost $
<1 1 7,208 1 8,573 1 7,823
1-4 11 13,527 6 8,650 16 11,313
5-9 6 8,738 5 8,968 12 8,859
10-14 11 10,374 6 8,110 17 9,502
15-19 25 18,964 12 17,773 37 18,565
20-24 43 40,635 7 14,389 50 32,255
25-34 78 45,802 24 28,632 102 40,103
35-44 54 38,812 30 37,209 83 38,206
45-54 42 41,989 20 30,575 63 37,424
55-64 27 40,910 22 40,995 49 40,947
65-74 23 60,336 13 32,818 36 46,276
75-84 37 129,046 48 119,364 85 123,445
≥85 39 228,206 61 189,682 100 203,122
Total 397 37,292 253 35,567 650b 36,595b
a. Rate per 1,000 population. b. Includes cases with unknown gender.
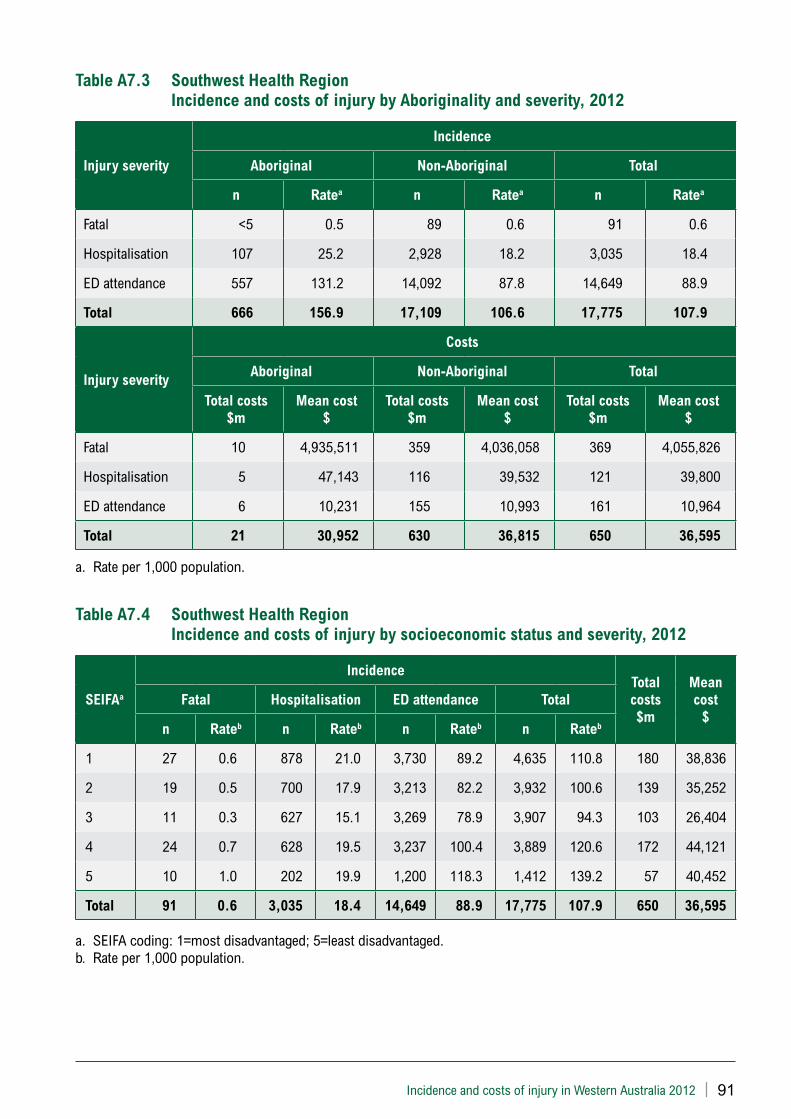
Incidence and costs of injury in Western Australia 2012 | 91
Table A7.3 Southwest Health Region Incidence and costs of injury by Aboriginality and severity, 2012
Injury severity
Incidence
Aboriginal Non-Aboriginal Total
n Ratea n Ratea n Ratea
Fatal <5 0.5 89 0.6 91 0.6
Hospitalisation 107 25.2 2,928 18.2 3,035 18.4
ED attendance 557 131.2 14,092 87.8 14,649 88.9
Total 666 156.9 17,109 106.6 17,775 107.9
Injury severity
Costs
Aboriginal Non-Aboriginal Total
Total costs $m
Mean cost $
Total costs $m
Mean cost $
Total costs $m
Mean cost $
Fatal 10 4,935,511 359 4,036,058 369 4,055,826
Hospitalisation 5 47,143 116 39,532 121 39,800
ED attendance 6 10,231 155 10,993 161 10,964
Total 21 30,952 630 36,815 650 36,595
a. Rate per 1,000 population.
Table A7.4 Southwest Health Region Incidence and costs of injury by socioeconomic status and severity, 2012
SEIFAa
IncidenceTotal costs $m
Mean cost
$Fatal Hospitalisation ED attendance Total
n Rateb n Rateb n Rateb n Rateb
1 27 0.6 878 21.0 3,730 89.2 4,635 110.8 180 38,836
2 19 0.5 700 17.9 3,213 82.2 3,932 100.6 139 35,252
3 11 0.3 627 15.1 3,269 78.9 3,907 94.3 103 26,404
4 24 0.7 628 19.5 3,237 100.4 3,889 120.6 172 44,121
5 10 1.0 202 19.9 1,200 118.3 1,412 139.2 57 40,452
Total 91 0.6 3,035 18.4 14,649 88.9 17,775 107.9 650 36,595
a. SEIFA coding: 1=most disadvantaged; 5=least disadvantaged.b. Rate per 1,000 population.
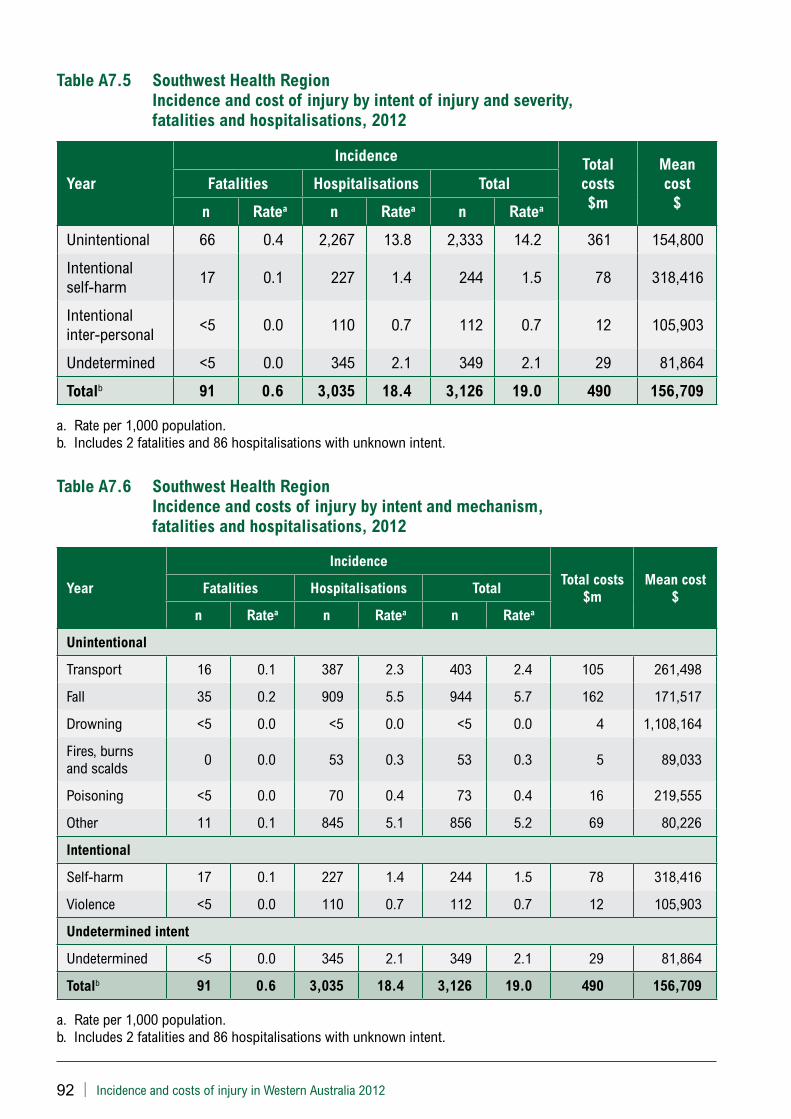
92 | Incidence and costs of injury in Western Australia 2012
Table A7.5 Southwest Health Region Incidence and cost of injury by intent of injury and severity, fatalities and hospitalisations, 2012
Year
Incidence Total costs $m
Mean cost
$Fatalities Hospitalisations Total
n Ratea n Ratea n Ratea
Unintentional 66 0.4 2,267 13.8 2,333 14.2 361 154,800
Intentional self-harm
17 0.1 227 1.4 244 1.5 78 318,416
Intentional inter-personal
<5 0.0 110 0.7 112 0.7 12 105,903
Undetermined <5 0.0 345 2.1 349 2.1 29 81,864
Totalb 91 0.6 3,035 18.4 3,126 19.0 490 156,709
a. Rate per 1,000 population.b. Includes 2 fatalities and 86 hospitalisations with unknown intent.
Table A7.6 Southwest Health Region Incidence and costs of injury by intent and mechanism, fatalities and hospitalisations, 2012
Year
IncidenceTotal costs
$mMean cost
$Fatalities Hospitalisations Total
n Ratea n Ratea n Ratea
Unintentional
Transport 16 0.1 387 2.3 403 2.4 105 261,498
Fall 35 0.2 909 5.5 944 5.7 162 171,517
Drowning <5 0.0 <5 0.0 <5 0.0 4 1,108,164
Fires, burns and scalds 0 0.0 53 0.3 53 0.3 5 89,033
Poisoning <5 0.0 70 0.4 73 0.4 16 219,555
Other 11 0.1 845 5.1 856 5.2 69 80,226
Intentional
Self-harm 17 0.1 227 1.4 244 1.5 78 318,416
Violence <5 0.0 110 0.7 112 0.7 12 105,903
Undetermined intent
Undetermined <5 0.0 345 2.1 349 2.1 29 81,864
Totalb 91 0.6 3,035 18.4 3,126 19.0 490 156,709
a. Rate per 1,000 population. b. Includes 2 fatalities and 86 hospitalisations with unknown intent.
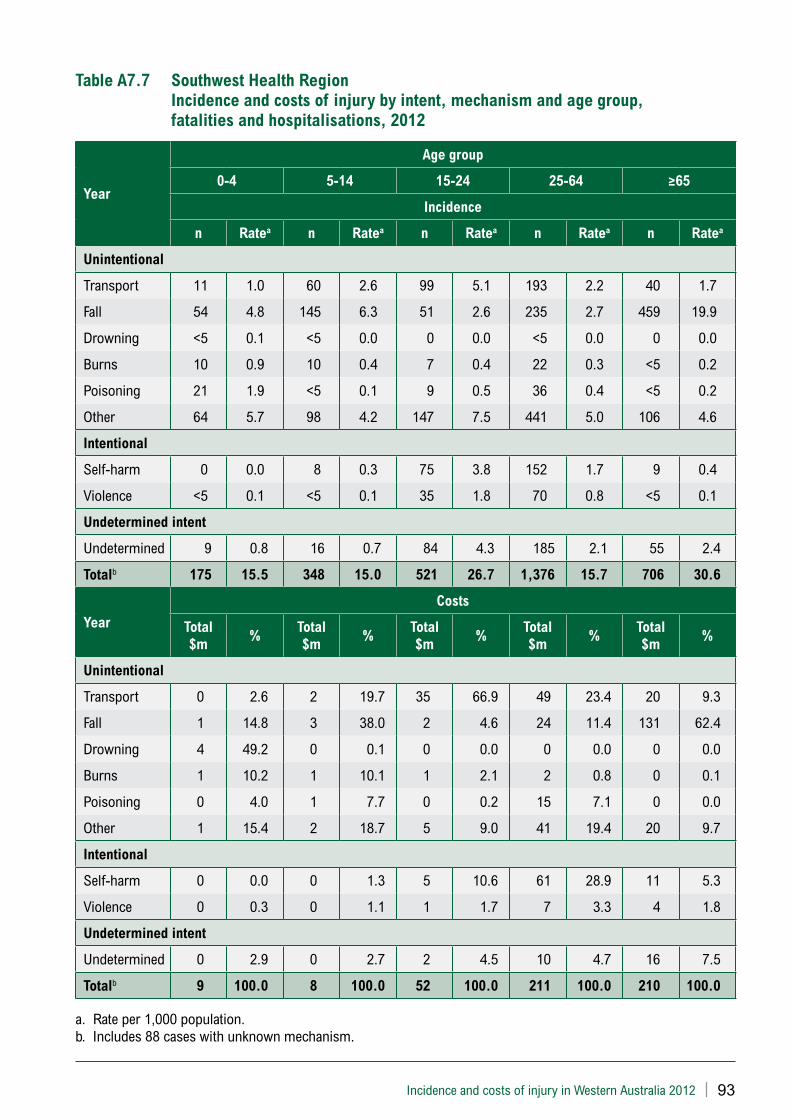
Incidence and costs of injury in Western Australia 2012 | 93
Table A7.7 Southwest Health Region Incidence and costs of injury by intent, mechanism and age group, fatalities and hospitalisations, 2012
Year
Age group
0-4 5-14 15-24 25-64 ≥65
Incidence
n Ratea n Ratea n Ratea n Ratea n Ratea
Unintentional
Transport 11 1.0 60 2.6 99 5.1 193 2.2 40 1.7
Fall 54 4.8 145 6.3 51 2.6 235 2.7 459 19.9
Drowning <5 0.1 <5 0.0 0 0.0 <5 0.0 0 0.0
Burns 10 0.9 10 0.4 7 0.4 22 0.3 <5 0.2
Poisoning 21 1.9 <5 0.1 9 0.5 36 0.4 <5 0.2
Other 64 5.7 98 4.2 147 7.5 441 5.0 106 4.6
Intentional
Self-harm 0 0.0 8 0.3 75 3.8 152 1.7 9 0.4
Violence <5 0.1 <5 0.1 35 1.8 70 0.8 <5 0.1
Undetermined intent
Undetermined 9 0.8 16 0.7 84 4.3 185 2.1 55 2.4
Totalb 175 15.5 348 15.0 521 26.7 1,376 15.7 706 30.6
Year
Costs
Total $m
%Total $m
%Total $m
%Total $m
%Total $m
%
Unintentional
Transport 0 2.6 2 19.7 35 66.9 49 23.4 20 9.3
Fall 1 14.8 3 38.0 2 4.6 24 11.4 131 62.4
Drowning 4 49.2 0 0.1 0 0.0 0 0.0 0 0.0
Burns 1 10.2 1 10.1 1 2.1 2 0.8 0 0.1
Poisoning 0 4.0 1 7.7 0 0.2 15 7.1 0 0.0
Other 1 15.4 2 18.7 5 9.0 41 19.4 20 9.7
Intentional
Self-harm 0 0.0 0 1.3 5 10.6 61 28.9 11 5.3
Violence 0 0.3 0 1.1 1 1.7 7 3.3 4 1.8
Undetermined intent
Undetermined 0 2.9 0 2.7 2 4.5 10 4.7 16 7.5
Totalb 9 100.0 8 100.0 52 100.0 211 100.0 210 100.0
a. Rate per 1,000 population.b. Includes 88 cases with unknown mechanism.
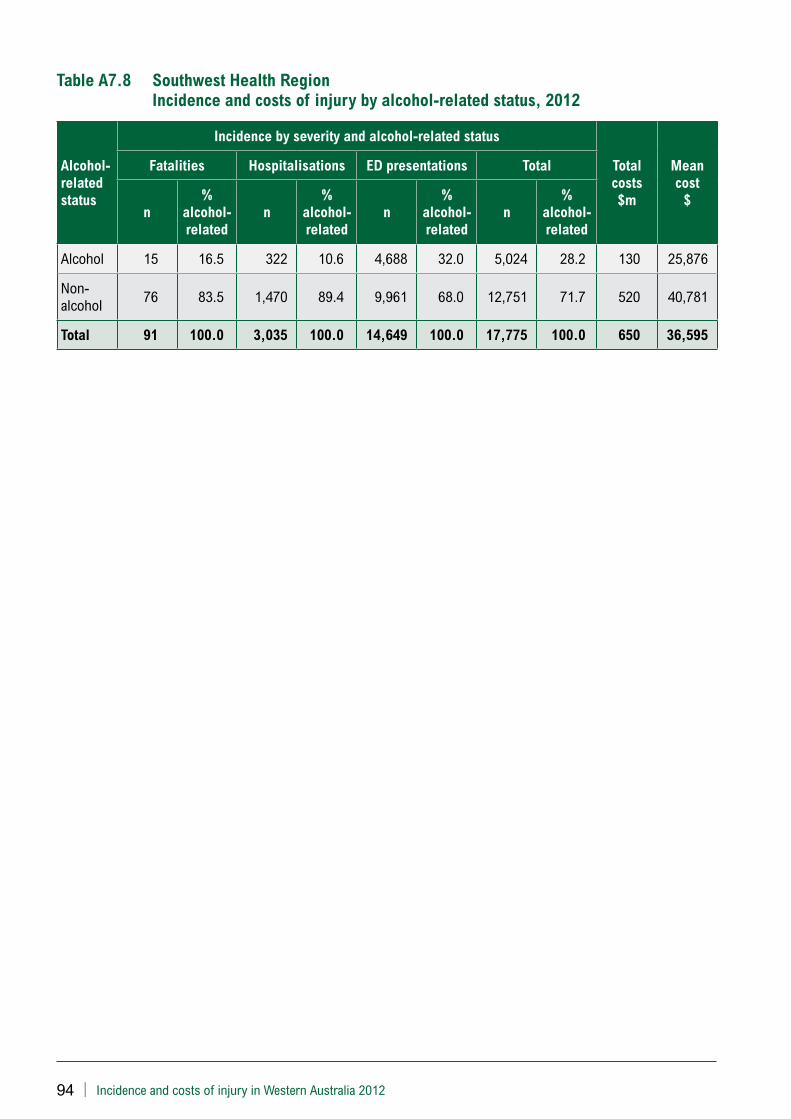
94 | Incidence and costs of injury in Western Australia 2012
Table A7.8 Southwest Health Region Incidence and costs of injury by alcohol-related status, 2012
Alcohol-related status
Incidence by severity and alcohol-related status
Total costs $m
Mean cost
$
Fatalities Hospitalisations ED presentations Total
n%
alcohol-related
n%
alcohol-related
n%
alcohol-related
n%
alcohol-related
Alcohol 15 16.5 322 10.6 4,688 32.0 5,024 28.2 130 25,876
Non-alcohol 76 83.5 1,470 89.4 9,961 68.0 12,751 71.7 520 40,781
Total 91 100.0 3,035 100.0 14,649 100.0 17,775 100.0 650 36,595
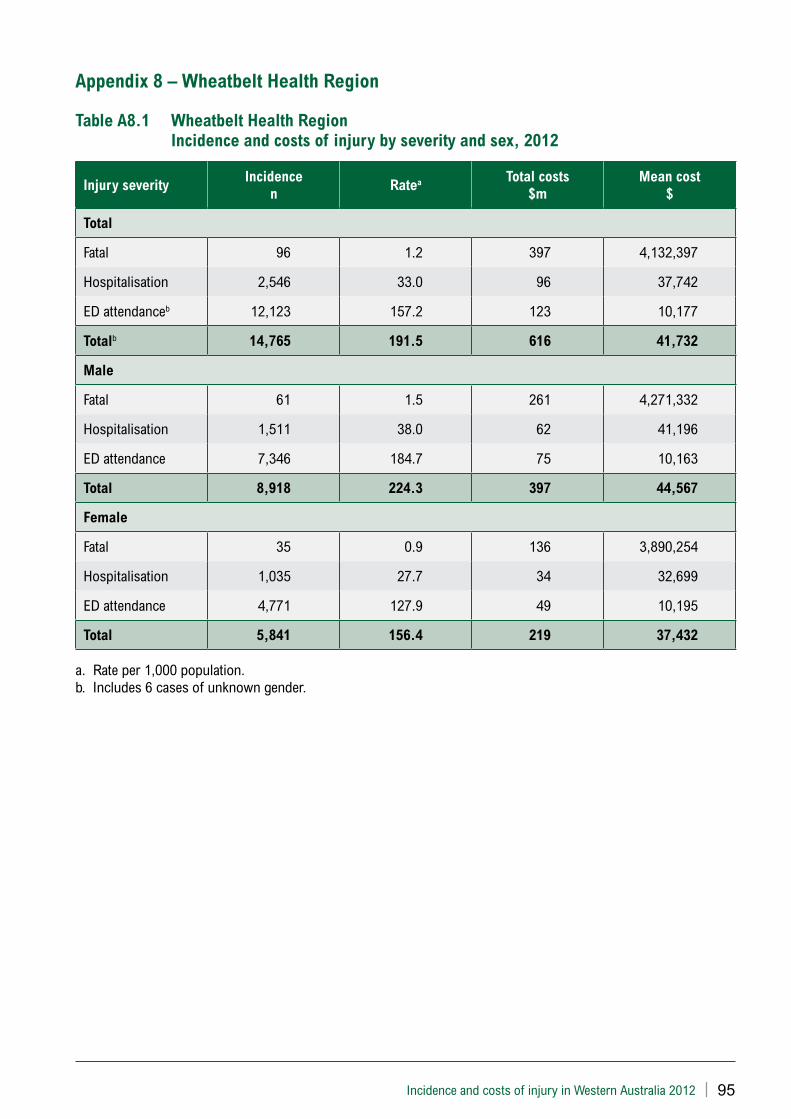
Incidence and costs of injury in Western Australia 2012 | 95
Appendix 8 – Wheatbelt Health Region
Table A8.1 Wheatbelt Health Region Incidence and costs of injury by severity and sex, 2012
Injury severityIncidence
nRatea Total costs
$mMean cost
$
Total
Fatal 96 1.2 397 4,132,397
Hospitalisation 2,546 33.0 96 37,742
ED attendanceb 12,123 157.2 123 10,177
Totalb 14,765 191.5 616 41,732
Male
Fatal 61 1.5 261 4,271,332
Hospitalisation 1,511 38.0 62 41,196
ED attendance 7,346 184.7 75 10,163
Total 8,918 224.3 397 44,567
Female
Fatal 35 0.9 136 3,890,254
Hospitalisation 1,035 27.7 34 32,699
ED attendance 4,771 127.9 49 10,195
Total 5,841 156.4 219 37,432
a. Rate per 1,000 population.b. Includes 6 cases of unknown gender.
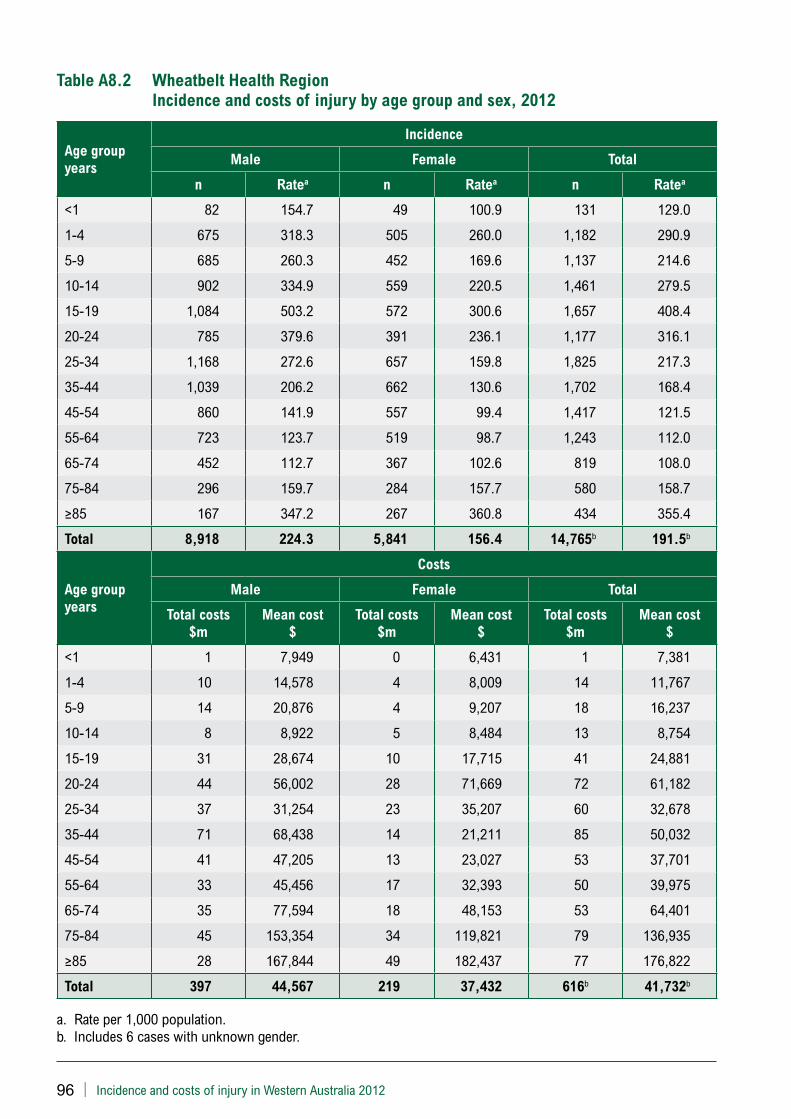
96 | Incidence and costs of injury in Western Australia 2012
Table A8.2 Wheatbelt Health Region Incidence and costs of injury by age group and sex, 2012
Age group years
Incidence
Male Female Total
n Ratea n Ratea n Ratea
<1 82 154.7 49 100.9 131 129.0
1-4 675 318.3 505 260.0 1,182 290.9
5-9 685 260.3 452 169.6 1,137 214.6
10-14 902 334.9 559 220.5 1,461 279.5
15-19 1,084 503.2 572 300.6 1,657 408.4
20-24 785 379.6 391 236.1 1,177 316.1
25-34 1,168 272.6 657 159.8 1,825 217.3
35-44 1,039 206.2 662 130.6 1,702 168.4
45-54 860 141.9 557 99.4 1,417 121.5
55-64 723 123.7 519 98.7 1,243 112.0
65-74 452 112.7 367 102.6 819 108.0
75-84 296 159.7 284 157.7 580 158.7
≥85 167 347.2 267 360.8 434 355.4
Total 8,918 224.3 5,841 156.4 14,765b 191.5b
Age group years
Costs
Male Female Total
Total costs $m
Mean cost $
Total costs $m
Mean cost $
Total costs $m
Mean cost $
<1 1 7,949 0 6,431 1 7,381
1-4 10 14,578 4 8,009 14 11,767
5-9 14 20,876 4 9,207 18 16,237
10-14 8 8,922 5 8,484 13 8,754
15-19 31 28,674 10 17,715 41 24,881
20-24 44 56,002 28 71,669 72 61,182
25-34 37 31,254 23 35,207 60 32,678
35-44 71 68,438 14 21,211 85 50,032
45-54 41 47,205 13 23,027 53 37,701
55-64 33 45,456 17 32,393 50 39,975
65-74 35 77,594 18 48,153 53 64,401
75-84 45 153,354 34 119,821 79 136,935
≥85 28 167,844 49 182,437 77 176,822
Total 397 44,567 219 37,432 616b 41,732b
a. Rate per 1,000 population.b. Includes 6 cases with unknown gender.
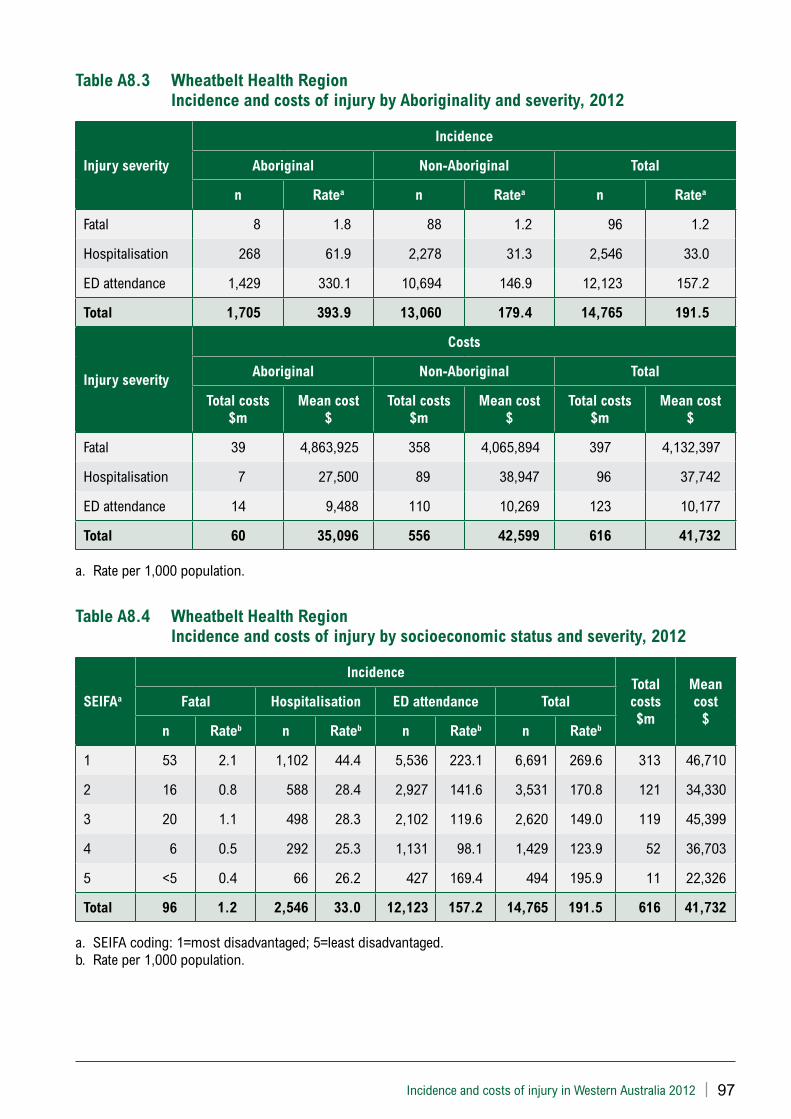
Incidence and costs of injury in Western Australia 2012 | 97
Table A8.3 Wheatbelt Health Region Incidence and costs of injury by Aboriginality and severity, 2012
Injury severity
Incidence
Aboriginal Non-Aboriginal Total
n Ratea n Ratea n Ratea
Fatal 8 1.8 88 1.2 96 1.2
Hospitalisation 268 61.9 2,278 31.3 2,546 33.0
ED attendance 1,429 330.1 10,694 146.9 12,123 157.2
Total 1,705 393.9 13,060 179.4 14,765 191.5
Injury severity
Costs
Aboriginal Non-Aboriginal Total
Total costs $m
Mean cost $
Total costs $m
Mean cost $
Total costs $m
Mean cost $
Fatal 39 4,863,925 358 4,065,894 397 4,132,397
Hospitalisation 7 27,500 89 38,947 96 37,742
ED attendance 14 9,488 110 10,269 123 10,177
Total 60 35,096 556 42,599 616 41,732
a. Rate per 1,000 population.
Table A8.4 Wheatbelt Health Region Incidence and costs of injury by socioeconomic status and severity, 2012
SEIFAa
IncidenceTotal costs $m
Mean cost
$Fatal Hospitalisation ED attendance Total
n Rateb n Rateb n Rateb n Rateb
1 53 2.1 1,102 44.4 5,536 223.1 6,691 269.6 313 46,710
2 16 0.8 588 28.4 2,927 141.6 3,531 170.8 121 34,330
3 20 1.1 498 28.3 2,102 119.6 2,620 149.0 119 45,399
4 6 0.5 292 25.3 1,131 98.1 1,429 123.9 52 36,703
5 <5 0.4 66 26.2 427 169.4 494 195.9 11 22,326
Total 96 1.2 2,546 33.0 12,123 157.2 14,765 191.5 616 41,732
a. SEIFA coding: 1=most disadvantaged; 5=least disadvantaged.b. Rate per 1,000 population.
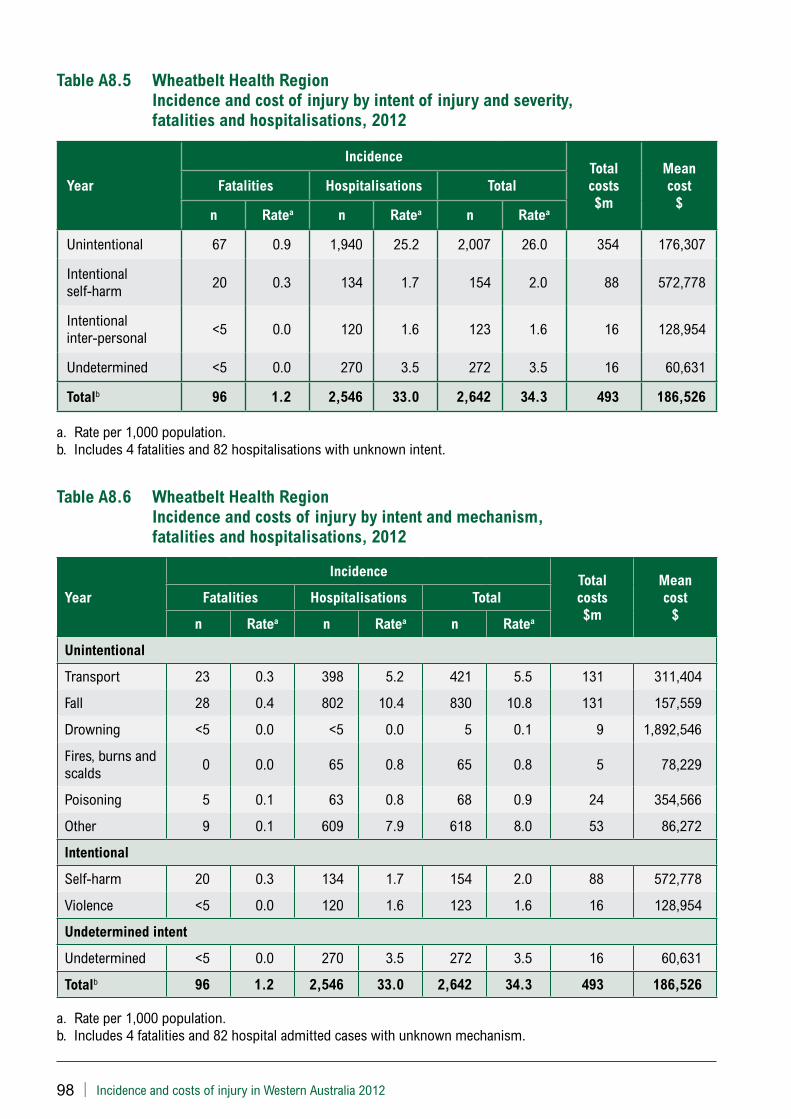
98 | Incidence and costs of injury in Western Australia 2012
Table A8.5 Wheatbelt Health Region Incidence and cost of injury by intent of injury and severity, fatalities and hospitalisations, 2012
Year
IncidenceTotal costs $m
Mean cost
$Fatalities Hospitalisations Total
n Ratea n Ratea n Ratea
Unintentional 67 0.9 1,940 25.2 2,007 26.0 354 176,307
Intentional self-harm 20 0.3 134 1.7 154 2.0 88 572,778
Intentional inter-personal <5 0.0 120 1.6 123 1.6 16 128,954
Undetermined <5 0.0 270 3.5 272 3.5 16 60,631
Totalb 96 1.2 2,546 33.0 2,642 34.3 493 186,526
a. Rate per 1,000 population.b. Includes 4 fatalities and 82 hospitalisations with unknown intent.
Table A8.6 Wheatbelt Health Region Incidence and costs of injury by intent and mechanism, fatalities and hospitalisations, 2012
Year
IncidenceTotal costs $m
Mean cost
$Fatalities Hospitalisations Total
n Ratea n Ratea n Ratea
Unintentional
Transport 23 0.3 398 5.2 421 5.5 131 311,404
Fall 28 0.4 802 10.4 830 10.8 131 157,559
Drowning <5 0.0 <5 0.0 5 0.1 9 1,892,546
Fires, burns and scalds 0 0.0 65 0.8 65 0.8 5 78,229
Poisoning 5 0.1 63 0.8 68 0.9 24 354,566
Other 9 0.1 609 7.9 618 8.0 53 86,272
Intentional
Self-harm 20 0.3 134 1.7 154 2.0 88 572,778
Violence <5 0.0 120 1.6 123 1.6 16 128,954
Undetermined intent
Undetermined <5 0.0 270 3.5 272 3.5 16 60,631
Totalb 96 1.2 2,546 33.0 2,642 34.3 493 186,526
a. Rate per 1,000 population.b. Includes 4 fatalities and 82 hospital admitted cases with unknown mechanism.

Incidence and costs of injury in Western Australia 2012 | 99
Table A8.7 Wheatbelt Health Region Incidence and costs of injury by intent, mechanism and age group, fatalities and hospitalisations, 2012
Year
Age group
0-4 5-14 15-24 25-64 ≥65
Incidence
n Ratea n Ratea n Ratea n Ratea n Ratea
Unintentional
Transport 9 1.8 42 4.0 128 16.5 212 5.1 30 2.4
Fall 44 8.7 115 10.9 47 6.0 218 5.3 406 32.6
Drowning <5 0.6 <5 0.1 0 0.0 <5 0.0 0 0.0
Burns 14 2.8 12 1.1 14 1.8 23 0.6 <5 0.2
Poisoning 16 3.2 <5 0.2 <5 0.5 34 0.8 12 1.0
Other 32 6.3 73 6.9 105 13.5 301 7.3 107 8.6
Intentional
Self-harm 0 0.0 <5 0.2 45 5.8 96 2.3 11 0.9
Violence <5 0.2 <5 0.2 27 3.5 91 2.2 <5 0.2
Undetermined intent
Undetermined 7 1.4 18 1.7 39 5.0 173 4.2 35 2.8
Totalb 129 25.4 270 25.7 419 53.8 1,184 28.7 640 51.4
Year
Costs
Total $m
%Total $m
%Total $m
%Total $m
%Total $m
%
Unintentional
Transport 4 58.3 1 7.4 49 55.7 65 35.5 12 5.9
Fall 1 12.3 3 17.3 2 2.1 16 8.7 110 54.9
Drowning 0 0.2 5 28.2 0 0.0 5 2.7 0 0.0
Burns 1 15.1 1 5.9 1 1.4 2 0.9 0 0.0
Poisoning 0 4.0 0 0.1 0 0.1 24 12.9 0 0.1
Other 1 8.2 6 37.8 5 5.5 13 7.2 29 14.4
Intentional
Self-harm 0 0.0 0 0.1 24 27.6 38 20.9 26 13.0
Violence 0 0.1 0 0.1 1 0.8 11 6.3 4 1.9
Undetermined intent
Undetermined 0 1.5 0 2.9 6 6.6 6 3.1 4 2.2
Totalb 8 100 16 100 87 100 182 100 199 100
a. Rate per 1,000 population.b. Includes 86 cases with unknown mechanism.
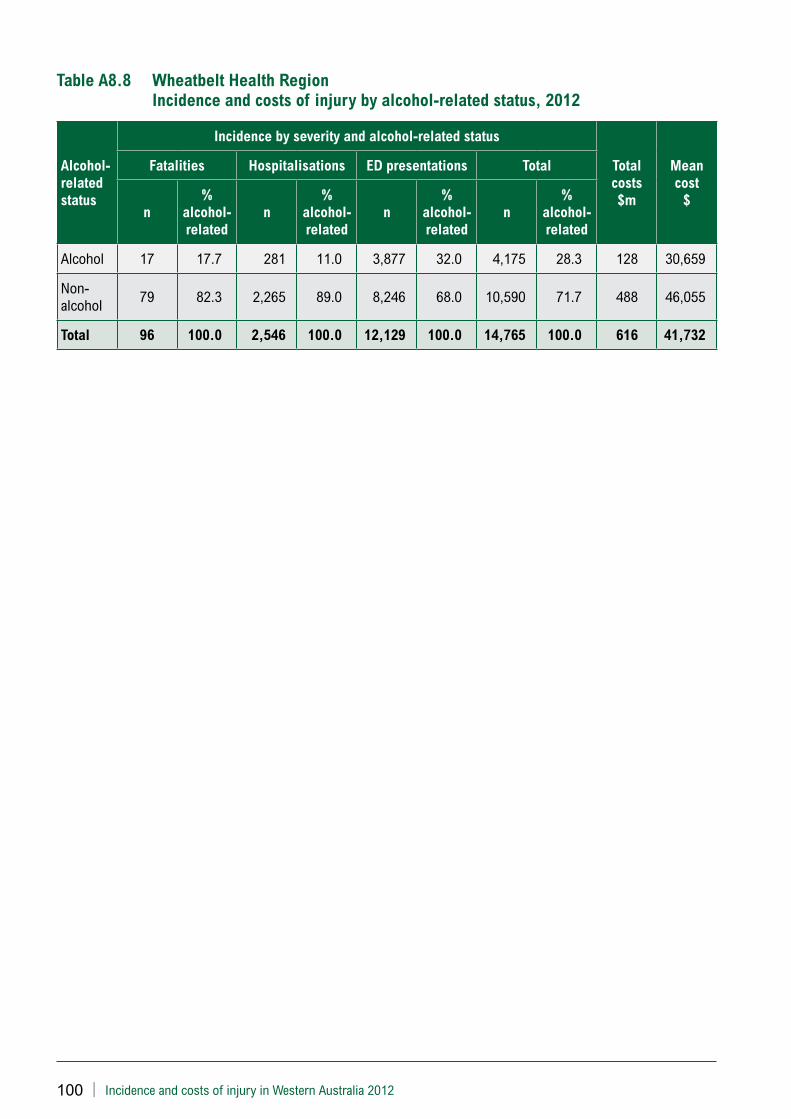
100 | Incidence and costs of injury in Western Australia 2012
Table A8.8 Wheatbelt Health Region Incidence and costs of injury by alcohol-related status, 2012
Alcohol-related status
Incidence by severity and alcohol-related status
Total costs $m
Mean cost
$
Fatalities Hospitalisations ED presentations Total
n%
alcohol-related
n%
alcohol-related
n%
alcohol-related
n%
alcohol-related
Alcohol 17 17.7 281 11.0 3,877 32.0 4,175 28.3 128 30,659
Non-alcohol 79 82.3 2,265 89.0 8,246 68.0 10,590 71.7 488 46,055
Total 96 100.0 2,546 100.0 12,129 100.0 14,765 100.0 616 41,732

Incidence and costs of injury in Western Australia 2012 | 101
Appendix 9 – Pilbara Health Region
Table A9.1 Pilbara Health Region Incidence and costs of injury by severity and sex, 2012
Injury severityIncidence
nRatea Total costs
$mMean cost
$
Total
Fatal 29 0.5 133 4,593,784
Hospitalisation 1,228 19.1 51 41,435
ED attendanceb 6,299 98.2 66 10,409
Totalb 7,556 117.8 250 33,042
Male
Fatal 19 0.5 91 4,779,632
Hospitalisation 760 19.0 35 46,064
ED attendance 3,842 96.3 40 10,367
Total 4,621 115.8 166 35,848
Female
Fatal 10 0.4 42 4,240,674
Hospitalisation 468 19.3 16 33,918
ED attendance 2,452 101.1 26 10,472
Total 2,930 120.8 84 28,655
a. Rate per 1,000 population.b. Includes 5 cases of unknown gender.
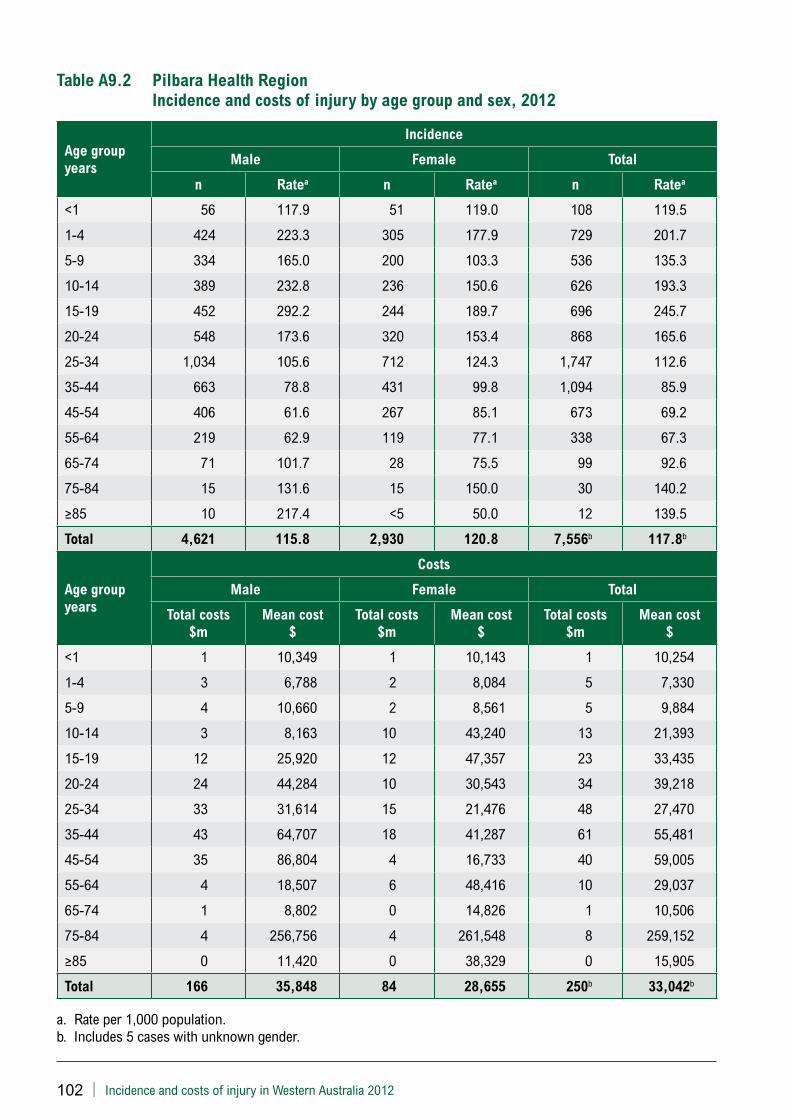
102 | Incidence and costs of injury in Western Australia 2012
Table A9.2 Pilbara Health Region Incidence and costs of injury by age group and sex, 2012
Age group years
Incidence
Male Female Total
n Ratea n Ratea n Ratea
<1 56 117.9 51 119.0 108 119.5
1-4 424 223.3 305 177.9 729 201.7
5-9 334 165.0 200 103.3 536 135.3
10-14 389 232.8 236 150.6 626 193.3
15-19 452 292.2 244 189.7 696 245.7
20-24 548 173.6 320 153.4 868 165.6
25-34 1,034 105.6 712 124.3 1,747 112.6
35-44 663 78.8 431 99.8 1,094 85.9
45-54 406 61.6 267 85.1 673 69.2
55-64 219 62.9 119 77.1 338 67.3
65-74 71 101.7 28 75.5 99 92.6
75-84 15 131.6 15 150.0 30 140.2
≥85 10 217.4 <5 50.0 12 139.5
Total 4,621 115.8 2,930 120.8 7,556b 117.8b
Age group years
Costs
Male Female Total
Total costs $m
Mean cost $
Total costs $m
Mean cost $
Total costs $m
Mean cost $
<1 1 10,349 1 10,143 1 10,254
1-4 3 6,788 2 8,084 5 7,330
5-9 4 10,660 2 8,561 5 9,884
10-14 3 8,163 10 43,240 13 21,393
15-19 12 25,920 12 47,357 23 33,435
20-24 24 44,284 10 30,543 34 39,218
25-34 33 31,614 15 21,476 48 27,470
35-44 43 64,707 18 41,287 61 55,481
45-54 35 86,804 4 16,733 40 59,005
55-64 4 18,507 6 48,416 10 29,037
65-74 1 8,802 0 14,826 1 10,506
75-84 4 256,756 4 261,548 8 259,152
≥85 0 11,420 0 38,329 0 15,905
Total 166 35,848 84 28,655 250b 33,042b
a. Rate per 1,000 population. b. Includes 5 cases with unknown gender.
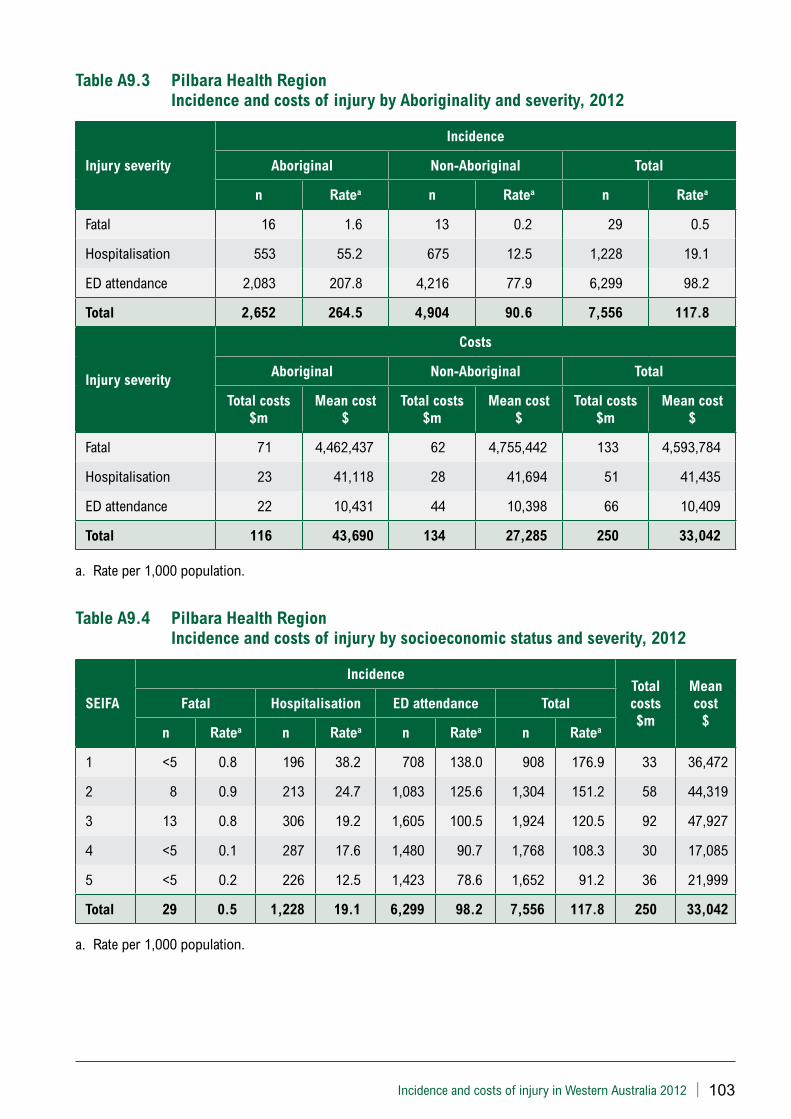
Incidence and costs of injury in Western Australia 2012 | 103
Table A9.3 Pilbara Health Region Incidence and costs of injury by Aboriginality and severity, 2012
Injury severity
Incidence
Aboriginal Non-Aboriginal Total
n Ratea n Ratea n Ratea
Fatal 16 1.6 13 0.2 29 0.5
Hospitalisation 553 55.2 675 12.5 1,228 19.1
ED attendance 2,083 207.8 4,216 77.9 6,299 98.2
Total 2,652 264.5 4,904 90.6 7,556 117.8
Injury severity
Costs
Aboriginal Non-Aboriginal Total
Total costs $m
Mean cost $
Total costs $m
Mean cost $
Total costs $m
Mean cost $
Fatal 71 4,462,437 62 4,755,442 133 4,593,784
Hospitalisation 23 41,118 28 41,694 51 41,435
ED attendance 22 10,431 44 10,398 66 10,409
Total 116 43,690 134 27,285 250 33,042
a. Rate per 1,000 population.
Table A9.4 Pilbara Health Region Incidence and costs of injury by socioeconomic status and severity, 2012
SEIFA
IncidenceTotal costs $m
Mean cost
$Fatal Hospitalisation ED attendance Total
n Ratea n Ratea n Ratea n Ratea
1 <5 0.8 196 38.2 708 138.0 908 176.9 33 36,472
2 8 0.9 213 24.7 1,083 125.6 1,304 151.2 58 44,319
3 13 0.8 306 19.2 1,605 100.5 1,924 120.5 92 47,927
4 <5 0.1 287 17.6 1,480 90.7 1,768 108.3 30 17,085
5 <5 0.2 226 12.5 1,423 78.6 1,652 91.2 36 21,999
Total 29 0.5 1,228 19.1 6,299 98.2 7,556 117.8 250 33,042
a. Rate per 1,000 population.
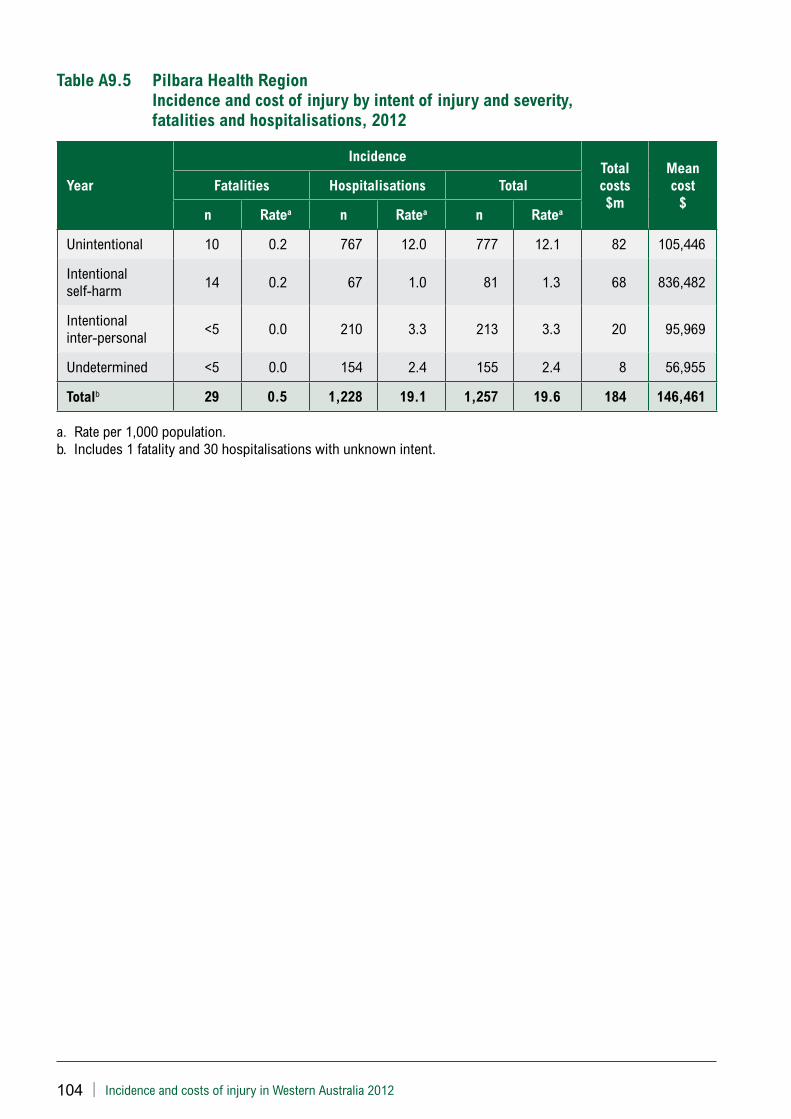
104 | Incidence and costs of injury in Western Australia 2012
Table A9.5 Pilbara Health Region Incidence and cost of injury by intent of injury and severity, fatalities and hospitalisations, 2012
Year
IncidenceTotal costs $m
Mean cost
$Fatalities Hospitalisations Total
n Ratea n Ratea n Ratea
Unintentional 10 0.2 767 12.0 777 12.1 82 105,446
Intentional self-harm 14 0.2 67 1.0 81 1.3 68 836,482
Intentional inter-personal <5 0.0 210 3.3 213 3.3 20 95,969
Undetermined <5 0.0 154 2.4 155 2.4 8 56,955
Totalb 29 0.5 1,228 19.1 1,257 19.6 184 146,461
a. Rate per 1,000 population.b. Includes 1 fatality and 30 hospitalisations with unknown intent.
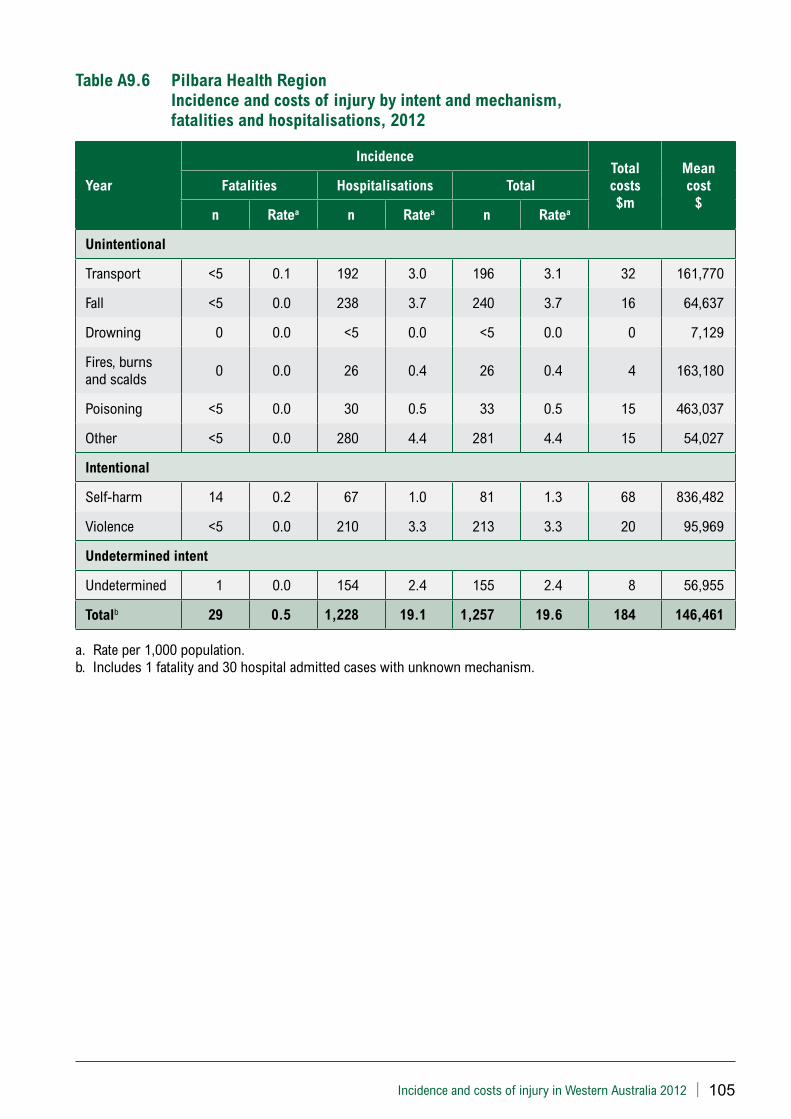
Incidence and costs of injury in Western Australia 2012 | 105
Table A9.6 Pilbara Health Region Incidence and costs of injury by intent and mechanism, fatalities and hospitalisations, 2012
Year
IncidenceTotal costs $m
Mean cost
$Fatalities Hospitalisations Total
n Ratea n Ratea n Ratea
Unintentional
Transport <5 0.1 192 3.0 196 3.1 32 161,770
Fall <5 0.0 238 3.7 240 3.7 16 64,637
Drowning 0 0.0 <5 0.0 <5 0.0 0 7,129
Fires, burns and scalds 0 0.0 26 0.4 26 0.4 4 163,180
Poisoning <5 0.0 30 0.5 33 0.5 15 463,037
Other <5 0.0 280 4.4 281 4.4 15 54,027
Intentional
Self-harm 14 0.2 67 1.0 81 1.3 68 836,482
Violence <5 0.0 210 3.3 213 3.3 20 95,969
Undetermined intent
Undetermined 1 0.0 154 2.4 155 2.4 8 56,955
Totalb 29 0.5 1,228 19.1 1,257 19.6 184 146,461
a. Rate per 1,000 population. b. Includes 1 fatality and 30 hospital admitted cases with unknown mechanism.
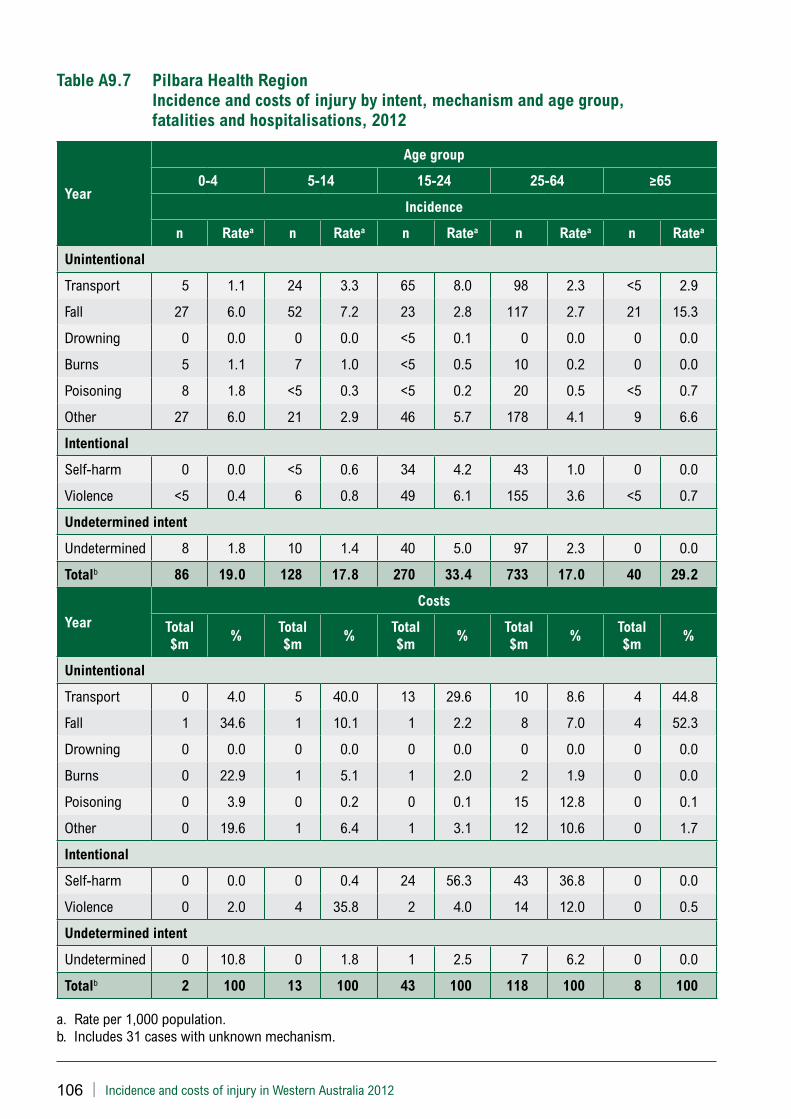
106 | Incidence and costs of injury in Western Australia 2012
Table A9.7 Pilbara Health Region Incidence and costs of injury by intent, mechanism and age group, fatalities and hospitalisations, 2012
Year
Age group
0-4 5-14 15-24 25-64 ≥65
Incidence
n Ratea n Ratea n Ratea n Ratea n Ratea
Unintentional
Transport 5 1.1 24 3.3 65 8.0 98 2.3 <5 2.9
Fall 27 6.0 52 7.2 23 2.8 117 2.7 21 15.3
Drowning 0 0.0 0 0.0 <5 0.1 0 0.0 0 0.0
Burns 5 1.1 7 1.0 <5 0.5 10 0.2 0 0.0
Poisoning 8 1.8 <5 0.3 <5 0.2 20 0.5 <5 0.7
Other 27 6.0 21 2.9 46 5.7 178 4.1 9 6.6
Intentional
Self-harm 0 0.0 <5 0.6 34 4.2 43 1.0 0 0.0
Violence <5 0.4 6 0.8 49 6.1 155 3.6 <5 0.7
Undetermined intent
Undetermined 8 1.8 10 1.4 40 5.0 97 2.3 0 0.0
Totalb 86 19.0 128 17.8 270 33.4 733 17.0 40 29.2
Year
Costs
Total $m
%Total $m
%Total $m
%Total $m
%Total $m
%
Unintentional
Transport 0 4.0 5 40.0 13 29.6 10 8.6 4 44.8
Fall 1 34.6 1 10.1 1 2.2 8 7.0 4 52.3
Drowning 0 0.0 0 0.0 0 0.0 0 0.0 0 0.0
Burns 0 22.9 1 5.1 1 2.0 2 1.9 0 0.0
Poisoning 0 3.9 0 0.2 0 0.1 15 12.8 0 0.1
Other 0 19.6 1 6.4 1 3.1 12 10.6 0 1.7
Intentional
Self-harm 0 0.0 0 0.4 24 56.3 43 36.8 0 0.0
Violence 0 2.0 4 35.8 2 4.0 14 12.0 0 0.5
Undetermined intent
Undetermined 0 10.8 0 1.8 1 2.5 7 6.2 0 0.0
Totalb 2 100 13 100 43 100 118 100 8 100
a. Rate per 1,000 population.b. Includes 31 cases with unknown mechanism.

Incidence and costs of injury in Western Australia 2012 | 107
Table A9.8 Pilbara Health Region Incidence and costs of injury by alcohol-related status, 2012
Alcohol-related status
Incidence by severity and alcohol-related status
Total costs $m
Mean cost
$
Fatalities Hospitalisations ED presentations Total
n%
alcohol-related
n%
alcohol-related
n%
alcohol-related
n%
alcohol-related
Alcohol 5 17.2 203 16.5 2,014 32.0 2,222 29.4 55 24,752
Non-alcohol 24 82.8 1,025 83.5 4,285 68.0 5,334 70.6 195 36,558
Total 29 100.0 1,228 100.0 6,299 100.0 7,556 100.0 250 33,042

108 | Incidence and costs of injury in Western Australia 2012
This page has been left blank intentionally.

Produced by Chronic Disease Prevention Directorate© Department of Health 2016
Copyright to this material is vested in the State of Western Australia unless otherwise indicated. Apart from any fair dealing for the purposes of private study, research, criticism or review, as permitted under the provisions of the Copyright Act 1968, no part may be reproduced or re-used for any purposes whatsoever without written permission of the State of Western Australia.
CD
P-0
1323
5 N
OV
’16
This document can be made available in alternative formats on request for a person with disability.
health.wa.gov.au