Embed Size (px)
DESCRIPTION
Report on the 2009 General Household Report
Citation preview
Report on the 2009 General Household Report:
Focus on Schooling
Published by the Department of Basic Education
222 Struben Street
Private Bag X895, Pretoria, 0001
Telephone: 012 357 3000 Fax: 012 323 0601
Website: http://www.education.gov.za
ISBN: 978-1-4315-0391-9
© Department of Basic Education, 2011
III
CONTENTS
1. INTRODUCTION 1
1.1 BACKGROUND TO THE GENERAL HOUSEHOLD SURVEY 1
1.2 DATA REVISIONS 2
1.3 CAUTION ON METHOD AND POPULATION DATA 2
2. ATTENDANCE AT EDUCATION INSTITUTIONS 2
2.1 EARLY CHILDHOOD DEVELOPMENT 2
2.2 ATTENDANCE OF 0 TO 4 YEAR OLD CHILDREN AT EDUCATION INSTITUTIONS 2
2.3 PARTICIPATION OF 5 YEAR OLDS IN EDUCATION 4
2.4 ATTENDANCE OF 6 YEAR OLD CHILDREN AT EDUCATION INSTITUTIONS 6
2.5 PARTICIPATION IN EDUCATION BY AGE GROUPS 7 2.5.1 Participation of 7 to 15 year old children in education 7 2.5.2 Gender parity in education access for 7 to 15 year old children 8 2.5.3 Attendance at education institutions by 16 to 18 year olds 8
3. DISTRIBUTION OF LEARNERS IN PUBLIC AND INDEPENDENT SCHOOLS 10
4. OUT OF SCHOOL (OOS) CHILDREN 11
5. YOUTH NOT ATTENDING EDUCATION INSTITUTIONS 12
6. REASONS FOR NON-ATTENDANCE AT EDUCATION INSTITUTIONS 13
7. PROBLEMS EXPERIENCED AT SCHOOLS 15
8. MEANS OF TRANSPORT 16
9. SCHOOL VIOLENCE 17
10. LEARNER PREGNANCY 18
11. TUITION FEES 19
12. SCHOOL NUTRITION PROGRAMME (SCHOOL FEEDING SCHEME) 21
13. LEARNER ABSENTEEISM 22
14. PERCENTAGE OF REPEATERS 24
15. DISABILITY 25
15.1 CHILDREN IN SCHOOLS THAT HAVE A DISABILITY: 2002-2009 25
15.2 PERCENTAGE OF 7 TO 15 YEAR OLD CHILDREN WITH A DISABILITY, WHO ATTEND
EDUCATIONAL INSTITUTIONS 25
15.3 PERCENTAGE OF 16 TO 18 YEAR-OLDS, WITH A DISABILITY, WHO ATTEND
EDUCATIONAL INSTITUTIONS 26
16. ORPHANS IN THE SCHOOLING SYSTEM 27
17. SOCIAL ASSISTANCE 27
18. LEVEL OF EDUCATION ATTAINMENT 28
18.1 COMPLETION OF GRADE 12 28
18.2 COMPLETION OF GRADE 9 29
19. LITERACY RATES 30
19.1 ADULT LITERACY 30
19.2 LITERACY BY POPULATION GROUP 32
19.3 YOUTH LITERACY RATE 32
20. CONCLUSION 33
BIBLIOGRAPHY 35
IV
LIST OF TABLES Table 1: Percentage of 0 to 4 year old children attending education institutions by gender, 2002-2009 3
Table 2: Percentage of 0 to 4 years old children attending education institutions by province, 2002-2009 4
Table 4: Percentage of 5 year old children attending education institutions by province, 2002-2009 6
Table 5: GPI of 5 year olds attending education institutions, 2002-2009 6
Table 6: Percentage of 6 year old children attending education institution by province, 2002-2009 7
Table 7: Percentage of 7 to 15 years old children attending Education Institutions, 2002-2009 7
Table 8: Percentage of 7 to 15 year old children attending education institutions by gender, 2002-2009 8
Table 9: Percentage of 7 to 15 years old children attending education institutions by population group, 2002-2009
8
Table 10: GPI of 7 to 15 year olds, 2002-2009 9
Table 11: Percentage of 16 to 18 year old children attending Education Institutions, 2002-2009 9
Table 12: Percentage of 16 to 18 year old children attending education institutions by gender, 2002-2009 10
Table 13: Percentage of 16 to 18 years old children attending education institutions by population group, 2002-2009
11
Table 14: Percentage learners attending either public or independent schools by province, 2009 11
Table 15: Percentage of 7 to 15 years old children out of school by gender, 2002-2009 12
Table 16: Percentage of 7 to 15 year old out of school children by population group, 2002-2009 12
Table 17: Percentage of 16 to 18 years old youth not attending education institutions by gender, 2002-2009
13
Table 18: Percentage of 16 to 18 years old children out of school by population group, 2002-2009 14
Table 19: reasons for 7 to 18 year old children not attending education institutions, 2002-2009 16
Table 20: Problems experienced at schools, 2002-2009 21
Table 21: Annual tuition fees paid by children attending schools, 2002-2009 24
Table 22: Percentage of Repeaters by Grade and gender, 2009 31
Table 23: Number and proportion of the population aged 20 and over by level of education, 2002-2009 32
Table 24: Adult literacy rates by population group, 2009 33
LIST OF FIGURESFigure 1: Percentage of 0 to 4 years old children attending education institutions, 2002-2009 3
Figure 2: Percentage of 5 year old children attending education institution, 2002-2009 5
Figure 3: Percentage of learners attending either public or independent schools, 2009 10
Figure 4: Reason for not attending education institutions, 2009 14
Figure 5: Problems experienced at schools, 2009 15
Figure 6: Mode of transport to school, 2009 16
Figure 7: Time taken by learners to school, 2009 17
Figure 8: % of children attending school that have experienced violence, 2009 17
Figure 9: Number of learners attending school who fell pregnant between July 2008 and July 2009 18
Figure 10: Status of pregnancy of learners who had fallen pregnant in the past twelve months, 2009 19
Figure 11: Total amount of tuition fees paid by learners attending schools, 2009 20
V
LIST OF FIGURESFigure 12: Reason for non-payment of school fees, 2009 20
Figure 13: % of children attending school benefiting from school feeding scheme, 2009 22
Figure 14: Absenteeism by gender, 2009 22
Figure 15: percentage of learners absent from schools, 2009 23
Figure 16: Main reason for learners being absent from school, 2009 23
Figure 17: Percentage of children attending schools that are disabled (irrespective of age) that are disabled, 2002-2009
25
Figure 18: Percentage of 7 to 15 year-old children with disabilities, attending educational institutions, 2002 – 2009
26
Figure 19: Percentage of 16 to 18 year old children suffering from disabilities, attending educational institutions, 2002 – 2009
26
Figure 20: Percentage of children who are orphans attending school, 2002 – 2009 27
Figure 21: Percentage of 7 to 15 year old children benefiting from social grants, by school attendance, 2009
28
Figure 22: Percentage of adults who have completed Grade 7 and above by province, 2009 28
Figure 23: Percentage of adults 20 years and above who completed Grade 7 and above, 2002-2009 29
Figure 24: Literacy Rates of 15 to 24 years old, 2002-2009 29
Figure 25: Percentage of adults (persons aged 20 years and above) who have completed Grade 12 and above by Province, 2002-2009
30
Figure 26: Percentage of adults 20 years and above who have completed Grade 12 and above by province, 2009
31
Figure 27: Percentage of adults 20 years and above who completed Grade 9 and above, 2002-2009 32
Figure 28: Percentage of adults 20 years and above who completed Grade 9 and above by province, 2009 33
ACRONYMSDBE Department of Basic Education
DoE Department of Education
EC Eastern Cape
ECD Early Childhood Development
FS Free State
GHS General Household Survey
GP Gauteng
GPI Gender Parity Index
KZN KwaZulu-Natal
LP Limpopo
MP Mpumalanga
NC Northern Cape
NW North-West
OOS Out of School
STATS SA Statistics South Africa
WC Western Cape
1
Report on the 2009 General Household Survey: Focus on Schooling
1. INTRODUCTION
This report presents key findings on school-associated matters as obtained from the General Household Survey
(GHS) which is conducted annually by Statistics South Africa. The report covers the period 2002-2009.
The report examines, among others, attendance at education institutions as well as levels of education attainment
in the population. The report has been developed for use by government departments, researchers and the public
in general. It is hoped that the report will be utilised as one of many information sources for planning, reporting,
accountability and decision-making, as well as provide a platform for further research.
This report broadly covers the following areas:
• access to schooling and early childhood education
• reasons why children do not attend an education institution
• problems experienced by children at schools
• learner pregnancy, learner transport, school fees
• gender parity
• level of education attainment
1.1 BACKGROUND TO THE GENERAL HOUSEHOLD SURVEY
The General Household Survey is conducted by Statistics South Africa (Stats SA) in approximately 30 000 households.
It has been undertaken annually since 2002. The survey is designed to obtain information on the availability of
goods and services in South African households. It covers six broad areas, namely: education, health, work and
unemployment, transport, housing and access to other services and facilities.
The survey targets all independent households as well as residents in workers’ hostels in all nine provinces of
South Africa. It does not, however, include other collective living quarters such as students hostels, old-age homes,
hospitals, prisons and military barracks. It is therefore representative of non-institutional and non-military persons or
households in South Africa.
The survey requests information from an adult in each household, in most instances the “household head”, through
a personal structured interview. Household members are interviewed in their home language or their language of
choice, by trained fieldworkers. The data obtained from the survey is weighted to population size. The information
and analysis provided in this report is therefore based on weighted data.
This report disaggregates key GHS data by population group (“race”). The GHS utilises pre-1994 categories to identify
population groups, with the aim of assessing equity and redress by tracking changes in the conditions of households.
The survey asks household members to self-identify race, in order to monitor changes in living standards among
population groups.
2
1.2 DATA REVISIONS
Following the release of the 2009 GHS data, Stats SA reweighted the GHS survey data as of 2002 to-date.
Further details related to the methodology of the survey can be obtained from the Stats SA website
([email protected]) or its telephonic user information service (012 310 8660/4892/8390).
1.3 CAUTION ON METHOD AND POPULATION DATA
The sample size of the GHS permits for data to be disaggregated to provincial level only; hence GHS data cannot
be disaggregated to district level.
It is also not always possible to obtain accurate data based on too many disaggregations. For instance, data that is
disaggregated by more than two variables may not be very accurate.
It is important for the reader to bear in mind that much of the information obtained for the GHS is self-reported (albeit
mediated by an interviewer); this report and the data therein should therefore be interpreted within this context.
2. ATTENDANCE AT EDUCATION INSTITUTIONS
This section examines the extent and patterns of attendance of household members at education institutions. The
GHS defines an education institution as a school, university, college, crèche, pre-school, nursery school, ABET
centre or similar such institutions, whether public or independent. It interprets “attendance at education institutions”
as enrolment in an education programme that is at least six months long. The survey asks the question: Is ……
attending an education institution?
2.1 EARLY CHILDHOOD DEVELOPMENT
This sub-section examines the extent to which 0 to 4 year old children have access to pre-school education and care.
The GHS asks the household Head to indicate whether any household member who is 0-4 years old, is attending
any of the following kinds of institutions: a day care centre, crèche, early childhood development (ECD) Centre, play
group, nursery school or a pre-primary school.
2.2 ATTENDANCE OF 0 TO 4 YEAR OLD CHILDREN AT EDUCATION INSTITUTIONS
Figure 1 shows the percentage of children aged 0 to 4 years old, attending education institutions over the 2002-2009
period.
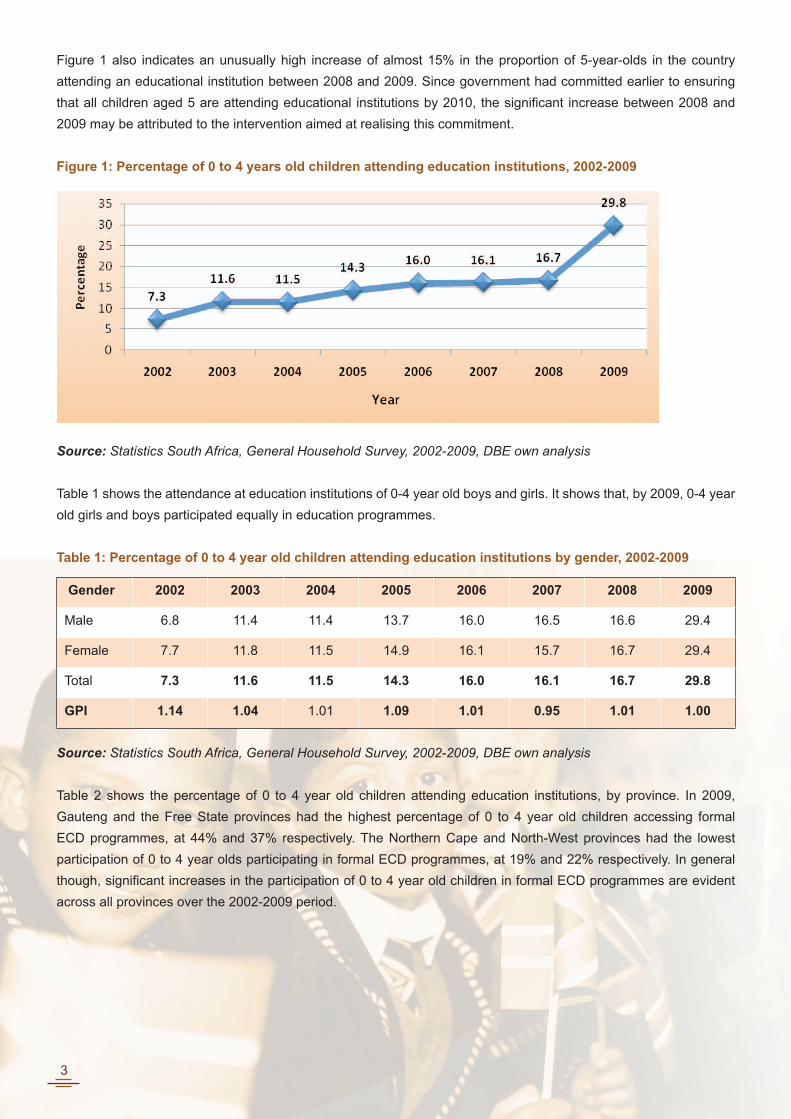
Access to ECD programmes by 0 to 4 year old children increased significantly from 7% in 2002 to 30% in 2009.
Although these figures do not provide any indication about the quality of care or education received by these children,
they are indicative, in a simple way, of both increased supply and demand. For instance, it can be inferred from Figure
1 that the capacity of the country to provide care/education for 0-4 year old children has increased significantly since
2002, and similarly, that demand for these services by the community has also increased substantially.
3
Figure 1 also indicates an unusually high increase of almost 15% in the proportion of 5-year-olds in the country
attending an educational institution between 2008 and 2009. Since government had committed earlier to ensuring
that all children aged 5 are attending educational institutions by 2010, the significant increase between 2008 and
2009 may be attributed to the intervention aimed at realising this commitment.
Figure 1: Percentage of 0 to 4 years old children attending education institutions, 2002-2009
Source: Statistics South Africa, General Household Survey, 2002-2009, DBE own analysis
Table 1 shows the attendance at education institutions of 0-4 year old boys and girls. It shows that, by 2009, 0-4 year
old girls and boys participated equally in education programmes.
Table 1: Percentage of 0 to 4 year old children attending education institutions by gender, 2002-2009
Gender 2002 2003 2004 2005 2006 2007 2008 2009
Male 6.8 11.4 11.4 13.7 16.0 16.5 16.6 29.4
Female 7.7 11.8 11.5 14.9 16.1 15.7 16.7 29.4
Total 7.3 11.6 11.5 14.3 16.0 16.1 16.7 29.8
GPI 1.14 1.04 1.01 1.09 1.01 0.95 1.01 1.00
Source: Statistics South Africa, General Household Survey, 2002-2009, DBE own analysis
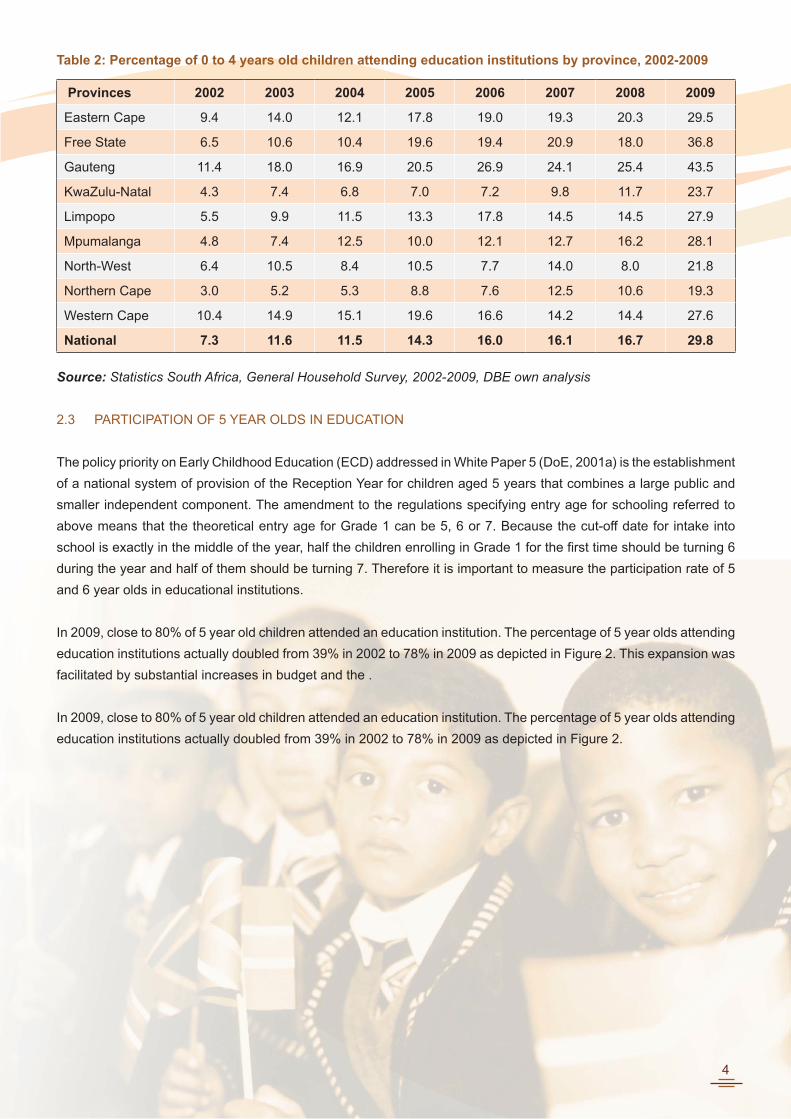
Table 2 shows the percentage of 0 to 4 year old children attending education institutions, by province. In 2009,
Gauteng and the Free State provinces had the highest percentage of 0 to 4 year old children accessing formal
ECD programmes, at 44% and 37% respectively. The Northern Cape and North-West provinces had the lowest
participation of 0 to 4 year olds participating in formal ECD programmes, at 19% and 22% respectively. In general
though, significant increases in the participation of 0 to 4 year old children in formal ECD programmes are evident
across all provinces over the 2002-2009 period.
4
Table 2: Percentage of 0 to 4 years old children attending education institutions by province, 2002-2009
Provinces 2002 2003 2004 2005 2006 2007 2008 2009
Eastern Cape 9.4 14.0 12.1 17.8 19.0 19.3 20.3 29.5
Free State 6.5 10.6 10.4 19.6 19.4 20.9 18.0 36.8
Gauteng 11.4 18.0 16.9 20.5 26.9 24.1 25.4 43.5
KwaZulu-Natal 4.3 7.4 6.8 7.0 7.2 9.8 11.7 23.7
Limpopo 5.5 9.9 11.5 13.3 17.8 14.5 14.5 27.9
Mpumalanga 4.8 7.4 12.5 10.0 12.1 12.7 16.2 28.1
North-West 6.4 10.5 8.4 10.5 7.7 14.0 8.0 21.8
Northern Cape 3.0 5.2 5.3 8.8 7.6 12.5 10.6 19.3
Western Cape 10.4 14.9 15.1 19.6 16.6 14.2 14.4 27.6
National 7.3 11.6 11.5 14.3 16.0 16.1 16.7 29.8
Source: Statistics South Africa, General Household Survey, 2002-2009, DBE own analysis
2.3 PARTICIPATION OF 5 YEAR OLDS IN EDUCATION
The policy priority on Early Childhood Education (ECD) addressed in White Paper 5 (DoE, 2001a) is the establishment
of a national system of provision of the Reception Year for children aged 5 years that combines a large public and
smaller independent component. The amendment to the regulations specifying entry age for schooling referred to
above means that the theoretical entry age for Grade 1 can be 5, 6 or 7. Because the cut-off date for intake into
school is exactly in the middle of the year, half the children enrolling in Grade 1 for the first time should be turning 6
during the year and half of them should be turning 7. Therefore it is important to measure the participation rate of 5
and 6 year olds in educational institutions.
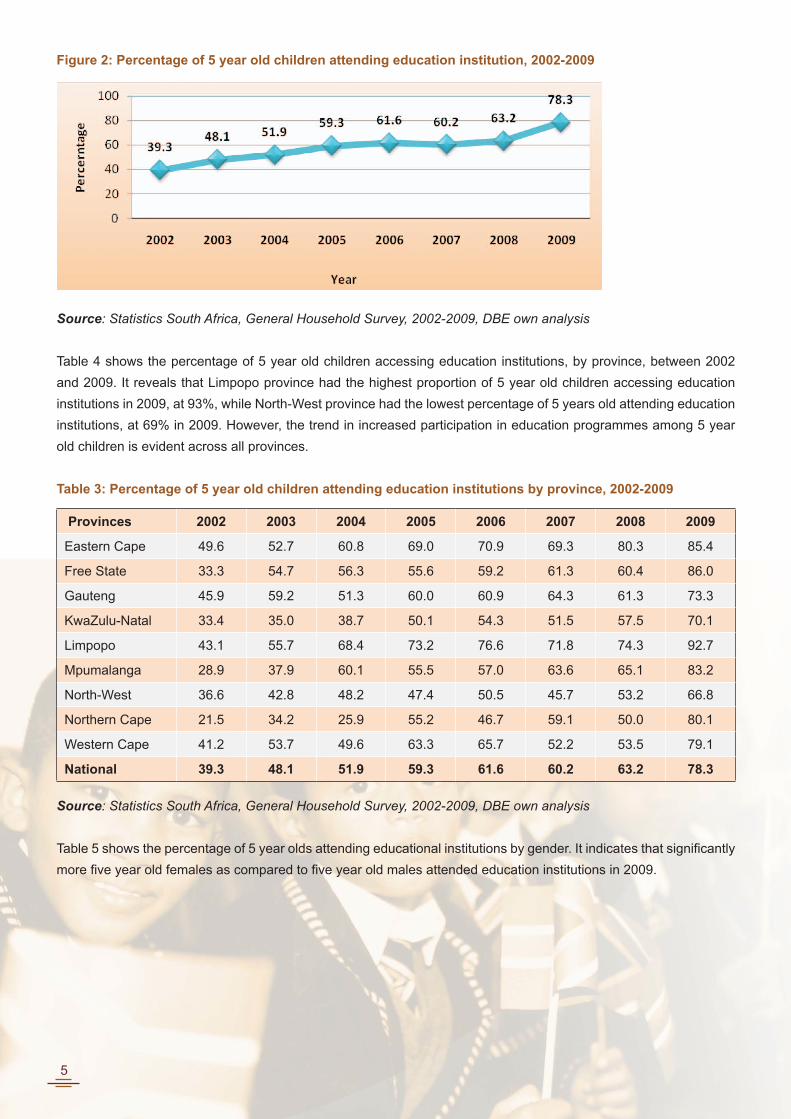
In 2009, close to 80% of 5 year old children attended an education institution. The percentage of 5 year olds attending
education institutions actually doubled from 39% in 2002 to 78% in 2009 as depicted in Figure 2. This expansion was
facilitated by substantial increases in budget and the .
In 2009, close to 80% of 5 year old children attended an education institution. The percentage of 5 year olds attending
education institutions actually doubled from 39% in 2002 to 78% in 2009 as depicted in Figure 2.
5
Figure 2: Percentage of 5 year old children attending education institution, 2002-2009
Source: Statistics South Africa, General Household Survey, 2002-2009, DBE own analysis
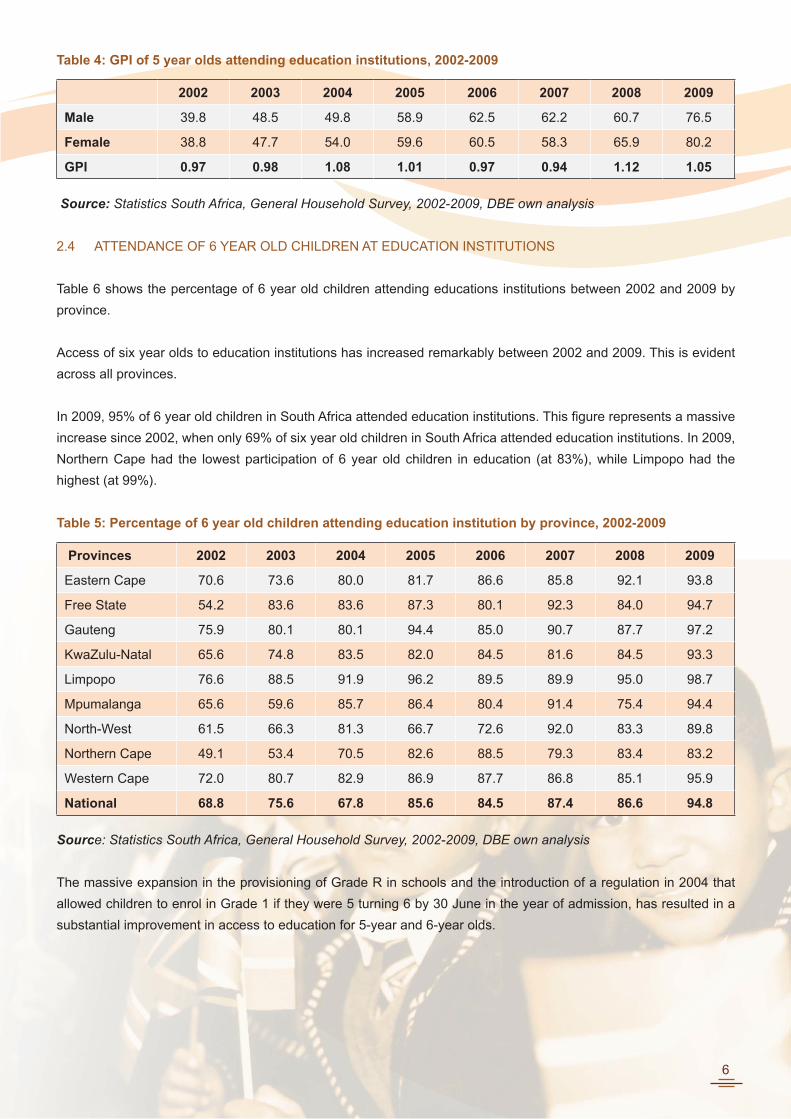
Table 4 shows the percentage of 5 year old children accessing education institutions, by province, between 2002
and 2009. It reveals that Limpopo province had the highest proportion of 5 year old children accessing education
institutions in 2009, at 93%, while North-West province had the lowest percentage of 5 years old attending education
institutions, at 69% in 2009. However, the trend in increased participation in education programmes among 5 year
old children is evident across all provinces.
Table 3: Percentage of 5 year old children attending education institutions by province, 2002-2009
Provinces 2002 2003 2004 2005 2006 2007 2008 2009
Eastern Cape 49.6 52.7 60.8 69.0 70.9 69.3 80.3 85.4
Free State 33.3 54.7 56.3 55.6 59.2 61.3 60.4 86.0
Gauteng 45.9 59.2 51.3 60.0 60.9 64.3 61.3 73.3
KwaZulu-Natal 33.4 35.0 38.7 50.1 54.3 51.5 57.5 70.1
Limpopo 43.1 55.7 68.4 73.2 76.6 71.8 74.3 92.7
Mpumalanga 28.9 37.9 60.1 55.5 57.0 63.6 65.1 83.2
North-West 36.6 42.8 48.2 47.4 50.5 45.7 53.2 66.8
Northern Cape 21.5 34.2 25.9 55.2 46.7 59.1 50.0 80.1
Western Cape 41.2 53.7 49.6 63.3 65.7 52.2 53.5 79.1
National 39.3 48.1 51.9 59.3 61.6 60.2 63.2 78.3
Source: Statistics South Africa, General Household Survey, 2002-2009, DBE own analysis
Table 5 shows the percentage of 5 year olds attending educational institutions by gender. It indicates that significantly
more five year old females as compared to five year old males attended education institutions in 2009.
6
Table 4: GPI of 5 year olds attending education institutions, 2002-2009
2002 2003 2004 2005 2006 2007 2008 2009
Male 39.8 48.5 49.8 58.9 62.5 62.2 60.7 76.5
Female 38.8 47.7 54.0 59.6 60.5 58.3 65.9 80.2
GPI 0.97 0.98 1.08 1.01 0.97 0.94 1.12 1.05
Source: Statistics South Africa, General Household Survey, 2002-2009, DBE own analysis
2.4 ATTENDANCE OF 6 YEAR OLD CHILDREN AT EDUCATION INSTITUTIONS
Table 6 shows the percentage of 6 year old children attending educations institutions between 2002 and 2009 by
province.
Access of six year olds to education institutions has increased remarkably between 2002 and 2009. This is evident
across all provinces.
In 2009, 95% of 6 year old children in South Africa attended education institutions. This figure represents a massive
increase since 2002, when only 69% of six year old children in South Africa attended education institutions. In 2009,
Northern Cape had the lowest participation of 6 year old children in education (at 83%), while Limpopo had the
highest (at 99%).
Table 5: Percentage of 6 year old children attending education institution by province, 2002-2009
Provinces 2002 2003 2004 2005 2006 2007 2008 2009
Eastern Cape 70.6 73.6 80.0 81.7 86.6 85.8 92.1 93.8
Free State 54.2 83.6 83.6 87.3 80.1 92.3 84.0 94.7
Gauteng 75.9 80.1 80.1 94.4 85.0 90.7 87.7 97.2
KwaZulu-Natal 65.6 74.8 83.5 82.0 84.5 81.6 84.5 93.3
Limpopo 76.6 88.5 91.9 96.2 89.5 89.9 95.0 98.7
Mpumalanga 65.6 59.6 85.7 86.4 80.4 91.4 75.4 94.4
North-West 61.5 66.3 81.3 66.7 72.6 92.0 83.3 89.8
Northern Cape 49.1 53.4 70.5 82.6 88.5 79.3 83.4 83.2
Western Cape 72.0 80.7 82.9 86.9 87.7 86.8 85.1 95.9
National 68.8 75.6 67.8 85.6 84.5 87.4 86.6 94.8
Source: Statistics South Africa, General Household Survey, 2002-2009, DBE own analysis
The massive expansion in the provisioning of Grade R in schools and the introduction of a regulation in 2004 that
allowed children to enrol in Grade 1 if they were 5 turning 6 by 30 June in the year of admission, has resulted in a
substantial improvement in access to education for 5-year and 6-year olds.
7
2.5 PARTICIPATION IN EDUCATION BY AGE GROUPS
2.5.1 Participation of 7 to 15 year old children in education
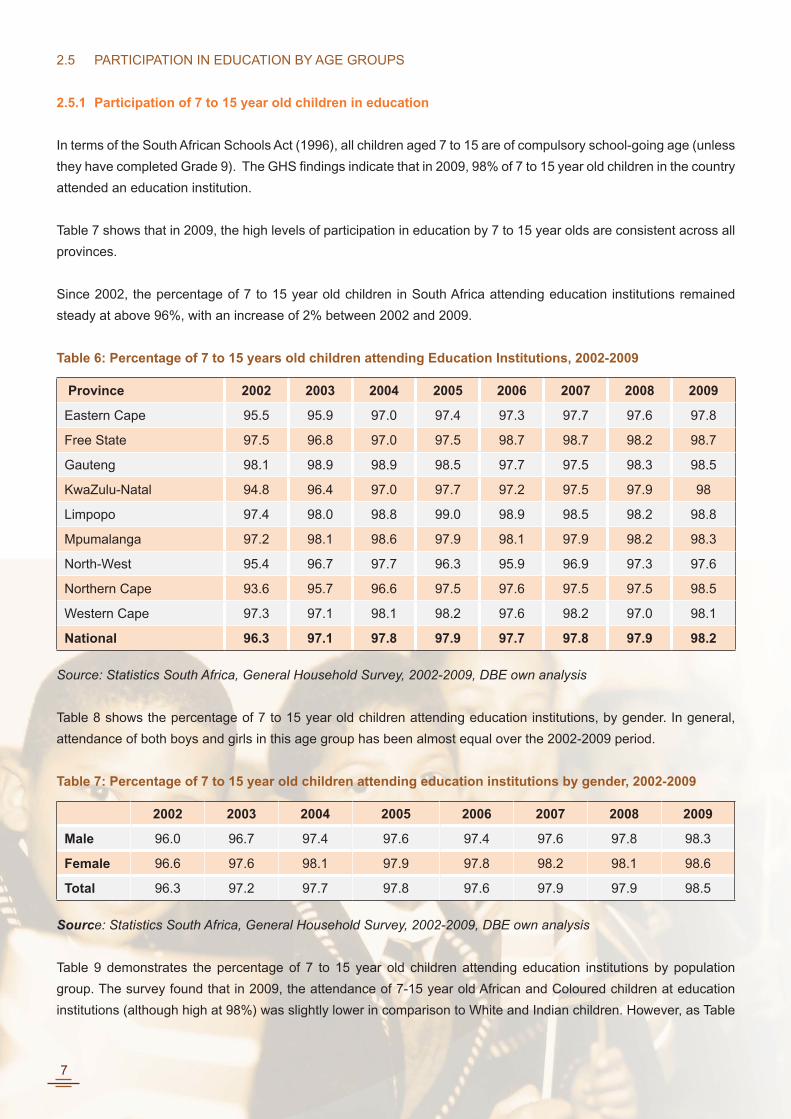
In terms of the South African Schools Act (1996), all children aged 7 to 15 are of compulsory school-going age (unless
they have completed Grade 9). The GHS findings indicate that in 2009, 98% of 7 to 15 year old children in the country
attended an education institution.
Table 7 shows that in 2009, the high levels of participation in education by 7 to 15 year olds are consistent across all
provinces.
Since 2002, the percentage of 7 to 15 year old children in South Africa attending education institutions remained
steady at above 96%, with an increase of 2% between 2002 and 2009.
Table 6: Percentage of 7 to 15 years old children attending Education Institutions, 2002-2009
Province 2002 2003 2004 2005 2006 2007 2008 2009
Eastern Cape 95.5 95.9 97.0 97.4 97.3 97.7 97.6 97.8
Free State 97.5 96.8 97.0 97.5 98.7 98.7 98.2 98.7
Gauteng 98.1 98.9 98.9 98.5 97.7 97.5 98.3 98.5
KwaZulu-Natal 94.8 96.4 97.0 97.7 97.2 97.5 97.9 98
Limpopo 97.4 98.0 98.8 99.0 98.9 98.5 98.2 98.8
Mpumalanga 97.2 98.1 98.6 97.9 98.1 97.9 98.2 98.3
North-West 95.4 96.7 97.7 96.3 95.9 96.9 97.3 97.6
Northern Cape 93.6 95.7 96.6 97.5 97.6 97.5 97.5 98.5
Western Cape 97.3 97.1 98.1 98.2 97.6 98.2 97.0 98.1
National 96.3 97.1 97.8 97.9 97.7 97.8 97.9 98.2
Source: Statistics South Africa, General Household Survey, 2002-2009, DBE own analysis
Table 8 shows the percentage of 7 to 15 year old children attending education institutions, by gender. In general,
attendance of both boys and girls in this age group has been almost equal over the 2002-2009 period.
Table 7: Percentage of 7 to 15 year old children attending education institutions by gender, 2002-2009
2002 2003 2004 2005 2006 2007 2008 2009
Male 96.0 96.7 97.4 97.6 97.4 97.6 97.8 98.3
Female 96.6 97.6 98.1 97.9 97.8 98.2 98.1 98.6
Total 96.3 97.2 97.7 97.8 97.6 97.9 97.9 98.5
Source: Statistics South Africa, General Household Survey, 2002-2009, DBE own analysis
Table 9 demonstrates the percentage of 7 to 15 year old children attending education institutions by population
group. The survey found that in 2009, the attendance of 7-15 year old African and Coloured children at education
institutions (although high at 98%) was slightly lower in comparison to White and Indian children. However, as Table
8
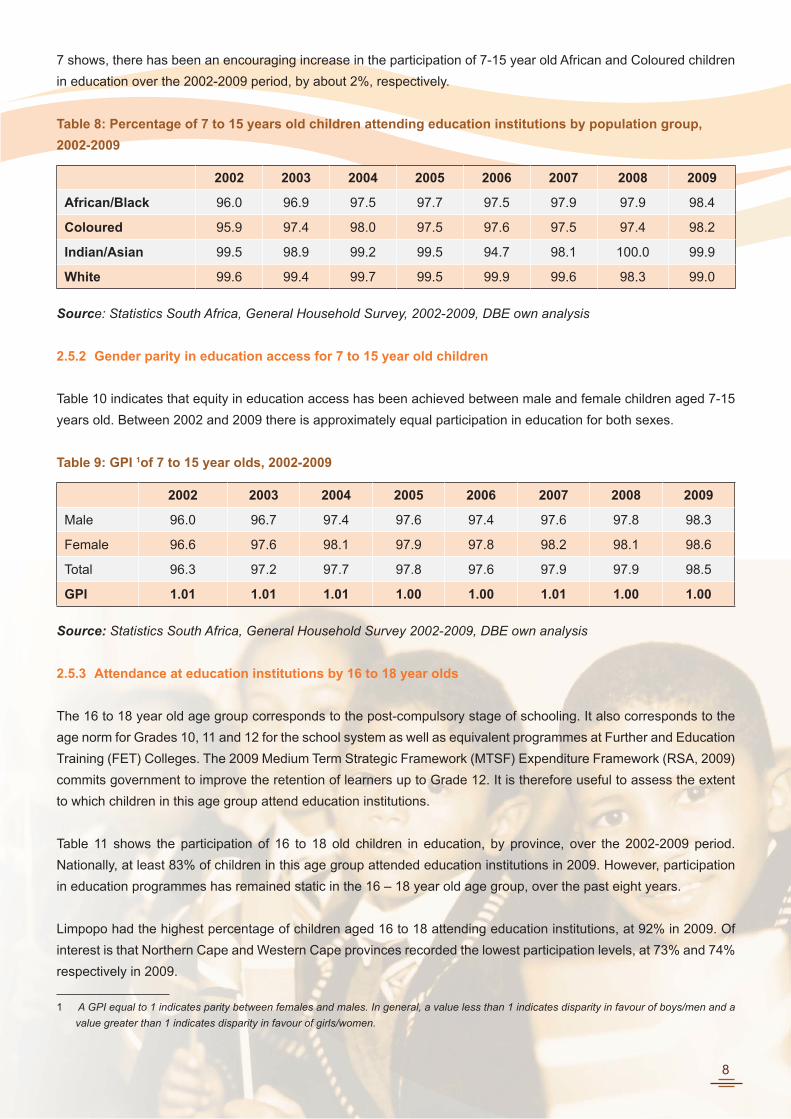
7 shows, there has been an encouraging increase in the participation of 7-15 year old African and Coloured children
in education over the 2002-2009 period, by about 2%, respectively.
Table 8: Percentage of 7 to 15 years old children attending education institutions by population group,
2002-2009
2002 2003 2004 2005 2006 2007 2008 2009
African/Black 96.0 96.9 97.5 97.7 97.5 97.9 97.9 98.4
Coloured 95.9 97.4 98.0 97.5 97.6 97.5 97.4 98.2
Indian/Asian 99.5 98.9 99.2 99.5 94.7 98.1 100.0 99.9
White 99.6 99.4 99.7 99.5 99.9 99.6 98.3 99.0
Source: Statistics South Africa, General Household Survey, 2002-2009, DBE own analysis
2.5.2 Gender parity in education access for 7 to 15 year old children
Table 10 indicates that equity in education access has been achieved between male and female children aged 7-15
years old. Between 2002 and 2009 there is approximately equal participation in education for both sexes.
Table 9: GPI 1of 7 to 15 year olds, 2002-2009
2002 2003 2004 2005 2006 2007 2008 2009
Male 96.0 96.7 97.4 97.6 97.4 97.6 97.8 98.3
Female 96.6 97.6 98.1 97.9 97.8 98.2 98.1 98.6
Total 96.3 97.2 97.7 97.8 97.6 97.9 97.9 98.5
GPI 1.01 1.01 1.01 1.00 1.00 1.01 1.00 1.00
Source: Statistics South Africa, General Household Survey 2002-2009, DBE own analysis
2.5.3 Attendance at education institutions by 16 to 18 year olds
The 16 to 18 year old age group corresponds to the post-compulsory stage of schooling. It also corresponds to the
age norm for Grades 10, 11 and 12 for the school system as well as equivalent programmes at Further and Education
Training (FET) Colleges. The 2009 Medium Term Strategic Framework (MTSF) Expenditure Framework (RSA, 2009)
commits government to improve the retention of learners up to Grade 12. It is therefore useful to assess the extent
to which children in this age group attend education institutions.
Table 11 shows the participation of 16 to 18 old children in education, by province, over the 2002-2009 period.
Nationally, at least 83% of children in this age group attended education institutions in 2009. However, participation
in education programmes has remained static in the 16 – 18 year old age group, over the past eight years.
Limpopo had the highest percentage of children aged 16 to 18 attending education institutions, at 92% in 2009. Of
interest is that Northern Cape and Western Cape provinces recorded the lowest participation levels, at 73% and 74%
respectively in 2009.
1 A GPI equal to 1 indicates parity between females and males. In general, a value less than 1 indicates disparity in favour of boys/men and a
value greater than 1 indicates disparity in favour of girls/women.
9
Table 10: Percentage of 16 to 18 year old children attending Education Institutions, 2002-2009
Province 2002 2003 2004 2005 2006 2007 2008 2009
Eastern Cape 83.0 78.5 78.5 80.9 83.9 85.4 83.0 80.9
Free State 85.4 86.0 86.6 88.7 83.3 90.7 85.8 83.8
Gauteng 87.7 86.5 85.6 84.2 80.6 82.2 85.6 87.2
KwaZulu-Natal 79.3 81.9 82.0 81.4 83.3 83.7 84.6 80.7
Limpopo 88.2 89.3 91.5 87.4 89.3 92.1 90.0 91.5
Mpumalanga 86.2 57.7 88.1 86.7 85.5 93.2 87.1 84.5
North-West 81.2 80.8 84.3 83.9 84.1 81.6 79.1 81.4
Northern Cape 71.0 67.7 68.8 75.4 71.9 77.8 76.0 73.4
Western Cape 72.6 73.2 72.6 69.7 66.0 73.7 71.6 73.7
National 82.9 79.3 83.3 82.4 82.5 85.0 83.9 82.9
Source: Statistics South Africa, General Household Survey, 2002-2009, DBE own analysis
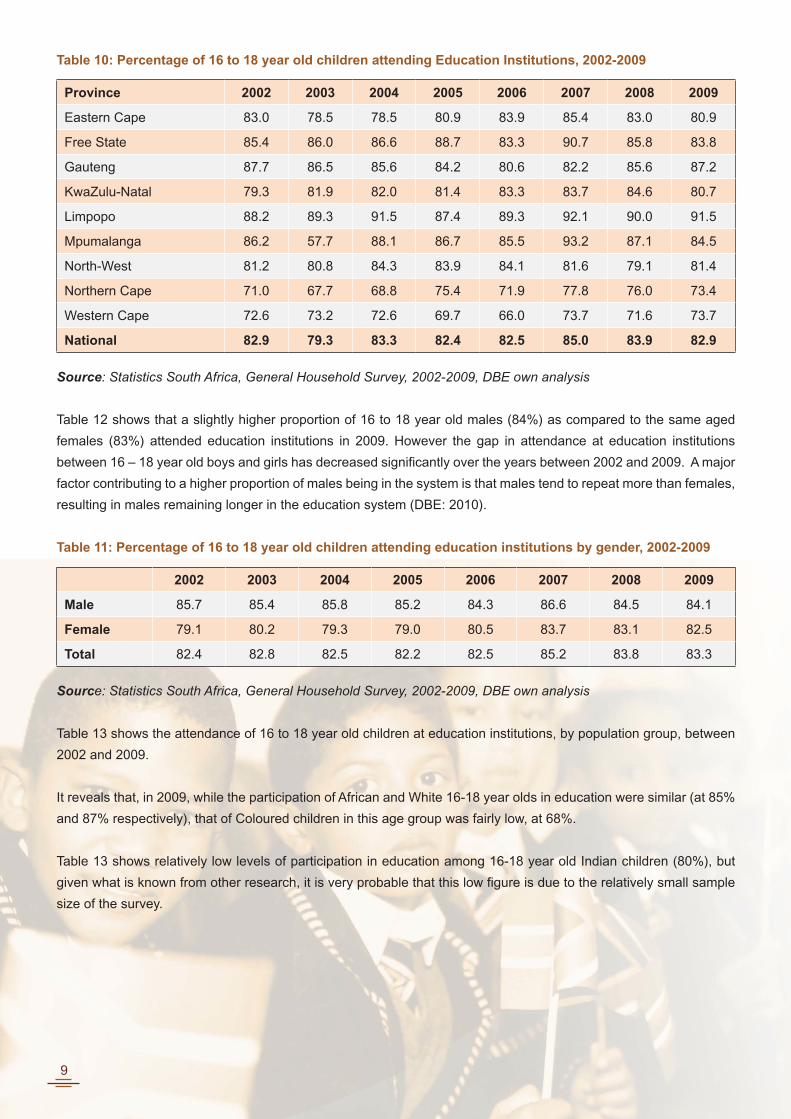
Table 12 shows that a slightly higher proportion of 16 to 18 year old males (84%) as compared to the same aged
females (83%) attended education institutions in 2009. However the gap in attendance at education institutions
between 16 – 18 year old boys and girls has decreased significantly over the years between 2002 and 2009. A major
factor contributing to a higher proportion of males being in the system is that males tend to repeat more than females,
resulting in males remaining longer in the education system (DBE: 2010).
Table 11: Percentage of 16 to 18 year old children attending education institutions by gender, 2002-2009
2002 2003 2004 2005 2006 2007 2008 2009
Male 85.7 85.4 85.8 85.2 84.3 86.6 84.5 84.1
Female 79.1 80.2 79.3 79.0 80.5 83.7 83.1 82.5
Total 82.4 82.8 82.5 82.2 82.5 85.2 83.8 83.3
Source: Statistics South Africa, General Household Survey, 2002-2009, DBE own analysis
Table 13 shows the attendance of 16 to 18 year old children at education institutions, by population group, between
2002 and 2009.
It reveals that, in 2009, while the participation of African and White 16-18 year olds in education were similar (at 85%
and 87% respectively), that of Coloured children in this age group was fairly low, at 68%.
Table 13 shows relatively low levels of participation in education among 16-18 year old Indian children (80%), but
given what is known from other research, it is very probable that this low figure is due to the relatively small sample
size of the survey.
10
Table 12: Percentage of 16 to 18 years old children attending education institutions by population group,
2002-2009
2002 2003 2004 2005 2006 2007 2008 2009
African/Black 83.1 84.0 83.7 82.6 84.1 86.3 85.2 84.6
Coloured 67.5 64.9 66.2 66.5 63.3 70.7 69.4 68.0
Indian/Asian 80.3 79.3 80.5 88.0 69.1 82.1 80.7 79.7
White 91.9 90.5 89.1 92.1 88.4 89.7 83.8 86.6
Source: Statistics South Africa, General Household Survey, 2002-2009, DBE own analysis
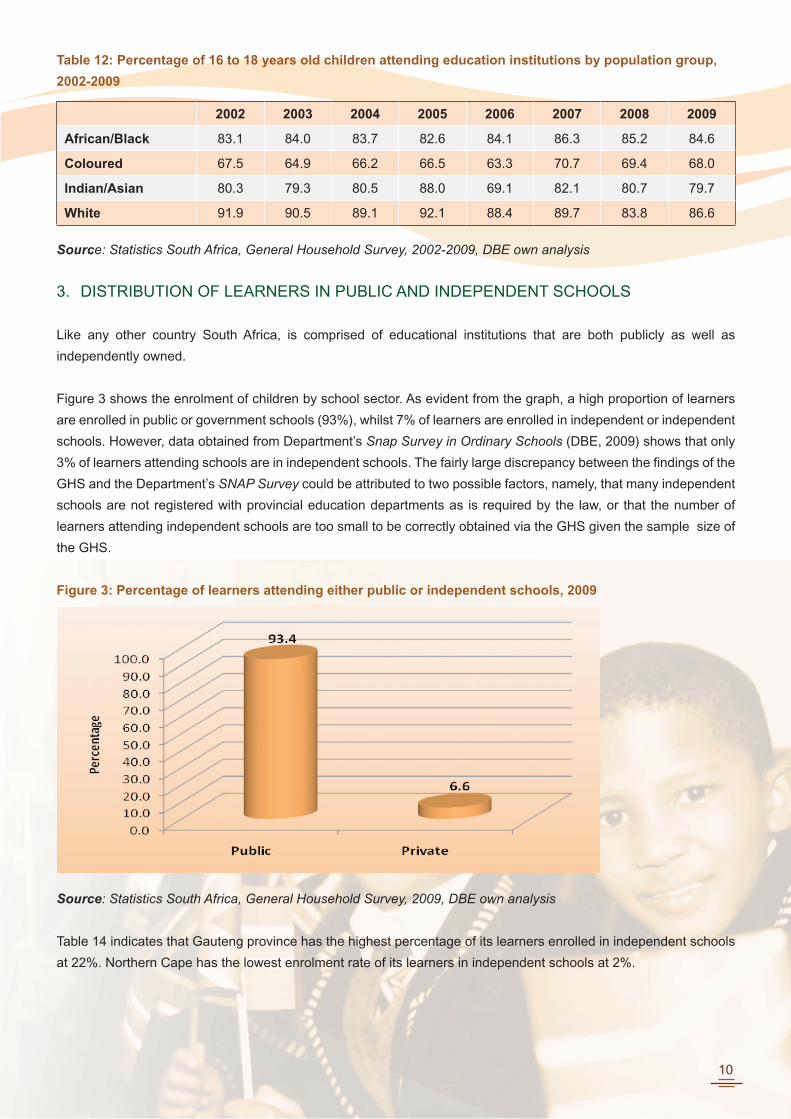
3. DISTRIBUTION OF LEARNERS IN PUBLIC AND INDEPENDENT SCHOOLS
Like any other country South Africa, is comprised of educational institutions that are both publicly as well as
independently owned.
Figure 3 shows the enrolment of children by school sector. As evident from the graph, a high proportion of learners
are enrolled in public or government schools (93%), whilst 7% of learners are enrolled in independent or independent
schools. However, data obtained from Department’s Snap Survey in Ordinary Schools (DBE, 2009) shows that only
3% of learners attending schools are in independent schools. The fairly large discrepancy between the findings of the
GHS and the Department’s SNAP Survey could be attributed to two possible factors, namely, that many independent
schools are not registered with provincial education departments as is required by the law, or that the number of
learners attending independent schools are too small to be correctly obtained via the GHS given the sample size of
the GHS.
Figure 3: Percentage of learners attending either public or independent schools, 2009
Source: Statistics South Africa, General Household Survey, 2009, DBE own analysis
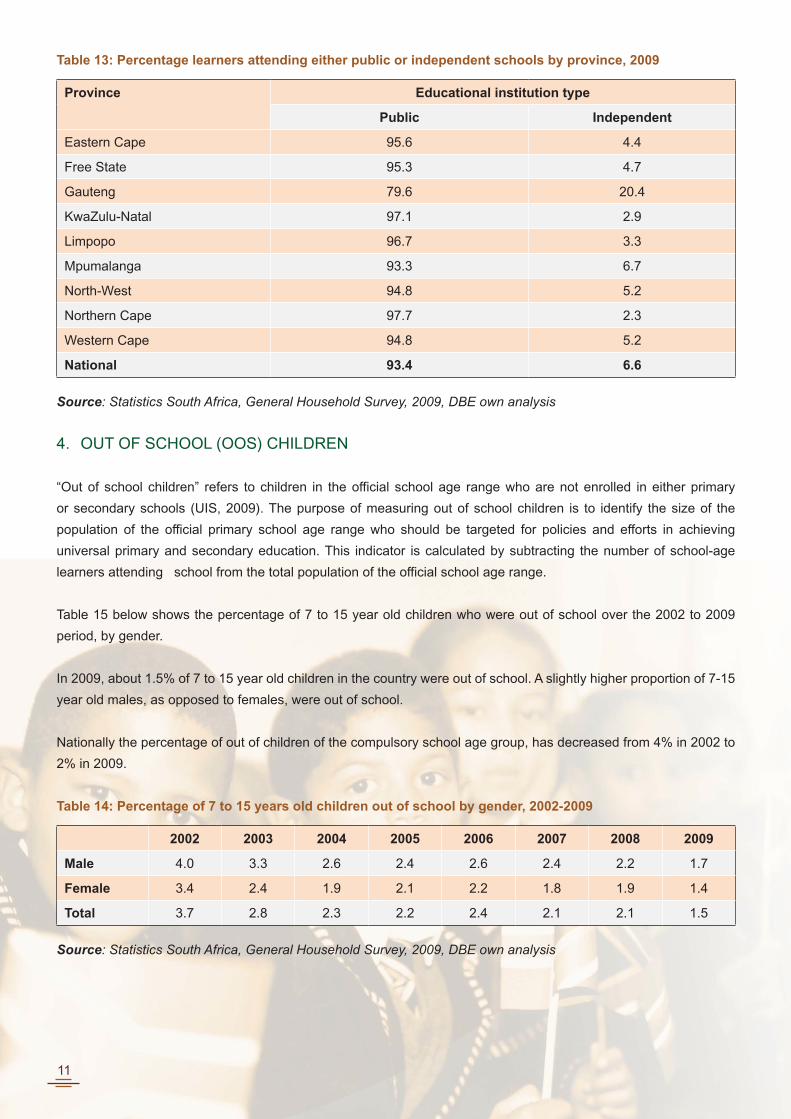
Table 14 indicates that Gauteng province has the highest percentage of its learners enrolled in independent schools
at 22%. Northern Cape has the lowest enrolment rate of its learners in independent schools at 2%.
11
Table 13: Percentage learners attending either public or independent schools by province, 2009
Province Educational institution type
Public Independent
Eastern Cape 95.6 4.4
Free State 95.3 4.7
Gauteng 79.6 20.4
KwaZulu-Natal 97.1 2.9
Limpopo 96.7 3.3
Mpumalanga 93.3 6.7
North-West 94.8 5.2
Northern Cape 97.7 2.3
Western Cape 94.8 5.2
National 93.4 6.6
Source: Statistics South Africa, General Household Survey, 2009, DBE own analysis
4. OUT OF SCHOOL (OOS) CHILDREN
“Out of school children” refers to children in the official school age range who are not enrolled in either primary
or secondary schools (UIS, 2009). The purpose of measuring out of school children is to identify the size of the
population of the official primary school age range who should be targeted for policies and efforts in achieving
universal primary and secondary education. This indicator is calculated by subtracting the number of school-age
learners attending school from the total population of the official school age range.
Table 15 below shows the percentage of 7 to 15 year old children who were out of school over the 2002 to 2009
period, by gender.
In 2009, about 1.5% of 7 to 15 year old children in the country were out of school. A slightly higher proportion of 7-15
year old males, as opposed to females, were out of school.
Nationally the percentage of out of children of the compulsory school age group, has decreased from 4% in 2002 to
2% in 2009.
Table 14: Percentage of 7 to 15 years old children out of school by gender, 2002-2009
2002 2003 2004 2005 2006 2007 2008 2009
Male 4.0 3.3 2.6 2.4 2.6 2.4 2.2 1.7
Female 3.4 2.4 1.9 2.1 2.2 1.8 1.9 1.4
Total 3.7 2.8 2.3 2.2 2.4 2.1 2.1 1.5
Source: Statistics South Africa, General Household Survey, 2009, DBE own analysis
12
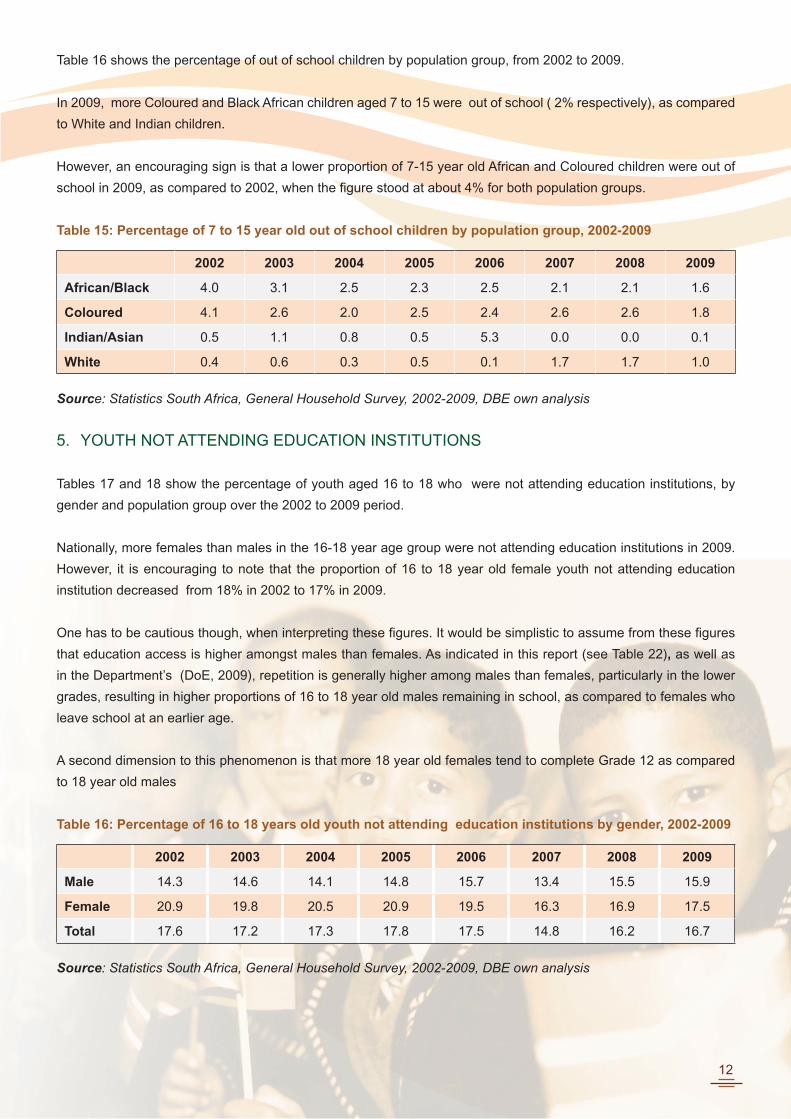
Table 16 shows the percentage of out of school children by population group, from 2002 to 2009.
In 2009, more Coloured and Black African children aged 7 to 15 were out of school ( 2% respectively), as compared
to White and Indian children.
However, an encouraging sign is that a lower proportion of 7-15 year old African and Coloured children were out of
school in 2009, as compared to 2002, when the figure stood at about 4% for both population groups.
Table 15: Percentage of 7 to 15 year old out of school children by population group, 2002-2009
2002 2003 2004 2005 2006 2007 2008 2009
African/Black 4.0 3.1 2.5 2.3 2.5 2.1 2.1 1.6
Coloured 4.1 2.6 2.0 2.5 2.4 2.6 2.6 1.8
Indian/Asian 0.5 1.1 0.8 0.5 5.3 0.0 0.0 0.1
White 0.4 0.6 0.3 0.5 0.1 1.7 1.7 1.0
Source: Statistics South Africa, General Household Survey, 2002-2009, DBE own analysis
5. YOUTH NOT ATTENDING EDUCATION INSTITUTIONS
Tables 17 and 18 show the percentage of youth aged 16 to 18 who were not attending education institutions, by
gender and population group over the 2002 to 2009 period.
Nationally, more females than males in the 16-18 year age group were not attending education institutions in 2009.
However, it is encouraging to note that the proportion of 16 to 18 year old female youth not attending education
institution decreased from 18% in 2002 to 17% in 2009.
One has to be cautious though, when interpreting these figures. It would be simplistic to assume from these figures
that education access is higher amongst males than females. As indicated in this report (see Table 22), as well as
in the Department’s (DoE, 2009), repetition is generally higher among males than females, particularly in the lower
grades, resulting in higher proportions of 16 to 18 year old males remaining in school, as compared to females who
leave school at an earlier age.
A second dimension to this phenomenon is that more 18 year old females tend to complete Grade 12 as compared
to 18 year old males
Table 16: Percentage of 16 to 18 years old youth not attending education institutions by gender, 2002-2009
2002 2003 2004 2005 2006 2007 2008 2009
Male 14.3 14.6 14.1 14.8 15.7 13.4 15.5 15.9
Female 20.9 19.8 20.5 20.9 19.5 16.3 16.9 17.5
Total 17.6 17.2 17.3 17.8 17.5 14.8 16.2 16.7
Source: Statistics South Africa, General Household Survey, 2002-2009, DBE own analysis
13
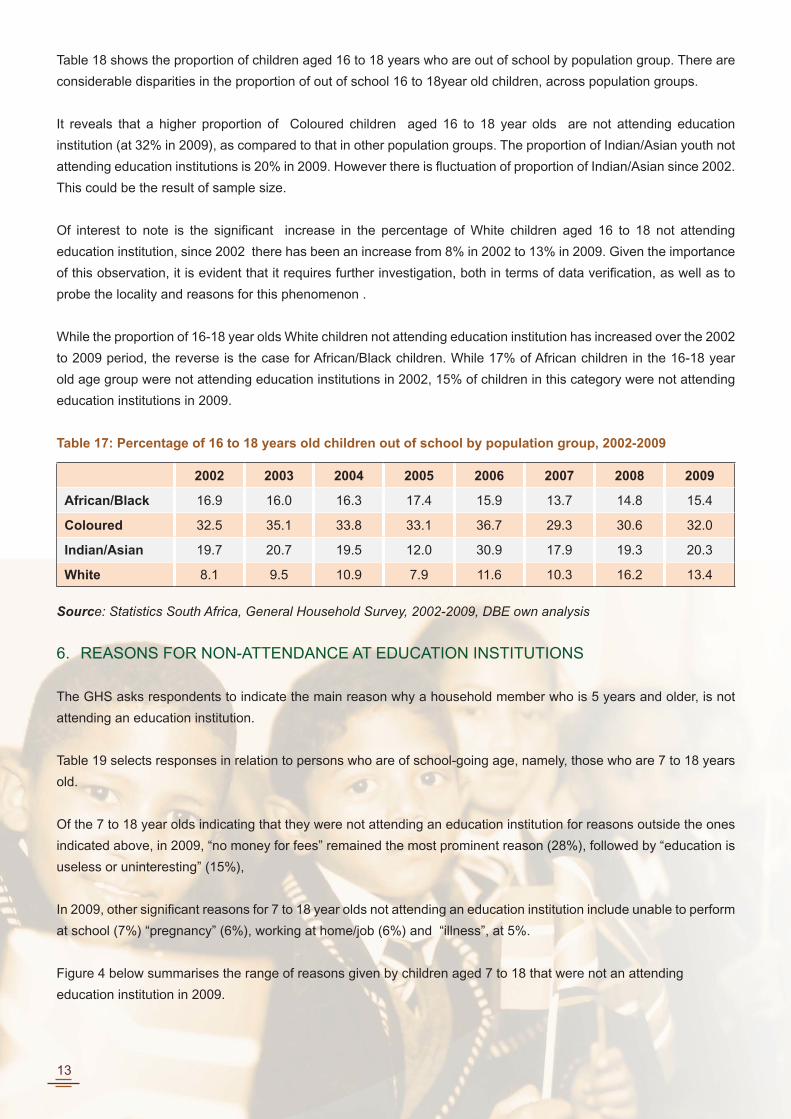
Table 18 shows the proportion of children aged 16 to 18 years who are out of school by population group. There are
considerable disparities in the proportion of out of school 16 to 18year old children, across population groups.
It reveals that a higher proportion of Coloured children aged 16 to 18 year olds are not attending education
institution (at 32% in 2009), as compared to that in other population groups. The proportion of Indian/Asian youth not
attending education institutions is 20% in 2009. However there is fluctuation of proportion of Indian/Asian since 2002.
This could be the result of sample size.
Of interest to note is the significant increase in the percentage of White children aged 16 to 18 not attending
education institution, since 2002 there has been an increase from 8% in 2002 to 13% in 2009. Given the importance
of this observation, it is evident that it requires further investigation, both in terms of data verification, as well as to
probe the locality and reasons for this phenomenon .
While the proportion of 16-18 year olds White children not attending education institution has increased over the 2002
to 2009 period, the reverse is the case for African/Black children. While 17% of African children in the 16-18 year
old age group were not attending education institutions in 2002, 15% of children in this category were not attending
education institutions in 2009.
Table 17: Percentage of 16 to 18 years old children out of school by population group, 2002-2009
2002 2003 2004 2005 2006 2007 2008 2009
African/Black 16.9 16.0 16.3 17.4 15.9 13.7 14.8 15.4
Coloured 32.5 35.1 33.8 33.1 36.7 29.3 30.6 32.0
Indian/Asian 19.7 20.7 19.5 12.0 30.9 17.9 19.3 20.3
White 8.1 9.5 10.9 7.9 11.6 10.3 16.2 13.4
Source: Statistics South Africa, General Household Survey, 2002-2009, DBE own analysis
6. REASONS FOR NON-ATTENDANCE AT EDUCATION INSTITUTIONS
The GHS asks respondents to indicate the main reason why a household member who is 5 years and older, is not
attending an education institution.
Table 19 selects responses in relation to persons who are of school-going age, namely, those who are 7 to 18 years
old.
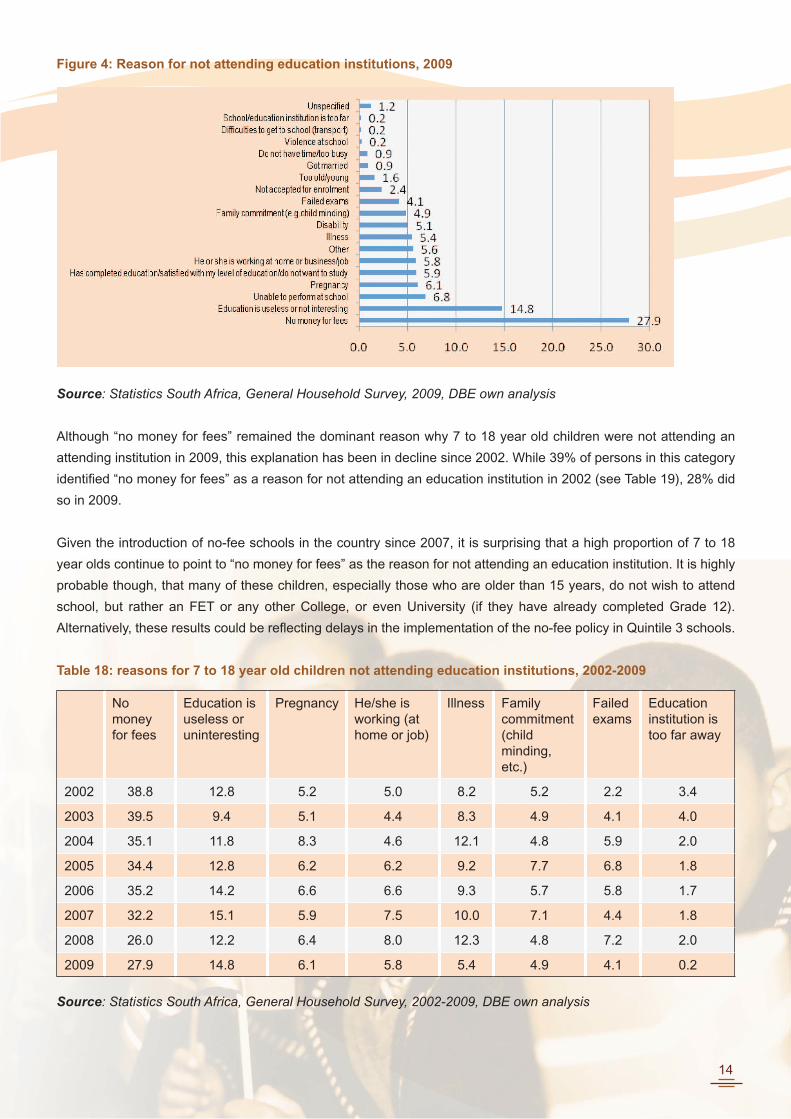
Of the 7 to 18 year olds indicating that they were not attending an education institution for reasons outside the ones
indicated above, in 2009, “no money for fees” remained the most prominent reason (28%), followed by “education is
useless or uninteresting” (15%),
In 2009, other significant reasons for 7 to 18 year olds not attending an education institution include unable to perform
at school (7%) “pregnancy” (6%), working at home/job (6%) and “illness”, at 5%.
Figure 4 below summarises the range of reasons given by children aged 7 to 18 that were not an attending
education institution in 2009.
14
Figure 4: Reason for not attending education institutions, 2009
Source: Statistics South Africa, General Household Survey, 2009, DBE own analysis
Although “no money for fees” remained the dominant reason why 7 to 18 year old children were not attending an
attending institution in 2009, this explanation has been in decline since 2002. While 39% of persons in this category
identified “no money for fees” as a reason for not attending an education institution in 2002 (see Table 19), 28% did
so in 2009.
Given the introduction of no-fee schools in the country since 2007, it is surprising that a high proportion of 7 to 18
year olds continue to point to “no money for fees” as the reason for not attending an education institution. It is highly
probable though, that many of these children, especially those who are older than 15 years, do not wish to attend
school, but rather an FET or any other College, or even University (if they have already completed Grade 12).
Alternatively, these results could be reflecting delays in the implementation of the no-fee policy in Quintile 3 schools.
Table 18: reasons for 7 to 18 year old children not attending education institutions, 2002-2009
No money for fees
Education is useless or uninteresting
Pregnancy He/she is working (at home or job)
Illness Family commitment (child minding, etc.)
Failed exams
Education institution is too far away
2002 38.8 12.8 5.2 5.0 8.2 5.2 2.2 3.4
2003 39.5 9.4 5.1 4.4 8.3 4.9 4.1 4.0
2004 35.1 11.8 8.3 4.6 12.1 4.8 5.9 2.0
2005 34.4 12.8 6.2 6.2 9.2 7.7 6.8 1.8
2006 35.2 14.2 6.6 6.6 9.3 5.7 5.8 1.7
2007 32.2 15.1 5.9 7.5 10.0 7.1 4.4 1.8
2008 26.0 12.2 6.4 8.0 12.3 4.8 7.2 2.0
2009 27.9 14.8 6.1 5.8 5.4 4.9 4.1 0.2
Source: Statistics South Africa, General Household Survey, 2002-2009, DBE own analysis
15
7. PROBLEMS EXPERIENCED AT SCHOOLS
The General Household Survey asks the household head if a person in the household attending an education
institution, experienced any problems at the institution over the last six months. The question lists nine options and
the respondent was expected to select one or more of the options provided.
In 2009 (according to household heads), 75% of children attending schools indicated that they did not experience any
problems at the school they attended.
Overall the reported problems experienced by children at schools have decreased significantly over the 2002 to 2009
period – from 64.7% to 25%.
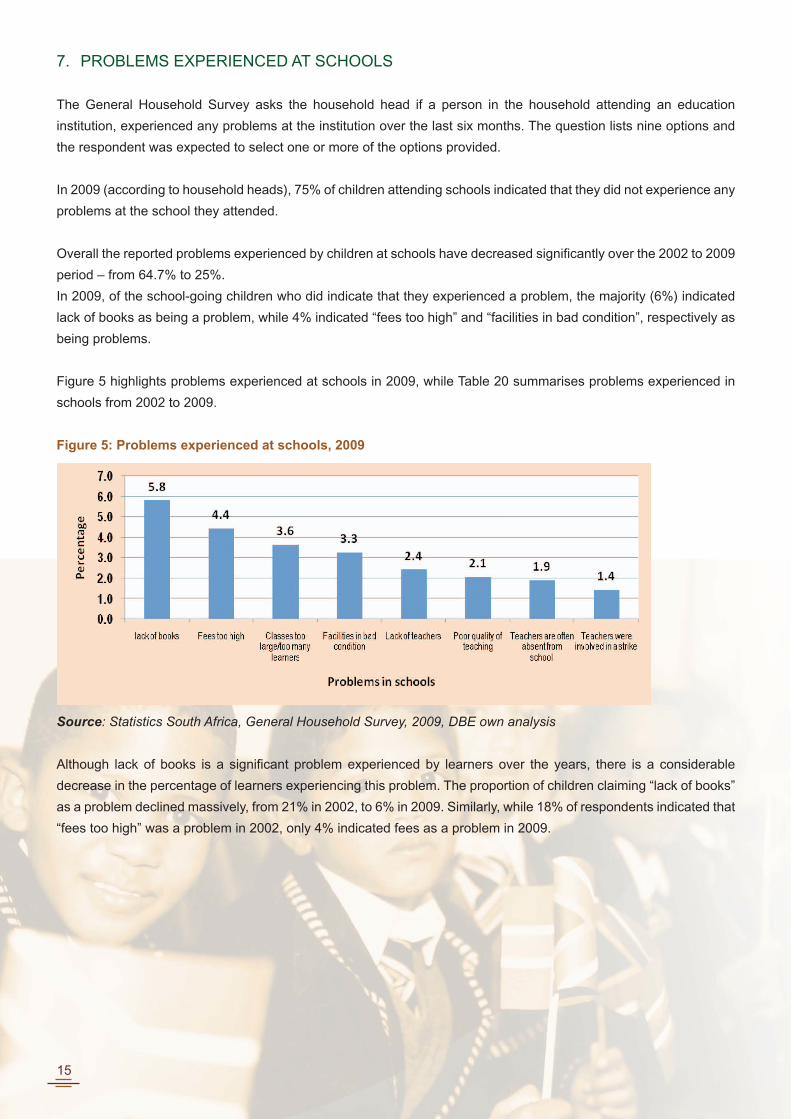
In 2009, of the school-going children who did indicate that they experienced a problem, the majority (6%) indicated
lack of books as being a problem, while 4% indicated “fees too high” and “facilities in bad condition”, respectively as
being problems.
Figure 5 highlights problems experienced at schools in 2009, while Table 20 summarises problems experienced in
schools from 2002 to 2009.
Figure 5: Problems experienced at schools, 2009
Source: Statistics South Africa, General Household Survey, 2009, DBE own analysis
Although lack of books is a significant problem experienced by learners over the years, there is a considerable
decrease in the percentage of learners experiencing this problem. The proportion of children claiming “lack of books”
as a problem declined massively, from 21% in 2002, to 6% in 2009. Similarly, while 18% of respondents indicated that
“fees too high” was a problem in 2002, only 4% indicated fees as a problem in 2009.
16
Table 19: Problems experienced at schools, 2002-2009
Year Lack of books
Fees too high
Facilities in bad condition
Classes too large
Lack of teachers
Poor teaching
2002 20.5 17.8 10.5 6.6 5.1 4.4
2003 18.3 16.7 9.9 6.6 4.2 3.7
2004 14.2 14.4 8.3 7.0 4.0 2.8
2005 15.2 13.6 7.5 6.5 4.5 3.7
2006 13.2 11.8 8.0 7.4 4.0 3.4
2007 10.1 7.0 5.4 4.9 8.5 6.0
2008 9.8 7.7 5.3 4.8 3.8 3.5
2009 5.8 4.4 3.6 3.3 2.4 2.1
Source: Statistics South Africa, General Household Survey, 2002-2009, DBE own analysis
8. MEANS OF TRANSPORT
For many learners, especially in rural South Africa, access to education is hampered in part by the long distances that
learners have to travel between home and school.
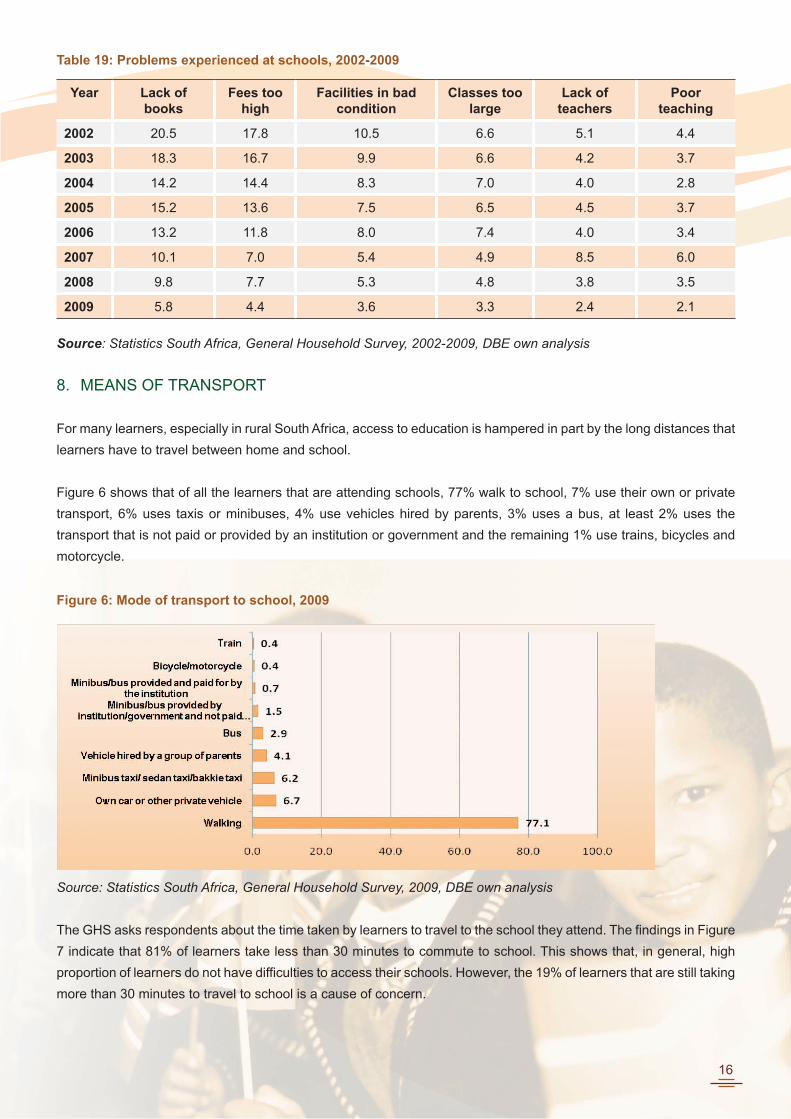
Figure 6 shows that of all the learners that are attending schools, 77% walk to school, 7% use their own or private
transport, 6% uses taxis or minibuses, 4% use vehicles hired by parents, 3% uses a bus, at least 2% uses the
transport that is not paid or provided by an institution or government and the remaining 1% use trains, bicycles and
motorcycle.
Figure 6: Mode of transport to school, 2009
Source: Statistics South Africa, General Household Survey, 2009, DBE own analysis
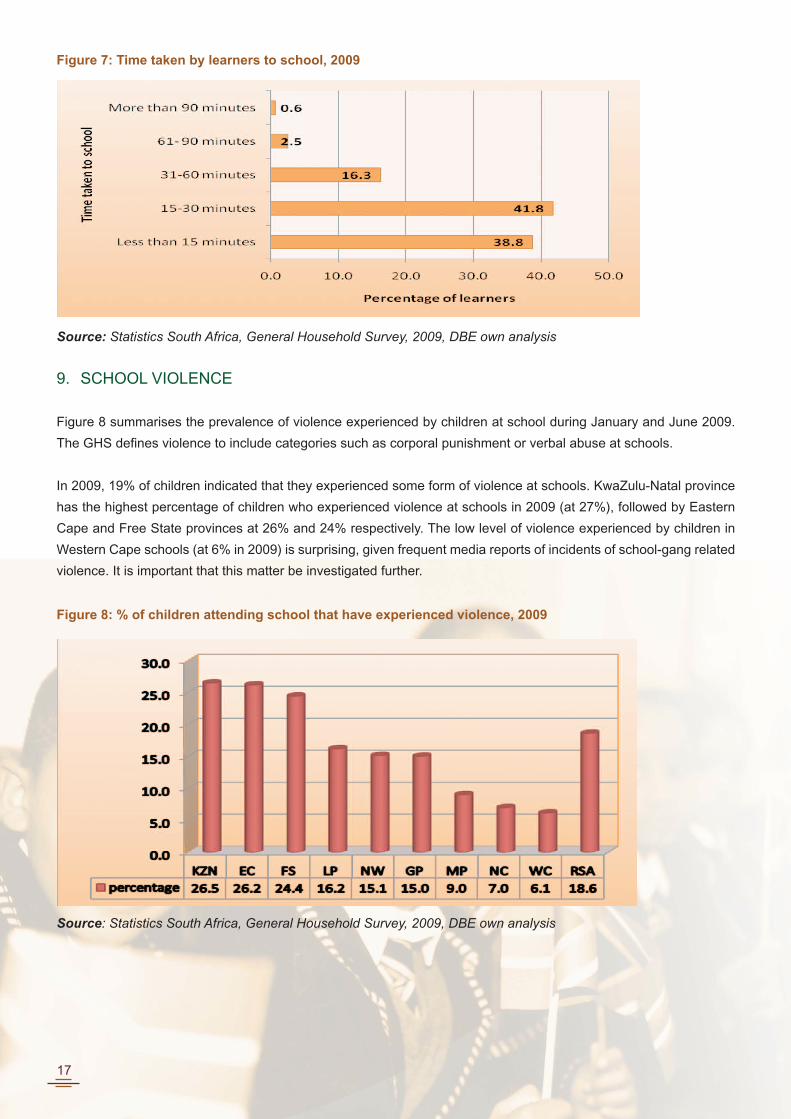
The GHS asks respondents about the time taken by learners to travel to the school they attend. The findings in Figure
7 indicate that 81% of learners take less than 30 minutes to commute to school. This shows that, in general, high
proportion of learners do not have difficulties to access their schools. However, the 19% of learners that are still taking
more than 30 minutes to travel to school is a cause of concern.
17
Figure 7: Time taken by learners to school, 2009
Source: Statistics South Africa, General Household Survey, 2009, DBE own analysis
9. SCHOOL VIOLENCE
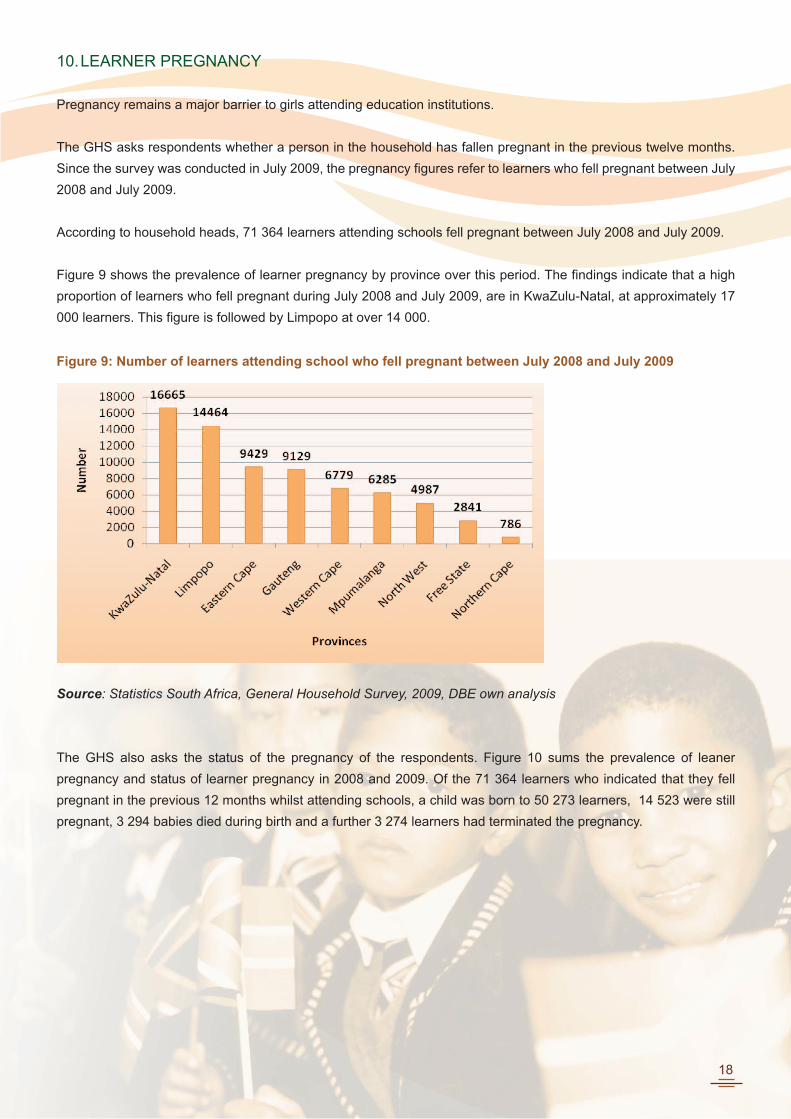
Figure 8 summarises the prevalence of violence experienced by children at school during January and June 2009.
The GHS defines violence to include categories such as corporal punishment or verbal abuse at schools.
In 2009, 19% of children indicated that they experienced some form of violence at schools. KwaZulu-Natal province
has the highest percentage of children who experienced violence at schools in 2009 (at 27%), followed by Eastern
Cape and Free State provinces at 26% and 24% respectively. The low level of violence experienced by children in
Western Cape schools (at 6% in 2009) is surprising, given frequent media reports of incidents of school-gang related
violence. It is important that this matter be investigated further.
Figure 8: % of children attending school that have experienced violence, 2009
Source: Statistics South Africa, General Household Survey, 2009, DBE own analysis
18
10. LEARNER PREGNANCY
Pregnancy remains a major barrier to girls attending education institutions.
The GHS asks respondents whether a person in the household has fallen pregnant in the previous twelve months.
Since the survey was conducted in July 2009, the pregnancy figures refer to learners who fell pregnant between July
2008 and July 2009.
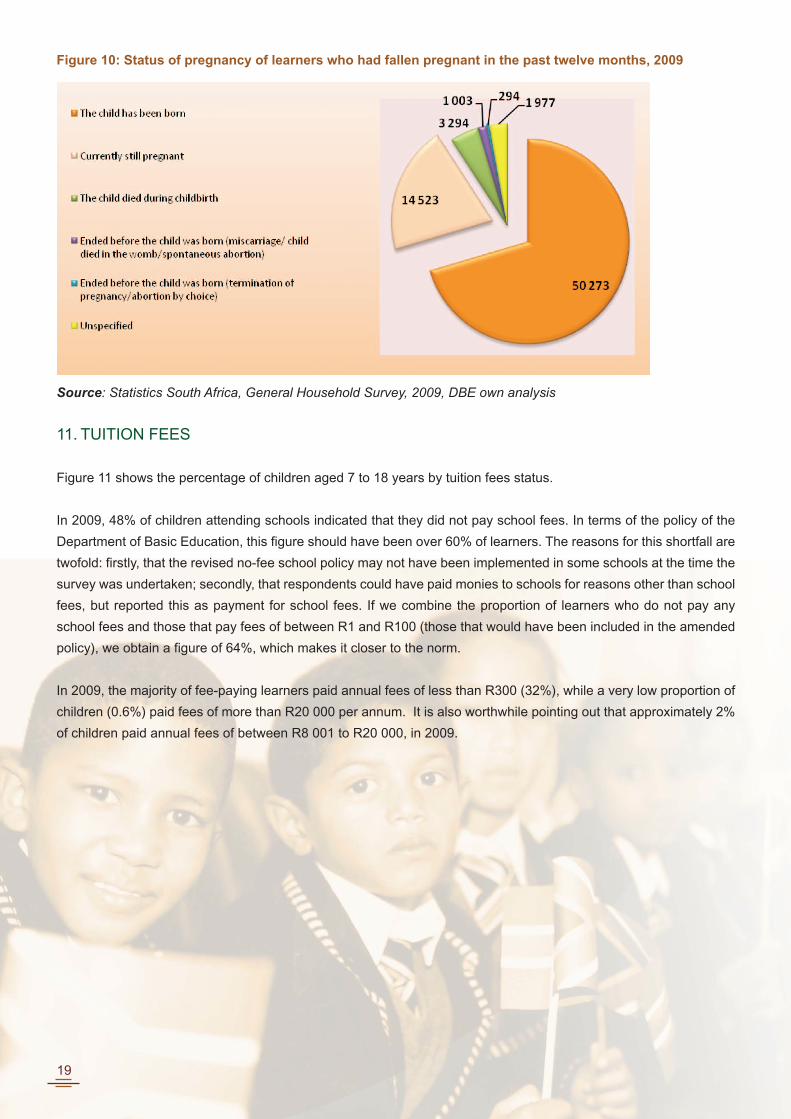
According to household heads, 71 364 learners attending schools fell pregnant between July 2008 and July 2009.
Figure 9 shows the prevalence of learner pregnancy by province over this period. The findings indicate that a high
proportion of learners who fell pregnant during July 2008 and July 2009, are in KwaZulu-Natal, at approximately 17
000 learners. This figure is followed by Limpopo at over 14 000.
Figure 9: Number of learners attending school who fell pregnant between July 2008 and July 2009
Source: Statistics South Africa, General Household Survey, 2009, DBE own analysis
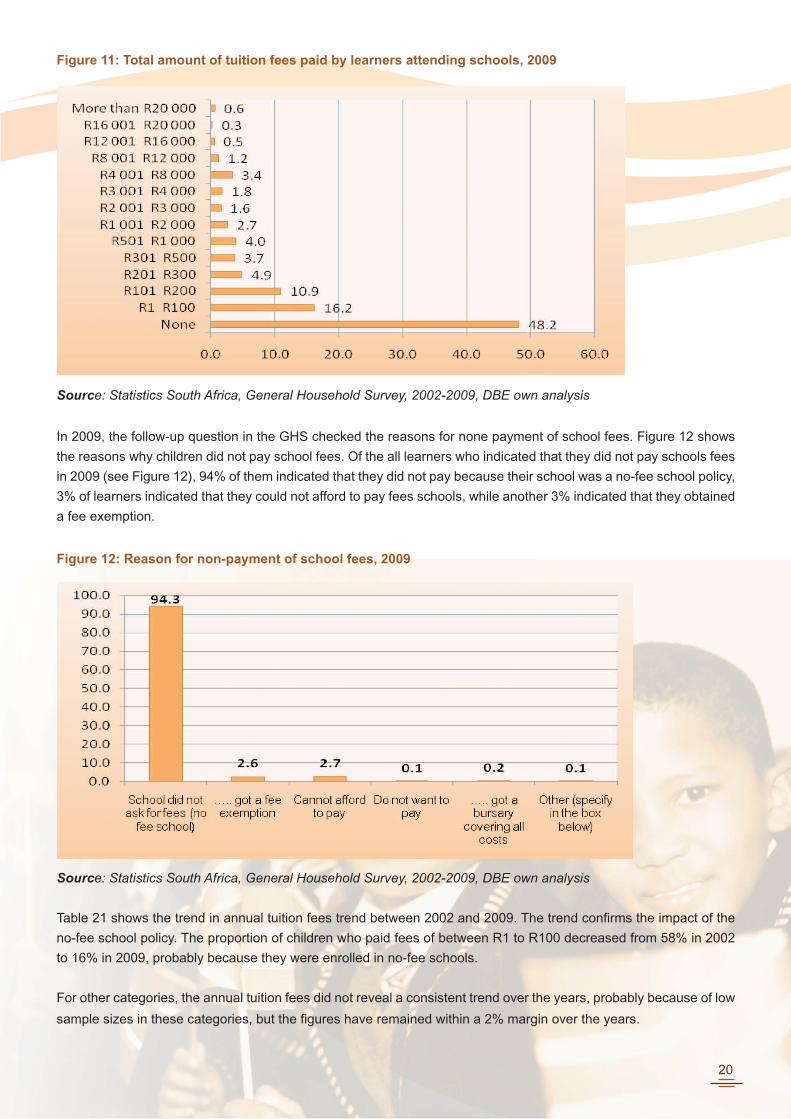
The GHS also asks the status of the pregnancy of the respondents. Figure 10 sums the prevalence of leaner
pregnancy and status of learner pregnancy in 2008 and 2009. Of the 71 364 learners who indicated that they fell
pregnant in the previous 12 months whilst attending schools, a child was born to 50 273 learners, 14 523 were still
pregnant, 3 294 babies died during birth and a further 3 274 learners had terminated the pregnancy.
19
Figure 10: Status of pregnancy of learners who had fallen pregnant in the past twelve months, 2009
Source: Statistics South Africa, General Household Survey, 2009, DBE own analysis
11. TUITION FEES
Figure 11 shows the percentage of children aged 7 to 18 years by tuition fees status.
In 2009, 48% of children attending schools indicated that they did not pay school fees. In terms of the policy of the
Department of Basic Education, this figure should have been over 60% of learners. The reasons for this shortfall are
twofold: firstly, that the revised no-fee school policy may not have been implemented in some schools at the time the
survey was undertaken; secondly, that respondents could have paid monies to schools for reasons other than school
fees, but reported this as payment for school fees. If we combine the proportion of learners who do not pay any
school fees and those that pay fees of between R1 and R100 (those that would have been included in the amended
policy), we obtain a figure of 64%, which makes it closer to the norm.
In 2009, the majority of fee-paying learners paid annual fees of less than R300 (32%), while a very low proportion of
children (0.6%) paid fees of more than R20 000 per annum. It is also worthwhile pointing out that approximately 2%
of children paid annual fees of between R8 001 to R20 000, in 2009.
20
Figure 11: Total amount of tuition fees paid by learners attending schools, 2009
Source: Statistics South Africa, General Household Survey, 2002-2009, DBE own analysis
In 2009, the follow-up question in the GHS checked the reasons for none payment of school fees. Figure 12 shows
the reasons why children did not pay school fees. Of the all learners who indicated that they did not pay schools fees
in 2009 (see Figure 12), 94% of them indicated that they did not pay because their school was a no-fee school policy,
3% of learners indicated that they could not afford to pay fees schools, while another 3% indicated that they obtained
a fee exemption.
Figure 12: Reason for non-payment of school fees, 2009
Source: Statistics South Africa, General Household Survey, 2002-2009, DBE own analysis
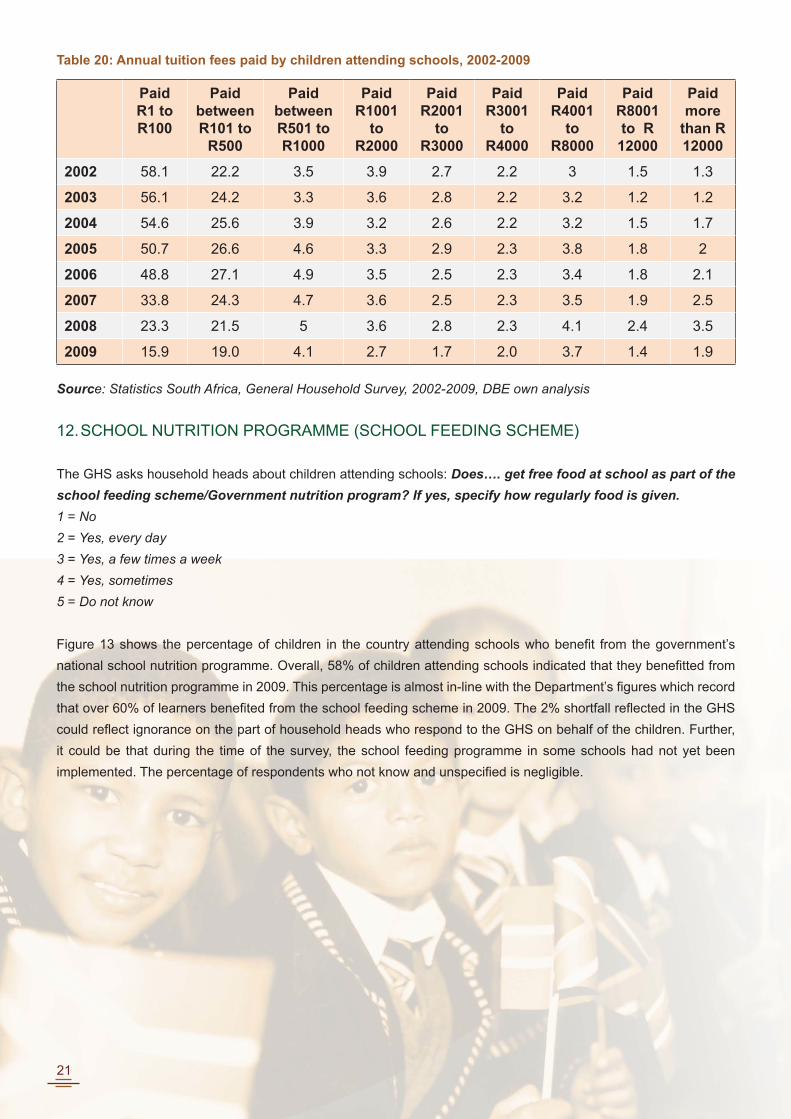
Table 21 shows the trend in annual tuition fees trend between 2002 and 2009. The trend confirms the impact of the
no-fee school policy. The proportion of children who paid fees of between R1 to R100 decreased from 58% in 2002
to 16% in 2009, probably because they were enrolled in no-fee schools.
For other categories, the annual tuition fees did not reveal a consistent trend over the years, probably because of low
sample sizes in these categories, but the figures have remained within a 2% margin over the years.
21
Table 20: Annual tuition fees paid by children attending schools, 2002-2009
Paid R1 to R100
Paid between R101 to
R500
Paid between R501 to R1000
Paid R1001
to R2000
Paid R2001
to R3000
Paid R3001
to R4000
Paid R4001
to R8000
Paid R8001 to R
12000
Paid more
than R 12000
2002 58.1 22.2 3.5 3.9 2.7 2.2 3 1.5 1.3
2003 56.1 24.2 3.3 3.6 2.8 2.2 3.2 1.2 1.2
2004 54.6 25.6 3.9 3.2 2.6 2.2 3.2 1.5 1.7
2005 50.7 26.6 4.6 3.3 2.9 2.3 3.8 1.8 2
2006 48.8 27.1 4.9 3.5 2.5 2.3 3.4 1.8 2.1
2007 33.8 24.3 4.7 3.6 2.5 2.3 3.5 1.9 2.5
2008 23.3 21.5 5 3.6 2.8 2.3 4.1 2.4 3.5
2009 15.9 19.0 4.1 2.7 1.7 2.0 3.7 1.4 1.9
Source: Statistics South Africa, General Household Survey, 2002-2009, DBE own analysis
12. SCHOOL NUTRITION PROGRAMME (SCHOOL FEEDING SCHEME)
The GHS asks household heads about children attending schools: Does…. get free food at school as part of the
school feeding scheme/Government nutrition program? If yes, specify how regularly food is given.
1 = No
2 = Yes, every day
3 = Yes, a few times a week
4 = Yes, sometimes
5 = Do not know
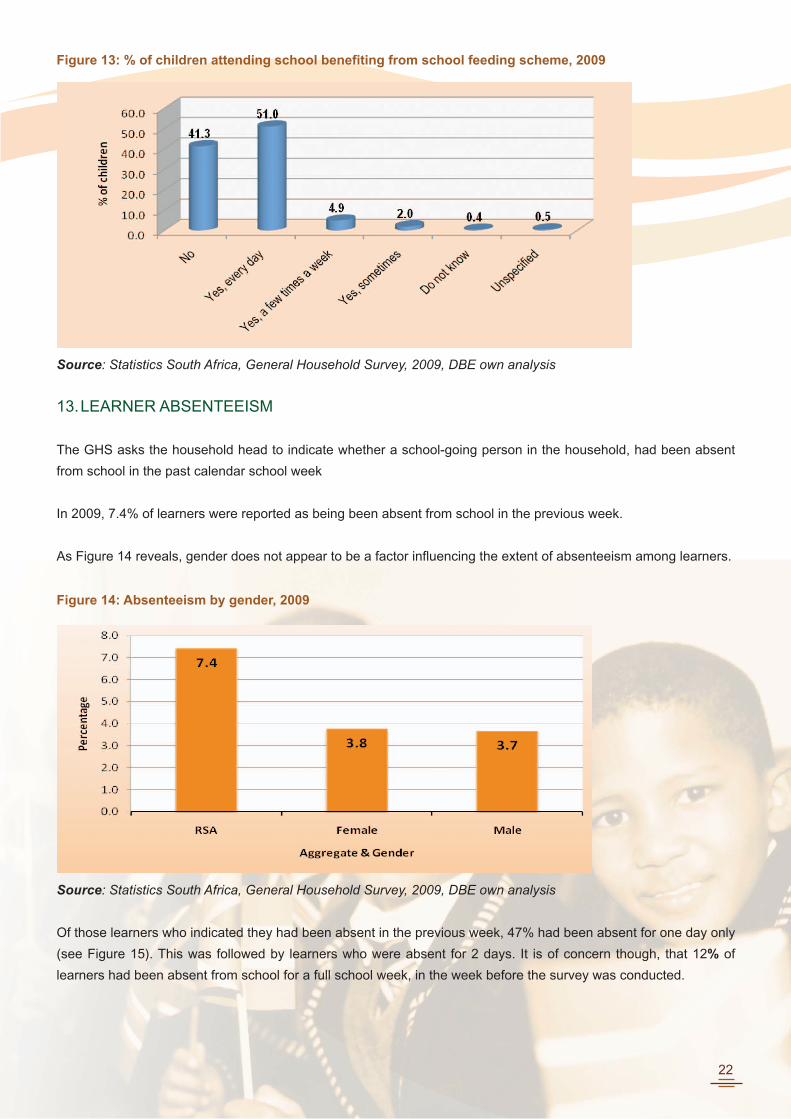
Figure 13 shows the percentage of children in the country attending schools who benefit from the government’s
national school nutrition programme. Overall, 58% of children attending schools indicated that they benefitted from
the school nutrition programme in 2009. This percentage is almost in-line with the Department’s figures which record
that over 60% of learners benefited from the school feeding scheme in 2009. The 2% shortfall reflected in the GHS
could reflect ignorance on the part of household heads who respond to the GHS on behalf of the children. Further,
it could be that during the time of the survey, the school feeding programme in some schools had not yet been
implemented. The percentage of respondents who not know and unspecified is negligible.
22
Figure 13: % of children attending school benefiting from school feeding scheme, 2009
Source: Statistics South Africa, General Household Survey, 2009, DBE own analysis
13. LEARNER ABSENTEEISM
The GHS asks the household head to indicate whether a school-going person in the household, had been absent
from school in the past calendar school week
In 2009, 7.4% of learners were reported as being been absent from school in the previous week.
As Figure 14 reveals, gender does not appear to be a factor influencing the extent of absenteeism among learners.
Figure 14: Absenteeism by gender, 2009
Source: Statistics South Africa, General Household Survey, 2009, DBE own analysis
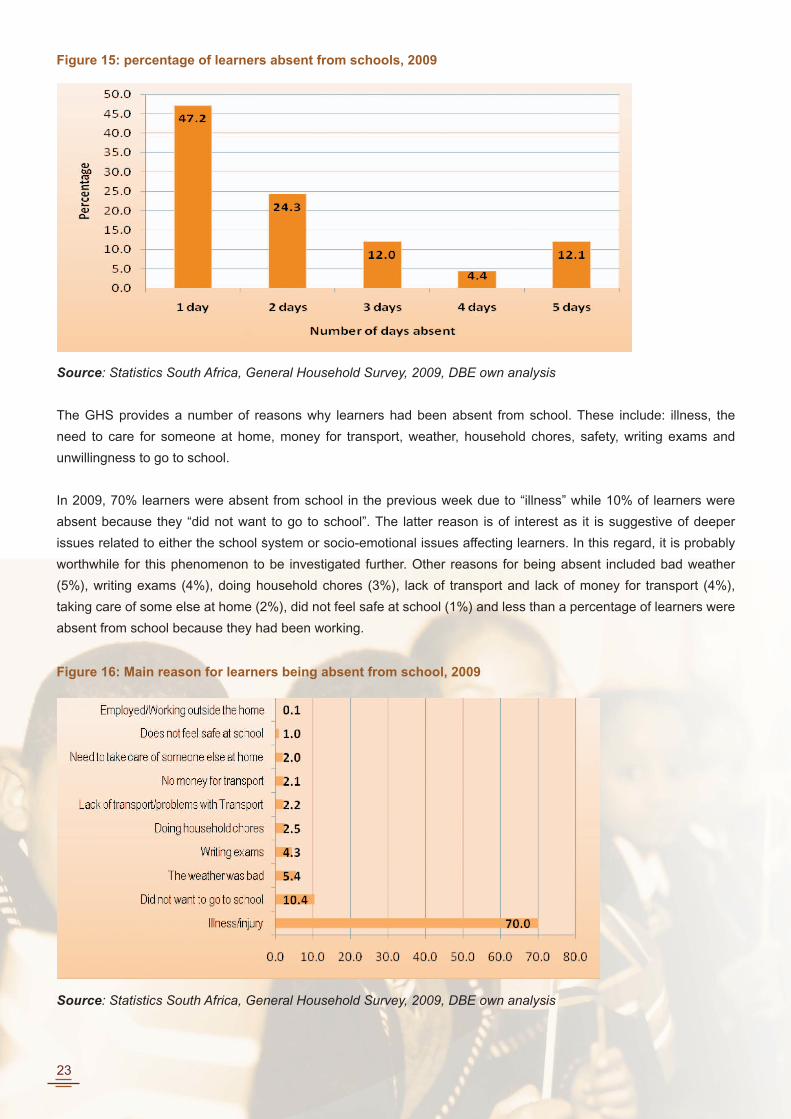
Of those learners who indicated they had been absent in the previous week, 47% had been absent for one day only
(see Figure 15). This was followed by learners who were absent for 2 days. It is of concern though, that 12% of
learners had been absent from school for a full school week, in the week before the survey was conducted.
23
Figure 15: percentage of learners absent from schools, 2009
Source: Statistics South Africa, General Household Survey, 2009, DBE own analysis
The GHS provides a number of reasons why learners had been absent from school. These include: illness, the
need to care for someone at home, money for transport, weather, household chores, safety, writing exams and
unwillingness to go to school.
In 2009, 70% learners were absent from school in the previous week due to “illness” while 10% of learners were
absent because they “did not want to go to school”. The latter reason is of interest as it is suggestive of deeper
issues related to either the school system or socio-emotional issues affecting learners. In this regard, it is probably
worthwhile for this phenomenon to be investigated further. Other reasons for being absent included bad weather
(5%), writing exams (4%), doing household chores (3%), lack of transport and lack of money for transport (4%),
taking care of some else at home (2%), did not feel safe at school (1%) and less than a percentage of learners were
absent from school because they had been working.
Figure 16: Main reason for learners being absent from school, 2009
Source: Statistics South Africa, General Household Survey, 2009, DBE own analysis
24
14. PERCENTAGE OF REPEATERS
For the first time in 2009, the GHS included questions about the grade a school-going learner was in, and whether
the learner was repeating the same grade he/she had been in, in the previous year.
The percentage of repeaters is a measure of the rate at which pupils from a cohort repeat a grade, and its effect on
the internal efficiency of educational systems. It is one of the key indicators for analysing and projecting pupil flows
from grade to grade within the educational cycle.
The percentage of repeaters is calculated by dividing the number of pupils (or students) repeating a given grade in
a given school-year by the number of pupils or students enrolled in the same grade in the same school-year and
multiply by 100 (UIS, 2009).
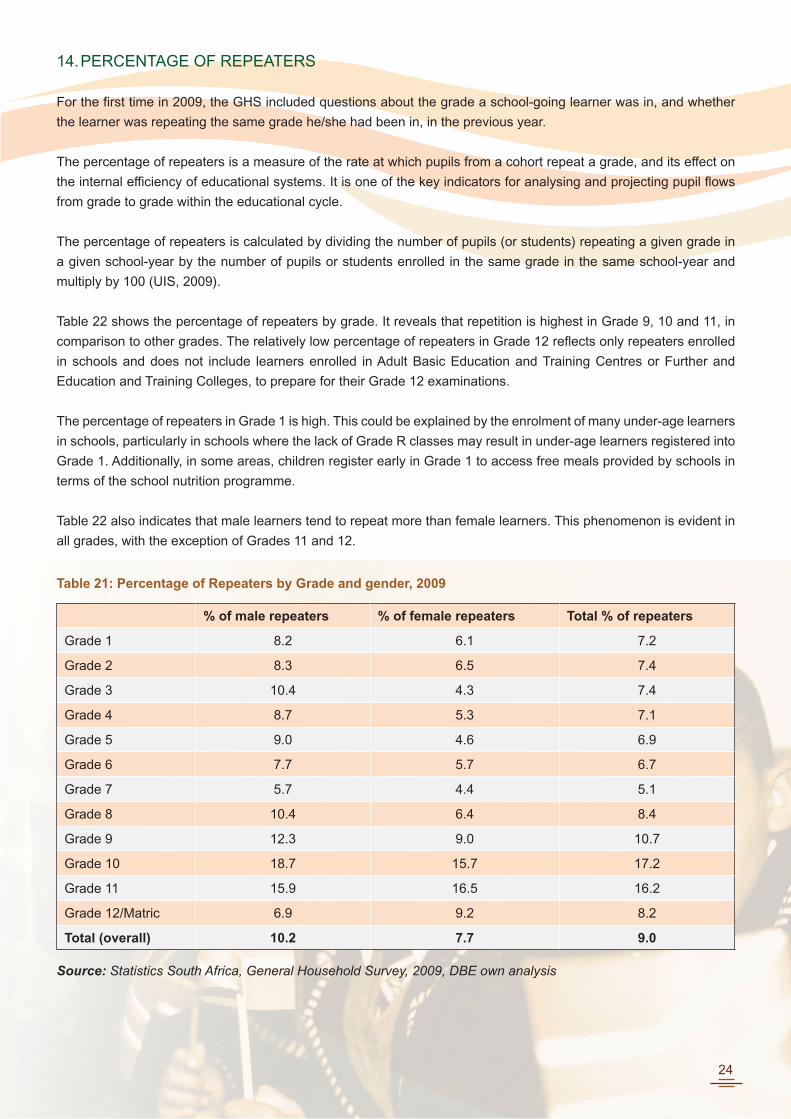
Table 22 shows the percentage of repeaters by grade. It reveals that repetition is highest in Grade 9, 10 and 11, in
comparison to other grades. The relatively low percentage of repeaters in Grade 12 reflects only repeaters enrolled
in schools and does not include learners enrolled in Adult Basic Education and Training Centres or Further and
Education and Training Colleges, to prepare for their Grade 12 examinations.
The percentage of repeaters in Grade 1 is high. This could be explained by the enrolment of many under-age learners
in schools, particularly in schools where the lack of Grade R classes may result in under-age learners registered into
Grade 1. Additionally, in some areas, children register early in Grade 1 to access free meals provided by schools in
terms of the school nutrition programme.
Table 22 also indicates that male learners tend to repeat more than female learners. This phenomenon is evident in
all grades, with the exception of Grades 11 and 12.
Table 21: Percentage of Repeaters by Grade and gender, 2009
% of male repeaters % of female repeaters Total % of repeaters
Grade 1 8.2 6.1 7.2
Grade 2 8.3 6.5 7.4
Grade 3 10.4 4.3 7.4
Grade 4 8.7 5.3 7.1
Grade 5 9.0 4.6 6.9
Grade 6 7.7 5.7 6.7
Grade 7 5.7 4.4 5.1
Grade 8 10.4 6.4 8.4
Grade 9 12.3 9.0 10.7
Grade 10 18.7 15.7 17.2
Grade 11 15.9 16.5 16.2
Grade 12/Matric 6.9 9.2 8.2
Total (overall) 10.2 7.7 9.0
Source: Statistics South Africa, General Household Survey, 2009, DBE own analysis
25
15. DISABILITY
The Department’s White Paper 6 (DoE, 2001) outlines government’s commitment to the provision of education
opportunities to learners who experience or have experienced barriers to learning and development.
The General Household Survey defines disability as a “physical or mental handicap which has lasted for six months
or more which prevents the person from carrying out daily activities independently, or from participating fully in
educational, economic or social activities”.
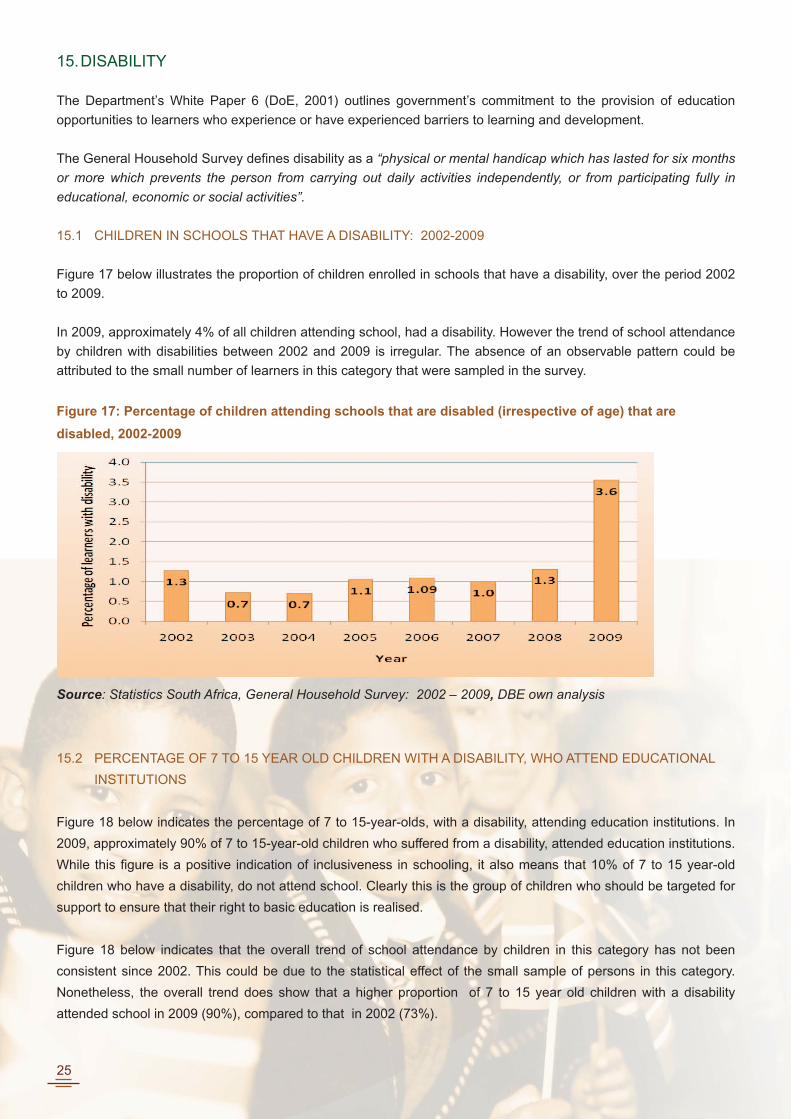
15.1 CHILDREN IN SCHOOLS THAT HAVE A DISABILITY: 2002-2009
Figure 17 below illustrates the proportion of children enrolled in schools that have a disability, over the period 2002
to 2009.
In 2009, approximately 4% of all children attending school, had a disability. However the trend of school attendance
by children with disabilities between 2002 and 2009 is irregular. The absence of an observable pattern could be
attributed to the small number of learners in this category that were sampled in the survey.
Figure 17: Percentage of children attending schools that are disabled (irrespective of age) that are
disabled, 2002-2009
Source: Statistics South Africa, General Household Survey: 2002 – 2009, DBE own analysis
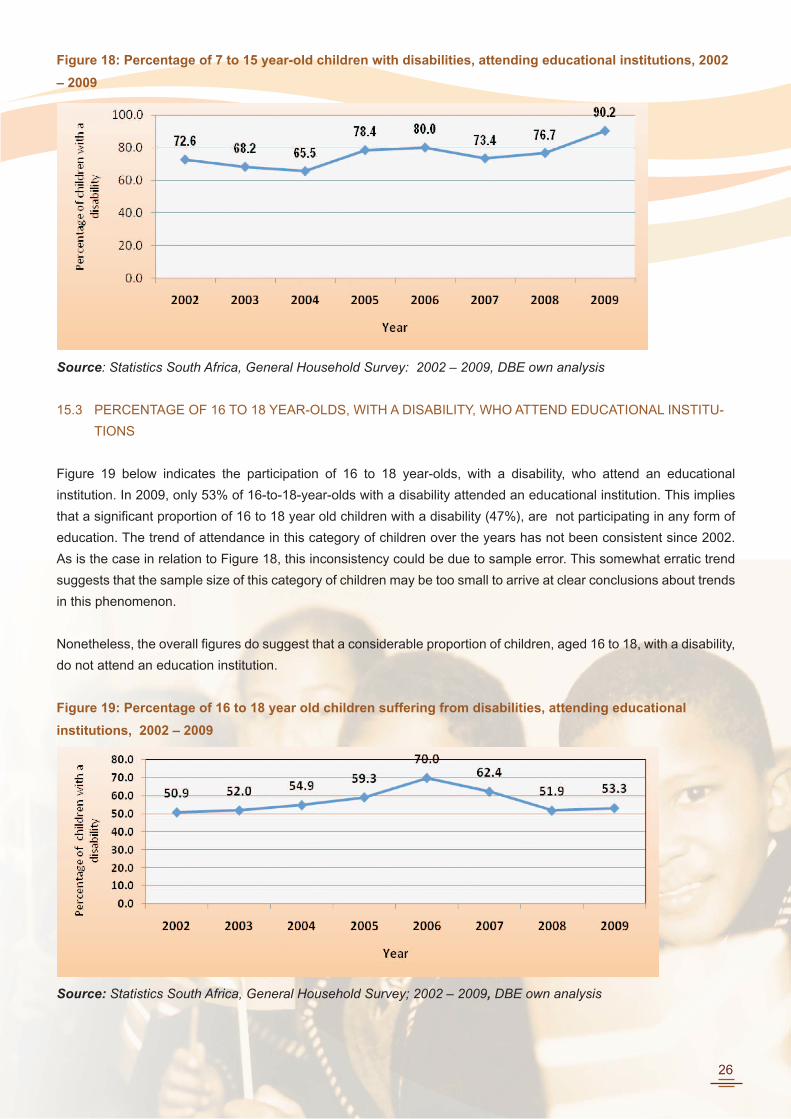
15.2 PERCENTAGE OF 7 TO 15 YEAR OLD CHILDREN WITH A DISABILITY, WHO ATTEND EDUCATIONAL
INSTITUTIONS
Figure 18 below indicates the percentage of 7 to 15-year-olds, with a disability, attending education institutions. In
2009, approximately 90% of 7 to 15-year-old children who suffered from a disability, attended education institutions.
While this figure is a positive indication of inclusiveness in schooling, it also means that 10% of 7 to 15 year-old
children who have a disability, do not attend school. Clearly this is the group of children who should be targeted for
support to ensure that their right to basic education is realised.
Figure 18 below indicates that the overall trend of school attendance by children in this category has not been
consistent since 2002. This could be due to the statistical effect of the small sample of persons in this category.
Nonetheless, the overall trend does show that a higher proportion of 7 to 15 year old children with a disability
attended school in 2009 (90%), compared to that in 2002 (73%).
26
Figure 18: Percentage of 7 to 15 year-old children with disabilities, attending educational institutions, 2002
– 2009
Source: Statistics South Africa, General Household Survey: 2002 – 2009, DBE own analysis
15.3 PERCENTAGE OF 16 TO 18 YEAR-OLDS, WITH A DISABILITY, WHO ATTEND EDUCATIONAL INSTITU-
TIONS
Figure 19 below indicates the participation of 16 to 18 year-olds, with a disability, who attend an educational
institution. In 2009, only 53% of 16-to-18-year-olds with a disability attended an educational institution. This implies
that a significant proportion of 16 to 18 year old children with a disability (47%), are not participating in any form of
education. The trend of attendance in this category of children over the years has not been consistent since 2002.
As is the case in relation to Figure 18, this inconsistency could be due to sample error. This somewhat erratic trend
suggests that the sample size of this category of children may be too small to arrive at clear conclusions about trends
in this phenomenon.
Nonetheless, the overall figures do suggest that a considerable proportion of children, aged 16 to 18, with a disability,
do not attend an education institution.
Figure 19: Percentage of 16 to 18 year old children suffering from disabilities, attending educational
institutions, 2002 – 2009
Source: Statistics South Africa, General Household Survey; 2002 – 2009, DBE own analysis
27
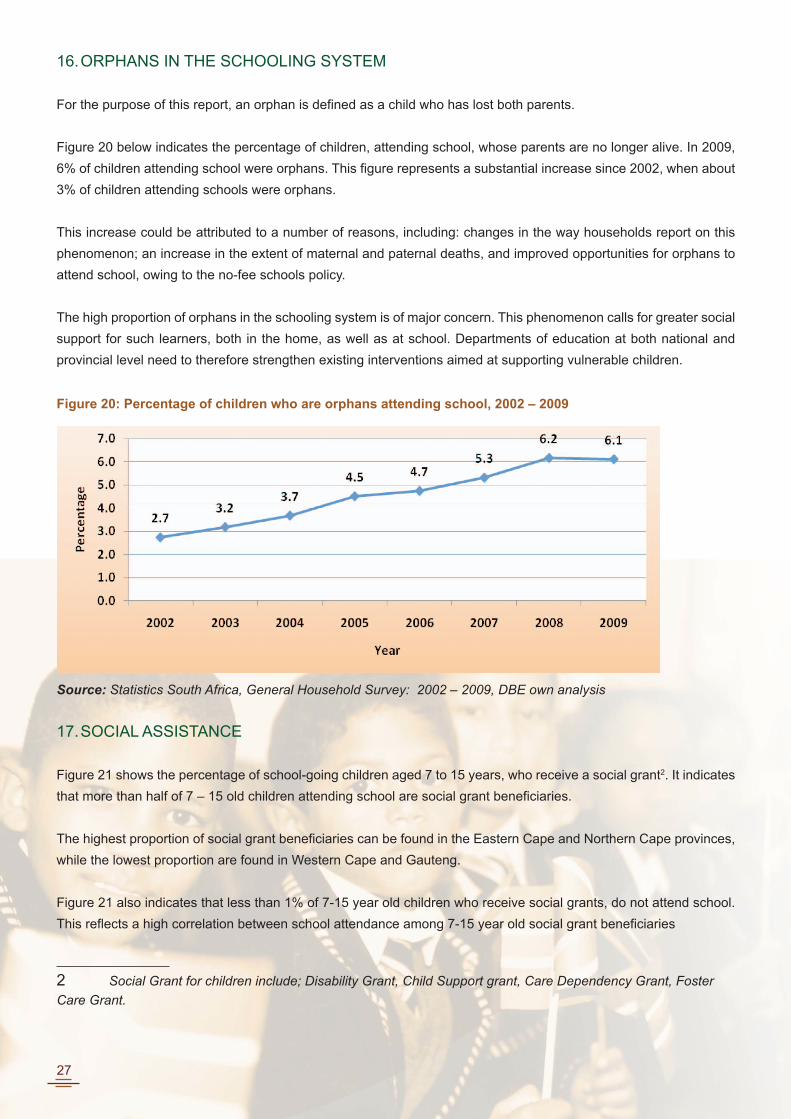
16. ORPHANS IN THE SCHOOLING SYSTEM
For the purpose of this report, an orphan is defined as a child who has lost both parents.
Figure 20 below indicates the percentage of children, attending school, whose parents are no longer alive. In 2009,
6% of children attending school were orphans. This figure represents a substantial increase since 2002, when about
3% of children attending schools were orphans.
This increase could be attributed to a number of reasons, including: changes in the way households report on this
phenomenon; an increase in the extent of maternal and paternal deaths, and improved opportunities for orphans to
attend school, owing to the no-fee schools policy.
The high proportion of orphans in the schooling system is of major concern. This phenomenon calls for greater social
support for such learners, both in the home, as well as at school. Departments of education at both national and
provincial level need to therefore strengthen existing interventions aimed at supporting vulnerable children.
Figure 20: Percentage of children who are orphans attending school, 2002 – 2009
Source: Statistics South Africa, General Household Survey: 2002 – 2009, DBE own analysis
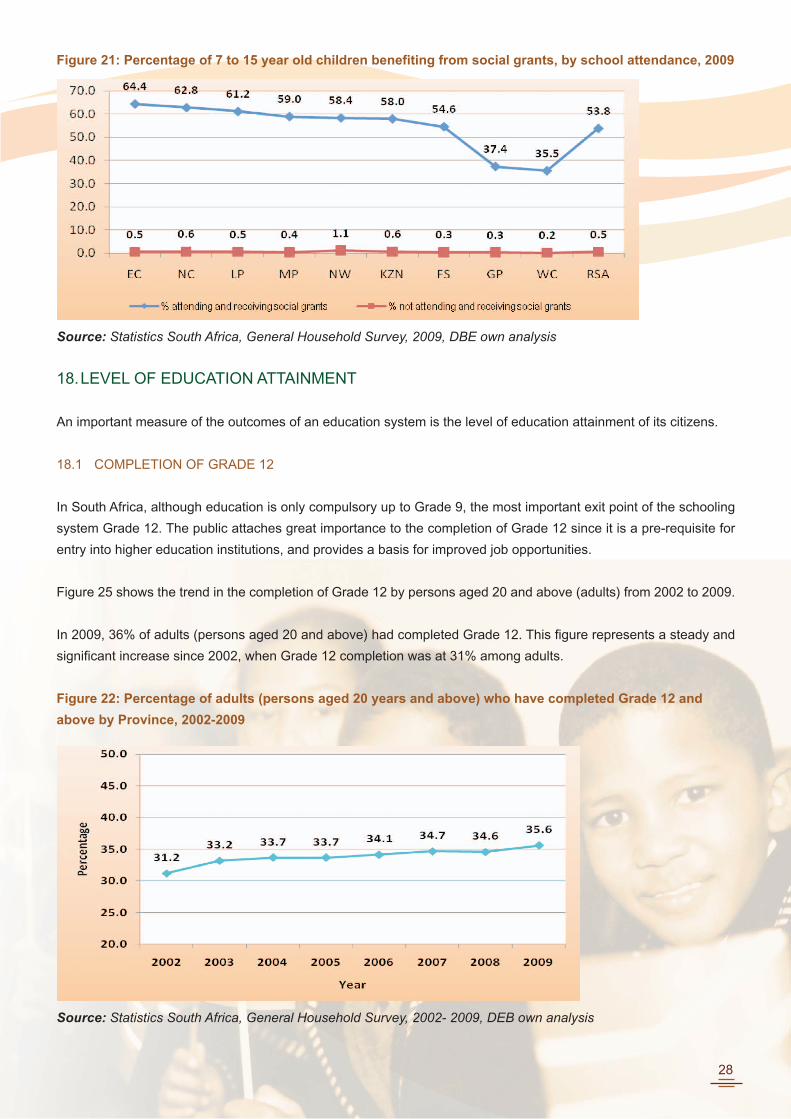
17. SOCIAL ASSISTANCE
Figure 21 shows the percentage of school-going children aged 7 to 15 years, who receive a social grant2. It indicates
that more than half of 7 – 15 old children attending school are social grant beneficiaries.
The highest proportion of social grant beneficiaries can be found in the Eastern Cape and Northern Cape provinces,
while the lowest proportion are found in Western Cape and Gauteng.
Figure 21 also indicates that less than 1% of 7-15 year old children who receive social grants, do not attend school.
This reflects a high correlation between school attendance among 7-15 year old social grant beneficiaries
2 Social Grant for children include; Disability Grant, Child Support grant, Care Dependency Grant, Foster
Care Grant.
28
Figure 21: Percentage of 7 to 15 year old children benefiting from social grants, by school attendance, 2009
Source: Statistics South Africa, General Household Survey, 2009, DBE own analysis
18. LEVEL OF EDUCATION ATTAINMENT
An important measure of the outcomes of an education system is the level of education attainment of its citizens.
18.1 COMPLETION OF GRADE 12
In South Africa, although education is only compulsory up to Grade 9, the most important exit point of the schooling
system Grade 12. The public attaches great importance to the completion of Grade 12 since it is a pre-requisite for
entry into higher education institutions, and provides a basis for improved job opportunities.
Figure 25 shows the trend in the completion of Grade 12 by persons aged 20 and above (adults) from 2002 to 2009.
In 2009, 36% of adults (persons aged 20 and above) had completed Grade 12. This figure represents a steady and
significant increase since 2002, when Grade 12 completion was at 31% among adults.
Figure 22: Percentage of adults (persons aged 20 years and above) who have completed Grade 12 and
above by Province, 2002-2009
Source: Statistics South Africa, General Household Survey, 2002- 2009, DEB own analysis
29
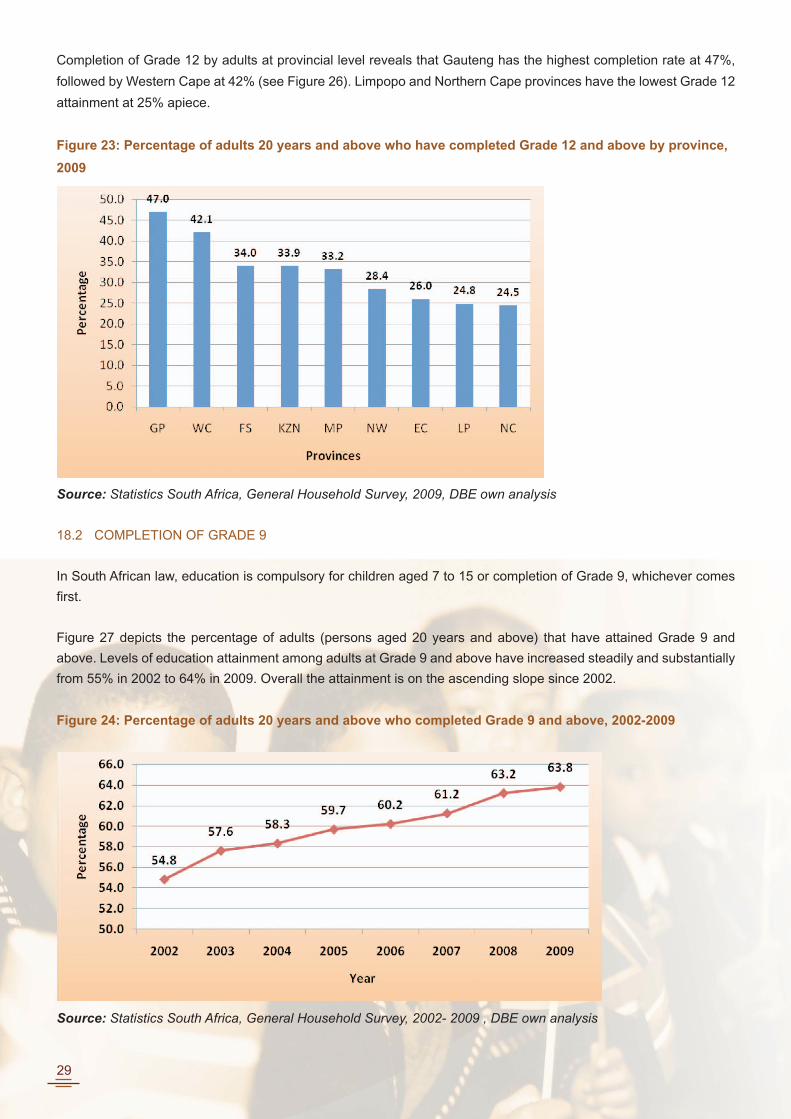
Completion of Grade 12 by adults at provincial level reveals that Gauteng has the highest completion rate at 47%,
followed by Western Cape at 42% (see Figure 26). Limpopo and Northern Cape provinces have the lowest Grade 12
attainment at 25% apiece.
Figure 23: Percentage of adults 20 years and above who have completed Grade 12 and above by province,
2009
Source: Statistics South Africa, General Household Survey, 2009, DBE own analysis
18.2 COMPLETION OF GRADE 9
In South African law, education is compulsory for children aged 7 to 15 or completion of Grade 9, whichever comes
first.
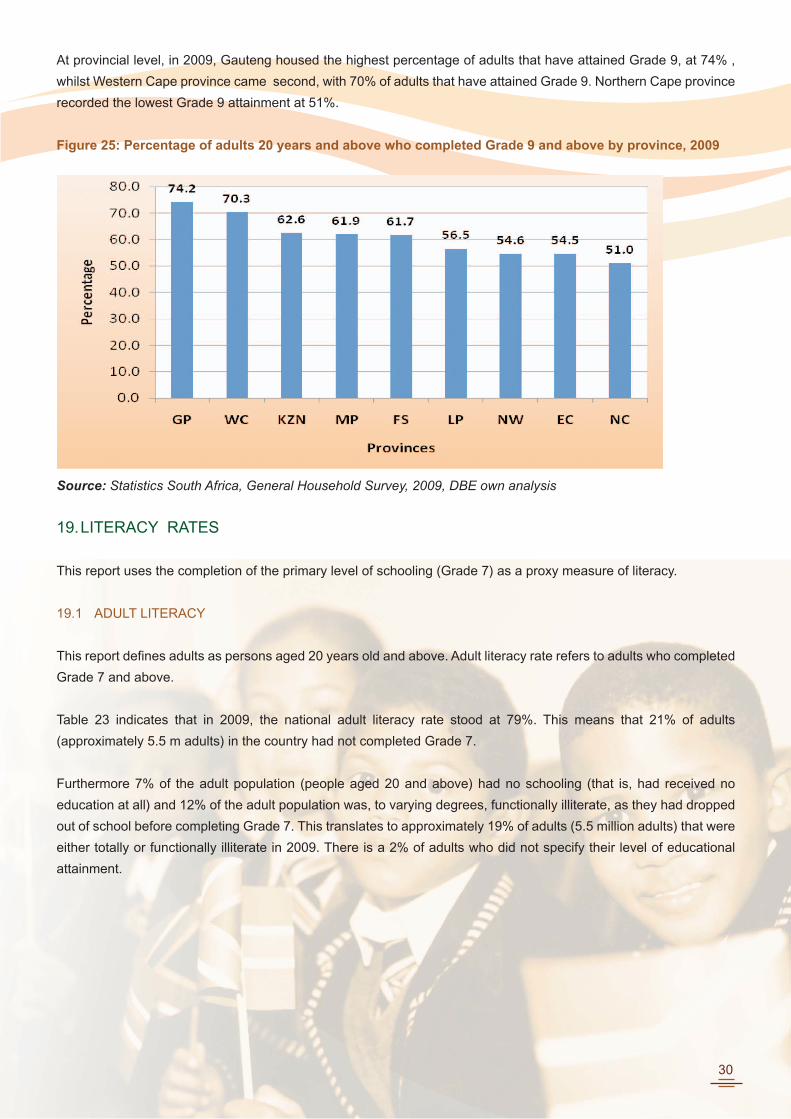
Figure 27 depicts the percentage of adults (persons aged 20 years and above) that have attained Grade 9 and
above. Levels of education attainment among adults at Grade 9 and above have increased steadily and substantially
from 55% in 2002 to 64% in 2009. Overall the attainment is on the ascending slope since 2002.
Figure 24: Percentage of adults 20 years and above who completed Grade 9 and above, 2002-2009
Source: Statistics South Africa, General Household Survey, 2002- 2009 , DBE own analysis
30
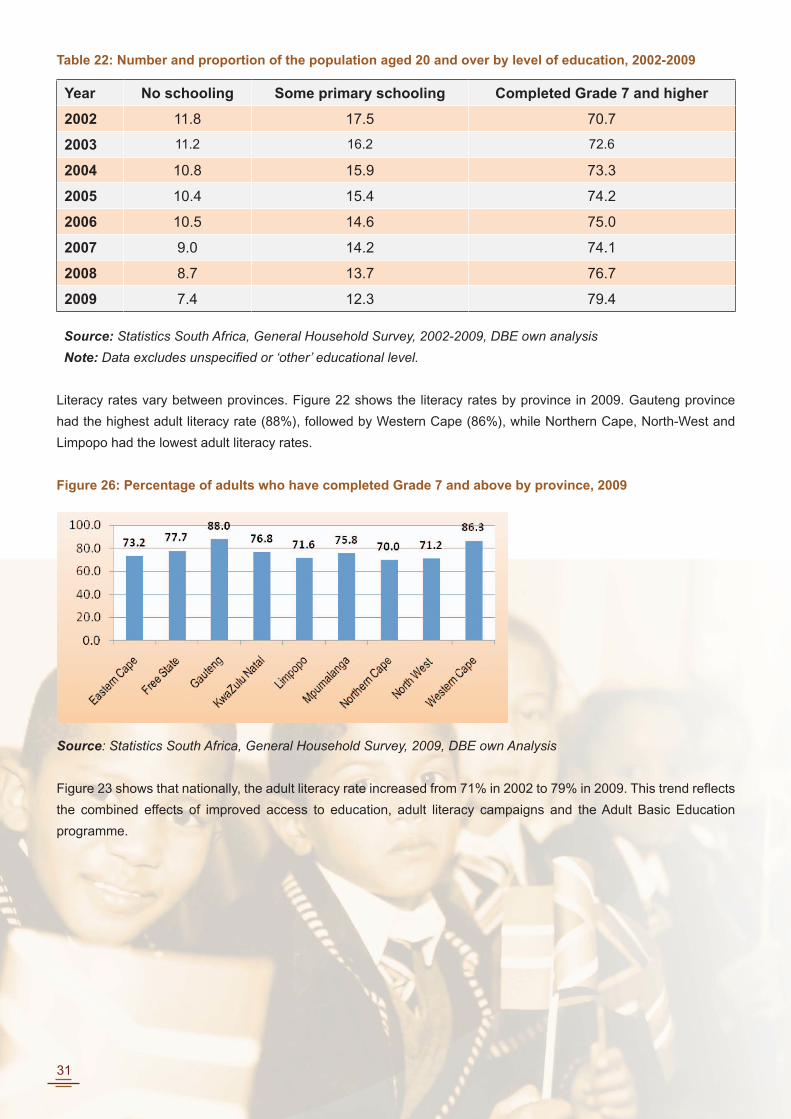
At provincial level, in 2009, Gauteng housed the highest percentage of adults that have attained Grade 9, at 74% ,
whilst Western Cape province came second, with 70% of adults that have attained Grade 9. Northern Cape province
recorded the lowest Grade 9 attainment at 51%.
Figure 25: Percentage of adults 20 years and above who completed Grade 9 and above by province, 2009
Source: Statistics South Africa, General Household Survey, 2009, DBE own analysis
19. LITERACY RATES
This report uses the completion of the primary level of schooling (Grade 7) as a proxy measure of literacy.
19.1 ADULT LITERACY
This report defines adults as persons aged 20 years old and above. Adult literacy rate refers to adults who completed
Grade 7 and above.
Table 23 indicates that in 2009, the national adult literacy rate stood at 79%. This means that 21% of adults
(approximately 5.5 m adults) in the country had not completed Grade 7.
Furthermore 7% of the adult population (people aged 20 and above) had no schooling (that is, had received no
education at all) and 12% of the adult population was, to varying degrees, functionally illiterate, as they had dropped
out of school before completing Grade 7. This translates to approximately 19% of adults (5.5 million adults) that were
either totally or functionally illiterate in 2009. There is a 2% of adults who did not specify their level of educational
attainment.
31
Table 22: Number and proportion of the population aged 20 and over by level of education, 2002-2009
Year No schooling Some primary schooling Completed Grade 7 and higher
2002 11.8 17.5 70.7
2003 11.2 16.2 72.6
2004 10.8 15.9 73.3
2005 10.4 15.4 74.2
2006 10.5 14.6 75.0
2007 9.0 14.2 74.1
2008 8.7 13.7 76.7
2009 7.4 12.3 79.4
Source: Statistics South Africa, General Household Survey, 2002-2009, DBE own analysis
Note: Data excludes unspecified or ‘other’ educational level.
Literacy rates vary between provinces. Figure 22 shows the literacy rates by province in 2009. Gauteng province
had the highest adult literacy rate (88%), followed by Western Cape (86%), while Northern Cape, North-West and
Limpopo had the lowest adult literacy rates.
Figure 26: Percentage of adults who have completed Grade 7 and above by province, 2009
Source: Statistics South Africa, General Household Survey, 2009, DBE own Analysis
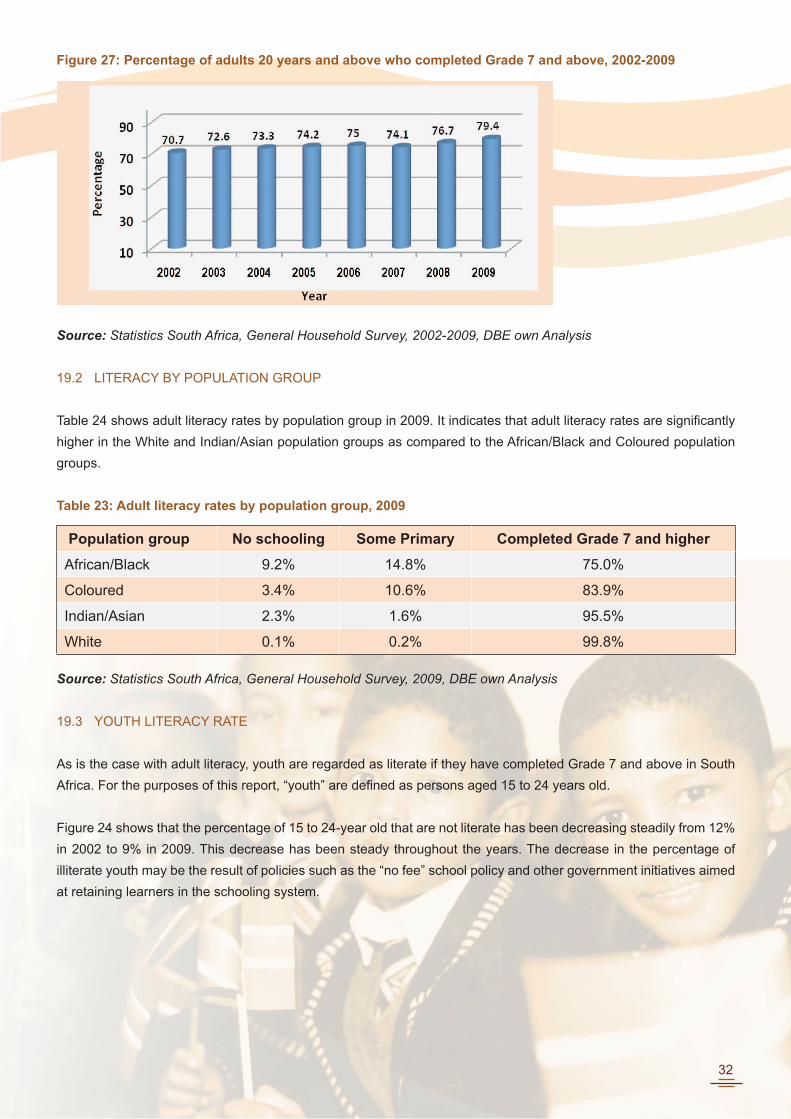
Figure 23 shows that nationally, the adult literacy rate increased from 71% in 2002 to 79% in 2009. This trend reflects
the combined effects of improved access to education, adult literacy campaigns and the Adult Basic Education
programme.
32
Figure 27: Percentage of adults 20 years and above who completed Grade 7 and above, 2002-2009
Source: Statistics South Africa, General Household Survey, 2002-2009, DBE own Analysis
19.2 LITERACY BY POPULATION GROUP
Table 24 shows adult literacy rates by population group in 2009. It indicates that adult literacy rates are significantly
higher in the White and Indian/Asian population groups as compared to the African/Black and Coloured population
groups.
Table 23: Adult literacy rates by population group, 2009
Population group No schooling Some Primary Completed Grade 7 and higher
African/Black 9.2% 14.8% 75.0%
Coloured 3.4% 10.6% 83.9%
Indian/Asian 2.3% 1.6% 95.5%
White 0.1% 0.2% 99.8%
Source: Statistics South Africa, General Household Survey, 2009, DBE own Analysis
19.3 YOUTH LITERACY RATE
As is the case with adult literacy, youth are regarded as literate if they have completed Grade 7 and above in South
Africa. For the purposes of this report, “youth” are defined as persons aged 15 to 24 years old.
Figure 24 shows that the percentage of 15 to 24-year old that are not literate has been decreasing steadily from 12%
in 2002 to 9% in 2009. This decrease has been steady throughout the years. The decrease in the percentage of
illiterate youth may be the result of policies such as the “no fee” school policy and other government initiatives aimed
at retaining learners in the schooling system.
33
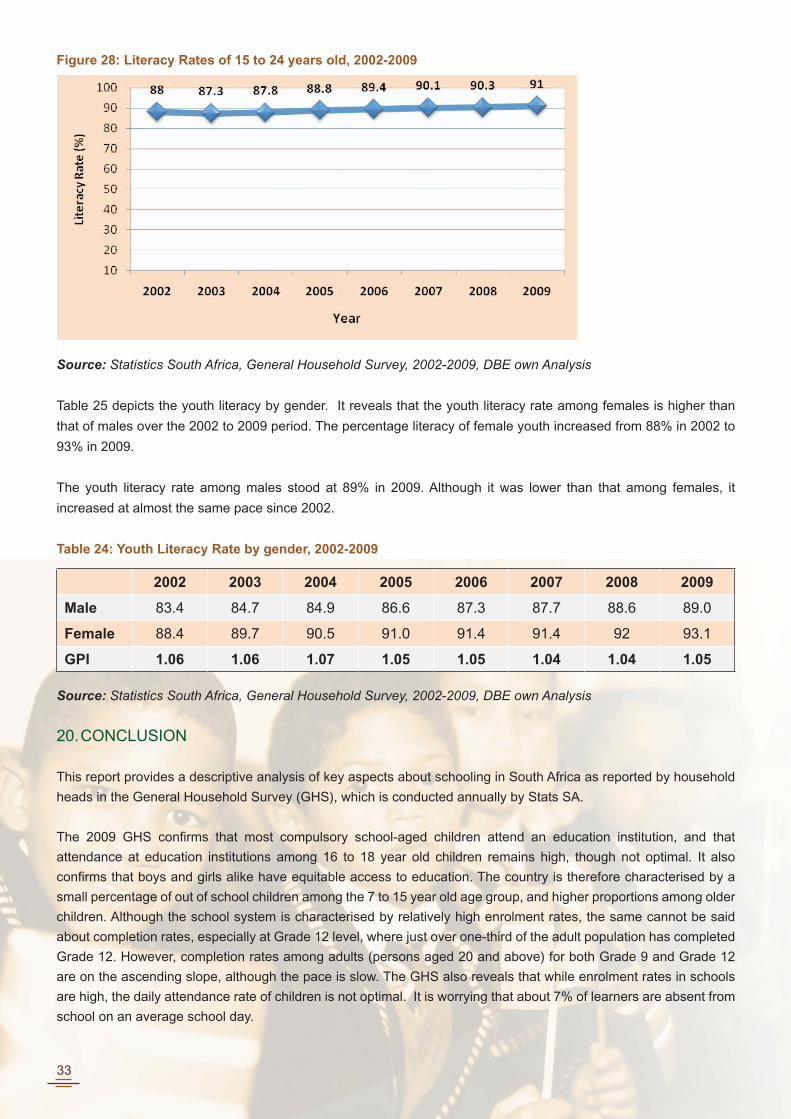
Figure 28: Literacy Rates of 15 to 24 years old, 2002-2009
Source: Statistics South Africa, General Household Survey, 2002-2009, DBE own Analysis
Table 25 depicts the youth literacy by gender. It reveals that the youth literacy rate among females is higher than
that of males over the 2002 to 2009 period. The percentage literacy of female youth increased from 88% in 2002 to
93% in 2009.
The youth literacy rate among males stood at 89% in 2009. Although it was lower than that among females, it
increased at almost the same pace since 2002.
Table 24: Youth Literacy Rate by gender, 2002-2009
2002 2003 2004 2005 2006 2007 2008 2009
Male 83.4 84.7 84.9 86.6 87.3 87.7 88.6 89.0
Female 88.4 89.7 90.5 91.0 91.4 91.4 92 93.1
GPI 1.06 1.06 1.07 1.05 1.05 1.04 1.04 1.05
Source: Statistics South Africa, General Household Survey, 2002-2009, DBE own Analysis
20. CONCLUSION
This report provides a descriptive analysis of key aspects about schooling in South Africa as reported by household
heads in the General Household Survey (GHS), which is conducted annually by Stats SA.
The 2009 GHS confirms that most compulsory school-aged children attend an education institution, and that
attendance at education institutions among 16 to 18 year old children remains high, though not optimal. It also
confirms that boys and girls alike have equitable access to education. The country is therefore characterised by a
small percentage of out of school children among the 7 to 15 year old age group, and higher proportions among older
children. Although the school system is characterised by relatively high enrolment rates, the same cannot be said
about completion rates, especially at Grade 12 level, where just over one-third of the adult population has completed
Grade 12. However, completion rates among adults (persons aged 20 and above) for both Grade 9 and Grade 12
are on the ascending slope, although the pace is slow. The GHS also reveals that while enrolment rates in schools
are high, the daily attendance rate of children is not optimal. It is worrying that about 7% of learners are absent from
school on an average school day.
34
The GHS identifies interesting reasons as to why children are not enrolled at an education institution. Financial
barriers, “schooling is uninteresting” and failing a grade are key reasons why children do not attend school or any
other education institution.
Household heads confirm the high proportion of school-going children that benefit from the school nutrition programme.
The survey also confirms increased benefits experienced by households with respect to school-fees as a result of the
no-fee school policy. However, households reported that their children experienced the following problems at school:
lack of books, poor teaching, poor facilities and overcrowded classes. However, the proportion of learners purported
to be experiencing these problems is generally quite low. A worrying phenomenon from the findings is the prevalence
of violence against learners in the form of verbal abuse and corporal punishment by both the educators and other
learners. An additional problem is that close to one-fifth of learners take more than one hour to travel to school.
The basic quantitative information reflected in this report provides a macro-perspective and an overview of some
aspects of schooling in South Africa. It provides a useful basis for further and deeper analysis of the GHS itself and
lays a good foundation for deeper and more qualitative research.
35
BIBLIOGRAPHY
Department of Education (2001). Special Needs Education: Building an Inclusive Education and Training System.
Education White Paper 6. Pretoria.
Department of Basic Education. (2010a). 2010 Education for All (EFA) Country Report. DBE. Pretoria
Department of Basic Education. (2010b). Education Statistics in South Africa: 2009. DBE. Pretoria.
Department of Basic Education. (2011). Macro-Indicator Trends in the Schooling System. Pretoria: DBE.
DoE. (2009). Trends in Education Macro Indicators report. Pretoria.
Statistics South Africa. (2009). General Household Survey Interactive Dataset.
RSA. (2009). Medium Term Strategic Framework (MTSF) Expenditure Framework . Pretoria.
UIS. (2009). Education Indicators: Technical Guidelines. Paris : UNESCO.
Enquiries
Mr Justice Libago Deputy Director: RCMETel.: 012 357 3661Email: [email protected]
Ms Rirhandzu BaloyiAssistant Director: RCMETel.: 012 357 3662Email: [email protected]