Embed Size (px)
Citation preview

Q1 (May – July 2016)Report on the 1st Quarter 2016 / 17 of Zumtobel Group AG

Zumtobel Group AG
1 May 2016 to 31 July 2016
2
>> FX-adjusted decline of 1.4% in Group revenues >> Substantial positive effects from restructuring and cost savings measures >> Increase of 48.6% in adjusted EBIT to EUR 20.1 million and 36.9% in net profit to EUR 12.6 million >> Positive free cash flow of EUR 7.4 million (previous year : minus EUR 35.5 million) >> Outlook on 2016/17: slight improvement in adjusted Group EBIT (previous year : EUR 58.7 million)
Key Data in EUR million Q1 2016/17 Q1 2015/16 Change in %
Revenues 325.7 342.4 (4.9)
Adjusted EBIT 20.1 13.5 48.6
as a % of revenues 6.2 3.9
EBIT 17.8 12.4 43.5
as a % of revenues 5.5 3.6
Net profit/loss for the period 12.6 9.2 36.9
as a % of revenues 3.9 2.7
Cash flow from operating results 33.4 27.2 22.6
Investments 9.4 12.8 (26.7)
31 July 2016 30 April 2016 Change in %
Total assets 1,075.2 1,068.6 0.6
Equity 338.3 333.2 1.5
Equity ratio in % 31.5 31.2
Net debt 139.1 134.8 3.2
Headcount incl. contract worker (full-time equivalent) 6,778 6,761 0.3
Development of Business by Quarter
Q1 Q2 Q3 Q4
Revenues (in EUR million)
Revenues FY 2015/16
Revenues FY 2016/17
-4.9%
Q1 Q2 Q3 Q4
Adjusted EBIT FY 2015/16 (in EUR million)
Adjusted EBIT FY 2016/17 (in EUR million)
Adjusted EBIT FY 2015/16 in % of revenues
Adjusted EBIT FY 2016/17 in % of revenues
17,7
6.2%
Adjusted EBIT
5,5
342.4
13.5
359.5
28.8307.9
5.5
346.6
10.9
3.9%
20.1
8.0%
1.8%3.1%
325.7
Overview of the First Quarter 2016/17
Zumtobel Group AG
1 May 2016 to 31 July 2016
3
Dear Shareholders,Dear Shareholders,Dear Shareholders,Dear Shareholders,
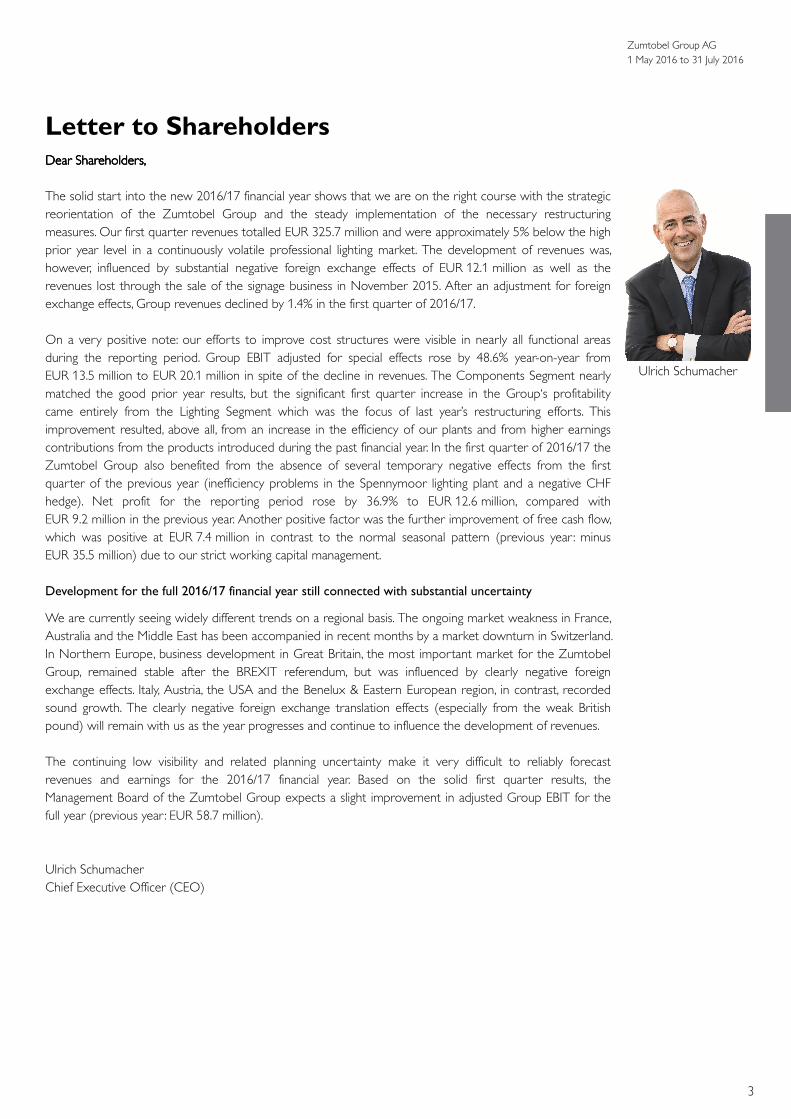
The solid start into the new 2016/17 financial year shows that we are on the right course with the strategic
reorientation of the Zumtobel Group and the steady implementation of the necessary restructuring
measures. Our first quarter revenues totalled EUR 325.7 million and were approximately 5% below the high
prior year level in a continuously volatile professional lighting market. The development of revenues was,
however, influenced by substantial negative foreign exchange effects of EUR 12.1 million as well as the
revenues lost through the sale of the signage business in November 2015. After an adjustment for foreign
exchange effects, Group revenues declined by 1.4% in the first quarter of 2016/17.
On a very positive note: our efforts to improve cost structures were visible in nearly all functional areas
during the reporting period. Group EBIT adjusted for special effects rose by 48.6% year-on-year from
EUR 13.5 million to EUR 20.1 million in spite of the decline in revenues. The Components Segment nearly
matched the good prior year results, but the significant first quarter increase in the Group‘s profitability
came entirely from the Lighting Segment which was the focus of last year’s restructuring efforts. This
improvement resulted, above all, from an increase in the efficiency of our plants and from higher earnings
contributions from the products introduced during the past financial year. In the first quarter of 2016/17 the
Zumtobel Group also benefited from the absence of several temporary negative effects from the first
quarter of the previous year (inefficiency problems in the Spennymoor lighting plant and a negative CHF
hedge). Net profit for the reporting period rose by 36.9% to EUR 12.6 million, compared with
EUR 9.2 million in the previous year. Another positive factor was the further improvement of free cash flow,
which was positive at EUR 7.4 million in contrast to the normal seasonal pattern (previous year : minus
EUR 35.5 million) due to our strict working capital management.
Development for the full 2016/17 financial year still connected with substantial uncertainty
We are currently seeing widely different trends on a regional basis. The ongoing market weakness in France,
Australia and the Middle East has been accompanied in recent months by a market downturn in Switzerland.
In Northern Europe, business development in Great Britain, the most important market for the Zumtobel
Group, remained stable after the BREXIT referendum, but was influenced by clearly negative foreign
exchange effects. Italy, Austria, the USA and the Benelux & Eastern European region, in contrast, recorded
sound growth. The clearly negative foreign exchange translation effects (especially from the weak British
pound) will remain with us as the year progresses and continue to influence the development of revenues.
The continuing low visibility and related planning uncertainty make it very difficult to reliably forecast
revenues and earnings for the 2016/17 financial year. Based on the solid first quarter results, the
Management Board of the Zumtobel Group expects a slight improvement in adjusted Group EBIT for the
full year (previous year : EUR 58.7 million).
Ulrich Schumacher
Chief Executive Officer (CEO)
Letter to Shareholders
Ulrich Schumacher

Zumtobel Group AG
1 May 2016 to 31 July 2016
4
Based on an unchanged number of 43.5 million common shares outstanding, the market capitalisation of
Zumtobel Group AG totalled EUR 591 million at the end of July 2016. There have been no major changes in
the shareholder structure since the end of the 2015/16 financial year. The Zumtobel family has remained the
stable core shareholder of Zumtobel Group AG since the initial public offering with a stake of slightly over
35%. As of 31 July 2016, the institutional investor FMR LLC held an investment of over 5% and Lazard Freres
Gestion SAS an investment of over 4%. The remainder of the shares is held predominately by other
institutional investors. In the ATX, the leading index of the largest listed companies in Austria, the Zumtobel
share ranked 24th based on market capitalisation and 14th based on trading volume as of 31 July 2016. The
average daily turnover on the Vienna Stock Exchange totalled 417,364 in the reporting period compared
with 119,378 in the previous year (double-count, as published by the Vienna Stock Exchange). The company
held 353,343 treasury shares as of 31 July 2016.
Key Data on the Zumtobel Group Share for the 1st quarter 2016/17
Closing price at 29.04.2016 EUR 11.370 Currency EUR
Closing price at 29.07.2016 EUR 13.575 ISIN AT0000837307
Performance FY 2015/16 19.4% Ticker symbol Vienna Stock Exchange (XETRA) ZAG
Market capitalisation at 29.07.2016 EUR 591 Mio Market segment Prime Market
Share price - high at 26.07.2016 EUR 13.945 Reuters symbol ZUMV.VI
Share price - low at 28.06.2016 EUR 9.900 Bloomberg symbol ZAG AV
Ø Turnover per day (shares) 417,364 Number of issued shares 43,500,000
31.07.2016 31.10.2015
Zumtobel Group AG
ATX
Development of the Zumtobel Group Share
31.01.2016 29.04.2016 29.07.2016
100%
40%
80%
20%
60%
120%
The Zumtobel Group Share

Zumtobel Group AG
1 May 2016 to 31 July 2016
5
Significant events since 30 April 2016
The 40th annual general meeting on 22 July 2016 authorised the payment of a EUR 0.20 dividend per share
for the 2015/16 financial year. This dividend was distributed to shareholders on 2 August 2016.
No other significant events occurred after the balance sheet date on 30 April 2016.
Development of revenues in the first quarter of 2016/17
Group revenues for the first three months (1 May to 31 July 2016) were 4.9% lower than the good first
quarter of the previous year (EUR 342.4 million) at EUR 325.7 million against the backdrop of a volatile
market climate. The development of revenues was influenced by substantial negative foreign exchange
effects of EUR 12.1 million as well as the loss of revenues from the sale of the signage activities in
November 2015. The negative foreign exchange effects resulted, above all, from the increase in the euro
versus the British pound (GBP) and Swiss franc (CHF). After an adjustment for these effects, the revenue
decline equalled 1.4%. The dynamic growth with LED products continued throughout the reporting period.
Revenues from the sale of LED products rose by 10.4% year-on-year to EUR 227.7 million (previous year :
EUR 206.2 million) and led to an increase in the LED share of Group revenues to 69.9% within 12 months
(previous year : 60.2%).
Segment development in EUR million
Q1 2016/17 Q1 2015/16 Change in % FX adjusted
in %
Lighting Segment 248.7 254.8 (2.4) 1.1
Components Segment 97.3 109.3 (11.1) (8.2)
Reconciliation (20.3) (21.7) (6.6)
Zumtobel Group 325.7 342.4 (4.9) (1.4)
Forecasts point to a general trend reversal and slight growth on the European markets during the 2016 and
2017 calendar years, but with substantial regional differences. This assessment was also confirmed by
Euroconstruct in its June 2016 report. Revenues in the Lighting Segment fell by 2.4% to EUR 248.7 million
during the first quarter of 2016/17 (previous year : EUR 254.8 million) – but increased by 1.1% after an
adjustment for negative foreign exchange effects.
The decline in the Components Segment was stronger at minus 11.1% (FX-adjusted minus 8.2%). It resulted,
above all, from revenues lost due to the sale of the signage activities in November 2015 (Q1 2015/16:
revenue contribution of approx. EUR 5.5 million) and the continuing sharp drop in the demand for
conventional electronic ballasts. However, the development of business in this segment was supported by
sound growth in revenues from the sale of intelligent, networkable LED components and Tridonic system
solutions. These products were, for the most part, introduced in recent quarters – they provide customers
with clear added value and differentiate the Zumtobel Group from the competition. They also demonstrate
the increasingly successful results of the high investments in Tridonic’s innovative strength during earlier years.
Group Management Report
Dividend of EUR 0.20
per share
for FY 2015/16
FX-adjusted decline of
1.4% in Group
revenues
FX-adjusted growth
of 1.1% in Lighting
Segment
Slower growth in
Components Segment
due to sale of signage
business

Zumtobel Group AG
1 May 2016 to 31 July 2016
6
Distribution of regional revenues
Q1 2016/17
Revenues in
EUR million
Change in % in % of Group
D/A/CH 97.1 (4.6) 29.8
Northern Europe 83.8 (4.4) 25.7
Benelux & Eastern Europe 39.2 3.5 12.0
Southern Europe 49.7 (0.4) 15.3
Asia & Pacific 32.6 (16.0) 10.0
Middle East & Africa 14.2 (21.0) 4.3
Americas 9.1 6.4 2.8
TotalTotalTotalTotal 325.7325.7325.7325.7 (4.9)(4.9)(4.9)(4.9) 100.0100.0100.0100.0
The reserved first quarter revenue development in both segments reflected the ongoing market weakness
in France, Australia and the Middle East as well as increasingly difficult market conditions in Switzerland
during recent months. In Northern Europe, business development in Great Britain, the most important
market for the Zumtobel Group, remained stable after the BREXIT referendum, but was influenced by
clearly negative foreign exchange effects. Italy, Austria, the USA and the Benelux & Eastern European region,
in contrast, recorded sound development.
Development of earnings in the first quarter of 2016/17
Group EBIT adjusted for special effects rose by 48.6% year-on-year from EUR 13.5 million to
EUR 20.1 million despite the decline in revenues. As a result, the return on sales increased from 3.9% to
6.2%. The Components Segment nearly matched the sound prior year earnings, but the significant first
quarter increase in the Group‘s profitability came entirely from the Lighting Segment and underscored the
successful implementation of restructuring activities in the previous year.
Income statement in EUR million Q1 2016/17 Q1 2015/16 Change in %
Revenues 325.7 342.4 (4.9)
Cost of goods sold (213.3) (234.9) (9.2)
Gross profit 112.4 107.5 4.5
as a % of revenues 34.5 31.4
SG&A expenses adjusted for special effects (92.3) (94.0) (1.9)
Adjusted EBIT 20.1 13.5 48.6
as a % of revenues 6.2 3.9
Special effects (2.3) (1.1) <(100)
EBIT 17.8 12.4 43.5
as a % of revenues 5.5 3.6
Financial results (1.4) (0.3) <(100)
Profit/loss before tax 16.4 12.1 35.1
Income taxes (3.8) (2.9) 29.8
Net profit/loss for the period 12.6 9.2 36.9
Earnings per share (in EUR) 0.29 0.21 38.0
Note: EBITDA (EBIT plus depreciation and amortisation) amounted to EUR 33.4 million in the first quarter of 2016/17.
Very different
regional trends
Increase of 48.6% in
adjusted Group EBIT

Zumtobel Group AG
1 May 2016 to 31 July 2016
7
The gross profit margin (after development expenses) for the Zumtobel Group rose to 34.5% in the first
quarter of 2016/17 (previous year : 31.4%). This improvement resulted, above all, from an increase in
production efficiency and better cost structures for the products introduced during the past financial year.
The Group also benefited from the absence of the temporary inefficiency problems in the Spennymoor
lighting plant and the negative effects of forward exchange contracts in Swiss francs during the first quarter
of 2015/16. Development costs included in the cost of goods sold totalled EUR 20.9 million and remained
constant at the prior year level (previous year : EUR 20.9 million).
Selling expenses declined from EUR 83.1 million to EUR 79.2 million in the first quarter despite wage and
salary increases mandated by collective negotiations. This reduction reflected the positive effects of the
extensive restructuring and cost savings measures implemented in recent quarters. The number of
employees in indirect sales areas fell by a further 20 below the level on 31 July 2015. Administrative
expenses rose slightly to EUR 14.0 million (previous year : EUR 12.4 million), with most of the increase is
attributable to additional staffing in headquarters functions. Other operating results, excluding special effects,
amounted to EUR 0.9 million (previous year : EUR 1.4 million) and included, among others, license income
from the LED business.
Negative special effects of EUR 2.3 million were recorded during the first quarter of 2016/17 (previous year :
EUR 1.1 million). They are related, above all, to the ongoing restructuring of the sales organisation and
adjustments to the global plant network.
Adjusted EBIT in EUR million Q1 2016/17 Q1 2015/16 Change in %
Reported EBIT 17.8 12.4 43.5
thereof special effects (2.3) (1.1) <(100)
Adjusted EBIT 20.1 13.5 48.6
as a % of revenues 6.2 3.9
Financial results declined by EUR 1.1 million year-on-year to minus EUR 1.4 million (previous year : minus
EUR 0.3 million). Interest expense consisted, for the most part, of interest on the current credit agreement.
Other financial income and expenses totalled plus EUR 0.5 million (previous year : plus EUR 1.8 million). The
negative change was caused primarily by effects from the valuation of foreign exchange receivables and
liabilities following the devaluation of key currencies for the Zumtobel Group versus the euro during the
reporting quarter.
Financial result in EUR million Q1 2016/17 Q1 2015/16 Change in %
Interest expense (2.0) (2.3) (14.2)
Interest income 0.1 0.1 22.0
Net financing costs (1.9) (2.2) 15.5
Other financial income and expenses 0.5 1.8 (73.5)
Result from companies accounted for at-equity 0.0 0.1 <(100)
Financial results (1.4) (0.3) <(100)
Profit before tax rose to EUR 16.4 million in the first quarter of 2016/17 (previous year : EUR 12.1 million),
and income taxes amounted to EUR 3.8 million (previous year : EUR 2.9 million). Net profit for the period
increased by a solid 36.9% to EUR 12.6 million, compared with EUR 9.2 million in the previous year. Earnings
per share for the shareholders of Zumtobel Group AG (basic EPS based on 43.1 million shares) equalled
EUR 0.29 (previous year : EUR 0.21).
Significant efficiency
improvements in
production
Selling expenses
below previous year
Negative special
effects of
transformation
process
Financial results
below previous year
Net profit of
EUR 12.6 million
Zumtobel Group AG
1 May 2016 to 31 July 2016
8
Cash flow and asset position
Cash flow was determined on a monthly basis in accordance with the indirect method. The resulting
monthly cash flows were translated at the applicable average monthly exchange rate and then aggregated,
while the balance sheet positions were translated at the exchange rate in effect on the respective closing
date. Individual positions on the cash flow statement therefore differ significantly from the respective balance
sheet positions, above all under cash flow from operating activities.
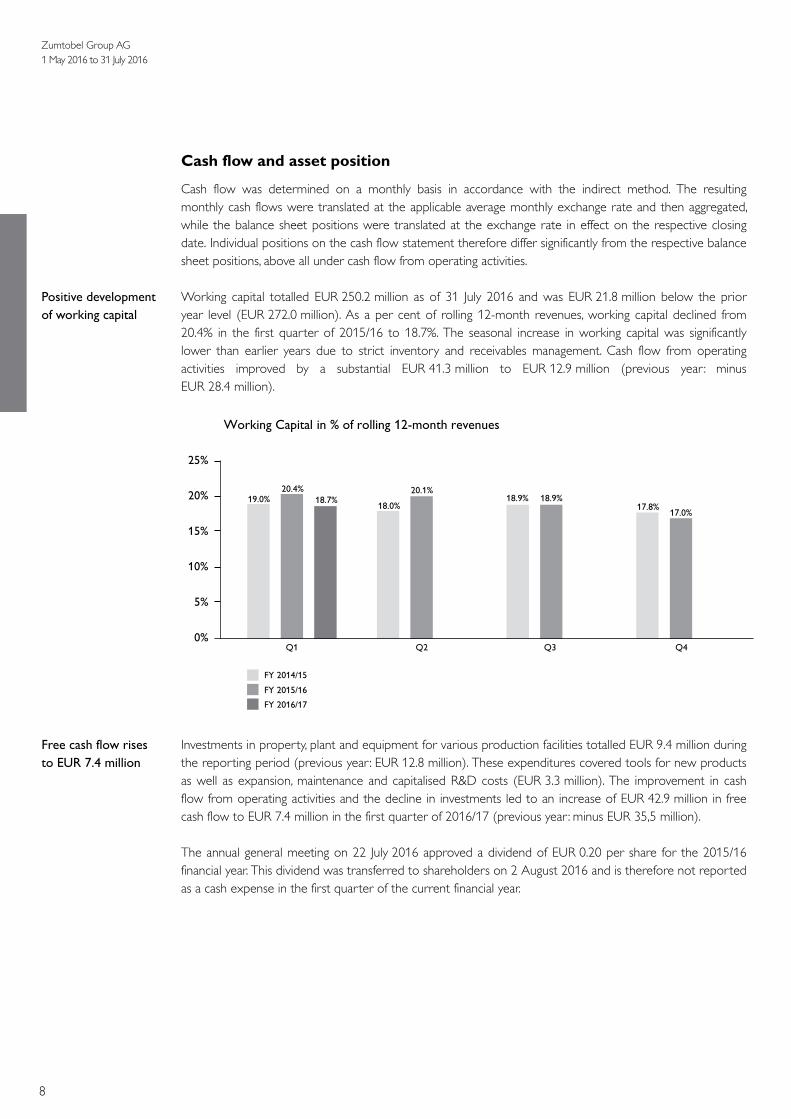
Working capital totalled EUR 250.2 million as of 31 July 2016 and was EUR 21.8 million below the prior
year level (EUR 272.0 million). As a per cent of rolling 12-month revenues, working capital declined from
20.4% in the first quarter of 2015/16 to 18.7%. The seasonal increase in working capital was significantly
lower than earlier years due to strict inventory and receivables management. Cash flow from operating
activities improved by a substantial EUR 41.3 million to EUR 12.9 million (previous year : minus
EUR 28.4 million).
Investments in property, plant and equipment for various production facilities totalled EUR 9.4 million during
the reporting period (previous year : EUR 12.8 million). These expenditures covered tools for new products
as well as expansion, maintenance and capitalised R&D costs (EUR 3.3 million). The improvement in cash
flow from operating activities and the decline in investments led to an increase of EUR 42.9 million in free
cash flow to EUR 7.4 million in the first quarter of 2016/17 (previous year : minus EUR 35,5 million).
The annual general meeting on 22 July 2016 approved a dividend of EUR 0.20 per share for the 2015/16
financial year. This dividend was transferred to shareholders on 2 August 2016 and is therefore not reported
as a cash expense in the first quarter of the current financial year.
Working Capital in % of rolling 12-month revenues
Q1 Q2
15%
10%
5%
0%
25%
Q3 Q4
FY 2014/15
FY 2015/16
FY 2016/17
20% 19.0%18.0%
18.9%17.8%
20.4% 20.1%18.9%
17.0%
18.7%
Positive development
of working capital
Free cash flow rises
to EUR 7.4 million

Zumtobel Group AG
1 May 2016 to 31 July 2016
9
Balance sheet data in EUR million 31 July 2016 30 April 2016
Total assets 1,075.2 1,068.6
Net debt 139.1 134.8
Debt coverage ratio 1.43 1.48
Equity 338.3 333.2
Equity ratio in % 31.5 31.2
Gearing in % 41.1 40.5
Investments 9.4 76.6
Working capital 250.2 232.7
As a % of rolling 12 month revenues 18.7 17.8
The quality of the balance sheet structure remains nearly unchanged. The equity ratio rose slightly from
31,2% on 30 April 2016 to 31,5% at the end of the first quarter. Net debt followed the normal seasonal
pattern – but to a more limited extent – with an increase of EUR 4,3 million to EUR 139,1 million (previous
year : EUR 195.6 million).
Development for the full 2016/17 financial year still connected with substantial uncertainty
We are currently seeing widely different trends on a regional basis. The ongoing market weakness in France,
Australia and the Middle East has been accompanied in recent months by a market downturn in Switzerland.
In Northern Europe, business development in Great Britain, the most important market for the Zumtobel
Group, remained stable after the BREXIT referendum, but was influenced by clearly negative foreign
exchange effects. Italy, Austria, the USA and the Benelux & Eastern European region, in contrast, recorded
sound growth. The clearly negative foreign exchange translation effects (especially from the weak British
pound) will remain with us as the year progresses and continue to influence the development of revenues.
The continuing low visibility and related planning uncertainty make it very difficult to reliably forecast
revenues and earnings for the 2016/17 financial year. Based on the solid first quarter results, the
Management Board of the Zumtobel Group expects a slight improvement in adjusted Group EBIT for the
full year (previous year : EUR 58.7 million).
Dornbirn, 6 September 2016
Ulrich Schumacher Karin Sonnenmoser Alfred Felder
Chief Executive Officer (CEO) Chief Financial Officer (CFO) Chief Operating Officer (COO)
Continued solid
balance sheet
structure
Zumtobel Group AG
1 May 2016 to 31 July 2016
10
in TEUR Q1 2016/17 Q1 2015/16 Change in %
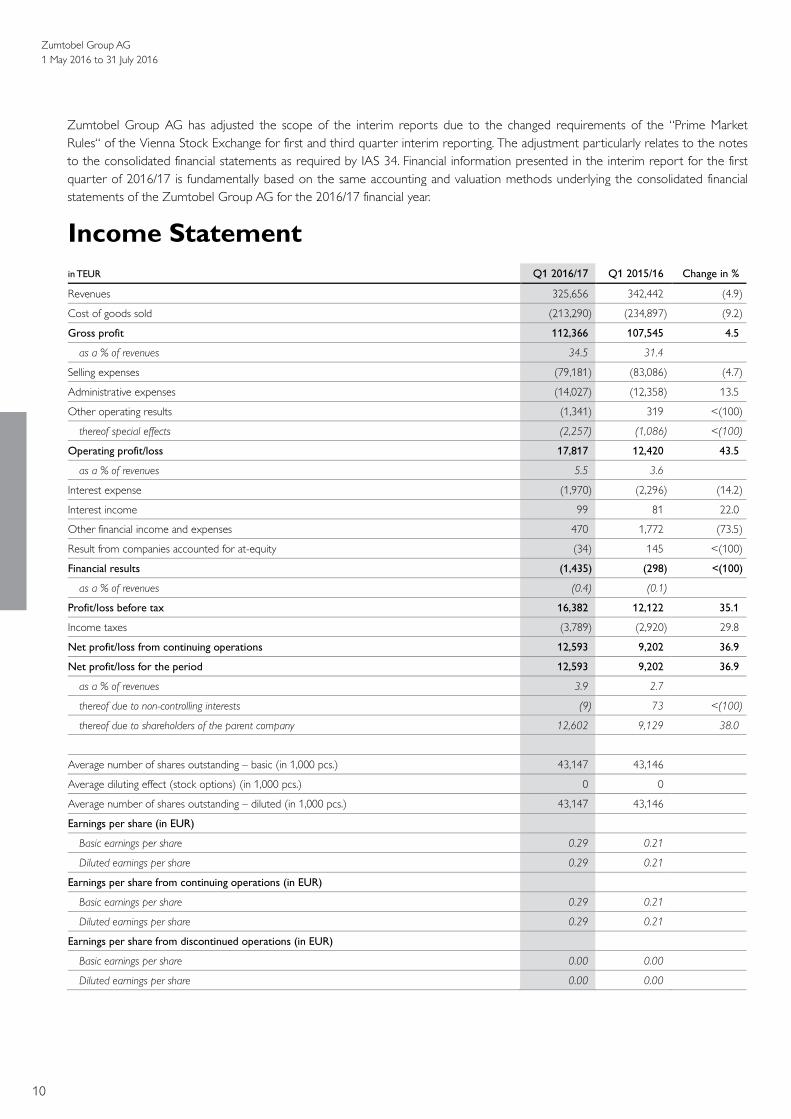
Revenues 325,656 342,442 (4.9)
Cost of goods sold (213,290) (234,897) (9.2)
Gross profit 112,366 107,545 4.5
as a % of revenues 34.5 31.4
Selling expenses (79,181) (83,086) (4.7)
Administrative expenses (14,027) (12,358) 13.5
Other operating results (1,341) 319 <(100)
thereof special effects (2,257) (1,086) <(100)
Operating profit/loss 17,817 12,420 43.5
as a % of revenues 5.5 3.6
Interest expense (1,970) (2,296) (14.2)
Interest income 99 81 22.0
Other financial income and expenses 470 1,772 (73.5)
Result from companies accounted for at-equity (34) 145 <(100)
Financial results (1,435) (298) <(100)
as a % of revenues (0.4) (0.1)
Profit/loss before tax 16,382 12,122 35.1
Income taxes (3,789) (2,920) 29.8
Net profit/loss from continuing operations 12,593 9,202 36.9
Net profit/loss for the period 12,593 9,202 36.9
as a % of revenues 3.9 2.7
thereof due to non-controlling interests (9) 73 <(100)
thereof due to shareholders of the parent company 12,602 9,129 38.0
Average number of shares outstanding – basic (in 1,000 pcs.) 43,147 43,146
Average diluting effect (stock options) (in 1,000 pcs.) 0 0
Average number of shares outstanding – diluted (in 1,000 pcs.) 43,147 43,146
Earnings per share (in EUR)
Basic earnings per share 0.29 0.21
Diluted earnings per share 0.29 0.21
Earnings per share from continuing operations (in EUR)
Basic earnings per share 0.29 0.21
Diluted earnings per share 0.29 0.21
Earnings per share from discontinued operations (in EUR)
Basic earnings per share 0.00 0.00
Diluted earnings per share 0.00 0.00
Income Statement
Zumtobel Group AG has adjusted the scope of the interim reports due to the changed requirements of the “Prime Market
Rules“ of the Vienna Stock Exchange for first and third quarter interim reporting. The adjustment particularly relates to the notes
to the consolidated financial statements as required by IAS 34. Financial information presented in the interim report for the first
quarter of 2016/17 is fundamentally based on the same accounting and valuation methods underlying the consolidated financial
statements of the Zumtobel Group AG for the 2016/17 financial year.
Zumtobel Group AG
1. Mai 2016 bis 31. Juli 2016
11
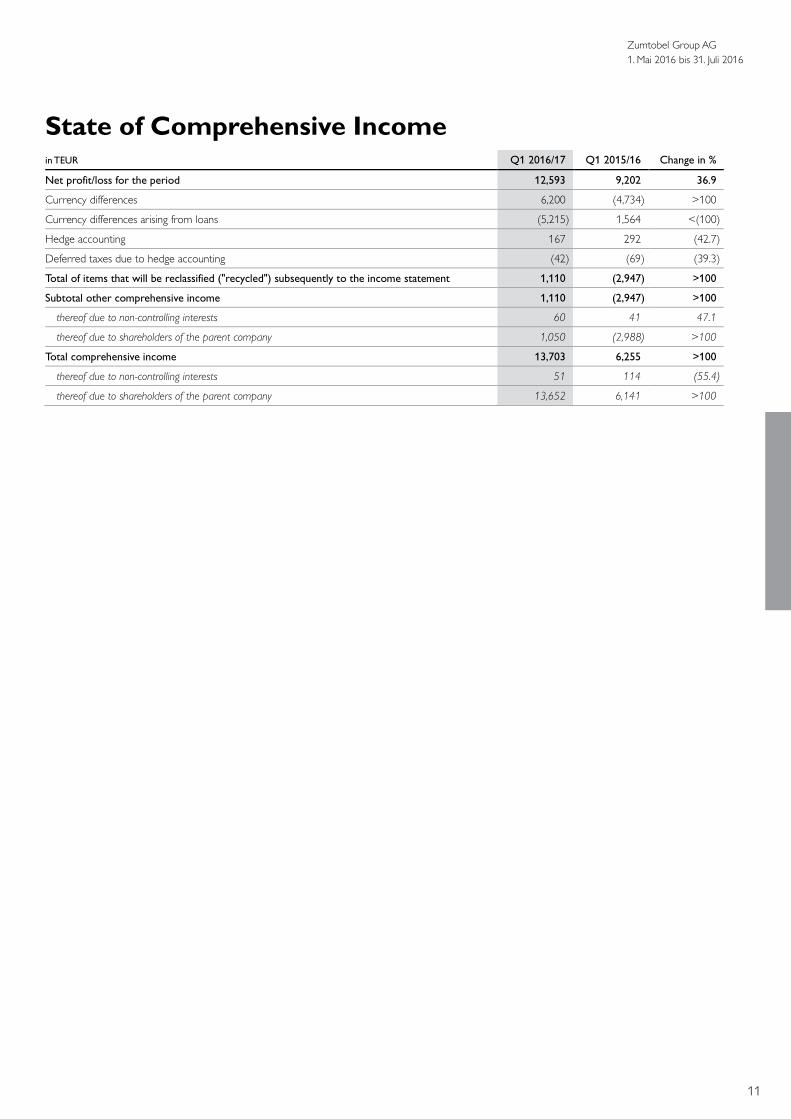
in TEUR Q1 2016/17 Q1 2015/16 Change in %
Net profit/loss for the period 12,593 9,202 36.9
Currency differences 6,200 (4,734) >100
Currency differences arising from loans (5,215) 1,564 <(100)
Hedge accounting 167 292 (42.7)
Deferred taxes due to hedge accounting (42) (69) (39.3)
Total of items that will be reclassified ("recycled") subsequently to the income statement 1,110 (2,947) >100
Subtotal other comprehensive income 1,110 (2,947) >100
thereof due to non-controlling interests 60 41 47.1
thereof due to shareholders of the parent company 1,050 (2,988) >100
Total comprehensive income 13,703 6,255 >100
thereof due to non-controlling interests 51 114 (55.4)
thereof due to shareholders of the parent company 13,652 6,141 >100
State of Comprehensive Income

Zumtobel Group AG
1 May 2016 to 31 July 2016
12
in TEUR 31 July 2016 in % 30 April 2016 in %
Goodwill 205,015 19.1 209,090 19.6
Other intangible assets 56,625 5.3 58,353 5.5
Property, plant and equipment 215,783 20.1 223,808 20.9
Financial assets accounted for at equity 2,200 0.2 2,234 0.2
Financial assets 1,205 0.1 1,203 0.1
Other assets 4,772 0.4 4,434 0.4
Deferred taxes 44,886 4.2 44,883 4.2
Non-current assets 530,486 49.3 544,005 50.9
Inventories 201,749 18.8 187,437 17.5
Trade receivables 222,218 20.7 220,869 20.7
Financial assets 4,748 0.4 2,309 0.2
Other assets 38,516 3.6 32,633 3.1
Liquid funds 77,453 7.2 81,394 7.6
Current assets 544,684 50.7 524,642 49.1
ASSETS 1,075,170 100.0 1,068,647 100.0
Share capital 108,750 10.1 108,750 10.2
Additional paid-in capital 335,316 31.2 335,316 31.4
Reserves (123,373) (11.5) (127,161) (11.9)
Net profit/loss for the period 12,602 1.2 11,367 1.1
Capital attributed to shareholders of the parent company 333,295 31.0 328,272 30.8
Capital attributed to non-controlling interests 5,024 0.5 4,973 0.4
Equity 338,319 31.5 333,245 31.2
Provisions for pensions 77,178 7.2 79,740 7.5
Provisions for severance compensation 48,699 4.5 48,717 4.6
Provisions for other employee benefits 11,299 1.1 11,527 1.1
Other provisions 742 0.1 744 0.1
Borrowings 203,773 19.0 209,438 19.5
Other liabilities 10,469 1.0 12,137 1.1
Deferred taxes 1,613 0.1 1,624 0.2
Non-current liabilities 353,773 33.0 363,927 34.1
Provisions for taxes 23,025 2.1 21,182 2.0
Other provisions 52,807 4.9 54,707 5.1
Borrowings 12,334 1.1 6,758 0.6
Trade payables 148,487 13.8 147,062 13.7
Other liabilities 146,425 13.6 141,766 13.3
Current liabilities 383,078 35.5 371,475 34.7
EQUITY AND LIABILITIES 1,075,170 100.0 1,068,647 100.0
Balance Sheet

Zumtobel Group AG
1. Mai 2016 bis 31. Juli 2016
13
in TEUR Q1 2016/17 Q1 2015/16
Profit/loss before tax 16,382 12,122
Depreciation and amortisation 15,545 14,886
Gain/loss from disposal of fixed assets (3) (88)
Interest income/ Interest expenses 1,911 2,223
Other financial income and expenses (476) (1,926)
Cash flow from operating results 33,359 27,217
Inventories (17,275) (15,766)
Trade receivables 105 (7,823)
Trade payables 619 (16,581)
Prepayments received (5,046) (198)
Change in working capital (21,597) (40,368)
Non-current provisions (1,052) (3,169)
Current provisions (1,628) (59)
Other current and non-current assets and liabilities 5,789 (10,559)
Change in other operating items 3,109 (13,787)
Taxes paid (1,996) (1,496)
Cash flow from operating activities 12,875 (28,434)
Proceeds from the sale of non-current assets 60 2,582
Capital expenditures on non-current assets (9,351) (12,760)
Change in non-current and current financial assets 3,848 437
Change in liquid funds from changes in the consolidation range 0 2,703
Cash flow from investing activities (5,443) (7,038)
FREE CASH FLOW 7,432 (35,472)
Change in net borrowings (15,106) 62,136
thereof restricted cash (9) (3)
Dividends 0 (9,888)
Interest paid (1,947) (2,249)
Interest received 94 73
Cash flow from financing activities (16,959) 50,072
Effects of exchange rate changes on cash and cash equivalents (300) (1,229)
CHANGE IN CASH AND CASH EQUIVALENTS (9,827) 13,371
Cash and cash equivalents at the beginning of the period 75,305 43,151
Cash and cash equivalents at the end of the period 65,478 56,522
Change absolute (9,827) 13,371
Cash Flow Statement

Zumtobel Group AG
1 May 2016 to 31 July 2016
14
Q1 Q1 Q1 Q1 2012012012016666/1/1/1/17777
Attributed to shareholders of the parent company
Non-
controlling
interests
Total
equity
in TEUR
Share
capital
Additional
paid-in
capital
Other
Reserves
Currency
reserve
Hedge
accounting
Reserve for
stock
options
Reserve
IAS 19
Net
profit/loss
for the
period
Total
30 April 2016 108,750 335,316 (636) (23,167) (2,046) 19,479 (120,791) 11,367 328,272 4,973 333,245
+/- Additions to reserves 0 0 11,367 0 0 0 0 (11,367) 0 0 0
+/- Total comprehensive
income 0 0 0 925 125 0 0 12,602 13,652 51 13,703
+/- Dividends 0 0 (8,629) 0 0 0 0 0 (8,629) 0 (8,629)
31 July 2016 108,750 335,316 2,102 (22,242) (1,921) 19,479 (120,791) 12,602 333,295 5,024 338,319
Q1 Q1 Q1 Q1 2012012012015555/1/1/1/16666
Attributed to shareholders of the parent company
Non-
controlling
interests
Total
equity
in TEUR
Share
capital
Additional
paid-in
capital
Other
Reserves
Currency
reserve
Hedge
accounting
Reserve for
stock
options
Reserve
IAS 19
Net
profit/loss
for the
period
Total
30 April 2015 108,750 335,316 (2,013) (9,782) (2,815) 19,479 (142,718) 12,231 318,448 4,152 322,600
+/- Additions to reserves 0 0 12,231 0 0 0 0 (12,231) 0 0 0
+/- Total comprehensive
income 0 0 0 (3,211) 223 0 0 9,129 6,141 114 6,255
+/- Dividends 0 0 (9,492) 0 0 0 0 0 (9,492) (396) (9,888)
31 July 2015 108,750 335,316 726 (12,993) (2,592) 19,479 (142,718) 9,129 315,097 3,870 318,967
The balance sheet position “reserves” comprises other reserves as well as the currency reserve, the reserve for hedge accounting,
the reserve for stock options and the IAS 19 reserve for “employee benefits”.
Statement of Changes in Equity

Zumtobel Group AG
1 May 2016 to 31 July 2016
15
Financial Terms
Adjusted EBIT EBIT adjusted for special effects
Adjusted EBIT margin = Adjusted EBIT as a percentage of revenues
CAPEX Capital expenditure
Debt coverage ratio Net debt divided by EBITDA
EBIT Earnings before interest and taxes
EBITDA Earnings before interest, taxes, depreciation and amortisation
Equity ratio = Equity as a percentage of assets
Gearing = Net debt as a percentage of equity
Net debt = Non-current borrowings + current borrowings - liquid funds - current financial
receivables from associated companies
WACC Weighted average cost of capital (debt and equity)
Working capital = Inventories + trade receivables - trade payables - prepayments received
Service
Zumtobel Group AG
1 May 2016 to 31 July 2016
16
Financial Calendar
Report on the First Half-year 2016/17 (1 May 2016 – 31 October 2016) 06 December 2016
Report on the First Three Quarters 2016/17 (1 May 2016 – 31 January 2017) 07 March 2017
Annual Results 2016/17 23 June 2017
Record Date Annual General Meeting 11 July 2017
41st Annual General Meeting 21 July 2017
Ex-Dividend Day 31 July 2017
Record Date Dividend 01 August 2017
Dividend Payout Day 02 August 2017
Report on the First Quarter 2017/18 (1 May 2017 – 31 July 2017) 05 September 2017
Contact Information
Investor RelationsInvestor RelationsInvestor RelationsInvestor Relations Press / CorporaPress / CorporaPress / CorporaPress / Corporate Communicationte Communicationte Communicationte Communication
Harald Albrecht Simone Deitmer
VP Investor Relations Head of Corporate Communications
Telephone +43 (0)5572 509-1125 Telephon +43 (0)5572 509-575
E-Mail [email protected] E-Mail [email protected]
Financial Reports
Our financial reports are available in English and German for download under : http://www.zumtobelgroup.com. You can also order
a copy by calling +43 (0)5572 509-1510.
More Information
on Zumtobel Group AG and our brands can be found on the Internet under :
www.zumtobelgroup.com
www.zumtobel.com
www.thornlighting.com
www.tridonic.com
www.acdclighting.co.uk
Imprint
Publisher : Zumtobel Group AG, Investor Relations, Harald Albrecht
Coordination Financials: Jan Güstemeyer
Translation: Donna Schiller-Margolis
Copyright: Zumtobel Group AG 2016
Produced in-house with FIRE.sys
Disclaimer
This quarterly financial report includes statements on future developments, which are based on information available at the present time and involve risks and uncertainties that could cause the results realised at a later date to vary from these forward-looking statements. These statements on future developments are not to be under-stood as guarantees. On the contrary, future developments and results are dependent on a wide range of factors and connected with various risks and incalculable events. Moreover, they are based on assumptions that may prove to be incorrect. Included here, for example, are unforeseeable changes in the political, economic and business environment, especially in the regions where the Zumtobel Group operates, as well as the competitive situation, interest rates and foreign exchange rates, technological developments and other risks and incalculable events. Other risks may arise as a result of price developments, unforeseeable events in the operating environments of acquired companies or Group companies as well as ongoing cost optimisation programmes. The Zumtobel Group does not plan to update these forward-looking statements. This interim financial report is also presented in English, but only the German text is binding.