Embed Size (px)
Citation preview
eE / X,'L/iReport No. 681 -GU /
Memorandum on Recent EconomicDevelopment and Prospects ofGuatemalaMarch 31, 1975 FCLatin America and the CaribbeanRegional Office
Not for Public Use
U
Document of the International Bank for Reconstruction and DevelopmentInternational Development Association
This report was prepared for official use only by the Bank Group. It may notbe published, quoted or cited without Bank Group authorization The Bank Group doesnot accept responsibility for the accuracy or completeness of the report.
Pub
lic D
iscl
osur
e A
utho
rized
Pub
lic D
iscl
osur
e A
utho
rized
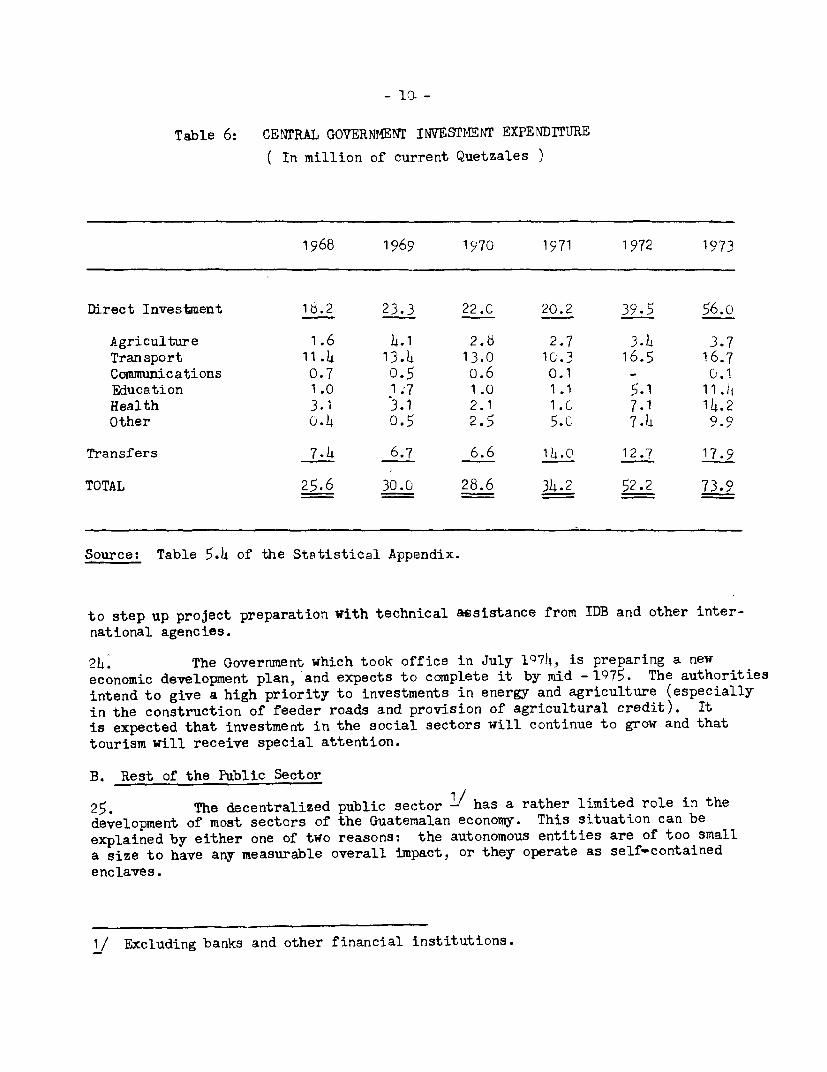
Pub
lic D
iscl
osur
e A
utho
rized
Pub
lic D
iscl
osur
e A
utho
rized
Pub
lic D
iscl
osur
e A
utho
rized
Pub
lic D
iscl
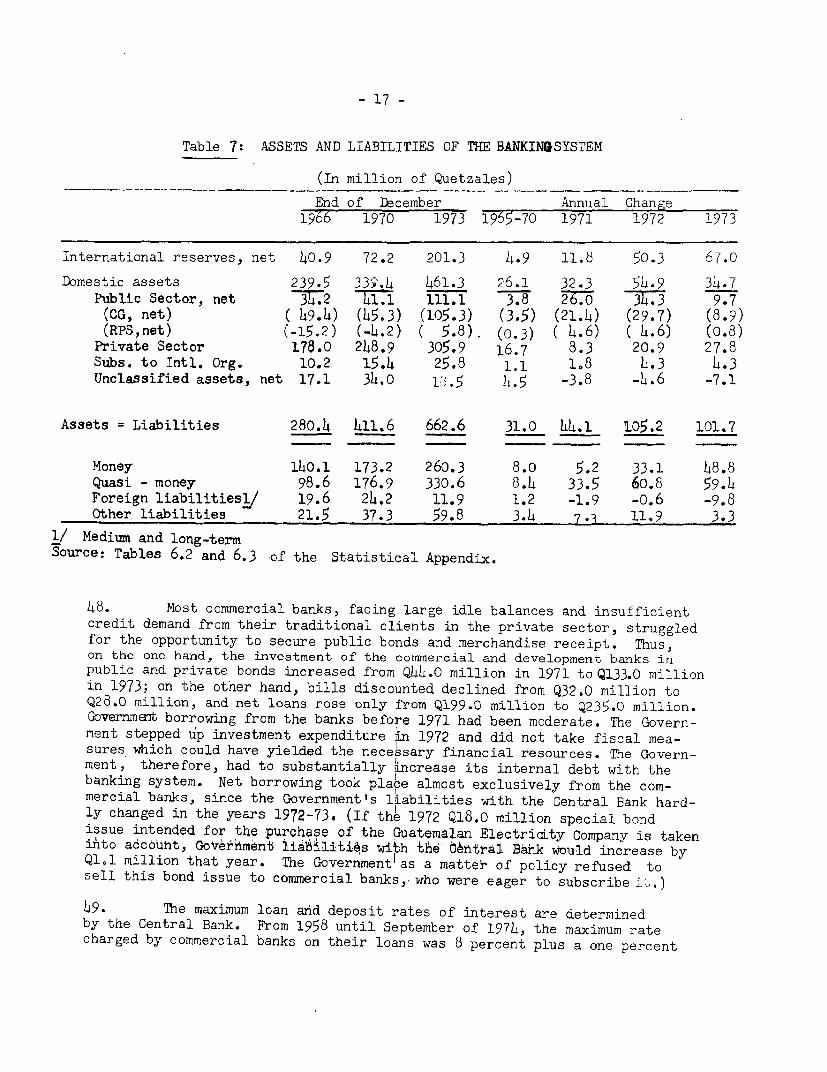
osur
e A
utho
rized
Pub
lic D
iscl
osur
e A
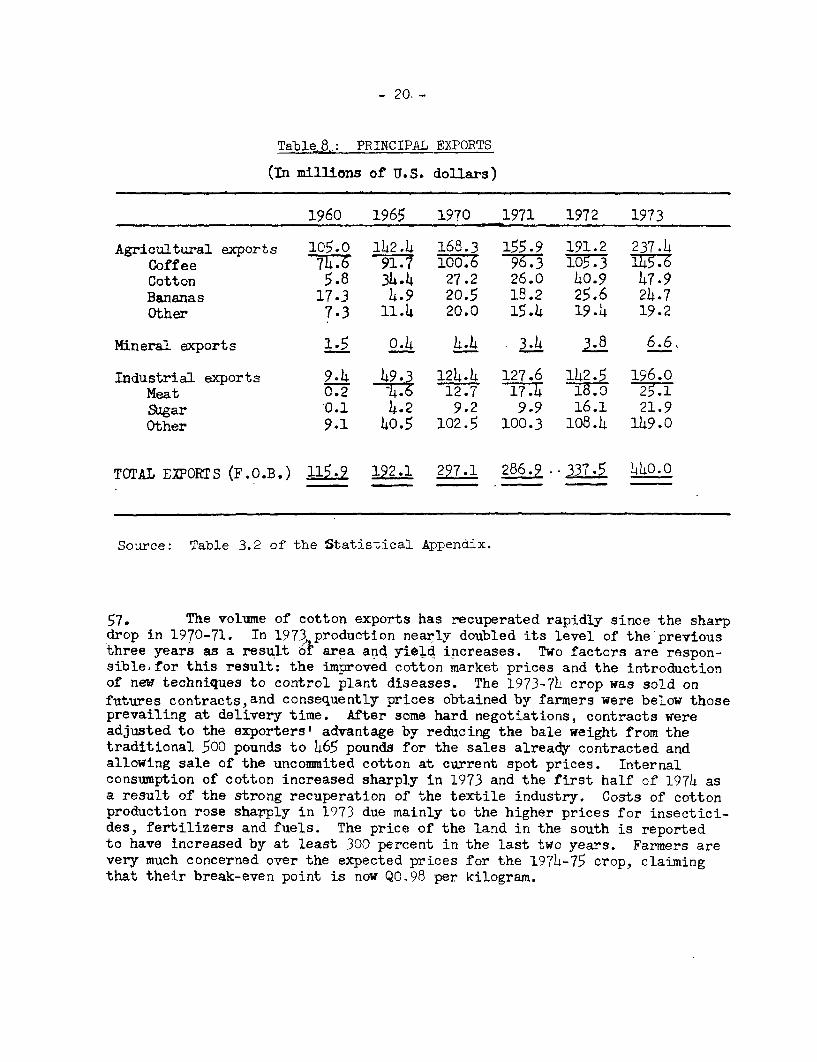
utho
rized
Pub
lic D
iscl
osur
e A
utho
rized

CURRENCY EQUIVALENTS
1 Quetzal (Q) = 1 U.S. dollar
GLOSSARY OF ABBREVIATIONS
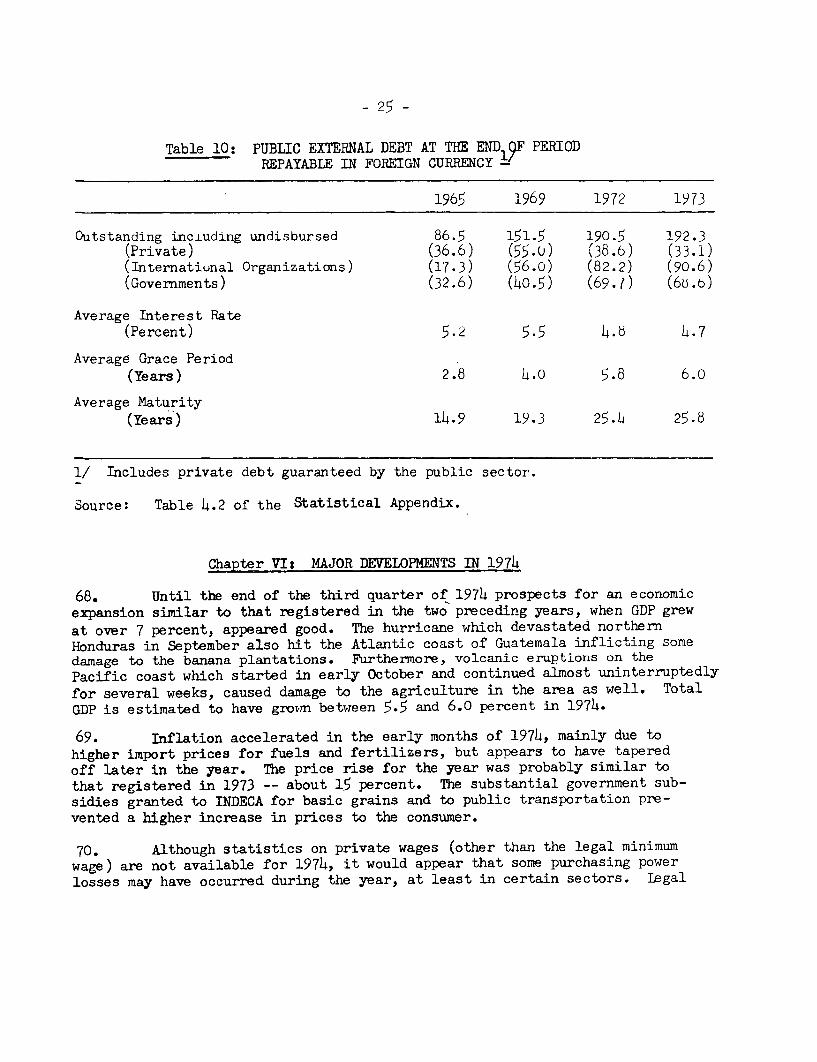
AID - U.S. Agency for International DevelopmentAVIATECA - Guatemalan AirlinesANACAFE - National Coffee AssociationBANDESA - National Bank for Agricultural DevelopmentBCIE - Central American Bank for Economic IntegrationCACM - Central American Common MarketOORFINA - National Finance CorporationEXMIBAL - Company for the Exploration and Exploitation of the
Izabal MinesFEGUA - Guatemalan RailroadsFYDEP - Peten Development AgencyGUATEL - Guatemala Telecommunications AdministrationGUATEXPRO - Guatemalan Export PromotionIDB - Inter-American Development BankIGSS - Guatemalan Social Security InstituteINDE - National Electricity InstituteINDECA - National Institute for the Commercialization of
Agricultural ProductsINFOM - Municipal Development InstituteINFOP - Institute for the Development of ProductionINGUAT - Guatemalan Tourism InstituteINTA - National Institute for Agrarian TransformationINTECAP - Technical Education InstituteINVI - National Housing Institute
FISCAL YEAR
January 1 to December 31
This report is based on thefindings of an economic missionto Guatemala in September 1974composed of:
Guillermo Castafeda ChiefJosefina-Vial Economist

GUATEMALA
TABLE OF CONTENTS
Page Number
COUNTRY DATA
SUMM.A.RY AND CONLUSIONS.i -i
I. INTRODUCTION ...................................... 1
II. ECONOMIC DEVELOPMENT ........................ ,.,, . 2
III. PUBLIC FINANCE ...................................... 5
A. Central Government ...... 6Revenue.. . . ... 7
Current Expenditure. 8
Investment Expenditure . . 9
B. Rest of the Public Sector .
IV. MONEY AND BANKING ................ .. i5
V. BALANCE OF PAYMENTS ................................. 19
Exports . ........ 19Imports ........................................... 22
Financing the Current Account Deficit ............ 2
VI. NAAJOR DEVELOPMENTS IN 1974 .......................... 25
VII. MEDIUM-TERM PROSPECTS ...... 30
MAP
STATISTICAL APPENDIX
PopulationNational AccountsPublic FinanceBalance of PaymentsExternal Public DebtMoney and CreditPrice Indexes

Page 1 of 2 pages
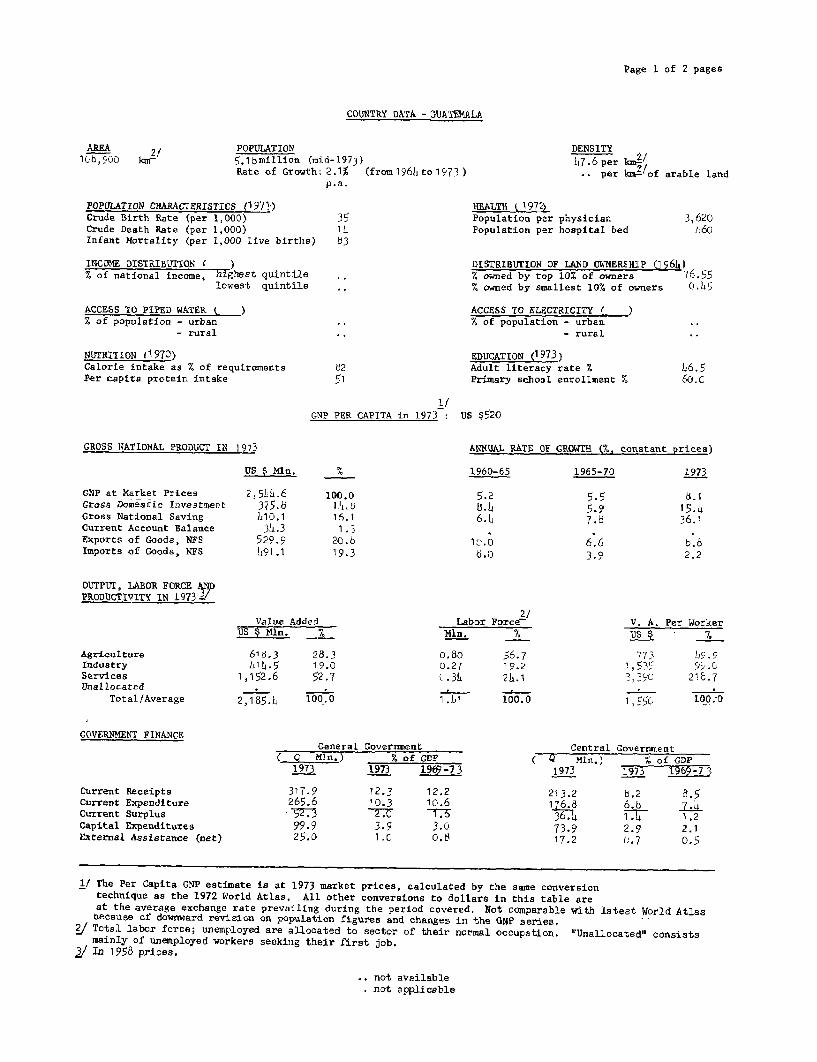
COUNTRY DATA - OUATEMALA
AREA 2/ POPULATION DENSITY1bG,900 ker 5.1bmillion (mid-1973) k7.6 per kn3t
Rate of Growth: 2.1% (from 196h to 17) .. per 2c /of arable landp.a.
POPULATION CHARACTERISTICS _1971-) HEALTH i 197i4Crude Birth Rate (per 1,000) 35 Population per physician 3,620Crude Death Rate (per 1,000) 14 Population per hospital bed L36Infant Mortality (per 1,000 live births) o3
INCOME DISTRIBUTION ( ) DISTRIBUTION OF LAND OWNERSHIP 0964)% of national income, highest quintile .. % owned by top 10% of owners 76.55
lowest quintile ., % owned by smallest 10% of owners 0.05
ACCESS TO PIPED WATER t ACCESS TO ELECTRICITY ( )% of population - urban .. 'A of population - urban
- rural .. - rural
NUTRITiON l970) EDUCATION (1973)Calorie intake as % of requirements 52 Adult literacy rate % h6. 5Per capita protein intake 51 Primary school enrollment Z 60.'
'IGNP PER CAPITA in 1973 : US $520
GROSS NIATIONAL PRODUCT IN 1973 ANNUAL RATE OF GROWTH (%. constant prices)
US $ Mn. x 1960-65 1965-70 1973
GCiP at Market Prices 2,5hh.6 100.0 5.2 5.5 6.1Gross Domestic Investment 375.8 Il .L5 5. 5.9 15.0Gross National Saving 010.1 16.1 6.4 7.6 36.1Current Account Balance 34.3 1 .3Exports of Goods, NPS 529.9 20.6 1'.0 6.6 b.6Imports of Goods, NPS 491.1 19.3 6.0 3.9 2.2
OUTPUT, 1ABOR FORCE pPRODUCTIVITY IN 1973_"
Value Added Labor Force2 V. A. Per WorkerUJS $Mln. %A Mln. 7US %
Agriculture 616.3 28.3 o.8o 56.7 773 1X5.5Industry 31l.5 19.0 0.27 19.2 i,535 959.Services 1,152.6 52.7 (.3 25.1 9.3.3 210.7Unallocated
Total/Average 2,185.0 100.0 1 .51 100.0 1,55, 100.-9
GOVERNMENT FINANCEGeneral Goverrmeat Central GovernmentMin.) 7. of CIP ( Q Mln.) 'A of GDP
1973 1973 1l26i2 1973 L973 1969-7 3
Current Receipts 317.9 12.3 12.2 213.2 5.2 8.5Current Expenditure 265.6 10.3 10.6 136k1 6.5 7 .Current Surplus 3273 2.C 7.6 .4h 1. 1.2Capital Expenditures 99.9 3.9 3.0 73.9 2.9 2.1External Assistance (net) 25.0 1.C 0.8 17.2 C.7 D.5
1/ The Per Capita CNP estimate is at 1973 market prices, calculated by the same conversiontechnique as the 1972 World Atlas. All other conversions to dollars in this table areat the average exchange rate prevailing during the period covered. Not comparable with latest World Atlasoecause of downward revision on population figures and changes in the GNP series.
2/ Total labor force; unemployed are allocated to sector of their normal occupation. '"Unallocated" consistsmainly of unemployed workers seeking their first job.
31 In 1958 prices.
not availablenot applicable
Page 2 of 2 pages
COUNTRY DATA - JUATEMALA
MONEY, CREDIT and PRICES 1966 1969 1970 1971 197 2 197 3(MillionQuetz outstanding end period)
Money and Quasi Money 239.3 31 I.7 350.1 3bb.& 462.7 590.5Bank Credit to Public Sector 3h.2 13.9 h1'.1 67.1 101.4 111.1Bank Credit to Private Sector 176.0 231h.9 24b.9 257.2 270.1 305.9
(Percentages or Index Numbers)
Money and Quasi Money as % of LNP 17.4 1.7 1ci.o 20.0 23.5 23.2General Price Index (1965 = 100) 99.1 103.0 108.1 lo6.o 1 u5.3 120.7
Annual percentage changes in:General Price Index -0.9 1.6 5.0 -1.2 -1.4 14.6Bank credit to Public Sector, net 11.1 -6.4 63.2 51.1 9.6Bank credit to Private Sector 7.2 6.o 3.3 8.1 10.0
BALANCE OF PAYMENTS MERCHANDISE EXPORTS (AVERAGE 1969-73)
1971 1972 1973 US $ Mln %(Millions US $)
Coffee 105.o 32.6Exports of Goods, NFS 33d.5 395.3 529.9 Cotton 36.5 11.2Imports of Goods, NFS 371.0 396.5 891.1 Bpnanss 21.6 6.7Resource Gap (deficit -) . 5 1TT2 jo.b Meat 17.0 5.2
Sugar 12.8 3.9Interest Payments (net) -12.3 -1h.o -9.4 All other commodities 131.1 140.4Workers' Remittances . . Total 32li.o T 8 QO
Other Factor Payments (net) -29.5 -33.1, -37.0Net Transfers 2'.2 20.0 8 .9 EXTERNAL DEBT. DECEMBER 31. 1973Balance on Current Account 38C.1 -15.c .3
US $ MlnDirect Foreign Investment 28i.6 15.3 2|.7Net MQT Borrowing Public Debt, incl. guaranteed 192.3
Disbursements 22.4 32.3 23.3 Non-Guaranteed Private DebtAmortization -20.2 -38.9 -12.8 Total outstanding & DisbursedSubtotal 2.2 -2.6 10.5 l/
Capital Grants 7.0 6.2 9.C DEBT SERVICE RATIO for 1973Other Capital (net) 1. 25.2 -22.4 %Other items n.e.i 16:L 2 c. 7.oIncrease in Reserves (+) 11.o 50.3 67.' Public Debt, incl. guaranteed 3.75
Non-Guaranteed Private DebtGross Reserves (end year) 101o.6 185.5 227.0 Total outstanding & DisbursedNet Reserves (end year) 08.0 13,.3 2C1.3
RATE OF EXCHANGE IBRD/IDA LENDING, February 28,l975(Million US $):
IBRD IDAUS $ 1.00 = Quetzples 1.CRQ 1.00 = US $ 1 .Co Outstanding & Disbursed 34.6
Undisbursed 11.4This rate uf exchenge hat Outstanding incl. Undisbursed 76rprevailed since December 18, 1946
1/ Ratio of Debt Service to Exports of Goods and Non-Factor Services.
not available
not applicable
July 18, 1972EPD/PRD
SUMMARY AND CONCLUSIONS
i. Guatemala's rate of economic growth has been accelerating since1950. Although the rate of growth fluctuated substantially during 1963-73,it never fell below h percent per annum; on average product grew by about5.8 percent per year. The average rate of growth of GDP for the years1972 and 1973 is estimated at more than 7 percent per annum. Populationgrowth seems to have decelerated significantly in the last decade, fallingfrom 3.1 percent during the period 1950-6h to 2.1 percent per annum during196h-73. The benefits of economic growth have been extremely concentratedand the standard of living of the rural poor -- who make up nearly 50 per-cent of the 5.2 million population -- does not seem to have improvedsignificantly. GNP per capita reached more than US$500 in 1973. Prelim-inary estimates for 1974 indicate output grew by some 5.7 percent.
ii. The Guatemalan public sector's role in promoting economic growthhas been limited. As emphasized in previous World Bank reports, a moreactive Government participation in the growth process is needed to attacksuccessfully the deep-seated long-term development problems of the country.Substantial increases in development expenditures (both capital and current)are needed to broaden the country's economic and social base and to inte-grate the large subsistence sector into the market economy. The Governmentthat left office in July 1974 is credited with some positive actions in thisdirection as part of the implementation of the 1971-75 Development Plan.Investment expenditures were doubled in 1972-73, with a large proportion ofthe increase occurring in health and education; thus from an annual averageof Q3.7 million for investment expenditures in these areas during 1968-71,they reached an average of Q20 million in the years 1972-73.-
iii. The major bottlenecks that prevented achievement of higher publicinvestment levels in the past were the inadequate capacity to prepare andexecute projects and an inadequate system of taxation. Nlew efforts are beingmade to enlarge project preparation capacity. Tax revenues are less than8 percent of GDP, which is among the lowest in the developing countries. Newtax measures were taken in l974, but these were primarily intended to compen-sate for the erosion of Government revenues resulting from the inelasticityof the tax system in the face of inflation. The new administration is cur-rently preparing a new economic development plan. In the meantime, however,some basic policy decisions have been made as part of the emergency programto fight inflation -- that is, the Government has provided fertilizers,extension services and storage, and has increased support prices in orderto stimulate production of basic grains. These measures should be integratedinto a compFehensive development program to improve the productivity ofsmall-scale subsistence agriculture in order to increase the lot of the poor-est sectors of the economy.
iv. Prices have been growing at an unusually fast rate in the recentpast. The force behind this new phenomenon in the Guatemalan economy

- ii -
originated mainly in the external sector. The Government has taken a seriesof measures to reduce the impact of world market conditions on the rest ofthe economy. The policies have been aimed mainly at increasing the supplyof goods which are considered essential. In addition, a temporary pricecontrol system was introdLuced to fight hoarding and artificial price escala-tion. Excess liquidity in the banking system prevailed in 1972 and 1973.The monetary authorities were slow in responding to this situation. Itwas not until September 1974 that an upward revision of interest rates andreserve requirements for the banking system was implemented.
v. In 1973 the balance of payments reached a record surplus ofUS$67.0 million, and the Central Bank's foreign reserves reached a recordof US$213.R million. However, mainly because of the increase in the priceof oil and speculative stockpiling of imported raw materials and intermediategoods, the balance in current account switched from a surplus of US$3h.0million in 1973 to a deficit of about. US$75.0 million in L97L4. In addition,there was a short-term capital outflow of about US$30.0 million last year.
vi. Despite higher costs of fuel and other imported inputs, the over-all economic prospects for Guatemala for the rest of the decade are reason-ably good. With no basic changes in policy, the economy could grow atabout 6 percent per year under fairly safe balance of payments conditions.However, a continuation of past trends would only have a very limited effecton the large segment of the population still on the margin of the casheconomy. If this segment of the population is to be integrated graduallyinto the modern economy, a more agressive development policy will have tobe implemented. The very low public debt service ratio (3.8 percent in1973), which will probably decline further, would easily allow the increasesin foreign indebtedness which are needed to accelerate development. However,this increase in the inflow of foreign resources could be brought aboutonly if the country were to expand its absorptive capacity through thestrengthening of the project preparation process and through a fiscal effortsufficient to generate the required additional counterpart financing.
ECONOMIC DEVELOPMENT AND PROSPECTS OF GUATEMALA
Chapter I: INTRODUCTION
1. Mountains divide Guatemala into four main regions: the highlands,the Pacific coastal plain, the Atlantic area and the Pet6n. Geologicalhistory has given this mountainous tropical country very fertile, volcanicsoil and a range of altitudes which offer a wide variety of climates. Thesevaried regional conditions are well-suited to the growth of almost any typeof agricultural product. The Pacific lowlands produce cotton, sugar cane,cattle, rice and other tropical crops. The upper Pacific piedmont is anexcellent coffee region and most of the coffee is produced in this area.The highlands produce most of the corn and beans, which are the principalitems in the country's diet, and the Atlantic area produces bananas andsome coffee. The Pet6n, which is the northernmost province, occupies abouta third of the country's area, but is largely unexploited. It containsthe most important archeological monuments of the Mayas, and produceschicle and some tropical woods.
2. On the other hand, the rugged and broken topography has hamperedtransport and created great obstacles to the development of the country,and has tended to perpetuate the cultural isolation of some segments of therural population. There has been no extensive exploitation of Guatemala'smineral resources. The first large commercial exploitation of nickel, nearLake Izabal in the Atlantic area, will be started in early 1977. Exploratorywork in potential petroleum areas has been carried out, apparently withencouraging results; however, while exploration continues, there are as yetno immediate plans for exploitation. The natural beauty of the country andits rich history, which has left archeological monuments and folklore ofrare quality, give Guatemala a high potential for tourism development.
3. Guatemala has the largest population among the Central Americancountries. Because of the good climate and soils, most of the populationand economic activity are concentrated in the central highlands and thePacific slopes. The population is mainly rural. Guatemala City, thecapital, has more than 717,000 inhabitants, but only two other cities haveover 30,000. Guatemala's population has been growing at about 2.1 percentper annum in the last decade and now totals 5.2 million. The most signif-icant characteristic of the population is its sharp ethnic division. Thepure Indians, who make up about 43 percent of the total population, areeconomically, culturally and linguistically separated from the rest of thepopulation, which is mainly of mixed Spanish and Indian origin. A largepart of the Indian population participate to a very limited extent in themoney economy and political life of the country. The main contribution ofthe Indians to output, apart from their subsistence agriculture, has beento provide a labor supply for the large coffee and cotton plantations atharvest time.
Chapter II: ECONOMIC DEVELOPMENT
4. Guatemiala's rate of economic growth has been accelerating inthe last two decades. In the first five years of the L950's, despite thestimulating effects of the Korean War on the country's exports, the averagerate of growth was only about 2.5 percent per annum. Substantial improve-ments in world market conditions for coffee in 1956-57 stimulated theeconomy, and output increased at a yearly average of 6.9 percent. However,as world market conditions for primary commodities deteriorated in 1958,growth fell back to 2.3 percent. In subsequent years the rate of growthremained above 3.5 percent. In 1963 Guatemala achieved a record crop ofcoffee, and the production of cotton, which had expanded rapidly in pre-vious years, nearly doubled. Despite some deterioration in prices, thevalue of Guatemala's exports increased by about 30 percent and output by9.5 percent. After 1963 the annual rate of growth never fell below 4.0percent and on average product grew by about 5.8 percent per annum.
5. The improvements of the 60's and 70's have been the result oftwo main factors: first, the development of commercial agriculture in newareas on the Pacific Coast, and second, the creation of the Central AmericanCommon Market in 1960. The Common Market gave a powerful incentive to themanufacturing sector which grew at a high rate until the 1969 Honduras-ElSalvador border conflict, which disrupted the market and contributed toHonduras? withdrawal from it. However, an interim bilateral trade agreementwith Honduras and good market conditions for most of Cpntral Arnericanprimary products spilled over into the manufacturing sector, which resumedits high rate of growth early in 1973.
6. Preliminary results of the 1973 census indicate that, contraryto previous estimates, population growth has decelerated significantly in-the last decade, falling from 3.1 percent per year in the intercensus period1950-64 to 2.1 percent per year between 1964 and 1973. Moreover, the ratioof urban population to total population has remained almost unchanged be-tween the last two censuses. This would appear to be the result of a steep-er decline in urban birth rates rather than a halt in urban migration -- theshare of population aged 0-14 in the urban area has declined by 1.5 percentagepoints between 1964 and 1973, while the corresponding share in rural areashas been reduced by only half a percentage point.
7. The change in structure of active population has followed thestandard pattern for countries at Guatemala's stage of development, withprimary activities losing their relative importance to secondary and tertiaryactivities. A major portion of the relative decline in the active agricul-tural population has been absorbed by manufacturing and construction -- theformer losing over seven percentage points of its share in the total, whilethe latter two together gained 5.5 percentage points (See Table 1).
Table 1: ECONOMICALLY ACTIVE POPULATION1950, 1964, 1973
(Percentage distribution)
1950 1964 1973
Agriculture 66.1 63.9 56.7
Mines and Quarries 0.2 0.2 0.2
Manufacturing 12.4 1265 14.6
Construction 2.9 2.9 4.3
Electricity 0.1 0.1 0.3
Commerce 5.9 6.7 7.9
Transport 1.7 2.h 2.7
Services L0.7 12.3 13.3
TOTAL 100.0 100.0 100.0
3ource: Appendix table 1.2
8. The average rate of growth of GDP for the years 1972 and 1973 is
estimated at more than 7.0 percent per annum. While in 1972 agriculture grew
faster than manufacturing (9.6 percent versus 5.5 percent), the reverse occurred
in 1973 with manufacturing growing by 8 percent, and agriculture by 7.3 percent.
9. Agriculture employs about 57 percent of the active population,
although it contributes only about 28 percent of GDP. The rate of growth of
agricultire has fluctuated sharply in response to changes in weather and
market conditions. In 1972-73 gross production grew by more than 11.5 percent
per annum. This high rate of growth compares very favorably with the generally
modest rates achieved in the preceeding seven years. Favorable market condi-
tions for some industrial crops led to a significant expansion of production
and exports. However, official export statistics do not fully reflect the
price movements because a high proportion of sales are made under futures
contracts, and, in addition, there is an apparent tendency to understate
export prices. This rapid growth of industrial crops has driven the price of
land up, especially in the south, where cotton and sugar are produced. Some
areas previously used for cattle raising and maize cultivation have been plant-
ed with the above mentioned crops. The rapid expansion of commercial crops
in 1972-73 induced an increase in rural wages. It is estimated that most of
the farmers were paying wages above the legal minimum wage set at Ql.15 per
workday plus food and lodging.

Table 2 GDP BY TYPE OF ECONOMIC ACTIVITY1950 - 1973
(In percentage)
Annual Averages
t950-52 1957-59 1966-66 1971-73
Gross Domestic Product 100.0 100.0 100.0 100.C
Primary production 32.6 . 9.7 29.0 26.2Agriculture and related sectors 32.6 29.5 26.9 26.1
Mining 0.2 o.2 0.1 .1
Secondary production 15.4 16.4 17.1 1d.dManufacturing 12.1 12.6 1h.27 15.9Construction 2.6 3.1 1.9 1.7
Utilities o.5 0.7 1.0 1.2
Services 51.o 53.9 53.9 53.oTransport and Communications 3.7 -T:T5.1 5, 3 gCommercial services 26.3 226.4 27.7 26.2Financial services 1.3 1.6 2.4 2.3Housing services 8.6 6.6 7.9 6.4Public Administration 6.2 5.9 h.6 4.7Other 5.7 6.1 5.8 5.6
Source: IBRD report WH-132b and appendix table 2.1
10. The average growth rate of gross production of food crops has exceeded
5 percent per annum in 1971-73 after the very low growth registered in the pre-ceeding six years. However, the production of maize, the main staple of the
population, dropped in 1971 and 1972, while that of beans, the other basic food
crop, registered significant gains only in 1972 and 1973, The slow growth in
basic grains has forced the Gcvernment to import substantial amounts of corn
in the recent past. In view of the importance of basic grains, the Government
has taken measures to promote their production.
II. Although investment has fluctuated widely from year to year, for the
last 23 years it has been growing on the average at a faster pace than GDP.In 19g0 gross investment as a percentage of GDP was only about 9.3 percent.
In the second half of the l950's, the economic boom which crigina.ted in the
external sector, had a positive impact on investment -- in 1956-53 the rate
of investment attained a level of 15.3 percent. In the period l19:-62 investmentwas substantially depressed and the average rate of investment declined to about
9.6 percent of GDP. However, investment received renewed stimulus there-after as a result of the creation of the Central American Cormon Market,which brought with it generous exemptions from duties 'on imports of capital
goods and raw materials, tax holidays for new industries, and increasedimport duties on products which would be competitive with those of the
Commcn Market. Since 1963 the average rate of investment to GDP hasrema_ned at nearly 13 percent, with public investment increasing sub-stantially in 1972 and 1973.
12. The new more aggressive investment policy of the Governmentcompensated in part for the lower levels of investment in the privatesector in 1972. Private investment in the manufacturing sector declin-ed due to prevailing uncertainties in the Central American Common Marketand to the existence of substantial excess capacity in industries suchas textiles. Recent increases in demand for manufactured products haveled to an expansion of investment in stocks, particularly in the earlymonths of 197h. The strong external market for the main commodity exportsof Guatemala stimulated investment in agriculture in 1972-73. Moreover,as a result of the economic boom, the housing industry, which had stagnatedfor many years, was growing at about 19 percent per annun. Constructionactivity is mainly concentrated in Guatemala City.
13. The country's economic fortunes have traditionally depended onfluctuating prices and supply conditions for a few agricultural export crops.Development in the agricultural sector has been restricted almost exclusivelyto large commercial agriculture, which is concentrated in only a few areasof the country. The effects of rapid economic growth have not been spreadwidely through the economy. Real wages in plantation agriculture havetraditionally been low and it appears that only recently they have register-ed some improvements. Productivity in most of the highlands -- where mainlybasic grains are grown on small plots of land -- has made only small gains.Since the beginning of the 1960's the base for economic growth was broadenedwith the creation of the Central American Common Market, which became animportant outlet for Guatemala's industrial production. The size of themarket and the limited possibilities for futher import substitution willcontinue to be a major constraint to future growth of the manufacturingsector. However, the experience gained through the Common Market will bevery valuable in promoting non-traditional exports to third markets.
Chapter III: PUBLIC FINANCE
1[. Although Guatemala's public sector participation in GDP has increasedduring the last eight years, it still remains at a very low level. Duringthis period GDP in current terms grew at an average rgte of 8.2 percent perannum, while public sector current revenue grew at about 10 percent per annumand current expenditure at a slightly lower rate. This expansion of publicsector operations was due to the creation of new public entities and therapid development of some public utilities already in existence.. The averageannual rate of growth of public investment expenditure during the periodexceeded 11 percent. As there was only a modest increase in current savings,the overall deficit of the public sector increased by about 9.7 percent per
- 6 -
annum on the average, attaining a level of 1.2 percent of GDP in 1973.
A. Central Government
15. Guatemala's management of fiscal affairs has had remarkablesuccess in achieving internal stability through conservative budget han-dling. This stability, however, has been attained at very low levels ofrevenue and expenditure. During the fifties and up to 1958, Central Govern-ment current revenue stood at about 9.4 percent of GDP, dropping to about8.5 percent in 1959-60 due to a reduction in tax collections on externaltrade. During these years coffee prices declined steeply and imports weresignificantly depressed. This declining trend in fiscal revenues continuedfor the first three years of the sixties because of further deterioration ofthe external sector and the introduction of tax exemptions under the CentralAmerican Common Market. The ratio of Government revenues to GDP fell to 7.6percent during this period. Tax measures taken in subsequent years succeededin raising this ratio to about 8.5 percent of GDP, a level which was maintained
Table 3: PUBLIC SECTOR SUMMARY OPERATIONS 1/(Main items as a percent of GDP)
965-67 1968-70 l971 1972 1973
Current Revenue 11.2 11.6 12.1 13.0. 12.3(Central Government) (6.7) (6.5) (6.7) (b.b) (b.2)
Current Expenditure 9.8 10.3 10.5 11.4 10.3(Central Government) (7Mb) (7.6) (7.4) (7.6) (6.5)
Savings 1.h 1.3 1.6 1.6 2.0(Central Government) (0.9) (0.9) (1.3) (1.2) (1.h)
Investment 2.6 2.5 2.9 3.0 3.9(Central Government) (2.2) (1.6) (1.7) (2.5) (2.9)
Deficit Financing -1.2 -1.0 -1.0 -1.2 -1.7(Central Government) (-1.2) (-o.6) (-0.4) (-1.2) (-1.4)
1/ Total public sector figures are net of transfers.
Source: Appendix tables 2.2 and 5.6; components may not add up because ofrounding off and the exclusion of capital receipts.
- 7 -
until 1972. The traditional policy has been to adjust total expenditures tothe revenues available. Guatemala's various administrations have frequentlyresorted to austere measures to keep the deficit to very low levels. Since1959 the overall Central Government deficit has never exceeded 1.8 percentof GDP and has averaged only about 1.0 percent.
16. The administration that left office in July 1974 relied mainly onadministrative reforms to increase current revenue. Although some improvementswere made, the overall impact was limited. On the expenditure side the Govern-ment had adopted an ambitious development program for 1971-75. A necessaryprecondition for the implementation of the program, however, was the creationand reorganization of public sector entities, a task to which the Governmentgave high priority in 1971-72. In 1972-73 Central Government investmentexpenditures increased substantially.
Revenue
17. In early 1973 the outgoing administration realized that the levelof current revenue required to substantially step up Government expenditures
Table 4 CENTRAL GOVERNMENT CURRENT REVENUE
(In millions of current Quetzales)
1965 1965 1971 1972 1973
Tax Revenue 107.1 120.4 153.8 164.2 169.2
Direct Taxes 16.4 22.1 26.3 29.d 33.0
Income tax 13.1 16.c 20.5 22.4 25.3Property tax 3.3 6.1 5.o 7.4 7.7
Indirect Taxes 90.6 98.3 127.5 134.4 156.2
Foreign trade 43.5 34.4 47.5 47.1 57.1(Export duty) ( 5.5) ( 4.b) ( 6.0) ( 5.6) (13.9)(Import duty) (30.5) (26.1) (34.8) (33.9) (37.7)(Unallocated) 4 4.5) ( 3.5) ( 4.7) ( 4.6) ( 5.5)
Domestic transactions 47.3 63.9 80.0 67.3 99.1Stamp tax (15.6) (30.6) (36.9) (40.6) (49.6)Petroleum Products ( 6.6) ( 9.5) (12.0) (13.2) (14.5)Tobacco ( 4-8) ( 5.1) ( 6.9) ( 7.c) ( 7.2)Alcohol (14.0) (15.1) (17.5) (18.5) (20.6)Other ( 4.3) ( 3.3) ( 6.4) ( 6.o) ( 7.2)
Non-Tax Revenue 11.7 13.4 19.2 19.9 24.0
Total Current Revenue 118.9 133.o 173.0 104.1 213.2
Source: Table 5.2 of the Statistical Appendix.
- 8 -
while maintaining stability could not be attained through administrative im-provements alone. However, the proximity of the presidential election(March L974) made the introduction of new taxes politically difficult at thattime.
18. While no new taxes were introduced during 1973, tax administrationimprovements yielded positive results. The number of tax returns auditedincreased by 43 percent, with efforts concentrated on the larger taxpayers, and12,143 new properties were entered in the tax records. Although the number ofnotices to delinquent taxpayers was reduced from 19,000 in 1972 to about 3,000in 1973, the contacts in the latter year were in the form of personal visitsby tax inspectors rather than letters sent through the mail as in the previousyear. The yield on account of tax penalties increased by more than 3h0 percent.A new sales tax auditing team was organized at the beginning of 197h. Thisteam has been visiting the interior resulting in substantial benefits forthe internal service. There are still, however, two important measureswhich need to be implemented: the use of tax identification numbers and thecompletion of property identification on the Pacific Coast.
19. In October 1973, the Goverrment extended for two years the importduty exemption on raw materials for the industries included in the Common Market4greement, and whose initial 10-year exemption period had expired. It is expectedthat the authorities will continue extending the deadlines until the GeneralAgreement being sought in the fiscal area, as part of the restructuring of theCommon Market, is completed. It is estimated that if the Government were toeliminate import duty exemptions, most of which are attributable to the CommonMarket Agreement, it could more than double import duty collections.
Current Expenditure
20. Central Government current expenditures during 1965-73 have grownat a lower rate than GDP. The structure of these expenditures in general hasregistered only minor variations during the period. Between 1965 and 1972,expenditures on social services grew at a faster rate than general services. In1973, however, expenditures on general services increased sharply, and theirshare in total expenditures returned to its 1965 level.
21. Given the degree and extension of poverty in the country, andparticularly in rural areas, the low level of current expenditure is clearly in-adequate to meet the needs of the population. An expansion of current expend-itures in health and education is urgently needed. Moreover, the levels ofGovernment investment in 1972-73 and those projected for future years, particular-ly in the social areas, will demand substantial increases in the Government'scurrent expenditures.
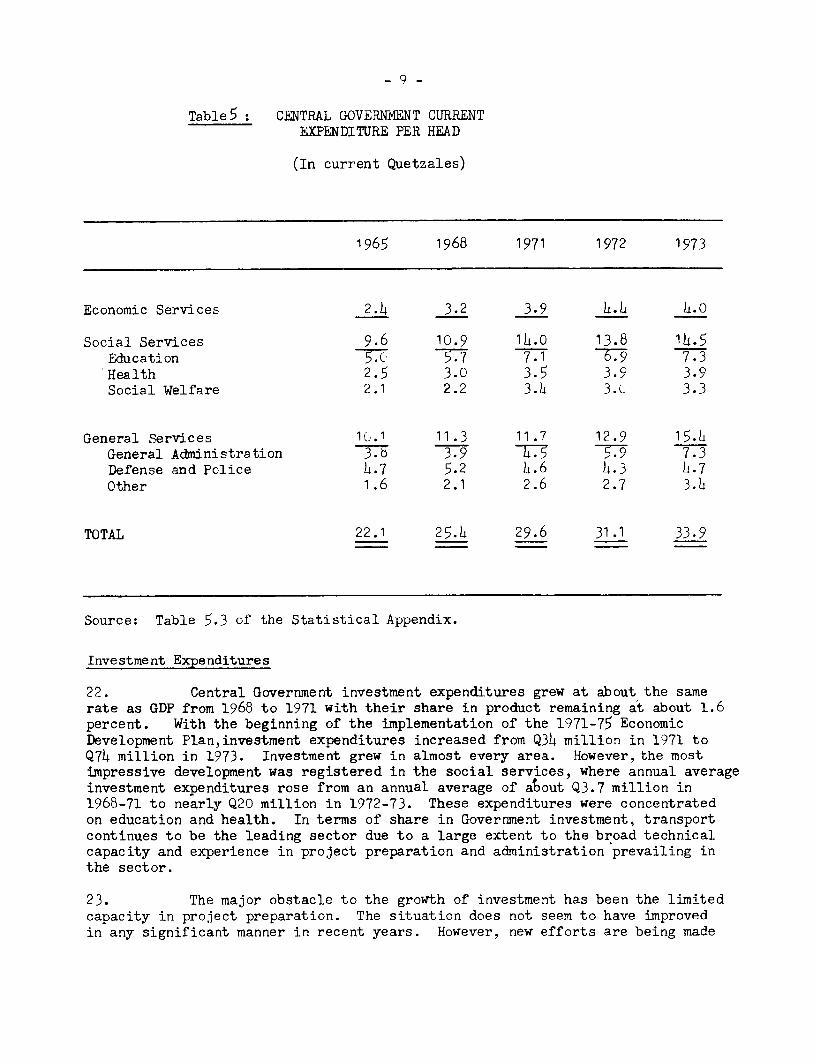
Table5 : CENTRAL GOVERYIENT CURRENTEXPENDITURE PER HEAD
(In current Quetzales)
1965 1968 1971 1972 1973
Economic Services 2.4 3.2 3.9 4.4 4.0
Social Services 9.6 10.9 14.0 13.8 14.5Education 57. -777 7.1 -h79 7.3Health 2.5 3.0 3.5 3.9 3.9Social Welfare 2.1 2.2 3.h 3.u 3.3
General Services 1Lc.1 11.3 11.7 12.9 15.4General Administration 37 3.9 T7§ 5.9 7.3Defense and Police 1.7 5.2 h.6 1.3 4.7Other 1.6 2.1 2.6 2.7 3.4
TOTAL 22.1 25.4 29.6 31.1 33.9
Source: Table 5.3 of the Statistical Appendix.
Investment Expenditures
22. Central Government investment expenditures grew at about the samerate as GDP from 1968 to 1971 with their share in product remaining at about 1.6percent. With the beginning of the implementation of the 1971-75 EconomicDevelopment Plan,investment expenditures increased from Q34 million in 1971 toQ74 million in 1973. Investment grew in almost every area. However, the mostimpressive development was registered in the social services, where annual averageinvestment expenditures rose from an annual average of a!out Q3.7 million in1968-71 to nearly Q20 million in 1972-73. These expenditures were concentratedon education and health. In terms of share in Government investment, transportcontinues to be the leading sector due to a large extent to the broad technicalcapacity and experience in project preparation and administration prevailing inthe sector.
23. The major obstacle to the growth of investment has been the limitedcapacity in project preparation. The situation does not seem to have improvedin any significant manner in recent years. However, new efforts are being made
- 10- -
Table 6: GENrRAL GOVERNMENT INVESTMENT EXPENDITURE
( In million of current Quetzales )
1968 1969 1970 1971 1972 1973
Direct Investment 18.2 23.3 22.C 20.2 39.5 56.o
Agriculture 1.6 4.1 2.b 2.7 3.4 3.7Transport 11.4 13.4 13.0 10.3 16.5 16.7Communications 0.7 0.5 o.6 0.1 - C.1Education 1.0 1.7 1.0 1.1 5.1 11.4Health 3.1 3.1 2.1 1.C 7.1 14.2Other (.4 0.5 2.5 5.0 7.4 9.9
Transfers 7.4 6.7 6.6 14.0 12.7 17.9
TOTAL 25.6 30.0 28.6 34.2 52.2 73.9
Source: Table 5.4 of the Statistical Appendix.
to step up project preparation with technical aesistance from IDB and other inter-national agencies.
2h. The Government which took office in July 1974, is preparing a neweconomic development plan, and expects to complete it by mid - 1975. The authoritiesintend to give a high priority to investments in energy and agriculture (especiallyin the construction of feeder roads and provision of agricultural credit). Itis expected that investment in the social sectors will continue to grow and thattourism will receive special attention.
B. Rest of the Public Sector
25. The decentralized public sector 1/ has a rather limited role in thedevelopment of most sectors of the Guatemalan economy. This situation can beexplained by either one of two reasons: the autonomous entities are of too smalla size to have any measurable overall impact, or they operate as self-containedenclaves.
1/ Excluding banks and other financial institutions.
26. Electricity. An exception to the above-described situation isfound in the field of electricity, where two public institutions form the back-bone of the sector and are key determinants in Guatemala's economic development:the National Electricity Institute (INDE), which is mainly responsible forgenerating electricity, and the Guatemala Electricity Enterprise (EEG), whichalthough generating some of the electricity consumed in western Guatemala, ismainly responsible for electricity distribution. The latter enterprise, formerlyprivate, was acquired by the GuatemalanGovernment in 1972 (96 percent of theshares amounting to Q1-8 million were financed through a bond issue). Seriousproblems have arisen as a result of the low price charged by INDE to EEG on thesale of electricity, although this situation improved in September 1974 whena new contract with a price adjustment clause for changes in the price of oilinputs was signed between the two entities. Simultaneously, electricity tariffscharged to consumers were adjusted upwards to cover the increase in oil prices.The impact of these tariff increases on INDE's financial rate of return arepresently under study.
27. In 1973, the two enterprises generated 82h.3 million 1WH of elec-tricity ( a very small additional amount was privately generated), only slightlymore than one-third was hydro-electricity. The fuel cost for the enterprisesaccounted for about 15 percent of Guatemala's imports of oil products in 1973.With electricity demand growing at 10-12 percent per year and new projects forhydro or geothermal generating expansion in only a very early stage of prepara-tion, the volume of oil products import will have to grow by over 15 percentper year in the next two to three years. Moreover, if no early decision ismade in relation to the interconnection with El Salvador or other plans forincreasing generating capacity by 1976, the shortage of electricity may becomea bottleneck to the country's economic expansion. By the early 1980's the hydrc-electric plant on the Chixoy River, for which financing by IBRD and otherexternal lenders is being sought, should meet the increased demand. Thus theproblem which requires prompt resolution is how to cope with demand in theinterim period. Tentatively, investment for the period 197h-80 has been project-ed at about Q160 million, of which more than 50 percent could be financedinternally.
28. All expansion of generating capacity will be handled by INDE. Sub-stantial financial foreign assistance will be required in this endeavor. Withregard to EEG, an investment plan for expanding electricity distribution hasbeen prepared for 197h-78, which assumes that INDE will plan on new generatingunits for 1976. Investment projected at Q2.7 million in 1974 will graduallygrow to Q3.9 million in 1978. The substantial current surpluses the enterprisegenerates should cover all or a major portion of its investment expenditures inyears to come.
29. Transport. The bulk of public investment in the transport sectoris used for the road network, and is handled by the Central Government. Thisinvestment has traditionally been allotted the highest -- although declining --

- 12 -
share of the Government's direct investment. A fairly ambitious road invest-ment program has been designed for 197h-75, but considerable slippages can beexpected. The longer term plan is being prepared at present.
30. The four most important decentralized public entities in thetransport sector are: the railway (FEGUA), the airline (AVIATECA), the portauthority of Santo Tomas on the Atlantic, and the port authority of Champericoon the Pacific. The two former enterprises have traditionally run deficitsimposing a heavy burden on the Government's budget, while the two latter entitieshave generated profits which throughout the 1970's have allowed internal financingof their investments.
31. FEGUA, an enterprise formely owned by an American firm, was takenover by the Guatemalan Government in 1968. After the takeover, FEGUA continuedto run an operational deficit, using obsolete equipment and a staff which farexceeded requirements. Finally, in 1974 the Government decided to supply FEGUAwith the necessary resources to reduce personnel. The total cost of retirementand severance payments, with a reduction in the staff of approximately 45 per-cent, was Q9.5 million. This money was derived from a Government bond issue.The total bond issue amounted to Q15.0 million, with the remainder being allocatedto the renewal of equipment. The oil-steam engines are to be removed from usebecause they consume many times more fueL per mile than the diesel engines.Moreover, contracts for tariffs for cargo on concessionary terms were rescindedin May, thus increasing the average tariffs. With these changes, it is expectedthat at least the operational deficit may be considerably reduced or even eliminatedby 1975. The specific investment program for FEGUA is presently being preparedby the Planning Office.
32. AVIATECA has considerably improved its position with regard to inter-national flights in 1973 and 197h. The improvement is due in part to restric-tions imposed on foreign airlines transporting passengers to and from Guatemala.The overall operational deficit may be eliminated this year; however, the Gov-ernment intends to transform the entity into a mixed enterprise with privatesector participation in the near future. Thus, no long-term investment plansare available for the airline.
33. The Santo Tomas port is managed strictly as a commercial enterprise,deriving its revenue from fees for ship servicing, cargo handling, and storage.The enterprise generates considerable surpluses after depreciation, of which25 percent is transferred to the Central Government budget. The port handlescargo to and from Guatemala and transit cargo of neighboring countries. Atpresent two warehouses are being constructed and new investments for expansionand improvements are contemplated for the coming years at a total cost ofQ18 million. Foreign financial assistance will be needed.
3ht. The port of Champerico on the Pacific is at present awaiting adecision on the construction of a new port. At this time, only minor invest-ments financed from current surpluses are planned for Champerico for the nexttwo to three years. If the new port now under discussion for the Pacific coastis either withdrawn from the public investment plan or postponed, additionalinvestments will be required for Champerico.
- 13 -
35. Telecommunications. The Guatemalan telecommunications agency,GUATEL, is a public enterPriSe in charge of national and internationalcommunications. It also owns and operates the Guatemala section of theCentral American regional microwave network. Although the telephone networkhas been expanding in recent years with Bank assistance, Guatemala stillhas the next-to-lowest telephone density among the Central American countries- 0.77 per 100 people. GUATEL has a fairly ambitious expansion program withannual investments of about Q17 million per year for the next five years ascompared with Q3.2 million per year in 1970-7h. The bulk of the foreignexchange resources needed are expected to be supplied by IBRD and CABEI.GUATEL, being operated on a profit basis, will be able to finance the totalor at least a major part of the local component of its investment frominternally generated cash.
36. Agriculture. The National Institute for Agrarian Reform (INTA)plays a major role in the colonization efforts of the decentralized agricul-tural public sector. The main responsibility of this institute at presentis the issuance of property titles to new "colonos", which enable themto obtain credit from BANDESA and the services of the National Institutefor Agricultural Commerce (INDECA). It appears that there has been a slow-down in the establishment of new colonies, with efforts being concentratedon the consolidation of existing ones. The entity derives its revenues forcurrent expenditures mainly from budgetary transfers. The earmarked taxon idle land and other nontax revenue weigh only marginally in total revenues.Amortization payments on the sale of public land and additional Governmenttransfers account for total capital revenues. Investment expenditures,which have been fairly modest in recent years, are related to the implementa-tion of colonization schemes. In addition to the above-described functions,INTA is in charge of the management of some cooperative farms. Up to theagriculture year 1969-70 INTA had generated a deficit in this endeavor. Sub-sequently, increasing although still modest surpluses have resulted. (Theoperating results of cooperative farming, basically private in nature, havenot been included in INTA's revenue and expenditure projections).
37. INDECA, the public entity in charge of basic grains stabilizationprograms, acts as a marketing board for these grains. It finances itsadministrative expenditures from Central Government transfers and its invest-ment expenditures from additional Government transfers and foreign loans.The major investment program being carried out at present is the constructionof silos, both for the entity itself and for cooperatives. In 197h-80, theentity is projected to invest between Q3 and Qh million a year in the construc-tion of silos, cold storage facilities and warehouses. Additional foreignresources besides those already committed by AID and CABEI may be requested.The role of INDECA in the development of agriculture is projected to increasein importance when its operations become better coordinated with those of theMinistry of Agriculture and BANDESA. The accounts for INDECA do not includethe results of the purchase and sale of grains for which the Government assignsspecific subsidies.
- 14 -
38. A major public development in the rural sector is being under-taken by the Peten Development Enterprise (FYDEP). This is a typical enclavein the economy. It started with the sale of public land under very favorableprice and timing conditions. Eligibility for the purchase of public landwas determined solely on the basis of the potential buyer's financial capacityto clear and exploit the land; there was no limit on the size of the plot.The population of the area, which was 30,000 five years ago, is estimatedat 100,000 at present; a number of large farms have been established as wellas 27 cooperatives with a total of about 10,000 smaller farmers on plotsaveraging about 45 ha. The enterprise derives its current revenues from asmall transfer from the budget and charges made to chicle and pepper exploita-tion concessions. Capital revenues are obtained from the budget and fromthe sale of land. The entity generally builds its own roads, schools, healthcenters, etc. and appears to have only marginal connections with either theCentral Government or other public sector agencies. With abundant unopenedpublic land in the area, further expansion of FYDEP activities is expectedin future years.
39. Tlhe entities described above are the three most important in theagricultural decentralized public sector excluding financial institutions.Other agencies of minor importance are included under the heading "Other"in Table 5.5. Their investments are only of marginal nature.
LO. Municipalities. The rapid growth of Guatemala City has meantthat revenues and expen ures of the capital city have consistently exceededthose of all other municipalities in the country put together. The sourcesof municipal revenues are basically municipal taxes and license fees; inaddition, some small municipalities receive support from the Central Govern-ment budget. Investment expenditures are financed through current surpluses andexternal and internal borrowing. INFOM (Institute for Municipal Development)was created for the purpose of assisting in the development of municipalitiesexcluding Guatemala City. Considerable municipal investment has been financedthrough soft loans granted by INFOM with funds derived partly from loans bythe IDB. The rate of loan recovery of INFOM has been extremely high and oper-ations are expanding rapidly. Investment in Guatemala City exceeds the amountin the municipal budget because one of the most important projects, city watersupply, is being carried out by the Ministry of Public Works. Consideringthe process of industrialization and the fact that urban population is growingfaster than rural, investment expenditure of the municipalities will have toexpand at a rapid pace.
41. Although INGUAT (Guatemalan Tourism Institute) is not directlyrelated to municipal or urban development, its main investment project isthe development of the Tikal tourist complex. This project, which is expectedto receive CABEI and IDB financing, contemplates, in addition to forestclearing and restoration and maintenance of the Tikal Mayan ruins, the con-struction of a tourist resort on the northern part of Lake Peten Itza fromwhich excursions to the ruins -- 90 kms. from the lake -- would originate.The projected amoun s of external and Government resources for this projectwould appear to fa'li short of requirements if the development is to take placein a reasonable period of time (facilities are almost nonexistent at present).
- 15 -
The Tikal ruins are probably the most promising archeological attraction inCentral America. INGUAT could play a more aggresive role in planning tourismdevelopment in Guatemala and in devising policies to attract private invest-ment in the sector: tourism continues to be a potentially high foreign exchangeearner for Guatemala.
42. Social Security. The Guatemalan Social Security Institute (IGSS)services all civil servants and about three-fourths of the urban labor forceemployed in the private sector. The armed forces have their own social securityinstitute (IMP), whose income is less than 10 percent of that of the IGSS.The IGSS insures all its members against accidents, granting medical attentionin such cases, and paying disability pensions and life insurance. In addition,in the Guatemala Province only, the IGSS carries out a program of maternityservices and medical attention in case of sickness. Up to now, no unemploy-ment or retirement benefits are included in the institution's programs.
43. The sources of revenue of the IGSS are a 4 percent charge on allemployees' salaries, with 3 percent paid by the employer and 1 percent by theemployee under the accident program, and an additional charge for participantsin the sickness and maternity programs. The Central Government is obligatedto make an annual transfer from the budget over and above its contribution asemployer; however, this is seldom or never done and considerable arrears haveaccumulated on this account. Partly because of these Government arrearages,IGSS' ambitious program for hospital construction has lagged far behind schedule.In practice, the amount of annual investment is determined by the surplus oncurrent account of the institution. In the hospital investment program, verylittle coordination with the Ministry of Public Health has taken place,resulting in certain cases in duplication of medical facilities in particularareas and total neglect in others.
44. Other autonomous agencies. Of the remaining autonomous agencies,the University of San Carlos is the only important one in relation to typeand volume of operation. Other autonomous institutions deal with fire pro-tection, sports development, recreational facilities and similar activitiesinvolving only negligible investments. These agencies as well as the Univer-sity obtain an important share of their resources from the Central Governmentbudget. The University of San Carlos has received assistance for its invest-ment program from the IDB in the past -- the increasing demand for highereducation will require considerable expansion of budgetary allocations for theUniversity.
Chapter IV: MONEY AND BANKING
45. Guatemala has enjoyed many years of price and balance of paymentsstability. These results have been achieved to a large extent by conservativefiscal and monetary policies. However, while the balance of payments hascontinued to improve in the last few years, prices have been growing at unusuallyfast rates. Although fiscal policy has been more expansionary and monetary
- 16 -
policy looser mainly through lack of action, the factors behind the inflationarytrend stem basically from the external sector.
h6. Banking system liabilities grew at a faster rate than GNP duringthe period 1966-1973, especially in the laat two years -- the ratio of liquidassets to GNP increased from 20 percent in 1971 to more than 23 percent in 1973.While the money supply, defined as cash and sight deposits, has remained atabout the same percentage of GNP during the period 1966-73, savings and timedeposits grew at an average rate of more than 18.5 percent per annum, comparedto an average rate of 9.2 percent per annum for GNP. This substantial changein the banking system liabilities structure seems to have been encouraged by twomain forces: on one hand, the cash requirement ratio which allowed the banksto use a larger proportion of their quasi-money liabilities for lending purposes;and on the other hand, the lack of investment opportunities for investors, espe-cially farmers and small city capitalists. While the first factor must have beenthe main force up to 1971, the second consideration was undoubtedly responsiblefor the growth in the last two years. As a consequence of the change in struc-ture of the banking system liabilities, the effective average cash requirementratio for the commercial banks was reduced from 21.3 percent in 1966 to 17.3 per-cent in 1972. / The monetary authority modified the cash requirement ratio inAugust 1973, which helped bring the effective average rate up to 18.2 percentfor 1973. Y
b7. The rapid growth of banking system liabilities in 1972-73 was broughabout by the sizeable surplus on the balance of payments which produced anincrease in net international reserves of more than Q117.0 million. However,despite the large increase in deposits of more than 50 percent between 1971 and1973, the banking system's internal credit expanded at only a moderate rate.This caused banks to accumulate idle balances, forcing some of them to discouragethe public from increasing their deposits by reducing interest rates payed onsavings. 3/ While several commercial banks were to a certain extent limited bythe legal capital requirements,4/ only one bank requested authorization toincrease its capital. It appears that in most cases the banks were not readyto assume the higher risks involved in a more aggresive policy -- which wouldattract new customers.
1/ The requirements were 35 percent against sigh and sho'rt-term time deposits andundrawn balances on lines of credit, and 10 percent against long-term time andsavings.
2/ The new cash requirement rates effective after September 1, 1973 were 30 percentagainst sight and short-term time deposits and undrawn balances on lines ofcredit, and 15 percent against long-term time and saving deposits.
3/ Banks are not allowed to transfer abroad the financial resources collected inthe country.
Lj/ Banks are required to maintain their capital at a level equal to at least 5percent of bonds issued or guaranteed by the Government, 10 percent of allother loans and 50 percent of fixed assets.
- 17 -
Table 7: ASSETS AND LIABILITIES OF THE BANKIN5SYSTEM
(In million of Quetzales)
End of December Annual Change1966 1970 1973 1955-70 1971 1972 1973
International reserves, net 40.9 72.2 201.3 4.9 11.8 50.3 67.0
Domestic assets 239.5 33;.4 461.3 26.1 32.3 54.9 34.7Public Sector, net 3 .2 -T.-1 111.1 3.8 3T 9.7(CG, net) ( 49.4) (45.3) (105.3) (3.5) (21.4) (29.7) (8.9)(RPS,net) (-15.2) (-4.2) ( 5.8). (0.3) ( 4.6) ( 4.6) (0.8)
Private Sector 178.0 248.9 305.9 16.7 3.3 20.9 27.8Subs. to Intl. Org. 10.2 15.4 25.8 1.1 1.8 4.3 4.3Unclassified assets, net 17.1 34.0 1,3.5 L.5 -3.8 -4.6 -7.1
Assets = Liabilities 280.4 411.6 662.6 31.0 44.1 105.2 101.7
Money 140.1 173.2 260.3 8.0 5.2 33.1 48.8Quasi - money 98.6 176.9 330.6 8.4 33.5 60.8 59.4Foreign liabilitiesl/ 19.6 24.2 11.9 1.2 -1.9 -o.6 -9.8Other liabilities 21.5 37.3 59.8 3.4 7.3 11.9 3.3
1/ Medium and long-termSource: Tables 6.2 and 6.3 of the Statistical Appendix.
48. Most commercial banks, facing large idle balances and insufficientcredit demand from their traditional clients in the private sector, struggledfor the opportunity to secure public bonds and merchandise receipt. Thus,on the one hand, the investment of the commercial and development banks inpublic and private bonds increased from Q44.0 million in 1971 to Q133.0 millionin 1973; on the other hand, bills discounted declined from Q32.0 million toQ28.0 million, and net loans rose only from Q199.0 million to Q235.0 million.Government borrowing from the banks before 1971 had been moderate. The Govern-ment stepped up investment expenditure in 1972 and did not take fiscal mea-sures which could have yielded the necessary financial resources. The Govern-ment, therefore, had to substantially increase its internal debt with thebanking system. Net borrowing took plalce almost exclusively from the com-mercial banks, since the Government's liabilities with the Central Bank hard-ly changed in the years 1972-73. (If thle 1972 Q18.0 million special bondissue intended for the -purchase of the Guatemalan Electricity Company is takeninto accOunt, Gov6iriment liaitilitihs with the C*nteal Bahk would increase byQl.l million that year. The Governmentlas a matter of policy refused tosell this bond issue to commercial banks, who were eager to subscribe --;.)
49. The maximum loan and deposit rates of interest are determinedby the Central Bank. From 1958 until September of 1974, the maximum ratecharged by commercial banks on their loans was 8 percent plus a one percent
- 18 -
commission; the maximum rate allowed to be paid on savings deposits was7 percent. The excess liquidity in the banking system created by theexternal sector has produced large variations in the rates of interestpaid on savings deposits. Thus, in early 1973 some banks reduced theirsavings rates from 6 percent, which was the standard for most banks, to4.5 percent and even 4 percent. The Industrial Bank -- a private organizationcreated by law --which was paying up to 6.5 percent on savings depositswas one of the few banks which did not alter its rate. This bank benefitsfrom an automatic capitalization, since its capital increases yearly bya contribution equivalent to 10 percent of the tax exemptions granted tomanufacturers under the Industrial Development Law. Thus, in order toobtain an acceptable yield on capital, the bank's management has to beaggressive in expanding operations.
50. The maintenance of a fixed rate of interest plus commission forlending operations tends to discriminate against medium-term loans. Ithas been more profitable for banks to lend at the shortest term possiblesince the effective rate increases due to the commission charged on loancontracts. The Central Bank estimates that in 1973, 90 percent of com-mercial bank loans were at less than one year. In addition, the mainte-nance of interest rates at substantially lower than world market levelsin the recent past, has encouraged the substitution of internal for ex-ternal credit, while in 1974 it also encouraged some capital flight.(However, investment opportunities had been very limited as well.)
51. The large increases in primary money through the balance of pay-ments surpluses in 1972-73 did not have a large expansionary effect onthe economy. This was a result mainly of the behavior of the banks them-selves in retaining large excess cash reserves. The expansionary fiscalpolicy, by reason of the small size of the public sector gave only moder-ate stimulus to monetary expansion. Even though there has been remarkablestability in the financial field, the experience of the last few years hasdemonstrated the need for the development of a system which would permitmore rapid and flexible excercise of the instruments of monetary control.Monetary measures were taken only late in 1974, when it was clear thatthe balance of payments was deteriorating and that inflation was continuingat a fast pace. The measures included, among others, raising interest ratesand cash requirerents for the banks.
52. Statistics on prices, wages and salaries in Guatemala are weakand must be interpreted with caution. Guatemala has had a long traditionof price and exchange stability. During the period 1960-72 the averageannual price increase, measured by the GDP deflator, was 0.4 percent.Prices started to climb at the very beginning of 1973 when the first signsof basic grain5 sh6rtages app6gred. Th shortages were Pre6ipitated by thedrought that mainly affected grain-producing areas in the 1972 farmingseason. INDECA imports of the necessary grains to cover the deficit camerather late. At the same time in an open economy such as Guatemala's, theimprovement in export prices (e.g.,meat) probably contributed to inflation-ary pressures. Moreover, prices for Guatemalan imports also started toclimb.

- 19 -
53. The Government has launched a campaign to keep the rate of in-flation as low as possible. In broad terms, the approach was to increasethe supply of basic grains, control growth of the money supply -- andintroduce temporary price controls to fight unjustified price escalation.For this purpose, the Government issued a series of decrees and createdan office in the Ministry of Economy to implement the legislation. Theauithorities intended to keep the price level of the so-called essentialconsumer products, that is, food and some industrial inputs, constructionmaterials, and agricultural small tools, as low as possible. To thisend, the Government published a comprehensive price list of the articlessubject to price control. It intended to authorize price increases onbasic commodities, only if producers 'could demonstrate that they hadincurred cost increases and that the price increases would not raiseprofit margins. It also intended to follow market developments as close-ly as possible, to be able, if necessary, to induce imports of certainitems in the event that supply shortages 'were causing upward price pres-sures. Moreover, to the same end, in September 1973 the authorities haddecided to establish certain export controls by introducing a system ofexport licensing for essential food products and raw materials for whichdomestic and foreign markets competed.
CHAPTER V: BALANCE OF PAYMENTS
54. Although Guatemala's balance of payments has experienced some sharpfluctuations, in general it has improved in the last twenty years. It is moreresilient, relying on a more diversified export structure, with a relativelylow external public debt on favorable terms and a comfortable foreign reservelevel.
Exports
55. Until the end of the fi:ties, changes in the level of Guatemalarsexports mainly reflected fluctuations in coffee prices. Coffee constitutedabout 70 percent of export value, while bananas,the main second export,account-ed for about I''. percent. The change in structure of exports that has takenplace in subsequent years has been due to the slow growth of coffee exportsand to the emergence and expansion of new exports. Thus cotton, whichaccounted for only about 5 percent of the value of exports in the fifties,increased its relative importance to about 11 percent by 1973, while coffeefell to 33 percent and bananas to 5.5 percent. Industrial exports (includingmeat and sugar) which were negligible in the ffties and constituted onlyabout 8 percent of total export value by 1960, increased their relativeimportance to more than 44 percent by 1973. More recently, tourism hasbecome another important source of export earnings.
56. The volume of coffee exports grew at less than 3 percent per annumon the average during 1960-73. Prices experienced a sharp deterioration from1967 through 1969, improving on the average thereafter. However, Guatemalanunit values do not entirely reflect world price movements. The unit valueof Guatemala's coffee exports dropped in 1972 due to the unusually largesales to new markets, i.e., countries which are not members of the Inter-national Coffee Organization.
- 20. -
Table 8.: PRINCIPAL EXPORTS
(In millions of U.S. dollars)
1960 1965 1970 1971 1972 1973
Agricultural exports 105.0 142.4 168.3 155.9 191.2 237.4Coffee 7436 91.7 100.6 96.3 105.3 145.6Cotton 5.8 34.4 27.2 26.0 40.9 47.9Bananas 17.3 4.9 20.5 18.2 25.6 24.7Other 7.3 11.4 20.0 15.4 19.4 19.2
Mineral exports 1.5 0-4 4.4 3.4 8 6.6
Industrial exports 9.4 49.3 124.4 127.6 142.5 196.0Meat 0.2 4.6 12.7 17.4 18.0 25.1Sugar 041 .2 9.2 9.9 16.1 21.9Other 9.1 40.5 102.5 100.3 108.4 149.0
TOTAL EXPORTS (F.O.B.) IL5.2 192.1 297.1 286.9 -- 337.5 440.0
Source: Table 3.2 of the 5tatistical Appendix.
57. The volume of cotton exports has recuperated rapidly since the sharpdrop in 1970-71. In 197, production nearly doubled its level of the previousthree years as a result of area and yield increases. Two factors are respon-sible for this result: the improved cotton market prices and the introductionof new techniques to control plant diseases. The 1973-74 crop was sold onfutures contract8,and consequently prices obtained by farmers were below thoseprevailing at delivery time. After some hard negotiations, contracts wereadjusted to the exporters' advantage by reducing the bale weight from thetraditional 500 pounds to 465 pounds for the sales already contracted andallowing sale of the uncommited cotton at current spot prices. Internalconsumption of cotton increased sharply in 1973 and the first half of 1974 asa result of the strong recuperation of the textile industry. Costs of cottonproduction rose sharply in 1973 due mainly to the higher prices for insectici-des, fertilizers and fuels. The price of the land in the south is reportedto have increased by at least 300 percent in the last two years. Farmers arevery much concerned over the expected prices for the 1974-75 crop, claimingthat their break-even point is now QO 98 per kilogram.
- 21 -
58. The volume of meat exports grew at an average rate exceeding lL1 per-cent per annum during 1965-72, with prices improving constantly. A substantialpart of this meat came from cattle imported from other Central Americancountries. However, restrictions on the export of live animals except forbreeding purposes, have been imposed in the Central American countries in thelast few years. Cattle-raising activity has been concentrated mainly in thesouth of the country; however, sharp rises in land prices due to expansion ofthe cotton and sugar areas in the last two years are driving the cattle tonew zones in the north: Coban and the Izabal area. In these areas the climateis not appropriate for cotton but is for sugar: however, there are no sugarmills at present and cattle is among the more attractive activities since landis relatively cheap compared to the south. Until recently, the high levelof demand in the United States market has been the main incentive for thisrelatively new export. The Goverrment is trying to promote the developmentof cattle raising and dairying with technical and financial support from IDBand IBRD.. In 1972 the Goverrnment passed a-decree establishing a system ofexport quotas, in order to assure sufficient supplies for the internal market.These quotas are determined by the Ministry of Economy in February of eachyear. It seems that the quota system has not discouraged cattle raising.In September 1973, the Government issued a decree prohibiting the export ofrawhide and establishing prior export licensing for processed hides. Theaim has been to assure the necessary raw material for local industry inview of its increasing scarcity in the world market.
59. The volume of banana exports increased by 15 percent in 1972, butin 1973 it dropped by about 3.5 percent -- high winds had damaged bananaplantations. The increase of 1972 was the result of the establishment ofnew production areas on the Atlantic coast. The main banana producer inthe country is Bandegua, a subsidiary of Del Monte Corp., which purchasedthe banana and livestock farms and other agricultural holdings of UnitedBrands in December of 1972. Bandegua does not plan to expand banana planta-tions in the near future; it is exploring rather the posibility of producingpdneapple and papaya for export to the eastern coast of the USA. The Govern-ment of Guatemala, which is a member of the recently formed association ofbanana-exporting countries, has not imposed the export tax agreed by themembers for the reason that Bandegua has a contract approved by Congress whichprecludes the levying of the tax. The company, however, is negotiating withthe Government to find other means to compensate it for the revenue forgone.
60. Tlr voLume of sugar exports has nearly doubled in the last threeyears. The high level of demand in the international market has been theprimary incentive for this rapid development. The producing areas, likethose for cotton, are concentrated in the south, and on land formerly usedfor cattle raising and basic grains.
61. The value of exports of industrial products, excluding meat andsugar, grew at an averaxge rate of 24 percent per annum during 1960-73. Thisrapid development has increased the share of industrial products in totalexports from about 8 percent in 1960 to more than 33.5 percent in 1973. The rapid
- 22 -
growth has been the result of incentives granted to the industrial sectorin 1960 with the establishment of the Central American Common Market, whichmeant a larger protected market plus generous tax holidays. The 1969 borderconflict between Honduras and El Salvador helped Guatemala's manufacturingexports. The country was able to capture part of the Honduran market whichhad been previously supplied by El Salvador. Guatemala's manufacturingexports increased by 24 percent in 1970, as compared with an annua.- averageof about 18 percent in the preceeding years. Honduras finally withdrewfrom the Central American Common Market trade agreement in December 1970,and Guatemala's manufacturing exports dropped by more than 2 percent in1971, the first decline since 1960. In 1972 these exports grew by only8 percent. However, the improvement of world market conditions for themain exports of Central America, which had begun in 1970, reached a boomsituation in 1973, and the demand for manufacturing products in the areaincreased substantially. Guatemala's manufacturing industry was able rapidlyto increase its output due to a large excess capacity which developed inthe second half of the sixties, and manufacturing exports grew by more than37 percent in 1973. The improved economic conditions in the area helpedinduce partial participation of Honduras in Common Market trade. Thus, inFebruary 1973, Guatemala signed a bilateral trade agreement with Honduras.
62. Tourism in Guatemala has continued to grow at a very fast pace.It is reported that the number of tourists increased by 16 percent in 1973,while their expenditure grew by nearly 50 percent. The industry could haveexpanded even faster but for the limited availability of hotel accommodations,especially in Guatemala city. At present new hotels are being built andothers are scheduled to be constructed in the next two years. This will addabout 1,000 first-class hotel rooms to the current 1,200 rooms in this cate-
gory. The Government has increased its interest in tourist industry developmentin view of its great potential which can be realized in a relatively short term.The Government intends to maintain the tourist sector as a high priority for thenext economic development plan. The archeological area in Tikal, in the PetenDepartment, will be developed with the financial assistance of the Central Amer-ican Bank for Economic Integration. Development of the area will include therestoration of a large group of Mayan pyramids, and the construction of a newairport in the Lake Peten Itza, which could receive international air traffic.(It is expected that construction will be initiated in early 1975.) In addi-tion, the road between Flores in Lake Peten Itz'a and Tikal will be improved,and the necessary infrastructure for hotel construction on the lake and pro-tection of its banks will be completed later on. Plaps for the development ofthe Izabal area on the Atlantic Coast; are advancing rather slowly.
Imports
63. Imports -/ in the first half of the 1960s grew at a considerably fasterpace than in subsequent years -- 14 percent per annum on the average as compared
1/ Imports of merchandise c.i.f., in current US$.
- 23 -
with 6 percent during the period 1965-72. In 1973, however, imports acceleratedincreasing by over 20 percent. This unusually high growth reflects the 1973faster expansion of the overall economy, but in particular, the recovery ofthe manufacturing sector -- imports of raw materials increased by about 25percent, and real value added in manufacturing grew by more than 8 percent.
Table 9: SUMKARY BALANCE OF PAY.MENTS
(In uillUons of U.S. dollars)
Annual Average
1965-66 1967-6 17969-70 1971 1972 1973
Resource Gap - 16.5 - 40.9 8.1 -32.5 - 1.2 38.0Exports (incl. n.f.s.) 7.7 2 326.2 338.5 395 3 529.9
Imports (incl. n.f.s.) 261.0 290.6 318.1 371.0 396.5 491.1
Net Factor Income - 14.5 _ 25.4 - 37.0 - 41.8 -47.h -46.4Net Current Transfer 8.5 10.0 15.5 25.2 28.8 41.9
Current Account Balance - 22.5 - 56.3 - 13.4 - 49.1 -19.8 34.3
Private Sector 23.5 37.4 21.8 53.6 62.9 28.1
Direct Investment, net Tb7 23.14 2b.67 13 27.7Other long-term, net 13.2 14.9 17.5 18.3 22.4 22.8Other short-term, net - 4.0 2.0 - 19.1 10.7 25.2 -22.4
Public Sector 6.3 16.8 12.2 11.2 8.5 25.4
International Organizations, net - 3.9 11.3 14.7 15.5 22.0Governments, net 1.5 3.7 0.3 - 14.9 6.7Other 5.4 9.2 o.6 - 3.5 -11.9 -3.3
Loans to banks 1/ 0.5 1.5 0.4 - 1.5 -0.1 -9.2
Others j - 1.1 - 0.9 0.9 3.9 4.8 1.3Monetary movements, net
(increase -) 14.7 1.9 - 17.6 - 11.8 -50.3 -67.0Net errors and ommissions - 11.4 - 0.4 - .4.3 - 6.3 - 6.o -12.9
Medium and long-term2 Capital subscriptions to international orgaLnizations and allocation of SDRs.Source: Table 3.1 of Statistical Appendix.
- 24 -
6h. Since the early 1960s the structure of imports has undergone substan-tial changes. In 1960 consumer goods accounted for more than 31h percent oftotal imports, while raw materials for only about 30 percent. By 1973, therelative importance of consumer goods in the import bill had declined toabout 27 percent, while that of raw materials had attained a level of about38 percent. The main determinant of these changes has been the increasingparticipation of the industrial sector in national output.
65. Simultaneously with the change in the structure of imports, a changein sources of imports to Guatemala has taken place. Although the UnitedStates continue to be the country's main supplier, its share in total importshas diminished significantly. While in 1956 over 67 percent of importsoriginated in the USA, by 1973 this share had declined to about 31 percent.This shift resulted primarily from the rapid increase in trade among CentralAmerican countries. Guatemala imported about 1.2 percent in 1956 and about7 percent in 1961 from the other Central American countries; by 1973, importsfrom the area were about 21 percent. After the USA and El Salvador, Japanhas become the single most important supplier of imports in the early seventies.
Financing the Current Account Deficit
66. Guatemala's balance of payments deficit on current account has beentraditionally financed mainly through capital inflows to the private sector.During the period 1965-72, on the average, the ratio of private to public netforeign borrowing has been 3:l. This broad difference originates in therelatively small size of the public sector and the rather conservative fiscalpolicies of the Central Government, which have kept the public external debtat a low level. Net disbursements to the private sector dropped from US$62.9million in 1972 to US$2V.1 million in 1973. -This change was prompted by areduction in short-term liabilities in the face of the tight internationalmoney market and lower interest rates within the country, and despite largeincreases in imports. Guatemala's overall balance of paynents ramained insurplus in 1963-73, the increase in reserves reaching an all-time record ofUS$67.0 million in 1973. The Central Bank's net international reserves hadreached US$213.8 million by the end of 1973.
67. The terms of Guatemala's external public debt (interest rate, graceperiod and maturity) have been improving steadily since 1965. This has beenmainly due to increased borrowing from the international organizations. Whilein 1965, external private sources of credit to the public sector accountedfor more than h2 percent of the total outstanding public external debt includ-ing the undisb-ursed portion, by 1973 these sources accounted for less than18 percent. In con;rast, the share held by the international organizationsincreased from 20 percent in 1965 to more than 47 percent 1973. This increasein the share of the international lending agencies will help maintain Guate-a--'s public dcbt service ratio at levels srimriLar or lower than the oncattained in 1973 -- 3.9 percent of exports, down from a peak of 10.5 percentin 1972.
- 25 -
Table 10: PUBLIC EXTERNAL DEBT AT THE ENDI F PERIODREPAYABLE IN FOREIGN CURRENCY -
1965 1969 1972 1973
Outstanding including undisbursed 86.5 151.5 190.5 192.3(Private) (36.6) (55.0) (38.6) (33.1)(Internatiunal Organizations) (17.3) (56.u) (82.2) (90.6)(Governments) (32.6) (h0.5) (69.7) (6b.b)
Average Interest Rate(Percent) 5.2 5.5 4.5 .7
Average Grace Period(Years) 2.8 4.0 5.8 6.o
Average Maturity(Years) 14.9 19.3 25.4 25.8
1/ Includes private debt guaranteed by the public sector.
Source: Table 4.2 of the Statistical Appendix.
Chapter VI: MAJOR DEVELOPMENTS IN 1974
68. Until the end of the third quarter of 1974 prospects for an economicexpansion similar to that registered in the two preceding years, when GDP grew
at over 7 percent, appeared good. The hurricane which devastated northernHonduras in September also hit the Atlantic coast of Guatemala inflicting somedamage to the banana plantations. Furthermore, volcanic eruptions on thePacific coast which started in early October and continued almost uninterruptedly
for several weeks, caused damage to the agriculture in the area as well. TotalGDP is estimated to have groim between 5.5 and 6.0 percent in 1974.
69. Inflation accelerated in the early months of 1974, mainly due tohigher import prices for fuels and fertilizers, but appears to have taperedoff later in the year. The price rise for the year was probably similar tothat registered in 1973 -- about 15 percent. The substantial government sub-sidies granted to INDECA for basic grains and to public transportation pre-vented a higher increase in prices to the consumer.
70. Although statistics on private wages (other than the legal minimumwage) are not available for 1974, it would appear that some purchasing power
losses may have occurred during the year, at least in certain sectors. legal

- 26 -
minimum wages were increased by about 25 percent from their 1967 level in De-ce-nber 1973. As prices had increased considerably less during the interimperiod, legal minimum wages had a lead over inflation as the year beganbut probably had started to lag behind by the end of the year. No dataare available for agricultural wages in 1974; however, these wages arepartially shielded against inflation because of their in-kind component.Monthly wages and salaries of public workers falling below Q300 wereincreased in September 1974 by declining rates which ranged from 50 per-cent for the lowest wage bracket, Q40 through Q60, to 5.7 percent forthose workers earning from Q260 through Q300. The full impact of thesesalary adjustments on Government expenditures will be felt only in 1975.
71. In 1974 the fiscal sector suffered from the effects of risingprices, with current revenues increasing more slowly than current expen-ditures. Moreover, a number of the Government's ongoing investment pro-jects were incurring substantial cost overruns. Some tax measures intendedto increase fiscal revenues were implemented during the year.
72. In view of the boom in the export sector, the outgoing administra-tion sent a tax package to Congress in June 1974. The powerful export lobbyfought the proposals and as a result, the Congress approved relativelymild new export taxes on sugar, meat and shrimp, while modifying thosealready existing on coffee and cotton. In the case of the latter, thechanges may actually result in decreases in revenue if prices drop backto the levels of a few years ago.
73. The export tax changes introduced in June 1974 are the following:
Coffee - The previous export tax accruing to the Treasury waslevied on a sliding scale ranging from 10 percent when the price of coffeewas below QO.20, up to 30 percent when the price was over QO35 per pound.The new law establishes no tax payment when the price is below QO.35 perpound; beyond this level the tax is progressive, rising from 5 percent onthe proportion of the price between QO.35 and QO.40 to a maximum of 45 per-cent on the excess over QO.50 per pound.
Cotton - The previous tax was 10 percent on that portion of theprice exceeding the f.o.b. value of QO.20 per pound. The modified taxestablishes a scale in which the duty is QO.75 per hundred pounds for aprice at or below QO.50 per pound. On the excess over QO.50 ner Poundincreasing rates are charged up to 45 percent on the excess over QO.6' perpound.
Sugar - This is a new tax. The export of sugar at a price belowQ0.115 per pound will be tax exempt. From Q0.1151, increasing rates arecharged up to 45 percent on the excess over QO.1451 per pound.
Meat - This is a new tax on bovine meat only. For prices belowQO.70 per pound no tax is levied; increasing rates are charged over thislimit up to 45 percent on the price in excess of Ql.00 per pound.
Shrimp - A specific new tax of QO.04 per pound is established.

- 27 -
74. The new law establishes, in addition, that export tax paymentswill be credited for income tax liabilities insofar as the former paymentsare lower than those due on income. There would be no reimbursement insofaras the export tax payment exceeds the income tax due.
75. The new administration which took office in July 1974 sent a newtax package to Congress. These new proposals were politically more acceptableand were quickly approved by Congress (in September 1974) with fewer amend-ments than in the case of the export taxes. An increase in revenues wasrequired to finance a 1974 budgetary enlargement in the amount of Q23 million.This enlargement, requested in September, related to expenditure increases inthe following items: fuel and lubricants (Q7.3 million), salary increases(Q8,0 million), basic grains subsidies (Q4.0 million), urban mass transitsubsidy (Ql.5 million), and cost overruns and additional transfers to publicentities (Q2.2 million). The main tax measures were the following:
Stamp tax - The rate was increased from 1.5 percent to 2.0 per-cent; the issuance of invoices and receipts by merchants and others pro-viding services was made compulsory.
Vehicles - The tax was modified; a 10 percent surcharge will belevied on the import of new cars priced above Q3,500, and the tax on cartags will vary according to the engine capacity of the vehicle. It willrange from Q30.0 for vehicles below 1,000 cc. up to Q400 for vehicles ofmore than 8,000 cc.
Tobacco and alcoholic beverages - The tax rate on the consumptionof tobacco was increased from 20 to 30 percent of the product's value.Tax rates on alcoholic beverages were increased by QO.16 per liter of spirits,QO.03 per liter of beer and Q0.04 per liter of wine and similar beverages.
Property tax - Those properties valued at less than Ql,000 weremade tax-exempt. This measure eliminates substantial administrative work bythe internal revenue service without any appreciable loss in revenue, andwill help it concentrate its efforts on the larger properties. The maximumtax rate: of 0.6 percent, which in the former law was applicable to all pro-perties valued above Q20,000, was increased to 0.8 percent and made appli-cable to properties valued above Q50,000. (Properties valued between Q20,000and Q50,000 are still subject to the 0.6 percent tax rate.) In additionthere are some minor modifications in passport fees, post office rates, theexit tax and the income tax.
76. The aforementioned tax package came too late in the year to fullycompensate for the deteriorating fiscal performance of the early months,which had resulted in the Government's limiting investment expenditure innew projects. This reduction in investment was accompanied by reduced dis-bursements on foreign loans. Domestic financing would also have been smallerthan budgeted, although considerably higher than in 1973, had it not beenfor prepayment of the outstanding external bonded debt by the Treasury.
77. The private sector, in reaction to the uncertainties in the world
- 28 -
market, moved into stock accumulation of fertilizers, insecticides and rawmaterials for the manufacturing and construction sectors. The lower internalinterest rate, as well as the tight money market in the industrial countries,induced a switch from import financing by suppliers and foreign financialinstitutions to financing by local banks. With the declining net use offoreign loans, the excess credit demand began to affect international reserves-- the overall balance of payments deficit is estimated at US$30 million at theend of the year. The growing concern of the authorities over this deteriorationin the balance of payments and the persistence of inflation prompted them toact in the monetary field by the end of the third quarter of the year.
78. In September 1974 the maximum interest rate charged on the banks'assets was raised to 11 percent; the maximum paid on liabilities was raisedto 9 percent. The one percent opening commission was eliminated to encouragebank lending at medium term. The cash requirement ratio was raised from 30to 40 percent on monetary liabilities, while the reserve rate for savingsand time deposits was left at 15 per~cent. The rapid growth in banks' invest-ment in warehouse certificates was halted by ordering the banlks to reduce invest-ment in such certificates to 25 percent of the level maintained at the time thenew measures were introduced. However, documents originating in exports areexempt. In addition, to help discourage capital flight, the Government willoffer public bonds with a repurchase guarantee at sight without any interestor price penalty.
79. Together with the corrective measures described above, the Govern-ment introduced additional credit measures intended to foster the productionof basic grains. BANDESA was authorized to reduce its interest rate to 5percent on loans made to the growers of basic grains. The commercial banksas well, were authorized to lend to farmers at a 5 percent interest rate forbasic grains production. For this purpose, the Central Bank provides a specialrediscount facility to commercial banks at a-one percent interest rate. Inaddition, in September 1974, the Central Bank extended a credit of Q21.0 mil-lion to BANDESA to buy fertilizer for resale to grain producers. The Govern-ment appointed a new General Manager of BANDESA to improve its performance inthe promotion of agricultural development. The new administration is reorgan-izing the institution and there are encouraging signs. The number of loansmade appears to have increased sharply in the first few months of the newadministration. The Guatemalan territory, for purposes of the bank's opera-tions, is being divided into regions, and authority has been delegated tothe regional offices to approve loans up to certain amounts. Furthermore,an effort is being made to evaluate and appraise in the originating localitythose applications which, due to their large amounts, must be brought to thecapital. This will substantially reduce the amount of travelling of the Bank'sengineers as they will have to reside in the regions. The need for guaranteeswhich is normally a serious difficulty for developing banks wishing to follow
a more aggressive policy, is being treated with greater flexibility; crops frompermanent plantations are being used as collateral for medium-term loans.
80. A number of additional measures were adoDted to increase basic grainsproduction. Decree No. 40-74 was issued on July 1, 1974, making it compulsoryfor farmers with 1D0 manzanas (69.9 ha.) or more to plant 10 percent of theirland with basic giains. However, as the decree was not issued until after the

- 29 -
main planting season, and the second planting is restricted to some selectedareas in the country, the Government is delaying full implementation of thedecree until the next main planting season in April-May 1975. Even thenthere will be difficulties in implementation that will have to be resolved.Fbr instance, the-most important commercial crop, coffee, is a permanentcrop, and many of the farmers affected may use all their land for it. Con-sequently, they will have to rent additional land to comply with the law.There are technical problems such as the soil to be used for the crops; thelaw requires that the planting be done in technically appropriate soils.The decree gives incentives to farmers through a guaranteed price that INDECA(National Institute for the Commercialization of Agricultural Products) wouldpay and through the form of technical assistance.
81. Perhaps the most significant measure to foster the cultivation ofbasic grains was the decision by INDECA to raise its support price for thesecommodities. Since basic grains are consumed by the majority of the popula-tion, the price has always been kept low for political reasons. INDECApaid Q6 per qq (US6 per h6 kilograms) for the first crop of 1974 andwas planning to raise it to Q6.40 per qq for the second crop. These pricesare much higher than those offered a year ago; for some of the best organizedfarmers in some areas and given the present costs of production for cotton,the INDECA price makes grains as profitable as cotton.
82. The world crisis that started at the end of 1973 created shortagesof fertilizers and other agricultural inputs. While the large commercialfarmers were able to obtain them, the small ones -- who were essentially thosethat produced the basic grains -- were unable to do so. In order to overcomethis difficulty, the Government, through BANDESA and with the financial supportof AID and the Central Bank, started to buy large quantities of fertilizer forbasic grainsgrowers. The price that BANDESA charged was below the market price,which was made possible by the better prices obtained by buying large quantitiesand the elimination of the intermediaries' margins. BANDESA has reduced itsrate of interest to 5 percent for the small farmers or those who grow basicgrains. The authorities argue that the low rate of interest is an instrumentfor promoting the use of credit in the rural area, and through it to introducebetter farming technology, i.e. the use of fertilizer, selected high yieldseeds, insecticides, etc. To assure better implementation of its policies,BANDESA is working with DIGESA (Direcci6n General de Servicios Agricolas) tosee that the farmers who receive the fertilizer are utilizing it properly.BANDESA, in addition to supplying fertilizer to its clients, sells it to otherfarmers, recommended by DIGESA, who are growing basic grains.
83. The authorities estimated that in 1974 there was a deficit of about230 thousand tons of corn, 18.4 thousand tons of beans and 4.6 thousand tons ofrice. They expect that by implementing the above measures, these deficits willbe substantially reduced in the future.
84. The Guatemalan balance of payments in 1974 moved from a current accountsurplus in 1973 to a deficit in 1974._/ Although receipts from exports
1/ Data on the balance of payments for 1974 are of a very preliminary nature andsubject to revision.
- 30 -
of goods and services are estimated to have expanded by about 33 percent fromtheir l973 level, payments for imports increased by about 60 percent. Thebalance on current account switched from a surplus of US$34 million in 1973 to adeficit of about US$75 million in 197h. The effect of the increase in priceof crude oil accounts for close to 60 percent of this change. The oil importbill rose from US$27.2 million in 1973 to US$95.5 million in 197h, with anincrease in volume of less than 5 percent.
85. The increase in revenue from merchandise exports originated for themost part from price gains. Volume increases for most traditional exportseither did not occur or were modest. Exports of coffee were suspended betweenJuly and October in accordance with the terms of an agreement intended toprotect prices which was reached among producers within the Central Americanregion. Export quotas have also been in effect since 1973 for a number ofproducts required by the domestic economy (e.g., cotton, meat, hides, etc.).Moreover, in September 1974, an export ban was imposed on basic grains, woodand agricultural inputs.
86. The volume of exports of non-traditional industrial products,however,appears to have increased significantly in 1974. In the services balance,proceeds from tourism continued to increase at an impressive rate during theyear -- tentatively estimated at 60 percent.
87. The steep increase in import prices, particularly for fuels, is notthe only reason for the unprecedented rise of imports in 1974. Import volumesin the various categories appear to have increased substantially; in particularthe speculative stockpiling of raw materials and intermediates which took placeearly in the year appears to have contributed in a significant manner to theboost in imports.
88. With lower net disbursements on medium and long-term loans, and witha significant net outflow on short-term capital, about 40 percent of the 1974current account deficit had to be financed by drawing on the country's foreignreserves. This did not represent an immediate danger as by the end of 1973Guatemala's reserves amounted to over five months' imports of goods and services.At the end of 197)a reserves were the equivalent of three months' imports.
89. In summary, the Guatemalan economy did better in 1974 than that ofmany developing countries which lack oil and rely heavily on the United Statesfor the marketing of their exports. It could have performed better, however,if the fiscal and monetary measures had been implemented earlier in the year.
Chapter VII: MEDIUM-TERM PROSPECTS
90. The Bank has projected a rete of growth of GDP in real terms of 6 per-cent per year for the second half of the 1970's. The projected rate of growth,along with investment rates and other parameters, are by no means normative;
- 31 -
instead they are extrapolations of long-term past trends.!/ The Guatemalaneconomy could expand considerably faster if a more progressive developmentpolicy were implemented, and provided the present western world recession doesnot significantly weaken Guatemala's traditional export markets for a lengthyperiod.
91. Although the private sector is at present the core of the Guatemalaneconomy, and will continue to be so in the forseeable future, its behavior isnot independent of that of the public sector. Government policies can have astiong impact on private investment decisions and resource allocation. Tothis effect the authorities will need to keep a close watch on interest rates,reserve requirements, volume and direction of credit, and in general the wholemonetary field, in such a manner that through timely addjustment they can fosterdomestic production and prevent internal savings from flowing to externalmarkets, as has happened in the recent past. 'Moreover, the Government isresponsible for providing the social and economic infrastructure necessary forthe private sector to operate effectively. In this connection, high priorityneeds to be given to expediting the implementation of the electric power develop-ment plan and thus to prevent this sector from becoming a bottleneck to develop-ment in the near future. Other areas warranting priority Government attentioninclude feeder road.s construction and maintenance and the expansion of creditand technical assistance facilities for small farmers. Such activities areparticularly important because of the large traditional rural sector that isstill at the margin of the cash economy. The gradual integration of this partof the population into the modern economy is a difficult undertaking., but onewhich merits higher priority because of the existing poverty and associatedproblems of health and education.
92. The projections for Central Government revenues assume that the recentlyintroduced tax changes and a continuation of the program of tax administrationimprovements will allow the Government to maintain its ratio to GDP at 8.8 percent(the lowest level among the five Central American countries). This level wouldrepresent a recovery from the very low levels attained in 1973-7h when, becauseof the inelasticity of the tax system to nominal incomes and the emergence ofinflation the ratio declined to about 8.2 percent. On the expenditure side,current expenditures are projected to increase at a rate somewhat higher thanGDP, with the social sectors share in these expenditures increasing from about43 percent in 1973 to about 47 percent in 1980. The expenditure levels thesesectors would attain by the end of the decade would still be inadequate toimprove in any significant manner the prevailing low socio-economic conditionof the very, backward majority of the population. Even under this modestassumption for increase in expenditure, real savings would decline steadily,and even though a shift in investment from the Central Government to the decen-tralized public sector has been assumed, Government savings would financedeclining shares of Central Government investment.
1/ Details of the projections and underlying assumptions are given in theStatistical Appendix to this report.
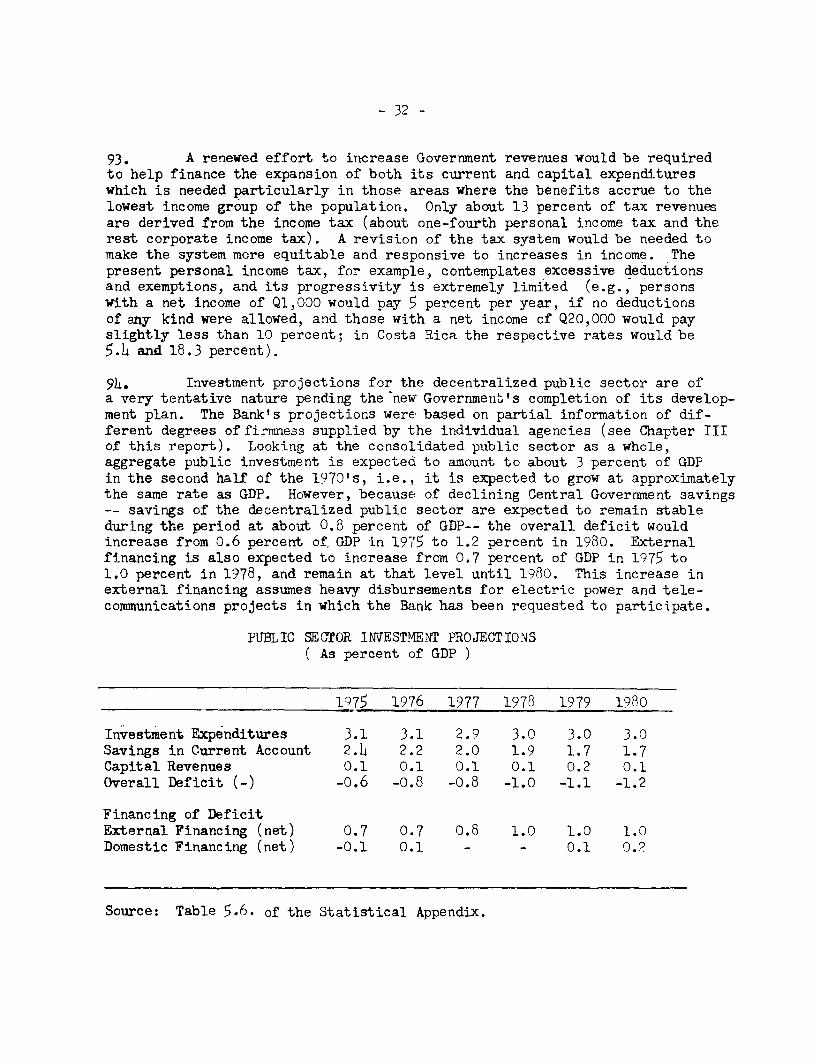
- 32 -
93. A renewed effort to increase Government revenues would be requiredto help finance the expansion of both its current and capital expenditureswhich is needed particularly in those areas where the benefits accrue to thelowest income group of the population. Only about 13 percent of tax revenuesare derived from the income tax (about one-fourth personal income tax and therest corporate income tax). A revision of the tax system would be needed tomake the system more equitable and responsive to increases in income. Thepresent personal income tax, for example, contemplates excessive deductionsand exemptions, and its progressivity is extremely limited (e.g., personswith a net income of Q1,000 would pay 5 percent per year, if no deductionsof any kind were allowed, and those with a net income of Q20,000 would payslightly less than 10 percent; in Costa Rica the respective rates would be5.4 and 18.3 percent).
9h. Investment projections for the decentralized public sector are ofa very tentative nature pending the new Government's completion of its develop-ment plan. The Bank's projections were based on partial information of dif-ferent degrees of firmness supplied by the individual agencies (see Chapter IIIof this report). Looking at the consolidated public sector as a whole,aggregate public investment is expected to amount to about 3 percent of GDPin the second half of the 1970's, i.e., it is expected to grow at approximatelythe same rate as GDP. However, becauset of declining Central Government savings-- savings of the decentralized public sector are expected to remain stableduring the period at about 0.8 percent of GDP-- the overall deficit wouldincrease from 0.6 percent of, GDP in 1975 to 1.2 percent in 1980. Externalfinancing is also expected to increase from 0.7 percent of GDP in 1975 to1.0 percent in 1978, and remain at that level until 1980. This increase inexternal financing assumes heavy disbursements for electric power and tele-communications projects in which the Bank has been requested to participate.
PUBLIC SECTOR INVESTMEN1T PROJECTIONS( As percent of GDP )
1975 1976 1977 1978 1979 1980
Investment Expenditures 3.1 3.1 2.9 3.0 3.0 3.0Savings in Current Account 2.4 2.2 2.0 1.9 1.7 1.7Capital Revenues 0.1 0.1 0.1 0.1 0.2 0.1Overall Deficit (-) -o.6 -o.8 -0.8 -1.0 -1.1 -1.2
Financing of DeficitExternal Financing (net) 0.7 0.7 0.8 1.0 1.0 1.0Domestic Financing (net) -0.1 0.1 - - 0.1 0.2
Source: Table 5.6. of the Statistical Appendix.
- 33 -
95. Guatemala's low public debt service ratio (3.8 percent in 1973)which will probably decline further because of improvement in the structureof the country's new debt, would not preclude an expansion of foreign in-debteness. However, any increase in foreign borrowing over and above thelevel projected would require a simultaneous increase of the country'sabsorptive capacity through the strengthening of the project preparationprocess and through a fiscal effort intended to generate the required ad-ditional counterpart financing. If absorptive capacity were to be expanded,Guatemala should be in a good position to attract multi and bilateralexternal resources for the financing of new projects, particularly thoseaddressed to the improvement of the socio-economic conditions of the poorestsections of the population.
96. The medium-term balance of payments prospects are, on the whole,favorable. Three main elements are expected to contribute to this outlook:(') deceleration in import growth; Xii) more rapid reaction and flexibili-ty of the authorities in the monetary field; and (iii) relatively favor-able market conditions for Guatemala's main exports. Under these assumptionsthe overall balance of payments can be expected to remain in surplus over theperiod 1975-80, with net foreign reserves never falling below three monthsimports of goods and services.
97. The volume of exports of goods and services is expected to increaseat almost 6 percent per year, and the volume of imports by only 5 percent peryear, between 1975 and 1980. However, because of expected deterioration inthe terms of trade, payments on imports are projected to increase as rapidlyas export receipts.1/ Among exports, coffee is expected to continue beingthe main product up to the end of the decade, although its relative importancewill decrease. A small expansion of export volume (slightly over 2 percentper year) is expected, originating in productivity improvements, and, to alesser extent, expansion of areas planted. A rapid expansion of sugar exportvolumes is expected up to 1976, with a leveling off thereafter because of aprobable decline in price incentives. However, nickel will be added to theexport list by 1977 and rapidly increase its share in total exports to about6 percent by the end of the decade. Exports of manufactures are expected tocontinue growing at a fast pace, increasing their share in merchandise exportsfrom about 34 percent in 1973 to about 43 percent 1980. Of all exports,including services, it is expected that tourism will become the second mostimportant item (next to coffee) as a foreign exchange earner.
98. The volume of imports in 1975 is expected to remain at the same levelas in 1974, a year in which there appears to have been excessive stock accumula-tion. An elasticity of demand for imports (constant terms) of 1.0 has beenassumed for the remainder of the decade. The negative factor income balance andthe positive transfers balance have been projected to increase at a moderate
1/ Price projections are those included in the I2RD Commodity Forecast,November 6, 197h.

- 3 -
rate for the remainder of the decade. Under these assumptions the deficitin the current account of the balance of payments (in current terms) wouldincrease from about US$12.0 million in 1975 to about US$155 million in 1980.This steep increase would not be a matter of concern because net transfersof financial resources in the capital account of the public sector are alsoexpected to grow at a very fast pace, from about US$22.0 million in 1975 toabout US$1h5 million in 1980. Particularly in 1977, a substantial increasein net transfers has been projected because of the initiation of severalrural development projects, but mainly because of lumpy disbursements for theconstruction of the Chixoy hydroelectric project. A minimum of US,$150.0 mil-lion in external financing is likely to be needed for the latter project.In addition, it is expected that the public sector (and the private sectorwith the guarantee of the Government) will engage in new borrowing fromprivate financial institutions and suppliers. For the period 1977-80, a nettransfer of about US$100 million per year is projected for the public sector.
99 If the relatively conservative Bank projections on exports, importsand capital inflows are realized, the debt service ratio for the remainderof the decade would not exceed 3.0 percent in any individual year. This wouldreinforce the argument that there is room for Guatemala to expand considerablyits borrowing abroad on reasonably soft terms without endangering the stabilityof its balance of payments. The constraint, in other words, on acceleratedsocio-economic growth would appear to originate not in the external sectorbut rather,as indicated above, in the limited fiscal effort and in the limitedcapacity to prepare projects.
STATISTICAL APPENDIX
Table No.
I. POPULATION
1.1 Population 1950, 1964, 19731 2 Economically Active Population by Sectors, 1950,1964,1973.
II. NATIONAL ACCOUNTS
2.1 Gross Domestic Product by Sector, 1960, 1965-73 (1958 prices)2.2 Gross Domestic Product by Expenditure Categories, 1960, 1965-73
(current prices)2.3 Summary of National Accounts (1967-69 prices and exchange rates)
Part A: 1960, 1965-73Part B: 1972-73 and projected 1975-80
2.4 Gross Fixed Capital Formation by Major Sectors, 1965-73 (1958 prices)2.5 Value Added in Manufacturing by Major Industrial Branches,
1950, 1955, 1960, 1965-73 (1958 prices)2.6 Value of Production in Manufacturing by Major Industrial Branches,
1950, 1955, 1960, 1965-73 (1958 prices)2.7 Gross Value of Production of Agriculture, Livestock, Forestry and
Fisheries, 1960, 1965-73 (1958 prices)
III. BALANCE OF PAYMENTS
3.1 Balance of Payments (in millions of US dollars)Part A:, 1965-73Part B: 1972-75 and projected 1975-80
3.2 Value, Volume and Unit Value of Principal ExportsPart A: 1960, 1965-73Part B: 1972-73 and projected 1974-80
3.3 Summary of Imports, 1961-733.4 Trade with Other Central American Countries, 1960-733.5 Summary of Trade with Other Central American Countries, 1968-733.6 Exports and Imports by Major Destination and Origins,
1956, 1961, 1966, 1971, 19733.7 Number of Tourists by Country of Origin, 1965-73
IV. EXTERNAL DEBT
4.1 External Public Debt Outstanding as of December 31, 1973:Repayable in Foreign Currency
4.2 External Public Debt Outstanding: (Profile)Repayable in Foreign Currency, 1965-73
4.3 External Public Debt Outstanding as of December 31, 1973:(Transactions)
4.4 External Public Debt Outstanding as of December 31, 1973:Renayable in Local Currency
4.5 External Public Debt Outstanding as of December 31, 1973: (Transactions)Re-nayable in Local Currency
4.6 External Public Debt Outstanding as of December 31, 1973 and Projections1974-80 (Transactions): Repayable in Foreign Currency
- 2 -
4.7 Reconciliation of the Net Total External Debt - Local and ForeignCurrency, 1965-73
V. PUBLIC FINANCING
5.1 Summary of Central Government OperationsPart A: 1965-73Part B: 1972-73 and projected 1974-80
5.2 Central Government Current RevenuePart A: 1965-73Part B: 1972-73 and nrojected 1974-80
5.3 Central Government Current Expenditure by SectorPart A: 1965-73Part B: 1972-73 and projected 1974-80
5.4 Central Government Capital Expenditures by SectorPart A: 1968-73Part B: 1972-73 and projected 1974-80
5.5 Summary Transactions of the Autonomous Agencies (RPS), 1965-73and projected 1974-80O
5.6 Consolidated Public Sector OperationsPart A: 1965-73Part B: 1972-73 and projected 1974-80
VI. MONEY AND CREDIT
6.1 Summary Accounts of the Banking System, 1966-736.2 Financing Capacity of the Banking System, 1966-736.3 Net Changes in the Assets and Iiabilities of the Banking
System, 1966-73
VII. PRICES
7.1 Price Indexes 1960 and 1965-73
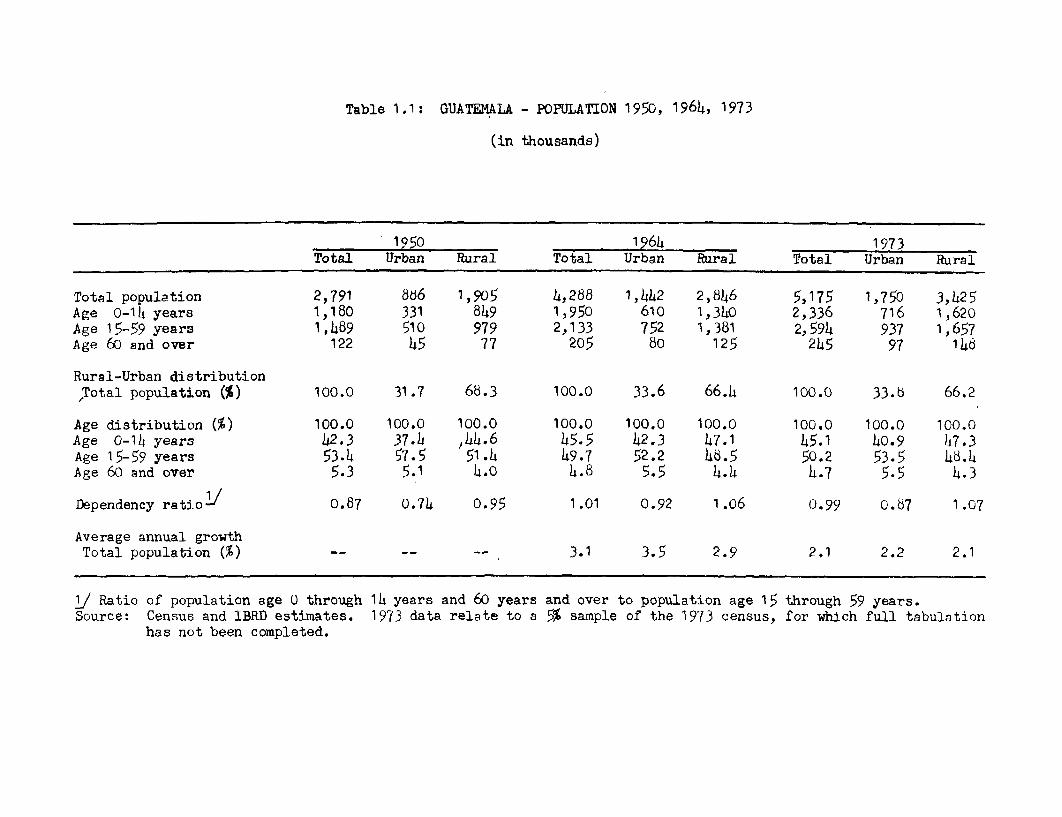
Table 1.1: GUATEMALA - POPUiLATION 1950, 1964, 1973
(in thousands)
1950 1964 1973Total Urban Rural Total Urban Rural Total Urban Rural
Total population 2,791 866 1,905 4,288 1,442 2,846 5,175 1,750 3,425Age 0-14 years 1,180 331 849 1,950 610 1,340 2,336 716 1,620Age 15-59 years 1,1489 510 979 2,133 752 1,381 2,594 937 19657Age 60 and over 122 45 77 205 80 125 245 97 146
Rural-Urban distribution,Total population (%) 100.0 31.7 68.3 100.0 33.6 66.4 100.0 33.b 66.2
Age distribution (%) 100.0 100.0 100.0 100.0 100.0 100.0 100.0 100.0 100.0Age 0-14 years 42.3 37., h44.6 45.5 42.3 47.1 45.1 40.9 47.3Age 15-59 years 53.4 57.5 51.4 49.7 52.2 46.5 50.2 53.5 46.4Age 60 and over 5.3 5.1 4.0 4.8 5.5 4.4 4.7 5.5 4.3
Dependency rati.ol o.87 0.714 0.95 1.01 0.92 1.06 0.99 0.67 1.07
Average annual growthTotal population (%) 3.1 3.5 2.9 2.1 2.2 2.1
j Ratio of population age 0 through 14 years and 60 years and over to population age 15 through 59 years.Source: Census and IBRD estimates. 1973 data relate to a 5% sample of the 1973 census, for which full tabulation
has not been completed.

Table 1.2: GUATEMALA - ECONOMICALLY ACTIVE POPULATION BY SECTOR L/
Average AnnualRate of Growth (%)
1950 1964 1973 1950-64 1964-73
Agriculture 577,646 764,957 797,900 2.2 0.2
Mines and Quaries 1,ho6 1,961 2,260 2.4 1.7
Manufacturing 108,744 140,607 204,720 1.9 4.3
Construction 25,765 35,534 61,o60 2.3 6.2
Electricity 1,213 1,57b 3,920 1.9 10.6
Commerce 51,245 62,027 111,040 3.4 3.4
Transport 14,966 29,135 37,920 4.9 3.0
Services 93,30b 150,631 1b6,100 3.5 3.3
Total 674,495 1,226,1430 1,014,94o 2.4 1.5
(percentage distribution)
Agriculture 66.1 63.9 56.7
Mines and Quaries 0.2 0.2 0.2
Manufacturing 12.4 11.5 14.6
Construction 2.9 2.9 a4.3
Electricity 0.1 0.1 0.3
Commerce 5.9 6.7 7.9
Transport 1.7 2.4 2.7
Services 10.7 12.3 13.3
Total 100.0 100.0 100.0
1/ Population 15 years and over. Excludes unidentified occupations.Source: Census and IBRD estimates. 1973 data relate to a 5% sample of the 1973
census, for which full tabulation has not been completed.
Table 2.1: GUATEMALA - GROSS DOMESTIC PRODUCT BY SECTOR1960 and 1965 through 1973 (preliminary)
(In millions of 1958 quetzales)
1960 1965 1966 1967 1968 1969 1970 1971 1972 1973
Gross domestic product (market prices) 1,049.2 1,355.2 1,429.9 1,488.6 1,619.2 1,695.9 1,792.8 1,892.8 2,031.6 2,185.4
Primary production 320.0 391.0 409.5 409.9 453.6 464.3 491.4 526.0 576.2 610.3Agriculture and related sectors 310.1 3c9T 407.7 4T081 45. 452.9 79T.7 524.3 374.7 616.5A4ining 1.9 1.6 1.8 1.8 1.4 1.4 1.7 1.7 1.5 1.7
Secondary production 163.5 229.4 253.2 274.5 300.7 321.9 332.9 354.4 379.7 414.54anufacturing 135.5 190.o 210.7 -228.5 254.o 273.3 283.0 303.2 319.8 9Construm tion 20.7 24.5 26.6 29.3 27.6 28.5 28.4 28.5 34.2 40.4Utilities 7.3 14.1 15.9 16.7 18.3 20.1 21.5 22.7 25.7 28.3
Services 565.7 734.8 767.2 804.2 864.9 909.7 968.5 1,012.4 1 075-7 1,152.5Transport and communications 7.T 777 75.5 7W1 o 92.0 90.2 105.5 11T.3 132.2Commercial services 274.5 376.6 397.2 417.6 461.5 480.6 518.o 542.1 569.6 612.7Financial services 18.7 32.7 33.4 35.0 36.2 38.2 42.3 43.6 46.7 53.3Housing services 94.4 107.6 111.4 1114.9 118.3 121.8 124.8 127.4 129.9 132.3Public administration 63.7 65.1 66.8 72.2 73.3 82.6 86.9 88.1 97.5 99.7Other 64.1 79.0 82.9 86.4 90.3 94.5 98.3 105.7 113.7 122.4
Source: Bank of Guatemala and IBRD Mission estimates.

Table 2.2: GUATH3ALA - GROSS DOiESTIC PRODlTJT B'f EXPELiDITUORE CATEGORIES1960 and 1965 through 1973 (preliminary)
(In millions of quetzales)
1960 1955 1 966 1 97 1966 1969 1970 1 971 1 ;72 197,
Consumption exnenditureFs .9 1183.1 1215.3 1315.9 1396.6 1510.4 15847.1 1731.3 l8b8.O 2176.4
General government 79.9 -1,"75-7 1127~- "9.9.S T 13 15o.77 ic.7
Private sector 876.0 185w.2 11140.3 1203.3 1281.5 1331.9 1495.7 1592.5 1691.3 2009.9
Domestic investment 107.5 177.2 149.6 185i.1 .. 195.7 2)44.1 285.5 254.6 375.8
Gross fixed casital forration 1 74 .'J 191.7 .I 231.0 c72 3L..7
(General government) (26.6) (42.6) (38.0) (1.3-8) (,h.) (1.3.8) (45.2) (57.Li) (67.1) (86.2)
(Private sector) (75.5) (132.3) (129-3) (11.7.9) (17659) (187.2) (193.3) (206.2) (205.8) (278.4)
Change in inventories 5.4 2.3 -17.7 -3.6 22.9 -35.3 5.6 21.9 -17.7 11.1
Gross domestic expenditure 1063.4 1360.3 1394.9 1504.0 16LO.6 1712.1 1891.2 2017.3 2102.8 25S2.2
Net balance goods and services -19.67 -_28 ,9-4.2 -30.0 3.3 -32.5 -1.2
Exports I=7 251.1 2S11 2 3 9
Imports 151.7 256.7 265.3 2P3.0 296.8 299.5 336.7 371.0 396.5 491.1
Gross domestic product 1043.6 1331.8 1390.7 1453.5 1610.6 1715.8) 1904.0 1984.8 2101.6 2591.0
Net factor income payments -1 0.) I T -31. -35. 7 --. -47.4
Gross national product 1033.2 13519.9 1373.3 1432.7 1579.2 1679.7 10 65.8 1943.0 2054.2 2544.6
Note: Data in the Table differ in certain cases from data supplied by the Central BanK.
Source: Sank of Guatemala and TIBRD Mission estimates.

Table 2.3: GUATEMALA - SUMMARY OF NATIONAL ACCOUNTSPart A: 1960 and 1965 through 1973 (preliminarv)
(In millions of US$ at average 1967-69 prices and exchange rates)
1960 1965 1966 1967 1968 1969 1970 1971 172 1973
I. Consumption 971.4 1,223.3 1,284.5 1,331.7 1,402.6 1,496.3 1,576.3 1,656.9 1,780.8 1,876.9
II. Gross Investment 117.4 173.3 153.5 202.1 241.1 184.4 222.9 257,5 216.7 250,0
III. .Gross National Expenditure (-I+II) 1,088.8 1,396.6 1,438.0 1,533.8 1;643.7 1,68007 1,799.2 1,914.4 1,997.5 2,126.9
INV Net balance goods and services - 414.9 - 48.2 - 15.3 - 52.7 - 32.7 6,7 - 15.4 -31.1 23.9 47.5(Exports) ( 133.4) ( 2i3.1) ( 251.2) ( 235.6) ( 26614) ( 299.9) ( 297.8) ( 304-8) ( 347.0) ( 377.6)(Imports) ( 178.3) ( 261.3) ( 266.5) ( 288.3) ( 299.1) ( 293,2) ( 313.2) ( 335.9) ( 323.1) ( 330.1)
V. Gross Domestic Product (=III+IV) 1,043.9 1,348.4 1,422.7 1,481.1 1,611.0 1,687.4 1,783.8 1,883.3 2.021.4 2,174.4
VI. Gains from terms of trade 20.7 17.0 10,5 01 2.5 - 3.5 27.3 1.7 - 24.8 - 21,4
VII. Gross Domestic Income (=V+VI) 1,064.6 1,365.4 1,433.2 1,481.2 1,613.5 1,683.9 1,811,1 1,855.0 1,996.6 2,153.0
VII. Domestic Savings (=VII-I) 93,2 142.1 148.7 149.5 210.9 187.6 134,8 228.1 215.7 276,1
IX. Net factor income payments - 509 - 11.7 - 18.9 - 19,7 - 31.6 - 35.0 - 35.5 - 37,8 - 38.6 - 31,2
X. Gross National Product (=V+IX) 1,038,0 1,336.7 1,403,8 1,46114 1,579.4 1,652.4 1,748.3 1,845.5 1,982.8 2,143.2
XI. Gross National Income (=X+VI) 1,058.7 1,353.7 1,414.3 1,461.5 1,581.9 1,648.9 1,775.6 1,847.2 1,958.0 2,121.8
XII. Current transfers received, net 17.1 7.6 9.5 9.4 10.8 13.1 16.3 22.8 23.5 28,2
XIII. National Savings (=XI+XII-I) 104.4 138.0 139.3 139,2 190.1 165.7 215.6 213,1 200.7 273.1
Gross Domestic Product at Current Prices 1,043.6 1,331.4 1,390.7 1,453.5 1,610.6 1,715.4 1,904.0 1,984.8 2,101.6 2,591,0
Source: Bank of Guatemala, IBRD mission estimates.
Table 2.3: GUATEMALA - SUMMARY OF NATIONAL ACCOUNTS
Part B: 1972-73, 1974 preliminary; projected, 1975-80
(In millions of US$ at average 1967-69 prices and exchange rates)
1972 1973 1974 1975 1976 1977 1978 1979 1980
I. Consumption 1,780.8 1,876.9 2,020.9 2,152.2 2,265.7 2,380.5 2,519.4 2,678.2 2,842.8
II. Gross Investment 1/ 216.7 250.0 298.8 308.h 342.5 363.0 384.8 407.9 432.4
III. Gross National Expenditure(=I+II) 1,997.5 2,126.9 2,319.7 2,460.6 2,608.2 2,743.5 2,904.2 3,086.1 3,275.2
IV. iNet balance goods & services 2/ 23.9 47.5 -21.4 -12.9 -13.6 6.7 11.1 4.1 0.4
(Exports) (347-0) (377.6) (401.6) (410-1) (434-8) (482.0) (514-9) (538.1) (566.5)
(Imports) (323-1) (330.1) (423-0) (423-O) (448-4) (h75-3) (503-8) (534-0) (566.1)
V. Gross Domestic Product 2,021.4 2,174.4 2,298.3 2,447.7 2.594.6 2.750.3 2,915.3 3,090.2 3,275.6
(=III+IV) J
VI. Gains from terms of trade V/ -24.8 -21.4 -23.2 1.3 -4.8 -37.2 -50.9 -58.5 -57.4
VII. Gross Domestic Income(=V=Vi) 1,996.6 2,153.0 2,275.1 2,449.0 2,589.8 2,713.1 2,864.4 3,031.7 3,218.2
VIII. Domestic Savings(=VII-I) 215.7 276.1 254.2 296.8 324.1 332.5 345.0 353.5 375.4
IX. Net factor income payments5/ -38.6 -31.2 -22.5 -21.6 -19.5 -19.3 -19.3 -19.7 -21.5
X. Gross National Product(=V+IX)1,982.8 2,143.2 2,275.8 2,426.2 2,575.1 2,731.0 2,896.0 3.070.5 3.254.1
XI. Gross National Income(-VI+X) 1,958.0 2,121.8 2,252.5 2,427.4 2,570.3 2,693.7 2,845.2 3,011.9 3,196.7
XII. Current Transfers received,Net i 23.5 28.2 27.6 27.6 27.6 27.6 27.6 27.6 27.6
XIII. National Savings (=XIxII-I) 200.7 273.1 259.3 302.8 332.2 340.8 353.3 361.3 381.5
Footnotes to Table 2.3 - Part B
*/ Projections are made using the IBRD Minimum Standard Model for Guatemala.
I/ Assumes that the ICOR rises from 2.00 in 1975 to 2.1 in 1976 and to 2.2in 1977 and subsequent years.
2/ See footnotes to tables 3.1 Part B and 3.2 Part B.
/ Assumes a rate of growth of 6.5 percent for 1975 and 6 percent per annumfor up to 1980.
g,/ See footnotes on tables 3.1 Part B and 3.2 Part B. Assumes the followingprice indexes:
1973 1974 1975 1976 1977 1978 1979 1980Exports 100.0 125.0 150.0 162.0 162.0 170.1 180.3 194.7Imports 100.0 125.0 139.4 153.0 166.0 179.3 192.8 206.3
5/ See Table 3.1 Part B.
Source: Bank of Guatemala and IBRD Mission projections.
Table 2.4: GUATEMALA - GROSS FIXED CAPITAL FORMATION BY MAJOR SECTORS
1965 THROUGH 1973 (preliminary)
(In millions of Quetzales at 1958 prices)
1965 1966 1967 1968 1969 1970 1971 1972 1973
Agriculture j 23.2 19.6 16.5 19.3 17.3 17.4 18.7 21.0 22.5(Machinery & equipment)(14.1) (10-5) (8-4) (10.3) (8.1) (8.0) (b.9) (9-4) (10.5)(Permanent crops) ( 5.3) ( 5.4) (4.7) ( 5.3) (5.4) (5.5) (5.7) (6.6) ( 7.0)(Land Improvement) ( 3.8) ( 3.9) (3.4) ( 3.7) (3.8) (3.9) (4.1) (4.8) ( 5.0)
Industry I/(Machinery & equipment) 47.0 44.6 49.5 56.5 56.6 60.3 58.4 55.7 62.9
Transport & communica-Lions 1/(Machinery & equipment) 15.7 15.2 17.5 21.1 20.0 17.9 34.1 21.8 26.9
Private Construction 26.5 30.6 24.4 24.5 27.5 25.8 24.7 21.4 24.5
Others j 16.8 26.4 38.5 49.7 54.2 51.4 53.6 58.4 62.3
Public InvestmentRoads & public works 35.6 29.3 37.6 3d.3 37.1 36.8 37.9 47.8 57.7
TOTAL 166.8 165.9 184.3 209.4 212.7 209.6 227.4 226.1 256.7
Source: Bank of Guatemala.
j Includes capital goods acquired by the public sector.j Includes only capital goods produced in the country.
Table 2.5- GUATEALkIA - VALUE ADDED IN MANNUFACTtEING BY kJCV(1 INDUSTRIAL BRA1{CHES1950, 1955, 1960, 1965 through 1973 (oreliminarv)
(In millions of quetzales at 1958 prices)
1950 1955 1960 1965 1966 1967 1968 1969 1970 1971 1972 1973
Food processing 26.2 29.3 41.2 51.14 54.9 56.3 69.5 73.6 76.5 85.9 89.8 93.4Beverages 19.1 19.7 24.6 26.4 26.5 26.6 27.1 28.9 30.6 33.1 3L.8 40.0Tobacco 9.4 9.1 11.2 13.7 14.3 16.5 15.2 15.8 17.6 18.0 16.5 19.3Textiles 4.7 6.4 12.3 24.5 26.6 29.4 30.3 31.7 33.8 35s1 36.6 38.1Clothing and footwear 11.1 13.2 18.9 24.6 26.8 27.8 31.5 33.3 32.6 34-4 35.6 36.7Wood and cork manufactures 2.0 2.5 2.5 4.0 4.2 4.1 3.9 5.0 5.5 5.2 5.6 6.5Furniture and fixtures 3.6 1.1 1.8 5.6 5.8 6.0 6.2 6.4 6.6 6.8 7.0 7.4Paper and paper goods - 0.1 0.6 2.6 2.7 3 .0 3.6 4.0 4 .9 4.7 .68 8.1Printing and allied industries 1.2 1.7 2.4 3.6 3.9 1.0) 4.0 1.5 14.9 50 5.4 5.9Leather and leather products 1.4 1.4 1.6 1.6 1.6 2.1 3.7 3.7 3.0 3.4 3.5 3.4Rubber products 0.1 0.2 1.1 2.1 3.2 3.5 4.5 4.1 3.° 3.9 1.5Chemicals and products 2.7 2.9 1.6 6.8 7.5 8.5 9.3 9.5 10.3 9.8 9.9 10.5Non-metallic minerals 3.8 4.8 5.3 10.2 10.9 10.0 9.0 10.6 10.2 9.9 9.4 11.2Hetal products o.4 0.9 1.5 6.3 11.7 16.1 21.1 23.6 22.0 23.1 25.0 26.7Machinery, excluding electrical 0.1 0.1 0.2 1.0 1.9 2.6 3.5 3.9 3.6 3.8 h.1 4.14Electrical machinery 0.1 0.2 0.3 1.1 2.0 2.8 3.7 4.1 3.9 4.0 41. i.7Transuortation equipment o.6 1.0 1.6 2.4 2.3 2.3 2.6 2.3 3.0 3.2 3.1 3.7Miscellaneous 0.1 0.2 0.8 2.9 3.7 4.7 6.1 7.8 10.0 12.9 16.5 21.1Total 86.6 98.3 135.5 190.6 210.7 228.4 251.0 273.3 282.9 303.2 319.8 345.8Index 1960 = 100 63.9 72.5 100.0 10o.6 155.5 168.6 188.0 201.7 208.8 223.8 236.0 255.2
Source: Bank of Guatemala
Table 2.6: GUATEMALA - VALUE OF P?ODUCTTOIO IN KANUFACTUITNG J1Y 1iAJ)R INDUSERIAL BRAIICZ3BS1950. 1955. 1950. 19S5 tlLrough 1973 (nreliminar-f)
(In millions of quetzales at 1958 prices)
1950 1955 1960 1965 1966 1967 1958 1969 1970 1971 1972 1973
Food processing 95.9 106.6 142.7 178.2 184.3 195.5 2341.l, 247.:; 261.2 29,.2 3C5.e 316.7Beverages 25.0 24.1 30.8 34.4 34.1 33.9 35.3 38.9 41.1 44.6 4?.5 54.5Tobacco 12.0 12.4 14.5 17.7 18.5 21.3 19.7 20.4 22.6 23.it 24.,) 25.0Textiles 10.9 14.6 28.4 56.8 61.7 68.1 70.4 73.7 76.5 33.9 85.3 8&.5Clothing and footwear 28.7 34.0 49.5 55.5 71.1 73.6 80.9 85.3 84.2 89.2) 92.j 94.9Wood and cork manufactures 4.8 6.0 S.o 9.5 10.0 9.? 9.4 11.9 13.3 12.4 13.5 15.7Furniturp and fixtlires 8.5 7.5 '.7 10.1 10.6 1V9 11.2 11.6 12.0 12.3 12.7 1Paper and paper goods 0.1 0.2 1.3 5.8 6.1 6.7 3.0 9.0 11.0 10, 12.9 lu.0Printing and allied industries 1.8 2.7 3.7 6.8 6.o 6.3 6.2 7.0 7.6 7.3 8.3 9.3Leather ano leather products 2.7 2.9 3.3 3.3 3.6 it.2 7.4 7.4 6.1 ,.8 7.0 6.9tiibber products 0.3 0.4 2.5 4.9 7.5 8.4 10.5 9.7 9.2 9.0 10.5 10.6Chemicals and products 8.2 8.7 14.2 20.2 22.0 24.9 27.1 27.4 28.6 28.1 28.7 30.3ijon-metallic minerarls 8.0 9.9 11.1 21.2 22.7 20.8 18.6 21.9 21.2 20.6 19.5 23.2Metal products 1.2 2.3 4.0 16.7 31.1 42.8 56.2 62.8 58.6 61.3 65.6 71.1niachinery, excluding electrical 0.1 0.3 0.5 2.1 3.9 5.3 7.0 7.8 7.3 7.7 8.3 G.9Electrical machinery 0.1 0.3 0.5 2.1 3.9 5.3 7.0 7.8 7.3 7.6 8.3 8.8Transportation equipment 0.9 1.6 2.4 3.7 3.5 3.5 4.0 4.3 4.6 4.9 5.3 5.7Miscellaneous 0.2 o.6 2.1 7.2 9.2 11.8 15.2 19.5 24.9 32.0 4100 52.5
TOTAL 207.4 235.1 326.2 866.2 509.8 553.0 628.5 674.o 699.5 758.1 796.9 854.2
Index 1960 = 100 63.6 72.1 100.0 18t2.9 156.3 169.5 192.7 205.6 214.4 232.8 244.3 261.9
Source: Bank of Guatemala
Table 2.7: GUATEMALA - GROSS VALUE OF PPODUCTION OF AGRICULTURE, LIVESTOCK, FORESTRY AM.iFISHERIIES
19O and 1965 through 1973 (preliminary)
1960 1965 1966 1967 1968 1969 1970 1971 1972 1973
(In thousand of quetzales at 1958 prices)
Agriculture 226,813.9 294,507.5 302,944.0 287,266.7 305.942.8 310,457.8 320,256.8 333,536.0 380,162.0 415,752.4
Food Crops 87,251.2 116,098.1 116,092.8 118,544.5 122,317.7 123,356.1 128,202.4 134,710.3 142,360.9 149,655.5
nalze 24,713.6 34,396.3 33,811.8 32,811.8 32,359.2 33,097.0 36,271.4 35,482.1 35,495.9 37,816.6dice 1,47j.6 3,054.2 2,004.9 2,490.0 2,713.1 2,870.0 2,453.6 6,35l.5 6,617.9 4,765.4kheat 2,591.4 4,856.2 3,982.3 3,139.3 4,517.9 3,091.0 4,074.5 4,636.5 5,901.0 6,623.2Barley 13.6 17.0 19.0 19.7 19.7 21.8 23.8 26.5 28.6 33.3Beans 15,326.4 21,214.2 22,596.6 25,725.0 26,258.4 26,601.5 25,836.1 25,987.2 27,543.0 29,917.5Lima Beans 860.3 928.2 1,033.5 1,665.5 1,098.2 1,132.6 1,167.7 1,203.5 1,241.0 1,279.2Lentils 4.9 6.1 6.2 6.4 6.6 6.8 7.0 7.3 7.5 7.7Ground Nuts 95.7 112.0 112.0 115.0 118.1 122.2 126.2 130.3 134.4 138.4Sesame 123.8 197.5 179.6 582.0 754.7 427.9 I19.7 1,008.6 1,590.7 1,986.4Potatoes 1, 218.9 1,948.5 1552.3 1,414.2 1,244.4 1,344.5 1,479.1 1,627.2 2,017.8 2,255.9Vegetables 14,a63.2 16,926.0 1?,416.8 17,956.8 1d,513.6 19,087.5 19,679.4 20,289.6 20,918.4 21,567.0Fruits 15,098.3 18,417.7 18,951.9 19,539.4 20,145.1 20,769.6 21,413.6 22,077.4 22,761.8 23,466.7Other 10,867.8 14,024.2 14,425.9 13,679.4 14,568.7 14,783.7 15,250.3 15,882.6 18,102.9 19,797.7
Industrial Jrsos 139,562.7 178,409.4 186,851.2 168,722.2 183,625.1 187,101.7 192,054.4 198,825.7 237,801.1 266,096.9
Coffee 87,651.5 105,300.9 100,039.6 87,765.8 96,363.7 98,355.5 108,499.4 110,077.4 122,335.0 131,615.2Cacao 310.1 138.1 195.1 202.1 209.0 216.0 223.0 229.9 236.9 243.9Rubber 249.7 915.4, 1,322.8 1,898.7 2,104.6 2,332.4 2,317.0 2,380.5 2,448.4 2,483.5Cotton (line) 8,895.4 40,090.2 4t,738.4 36,866.8 41,415.4 37,078.5 29,574.2 33,603.6 45,042.3 48,606.9Cotton (seed) 950.3 4, 376 4 4,770.8 3,950.6 4,646.5 4,167.6 3,285.0 3,683.2 4,911.4 5,454.3Kenaf 80.0 671.2 680.0 752.0 856.8 744.8 761.6 649.6 622.4 656.0Sugar 14,388.6 16,430.9 20,010.2 20,733.4 18,995.2 21,150.9 22,645.1 23,792.3 314ll1.o 37,352.3Banana Export 20,938.3 5,262.2 9,631.8 8,305.0 12 880 2 16,198.8 16,848.5 17,82?.9 23,395.9 28,269.4C.tronela 602.0 478.6 398.2 356.5 246.7 161.1 146.6 'i1ijdo 300.0 306.6Lemon Grass 1,091.7 729.1 792.3 743.0 585.1 614.8 930.5 7'3.0 669.1 565.8Cardamon 1,574.0 1,216.1 1,477.8 1,770.3 2,062.8 2,016.6 3,278.9 2,401.5 2,155.2 4,756.7Tobacco 1,019.8 1,637.1 1,710.9 1,978.5 1,828.9 1,892.1 2,121.8 2,446.2 2,829.7 4,481.6Chicle 1,661.3 1,113.2 1,083.3 3,399.5 1,430.4 2,172.6 1,422.8 862.6 1,693.8 1,304.7
Liveitock 81,536.6 94,688.2 104,916.5 118,972.8 149,622.7 155,014.5 172,608.9 196,366.2 203,341.2 211,436.2
,'orestry 26,i50.6 35,738.2 35,891.2 38,200.4 38,003.0 39,530.9 41,055.5 42,124.3 44,120.8 46,415.1
Fishing and Hunting 3,176.9 4,166.1 4,177.1 5,064.9 )4,4L95.4 4,818.9 5,310.7 5,368.1 5,284.4 5,400.7
Total Gross Valueof Production 340,187.9 432,100.0 447,928.8 449,504.8 498,063.9 509,822.1 539,291.9 577,393.6 632,908.0 679,004.4
Inputs 22,092.9 39,753.2 40,209.4 41,354.4 45,821.9 46,903.6 49,65i.8 53,118.4 58,221.2 62,461.6
Total Value Adidea 318,095.0 389,346.8 407,719.4 408,150.4 452,242.0 462,918.5 489,677.1 524,279.2 574,687.2 616,642.6
(As rercentage of gross value of production)
Agriculture 66.7 68.1 67.6 63.9 61.4 60.9 59.4 57.7 6o.1 61.2(Food Crops) (25.7) (26.9) (25.9) (26.4) 24.5 (24.2) (23.8) (23.3) (22.5) (22.0)
(Industrial Crops) (41.0) (41.2) (41.7) (37.5) 36.9 (36.7) (35.6) (34.4) (37.6) (39.2)
Livestock 24.0 22.6 23.4 26.5 30.1 30.4 32.0 34.0 32.1 31.1
Forestry 8.4 8.3 8.0 8.5 7.6 7.8 7.6 7.3 7.0 6.9
Fishing and Hunting 0.9 1.0 1.0 1.1 0.9 0.9 1.0 1.0 0.8 0.8
Total Gross Value ofProduction 100.0 100.0 100.0 100.0 100.0 100.0 100.0 100.0 100.0 1 0.0
Source: Bank of Guatemala
0'. 000'. .-iO )0.('J I 04 -C O-.C ON I 'N11 ,..) �-QN .4 -10(0)0)0-0 ON"'. (NJ 0-44 - 0'. 0'. 0I','. . I0400-Cd 02040041 0) '.0044'. Hf �II 040-0404 � 0 4 O N t'. H 04 t-I 440'. )� ON, Cd)'JCdOJ ('20204&j04ON �0041 I I i I I I I I �
04.40(0 MN'CCdCd4 0) -ON-CO 041 (0 0(04.404 00400NCd.00) HO-0404 0- H 0I- VNO-'.CH '0)-INOOI -I r-'.-'..n 'CI 0'. )'r'.co) 0)ON'OH-40--(OH OO.(Nj0 0 -4 '.0 0O'.ONH..02 0'Ot.0'CI �4 ON H 041 H 'Co'.C'J04 o,H H MN'H ON)". "NOd j III I I ---' -'.-'.'I II I I I
rn0�'OO 09'.4'.OJI MN 040404 CdI II '0-0040-- o'.0-ON'C ONOflO'. 04.0 H 0'. �'N 'C)O'00404 -iC.'fl.4I 04 HONa )HI �II "'-)'.�0 '-'-0MN� 00)004 H,-'. 0 ON 'C0)04 H ON 0-040400' ON .4CdH Cd' ,0)N'UNCdHH ,-,HH A0410 ON041 I II) I ill '--'-' II I I I
I 0v'.H,-04 )'-'C)fl04 04 0.0.04 MN ON ON'.JNC'.ON '.00))C'.HCd..4044) OIJNHO.) 0 )NJ MN 04I -)I 'I I4.404.-C0(0040 '0 0'. 04 040(04 0-- 0- 040404 CdCd�CdO04Cd0'Cu �I -�
ON HI 0.�C))0. Cd 'I'"'"' H 0'I __
04MNCdH MNO'.ONONI ON 0-HON .4 0 (0.2400. Cd04OH44MNHO) 00)0.404 -4 ON in 0)0'
- I . . 0)(N'CdONH 0000,041 ON MN040- 0' 0'. H-I 'ON o)C.H0i00�Cd04 HHOO H 02) 0 0002) ON 0'00.ONf ON)'.� 0 H Cd�
2
H HIII I I '"' 'I F 4 ON04 ON
C'.I H
'00) 04MNMN04 04'C.-C04 0 4040'. 0-- 0- o)'-00N0 .-HHOH0'.000) 0'. Cd ON 'C 0 C1¾'-' . . .
. . I I c-4
o 0�"04'(N'(N 'CONHO' 0 02040- 0 0 0--O-JMNH CdMN0O'J.-TMNHCd 0404 0 0 0) 40 0)
0.4 0 '.�ON'& 0'ONNON ON ON)'.) H MN ON)NH H .00 0 "-' C''' 4 .-'.'.-- 4 I. I� II U ON
(C'. CNMN H .40)4 (N) 0'- O'. 04 H ON 0 -C Cd ON C'. MN-C '.02' ON 0 0- '0 H H H H MN 04 MN 0.- I I0) 04ONMNON �402ON-in H C'.404 0'. Cd 0-044-) HCd44HONMNHMN 0000) H 0 MN n -S aa i
0.0 '.�02 .0 00 (N 040 0. 04Cd)NJON UN H,-) '-qjj ON',-) 4' 4 4 ) 0.4 0� 0
0 �Cd 4 '' '� I 40 � in H
OMN ..' '00 inO
04 .4 OH '44 0
00 1= P(N 0) in
04 H). Cin 0 �
0�' 04 j -�.ON ON'ON' 00 -�.0) Cd 0 .0)- -'.00404 (".040.0'. 0-. 40.04 ..4 Cd 0'.UNMN04 0--004'C Cd'0.404 )'N'-C OH 04 MN 04 0 H C) H 4. .0(4 .42' 0 0 0
HH� '.JV,-,ONH)I .0 0 -
-'0o) 0.Cd41ONONCdOCHO,OH-ON 04020 0 4 H '.0) 0 0) H 2' 0'-DON Cd 'OOH..0 ¶1
'.2 4.0404 0.0. I ' H.-) H 02,-Cd
H ,-JH 0) 000 0)0 �) �H)-. �0'00
. 0)0)).
0 0'0 0. � � 002
0)04040- ('Cd �in 04040404 04 04 MN H.1.40404.40- 0000 ON H 04 4 .04 0).'-'04040(04 Cd Cd-C 0'. 040-04 MN 0'. 04.404 ON 040'. ...0-04040'. 'C'Oc0)0. 04 -'020 0- 0. 04-0)0'. 0(0 0. '0 00 .00)'., (NH0404 04 044) MON Cd .402 ON 4HHH 4 I 0) �O 0020) -00 00404 0404 I I I '"-' '-'-'
003
�iin a'). $o-� 0
0-H (NOC 2' (No (N C)-'-(0 NJ'.)O NJ.". 0 0)0 04L�. 0) H
02 0 A) 0 1. OH. 04 0 0)4 0 0 0 042' 0 0 -H 0 0404 0 .4 0 0)00 0204 H 00 H 0 0) 04-40 .,i.0)H 0)(N 0- 0 NJ 0 �.04N 00 0 0 in'-. 0 0 C .O,H4. oto. 0 NJO 0NJ )- - C MNI ' (1 H inONJ NJ C 0.
.4 in 4 -ol 0) -H 4 0 000 '.-�0 02 002 0-o '4 0 '. H (N C in 0) 0)00 00) 0o in-) 0 Cin 0 0 '� 0 2' (N 0 in H0 � 0- 00 .-, 0 0) NJ 0tH 0 .'0 C)))in ') 041 00 H 0) 0 in NJNJP 0 'C 0 0)
(N . 0 0 -'.�'. H 0-'. 00- 0 0 � � NJ-OH (4(N .0) 04'.)) ON 0) .0 4ON-.' inCin ,UNIH in'.Cl H C 0 401.0 H)-) 0) 0(40 C .NJ - (4.20 000 00-,- 0 0 0) H oUC 00) NJ 0.0.20-00 NJ H in H .4 0) 0 in 00.4 04 .00'. 00 ol 0-400)0'
00 .0 ' '0 �0). 0Oo00)in � � 0 0) 0) .0 .0.00 0'.'. 04 0 CI-'.-N .400 ooo '00- H
0� 0 in H�H 0 . NJ.
o o 0 '-'� t in � '4!.00 '-' Cin'.) 04 OH' 04I000 'NJ (NH '.2.20 o 02 0 3 C 0 inON. 8o 0 .- (N NO', 04 000 0)0) 'in C -40) OH 0 CO H 30 '0 0 0.0)02 oHI 8 0 �'0 0 2' 0,-.)- N-) (N 0) 040)). 40 .4�00))- 04.40 0 NJ-' 0 0 $ �.0 NJ �,0) 0 NJ C -) NJ �' '. - H - .400.0 (N-OdDNJClo0.-) HC)00 00 0 0) 0 0)O 2'�$ ''
00 0) 00 N) NJ 0 0.0 0 '.-.� 0 0.0.0 .2.2000,.-). (NC) ...H 0 0 0)2'0) 0 NJ) OHo 0) 000 0 0 0 HO 0 00 00.�04 '00.0)0) H H 0 N 0) 0 00)0 H 0 0 a �0,-. 0.0 0 0020 '.4 '.-' 00CZ-�.C'------ 0000 '.0 0 NJ o -4-�o. oOO HNJ- 004 '.-' .40)). (±2 0.-.). 0 0).). 44.'�(N.�). NJ 0 0,.,. inO 0 0 2' 0.0'-' 0 � a0) 00)1. 0 (Jo)) 0'--.)- 0) -0 0000 0 0 0 .000 0 H NJ NJ (40). HH 0)0)4.0.4 00.4,0 0 '-'0.2 NJ .40)0.0 oH 4 .0 0000 000 NJ 0 0(N044).H 0004.4 0 0)0 0 4-. ))HHH 00 0 in 0000 0)0 0 0) in (1H 002020 .2.404040 ). 0.04'-) 4' (4 ('000 HON 0 0) 0400 00) 0 NJNJ'.. 0)0 0 0 0 0) .0 0 (N H '0 00)- 0)- 0 NJ �0 0- 0- 0- 0- 0- 0- 0-0 4 ' 04 02 0- 04 0) 02 HI Cdl 041 .01041 'CI 0--I 0)
HO 0404 020
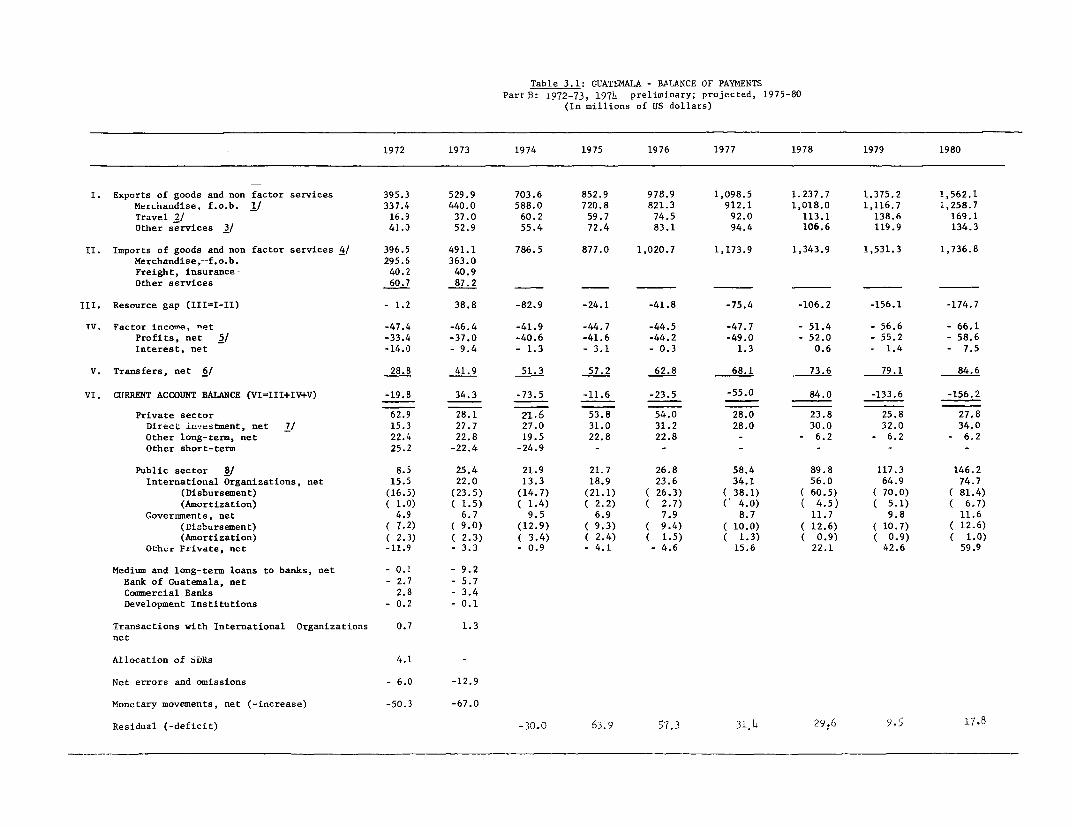
Table 3.1: GUATEMALA - BALANCE OF PAYMENTSPart B: 1972-73, 1974 preliminary; projected, 1975-80
(In millions of US dollars)
1972 1973 1974 1975 1976 1977 1978 1979 1980
I. Exports of goods and non factor services 395.3 529.9 703.6 852.9 978.9 1,098.5 1.237.7 1.375.2 1,562.1MeLLeaLidise. f.o.b. 1/ 337.4 440.0 588.0 720.8 821.3 912.1 1,018.0 1,116.7 1,258.7Travel 2/ 16.9 37.0 60.2 59.7 74.5 92.0 113.1 138.6 169.1Other services 3/ 41.0 52.9 55.4 72.4 83.1 94.4 106.6 119.9 134.3
II. Imports of goods and non factor services 4/ 396.5 491.1 786.5 877.0 1,020.7 1,173.9 1,343.9 1,531.3 1,736.8Merchandise,--f.o.b. 295.6 363.0Freight, insurance- 40.2 40.9Other services 60.7 87.2
III. Resource gap (III=I-II) - 1.2 38.8 -82.9 -24.1 -41.8 -75.4 -106.2 -156.1 -174.7
TV, Factor incom.e, net -47.4 -46.4 -41.9 -44.7 -44.5 -47.7 - 51.4 - 56.6 - 66.1Profits, net 5/ -33.4 -37.0 -40.6 -41.6 -44.2 -49.0 - 52.0 - 55.2 - 58.6Interest, net -14.0 - 9.4 - 1.3 - 3.1 - 0.3 1.3 0.6 - 1.4 - 7.5
V. Transfers, net 6/ 28.8 41.9 51.3 57.2 62.8 68.1 73.6 79.1 84.6
VI. CURRENT ACCOUNT BALANCE (VI=III+IV+V) -19.8 34.3 -73.5 -11.6 -23.5 -55.0 84.0 -133.6 -156.2
Private sector 62.9 28.1 21.6 53.8 54.0 28.0 23.8 25.8 27.8Direct iavestment, net 7/ 15.3 27.7 27.0 31.0 31.2 28.0 30.0 32.0 34.0Other long-term, net 22.4 22.8 19.5 22.8 22.8 - - 6.2 - 6.2 - 6.2Other short-term 25.2 -22.4 -24.9 - - - - - -
Public sector 8/ 8.5 25.4 21.9 21.7 26.8 58.4 89.8 117.3 146.2International Organizations, net 15.5 22.0 13.3 18.9 23.6 34.1 56.0 64.9 74.7
(Disbursement) (16.5) (23.5) (14.7) (21.1) ( 26.3) ( 38.1) ( 60.5) ( 70.0) ( 81.4)(Amortization) ( 1.0) ( 1.5) ( 1.4) ( 2.2) ( 2.7) ( 4.0) ( 4.5) ( 5.1) ( 6.7)
Governments, net 4.9 6.7 9.5 6.9 7.9 8.7 11.7 9.8 11.6(Di_bursement) ( 7.2) ( 9.0) (12.9) ( 9.3) ( 9.4) ( 10.0) ( 12.6) ( 10.7) ( 12.6)(Amortization) ( 2.3) ( 2.3) ( 3.4) ( 2.4) ( 1.5) ( 1.3) ( 0.9) ( 0.9) ( 1.0)
Other Private, net -11.9 - 3.3 - 0.9 - 4.1 - 4.6 15.6 22.1 42.6 59.9
Medium and long-term loans to banks, net - 0.1 - 9.2Bank of Guatemala, net - 2.7 - 5.7Commercial Banks 2.8 - 3.4Development Institutions - 0.2 - 0.1
Transactions with International Organizations 0.7 1.3net
Allocation of SDRs 4.1 -
Net errors and omissions - 6.0 -12.9
Monetary movements, net (-increase) -50.3 -67.0
Residual (-deficit) -30.0 63.9 57.3 31.4 29.6 9.5 17.8
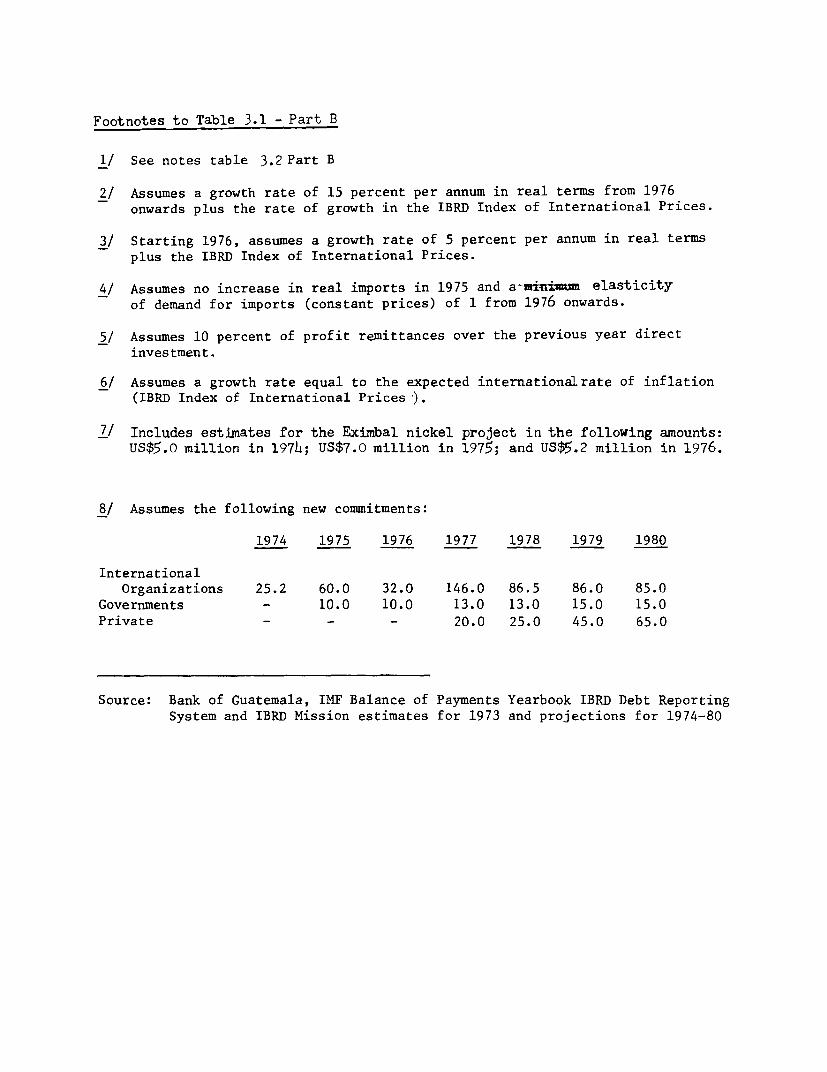
Footnotes to Table 3.1 - Part B
1/ See notes table 3.2 Part B
2/ Assumes a growth rate of 15 percent per annum in real terms from 1976onwards plus the rate of growth in the IBRD Index of International Prices.
3/ Starting 1976, assumes a growth rate of 5 percent per annum in real termsplus the IBRD Index of International Prices.
4/ Assumes no increase in real imports in 1975 and a-ainœium elasticityof demand for imports (constant prices) of 1 from 1976 onwards.
5/ Assumes 10 percent of profit remittances over the previous year directinvestment.
6/ Assumes a growth rate equal to the expected internationalrate of inflation(IBRD Index of International Prices ).
7/ Includes estimates for the Eximbal nickel project in the following amounts:US$5.o million in 197h; US$7.0 million in 1975; and US$5.2 million in 1976.
8/ Assumes the following new commitments:
1974 1975 1976 1977 1978 1979 1980
InternationalOrganizations 25.2 60.0 32.0 146.0 86.5 86.0 85.0
Governments - 10.0 10.0 13.0 13.0 15.0 15.0Private - - - 20.0 25.0 45.0 65.0
Source: Bank of Guatemala, IMF Balance of Payments Yearbook IBRD Debt ReportingSystem and IBRD Mission estimates for 1973 and projections for 1974-80
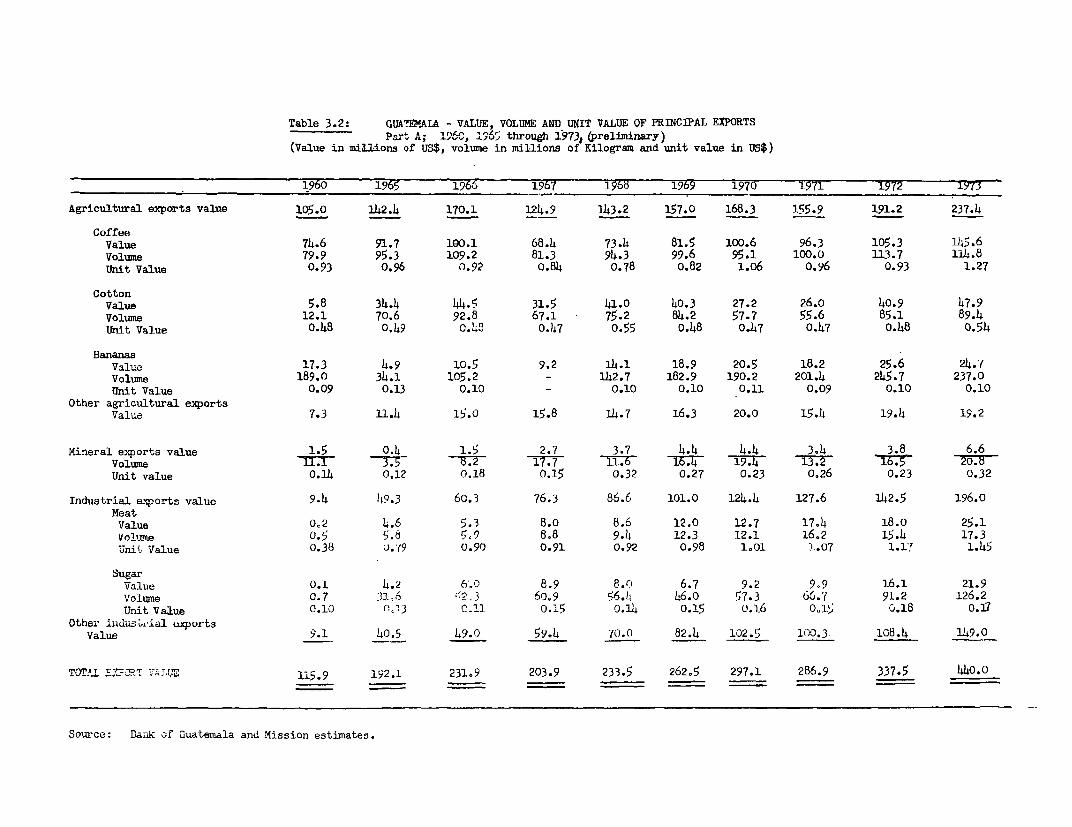
Table 3.2: GUATEMALA - VALUE, VOLUME AND UNIT VALUE OF PRINCIPAL EXPORTSPart A; 1260, 1965 through 1973, (preliminary)
(Value in millions of US$, volume in millions of Kilogram and unit value in US$)
1960 1965 1966 1967 1968 1969 1970 1971 1972 1 7JAgricultural exports value 105.0 142.4 170.1 124.9 1143.2 157.0 168.3 155.9 191.2 237.4
CoffeeValue 74.6 91.7 190.1 68.4 73.4 81.5 100.6 96.3 105.3 145.6Volune 79.9 95.3 109.2 81.3 94.3 99.6 95.1 100.0 113.7 114.8Unit Value 0.93 o.96 0.92 0.84 0.78 0.82 1.06 0.96 0.93 1.27
CottonValue 5.8 34.4 44.5 31.5 41.0 40.3 27.2 26.0 40.9 47.9Volume 12.1 70.6 92.8 67.1 75.2 84.2 57.7 55.6 85.1 89.4Unit Value 0.48 0.49 0.4" 0.47 0.55 o.48 0.47 0.47 o.48 0.54
BananasValue 17.3 4.9 10.5 9.2 14.1 18.9 20.5 18.2 25.6 24.7Volume 189.0 34.1 105.2 - 142.7 182.9 190.2 201.4 245.7 237.0Unit Value 0.09 0.13 0.10 - 0.10 0.10 0.11 0.09 0.10 0.10Other agricultural exportsValue 7.3 11.4 15.0 15.8 114.7 16.3 20.0 15.4 19.4 19.2
Mineral exqports value 1.5 0.4 1.5 2.7 3.7 4.4 4.4 3.4 3.8 6.6Volume '1.2 1 7.7 11.6 -Iwb --F -19.14 13.2 16.5Unit value 0.14 0.12 0.18 0.15 0.32 0.27 0.23 0.26 0.23 0.32
Industrial exports value 9.4 149.3 60.3 76.3 86.6 101.0 124.4 127.6 142.5 196.0Meat
Value 0.2 4.6 5.3 8.0 8.6 12.0 12.7 17.4 18.0 25.1Volume O.5 5.- 5,9 8.8 9.4 12.3 12.1 16.2 15.4 17.3Unit Value 0.38 0.Y9 0.90 0.91 0.92 0.98 1.01 Th.07 1.1! 1.45
SugarValue 0.1 4.2 6,0 8.9 8.0 6.7 9.2 9.9 16.1 21.9Volume 0.7 31>6 - 3 60.9 56.4 46.o 57.3 66.7 91.2 126.2Unit Value 0.10 fl23 0 11 0.15 0.14 0.15 o.l6 0,15 G.18 0.7Other iiiduz U±ial uixports
Value 9.1 40.5 L9.0 59.4 70.0 82.4 102.5 100.3 108.4 1149.0
TOTl.L E.7 T 'L 1l5.9 192.1 231.9 203.9 233.5 262.5 297.1 286.9 337.5 440.0
Source: DaTi of Guatemala and Mission estimates.
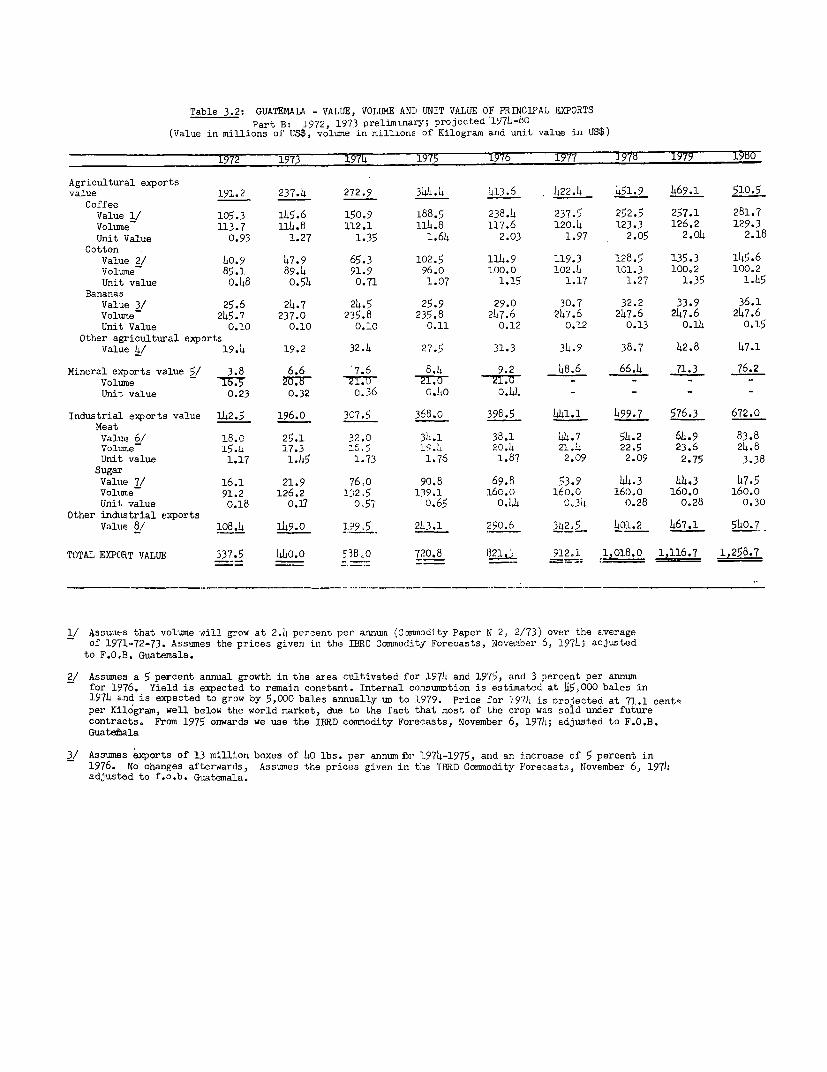
Table 3.2: GUATEMALA - VALUE, VOLUME AND UNIT VALUE OF PRINCIPAL EXPORTSPart B: 2972, 1973 preliMLnary; projected 1974-80
(Value in millions of US$, volume in millions of Kilogram and unit value in Us$)
1972 1973 1974 1975 1976 1977 197T 1979 19d0
Agricultural exportsvalue 191.2 237.4 272.9 344.4 413.6 422.4 451.9 469.1 510.5
CoffeeValue 1/ 105.3 145.6 150.9 188.5 238.4 237.5 252.5 257.1 281.7Volume 113.7 114.8 112.1 114.8 117.6 120.4 123.3 126.2 129.3Unit Value 0.93 1.27 1.35 1.64 2.03 1.97 2.05 2.04 2.18
CottonValue 2/ 40.9 47.9 65.3 102.5 114.9 119.3 128.5 135.3 145.6Volume 85.1 89.4 91.9 96.0 100.0 102.4 101.3 100,2 100.2Unit value 0.48 0.54 0.71 1.07 1.15 1.17 1.27 1.35 1.45
BananasValue 3/ 25.6 24.7 24.5 25.9 29.0 30.7 32.2 33.9 36.1Volume 245.7 237.0 235.8 235.8 247.6 247.6 247.6 247.6 247.6Unit Value 0.10 0.10 0.10 0.11 0.12 0.12 0.13 0.14 0.15
Other agricultural exportsValue 4/ 19.4 19.2 32.4 27.5 31.3 34.9 38.7 42.8 47.1
Mineral exports value 5/ 3.8 6.6 7.6 8.4 9.2 48.6 66.4 71.3 76.2Volume - -76 2. rnr - --Unit value 0.23 0.32 0.36 0.40 0.44 - - - -
Industrial exports value 142.5 196.0 307.5 368.o 398.5 441.1 499.7 576.3 672.0MeatValue 6/ 18.0 25.1 32.0 34.1 38.1 44.7 54.2 64.9 83.8Volun,e 15.4 17.3 2c . 19.4 20.4 21.4 22.5 23.6 24.8Unit value 1.17 1.45 1.73 1.76 1.87 2.09 2.09 2.75 3.38SugarValue 7/ 16.1 21.9 76,0 90.8 69.8 53.9 44.3 44.3 47.5Volume 91.2 126.2 132.5 139.1 160.o 160,.0 160.0 160.0 160.0Unit value 0.18 0.27 0.57 0.65 0.144 0.34 0.28 0.28 0.30
Other industrial exportsValue 8/ 108.4 149.0 199.5 243.1 290.6 342,5 401.2 467.1 540.7
TOTAL EXPORT VALUE 337.5 440.0 538,O 720.8 821. 912.21 1,018.0 1,116.7 1,258.7
1/ Assunes that volume dill grow at 2.4 percent per annum (Cimmodity Paper N 2, 2/'73) over the averageof 1971-72-73. Assumes the prices given in the IBRD Commodity Forecasts, November 6, 1974; adjusted
to F.O.B. Guatemala.
2/ Assumes a 5 percent annual growth in the area cultivated for 1974 and 1975, and 3 percent per annumfor 1976. Yield is expected to remain constant. Internal consumption is estimated at 45,000 bales in1974 and is expected to grow by 5,000 bales annually up to 1979. Price for 1974 is orojected at 71.1 centsper Kilogram, well below the world market, due to the fact that most of the crop was sold under futurecontracts. From 1975 onwards we use the IBRD commodity Forecasts, November 6, 1974; adjusted to F.O.B.Guatethala
3/ Assumes exports of 13 million boxes of 40 lbs. per annum hr 1974-1975, and an increase of 5 percent in1976. No changes afterwards, Assumes the prices given in the IBRD Commodity Forecasts, November 6, 1974adjusted to f.o.b. Guatemala.
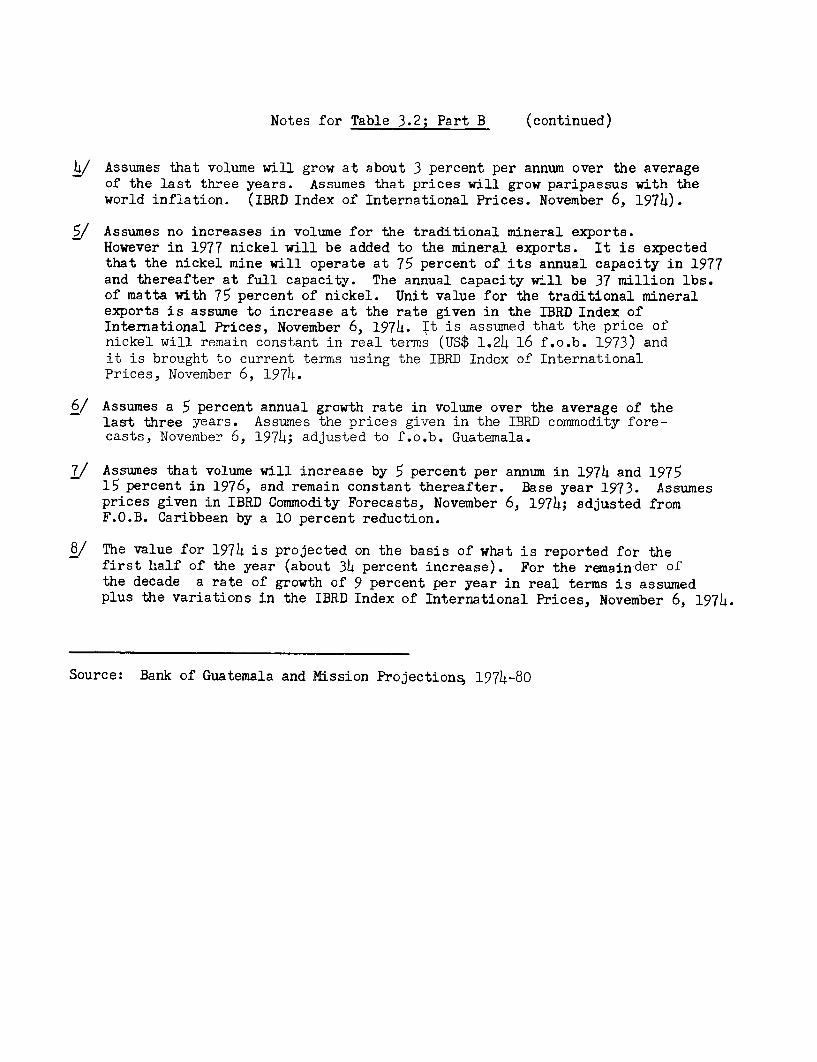
Notes for Table 3.2; Part B (continued)
4/ Assumes that volume will grow at about 3 percent per annum over the averageof the last three years. Assumes that prices will grow paripassus with theworld inflation. (IBRD Index of International Prices. November 6, 1974).
/ Assumes no increases in volume for the traditional mineral exports.However in 1977 nickel will be added to the mineral exports. It is expectedthat the nickel mine will operate at 75 percent of its annual capacity in 1977and thereafter at full capacity. The annual capacity will be 37 million lbs.of matta with 75 percent of nickel. Unit value for the traditional mineralexports is assume to increase at the rate given in the IBRD Index ofInternational Prices, November 6, 1974. Tt is assumed that the price ofnickel will remain constant in real terms (US$ 1.24 16 f.o.b. 1973) andit is brought to current terms using the IBRD Index of InternationalPrices, November 6, 1974.
6/ Assumes a 5 percent annual growth rate in volume over the average of thelast three years. Assumes the prices given in the IBRD commodity fore-casts, November 6, 1974; adjusted to f.o.b. Guatemala.
7/ Assumes that volume will increase by 5 percent per annum in 1974 and 197515 percent in 1976, and remain constant thereafter. Base year 1973. Assumesprices given in IBRD Commodity Forecasts, November 6, 1974; adjusted fromF.O.B. Caribbean by a 10 percent reduction.
8/ The value for 1974 is projected on the basis of what is reported for thefirst half of the year (about 34 percent increase). For the remainder ofthe decade a rate of growth of 9 percent per year in real terms is assumedplus the variations in the IBRD Index of International Prices, November 6, 1974.
Source: Bank of Guatemala and Mission Projections, 1974-80
Table 3.3: GUATEMALA - SUMMARY OF IMPORTS1961 through 1973 (preliminary)
(In millions of U.S. dollars)
1961 1962 1963 1964 1965 1966 1967 1968 1969 1970 1971 1972 1973
Total imports, c.i.f. 133.6 136.0 171.2 202.1 224.3 221.0 249.7 259.0 262.2 291.9 316.8 335.8 403.9
Consumer goods 45.9 44.0 59,7 60.2 73.5 67.1 74.0 77.9 78.7 87.7 89.4 91.4 107.7
Non-durables 32.2 30.9 37.9 37.2 49.5 43.7 51.1 52.5 54.2 60.2 60.3 61.8 73.6
Durables 13.7 13.1 21.8 23.0 24.0 23.4 22.9 25.4 24.5 27.5 29.1 29.6 34.1
Raw Naterials 41.3 42.2 47.4 59.3 78.3 78.1 93.6 96.7 93.9 108.3 113.8 123.2 153.7
Agriculture n.a n.a n.a 16.5 17.4 1407 15.6 14.6 n.a n.a n.a n.a n.a
Industry and mining n.a n.a n.a 42.8 60.9 63.4 78.0 82.1 n.a n.a n.a n.a n.a
Lubricants and fuels 12.5 11.8 13.9 15.4 13.8 13.3 14.2 8.3 11.9 14.9 18.1 24.8 33.2
Construction materials 5.8 7.7 6.5 11.5 11.5 12.0 12.2 15.8 17.8 18.5 16.2 14.7 22.6
Capital goods 27.8 29.5 37.5 49.7 42.9 46.0 49.6 57.9 57.3 61.4 74.3 76.6 85.8
Agriculture 5.8 6.0 6.1 7.3 7.8 6.9 5.5 6.8 5.5 5.7 6.6 8.3 9.1
Industry and Mining 16.1 18.2 21.1 30.1 26.5 29.1 32.5 37.2 38.3 42.9 42.8 49.1 55.0
Transportation and equipment 5.9 5.3 10.3 12.3 8.6 10.0 11.6 13.9 13.5 12.8 24.9 19.2 21.7
Unclassified 0.2 o.6 6.0 6.1 4.3 4.5 6.1 2.4 206 1.1 5.0 5.1 0.9
Source: Bank of Guatemala
Table 34- bGUATEMALA - TRADE WITH OTHER CENTRAL AMICAN COUNTRIES
1960 through 1973 (preliminary)
(In millions of U.S. dollars)
1960 1961 1962 1963 1964 1965 n 6 -19E7 1960 1969 1970 1971 ly, 1Z 0(
Exports, f,o.b. 4 8.5 8.7 17.3 29.6 35.7 5o.9 57.7 70.9 83.8 102.6 92.1 99.0 129.9
El Salvador 4.4 6.1 6.2 11.1 17.1 19.6 28.5 28.7 32.5 37.5 39.7 40.8 45.3 55.8Honduras 0.4 1.3 1.7 3.5 5.4 6.6 7.2 9.4 12.7 17.1 27.8 8.9 9.4 16.7Nicaragua - 0.3 0.7 2,3 4.4 5.2 7.9 10.6 11.3 12.3 14.9 16.7 17.6 26.8Costa Rica 0.1 0.8 0.1 0.4 2.7 4.3 7.3 9.0 14.4 16.9 20.2 25.7 26.7 30.6
ITports, c.i.f. 7.6 8.8 11.1 19.8 26.3 31.5 33.8 42.1 49.4 51.4 65.0 66. 68.9 84.6
El Salvador 5.9 6.8 7.6 16.2 19.1 22.4 23.5 29.3 30.8 33.3 39.5 42.5 45.8 52.1Honduras 0.9 1.2 3.0 2.7 3.6 3.8 1.9 5.4 7.1 6.o 7.1 1.8 1.3 3.2
Nicaragua - - 0.4 0.5 0.8 1.4 2.1 2.1 3.5 4.6 7.2 8.6 8.7 12.4Costa Rica 0.8 0.8 0.1 0.4 2.8 3.9 4.3 5.3 9.0 7.5 11.2 13.6 13.1 16.9
Trade balance -2.7 -0.3 - 2.4 -2.5 3.3 4.2 17.1 15.6 21.5 32.4 37.6 25.6 30.1 45.3
(Trade with other Central American countries an percentage of total trade)
Exports 4.2 7.5 7.2 11.2 17.5 18.6 22.3 28.3 30.4 31.9 34.5 32.1 29.3 29.5Imports 6.1 6.6 8.2 11.6 13.0 14.0 15.3 16.9 19.1 19.6 22.3 21.0 20.5 19.6
(Yearly growth rates)
Exports 73.5 2.4 98.9 71.1 20,6 42.6 13.4 22.9 18.2 22.4 -10.2 7.5 31.2Imports 15.8 26.1 78.4 32.8 19.8 7.3 24.6 17.3 4.0 26.5 2.3 3.6 22.8
Source: Bank of Guatemala.
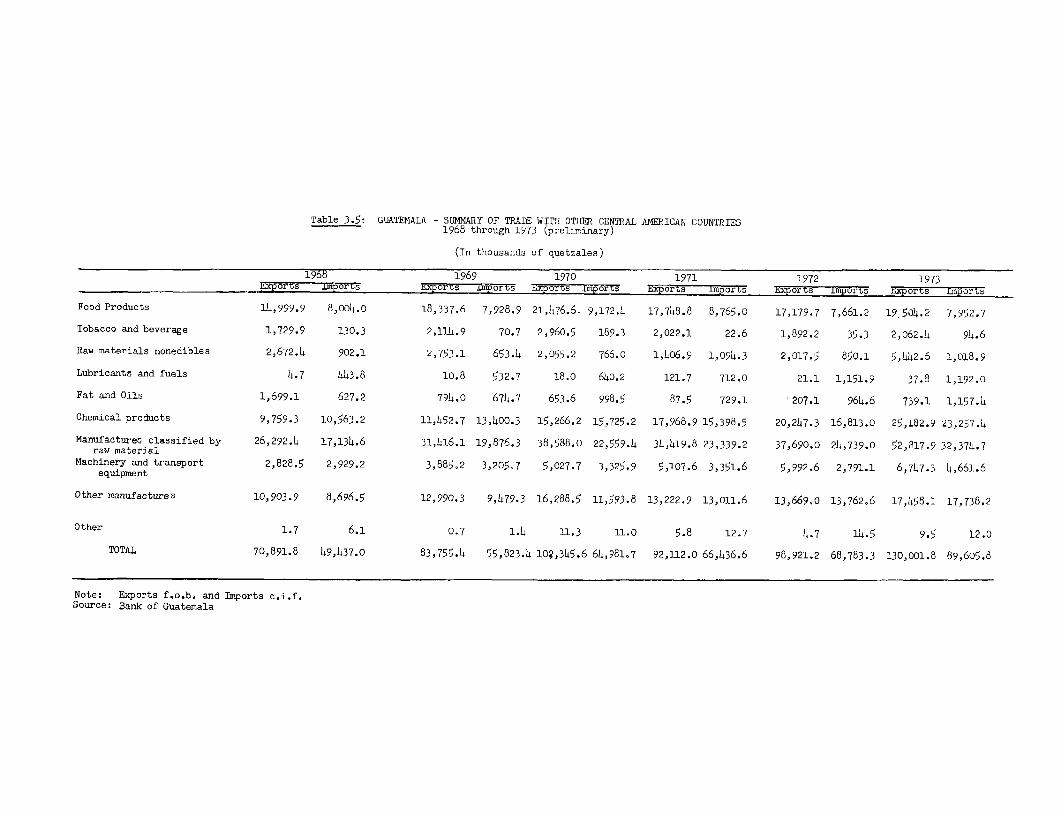
Table 3.5: GUATEMALA - SUMMARY OF TRADE WITH OTHER CENTRAL AMERICAN COUNTRIES1968 through 1573 (preliminary)
(In thousands of quetzales)
1968 1969 1970 1971 1972 1973Exports iMpors axporca imorts Exports Imports Exports lmports Exports impors Exports Imports
Food Products 14,999.9 8,oo4.o 18,337.6 7,928.9 21,476.6. 9,172.4 17,748.8 8,765.0 17,179.7 7,661.2 19 504.2 7,952.7
Tobacco and beverage 1,729.9 130.3 2,114.9 70.7 2,960.5 189.3 2,022.1 22.6 1,892.2 35.3 2,062.4 94.6
Raw materials nonedibles 2,672.4 902.1 2,753.1 653.4 2,055.2 766.o 1,406.9 1,094.3 2,017.5 850.1 5,442.6 1,018.9
Lubricants and fuels 4.7 443.8 10.8 532.7 18.0 640.2 121.7 712.0 21.1 1,151.9 37.8 1,192.0
Fat and Oils 1,699.1 627.2 794.0 674.7 653.6 998.5 87.5 729.1 '207.1 964.6 739.1 1,157.4
Chemical products 9,759.3 10,563.2 11,452.7 13,400.3 15,266.2 15,725.2 17,968.9 15,398.5 20,247.3 16,813.0 25,182.9 23,257.4
Manufactures classified by 26,292.4 17,134.6 31,416.1 19,876.3 38,588.0 22,559.4 34,419.8 23,339.2 37,690.0 24,739.0 52,817.9 32,374.7raw materialMachinery and transport 2,828.5 2,929.2 3,885.2 3,205.7 5,027.7 3,325.9 5,107.6 3,351.6 5,992.6 2,791.1 6,747.3 4,661.6equipment
Other manufactures 10,903.9 8,696.5 12,990.3 9,479.3 16,288.5 11,593.8 13,222.9 13,011.6 13,669,0 13,762.6 17,458.1 17,738.2
Other 1.7 6.1 0.7 1.4 11.3 11.0 5.8 12.7 4.7 14.5 9.5 12.0
TOTAL 70,891.8 49,437.0 83,755.4 55,823.4 10?,345.6 64,981.7 92,112.0 66,436.6 98,921.2 68,783.3 130,001.8 89,605.8
Note: Exports f.o.b. and Imports c.i.f.Source: Bank of Guatemala
TABLE 3.6: GUATEMALA - EXPORTS AND IMPORTS BY MAJORDESTINATION AND ORIGINS
1956, 1961, 1966,1971,1973 (preliminary)
(Percentages)
1956 1961 1966 1971 1973
EXPORTS, f.o.b. 100.0 100.0 100.0 100.0 100.0
United States 71.5 53.3 31.0 30.6 33.1
European Common Market 20.2 23.6 21.5 18.8 18.9(West Germany) (5.9) (17.6) (13.4) (10.7) (9.2)(Others) (11.3) (6.0) (8.1) (8.1) (9.7)
Other European Countries 3.7 6.4 9.3 7.2 5.2 /Central America 1.3 7.8 2205 32.5 29.5
(El Salvador) (1.2) (5.6) (12.6) ((14.4) (12.7)(Others) (0.1) (2.2) (9.9) (18.1) (16.8)
Japan 0.7 707 8.6 6.9 5.6
Others 2.6 1.2 7.1 4.0 7.7
IMPORTS, c.i..f. 100.0 100.0 100.0 100.0 100.0
United States 67.3 47.4 42.3 32.1 31.1
European Common Market 11.6 19.8 15.6 17.2 19.2(West Germany) (6.2) (11.0) (8.7) (10.3) (9-5)(Others) (5.4) (5.b) (6.9) (6.9) (9.7)
Other European Countries 6.3 5.1 8.5 5.8 3.9 j
Central America 1.2 6.7 16.3 22.4 20.8(El Salvador) (0.5) (5.1) (11-3) (14.0) (13.2)(Others) (0.7) (1.6) (5.0) (8.4) (7.6)
Japan 0.6 4.9 7.4 10.6 10.0
Others 13.0 13.1 9.9 8.9 15.0
2/ Excludes the United Kingdom, Ireland and Denmark.
So-urce: Bank of Guatemala.
Table 3.7: GUATEMALA - NJMiBER OF TOURISTS BY COUNTRY OF ORIGIN1965 through 1973
(In thousands of persons)
1965 1966 1967 1968 1969 1970 1971 1972 1973North America 46.6 49.3 6o.8 64.0 67.6 63.8 90.5 103,1 130.9Canada 1.2 1.6 1.7 2.2 2. 3 3.8Mexico 8.4 9.4 11.3 13.1 l1.6 13.3 20.5 22.2 26.0U S A 37.0 38.3 )17.8 48.7 50.6 48.o 66.6 77.1 99.9Central America 86.6 7103 88.4 84.2 81.0 81.3 104.4 193.9 214.2South America 4.5 5.5 6.2 7.0 8.4 8.4 11.4 13.5 15-7Europe 8.6 10.9 13.2 15.5 16.9 16,6 27.1 31.9 35.0Germany 3.0 2.6 TF -TW. TW -6W3 -T. ToFrance 1.4 105 1.7 2.1 2.3 2.6 4.3 5.6 6.3Italy 1.4 1.0 1.5 1.5 1,8 1.7 2.4 3.0 3.2Spain 2.0 1.7 2.3 2.3 2.4 2.4 4.8 4.4 4.9Switzerland 0.8 0.8 0.8 1.1 1.4 1.2 1.6 2.4 2.4Others n.a 3.3 3.5 4.5 4.6 4.9 7.7. 8.5 9.6Asia 1.2 0.9 1.0 1.2 1.0 0.7 3.1 3.0 4.2Antillas 1.0 0.9 0,8 1.2 1.4 0.9 1.5 1.6 1.7Others 5.0 0.5 1.2 105 1.9 2.0 0.8 1.1 1.9TOTAL '153.5 139.3 171.6 174,6 178.2 173.7 238.8 348.1 403.6annual change (%) - -9.3 23.2 1,7 2.1 -2.5 37.5 45.8 15.9
Source: Direccion General de Migracion and Guatemala Tourist Cormnission (INGUAT).
Table 4.1: GUATEMALA - EXTERNAL PUBLIC DEBT OUTSTANDING AS OF DECEMBER 31, 1973 1/
Debt Repayable in Foreign Currency
(In thousands of U.S. Dollars)
Source Debt OutstandingDecember 31, 1973
Disbursed Includingonly undisbursed
Privately held debt 261518 33,138Suppliers 6 6702 6,702
(Spain) ( 2,492 ( 2,492)(United Kingdom) (4,210 (4,210)
Financial Institutions 19,234 25,854(United Kingdom) ( 115) ( 115)(U.S.A.) (19,119) (25,739)
Privately placed bonds 582 582(Canada) ( 26) ( 26)(U.S.A.) ( 525) ( 525)(Multiple Lenders) ( 31) ( 31)
Loans from International Organizations 57 720 90,581IBRD 46,795IDB 4,245 5,503BCIE 2/ 26,414 38,283
Loans from Goverrnents 34,197 68,611U.S.A. 34,197 68-611
TOTAL EXTERNAL PUBLIC DEBT 118,435 192,330
1/ Debt with an original or extended maturity of over one year, unadjusted for thecurrency realignment.
2/ Central American Bank for Economic Integration.'Source: IBRD Debt Reporting System.
Table 4.2: GUATEMALA - EXTERNAL PUBLIC DEBT OUTSTANDING AND AVERAGE TERMS 1/Debt Repayable in Foreign Currency
1965 through 1973
1965 1966 1967 1968 1969 1970 1971 1972 1973
SiuppliersAmount (millions us$) 3.5 307 2.9 2.1 1.2 3.6 8.4 7.6 6.7Average Interest Rate (%) 6.ooo 5.788 5.736 5.650 5.577 7.187 7.134 7.157 7.186Average Grace Period (years) 0.9 1.3 1.4 1.6 1.7 2.1 1.1 1.1 1.1Average Maturity Period (years) 7.0 7.1 7.1 7.1 7.1 10.5 10.6 10.6 10.7
Private BanksAmount (million us$) 20.2 18.3 16.3 24.4 29.2 42.7 38.0 28.7 24.5Average interest Rate (%) 5.936 5.974 5.975 6.391 6.813 7.507 7.4 7.237 7.288Average Grace Period (years) 0.9 1.1 1.1 1.1 1.0 1.1 1.1 1.1 1.1Average Maturity Period (years) 12.6 13.4 14.1 12.4 10.7 10.1 10.8 12.5 12.4
Privately Placed BondsAmount (millions uS$) 12.9 17.0 30.7 30.6 22.3 13.8 7.4 0.7 o.6Average Interest Rage (%) 5.665 5.762 6.362 6.447 6.455 6.477 6.419 4.477 4.473Average Grace Period (years) 1.3 1.2 1.1 1.1 1.1 1.2 1.4 4.4 4.4Average Maturity Period (years) 6.7 6.6 5.5 5.5 5.6 5.8 6.1 14.0 14.0
Other Private Financial InstitutionsAmount (millions US$) 2.8 2.6 2.4 2.2 1.9 1.6 1.4Average Interest Rate (%) 7.500 7.500 7.500 7.500 7.500 7.500 7.500Average Grace Period (years) o.8 0.8 0.8 0.8 0.8 0.8 0.8Average Maturity Period (years) 10.3 10.3 10.3 10.3 10.3 10.3 10.3
International OrganizationsAmount (millionsUS$) 17.3 22.5 41.2 56.3 56.o 54.6 61.8 82.2 90.6Average Interest Rate (%) 5.147 4.988 5.407 5.646 5.756 5.767 5.864 6.064 6.138Average Grace Period (years) 3.8 4.4 4.2 4.9 4.9 5.0 4.9 4.9 4.8Average Maturity Period (years) 15.5 20.6 23.1 24.0 23.9 24.5 24.0 23.2 22,2
GovernmentsAmount (millions US$) 32.6 35.5 39.4 46.2 40.5 63.1 72.0 69.7 68.6Average Interest Rage (%) 4.455 4.361 4.388 3.993 3.719 2.496 2.016 1.928 1.554Average Grace Period (years) 4.2 4.7 4.9 6.1 6.6 8.5 9.1 9.3 9.9Average Maturity Period (years) 20.1 21.8 21.8 25.3 27.4 33.0 34.8 35.3 37.2
TOTALAmount (millions) 2/ 86.5 97.0 133.2 162.3 151.5 180.1 189.6 190.5 192.3Average Interest Rate (%) 5.182 5.13 5.446 5.445 5.545 5.137 4.797 4.777 4.690Average Grace Period (years) 2.8 3.2 3.2 3.9 4.0 4.9 5.4 5.8 6.oAverage Maturity Period (years) 114.9 16.7 17.0 18.8 19.3 22.2 24.0 25.4 25.8
1/ Includes the private debt with government guarantee. Debt with an original or extended maturityof over one year unadjusted for currency realignments reported as of end of period.
2/ Partials may not add because of rounding.
Source: IBRD Debt Reporting System
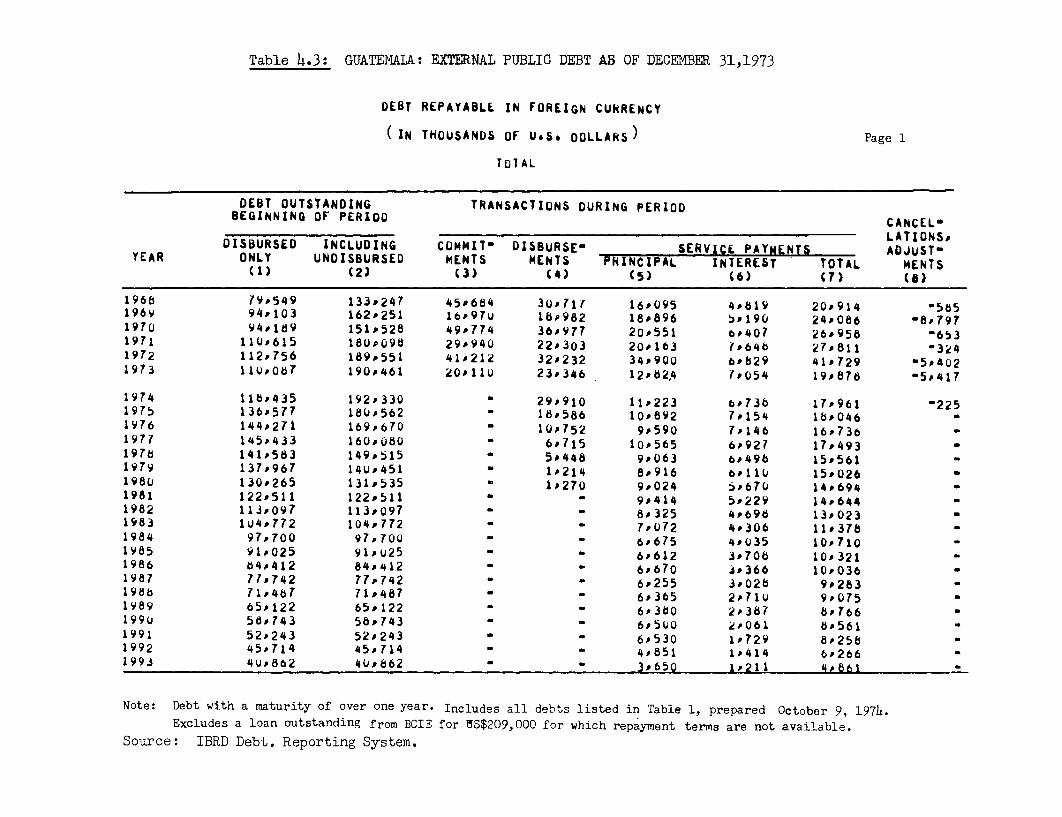
Table 4.3: GUATEMALA: EXTERNAL PUBLIC DEBT AB OF DECEMBER 31,1973
DEBT REPAYABLL IN FOREIGN CUkRENCY
(IN THOUSANDS OF U.S. DOLLARS) Page 1
Tol AL
DEBT OUTSTANDING TRANSACTIONS DURING PERIODBEGINNING OF PERIOD CANCEL-LATIONS*DISBURSED INCLUDING COMMIT- DISBURSE- SERVICE PAYMENTS ADJuST;
YEAR ONLY UNDISBURSED MENTS MENTS PRINCIPAL INTEREST TOTAL MENTS(1) (2) (3) (4) (s) (6) (7) (6)
1968 79.549 133P247 45.684 3U,717 16,095 4.819 20.914 5651969 94.103 162,251 16P97U 18,982 18.896 5.190 24.086 -8,7971970 94.189 151.528 49.774 36.977 20#551 6.407 26#958 6531971 110,615 180.09d 29.940 22P303 20,163 1.64b 27.811 -3241972 112,756 189P551 41.212 32.232 340900 6.829 41.729 O5p4021973 11U,OB7 190,461 20.110 23.346 12.82,4 71054 19.878 -5*417
1974 11b.435 192,330 - 29.910 11,223 6.736 17.961 *2251975 136.577 18U.562 - 18.586 10.892 7.154 18.046 -1976 144,271 169P670 - 10.752 9.590 7.146 16.736 -1977 145J433 160.080 - 6J715 10.565 6.927 17.4931978 141.583 149.515 5.448 9.063 6.49b 15.561 -1979 137J967 14UJ451 - 1,214 8.916 o6110 15.O26 -1980 130.265 131#535 1.270 9#024 5,670 149694 -1981 122.511 122.511 - - 9,414 5.229 14J6441982 113i097 113.O97 8*325 4.698 13.0231983 1U4.772 104.772 - - 7,072 4.306 11.378 -1984 97,700 97,700 - - 6.675 4.035 10.710 -1985 91,025 910U25 6J612 3.706 10.321 -1986 b4.412 84 412 - 6,670 3.366 10j036 -1987 77.742 77,742 6,255 3.028 9.283198B 71,487 71.487 - 6#365 2.71U 9.0751989 65J122 65.122 - - 6.30 2. 387 8Z766 -1990 58.743 58P743 6.500 2*061 8.561 -1991 52,243 52.243 - - 6.530 1.729 8.o258 -1992 45o714 45.714 - - 4,851 1.414 6.2661993 4U,862 40.862 - 3.650 1.211 4P861 -
Note: Debt with a maturity of over one year. Includes all debts listed in Table 1, prepared October 9, 197l.Excludes a loan outstanding from BCIE for 1S$209,000 for which repayment terms are not available.
Source: IBRD Debt. Reporting System.
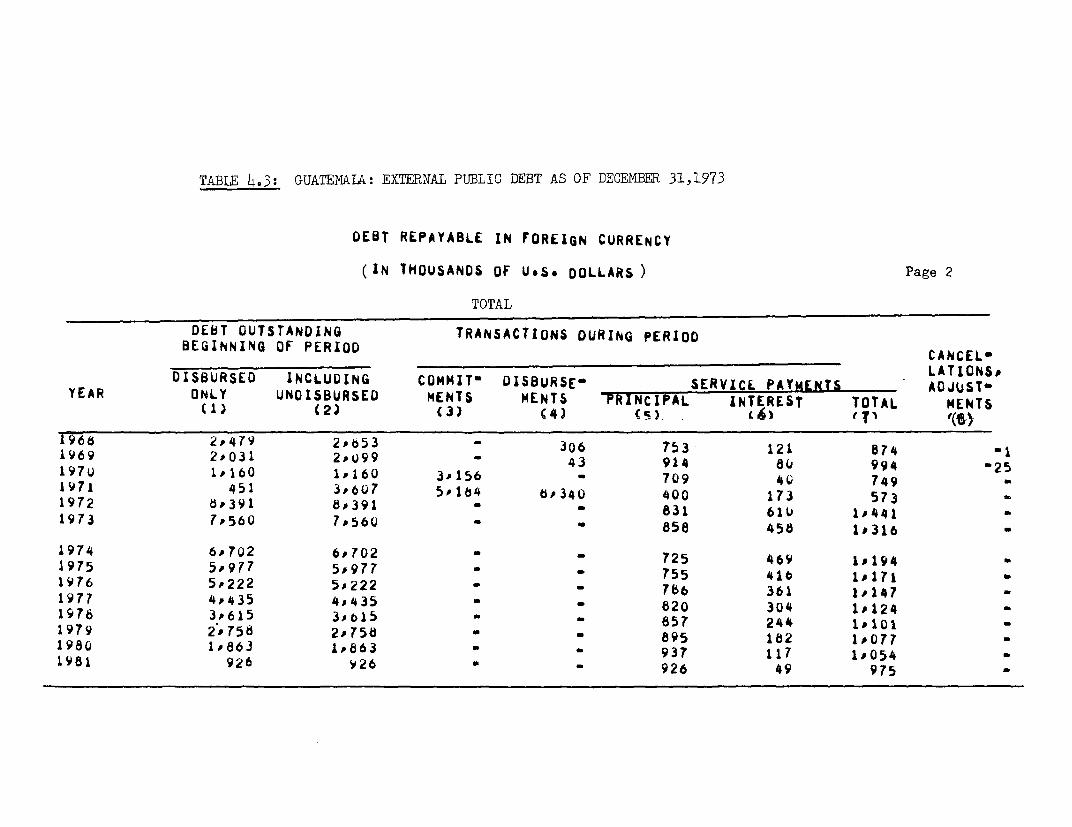
TABLE 4.3: GUATEMALA: EXTERNAL PUBLIC DEBT AS OF DECEMBER 31,1973
DEBT REPAYABLE IN FOREIGN CURRENCY
(IN THOUSANDS OF U.S. DOLLARS ) Page 2
TOTAL
DEBT OUTSTANDING TRANSACTIONS DURING PERIODBEGINNING OF PERIOD CANCELS
DISBURSED INCLUUING COMMIT" DISBURSE- SERVICE PAYMENTS LATIONSYEAR ONLY UNDISBURSED MENTS MENTS PRINCIPAL INTEREST TOTAL MENTS(1) (2) (3) (4) (s) (b) ' T' "(O196B 2J479 2,653 - 306 753 121 874 -11969 2,031 2,U99 - 43 914 au 994 -25197u 1,160 1,160 3'156 - 709 40 7491971 451 3,'6o7 5J1b4 8,340 400 173 5731972 8,391 8,391 - 831 610 1'4411973 7,560 7,56U - 858 458 1i3161974 6,702 6,702 725 469 1'1941975 5,977 5,977 -755 410 IP1711976 5o222 5,222 766 361 1.1471977 4,435 4,o435 8 - 620 304 1'124 -1976 3,615 3,015 - 857 244 1,101 -1979 2,75B 2,75d 895 182 1*077 -1981 92863 1,863 937 117 1,0541981 926 926 9 - 926 49 975 -
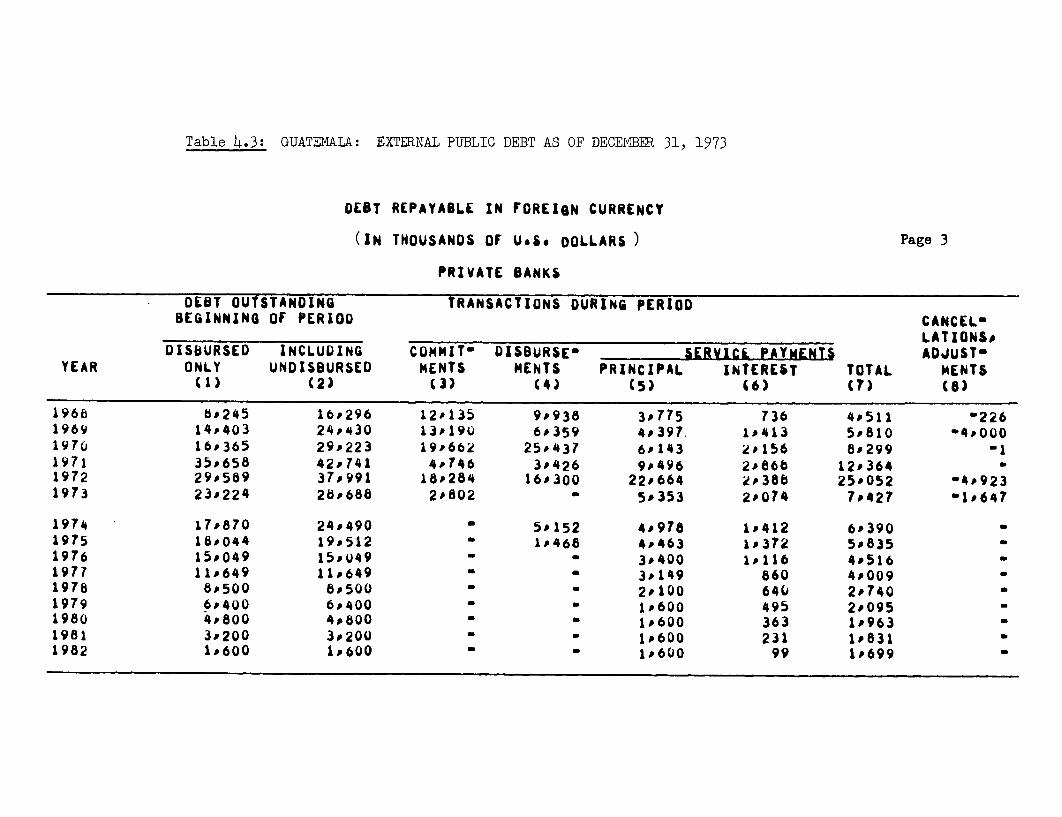
Table 4.3: GUATEMALA: EXTERNAL PUBLIC DEBT AS OF DECEMD1BER 31, 1973
DEBT REPAYABLE IN FOREIGN CURRENCY
(IN THOUSANDS OF U.S. DOLLARS) Page 3
PRIVATE BANKS
DEBT OUTSTANDING TRANSACTIONS DURING PERIODBEGINNING OF PERIOD CANCEL-
____ ____ ____ ____ ____ ____ ____ ____ ____ ___LATIONS *
DISBURSED INCLUDING COMMITO DISBURSES SERVICL PAYMENTS ADJUSTOYEAR ONLY UNDISBURSED MENTS MENTS PRINCIPAL INTEREST TOTAL MENTS
(1) (2) (3) (4) CS) (6) (7) (6)
1968 8b245 16P296 12'135 9,938 3,775 736 40511 2261969 14,403 24P430 13#190 6#359 4o397. 1,413 5'810 4*0001970 16P365 29o223 19'662 25,437 6*143 2#156 8#299 11971 35,658 42*741 4,746 30426 9J496 2#86b 12'3641972 29#589 37,991 18i284 16*300 22p664 2#388 25#052 -4p9231973 23,224 28688 2#802 a 5*353 2,074 7#427 -1*647
1974 17#870 24P490 5'152 4,978 1#412 6#3901975 18,044 19,512 - 1P468 4J463 1#372 5P835 -1976 15o049 15jo49 - 3#400 1#116 4#5161977 11,649 11J649 - 3,149 860 400091978 8P500 8500 2R10O 640 2#7401979 6P400 6,400 1,600 495 2s095 -1980 4#800 4,800 1P600 363 1J9631981 3J200 3,200 1600 231 1J8311982 1#600 1,6OO - 1,600 99 1J699
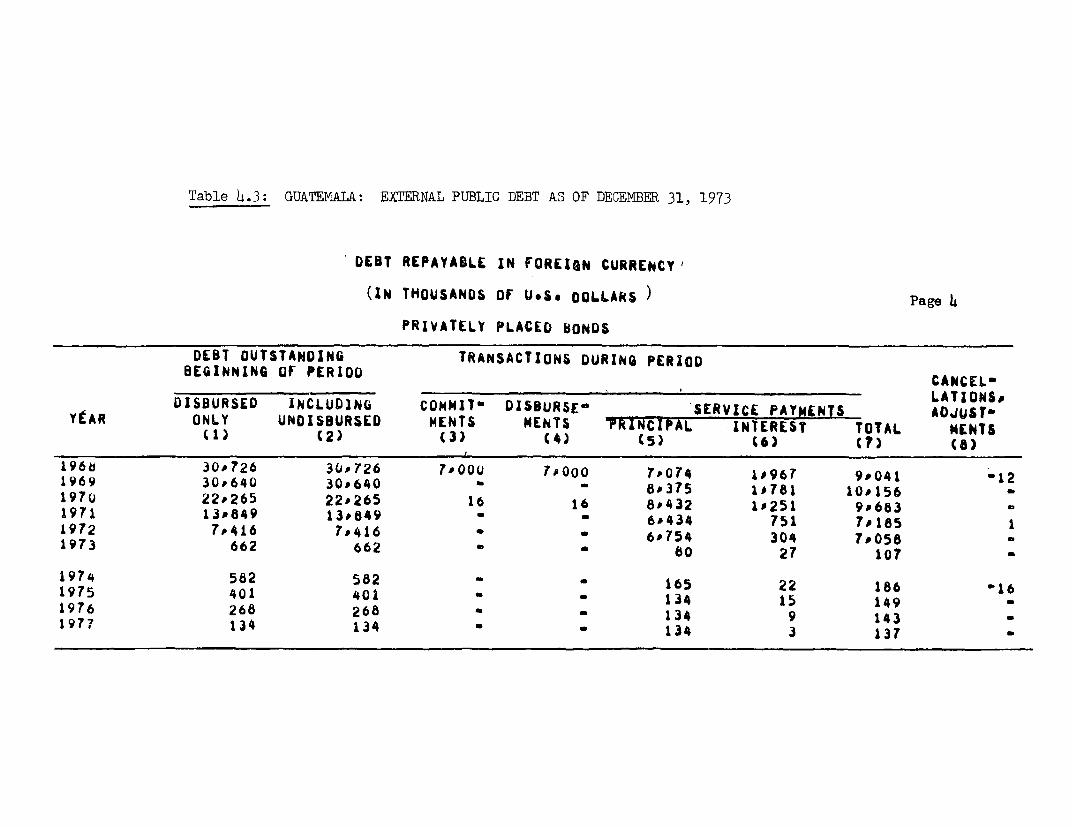
Table 4.3: GUATEMALA: EXTERNAL PUBLIC DEBT AS OF DECEMBER 31, 1973
DEST REPAYABLE IN FOREIGN CURRENCY'
(IN THOUSANDS OF U.S. OOLLAkS ) Page 4gPRIVATELY PLACED BONDS
DEBT OUTSTANDING TRANSACTIONS DURING PERIODBEGINNING OF PERIOD CANCEL-
LATIONS*DISBURSED INCLUDING COMMIT" DISBURSE- SERVICE PAYMENTS ADJuJSTYEAR ONLY UNDISBURSED MENTS MENTS ?RINCIPAL INTEREST TOTAL MENTS(1) (2) (3) C4) (s) (6) C?) Ca)
196b 30*726 30#726 7#000 7pOoo 70074 11967 9.041 121969 30P640 30.640 - 8.375 11761 10#156197% 22.265 22J265 16 16 8.432 1.251 9.68.31971 13.849 13.849 ' 6#434 751 7J1851972 7P416 7.416 a 6*754 304 7.05B1973 662 662 U 60 27 107
1974 582 582 - 165 22 186 n161975 401 401 * 134 15 149 -1976 268 268 a 134 9 1431977 134 134 - 134 3 137
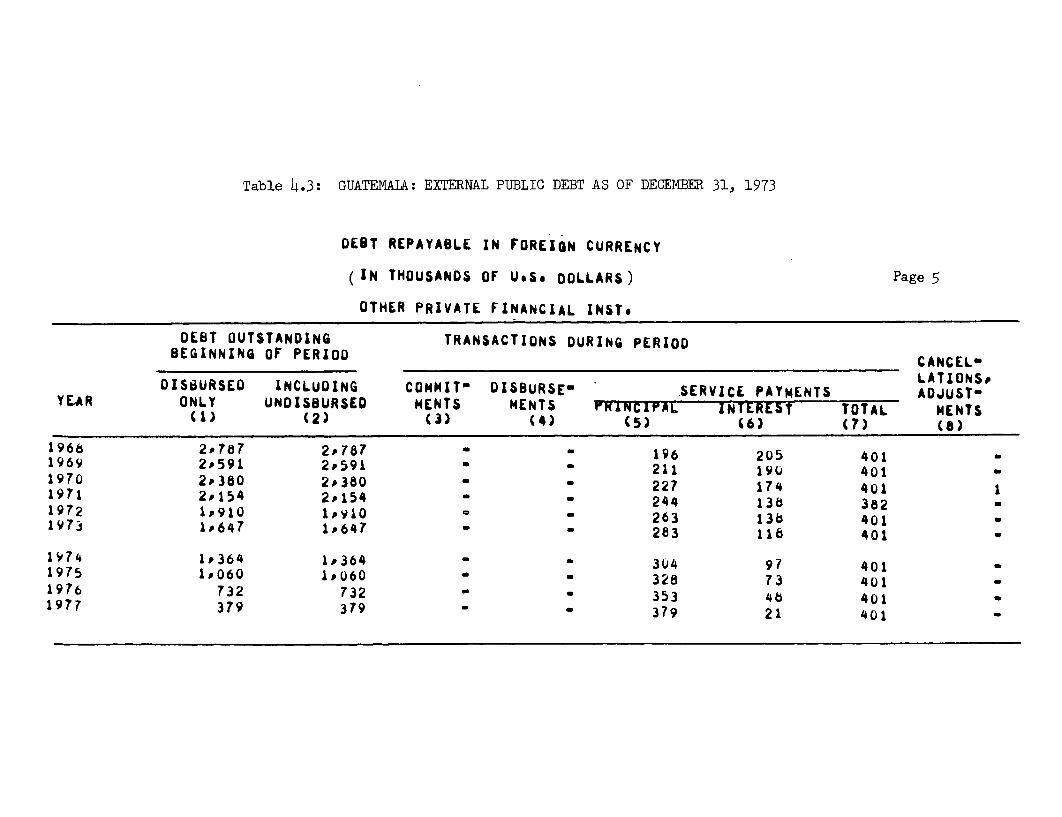
Table 4.3: GUATEMALA: EXTERNAL PUBLIC DEBT AS OF DECEMIBER 31, 1973
DEBT REPAYABLE IN FOREIGN CURRENCY
(IN THOUSANDS OF U.Se DOLLARS) Page 5
OTHER PRIVATE FINANCIAL INST.
DEBT OUTSTANDING TRANSACTIONS DURING PERIODBEGINNING OF PERIOD CANCELSLATIONS,DIS8URSED INCLUDING CONMIT" DISBURSE- SERVICE PAYmENTS ADJUST-YEAR ONLY UNDISBURSED MENTS MENTS rNLNCIPAL INTEREST TOTAL MENTS(1) (2) (3) (4) (5) (6) (7) (8)
1966 2,787 2P787 ' - 196 205 4011969 2P591 2P591 ' - 211 190 4011970 2P380 2#380 ' - 227 174 4011971 2#154 2o154 ' - 244 138 3821972 1,910 1,Y1O X 263 138 4011973 1,647 1*647 - - 283 116 401 -
1974 1,364 1I364 - * 304 97 4011975 1,060 1I060 ' 328 73 401 -1976 732 732 ' - 353 48 4011977 379 379 - 379 21 401
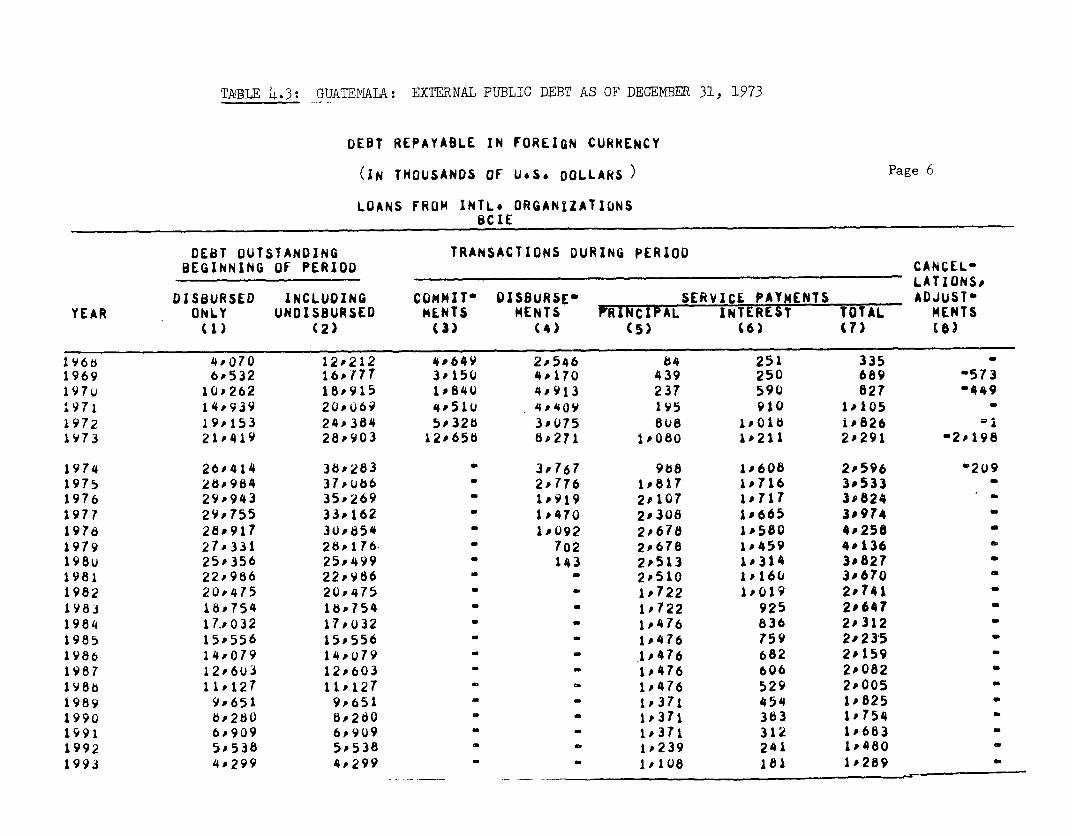
TABLE 4.3: GUATEMALA: EXTERNAL PUBLIC DEBT AS OF DECEMBER 31, 1973
DEBT REPAYABLE IN FOREIGN CURRENCY
(IN THOUSANDS OF U.S. DOLLARS ) Page 6
LOANS FROM INTL. ORGANIZATIONSBCIE
DEBT OUTSTANDING TRANSACTIONS DURING PERIODBEGINNING OF PERIOD CANCEL-
LATIONS.DISBURSED INCLUDING COMNITa DISBURSE SERVICE PAYMENTS ADJUST-YEAR ONLY UNDISBURSED MENTS MENTS FRUNCIPAL INTEREST TOTAL MENTS
(1) (2) (3) (4) (5) (6) (7) (a
IY66 4,070 12.212 4C649 2.546 84 251 3351969 6,532 16,777 3.150 4,170 439 250 689 573197u 10,262 18P915 1.840 4.913 237 590 827 '4491971 14.939 20.069 4.510 4,.409 195 910 1,1051972 19P153 24.384 5.J32 3, 75 808 1,016 .i8261973 21,419 28,903 12P656 68271 1,080 1.211 2.291 -2,198
1974 26.414 38,283 3,767 988 1J608 2.596 @2091975 28.984 37,0u6 2,776 1J817 1J716 3.533 -1976 29'943 35,269 1919 2,1o7 1,717 3.8241977 29P755 33.162 * 1*470 2,308 1.665 3P9741976 28.917 30,854 - 1.092 2,678 1.580 4.2581979 27,331 28,176 - 702 2,678 1,459 4.136198o 25,356 25,499 143 2.513 1,314 3P8271981 22.986 22,986 2,510 1P160 3#6701982 20,475 20,475 - _ 1,722 1.019 2.7411983 18,754 16.754 1,,722 925 2.6471984 17.P032 17,U32 ' 1,476 836 2.312 -1985 15,556 15,556 - .1476 759 2P2351986 14,.079 14,0Q79 - . 1,476 682 29159 -1987 12.603 12,603 - 1,476 606 2.0821986 11,127 11,127 1J.476 529 2.0051989 9.651 9,651 _ 1J371 454 1J825 -1990 6.280 8,280 a 1,371 383 1J7541991 66909 6-9U9 m 1,371 312 1.683 -1992 5,538 5,538 - 1,.239 241 1J4801993 4.299 4,299 - - 1.108 181 1.289 a
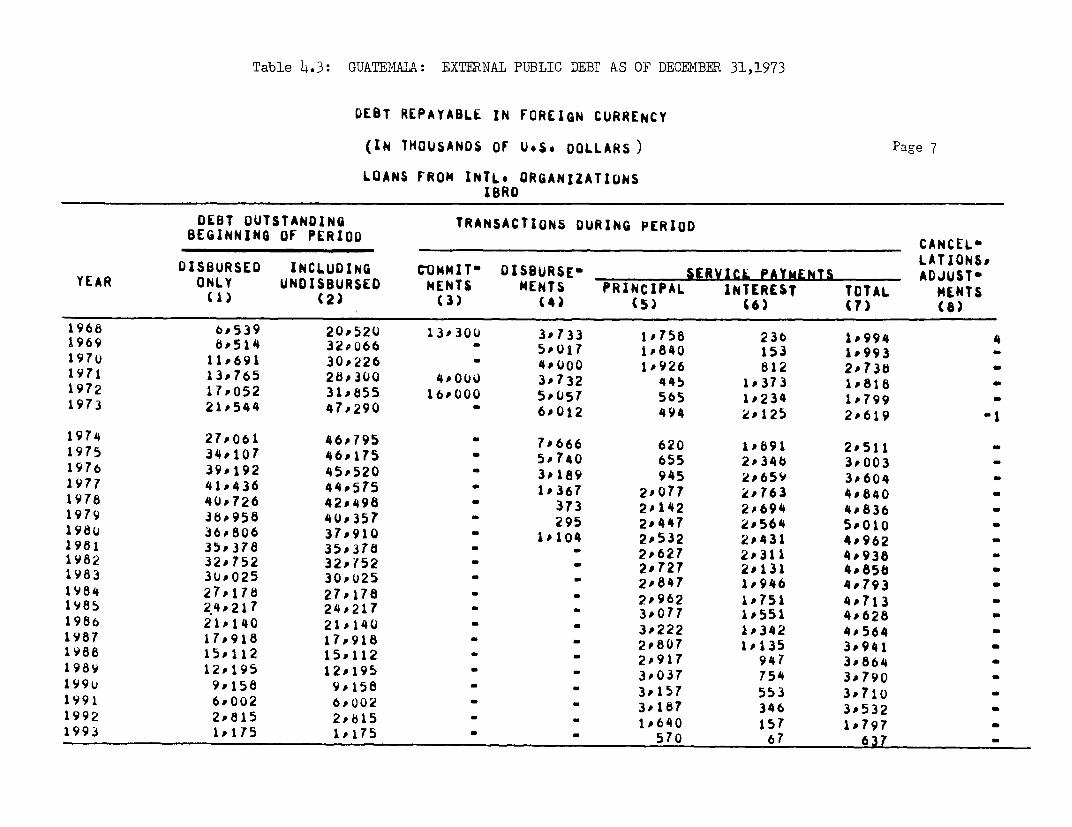
Table 4.3: GUATEMAIA: EXTERNAL PUBLIC DEBT AS OF DECEIBER 31,1973
DEBT REPAYABLE IN FOREIGN CURRENCY
(IN THOUSANDS OF U.S. DOLLARS) Page 7
LOANS FROM INTL. ORGANIZATIUNSIBRD
DEBT OUTSTANDING TRANSACTIoNs DURING PERIODBEGINNING OF PERIOU CANCEL'
LATIONS,DISBURSED INCLUDING CONMITO DISBURSE' SERVICL PAYMENTS ADJUSTO
YEAR ONLY UNDISBURSED MENTS NENTS PRINCIPAL INTEREST TOTAL MENTS(1) (2) (3) (4) (5) W6) (C) (a)
1968 6,539 20*52U 13P30U 3,?33 1,758 236 1'994 41969 8'514 32j066 - 5,017 1,840 153 1'9931970 1 *691 30*226 - 4,000 1*926 812 2 73b1971 13*765 2 ,300 4'O0. 3'732 445 1,373 1'8181972 17PO52 31*855 16poo0 5,O57 565 1,234 1'7991973 21*544 47o290 - 6,012 494 2'125 2P619
1974 27,061 46P795 70666 620 1,891 2P5111975 34,107 46,175 5,740 655 2'34b 3'0031976 39,192 45'520 3#189 945 2,659 3#6041977 41.436 44,575 10367 2,077 2,763 4D8401978 40,726 42#498 373 2P142 2,694 4v8361979 36,958 4u,357 a 295 2,447 2,564 5'0101980 36#806 37,910 . 10104 2#532 2,431 4,9621981 35,378 3537T8 - 2*627 2.311 4,9381982 32#752 32P752 a 2F727 2#131 4*8561983 3UP025 30,025 - 2,847 1I946 4,7931984 27,178 27,178 - 2,962 1'751 4,7131985 24,217 24,217 _ 3,077 1'551 4*6281986 21 140 21i140 - 3o222 1J342 4 5641987 17,918 17,918 - 2 807 1'135 3'9411988 15P112 15o112 - . 2,917 947 3'8641989 12^ 195 12 195 3 - 3 037 754 3?790 g199u 9w158 9P158 - - 39157 553 3i7101991 6 002 6, 002 3 - 3 87 346 3 5321992 2P815 2,815 -1640 157 1-7971993 1,175 1,175 -50 67 637
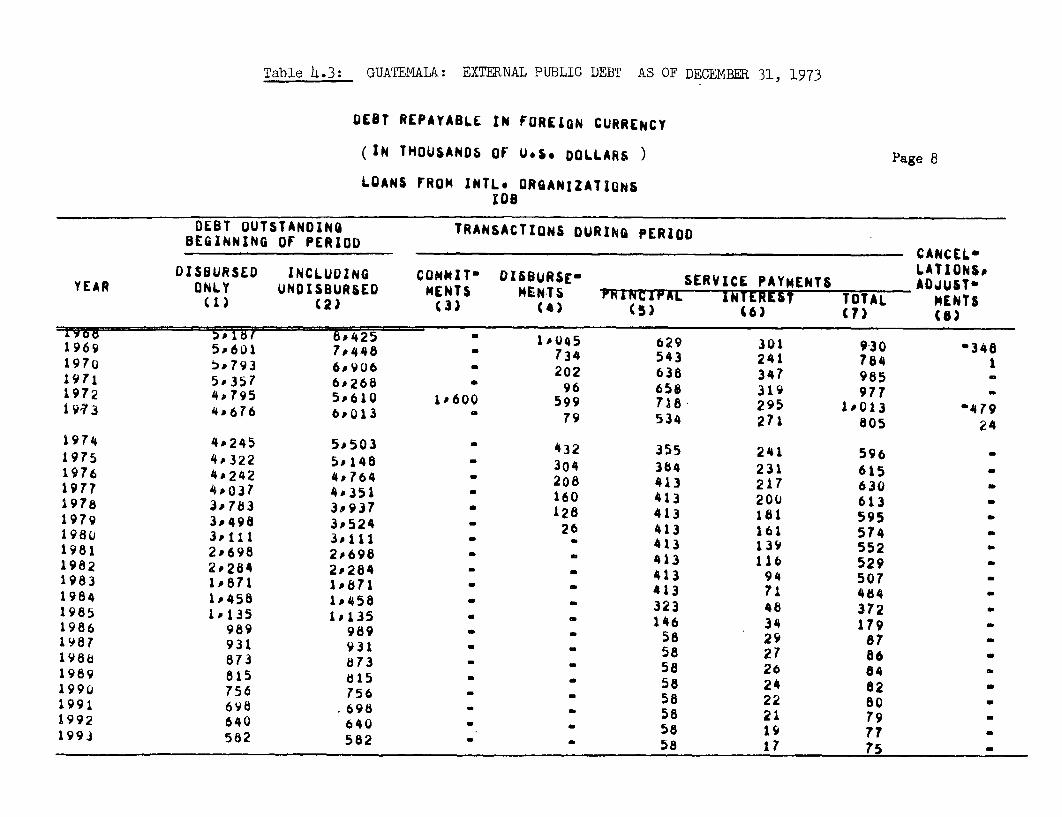
Table 4.3: GUATEMALA: EXTERNAL PUBLIC DEBT AS OF DECEMBER 31, 1973
DEBT REPAYABLE IN FOREIGN CURRENCY
(IN THOUSANDS OF U.S. DOLLARS ) Page 8
LOANS FROM INTL. ORGANIZATIONSIDS
DEBT OUTSTANDING TRANSACTIONS DURING PERIODBEGINNING OF PERIOD . CANCEL-LATIONS,DISBURSED INCLUDING COMMZT- DISBURSE- SERVICE PAYMENTS ADJUSTYEAR ONLY UNDISBURSED MENTS MENTS PFNNCirAL INTEREST TOTAL MENTS(1) (2) (3) ~~~~~~~(4) (s) (6) CT) CO)
1969 5.06ul#425 ' 1D045 629 301 9-30 -3481969 59601 7,448 - 734 543 241 784 11971 5,793 6i906' 202 638 347 985 -1971 5.357 6,268 * 96 658 319 9771972 4.795 5.610 1'600 599 718 295 1'0l3 47919?3 4,676 6,013 # 79 534 211 805 241974 4#245 5,503 r 432 355 241 596 -1975 4--322 5,148 - 304 384 231 615 -1976 4#242 4.764 - 208 413 217 630 U1977 4,037 4.351 160 413 200 613 U1978 3.783 3,937 126 413 1B1 595 01979 3.498 3P524 1 26 413 161 574 -198u 3.111 3.111 U U 413 139 5521981 2.698 2O698 - 413 110 529 U1982 2.284 2.284 413 94 5071983 1.871 1I871 - - 413 71 4841984 1,458 1.458 1 323 48 3721985 1.135 1.135 3 146 34 179 1986 989 989 1 - 58 29 87 -1987 931 931 U U 58 27 86 -1988 873 u03 U U 58 27 841989 815 d15 58 24 821990 756 756 - U 58 22 801991 698 .698 U - 58 21 791992 640 640 U - 58 19 771993 582 582 - _ 58 17 75 -
5 8 17 7 5~~~~~~~~
Table 4.3: GUATEMALA: EXTERNAL PUBLIC DEBT AS OF DECEMBER 31, 1973
DEBT REPAYABLE IN FOREIGN CURRENCY
(IN THOUSANDS OF U.s. DOLLARS) Page 9
LOANS FROM INTL. ORGANIZATIONS
DEBT OUTSTANDING TRANSACTIONS DURING PERIODBEGINNING OF PERIOD CANCEL"
LATIONS.DISBURSED INCLUDING COMMIT- DISBURSEb SERVICE PAYLENTS ADJUSTYEAR ONLY UNDISBURSED NENTS MENTS PRINCIPAL INTEREST TOTAL NENTS
(1) (2) (3) (4) (S) (6) (T) (8)
1968 15.796 41.157 17.949 70324 2.471 78b 3.259 :3441969 20J647 56J291 3.150 9.921 2J822 644 3#466 5721970 27J746 56.047 10840 9J115 2.801 1J749 4#550 -4491971 34J061 54J637 8.51u 8J237 129B8 2J602 3J90019,72 41#000 61#849 22J928 84J31 2J091 2.547 4.638 4801973 47J639 82.206 12.658 14.362 2J108 3J607 5.715 2J175
1974 5rJ720 90581 11865 1.*963 3J741 5J704 2091975 67J413 88J409 BJ620 2.857 4J295 701511976 73J377 85J553 ' 5*316 3.465 4J592 8057 -1977 75J228 82.088 ' 2J997 4.798 4.626 9.426 -1978 73.427 77.290 1J593 5.232 4.455 9J688 -1979 69.787 72.057 - 1.023 5.537 4J183 9J7211980 65J273 66.520- 1J247 5.458 3J883 9J341 a1981 61,062 61J062 ' - 5.550 3.588 9J138 -1982 55.511 55,511 - 4JB62 J5244 8,106 11983 50.650 50.650 - 4,982 2J942 792401984 45.668 45.668 - 4Jt61 2,636 7#392 41985 40.907 40,907 - - 47699 26344 730421986 36.208 36P208 a a 4.756 2.054 6J810 -1987 31.452 31J452 a 4J341 12r6B 6.109 -1988 27,111 27,111 - a 4.451 16502 569541989 229660 22#660 . 4,466 15232 5.697 -1990 18.195 18.195 46586 95B 5569 71991 13.609 13#609 - 4.616 67b 5J2941992 85993 86993 - a 2.938 416 3.3541993 6J056 6.056 - a 1,736 265 2.001
Table 4X.3: GUATEMALA: EXTERNAL PUBLIC DEBT AS OF DECEMBER 31, 1973
DEBT REPAYABLL IN FOREIGN CURRENCY
IN THOUSANDS OF U.S. DOLLAkS Page 10
LOANS FROM GOVERNMENTS
DLBT OUTSTANDING TRANSACTIONS DURING PERIODBEGINNING OF PERIOU CANCELL
LAT IONS,DISbURSED INCLUDING COMMIT DISBURSE- SERVICE PAYMENTS ADJUSTYEAR ONLY UNDISBURSED MENTS MENTS PRINCIPAL INTEREST TOTAL MENTS(1) (2) (3) (4) (5) (6) (7) (81
1968 19,516 39,428 8,6UU 6,149 1,826 1IU 0 2P828 '21969 23,791 46,2U0 630 2,059 2,177 1'ub2 3,259 4#2UO197U 24,273 40,453 25P100 2,409 2,239 1,037 3,270 2u41971 24,442 o3s110 11F50D 2,3OU 2,291 1,110 3,407 3251972 24,450 71,994 - 7,201 2,297 842 3#139 11973 29,355 69,698 4,650 8P984 4'142 770 4,912 -1,595
1974 34,197 686i11 - 12,C93 3,088 999 4,O86 -1975 43,663 65,204 -#298 2,357 982 3,339 -197c 49,624 62,847 5,430 1,452 1oU20 2,472 -1977 53,608 61,395 - 3,718 1,2b5 1i112 2,396 -1976 50,041 60,110 I 3,855 674 1.159 2,033 31979 59,022 59,236 191 8b3 1l25U 2.133 -198u 58,330 58P353 - 23 1.029 1,3/7 2,336 -1981 57,324 57,324 - 1,338- 1.361 2#700 -1982 55,985 55,985 - - 1,863 1#355 321b-1983 54,122 54,122 - 2,090 1,364 3,454 -1984 52.032 52.032 - 1,914 1.400 3#3141985 50,118 50,118 - - 1,914 1,365 3,27B1986o 48,2U4 48o204 - - 1,914 1.312 3,226 -1987{ 40,290 46,290 - - 1914 1,260 3.174198b 4 4,- 317 6 44,376 - 1,914 1,20C 3.12 -198v 4Z2462 42,462 - - 1914 1.155 3,069 -1990 40,548 40.546 - - 1,914 1,103 3.017 _1991 38,635 3).635 - . 1,914 1,051 2,9051992 36,721 36,721 - - 1.914 99b 2J912 -1993 34,807 34,807 - - 1,914 940 2,860
EXTERNAL DEBT DIVISIONECONOMIC ANALYSIS & PROJECTIONS DEPARTMENT
OCTOBER 9, 1974
Table 4.4: GUATEMALA - EXTERNAL PUBLIC DEBT OUTSTANDING AS OF DECEMBER 31,1973
DEBT REPAYABLE IN LOCAL CURRENCY
(IN THOUSANDS OF U.S. DOLLARS)
DEBT OUTSTANDING DECEMBER 31, 1973SOURCE UNDIS-
DISBURSED BURSED TOTAL
BCIE 5,997 1,384 7,381
IDB 48,702 21,378 70,080
LOANS FROM INTL. ORGANIZATIONS 54,699 22,762 77,461
TOTAL EXTERNAL PUBLIC DEBT 54,699 22,762 77,461
Note: Debt with a maturity of over one year.
Source: IBRD Debt Reporting System.
Table 4.5: GUATEMALA: EXTERNAL PUBLIC DEBT AS OF DECEMBER 31, 1973
nEsT REPAYARLE IN LOCAL CURRLNLY
IN THOUSANDS OF U.S. DOLLARS Page
TOTAL
nFPT flITSTANnTNG TRANSACTIONS DURING PERIOUPrGTNFrlAJlG OF PFPIOD CANCEL-
_ _ _ _ _ _ _ _ _ _ _ _ _ _ _ _ _ _ _ _ _ _ _ _ _ _ _ _ _ _ _ _ _ _ _ _ _ _ _ _ _ _ _ L A T I O N A ,ntSR(iPs'n INrl (IDING CC4MI'TT DISHURSE SEftYICC PAYMENTS ADJUST-YFAR nNNIY UNOTSRURSEO MENTS MENTS PIIPA INTER5TT TTAL MENTS(1) (2) (3) (4) (5) (6) CT) (B3
I 0.0 1nsAwl "~9 # 1 7.6 i 1 8 4,3Q9 AP3 423 9 06ii^ 1Q,q O lip l,000 ,264 553 542 1,095 -107 0 n,0!Q .A994 19,Q60 10P?33 947 (42 1i689 -1Q71 74,0(:V 70, 004 7,8i0 8,,915 1,l040 1,2u9 ?9*i449 -9, soI1Q7e 7, tf 4 9,7,7iU 1 ?PU YJ3U5 1J574 I,4?,I 3'O5' T1I c7 3 1ih 0 1 A h I.*27A 1 384 91 fw U 1,9 4 3 1 . ( k 3--725 ' 7 9
IQ71J ;4 AQQ 77,461 7, 051 30 77 ,444 ?.'?to7z; SPPA79 74,3844 6,09? 3,29( 1.66I 4#95AIi7 A St 'a 7'; 71 1 A8 4,a54 3,395 1,b45 5p 2i1tQ77 Ah,1t4 A70692 3,#17n 3p4i 1.Jb33 5f3141 97P A 1 , 7/1 h 4 . 2 211 1, 3 6 9 34 9A 19 7PR0 5P2761170 "44ihb0 6UD715 - ,0t41 3,459 1,695 St1541qPOn -;7,9?A 287fi?5 ; 3,4(6 1,599 5,074IqR1 5'I7 I0 767,3 ) -7 3,49 1 ,49l 4,9S -1QP2 EO,pKA 'O. 28t - - 3,490 1.3a3 4* i73 -1I83 4F, 7T LiAh79A ' - 3,'4d7 1,274 4.761 -t gPli it 'A'Q h3, 30i - 3,732 1,264 4,996I VP ̂, 3 I; 17 I YP 77 - 3,357 1115U 4.507 -I QRA 3 ') I p I A 2 -Q 3 fi3(3 10 47 4 J4201OP7 , pL$ 1; - - 3, 31i9 944 4, 333IOPA 9Q#a;7 79945Zi? 3,4(17 bW.O *1,247 -1 QP p 0 9 7fi,(J4s -6 3,051 737 3'78691000 2)PQ°)P 9?299Q8 - 2,931 645 3P577 -1qa1 7,A'. 7 910067 - 2,949 554 350 31Q@92 17,l t17.I1M - - 2r551 463 3P014'1Q93 '1 4p,.A7 1 A1,67 - - 2 0 1 3 86 2,470 0
Note: Debt with a maturity of over one year. Includes all debts listed in Table 1, prepared October 9, 1974.

Table 4.5: GUATEMALA: EXITERIAL PUBIC DEBT AS OF DECEMBER 31, 1973
DEBT REPAYPRLE IN LOCAL CURRLNCY
IN THOUSANDS OF U&Sa nOLLARS Page 2
LOANS FROP INTL. ORGANIZATIONSBCIE
nFPT 01(TSTANnTNG TRANSACTIONS DURING PERIODAFGT?NNING OF PFRIOD CANCELOLAT 1ONsp.nfTSiIRSEFn INCI IIDING COUNITT DISBURSE- SERVICE PAYMENTS ADJUST-YFAP nNl Y UNOYTRURSEn MENTS MENTS PRINCIPAL INTEREST TOTAL MENTE%t1 ) t7) (3) (4) (5) (6) (7) (8)
IF I0- 2 073 I1,Ih 400lCfQ h(0 2,190 * 52A - _ -1Q7t) 9,P 2,19l 460 1,024 - 70 70 11071 1PQtLA 2A651 I,1t0 958 1290 1191079 PP,QC 3.*e3( r80 754 58 15s 216 1f%71 'sA A, 0; (I - 4 p 0 n53 1,184 405 207 Pa3 a50 2*151t07t 9;# C, C4 7 7 , 3 fe i 346 297 321 6161Q75 f ? A,084 ' 360 308 323 632 a1076 ^sAin,P 6,776 235 348 322 670 m1077 r,QAS 6s429 - 180 419 314 732 a7Q78 15,4A 6,009 ' 138 419 300 718 -11 f.0 5,592 - 97 366 2h5 651 -tnnp(l r%PI9^ i:220 * 28 366 269 635 -1P01 APFINA 4.858 - 366 250 617 -1Op9 aj,119:1 4P49P - 366 231 597 -1IP3 aPIPI 4,1215 - 3hW ;212 578 -1980 1P07% 3,759 ' ' 366 13 55-10RS As'I 3,393 - 366 113 S) -1QP6 A,n7 . 3.02 2 3D6 154 520 -°0P7 R'Dtn ;if)(l) ' ' 3t66 135 501 -Io^p PP 7P29t 3- 66 116 A8 a-1o0Q 1,t o0 If 927 - 261 98 359109(0 1 A66 1,666 - 261 e4 34510511 I,anG 1,405 - 261 7t 331 M1Q92 1J144 IP1,44 261 57 318 -1993 Ft P. a 8 -1 261 l3 304 -
Table 4.5: GUATEMAL^A: ESXTERNAL PUBL,IC DEBT AS OF DEiCZ0EREP 31, 1973
DEST IkEPPSAYALE IN LDCAL CURRLNCY
IN THiXUSANDS OF U6S& nDULARS Page 3
LOANS FROP INTLe O RGANIZATIiiNSID
nFhT IilTSTANnNG TRA fH*NACTIONS rPll Xst iRIUDRFGTNNING OF PFRIOl) CANCEL-
~~~~~~~~~~~~~~~~~~~~~~~~LATID1NgonTStS1R1RFn IN(,t tllplNG COMPIT- 01SOURS" 5ERVEL4¢ ¢'^tHtNTS ADJUST&Ytd n~~~~~~(N[ Y LINOfSRURSiEO eE T 5 A _717 INTeX Tr- TAL MIEN1rs
(t ) (:1) ~~~(3, 4 )(. 7 s
I48 1oAfk i 0,9If) 6), 0 0 3 A99 9 4b3 423 906 71146°~~~~~~~~~-I v tto1 t4, : 5t 1fSo 9;'!' 'i 0 53 54 2 1j,095 I O7 0 JnQr,' S2 80 4 Ilip SOO 9 p20 Q 64 .X7 119 u4Q 7 1 9 t, Jh 67Pi393 6,hO 00 7 ,9 57 liti40 t0 90 ?AI3( B9 PSOO01077 14.,27A A3#411 nno0 8P551 1sS16 1P373 2.#839 ^91073 41PJ tl 67r 175 1J0 9.0495 1..73b iP39 3j-2T5 S
1QCo741A aR7tf, 7000610 6J00 2-760 1 j124 3,904_iQ7F 7,; f,7#30(i 5,737 2Jo9bb t0338 4>*326 tIJ?A S9,P171 h4#319 3#819 3>t%4e 1.1523 b>571-1Q77 %Apl1iQ A1s,064 2 :?940 3.063 1#520 4,*5812tq7s4 RA.02A Sp,,>01 1.s23i 3P07 'i;14O 4j,557 1470 liAtilo 1;5o1?4 -944 3,oO93 1l0411 4#503 I p(' 1, ,v(I.4 1 "2003 ?t - 3J.10 1 p3 30 4.*4 39 10 PIi <P0 , 9 I a P.Jq02 _. I S2 8 1 P 2 4 4p 369 I 9P 124r 744,4'i aj794 3) - 2s;4 I lIs15 4 A 27 5
QI 43 4Pjf,( 1 42P{7 6 71 3* 1 21 1 P063 4P I81 3qp it 49 P io '49 P 5t) 3p s360 1 P, 72 AP443R -
1 Q84 thn i 84 ~ ~ ~ ~ ~ ~ ~~~ ,:s99 1- 8 97: 3s 968 A 6i 3 -4P Io A3 P1 93 3 A 3of 7 893 3.9900-
lO8 Fk7 'A Pi 0 '40P I8 6 3. C 3C. 3 b OS- 3 8 3 21 oFRp ;)7 P 1 h 3 P 1 fs 3 3 s- 0 04 1 7 2 3P 76t5 1QAQ 24t4 4JO122 o 2 *790) 640 3s430
<><>(e ~ ~~~~~~ ~ ~~~~~~~~ >13 13 37 - 2 P 6 7 0 5 61 3 jo2 3 11qg1~~~~~~~~~. At, ^^ 1 5 6 62 2. 6 s8 8 484A 3J'17 2_
lc;PQ74 ~ ~~~~~~~~~ s59 2 29 4 06 7 b9 7 iQQ3 11,*Aa 13#684_ 1.*820 346 2P165_
Table 4.-5: GUATEMAIA: EXTERNAL PUBLIC DEBT AS OF DECMBER 31, 1973
DEBT REPAYARLE IN LOCAL CURRENLY
IN THOLSANnS OF U*So nOLLARS Page 4
LOANS FRONJ INTL* ORGANIZATIONS
OFPT OIITSTANnING TRANSACTIONS DURING PERIODRFGtNNING Or PFRIOD CANCEL-
LATIONS*nfSpItRSFO IN.i 11DING CJfrTIT' DISBURSE- SEkVICL PAYMENTS ADJUST-
YFAP nINl Y UNOlTShlURSEYI VENTS MENTS FWlhtltAL INIFHEbTI ITD1AL ENTSC1) (2) (3) (4) 45) (6) (7) (8)
1I6f 1 (''.s 79,91) 7f118 4i,399 4 423 906 1iqSo 1a ,C .'0q 16S4h 1,9o0 b,26b 553 542 I1095 *1I 7r pnY01Q 'a4o,99& 1,Q6(1 10,233 947 7 42 1,689 *31Q71 2930Q '4fi 70, 7,750 li,915 1,04U I 1209 262L9 -9P5011 Q79 l7,i54 A7f04 - 1,980 9,305 1,574 1,451 3,055 -711t73 Ia91 6 6.h22i 11,354 9,l190 1,943 i,782 3,725 J1797
1Q74 rh40,6c 77*4ti - 7,053 3,o77 1,444 4,522 -1Q7' 5MF,7'e 74,384 - 6,097 3,297 1,661 4#958 -107A 61, .7 71. 07 4, 054 3.395 1,545 5P241 -1t77 AP# 13 1 67ueh92 - 3,120 3,4At1 Ij833 5 314147Fk 61773 p4,211 - 1,369 3,496 1,780 5.f276 _1970 sQ61&A AJ#71i - 1,041 3#459 1695 5,15* -10QP( 57,77P r7,25A - 28 3,476 1,599 5,074Iot1 5',7!P71 53,780 - - 3p494 1,491 A,985 -1QP? 50,712A 5,20286 3,490 1.383 4*873 -103 a*.706 a*6,79 A 3,487 1,274 4,7614954 43,3Co 43,309 - 3P732 1,264 4.996 -I1opt 39,s77 39,577 3 -3,357 1 150 4P507 -Iq9f 36,910 36,215 - - 3..37 1,047 4,420 -l05? .72,Pt6 91-R4f * - 3,379 944 4,333 310P5 9POPL'7 ',4i57 o- 34407 84G 4A247 -1iQ0 26,iLo 26j,049 - - 3,051 73" 3,T78 -tt(q( 99.0cp 9J7o995 - - 2,931 645 3,577 -1091 ?Op,f.7 20.067 2'- 2,949 554 3.503 -lv92 17115 17.115 I - 2,551 463 3,014 -1093 1aPgf.7 14,56 7 - - 2,01 3115 2,470 -
EXTERNAL DEBT DIVISIONECONOMIC ANALYSIS & PROJECTIONS DEPART?IMENT
OCTOBER 9, 1974

Table 4.,6 GUATEMALA- EXTERNAL PUBLIC DEBT REPAYABLE IN FOREIGN CURRENCY1965 through 1973 and projected 19.74-60
(in thousands of U.S. dollars)
Debt 0COutsiitan-gBeginning of Period Transactions during Period
_ ________________________ ___ __---Cancel-lations,
Disbursed Including Commit- Disburse- Service payments Adjust-Year Only Undisbursed ments ments Principal interest Total ments
(1) (2) (3) (4) (5) (6) (7) (8)
1965 46,141 76,453 19,698 20,171 9,627 2,154 11,781 -11966 56,332 86,532 24,737 13,894 11,658 3,092 14,750 -2,5971967 58,567 97,005 50,466 34,795 13,S11 3,497 17,308 -41-31968 79,549 133,247 45,684 30,717 16,095 4,819 20,914 -5851969 94,103 162,251 16,970 18,982 18,896 5,190 24,086 -8,7971970 94,189 151,528 49,774 36,977 20,551 6,407 26,958 -6531971 110,615 180,098 29,940 22,303 20,163 7,648 27,811 -3241972 112,756 189,551 41,212 32,232 34,900 6,829 41,729 -5.402,1973 110,087 190,461 20,110 -p3,346 1-2,824 7-,054 19,878 -5,4171974 118,435 192,330 25,200 32,820 10,900 6,500 17,700 -1975 140,220' 206,630 70,000 31,690 10,200 7,410 17,610 -
1976 161,910 266,430 42,000 35,651 8,900 7,776 16,676 -1977 188,661 299,530 179,000 68,138 9,700 8,926 15,626 -197T 247,099 465,830 124,500 98,145 5,300 12,227 20,527 -1979 336,944 585,030 146,000 125,714 8,457 17,098 25,555 -
1980 454,201 722,573 165,000 158,929 12,745 24,430 37,175 -
t/ Includes the debt as of December 31, 1973 to suppliers, Private Banks, Privately placed bondsand other private financial institutions.
Source: IBRD Debt Reporting System Table 4.3 and mission projections.
Table 4.7: GUATFMALA - RECONCILIATION OF THE NET TOTAL EXTERNAL DEBT1965 through 1973
(In millions of US dollars)
1965 1966 1967 1968 1969 1970 1971 1972 1973
PUBLIC SECTOR
I. Total debt repayable in localforeign currency, net Tables 4.3and 4.5 13.7 4.0 24.7 18.5 5.8 25.7 10.0 5.1 18.5
II. Table 5.6, Part A (external fin-ancing, net) 11.0 2.4 24.3 14.6 4.7 26.2 12.5 9.0 25.0
III. Difference (=I - II = A + B) 2.7 1.6 0.4 3.9 1.1 - 0.5 - 2.5 - 3.9 - 6.5A. Entities not included in Table
5.5 2.8 1.8 o.6 3.8 1.1 - 0.5 - 2.3 - 3.8 - 6.4(Central Bank) ( 2.8) ( 0.3) ( 0.7) ( 3,8) ( 1.6) (-0.1) (-1.8) (-3,3) (-6.1)(Nat'l Mortgage Bank) ( - ) ( 0.4) (-0,5) (-O1) (-0.4) (-0.2) (-0.3) ( _ ) ( _)(Private with Public Guarantee) ( - ) ( 1.1) ( 014) ( 0.1) (-0.1) (-0.2) (-0,2) (-0.5) (-0.3)B. Statistical Discrepancy -0.1 -0.2 -0.2 0.1 _ _ -0.2 -'O* -0.1
BALANCE OF PAYMENTS
I. Total debt repayable in local andforeign currency, net. Tables 4.3and 4.5 13,7 4.0 24.7 18.5 5.8 25.7 10.0 5.1 18.5
II. Disbursement in local currency 3.2 2.0 4.1 3.4 3.6 4.1 1.8 1l0 0,8III. Amortization in local currency 0.1 0.3 0.4 0.5 0.6 0.9 1.0 1,6 1.9IV. Difference (=I-II+III) 10.6 2.3 21.6 15.6 2.8 22.5 9.2 5.7 19.6
A. Table 3.1 Part A (Public Sectorand Bank of Guatemala) 10.6 2.1 21 .6 15.5 3.3 22.8 9.8 5.8 19.7
B. Natil Mortgage Bank - 0.4 - o5 -o.t -o.4 -0,2 -0.3 - -
C. Statistical Discrepancy - - 0.2 0.5 0.2 - 0.1 -0.1 -0.3 -0il -0.1
Source: Tables 3.1, 5.5, 5.6, and IBRD Debt Reporting System
Table 5.1; GUATEMALA - SUMMARY OF CENTRAL GOVERNME:JT OPFFATTnulMOPart A; 1965 through 1973
(In millions of Quetzales)
1965 1966 1967 1966 1969 1970) 1971 1972 1573
Current Revenue 118.9 120.4 121.5 133.8 146.9 162.3 173.0 184.1 213.2
Current Expendi ture 96.9 109.1 118.4 118.8 129.3 147.8 147.9 156.8- 176.6
Current Surplus 22.0 11.3 3.1 15.0 17.6 14.5 25.1 25.3 36.4
Capital Receipts 1.1 1.3 2.2 2.2 2.1 0.8 O.S 1.5 2.S
Investment Expenditure 34.8 26.6 29.8 25.6 30.0 28.6 34.2 52.2 73.9(Direct) ( 24.6) (16.9) ( 20.0) (18.2) (23.3) (22.0) (20.2) (39.5T (50.0)(Transfers) ( 10.2) ( 9.7) ( 9.8) .7) ( 6.6) (14.0) (12-7) (17.9)
Surplus or Deficit -11.7 -14.0 -214.5 8.4 -10.3 -13.3 - 8.3 -25.4 -35.5
External Financing, net 21 10.0 1.8 l8.6 11.1 - 1.7 23.3 o.a 9.2 17.2Bonds, net 10,0 17.2 1 0.9 1.0 - t . L -7 -
(placement) (10.0) (6.2) ( 1.0) (7.0) (-_ (-) ( ) (-) (-)(amortization) ( - ) (-2.0) (- 416) (-.o6, (-7.4) (-7.4) (S-4) (-5.8) ( -
International Organizations, net - 0.3 - 0.8 3.4 L.0o 7.7 12.1 11.6 11.7 12.5(disbursement) ( 1.2) ( 0.9 ( 5-3) ( 6.0) ( 9-8) (14-3) (12.1) (12.9) (14.4)(amortization) (- 1.5) (-1.7) (- 1.9) (-2.0) (_2.1) (-2.2) (-0.9) (-1.2) ( 1 9)
Governments, net 2,7 0.2 3.3 4.1 0.ft 0.2 - S-7 6.7(disbursement) ( 3,9) ( 1.6) ( 5-0) (5-9) ( 2.5) ( 2.4) ( 2.3) C 7.0) (9.0)(amortization) (- 1.2) (-1.4) (- 1.7) (-1.8) (-2.1) (-2.2) (-2.3) (-2-3) (-2.3)
Other Private, net - 2.4 -1.8 1.0 2.0 -2.4 18.4 -5.4 - 1.4 2.0(disbursement) ( -) (_) ( 3-1) ( .3) (-) (22.0) ( ^) (16.0) C_)(amortization) (-2.4) (-1.8) (- 2.1) (2-3) (-2.4) (-3-6) (-5.4) (-17.L) (-2.0)
Domestic Financing, net 1.7 12.2 2.9 97 =.a_n n - .5 1/ 18.3Bank of Guatemala, net _-, ll.U 1.7 -3.0 5.9 - 7.1 9.4 - 9.7 1/ -17.7Commercial Banks, net - 2.9 7.2 - 3.0 1.2 -1.9 1.2 10.9 23.6 1/ 23.6Development Institutions, net - o.5 - O.4 - - 1.0 - 0.1 1.1 0.5 3.3Other, net 5.7 - 5.6 7.2 -0.9 7.0 - 4.0 -13.9 1.8 1/ 9.4
1/ Does not include Q18 million for the requisition of Empresas Electicas de Guatemala.T/ Data from IBED Debt F.eportimg System
Source: Ministry of Finance
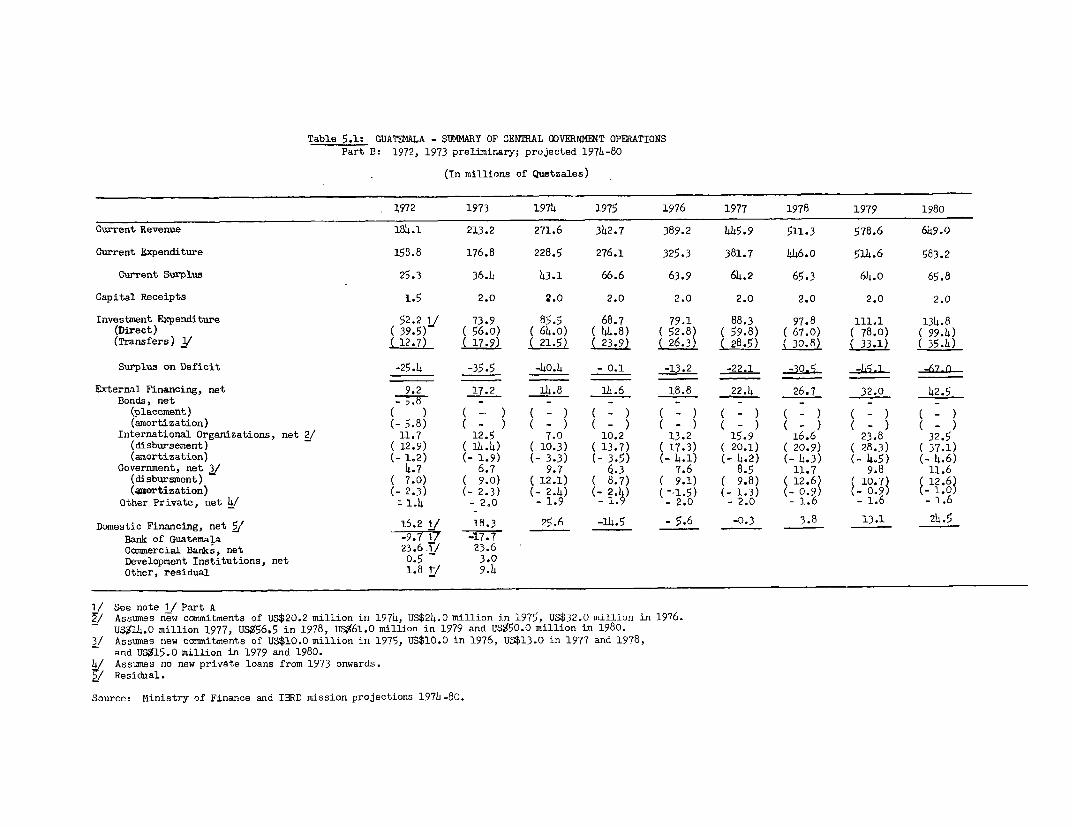
Table 5.1: GIATEMALA - SUMMARY OF CENTRAL GOVERNMET OPERATIONSPart B: 1972, 1973 prelimirary; projected 1974-80
(In millions of Quetzales)
1972 1973 1974 1975 1976 1977 1978 1979 1980
Current Revenue 184.1 213.2 271.6 342.7 389.2 445.9 511.3 578.6 649.0
Current Expenditure 158.8 176.8 228.5 276.1 325.3 381.7 446.o 514.6 583.2
Current Surplus 25.3 36.4 43.1 66.6 63.9 64.2 65.3 64.0 65.8
Capital Receipts 1.5 2.0 2.0 2.0 2.0 2.0 2.0 2.0 2.0
Investment Expenditure 52.2 1/ 73.9 85.5 68.7 79.1 88.3 97.8 111.1 134.8(Direct) ( 39.5)_ ( 56.0) ( 64.0) ( 44.8) ( 52.8) (59.8) ( 67.0) ( 78.0) ( 99.4)(Transfers) Y(12.7) ( 17.9) (21.5) (23.9) (26.3) (28.5) (30.8) (33.1) ( 35.4)
Surplus on Deficit -25.4 -35.5 -40.4 - 0.1 -13.2 -22.1 -30-5 -h5.1 -h7-0
External Financing, net 9.2 17.2 14.8 14.6 18.8 22.4 26.7 32.0 42.5Bonds, net - - - - - - - -
(placement)(amortization) (-5.8) (-) (-) (-) ( ) (_) (_) (_) (
International Organizations, net 2/ 11.7 12.5 7.0 10.2 13.2 15.9 16.6 23.8 32.5(disbursement) ( 12.9) ( 14.4) ( 10.3) ( 13.7) ( 17-3) ( 20.1) ( 20.9) ( 28.3) ( 37.1)(amortization) (- 1.2) (- 1.9) (- 3.3) (- 3.5) (- 4.1) (- 4.2) (- 4.3) (- 4.5) (- 4.6)
Government, net 3/ 4.7 6.7 9.7 6.3 7.6 8.5 11.7 9.8 11.6(disbursment) - ( 7.0) ( 9.0) ( 12.1) ( 8.7) ( 9.1) ( 9.8) (12.6) 10.7 12 6)(amortization) (-2.3) (-2.3) (- 2.4) 2,4) (--1-5) (-1.3) (- 0.9) - 910
Other Private, net 4/ 1.4 - 2.0 - 1.9 - 1.9 - 2.0 -2.0 16 1.6 1.6
Domestic Financing, net W 16.2 I/ 18.3 25.6 -14.5 5 5.6 -0.3 3.8 13.1 24.5Bank of Guatemala -9.7 1/ -17.7Cossmercial Banks, net 23.6.1/ 23.6Development Institutions, net 0.5 - 3.0Other, residual 1.8 1/ 9.4
1/ See note 1/ Part A2/ Assumes new commitments of US$20.2 million in 1974, Us$24.0 million in 1975, US$32.0 million in 1976.
uS%14.0 million 1977, US$56.5 in 1978, US$61.0 million in 1979 and USX50.0 million in 1980.3/ Assumes new commitments of US$10.0 million in 1975, US$10.0 in 1976, US$13.0 in 1977 and 1978,
and US$15.0 million in 1979 and 1980.4/ Assumes no new private loans from 1973 onwards.5/ Residual.
Source: Ministry of Finance and IBRD mission projections 1974-80.
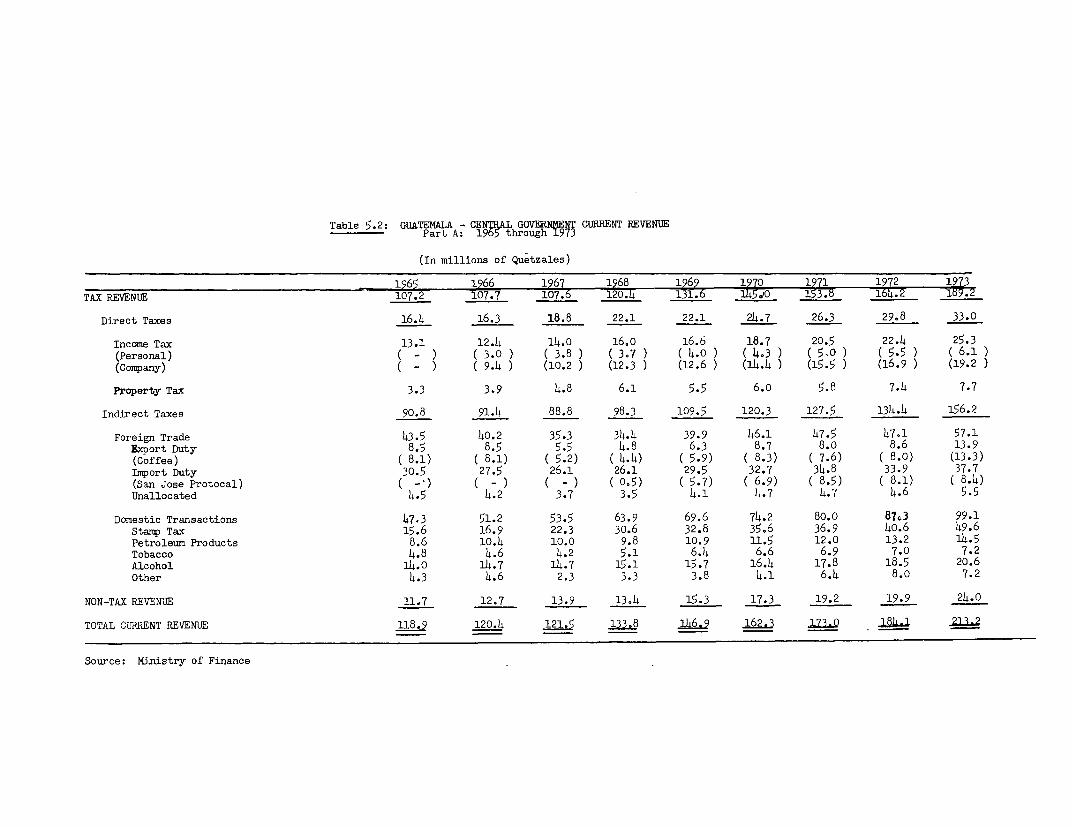
Table 5.2: GUATEMALA - CEN L GOVERNME CURRENT REVENUEPart A: 196 through 1973
(In millions of Quetzales)
1965 1966 1967 1968 1969 1970 1971 1972 1973TAX REVENUE 107.2 06. 131. 145d 13.9 164.2
Direct Taxes 16.4 16.3 18.8 22.1 22.1 24.7 26.3 29.8 33.0
Income Tax 13.1 12.4 14.0 160o 16.6 18.7 20.5 22.4 25.3(Personal) ( - ) (3.0 ) (3.8 ) (37 ) (4.0 ) (4.3 ) (5,0 ) (5.5 ) (6.1)(Company) ( - ) ( 9.4 ) (10.2 ) (12.3 ) (12.6 ) (14.4) (15.5 ) (16.9) (19.2
Property Tax 3.3 3.9 4.8 6.1 5.5 6.o 5.8 7.4 7.7
Indirect Taxes 90.8 91.4 88.8 98.3 109.5 120.3 127.5 134.4 156.2
Foreign Trade 43.5 40.2 35.3 34.4 39.9 46.1 47.5 47.1 57.1Export Duty 8.5 8.5 5.5 4.8 6.3 8.7 8.0 8.6 13.9(Coffee) (8.1) ( 8.1) (5.2) ( 4.4) ( 5.9) ( 8.3) ( 7.6) ( 8.0) (13.3)Import Duty 30.5 27.5 26.1 26.1 29.5 32.7 34.8 33.9 37.7(San Jose Protocal) ( -) ( - ) ( - ) (05) ( 5.7) ( 6.9) ( 8.5) ( 8.1) ( 8.4)Unallocated 4.5 4.2 3.7 3.5 4.1 4.7 4.7 4.6 5.5
Domestic Transactions 47.3 51.2 53.5 63.9 69.6 74.2 80.0 873 99.1Stamp Tax 15.6 16.9 22.3 30.6 32.8 35.6 36.9 40.6 49.6Petroleun Products 8.6 10.4 10.0 9.8 10.9 11.5 12.0 13.2 14.5Tobacco 4.8 4.6 4.2 5.1 6.4 6.6 6.9 7.0 7.2Alcohol 14.0 14.7 14.7 15.1 15.7 16.4 17.8 18.5 20.6Other 4.3 4.6 2.3 3.3 3.8 4.1 6.4 8.0 7.2
NON-TAX REVEN'dE 11.7 12.7 13.9 13,4 15.3 17.3 19.2 19.9 24.0
TOTAL CURRENT REVENUE 118.9 120.4 121.5 jj3j8 146,9 ]16.3 173.0 . 21a.2
Source: Ministry of Finance
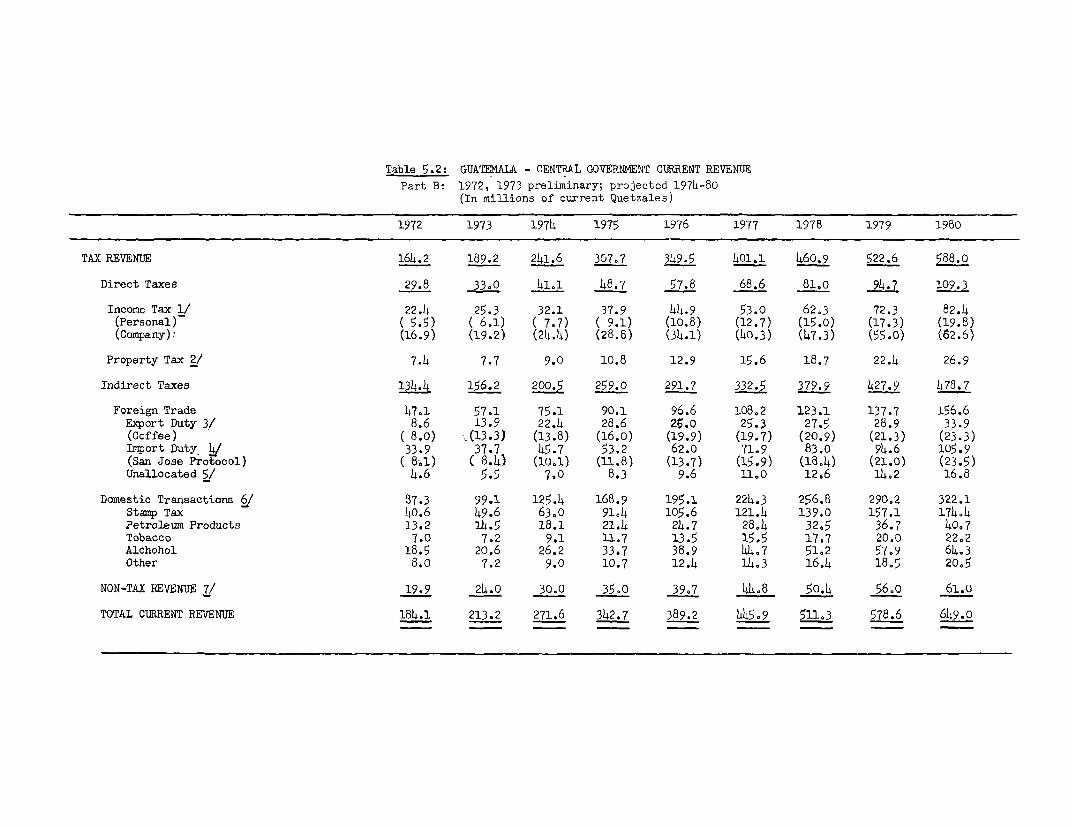
Table 5.2: GUATEMALA - CENTRAL GOVERNMENT CURRENT REVENUE
Part B: 1972, 1973 preliminary; projected 197L-80(In millions of current Quetzales)
1972 1973 1974 1975 1976 1977 1978 1979 1980
TAX REVENUE 164.2 189.2 241.6 307.7 349.5 401.1 4160.9 522.6 588.0
Direct Taxes 29.8 33.0 41.1 48.7 57.8 68.6 81.0 94.7 109.3
Income Tax 1/ 22.4 25.3 32.1 37.9 44.9 53.0 62.3 72.3 82.4
(Personal) (5.5) ( 6.1) ( 7.7) ( 9.1) (10.8) (12.7) (15.0) (17.3) (19.8)(Company)' (16.9) (19.2) (24.4) (28.8) (34.1) (40.3) (47.3) (55.0) (62.6)
Property Tax 2/ 7.4 7.7 9.0 10.8 12.9 15.6 18.7 22.4 26.9
Indirect Taxes 134.4 156.2 200.5 259.0 291.7 332.5 379.9 427.9 478.7
Foreign Trade 47.1 57.1 75.1 90.1 96.6 108.2 123.1 137.7 156.6
Export Duty 3/ 8.6 13.9 22.4 28.6 25.o 25.3 27.5 28.9 33.9(Coffee) ( 8.0) ,(13.3) (13.8) (16.0) (19.9) (19-7) (20.9) (21.3) (23.3)
Import Duty 4/ 33.9 37.7 45.7 53.2 62.0 71.9 83.0 94.6 105.9
(San Jose Protocol) ( 8.1) ( 8.4) (10.1) (11.8) (13.7) (15.9) (18,4) (21.0) (23.5)
Unallocated 5/ 4.6 5.5 7.0 8.3 9.6 110 12.6 1142 16.8
Domestic Transactions 6/ 87.3 99.1 125.4 168.9 195.1 224.3 256.8 290.2 322.1
Stamp Tax 40.6 49.6 63.0 91.4 105.6 121.4 139.0 157.1 174.4
Petroleum Products 13.2 1h.5 18.1 21.4 24.7 28.4 32,5 36.7 40,7
Tobacco 7.0 7.2 9.1 11.7 13.5 15.5 17,7 20.0 22,2
Alchohol 18.5 20.6 26.2 33.7 38.9 44.7 51,2 57.9 64.3
Other 8.0 7.2 9.0 10.7 12.4 14,3 16.4 18,5 20.5
NON-TAX REVENUE 7/ 19.9 24.0 30.0 35.0 39.7 44.8 50.4 56.0 61.0
TOTAL CURRENT REVENUE 184.1 213.2 271.6 342.7 389.2 445,9 51103 578.6 649.0
Footnotes to Table 5.2: Part B
*/ Assumes that domestic inflation will keep pace with world inflation asprojected by the IBRD in November 1974.
1/ Assumes income elasticity of one for 1974 and 1975. Fbr 1976 onwards,elasticity is assumed to increase to 1.17 as a result of improvements intax administration, particularly the introduction of the tax identifica-tion number, and termination of the tax holiday for enterprises.
2/ Assumes a yield of Q9 million in 1974 and, as a result of the September1974 tax changes, a nominal rate of growth of 20 percent per annum there-after.
3/ Assumes that the yield of export duties will continue to depend mainlyon coffee exports. Taxes on coffee are assumed to grow at the samerate as coffee exports. Due to expected high international prices forsugar, substantial increases in the yield of the new sugar tax are pro-jected for the next three years. Export taxes on other products areexpected to grow at a rather low rate.
4i Assumed to exceed the amount submitted in the 1974 budget by 20 percent,to increase by 5 percent in real terms in 1975, and by 8 percent peryear in real terms thereafter.
5/ Assumed to grow at 7 percent per year in real terms.
6/ Assumed to grow by 5 percent in real terms in 1974, and by 7 percent peryear in real terms thereafter.
7/ Assumed to grow by 5 percent per year in real terms. Adjustments in theprices of Government services are assumed to lag behind overall inflationrates.
Source: Ministry of Finance and IBRD mission projections, 1974-80.
Table 5.3: GUATEMAIA - CENTRAL GOVERNMENT CURRENT EXPENDITURE BY SECTORPart A: 1965. through 1973 (Preliminary)
(In millions of Quetzales)
1965 1966 1967 1968 1969 1970 1971 1972 1973
Economic Services 10.6 17.1 16.7 15.2 17.2 18.0 19.7 22.4 20.7Agriculture 3.0 3 5 3.0 2.7 3.0 3.7 TIv 7.3 .Transport 2.6 7.9 7.8 6.9 8.0 7.3 8.2 8.0 8.0Communications 3.5 4.1 4.2 4.1 4.2 4.4 4.1 3.8 4.oOther 1.5 1.6 1.7 1. 2.0 2.6 3.3 3.3 1.9
Social Services 41.9 45.1 50.4 50.9 57.5 61.1 69.8 70.5 75.6Edueation 21.9 23.1 26.4 26.h -297.3 3004 35-5Health 11.1 12.4 13.4 13.9 17.4 19.7 17.2 20.0 20.4Social Welfare 7.6 6.6 7.5 8.2 7.0 8.3 13.4 12.2 14.3Other 1.3 3.0 3.1 2.2 3.8 2.7 3.7 3.3 3.1
General Services 44.4 46.9 50.3 52.7 54.6 68.7 58.4 65.9 80.5General Admir,nistration 16.6 17.7 17-. IT 19.2 20.1 22.3 30.0Defense and Police 20.5 21.0 24.6 24.3 24.4 37.3 23.1 2200 24.5Justice 2.5 2.5 2.6 2.5 3.3 3.3 3.6 3.4 4.1Interest 4.8 5.7 6.6 7.5 7.7 8.o 9.4 10.5 13.9
TOTAL CURRENT EXPENDITURE 96.9 109.1 118.4 118.8 129.3 147.8 147.9 158.8 176.8
Source: Ministry of Finance
Table 5.3: GUATEMALA - CENTRAL GOVERNMENT CURRENT EXPENDITURE BY SECTORPart B: 1972, 1973 preliminary; projected 1974 - 80 1/
(In millions of current Quetzales)
1972 1973 197L 1975 1976 1977 1978 1979 1980
Economic Services 22,4 . 71.-7 36.9 42.b 49.4 56.3 b3.1Agriculture 7.3 677Transport 8.0 8.0Communications 3.8 4.0Other 3.3 1.9
Social Services 7 05, 75.6 99.0 121.3 145.0 72 204.4 239.2275.1Edication 35.0.-Health 20.0 20.4Social Welfare 12.6 14.3Other 3.3 3.1
General Services 65.9 80.5 103.0 123.1 i3 166.4 1 221. 2145.0General Administration 30.0 38.0Defense and Police 22.0 24.5Justice 3.4 4.1Interest 10.5 13.9
TOTAL CUIRENT EXPENDITURE j/ 158.8 176.8 228.5 276.1 325.3 _81.7 446.0 514.6 -s83.2
1/ Assumes that expenditure on Social Services will grow at about 11 percent per annum in real terms, economic and general services at about 8 percentper annum in real terms. See footnotes to Table 5.2 for assumptions on inflation.
Source: Ministry of Finance and IBRD YMission Projections 1974-80
Table 5.h4 GUATEMALA - CENTRAL GOVERNMENT CAPITAL EXPENDITURE BY SECTORPart A: 1968 through 1973
(In millions of Quetzales)
15M8 -- )b9 l-psp ~ 1970 1971 1972 1973
Direct Investment 18.2 23.3 22.0 20.2 39.5 56.0Economic Services 13.7 18.0 16.5 13.1 20.1 21.0Agriculture 1.6 4.1 2.8 2.7 3.4 3.7Transport 11.4 13.4 13.0 10.3 16.5 16.7Communications 0.7 0.5 0.6 0.1 _ 0.1Other - - 0.1 - 0.2 0.5
Social Services 4.1 4.8 3.3 2.4 13.0 26.8Education 1.0 1.7 1.0 1.1 5.1 11.4Health 3.1 3.1 2.1 1.0 7.1 14.2Other - - 0.2 0.3 0.8 1.2
General Services 0.4 0.5 2.2 4.7 6.4 8.2
Transfers 7.4 6.7 6.6 14.0 12.7 17.9Agriculture 1.0 1.5 2.0 6.1 482Housing 0.2 0.3 0.5 1.8 1.9 0.9Power 3.0 3.1 2.5 2.0 2.4 4.5Other 3.2 1.8 1.6 4.1 3.6 4.3
TOTAL INVESTMENT 25.6 30.0 28.6 34.2 52.2 1/ 73.9
Total Investment is Percentage ofG. D. P. 1.6 1.7 1.5 1.7 2.5 2.9
1/ Does not include Q18 million for the requisition of Empresas Electricas de Guatemala.
Source: Ministry of Finance
Table 5.4: GUATEMAIA - CENTRAL GOVERNMENT CAPITAL EXPENDITURE BY SECTORPart B: 1972, 1973 preliminary; projected 1974-80
(In millions of current Quetzales)
1972 1973 1974 1975 1976 1977 1978 1979 1980
Direct Investment 1/ 39.5 56.o 64.0 4148 52.8 59.8 67.0 78.0 99.4
Economic Services 20.1 21.0 29.9 21.8 25.5 28.7 32.1 37.1 46.7Agriculture - -377Transport 16.5 16.7Communications - 0.1Other 0.2 0.5
Social Services 13.0 26.8 23.0 16.4 19.2 21.7 24.3 28.2 35.8Education .1T 1TTHealth 7.1 14.2Other 0.8 1.2
General Services 6.4 8.2 11.1 6.6 8.1 9.4 10.6 12.7 16.9
Transfers 12.7 17.9 21.5 23.9 26.3 28.5 30.8 33.1 35.4Agriculture 4 T.=Housing 1.9 0.9Power 2.4 4.5Other 3.6 4.3
TOTAL INVESTMENT 52.2 739 85.5 68.7 79.1 88.3 97.8 111.1 1314.8
Total Investment as Percentage of G.D.P. 2.5 2.9 2,6 1.7 1.7 1.7 1.7 1.7 1.8
1/ Projected on the basis of past commitments and expected new commitments of international organizations and foreign governments.2/ Does not include Q18 million for the acquisition of Empresses Electricas de Guatemala.
Source: Ministry of Finance and IBRD Mission projections, 1974-80.
Table 5.5: GUATEMALA - SUMMARY TRANSACTIONS OF THE AUTONOMOUS AGENCIES (RPS)1(
Actuals 1965 through 1973 and Projections for 1974-1980
(In millions of current Quetzales)
Page 1 of 4
Current Revenue Current E end. Current SurElus Capital Receits Investment Surplus(&) External DomesticTotal Transff. T orDeficit( Total Transf. expenditure or financing, fLnancirg,
from CG to CG from CO Deficit(-) net net
1965 - TOTAL 36.5 (4-2) 2B.4 ( 8.1 4.7 4.5 U13 -0.7 1.0 -0.3
University of Sun Carlos 3.1 (2.1) 2.8 ( - ) 0.3 - - 0.3 - - -Social Security Institute (IGSS) 11.1 (1.0) 10.3 ( - ) 0.8 - - 0.2 0.6 - -0.6Guatemala City 9.4 ( - ) 6.5 (-) 2.9 - (-) 3.4 -0.5 -0.1 0.6Other municipalitLes 5.1 ( - ) 2.3 ( - ) 2.8 - ( ) 2.2 0.6 - -0.6National Electricity Inatitmte (IDE) 0-8 ( - ) 0.5 ( - ) 0.3 3.0 (3.0) 5.1 -1.8 1.2 0.6
Other 7.0 (1.1) 6.o ( - ) 1.0 1.7 (1-5) 2.3 0.4 -0.1 -0.3
1966 - TOTAL 40.5 (5-0) 34.3 (0.3) 6.2 7.3 6.5 11.6 1.9 0.6 -2.5
University of San Carlos 3.8 (2.7) 3.4 ( - ) 0.4 - ( - ) 0.6 -0.2 0.1 0.1Social Security Institute (IGSS) 11.7 (1.0) 11.2 ( - ) 0.5 - ( - ) 0.1 0.4 - -0.4Ouatemala City 8.9 (-) 7.3 (- ) 1.6 - (-) 2.0 -0.4 -0.1 0.5Other municipalities 5.6 ( - ) 3.4 ( - ) 2.2 - ( - ) 2.0 +0.2 - -0.2National Electricity Institute (INDE) 1.7 ( - ) 0.9 ( - ) 0.8 3.6 (3.6) 4.5 -0.1 0.7 -0.6Guatemala Telecommunications (OUATEL) 1.3 ( - ) o.8 (0-3) 0.5 0.3 (0.3) 0.2 0.6 - -o.6
Other 7.5 (1.3) 7.3 ( - ) 0.2 3.4 (2.6) 2.2 1.4 -0.1 -1.3
1967 - TOTAL 45.0 (5.4) 37.0 (0.3) 8.o 5.8 (4.4) 15.6 -_.8 5.7 -3.9
University of San Carlos 4.0 (3.0) 4.0 ( - ) - 0.7 (0.4) 0.6 0.1 0.2 -0.3Social Security Institute (IGSS) 13.2 (1.0) 11.5 ( - ) 1.7 - ( - ) 1.8 -0.1 - 0.1Guatemala City 9.4 ( - ) 7.5 ( - ) 1.9 - ( - ) 2.3 -0.4 3.4 -3.0Other municipalities 5.8 ( - ) 3.8 ( - ) 2.0 - ( - ) 2.5 -0.5 - 0.5National Electricity Institute (INDE) 2.7 ( - ) 1.3 ( - ) 1.4 1.8 (1.8) 4.7 -1.5 2.0 -0.5Ouatemala Telecommunications (GUATEL) 1.5 ( - ) 1.1 (0.3) 0.4 0.1 (0.1) 0.3 0.2 - -0.2
Other 8.4 (1.4) 7.8 ( - ) 0.6 3.2 (2.1) 3.4 0.4 0.1 -0.5
1968 - TOTAL 54.1 (6.6) 49.4 (0-5) 4.7 10.2 (42 19.1 -4.2 3. 0.7
University of San Carlos 4.3 (3.1) 4.2 ( - ) 0.1 0.1 ( o ) 0.6 -0.4 0.1 0.3Social Security Institute (IGSS) 14.7 (1.3) 12.6 ( - ) 2.1 - 1.6 0.5 - -0.5Guatemala City 9.5 ( - ) 8.2 ( - ) 1.3 _ (_) 2.6 -1.3 0.2 1.1Other municipalities 6.3 (0.5) 4.3 ( - ) 2.0 - ( - ) 1.8 0.2 - -0.2National Electricity Institute (INDE) 4.1 ( - ) 2.5 ( - ) 1.6 3.0 (3.0) 8.2 -3.6 3.5 0.1Guatemala Teleccmuni.cations (GUATEL) 1.9 ( - ) 1.5 (0.5) 0.4 0.1 (0.1) 0.8 -0.3 - 0.3Guatemala Railways (FEGUA) 4.0 ( - ) 7.2 ( - ) -3.2 4.0 ( - ) - 0.8 - -0.8
Other 9.3 (1.7) 8.9 ( - ) 0.4 3.0 (1.6) 3.5 -0.1 -0.3 0.4
1969 - TOTAL 67.2 (11.3) 58.9 (0.7) 8.3 6.0 (4.8) 20.5 -6.2 6.4 -0.2
University of San Carlos 4.8 (3.9) 4.8 ( - ( - ) 0.1 -0.1 0.2 -0.1Social Security Institute (IGSS) 20.1 (2.6) 17.6 ( - ) 2.5 - ( - ) 1.2 1.3 - -1.3Guatemala City 11.1 ( - ) 9.3 ( - ) 1.8 - ( - ) 2.8 -1.0 1.6 -0.6Other municipalities 6.7 (1.2) 4.5 ( _ ) 2.2 - ( - ) 3.5 -1.3 - 1.3National Electricity Institute (INDE) 4.8 ( - ) 3.3 ( - ) 1.5 3.1 (3.1) 8.7 -4.1 4.8 -0.7Guatemala Telecommunications (GUATEL) 2.4 ( - ) 1.8 (0-7) 0.6 - ( - ) 0.5 0.1 - -0.1Guatemala Railways (FEGUA) 5.9 (1.0) 6.6 ( - ) -0.7 - ( - ) - -0.7 - 0.7
Other 11.4 (2.6) 11.0 ( - ) 0.4 2.9 (1.7) 3.7 -0.4 -0.2 o.6

-9 'T~ l''4'W'1 o
I 17 I Io 0 1, ? I., I I? 1~ I I 7
- - - - - - - -- - -- - -- - -- -- I - -- 04 -0l- C C - 0
CC044N4 000 0 -- N 0- 4- - - 0-- 0-- - 0 - . CC C -00 0 0 C .CC C C .C C- - - - - - - - 0- - - J
1~~~ 9 9 - 1~~~~~~ 1: 11~4 C CC 0' CC ,
2 ~'.NCC - 0 O~-3g~-C0 . 0 C'.,C0400CC'CO 00 0
-----0 C - CC CCJ 4 -4 4 4 0 4 CC.' 4 C- ~I 40 CCC CC- OC CCC 0 C40.2'C- 25C I0.CCC--4C0C 0C-
CO~~~~~~~ N t OV 'E l1 lF5 W -WmotOI sOHWsOv
Sga ~ a -,'" a ~ Wz g 'a z- 7A9v
A_AA o P t W , , -, , , O g , .. I 4 I o o I -,. W -p e
- -IN- --
F F ' W b F * ~. .I,*V IP .V . .'WV V O V VI_ . . , 0 o,oo, oFVeI|>'. . .I . . . . . . . .W . . . . . .
-- -° ---- - - - - - --w - -| - -w - - - , -- ° -- ° - 1 -
a.-. a.-. a~~~~~~~~6~F .-..

u v vo _ oo og , UO. o,,g . ,, . o o w_, u;D _% I NI O '' * 'S O 3O .0UX N O _{_ O EAI
1
00 1 C-IC|I.Tf* ,ICz A * .I
i i# >1 ° u. c o oV NACICC.A O Qw 3 Dj3I<I- r| r .
0.p
0r0
E3HN3_|\EOo
SKo 8 1 l - ..i O N C L D.gOOONoo E 4 °r 04~OONgHo
! 0C A A 0- A C A I ,C3 o ao- a. IoC N > i. C-AIAH 100 ICOAcI 1. i
0 Ci 'I o ?II s .° > I RO CL A ° O ° , - l -o 01. wR< w Eeao 0.v N00 1 NNN,°.1 I NI O , N N~ I L f -t I Oa- N . .1 _1 0 2N .O
ES ~ ~ ~ 2 -U 21 H~ 0H C 2
- C D 010 0CC 00. 0 '0 0 'n 0 0 0 C A AE As> _0 CIA COLLI A,
° A .5 8 I l SCIeH;3eqS
0..AHC A A .00 CA00 A H OsI .0HHHs ACA : t _t ?<
a2 °C Cx o 1111C CACCA Al A *AHAA 2c bo 8 o e S :=2OCCO-I ' 0) _0O AA CAlO°AHA Yh^ i 1!
a 2yt3 = c< o H ACLACH A HAHA Ac AH_=AACAAAHA CC oo °@

Table 5. 6: GUATEMALA - CONSOLIDATED PUBLIC SECTOR OPERATIONS Page 1 of 6Part A: 1965 through 1973 (preliminary)
(In millions of Quetzales)
1965 1966 1967 1968 1969 1970 1971 1972 1973
(1) Central Government (CG)
Current Revenue 118.9 120.4 121.5 133.8 146.9 162.3 173.0 184.1 213.2(Transfers frm RPS) ( - ) ( 0.3 ) ( 0.3 ) (0.5) ( 0.7 ) ( 0.1 ) ( 0.9 ) ( 4.4) (5,7
Current Expenditure 96.9 109.1 118.4 118.8 129.3 147.8 147.9 158.8 176.8(Transfers to RPS) ( 4.2 ) ( 5.0 ) ( 5.4 ) ( 6.6) (11.3 ) ( 10.8 ) ( 12.6 ) ( 12.9) (14.1
Current Account surplus (+) or deficit (-) 22.0 11.3 3.1 15.0 17.6 14.5 25.1 25.3 36.4
Capital receipts 1.1 1.3 2.2 2.2 2.1 o.8 0.8 1.5 2.0
Investment expenditure 34.8 26.6 29.8 25.6 30.0 28.6 34.2 52.2 73,9(Transfers to RPS) ( 4.5 ) ( 6.5 ) ( 4.4 ) ( 4.7) ( 4.8 ) ( 5.0 ) ( 6.3 ) (10.4) ( 9.3(Other Transfers) (5.7) ( 3.2 ) ( 5.4 ) Q_ ( 1.9 ( 1.6 ) (7.7) (2.3) (8.6
Overall surplus (+) or deficit (-) -11.7 -14.0 -24.5 - 8.4 -10.3 -13.3 - 8.3 -25.4 -35.5
External financing, net 10.0 1.8 18.6 11.1 - 1.7 23.3 0.8 9.2 17.2(Disbursement) (15.1 ) (0.T7 ) ( 28.4) ( 23-.2 ) (12.3 ) (33.) (14.4) ( 35.9) ( 23.4)(Amortization) (- 5.1 ) (- 6.9 ) (- 9.8 ) (-12.1 ) (-14.0 ) (-15.4 ) (-13.6 ) (-26.7 ) (- 6.2
Domestic financing, net 1.7 12.2 5.9 - 2.7 12,0 -10.0 7.5 16.2 18.3Bank of Guatemala, net 0.6 11.0 1.7 - 3.0 579 - 7.1 9.4 - 9.7 -17.7Commercial banks, net - 2.9 7.2 - 3.0 1.2 - 1.9 1.2 10.9 23.6 23.6Development Institutions, net - 0.5 - 0.4 - - 1.0 - 0.1 1.1 0.5 3.0Other residual 5.7 -5.6 7.2 -0.9 7.0 - 4.0 -13.9 1.8 9.4
Source: Table 5.1

Table 5. 6: GUATEMALA - CONSOLIDATED PUBLIC SECTOR OPERATIONS Page 2 of 6
Part A: 1965 through 1973 (preliminary)(In millions of Quetzales)
1965 1966 1967 1968 1969 1970 1971 1972 1973
(2) Rest of the Public Sector (RPS)
Current Revenue 36.5 40.5 45.0 54.1 67.2 74.0 80.8 107.4 124.5
(Transfers from CG) ( 4.2) ( 5.0) ( 5.4 ) ( 6.6) (11.3) (10.8) (12.6) (12.9) (14.1
Current Expenditure 28.4 34.3 37.0 49.4 58.9 66.6 74.4 98.9 108.6
(Transfers to CG) (- ( 0.3) .3 (0.5) 0.7) ( 0.1) ( 0.9) (4.4) (5.7
Current Account surplus (+) or deficit (-) 8.1 6.2 8.0 4.7 8.3 7.4 6.4 8.5 15.9
Capital Receipts 4.7 7.3 5.8 10.2 6.o 8.1 9.8 13.0 12.0
(Transfers from CG) 4 4.5) ( 6.5) 4 4-4) 4 4.7) ( 4.8) ( 5.0) ( 6.3) (10.4) ( 9.3
Direct Investment Expenditure 13.5 11.6 15.6 19.1 20.5 23.3 28.7 21.0 35.3
Overall surplus (+) or deficit (-) - 0.7 1.9 - 1.8 - 4.2 - 6.2 - 7.8 -12.5 0.5 - 7.4
External financing, net 1.0 o.6 5.7 3.5 6.4 2.9 L1.7 - 0.2 7.8
(Disbursements) ( 1.2 ) (- 8-) (6-1V) (1-7 ) (-7 ) ((7 45 (3 ) (4-8) ( 9.9(Amortization) (-0.2) (-.0.2) (_0.4) (-1.3) (-1.4) (-1.6) (-2.1) (-5.0) (-2.1
Domestic financing, net -0.3 -2.5 -3.9 0.7 -0.2 4.9 0.8 0.3 o.4
Source: Table 5. 5
Table 5. 6: GUATEMALA - CONSOLIDATED PUBLIC SECTOR OPEIATIONS Page 3 of 6Part A: 1965 through 1973 (preliminary)
(In millions of quetzales)
1965 1966 1967 1968 1969 1970 1971 1972 1973
(3) Public Sector
Current Revenue 151.2 155.6 160.8 180.8 202.1 225.4 240.3 274.2 317.9
Current Expenditure 121.1 138.1 149.7 161.1 176.2 203.5 208.8 240.4 265.6
Current Account surplus (+) or deficit (-) 30.1 17.5 11.1 19.7 25.9 21.9 31.5 33.8 52.3
Capital Receipts 1.3 2.1 3.6 7.7 3.3 3.9 4.3 4.1 4.7
Investment EXpenditure 43.8 31.7 41.0 40.0 45.7 46.9 56.6 62.8 99.9
(Transfers to others) ( 5.7) ( 3.2 5.4) ( 2.7) 1.9) ( 1.6) ( 7.7) ( 2.3) C 8.6)
OveraIl surplus (+) or deficit (-) -12.4 -12.1 -26.3 -12.6 -16.5 -21.1 -20.8 -24.9 -42.9
External financing, net 11.0 2.4 24.3 14.6 4.7 26.2 12.5 9.0 25.0
(Disbursement) (1h-3) ( 9.S) (3 7) ( 2.0) ( 20.1) (143.2 ) ( 27.2) (140.7) (33.3)
(Amortization) (- 5.3 ) (-7.1 ) (-10.2 ) (-13.4 ) (-15.4 ) (-17.0 ) (-15.7 ) (-31n7 ) (- 8.3)
Domestic financing, net 1.4 9.7 2.0 2.0 11.8 -5.1 8.3 15.9 17.9
Bank of Guatemala to CG, net 11.0 3.0 5.9 - 7.1 ' . - 9-17.Commercial Banks to CG, net -2.9 7.2 -3.0 1.2 - ld9 1.2 10.9 23.6 23.6
Development Institutions to 00, net -0.5 -0.4 - - 1.0 - 0.1 1.1 0.5 3.0
Other residual to C.,. 5.7 -5.6 .2 - 0.9 7.0 - 4.o -13.9 1.8 9.4
Domestic financing to RPS -0.3 -2.5 -3.9 0'7 -0.2 4.9 0.8 -0.3 -0.4
Table 5.6: GUATEMAIA - CONSOLIDATED PUBLIC SECTOR OPERAITONSPart B: 1972, 1973 prelininary;projected 1974-80 Page 4 of 6
(In million of Qaetzales)
1272 1973 1974 1975 1976 1977 1978 1979 1980
(1) Central Government (CoG)
Current Revenue 184.1 213.2 271.6 342.7 389.2 445.9 511.3 578.6 649.0
(Transfers from RPS) ( 4.4) ( 5.7) ( 2.4) ( 4.2) ( 4.6) ( 5.3) ( 5-7) ( 6.2) ( 6.9)
Current Expenditure 158.8 176.8 228.5 276.1 325.3 381.7 446.o 514.6 583.2
(Transfers to RPS) (12.9) (14.1) (25. (1.3 (13 (20.0) (21.3) (23.9) .61
Current Account surplus (+) or deficit (.) 25.3 36.4 43.1 66.6 63.9 64.2 65.3 64.o 65.8
Capital Receipts 1.5 2.0 2.0 2.0 2.0 2.0 2.0 2.0 2.0
Investment Expenditure 52.2 73.9 85.5 68.7 79.1 B8.3 97.8 111.1 134.8
(Transfers to RPS) (10.4) ( 9.3) (14.7) (13.7) (18.2) (19,5) (22.1) (15.6) (19.0)
(Other transfers) j,3 ( 86 ( 6.8) (10.2 ) ( 8.1 ) ( 9.0) ( 8-7) (17.5) (16.4)
Overall surplus (+) or deficit (_) -25.4 -35.5 -40.4 -0.1 -132 -22.1 -30.5 -45.1 -67.0
External financing, net 9.2 17.2 14.8 14.6 18.8 22.4 26.7 32.0 42.5
(Disbursement) -(35 9) (2322.4) (22 4 96.4) 29.9) (33.5) (39o)
(Amortization) (-26.7) (-6.2) (-7.6) (-7-8) (-7.6) (-7.5) (-6.8) (-7.0) (-7.2)
Domestic financing, net 16.2 18.3 25.6 -14.5 -5.6 -0.3 3.8 13.1 24.5
Bank of Guatemala, net -9'7 -17.7Connercial Banks, net 2336 23.6
Develop-ment institutions, net 0.5 3.0Other residual 1.8 9.4
Source: Ministry of Finance and TMRD Mission projections 1974-80 (see footnotes on tables 5.2, 5.3, 5.4).

Table 5.6: GUATEMALA - CONSOLIDATED PUBLIC SECTOR OPERATIONSPart B: 1972, 1973 prelininary;projected 1974-80 Page 5 of 6
In million of Quetzales)
1972 1973 1974 1975 1976 1977 1978 1979 1980
(2) Rest of the Public Sector (RPS)
Current Revenue 107.4 124.5 159.0 186.8 216.7 249.2 289.1 335.3 389.7(Transfers from CG) (12.9) (14.1) (25.5) (18.3) (18.3) (20.0) (21.3) (23.9) (26.6)
Current Expenditure 98.9 108.6 137.9 158.7 181.0 209.2 244.2 283.9 329.4(Transfers to CG) (14.4) (5.7) (2.(4) ( I.2) 4(6) 5. 3 (57) (6.2) (6.9)
Current Account surplus (+) or deficit (-) 8.5 15.9 21.1 28.1 35.7 40.0 h4.9 51.4 60.3
Capital Receipts 13.0 12.0 16.8 16.9 21.5 23.5 25.5 20.2 24.1(Transfers from CG) (10.4) ( 9.3) (14.7) (13-7) (18.2) (19.5) (22.1) (15.6) (19.0)
Direct Investment Expenditure 21.0 35.3 50.5 66.8 79.4 80.6 101.7 101.8 107.1
Overall surplus (+) or deficit (-) 0.5 -7.4 -12.6 -21.8 -22.2 -17.1 -31.3 -30.2 -22.7
External Financing, net -0.2 7.8 10.0 11.6 10.8 17.0 36.0 34.5 27-8(Disbursement) ( J -9. 9 (192.2 T7 TT7T (21.0) (10.37) (43d 7) (31.9)(Amortization) (-5.0) (-2.1) (-2.2) (-2.5) (-2.7) (-4.0) (-4.3) (-4.2) (-4.1)
Domestic financing, net -0.3 04 _6 102 11.4 0.1 -47 -4.3 -5.1
Source: Table 5.5
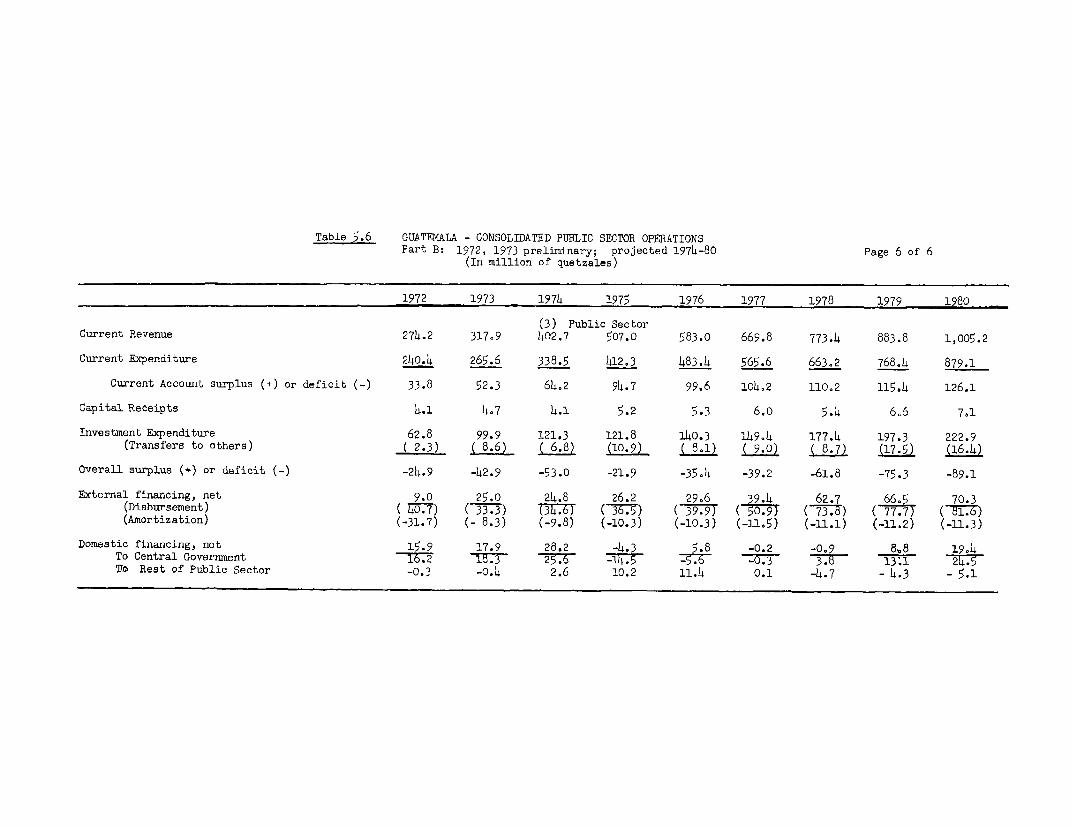
Table 5.6 GUATEMALA - CONSOLIDATED PUBLIC SECTOR OPERATIONSPart B: 1972, 1973 preliminary; projected 1974-80 Page 6 of 6
(In million of quetzales)
1972 1973 1974 1975 1976 1977 1978 1979 1980
(3) Public SectorCurrent Revenue 274.2 317.9 402.7 507.o 583.o 669.8 773.4 883.8 1,005.2
Current Expenditure 240.4 265.6 338.5 412.3 483.4 565.6 663.2 768.4 879.1
Current Account surpluo (+) or deficit (-) 33.8 52.3 6402 94.7 99.6 10i42 11002 115.4 126.1
Capital Receipts 4.1 407 4.1 5.2 5.3 6.0 5.4 606 7.1
Investment Expenditure 62.8 99.9 121.3 121.8 140,3 149.4 177.4 197.3 222.9(Transfers to others) ( 2.3) ( 8.6) ( 6.8) (10.9) (80_1 (16.4)
Overall surplus (4) or deficit (-) -24.9 -42.9 -53.0 -21.9 -35.4 -39.2 -61.8 -75.3 -89.1
External financing, net 9.0 25.0 24.8 26.2 29.6 39.4 62.7 66.5 70.3(Disbursement) ( 40.7) (33.3) T34-.6) ( ( 39.9) ( 00.97 ( 73.8) ( 77.7) (-T 8.)(Amortization) (-31.7) (- 8.3) (-9.8) (-10.3) (-10.3) (-1105) (-11.1) (-11.2) (-11.3)
Domestic financing, net 15.9 17.9 28.2 -4.3 5.8 -0.2 -0,9 8*8 1904To Central Government 16.2 -1W77- 25.6 -1.5 -0.3 -7_ 13,1 24.5Tb Rest of Public Sector -0.3 -0.4 2.6 10.2 11.4 0.1 -4.7 - 4.3 - 5.1

Table 6.1: GUATEMALA - SUMlM1APY ACCOMIUS OF T!' BAJXVT0l 3S STEl966 through 1973 Page 1 oT' 4
(In Million of Quetzales
1966 19.67 1968 19°'9 1970 1971 1972 1973
I. Bank of Guatemala
International reserves, net - 53.0 46.6 49.3 62,.9 80.3 95.5 137.6 213.8Gold and foreign assets 60.7 65.5 65.¢ 74.4 81.5 86.1 117.9 195.8Net IMfF position - 5.3 -15.2 -13.4i -11.1 - 3.0 9.8 10.9Holdings of SDRs - - - - 2.0 8.6 12.5 13.8Short-term liabilities - 2.4 - 3.7 - 2.8 - 2.3 - 3.2 - 2.2 - 2.6 - 6.7
Domestic assets 82.5 92.9 97.4 101.6 104.5 100.0 105.6 62.6Credit to control Government, net 38.2 39.9 36.9 42.8 35.7 )-5.1 46.2 28.5(Credit) ( 55.9 ) (52.0) (46.3 ) (55.1 ) (51.8 ) (14.8 705 565(Deposit ( -17.7 ) (-12.1 ) (-9.4 ) (-12.3 ) (-16.1 24(-19.7 (-23 i8Credit to rest of oublic sector, net -13.4 - 9.7 - 5.2 - 4.6 - 1.8 2.5 2.9 - 4.2(Credit) ( 0.6) (0.7) (0.2) (0.6) (4.4) (7.9) (9.7) (6.3(Deposits) ( 14.0) (-10.4) (54) (-52) (- 6.2) (5.4) (-6.8) (-10.,)Credit to commercial banks 23.6 24.8 23.1 19.8 27.3 21.1 28.4 2L,.6From domestic resources 14.7 16.0 14.3 11.3 19.5 13.7 22,1 21.1From foreign resources 7.2 7.3 7.5 7.3 607 6.2 4.9 2.6Bank securities 1.7 1.5 1.3 1.2 1.1 1.2 1.4 0.9Credit to development institutions 19.3 22.7 27.4 27.1 26.2 12.9 1/ 9.3 5.1From domestic resources 13.4 14.6 15.7 14.1 13.6 2.7 1.0 0.1From foreign resources 5.7 7.5 11.2 12.4 12.0 9.6 7.2 4.2
Securities 0.2 0.6 0.5 0.6 o.6 0.6 1.1 0.8Official capital and reserves -9.8 -10.6 -10.3 -10.3 -10.3 -10.3 -10.3 -13.3Subscriotions to international agencies 10.2 10.8 13.2 14.9 15.4 17.2 21.5 25.8Deposits of international agencies - 3.8 - 2.9 - 5.1 - 5.4 - 4.9 - 6.7 -11.7 -16.3Unclassified assets, net 18.2 17.6 17.4 17.3 16.9 18.2 19.3 9.6(Assets) (20.1) (20.2) (18.3) (18.3) (17.5) (18.8) (21.2) (23.1(Liabilities) (-1.9 ) (-2.6 ) (-0.9) (-1.0 ) (-0.6 ) (-0.6 ) (-1.9) (-13.5
Allocation of SDRS - - - - 4.2 8.1 12.9 14.3
Foreign liabilities (medium and long-term) 15.6 16.2 20.6 21.6 21.5 1907 16.5 10.2
Liabilities to banks 38.8 40.8 43.3 50.0 63.0 69.3 100.2 115.4Commercial banks 3 3 4. 4W.2 lO0.2Cash in vaults 4.2 4.8 7.4 7.4 7.4 8.2 8.9 11.4Reserve de?osits 31.7 34.o 34.2 41.0 53.4 58.6 86.2 96.7Foreign exchange deoosits 0.1 0.1 0.1 0.1 0.1 0.1 0.1 0.1Development institutions 2.8 1.9 1.6 1.5 2.1 2.4 5.0 7.2Cash in vaults 0.2 0.3 0.5 0.4 0.4 0.5 0.4 0.7Reserve deoosits 1.8 1.2 0.9 0.8 1.1 1.9 4.4 6.5Sinking fund deposits 0.8 0.4 0.2 0.3 o06 - 0.2 -
Currency in circulation 81.1 82.5 82.8 90.9 96.1 98.4 113.6 136.7
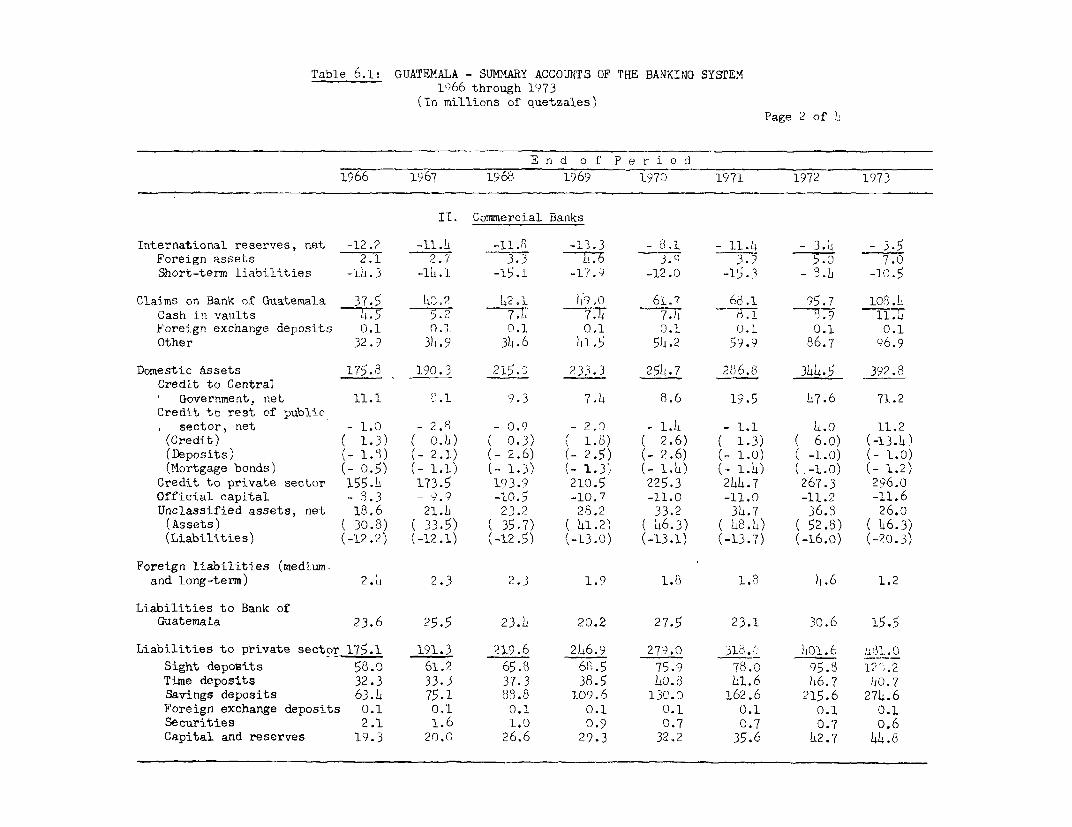
Table 6.1: GUATEMALA - SUMMARY ACCOUNTS OF THE BANKING SYSTEM1')66 through 1973
(Tn millions of quetzales)Page 2 of 2
E n d o f P e r i o d
1966 1967 1968 1969 1970 1971 1972 1973
IT. Commercial Banks
International reserves, net -12.2 -11. -11. -13.3 - 8.1 - 11.4 - 3.2 - 3.5
Foreign assets 2.1 2.7 3.3 3.9 3. 7.0
Short-term liabilities -12.3 -1l.1 -15.1 -17.9 -12.0 -15.3 - 3.2 -10.5
Claims on Bank of Guatemala 37.5 0.? ,2.1 2-Q0 61.7 6,S.1 5. 7 108.2
Cash in vaults 45 5.2 7T 7T; -7.7 . 1.
Foreign exchange deposits 0.1 0.1. 0.1 0.1 0.1 0.1 0.1 0.1
Other 32.9 32.9 34.6 21.5 52.2 59.9 56.7 96.9
Domestic Assets 175.8 190.3 215.o 233.3 252.7 286.8 342.5 392.8
Credit to CentralI Government, net 11.1 P.1 9.3 7.4 8.6 19.5 27.6 71.2
Credit to rest of publicsector, net - 1.0 - 2.8 - 0.9 - 2.0 - I.h - 1.1 .0 11.2
(Credit) ( 1.3) ( 0-.) ( 0.3) ( 1.8) ( 2.6) ( 1.3) ( 6.o) (-13.4)
(Deposits) (- 1.8) (- 2.1) (- 2.6) (- 2.5) (_ 2.6) (- 1.0) ( -1.0) (- 1.0)
(Mortgage bonds) (- 0.5) (- 1.1) (- 1-3) 1- 1.3, - 1.2) (- 1.4) (-1.O) 1- 1.2)
Credit to private sector 155.2 173.5 193.9 210.5 225.3 2122.7 267.3 296.0
Official capital - 8.3 - 9.9 -10.5 -10.7 -11.0 -11.0 -11.2 -11.6
Unclassified assets, net 18.6 21.2 23.2 28.2 33.2 3h.7 36.8 26.o
(Assets) ( 30.8) ( 33-5) ( 35.7) 4 21.2) ( 26.3) ( 48.) (52.8) ( 46-3)
(Liabilities) (-12.2) (-12.1) (-12.5) (-13.0) (-13.1) (-13.7) (-16.0) (-20.3)
Foreign liabilities (medium-and long-term) 2.2 2.3 2.3 1.9 1.8 1.3 2.6 1.2
Liabilities to Bank ofGuatemala 23.6 25.5 23.2 20.2 27.5 23.1 30.6 15.5
Liabilities to private sector 175.1 191.3 219.6 2l46.9 27'?.0 31i.i 2i0.6 6 i81.0
Sight deposits 56.0 61.2 65.8 63.5 75.9 78.0 95.8 1?:.2
Time deposits 32.3 33.3 37.3 38.5 ho.8 L1.6 26.7 20.7
Savings deposits 63.2 75.1 39.8 109.6 130.0 162.6 215.6 272.6
Foreign exchange deposits 0.1 0.1 0.1 0.1 0.1 0.1 0.1 0.1
Securities 2.1 1.6 1.0 0.9 0.7 0.7 0.7 0.6
Capital and reserves 19.3 20.0 26.6 29.3 32.2 35.6 42.7 44.8

Page 3 of 4Table 6.1: GUATEMALA - SUMMARY ACCOUNTS OF THE BANKING SYSTEM
1966 through 1973(In millions of quetzales)
E n d o f P e r i o d1966 1967 1968 1969 1970 1971 1972 1973
III. Development Institutions
International reserves, net 0.1 0.2 -0.5 -0.3 - -0.1 0.1 -9.0
Foreign assets 0.1 0.3 0.2 0.3 0.3 - 0.3 0.
Short-term liabilities - -0.1 -0.7 -o.6 -0.3 -0.1 -0.2 -9.3
Claims on Bank of Guatemala 2.0 1.5 1.7 1.2 1.6 2.4 5.0 7.3
Cash in vaults 0.2 0.3 0 4 07 o 0h o.7
Deposits 1.8 1.2 1.3 0.8 1.2 1.9 4.6 6.6
Domestic assets 2h.0 29.0 33.1 34.6 3h.1 20.5 16.3 26.4
Credit to Central Government, net 0.1 0.1 0.1 1.1 1.0 2.1 7_7 g.6
Credit to rest of public sector, net -0.8 -0o5 -0.7 -0.8 -1.0 -1.0 -1.9 -1.2
(Credit) 0 °3) (- ) (0.1) ( - 0 ) (-)°3)
(Deposits) (-0.5) (-0.1) (-0-1) (-0.2) (-0.2) (-0.3) C-16) (-0.9)
(Mortgage bonds) (-o.6) (-o-.L) (-0.7) (-o.6) (-0.8) (-0.7;/ (-0.4) (-0.6)
Credit to private sector 22.6 25.9 25.3 24.4 23.6 12.5.J 10.8 9.9
Official capital -10,) -9.5 -9.1 -8.6 -7.3 -4.5 -5.5 -12.0
Unclassified assets, net 12.5 13.0 17.5 18.5 17.8 11.h 10.3 24.1
(Assets) (19.6) (20.1) (24.8) (25.8) (25.7) (13.6) (15.3) (33.1)
(Liabilities) (-7.1) (-7-1) (-7.3) (-7.3) (-7.9) (-2.2) (-5.0) (-9-0)
Foreign liabilities (medium-andlong-term) 1.6 1.5 1.3 1.1 0.9 0.8 o.6 0.5
Liabilities to Bank of Guatemala 20.0 23.5 27.8 27.2 26.7 13.71/ 9.7 5.5
Liabilities to private sector h.5 5.7 5.2 7.2 8.1 8.3 11.1 18.7
Sight deposits 11.9 6 1.7 1.9 2.0 2.1 3.4
Time deposits 0o. 1.1 0.7 2.0 1.8 1.5 3.0 5.7
Savings deposits 2.5 2.7 2.9 3.5 4.3 4.7 5.9 9.6
Securities - - - - 0.1 0.1 0.1 -
1/ In mid-1971 Q8 million of the development institutions' claims on the National Plantations were transferred to
the Bank of Guatemala and reclassified as claims on the Government.

Page 4 of 4Table 6.1: GUATEMALA - SUMMARY ACCOUNTS OF THE BANKING SYSTEM
1966 through 1973(In millions of quetzales)
E n d p e r i o d
196,6 1967 1?6, J69 171 :972 1973
IV. Barking System
International reserves, net 40.9 35.4 37.0 47.4 72.2 84.0 134.3 201.3Gold and foreign assets 62.9 69.O 79.3 7 90.0 123.2 203.1Net IMF position -5.3 -15.2 -13,4 -11.1 - 3.0 9.8 10.9Holdings of SDRs - - - 2.0 8.6 12.5 13.8Short-term liabilities -1677 -17.9 -18.6 -20.8 -'5.5 -17.6 -112 -26.5
Domestic assets 239.5 264.1 294.8 322.2 339.4 371.1 426.6 461.3Credit to Central Government, net 4 0 T.1 46 . 3 51.3 415.3 77 96.4Credit to rest of public sector, net -15.2 -13.0 -6.8 -7.4 -4t.2 0.4 5.0 5.8
(Credit) ( 2.2) ( 1.1) ( 3-3) ( 2.4) ( 7-0) ( 9.2) (15-7) ( 20.0)(Deposits) (-16,3) (12.6) (-6.1) (-7.9) (-9.0) (-6.7) (-9.3) (-12.4)(Mortgage bonds) -1.1) (,1.5) (-2.0) (-1.9) (-2.2) (-2.1) (-14) ( -1.8)
Credit to private sector 178.0 199.4 219.2 234.9 248.9 257.2 278.1 305.9Official capital and reserves -26.5 -30.0 -29.9 -29.6 -28.6 -25.8 -27.0 -33.9Subscriptions to international agercies 10.2 10.8 13.2 14.9 15.4 17.2 21.5 25.bDeposits of international agencies -3.8 -2.9 -5.1 -5.4 -4.9 -6.7 -11.7 -16.3Unclassified assets, net 49.3 52.0 58.1 64.0 67.9 64.3 66.6 59.7
(Assets) ( 70.5) C 73.d) (78.8) ( 85-3) ( 89.5) ( b0.6) ( 89.5) (102.5)(Liabilities) (-21.2) (-21.6) (-20.7) (-21.3) (-21.)) (-16.5) (-22.9) (-42.8)
Interbank float 0.1 -0,3 -0.2 -0.5 -0.4 -1.6 -2.3 9.0
Allocation of SDR _- - - 4.2 8.1 12.9 14.3
Foreign liabilities (medlum and long
term) 19.6 20.0 24.2 24.6 24.2 22.3 ,21.7 1.9
LE--b-ltics to cr .sts sector 260.8 279.5 307.6 345.0 383.2 425.3 526,3 636,4Currency in circulation T7TT o 2 82.o 90.9 96.1 9T.4 11.6 136.7Sight deposits 59.6 63.1 67.4 70.2 77.1 80.0 97.9 123.6Time deposits 32.7 34.4 38.0 4005 42.6 43.1 49.7 46.4Savings deposits 65.9 77.8 91.7 113.1 134.3 167.3 221.5 284.2Foreign exchange deposits 0.1 0.1 0.1 0.1 0.1 0.1 0.1 0.1Securities 2.1 1.6 1.0 0.9 0.06 0.8 0.8 0.6Capital and Reserves 19.3 20.0 26.6 29.3 32.2 35.6 42.7 44.8
Source: Bank of Guatemala and IMF.
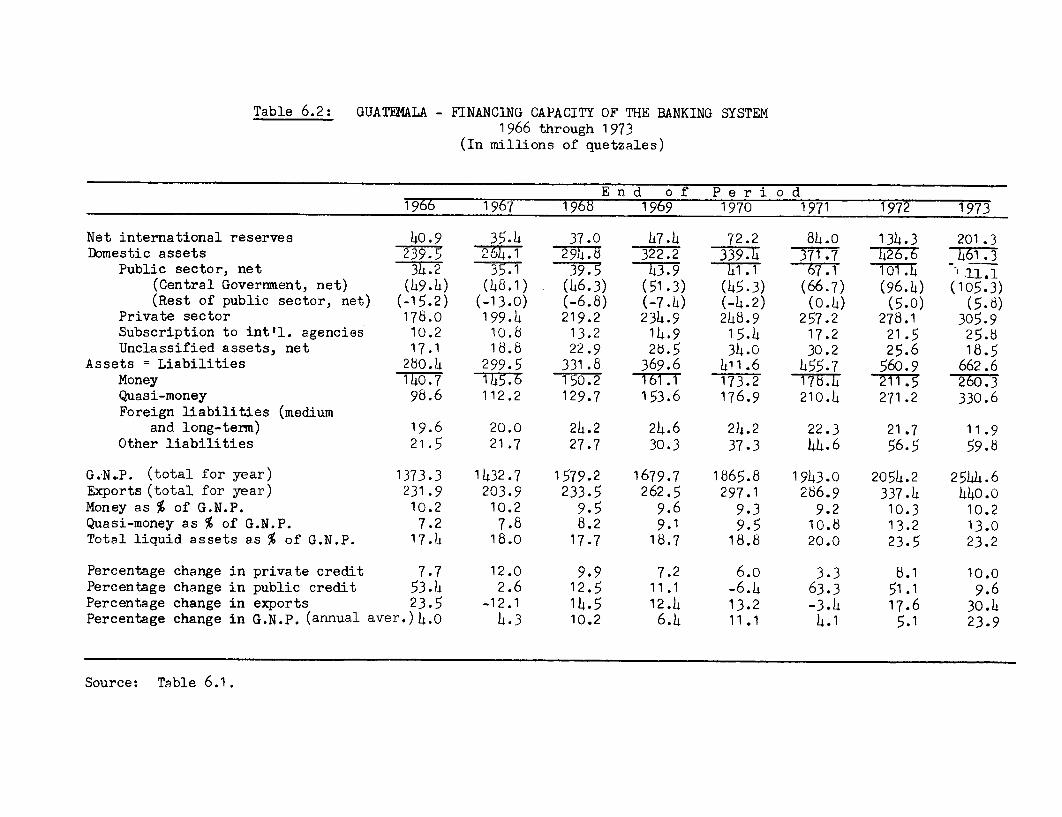
Table 6.2: GUATEKALA - FINANCING CAPACITY OF THE BANKING SYSTEM1966 through 1973
(In millions of quetzales)
E n d o f P e r i o d1966 1967 1968 1969 1970 1971 1972 1973
Net international reserves 40.9 35.4 37.0 47.4 72.2 84.0 134.3 201.3Domestic assets 2 39.5 77 97v7 1322.2 339.4 371.7 426.6 461.3
Public sector, net 34.2 3 3 43.9 41.1 67. 101.4 11.1(Central Government, net) (49.4) (48.1) (46.3) (51.3) (45.3) (66.7) (96.4) (105.3)(Rest of public sector, net) (-15.2) (-13.0) (-6.8) (-7.h) (-4.2) (0.4) (5.0) (5.6)
Private sector 176.0 199.4 219.2 234.9 248.9 257.2 278.1 305.9Subscription to int'l. agencies 10.2 10.8 13.2 14.9 15.4 17.2 21.5 25.5Unclassified assets, net 17.1 16.8 22.9 25.5 34.0 30.2 25.6 18.5
Assets = Liabilities 280.4 299.5 331.8 369.6 411.6 455.7 560.9 662.6Money 140.7 145.6 150.2 1T6T7 173.2 177.4 271.5 260.3Quasi-money 9b.6 112.2 129.7 153.6 176.9 210.4 271.2 330.6Foreign liabilities (medium
and long-term) 19.6 20.0 24.2 24.6 24.2 22.3 21.7 11.9Other liabilities 21.5 21.7 27.7 30.3 37.3 44.6 56.5 59.8
G.N.P. (total for year) 1373.3 1432.7 1579.2 1679.7 1865.8 1943.0 2054.2 2544.6Exports (total for year) 231.9 203.9 233.5 262.5 297.1 266.9 337.4 440.0Money as % of G.N.P. 10.2 10.2 9.5 9.6 9.3 9.2 10.3 10.2Quasi-money as % of G.N.P. 7.2 7.8 8.2 9.1 9.5 10.8 13.2 13.0Total liquid assets as % of G.N.P. 17.4 18.0 17.7 18.7 18.8 20.0 23.5 23.2
Percentage change in private credit 7.7 12.0 9.9 7.2 6.o 3.3 8.1 10.0Percentage change in public credit 53.4 2.6 12.5 11.1 -6.4 63.3 51.1 9.6Percentage change in exports 23.5 -12.1 14.5 12.4 13.2 -3.4 17.6 30.4Percentage change in G.N.P. (annual aver.)4.o 4.3 10.2 6.4 11.1 4.1 5.1 23.9
Source: Table 6.1.
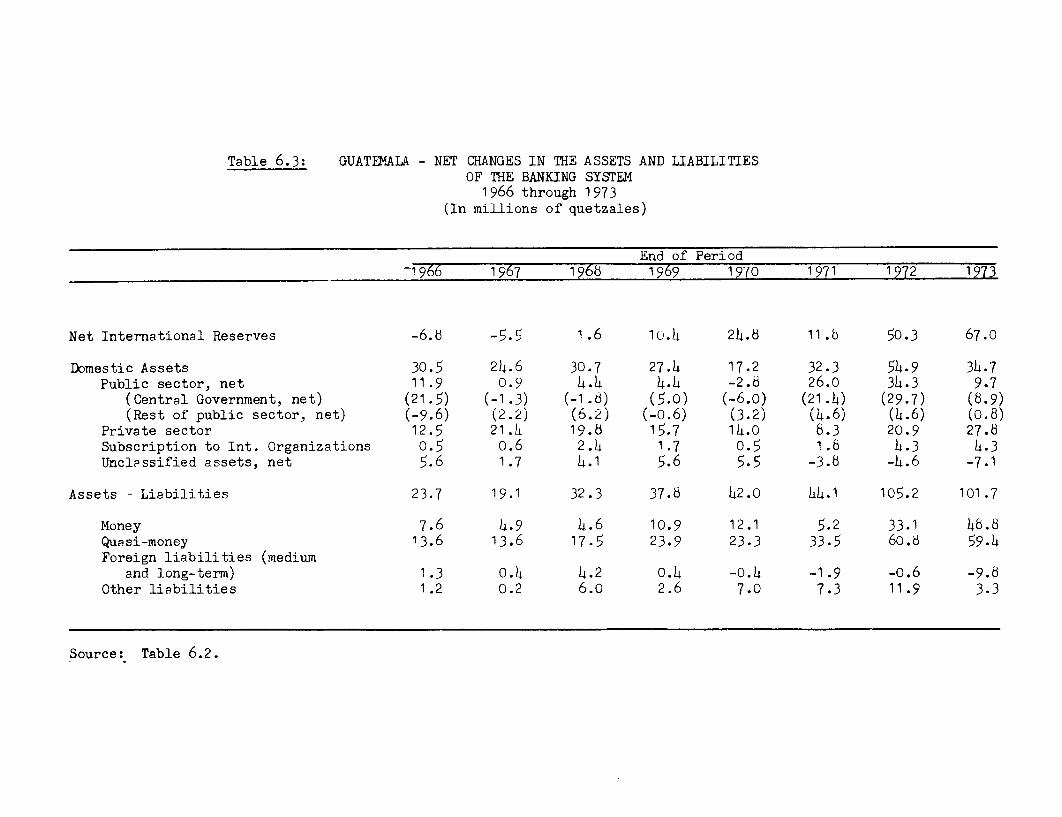
Table 6.3: GUATEMALA - NET CHANGES IN THE ASSETS AND LIABILITIESOF THE BANKING SYSTEM
1 966 through 1 97 3(In millions of quetzales)
End of Period-1966 1967 1968 1969 1970 1971 1972 1973
Net International Reserves -6.8 -5.5 1.6 lo.4 24.8 11.b 50.3 67.0
Domestic Assets 30.5 24.6 30.7 27.4 17.2 32.3 54.9 34.7Public sector, net 11.9 0.9 4.h4 4.4 -2.8 26.0 34.3 9.7
(Central Government, net) (21-5) (-1.3) (-1.8) (MO) (-6.0) (21.4) (29-7) (8-9)(Rest of public sector, net) (-9.6) (2.2) (6.2) (-0.6) (3.2) (4.6) (4.6) (0.8)
Private sector 12.5 21.4 19.8 15.7 l4.o 8.3 20.9 27.8Subscription to Int. Organizations 0.5 o.6 2.4 1.7 0.5 1.8 4.3 4.3Unclassified assets, net 5.6 1.7 4.1 5.6 5.5 -3.8 -4.6 -7.1
Assets - Liabilities 23.7 19.1 32.3 37.6 42.0 44.1 1O5.2 101.7
Money 7.6 4.9 4.6 10.9 12.1 5.2 33.1 48.8Quasi-money 13.6 13.6 17.5 23.9 23.3 33.5 60.8 59.4Foreign liabilities (medium
and long-term) 1.3 o.4 4.2 0.4 -o.4 -1.9 -0.6 -9.8Other liabilities 1.2 0.2 6.o 2.6 7.0 7.3 11.9 3.3
Source: Table 6.2.
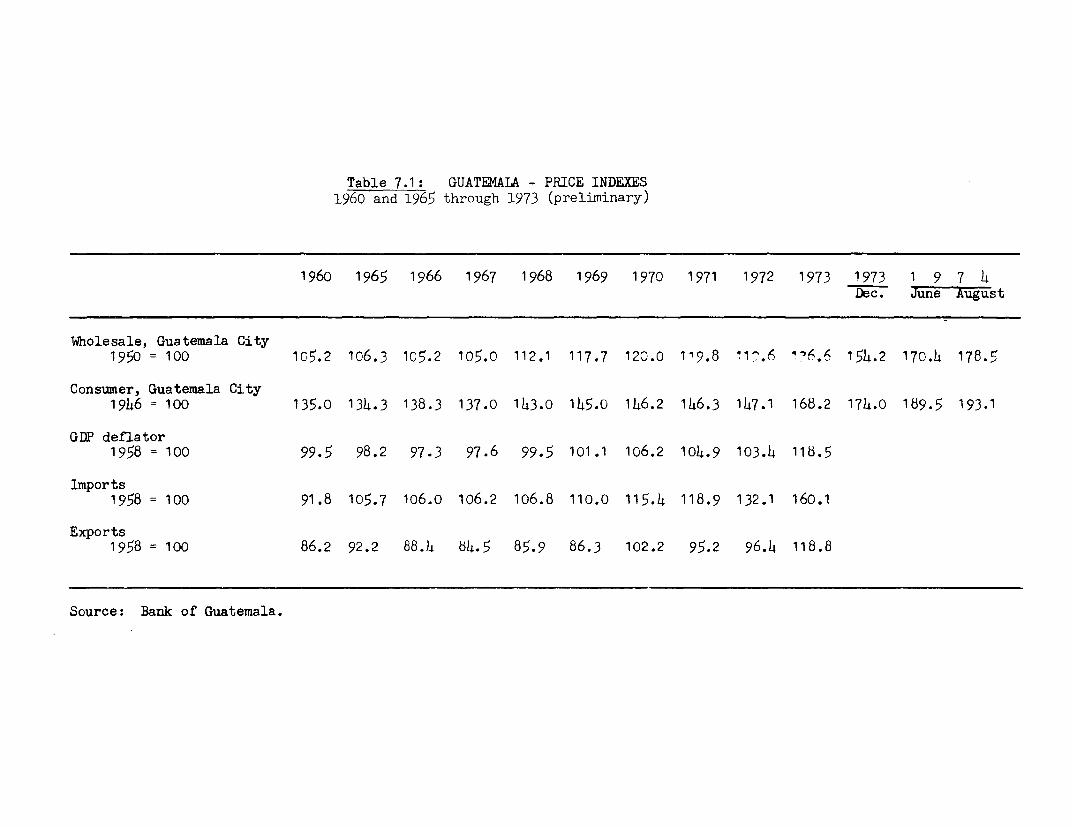
Table 7.1: GUATEMALA - PRICE INDEXES1960 and 1965 through 1973 (preliminary)
1960 1965 1966 1967 1968 1969 1970 1971 1972 1973 1973 1 9 7 4Dec. June August
Wholesale, Guatemala City1950 = 100 105.2 106.3 1C5.2 105.0 112.1 117.7 120.0 119.8 11^.6 1"'.6 154.2 170.4 178.5
Consumer, Guatemala City1946 = 100 135.0 134.3 138.3 137.0 143.0 145.0 146.2 146.3 147.1 168.2 17h.0 189.5 193.1
GDP deflator1958 = 100 99.5 98.2 97.3 97.6 99.5 101.1 106.2 10h.9 103.4 115.5
Imports1958 = 100 91.8 105.7 106.0 106.2 106.8 110.0 115.4 118.9 132.1 160.1
Exports1958 = 100 86.2 92.2 88.4 84.5 85.9 86.3 102.2 95.2 96.4 118.8
Source: Bank of Guatemala.


GUATEMALA M E X I C O
Main roads
Secondary roads
Railroads
*.~ Airports DOos Logunas
Ports
Department boundaries
_ _ International boundaries +oCj
11 °'Poso Caballos
P E T E N j0!
Lake Petin Melchor Menco
- Flores
20 40 60 80 La Libertad aSn FranciscoK ILOMETERS5<
* b
10 20 30 40 50 S r;~ i o+Santo Toribi o
MILhrrnd ES Ohuno
In1pd
rmWly rnd.- 1an ,r 0-pi-Wr bi, th. a Saya xc eIVorld rto-A -red lza .0.1. + 1
A j
tN \ ~~~~~~~~~~~~,OPctunj/
E X IC 0 Gulf
. . . . . . . . . . .. Hon dui
> i ~~~~~~San Mateo lxtaton/ i _8_ \
/H / U E H U E T XA NM RA L T A A P A XMIBALZPR SJC T
AL TA V E ~~~qui PAZ A B9 4_ AE E L Q U I C H E 0 COBAN*+ - ~ < EL ASTORSIL
Pan IZAguL M< Borales.Tutiupa HUEHUETE~G
usa~~~g
Cahen;e NT CR Z DE\LIH SALAM Z A C -<OAn
K N M/>L CUZOC T°1ZIIClAPAN gSANTA CRUZ DEL OUidICE7 Z AP rUNqN
ZATCANPCAPA
Con epci6n n H O N D U R A'0tQE•ALTENANG0 ZiJ
\_P C 'l SOALLO 1AT EIAALAO HIQUIMULA \
* Champerc ATr\AC 1
hima I nnT LA LH U I 1IJ UL A
>TENANGo j ANTIGUAJ j < ~~~~~~JTIP 4 A P MEAC ' / C B9
ATE S C /1 Sl GT0 . ChBqUATEMUIIIIO>J U T I A PA ( UATEMALA4bNDURAS >-
- El Teco atcc>/ ( Izbopa ) \ (/~~~~~~~~~~ °S'0 14 - EL SALVADOR 'NICARAGUA'
S~~~~~~~~~~~~~~~~Pac,fcocea_.n 0X
/F/C OCc'A N - ~ SANJ0SE -% IS tocAfc O9,


![The Status of [ ] in Guatemalan Spanish (1997)](https://img.pdfslide.us/doc/110x75/586cd3e41a28ab6d768bf097/the-status-of-in-guatemalan-spanish-1997.jpg)