Embed Size (px)
Citation preview
Report No. 11583-SW
SwazilandPublic Expenditure Review
July 1, 1993
Country Operations DivisionSouthern Africa Department
FOR OFFICIAL USE ONLY
Document of the World Bank
This document has a restricted distribution and may be used by recipientsonly in the performance of their official duties. Its contents may not otherwisebe disclosed without World Bank authorization.
Pub
lic D
iscl
osur
e A
utho
rized
Pub
lic D
iscl
osur
e A
utho
rized
Pub
lic D
iscl
osur
e A
utho
rized
Pub
lic D
iscl
osur
e A
utho
rized
Pub
lic D
iscl
osur
e A
utho
rized
Pub
lic D
iscl
osur
e A
utho
rized
Pub
lic D
iscl
osur
e A
utho
rized
Pub
lic D
iscl
osur
e A
utho
rized
CURRENCY EQUIVALENTSUSD 1.00 = 2.7 Emalangeni
Fiscal Year: April 1 to March 31
ABBREVIATIONS AND ACRONYMS
ADB African Dvelopment BankCBPMS Capital Budgeting, Planning and Monitoring SystemCBS Central Bank of SwazilandCEF Capital Investment FundCMA Common Monetary AreaCSO Central Statistical OfficeCTA Central Transport AuthorityCTA Central Transport AdministrationCTB Central Tender BoardEAU External Assistance UnitEC European ConununityEFAs External Financing AgenciesEPO Economic Planning OfficeESKOM South African Electricity CommissionHIID Harvard International Institute of DevelopmentLAM Mozambique AirwaysLRMC Long-Run Marginal CostsMEPD Ministry of Economic Planning DevelopmentMHUD Ministry of Housing and Urban DevelopmentMNLUE Ministry of Natural Resources, Land Utilization and EnergyMOE Ministry of EducationMOF Minsitry of FinanceMOLPS Ministry of Labor and Public ServiceMOW Ministry of WorksMOWC Ministry of Works and CommunicationsMPUs Ministerial Planning UnitsMT Ministry of TransportNATCAP National Technical Corporation Assessment and ProgramNERCOM National Education Review CommissionNIDC National Industrial Development CorporationNRL Northern Rail LinkNWA National Water AuthorityPBC Planning and Budgeting CommitteePEU Public Enterprise UnitPTC Post and Telecommunications CorporationPU Planning UnitRB Roads BranchRRA Recruitment and Retention AllowanceRWSB Rural Water Supply BoardSACU Sothern AFrica Customs UnionSATS South African RailwaysSCOT Swaziland College of TechnologySEB Swaziland Electricity BoardSEDCO Small Enterprise Development CompanySIDC Swaziland Industrial Development CompanySIHS Swaziland Institute of Health SciencesSIMPA Swaziland Institute of Management and Public AdministrationSNACS Swaziland National Association of Civil ServantsSNAT Swaziland National Association of Civil TeachersSNL Swazi Nation LandSR Swaziland RailwaysTCS Technical Cooperation SectionTDL Title Deed LandTEC Total Estimated CostUPS Uninterruptible Power SupplyVAT Value Added TaxVOCTIM Vocational Training Institute MatsaphaWSB Water and Sewage BoardZC Royal Swazi National Airways
FOR OFFICIAL USE ONLY
Preface
This World Bank Report is based on the findings of a mission to Swaziland inOctober 1991. The Bank mission comprised Rocio Castro (mission leader), Peter Fallon andAnna Muganda from AF6CO, Melody Mason, Christopher Joubert, and Gavin Maasdorp(Consultants). In addition, Asamenetch Fantaye (AF6IN) prepared the Chapter on the Waterand Sewerage Board and Caroline Sullivan (Consultant) contributed to the Chapter on thLeSwaziland Electricity Board. Mike Stevens, adviser from OPRPG, provided valuableguidance throughout the preparation of the report. The green cover draft of the Report wasdiscussed with the Swaziland authorities in February 1993.
This document has a restricted distribution and may be used by recipients only in theperfornance of their official duties. Its contents may not otherwise be disclosed withoutWorld Bank authorization.
TABLE OF CONTENTS
Pape
EXECUTIVE SUMMARY ................................... i--xv
I. MACROECONOMIC FRAMEWORKIntroduction ..A. Output, Demand and Employment Trends. 2B. Prices and Wages .10C. Money and Credit .11D. External Trade and Payments .12E. Public Sector Finance .14F. Conclusions and Recommendations .25
II. PUBLIC SECTOR MANAGEMENTIntroduction ............. ............. 29A. Institutional Setting ............................ 29B. The Development Planning System ........... .......... 30C. Institutional Issues . ........................... 40D. External Financing Issues ........................... 42
III. PUBLIC PAY AND EMPLOYMENT ISSUESIntroduction ............... .... 43A. The Size and Composition of Public Sector Employmen4 .... ... 46B. Public Sector Pay .......... ...................... 47C. Policy Analysis .......... ....................... 53
IV. EDUCATION SECTORIntroduction ............. ............. 56A. Financial Analysis ............................ 56B. Analysis of Performance Indicators ............ ......... 63C. Policy Considerations ........................... 63D. Conclusions and Recommendations ............ ......... 74
V. TRANSPORT SECTORIntroduction ............ ............ 781. Roads Sub-Sector .......... .............. 78
A. Budgetary Expenditures ......................... 78B. Issues and Recommendations ....................... 81
2. Swaziland Railways .............. ........... 88A. Financial Analysis ......................... 89B. Issues and Recommendations ....................... 95
3. Royal Swazi National Airways ........................ 99
VI. SWAZILAND ELECTRICITY BOARDIntroduction .... ............... 103A. Operating Regime ................... 103B. Quality of Service by SEB ......... .......... 106C. Capital Expenditures ...... ............. 108D. Management Systems ...... ............. 109E. Conclusions. ................................... 113
VII. WATER AND SEWERAGE BOARDIntroduction ....... .......... 115A. Intersectoral Allocation ................. 116B. Financial Performance ................. 117
ANNEXES
Annex I - Macroeconomic DataAnnex II - Education Sector Data
SWAZILAND
PUBLIC EXPENDITURE REVIEW1 '
EXECUTIVE SUMMARY
Swaziland faces the prospect of a serious deterioration in its budgetary situationunless timely measures are adopted to control the level of expenditures and improve overallpublic sector efficiency. An upsurge in economic activity experienced in the late 1980s, ledto substantial increases in fiscal revenues and large budget surpluses. On this basis,expenditures have been allowed to increase at a rapid pace but will be not be sustainable inthe medium term as economic growth has now levelled-off. Furthermore, given theuncertain regional situation, fiscal revenues are highly vulnerable to (i) changes in theSouthern African Customs Union (SACU) 2', which finances about half of the budge, and(ii) the stability of foreign investment flows which spurred the economic boom of the late1980s in the wake of the tightening of sanctions against South Africa.
Main Economic Features
1. Swaziland is a small landlocked country bordered mainly by South Africa with apopulation of around 800,000. Membership in SACU and the Common Monetary Area(CMA) have further reinforced economic ties with South Africa, which accounts for 80 and30 percent of merchandise imports and exports, respectively. In addition, workers'remittances, mostly from Swazis employed in South African mines, represent over 15 percentof GNP.
2. The economy relies on agro-forestry based activities, under a dualistic land ternuresystem. This comprises (i)a highly developed commercial subsector, dominated by capitalintensive export oriented industries, e.g., sugar and wood pulp, developed by foreign privatecapital; and (ii) a basically stagnant smallholder subsector, characterized by semi-subsistenceproduction, communal grazing and traditional tenure on the Swazi Nation Land (SNL); withlow productivity and vulnerable to droughts and changes in rainfall patterns.
3. As a small open economy, Swaziland is highly vulnerable to external shocks andsubject to wide fluctuations, typically related to changes in goods/factor flows with SouthAfrica, commodity prices and, climatic conditions. Fiscal revenues have fluctuated wiitheconomic activity while public expenditures have been rather countercyclical, e.g., higher inyears of low economic growth, not as a deliberate measure, but because they have tended tolag behind revenue changes.
IBRD lending operations with Swaziland have been inactive since the mid-1980s. This presentreport constitutes the first economic work prepared by the World Bank in several years. Thelast Country Economic Memorandum (CEM) was published November 1, 1985.
In addition to South Africa, SACU members include Botswana and Lesotho and CMA, includesNamibia and Lesotho.
- ii -
5. Since real GDP growth has, on average, outpaced population growth, per capitaincomes have increased overtime, albeit with fluctuations. Thus, with a per capita GNP ofUS$840, Swaziland falls in the category of a middle income country 3/. However, becauseof its dual system, income distribution is probably fairly uneven. Furthermore, formal sectorwages are high relative to per capita GDP, partly reflecting labor mobility with South Africa,which ultimately exerts pressures on civil service wages.
6. Swaziland's good growth record has, so far, been based on a market oriented policyand a relatively prudent fiscal stance. First, favorable conditions for foreign investment,including political stability, a number of fiscal incentives, and liberal regulations on profitremittances, have been the basis for the development of a large, mostly South African based,private sector. Second, the pursuance of a cautious fiscal policy, avoiding large budgetdeficits and limiting the size of the public sector, has ensured a stable macroeconomicframework.
7. However, Swaziland's growth outlook is colored by a great deal of uncertainty overthe future of South Africa. In addition, the fiscal situation could deteriorate rapidly as aresult of fast spending, stagnating revenues and financial pressures from the parastatal sector.
A. The Macroeconomic Framework
Recent Economic Developments
8. The Swazi economy expanded by over 5 percent per annum in real termis during thesecond half of 1980s. Real GDP growth peaked in 1986-87, at 8 percent per annum, led by aan impressive 35 percent annual increase in manufacturing output 4/. This reflected mainlythe relocation of key investments into Swaziland prompted by the tightening of sanctionsagainst South Africa. Improved export prices for sugar, reinforced by the depreciation of theLilangeni, and favorable weather conditions were also contributing factors. With the onset ofanother recession in South Africa, economic growth has recently slowed and foreigninvestment is now half the level reached in 1989. In 1992, real GDP fell by an estimated 2percent as a result of the severe drought affecting the region.
9. In line with the expansion in economic activity fiscal revenues boomed, notablycompany tax and SACU receipts, which combined with lagging expenditures resulted in largebudget surpluses in the 1987-91 period. However, budgetary deficits are expected to re-emerge from 1992 onwards, as modest revenue increases resulting from slackening economicactivity will be outpaced by increasing personnel and capital expenditures.
10. The balance of payments position was strong during the second half of 1980s as grossforeign reserves continued to build up despite substantial short term capital outflows triggeredby interest rate differentials with South Africa. Since 1988, the Central Bank has deliberatelykept interest rates below those in South Africa with the objective of encouraging investment
2' As of 1990, based on World Bank Atlas methodology.
Based on staff estimates, see Chapter 1.
- iii -
and reducing banks' liquidity. While banks' liquidity has actually been reduced, this policyhas failed to promote productive investment because the deposit structure resulting fromnegative real interest rates has favored short term lending, and interest differentials haveencouraged capital flight. As interest differentials are narrowed, this trend is gradually beingreversed.
Growth Trends and Development Constraints
11. There is concern about the long term sustainability of economic growth in SwaLziland,not only because of the unstable nature of the factors behind the economic upswing of the late1980s, but also given recent trends in other macroeconomic aggregates. In particular, thedecline in investment relative to GDP and the growth trend in wage employment.
12. The investment to GDP ratio decreased to an average of 20 percent in the late 1980s,from 30 percent the previous decade. In particular, public investment fell sharply as a resultof expenditure lags by central Government and serious financial difficulties faced by keypublic utilities. Private investment to GDP also decreased, albeit less markedly, despite theexceptional inflow of foreign investment experienced in the late 1980s. Moreover, followinga 50 percent nominal contraction in 1990, foreign investment has stagnated thereafter,suggesting that the recession in South Africa may play a determining role in the long run.
13. Another important indicator concerns the long term growth of wage employmentcompared to the labor force. In the 1980s, growth in wage employment was down to anannual average of only 2.2 percent, from 5.9 percent in the 1970s, and compared with anestimated labor force growth of 2.7 percent. This suggests that the level of unemployment inthe formal sector must be increasing.
14. The development of Swaziland will remain closely linked to South Africa. Thus, itsability to sustain economic growth and overall macroeconomic stability may be impaired byadverse developments in that country. While this dependence may limit Swaziland's scope tosustain investment and output growth, Government policy has a critical role in shaping theincentive structure for factor allocation of capital, labor, and land; through taxation and othernon-price regulations. Furthermore, Government can contribute to enhance the efficiency offactor use through investment in human resources and productive infrastructure. Thus, froma microeconomic perspective, active Government intervention is required in terms of:
(a) Human Resources. Despite Swaziland's success in expanding its educationsystem, overall quality is poor and consequently labor productivity, lo'w.Management and professional skills are in short supply and many keypositions in both private and public sector are filled by expatriates.
(b) Land. Limited flexibility for the commercial utilization of traditional land,the SNL, inhibits further development of agricultural activities and economicinfrastructure, including a housing market.
(c) Relative Factor Prices. It can be argued that current relative factor costs,tend to favor capital intensive techniques in the formal sector. Therefore,some incentive adjustments could be made to encourage more labor intensiveinvestments in the private sector.
- iv -
(d) Infrastructure. This aspect as well as (a) are concerned with the role of theGovernment as a provider of public services. As explained below, in manyinstances the government's expenditure program has not adequately respondedto the economy's needs in terms of maintenance, rehabilitation anddevelopment of physical infrastructure.
15. The country's development constraints must be addressed in the context of an updatedlong term strategy which defines priorities and policy options open to the country in themedium to long term. In this respect, the Government's decision to prepare a nationaldevelopment plan provides a suitable framework to undertake this task.
16. The national development plan should identify future sources of sustainable economicgrowth and the mechanisms for the efficient mobilization and use of public and privateresources. A few considerations need to be taken into account:
(a) The maintenance of appropriate levels of investment is a necessary but notsufficient condition for sustainable growth. Greater emphasis should be givento the quality of these investments, e.g., in terms of enhancement ofproductive infrastructure (public investment).
(b) The efficiency of public sector spending, both recurrent and capital, should beassessed within a well-defined framework of national and sectoral priorities,and taking into account existing macroeconomic constraints.
(c) Efficient mobilization and use of private resources requires appropriate priceincentives, including interest and taxation rates. In this regard, it is importantpositive real interest rates be restored, so as to reflect more closely theopportunity cost of capital, thereby promoting efficient financialintermediation.
17. The objective of this study has been twofold: first, to evaluate the sustainability offiscal expenditures from a macroeconomic perspective and second, the efficiency of publicexpenditures with particular emphasis on education and productive infrastructure, both ofwhich have been identified as potential constraints for future development.
B. Public Sector Expenditures
18. In view of the vulnerability of fiscal revenues to uncertain prospects for economicgrowth and SACU, and current expenditure trends, the Government will need to adopt criticalmeasures both to ensure sustainability and improve the efficiency of public expenditures.Otherwise, Swaziland faces the risk of undergoing even harsher stabilization measures andwasting scarce resources in the medium term.
Sustainability of Expenditures
19. The size of Government expenditures relative to GDP, about 30 percent of GDP in1991, is comparable with other countries in the region and other SACU members which have
also a large private sector 5/. However, the scope for increasing or even maintaining publicspending relative to GDP is constrained by two key factors: (i) limited prospects to raiserevenues in the medium term, (ii) the posibility of a reduction/elimination of extraordinaryreceipts obtained under SACU, representing roughly 5 percent of GDP or 20 percent of fiscalrevenue.
20. In 1992, expenditures jumped to 36 of GDP and are estimated to rise further to 40percent in 1993-94. With revenues expected to remain at around 33 percent, there is clearlyan issue of medium term sustainability if expenditure trends remain unchanged. The issue ofsustainability is further underscored by uncertainty over the future of SACU. In the mediumto long term, SACU receipts could be adversely affected by changes in the sharing agreementparticularly concerning the stabilization clause. Under this clause, Swaziland has received asa minimum 17 percent (maximum 23 percent) of total imports Y. This band could bereduced in the context of lower tariffs in South Africa and prospects of broadening its tradeagreements with other countries in the region.
21. On the revenue side, further measures need to be taken to reduce Swaziland'svulnerability to external shocks and possibly a downward adjustment in SACU receipts. Inthis regard, consideration must be given to the following aspects:
(a) Swaziland's ability to generate fiscal revenues in the long term will dependultimately on its capacity to attain sustained economic growth. From thispoint of view, the preparation of a long term development strategy, will helpto identify future sources of growth as well as appropriate incentivemechanisms. The tax structure itself, is an important element of the incentivemechanism and should be considered in that light.
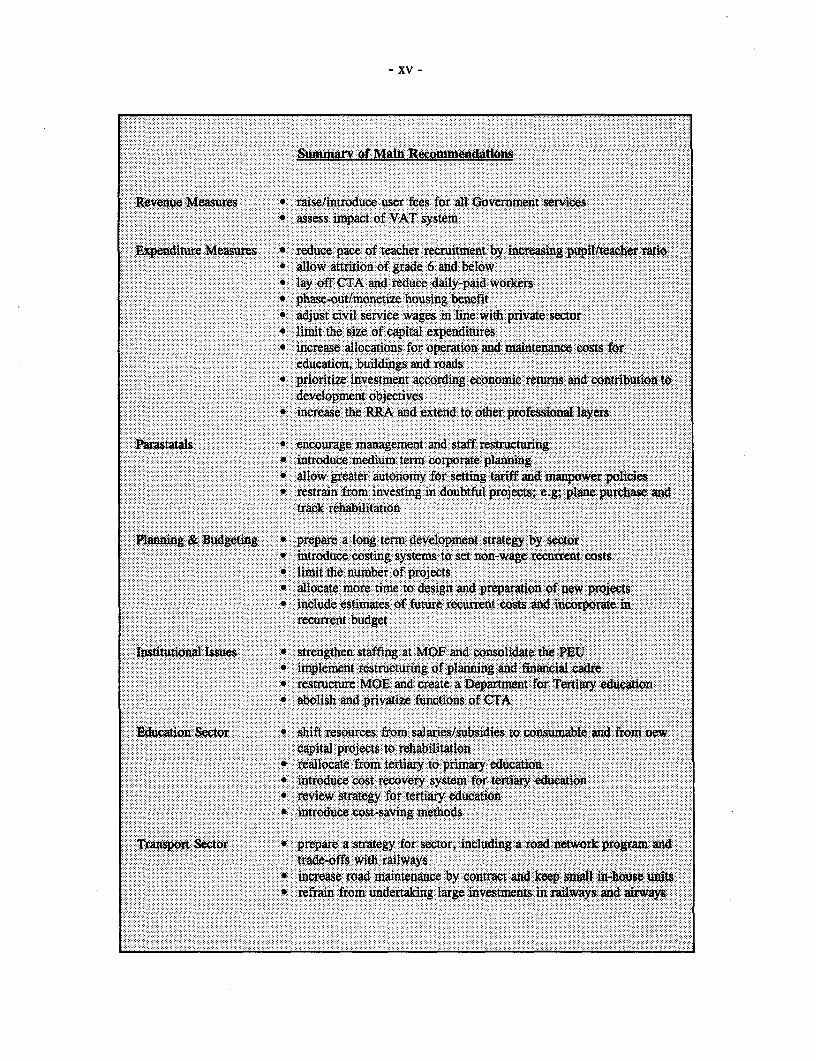
(b) In view of the introduction in 1991 of a Value Added Tax (VAT) in SouthAfrica, Swaziland might need to adopt a similar system in order to avoid widediscrepancies in relative prices compared with South Africa. An evaluation ofthe economic and fiscal impact of introducing a VAT in Swaziland, to replacethe sales tax, needs to be made at the earliest opportunity.
(c) In addition, greater emphasis should be given to expanding the revenue basethrough cost-recovery mechanisms at all levels of Government service:s byraising/introducing charges and user fees, which now represent a smallproportion of total revenues. This will contribute to enhance efficiency.
22. The sterilization of past budgetary surpluses, through the Capital Investment .Fund(CIF), is a right step to cushion the impact of economic fluctuations, but will not be enoughto address longer term issues. Therefore, the Government should pursue a cautious fiscal
Compared for example with Lesotho (31 percent) and Botswana (39 percent).
SACU receipts are calculated applying a compensation factor (1.42) to the average importtariff levied by South Africa. Under the stabilization clause, receipts must fall within a bandof 17 to 23 percent of total imports with a two year lag. Typically, Swaziland has receivedthe lower end of the band.
- vi -
policy, emphasizing sustainability issues both with regard the central Governmentexpenditures and the parastatal sector.
23. The level of expenditures must be kept in line with the revenue base, which is notlikely to exceed 33 percent of GDP in the medium to long term. Priority must be given tolimiting the expansion of the wage bill through a prudent employment and wage policy. Inaddition, the Government needs to review its housing policy, which has implications for therecurrent and capital budget, and to take more into consideration the recurrent costs of itscapital program.
(a) Employment policy. A tight rein must be kept on the size of the civil service,which is large by international standards, through (i) reducing the pace ofteacher recruitment. This would imply an increase of the pupil/teacher ratiowhich at present is lower than other countries and the recommended norm; (ii)allowing posts at grades 6 and below to decline with natural wastage until astaffing reduction of one third in numbers have been achieved; (iii) laying-offstaff at the Central Transport Administration (CTA); and (iv) reducing thenumber of casual/daily paid workers.
(b) Wage Policy. Pay adjustments for most categories should be limited to paymovements in the private sector, while efforts should be made to narrow thesalary gap with the private sector for highly skilled civil servants.
(c) Housing Policy. The housing benefit for civil servants should be radicallyreviewed alongside measures to promote the development of a housingmarket. The provision of houses should be restricted to civil servants inremote areas, while the housing benefit should be monetized accross theboard: wage adjustments could be financed by raising all rents to marketvalues. This will eliminate inequities arising from the fact that many civilservants do not receive housing but a comparatively lower allowance. Thismeasure should be phased over several years to smooth out budgetarypressures and the impact of a redistribution in real incomes from civil servantscurrently receiving a house to those who receive an allowance.
(d) Capital Expenditures. The level of capital expenditures must be kept undercontrol, taking more fully into account (i) future recurrent costs; (ii) theimplementation capacity of the country; and (iii) the need to address thebuilding maintenance backlog, officially estimated at E500 million or twice thetotal capital budget for FY1991.
24. In particular, given the size of the proposed Komati River Basin Project, costed atE547 million, with a budgetary contribution of E276 million, additional studies need to beundertaken to establish the economic viability and appropriate phasing of the project.
25. In addition, it is critical that the posible financial impact of the parastatal sector beexplicitly factored in the central Government budgetary projections, particularly given thedifficulties faced by key public enterprises.
- vii -
Parastatal Subsector
26. The financial situation of key parastatals has been reflected in the significant level ofoperating losses accumulated over the years. Major loss making companies include; RoyalSwazi National Airways (ZC), Swaziland Electricity Board (SEB), Swaziland Railways (SR)and Water and Sewerage Board (WSB).
27. The flow of funds from parastatals to Government in terms of income tax anddividends are negligible. Instead, budgetary resources have been channelled to the sector inthe form of (i) explicit subsidies to cover operating costs, (ii) loan capital for debt serviceassistance--included under net lending; and (iii) direct financing of capital expenditures.
28. The gross flow of budgetary resources to parastatals, excluding direct financing ofcapital expenditures by the budget, increased from 2 percent of GDP in FY1985 to 4 percentin FY1989, reflecting debt service assistance to SR and the SEB. Debt service difficultieswere caused by the substantial depreciation of the Lilangeni in 1985, which increased foreigncurrency denominated debt.
29. According to proposed plans, investment requirements of five key parastatals ( ZC,SEB, SR, WSB and Post and Telecommunications Corporation - PTC) are projected at aboutE400 million over the next 3 to 4 years. Some of these investments such as the rehabilitationof the rail track (E70 million) and the acquisition of a new plane (E150 million) are ofdoubtful economic benefit and threfore should not be undertaken.
30. Most of these parastatals are highly indebted and would not be able to finance futurecapital expenditures unless they substantially improve their financial situation. In the interimperiod, they constitute a potential burden for the Government budget. In order to improve theperformance of parastatals, priority must be given to the following aspects:
(a) Management and staff restructuring. Lack of qualified managers at thefinancial and technical level are a key source of inefficiency in parastatals, andfirms face serious problems in recruiting and retaining highly qualifiedpersonnel.
(b) Introduction of medium term corporate planning. Most parastatals havelacked a medium term framework to assess their capital programs, andtherefore a strategic view to guide decision making. However, a number ofparastatals have now began to prepare corporate plans and this practice: shouldbe reinforced.
(c) Greater autonomy for setting tariffs and manpower policies. Ministerialapproval is needed for both tariff and salary adjustments but decisions aremade sometimes on political grounds and without the required technicalexpertise.
31. In 1989, the Public Enterprise Unit (PEU) was created at the Ministry of Finance(MOF), with the objective of establishing performance criteria for the parastatal sector. ThePEU has taken a number of positive steps including the liquidation/transfer of the HavelockAsbestos Mine, overseeing the preparation of management contracts for the public utilities
- viii -
including SEB, WSB and the PTC as well as the divestiture of the Swaziland Royal InsuranceCompany.
Efficiency of Expenditures
32. Increased efficiency in public expenditures could be achieved through a reallocation ofbudgetary resources into identified priority areas. These may be summarized as follows:
(a) The recommendations on staffing made above, will enhance the compositionof the civil service, by reducing the proportion of redundant staff.
(b) Increased funds should be allocated to finance operating and maintenance costsfor education, e.g., textbook, roads and buildings. The building maintenancebacklog needs to be urgently addressed.
(c) Priority must be given to rehabilitation over new capital projects, and lessemphasis to "unproductive" investment, eg., government buildings andhousing. Given the existing macroeconomic constraints and implementationcapacity, a careful assessment of public investment priorities should be madeacross the sectors, including the parastatals, measuring the opportunity cost ofimplementing large projects, e.g., the Komati River Basin project.
(d) Budgetary allocations to the CTA must be wholly re-assessed, in light of theGovernment's restructuring plans. The CTA absorbs a significant proportionof the budget but funds are believed to be grossly wasted. It is recommendedthat CTA be abolished and its functions privatized. In addition to enhancingefficiency, this should generate important net savings.
(e) The Recruitment and Retention Allowance (RRA) should be increased in realterms and extended to other professional layers, such as accountants. TheRRA was introduced in 1988 as an incentive to retain high level staff but hasbeen kept fixed in nominal value since its introduction.
C. Recurrent and Capital Budgeting Systems
33. Swaziland has made significant progress in developing fairly advanced budgeting andplanning systems at the central level. A three-year rolling development plan was introducedin 1989, based on a project-driven computerized system. The budgeting cycle, which runs forsix months, is dominated by the preparation of the three-year development plan. The budget,including recurrent estimates, is prepared for the first year of the plan as a by-product of thisprocess.
34. The problems with the system include (i) inadequate estimation of non-wage recurrentcosts and insufficient link between recurrent and capital budgeting; and (ii) uneven quality ofprojects. The budgeting of non-wage recurrent costs is based on inflation adjustments on theprevious year's allocations and bear no relation with the sectors actual or emerging needs, andonly a small proportion of projects include estimates of future recurrent costs. There is aconsensus that the quality of projects is frequently poor, partly because the large number of
- Ix -
projects strains the capacity of the limited number of qualified staff, and lack of a strategicframework in which to assess priorities.
35. The main recommendations to improve the budgeting and planning systems at theCentral Government level include:
(a) Preparation of a long term development strategy, so that decision making,including the allocation of public resources, can be made in the context ofnational and sectoral priorities.
(b) Introduction of costing systems, including standard costs, to estimate recurrentbudgets for operations and maintenance. This will allow expenditureprograms to be related to activity levels and other output indicators.
(c) Reduction in the number of projects, by consolidating small projects into asingle large project or, by transferring some to the recurrent budget.
(d) More time should be allocated to the design and preparation of new prcjects.All projects must include appropriate estimates of potential recurrent costs.
D. Institutional Issues
36. In the course of this review it became apparent that a number of institutional changesare required to implement some of the recommendations outlined above concerning thesustainability and efficiency of the expenditure program. Some of these changes are alreadyon-going:
(a) The highest priority must be given to strengthening the Ministry of Finance(MOF), which is seriously under-staffed at the technical level. Thesepositions, should be preferably filled with qualified local staff so as to ensurecontinuity and institutional development.
(b) Restructuring of the planning and financial cadre under the auspices of theMinistry of Economic Planning and Development (MEPD). This should helpimprove planning capabilities at line ministries and enhance decentralization.
(c) With the recent split of the Ministry of Works and Communications (MOWC)into the works and transport ministries, the MOW has kept the roadssubsector. Close coordination between the two ministries will be necessary toensure effective transport planning, which needs to be comprehensive giventhe trade-offs between railway and road transportation.
(d) The role of the PEU should be further consolidated within the institutionalframework. The unit became operational only in 1991, with the appointmentof a new director financed by USAID. It has few staff, mostly expatriates. Itis recommended that local counterparts be appointed to ensure continuity oncethe Director leaves.
x -
(e) A review of the organization and structure of the Ministry of Education(MOE) is strongly recommended. In particular, the creation of a Departmentof Tertiary Education at the MOE.
(f) In line with the Government's plans to radically restructure the CTA, it isrecommended that CTA be abolished and its activities privatized.
E. Sectoral Reviews
E.1 Education
37. Education is the largest recipient of budgetary resources. Its share in the total budget,over 30 percent, is well above the average for Africa. Although the country has been able tosignificantly expand its school system since independence in 1968, cost efficiency is very low,particularly at the primary level, as evidenced by the high repetition and drop out rates. Inaddition, key management and professional skills are in short supply.
38. It is vitally important to improve the quality of the education system. To this endresources should be shifted within the sector from (i) salaries/subsidies to consumables,specifically teaching materials for primary education and maintenance of physical facilities and(ii) from new capital projects to rehabilitation of existing facilities.
39. In terms of sub-sectoral composition, resources should be shifted from post-secondaryto primary education. The share of the recurrent budget devoted to post-secondary education,notably grants and subsidies, is far higher than the average for Africa. The main source ofsuch a shift, should be the introduction of a cost recovery system from students at the tertiarylevel.
40. Increased resources should be spent in teacher training, as teachers themselves are theproduct of a poor education system. In addition consideration should be given to introducinginnovative methods of instruction, e.g., radio and audio-visual techniques, which have provedsuccessful in other countries.
41. A number of cost-saving methods should be adopted, including (i) increasing thepupil/teacher ratio; (ii) introducing double shifts; and (iii) introducing multigrade classes; and(iv) adopting continuous assessments to minimize repetition and dropout rates.
42. A review of the strategy for tertiary education should be undertaken. In the interim,University enrolment should be limited. Labor market surveys should be carried out on aregular basis so that the syllabus and disciplines offered at the post-secondary level match theneeds of the market.
- xi -
E.2 Roads Subsector
43. The roads subsector has typically accounted for the largest proportion of the capitalbudget, nearly 20 percent. Capital expenditures increased by about 19 percent in nominalterms, between 1987 and 1990; and were projected to rise by 50 over percent per annum inthe 1991-93 period.
44. Major capital projects undertaken over past few years have been, on the whole,economically justified. However, in some cases they were not the highest priority, andi somemarginal projects, e.g., the Miliba-Mafutseni road, were undertaken before more criticalones, e.g., the upgrading of the Mbabane-Manzini road.
45. The quality of feasibility studies is variable and the Planning Unit (PU), has beenoverstretched to carry out in-depth reviews. The restructuring of the planning cadre shouldhelp strengthen the PU and define clearly terms of reference for project evaluation and fornetwork planning.
46. Although the basic arterial road network has been put in place, some networkplanning is required, as some proposed upgrading projects will divert traffic from existingpaved roads and other proposed upgrading projects; thereby affecting economic returns.
47. The main problem in the roads subsector has been inadequate road maintenance. Thisresulted from inadequate budgeting and low availability of equipment at the CTA. Progresshas been made in estimating the costs maintenance needs and implementation has improvedbecause a large proportion is being contracted out to private firms. As a result, budgetaryallocations for maintenance were raised by 30 percent in FY1991, thereby meeting 70 percentof estimated requirements.
48. The costs of contracting out periodic maintenance work is lower than using the RoadsBranch units. Therefore, it is recommended that all re-graveling and re-sealing be put out tocontract and that these units be phased out; and only a small unit be retained for emergencywork and keep in-house expertise. This would save maintenance costs by E34 million peryear, or 15 percent of the projected costs.
E.3 Railways
49. Swaziland Railways (SR), is the parastatal running the railway system. It operates asouthern rail link (SRL)--built in 1978--and a northern rail link (NRL)--built in 1985--bothconnecting with the South African railways and providing access to South African ports.
50. SR incurred consistent net losses between 1977 and 1987, amounting to E22 million.Although the increased traffic from the NRL helped to improve SR's operating ratio since1987, inability to repay the commercial loan borrowed for the construction of the line,including a E16 million foreign exchange loss, forced a Government injection of E22.4million in 1988 and 1989. The reduced debt service burden resulting from the repayment ofthe loan, allowed small operating surpluses thereafter.
- xii -
51. In addition to financial difficulties, SR suffers from serious problems of managementand overstaffing; it employs 1100 workers. Maintenance of tracks has been poor with theresult that more costly rehabilitation will be needed in future. Furthermore, recurrentaccidents, have considerably added to SR's already high operating costs. If under-maintenance and accidents were explicitly costed out, net income in recent years would havebeen negative.
52. Apart from the construction of the NRL in 1985 and the rehabilitation of the Usuthubridge in 1986, destroyed by the 1985 cyclone, no major capital expenditures have beenundertaken by SR. Total investment between 1985-90 totalled E37.1 million, and wereeffectively financed by Central Government. SR received E71.6 million in Govermnent loansbetween 1977 and 1989, including the E22.4 million for debt relief; which will probablynever be repaid.
53. Financial projections indicate that SR will incur operating losses if transit trafficdeclines drastically because of its diversion to Maputo, or at best break even if traffic levelsremain at existing levels. These projections assume, substantial tariff adjustments on localtraffic and debt forgiveness by Government.
54. In response to expected future diversion of traffic to Maputo, a major trackrehabilitation program, the Mpaka-Siweni, is being proposed by SR. The estimated cost isE70 million, to be funded as a grant by Government. Part of the project has been included inthe three year rolling plan, although no proper economic analysis has been carried out.
55. It is essential that a long term view on the future of the railways be developed, withinthe context of a transport plan, which would include an cost/benefit analysis of alternativeoptions, including closure of the railways and/or leasing the North/South line to the SouthAfrican railways. Ideally, the study should include more accurate estimates of the costs oftransporting goods by road.
56. In the interim, no major track rehabilitation should be undertaken until the role of therailways is clearly defined and acceptable economic returns are properly estimated.
57. A major financial restructuring will be necessary, if the SR, or some of its activities,are to remain in operation. These would include (i) a significant staff retrenchment(ii) debt forgiveness, or conversion to equity of debt owed to Government; and (iii) costsavings measures to reduce administration costs and overheads, particularly in terms ofvehicle fleet, allowances and gratuities.
E.4 Airways
Airline
58. The Royal Swazi National Airways (ZC), is a parastatal running a single plane airline.The ZC has operated at a net loss since its establishment in 1978, although losses havegradually declined over the past four years. This improvement reflects the repayment of theloan to purchase an aircraft in 1988, which carried substantial foreign exchange losses, anddoubling of passenger traffic.
- xiii -
59. Government's accumulated subsidies to finance ZC's losses amounted to E30 millionbetween 1985 and 1989. No subsidies were granted in 1990. ZC plans to continueoperations at a loss, particularly given the decline in passenger traffic associated with therecession in South Africa, and the breakup of its joint venture with LAM.
60. No capital expenditures are planned over the rolling plan period, but there has beendiscussion of the need to acquire a "second" plane. A second plane, costed at about E43million, would not be economically or financially justified under any circumstances over thenext few years and Government should resist any suggestions to purchase another plane.
Airport
61. There is significant political pressure to undertake an airport expansion project, withan estimated cost of E46 million. The economic analysis shows negative returns, and fuirtherstudies have been included in the rolling plan to examine how improvements can be maclemore cost-effective. In any case, such expansion should be phased in a number of years.
E.5 Electricity
62. The Swaziland Electricity Board (SEB), is a public sector corporation, with amonopoly for the transmission, generation, and distribution of electricity within Swaziland,although it may grant licenses to third parties to generate electricity for their own use.
63. Over 50 percent of electricity sales by SEB are imported from the South AfricanElectricity Commission (ESKOM). Domestic capacity is basically hydro-based, andconsequently vulnerable to periodic droughts.
64. SEB's net income position has been negative since 1985, because of inadequate lariffadjustments and increased debt service burden. The depreciation of the Lilangeni resulted insizeable foreign exchange losses on World bank loans contracted to build a hydro-powerstation in 1984. The Government prepaid these loans in 1989, and converted them intoequity.
65. Between 1985 and 1989, SEB undertook limited investments. Because of its strainingfinancial situation, the construction of a third ESKOM line was postponed until 1990, wiith theresult that systems reliability was extremely poor for several years and has only now reachedacceptable levels. A fourth ESKOM line is planned for 1994, at a cost of E20 million. Inaddition, the Government is considering an additional E41 million for another hydro-powerstation, the Maguga dam, as part of the Komati River Basin irrigation project.
66. A management contract has recently been signed between SEB and Government,which is expected to improve the financial performance of the company. Under this contract,SEB will undergo significant financial and management restructuring.
67. It is essential that tariffs are allowed to increase to cover at least operating costs. Inaddition, the Government might need to make a capital injection to cover unrealized foreignexchange losses estimated at E36 million, which if included in the balance sheet would renderSEB insolvent.
- xiv -
E.6 Water and Sewerage
68. The Water and Sewerage Board (WSB) is not an independent body but operates asGovernment department responsible for servicing principal urban areas.
69. The financial and service performance of the WSB has reached a critical stage. It hascontinuously incurred net losses, partly because insufficient tariff adjustments, and precariousbilling and collection systems (35 percent of water produced is not accounted for). Inprinciple, the Government provides subsidies to finance recurrent deficits on non-viableactivities but has also covered payroll costs, about El million per annum.
70. Government's contributions to finance WSB capital expenditures have been negligible,while overall Government investments in the water sector, including rural areas, accountedfor a mere 4 percent of total Government capital expenditures between 1985 and 1989.
71. Financial and management weakness within the Board, compounded by insufficientsupport from central Government have resulted in under-investment, as evidenced by agedand leaking pipes, and subsequently in extremely poor standards of service in the urban areas.
72. A capital program of E55.6 million, largely for rehabilitation, is envisaged for theFY1992-96 period. Unless appropriate tariff adjustments are made, the Board will not beable to significantly contribute to finance these expenditures.
73. The highest priority should be given to implement the Government's decision tomake the WSB a corporation with full authority to conduct its affairs, e.g., tariff andmanpower policy.
.
- xv -
::::::::::::::::::::�:::::�::"...�.. . � �. � �.... . .. �' I .... .. 1. -1 � ... � .,.,...,. 1-1.1 ... .. .. .-. ,...,.".., .. .. .. .. "..'......' � 1. �. . � .'..'..'..� .... .. .. ...".--�- � .. '- --- -'.......... ::::::::::::::::::::::::::::7 ........ -.-. -- "..
..... �.... -::::�: '.. .. -.-- �� . .. :� :X: -:::-: :�::::: :x: :: .::::::::::::::::::::�::�::::::::�::::::::::::::::::...,.....� ..... I.... -- : : : : ! : ::::�:::::::: :: :: : X: �: -� I1, � �I."."..,..�..,..�..,..�..�...''�.�,� ,� .. . .. ..... ' :' �. ...1%."......'.........::. . . .I .. ,. -� .. ....'.....'..-I....%-:'X:X::::::::::::::::' .- . ,'',. -. ...... 1; : -::X; :V:::-.�:.. :� ...... ,....,.......,.:X::- :- : �::::::: �:: :: :: .1 �-...'..... - .,...,...,..�".,.,....,..,.....,.....,.,......,....,.,...�.,���,����� �". -'....'.'..-l -�'.'- -- '... . . �. - - .. .....,..,..,...........,..,....."",.�'. .. ''...1--l- ... �.....I.....-..... ."'...----- 1.1- .. 1. .. 1. 1. I-- ..... ''. -.. - �� -I 1. I.- 1. - 1. - - .. .. 1-1.1-1 ....................... ... - .. -- ............ �...............-� �-,-� -1. . ............... �..-... 1. ..--.... --- ..... .. ..... .. .. .. .. ........ .. I 1-.�,.. . --.b..-...-... .- :. . .�:;�:� .. -..... .. .. .. .. ........-- �-...... -.- -1-1. ... I.--................... 1-1- .... . . . . . .-. .....".....- :: ` . 1. .. .. I....... ''. ... I. I.. -.. .. ........ �:::�: , ,: :�::: : ::: '. ,. .: ...... ..... �:.:�:.:.:�:.:. ..: :� �: .�I--- .. ��11.. I.I.1.I........ ....... 11 .I.. .. -1.-..........-, , �:: : : : : I . .'% -X ".1-... I.......-::: :,.:, . ..... ........ : �. F�. ., ,. 1, �..�.. .. ,... :: � v :::::X�:: ::]::1:: ::]:: :: :: ::,.. �"... ��. � �., ,� I�1. � �� ,,-- I I., .'...........�.. �. %'.�,. ,�.. . , .1 .' .1 1, �. .I.. I.,..,....... ........'.....�'. .. ..-- :::: :�: :.: : X:::::: :: .: .. ::::::... - - ... .... ::: .. - ..... .. . I ..... .. . - , .. . . . - .1- 1.1 ..... - �.... - . 1. - .. .... '' '' '' ' ' .. .11.1. I . .1 . .':...' --::�:X: .. �..`-...... .. .. .. .. �.. -'.�.� .1 -I .� ... 1�.. �.'.....'..'..... -- -. � I .- �. � I .�. .- I. .1 . ..'..". -'.'.� ,. I.,............ .. . . . � . ,.. . . ... -::�::::: : � : : � : : 1 : : 1 :!- : X::�::� :�::: ::�'... .1 .. 1- ,. ." '.'... ....'..'....' . � .I.. �� 1, ,..�,��' ." .' 1-1 ........ .�.. . .. ,. 1,.I. ,. .. .'..'.. -. .. -, -1 . ." ..' .1 ...... . . . .11, -.. � : :-�: ,.' ..:j::: .:�:�:�:�:�:�:�:],.,:i::il�i��i::-1- ..... ���..�:�".i.:�.-:�::.:::�.:::::::::�:::.:�:�.'�'�:�:]�:�:'.�.,....,...........,.....,...",,....I ............. �. - � -..... ... ...'.'..,-..-.-.',.'.,, -1. - -1.-........'.....Z.. ----. ,.,..'-., .. .. .. I.-..-.%-.l'..l ultimar-y am: :ecom .- �::- ..... ......-4.".. - �����ii�:i�:������]�.i�������]���:��ii����i�iii�:����.,..,..,.�'.....�....�,.....,.,.:::�::: ..... --. .... '- 1:.I.R..I....,..,..,..�...."......,..,..�.�.....,.. :x' - �'�.�:�:�.]�:�:�Ws-mi�� -......I-- 11-11-1- ..... I....,......... -- l. 1.,..........I.- .. ....... .-:1 x ;:: : � � -- :::::::�::�::::::::::::::::::::::::: :X::::::: --..... . .---- .... �. � �. � � � i i�: I -� �:::x:::::::::::!:!z::�::!! --- ---- I-....''I.-I ..... -�� "",.,.,.,...�.�,�'..'�,.,.,.............,..I ........ .. .. ."....'....---- .... ..���. - - -1..1. I..., ........ ......' .... ..I..... ..�...�. . ......... � ::: .....�....,..-'-....l .. .. .. --- :-:.:.." .-'.. I.. --'." - 1. 1. 1.11, -'.'...'..�.......'-- -'.....--:-- ... .:::::::...... .. -- ::. ...' -.,.1-1. .1. -1.III-- -1-I'.'...'-..'-...- .... :.X..::::::::::::::: .--- " '. -" -�. ". -'. -' .... ..' .'. -�... ::::::::::::::::::::::::::::::::::::::::::::::�:::::::::::::::::�:::::::�::�::::::::::::::::::::::::::::::::::: ................ �.. 1. ... ,.,..�."..,..,.....,...."...,.,.,.,."..,..,.....,...''.''."......,...."..,.�'',.,.,."..1 ........ I-- ........ �.....�.........,.........�........�...........,..,...........I.11 I.- ...............-I ........... �.....'' . .......-.......I........�,�ilIi"..'......''. I.''..... -.... - -. 1-1-.- I-- - - - -'............-.-- .. .... �.. �.. � 1. �.......... I...., ..... .. .�:i::�::�i:�;i:�:�i::.�::::::::::::.-..I'' -.. �.. .................�...�... ... .................. -- ....-. ..... -'..- ..... .. ... .. .. .. ''''. I.......... .�I-- � � �� � �. 1, -, I .1. I ...... I..... ... ...'.:::.:i::::::.��::::i:::,�::�.i::::.:�:,�.:::......."..,."..,..,.,'..,....I .. .. .. .. I.. I.- -. '-.-- I .1. -...... -".'..' .. ................. ... -. '.,-.1- ---.. I -....... - I I''... .- - . -- '- ''�'..I..,..,....�..�..'�.....,..,..............�...,...,...��.�..",.,,..............�...�..�:�: �:::%.. ........,.,..''.,..,..,..,..''... I-- ..... I.- .. .. ..�.....-. �.. .. .. � � I � �. � 1, -'.....".....'..l.-...'... -...........�..�.- � '.'.�' ..... ..- --..- I.-I..."....�...............�........... �.... . -.... .--- .I I - -..... ..I.... I...:..::-:::- �X:-:::.: 1. I........... �.��.�....''�.I...�.�...�...�..........,.......,..........,...��..�..I . ........ .- , � '.- �-...........�.. .... .::. '..- .::::::---- ...... :::�::�::�'i-�-:::�:.::::--,...�"- ... ..... .._,.�..'. -. 1-.1- -11 I.I.- � 1. -- .. .....'' I... ................. �.I..�..�.I."..,..,..,.�'....�..........."�".,.�'.......::::::::::::::::::�:::::�::]::]�::::]::�::::::::::::�::::::�:: . .............. , -,:: �:�::::�::::::::::::::;::::;:::�:::::::�::::::::::::::::::.:::::::::::�::'...- -� --- '. ....1,-� -:-.,�.:�S. . ":::::..... ','....'..'....' fteala: 91 G "- IA � � ". .I....."�..'.*00 ....�.... mcasu=-. �. .:"��..'.. ....�..�.18:.:: ralgelm' " d te us:-, . Ve =- O.; M 1 M...... � -. ._ r*'U �. ".i :_0 It � t,...... -.1-1 ......-.... --- -1.1 - - ----. - - -.. .I_- ..- � -- I --- -.1. :;:::�::::::::::::::!;::X: .: ........�........",.- ......... .. .. ..�... :;:�--'. I.... .1-1-1 - -- �----- - -1- � 1. .1. 11-11-1-1-1- ...,....- -..... .---- :. ..... ......:,.::.: --.::.::::: .... .. .. .. .. .. .�.. -'. . .- -. 1 � . . � � - � I I...... ''...' .... I � .....�.� I.. .'...-.... � � ..... '. , �. �...... .:x:-::�-:::-::::p::: :-:::::p�.--'l ....... -."I....... ::::::.::::: .:: -:::::::::::::::: .: , I �, -- .1 .... ....... 6f:11-1 -�W ..�.�.�.��..�,-��...,.�.��l.,�l.,.,.,.,,.�I.I...�.,�'...,..'..�....,..,. .. ---.-.1 �:�' 0-1 : S.V,. m��i��:�:��:�:� ...... ::.:: :::::., .......... ::�:X�:::v- �:::.- .. .. ..I.. .. .. .. I.. ::::::::::::::::::::::::::,::::.:::::::: .......,i:�:�:.�:::,���:�:�:�:�:�:�:.�:�:�:]:�:�:�:�:i:�����]��::".:,..:,.I ... ... ...-::-:-:; , .*:,:.asses.sjm.W NAT �..::-:::: -:: -: ::-- :::.::::;::::::::::::.�::%.::..:..::::::::::.:.. , -,- ,. . . .�.........�.�....,....�,.�,.�'..,.....�..�..�.....,.."�'..I ... ... ..::::::::x....- ...�.. .'- -' ...�....... �.. I. ,:: "..b .- I.... ''. I.. I.. .� 1. - I I I......,..., -..."' � . I.... - �' 1. X I.... .- � : �:: ::.. �� 4..- I I -'I 1. .1. - 1. ......Z........., - 1 ........�..... ' '� ..'-''-'. I. ...:. .: ".:::::::::::::::::::;::::::::::::::::::.".......,.,...,........,.,.. �--'-"'..'.....-- -. -1- ...... -....-�.- "....'......-- I.---l..''.. ..'.................'.'.'..l'.'-... I'll ........ .. .... .1- I. . � . . .. " '�:::::�::::::-::-::::::::::.- :::: , , ,-- I ". '..'..'..' .. .. .. .. 0 � I .....Z.... � � - 1". � , , ' ':::z' :::::::::::::::::::: '::':x::::::::::.-.-"-'-- ..........�...... ..-..... ----- . ........... .. ''..' ..... ... --.... � I.I...- - -1. . ..... --- .....�..... ,�1.11.,..,....,.,......,.,...,.".,..�.....�.�......,.,...-1 ...�..... -::::: ::::::::x::::::-........I....... .. .1 � ---- :::: :::::::::::::::::::::::::::::::::::::.�..��.�.,�,::....'�,�:..,:..,:,.:...:...:]:::::.:,................�......,............. ---- ,.. - --.-.-- . ........... --- ..... -....-- , ........ .� ''.....- � " - . .1. I..., .....I... .-..::::. '. -, --- � -,�,,�,.�,.�,,��.,�.....�..�..�.. � .- I.I.--..'.."...."..."..".. ----I --� I I. I .I I ---I -... I -:-:Y::-:w �..�:::�.�:i::.�.i:::::.,:i::ii:�:�i::i��i��i�:i:I. ...,:�1111',t��. �.. 1. *-- '11.a�.. ,,' fd�r ..'..',� : ,:� ft �-.....:�:��Jtd �'of h 'TOPM, I. ....... � � b.:`1 ' "' P'..,P,';' " ' " 'h'."xpend�ur : �:���:�:�:. 'U'ce�:�eht�� 1v mliftfoc, I elatjol::: �...:: ...... ........-.......... : �:: � .. - -0.q.W., .....:,:::�� � ,W... -� -.-- M... �.. �.�....��. ,--'..-..l.. - � .�. �. �� -1 �l -1, I. .. .. ........ �. - , -Mw:':':.: .......... ..:. .. .....'.- ...... � .11- -.. -. I...�..1.11.1 .....--- � -- .. ... .. --- l- . .- ...' ..... - '' �.......... �.... -1-.I. .... I. - , , '- � � � � - 1, � --'. �. �. �. � --� I..... � �.. � I � � I .1. I... I I I I... I.. .. .. I...''. '"'...1-1.11.1 .............. - �'"... .. 1. . . � . �....... .,v...-'..'.l-- ....... .. .. ........ ... .p'.-� � �. . ....�.- ....... ::::: ::::::... -11 I � �.. ::::::::::::::::::,.:.:.:.:.:.:.:::: '....�...1.1.11.1 .....-.........1. �.�.0: � OW. -- �...... .. .......... �-: ..... :.,... ... .......-. 1 .......................--- - -..... .l.. .....�...1. . .. , -1. I...... . I- -,: :,.X:..1-1.1-1.1-1--,.1:1.1 ..... 1.11-I..........'..' . .-- d' 61fid be .... � ''.....' " '' ....'... -:::::::::::::::::::::.. ... .... :X�X::::X: -1- 1...,."."......"...........,.....,.....,.,....�'........ Xa'' �4tf j ''... ..... ''.11.---- ... I...".., ...........I.. .. .. .. I...""I---.4- � hfiowof isp_q �� u:l_'.'IQw '.,'.....-'-.':...- --". -.1 � ,� �..-1, � -. 11.1 .....''.-, ..... -:::::::.:,v.:..: .... ::.:.:,... 1.11.11, ..... - -. -1- -11 .. -..... 1-1. ::::::::::::::::::::::::::::::::::::::::::::::::::::,...,..,.......,..,..."..,.".,.....,...".,.."I . . � � 1. -�-1-1-F, ............ �.. .41.1....'�-'. � I .1-1 -.1 �'........,..,."...............,.�I."..,........�.....�..�,.".�.,.."�'I.I��... -w-". �.............I...-.. ........ ..............I.. .. ..I.. � : M., i�:.".".". :.. - '''.............,.....,......�...'�'...''..,."..,."........,.....,..,....'....'.''.'Iw-I. I-.1-1- '.... ............ ..'....'..' ........ I...I .: ce,�:f --�Jw0...�.............,.........,.,...."� ................ �.. ::::��:�:�:�:*:��j :off� : �. �V:�.:::::�:::::::::;:.�::�::,::�:::::-:--:-:-::::".�.."..."....,.................. �... :: -1-11''. : redu diii. d ik .q:::::::::::::::::::: .- ,:.::: .::::.:.�....... ..' .. 1.,I-.1--.: ... .. ........... ........-... :::::::::::-: ...-F. .'.'�..... 1.1-1 ... I. ........ ..... � "'.".1-1.1-.- I I.- I....:.:..,.".,..�..�..�..�...�,�.,..�'...�'. ." -..--- .... �..:�:.:.:.:.:.::::::::::::::::::::::::: .... .�, .�.,�,�..,.".,....,.........".."..,.,..,........,. ..'..-.--.-----.,..,.�..�....�.�,.��..,.....��.��..''.I ........ �.. �. � �. � :.,..,.....,.....,.....,..�..". " -'."..,."....,....... -:.. li ....... -� �:�.,.,.,..,........�.��...��.'',�,.�.�'. ....- ''"'' ''..'--l ........ � I � �.. �.. I.. I ...'.-...-.�..�..��.��. � "..............'.. .I.-.11.11 .......--.. "ll ... ........ �.. I. -.... -.....-- ..... --. 1 ....... ...'......�....... ---- , ...-. .. ..... ....'' ....... .1-1.11 ....... -1-1-1- .... -.......---- .... .. �.. �. � �.... I 0..'..�.....�..��.�.-.�� � � � 1� . ..... �......'�. ...... I.... ............ �..�... -- ........ �..�........,.,..."..,....-,.....,.,."".".."........�..,.�.......�....�....�...��...�.�"",..�.�.�.,.......�.....,.�",�...�...�.4������'.Pih re e hdu -bt'-fit: � � I � � , '.'........'.....� ......... I. � , � I., �.. .... � . . � . I . I I u " . :. � 7,..�.. �':,,.!.-:::�X::::�::�:- - .. . � � I � .. � � I I - I - � � . I. 0844001=..Wttz�". MII .. 'M--x:-::x:::::::: ,:::::,::::::::::: - �::�::�::�::;:::::::::::�::::::: -- ''-....'. .- - I - -_��. I -8 - 1. 11- :: : �:: -. 1-4.1 .........w.:.:.:.:..:�:.:,:,:��.:X:� ----l - � .� � � X��.:' ::�:::-.. .. ......Z. I.�. 1. -1-I..'.-I .... ..... I.. I. ........ �.. �... - I � .Z.. :�::::::::::: � �::�::�::�:::::::�::�:::�:�:::.::.:::---- --- : ��.��� 1-.-,."..... .�.I.�.'..'.'....'... .."ffi....I.-.., �.. .. , - I - . � .. :..- .............. ...- -1- -.. - I - �- �. ., --. ,- . ..-- -.......... I.- ... --- -- -- -- �, ,. �... .'.-,,-....... �..... ......... -- �:::�X::v�::X. iwi ....--.... '..'..:.: : ��i�::�4::]��� .. aseII.nVaclector. ...'' ..:::::: ' "''yug'tav:1.1.,..,."..,..,..::::::::::�:j:j:�:i:::::::::::::::::�,�.]:i:�i�:��:....' ..... .. - - .... '' . ... ..... I..''...., ........I..... I-.:::: - .I.....- I.I.- ''. -- -- I ., : �. WWSPI � mem:,.�::�:�i:�::i��i���������������]������������������i�����:���:: -. 11, - - ----- '.'--b.'--- Z..F....--l .... :. "....'..',1-1.11. I.. . - .. -...-- . .11 I-- .. ... . ........... ..... ..�..O- �.. � I � I.. 1. 1. �... .- -': ::-:::::1::1::-: ..:::::..,..�.,...,.,...",,....�'........�'... .............. .11.11.1-I....I.I...., - - I... . -- � � - I... �... � I... '' -. 1-1- .....�..... �. � � 'I.I.-.l.-...... -.1. - I .1. I � � I'' '''"..,.............,.....,..,..,..,..,.,.,.� ... .. ... "....'.. 1. I-- �11111 I I-- ,: ---. 1 � �11.1.''"..'."....'.....' ............�................................. I . ::-- ... -....''.--, .. .. ..�.,.,."".."...."".................... 1".. 1. - 1. 1. I- ,..'.. -I..."...'....'.. "--- I..... 1. ...................... .. ... ..... . .. � 1.�.11.1�.. -:::::X:X.."..'' '1. I � I � I-., I .�� �t ft 6.f. itaLtiDenditt' ..- �-.. 1. I.... II--. ::,�:::::]:::::::.:::.::::::::...:.:.:.::.:.:':.�.:::::X .. .. .. I.I�,.,.,..�,�..".".,.,.,.,...,.,.,.. ' ':4:'::'l'I-. . ....... 1.1--l-II.-I."..' -.'."'.'.'.'.'.'-'-- ":::; ::::::........l.l..... , " 1".-"..'.'.'.'.l'..l.- I.,..., I I I.- I I.- 1. I - I� . . �, - .... 1.11.1 ........ .11-1-1-1.1 ......... ::::::�:::::::.-.".- � ... :: - -1.1 -1-1-1.1-14--.... I..... --. ::::!:::..... 1. -- . - -: �::: .: .: ::��:.:: :::::::::�V:::::m::::::X: .- - --... I.''. - 1. --- ..... -.... 4."..."..'.....''..I....-........... ... 1. I. ..... I..''. " I. ..... . .1-1- - .' "' ".-�,..'''',..,.................,....,.,..",.,.,,.,.,.,..,........".,."..:..."..'','',:,i p - .11 1-I.. .. ... .-.- "'.'....'...�..�..�-. '�'-- -.- '.-� .. .. .. .. ,..."."-.'.-'-::X'.- I.f..i....,....�...'�".."....� ... --..............�.....�.. .. ............ %. .0 ;:::v::::::::::.::::". I.... I :...... ..... iqns.:.�.qfbper Wif: i�� ............' .......... flI- ....,'.-......,.��....�........��....��....:::::::::,:::::::::::::::: :::: .,�..'-.-'.- ... ....,.l.-,..'..'..-.. � :S�::�:::.::� increase.9 OMaiia vog :::::�...... . _m ... --.'.',." .... ..,F..-...."I-,,-,,, ....... :::::: � �::::::::::::::::� . 1. piaten.- 1.,. .......... .- 1-1.1-1--l ...... "."..'.......'...'-, '..'.. : ���.... _...---l-11 -- "..... ... -- .------- ' . .. .. ..... ........ -1-1 ...........-....'-- ..... -'' �.....I.......--- -. 1- .I.. I-- ... I.''......, ... I--, ...�................ "..'... - -::::::::'::-:-::�....-.... ---- .. .............. �.��....,.....,..�.....�......".,.I .... .l."..'........'.... I .I .I.. I...... - -.. ..... .- .1..... ---- .. . ....�...... --. 11. 1. -:: :�:Xxq ::::::::::::: . . ......�..... �:::::::::::-:!-:::::::::::.:,. � :::::::... �.... -- '...- .. ........�.... .. '' - .'42.4.: ..... .. - .. ::::.. ]::'e. -�::'�'::- ...l..l..-::::: ..... �.,."....".,....".,.."..,......,.,..�.I ... ... ..... �.:-:w:::::::;:::::::::::: �.. �.. .. ...... ----- bildiiidMd I..'', .. ... -.......,-.,:::::d',' ' ' " "'.."..", "". ",""'-,""-'F.I I....... I 1-1. -...- ,-- 1. ..-. �� � � I I � : � �:�� ucatim.]�l U � 9&ln XG &.1 .... -I-- ..... ''...' .........�..'..' ..... ...-1-1--l.....'... '- .... .. �.�.�-,�..�":..'�:.�.::.;.:�:.:�:�:�� :-'........'........�.- ::�::::::::X �::- --- - -- l.......l.''.I... ::::::::::::::::;:::::::::: ....... ..''. . ...... I... , - -. �..... .----- ... I ---- -- - - -.-- ". �.... .. �..,I....I...--.I... - - .- II-11- , - -.--- -........�- �. � 1. 1. 1. I.- -.....I....I...I........... ....' ............................. .- ......�............ -. 1-1--- ....... .. .� -- ... . �..--- ....-.............. .- -- ---.......- � o..'--- ". .. �� � � , "; .�.... ....'v..'..l.-'.....'....,w :' " ' "''.':::': t.:.::.::.......�.....�.......... -'-----'.'-- -- 41'..".I..'meneacc6idinittoonom" rmms:'.:3nd:::c6n-'t '�: 'O." '...-.....�.... -- .1. -. 1 �-,-.....�........ ....-- - -1. --...-.... �.. -....... 1-1.1---F.I...." ,� �i �� �� ��i����:i:....:�:�����'Dn4Dtttim.:.i��g.t,--z-,.,'l..'.' M,; ...... on: .- :'-:�:::::::,:: . ..... .�.I.",...,.�.�.���...�.��'..��.,�.�... '--. . . ..... xx�..'.::- "::."...,.,...,.,.."..�.I...,.. -.....�..�..��,�,,�1.11�.,�..�.��.�.��� :X:X �-:X::: .::::::::�::::::!:::::::::::::::::::::::::::::::::�::: ........... ...... ''....... x:::.:::::�::::;::: - -----.... -- .......�.... ---. -.- - --- '. ..' . ..........�... ::,:.:.:.:.:.:�:.:.:�:.:.:�:..:.:�::,.,..�.,� .............. _''.'.'-.-.-'__-'' . ........- - ....... - :::�:X-: .:.:::.:::.:: ::::: :::.��,.�.�.��.. I''' ''' ' ' ' ..�...�,.".,.,..,.,.�.�.,�.I..,."- -- --- -z.- .-.l- �. . - ..l- - .- .- .- .1. -- - -.... ,�..�..'�..�......�....."..........:::-:::::::::-:::::,,.'....l....-.�....'., ......... -1- ... '---.l.AI'' ii�fiv .. .. .. ..'..'........'-.. ---.- I-- ---.,---"""""''' ..'.'..'.-".'. I... � I � �....-M�il�i���i�� .�... .- , ,.-I... -, .1. --- �. : : .:��':-:::- .:.,-.,..'--------- .. -- �.11. I.- .- ---...,.. -WOW:& ,. "...'.... :", .�.�.-�'.-.',-.---'--.'.-'. �::::::::::::::::::::::::::::::...., .......... -� ....... �. -----.� -1-1-1-1-- � 111.11 ........ .� _':':.:: � -: �:: � -- �.I.�'I'�.11''�.I..,..........,:::�:::,.I I.--.����.�. , "-...... �'' , ,I-�::X:: ...'', I....,.....,..,........�..�..��....'�.�,,�,�....,.,.,..��::.:.:�:.",�.�. -1:-.- .... �.. ...... .".-,.........-F -- . - - �. .. ''..-.1. -1-1 .::::.--4 � 0:,�.. '..'..'.....,... .. .. .. �.::�afje ::to:: ", i'Ve .. ......�.I.:::���ii�i�:�i�i���i����;i�����������������������:�����i��������� '' 'I' '' �:�ii��:j:�:�:j:�:��������������'..�i��..�'...�������..,:.:..:::"....,,................�....'�.,.,.�.,.,,..,.,,,..,..,.,....''... '::;'::'::'�::'X: :i J=-RRAidd fid othlJ:'�v:'r'0.f4v':::"' id ....1.11.11 ............... . ........ :::::::::::�. , rease e,: , m,l�i�i��i��::::::��:j:�:�:�:�:�:�:i:::............... .. .. ...... .:. I-- I-, �.,..'..' --- �... , F. ... ".- �.. -1 -1.1.11.:.........I.: 1. I.. I.. �:::::::: - " ��:: :::^X: :::: �:::-:::- : � F:.::-:: -. 'l..--I-..".-..' ............I........................................I.. ........ I...I.. . ............ -. �.'.::: ,.: . ............................... ................ �..... - . -- �...... . ..-.. .. .. .. .. .. -. 1-1 . ..... I.................-'- ............... .. .. ............... .. .�....�... - ", , , , . . . , , , . ".. "....'.''. ''..''.."........�....�..'�,.�,,�.."�.�.�....��. ,, �...,.,�".,�"..�.,�"...�.....,.:.... ........ ' ' '-' ''..,.:,��i�i�ii�ii���:��]��]��]��i�����i:i:����ii��i:�i��i]���::�..�:. ::.:::::':.:..::. .'::::::::::::: ''-. .. .... ..... --- - -1.1. -"..'..'..''..'..'' '.... . �.. - .- ........... I.- 1. 1. - I-- - 1. � - 1.1-1-1--.1-1'' "':l:::::.::.'-'::::::::::::�.... :.,::::.:::::..............,...,..., ......... --- . ..-.. '..'.......�..�-' I �. " ,'. I-% �. �. .'-. � 1. 1. I . 1. �..... I.- I �.....-. 1-1- ....... :::::::::::::::::::::::::::::::]:::.''.,.."."..,."...".,.,.,�"I.I�.--.'...�..'..�..'..- .1- -- l:-: -.... l.-'-:::::�'::..--l . ..........-. .... : :::�::�:,.�:.:: - -.. ... I......%:.:�.::j �:�i:::]*:: ....... . .11".....................,."..,.".,."....."".,.I .1-1-1. . .- Il"'....'.11.1-1- - -1-1- . . ..... .-- .... .I.:.::�::::::::::::::::::�::. -: -�.... ..- �....... -1-1-l'.....''.- -- l."'....".-I-1-1. I....,..,."...",�....,..,..�..�..�.I --- ... .'.,:::� :..x.:::::::::::: :..'.1. 1..X: 4,�:::::::::,:::�:::::::]:]::::::::::::�:::::�:::: : ::: : : ': :: .!::,:::::::''..' .... .W-Itt ..',-- ... -, :�::: ...... f- �'.'..."......'.....--..... .l. '.x��]��e .......''ll.-.. .. ..I. .. ......... �. - ff ....I.-.1-1-1 ......:.......'�--... ".-4.: :- - .............. .. . ..... I 11 .... I.- .... .. ... ... .. .............. .. . ...... ........ .. .. . .: :::www. --. :]::]4]:'.0te �m -. 1 .1--l.-I .....:O'. gs.-'-l'.'..l ............ . , ''.�. ::vX::::::::::w::: d.-I..�.��..�.."..........,.....�....... . RCOU managemen �: g'R-TI .-... '...'.... rage��.:�::::::::::: �:�::' :::::::::::::::w::;--- 1-1-1 ..... -.-- .............. ''Ill: :1: �:::::::X::: �:: ... �....�. �.. �... I ll� I-. � �. ......l.".. ....",........... I.- .".,-'. , I...................... ....I.I.- ...... .- '...-.---.. - .1 . ........ I.. , ,.. .1-1.1 ......... ........--.'..-.--.... ... ......-.. .. ....... - - - -- 1. I... -.....-..... 11.1 ... --.- ....... .... ......-.'...-..-...l ..........I... - -.. �.. �.. � I I I I..... -.. ''. 11 1. 1. ...-.''...''.''....... 11 I-- ... ...-I., ---- ... 1.1'......-,'........ ...- ..... .... "..'..''...''.''... 1.11.11 ......... ...�....�.�,.���.�,.�.�,.�"..�"...�,.��.�...�..�.....��.�.�..�..,.,...........�'..,.�,�.I.. '..'..'..'........'.....'. -,'. - .. :::��::::�::::::�:::�..:::��l:��.-.�-, fWl�p ::'.-::::,:'.:w:.:.':: .... .:.- .. :.. ...:... -. 1 .... .. '':: �:::�� ̀:::::::::::::!:�::: ..::,:: .... -.-'-'..' -" - �.... ----'-'----l:-: ..... �.. -i''Aiwed-:.3-I' ''"' ... �'. �.:: :" '::::::::::::::�:;::::::::::::':::: :: ::: :: :::.Wlu :. tm: Do --............. "."."."..,........� ........ .I.I.I..-..-.-,,'.- .... �'....,.�...�..�..��...�.I..,..."..,...............-....,.I .. ..... 1: . .. .. ........ .A..,,.,o.nning.���:��:::::::::::::::.--- . -W.::::::::.�.�.::.:�'i.:.].:.:::I ............ ;:;::::::::�::-.-.. .. ..-..- ....... ....... .. .--- .. .. ........ .- .1.��,.�...'�.I.I...".,."..,..,..,.....,.....,.�..I :::::: -:::::.I..-1' '.....-'.....'....".... :::::::�::�::::: I.. ' ' '' '::':::::x-'-'..I.. ..... .-.1- .. I....-,..... ---...-- .t.t. -mg..�.,<�:'X.XX: ... .:::.....,..,..�..��..�..�"".. .,...'-........ -.....1.11.1'.. -1- .. .... �auq . .i i��nja:.:.:.:.:.:.::.:-:-X.:'X. ::�::�:::::::::::::::::::,.�'..,.�,.�......�..��.:::m1. .... --- -"�". ������������:�����:��*i�������aII6*.�itt3jorse. :- ,��ff ' ::::::::::::,......I....... .,'."."..'.'...'..�.'�....--rm:er,.M.. .. ... ..... .:"...... I--L,. .. �....... .W...., ': 6wi6w.:,��:.:,:�:.:.��:.:��:�:��..,.:::::::::-:::::w::::!::!"' -1. 1. .1-1. 1.11 .l.... 1.11 ....... ... .....T'.-':.:::::::::::j:.-::::!: 1. -- .I..''.--..-..::::::::�::�::�::::::::::::::::::�::::::::::::::::::::::::::::::::: :::�::::::::::::: ::!::: � �� � ". I. � � ---: ..'.1-1-1.11-1: ......... ..... ...... .. .....I........ :�:-: ::::::.....,.....,.�,.�,,�..............".
- �-. " "",��...e:'I --h'I. ... .... .::::,. .... . " ''....0. �.. -- ft .... I.I.....--..... 11,.::: �: -'::':':-..-.-:.:� AMC , 'idt.ig :.�-....'.:WI :x: - ... '. .x::v:::!��.: l: �. .. .. .r strawl v stm ::.dub fO c :..:.P.,..nIa..: 1�-.:.-::::::::: :::::::. .. . c-In .All n, �:W. ,, :1-4..C-4 .':::...... -- ........... -- ........:....%,:..:::::::.:,:,.:::�:,:,:.::::::�:::::::�.I..,..,.. , ,,",.---,.' .-.- �' . - PF - � -v ,W'. ��V=ll ...... W�iI-�. 1-1 ...�......... ...........-�. .. .... -- -1---- -- - - - - �. 1. .- 1. -..... -.- '"'" "'I...I....I.....-.....-.-I....- I.. ---- �.,.. I.. �.. �. � -- '.. .... 1-1-- ......... - -.. ..... -- ... ........ .-. 1-1 --- .... .. ''. -...... -.1--l .... .........�.......�..............,..�.�..'�.I..��'...'�..."".",..�'..�.,��.21���,��,�''::]:.:�:�.::::I.-I-l"I'l.'........-I .- --,'... �., ,.,.,..,.�..�...,.,.::.:.::.�::::::::::::::::::::::::::::::::::: .:: I.,-'' "'....... ....... ....-. ..... .. 1-1--l.... ....b...,..................'... ..... .....- �' �ftkkir&'Ailltitioft. ...' 1, I I ."-"....,...,... - ��-"'.......�.. - -� .1-1-1-I...'.....''.-I ... � .. � �:::::::::: �... �..I.....,.....�."..,:::::::::::::: -::�:: :�X::::::::!:::!: _.. _ �.-.."..."..'..I.-.1.1 .-I.... ......-- .......... :::::::��:::X::::X:�::!:� ''. . I.''. I-- ...... �..�..�.�l::�::::::::::�::.��:,.;�:::::::�:��:::::�::::::::�:::::�:::.::::�:::�::�:::::::::::]::�:.� .......... .. ........ -- ...:::::-:::- :::::: .......... .. .I..... ..... .. .. I-- --.. � - - I.. �� � �� �� - - -.- �l I........1-1-1 .---.- .... ..I.. ....-......- . . -11 .. .. .. . .. ..... .. �.. -:... 1-1. 1. -.... ''.....-I.. -........ ................- I-- -"------ -- � 1. - 1. �' I I I..... I.., -..'..'..'..�....��.�V--11.1- .. � .1. - �� - � � . . 11 I I 1. I.''. ....... I.-- 7:�::::::]::::.�:�:::�::::::::::�::::::].:.:.: :1::::::-: ..."'..i�����������:�����..��]���������������������������������:,'.i��..,..............,...,.,�'1. -1. -- -, - � -- � " -- � ., ".-.....,.- '' .. .. ..... .�,�'..�::�::::::::]:::::�:::::::::::�::��:�:�:::::�:::::�:::::]:: - ..'.-... I... I."�,.'..,..",�,.��.�...,......I'.... ' "-- ... - '':-'- '''<-'', .. ...... , ... ,.���,�,�l',�......�����"...,."��.1l.::�:::::: ::::::::::::::-: .-. "." .. .. .. .. 4-.1'..'
::-::.:.:,....:::::::::::::::;:::::;:::::::::::::::::::::::::::::::::::::::::::::::::::::]:�::�::�::::�.,�,,� -. 11 ,.''." .... -l...'.l...-:::::X:X: �� �... � I., - I... �..... W.- .......... I... .:::::�:::::::::::::::::�::::::::::::::::�::::::::::::::::..�... -- I'll ........... I..''.....1-1--1--l. .1. .- 1. ... 1. 11.1I.. .. .. -- - , , .- :. .... :::-::-:::::::X:::::-:-:-:: ::::.. .. ......... '........"."'. .-- -- -1. 1. 1. -I.-"".'.'.'.l.-. 1, ...... 'w�i*:':.:.:':..:..... ;... ...... ....... I..''.''.* - - - 1. 1. 1. -.. t. - -..... � .,,...... ': ...........-......-... :........ -q: -, -. ''.:-....I... I..'' ...................... -1......... :: ::2;,re .:J......... ... .....,."......,..,."..,.,..�.,�.��....�..�...... :.,1!.Mg:.�i���:�:�i�:�:�..�ii:�i��D .pare.:� &:� qqg:� em:t ev. :.1b, SeC.N...........'.....'......:&;: d 61:tt: 't., ii� .".....'..'... 0�........... I...................'.., ... 1. 1-1.1.......... ....... iltra, , I.T......,"..'.-I ...........�.. .... -- , .:::.:..... :..:: ....- ::-::-:x�::::::::: : ''.9 . .... .. Pa.:- ..'........... ... X..:::!: :9.:!:::�:�:.,::::::::::]::::�::�::�:]::�::� :::::::: :� - -... �... �: . . ................. I..'' .........I... ............... I..........�.... -. 1-1-11.1 ...........�.. .............. ..I.-II., ..... 1. I... .....Z.,..''. ---.--- �...�.��.�.�.�...�.�.."�I.I.I........,.,.I ....... .I..,.......'�'...,.,.................�......'�"..�.�.,�........��.....,..�.....�.��.�..,.�..,.�'.....,..,.".,....�.. ..................................�.. .... ........' 11.1 .. I. - I...-...I............... -- ...... .. .- -. .... .11. ,.. I t, ..... ....-- I.'.- .. ....... ..... ...... II 1. �....... -- -1.. . .... ..... ...............-. - .�I. . .. ''... --- ... .... -- ....-..... ........ ,..'..... ... I..........-.. .....I....,............ - -� .'...'. �:��:�:�:�:�:���:�:����..*..�]��:���,mtro 1...1. . .Vos..s .... .....�....-. ..... ...................... ���.......�.�.�:."�:,..,...�..,..�..�..�..��.�l.,: . d., .. g: tte �,tdsethor,-.1-1- .... ..��.b--'.....'-.....-- - .. �..... .............. �............... -- .��............ , .1.-... .11 . .........WWs...-........'....'.. . ........ ..:'W:I-.".'"......... -X ....... .X: - :::::::: �........................ I.I....,::::::::::::.:":,:...�,,�'.....,:.�.::.:.:�:.:�:�:..::.. ........''................., :::::�.::::::. q.--..----.-. ''.......W.V:.. ................ .... ...�...,.�....,..,..,..,..�..�.,�...'I ............ .. .. ..I........-.. .. ..... .. .. -. - --- .... 1. 1. .- I -I.................,.",.�.."�............. .. :.:::::::::::::::::::::::::::::::::::::::�::::-:: ...... �::::::::::::�:::::�:::::::::::::�::�:::::::::::.:,. ...�.- ....... 1-1-1-- .... ,....F.b ............. :::�::X:':::: ...... I...."..,.....,....�...�...,...., ...�....... �.. I.... --- ...........' :�:::::::::::::::.:::*:::::� .--.-. '.'.'."." ........ 11.1'....."..............�..�..�..,.�'.....,.�..�'.....�..�..�..�.."..,.,.,..�,.�......�..�..�..��.�....:,:�,.�".,........:::-.:. iiifift the.:::humber of. ' jI"...''. ,..,.'............�.,..,..,.....,.......,.....,....,....,......�........,..,.�'..�.�'....�.....�..�..��.�..,.......l.' , pro ts ....1.1.1" ..,.............�..�....."..,....I ........ ��.�..�.I.�.,�,,�,.��.......�,.�,.�..,.�...'�..�.��...�.,.�."��..�.�..�..'..'....l--.-... "::::::::�::;::�:::::::�:::::::�::�::::�::::::::::::::�::,:::,....�.�.I ... I� .J op ,. .. 1.-.....-...... --- .. ........ --%..... - - - I.. � I.. ... -I .I::::::::::::::::::::::::::::::::::::::::::::::::�::::: ::::::-'-.'..I.-.1--l. . I. .. .. ...... ... -- ... -- ....-......�....... �. --. ::::-:m .........-.... ::::�::::::��::�::�.��...�,,,,.,........�.�..�..� .- .:::---::::: - :-.-::::::::::::;.--...'- ...... - -.--... . � � � ... � I.I.- II --. .A.--&-. ...... U.. I - �... . �........I............... "..' :::: .: -:�::�::::X::: -....-. �:.#-:� ��'.--.....F ..............................I.....-.'l'-....-..II= II..... ' ':::::�:::::::-::!!::::::::,. .-I.....'.."."..'..........-"..'. mcRe:,'Vore.-:.:�:% na'' '' ' f:::::::::::::�::::::::::�:::::�:;:::::::::::::.-... ....... .. ..-... I.''.-... -- ml�'o.. nd........., .p PrOpm.0WO �. ...............,."..,..,.......".....,.,�..I .. .. .. 1. 1. I..... I, ,,. 1: .........- .... -1-1.-.-F-.',' .,�,�,,�l.,.....�.�.�::::::::::::�::: �::. 1. I... I.... -..-.... -.1-1- .......I...-...........' ............................... ..-.....- ,.: �. ."..'a ... �..:.:.:.:�.:.:.:.:.:�:..�.".�,.�...,......��.��.�, .... 0�s-..-.- - :X�............,. .,.'' ............. I �..... 1-1.1 . ...:::.............. %.....".."...,..,..,..,.........,..,..,.".".. � .l.". �.. . ... ....... .. ...�..........-...�........'.....'..'' ..........I..... ..... ,- -- -. ,........ I.-....�.... .1-....l.. � � I.-1:::::::::-:. ..-.1: :wi� F�- '.'� ... ,.1 �...,M, ::::::::::::::::::::::::-.......''.''... 1. I.... ..-... ' ---- - I...... I-- ..... --.----.-.-. '14::!:W:4�:::�::�:::::��::"-.- I......1 =. :.. an�-'......'.. .... ..... .. , lue, e� Vstumtet. 0'Leo' .. '' 'I"''............. - 1.11.11.1 ..... I.. .-....'...'...-'-,:- � �' . - -''--......I.......... ::-:::-:::-: :X:X:::�::�::�-::..- '....-.'.-'-. ,-.1-1- -- l-1--, �...,f .N.Wdi,.�................,....,.........,.....,.....,....,...,..,.,�.,�.,�.�........'.,�".".". I� -----'...� .. .. ..-.-.. --- m9Qw..'N .. . ................ -.1- ..-I.- ..... -1-I...- - .....,-...-........ -.. ---.- 11........ ..�.. ............... .--.. -.-. l---..-...-- .... - �. . . .. .. .. .. .. ..... .. ........... �.... ---- .... 1. -- ........ .. .-.. ........X..::.:.::.:::��:�::::::::.:::::::::::::.-I..... ............... 11 .. .. ..... .-. 1-- ... 1. -.- .....''..-I ..... -- ... - ---- ..... --- ..... .. --.- .........�........................,..,.,�..............,..,. .... WW'.....'' . .. .. ..... .. .�..... - . -1-1.1 � I...�'."�.��........."�'..,.,....'�.,�.,�.,�........."..,..,..,.....,........I ...I....... �... ............�... ..:... ::::�::::::.:.::::::::::::�::::�:�-� -. 1-1-1--::-: i.::::::�::::::::::::,�.::.:.:.::.:.: ... :':.:.:'v,,,:--...- ........ ...�..................: ............ .,:_: ... :::::::�.::,�.:.:.�.::,�.:�:,:.:::.�.:.�.�:,�.:,:.]: :�:�Xr.��-.- " �: � �::: �: X.: --..... ....... ... -- :;:.:::.0,I,�'.1'..,..,.......�....�....�.�...�,�,.,..�....�.....................'..'.... ... .1 . .. ........ ---. 6 :.,:, . -.- .�.. .'-......'.....�..� .. .. .. .. .. ..I.I........-........'...' . . ..... ..-..... .. - I..�.,�.,�......,.....,...,.....,..........�......... � . .:-: -:- �::::::::::::::::::�:::::::::.:::�::�::�::::::::::�::�:::::�::�-�:.::�::�::]�::�:��::�:]�:��:�.:��:�::��:�....,. -I...-I ........ .. ..... ....-.. .. ..... .:::]:: :::: 1-1-1--l-'... ... .-W..'... ... 1. I....... I,. �.. � 1. � .....".- � 1. I........""."''. � � -.. :.:::::-:-:::__. 1. --...- -----.. '.'... -- . I. .. .. ........................... ...-................ I :::� . . ...-....................... ''.....- -..... .I .. --- .1. 1. 1. -.. ''. I... I.''... -. 1--- 1-1 - � --.. ''''.., .....-..... .. .. .................. .:.� � . . ...-..,.,..................,.....,..,."..,�.".,.,,.,,..� .. .. .. .. I.....'�.,.....,..".,�'I.I...�'. - 11 I...-..... .. ..... .. ... ..... --- ".'. . .....''.1-1 ..... .......... ..'.'..,"-:�: ::.:...... :::' ':::::::::,.::::::::;�.....,.,....I ..........-............... .I.. .. .. ,-....'..' -1-1. 1. I.- .....'..."......'....." .. .. .. ..."..,..,..,.....,....��.�.�...,.I -- 1. � 1. ...' .:. .::: .�:�:�i�:�:��i�ii�ii�i:�:���i�:�:]:�:�:�:�:�:]:�i:�::�:::�::.�.......�..�.......�,�'.....�...... - :::::::-::::: -- -. .� I- - 1. - : : :: �::::: :: :: �:: � F �. .l'--- '..-.- .-'.'- '..'...::::: ........I..... .:.:.- . -. . .- .. - � . - -l'. .. ..'' ................... ........ ---- . . ........................... .. --- ..... .. .. .. .. .. I..''., ........... 1-1.1-I...- ..- I....... .. 11 . ....... .:::;::-:-:.............-............................. ................. .. .. .. ''. .1 ........I..... .. .-....... '...'--- ...�.. ..... ........ ........I.............. I.I."..,.....::::::::::::::::::::::::::::::;::�:::::::::::: .: . .::::-.1-I.-I-I.....' ............ I................ .. .. .. .. .....I.. ........... .. .'.'... - - . . ... -. ..... I.. I.. ... -......... :.. .....�.....-....�............................... I..''.., .. ..... .. 11.11 . .. ........... .--.. -- - � �. .. .. .. ..... .........................................-:.:::.::: �::::: �:::: -:::<::... ::.. �- :: .1.-......... s$U ".1.0.:-h ...:''.".'.....�: :::::::������������i:�i����:::i���::���i����:����]�]:�ll::]���i��ii��.-.-,.,-�.-.-..... ���A.A. so CA:'...�',,' Imutou"b"t, I '. 0thFI dg : �'..6 PEU .:.::.:.:.S����������i���������:�i:::.,����]����gtregg .,an gm MO . Aft d:j . ......-........ 1-1 . ..... -.1---.1 .... I �.. .. .. .. �. �. �. �� --."."...,....... �.. .,�....... ..............I. ............... �.................-.. .. .. .. .. ....................�.. ...........-..-- '..---.-...-- - - � ..... �.''' . ..... .... ...:::::: 1:��::�:11:�.�.::..:�:,:.:::.�::.:::.. ..... �---. '. ---- 1. - - �...-''...I.............. 11.11 .... .-- ..... 1.., ,::- --- -:::::!��-................ ...........I..... ..... .. .. .:: .. .. ..f.... I.: ...... .. ...�......�Cal'.' -�::::-:::-:: -' '......................,....".�'...."..".................,..,..�.....,..,..'.,...,..,.,.". ,:.::4 :�� -, -,��,..,."..,...............''''.''.,..,..,..,..,..,... ..... ".".1 - �� i� ��i�*i��: ��l :� �JmDjd ::t',I ..- ::::]::::::::::::::X::::I...."..............,...."......."..,.,...,..,.....,."..,..,........,..."I.Tes M. UtO :d: IlaRM dre.....''..,........,.........,...,..'�"..�'..".,..,..,.....:.,.�.. .''. ----.- . - -- .. ... .. ... :..:'-..-'..':.:.::-....-....-....- �.......�.....-....-... �:::::�:::::::::::�;:�::�:::::::�::::::::::::::::::::::::::::.......,I .. 11. --. '.-..... 1. ..-... -'-... .... ...........................-.......... - '' ....... I-- ..... -'--.-'.'.'. I.. -.... .. .. 1. -.... 1. -.-- .. .......... .. -:�:�::"::X.�:::.:::::.:�W..., ...%...................''...'' ................. .. ........ 1.11. 1. I... I. . ..... 1.11 .1.. ::-::-: ....-p...... .... , ,........... .::::::.:.:.�:. I 1. .I I:. .. xmw.�: ''O .. "Im im ".......'....................... -::::::::::::' .. 1. :�::: .:::,: A::x��01104ft:.Mos. W, ... �� .f ii::::::-:.- .....I.......... . .-----......... �..,...,.,..............,..".,."."..,..,.,.,..,.::::::: . I .I:I. Cl...Uefl .7� �. Uca 1:-....... �.... ......... .... 1. -.. . .- - I �. 1. 1. -.,, 1. -...,..,..,.,-''.,. I.. I.. -..�.....'.. I -- ......,....�..,..,..:.:...�...:.�::::::::::::::::::::::::::::. "....."..."......- - II I..,..::::::.::,..::::::::::::::::�:::::,.,.....�.....�.....�.�I ... ... ---v.-- ...... ..''.'..,-.1 ..... .'-'...'..'........ ... .. .. .. � f.: �1. �-......... .....I........ I.... ''. ---- '...-:�:�:�:�:j:�:�:j:�:::i:�:::�:�:�:�:�:�:�:�:�:�:�:�:�:�:]:::�:�.''....................,."....".........,.,... -.4- .....,-- ..'' .... .. I.....,..,..............�..�....:::.'': ......... -.4 ... .. - :: , 1.,..'q:-.I........ ..-. ,..::::::::::::::::::::: x:::::::x: ....:.:�:.�l:.:.:.:,:.:.:,:.:.:.:�:.:.....�.,::'':::::: .l.. . sn'.� iimva e�;.W ... .... :::: -...I.-.�.,.... �..�,,�.........�.,�....,.,.".,.,,.. V..'....'... ;::::::::::�::::::::::::::::::;:::::::::::::..: .. ... .�. ]:::�' B.- I ..... ... ::::...,..:::::::::::::::::::::::::::::::::::�:::::�::::::::�::::::::�:.,.�'...'.�'..�..,.....�'......,.''....... �..-..-...-.-'l,.-.l...-- . - -- � �.4. Ak I : ifid�,-........'.-.-.'......... -:: .... .0.1. Lifi tun :0I.". .......... �...... .,.... -. .- , ."'.,'--... ....... 1-1-1 ..... -...- .......... .. .. I I.. ........ -... ,....,..�.. ,. �...... .---.--�-,�-,�-11.11.11�11-11111-11�..''.I -111"I'll "I',"..,..'' I'll, .... .. ''. - 11 II---. . ...... ..... ...-.- ,.,'��-'----.'� .'.. -'-...-�..�.....�,�'..,."�,,�,.�.I.....�..��.����,���,,� .... ..- I .. .. .. ......... :.�.�,:,:....".,."....,..,..,....,....,...'I .-- �-!�- �- 2 - I.............. I.'---..- .... ..-- ''. .----.. ,- -1- ....... I.... -..... .. ''.1 ... - -I...... ..... ---. '.. ''.''.,....,...'�.::�:::-:;:::�:::::::�::::::,:-�::-:: :: :- - �:: �: �: �::: ]::: �:'-'---- .... '::::::�:::::::::::::::::....'.-.'..'.''. -::::::::::::: :::::::::::::::..:,��.:�:.:.::::::::.�::.� ::XX:!
I. MACROECONOMIC FRAMEWORK
Introduction
1.1 Swaziland is a small landlocked country bordered mainly by South Africa with apopulation of just below 800,000 and a per capita GNP of US$840". Its economic linkswith South Africa are strong not only because of geographical reasons but also its membershipin SACU and the CMA'. Under SACU, free trade is allowed among member countries anda common tariff is levied on outside imports; the proceeds of which are pooled and dividedaccording to a formula. SACU receipts contribute one half of fiscal revenues. South Africaaccounts for 80 and 30 percent of merchandise imports and exports, respectively. In addition,Swazi workers in South African mines represent about 25 percent of wage employment, andprovide a substantial flow of workers' remittances (over 15 percent of GNP).
1.2 The economy relies primarily on agro-forestry based activities under a dualistic tenuresystem: (i) a capital-intensive export oriented commercial subsector, operating on Title DeedLand (TDL), developed by foreign capital; and (ii) a semi-subsistence smallholder subsectoron Swazi Nation Land (SNL). Given its structure, openness and size, the economy isvulnerable to external shocks and therefore subject to wide fluctuations. In particular, it hasbeen sensitive to developments in South Africa, e.g., affecting goods and factor markels, tosignificant changes in commodity prices, e.g., for sugar and wood pulp, and to periodicdroughts.
1.3 Swaziland has been able to achieve relatively high growth rates over the past decades,based on a market oriented policy, with very little Government intervention on prices andwages. In particular, favorable conditions for foreign investment, including the country'spolitical stability, a number of tax incentives, and liberal regulations on profit remittanceshave been the basis for the development of a large private sector mostly consisting of SouthAfrican based investments. In addition, the Government has pursued a cautious fiscal policy,avoiding large deficits and limiting the size of the public sector. The Government conlrols afew strategic sectors, like public utilities, and the size of the public sector as a whole is notlarge by African standards.
1.4 While the assessment of public expenditures is primarily concerned with allocationand efficiency issues, this discussion needs to be placed in the context of the macroeconomicframework in which Government operates. This Chapter analyzes the main trends ofSwaziland's economic development, identifying the role of the public sector.
As of 1990, based on World Bank Atlas methodology.
In addition to South Africa, SACU members include Botswana and Lesotho and CMA includesNamibia and Lesotho.
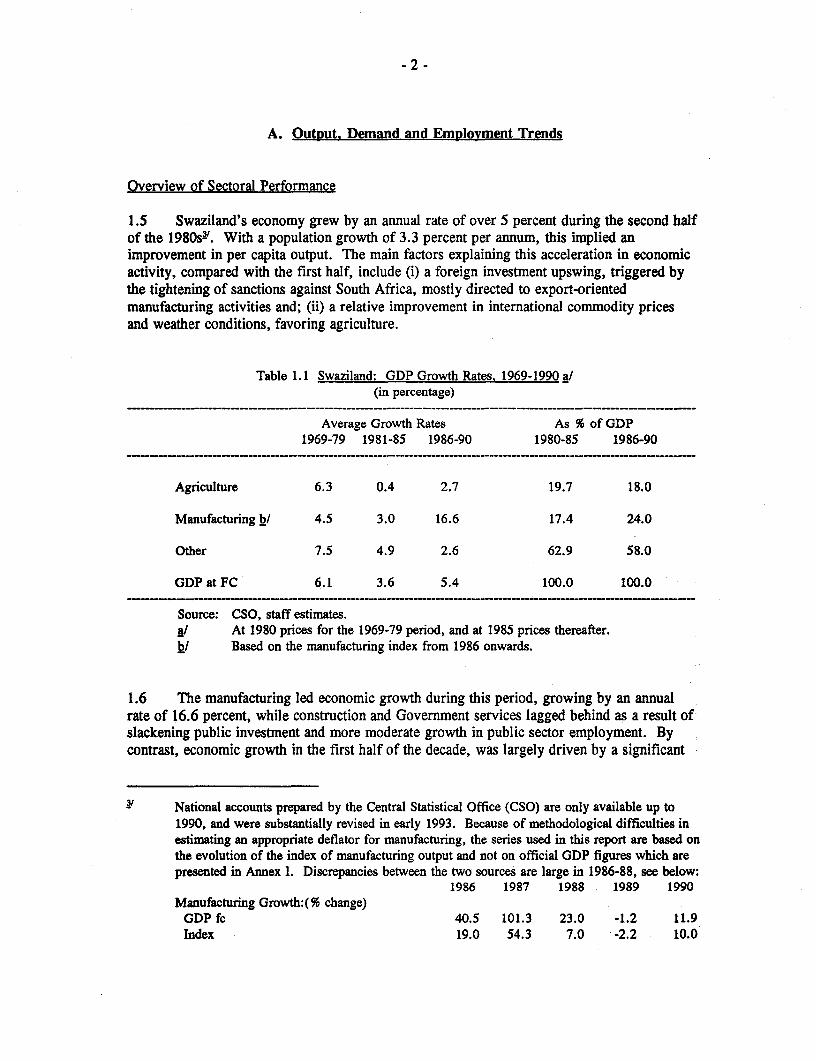
-2 -
A. Output. Demand and Employment Trends
Overview of Sectoral Performance
1.5 Swaziland's economy grew by an annual rate of over 5 percent during the second halfof the 1980s3'. With a population growth of 3.3 percent per annum, this implied animprovement in per capita output. The main factors explaining this acceleration in economicactivity, compared with the first half, include (i) a foreign investment upswing, triggered bythe tightening of sanctions against South Africa, mostly directed to export-orientedmanufacturing activities and; (ii) a relative improvement in international commodity pricesand weather conditions, favoring agriculture.
Table 1.1 Swaziland: GDP Growth Rates, 1969-1990 a/(in percentage)
Average Growth Rates As % of GDP1969-79 1981-85 1986-90 1980-85 1986-90
Agriculture 6.3 0.4 2.7 19.7 18.0
Manufacturing h/ 4.5 3.0 16.6 17.4 24.0
Other 7.5 4.9 2.6 62.9 58.0
GDP at FC 6.1 3.6 5.4 100.0 100.0
Source: CSO, staff estimates.a/ At 1980 prices for the 1969-79 period, and at 1985 prices thereafter.b/ Based on the manufacturing index from 1986 onwards.
1.6 The manufacturing led economic growth during this period, growing by an annualrate of 16.6 percent, while construction and Government services lagged behind as a result ofslackening public investment and more moderate growth in public sector employment. Bycontrast, economic growth in the first half of the decade, was largely driven by a significant
National accounts prepared by the Central Statistical Office (CSO) are only available up to1990, and were substantially revised in early 1993. Because of methodological difficulties inestimating an appropriate deflator for manufacturing, the series used in this report are based onthe evolution of the index of manufacturing output and not on official GDP figures which arepresented in Annex I. Discrepancies between the two sources are large in 1986-88, see below:
1986 1987 1988 1989 1990Manufacturing Growth:(% change)
GDP fc 40.5 101.3 23.0 -1.2 11.9Index 19.0 54.3 7.0 -2.2 10.0
-3 -
expansion in Government services and public investment, in the context of sluggish foreigninvestment and bad weather conditions caused by a seasonal drought.
1.7 In 1990-1991, real GDP growth slowed to an estimated 3 percent per annum4'.Weaker commodity prices and the onset of another recession in South Africa have affectedmanufacturing and commercial agriculture; as well as foreign investment flows. Furthermore,real GDP fell by an estimated 2 percent in 1992 as a result of the devastating effect of ithedrought on subsistence agriculture. Note that the elements present in this economic cycle arevery similar to those encountered in the first half of the 1980s, where public sector play ed anexpansionary role, partly offsetting the overall slow down in the rest of the economy.
1.9 Thus, public sector growth has been counter-cyclical over the past decade,decelerating during periods of high growth (late 1980s) and picking up during sluggishperiods as observed in the early 1980s and 1990s.
Output Structure and Growth
1.10 As a result of recent growth developments, Swaziland's output structure has shifted infavor of the manufacturing sector, which has become the major contributor of GDP (24percent). Agriculture, traditionally the dominant sector, continues to account for about 20percent of GDP, but now takes second place after manufacturing. The importance of othersectors has, however, decreased notably mostly reflecting relatively less rapid growth by thepublic sector.
1.11 Agriculture remains a key economic sector in Swaziland. Production and tenure aredivided into two subsectors. The modern commercial subsector producing export crops, e.g.,sugar, citrus and wood pulp; and operating on Title Deed Land (TDL); and the smallhcldersubsector characterized by semi-subsistence production,; mostly of maize; communal grazingand traditional tenure on the Swazi Nation Land (SNL). Sugar accounts for over 55 percentof total output, followed by maize and cotton. Other important agricultural produce includecitrus (grapefruit and oranges), pineapple and livestock.
1.12 Typically, growth is very uneven in Swaziland and sharp contractions were recordedin the drought years of 1982-83 and, in 19875'. In the 1980s, the sector grew on average by2 percent per annum, compared with 6 percent the previous decade. The major underlyingfactor behind this lower trend is the performance of commercial agriculture, particularly ofsugar, which entered a more mature development stage combined with less favorable exportprices. In the meantime, the traditional subsector has remained basically stagnant with lowcrop productivity and serious problems of over grazing.
Based on preliminary estimates made by the Ministry of Economic Planning and Development(MEPD) and staff estimates.
The 1987 decline mainly reflected lower sugar output after and an all time record in 1986which had responded to a substantial price improvement.

UMILIONS OF EMALANGENI
I.-O-Nm NCR CD Cii CD cmCD 0 0 0
Id~~~~~~~~~~~~~~
to -.1
- A o U*~~~~~~~~c
c-CY)
D~~~~~~~~~~~~C
COco
4~~~~~~~~~~~c
co.*1~~~~~~~~c
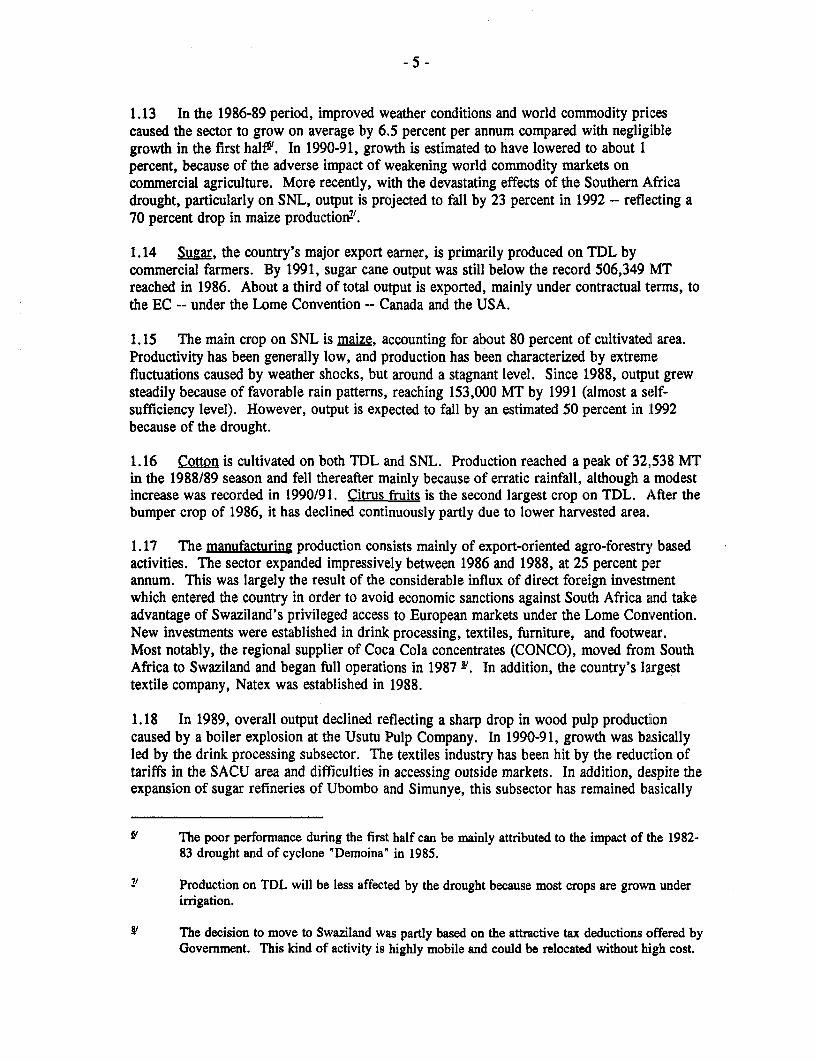
1.13 In the 1986-89 period, improved weather conditions and world commodity pricescaused the sector to grow on average by 6.5 percent per annum compared with negligiblegrowth in the first half-@. In 1990-91, growth is estimated to have lowered to about 1percent, because of the adverse impact of weakening world commodity markets oncommercial agriculture. More recently, with the devastating effects of the Southern Africadrought, particularly on SNL, output is projected to fall by 23 percent in 1992 - reflecting a70 percent drop in maize production'-.
1.14 Suggar, the country's major export earner, is primarily produced on TDL bycommercial farmers. By 1991, sugar cane output was still below the record 506,349 MTreached in 1986. About a third of total output is exported, mainly under contractual terms, tothe EC -- under the Lome Convention -- Canada and the USA.
1.15 The main crop on SNL is maize, accounting for about 80 percent of cultivated area.Productivity has been generally low, and production has been characterized by extremefluctuations caused by weather shocks, but around a stagnant level. Since 1988, outpu1t grewsteadily because of favorable rain patterns, reaching 153,000 MT by 1991 (almost a self-sufficiency level). However, output is expected to fall by an estimated 50 percent in 1992because of the drought.
1.16 Cotto is cultivated on both TDL and SNL. Production reached a peak of 32,538 MTin the 1988/89 season and fell thereafter mainly because of erratic rainfall, although a modestincrease was recorded in 1990/91. Citrus fruits is the second largest crop on TDL. After thebumper crop of 1986, it has declined continuously partly due to lower harvested area.
1.17 The manufacturing production consists mainly of export-oriented agro-forestry basedactivities. The sector expanded impressively between 1986 and 1988, at 25 percent perannum. This was largely the result of the considerable influx of direct foreign investmentwhich entered the country in order to avoid economic sanctions against South Africa and takeadvantage of Swaziland's privileged access to European markets under the Lome Convention.New investments were established in drink processing, textiles, furniture, and footwear.Most notably, the regional supplier of Coca Cola concentrates (CONCO), moved from SouthAfrica to Swaziland and began full operations in 1987 F'. In addition, the country's largesttextile company, Natex was established in 1988.
1.18 In 1989, overall output declined reflecting a sharp drop in wood pulp productiioncaused by a boiler explosion at the Usutu Pulp Company. In 1990-91, growth was basicallyled by the drink processing subsector. The textiles industry has been hit by the reduction oftariffs in the SACU area and difficulties in accessing outside markets. In addition, despite theexpansion of sugar refineries of Ubombo and Simunye, this subsector has remained basically
The poor performance during the first half can be mainly attributed to the impact of the 1982-83 drought and of cyclone "Demoina" in 1985.
2" Production on TDL will be less affected by the drought because most crops are grown underirrigation.
Y The decision to move to Swaziland was partly based on the attractive tax deductions offered byGovernment. This kind of activity is highly mobile and could be relocated without high cost.

-6 -
stagnant since 1989. The 1992 drought affected some manufacturing activities such as thefruit canning industry. Despite the relative diversification of the industrial base, the sectorcontinues to be dominated by few subsectors: sugar, wood pulp, drink processing and fruitcanning.
1.19 As part of its industrial policy, the Government created in 1987 the SwazilandIndustrial Development Company (SIDC)2. This is a joint venture between the Governmentand some international institutions, aimed at promoting private investment through themobilization of domestic and foreign resources. By early 1992, SIDC had approved about 49projects, with a SIDC contribution of E83 million.
1.20 Government services account for about 20 percent of total output. The rate ofexpansion of civil service employment in the 1980s averaged 4.5 percent per annum, abovewage employment, with the highest growth recorded in the first half. Together with theparastatal sector, which includes public utilities, airways and railways, the public sectoraccounts for around 35 percent of GDP.
Expenditures and Savings
1.21 An interesting feature in Swaziland's development is the decline in the investment toGDP ratio observed in the second half of 1980s, which may have negative implications onfuture growth prospects.LO' This resulted mainly from a nominal fall in public investmentboth by central Government and parastatals. The fact that Swaziland was able to grow rapidlyin the second half of the 1980s, despite the observed decline in the average investment ratio,suggests increased capacity utilization based on previous years' investments, and possiblysome efficiency gains associated with increased economies of scale.
1.22 It is common to find the relative importance of public investment declining at a certainstage of economic development, e.g., once basic infrastructure has been put in place. InSwaziland, part of the decline in public investment could be attributed to a structural shift ofthis nature, particularly given the high levels attained in the late 1970s and early 1980s.However, there is evidence that investment in certain key public services was inadequate andcapacity was overstretched to meet increased demand generated by the expansion in economicactivity. In particular, investment in electricity, water and telecommunications sufferedsignificantly as a result of financial difficulties faced by the public utilities while investmentby central Government was poorly targeted. Since 1989, the Government has embarked intoan ambitious investment plan which, however, does not adequately address priorities andcould prove unsustainable in the long term.
2' The SIDC replaces the National Industrial Development Corporation (NIDC) previously incharge of investment finance and business promotion.
°0' The quality of the national accounts series is questionable because of inconsistencies inmethodologies and coverage throughout the years. Thus the observed decline in the investmentratio may well reflect significant statistical problems. For example, the investment seriescannot be matched with machinery and equipment imports because the coverage of the latterhas changed considerably.
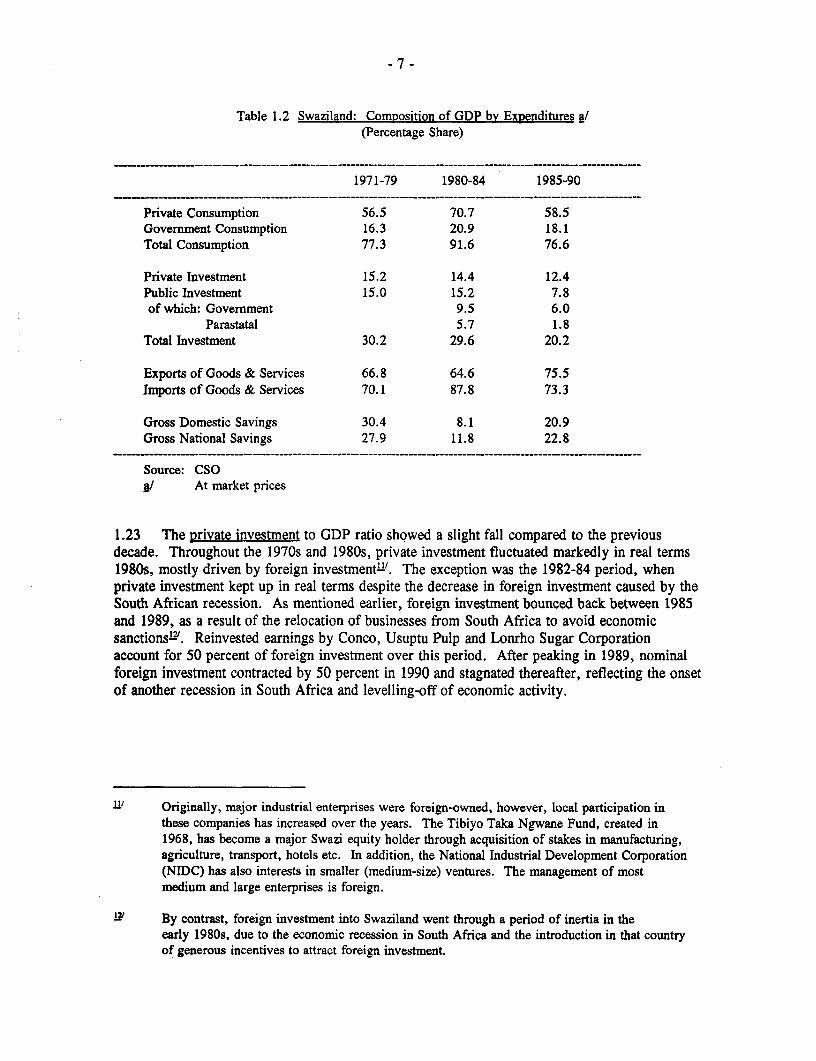
-7-- 7 -
Table 1.2 Swaziland: Composition of GDP by Expenditures a/(Percentage Share)
1971-79 1980-84 1985-90
Private Consumption 56.5 70.7 58.5Government Consumption 16.3 20.9 18.1Total Consumption 77.3 91.6 76.6
Private Investment 15.2 14.4 12.4Public Investment 15.0 15.2 7.8of which: Government 9.5 6.0
Parastatal 5.7 1.8Total Investment 30.2 29.6 20.2
Exports of Goods & Services 66.8 64.6 75.5Imports of Goods & Services 70.1 87.8 73.3
Gross Domestic Savings 30.4 8.1 20.9Gross National Savings 27.9 11.8 22.8
Source: CSOA/ At market prices
1.23 The private investment to GDP ratio showed a slight fall compared to the previousdecade. Throughout the 1970s and 1980s, private investment fluctuated markedly in reall terms1980s, mostly driven by foreign investment!-. The exception was the 1982-84 period, wthenprivate investment kept up in real terms despite the decrease in foreign investment caused by theSouth African recession. As mentioned earlier, foreign investment bounced back between 1985and 1989, as a result of the relocation of businesses from South Africa to avoid economicsanctions-L'. Reinvested earnings by Conco, Usuptu Pulp and Lonrho Sugar Corporationaccount for 50 percent of foreign investment over this period. After peaking in 1989, nominalforeign investment contracted by 50 percent in 1990 and stagnated thereafter, reflecting the onsetof another recession in South Africa and levelling-off of economic activity.
"1' Originally, major industrial enterprises were foreign-owned, however, local participation inthese companies has increased over the years. The Tibiyo Taka Ngwane Fund, created in1968, has become a major Swazi equity holder through acquisition of stakes in manufactlring,agriculture, transport, hotels etc. In addition, the National Industrial Development Corporation(NIDC) has also interests in smaller (medium-size) ventures. The management of mostmedium and large enterprises is foreign.
'V By contrast, foreign investment into Swaziland went through a period of inertia in theearly 1980s, due to the economic recession in South Africa and the introduction in that countryof generous incentives to attract foreign investment.
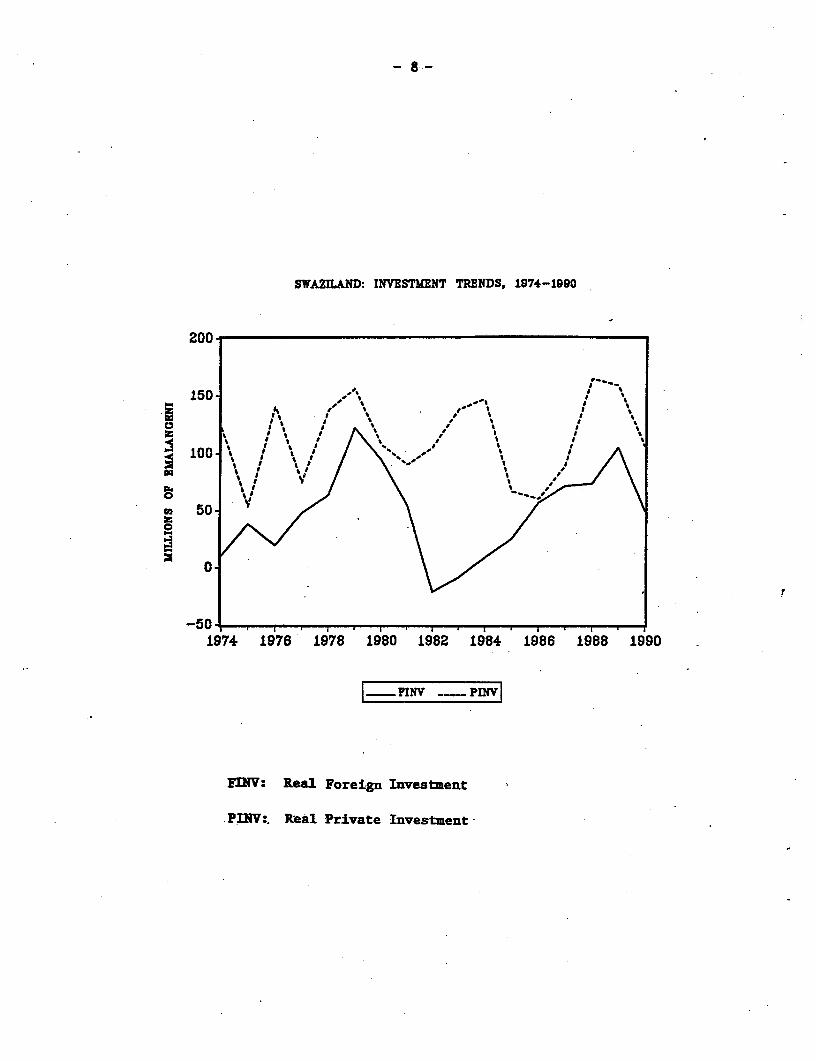
- 8 -
SWAZILAND: INESTMENT TRENDS, 1974-1990
200-
0 -~ ~ ~ ~~~~~~~~~
150 ,
190-74 1976 1978 1980 1982 1984 1986 1988 1990
- FINV __ PDNV
FM: Real Foreign Investment
.PINV:. Rkal Private Investment-
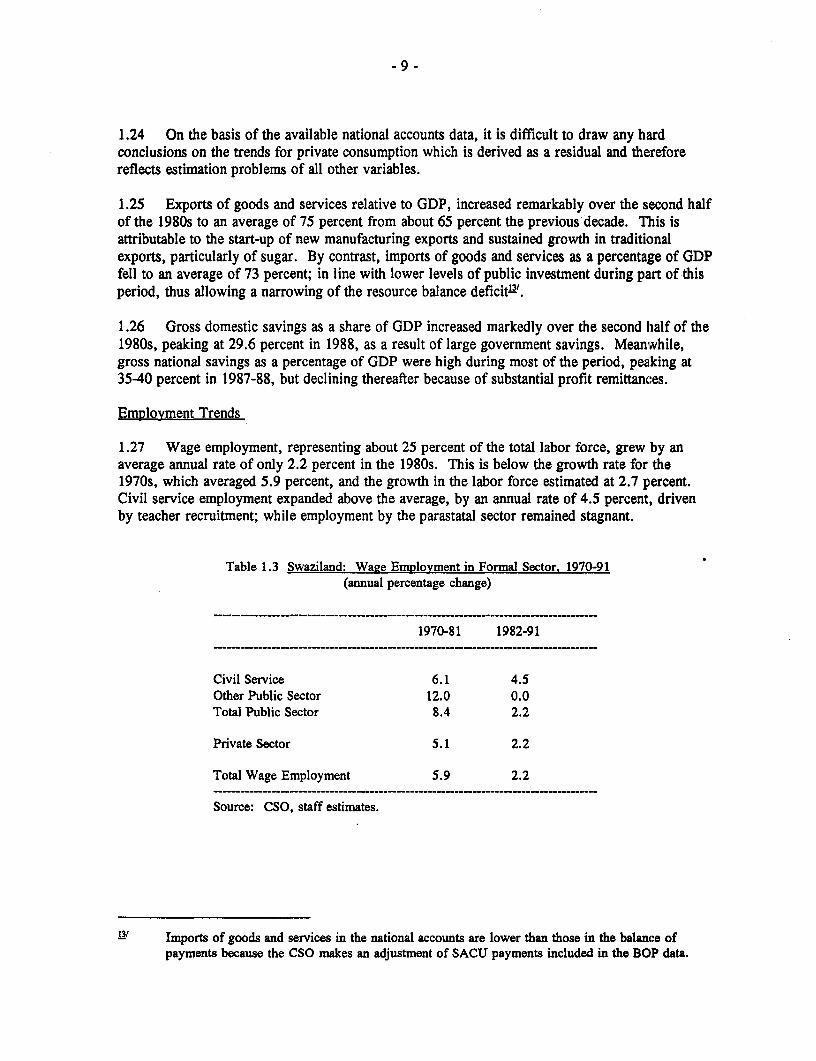
- 9 -
1.24 On the basis of the available national accounts data, it is difficult to draw any hardconclusions on the trends for private consumption which is derived as a residual and thereforereflects estimation problems of all other variables.
1.25 Exports of goods and services relative to GDP, increased remarkably over the second halfof the 1980s to an average of 75 percent from about 65 percent the previous decade. This isattributable to the start-up of new manufacturing exports and sustained growth in traditionalexports, particularly of sugar. By contrast, imports of goods and services as a percentage of GDPfell to an average of 73 percent; in line with lower levels of public investment during part of thisperiod, thus allowing a narrowing of the resource balance deficit1l3'.
1.26 Gross domestic savings as a share of GDP increased markedly over the second half of the1980s, peaking at 29.6 percent in 1988, as a result of large government savings. Meanwhile,gross national savings as a percentage of GDP were high during most of the period, peaking at35-40 percent in 1987-88, but declining thereafter because of substantial profit remittances.
Employment Trends
1.27 Wage employment, representing about 25 percent of the total labor force, grew by anaverage annual rate of only 2.2 percent in the 1980s. This is below the growth rate for the1970s, which averaged 5.9 percent, and the growth in the labor force estimated at 2.7 percent.Civil service employment expanded above the average, by an annual rate of 4.5 percent, drivenby teacher recruitment; while employment by the parastatal sector remained stagnant.
Table 1.3 Swaziland: Wage Emplovment in Formal Sector. 1970-91(annual percentage change)
1970-81 1982-91
Civil Service 6.1 4.5Other Public Sector 12.0 0.0Total Public Sector 8.4 2.2
Private Sector 5.1 2.2
Total Wage Employment 5.9 2.2
Source: CSO, staff estimates.
Imports of goods and services in the national accounts are lower than those in the balance ofpayments because the CSO makes an adjustment of SACU payments included in the BOP data.
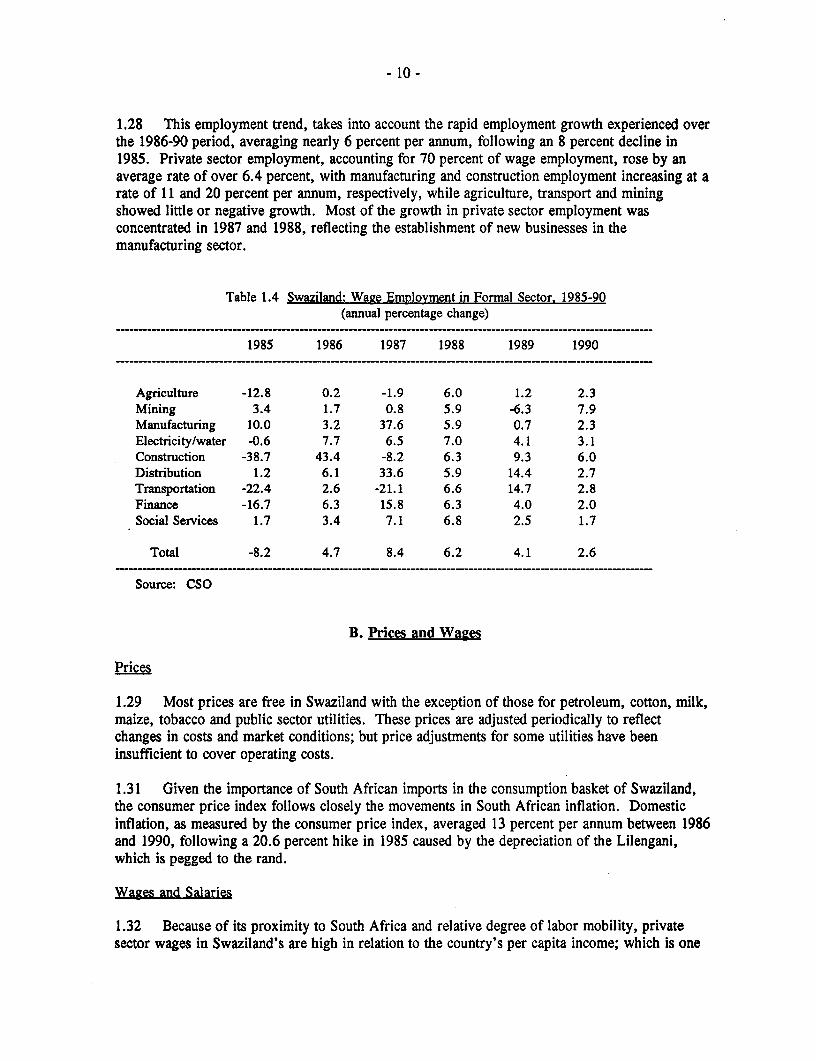
- 10-
1.28 This employment trend, takes into account the rapid employment growth experienced overthe 1986-90 period, averaging nearly 6 percent per annum, following an 8 percent decline in1985. Private sector employment, accounting for 70 percent of wage employment, rose by anaverage rate of over 6.4 percent, with manufacturing and construction employment increasing at arate of 11 and 20 percent per annum, respectively, while agriculture, transport and miningshowed little or negative growth. Most of the growth in private sector employment wasconcentrated in 1987 and 1988, reflecting the establishment of new businesses in themanufacturing sector.
Table 1.4 Swaziland: Wage Emplovment in Formal Sector. 1985-90(annual percentage change)
1985 1986 1987 1988 1989 1990
Agriculture -12.8 0.2 -1.9 6.0 1.2 2.3Mining 3.4 1.7 0.8 5.9 -6.3 7.9Manufacturing 10.0 3.2 37.6 5.9 0.7 2.3Electricity/water -0.6 7.7 6.5 7.0 4.1 3.1Construction -38.7 43.4 -8.2 6.3 9.3 6.0Distribution 1.2 6.1 33.6 5.9 14.4 2.7Transportation -22.4 2.6 -21.1 6.6 14.7 2.8Finance -16.7 6.3 15.8 6.3 4.0 2.0Social Services 1.7 3.4 7.1 6.8 2.5 1.7
Total -8.2 4.7 8.4 6.2 4.1 2.6
Source: CSO
B. Prices and Wages
Prices
1.29 Most prices are free in Swaziland with the exception of those for petroleum, cotton, milk,maize, tobacco and public sector utilities. These prices are adjusted periodically to reflectchanges in costs and market conditions; but price adjustments for some utilities have beeninsufficient to cover operating costs.
1.31 Given the importance of South African imports in the consumption basket of Swaziland,the consumer price index follows closely the movements in South African inflation. Domesticinflation, as measured by the consumer price index, averaged 13 percent per annum between 1986and 1990, following a 20.6 percent hike in 1985 caused by the depreciation of the Lilengani,which is pegged to the rand.
Wages and Salaries
1.32 Because of its proximity to South Africa and relative degree of labor mobility, privatesector wages in Swaziland's are high in relation to the country's per capita income; which is one
- 11 -
third of that in South Africa. Since public sector wages, at least for skilled labor, tend to followthose in the private sector, this has had the effect of pushing the Government's overall wage bill(see Chapter III).
1.33 Wages in the private sector are set by wage councils and annual collective bargaining, andthe minimum wage is set as a by-product of this process. Minimum wages rose in real termsover the second half of 1980s, but from a very low base, indirectly reflecting adjustments agreedfor the private sector in a period of rapid economic growth and a strong trade union activity.
1.34 Civil service pay policy has been subject to much controversy within Swaziland and hasled to significant industrial relations difficulties over recent years. Not less than three salarycommissions have been charged with the responsibility of revising the wage structure since 1986(see Chapter III) and important pay scale adjustments were effected in 1988 and 1990. Inaddition, in response to union pressure, cost of living adjustments are being done on an annualbasis since 1987L1 .
C. Money and Credit
1.35 The financial system is composed of the Central Bank of Swaziland (CBS), fivecommercial banks and four other financial institutions. The CBS is responsible for regulating thefinancial system, issuing currency and managing foreign exchange reserves111. With theestablishment of the Swazi Stockbrokers Limited in 1990, an incipient stock market has started todevelop. Under the CMA agreement, renegotiated in 1986, the rand is no longer legal tender inSwaziland, and the requirement of rand backing for the issuance of emalangeni by the CBS hasbeen removed. The lilangeni is however pegged at par to the rand and rand notes circulate freelyin Swaziland.
Interest Rate Policy
1.36 Since 1988, the CBS has deliberately kept interest rates below those in South Afirica withthe objective of encouraging borrowing for productive investment and reducing commercialbanks' high level of liquidity. Although interest rate differentials with South Africa have, beenreduced, they have remained high -- at 3.5 percentage points, with the lending and deposit ratesset at 16 and 10.5-12.25 percent, respectively in 1991. While this policy succeeded in increasingprivate sector lending, most of it has been directed to short term financing, of trade and workingcapital, as well as personal loans rather than to investment. This is not surprising given that thestructure of bank deposits resulting from this policy has contributed to discourage long termlending as time deposits account for a very small proportion of total private deposits -- 9 percentin 1991. Furthermore, negative real interest rates for time deposits has not only prevented an
14/ Prior to 1987, civil service wages were adjusted on a bi-annual basis.
151 The Government handles directly a proportion of foreign exchange reserves, mostly SACUreceipts which are held in South Africa.

- 12 -
increase of domestic financial savings but has also encouraged capital flight as suggested by theincrease in short term capital outflows during 1986-90.
1.37 This policy should be reversed not only because of the need to change the depositstructure in favor of long term deposits but also because an increased level of financial savingswill be required in the future to make up for the reduction in bank excess liquidity. The liquidityratio has substantially declined from 53 percent in 1987 to below 25 percent in 1991, comparedwith a reserve requirement of 16 percent.
Monetary Aggregates
1.38 Money supply growth averaged 27 percent per annum in the 1985-90 period, based on therapid expansion in net foreign assets while net domestic credit remained relatively unchanged.Net foreign reserves rose despite the large short term capital outflows induced by interestdifferentials with South Africa, because of the combined effect of booming SACU receipts and thesubstantial inflow of direct foreign investment that occurred during this period to avoid sanctionsin South Africa. Credit to the private sector expanded by over 40 percent per annum, while netcredit to government was negative reflecting large budgetary surpluses since 1987.
D. External Trade and Payments
1.39 Swaziland's balance of payments position was strong in the late 1980s, which translatedinto a continued build up in gross foreign reserves. The main contributing factor was thesubstantial inflow of nonduty SACU receipts; followed by rapid export growth and a significantrebound in direct foreign investment.
Table 1.5 Swaziland: Value of Exports. 1986-90(in millions of Emalangeni)
-Average % Share-1986 1987 1988 1989 1990 1986 1990
Sugar 245.3 278.2 295.3 388.8 441.2 38.6 30.5Edible Concentrates - 155.1 176.3 252.8 335.9 0.0 23.4Wood Pulp 108.7 128.5 163.5 160.6 165.5 17.1 11.4Wood & Wood prod 48.9 20.4 38.6 42.1 64.5 7.7 4.5Canned Fruits 30.3 32.7 43.7 48.1 52.9 4.8 3.7Citrus Fruits 28.7 30.3 39.6 35.5 40.2 2.8 4.5Footwear - 13.1 13.8 19.4 24.6 0.0 1.7Cotton linters 4.6 11.6 8.5 40.2 18.0 0.7 1.2Zippers 15.1 19.9 22.9 30.4 30.4 2.4 2.1Cotton yarn - 11.0 22.0 21.6 25.0 0.0 1.7
Total 635.5 862.4 1059.9 1292.6 1447.0 100.0 100.0% change 61.7 35.7 22.9 22.0 11.9
Source: Central Bank of Swaziland
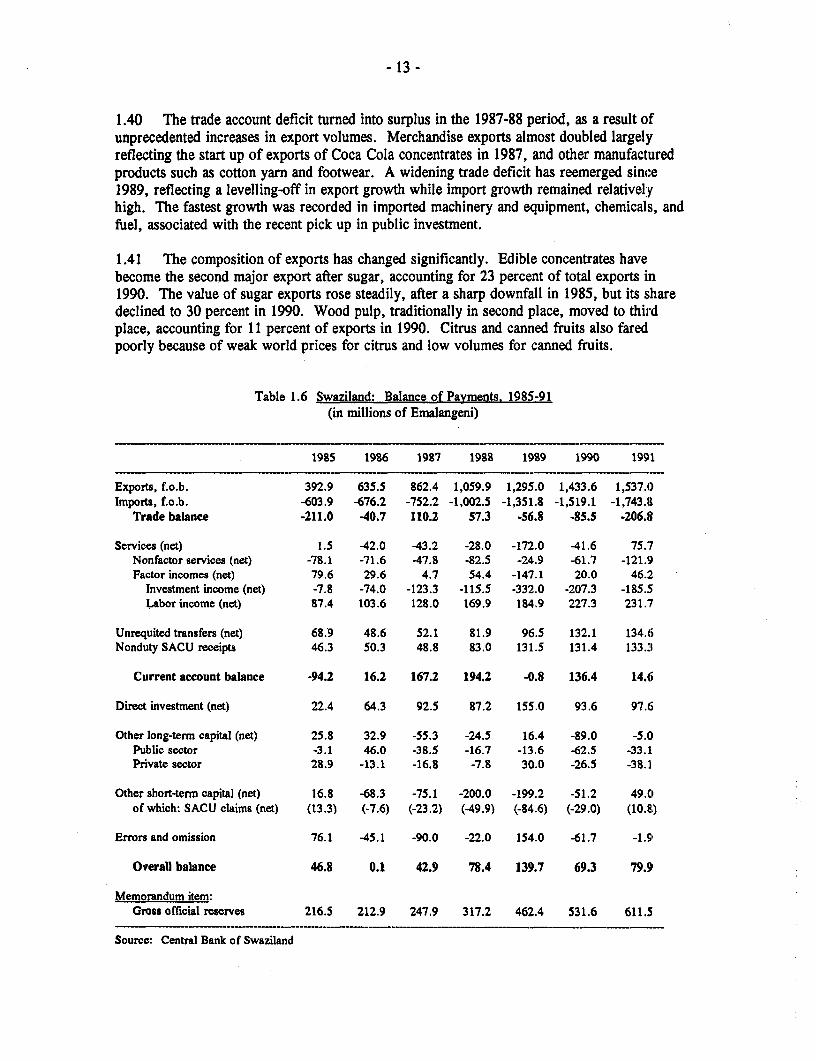
- 13 -
1.40 The trade account deficit turned into surplus in the 1987-88 period, as a result ofunprecedented increases in export volumes. Merchandise exports almost doubled largelyreflecting the start up of exports of Coca Cola concentrates in 1987, and other manufacturedproducts such as cotton yarn and footwear. A widening trade deficit has reemerged since1989, reflecting a levelling-off in export growth while import growth remained relativelyhigh. The fastest growth was recorded in imported machinery and equipment, chemicals, andfuel, associated with the recent pick up in public investment.
1.41 The composition of exports has changed significantly. Edible concentrates havebecome the second major export after sugar, accounting for 23 percent of total exports in1990. The value of sugar exports rose steadily, after a sharp downfall in 1985, but its sharedeclined to 30 percent in 1990. Wood pulp, traditionally in second place, moved to thirdplace, accounting for 11 percent of exports in 1990. Citrus and canned fruits also faredpoorly because of weak world prices for citrus and low volumes for canned fruits.
Table 1.6 Swaziland: Balance of Payments. 1985-91(in millions of Emalangeni)
1985 1986 1987 1988 1989 1990 1991
Exports, f.o.b. 392.9 635.5 862.4 1,059.9 1,295.0 1,433.6 1,537.0Imports, f.o.b. -603.9 -676.2 -752.2 -1,002.5 -1,351.8 -1,519.1 -1,743.8
Trade balance -211.0 40.7 110.2 57.3 -56.8 -85.5 -206.8
Services (net) 1.5 -42.0 -43.2 -28.0 -172.0 -41.6 75.7Nonfactor services (net) -78.1 -71.6 -47.8 -82.5 -24.9 -61.7 -121.9Factor incomes (net) 79.6 29.6 4.7 54.4 -147.1 20.0 46.2'
Investment income (net) -7.8 -74.0 -123.3 -115.5 -332.0 -207.3 -185.5Labor income (net) 87.4 103.6 128.0 169.9 184.9 227.3 231.7
Unrequited transfers (net) 68.9 48.6 52.1 81.9 96.5 132.1 134.6Nonduty SACU receipts 46.3 50.3 48.8 83.0 131.5 131.4 133.3
Current account balance -94.2 16.2 167.2 194.2 -0.8 136.4 14.6
Direct investment (net) 22.4 64.3 92.5 87.2 155.0 93.6 97.6
Other long-term capital (net) 25.8 32.9 -55.3 -24.5 16.4 -89.0 -5.0Public sector -3.1 46.0 -38.5 -16.7 -13.6 -62.5 -33.1Private sector 28.9 -13.1 -16.8 -7.8 30.0 -26.5 -38.1
Other short-term capital (net) 16.8 -68.3 -75.1 -200.0 -199.2 -51.2 49.0of which: SACU claims (net) (13.3) (-7.6) (-23.2) *-49.9) (-84.6) (-29.0) (10.8)
Errors and omission 76.1 -45.1 -90.0 -22.0 154.0 -61.7 -1.9
Overall balance 46.8 0.1 42.9 78.4 139.7 69.3 79.9
Memorandum item:Gross official reserves 216.5 212.9 247.9 317.2 462.4 531.6 611.5
Source: Central Bank of Swaziland
- 14 -
1.42 The services account was in deficit throughout the 1986-90 period, but showed asmall surplus in 1991. The non-factor services deficit narrowed since 1989 as a result ofincreased tourism receipts and earnings from the northern transient line of Swaziland Railways(SR). The factor services account, traditionally in surplus, showed deficits in some yearsbecause of large profit remittances. Despite the recent worsening in the trade deficit, and thecontinued deficit in the services account, the current account balance was in surplusthroughout most of the period, because of the substantial inflow of nonduty SACU receipts,recorded under official transfers!-.
1.43 On the capital account, large direct foreign investment inflows were more thancompensated by other short term net capital outflows, partly induced by the prevailing interestrate differentials with South Africa, and external debt repayments. In 1991, the capitalaccount contributed to the overall balance of payment position, through a positive net shortterm capital flow for the first time in several years, probably resulting from the recentnarrowing in interest rate differentials.
External Debt
1.44 Swaziland's external debt profile has improved remarkably in recent years. Itsexternal public debt, including both Government and Government guaranteed debt, declinedsteadily from US$221.5 million in 1986 (54 percent of GDP) to US$208.5 million in 1989(34 percent of GDP). Net repayments to multilaterals, including a prepayment to the WorldBank of debt owed by the Swaziland Electricity Board (SEB), and complete phasing out ofborrowing from private financial institutions, contributed to this outcome.
E. Public Sector Finance
E.1. Central Government
1.45 The scope of pursuing an independent monetary policy under the CMA arrangement islimited; thus, public finance constitutes the key policy instrument influencing economicactivity. The Government has been able to avoid large budget deficits in the past, and attimes, has recorded surpluses due to fluctuations in economic activity.
Recent Budgetary Trends. FY1985-91
1.46 Substantial budgetary surpluses were recorded in the FY1987-91 period, reflecting anupsurge in fiscal revenues caused by the expansion in economic activity. Governmentexpenditures lagged behind for a while but accelerated since 1989, through rapidly increasingcapital and personnel outlays. As a result of these surpluses, the Government became a netcreditor to the banking system and was able to make net repayments of its external debt. Inthe FY1990-91 period, a large proportion of the budget surpluses were sterilized through the
16' These flows represent SACU receipts accrued to Swaziland under the compensatory factor.
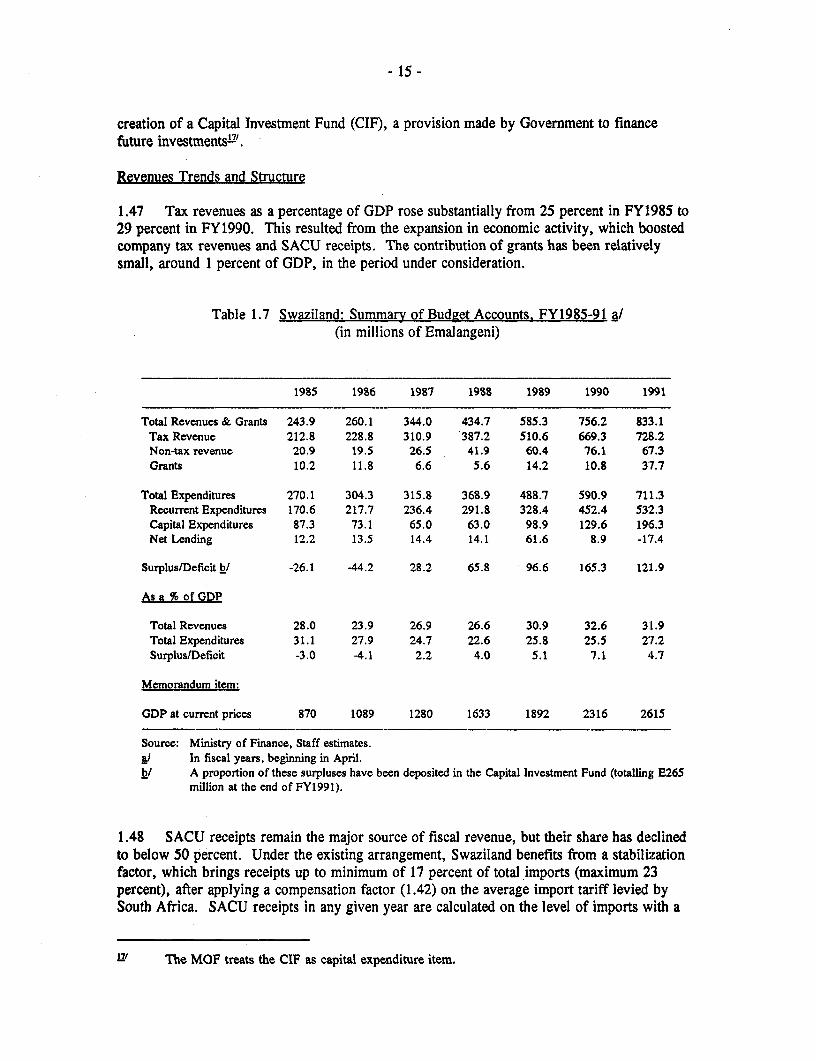
- 15 -
creation of a Capital Investment Fund (CIF), a provision made by Government to financefuture investments''.
Revenues Trends and Structure
1.47 Tax revenues as a percentage of GDP rose substantially from 25 percent in FY1985 to29 percent in FY1990. This resulted from the expansion in economic activity, which boostedcompany tax revenues and SACU receipts. The contribution of grants has been relativelysmall, around 1 percent of GDP, in the period under consideration.
Table 1.7 Swaziland: Summary of Budget Accounts. FY1985-91 a/(in millions of Emalangeni)
1985 1986 1987 1988 1989 1990 1991
Total Revenues & Grants 243.9 260.1 344.0 434.7 585.3 756.2 83:3.1Tax Revenue 212.8 228.8 310.9 387.2 510.6 669.3 728.2Non-tax revenue 20.9 19.5 26.5 41.9 60.4 76.1 67.3Grants 10.2 11.8 6.6 5.6 14.2 10.8 37.7
Total Expenditures 270.1 304.3 315.8 368.9 488.7 590.9 711.3Recurrcnt Expenditures 170.6 217.7 236.4 291.8 328.4 452.4 532.3Capital Expenditures 87.3 73.1 65.0 63.0 98.9 129.6 196.3Net Lending 12.2 13.5 14.4 14.1 61.6 8.9 -17.4
Surplus/Deficit bl -26.1 -44.2 28.2 65.8 96.6 165.3 121.9
As a % of GDP
Total Revenues 28.0 23.9 26.9 26.6 30.9 32.6 31.9Total Expenditures 31.1 27.9 24.7 22.6 25.8 25.5 27.2Surplus/Deficit -3.0 4.1 2.2 4.0 5.1 7.1 4.7
Memorandum item:
GDP at current prices 870 1089 1280 1633 1892 2316 2615
Source: Ministry of Finance, Staff estimates.a/ In fiscal years, beginning in April.b/ A proportion of these surpluses have been deposited in the Capital Investment Fund (totalling E265
million at the end of FY1991).
1.48 SACU receipts remain the major source of fiscal revenue, but their share has declinedto below 50 percent. Under the existing arrangement, Swaziland benefits from a stabilizationfactor, which brings receipts up to minimum of 17 percent of total imports (maximum 23percent), after applying a compensation factor (1.42) on the average import tariff levied bySouth Africa. SACU receipts in any given year are calculated on the level of imports with a
L7' The MOF treats the CIF as capital expenditure item.
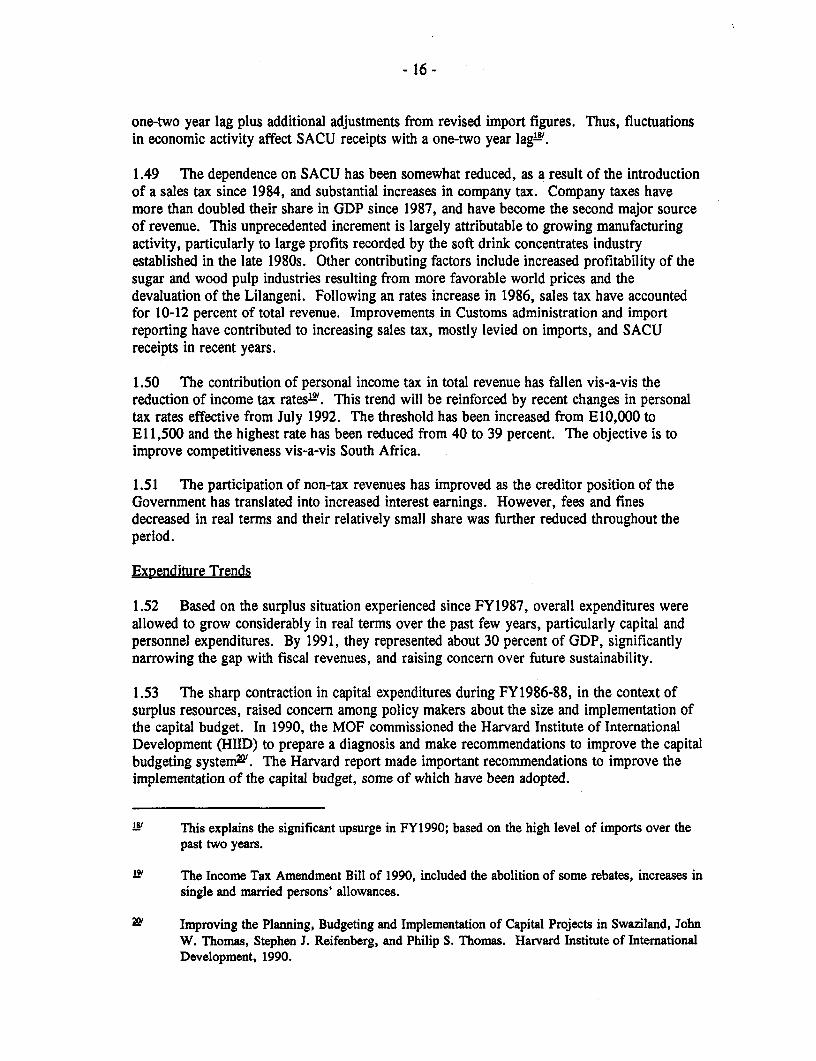
- 16 -
one-two year lag plus additional adjustments from revised import figures. Thus, fluctuationsin economic activity affect SACU receipts with a one-two year lag'8'.
1.49 The dependence on SACU has been somewhat reduced, as a result of the introductionof a sales tax since 1984, and substantial increases in company tax. Company taxes havemore than doubled their share in GDP since 1987, and have become the second major sourceof revenue. This unprecedented increment is largely attributable to growing manufacturingactivity, particularly to large profits recorded by the soft drink concentrates industryestablished in the late 1980s. Other contributing factors include increased profitability of thesugar and wood pulp industries resulting from more favorable world prices and thedevaluation of the Lilangeni. Following an rates increase in 1986, sales tax have accountedfor 10-12 percent of total revenue. Improvements in Customs administration and importreporting have contributed to increasing sales tax, mostly levied on imports, and SACUreceipts in recent years.
1.50 The contribution of personal income tax in total revenue has fallen vis-a-vis thereduction of income tax rates'-W. This trend will be reinforced by recent changes in personaltax rates effective from July 1992. The threshold has been increased from E10,000 toEl 1,500 and the highest rate has been reduced from 40 to 39 percent. The objective is toimprove competitiveness vis-a-vis South Africa.
1.51 The participation of non-tax revenues has improved as the creditor position of theGovernment has translated into increased interest earnings. However, fees and finesdecreased in real terms and their relatively small share was further reduced throughout theperiod.
Expenditure Trends
1.52 Based on the surplus situation experienced since FY1987, overall expenditures wereallowed to grow considerably in real terms over the past few years, particularly capital andpersonnel expenditures. By 1991, they represented about 30 percent of GDP, significantlynarrowing the gap with fiscal revenues, and raising concern over future sustainability.
1.53 The sharp contraction in capital expenditures during FY1986-88, in the context ofsurplus resources, raised concern among policy makers about the size and implementation ofthe capital budget. In 1990, the MOF commissioned the Harvard Institute of InternationalDevelopment (HIID) to prepare a diagnosis and make recommendations to improve the capitalbudgeting systemn'. The Harvard report made important recommendations to improve theimplementation of the capital budget, some of which have been adopted.
LBI This explains the significant upsurge in FY1990; based on the high level of imports over thepast two years.
w The Income Tax Amendment Bill of 1990, included the abolition of some rebates, increases insingle and married persons' allowances.
LD' Improving the Planning, Budgeting and Implementation of Capital Projects in Swaziland, JohnW. Thomas, Stephen J. Reifenberg, and Philip S. Thomas. Harvard Institute of InternationalDevelopment, 1990.

- 17 -
Table 1.8 Swaziland: Central Government Revenue and Grants. FY1985-91(in percent of GDP)
1985 1986 1987 1988 1989 1990 1991
Total Revenue 26.9 22.8 26.9 26.6 30.9 32.6 31.9Tax Revenue 24.5 21.0 24.3 23.7 27.0 28.9 27.8
Net income and profits 6.8 6.2 8.8 8.8 11.6 9.6 10.0Companies 3.0 2.2 5.7 5.1 8.0 6.2 6.9Individuals 3.4 3.5 3.4 3.1 3.2 3.1 2.5Dividends and interest 0.4 0.4 0.6 0.6 0.6 0.6 0.6
Property 0.0 0.1 0.1 0.0 0.1 0.1 0.1Goods, services & trade 17.6 14.8 14.4 15.0 15.9 21.4
Customs Union Receipts 15.7 11.0 10.5 9.9 9.9 14.6 13.6Sales Tax 1.6 2.9 2.7 3.2 3.8 3.7 3.7
Non Tax Revenue 2.4 1.8 2.1 2.6 3.2 3.3 2.6Property income 1.5 1.2 1.3 1.7 2.5 2.9Fees, fines & nonindustr. sales 0.9 0.6 0.8 0.9 0.8 0.6 0.7
Grants 1.2 1.1 0.5 0.3 0.8 0.5 1.4
Source: Ministry of Finance, Staff Estimates.
1.54 The focus on implementation, however, diverted the attention from more fundamentalissues regarding the sustainability and efficiency of a rising capital expenditure prograrrm.Capital expenditures tripled in nominal terms between 1989 and 1991. At the same time, thenumber of projects under execution increased dramatically from about 90 in FY1987 to over230 in FY1991aI'. Given limited staff, the quality of project preparation and evaluation hasinevitably suffered. Consequently, investment decisions have been based on weak projectevaluation and an unclear sense of sectoral priorities (see Chapter II). This is illustrated bythe overwhelming proportion of "unproductive " projects that have been implemented, e.g.,Government buildings and civil servants housing. In addition, only 20 percent of the projectshad adequate estimates of associated recurrent costs.
1.55 Another source of concern is the rapid growth of the wage bill in recent years. Theshare of personnel outlays in total expenditures has increased significantly since FY1985,driven by substantial wage adjustments and a relatively high recruitment rate. Important payadjustments aimed at restoring real wages and enhancing salary decompression, were effectedin 1986, 1988 and 1990, following the recommendations of various salary commissions. In1990, the civil service wage bill rose by 49 percent, reflecting, in addition to cost of livingadjustments, pay scale adjustments and a one-off back pay awardw'. Civil serviceemployment continued to grow faster than wage employment during the 1980s, but this was
21/ Part of this increase can be attributed to the improved coverage of the capital budget, since theintroduction of the three-year rolling plan since FY1989. In addition, a number of programshave been split into their project components because the monitoring system is project driven.
This followed the recommendations made by the Richards Commission in 1988 whereemphasis was given to salary adjustments for higher level civil servants.
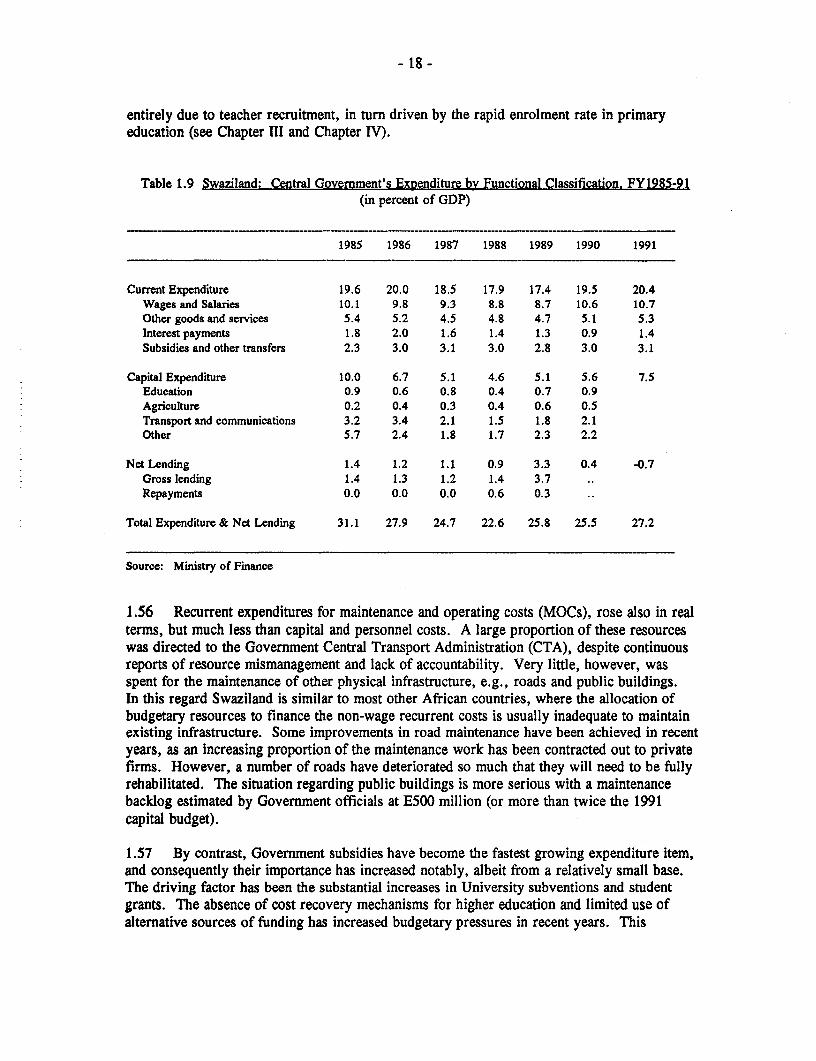
- 18 -
entirely due to teacher recruitment, in turn driven by the rapid enrolment rate in primaryeducation (see Chapter HI and Chapter IV).
Table 1.9 Swaziland: Central Government's Expenditure by Functional Classification. FY1985-91(in percent of GDP)
1985 1986 1987 1988 1989 1990 1991
Current Expenditure 19.6 20.0 18.5 17.9 17.4 19.5 20.4Wages and Salaries 10.1 9.8 9.3 8.8 8.7 10.6 10.7Other goods and services 5.4 5.2 4.5 4.8 4.7 5.1 5.3Interest payments 1.8 2.0 1.6 1.4 1.3 0.9 1.4Subsidies and other transfers 2.3 3.0 3.1 3.0 2.8 3.0 3.1
Capital Expenditure 10.0 6.7 5.1 4.6 5.1 5.6 7.5Education 0.9 0.6 0.8 0.4 0.7 0.9Agriculture 0.2 0.4 0.3 0.4 0.6 0.5Transport and communications 3.2 3.4 2.1 1.5 1.8 2.1Other 5.7 2.4 1.8 1.7 2.3 2.2
Net Lending 1.4 1.2 1.1 0.9 3.3 0.4 -0.7Gross lending 1.4 1.3 1.2 1.4 3.7Repayments 0.0 0.0 0.0 0.6 0.3
Total Expenditure & Net Lending 31.1 27.9 24.7 22.6 25.8 25.5 27.2
Source: Ministry of Finance
1.56 Recurrent expenditures for maintenance and operating costs (MOCs), rose also in realterms, but much less than capital and personnel costs. A large proportion of these resourceswas directed to the Government Central Transport Administration (CTA), despite continuousreports of resource mismanagement and lack of accountability. Very little, however, wasspent for the maintenance of other physical infrastructure, e.g., roads and public buildings.In this regard Swaziland is similar to most other African countries, where the allocation ofbudgetary resources to finance the non-wage recurrent costs is usually inadequate to maintainexisting infrastructure. Some improvements in road maintenance have been achieved in recentyears, as an increasing proportion of the maintenance work has been contracted out to privatefirms. However, a number of roads have deteriorated so much that they will need to be fullyrehabilitated. The situation regarding public buildings is more serious with a maintenancebacklog estimated by Government officials at E500 million (or more than twice the 1991capital budget).
1.57 By contrast, Government subsidies have become the fastest growing expenditure item,and consequently their importance has increased notably, albeit from a relatively small base.The driving factor has been the substantial increases in University subventions and studentgrants. The absence of cost recovery mechanisms for higher education and limited use ofalternative sources of funding has increased budgetary pressures in recent years. This
- 19 -
problem is compounded by the poor integration of the University in the budgeting andplanning process of the education sector.
1.58 Given the Government's ability to repay debt during this period, outlays in interestpayments actually declined in real terms and now account for a small share of expenditares.
Sectoral Composition of Expenditures
1.59 The sectoral composition of expenditures over the past five years has moved further infavor of the social services, particularly of education. In addition, there has been a shifttowards of general public services partly in detriment of economic services, e.g., of transportand communications.
Table 1.10 Swaziland: Central Government's Expenditure by Economic Classification. FY1986-91(in percent of total expenditure)
1986 1987 1988 1989 1990 1991L
General Public Services 25.4 28.0 30.5 33.0 33.1 30.1General Administration 11.4 13.8 15.4 17.4 15.9 14.2Public Order, Safety & Defence 14.0 14.3 15.1 15.6 17.2 15.8
Social Services 37.4 38.0 39.3 38.0 40.7 43.5Education 22.1 24.7 23.9 24.5 27.4 29.1.Health 8.3 9.4 8.6 8.2 8.9 9.3Other Social Services a/ 7.0 4.0 6.8 5.3 4.5 5.1
Economic Services 29.8 27.3 24.0 23.3 22.7 23.5Agriculture 6.3 6.8 7.2 8.0 7.3 8.9Industry and Mining 4.9 4,7 2.2 1.7 1.3 0.9Water and Sewerag 1.4 1.7 1.9 0.7 1.2 0.9Transport and Communication 16.7 13.5 12.2 12.4 11.9 12.2
TOTALb/ 100.0 100.0 100.0 100.0 100.0 100.0
o/w: current 74.8 78.5 82.2 76.9 77.7 71.2capital 25.2 21.5 17.8 23.2 22.3 28.9
Source: Ministry of Financeit Includes housing and community amenitiesbl Excludes net lending

- 20 -
1.60 Education, is the single largest recipient of public funds, and its share has actuallyincreased since 1985, to about a third of total expenditures. This is well above the averagefor other African countries. The increase of expenditures in the sector has been led by rapidteacher recruitment - 9.2 percent per annum in 1982-91 - driven by the goal of attaininguniversal primary school enrolment. Currently, the sector absorbs 35 percent of the recurrentbudget and 15 percent of the capital budget; with teachers salaries accounting for 40 percentof the wage bill. While progress has been made in expanding the coverage of education, thequality of the system is poor as evidenced by the high repetition and drop-out rates,particularly at the primary level (see Chapter IV). The main factors contributing to this resultinclude deficient teacher training and inadequate supplies of teaching materials that areessential to improve quality. The subsectoral allocation of non-wage expenditures appears tobe also inadequate with a large proportion being directed to the University, in the form ofsubsidies and student grants and new capital projects.
1.61 Other social sectors have accounted for 12-15 percent of the budget. A largerproportion of the capital budget has been directed to housing since FY1988, and recently tothe health sector.
1.62 General public services, both general administration and public safety and defense --account for 30 percent of total expenditures -- 35 percent of the recurrent costs and 20 percentof the capital budget. Expenditures in these sectors expanded rapidly particularly on accountof increased capital expenditures since FY1989. These include construction of Governmentbuildings (e.g., new embassies abroad) and housing for civil servants. Arguably, theworsening of crime in the country has brought the need to increase police staffing andconsequently police stations and housing. There is no evidence that this is actually helping toreduce crime, particularly since police stations continue to be located far from the targetedcommunities.
1.63 Transport and communications -- composed of roads, CTA, and support to parastatalsoperating in the sector3' -- continue to absorb the largest proportion of the capital budget,33 percent in FY1991, but its importance decreased steadily since FY1985. This reflectsreduced support to other transport activities, while allocations to the roads subsector and CTAgrew significantly in real terms. In particular, purchases of vehicle and equipment by CTAsurged in FY1990, accounting for 50 percent of the sectoral capital budget and 18 percent ofthe total capital expenditures. In FY1991, CTA capital outlays were reduced in value but stillrepresent and important share in the total. The roads subsector accounts for the largest shareof the capital budget, over 20 percent in FY1991.
1.64 Among other economic sectors, the importance of agriculture has increased mostlyreflecting building construction for institutional support. In the case of water and seweragesector, expenditures have been clearly underfunded, as evidenced by widespread reports ofaged and leaking pipes. The funds allocated for the sector from the Central budget have beenvery small and declined in real terms. In addition, the Water and Sewerage Board (WSB),which effectively operates as a Government department, has undertaken very little investmentsand maintenance work because of management and financial weaknesses.
W The sector includes support to a number of parastatals-in railways, civil aviation,telecommunications, and broadcasting-which operate with autonomous budgets.
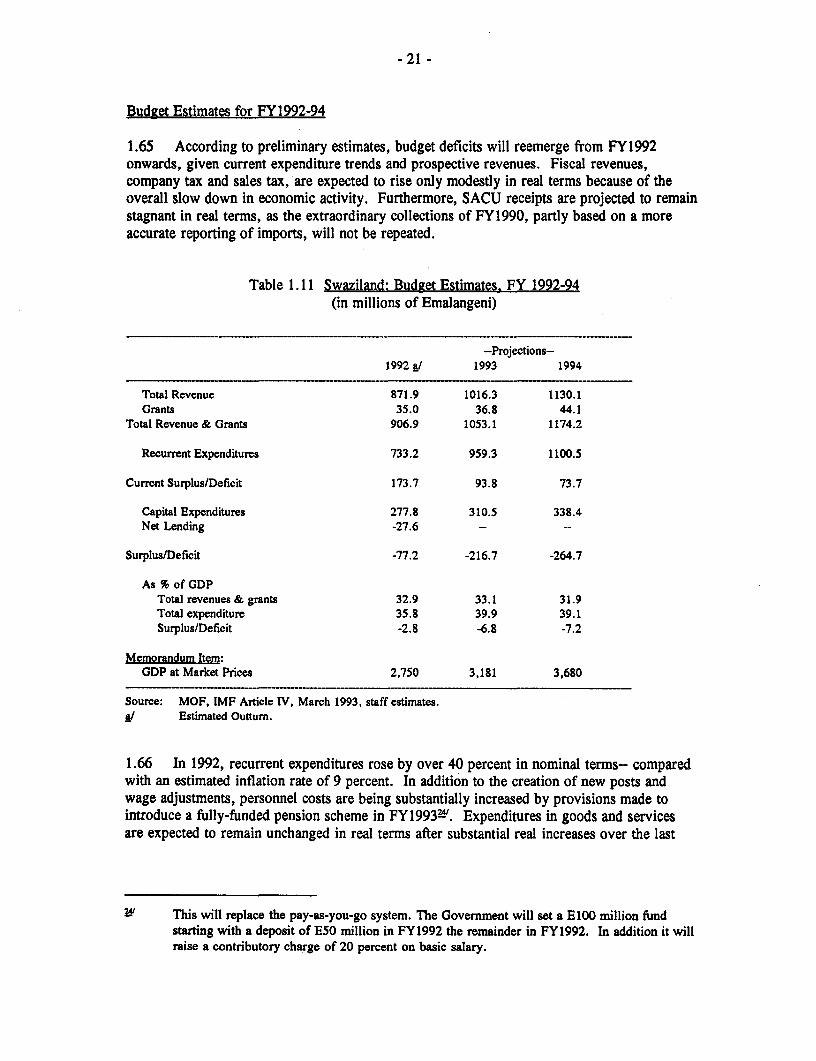
- 21 -
Budget Estimates for FY1992-94
1.65 According to preliminary estimates, budget deficits will reemerge from FY1992onwards, given current expenditure trends and prospective revenues. Fiscal revenues,company tax and sales tax, are expected to rise only modestly in real terms because of theoverall slow down in economic activity. Furthermore, SACU receipts are projected to remainstagnant in real terms, as the extraordinary collections of FY1990, partly based on a moreaccurate reporting of imports, will not be repeated.
Table 1.11 Swaziland: Budget Estimates. FY 1992-94(in millions of Emalangeni)
-Projections-1992_/ 1993 1994
Total Revenue 871.9 1016.3 1130.1Grants 35.0 36.8 44.1
Total Revenue & Grants 906.9 1053.1 1174.2
Recurrent Expenditures 733.2 959.3 1100.5
Current Surplus/Deficit 173.7 93.8 73.7
Capital Expenditures 277.8 310.5 338.4Net Lending -27.6 - --
Surplus/Deficit -77.2 -216.7 -264.7
As % of GDPTotal revenues & grants 32.9 33.1 31.9Total expenditure 35.8 39.9 39.1Surplus/Deficit -2.8 -6.8 -7.2
Memorandum Item:GDP at Market Prices 2,750 3,181 3,680
Source: MOF, IMF Article IV, March 1993, staff estimates.Estimated Outturn.
1.66 In 1992, recurrent expenditures rose by over 40 percent in nominal terms-- comparedwith an estimated inflation rate of 9 percent. In addition to the creation of new posts imdwage adjustments, personnel costs are being substantially increased by provisions made tointroduce a fully-funded pension scheme in FY19930. Expenditures in goods and senticesare expected to remain unchanged in real terms after substantial real increases over the last
I4 This will replace the pay-as-you-go system. The Government will set a E100 million fiundstarting with a deposit of E50 million in FY1992 the remainder in FY1992. In additicin it willraise a contributory charge of 20 percent on basic salary.
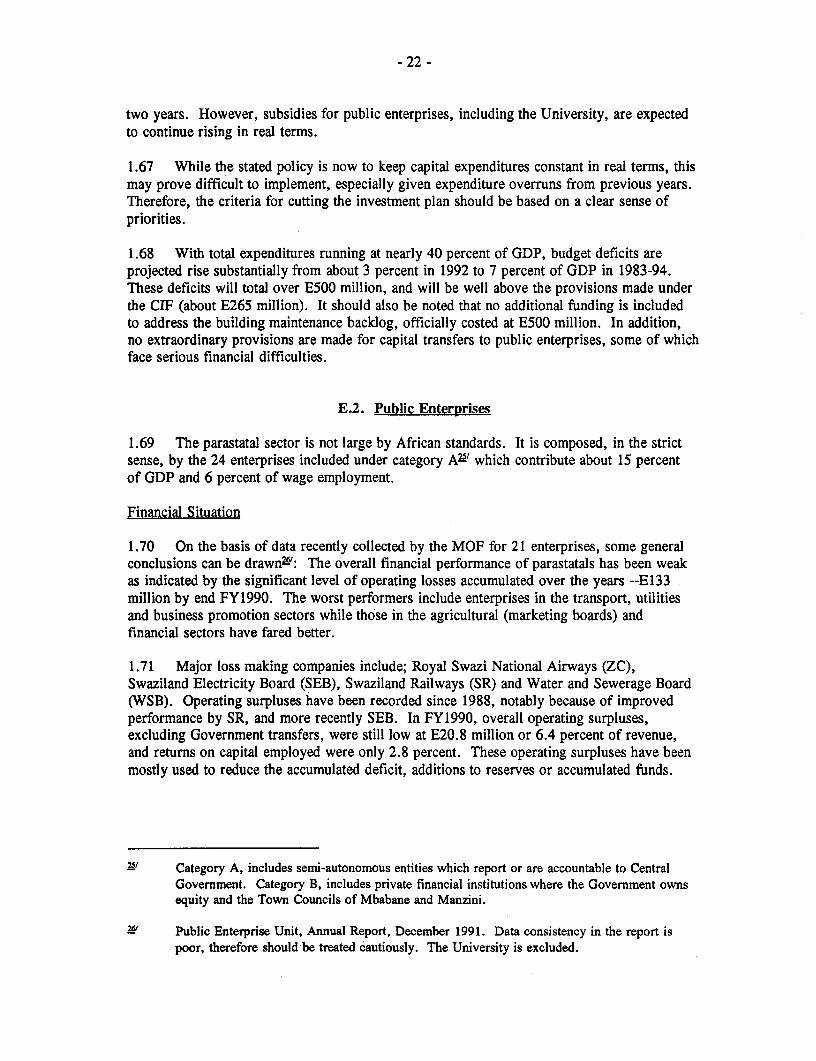
- 22 -
two years. However, subsidies for public enterprises, including the University, are expectedto continue rising in real terms.
1.67 While the stated policy is now to keep capital expenditures constant in real terms, thismay prove difficult to implement, especially given expenditure overruns from previous years.Therefore, the criteria for cutting the investment plan should be based on a clear sense ofpriorities.
1.68 With total expenditures running at nearly 40 percent of GDP, budget deficits areprojected rise substantially from about 3 percent in 1992 to 7 percent of GDP in 1983-94.These deficits will total over E500 million, and will be well above the provisions made underthe CIF (about E265 million). It should also be noted that no additional funding is includedto address the building maintenance backlog, officially costed at E500 million. In addition,no extraordinary provisions are made for capital transfers to public enterprises, some of whichface serious financial difficulties.
E.2. Public Enterprises
1.69 The parastatal sector is not large by African standards. It is composed, in the strictsense, by the 24 enterprises included under category A2' which contribute about 15 percentof GDP and 6 percent of wage employment.
Financial Situation
1.70 On the basis of data recently collected by the MOF for 21 enterprises, some generalconclusions can be drawnW': The overall financial performance of parastatals has been weakas indicated by the significant level of operating losses accumulated over the years --E133million by end FY1990. The worst performers include enterprises in the transport, utilitiesand business promotion sectors while those in the agricultural (marketing boards) andfinancial sectors have fared better.
1.71 Major loss making companies include; Royal Swazi National Airways (ZC),Swaziland Electricity Board (SEB), Swaziland Railways (SR) and Water and Sewerage Board(WSB). Operating surpluses have been recorded since 1988, notably because of improvedperformance by SR, and more recently SEB. In FY1990, overall operating surpluses,excluding Government transfers, were still low at E20.8 million or 6.4 percent of revenue,and returns on capital employed were only 2.8 percent. These operating surpluses have beenmostly used to reduce the accumulated deficit, additions to reserves or accumulated funds.
Category A, includes semi-autonomous entities which report or are accountable to CentralGovernment. Category B, includes private financial institutions where the Government ownsequity and the Town Councils of Mbabane and Manzini.
Public Enterprise Unit, Annual Report, December 1991. Data consistency in the report ispoor, therefore should be treated cautiously. The University is excluded.
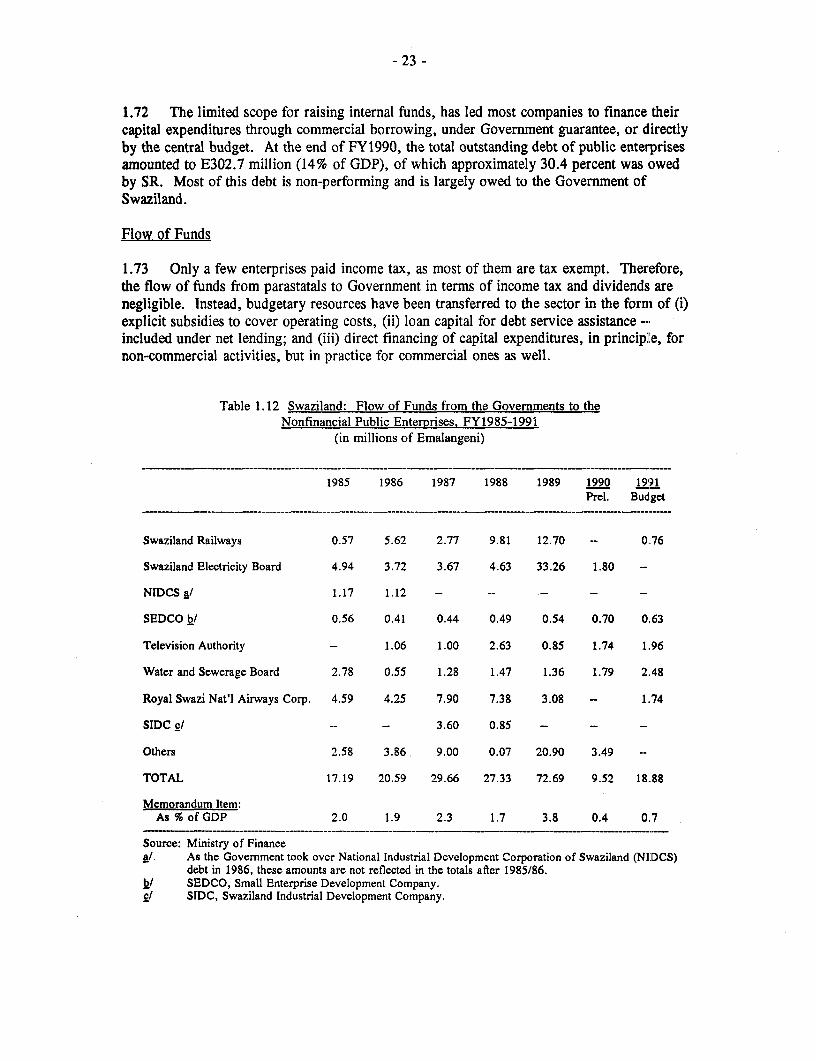
- 23 -
1.72 The limited scope for raising internal funds, has led most companies to finance theircapital expenditures through commercial borrowing, under Government guarantee, or clirectlyby the central budget. At the end of FY1990, the total outstanding debt of public enterprisesamounted to E302.7 million (14% of GDP), of which approximately 30.4 percent was owedby SR. Most of this debt is non-performing and is largely owed to the Government ofSwaziland.
Flow of Funds
1.73 Only a few enterprises paid income tax, as most of them are tax exempt. Therefore,the flow of funds from parastatals to Government in terms of income tax and dividends arenegligible. Instead, budgetary resources have been transferred to the sector in the form of (i)explicit subsidies to cover operating costs, (ii) loan capital for debt service assistance -included under net lending; and (iii) direct financing of capital expenditures, in principle, fornon-commercial activities, but in practice for commercial ones as well.
Table 1.12 Swaziland: Flow of Funds from the Governments to theNonfinancial Public Enterprises. FY1985-1991
(in millions of Emalangeni)
1985 1986 1987 1988 1989 1990 1991Prel. Budget
Swaziland Railways 0.57 5.62 2.77 9.81 12.70 - 0.76
Swaziland Electricity Board 4.94 3.72 3.67 4.63 33.26 1.80 -
NIDCS a/ 1.17 1.12 - -- - - -
SEDCO b/ 0,56 0.41 0.44 0.49 0.54 0.70 0.63
Television Authority - 1.06 1.00 2.63 0.85 1.74 1.96
Water and Sewerage Board 2.78 0.55 1.28 1.47 1.36 1.79 2.48
Royal Swazi Nat'l Airways Corp. 4.59 4.25 7.90 7.38 3.08 - 1.74
SIDC_/ - - 3.60 0.85 - - -
Others 2.58 3.86 9.00 0.07 20.90 3.49 --
TOTAL 17.19 20.59 29.66 27.33 72.69 9.52 18.88
Memorandum Item:As % of GDP 2.0 1.9 2.3 1.7 3.8 0.4 0.7
Source: Ministry of Financea/ As the Government took over National Industrial Development Corporation of Swaziland (NI]DCS)
debt in 1986, these amounts are not reflected in the totals after 1985/86._I SEDCO, Small Enterprise Development Company.CI SIDC, Swaziland Industrial Development Company.
- 24 -
1.74 The gross flow of budgetary resources to the parastatal sectorD2 1, excluding directbudgetary financing of capital expenditures, increased from 2 percent of GDP in FY1985 to 4percent in FY1989, reflecting debt service assistance to SR and the SEB. Debt servicedifficulties were caused by the substantial depreciation of the Lilangeni in 1985, whichincreased foreign currency denominated debt. In FY1990, budgetary flows declined to 0.5percent of GDP because no subsidies were granted to SR and ZC.
1.75 There is no systematic information on how much of the capital expenditures have beenfinanced directly by the budget. It has been found, however, that the development budget hasin the past financed investments of SR, ZC, SEB and the Piggs Peak Hotel.
Capital Expenditures
1.76 Inevitably, the weak financial situation of parastatals has constrained their ability toundertake critical investments and provide adequate standards of services. According to arecent survey by the Swaziland Chamber of Commerce and Industry and interviews withprivate sector firms, this problem was particularly serious in the areas of electricity,telecommunications and water and sewerage. Frequent power outages, faulty communicationnetworks and insufficient water infrastructure were identified as factors increasing the costs ofeconomic activities and inhibiting further expansion.
Table 1.13 Swaziland: Public Enterprises - Capital Expenditures a/(in millions of Emalangeni)
1982 1983 1984 1985 1986 1987 1988 1989
Swazi Railways 2.1 9.2 37.0 18.6 10.9 2.0 1.4 1.4Swaziland Electricity Board 20.6 26.5 10.1 14.1 1.6 2.6 14.5 8.8Post & Telecommunications 9.3 4.1 2.7 5.9 2.6 10.4 11.8 13.0Water & Sewage 0.5 0.8 1.6 3.8 4.6 2.2 3.5 3.4
Total 32.5 40.6 51.4 42.4 19.7 17.2 31.2 26.5
Source: Financial Statements, in fiscal years, beginning in April.a/ Includes capital expenditures in the central budget.
1.77 As indicated earlier, parastatal investment decreased significantly in real terms duringthe 1985-90 period. This finding is confirmed by the financial statements of five mainparastatals2' -- representing over 95 percent of sample for parastatal investment in nationalaccounts. The data, however, include investment financed by the budget and cannot bebroken down.
1.78 Major investment projects were undertaken in the mid-1980s by SR, for the Northernlink trail in 1984-86, and by SEB, for the Luphohlo hydro plant completed in 1985; largelyfinanced by external loans. After two years of negligible investments, SEB began to expandits capital program since 1988 and started the construction of a third power link from SouthAfrica to reduce overloading of the other two links only in 1990. This project, although
27/ Including the University.
These include transport firms (ZN, SR) and utilities (SEB, PTC, WSB).
- 25 -
considered essential for system reliability, had been postponed for some years because ofSEB's financial difficulties to service its debt.
1.79 PTC's net income has been positive, but has decreased over recent years due toinsufficient tariff adjustments; and the company has generally pursued a conservativeinvestment policy. The situation at the WSB, which in practice operates as a Governmentdepartment, was the most critical both financially and because very little investments wereundertaken throughout the period, including those financed by the central budget.
1.80 The investment plans of the main parastatals, including the public utilities plus SRand ZC, are currently estimated a over E400 million over the next 3-4 years. Some of theseinvestments such as the rehabilitation of a rail track (E70 million) and the acquisition oiF a newplane (E150 million) are of doubtful economic benefit and must be carefully considered.
F. Conclusions and Recommendations
1.81 In assessing the adequacy of fiscal policy, policy makers need to consider two criticalfactors: sustainability and efficiency of a given expenditure program. In many africancountries, macroeconomic constraints have forced Governments to contain expenditures andtherefore to establish priorities, so as to ensure efficiency in the use of scarce resources. Inthe case of Swaziland, the revenue buoyancy experienced in the late 1980s paved the way forfaster spending but sustainability and quality issues appear to have been by and largeoverlooked.
Sustainability of Expenditures
1.82 The size of Government expenditures relative to GDP, about 30 percent of GD:P in1990, is comparable with other countries in the region including those in the SACU areawhich have also a large private sector2'. However, the scope for increasing or evenmaintaining public spending relative to GDP is constrained by at least two factors: (i) limitedprospects to raise revenues in the medium to long term, (ii) the feasibility of areduction/elimination of extraordinary receipts under SACU, representing roughly 5 percentof GDP in 1991.
1.83 The reemergence of budget deficits, given current expenditure trends and only modestrevenue increases resulting from slackening economic activity, clearly questions the mediumterm sustainability of expenditures. The issue of sustainability is further underscored byuncertainty over the future of SACU. In the medium to long term, SACU receipts may beadversely affected by changes in the sharing agreement particularly concerning thestabilization factor, which affects about 20 percent of receipts (5 percent of GDP). It isconceivable that this factor could be significantly reduced in the context of lower tariffs inSouth Africa and prospects of broadening of its trade agreements with other countries in theregion.
Revenue Measures
1.84 On the revenue side, concerted efforts need to be made to reducing Swaziland'svulnerability to external shocks. In this regard, consideration should be given to thefollowing aspects:
29/ Compared for example with Lesotho (31 percent) and Botswana (39 percent).
- 26 -
(a) Swaziland's ability to generate fiscal revenues in the long term, will dependultimately on its capacity to attain sustained economic growth. From thispoint of view, the preparation of a long term development strategy, will helpto identify future sources of growth as well as appropriate incentivemechanisms. The tax structure itself, is an important element of the incentivemechanism and should be considered in that light.
(b) In view of the introduction in 1991 of a Value Added Tax (VAT) in SouthAfrica, Swaziland might need to establish a VAT system in order to avoidwide discrepancies in relative prices compared with South Africa. In thisregard, the Government would need to consider the fiscal implications ofadopting a VAT and plan its introduction carefully, allowing time for publicinformation and staff training.
(c) In addition, greater emphasis should be given to expanding the revenue basethrough cost-recovery mechanism at all levels of Government services byraising/introducing charges and user fees. This will contribute to enhanceefficiency in resource use and expand the revenue base.
1.85 The sterilization of past budgetary surpluses through the Capital Investment Fund(CIF), represents a positive measure to cushion the impact of economic fluctuations, but is notenough to address longer term issues. Therefore, it is essential that a cautious fiscal policy bepursued by Government, emphasizing sustainability issues and making provisions to face adownward adjustment in SACU receipts.
Expenditure Measures
1.86 In order to control the level of expenditures, priority must be given to limiting theexpansion of the wage bill, through a more prudent employment and pay policy. In addition,the Government must address more carefully not only the recurrent implications of itsinvestment program, but also review the long term impact of its housing policy for civilservants, whereby the recurrent budget is driving the capital budget.
(a) Employment Policy. A tight rein must be kept on the size of the civil service,which is large by African standards. Recommended measures include:
(i) reducing the pace of teacher recruitment. This would implyan increase of pupil/teacher ratios which at present seemslower than other countries and than the recommended norm;
(ii) allowing posts at grades 6 and below to decline with naturalattrition, until a staffing reduction of one third has beenachieved;
(iii) laying-off staff at the CTA; and reducing casual/daily paidworkers.
(b) Wage Policy. Pay awards must be limited according to pay movements toprivate sector, while efforts should be made to narrow the salary gap with theprivate sector for highly skilled civil servants.
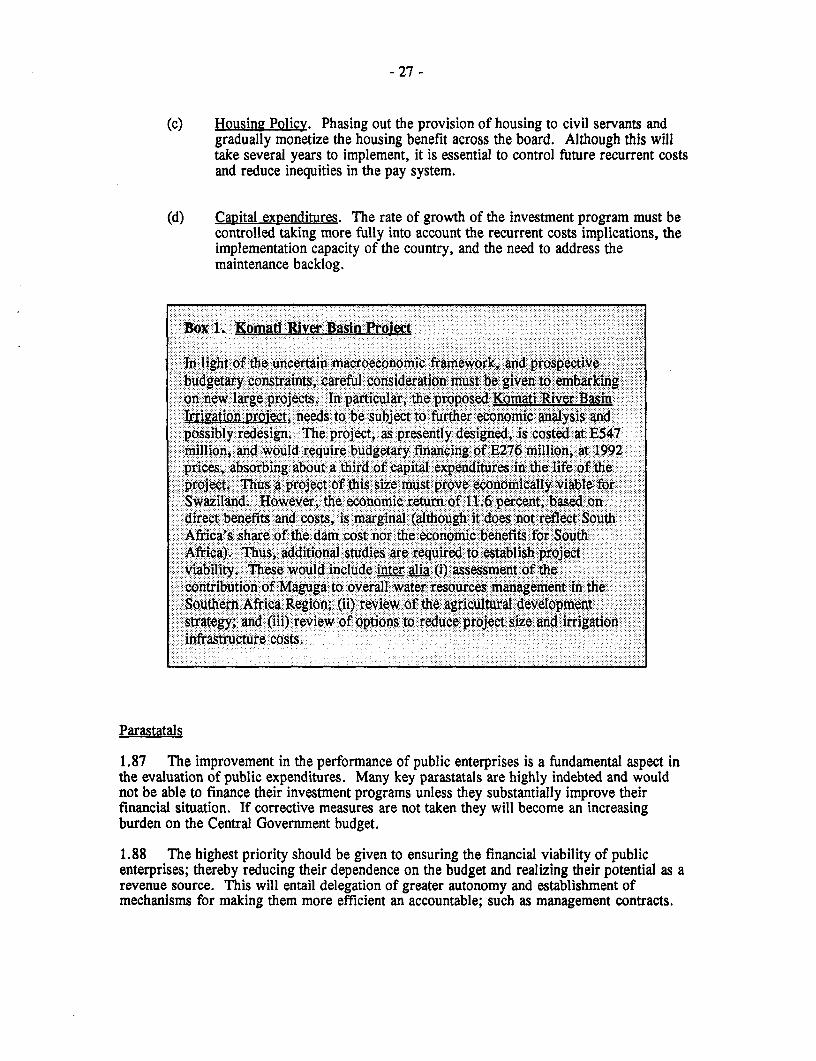
- 27 -
(c) Housing Policy. Phasing out the provision of housing to civil servants andgradually monetize the housing benefit across the board. Although this willtake several years to implement, it is essential to control future recurrent costsand reduce inequities in the pay system.
(d) Capital expenditures. The rate of growth of the investment program must becontrolled taking more fully into account the recurrent costs implications, theimplementation capacity of the country, and the need to address themaintenance backlog.
.- :, ,:.: :, - . : ........ ~~~~~~~..... . .... . : ..... . . .. ;.: -.:..i-::::.:.Box1. homatu ier Bain Proa e
Tin light of -the uncerin- macroeconomic frmewo.rk, an dprosp ect.vbud.ge,,ta nstrai ,..c areful consiation :must :e giventoem rin--on--new 'large.projcts. -In pOartcu, the ppose: Komat River Basi' ' ''aigXion-proJeit,.needs to be esubject to. fuer economic analys s andpossibly ried ign, The project, as presently designed,,is costoed:at E547.m,illion, and would require budgetary financing: of E276 million, at 1992prices,. absorbing abouta third ofc,apital exp'enditure in-t lif .f epiroject. Thus s'.:a.pr-oject of jthis:size..mustprov
.'.'.'-.""Sw.,'z'ilan,'"d,. Ho'w.ever, the economic-,ret'u,rn','of .l.ii6.:percent, ba o' i''n""":direct benefits. and costs, is marginal (although, it does not.refle,ct South::Africa's. share of the dam cost nor the,economic ben r South:.- -Afica T. Thuse additional studies atrerequire to ,estblih projet..'.'viabfl,ity-.The'se.wo.u.l,d.include intefreua sessm ent thecontributionof Mag ga to. overal water resourcs hmaagem nthe.i.Southern Africa Region;::(ii) reiew of t aru development
"'stategy; and (iii),review of optios sto reduce pr.ojec s and irrigaton'infrastructure costs.
Parastatals
1.87 The improvement in the performance of public enterprises is a fundamental aspect inthe evaluation of public expenditures. Many key parastatals are highly indebted and wouldnot be able to finance their investment programs unless they substantially improve theirfinancial situation. If corrective measures are not taken they will become an increasingburden on the Central Government budget.
1.88 The highest priority should be given to ensuring the financial viability of publicenterprises; thereby reducing their dependence on the budget and realizing their potential as arevenue source. This will entail delegation of greater autonomy and establishment ofmechanisms for making them more efficient an accountable; such as management contracts.
- 28 -
Composition of Expenditures
1.89 The measures proposed above would imply, in some cases, a re-allocation ofexpenditures which should improve efficiency. Additional measures to enhance the efficiencyof expenditures include:
(a) Increasing budgetary allocations for operations and maintenance, e.g.,teaching materials for primary education and maintenance of roads andbuildings. Part of this shift could be financed through the reduction of certainsubsidies and the introduction of cost recovery mechanisms, e.g., for tertiaryeducation.
(b) Prioritizing rehabilitation over new capital projects, as they usually carryhigher rates of return and low future recurrent costs. This would implyreducing allocations for "unproductive" investment, e.g., houses andgovernment buildings.
(c) It is recommended that CTA be abolished and its functions privatized.Important efficiency gains and net-savings should be derived from thismeasure as staff and resources at CTA are believed to have been grosslyunderutilized and wasted.
(d) The Recruitment and Retention Allowance (RRA) must be increased in realterms and extended to other key professional layers, such as accountants.

- 29 -
II. PUBLIC SECTOR MANAGEMENT
Introduction
2.1 On the basis of the budgetary trends described in Chapter I, a number of concernshave been raised regarding the composition of public expenditures, e.g., uneven and poorlytargeted public investment, insufficient allocation for non-wage recurrent expenditures; andpoor parastatal performance. In addition, in view of perceived bottlenecks in the constructionof infrastructure, the Government has been concerned for many years about theimplementation ratio of the development budget. More recently, sustainability issues haveemerged in connection with the rapid expansion of the public investment program andpersonnel costs.
2.2 To the extent that these problems are the result of the public sector managementsystem in place, any recommendations to improve the allocation of public resources mustnecessarily address underlying public sector management issues.
2.3 This chapter evaluates the operation of key elements of public sector management inSwaziland, namely the scope and effectiveness of the national plan, the planning andbudgetary process used to determine recurrent and capital expenditures, as well as theintegration of the parastatal sector in the planning system. Implementation and institutionalissues are also discussed as they have a baring in the final outcome. In order to set the scenefor the discussion, the "core" institutions involved in public sector management are identifiedas well as their functions and inputs in the process.
A. Institutional Setting
2.4 The institutional organization of the Government of Swaziland follows closely thesystem of anglophone Sub-saharan Africa. The "core ministries" include (i) the Ministry ofFinance (MOF), responsible for preparing the budget and presenting the budget speech beforeparliament; (ii) the Ministry of Economic Planning and Development (MEPD), recentlyupgraded from a department level at the Prime Minister's office, in charge of setting theguidelines for the preparation and submission of investment projects by the line ministries. Itprepares the medium term plan and the public investment program; (iii) the Ministry of Laborand Public Service (MOLPS) oversees employment, training and wage policy. It isresponsible for keeping the establishment register of civil servants.
2.5 The Ministry of Works (MOW) may be considered here a "core institution" given itsoverall responsibility in executing investment projects for other ministries and consequently itsrole in the implementation of the capital budget. Line ministries have finance and planingunits responsible for project submission and monitoring.
2.6 Public enterprises, in this discussion refer only to those classified under Category A,which have a semi-autonomous legal and management status; and excludes enterprises inwhich Government has a minority equity participation. Public enterprises report to aparticular line ministry and to the Public Enterprise Unit (PEU). The PEU was created in
- 30 -
1989, at the MOF, but became fully operational only in 1991. Annual financial statementsare produced by public enterprises but no other regular documentation is produced to beintegrated in the central planning system.
B. The Development Planning System
National Development Plan
2.7 In Swaziland, the system of five-year development plans was discontinued in 1984.Consequently, the most recent expression of national objectives is contained in the last plan,the Fourth National Plan FY1983-87. The main objectives stated in the plan include: (i)greater efficiency and control of public funds; (ii) stimulation of private investment; and (iii)job creation through vocational training and establishment of employment opportunities in therural areas.
2.8 In 1986, the Government decided to introduce an improved planning system thatwould comprise (i) a long term strategy statement; and (ii) a three-year rolling developmentplan, both with regular mid-term reviews. Because of staff constraints and the perceivedpriorities at the time, priority has been given to the introduction of a three-year rollingdevelopment plan system, and the strategy statement has not yet been prepared.
2.9 The Government has made excellent progress in implementing a system of three-yearrolling development plans, the first of which was prepared in 1989. The plan incorporates aneconomic review and outlook, a three-year financial framework and sectoral investmentprograms. The core of the plan, however, is the public investment program.
2.10 The key achievement of the system has been to establish a link, with the help of theCapital Budgeting, Planning and Monitoring System (CBPMS, see below), between the annualcapital budget and the first year of the three-year development plan.
2.11 The lack of an updated long term strategic framework for so many years hascontributed to inefficiencies in public sector resource allocation outlined earlier. The overallnational objectives stated in the fourth development plan, while valid in their own right aretoo broad to be effectively used as management tools. In addition, although sectoral strategiesare in place, they are generally dated and are not an integral part of the planning andbudgeting process.
2.12 The Government recognizes this as a significant shortcoming in the planning system,and has expressed its commitment to prepare a national development strategy, as a matter ofurgency. The highest priority should be given to the preparation of this strategy, therebyreviewing and updating sectoral and subsectoral strategy documents.
2.13 The role of a national plan as a management tool is, essentially, to provide a longerterm view of overall and sectoral development objectives, policies and programs, withinwhich future revenue sources and public expenditures priorities can be identified. Theimportance of a national plan, however, lies very much in the process of preparation itself andregular updating of the policies and programs on which it is based, through medium termreviews.

- 31 -
2.14 The preparation of the strategy should be used to raise national consciousness in aconstructive debate about Swaziland's future prospects, identifying sustainable sources ofeconomic growth and development constraints and, ideally arriving to a broad consensus onobjectives and how to achieve them. In this sense, the process should not be confined to atechnical economic evaluation of alternatives, although that will be an essential input in thedebate, but should involve as many as possible social and political elements in the Swazisociety, under a strong Government leadership.
2.15 It is important that the strategy be placed within the regional context, so that theimpact of regional developments could be factored in the long term scenario, particularlyconcerning the future of South Africa.
B.1 Capital Budgeting Process
2.16 The attention of Government for many years has been focused on improving theplanning, budgeting and implementation system on the capital side. This stance is reflected inthe importance given to the introduction of the three-year development plan and the CBPMSin 1989, subsequently followed by the Harvard Report in 1990, which dealt extensively withimplementation issues.
Capital Budgeting
2.17 The capital budgeting process is based on the CBPMS, a computer-based system forproject documentation and monitoring. It is used for the formulation of an annual roll-over ofthe three-year investment program, and to compile related capital budgets and supplementarybudgets.
2.18 The CBPMS is a powerful budgeting tool. It requires line agencies to present projectproposals in a standard format, according to the stages of project preparation. However, asnoted by some officials, the information required, while extensive, is not sufficient forprojects that are about to start, and is not set out in the format that some aid agencies requirefor project approval. On the other hand, it is too detailed for projects that are at the earlyplanning stage.
2.19 More importantly, the effectiveness of the CBPMS is inhibited by the absence of astrategic framework within which to consider the proposals and the quality of the projectproposals is frequently poor. In addition, the uncertainty of the macroeconomic outlook andthe shortage of skilled manpower are rising concerns about the ability of the Government tomeet the recurrent costs and manpower needs generated from the rapidly increasing capitalprogram.
2.20 The poor quality of projects may be partly accounted for by the number of projectswhich is large for a development budget of the size of Swaziland's. Too many small projectsplace an excessive burden on the limited number of qualified staff available to undertakeproject preparation, appraisal and monitoring. In turn, planning units may face incentives tosubmit a large number of projects.
- 32 -
2.21 While the CBPMS makes provisions to include recurrent costs implications in theanalysis of projects, these were available for only 40 out of the 230 projects in 1991.Furthermore, there seems to be no mechanism to relate these costs to the recurrent budget andto reflect them in deciding whether to proceed with a project.
2.22 Failure to provide adequately for the maintenance of assets in the recurrent budget,has resulted in a large backlog of maintenance. Just in the case government buildings thisbacklog has been estimated by Government at E500 million, in 1991 prices, or more thantwice the capital budget for that year. Some of this is being dealt with (at much greater costthan if maintenance had been carried out in the first place) through the capital budget (under'rehabilitation' or 'renovation' projects), but that is not getting to the heart of the problem.
Parastatals
2.23 Public enterprises are supposed to operate on a self-financing basis, and finance theircapital expenditures outside the budget. However, many of them face serious financialdifficulties as indicated by the substantial losses and high level of indebtedness accumulatedover the past years. As a result, they have been unable to undertake necessary investments,particularly the public utilities, and consequently the standard of services has been extremelypoor with high costs for the private sector.
2.24 Because of their weak financial situation, the Government has been forced to makeinjections in the form of subsidies, debt assistance and direct financing of capital projects.This has been done on an ad-hoc basis, sometimes under unclear terms. In addition, thebudgeting for the capital programs of the parastatal sector is poorly integrated into thedevelopment planning and budgetary system.
2.25 The poor performance of public enterprises, largely reflects management weaknessesbut also the lack of autonomy to set prices, salaries and manpower needs. In addition, mostparastatals lack a medium term framework to assess their capital expenditures programs, andtherefore do not have an strategic view to guide their decision making.
2.26 With the appointment of a new director, the PEU will seek to deal with, as a matterof priority, the utilities parastatals. A performance contract for the SEB, has been signedunder the PEU supervision and with the assistance of outside consultants. The introduction ofsuch a contract should be combined with greater delegation to the SEB of authority to settariffs and remuneration levels.
2.27 The unit remains inadequately resourced, but the improvements it is seeking willresult both in better planning and budgeting in the parastatals, and significant improvements intheir economic and financial performance, with resulting benefits to the exchequer. As a firststep, the PEU director has been invited to attend meetings of the PBC working group.
- 33 -
Recommendations
2.28 Although substantial progress has been made in establishing an advanced capitalbudgeting system, it would appear that a quantitative approach has predominated, withoutenough consideration of the quality and sustainability of the rapidly expanding investmentprogram. This is illustrated by the significant increase in the number of projects, frequentlyin "unproductive" sectors. In addition, there have been no effective mechanisms to addresspublic sector investment within an overall policy framework, as shown by the poorperformance of parastatals. In light of the above, the following recommendations can bemade for the improvement of the capital budgeting process:
2.29 CBPMS. While the CBPMS represents a step in the right direction to strengthen theproject cycle, it has been reported to be time-consuming and too detailed in some cases'.Thus, it would be desirable that its operation be reviewed so as to ensure more flexibility todeal with projects at different stages of preparation. The forms should be redesigned with thehelp of a specialist to make them more 'user friendly'.
2.30 Projects. A smaller number of well-prepared projects is likely to result in a higherrate of benefit from the development budget program as a whole. Therefore, the number ofprojects should be reduced by transferring small projects to the recurrent budget, and byconsolidating some related projects into single larger projects.
2.31 Emphasis should continue to be placed on the need to improve the quality of projectpreparation (especially in relation to realistic estimation of benefits, costs and timing), ratherthan increasing the number of projects coming forward. Once there is a development strategyin place, sectoral programs and projects should be subject to explicit justification in terms oftheir contribution to the achievement of that strategy.
2.32 Sustainability. Closer attention needs to be given to the recurrent and manpowerimplications of new project proposals, in light of both the past under-provision formaintenance in the recurrent budget, and the uncertainty of the macroeconomic outloolc.
2.33 The structure of the development budget should be reviewed on the basis of emerginginformation about the scale of the maintenance backlog, the elimination of which may preempta large proportion of available resources over a considerable period, and of futurerequirements for adequate maintenance provision in the recurrent budget. The governmentneeds to carefully consider:
(a) The financial impact on its ability to continue to invest in new projects, if it isto address the backlog;
(b) the capacity to implement any new construction projects while the backlog isbeing dealt with and;
(c) the additional resources that should be put into the recurrent budget to keep upwith maintenance needs in the future, and therefore avoid a recurrence of thebacklog.
- 34 -
2.34 Parastatals. Unless their financial and management situation is improved, publicenterprises are potentially a burden to the Central Government, and will continue to provideinadequate standard of services. Therefore, immediate measures must be taken to improvetheir efficiency and accountability. To achieve this objective it is recommended that thepolicy of management contracts be extended to the most important sectors, combined withgreater autonomy to set tariffs, remuneration and employment policies.
2.35 In addition, the planning and budgeting process should embrace the examination ofcorporate plans and the careful scrutiny of investment proposals put forward by parastatals.External financing frameworks should be developed for each body, and they should berequired to satisfy the same criteria for investment as those that apply to the government'sdevelopment projects. Capital transfers should be made only in accordance with the externalfinancing framework, and on terms that are clearly specified.
2.36 The PEU should play a full part in the processes of the Planning and BudgetingCommittee (PBC). Proposals are being discussed in the MEPD for the presentation ofimproved information about the financial relationship between the parastatals and the budget.They include:
the publication of outturn information in the Treasury Annual Report,the inclusion in the estimates of more information about the parastatals,publication of performance indicators in the rolling three-year plan.
B.2 Implementation Issues
2.37 The implementation performance of capital budget has been the subject of extensivediscussions over the past years, and was one of the main focus of the Harvard Report. Thefinancial implementation ratio for the 1985-91 period is shown in Table 1. (Budgeted andactual expenditures are measured at constant 1991 prices, after the deduction of transfers, on-lending and military and celebrations expenditure).
2.38 With the exception of 1989, the implementation ratio fell from 85 percent in 1986-87to 71 percent in subsequent years. Although it did not fall as low as the 66 per cent quoted inthe Harvard Report, it still shows a deterioration-'. It should be noted, however, that theratio has remained basically unchanged despite the fact that the budget more than doubled inreal terms since 1987.
AI The 1985 and 1989 ratios are excluded because the 1985 ratio, distorted by a direct paymentof E22 million (E55 million at FY1991 prices) which was not budgeted, and 1989 ratio reflectsimproved coverage following the introduction of the CPBMS.
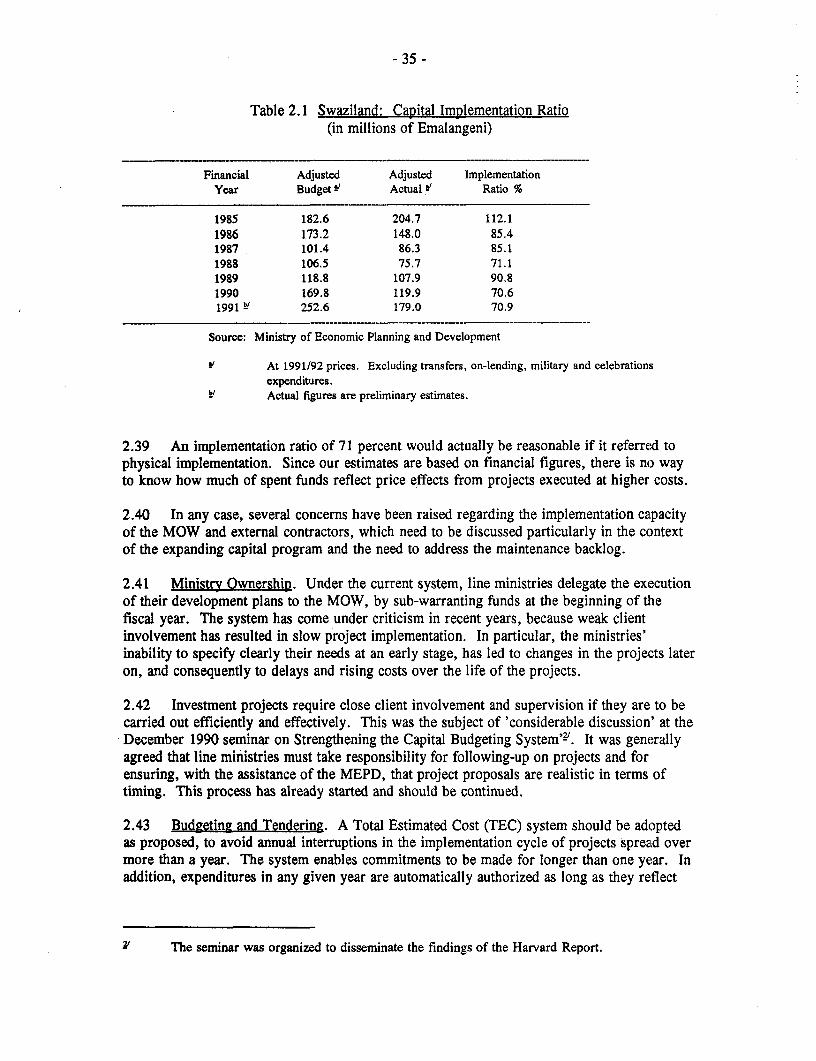
- 35 -
Table 2.1 Swaziland: Capital Implementation Ratio(in millions of Emalangeni)
Financial Adjusted Adjusted ImplementationYear Budget S Actual Y' Ratio %
1985 182.6 204.7 112.11986 173.2 148.0 85.41987 101.4 86.3 85.11988 106.5 75.7 71.11989 118.8 107.9 90.81990 169.8 119.9 70.61991 b 252.6 179.0 70.9
Source: Ministry of Economic Planning and Development
f' At 1991/92 prices. Excluding transfers, on-lending, military and celebrationsexpenditures.Actual figures are preliminary estimates.
2.39 An implementation ratio of 71 percent would actually be reasonable if it referred tophysical implementation. Since our estimates are based on financial figures, there is no wayto know how much of spent funds reflect price effects from projects executed at higher costs.
2.40 In any case, several concerns have been raised regarding the implementation capacityof the MOW and external contractors, which need to be discussed particularly in the contextof the expanding capital program and the need to address the maintenance backlog.
2.41 Ministra Ownership. Under the current system, line ministries delegate the executionof their development plans to the MOW, by sub-warranting funds at the beginning of thefiscal year. The system has come under criticism in recent years, because weak clientinvolvement has resulted in slow project implementation. In particular, the ministries'inability to specify clearly their needs at an early stage, has led to changes in the projects lateron, and consequently to delays and rising costs over the life of the projects.
2.42 Investment projects require close client involvement and supervision if they are to becarried out efficiently and effectively. This was the subject of 'considerable discussion' at theDecember 1990 seminar on Strengthening the Capital Budgeting System'2'. It was generallyagreed that line ministries must take responsibility for following-up on projects and forensuring, with the assistance of the MEPD, that project proposals are realistic in terms oftiming. This process has already started and should be continued.
2.43 Budgeting and Tendering. A Total Estimated Cost (TEC) system should be adoptedas proposed, to avoid annual interruptions in the implementation cycle of projects spread overmore than a year. The system enables commitments to be made for longer than one year. Inaddition, expenditures in any given year are automatically authorized as long as they reflect
21 lThe seminar was organized to disseminate the findings of the Harvard Report.
- 36 -
faster implementation and not cost increases. The implementation of this system requiresclose monitoring of expenditures to ensure aggregate expenditures remain on track.
2.44 Key to smoothing project implementation is the Government procurement system. InSwaziland the system, based on competitive open tendering under the supervision of theCentral Tender Board (CTB), is fundamentally sound. However, complaints have been madethat the tendering process is sometimes unnecessarily cumbersome, and that the frequency ofCTB meetings was not enough to respond to the expanding development program. It nowappears that the CTB meets more regularly and there are fewer complaints. However, fulltendering seems inappropriate in some specific cases. In this regard, the categorization ofcontracts, which is now being implemented, is a step in the right direction. This allows forthe use of 'call-off' contracts with an approved panel of contractors, for certain standardcategories of work up to a maximum size.
2.45 Professional Staff Shortages. The MOW performance has been handicapped byshortages of skilled staff in various professional categories, e., architects, engineers.In addition, staff are poorly managed and lacking appropriate incentives to performefficiently.
2.46 There clearly needs to be an increase in professional staffing levels at the MOW,even assuming that an increased proportion of the work load could be contracted out.Technical assistance should be urgently sought to increase the staffing levels with contractstaff and at the same time the remuneration of Swazi personnel be reviewed to bring it up to alevel that will provide a sufficient incentive to attract them for training, and retain them in thelonger term.
2.47 External Contractors. In an attempt to speed up the implementation of the capitalbudget, an increasing proportion of public works has been contracted out to private firmssince 1989. The construction industry in Swaziland is made up of a few predominantlyexpatriate-controlled large firms and more than 100 small locally-owned contractors. It isreported that currently all capable consultants have heavy workloads, and are unwilling toexpand their capacity for fear that capital budgets, and therefore demand for their services,may fall in the future. In addition, the small firms generally face financial and managementproblems, so banks are extremely conservative in providing lending for working-capital.
2.48 In early 1991, the Government Stores Regulations were amended to require allbuilding contracts up to a value of El million to be awarded to Swazi contractors. Thischange has been made without regard to the ability of Swazi contractors to respond, and it isbelieved that only two Swazi firms are capable of undertaking jobs in this category-'.
2.49 In order to address capacity constraints in the private sector, it is recommended thatperiodic meetings be held both with consultants and contractors, in which the size andcomposition of future public investment program are explained by Government. Theopportunity should be given to the private contractors to raise matters that may beconstraining their effectiveness and which might be alleviated by Government action.
One occasion the ministry had to recommend that the Tender Board accept the 13th lowesttender for a job because the lower tenderers were judged incapable, financially or technically,of doing the work.
- 37 -
2.50 With regard to small firns, the most urgent requirement is to bring about animprovement in management skills. As proposed by the MOW, smaller firms could build upexperience by a system of categorizing jobs and contractors so that firms are restricted totendering for the size of job that is within their scope. This is now being implemented. Atthe same time, the Stores Regulations should be made more flexible, and future changes intendering limits should be revised in line with the capacity of local industry.
2.51 In addition it would be desirable for some of the firms to merge and pool theirmeager managerial and financial resources. A restructuring of the industry into a smallernumber of stronger firms would clearly be in the interests of Swaziland. Thus theGovernment should explore the possibility of channelling technical assistance to support thiseffort.
2.52 Directly Employed Labor. There are five district PWD depots (as they are called forhistorical reasons). With the exception of the Nhlangano depot, they are generally poorlymanaged, and not subject to proper accountability. Productivity is low, funds are 'lost', andmaterials disappear. Their record of project implementation is poor, and they have greatdifficulty in keeping to deadlines or budgets. As a result, construction work undertaken bydirect labor could cost twice as much as by contractors, and are subject to serious delays.
2.53 It is recomrnended that the management of the depots be radically tighten, to irnproveaccountability and efficiency. The performance of one of the depots, which provides anexample of good practice could be read across to the others. This would require firm action,to allow disciplining or dismissal of staff.
2.54 At the same time, the size of the depots must be gradually reduced as more work iscontracted out to private firms. The government should therefore reverse the rejection by theDecember 1990 seminar of the Harvard recommendation to reduce the employment of directlyemployed labor.
B.3 Recurrent Budeetarv Process and Outcome
2.55 In the course of this review, it has become evident that the allocation of recurrentfunds for operating and maintenance costs has been inadequate in some areas, e.g., roads andeducation. This is a common problem in many developing countries, and has been the focusof much of the debate on public expenditures in recent years. In most countries, allocationsfor non-wage recurrent costs have been squeezed in the context of budgetary constraintsbecause they have been found easier to cut than investment projects. As a result,Governments have been faced with tremendous rehabilitation costs and inefficient educationand health system.
2.56 In Swaziland, observed inadequacies cannot be attributed to budgetary constraints butrather to shortcomings in the recurrent budgeting process itself. This partly reflects theemphasis given to the capital side, but also the lack of a longer term framework in which toassess expenditure trends.
2.57 In this section, we evaluate in particular the recurrent budgeting process as it concernsthe determination of maintenance and operating costs. Issues relating to other recurrent
- 38 -
expenditure categories such as personnel costs, which account for a large proportion of therecurrent budget, and subsidies (for tertiary education) are discussed in detail in Chapters IIIand IV, respectively.
Estimation of Maintenance and Operating Costs
2.58 The MOF operates a 'last year's budget allocation plus x per cent', to adjust forinflation, budgeting system to prepare detailed draft estimates for 'other costs'. Thecomputerization of the system has eliminated much form filling, but has produced a purelymechanical calculation of every line item under 'other costs' for every responsibility center.The estimation requested to the responsibility centers is, in practice, a purely bureaucraticprocess and, at times, the computer-produced draft is returned to the MOF by a ministry withno amendments. If an attempt is made to introduce more rationality into the estimationprocess, the system is not designed to respond accordingly4'.
2.59 In its current form, the budgeting system does not make provisions to incorporateincreased recurrent costs arising from new investment programs or to re-allocate betweenexpenditure items on the basis of actual expenditures incurred the previous years.
2.60 With a recurrent budgeting system operating in this mechanical way, it is notsurprising that there has been persistent under-funding of essential maintenance expenditure,to the extent that the backlog of maintenance on government buildings has risen to anestimated E500 million.
2.61 The reasons for the failure by the MOF to improve the responsiveness of the systemare, to some extent, the result of lack of qualified staff (the MOF and line ministries) and ofinadequate budgeting practices.
Off-budget Funding
2.62 A further weakness of the recurrent budgetary process is the practice of some externalfinancing agencies of making direct payments and, in some cases, not even informing thegovernment of the amounts spent5'. The result is that the published estimates present adistorted picture of the resources allocated to various sectors, sub-sectors and activities. For-example, a large proportion (about half) of the Ministry of Health's recurrent expenditure isexternally funded by direct payments that do no go through the budget. The amounts are
In the MOW, for example, the financial controller recalculated the draft estimates based on theprevious year's actual expenditure, which were below budget, reallocating expenditures. Themechanical nature of the process is shown by the fact that the computer printed out the reviseddraft with the original draft estimates, rather than the reallocated estimates made by the MOW.
This problem does not arise in the case of the capital budget, because it includes all externalgrants.
- 39 -
such as significantly to understate the resources going to the priority area of primary healthcare@'.
Recommendations
2.63 It is crucial that the recurrent budgeting process be made more sensitive to changingneeds. The first requirement for such a change is a development strategy, so that recurrentfunding requirements can be addressed in the context of national and sectoral priorities.
2.64 The next step is for the MOF to encourage a more flexible use of the system, movingaway from detailed draft budgets for individual line items and responsibility centers based onlast year's budgets plus an escalation factor. In the longer term, the government shouldintroduce, first on a pilot basis, and then ministry by ministry, a system of programbudgeting, in which budgeting and control of expenditure is by vertical program categoriesrather than horizontal line items.
2.65 To make such improvements, it is necessary for ministries to develop costing systems,including standard costs, so that they can project the recurrent costs of their programs(including adequate provision for maintenance costs) on various assumptions about activitylevels. This is not zero-based costing (which, in its pure form, is far too ambitious), but isthe essential process of adjusting resource allocation at the margin to reflect changes inpriorities and activity levels.
2.66 Within ministries, some attempts are being made to improve the recurrent budgetingprocess, e.g., the MOW. Although the ministry does not have yet a proper system toestimate road maintenance costs, it has reached the verification stage in consideringrecommendations from consultants for a costing system, and is to introduce it department-by-department in the ministry. The intention is then to read it across to other ministries such aseducation and health.
2.67 The UK-funded technical assistance project located in the Treasury could addressthese questions and undertake the preparation of a finance officers' manual, as well asdeveloping the financial and accounting cadre.
2.68 A further issue that needs to be addressed is the introduction of memorandum tradingaccounts and net-cost budgeting into relevant areas of government. Experience in othercountries has shown that such accounting methods, combined with appropriate delegation ofbudget responsibility, lead to significant improvements in efficiency. Apparently, theMinistry of Health has made a proposal for a pilot scheme whereby one of its regions wouldretain part of the fees it collects, but has received no response from the central ministries.Proposals of that kind should be encouraged and taken under serious consideration.
USAID stated that the agency would have no problem in providing both budgetary andexpenditure information on a quarterly basis (which would make it possible to bring intosynchronization figures based on the US fiscal year and the Swaziland financial year), andindeed had discussed such a proposal with the MOF.
- 40 -
2.69 The problem of inadequate maintenance is so serious that it should be made thesubject of a special budget exercise. As soon as sufficient information has been collected onthe annual amounts required to maintain assets to an adequate level, special provision shouldbe made in the recurrent budget to meet the needs of the various ministries.
C. Institutional Issues
Introduction
2.70 A number of the findings and recommendations in the preceding sections have pointedto the need for institutional development and upgrading of staff. In the following paragraphswe consider (i) institutional improvements to raise the standard of planning and budgetpreparation; (ii) the current proposals for the development of the planning cadre,(iii) the work being done on the financial cadre. Improvements needed in the MOW to raiseimplementation capacity have been discussed earlier.
Institutional development
2.71 In the course of this review, several examples of poor management and coordinationin the planning, budgeting and implementation of public expenditure programs were madeevident. The general level of management ability is low. The results include poorcommunication, both within and between ministries, and a lack of rigor in the formalmanagement process, which is inadequately compensated for by the parallel informal process.High priority needs to be given to training and staff development in general management,including financial and staff management.
2.72 An essential element in a successful development strategy is commitment andownership by both the political and official leadership of the country. That requires a highdegree of openness in the strategic and planning process, so that ministers and members ofparliament do not see it as a purely technical exercise, to be left to officials, but one in whichthey are fully involved21. By the time the budget proposals reach the Cabinet at thebeginning of January it is too late for them to take part in a substantive debate.
2.73 It is recommended that a ministerial seminar be held to discuss the emergingbudgetary options following the preparation of the budget outlook paper in August, ratherthan simply presenting the paper to the Cabinet for its approval: there needs to be a dialoguebetween ministers and officials if the former are to feel genuine commitment to what isproposed. Once that commitment has been obtained, there should be a similar seminar for
2' For a discussion of this point, see Nimrod Raphaeli, Jacques Roumani and A C MacKellar,Public Sector Management in Botswana: Lessons in Pragmatism, World Bank Staff WorkingPaper No. 709, page 20, where reference is made to the Economnic Committee of Cabinet,which is composed of the entire Cabinet, all Permanent Secretaries, the Governor of the Bankof Botswana, the Commander of the Defence Force and the Commissioner of Police, andmeets from time to time to review major economic policy issues and choices. The nationaldevelopment plans proceed through a series of such meetings. There is also a caucus ofmembers of Parliament from all parties at which senior officials and professionals discuss keyissues, whether or not there is an immediate requirement for parliamentary action.
- 41 -
backbenchers. Both ministers and backbenchers should, of course, play a full part in theprocess to build consensus on the country's development strategy.
2.74 At ministry level, there are cases where the preparation of recurrent and developmentbudget proposals are informed by committee discussion of the options, but in others such amechanism is either weak or lacking. Those responsible for the drafting of ministerialproposals for the two budgets should meet under the chairmanship of the Principal Secretaryto discuss the substance of the two budgets, their interrelationship, and their contribution tothe achievement of ministerial strategy and objectives. The minister should also be involvedonce proposals have emerged.
2.75 The PBC, with its working group, is clearly the key mechanism by which expenditureproposals are scrutinised and coordinated, but it is not working as well as it should inpractice. Officials should regard attendance at meetings as being of the highest priority. Allmeetings should have an agenda (circulated with copies of the proposals to be considered) andminutes should be circulated immediately after the meeting with points for action, responsibleindividuals and deadlines clearly identified. It is not evident that the MOF is adequatelyexercising its responsibility to provide an effective secretariat to the PBC and the workinggroup. The Public Enterprise Unit needs to be represented on the PBC working group, sothat budgeting for the parastatal sector can be integrated into the central budgetary process.
The Planning Cadre
2.76 The planning cadre has two main wings, the Economic Planning Office (EPO) uin theMEPD, and the Ministerial Planning Units (MPUs). Much preparatory work has alreadybeen done in the development of the cadre. This include a review of the cadre, an outline ofscheme of service, job descriptions and organizational proposals for the cadre. The proposalshave been widely discussed. The preparation and introduction of an operations andprocedures manual for the cadre is the major task in the terms of reference of the planningadviser attached to the EPO under the ADB-funded institutional support project, and a draftoutline of the manual has already been circulated. Preparation of the manual will be spreadout over about a year to allow for adequate discussion, in which workshops will play animportant part.
2.77 The proposals for the reorganization, development and staffing of the cadre - thedetails are a matter to be worked out internally - should be endorsed in principle andimplemented as soon as possible. That would greatly alleviate the weaknesses found both atthe center and in the ministries.
The Finance and Accounting Cadre
2.78 A parallel exercise is being carried out under UK technical assistance in the financialand accounting cadre. A scheme of service is being prepared, and a human-resourcesdevelopment and training plan. The technical assistance team working on the project (whichis drawn from people who have previously worked in the finance function in line ministries)will also work on the development of improved financial systems both in the center and in theministries.
- 42 -
2.79 This exercise, too, deserves strong endorsement. It would be however preferable if itwas located in the central MOF, rather than Treasury, where particular weaknesses have beenidentified for example in budget preparation, liaison with other ministries and support to thePBC. The tasks of the team should include the preparation of a finance officers' manualanalogous to the planning officers' manual being prepared by the MEPD.
2.80 It is also recommended that the planning and financial teams work closely together toensure consistency in their proposals, for example in the respective schemes of service.
D. External Financing Issues
2.81 The Swaziland government is not heavily dependent on external aid, but aid plays acrucial role in certain areas, notably in the form of technical assistance and in providinginputs to the primary health care sub-sector. The lack of a national development strategymeans that the government has no clear set of criteria on which to base its approach toexternal financing agencies (EFAs). This, combined with institutional weaknesses in aid co-ordination, means that the shape of the external financing program is ultimately driven by theEFAs, whose priorities may not coincide with those of the government.
2.82 For example, USAID has its own five-year strategy, the current edition of which runsfrom 1990 to 1995. So far, USAID has taken the initiative in designing programs forSwaziland, but problems of ownership and implementation arise from the non-participation ofgovernment officials in project design, e.g., for the creation of counterpart posts.
2.83 To be effective, the aid program needs to be the product of a dialogue between theagencies and the recipient government, in which the latter takes the lead in coordinating theprogram. Therefore, it is recommended that the Government adopt a strategic approach, andendorse the proposals for the establishment of an External Assistance Unit (EAU) at theMEPD.
2.84 The EAU is expected to take a leading role in addressing aid coordination issues,including technical assistance. In this sense, it would be responsible for convening and settingthe agenda for aid co-ordination meetings with EFAs, and generally acting as the channel forcommunicating the development strategy.

-43-
III. PUBLIC PAY AND EMPLOYMENT ISSUES
Introduction
3.1 Policies regarding public sector pay and employment are always a very importantcomponent in the policy framework of any government, and in this respect Swaziland iscertainly no exception. During FY1990, government expenditure on wages and salaries isestimated at E244.6 million, about 11 percent of GDP, and 41.2 percent of total governmentexpenditure. Control of the government's wage bill is therefore a vital element inSwaziland's fiscal policy. Public sector wage and employment policies have, however,another very important dimension in that they heavily influence the level of efficiency cf thepublic sector itself. Inadequate pay levels for example, usually impair the performance ofindividual public sector employees, while an inappropriate skill structure will reduce bothadministrative capacity and efficiency in delivering publicly-provided services.
3.2 This Chapter evaluates both the size and composition of the public sector inSwaziland, and its pay structure. The term "public sector" is here taken to include the civilservice, local government, the armed forces and the parastatals. The remuneration of politicalposts is not analyzed here, although this is included in budgetary estimates of expenditure ongovernment wages and salaries. The main focus of the analysis is upon the civil service, asthis accounts for the great majority of public sector employees, and is subject to direct policycontrol in terms of both pay rate and employment levels. Controls on the parastatals differbetween institutions, consequently, the analysis is restricted to those parastatals still subject toa significant degree of Government control over their wage and employment levels.
3.3 The Government's wage and salary expenditure seems relatively high by internaLtionalstandards. As shown in Chapter I, expenditure on wages and salaries over recent years hasaveraged around one half of recurrent expenditures and about twice the level of expenditureson other goods and services. Both of these ratios are high on the basis of internationalcomparisons with both other sub-Saharan African countries and developing countries ingeneral. Similarly, wages and salaries have accounted for 36.5 percent and 9.7 percent oftotal central government expenditure and GDP, respectively, over the second half of the1980s. This compares with an average for sub-Saharan Africa as a whole of 26.9 percent''.Throughout the whole of sub-Saharan Africa, only Benin, Burkina Faso, the Central AfricanRepublic and Liberia can lay claim to a larger proportion.
3.4 These observations must be tempered, however, by three considerations. First,Swaziland's economy is closely intertwined to that of its much larger neighbor, South Africa,whose per-capita income is about three times higher. Inevitably, given wage-earningopportunities in South Africa, the labor market for skilled and, in particular, for professionaland managerial workers in Swaziland is influenced by developments over the border.Consequently, average wages in the private sector for skilled workers at least, tend to bemuch higher than one would expect in a country with Swaziland's per-capita income.Second, as shown later in this Chapter, wages in the public sector in Swaziland do not lag as
V' African Economic Indicators. The Word Bank and UNDP (1992).
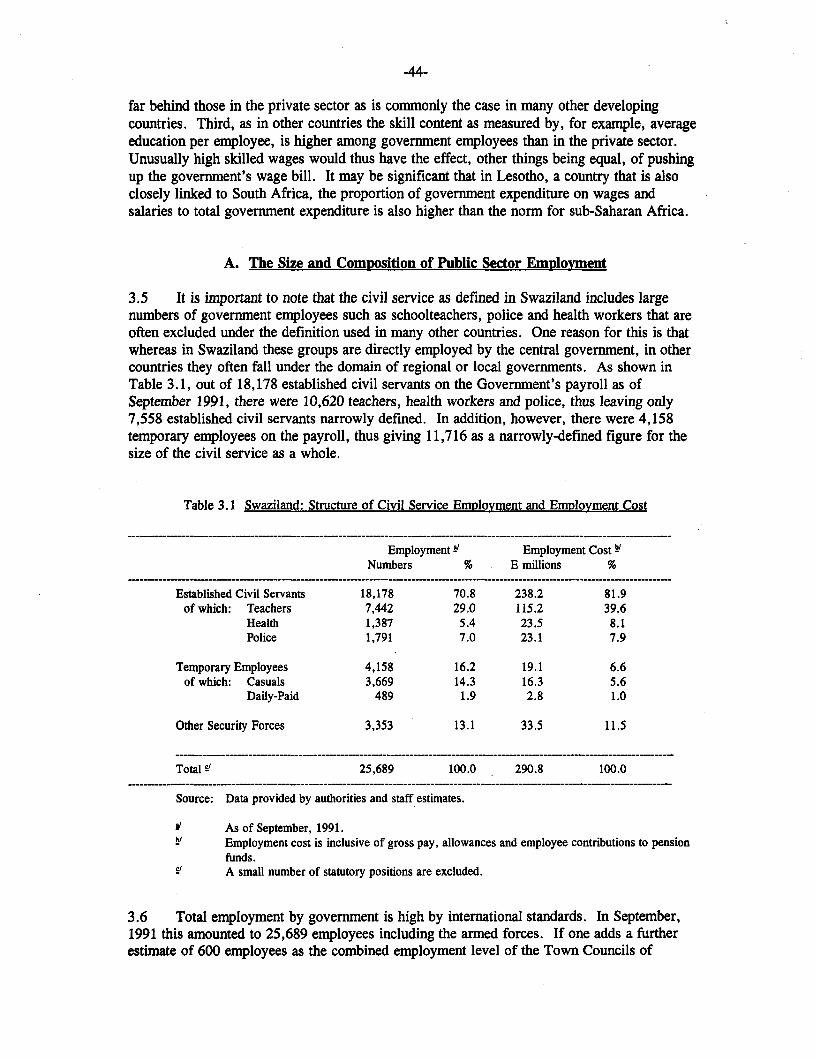
-44-
far behind those in the private sector as is commonly the case in many other developingcountries. Third, as in other countries the skill content as measured by, for example, averageeducation per employee, is higher among government employees than in the private sector.Unusually high skilled wages would thus have the effect, other things being equal, of pushingup the government's wage bill. It may be significant that in Lesotho, a country that is alsoclosely linked to South Africa, the proportion of government expenditure on wages andsalaries to total govermment expenditure is also higher than the norm for sub-Saharan Africa.
A. The Size and Composition of Public Sector Emplovment
3.5 It is important to note that the civil service as defined in Swaziland includes largenumbers of government employees such as schoolteachers, police and health workers that areoften excluded under the definition used in many other countries. One reason for this is thatwhereas in Swaziland these groups are directly employed by the central government, in othercountries they often fall under the domain of regional or local governments. As shown inTable 3.1, out of 18,178 established civil servants on the Government's payroll as ofSeptember 1991, there were 10,620 teachers, health workers and police, thus leaving only7,558 established civil servants narrowly defined. In addition, however, there were 4,158temporary employees on the payroll, thus giving 11,716 as a narrowly-defined figure for thesize of the civil service as a whole.
Table 3.1 Swaziland: Structure of Civil Service EmPloyment and Emplovment Cost
Employment ' Employment Cost '
Numbers % E millions %
Established Civil Servants 18,178 70.8 238.2 81.9of which: Teachers 7,442 29.0 115.2 39.6
Health 1,387 5.4 23.5 8.1Police 1,791 7.0 23.1 7.9
Temporary Employees 4,158 16.2 19.1 6.6of which: Casuals 3,669 14.3 16.3 5.6
Daily-Paid 489 1.9 2.8 1.0
Other Security Forces 3,353 13.1 33.5 11.5
Total 5' 25,689 100.0 290.8 100.0
Source: Data provided by authorities and staff estimates.
As of September, 1991.Employment cost is inclusive of gross pay, allowances and employee contributions to pensionfunds.A small number of statutory positions are excluded.
3.6 Total employment by govermnent is high by international standards. In September,1991 this amounted to 25,689 employees including the armed forces. If one adds a furtherestimate of 600 employees as the combined employment level of the Town Councils of
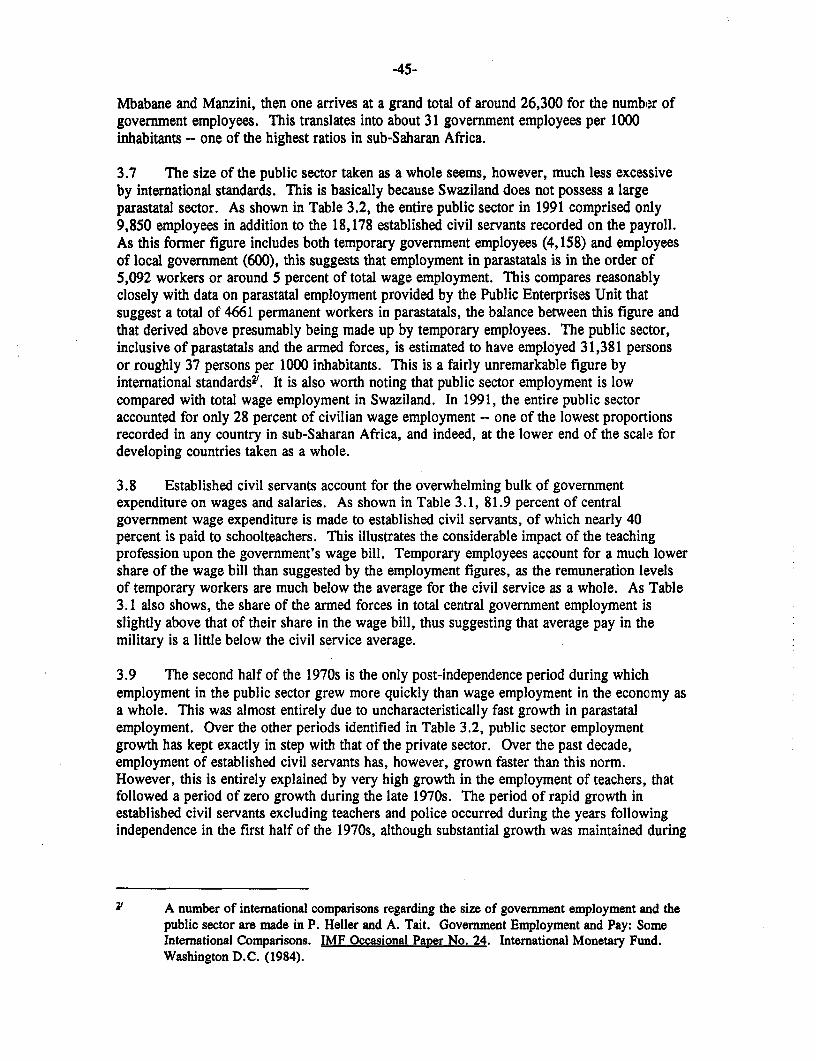
-45-
Mbabane and Manzini, then one arrives at a grand total of around 26,300 for the number ofgovernment employees. This translates into about 31 government employees per 1000inhabitants -- one of the highest ratios in sub-Saharan Africa.
3.7 The size of the public sector taken as a whole seems, however, much less excessiveby international standards. This is basically because Swaziland does not possess a largeparastatal sector. As shown in Table 3.2, the entire public sector in 1991 comprised ordy9,850 employees in addition to the 18,178 established civil servants recorded on the payroll.As this former figure includes both temporary government employees (4,158) and employeesof local government (600), this suggests that employment in parastatals is in the order of5,092 workers or around 5 percent of total wage employment. This compares reasonablyclosely with data on parastatal employment provided by the Public Enterprises Unit thatsuggest a total of 4661 permanent workers in parastatals, the balance between this figure andthat derived above presumably being made up by temporary employees. The public sector,inclusive of parastatals and the armed forces, is estimated to have employed 31,381 personsor roughly 37 persons per 1000 inhabitants. This is a fairly unremarkable figure byinternational standards2'. It is also worth noting that public sector employment is lowcompared with total wage employment in Swaziland. In 1991, the entire public sectoraccounted for only 28 percent of civilian wage employment -- one of the lowest proportionsrecorded in any country in sub-Saharan Africa, and indeed, at the lower end of the scale fordeveloping countries taken as a whole.
3.8 Established civil servants account for the overwhelming bulk of govermnentexpenditure on wages and salaries. As shown in Table 3.1, 81.9 percent of centralgovernment wage expenditure is made to established civil servants, of which nearly 40percent is paid to schoolteachers. This illustrates the considerable impact of the teachingprofession upon the government's wage bill. Temporary employees account for a much lowershare of the wage bill than suggested by the employment figures, as the remuneration levelsof temporary workers are much below the average for the civil service as a whole. As Table3.1 also shows, the share of the armed forces in total central government employment isslightly above that of their share in the wage bill, thus suggesting that average pay in themilitary is a little below the civil service average.
3.9 The second half of the 1970s is the only post-independence period during whichemployment in the public sector grew more quickly than wage employment in the economy asa whole. This was almost entirely due to uncharacteristically fast growth in parastatalemployment. Over the other periods identified in Table 3.2, public sector employmentgrowth has kept exactly in step with that of the private sector. Over the past decade,employment of established civil servants has, however, grown faster than this norm.However, this is entirely explained by very high growth in the employment of teachers, thatfollowed a period of zero growth during the late 1970s. The period of rapid growth inestablished civil servants excluding teachers and police occurred during the years followingindependence in the first half of the 1970s, although substantial growth was maintained during
A number of international comparisons regarding the size of government employment and thepublic sector are made in P. Heller and A. Tait. Government Employment and Pay: SomeInternational Comparisons. IMF Occasional Paper No. 24. International Monetary Fund.Washington D.C. (1984).
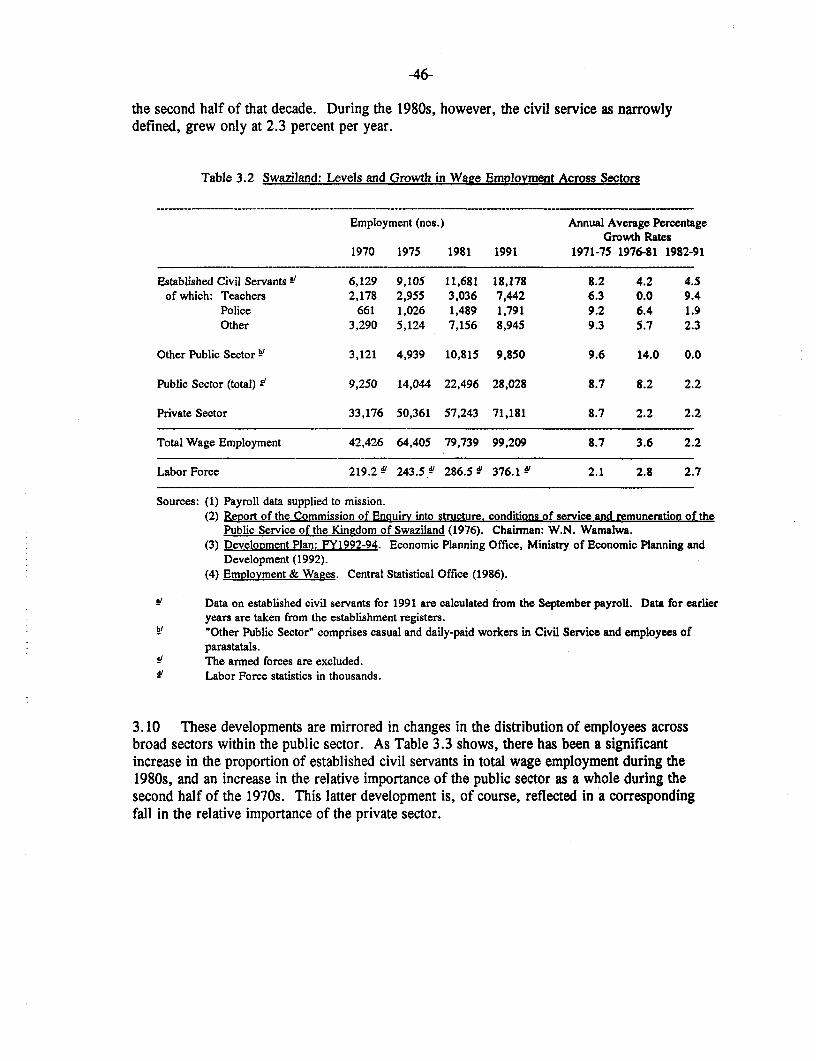
-46-
the second half of that decade. During the 1980s, however, the civil service as narrowlydefined, grew only at 2.3 percent per year.
Table 3.2 Swaziland: Levels and Growth in Wage Emplovment Across Sectors
Employment (nos.) Annual Average PercentageGrowth Rates
1970 1975 1981 1991 1971-75 1976-81 1982-91
Established Civil Servants!' 6,129 9,105 11,681 18,178 8.2 4.2 4.5of which: Teachers 2,178 2,955 3,036 7,442 6.3 0.0 9.4
Police 661 1,026 1,489 1,791 9.2 6.4 1.9Other 3,290 5,124 7,156 8,945 9.3 5.7 2.3
Other Public Sector F 3,121 4,939 10,815 9,850 9.6 14.0 0.0
Public Sector (total)!' 9,250 14,044 22,496 28,028 8.7 8.2 2.2
Private Sector 33,176 50,361 57,243 71,181 8.7 2.2 2.2
Total Wage Employment 42,426 64,405 79,739 99,209 8.7 3.6 2.2
Labor Force 219.2 v' 243.5 v 286.5 v' 376.1 Y 2.1 2.8 2.7
Sources: (1) Payroll data supplied to mission.(2) Resort of the Commission of Enquiry into structure, conditions of service and remuneration of the
Public Service of the Kingdom of Swaziland (1976). Chairman: W.N. Wamalwa.(3) Development Plan: FY1992-94. Economic Planning Office, Ministry of Economic Planning and
Development (1992).(4) Employment & Wages. Central Statistical Office (1986).
Data on established civil servants for 1991 are calculated from the September payroll. Data for earlieryears are taken from the establishment registers."Other Public Sector" comprises casual and daily-paid workers in Civil Service and employees ofparastatals.The armed forces are excluded.
dv Labor Force statistics in thousands.
3.10 These developments are mirrored in changes in the distribution of employees acrossbroad sectors within the public sector. As Table 3.3 shows, there has been a significantincrease in the proportion of established civil servants in total wage employment during the1980s, and an increase in the relative importance of the public sector as a whole during thesecond half of the 1970s. This latter development is, of course, reflected in a correspondingfall in the relative importance of the private sector.
-47-
Table 3.3 Swaziland: Percentage Distribution of Wage Emplovment Across Sectors
1970 1975 1981 1991
Established Civil Servants 14.4 14.1 14.6 18.3of which: Teachers 5.1 4.6 3.8 7.5
Police 1.6 1.6 1.9 1.8Other 7.8 8.0 9.0 9.0
Other Public Sector 7.4 7.7 13.6 9.9
Public Sector (total) 21.8 21.8 28.2 28.3
Private Sector 78.2 78.2 71.8 71.7
Total Wage Employment 100.0 100.0 100.0 100.0
Sources: (1) Payroll data supplied to mission.(2) Report of the Commission of Enquiry into structure, conditions of service and remuneration
of the Public Service of the Kingdom of Swaziland (1976). Chairman: W.N. Wamailwa.(3) Development Plan: FY1992-94. Economic Planning Office, Ministry of Economic
Planning and Development (1992).(4) Emplovment & Wa2es. Central Statistical Office (1986).
3.11 In broad terms, excluding recent growth in the number of schoolteachers, there seemsto have been little change in either the occupational distribution within the established civilservice or the allocation of staff across different parts of the functional structure ofgovernment. At present, civil servants are classified according to 28 grades. Unskilledworkers are contained within grades 1 to 5, grades 6 to 15 contain a wide range of clerical,semi-skilled and skilled workers, while grades at 16 and above are essentially professional andmanagerial positions. Using this as a basis for a very crude occupational classification, theproportions within each of these grade ranges have changed little over recent years. Forexample, the proportions of unskilled and professional/administrative workers were 19 and7.4 percent respectively in 1991, as compared with 17.6 percent and 7.9 percent in 1985.Comparisons with the 1970s are much more difficult given major changes in the gradingsystem. However, unskilled workers in 1975 accounted for 8.5 percent of established cilvilservice employment. It would thus seem that in occupational terms at least, the civil servicehas become marginally more skilled over time. It may have been anticipated that, given rapidgrowth in the number of teachers during the 1980s, the proportion of schoolteachers withoutteaching qualifications would have risen. However, this was not the case, and the proportionof unqualified schoolteachers remained at the relatively minor value of 10 percent.
B. Public Sector Pay
Civil Service
3.12 While civil service pay levels are generally below those in other parts of the ecoinomy,disparities between public and private sector pay are proportionately less than are commonlyfound in many other countries in sub-Saharan Africa. Pay at the lower levels of the civilservice are, however, much closer to those in the private sector than is the case for staff
-48-
employed at higher levels. This is highly consistent with experience in most other developingcountries and even some developed countries. As the analysis described below shows,however, an assessment of the appropriateness or otherwise of civil service pay dependscritically upon the additional benefits that accrue to a given civil servant. Indeed, one seriousproblem in terms of the equity of the civil service pay system is that fringe benefits, and, inparticular, the provision of subsidized housing, are allocated unevenly even among employeesof the same grade.
3.13 Civil service pay has been a subject of much controversy within Swaziland and haslead to significant industrial relations difficulties over recent years. There have been 4 paycommissions appointed since 1974 to look into pay and employment matters: Wamalwa(1975), Hlophe (1986), Richards (1988), and Masina (1991). The evolution of civil servicepay has essentially been determined by the recommendations of these commissions and by aseries of interim pay awards. The Wamalwa Commission had considerable influence inlaying down the form of the present grading and pay structure. Prior to 1976, the systemconsisted of ten overlapping structures or cadres with separate arrangements for teachers.Following Wamalwa's recommendations, this system was replaced with a unified structure of17 grades that was subsequently extended to the present level of 28 grades in 1980.
3.14 Grades move upwards from the lowest grade (1) (unskilled) to the highest grade (28)(a top civil servant such as Secretary to the Cabinet), and each has its own salary scale withtypically six to eight increments. These scales overlap, however, with the bottom of anygiven scale set equal to a midpoint for the next scale down. Thus, for example the bottompoint on grade 12 is equal to the fourth notch on grade 11. The annual increase that a workerreceives is thus equal to the structural pay rise awarded to his grade plus the increment to thenext notch on his or her scale. The increments are not proportionately very large, however,and typically vary between 2 and 3 percent of the previous year's salary. The fact that thecivil service'has a unified structure means that each grade may apply to employees in adiverse number of occupational categories. For example, grades 7 to 9 contain both driversand typists, grade 11 contains both primary school teachers and mortuary attendants, whilegrade 15 contains both primary school headmasters and construction foremen. Nevertheless,the grades can be represented according to a rough hierarchy according to the educationalqualification required at entry, with grades 1 to 4 requiring no educational qualification, grade8 requiring GCE 'O' levels, grades 10 and 11 requiring 'O' levels plus a technicalqualification, grade 14 requiring a Diploma, grade 16 is the graduate entry point, whileholders of Masters degrees and post-graduate diplomas enter at grade 18.
3.15 While the integrated grading system has advantages of simplicity over one withseveral different cadres, concern has been expressed in the reports of both Hlophe andRichards that this system can create problems of attracting and retaining staff with skills inshort supply, particularly if such staff have little seniority. Hlophe recommended the paymentof special allowances for such staff, and these were finally implemented on a limited basisfollowing further support for this proposal from Richards. Both commissions wereconcerned, however, by the potential exacerbation of such problems through a tendency forthe pay structure to become increasingly compressed through a tendency to favor the lowerpaid in interim pay awards. Hlophe, for example, noted that the ratio between the startingpay of a Junior Clerical Officer and that of a Principal Secretary had fallen sinceindependence from 1:15.5 to 1:7.3 in 1984, and recommended a new set of pay scales thatwould have increased this ratio back to 1:11.6 as established in the Wamalwa proposals. Bythis criterion, the scales proposed by Richards were similar -- a ratio of 1:11.0, although
-49-
Richards approach was based on a more far-reaching reform of the pay structure based upon adetailed comparison of jobs and remuneration with those in the private sector. Greatdifficulty was encountered with the two main trade unions, the Swaziland NationalAssociation of Civil Servants (SNACS) and the Swaziland National Association of Teachers(SNAT) in implementing Richards' proposals, and a substantially lower award was granted toemployees at grade 24 and above. At the request of the Government, the Masina Commissionre-examined this and granted an additional compensatory award to these higher grades. Thishas had the effect of bringing the Hlophe ratio back to 1:9.1 -- a slightly lower value thian in1980.
3.16 As the Richards' approach suggests, a compression ratio such as that employed byHlophe is only a very crude guide at best to the appropriateness of the pay structure. A betterapproach is to compare the pay levels and conditions of employment of civil servants inselected grades with those of suitable comparators elsewhere in the economy. This isattempted in Tables 3.4(a) and 3.4(b). The method used here is to calculate the annual valueof the total remuneration received by each category of civil service employee includingadditional benefits such as the pension scheme, and to compare this with the total value of theremuneration received by an appropriate comparator in the private sector. The "Job Matches"used by Richards are used as a guide to establishing such comparators. The data on theprivate sector are taken from a survey of 38 local firms carried out during June 1991 andfujrther interviews conducted by the mission.
3.17 It is very clear that the percentage gap between civil service pay and that of theprivate sector increases according to all of the comparisons made as one moves up the skillladder. The comparisons are made for two cases: civil servants who are provided withgovernment housing and those who are not. As both Tables show, this makes a great deal ofdifference to the estimated ratio of private to civil service remuneration. If grossremuneration is taken as the basis of comparison as in Table 3.4(a), the private sectorequivalent to a top grade civil servant earns 2.25 times a Principal Secretary's salary if thelatter is not housed by the Government, but only 1.72 times this if housing is provided. Thedifferential impact of housing provision is at least equally marked at the bottom end of thescale -- a private sector laborer earns 1.72 times his "unhoused" civil service remuneration,but remuneration levels are effectively equalized if housing is provided. These results atrebroadly consistent with those obtained by Richards in 1988.

-50-
Table 3.4(a) Swaziland: Comparisons of Gross Remuneration in the Civil Serviceand Private Sector (1991)
(E per year)
Gross EmolumentsCivil Service Private Y
Excluding Including RatiosHousing b' Housing '
(1) (2) (3) (3) to (1) (3) to (2)
Principal Secretary 51,851 68,015 116,421 2.25 1.72
Under Secretary 40,265 53,333 84,825 2.11 1.59
Principal Accountant 32,362 42,118 74,190 2.29 1.76
Administrative Officer 23,892 32,172 52,943 2.22 1.65
Graduate Recruit 17,246 25,526 37,886 2.20 1.48
Senior Technician 13,363 21,643 30,239 2.26 1.40
Shorthand Typist 9,877 18,157 21,254 2.15 1.17
Driver 6,840 10,128 13,155 1.90 1.03
Unskiled 4,829 8,117 8,328 1.72 1.03
Source: Staff calculations based upon civil service salary scales, data collected from private sectorfirms, and details of personal income tax supplied by the Commissioner of Taxes.
3V !Emoluments in the private sector include basic salaries, annual bonus, pension fundcontribution, housing allowances, value of car provision, value of subsidized loans, domesticbenefits, medical aid, and value of free schooling.Emoluments in the civil service consist of gross salary plus value of pension (assumed equal to20 percent of gross salary) plus value of subsidized housing where shown.Housing benefit is calculated as the difference between the free market rent and the rentcharged by the Govemment. This information is taken from Review of Government Housina:Report from the Housine Task Force. Ministry of Labour and Public Service (1991).
3.18 The proportional gap between civil service and private sector remuneration becomesless if one allows for the progressive nature of the personal income tax system. Table 3.4(b)indicates that at the top end of the civil service, private sector comparators earn net-of-taxdifferentials of 60 percent or less above housed civil servants. The differentials areconsiderably less at lower levels. By sub-Saharan African standards, the conclusion must bethat civil servants who are provided with housing are not grossly underpaid relative to theprivate sector. Indeed differentials of this magnitude have frequently been observed in somedeveloped countries.
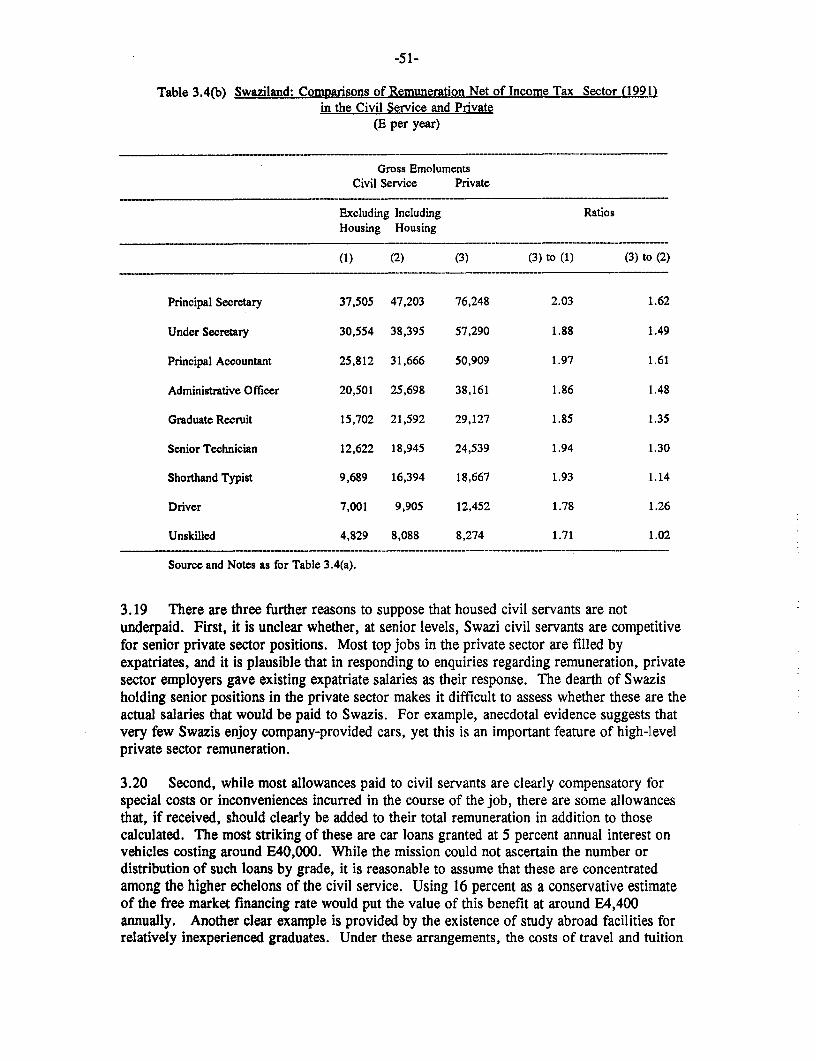
-51-
Table 3.4(b) Swaziland: Comparisons of Remuneration Net of Income Tax Sector (199 )in the Civil Service and Private
(E per year)
Gross EmolumentsCivil Service Private
Excluding Including RatiosHousing Housing
(1) (2) (3) (3) to (1) (3) to (2)
Principal Secretary 37,505 47,203 76,248 2.03 1.62
Under Secretary 30,554 38,395 57,290 1.88 1.49
Principal Accountant 25,812 31,666 50,909 1.97 1.61
Administrative Officer 20,501 25,698 38,161 1.86 1.48
Graduate Recruit 15,702 21,592 29,127 1.85 1.35
Senior Technician 12,622 18,945 24,539 1.94 1.30
Shorthand Typist 9,689 16,394 18,667 1.93 1.14
Driver 7,001 9,905 12,452 1.78 1.26
Unskilled 4,829 8,088 8,274 1.71 1.02
Source and Notes as for Table 3.4(a).
3.19 There are three further reasons to suppose that housed civil servants are notunderpaid. First, it is unclear whether, at senior levels, Swazi civil servants are competitivefor senior private sector positions. Most top jobs in the private sector are filled byexpatriates, and it is plausible that in responding to enquiries regarding remuneration, privatesector employers gave existing expatriate salaries as their response. The dearth of Swazisholding senior positions in the private sector makes it difficult to assess whether these are theactual salaries that would be paid to Swazis. For example, anecdotal evidence suggests thatvery few Swazis enjoy company-provided cars, yet this is an important feature of high-levelprivate sector remuneration.
3.20 Second, while most allowances paid to civil servants are clearly compensatory forspecial costs or inconveniences incurred in the course of the job, there are some allowancesthat, if received, should clearly be added to their total remuneration in addition to thosecalculated. The most striking of these are car loans granted at 5 percent annual interest onvehicles costing around E40,000. While the mission could not ascertain the number ordistribution of such loans by grade, it is reasonable to assume that these are concentratedamong the higher echelons of the civil service. Using 16 percent as a conservative estimnateof the free market financing rate would put the value of this benefit at around E4,400annually. Another clear example is provided by the existence of study abroad facilities forrelatively inexperienced graduates. Under these arrangements, the costs of travel and tuition

-52-
are donor-financed, while the beneficiary receives his or her civil service salary during thestudy period. The indicators are that such benefits are rare if not non-existent in the privatesector. Apart from the consumption benefits of overseas study, the acquisition of Europeanor American qualifications obviously improves the earnings prospects of the recipient bothinside, and perhaps more importantly, outside of the civil service. One difficulty that hasarisen, is that civil servants who have benefitted substantially from overseas training havesubsequently remained in government service for a short time. To address this problem, abonding scheme was introduced in July 1991, under which early departure from governmentservice would incur part-repayment of the salary advanced while overseas.
3.21 A third point is that the civil service may offer better non-monetary benefits to itsemployees than does the private sector. The Richards report found evidence, for example,that typically, employees in the private sector at all grades worked longer hours that their civilservice comparators. More important perhaps, is the fact that there is a strong perception thatcivil service employment offers more job security than the private sector. Objective evidenceon defacto job security is lacking in Swaziland, but this perception seems reasonable on thebasis of international experience.
3.22 There is little evidence that the civil service taken as a whole suffers from excessivestaff turnover. This provides strong support for the view that remuneration is not too low.Richards found an overall vacancy rate of 5.2 percent among established positions, while dataobtained from the payroll of September, 1991 suggested that this rate had fallen to 2.2percent. There are of course severe problems in attracting and retaining staff at specialistgrades, and it was for precisely this reason that recruitment and retention allowances wereintroduced for doctors, dentists, veterinary surgeons, engineers and lawyers following theRichards Report. A serious shortage of experienced statisticians has also more recentlyemerged in the Central Statistics Office. However, the overall picture does not suggest thatthe Government is generally unable to fill its positions. Nor is there any serious evidence thatproblems of moonlighting or persistent absenteeism are commonplace. In addition, the civilservice continues to benefit from the technical expertise provided by its contingent of largelydonor-funded expatriate staff. As Swaziland as a whole suffers from a relative shortage ofexperienced and highly qualified manpower amongst its citizens, the employment ofexpatriates in the public sector has offered, and will continue to offer, a valuable gap-fillingrole.
3.23 The evidence above suggests that the provision of housing is a key determinant ofwhether an individual civil servant's level of remuneration is appropriate or otherwise. Thecentral problem here is that only a minority of civil servants are actually housed. The Reportof the Housing Task Force found that as of September 1990, only 5096 civil servants rentedgovernment-provided housing -- less than one quarter of all non-military civil servants bothpermanent and temporary. While the proportion receiving such housing was higher at grades16 and above than at lower grades, no grade was entirely housed. As it is known that allrural-based civil servants are housed by government, this implies that in urban areas, thesituation is one in which, for most grades at least, a privileged minority are receivingsubstantially higher remuneration than their colleagues. While it is possible that suchdifferential treatment may represent a reward to especially competent individuals, this doesnot seem consistent with the Task Force's view that government housing is allocatedinefficiently. The conclusion here is as voiced earlier in the Richards Report - that thesystem of subsidized housing provision represents a major inequity in the system of civil
-53-
service remuneration. In addition to providing subsidized housing, the government also has ahousing loan scheme. So far, however, this scheme has benefitted only a few civil servants.
Parastatals
3.24 Overall levels of remuneration in the parastatals lie in between those of the civilservice and the private sector. Under the Public Enterprises (Control and Monitoring) Act of1989, the Government split the parastatals into two categories: those within which Ministerialapproval is required for certain economic decisions including adjustment to salary levels andtheir structure (Category A); and those that were granted full autonomy in this respect(Category B). The evidence collected by the mission suggested that a mixed picture hasemerged among the Category A parastatals with some given considerable discretion regardingtheir pay and employment policies, and others essentially tied to a 10 percent band abcve civilservice pay levels. The latter group seemed to have more latitude, however, in terms of theirability to pay fringe benefits. The Water and Sewerage Board constituted an extreme case as,although it is covered by the Act, it was still treated as part of the civil service, and was thusfully bound by the pay scales and other provisions. The general picture is that Category Aparastatals do find it difficult to recruit and retain highly qualified staff, and, in the case ofthe Water and Sewerage Board, to retain skilled manual workers.
C. Policy Analysis
3.25 In light of the continuing need to pursue a prudent fiscal policy over the comingyears, public sector wage and employment policy should adopt three main objectives. First,the rate of increase in civil service employment levels should be carefully controlled. Second,pay increases for most categories should be limited according to those observed in the privatesector. Third, further efforts should be made to narrow the gap further between theremuneration of highly skilled individuals in designated occupational categories and theircontemporaries in the private sector.
Employment Policy
3.26 As noted elsewhere in Chapter IV, there is a strong case to be made for haltinn thLbexisting expansion of schoolteachers and increasing pupil/teacher ratios. As teachersrepresent a substantial proportion of the civil service, this would be highly consistent with acautious approach to civil service employment growth. It should be recognized, however,that there is a danger that schoolteachers may be increasingly drawn away to South Africa asprograms of educational expansion are implemented. The Government may therefore wish tohave greater flexibility over setting teachers' pay than will be permitted under its general civilservice pay policy. In this regard, many countries have taken the route of splitting theteaching service away from the civil service so that pay levels could be reviewed separately.This option, however, could further complicate wage negotiations with the unions and shouldtherefore be carefully considered.
3.27 Not only is Swaziland's civil service large by international standards but there is aclear consensus that substantial over-staffing exists particularly at grade 6 and below. Onefundamental problem is that strong kinship ties prevail in Swaziland, and consequentlyretrenchment is very difficult. The Management Services Division of the Ministry of Laborhas very successfully kept a tight rein on numbers of new established posts over much of the
-54-
service and it is desirable that this should continue. It is suggested that an attempt should bemade to allow posts at grades 6 and below to decline with natural wastage until a staffingreduction of one third in numbers has been achieved. To avoid the structural imbalances thatwould otherwise arise under such a policy, it would be necessary to iron these out throughreallocation of low level staff within the civil service.
3.28 There are two areas of the civil service that need special scrutiny: a) the CentralTransport Authority (CTA); and b) casuals/daily-paid. The CTA accounts for about 419permanent and 77 temporary employees. CTA performs two functions: to service governmentvehicles and to test all vehicles registered in Swaziland. It is widely believed that substantialtheft and corruption occur in the discharge of CTA's duties. Since 1986, government vehiclesaged less than 3 years have been serviced privately, yet CTA's establishment has only fallenby 9 percent. It is recommended that CTA's remaining functions be privatized and that CTAbe abolished. Casual and daily paid workers account for around 4,158 workers and for 7.1percent of the civil service wage bill. It is believed that substantial underutilization amongsuch workers prevails in the Ministry of Works (988 workers). The Government shouldinvestigate the use made of such workers and decide whether existing employment levels arejustified.
Pay Policy
3.29 In general, future annual pay awards should be made according to pay movements inthe private sector. although some exceptions may be made as detailed below. Following thepublication of the Richards' Report, excellent work has continued to be done in the Ministryof Labor monitoring pay in comparator organizations. There seems to be no reason why thiswork should not be formalized and used as the central input in the pay setting process. Itmay be expected that in the near future, real wages will fall in Swaziland's private sectorfollowing real wage decreases in South Africa. In this event, the Government should nothesitate to set pay awards at rates of increase less than the rate of inflation. Awards shouldnot, however, subtract the value of an annual salary scale increment as the latter should betreated as an annual return to experience.
3.30 The recruitment and retention allowances should be increased. These have been fixedin nominal value since their introduction in September 1988. It is suggested that the increasebe calculated as the increase in the Consumer Price Index over the period since theirintroduction. It is also suggested that a similar allowance be extended to accountants.
3.31 The inequities posed by insufficient availability of housing constitute a difficultproblem. One facile solution would be to simply build more houses. However, this simplytranslates into a substantial increase in remuneration for those receiving the additionalhousing, while the Government would be meeting this through the construction costs. Theonly fiscally sound solution would be to remove the housing inequity by raising salariesacross-the-board and financing this increase by raising all rents to market values. This wouldimply, however, an increase in real income for those currently not receiving housing, but onlyand allowance, and a corresponding loss in income for those currently enjoying such housing.Given this consideration and likely union opposition, it would be wise to phase such ameasure over a number of years.
-55-
Other Policies
3.32 The bonding system as introduced in July 1991 seems a sensible measure. However,if this deters employees from returning to government service, it may be appropriate tointroduce a different device. One alternative would be to stop the practice of paying thetrainee's salary during his absence, and to repay this amount plus interest over an extendedperiod after his return.
3.33 The system for filling vacant positions is not always effective. Many internalvacancies are filled by direct transfer within the civil service, and often the individuals inquestion and their line managers are not properly involved in the final decision. On the otherhand, high level positions remain vacant for long periods of time, even when they have beeninternally advertized, because the recruitment system has no mechanisms to define priorities.
- 56 -
IV. EDUCATION SECTOR
Introductio
4.1 Swaziland has performed well in terms of expanding its education system sinceindependence in 1968. However, cost overruns are considerable and efficiency is very low,particularly at the primary level. Since the largest proportion of budgetary resources (about30 percent) are devoted to education, and since this is well above African standards, concertedefforts need to be made to shift the composition of expenditures within the sector in order toenhance the quality of the system.
4.2 This Chapter is organized in four sections. Section A provides a picture of the sizeand sources of finance of the sector. Section B analyzes the main performance indicators ofthe sector. Policy considerations are discussed in Section C, and the final section consists ofconclusions and recommendations. The report concentrates on primary, secondary andtertiary education and does not examine the small pre-school and special education sub-sectors.
A. Financial Analysis
Sectoral Share in the Budget and GDP
4.3 Approximately 25-30 percent of Swaziland's total expenditure on recurrent and capitalitems is devoted to education. This puts Swaziland well above the average for Africa of 16.2percent between 1965-801'. Expenditures in education accounted for around 6 percent ofGDP in the FY1986-90 period, above the average of 5.0 percent for sub-Saharan Africa in19851. In FY1991, the share increased to 8.6 percent of GDP.
4.4 The share of the recurrent and capital budgets devoted to education over the five yearsto FY1990, as well as in the Estimates for FY1991 are presented in Table 4.1. Table 4.1(a)reproduces figures from the Treasury reports and Table 4.1(b) shows the figures adjusted bythe Ministry of Finance (MOF) to accord with IMF conventions.
4.5 The Treasury figures exclude direct payments made under grant-funded projects andfinancing to institutions administered by other ministries-. If donor financing were to beincluded, the share of education in total capital expenditure would rise to 10.2 percent in
1' World Bank, Financing Education in Developing Countries, 1986, p.7 .
71 World Development Report 1991, p.66.
I Payments from donors, however, are listed in the reports on expenditure from FY1989onwards and are included in the capital expenditure figures. Institutions outside the Ministryof Education include: the Swaziland Institute of Health Sciences (SIHS) and the NazareneNursing College under the Ministry of Health, and the Swaziland Institute of Management andPublic Administration (SIMPA) under the Ministry of Labor and Public Service.
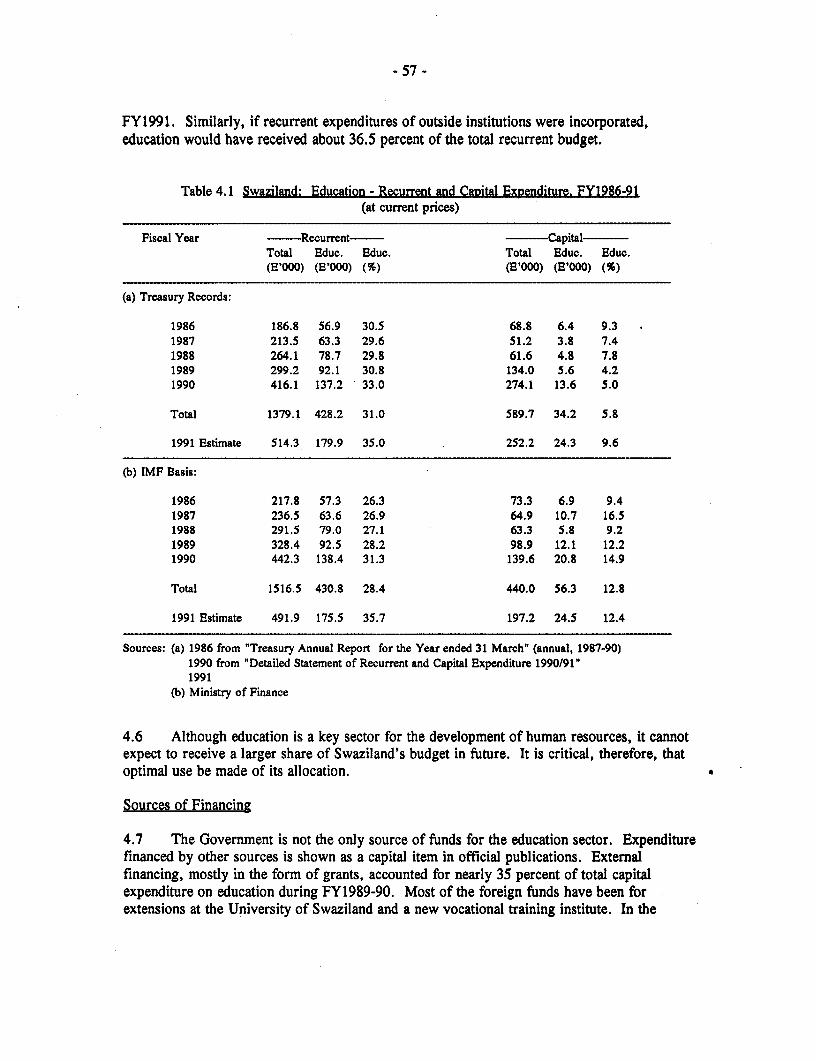
- 57 -
FY1991. Similarly, if recurrent expenditures of outside institutions were incorporated,education would have received about 36.5 percent of the total recurrent budget.
Table 4.1 Swaziland: Education - Recurrent and Capital Exnenditure. FY1986-91(at current prices)
Fiscal Year - Recurrent- CapitalTotal Educ. Educ. Total Educ. Educ.(E3000) (E'O0) (%) (E'000) (E'000)
(a) Treasury Records:
1986 186.8 56.9 30.5 68.8 6.4 9.31987 213.5 63.3 29.6 51.2 3.8 7.41988 264.1 78.7 29.8 61.6 4.8 7.81989 299.2 92.1 30.8 134.0 5.6 4.21990 416.1 137.2 33.0 274.1 13.6 5.0
Total 1379.1 428.2 31.0 589.7 34.2 5.8
1991 Estimate 514.3 179.9 35.0 252.2 24.3 9.6
(b) IMF Basis:
1986 217.8 57.3 26.3 73.3 6.9 9.41987 236.5 63.6 26.9 64.9 10.7 16.51988 291.5 79.0 27.1 63.3 5.8 9.21989 328.4 92.5 28.2 98.9 12.1 12.21990 442.3 138.4 31.3 139.6 20.8 14.9
Total 1516.5 430.8 28.4 440.0 56.3 12.8
1991 Estimate 491.9 175.5 35.7 197.2 24.5 12.4
Sources: (a) 1986 from "Treasury Annual Report for the Year ended 31 March' (annual, 1987-90)1990 from "Detailed Statement of Recurrent and Capital Expenditure 1990/91"1991
(b) Ministry of Finance
4.6 Although education is a key sector for the development of human resources, it cannotexpect to receive a larger share of Swaziland's budget in future. It is critical, therefore, thatoptimal use be made of its allocation.
Sources of Financing
4.7 The Government is not the only source of funds for the education sector. Expenditurefinanced by other sources is shown as a capital item in official publications. Externalfinancing, mostly in the form of grants, accounted for nearly 35 percent of total capitalexpenditure on education during FY1989-90. Most of the foreign funds have been forextensions at the University of Swaziland and a new vocational training institute. In the

- 58 -
FY1991 Estimates total capital expenditure is shown as E34.027 million of which Governmentaccounted for E24.256 million (or 71.3 percent). The balance consisted mainly of grants4'.
4.8 However, the amounts included in the capital budget do not cover all externalassistance. According to the UNDP's local office, Swaziland received E14.047 million in1989 for human resource development. This would represent 12.6 percent of totalexpenditure from all sources in 1989. Of this amount, E5.792 million was for technical andmanagerial education and training, mainly assistance to the Vocational Training InstituteMatsapha (VOCTIM). About E3.1 million went to primary, E2.2 million to secondary andE2.7 million to tertiary education.
Recurrent Expenditure
4.9 The share of primary education has declined and is about 36 percent of recurrentexpenditure in FY1990 as against 24 percent for secondary education and 25 percent for post-secondary education (including teacher training). In Eastern and Southern Africa in 1980 theprimary sector absorbed 56.1 percent, the secondary 22.4 percent and the tertiary 21.5percent of recurrent expenditure on education!'. Swaziland's pattern therefore is verydifferent, and the post-secondary figure is excessive in relation to the number of studentsserved (less than 2 percent of the total). It is important to note that 80 percent of expenditureon post-secondary education in FY1990 consisted of grants and subsidies. This point will bedealt with at greater length later.
Table 4.2 Swaziland: Education - Trends in Recurrent Expenditure. FY1985-91(in percentage)
Year Ministry Primary Secondary Post-SecondaryAdmin. Education Education & Teacher Training
1985 7.4 40.6 26.6 22.31986 12.1 37.3 23.2 23.21987 9.4 37.7 24.4 24.11988 12.1 35.1 23.9 24.41989 12.4 35.4 23.5 24.31990 11.4 35.7 24.0 25.01991 23.1 28.2 22.8 21.8
4.10 No significant changes have taken place in the distribution among categories except inthe FY1991 Estimates which include higher allocations for grants and subsidies. TheMinistry of Education (MOE) merely receives from the Ministry of Finance the previousyear's allocation plus an adjustment for inflation. It is up to the MOE to juggle theadjustment among the different items; some, such as food for hostels, for example, might
E4.758 million from the USA, E615,000 from the EDF, E336,000 from Germany, El millionfrom miscellaneous sources, and a loan from the EDF of E3.062 million.
World Bank, Financing Education in Developing Countries, 1986, p.54.
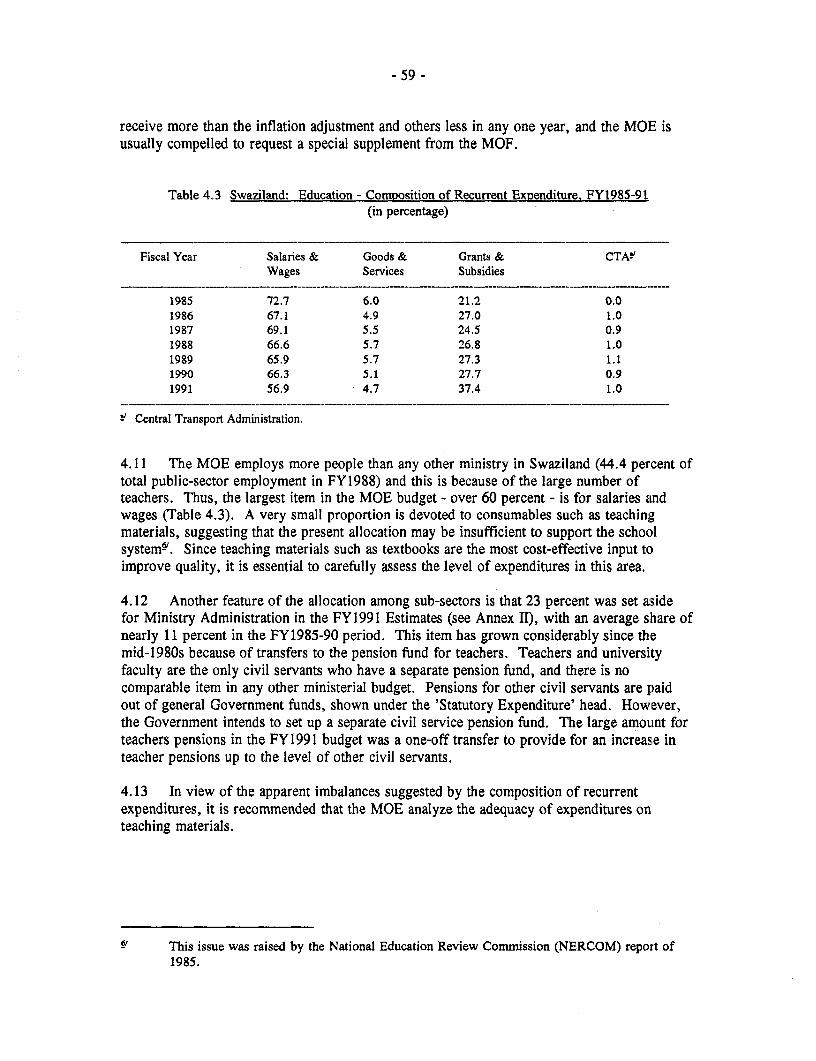
- 59 -
receive more than the inflation adjustment and others less in any one year, and the MOCE isusually compelled to request a special supplement from the MOF.
Table 4.3 Swaziland: Education - Composition of Recurrent Expenditure. FY1985-91.(in percentage)
Fiscal Year Salaries & Goods & Grants & CTAVWages Services Subsidies
1985 72.7 6.0 21.2 0.01986 67.1 4.9 27.0 1.01987 69.1 5.5 24.5 0.91988 66.6 5.7 26.8 1.01989 65.9 5.7 27.3 1.11990 66.3 5.1 27.7 0.91991 56.9 4.7 37.4 1.0
' Central Transport Administration.
4.11 The MOE employs more people than any other ministry in Swaziland (44.4 percent oftotal public-sector employment in FY1988) and this is because of the large number ofteachers. Thus, the largest item in the MOE budget - over 60 percent - is for salaries andwages (Table 4.3). A very small proportion is devoted to consumables such as teaching3materials, suggesting that the present allocation may be insufficient to support the schoolsystem-'. Since teaching materials such as textbooks are the most cost-effective input toimprove quality, it is essential to carefully assess the level of expenditures in this area.
4.12 Another feature of the allocation among sub-sectors is that 23 percent was set asidefor Ministry Administration in the FY1991 Estimates (see Annex II), with an average share ofnearly 11 percent in the FY1985-90 period. This item has grown considerably since themid-1980s because of transfers to the pension fund for teachers. Teachers and universityfaculty are the only civil servants who have a separate pension fund, and there is nocomparable item in any other ministerial budget. Pensions for other civil servants are paidout of general Government funds, shown under the 'Statutory Expenditure' head. However,the Government intends to set up a separate civil service pension fund. The large amount forteachers pensions in the FY1991 budget was a one-off transfer to provide for an increase inteacher pensions up to the level of other civil servants.
4.13 In view of the apparent imbalances suggested by the composition of recurrentexpenditures, it is recommended that the MOE analyze the adequacy of expenditures onteaching materials.
eX This issue was raised by the National Education Review Commission (NERCOM) report of1985.
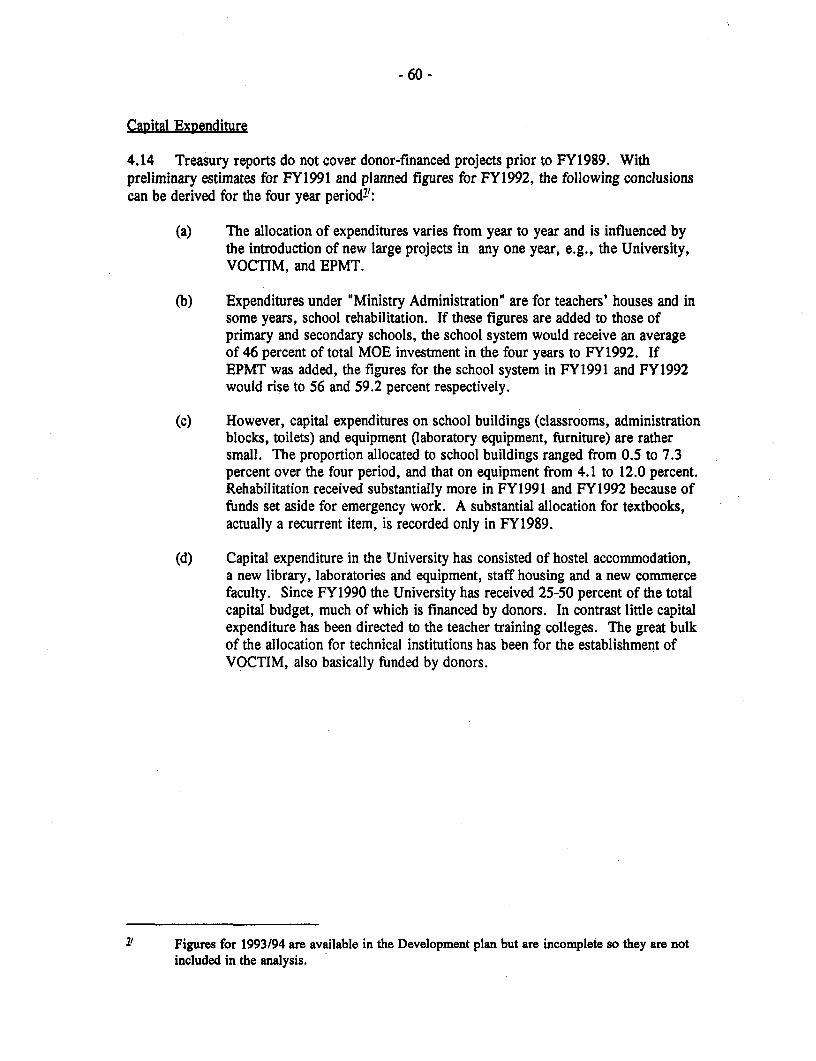
- 60 -
Capital Expenditure
4.14 Treasury reports do not cover donor-financed projects prior to FY1989. Withpreliminary estimates for FY1991 and planned figures for FY1992, the following conclusionscan be derived for the four year period"':
(a) The allocation of expenditures varies from year to year and is influenced bythe introduction of new large projects in any one year, e.g., the University,VOCTIM, and EPMT.
(b) Expenditures under "Ministry Administration" are for teachers' houses and insome years, school rehabilitation. If these figures are added to those ofprimary and secondary schools, the school system would receive an averageof 46 percent of total MOE investment in the four years to FY1992. IfEPMT was added, the figures for the school system in FY1991 and FY1992would rise to 56 and 59.2 percent respectively.
(c) However, capital expenditures on school buildings (classrooms, administrationblocks, toilets) and equipment (laboratory equipment, furniture) are rathersmall. The proportion allocated to school buildings ranged from 0.5 to 7.3percent over the four period, and that on equipment from 4.1 to 12.0 percent.Rehabilitation received substantially more in FY1991 and FY1992 because offunds set aside for emergency work. A substantial allocation for textbooks,actually a recurrent item, is recorded only in FY1989.
(d) Capital expenditure in the University has consisted of hostel accommodation,a new library, laboratories and equipment, staff housing and a new commercefaculty. Since FY1990 the University has received 25-50 percent of the totalcapital budget, much of which is financed by donors. In contrast little capitalexpenditure has been directed to the teacher training colleges. The great bulkof the allocation for technical institutions has been for the establishment ofVOCTIM, also basically funded by donors.
71 Figures for 1993/94 are available in the Development plan but are incomplete so they are notincluded in the analysis.
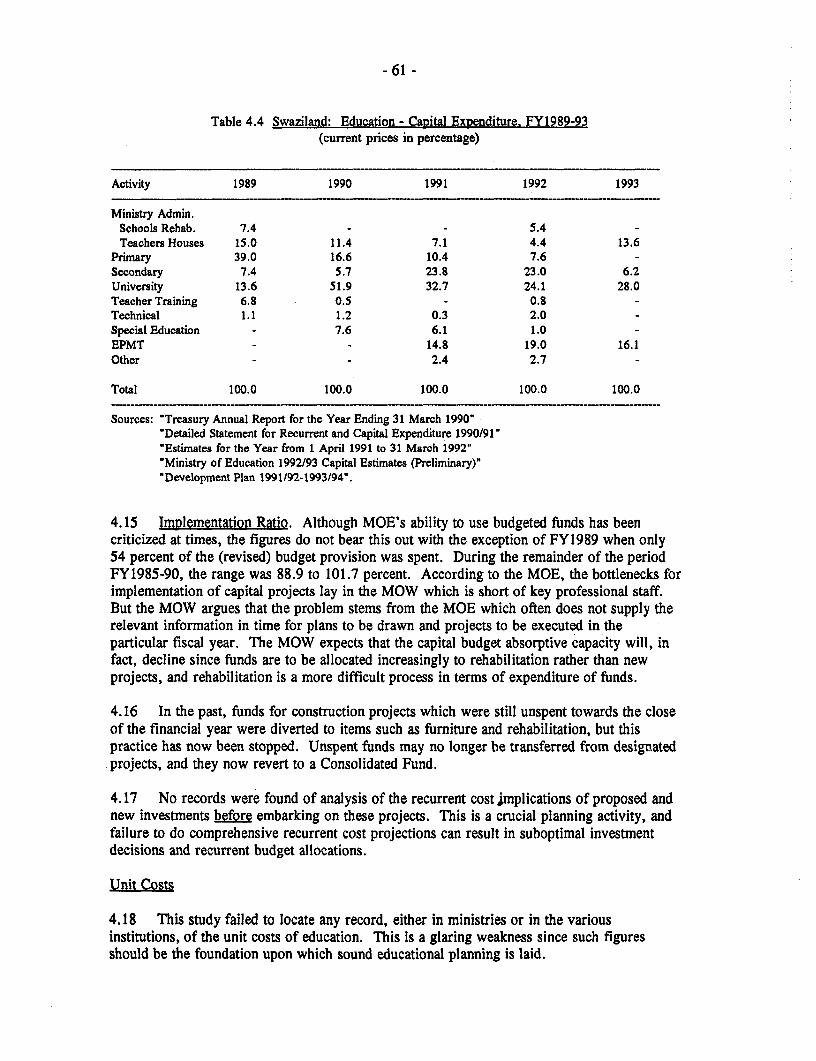
- 61 -
Table 4.4 Swaziland: Education - Capital Expenditure. FY1989-93(current prices in percentage)
Activity 1989 1990 1991 1992 1993
Ministry Admin.Schools Rehab. 7.4 - - 5.4 -Teachers Houses 15.0 11.4 7.1 4.4 13.6
Primary 39.0 16.6 10.4 7.6 -Sc4ondary 7.4 5.7 23.8 23.0 6.2University 13.6 51.9 32.7 24.1 28.0Teacher Training 6.8 0.5 - 0.8 -Technical 1.1 1.2 0.3 2.0 -
Special Education - 7.6 6.1 1.0 -EPMT - - 14.8 19.0 16.1Other - - 2.4 2.7 -
Total 100.0 100.0 100.0 100.0 100.0
Sources: "Treasury Annual Report for the Year Ending 31 March 1990""Detailed Statement for Recurrent and Capital Expenditure 1990/91""Estimates for the Year from 1 April 1991 to 31 March 1992""Ministry of Education 1992/93 Capital Estimates (Preliminary)""Development Plan 1991/92-1993/94".
4.15 Imlementation Ratio. Although MOE's ability to use budgeted funds has beencriticized at times, the figures do not bear this out with the exception of FY1989 when only54 percent of the (revised) budget provision was spent. During the remainder of the periiodFY1985-90, the range was 88.9 to 101.7 percent. According to the MOE, the bottleneclks forimplementation of capital projects lay in the MOW which is short of key professional staff.But the MOW argues that the problem stems from the MOE which often does not supply therelevant information in time for plans to be drawn and projects to be executed in theparticular fiscal year. The MOW expects that the capital budget absorptive capacity will, infact, decline since funds are to be allocated increasingly to rehabilitation rather than newprojects, and rehabilitation is a more difficult process in terms of expenditure of funds.
4.16 In the past, funds for construction projects which were still unspent towards the closeof the financial year were diverted to items such as furniture and rehabilitation, but thispractice has now been stopped. Unspent funds may no longer be transferred from designatedprojects, and they now revert to a Consolidated Fund.
4.17 No records were found of analysis of the recurrent cost Implications of proposed andnew investments before embarking on these projects. This is a crucial planning activity, andfailure to do comprehensive recurrent cost projections can result in suboptimal investmentdecisions and recurrent budget allocations.
Unit Costs
4.18 This study failed to locate any record, either in ministries or in the variousinstitutions, of the unit costs of education. This is a glaring weakness since such figuresshould be the foundation upon which sound educational planning is laid.
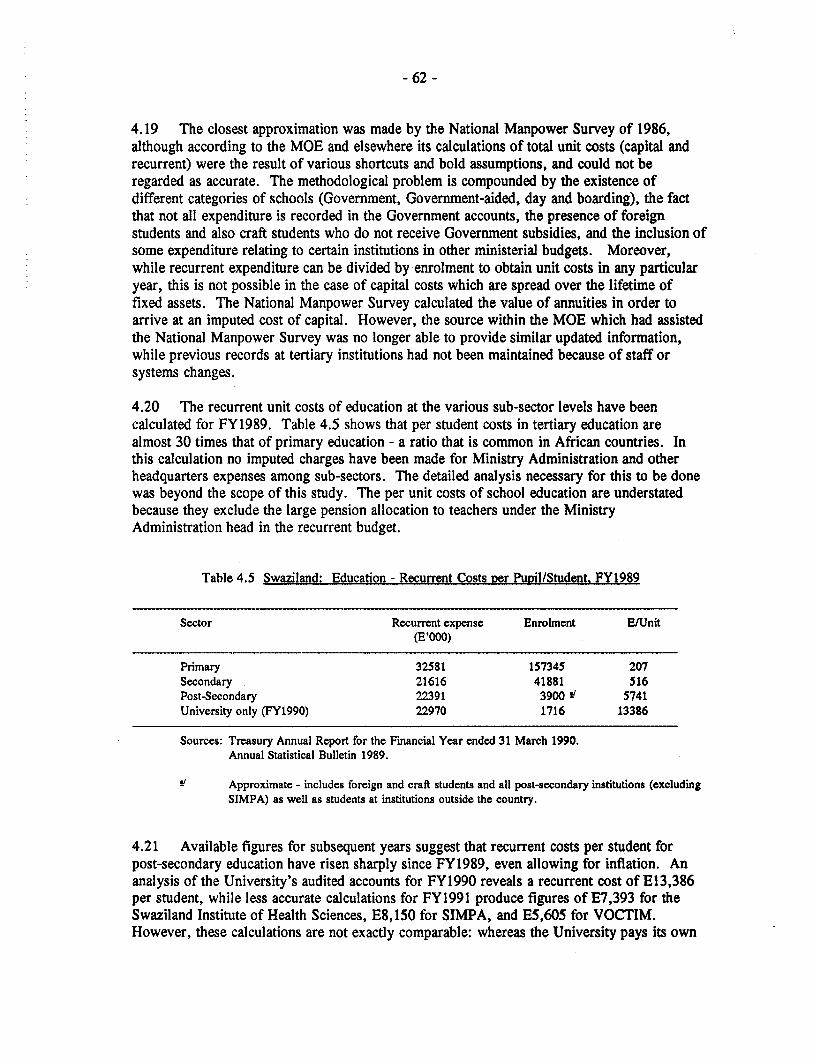
- 62 -
4.19 The closest approximation was made by the National Manpower Survey of 1986,although according to the MOE and elsewhere its calculations of total unit costs (capital andrecurrent) were the result of various shortcuts and bold assumptions, and could not beregarded as accurate. The methodological problem is compounded by the existence ofdifferent categories of schools (Government, Government-aided, day and boarding), the factthat not all expenditure is recorded in the Government accounts, the presence of foreignstudents and also craft students who do not receive Government subsidies, and the inclusion ofsome expenditure relating to certain institutions in other ministerial budgets. Moreover,while recurrent expenditure can be divided by enrolment to obtain unit costs in any particularyear, this is not possible in the case of capital costs which are spread over the lifetime offixed assets. The National Manpower Survey calculated the value of annuities in order toarrive at an imputed cost of capital. However, the source within the MOE which had assistedthe National Manpower Survey was no longer able to provide similar updated information,while previous records at tertiary institutions had not been maintained because of staff orsystems changes.
4.20 The recurrent unit costs of education at the various sub-sector levels have beencalculated for FY1989. Table 4.5 shows that per student costs in tertiary education arealmost 30 times that of primary education - a ratio that is common in African countries. Inthis calculation no imputed charges have been made for Ministry Administration and otherheadquarters expenses among sub-sectors. The detailed analysis necessary for this to be donewas beyond the scope of this study. The per unit costs of school education are understatedbecause they exclude the large pension allocation to teachers under the MinistryAdministration head in the recurrent budget.
Table 4.5 Swaziland: Education - Recurrent Costs Rer Pupil/Student. FY1989
Sector Recurrent expense Enrolment B/Unit(E'000)
Primary 32581 157345 207Secondary 21616 41881 516Post-Secondary 22391 3900 5741University only (FY1990) 22970 1716 13386
Sources: Treasury Annual Report for the Financial Year ended 31 March 1990.Annual Statistical Bulletin 1989.
V Approximate - includes foreign and craft students and aU post-secondary institutions (excludingSIMPA) as well as students at institutions outside the country.
4.21 Available figures for subsequent years suggest that recurrent costs per student forpost-secondary education have risen sharply since FY1989, even allowing for inflation. Ananalysis of the University's audited accounts for FY1990 reveals a recurrent cost of E13,386per student, while less accurate calculations for FY1991 produce figures of E7,393 for theSwaziland Institute of Health Sciences, E8,150 for SIMPA, and E5,605 for VOCTIM.However, these calculations are not exactly comparable: whereas the University pays its own
- 63 -
bills for utilities, the Treasury does so directly on behalf of schools and other post-secondaryinstitutions. Thus, the figures are only approximate.
B. Analysis of Performance Indicators
4.22 Swaziland's educational performance may be summarized as follows:
(a) There has been a rapid growth in the number of schools, pupils and teachersover the last 30 years, especially since independence in 1968.
(b) In 1989, 77 percent of children of primary-school age (6-12 years) were atschool (using the median estimate of the population by the Census Office).
(c) However, the system is characterized by high rates of repetition and drop out,resulting in low efficiency ratios. The time and cost overruns are considlerableand have not been improving. It takes 13 years to produce a school leaverfrom what should be a seven-year primary course, and almost double thenormal time to produce a secondary school leaver. In cost terms, almostdouble the number of pupil places are required, and the MOE estimates thatGovernment is spending 84 percent and 93 percent more than it should onprimary and secondary education respectively.
(d) The system resembles a pyramid with a large base - 78 percent of thosereceiving formal education in 1989 were in primary schools, 21 percent insecondary schools and only 2 percent in post-secondary institutions.
(e) The pupil/teacher ratios of 32 in primary and 20 in secondary schools werecomparatively favorable by the standards of sub-Saharan Africa, although theaverages mask wide disparities.
(f) The enrolment at University is greater than at technical institutes, despite themanpower requirements of Swaziland which are referred to in greater detail inthe next section.
4.23 Efficiency is the overriding issue in Swaziland education today, the main challengebeing to develop a cost-effective system which is within the means of the economy. Thisrequires clarity about the country's manpower needs.
C. Policy Considerations
Manpower Requirements and Implications for Educational Policy
4.24 The stated goal of the Swaziland Government in its education policy is to provide allcitizens with an education which is appropriate to their basic survival needs and abilities whileat the same time conforming to the developmental needs of the country.
-64 -
4.25 The present school system consists of three tiers, i.e., seven years at primary, three atsecondary and two at high school, making a total of twelve years. The NERCOM report of1985 recommended increasing the basic period to nine years but, although accepted, it has notyet been implemented. A large proportion of pupils do not complete primary school, and thenumbers decline precipitously in secondary and high schools. Those who complete highschool with satisfactory Cambridge Overseas School Certificate 'O' level passes may continueto university, teachers' training college or the Swaziland College of Technology (SCOT),while those who leave with a secondary school pass or who drop out of high school maycontinue at vocational training institutions. The curricula at all levels have been biasedtowards academic rather than vocational education; even in vocational courses at school andpost-school levels, the emphasis is often on the theoretical rather than the practical. Thisacademic orientation has been criticized in a number of reports, and the recommendation thatgreater stress be placed on pre-vocational and vocational training has been accepted and isslowly being implemented.
4.26 However, it is very difficult to frame a clear education strategy in the absence of goodlabor market information. A manpower plan was produced in 1977 and revised in somewhatless detail in 1986. The problem is that manpower forecasts are based on certain assumptionsregarding economic growth rates, capital/labor ratios and so on, that have to be revised on acontinuous basis in light of changes in the economic climate, domestically and abroad. Thusmost manpower plans tend to be outdated and/or of dubious reliability as a way of predictingdemand for labor. Instead, it is recommended that regular surveys be taken of employment,vacancies and turnover, so that Government can monitor which skills are in demand.Manpower planning is not the responsibility of an education Ministry, but of the Ministry ofEconomic Planning, or Labour, which should then guide MOE and especially the Universityas to the country's needs and the labor market supply and demand.
4.27 School leavers entering the labor market may find income-earning opportunities in thewage sector (private and public), the informal sector, or the (traditional) rural sector. Wageemployment in Swaziland has expanded less rapidly than the labor force, and openunemployment, especially among the more educated groups, is a growing source of concernto Government.
4.28 Swaziland's ability to generate wage employment will be influenced by growthprospects in South Africa, the attractiveness of the region for foreign investment, andGovernment actions to develop an active marketing campaign. In the meantime, wageemployment is likely to continue to grow slowly, in particular, given that large private sectorcompanies are stating that they could expand output without increasing present levels ofemployment and that they have no plans to take on further staff during the next few years.This could put greater pressure on Government to expand the civil service, but the publicsector is large enough and it is Government policy to keep it to its present size.
4.29 Swaziland has maintained a core of approximately 3,500 expatriates in jobs which,according to many, could potentially be filled by suitably qualified local staff. While this isno doubt true of some of the posts, there will always be some positions for which the level ofskill or experience is not present locally, and jobs will need to be filled by expatriates. Thefact that a certain number of expatriates will always be required should be regarded in apositive light since their presence is usually beneficial to economic growth. Some firms andthe civil service lose skilled citizens to South Africa where salaries are more attractive, so that
- 65 -
Swaziland itself paradoxically suffers from a brain drain of skilled manpower. SinceSwaziland is part of a regional labor market, it will always be both importing and exportingskilled manpower. Nonetheless, firms state that, all other things being equal, they wouldprefer to employ citizens rather than expatriates because the latter cost considerably more toemploy - salaries have to be regionally competitive and fringe benefits such as housing,transport, services and education allowances have to be paid. The major firms have alreadyachieved high rates of local labor, but there is room for further progress provided thatappropriate skills are available.
4.30 Expatriates tend to be concentrated in managerial, administrative and technical posts.The key areas in which shortages of skilled manpower are encountered include accountancy,top and middle management, the technical professions (such as engineering) andtechnician/artisan posts. On the technical and artisan side, it is foremen, master craftsmnenand individuals with practical experience which are required.
4.31 Those who are unable to secure a wage job will have to fall back on the informal orrural sectors. The importance of promoting the idea of self-employment, and of orientatingthe education system to provide the necessary practical skills for this, have been stressed inseveral reports (self-employment, of course, could also be in the formal sector). It is alsorecognized that the absorptive capacity of the Swazi Nation Land, and its ability to providereasonably attractive income-earning opportunities, depends upon changes being made in landtenure and certain other policy changes in agriculture and rural development.
4.32 It is critical that the education system reform itself so as to better meet the manpowerrequirements of the country. Guidance needs to come from the central ministries.
The School Sector
4.33 The challenge at the primary and secondary levels is to improve efficiency. This canbe achieved by improving the quality of teaching, management and maintenance, and byreducing wastage through the replacement of terminal examinations by a process ofcontinuous assessment (as recommended by NERCOM). It is important for reasons of equitythat each child be guaranteed access to primary school, which will require a continued rapidexpansion in enrolment. But, as pointed out before, the system is internally inefficient andexpenditure could be almost halved by reducing the present time overruns. Thus, forexample, the MOE calculates that the number of projected primary pupils in the year 2000could be reduced from 220,000 to 197,000 by reducing the time cycle taken to produce aschool leaver at the end of Grade 7. Repetition rates have been increasing in grades 2-4 butdecreasing in grades 5-6 and are highest in grade 1. Continuous assessment was to beintroduced in Grade I in 1992 in order to reduce repetition.
4.34 Other possible methods of cost saving would be to introduce a system of double shiftsat schools and in areas (especially towns) where this is possible, or allow multigrade classesin schools where class sizes are uneconomically small. Both these policies can prove effectivein increasing enrolment and allowing a more cost-effective use of physical resources.

- 66 -
Multigrade classes can improve pupil achievement provided appropriate teaching materials andteacher trainingl'.
4.35 Double shifts would not reduce the need for more teachers. One way of doing so,however, would be to increase the pupil/teacher ratio. In African countries such as Tanzania,Kenya and Guinea with ratios almost the same as Swaziland's, savings in public recurrentexpenditure of between 14-21 percent have been obtained by raising the ratio to 45:1, and nonegative effects on results have been found when ratios have risen from 40:1 to 50:1.9 Inneighboring South Africa it is now officially accepted that the pupil/teacher ratio in hithertoadvantaged schools should rise to about 40:1. A school mapping exercise undertaken as partof the EPMT project will provide more detailed information on pupil/teacher ratios, andserious consideration should be given to increasing the ratios where possible. The NERCOMreport recommended that class sizes should not exceed 40 at primary and 35 at secondaryschools, but even this allows a large margin for increasing the present ratios.
4.36 Projections by the MOE put the enrolment in primary schools at 220,000 and insecondary schools at 60,000 in the year 2000. At present there are 460 unqualified teachers;350 new posts are to be created in 1992 and the annual teacher attrition rate (throughretirement, death and resignation) is 3.9 percent, or 270. Thus, 1,080 additional teachers willbe required in 1992. At present pupil/teacher ratios and teacher attrition rates, the totalnumber of additional teachers required between 1992 to 2000 will be 5,982, or about 664 perannum. The output of trained teachers in Swaziland at present is about 380 per annum, aconsiderable shortfall which would have to be covered by increasing the output of teachers,i.e., if unqualified teachers are not to be used. Alternatively, if the number of teachers canbe pegged at the 1993 level, the annual number required until 2000 would be reduced to 420,just 40 above existing output levels which could be stepped up to wipe out the discrepancy.This would imply pupil/teacher ratios of 39.8 at primary and 25.3 at secondary schools. Ifthe efficiency index can be improved and the projected primary school enrolment limited to197,000 in the year 2000, then at existing pupil/teacher ratio, 590 additional teachers wouldbe required annually until 2000. But if teacher numbers are pegged at 1993 levels, the annualnumber required would fall to 392, or almost exactly the present output. Pupil/teacher ratiosin primary schools in 2000 would be 37.2. This exercise shows the importance for costsavings of (i) improving the efficiency index at primary schools and (ii) increasing thepupil/teacher ratio.
4.37 More important than the quantitative aspects, however, are the qualitative. Severalreports have raised this issue which is also being stressed in other developing countries.Teachers in Swaziland are themselves the products of poor education, and although specialprograms have been successfully mounted with foreign funding to improve the standard ofmathematics and science among 'O' level candidates and university entrants, serious attentionshould now be devoted to using proven ways to improve the quality of teaching and training.Investments in quality, especially in textbooks and writing materials can have very high pay-offs.
1' World Bank, Primary Education, 1990, p.35.
2F World Bank, Primary Education, 1990, p.42.
- 67 -
4.38 Mass media have been used with good effect. Interactive radio has proved a cost-effective way to improve Math and English in Lesotho, Kenya, Honduras and Thailand. Asystem which has been developed privately in South Africa specifically for secondary studentsdeserves consideration. This particular program has started from the final year of high schooland is rapidly working its way down to the primary level, supplying cassettes andaccompanying textbooks in those subjects which will help the pupil to become a productiveunit in the economy. Communication skills, literacy and numeracy are the prime objectives,and courses are available in English, mathematics, science, biological sciences, accounting,business economics and geography. Schools require a television set: in Swaziland this wouldbe no problem in areas with electricity, while schools in areas not yet served by the electricitygrid could use solar-powered TV. A complete solar-powered color system (including a videorecorder) is available for E8,000. In areas with electricity this cost would be approximatelyE2,500. The cost of a complete set of courses amounts to EIO per pupil per annum. Thecapital cost of equipping the 134 secondary schools with the TV system would beapproximately E703,500 (assuming 50 percent in electrified areas) while the initial recurrentoutlay on materials would be E418,800 per annum (at 1989 enrolment rates). Thereafter therecurrent figure could be reduced as the teaching materials would have a lifetime of severalyears. Donor funds could be sought to support such a program.
4.39 It therefore appears worthwhile to seriously consider supplementing traditionalteaching methods to provide all pupils with the same top-level instruction and enhance thequality of education. This could well offset any negative effects on teacher performance fromhandling large classes if increased pupil/teacher ratios are accepted. This does not imply thatteacher training and upgrading programs should not also be an important part of educationstrategy.
4.40 Another important decision regarding schooling which cannot be delayed indefinitelyrelates to the orientation of the syllabus. The academic bias to date is simply not inconformity with the reality of the job market and the needs of the country. Yet any decisionto change the emphasis will apparently be politically difficult because of the strong viewsamong the Swazi people, especially parents and officials in the MOE, who prize an'academic' qualification and a subsequent white-collar career far more highly than a'vocational' qualification and a blue-collar job. However, there are apparently some signsthat this attitude is beginning to change as the reality of the labor market becomes moreobvious. Far greater emphasis needs to be placed on vocational, agricultural and technicalsubjects. The ADB program on prevocational agriculture is a particularly positive step in thisdirection. On the other hand, attempts to "vocationalize" the school curriculum have failedmiserably in many countries. Thus changes should be based on clear signals about theemployment opportunities and usefulness of various skills for self-employment.
4.41 Parallel to this change in orientation should be a far stricter streaming system. Whileit might be desirable to retain an element of flexibility so that pupils may move from onestream to another at various points in the school system, pupils should not be allowed intostreams which they have no realistic chance of mastering. Again, this may not be a politicallypopular decision but it is essential that it be followed if cost-effectiveness is to be increased.However, in order to save costs on some items, additional expenditure will have to beincurred on others, notably vocational guidance and testing, the expense of which has beenone factor delaying the wider introduction of vocational and technical streams.
- 68 -
4.42 The conditions of service of teachers are now having an adverse effect on theeducation system. This is particularly true in the case of housing; despite absorbingapproximately one-tenth of the capital budget for education since FY1989, there is aformidable backlog, and figures from the current school mapping study reveal that 70 percentof teachers have inadequate housing. The MOE calculates that the capital cost of meeting thebacklog by 2000 would be El billion (or equivalent to the entire Swaziland budget forFY1992). Alternatively, teachers could be given housing allowances which would be shownin the recurrent budget's. There is a general housing shortage in Swaziland but the MOE isperhaps the most affected since teachers are the best educated and most vocal group in thecountry and can be easily demotivated by poor living conditions. It is clear that teacherhousing is only one part of a national problem and that the solution lies not within the MOE,but in the implementation of a national housing program which takes account of the variousalternative housing prototypes available in Southern Africa, many of which offer speedy andlow-cost production, often using labor-intensive methods which would be particularlyappropriate in Swaziland.
The Post-Secondary Sector
4.43 Difficult decisions also need to be made in the tertiary sector. This is particularlytrue of the University which grew rapidly in the 1980s but is not producing the type ofgraduates required in the business sector. Too many lawyers, for instance, are graduatingwhile management and engineering-related subjects have not been offered. However, theestablishment of the new Faculty of Commerce is an important step in the right direction andits interaction with the Faculty of Agriculture should be encouraged in order to produce moregraduates with a training in agricultural management rather than only in agricultural science.The output of teachers from the University is too low to meet MOE's demand, an increaseshould be considered, especially of science and math teachers.
4.44 There has been some discussion about establishing a Faculty or Department ofEngineering, but this should be reconsidered. It is expensive to establish and maintain, andthe annual demand for engineers in Swaziland is far too small to justify such a step. Instead,engineering-related subjects such as soils analysis and electronics could be introduced in theFaculty of Science. It is cheaper for Swaziland to send its medical and engineering studentsto universities elsewhere for their training. The recurrent cost per student was E14,633 in theFaculty of Science in FY1990. Engineering would almost certainly entail higher per studentcosts than Science. The facilities at SCOT have been mentioned as perhaps providing thebasis for an engineering Faculty, but this would add a third campus to the University, andmulti-campus universities are costly to run. It makes sense for small developing countries totake advantage of the regionalization of expensive facilities.
4.45 It is recommended that Government, without infringing on academic autonomy,should formulate a clear policy towards the University, especially with regard to manpowerneeds in the country. In particular, the entire emphasis in the University should be changedand enrolment should be monitored to ensure that a class of graduate unemployed does notarise. As mentioned earlier, the University absorbs a large proportion of the budget for
The present cost of a standard teacher's house constructed by the Ministry of Works isE60,000.
- 69 -
education, and some of its recent capital projects, although funded largely by foreign donors,have been criticized as being lavish. This may or may not be justified: the University(especially the Luyengo campus) has not always been generously funded, but if any capitalproject in the education sector is unduly lavish, it may be the University library at presentunder construction. The need for a new Faculty of Commerce building is a questionabtlepriority - maximum use should be made of existing buildings.
4.46 In contrast to the University, SCOT gives the impression of having been neglected interms of both funding and maintenance; the latter aspect is perhaps surprising at an institutionwhich trains students in maintenance-related subjects. SCOT functions as a training center fortechnician supervisors and craftsmen, those in the latter category paying fees and requiringlower entrance qualifications. One possibility is to transfer all craft training to institutiionssuch as VOCTIM and to upgrade SCOT to a polytechnic-type institution. An alternativecould be to split SCOT into two institutions - a technical college and a craft center - but thefinancial and educational efficiency implications need to be investigated. It is clear, as waspointed out by the National Manpower Survey, that SCOT at present is operatingsub-optimally.
4.47 In addition to SCOT, students may pursue craft courses at VOCTIM. The EC andGermany funded the construction of this institution which was opened in 1988, but allrecurrent costs are borne by the MOE. There is an apparently widespread view in the privatesector that craft students from VOCTIM and SCOT fit the needs of firms much better than thetechnician supervisors trained at SCOT. In fact, VOCTIM and the privately run ManziniIndustrial Training Center (where salaries are paid by the MOE) are probably the types ofinstitutions best suited to providing Swaziland's requirements of technical personnel forindustry.
4.48 There are also contrasts in the teacher training institutions. The Ngwane Teachers'Training College at Nhlangano is only a decade old and is well catered for but WilliarmPitcher College, built in 1962, is in need of rehabilitation and expansion, especially thelibrary, student and staff accommodation, and recreation facilities. The same applies to theSwaziland Institute of Health Sciences. SIMPA, also established in the 1960s, requires somemodernization. An anomaly at the SIHS and SIMPA is that the principal and staff are onlower salary grades than their counterparts at other tertiary institutions. In spite of this, unitcosts are rather high and the quality of training provided mostly to lower categories of civilservants is regarded as poor.
4.49 The structure of the entire post-secondary sector should be reviewed, particularly thesize and content of education at the University, as well as the role of SCOT and SIMPA intertiary education.
Cost Recovery and Minimization
4.50 Given the uncertainty on the future of fiscal revenues during the 1990s, it is imnportantto examine the possibility of cost recovery in education which is the largest recipient ofbudgeting resources. Cost recovery would be based on the concept of user charges, i.e., fees.Alternatively, Government could seek to reduce its expenditure on education by encouragingthe takeover of existing schools by communities or the establishment of private schools.

- 70 -
4.51 The present position is that parents pay fees at schools; the school itself decides onthe level and purpose of the fees, e.g., for a building fund. There is no record of these feesin the MOE but the recent EPMT school mapping exercise will produce the data. Indicationsare that the range is from as little as EIO-15 per annum at primary schools to approximatelyE800 at secondary schools. In addition, boarding fees are in the range of E500-600 perannum. The interesting point about cost recovery, however, is that at the tertiary institutionsstudent fees are totally subsidized by Government, i.e., with the exception of craft students.The system, then, is diametrically the opposite of what is normally recommended, namely,free education for as much of the school system as possible with cost recovery at the top endfrom students who tend to come from better-off families and have better job prospects andhence future ability to repay loans.
4.52 Any individual with 'O' levels wishing to study at the university, SCOT or a trainingcollege may apply for a 'scholarship' (in actual fact a bursary) from the MOE. The bursaryconsists of a 50 percent grant element with the remaining 50 percent in the form of a loanrepayable at 5 percent per annum over a period equal to double the normal duration of thecourse. The bursaries cover tuition, accommodation, books and even an allowance (pocketmoney). All the student pays are application fees, caution monies and supplementaryexamination fees.
4.53 There is no legislative backing for enforcing repayment of the loan. While theGovernment is able to deduct repayment from monthly salaries of graduates who join thecivil service, it is powerless to recover from those who take jobs in the private sector. This isa disincentive for graduates to enter the Government service since they know that their ridewill be truly free if they join the private sector. In practice, therefore, recoveries are onlyabout El million per annum - far less than they should be. What was intended to be arevolving fund for bursaries for successive generations of students virtually has to bereplenished in total each year. The Government has recently introduced a bonding schemewhereby scholarship holders have to work for Government for a specific period, but there issome skepticism as to whether this scheme will succeed, e.g., what if Government has nosuitable post to offer and cannot auction the bond to the private sector? A more effectivesystem would be extending pay-roll deductions (like income tax) to private sector employees.
4.54 Scholarships for tertiary students in the FY1991 Estimates amount to E13.6 million(or 7.7 percent) of the recurrent budget for education, including studies abroad. There is astrong view within both the civil service and business that Swaziland cannot afford to continuefunding tertiary education on this scale, and that ways must be found to recover costs. Anumber of questions arise, however. First, to what extent could families afford to pay?Second, could students raise the funds from the private sector instead? Third, couldGovernment bursaries carry with them a greater loan component and an improved recoverymechanism?
4.55 The NERCOM report suggested that Swaziland should provide free education up toGrade IV and that fees should be payable thereafter, with provision for means-testedscholarships at the tertiary level. Although means tests can be abused and can also bedifficult to administer, the concept is supported by the fact that some families could afford topay fees, either in whole or part.

- 71 -
4.56 On the question of private sector loans, commercial banks' involvement would bedifficult without either Government or parental guarantees. In some cases it is unlikely thatthe families of students would be able to provide acceptable collateral. Recovering loans fromdropouts would also be a problem. This is a common problem in developing countries, andone way of overcoming it is for Government to guarantee loans from commercial banks orfirms.
4.57 It is certainly difficult to justify that tertiary students are free riders whereas familieshave to pay fees for children at school. The evidence is that people in developing countriesare prepared to pay for higher education. A number of African Governments are examiningor have introduced fee-paying schemes, and there appears to be no reason why Swazilandshould not do the same. It might be politically difficult since the vocal urban middle-class ismost affected, but the costs and benefits of the move should be communicated to the public.In Swaziland the total subsidy given to a student at the university (E5,990 in the FY1992estimates) is 93 percent of the starting salary of a primary-school teacher. The opportunitycost of the E13.6 million set aside for scholarships in FY1991 is extremely high - sufficient toincrease the primary school recurrent budget by 29 percent. Cost recovery increasesefficiency by heightening cost-consciousness, and promotes equity by directing funds toprimary education; this allows more people to acquire literacy and numeracy and henceincrease their income-earning prospects. Possibilities are to make Government bursaries fullyrepayable with legislative backing and legal contracts; to require students to put up a certainproportion (say a quarter or third) of the fees with the remainder being in the form of loans;to grant scholarships/bursaries for specific courses (the more economically valuable sciienceand business degrees, for example) or for tuition only.
4.58 It is recommended that a policy be formulated for cost recovery at the post-secondarylevel, perhaps with the system being phased in over a period (although it should not beexpected that full cost recovery is possible in a student loan scheme). While free tertiaryeducation might have made sense at the time of independence when Swaziland desperatelyneeded to produce graduates for the public service, it is difficult to justify it today. The smallproportion of the population in higher education receives a large percentage of the budget,enjoys high private rates of return from the subsidies, (although social rates of return arelowest to tertiary education) and is probably comprised disproportionately of better-offindividuals if African experience holds for SwazilandL'.
4.59 A spin-off from improved cost recovery is that the problems of discipline which haveplagued the university for many years might be mitigated since students would be less likelyto go on strike if they were responsible for meeting the costs of their studies. Student strikescontribute to cost-inefficiency at tertiary institutions, and the image among sections of thepublic is one of a small privileged elite who do not realize the sacrifices the nation is makingfor their education or the social responsibility they should bear in return. Another spin-off isthat students might tend to register for courses with a greater employment potential and hencemore attuned to the needs of the economy, e.g., at SCOT more students might register forcrafts courses. It is interesting that craft students have to pay for their education and are indemand, whereas those who do not have to pay are often not in demand.
WL World Development Report 1988, p. 135.

- 72 -
4.60 In addition to reducing Government expenditure on education through cost recovery,there is the possibility of obtaining more non-Government financing for this sector. This isparticularly important for the tertiary institutions. The University, for example, has recentlymade its first concerted attempt to raise funds from the local private sector - for the newFaculty of Commerce building. This is a good initiative. The fact is that the University hashad a remarkably low profile in Swaziland with few links with the private sector over theyears. It should be encouraged to reduce its dependence on Government funding byestablishing an Endowment Fund as well as a strong Alumni Association, one of the objectsof which should be to solicit contributions from graduates. At the school level, Governmentshould encourage the establishment of more private or mission schools, and also theparticipation by communities or parents' associations both in providing physical facilities andin managing and maintaining schools.
The Ministry
4.61 The MOE is the largest in Swaziland in terms of personnel. Rapid populationgrowth, rapid growth in pupil numbers and hence in numbers of schools and teachers have ledto poor quality of output at all levels (education, administration both in the schools and theMOE, maintenance of physical plant, and cost-efficiency).
4.62 In many respects, the difficult situation both in the MOE itself and the educationsector as a whole, is the result of decisions made elsewhere in Government. Education hasbecome politicized in Swaziland with a vocal teachers' union and growing student activism,and the MOE perhaps unfairly has to bear the brunt of public criticism for shortcomingswhich may stem from the decisions of central ministries.
4.63 There is clearly a need to undertake a thorough review and restructuring of the MOE.A number of competent reviews have been done in the past, most notably the NERCOMstudy. While many weaknesses have been identified, very few of the recommendations havebeen acted upon. A new review should begin with the findings and suggestions of studies,and lead to an action plan, with firm dates, to make the improvements recognized asnecessary and desirable by MOE and Central Government ministries.
(a) The Planning and Research Unit has been neglected in the past and as a resultit has been quite ineffectual. The education system has expanded considerablyand the problems have become increasingly complex, but it is only now thatan attempt is being made to strengthen this unit by increasing the staff andpreparing job descriptions.
(b) There are some competent senior personnel but the consensus was that theyare too overstretched trying to meet their day-to-day responsibilities and havelittle time to address broader strategic issues. In addition, there is little scopefor delegation of responsibility, particularly since some of the top dozen postswere vacant.
(c) The official policy is one of decentralizing responsibilities to the regionaloffices. At present, however, MOE's regional offices are too weak for thepolicy to be successfully implemented, and there is insufficient clarity aboutwhich decisions rest with regional offices and which should be referred to
- 73 -
head office. Regional offices tend to be more knowledgeable thanheadquarters about local communities and schools, and increased autonomy inmanagement and planning are desirable from an efficiency point of view.
(d) The MOE urgently requires a regular flow of information from the districts toheadquarters, and it needs competent senior staff in its regional offices.Although requests have been made to fill these senior posts, funds have notbeen granted from the budget. This limits the effective implementation of theministry's decentralization policy.
(e) There is a serious lack of good statistical information, especially that relatingto costs, which casts doubts as to whether the MOE has the capacity at presentto manage its resources efficiently. Neither the MOE nor the majorinstitutions are selecting important information which is necessary for properplanning. As pointed out earlier, there are no estimates of unit costs per pupilor student. Schools levy various types of fees and collect a considerable sumof money from this source, yet there is no record as to how these funds arespent and no control is exercised from the MOE to ensure that communitiesare not being exploited. The EPMT project should provide some key data forthe first time - a management information system to assist in decision making- and is a welcome initiative.
(f) Problems in management and decision making are exacerbated by the absencesof high level staff, in many instances receiving training abroad. Thus, seriousconsideration should be given to restricting travel abroad until senior andplanning posts are adequately filled.
(g) There is lack of coordination among different sections within the MOE, and ageneral feeling that some sections had no idea of what others were doing.
(h) The Financial Section in the past has sometimes been unable to keep up withthe turnover of teaching staff, and has found it difficult to stop payment tothose who have resigned. However, the records are now being computerizedand this should improve the situation.
(i) A great weakness in the MOE is the lack of a Department of TertiaryEducation. The establishment of such a department has been recommended ina previous report (Skills for the Future, 1990) but no action has been taken.As a result, the MOE appears to have little grasp of what is happening inthese institutions. The University, in particular, is regarded by many inGovernment as being an uncontrolled institution, and the lack of monitoring ofits expenditure was stated to be a "black hole in the budget". Government hasno clear strategy for tertiary education or for the University, and this meansthat there are no criteria for assessing budgetary allocations. Swazilandshould follow the example of some developing countries and establish aDirectorate of Tertiary Education to improve planning and coordination. Thisneed consist of only one or two people. Principals of tertiary institutions feltthat this would be highly desirable since communications with the Ministrywere so poor.
- 74 -
(j) It appears that communication between the central ministries and the MOE(and perhaps line ministries in general) is inadequate, and improvedmechanisms should be found.
D. Conclusions and Recommendations
Main Features
4.64 Swaziland is well above the average for Africa in terms of the education sector'sproportionate share of the total Government budget and GDP. The sector is the largest singlerecipient of budgetary resources and cannot expect to receive a larger share of Swaziland'sbudget in future, and, therefore, optimal use must be made of its allocation.
4.65 The country has performed well in terms of expanding its secondary school system,and the proportion of children of primary school age who are in school, as well aspupil/teacher ratios, compare favorably by African standards. However, time and costoverruns are considerable and efficiency is very low, particularly at the primary level.Government is spending 84 percent and 93 percent more than it should on primary andsecondary education respectively, because of high repetition and dropout rates.
4.66 The sub-sectoral composition of expenditures appears to be unbalanced. The share ofthe recurrent budget devoted to post-secondary education is far higher than the average forEastern and Southern Africa, and is excessive in relation to the number of students served.Conversely, primary schools in Swaziland receive far less proportionately than in Eastern andSouthern Africa.
4.67 The MOE accounts for 44.4 percent of total public sector employment in Swaziland,and the largest item in its recurrent budget, 60 percent, is for salaries and wages.Nevertheless, its share has been declining in favor of grants and subsidies, 35 percent, mostlyfor post-secondary education. About 80 percent of recurrent expenditure on post-secondaryeducation consists of grants and subsidies for students. Meanwhile, expenditures on goodsand services have fallen to below 5 percent, reflecting a dramatic decline in both nominal andreal terms of expenditures for primary education, with likely disastrous consequences for thequality of education.
4.68 Unit cost records are non-existent and there is no basis at present for accuratecalculations to be made. A rough calculation shows that costs in tertiary education perstudent are almost 30 times those per pupil in primary school.
4.69 There is no regular national manpower planning, and this makes it difficult to frame aclear education strategy. Skilled shortages are encountered in accountancy, top and middlemanagement, the technical professions (such as engineering), and technician/artisan posts.Prospects for rapid growth of wage employment are not good, and those who are unable tosecure such employment will have to rely on the informal and rural sectors. Therefore, self-employment will become increasingly important.
4.70 Improving the efficiency of schools is one of a number of ways in which cost savingscan be achieved in order to provide for a reallocation of expenditures, particularly in
- 75 -
introducing innovative techniques of instruction and improving the quality and availabiliity ofteaching and learning materials.
4.71 The policy of re-orientating the present academic basis of the school syllabus towardsprevocational subjects is a step in the right direction but needs to be pursued with a clearunderstanding of the type of skills valued by employers and useful for self-employment.
4.72 The output from the University also needs to be matched more closely with conditionson the job market. There is no clear policy regarding the future growth of the University, thelink between the University and MOE could be better, and the University needs clearguidance from central ministries on numbers and mixes of graduates from various facultiesmost needed in the economy.
4.73 There are some anomalies regarding other post-secondary institutions. The facilitiesat SCOT are under-utilized, and the quality of output at SIMPA is rather low despite high unitcosts.
4.74 Relatively high fees are being charged at secondary school, but at the tertiary levelGovernment bursaries cover all tuition and living costs of students. This implies a feestructure contrary to what is normally recommended. Moreover, the cost-recovery rate, of theloan portion of the bursaries is very low. Bursaries amount to 7.7 percent of the recunrentbudget for education, and a total cost-recovery system would allow the primary schoolrecurrent budget to increase by 29 percent. The opportunity cost of the present grants andsubsidies, therefore, is very high.
4.75 There are a number of ways in which cost-recovery schemes could be implemented,and a number of benefits in terms both of equity and efficiency are to be gained from such aschemes.
4.76 The MOE suffers from a number of weaknesses, in particular relating to theineffectiveness of its Planning and Research Unit, the absence of a wing responsible for thecoordination of tertiary education, and the absence of a good statistical base for planning.The NERCOM report includes a clear exposition of the need to strengthen parts of the MOE,including decentralizing and strengthening of regional staff.
Recommendations
4.77 A thorough review of the education sector should be undertaken. This review shouldcover all aspects and levels of education including the organization and structure of the MOEitself. MOE's authority and responsibility for education planning and investment decisionswithin a budget limit should not be overridden. The decision-making processes andresponsibilities and the relationship between MOE and central ministries should betransparent.
4.78 Concomitant with this review, a Manpower Planning Unit in the MEPD, alreadydiscussed and agreed at inter-ministerial meetings, should be established. It should carry outregular surveys of employment vacancies and turnover especially for selected key skills, sothat demand and supply can be monitored and to guide decisions on education and trainingoutputs to match the country's needs.
- 76 -
4.79 The review should pay particular attention to management aspects, staffing, thedevelopment of an efficient Planning and Research Unit, and the collection of vital statisticaldata (especially cost data), but without repeating the work of earlier commissions andconsultants. Urgent attention should be paid to the recommendations contained, inter alia, inthe NERCOM and National Manpower Survey reports, and to the work of various consultantsat present active in the MOE on important projects and programs. It should ensure that theneed for implementing key actions is communicated to central ministries, and could perhapsbe the catalyst for giving MOE the go-ahead to do so.
4.80 It is vitally important to make qualitative as opposed to quantitative improvements inschool education in order that Swaziland might consolidate what it has already achieved andnot waste the huge resources devoted to education. To this end, resources should be shiftedwithin the school sector from salaries to consumables and maintenance of physical facilities,and from new capital projects to maintenance and rehabilitation of existing facilities. Inparticular, an increased proportion of resources should be allocated to teaching materials atthe primary level, in order to improve the quality of school education. Similarly, anassessment should be made of training needs for teachers, who are themselves the product ofa weak education system.
4.81 Within the education budget as a whole, resources should be shifted from thepost-secondary to the primary sector. The main source of such a shift should be theintroduction of an effective system of cost recovery from students at tertiary institutions. Therecommendation of the NERCOM Report that free education be provided up to Grade 4 withfees being payable thereafter, should now be implemented, and the question of cost recoveryat tertiary levels should be examined as a matter of priority.
4.82 However, within the school system itself, a number of cost-saving methods should beconsidered. These include:
- raising efficiency at primary and secondary schools through a policy ofcontinuous assessment which will minimize repetition and dropout rates;
- increasing the pupil/teacher ratio;- introducing double shifts;- introducing multigrade classes;- encouraging the greater participation of communities in school maintenance
and rewarding preventive maintenance;- encouraging the establishment of more mission, company, private and
community schools;- introducing a stricter streaming system and restricting entry to secondary and
tertiary education only to those with a realistic chance of coping with thesyllabus.
4.83 In order to enhance the quality of education, consideration should be given toinnovative new methods of instruction, particularly radio or audio-visual techniques,especially if grant donor funds are available.
4.84 The present policy of placing greater emphasis on prevocational and practical subjectsshould be implemented as rapidly as possible, and once existing programs are found to beworking well, they should be introduced in more schools.
- 77 -
4.85 A thorough review of the structure of the tertiary sector and of post-secondaryinstitutions should be made, a strategy for tertiary education should be developed, and thleNERCOM recommendation to set up a Department of Tertiary Education in the MOE shouldbe implemented. The new Department would coordinate the activities of the variousinstitutions and strengthen ministerial planning and control of expenditure.
4.86 In the meantime, the physical expansion and growth of enrolment at the Universityshould be limited. More intensive use should be made of existing physical plant, and no' newbuildings should be constructed unless absolutely necessary, and then only to designs andstandards which are affordable. Clear guidelines should be given to University as to whatacademic disciplines it should concentrate on, given the manpower requirements of thecountry. The University should be encouraged to reduce its financial dependence onGovernment by establishing an endowment fund and a strong Alumni Association.
4.87 The operation of SCOT, particularly the underutilization of its facilities, should beinvestigated, and a comparison made with VOCTIM and MITC to determine the optimalbalance of output of skilled technical manpower. The maintenance and rehabilitationrequirements of the older tertiary institutions should be given greater attention.
4.88 Strong encouragement should be given to adult education, extra-mural courses attertiary institutions on a full cost-recovery basis, and correspondence courses (distancelearning).
- 78 -
V. TRANSPORT SECTOR
Introduction
5.1 Up until 1991, the Ministry of Works and Communications (MOWC) had overallresponsibility for overseeing policy and expenditures in the transport sector. But the MOWChas been split into two ministries, the MOW and the Ministry of Transport. The MOW haskept the roads subsector and the MOT, is in charge of the railways and civil aviation.
5.2 The transport sector has typically absorbed the largest proportion of the capital budgetbut its share has declined from 50 percent in FY1986 to just over 35 percent in FY1990. Themain recipients have been the roads subsector and the Central Transport Administration(CTA). Key parastatals in the sector include Swaziland Railways (SR) and Royal SwazilandNational Airways (ZN).
1. ROADS SUB-SECTOR
A. Budgetary Expenditures
Capital Expenditures
5.3 The roads sub-sector accounts for the largest proportion of total capital expenditures,about 20 percent. Capital expenditure for the road sub-sector increased by about 19 per centper annum in the FY1987-90 period, little over the rate of inflation. One major constructionproject generally accounted for 60-80 percent of total expenditure in any one year and threeforce account programs (district roads construction, gravel roads and minor bridges, andresealing) accounted for a further 15-20 percent.
5.4 The level of capital expenditure is projected to be significantly higher over the nextthree years, with an increase of nearly 50 percent per annum in FY1991-93. Expenditures forFY1991 are projected to increase substantially with more than a 100 percent increase overactual expenditures in the previous year due to the start-up of a major upgrading project(Mbabane-Mhlambanyatsi road) and a rehabilitation project (Helehele-Big Bend and Tshaneni-Mlawula roads), plus final payments for the Mliba-Mafutseni road. A further increase ofmore than one third is projected for FY1992 since the above construction and rehabilitationprojects will still be ongoing and construction of the Mbabane-Manzini road is scheduled tostart, involving the upgrading to four lanes of 15 km and realignment of 19 km to a highstandard two lane road.
5.5 The African Development Bank (ADB) is the main funding source for road projectsalthough funding from the European Community (EC) has been obtained for one section ofthe Mbabane-Manzini road.
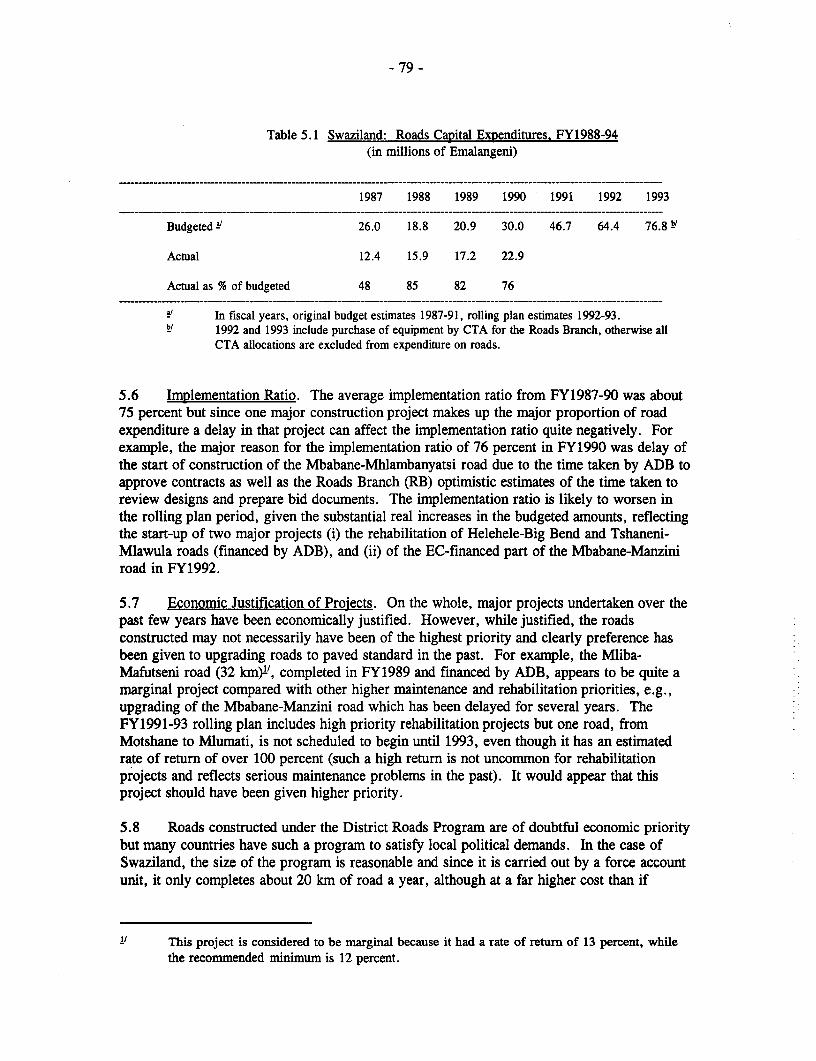
- 79 -
Table 5.1 Swaziland: Roads Capital Expenditures. FY1988-94(in millions of Emalangeni)
1987 1988 1989 1990 1991 1992 1993
Budgeted a' 26.0 18.8 20.9 30.0 46.7 64.4 76.8 '
Actual 12.4 15.9 17.2 22.9
Actual as % of budgeted 48 85 82 76
In fiscal years, original budget estimates 1987-91, rolling plan estimates 1992-93.1992 and 1993 include purchase of equipment by CTA for the Roads Branch, otherwise allCTA allocations are excluded from expenditure on roads.
5.6 Implementation Ratio. The average implementation ratio from FY1987-90 was about75 percent but since one major construction project makes up the major proportion of roadexpenditure a delay in that project can affect the implementation ratio quite negatively. Forexample, the major reason for the implementation ratio of 76 percent in FY1990 was delay ofthe start of construction of the Mbabane-Mhlambanyatsi road due to the time taken by ADB toapprove contracts as well as the Roads Branch (RB) optimistic estimates of the time taken toreview designs and prepare bid documents. The implementation ratio is likely to worsen inthe rolling plan period, given the substantial real increases in the budgeted amounts, reflectingthe start-up of two major projects (i) the rehabilitation of Helehele-Big Bend and Tshaneni-Mlawula roads (financed by ADB), and (ii) of the EC-financed part of the Mbabane-Manziniroad in FY1992.
5.7 Economic Justification of Projects. On the whole, major projects undertaken over thepast few years have been economically justified. However, while justified, the roadsconstructed may not necessarily have been of the highest priority and clearly preference hasbeen given to upgrading roads to paved standard in the past. For example, the Mliba-Mafutseni road (32 km)1', completed in FY1989 and financed by ADB, appears to be quite amarginal project compared with other higher maintenance and rehabilitation priorities, e.g.,upgrading of the Mbabane-Manzini road which has been delayed for several years. TheFY1991-93 rolling plan includes high priority rehabilitation projects but one road, fromMotshane to Mlumati, is not scheduled to begin until 1993, even though it has an estimatedrate of return of over 100 percent (such a high return is not uncommon for rehabilitationprojects and reflects serious maintenance problems in the past). It would appear that thisproject should have been given higher priority.
5.8 Roads constructed under the District Roads Program are of doubtful economic prioritybut many countries have such a program to satisfy local political demands. In the case ofSwaziland, the size of the program is reasonable and since it is carried out by a force accountunit, it only completes about 20 km of road a year, although at a far higher cost than if
.11 This project is considered to be marginal because it had a rate of return of 13 percent, whilethe recommended minimum is 12 percent.

- 80 -
constructed by contract. The graveling units, although mostly implementing the maintenanceprogram, do not work at full capacity and at times get diverted to non-economic projects.
5.9 Of more concern is that allocations for CTA to purchase equipment for the RoadsBranch (RB) have not been revised, now that a policy of maintenance by contract has beenadoptedz'. RB justifies the request for funds as long overdue purchases of construction andmaintenance equipment to replace old and uneconomic units, but without a review as towhether such units are really required if more maintenance works are put out to contract.Moreover, since plans to improve the operations of CTA are yet to be adopted, there is thequestion of whether CTA will be in a position to maintain such equipment given theircontinued poor performance.
5.10 RB is proposing additional projects not presently included in the three year rollingplan but the only ones that might actually start by 1993 are extension of the District RoadsProgram, a Minor Bridges Project, and upgrading of the Luyengo-Sicunusa-Nhlangano andMliba-Madlangampisi-Msahweni roads. Detailed engineering of the last two roads is nowunder way and financing is being sought. The Mliba-Madlangampisi-Msahweni road is acontinuation of the recently completed Mliba-Mafutseni road and seems marginal given thatthe feasibility study estimated a rate of return of 13 percent based on traffic volumes of 230-240 vpd in FY1989. Traffic diversion was projected to increase traffic volumes to 460-470vpd. However, an evaluation carried out by the University of Natal2' only found a rate ofreturn of 6 percent for certain sections of the road based on a traffic volume of 200 vpd inFY1986. There is also some question over the routing of this road since there are otheralternatives which may not have been studied in sufficient detail.
Maintenance Expenditure
5.11 Maintenance Expenditure. Expenditure on road maintenance in FY1989 decreased inreal terms because of the low periodic maintenance output, but recovered in FY1990 becauseof more resealing by contract and hire of equipment from a private contractor for the re-graveling and district construction units. Underspending of the recurrent maintenance budgetwas a problem in previous years mainly because allocated funds could not be spent on hiringvehicles and equipment from CTA due to low availability levels. Expenditure is projected torise again in FY1991 reflecting increased periodic maintenance by contract.
CTA allocations for this purpose were reported at E41.5 million for the FY1991-93 period.
Feasibility Study of Road Projects, Economic Research Unit, University of Natal, March1988.
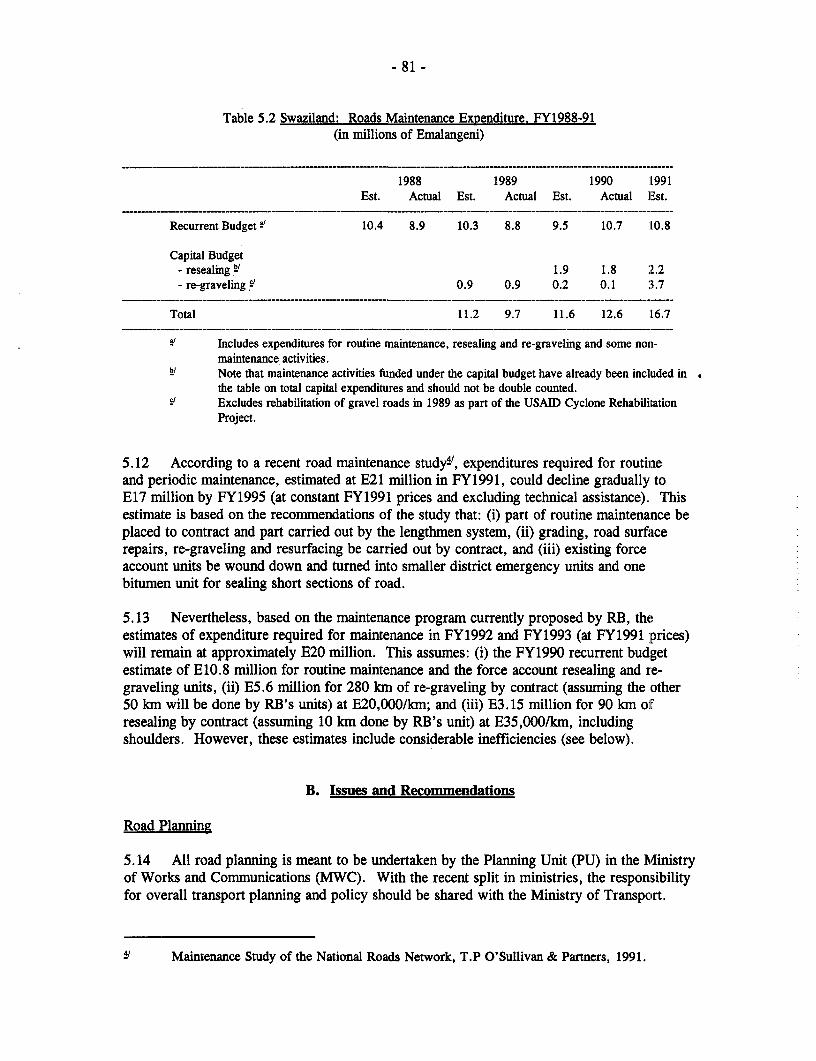
- 81 -
Table 5.2 Swaziland: Roads Maintenance Expenditure. FY1988-91(in millions of Emalangeni)
1988 1989 1990 1991Est. Actual Est. Actual Est. Actual Est.
Recurrent Budgeti 10.4 8.9 10.3 8.8 9.5 10.7 10.8
Capital Budget- resealing b' 1.9 1.8 2.2- re-graveling cl 0.9 0.9 0.2 0.1 :3.7
Total 11.2 9.7 11.6 12.6 16.7
Includes expenditures for routine maintenance, resealing and re-graveling and some non-maintenance activities.Note that maintenance activities funded under the capital budget have already been included inthe table on total capital expenditures and should not be double counted.
Y/ Excludes rehabilitation of gravel roads in 1989 as part of the USAID Cyclone RehabiitationProject.
5.12 According to a recent road maintenance study4', expenditures required for routineand periodic maintenance, estimated at E21 million in FY1991, could decline gradually toE17 million by FY1995 (at constant FY1991 prices and excluding technical assistance). Thisestimate is based on the recommendations of the study that: (i) part of routine maintenance beplaced to contract and part carried out by the lengthmen system, (ii) grading, road surfacerepairs, re-graveling and resurfacing be carried out by contract, and (iii) existing forceaccount units be wound down and tumed into smaller district emergency units and onebitumen unit for sealing short sections of road.
5.13 Nevertheless, based on the maintenance program currently proposed by RB, theestimates of expenditure required for maintenance in FY1992 and FY1993 (at FY1991 prices)will remain at approximately E20 million. This assumes: (i) the FY1990 recurrent budgetestimate of E10.8 million for routine maintenance and the force account resealing and re-graveling units, (ii) E5.6 million for 280 kmn of re-graveling by contract (assuming the other50 km will be done by RB's units) at E20,000/hn; and (iii) E3.15 million for 90 km olfresealing by contract (assuming 10 km done by RB's unit) at E35,000/km, includingshoulders. However, these estimates include considerable inefficiencies (see below).
B. Issues and Recommendations
Road Planning
5.14 All road planning is meant to be undertaken by the Planning Unit (PU) in the Ministryof Works and Communications (MWC). With the recent split in ministries, the responsibilityfor overall transport planning and policy should be shared with the Ministry of Transport.
41 Maintenance Study of the National Roads Network, T.P O'Sullivan & Partners, 1991.

- 82 -
Over the past two years, the PU has been staffed by two local economists and one expatriatefinanced under an ADB projectPi. However, very little in the way of planning has beenundertaken because of the limited capacity of local staff, and the expatriate planner's diversionto special assignments for the PS. At the time of the mission, the unit was staffed by onelocal economist and also a new advisor, a transport planner financed by GTZ. The role ofthis expatriate planner was still unclear but he was proposing to work on institutional transportplanning issues and interrelated transport and private sector issues.
5.15 The PU has carried out little economic analysis and is able to provide no guidance insuch key areas as network planning, the role of the railway, estimation of vehicle operatingcosts (VOC), etc. Feasibility studies are carried out for most road projects but they are notreviewed in depth by the PU and consequently vary in quality. Each study does its owncalculation of VOC which results in widely varying estimates. Although not reviewed ingreat detail, it would appear that some feasibility studies tend to be optimistic regarding thebenefits of projects. This may not be such a problem in some cases because of the lengthyperiod between completion of feasibility studies and the actual start of construction (typicallyfour to five years). The higher base traffic volume resulting from traffic growth in theintervening years should at least partly offset the overestimation of benefits.
5.16 The basic arterial road network in Swaziland is now in place; however, someproposed upgrading projects will divert traffic from existing paved roads and other proposedupgrading projects. Consequently, a number of road projects currently at the identificationstage would affect the economic viability of other projects. Clearly, some network planningis required to identify priorities and ensure that roads are not being justified based on thesame traffic. ADB has proposed to deal with this problem by including a TransportationMaster Plan Study at an estimated cost of E2.4 million, including contingencies, in anupcoming Transport Institutional Support Project. Meanwhile, the PU will remain with nonequalified to supervise feasibility studies and ongoing planning activities. Whilst there isagreement with the objectives of this plan, the needs of Swaziland would be better served ifthe project were to use one transport planner and short term consultants when required, ratherthan the large number of specialists currently proposed.
5.17 Clearly, a reevaluation of the role of the PU is required and a priority work programagreed. Staffing of the unit needs to be improved and staff should work on planning issuesand not be diverted to other activities. If this is not possible, consideration should be given tostrengthening the Ministry of Economic Planning and Development (MEPD) with a transportplanner responsible for evaluating transport projects and establishing some kind of qualitycontrol over the consultants working on feasibility studies. One expatriate economist wouldbe required given the small number of road projects. If at all possible, the ADB should bepersuaded to redefine the long term transport planning needs of Swaziland and focus only onthe issues that have not yet been addressed, such as network planning, determination ofvehicle operating costs, and the role of the railway (see section 2). This would require onetransport planner for two years with a small consulting budget. The necessary highwayengineering and training input could be provided by the large expatriate team to be financedby ADB but external assistance would be required for railway and aerodrome consultantengineers (possibly for three to four weeks each), and a financial analyst. The cost is likely
5/ ADB Project, Mafutseni-Mliba Road Project.
- 83 -
to be less than half of that estimated for the Transport Plan currently included in ADB'sproposed project.
5.18 RB is proposing to seek finance for the Luyengo-Nhlangano and Mliba-Msahweniroads but in view of the large amount of resources required for the Mbabane-Manzini roadover the next few years, priority should be given to rehabilitation projects and to improvingroad maintenance because of the far higher economic returns compared to upgrading projects.The Government needs to reevaluate the priority of such upgrading projects given uncertaintyover the future economic situation in Swaziland which could affect (i) the availability of localfunds for road construction (E45 million of local funds will be required for the Mbabane-Manzini road alone), and (ii) future traffic levels - any downturn in the economy would resultin lower rates of traffic growth and therefore affect the economic viability of road projects.The priority of such projects also needs to be reevaluated in view of the large backlog ofrehabilitation projects in other sectors resulting from a complete lack of maintenance.
Implementation Ratio
5.19 The implementation ratio for roads has been particularly low in some years becauseof: (i) RB's over-optimistic assumptions about the time it takes donors to process loanrequests, (ii) problems with tendering of projects, (iii) delays with loan effectiveness anddonors approving pre-qualification of contractors and award of contracts, and (iv) poorplanning on the part of RB.
5.20 The first problem can be partly explained by the continual turnover of engineers, bothlocal and expatriate, which means that there is little staff continuity or institutionalization ofexperience. However, since ADB has been the prime donor for the roads sub-sector formany years, RB should by now have some indicators of the time it takes ADB to processloans and certainly a review of its files for various ADB projects would provide the necessarydata. The second problem relates to delays due to the lengthy tendering process in SwaLziland(see Chapter II) but such delays should only occur if there is an unexpected problem with aparticular project, since by now RB should be able to allow sufficient time for the process inits planning. The third problem relates to delays over approval of contracts which seem to bea problem particularly associated with the ADB; the resulting uncertainties over how longapproval will take makes it difficult to plan. A review of the last three projects indicate thatconstruction of a project road only begins about three to four years after ADB approves theloan. Lastly, RB has continual problems with planning although there has been someimprovement since the arrival of the technical assistance team in 1989. The MEPD shouldmonitor RB's planning more closely and it should require a more detailed basis for RB'sfunding needs over the rolling plan period based on actual experience of past projects.
Staffing of RB
5.21 Over the last two years, RB has been assisted by a six-man technical assistance team,financed by ADB, including construction, maintenance, planning and training engineers.Although they were intended to be advisors they have basically filled line positions given thatthere are now only three local engineers - the Chief Roads Engineer and two recent graduateengineers. Whilst assisting with the day to day operations of RB, the team has had lim,itedimpact on improving force account construction and maintenance activities, programnming andplanning (both economic and engineering), and development of adequate management
-84 -
information systems. Much of their time has been spent on administrative activities, dealingwith donors, and general "fire-fighting" activities and they have been hampered by continuingproblems with CTA.
5.22 Because of growing concern over the inability of RB to develop its own cadre ofengineers, the ADB plans to finance a transport sector institutional support project (to beappraised in early 1992) which is mostly comprised of support for RB. The project wouldinclude about 309 man-months of technical assistance for RB over a period of seven years,including retroactive financing for engineers for this and the next financial year. Theengineering team would comprise a principal roads engineer, and one engineer each formaintenance, training, contracts, planning, and design and materials, plus a constructionengineer for part of the period. Another project would finance the project manager for theMbabane-Manzini road. The staffing is very much in line with that proposed in theMaintenance Study, completed in early 1991, except that there is no provision for the fourregional maintenance engineers recommended in the study. In addition, the ADB would fundoverseas training for 39 local engineers. Since most engineers leave Government service afterobtaining their degree, ADB is discussing with Government the enforcement of currentbonding legislation for engineers.
5.23 Considering the roads network comprises only 2,800 kIn and that RB is movingfurther towards contract maintenance, there appears to be a certain amount of overkillregarding the level of technical assistance. Clearly, expatriate engineers are required foradministering the major road projects (probably two in addition to a project manager for theMbabane-Manzini road), but for activities, especially construction and training, considerationshould be given to obtaining the services of expatriate road technicians rather than engineers.Alternatively, young motivated graduate engineers from developed countries could be used forsome of the activities.
5.24 While the ADB's condition on bonding of staff trained by Government is basicallysound there will be considerable problems implementing such a policy. Government mayagree in principle, but when it comes to individual cases it is highly unlikely that bonding willbe enforced because of: (i) the use of influence by individuals to escape bonding, and (ii) thereluctance of Government to punish civil servants.
5.25 At present, the outlook for developing a cadre of engineers in the short to mediumterm is poor. Therefore, ADB's program to train a large number of engineers is sound giventhat only a certain percentage will work for RB. There will still be a net gain to the countryof training engineers who subsequently leave RB since they will be of value working either inthe private sector in Swaziland or sending back remittances from South Africa.
Trai ni
5.26 One of the ADB financed engineers has recently completed his two year contract fortraining of RB staff. Although numerous courses for all levels of staff were provided, noinstructors have been trained. Consequently, since his departure in mid-1991, virtually alltraining activities have come to a halt. Every effort should be made to resume training ofroads staff. The ADB is proposing to assist with training in its institution building project byincluding funds for a Training Engineer, improving the Roads Training Center, and assistanceto the Swaziland College of Technology (SCOT) for the training of road technicians, but the
- 85 -
time taken to process the loan will mean that there will be no training for the next one and ahalf to two years.
5.27 The training of road technicians is particularly important because they are responsiblefor supervision of maintenance activities in the field and, if the recommendations of theMaintenance Study are implemented, will play a crucial role in the supervision of contractmaintenance activities. Therefore, RB should focus far more on efforts to train roadtechnicians to supervise maintenance activities, whether carried out by force account orcontract. No such training has taken place since the early 1980s and the present dozen or sotechnicians differ in quality. The level of remuneration and the opportunities for promrotionneed to be evaluated to determiine how to attract and retain trainees in RB.
Road construction costs
5.28 Donor restrictions on financing contractors or consultants from South Africa hasmeant that Swaziland has not been able to take advantage of South Africa's current economicslump in construction. Consequently, the cost of road construction projects financed by ADBand other donors is estimated to be about 30 percent higher than if S. African contractorswere tendering. For example, additional costs to be incurred in the construction of theMbabane-Manzini road amount to E35 million (US$13 million). Such additional costssubstantially increase the effective rate of financing thereby making other financing sourceswith nominally higher interest rates more attractive since contractors from South Africa wouldbe allowed to bid-'.
Road Maintenance
5.29 Periodic Maintenance 2. Problems with road maintenance are much as detailed inthe last Bank mission report in November 1989. The presence of expatriate maintenance andconstruction engineers for nearly three years has had little impact on routine maintenance orimproved output of RB's re-graveling and resealing units. The three graveling units onrlycompleted a total of 50 km of re-graveling in both 1990 and 1991, compared to an annualrequirement of 330 km. The output of the resealing unit was only 10 km compared with anannual requirement of 100 km but an additional 40 km of resealing was put out to contract inFY1989 and 70 km in FY1990. RB has been extremely slow to identify suitable contractorsand obviously did not give sufficient priority to periodic maintenance in these years, despitehaving expatriate engineers to plan and oversee such works.
5.30 Contract maintenance eventually increased in FY1991: contracts for re-graveling of180 km of roads have been let to four contractors and a contract for 72 km of resealing to onecontractor. The total km of re-graveling to be completed will be about 230 kmn, inclucling anestimated 50 km by the three force account units, still a 100 km short of the annual target.
The Government has rejected Work Bank assistance in the roads sub-sector taking into accountnominal rates and not effective rates.
2' Refers to maintenance activities (re-graveling and re-sealing) that need to be made once everyfew years.
- 86 -
However, there should only be a shortfall of 15-20 km of resealing, including the 10 km byRB's resealing unit.
5.31 Expenditure required for road maintenance in FY1991 and FY1992 is an estimatedE20 million, but this includes provision for the highly inefficient re-graveling and resealingunits. These units are estimated to account for over E5 million of recurrent maintenancefunds, yet their output is very low. Nevertheless, RB does not propose to phase out the units,at least over the next two years, even though it is now clear that contractors can carry out allperiodic maintenance at far less cost. By RB's resealing unit and two of the three gravelingunits, road maintenance budget requirements could be reduced to E16-17 million in FY1991and FY1992, even assuming that labor would not be laid off (because of Government policy)but remain part of RB's costs. It is therefore recommended that RB puts all resealing and re-graveling out to contract and only retains small district units for emergency works and oneunit for sealing small sections of road to keep an in-house expertise and provide training.
5.32 Routine Maintenance Al. The estimates for road maintenance expenditurerequirements in FY1992 and FY1993 are also based on "business as usual" for force accountroutine maintenance which means very low levels of output and no improvements inefficiency. While the unavailability of equipment is undoubtedly a major reason for the poorperformance of force account maintenance units, other factors are equally important. Thesefactors include lack of discipline, lack of supervision, poor programming and monitoring ofworks, and lack of knowledge of basic maintenance techniques. Immediate and substantialincreases in efficiency could have been achieved if there had been intense supervision in thefield but there is little evidence that such efforts have been made since the last Bank missionin 1989. The lack of routine maintenance results in higher periodic maintenance andrehabilitation costs.
5.33 The maintenance study has recommended that most road maintenance be carried outusing contractors and remaining routine maintenance activities be carried out using thelengthmen system. The study proposes that RB's maintenance workers be returned to theirhome areas and each given a length of road to maintain. The effectiveness of such a schemeis questionable given the discipline records of maintenance workers in the past.
5.34 The recommendation to turn maintenance workers into mini-contractors is quiteunderstandable given that Government is unlikely to support any recommendations to lay offgovernment staff in favor of private contractors. However, the feasibility of suchrecommendations need to be tested. Therefore, RB should carry out a pilot project to test theeffectiveness of the lengthmen system, possibly using volunteers from the maintenance workforce. RB is in favor of this more phased approach as opposed to the one recommended inthe maintenance study to contract five expatriate maintenance engineers to immediatelyimplement an unproven system. However, no further action is envisaged until the proposedADB Institution Support project begins which will mean routine maintenance will be neglectedfor another one and a half to two years.
it Maintenance activities that need to be repeated one or more times a year (includes local repairof roadway and pavement, grading of unpaved surfaces and shoulders, and regularmaintenance of drainage).
- 87 -
5.35 Rather than waiting for the next ADB project, RB needs to take immediate action toimprove routine maintenance by proceeding with pilot projects to test the effectiveness of thelengthmen system, contract grading and contract road surface repairs. If the lengthmenisystem cannot be made to work with the existing labor force, then an alternative strategy is togradually reduce the work force through attrition and early retirement and employ lengthmenwho have never worked for government before. The pilot projects should be theresponsibility of the expatriate maintenance engineer who will be with RB for at least the nextnine months. He does not have a heavy workload at present because another expatriateengineer is responsible for the graveling and resealing units.
5.36 Whether routine maintenance is carried out by force account or contract, there needsto be far more supervision of activities in the field. Such supervision can best be provided bytwo experienced Road Technicians based in the field with prime responsibility for improvingthe efficiency of maintenance operations.
5.37 Central Transport Administration. CTA's performance has been very poor and thelow availability rates have made it difficult for RB to carry out its maintenance activities. TheGTZ study recommendations to put CTA on a commercial basis and make it compete with theprivate sector were studied by a Government Committee of Inquiry for over a year and itfinally recommended acceptance of the GTZ proposals. Cabinet accepted the Commission'srecommendations in 1991 and proposed that a short term consultant be appointed to work onthe financial strategy and stages of implementation. However, the funds that were availablefrom GTZ for the commercialization of CTA were cancelled after three years of waiting for adecision. The apparent reluctance of Government to take more timely measures to improveCTA are in part due to the number of staff who would have to be laid off and to vestedinterests who benefit from certain of CTA's unofficial activities.
5.38 At present, the Government is in the process of implementing a restructuringprogram for CTA which involves radical changes in organization and management. However,if CTA is to be operated as a commercial entity, it would probably be more efficient toprivatize and keep only a supervisory unit within Government. At any rate, the programenvisages increased competition with the private sector, therefore Government shouldaccordingly reduce CTA's activities, allowing RB to directly hire plant and equipment fromthe private sector. In the meantime, RB should review all equipment needs in the light of themaintenance strategy to be followed over the next few years and keep vehicle and equi]pmentpurchases to a minimum until the performance of CTA improves or other arrangements aremade for maintenance of equipment.
- 88 -
2. SWAZILAND RAILWAYS
Introduction
5.39 Swaziland Railways (SR) began operations in 1964 as a single commodity railwaytransporting iron ore from Ngwenya to the port of Maputo in Mozambique. By the time ofthe closure of the mine in 1981, the railway had expanded operations with the construction ofa new southern line in 1978 to connect SR with the South African railway (SATS) providingaccess to the South African ports of Durban and Richards Bay. Given the small size of theSwaziland economy and competition from road haulers, total rail traffic was only 1.2 milliontons, or 140 million ton-kIn, in the early 1980s. Such a low traffic base meant that Swazilandwas unable to recoup its investment in the southern link, particularly as there were limitedprospects for increasing traffic. Consequently, the railway was receptive to the idea ofincreasing traffic by linking up with SATS from two directions so that transit traffic couldflow through Swaziland. The Northern Rail Link (NRL) was constructed in 1986, (63 km inSouth Africa and 59 km in Swaziland), reducing the distance to South African ports forEastern Transvaal customers by about 250 km.
5.40 There have been frequent periods of dislocation with SR's rail link to Maputofollowing the independence of Mozambique in the mid-1970s. Indeed, it was because of fearsabout dependance on Maputo for Swaziland's exports and the diversion of traffic from rail toroad during periods of insecurity that the Government supported the construction of thesouthern link. Practically all of Swaziland's traffic now goes through South Africa because ofsecurity considerations, problems at the port of Maputo, and the high rate of theft from SRwagons within Mozambique.
Traffic
5.41 Traffic carried by SR since the opening of the NRL is given below. Transit traffichas proved the main stay of the railway, accounting for over 75 percent of total tonnage andabout 85 percent of total ton-km since FY1987. After peaking in 1988, total traffic hasdeclined by about 15 percent per annum. Local traffic has declined by about 7 percent perannum, mainly because of the diversion of all internal traffic (i.e. non-exports or imports) toroad transport. Of even more concern is the sharp decline in transit traffic - by more thanone third - over the last two years, mostly due to the depressed market for rock phosphate(accounting for nearly 46 percent of transit traffic) and downturn in the South Africaneconomy. The latter has resulted in a decline of nearly 30 percent in general goods traffic(comprising one third of transit traffic), although increased competition from road haulersfollowing the recent deregulation of the transport sector in South Africa may also account forsome of the decrease. Rock phosphate traffic picked up in 1991 but remained below the 1988peak.
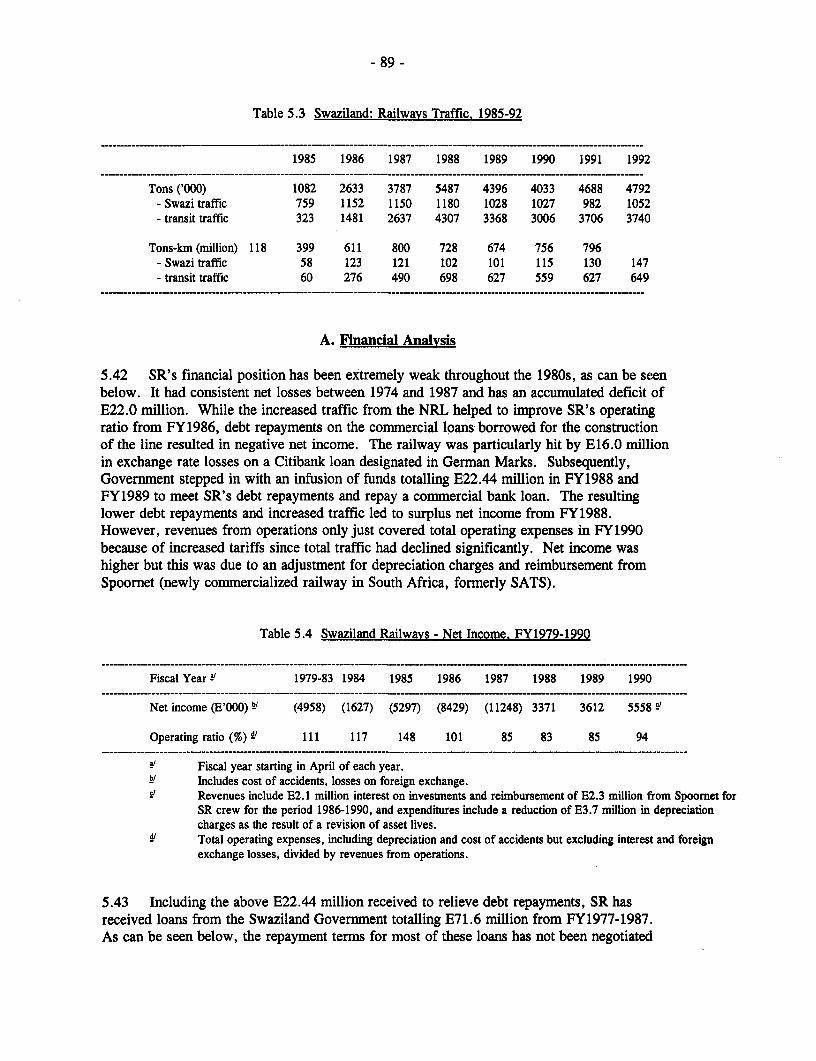
- 89 -
Table 5.3 Swaziland: Railways Traffic. 1985-92
1985 1986 1987 1988 1989 1990 1991 1992
Tons ('000) 1082 2633 3787 5487 4396 4033 4688 4792- Swazi traffic 759 1152 1150 1180 1028 1027 982 1052- transit traffic 323 1481 2637 4307 3368 3006 3706 3740
Tons-km (million) 118 399 611 800 728 674 756 796- Swazi traffic 58 123 121 102 101 115 130 147- transit traffic 60 276 490 698 627 559 627 649
A. Financial Analvsis
5.42 SR's financial position has been extremely weak throughout the 1980s, as can be seenbelow. It had consistent net losses between 1974 and 1987 and has an accumulated deficit ofE22.0 million. While the increased traffic from the NRL helped to improve SR's operatingratio from FY1986, debt repayments on the commercial loans borrowed for the constructionof the line resulted in negative net income. The railway was particularly hit by E16.0 millionin exchange rate losses on a Citibank loan designated in German Marks. Subsequently,Government stepped in with an infusion of funds totalling E22.44 million in FY1988 andFY1989 to meet SR's debt repayments and repay a commercial bank loan. The resultinglower debt repayments and increased traffic led to surplus net income from FY1988.However, revenues from operations only just covered total operating expenses in FY1990because of increased tariffs since total traffic had declined significantly. Net income washigher but this was due to an adjustment for depreciation charges and reimbursement fromSpoornet (newly commercialized railway in South Africa, formerly SATS).
Table 5.4 Swaziland Railways - Net Income. FY1979-1990
Fiscal Year!' 1979-83 1984 1985 1986 1987 1988 1989 1990
Net income (E'000) b' (4958) (1627) (5297) (8429) (11248) 3371 3612 5558 f'
Operating ratio (%) LI 111 117 148 101 85 83 85 94
Fiscal year starting in April of each year.Includes cost of accidents, losses on foreign exchange.
2" Revenues include E2.1 million interest on investments and reimbursement of E2.3 million from Spoornet forSR crew for the period 1986-1990, and expenditures include a reduction of E3.7 million in depreciationcharges as the result of a revision of asset lives.Total operating expenses, including depreciation and cost of accidents but excluding interest and foreignexchange losses, divided by revenues from operations.
5.43 Including the above E22.44 million received to relieve debt repayments, SR hasreceived loans from the Swaziland Government totalling E71.6 million from FY1977-1987.As can be seen below, the repayment terms for most of these loans has not been negotiated
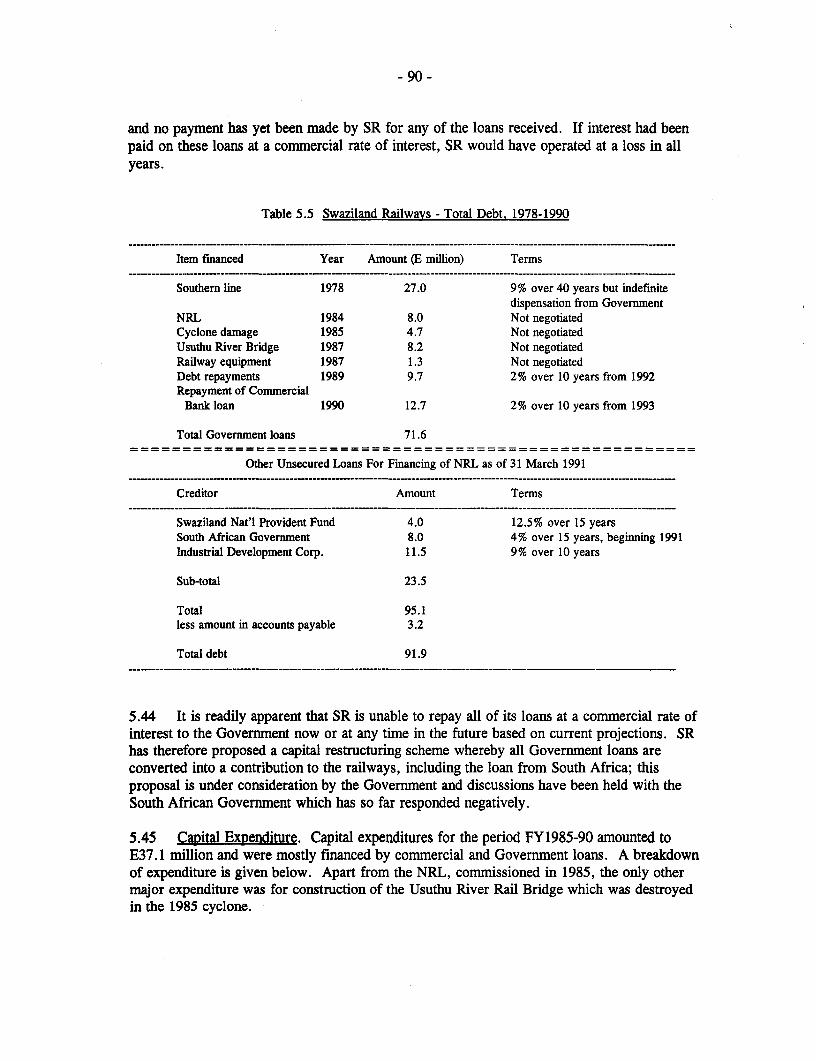
- 90 -
and no payment has yet been made by SR for any of the loans received. If interest had beenpaid on these loans at a commercial rate of interest, SR would have operated at a loss in allyears.
Table 5.5 Swaziland Railways - Total Debt. 1978-1990
Item financed Year Amount (E million) Terms
Southern line 1978 27.0 9% over 40 years but indefinitedispensation from Government
NRL 1984 8.0 Not negotiatedCyclone damage 1985 4.7 Not negotiatedUsuthu River Bridge 1987 8.2 Not negotiatedRailway equipment 1987 1.3 Not negotiatedDebt repayments 1989 9.7 2% over 10 years from 1992Repayment of Commercial
Bankloan 1990 12.7 2% over 10 years from 1993
Total Govermnent loans 71.6
Other Unsecured Loans For Financing of NRL as of 31 March 1991
Creditor Amount Terms
Swaziland Nat'l Provident Fund 4.0 12.5% over 15 yearsSouth African Government 8.0 4% over 15 years, beginning 1991Industrial Development Corp. 11.5 9% over 10 years
Sub-total 23.5
Total 95.1less amount in accounts payable 3.2
Total debt 91.9
5.44 It is readily apparent that SR is unable to repay all of its loans at a commercial rate ofinterest to the Government now or at any time in the future based on current projections. SRhas therefore proposed a capital restructuring scheme whereby all Government loans areconverted into a contribution to the railways, including the loan from South Africa; thisproposal is under consideration by the Government and discussions have been held with theSouth African Government which has so far responded negatively.
5.45 Capital Expenditure. Capital expenditures for the period FY1985-90 amounted toE37. 1 million and were mostly financed by commercial and Government loans. A breakdownof expenditure is given below. Apart from the NRL, commissioned in 1985, the only othermajor expenditure was for construction of the Usuthu River Rail Bridge which was destroyedin the 1985 cyclone.
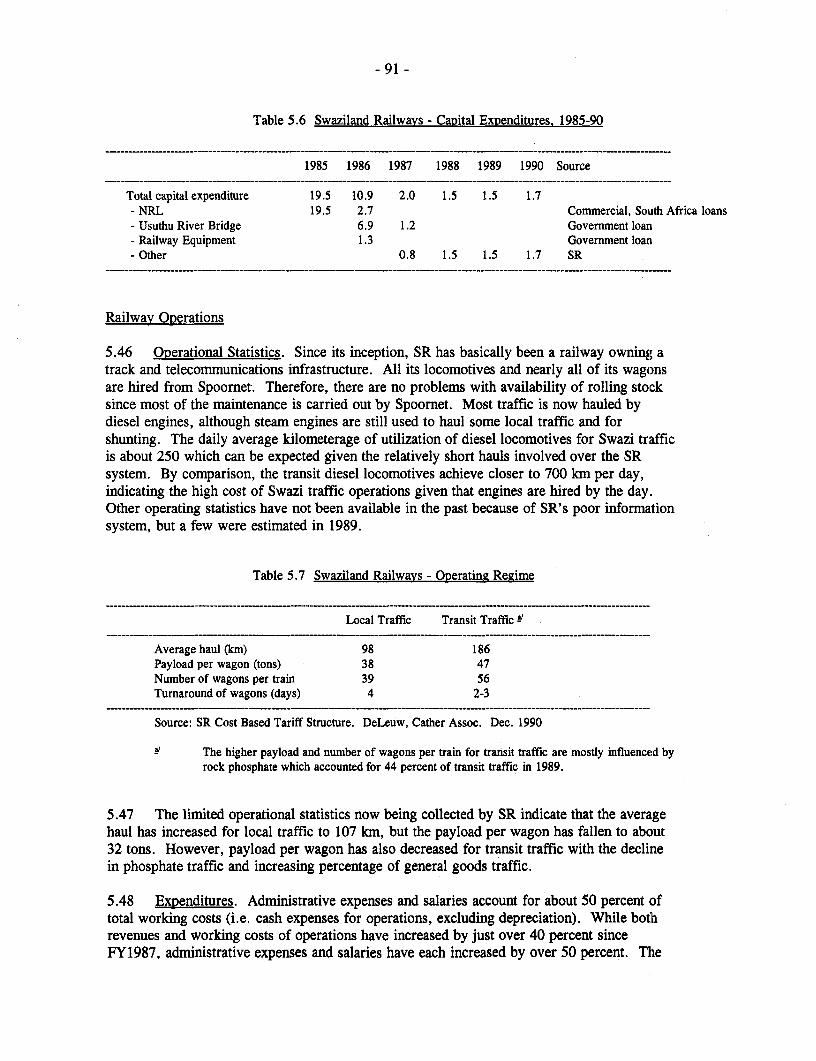
- 91 -
Table 5.6 Swaziland Railways - Capital Expenditures. 1985-90
1985 1986 1987 1988 1989 1990 Source
Total capital expenditure 19.5 10.9 2.0 1.5 1.5 1.7- NRL 19.5 2.7 Commercial, South Africa loans- Usuthu River Bridge 6.9 1.2 Government loaii- Railway Equipment 1.3 Govermment loan- Other 0.8 1.5 1.5 1.7 SR
Railway Operations
5.46 Operational Statistics. Since its inception, SR has basically been a railway owning atrack and telecommunications infrastructure. All its locomotives and nearly all of its wagonsare hired from Spoornet. Therefore, there are no problems with availability of rolling stocksince most of the maintenance is carried out by Spoornet. Most traffic is now hauled bydiesel engines, although steam engines are still used to haul some local traffic and forshunting. The daily average kilometerage of utilization of diesel locomotives for Swazi trafficis about 250 which can be expected given the relatively short hauls involved over the SRsystem. By comparison, the transit diesel locomotives achieve closer to 700 km per day,indicating the high cost of Swazi traffic operations given that engines are hired by the day.Other operating statistics have not been available in the past because of SR's poor informationsystem, but a few were estimated in 1989.
Table 5.7 Swaziland Railways - ORerating Regime
Local Traffic Transit Traffic i
Average haul (km) 98 186Payload per wagon (tons) 38 47Number of wagons per train 39 56Turnaround of wagons (days) 4 2-3
Source: SR Cost Based Tariff Structure. DeLeuw, Cather Assoc. Dec. 1990
a/ The higher payload and number of wagons per train for transit traffic are mostly influenced byrock phosphate which accounted for 44 percent of transit traffic in 1989.
5.47 The limited operational statistics now being collected by SR indicate that the averagehaul has increased for local traffic to 107 kIn, but the payload per wagon has fallen to about32 tons. However, payload per wagon has also decreased for transit traffic with the declinein phosphate traffic and increasing percentage of general goods traffic.
5.48 Expenditures. Administrative expenses and salaries account for about 50 percent oftotal working costs (i.e. cash expenses for operations, excluding depreciation). While bothrevenues and working costs of operations have increased by just over 40 percent sinceFY1987, administrative expenses and salaries have each increased by over 50 percent. The

- 92 -
increase in salaries is mostly due to a 15 percent salary increase in FY1990 as the result ofbargaining by the recently formed trade union, as well as an increase of 5 percent tocompensate for a Job Evaluation exercise carried out by the USAID team.
5.49 Staffing. Quite clearly, SR is over-staffed with 1100 employees for a rail system of300 route kms, one train a day on the east/west sections of the line and two a day on theNorth/South sections, and very little maintenance of hired rolling stock. Staff should bereduced by as much as 30-40 percent according to railway management but the Government isreluctant to consider staff redundancies, particularly given the political strength of the railwayunion. A hiring freeze has only had a limited impact because of the relatively young workforce: consequently, total staff have only decreased from a high of 1200 in FY1987 to 1100 inFY1990. Wages and salaries account for about 25 percent of total working expenses, but theinclusion of benefits, such as housing, are thought to increase the cost of labor by at leastanother 50 percent.
5.50 Maintenance. Despite the abundance of labor, preventive routine maintenance of thetrack has been neglected and has obviously declined from 1986 when the last World Bankrailway mission was in Swaziland. No doubt SR's financial crisis has had a negative impacton the availability of resources for maintenance, but poor management and low morale of thework force is more likely to have been the reason for such a marked deterioration inmaintenance standards. The two sections of the east/west line, Matsapha-Phuzumoya andMpaka-Siweni, are now in poor condition, in large part due to lack of preventive maintenancebut also because of the age of the track (laid down in 1964); SR plans to rehabilitate the trackover the next few years.
5.51 Accidents. Of considerable concern to the railway is SR's high accident rate over thelast few years, mainly due to human error. There have been nine collisions or derailmentssince 1988, mostly involving Spoornet locomotives and wagons, at an estimated cost ofE20.75 million. Such high expenditures for compensating Spoornet cannot be sustained andSpoornet have expressed concern over the high accident rate. An improved signalling systemis now being introduced to reduce accidents, but it will only have a limited impact if theperformance of train crews and signalling staff cannot be improved. At present, it takes aserious accident before disciplinary measures can be taken for safety violations and then onlyafter a lengthy appeals process. During the last three years, six drivers have been firedbecause they were responsible for major accidents.
5.52 Following concern over the performance of SR there was a complete overhaul ofmanagement in 1989 and the Government appointed a USAID technical assistance team toassist with the management of the railway. The cost of the project is US$4.4 million. Theteam comprises a Chief Executive Officer, Director of Finance, and three advisors. Variousstudies have been carried out to improve the organization, including asset revaluation and acost allocation system that will allow SR to implement a cost based tariff system. However,progress with implementing a cost allocation system is slow and some basic operatingstatistics are still not available. Maintenance on those sections of the track that requirerehabilitation is still inadequate and in general there appears to have been very limitedprogress with improving productivity.
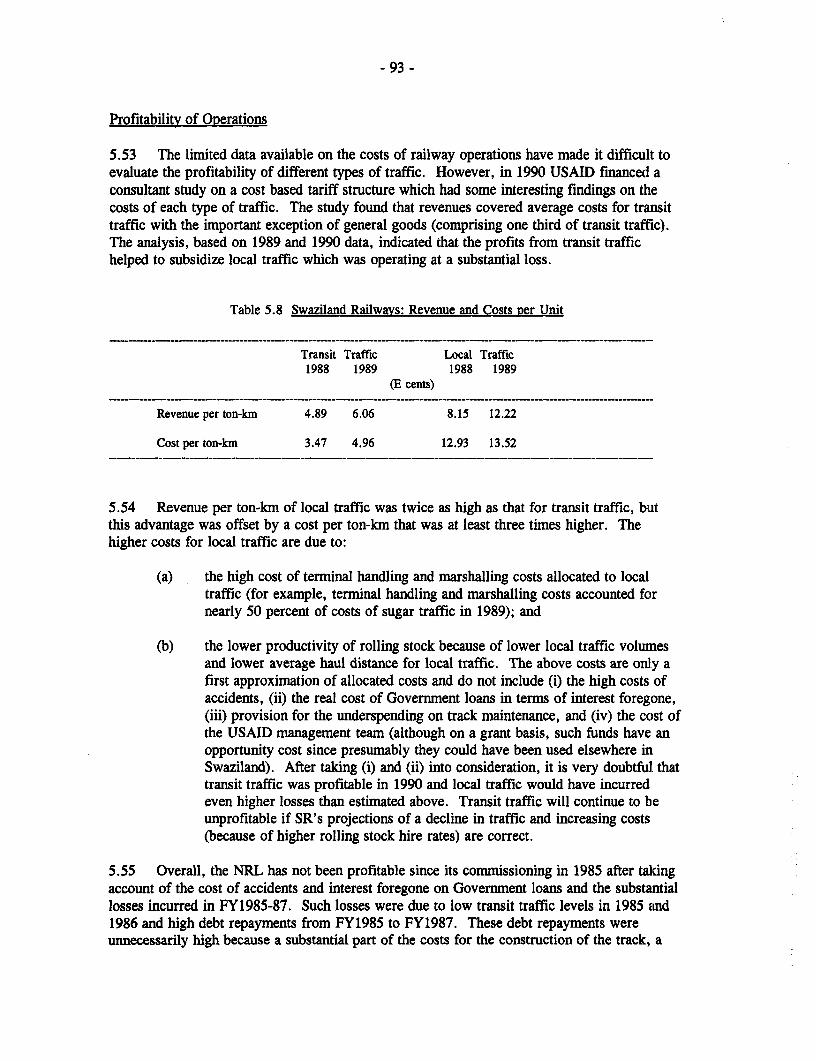
- 93 -
Profitability of Operations
5.53 The limited data available on the costs of railway operations have made it difficult toevaluate the profitability of different types of traffic. However, in 1990 USAID financed aconsultant study on a cost based tariff structure which had some interesting findings on thecosts of each type of traffic. The study found that revenues covered average costs for tramsittraffic with the important exception of general goods (comprising one third of transit traffic).The analysis, based on 1989 and 1990 data, indicated that the profits from transit traffichelped to subsidize local traffic which was operating at a substantial loss.
Table 5.8 Swaziland Railways: Revenue and Costs Rer Unit
Transit Traffic Local Traffic1988 1989 1988 1989
(E cents)
Revenue per ton-km 4.89 6.06 8.15 12.22
Cost per ton-km 3.47 4.96 i2.93 13.52
5.54 Revenue per ton-km of local traffic was twice as high as that for transit traffic, butthis advantage was offset by a cost per ton-km that was at least three times higher. Thehigher costs for local traffic are due to:
(a) the high cost of terminal handling and marshalling costs allocated to localtraffic (for example, terminal handling and marshalling costs accounted fcrnearly 50 percent of costs of sugar traffic in 1989); and
(b) the lower productivity of rolling stock because of lower local traffic volurnesand lower average haul distance for local traffic. The above costs are only afirst approximation of allocated costs and do not include (i) the high costs ofaccidents, (ii) the real cost of Government loans in terms of interest foregone,(iii) provision for the underspending on track maintenance, and (iv) the cost ofthe USAID management tearn (although on a grant basis, such funds have anopportunity cost since presumably they could have been used elsewhere irnSwaziland). After taking (i) and (ii) into consideration, it is very doubtful thattransit traffic was profitable in 1990 and local traffic would have incurredeven higher losses than estimated above. Transit traffic will continue to beunprofitable if SR's projections of a decline in traffic and increasing costs(because of higher rolling stock hire rates) are correct.
5.55 Overall, the NRL has not been profitable since its conmmissioning in 1985 after takingaccount of the cost of accidents and interest foregone on Govermnent loans and the substantiallosses incurred in FY1985-87. Such losses were due to low transit traffic levels in 1985 and1986 and high debt repayments from FY1985 to FY1987. These debt repayments wereunnecessarily high because a substantial part of the costs for the construction of the track, a
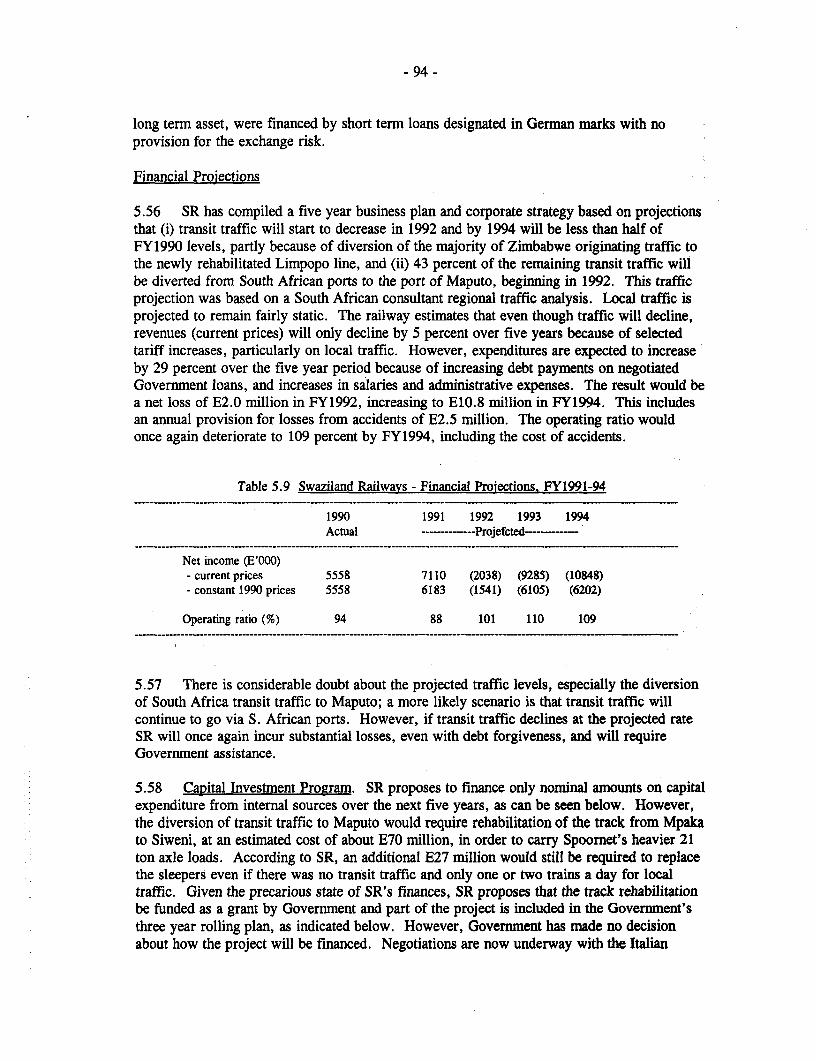
- 94 -
long term asset, were financed by short term loans designated in German marks with noprovision for the exchange risk.
Financial Projections
5.56 SR has compiled a five year business plan and corporate strategy based on projectionsthat (i) transit traffic will start to decrease in 1992 and by 1994 will be less than half ofFY1990 levels, partly because of diversion of the majority of Zimbabwe originating traffic tothe newly rehabilitated Limpopo line, and (ii) 43 percent of the remaining transit traffic willbe diverted from South African ports to the port of Maputo, beginning in 1992. This trafficprojection was based on a South African consultant regional traffic analysis. Local traffic isprojected to remain fairly static. The railway estimates that even though traffic will decline,revenues (current prices) will only decline by 5 percent over five years because of selectedtariff increases, particularly on local traffic. However, expenditures are expected to increaseby 29 percent over the five year period because of increasing debt payments on negotiatedGovernment loans, and increases in salaries and administrative expenses. The result would bea net loss of E2.0 million in FY1992, increasing to E10.8 million in FY1994. This includesan annual provision for losses from accidents of E2.5 million. The operating ratio wouldonce again deteriorate to 109 percent by FY1994, including the cost of accidents.
Table 5.9 Swaziland Railways - Financial Proiections. FY1991-94
1990 1991 1992 1993 1994Actual --------- Projefcted---
Net income (E'000)- current prices 5558 7110 (2038) (9285) (10848)- constant 1990 prices 5558 6183 (1541) (6105) (6202)
Operating ratio (%) 94 88 101 110 109
5.57 There is considerable doubt about the projected traffic levels, especially the diversionof South Africa transit traffic to Maputo; a more likely scenario is that transit traffic willcontinue to go via S. African ports. However, if transit traffic declines at the projected rateSR will once again incur substantial losses, even with debt forgiveness, and will requireGovermnent assistance.
5.58 Capital Investment Progra . SR proposes to finance only nominal amounts on capitalexpenditure from internal sources over the next five years, as can be seen below. However,the diversion of transit traffic to Maputo would require rehabilitation of the track from Mpakato Siweni, at an estimated cost of about E70 million, in order to carry Spoomet's heavier 21ton axle loads. According to SR, an additional E27 million would still be required to replacethe sleepers even if there was no transit traffic and only one or two trains a day for localtraffic. Given the precarious state of SR's finances, SR proposes that the track rehabilitationbe funded as a grant by Government and part of the project is included in the Govermnent'sthree year rolling plan, as indicated below. However, Govermment has made no decisionabout how the project will be financed. Negotiations are now underway with the Italian
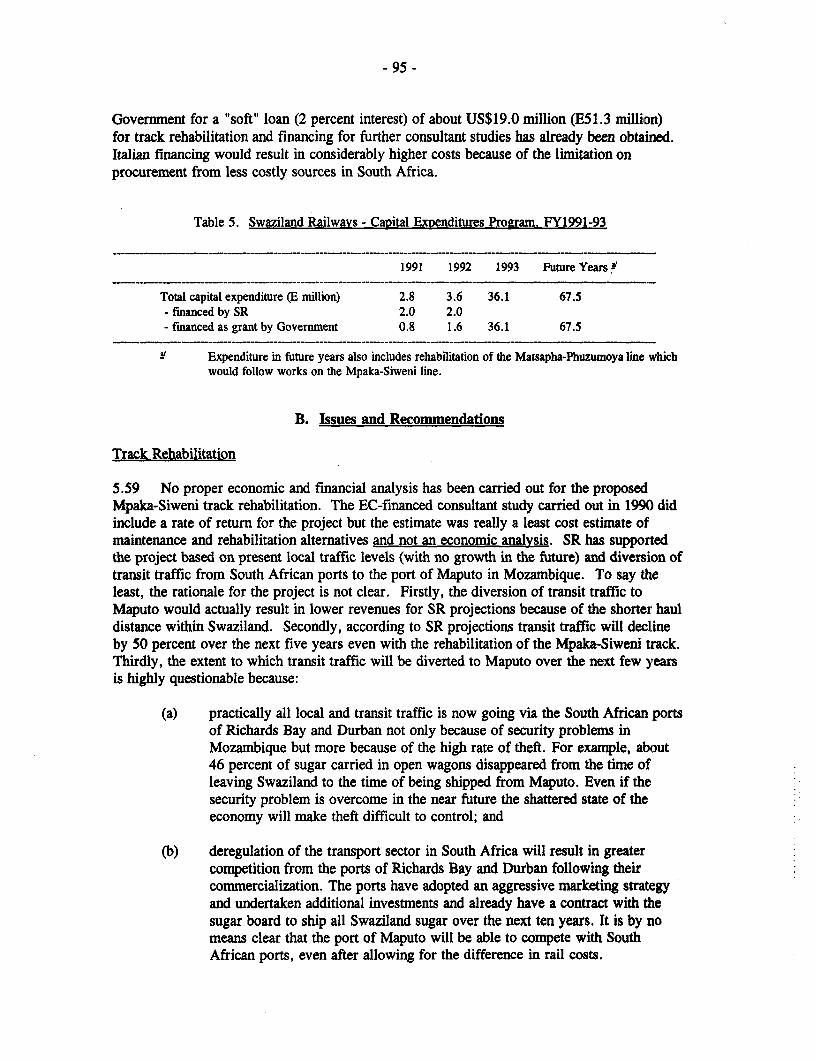
- 95 -
Government for a "soft" loan (2 percent interest) of about US$19.0 million (E51.3 million)for track rehabilitation and financing for further consultant studies has already been obtained.Italian financing would result in considerably higher costs because of the limnitation onprocurement from less costly sources in South Africa.
Table 5. Swaziland Railways - Capital Expenditures Program. FY1991-93
1991 1992 1993 Future Years i
Total capital expenditure (E million) 2.8 3.6 36.1 67.5- financed by SR 2.0 2.0- financed as grant by Government 0.8 1.6 36.1 67.5
Expenditure in future years also includes rehabilitation of the Matsapha-Phuzumoya line whichwould follow works on the Mpaka-Siweni line.
B. Issues and Recommendations
Track Rehabilitation
5.59 No proper economic and financial analysis has been carried out for the proposedMpaka-Siweni track rehabilitation. The EC-financed consultant study carried out in 199() didinclude a rate of return for the project but the estimate was really a least cost estimate ofmaintenance and rehabilitation alternatives and not an economic analysis. SR has supportedthe project based on present local traffic levels (with no growth in the future) and diversion oftransit traffic from South African ports to the port of Maputo in Mozambique. To say theleast, the rationale for the project is not clear. Firstly, the diversion of transit traffic toMaputo would actually result in lower revenues for SR projections because of the shorter hauldistance within Swaziland. Secondly, according to SR projections transit traffic will declineby 50 percent over the next five years even with the rehabilitation of the Mpaka-Siweni track.Thirdly, the extent to which transit traffic will be diverted to Maputo over the next few yearsis highly questionable because:
(a) practically all local and transit traffic is now going via the South African portsof Richards Bay and Durban not only because of security problems inMozambique but more because of the high rate of theft. For example, about46 percent of sugar carried in open wagons disappeared from the time ofleaving Swaziland to the time of being shipped from Maputo. Even if thesecurity problem is overcome in the near future the shattered state of theeconomy will make theft difficult to control; and
(b) deregulation of the transport sector in South Africa will result in greatercompetition from the ports of Richards Bay and Durban following theircommercialization. The ports have adopted an aggressive marketing strategyand undertaken additional investments and already have a contract with thesugar board to ship all Swaziland sugar over the next ten years. It is by nomeans clear that the port of Maputo will be able to compete with SouthAfrican ports, even after allowing for the difference in rail costs.
- 96 -
5.60 Under such circumstances, a policy of retrenchment might appear more rational.Since SR is under pressure to keep open the traditional route to Maputo for local traffic, theleast cost alternative would be either to continue intensive maintenance and maintain speedrestrictions or, at most, to replace all the sleepers but only replace the rails when necessarywith track from the now unused Kadake-Matsapha line. In the case of the Matsapha-Phuzumoya line which also needs rehabilitating over the next five years, economic returnsare also likely to be unattractive given low traffic levels.
5.61 It is strongly recommended that rehabilitation of the track from Mpaka to Siweni bedelayed until a proper economic and financial analysis has been carried out to demonstrate toGovernment the non-viability of a project designed to serve transit traffic. The project asnow designed (including re-railing as well as re-sleepering) should only proceed if Spoornet iswilling to finance it. In the event that transit traffic would not use the line but theGovernment would still wish to keep the line open for local traffic (involving one or twotrains a day), an engineering analysis should be carried out to determine how to rehabilitatethe track at minimum cost.
Role of Railway
5.62 No comprehensive analysis of the role of the railways has been made in recent yearsand Government has proceeded with southern and northern rail extensions of doubtfuleconomic viability, although in both cases the Government was under some regional pressure.A short study was carried out under the USAID project in 1989 on the economic and financialviability of the railway, but it was somewhat limited because of lack of time to adequatelyestimate road user costs and was based on the assumption that transit traffic would grow at 5percent per annum with FY1988 as the base year. However, transit traffic has actuallydeclined quite sharply.
5.63 Government appears to have accepted SR's plan for continuation of the railway andsubstantial investment in track rehabilitation without considering alternative strategies,including:
(i) closure of the railways and transportation of all goods byroad;
(ii) closure of the railways, diverting local traffic to road transportbut leasing the use of the North/South line to Spoornet;
(iii) continuation of local rail operations but leasing the use of theNorth/South line to Spoornet;
(iv) continue local and transit traffic operations but undertaking nofurther investments unless financed by Spoornet.
5.64 Government should be aware of the costs and benefits of each of the above options,based on different traffic scenarios, when determining its strategy for the railways. Even ifthere is no intention of closing the railways, Government needs to have a clear understandingof the economic and financial costs of continuing rail operations and any further investments.
5.65 The ADB is proposing to include a transport planning study in their next highwayloan. This would be an excellent opportunity to undertake an objective review of the costs of
- 97 -
rail operations, both financial and economic29. However, such a study would not start until1993 at the earliest.
5.66 Another alternative would be for the USAID project to finance the study and the CEOof SR indicated that this might be a possibility and expressed his support for the idea. Anintegral part of the analysis should include an assessment of the impact of deregulation of thetransport sector in South Africa and the extent to which road transport competition coulddivert both transit and local traffic from the railways. Ideally, the study should also includeeither a simple study of road user charges or base some estimates on a road user charge studycarried out in a similar country so as to obtain a more accurate estimate of the costs oftransporting goods by road.
Capital Restructuring of SR
5.67 SR has requested debt forgiveness on all its Government loans, arguing that it willnever be possible to repay them based on current projections of financial losses (evenassuming a large portion of transit traffic is shipped through Maputo). SR may only justbreak even at present traffic levels if transit traffic continues to be shipped through ports inSouth Africa, but any further declines in traffic will result in financial losses. Capitalrestructuring is obviously required and it would really make little difference whether loans areforgiven or turned into equity contributions given that it is highly unlikely that there wouldever be any return on the equity. On the other hand, there is a case for retaining the NRLloans in the event that transit traffic does not decline to the extent projected so as to be able tomonitor the "profitability" of the NRL and instill some sense of financial discipline.However, the past practice of Government giving dispensation for debt repayments wheneverSR had financial problems is hardly conducive to developing such a sense of discipline. Inthe case of the loan from South Africa for construction of the NRL, SR should support itscase for cancellation of the loan by preparing a detailed breakdown of the costs and revenuesof the NRL since its commissioning and projections of future earnings. Government shouldresolve the issue of capital restructuring for SR in the context of the future role of therailway and any future investments to be made in the railway.
Efficiency of Operations
5.68 Based on present projections, SR will be unable to cover the cost of future operations.Therefore, every effort must be made to introduce cost cutting measures unless Government isprepared to fund losses of this nature for an indefinite period of time (based on SR's firLancialprojections). Such measures would include manpower re-deployment and control, outpult-linked remuneration, particularly for train crews, and reduction of overheads and expenses notdirectly related to operations. If Government will not approve the reduction of SR's workforce, the cost of carrying excess staff should be reflected in the accounts of SR so as to havea clearer understanding of the impact of excess staffing on the costs of operations for differenttypes of traffic. A complete review of administrative costs is necessary to identify wherecost-cutting measures can be implemented and particular attention needs to be given to: (i)
2' The ADB engineer responsible for transport has expressed his agreement to include such ananalysis to the terms of reference of the study.
- 98 -
the large number of vehicles owned by the railway and their high cost of operation (El .3million in FY1990), (ii) allowances (nearly 25 percent of salaries), and (iii) gratuities.
- 99 -
3. ROYAL SWAZI NATIONAL AIRWAYS
Introduction
5.69 Royal Swaziland National Airways (ZC) began operations in 1978. It was establishedas a private company, 50% owned by Government and 50% by Tiboyo Ltd (Swazi Nation).The airline has one regional jet, a Fokker F28 with 65 seat capacity, and provides a regionalservice, including flights to Johannesburg, Maputo, Harare, Lusaka, Dar-es-Salaam, andNairobi. Basic statistics for FY1990 are given below.
Number of passengers 57,558Passenger-km 46.97 millionFreight ton-kmn 235,000Block hours 2,250Load factor 59.9%
5.70 ZC suffers from all the problems of a small airline plus a few others, including:
(a) lack of scale economies: total staff are 176 and although there is probablysome room for reducing staff ZC is quite close to the minimum required tooperate an airline;
(b) excess capacity even with one aeroplane: ZC was gradually overcoming thisproblem until the recent downturn in traffic;
(c) ownership of a plane that is not suitable for most of the routes served by theairline - a turbo prop would have been more economic, but ZC had little to dowith the original choice of aircraft;
(d) ownership of a plane which is the only one of its kind in the region pushingup the cost of maintenance;
(e) inability to expand into night-time operations because of an apparentreluctance on the part of passengers to fly at night; and
(f) increasing competition from other airlines.
5.71 Over the past three years, ZC has managed to double the number of passengers from28,913 in FY1987 to 57,558 in FY1990 and has been quite effective at expanding itsoperations by going into joint ventures with LAM (Mozambique Airways) and ZambiaAirways. However, there will be a marked drop in traffic in 1991, particularly on theJohannesburg-Manzini route, largely due to the reduction in traffic originating from SouthAfrica due to the econonmic recession. The airline is quite well managed but depends onexpatriate staff: the expatriate Managing Director has been in an acting capacity for severalyears and there does not appear to be an obvious local successor.
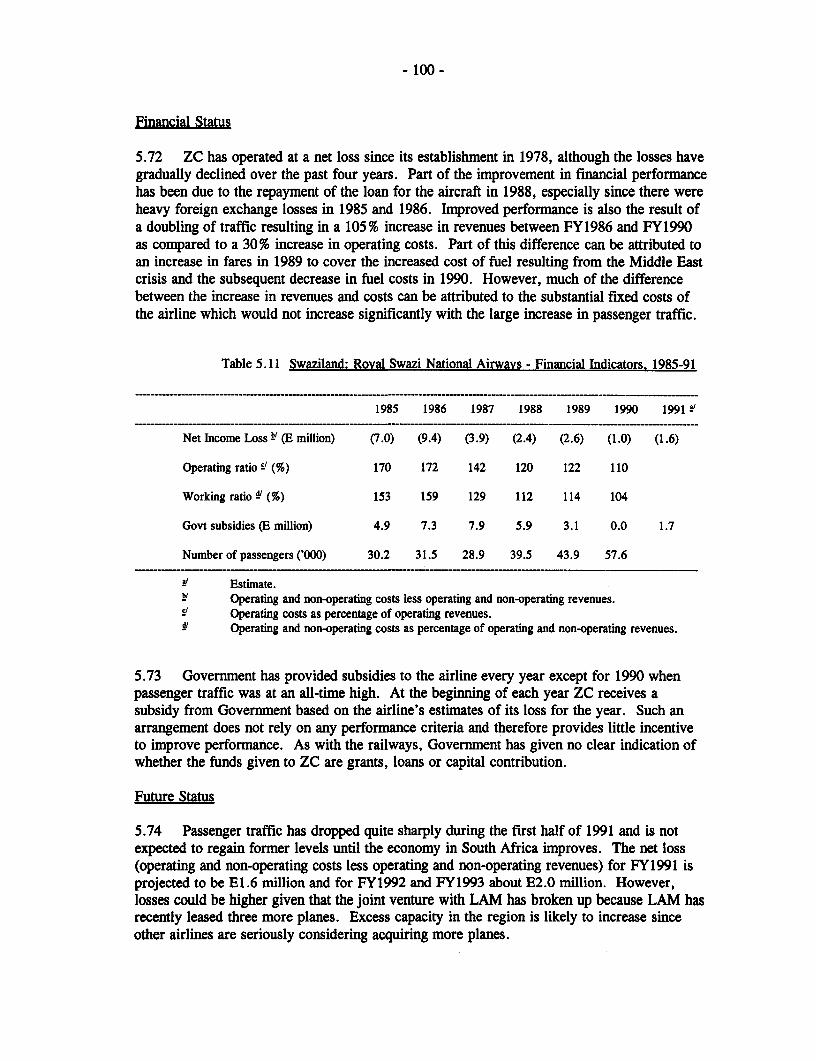
- 100-
Financial Status
5.72 ZC has operated at a net loss since its establishment in 1978, although the losses havegradually declined over the past four years. Part of the improvement in financial performancehas been due to the repayment of the loan for the aircraft in 1988, especially since there wereheavy foreign exchange losses in 1985 and 1986. Improved performance is also the result ofa doubling of traffic resulting in a 105% increase in revenues between FY 1986 and FY1990as compared to a 30% increase in operating costs. Part of this difference can be attributed toan increase in fares in 1989 to cover the increased cost of fuel resulting from the Middle Eastcrisis and the subsequent decrease in fuel costs in 1990. However, much of the differencebetween the increase in revenues and costs can be attributed to the substantial fixed costs ofthe airline which would not increase significantly with the large increase in passenger traffic.
Table 5.11 Swaziland: Royal Swazi National Airways - Financial Indicators. 1985-91
1985 1986 1987 1988 1989 1990 1991 a
Net Income Loss 9' (E million) (7.0) (9.4) (3.9) (2.4) (2.6) (1.0) (1.6)
Operating ratio V (%) 170 172 142 120 122 110
Working ratio 4'(%) 153 159 129 112 114 104
Govt subsidies (E million) 4.9 7.3 7.9 5.9 3.1 0.0 1.7
Number of passengers ('000) 30.2 31.5 28.9 39.5 43.9 57.6
i' Estimate.Operating and non-operating costs less operating and non-operating revenues.Operating costs as percentage of operating revenues.Operating and non-operating costs as percentage of operating and non-operating revenues.
5.73 Government has provided subsidies to the airline every year except for 1990 whenpassenger traffic was at an all-time high. At the beginning of each year ZC receives asubsidy from Government based on the airline's estimates of its loss for the year. Such anarrangement does not rely on any performance criteria and therefore provides little incentiveto improve performance. As with the railways, Government has given no clear indication ofwhether the funds given to ZC are grants, loans or capital contribution.
Future Status
5.74 Passenger traffic has dropped quite sharply during the first half of 1991 and is notexpected to regain former levels until the economy in South Africa improves. The net loss(operating and non-operating costs less operating and non-operating revenues) for FY1991 isprojected to be E1.6 million and for FY1992 and FY1993 about E2.0 million. However,losses could be higher given that the joint venture with LAM has broken up because LAM hasrecently leased three more planes. Excess capacity in the region is likely to increase sinceother airlines are seriously considering acquiring more planes.
- 101 -
5.75 The pros and cons of different strategies for ZC and other airlines have been verywell covered in the SADCC Airline Industry Study (1991). It is quite clear that the ornyfinancially and economically viable option for ZC is to enter into a joint use agreement withother airlines, such as Air Botswana and Lesotho Airways. This would involve flying as oneairline on integrated routes. Unfortunately, it is extremely unlikely that such a venture willtake place because of the desire to retain a national airline. However, if there is not asignificant increase in traffic, Government must be willing to pay an annual E2 million forthis privilege. ZC's strategy is to continue seeking joint venture agreements with otherairlines in the region, although it recognizes that most such agreements are short-lived andwill therefore entail frequent switching from one airline to another. For example, in the eventthat the joint venture with LAM falls through, ZC will pursue the possibility of an agreementwith Air Malawi.
5.76 ZC plans to continue operations with the one plane over the next few years and nocapital expenditures are envisaged over the rolling plan period, although there have beenmany discussions in Parliament and in the press about "the need" for a second plane. Asecond plane would not be economically or financially justified under any circumstances overthe next few years and Government should therefore resist any suggestions to purchaseanother plane.
Civil Aviation
Matsapha Airport Development - Phase II
5.77 In 1989, consultants prepared an update of the 1981 Airport Development Master Planand recommended that the airport be improved to international standards by constructing anew terminal, a new VIP building, cargo building, apron and two taxiways, additionalparking facilities and 110 houses for airport staff. The total cost was estimated at E46 million(1990 prices). The economic analysis showed a negative economic rate of return based onprojected traffic to the year 2010. However, there is considerable pressure from politiciansand others to improve the airport, therefore further studies have been included in the rollingplan to examine how the improvements can be more cost-effective. France has expressedinterest in financing these studies and possible expansion of the airport. No construction willbegin in the rolling plan period and the earliest date would be 1994.
5.78 The present airport has reached its capacity of 80,000 passengers and will certainlyrequire some expansion over the next few years. Clearly, the economic analysis indicates thatthe expansion should be phased but has not considered all options, especially given theuncertainties over future traffic levels, much of which is dependant on what happens in SouthAfrica and resulting impact on the Swaziland economy.
Operation of the Airport
5.79 The management of ZC expressed concern over the operation of Matsapha Airportand evidently one of the small South African airlines, Comair, has registered severalcomplaints about safety issues. There have been problems with training of personnel tooperate the navigation and other aids as well as problems with the equipment itself. Most of
- 102 -
the equipment comes from France and needs replacing or has broken down and has not beenrepaired because of the unavailability of spare parts.
5.80 Fire appliances and certain essential items of electronic and mechanical equipment,such as voice logging equipment, are now in the process of being replaced at MatsaphaAirport. ADB has included substantial assistance for civil aviation under its proposedTransport Institution Support Project, including financing of a flight safety inspector (threeyears) and air traffic services expert (one year), consultant services for air transporteconomics, airline management, aviation security, and air legislation, and training for 39 civilaviation personnel. Unfortunately, it will be at least two years before any technical assistanceor consultants can start working on the project, given the time for ADB to process the loanand time to recruit/award contracts for the necessary personnel.
- 103 -
VI. SWAZILAND ELECTRICITY BOARD (SEB)
Introduction
6.1 The Swaziland Electricity Board (SEB) is a public sector corporation established underthe Electricity Act 1963. Under the act, it has a monopoly for the transmission, generationand distribution of electricity within Swaziland, though it may grant licenses to other entitiesto generate electricity for their own use. The Act makes provision for all aspects of theBoard's performance including (i) setting up tariffs and other charges so that revenues exceedoutgoings; (ii) developing, extending and reducing the costs of electricity supplies; (iii)providing electricity to any customer within 100 yards of its lines. The Board is expected toperform on a commercially viable basis and in the public interest.
6.2 The SEB is controlled by a Board consisting of three to five members appointecl bythe Ministry of Natural Resources. The Board is required to consult and get approval by theMinister for any reorganization and major development for the sector. In the absence ol anational energy policy and limited technical expertise at the ministry, the SEB has effectivelyoperated on its own. However, with the creation of the PEU, at the MOF, the institutionallinks between SEB and Government have been made more formal.
6.3 SEB is the largest parastatal in terms of employment--550 staff and E71.9 millionturnover in 1991. Of the 552.8 GWh generated in 1991, 70.5 percent was imported fromSouth Africa and the remainder was generated by SEB power plants (mainly hydro-based).imported capacity is derived from the South African Electricity Commnission (ESKOM),through the operation of two links and recently a third line coming from the South West sideof Swaziland, which has increased capacity by 36MW. Domestic capacity is hydro-based,although there is small proportion of diesel generated power.
6.4 SEB's financial situation continues to be strained despite improvements in recentyears. Operating losses, excluding extraordinary items, were turned into small surpluses in1990 and 1991, but is still in need of major restructuring. A management contract has beensigned under the supervision of the PEU, which entails management restructuring, change inthe tariff structure and the elaboration of an energy master plan.
A. ORerating Regime
Operating Costs
6.5 The principal costs which face SEB are the purchases of electricity from ESKOM andthe operating and maintenance costs of their own generators. The operating and maintenancecosts of the hydro-station costs are not heavily dependent on actual units generated and theymay be viewed as a fixed annual charge, thus the operating regime is designed to minirmizethe variable costs.
6.6 The cheapest energy is from SEB's own hydro, then comes the ESKOM energy units,and finally, the fuel costs of SEB's diesel. In addition, ESKOM levy a maximum demand
-104-
charge which is geared to the maximum demand (MD) in any of the months June, July andAugust.
6.7 The principle behind operations, therefore, is to use hydro to its maximum potential,both as far as units (kWh) are concerned and in time of use, so the maximum demand onESKOM is minimized, and once a high MD charge has been incurred to take account of thefact. Diesel generation is used only to cut the peak demand on ESKOM over short periods.
6.8 The main feature of Swaziland's hydro stations is that flow past Edwaleni andMagaduza is controlled (beyond a minimum compensation flow) by the releases upstreamthrough Ezulwini. Ezulwini is the only station with significant storage.
6.9 The natural re-regulation of the river bed means that releases from Ezulwini are seenmany hours later and the variations much attenuated at the downstream stations. Edwaleniand Magaduza therefore are run-of-river stations at which only small variations in output canbe designated. This leaves Ezulwini with the major peak lopping duty.
6.10 With regards the status of the technical assets involved in the generation, transmissionand distribution of electricity, the impression gained is that the assets have been well lookedafter; the high availability, for example, of the generating plant, is evidence of goodmaintenance. It has not been possible to assess whether the large number of lightning strikeson the transmission lines is having a deleterious effect on the useful lives of transformers.Certainly the switches have more protective duties to perform than on similar plant elsewhere.
Losses
6.11 In the period 1982 to 1988 the differences between units sold and the sum of unitsgenerated and purchased increased from 9.3 percent to 12.3 percent. In the year to endMarch 1991, the ratio had been reduced to 10.1 percent. A small amount, some 900,000Kwh/year (0.5 percent of generation) is consumed within the power stations themselves sothat the losses between the units sent out and units sold has fallen to 9.9 percent. There is notmuch prospect of making worthwhile reductions in the work units.
6.12 Improvements can, however, be made in the distribution system. But first, it isnecessary to investigate in which area of the system the losses are being incurred. To thisend, SEB is purchasing (via the Danish grant) new meters which incorporate 'memory'features. These will be installed initially to record power flows at the main substations. It isthe intention that the meters will be repositioned at intervals so that the heavily loaded (hencehigh loss) lines can be tracked down.
6.13 A contributory cause to losses on particular lines may be the power factor of the loadbeing supplied. The meters will record power factor and thus allow poor power factor powerflows to be identified. The power tariff is also designed to penalize consumers with lowpower factors. Consumers presenting low power factors can then be encouraged to installpower factor correction equipment.
- 105 -
Sales and Tariff Structure
6.14 Total sales by SEB increased by 11 percent in FY1990 to 494GWh. Imports fromESKOM have increased notably in the last two years because low river flows have affec teddomestic hydro capacity generation quite dramatically. Domestic generation was only163GWh in FY1990 compared to 198.7GWh the previous year. This situation has beenfurther exacerbated by the drought and domestic generation is expected to be negligible inFY1991.
6.15 SEB has generally revised tariffs in line with costs. Charges discriminate in favor ofdomestic consumers, followed by industrial and commercial consumers. In the past, tariffincreases were equal to all categories, and in the 1988-90 period were lower than thoseimposed by ESKOM. Electricity charges were raised by 12.8 percent in January 1991-- 8percent for domestic and 14 percent for commercial and industrial use-- following an 8percent tariff increase by ESKOM.
6.16 Currently, the tariff structure is being reviewed by external consultants, and aproposal will be submitted to Parliament. In the short term, the main concern is to redujcecross-subsidies between commercial and domestic consumers, and to apply adjustmentsconsistent with an improvement in SEB's net income position in the future, e.g., cover debtservice obligations. Tariff policy, however, should incorporate the cost of future investments,and therefore should be based on long-run marginal costs (LRMC).
Net Income
6.17 Since 1986, SEB has recorded a negative net income position, except for a smallsurplus in 1987, partly because tariff adjustments have not been sufficient to cover fully itsoperating costs, including the increasing the debt service burden arising from the depreciationof the Lilangeni. Debt service obligations increased from E2.3 million in 1985 to E18.9million in 1990, mostly on account of a foreign exchange loss realized on full repayment oftwo World Bank loans- equivalent to US$ 16.5 million- contracted to finance the constructionof the Luphohlo hydropower station. The loans were prepaid by the Government on behalf ofSEB and converted it into equity. As a result of this operation SEB has reduced interestpayments by E1.8 million a year.
6.18 The drought, currently affecting the region will have a negative impact. SEB cannotgenerate its own electricity because of inadequate water supply in the dam and theconsumption in the agricultural sector has increased because of the need of greater irrigation,particularly for sugar. Although adequate supply can be maintained by purchasing powerfrom ESKOM which has capacity surplus, expenditures will increase directly in proportion ofthe electricity purchases as the costs of the domestic generators are a fixed charge. This willeffectively increase expenditures and consequently reduce net income by an estimated E14.5million (18OGWhx8. 1) for the year ending in March 1992.
6.19 SEB's outstanding debt amounted to E77. 6 million at end March 1991, 'excludingunrealized foreign exchange losses of E35.9 million, on foreign currency loans. While thecompany has been recording realized foreign exchange losses against revenue, the unrealizedlosses are only indicated on the accounts but are not actually included in the balance sheet. If
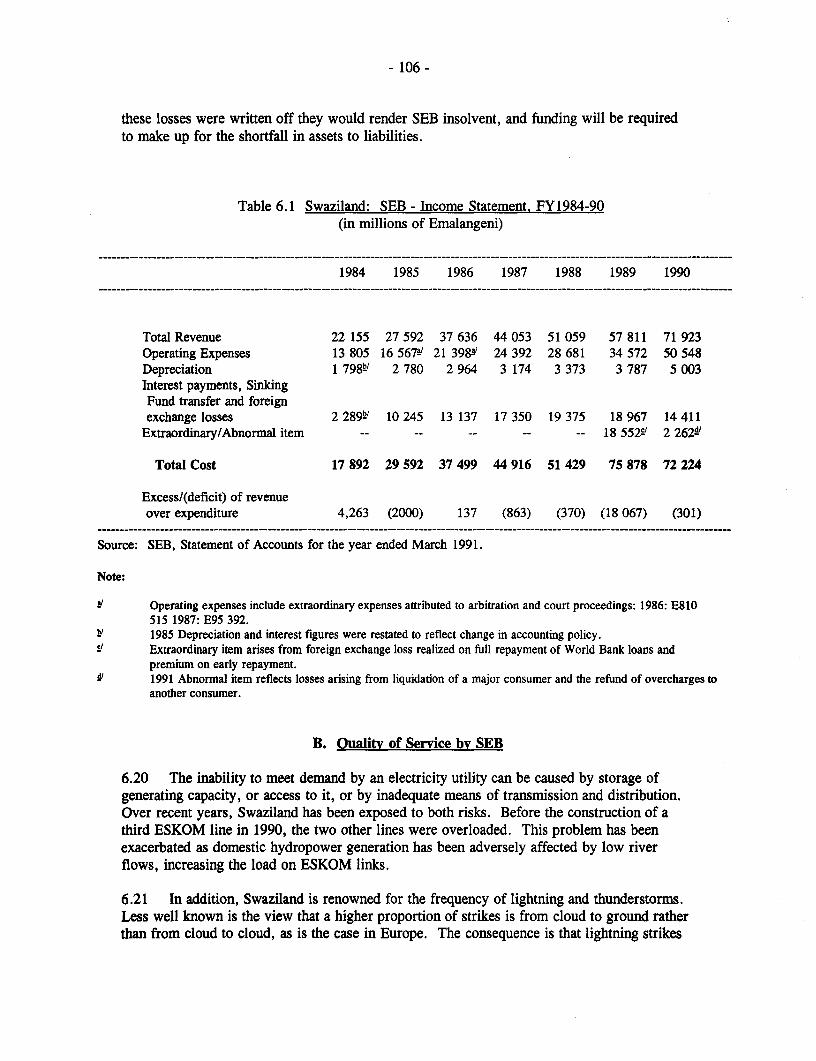
- 106 -
these losses were written off they would render SEB insolvent, and funding will be requiredto make up for the shortfall in assets to liabilities.
Table 6.1 Swaziland: SEB - Income Statement. FY1984-90(in millions of Emalangeni)
1984 1985 1986 1987 1988 1989 1990
Total Revenue 22 155 27 592 37 636 44 053 51 059 57 811 71 923Operating Expenses 13 805 16 567!) 21 398a} 24 392 28 681 34 572 50 548Depreciation 1 798k/ 2 780 2 964 3 174 3 373 3 787 5 003Interest payments, SinkingFund transfer and foreignexchange losses 2 289t/ 10 245 13 137 17 350 19 375 18 967 14 411Extraordinary/Abnormal item -- -- -- -- -- 18 552V. 2 262d!
Total Cost 17 892 29 592 37 499 44 916 51 429 75 878 72 224
Excess/(deficit) of revenueover expenditure 4,263 (2000) 137 (863) (370) (18 067) (301)
Source: SEB, Statement of Accounts for the year ended March 1991.
Note:
i' Operating expenses include extraordinary expenses attributed to arbitration and court proceedings: 1986: E810515 1987: E95 392.
ki 1985 Depreciation and interest figures were restated to reflect change in accounting policy.SY Extraordinary item arises from foreign exchange loss realized on full repayment of World Bank loans and
premium on early repayment.iF 1991 Abnormal item reflects losses arising from liquidation of a major consumer and the refund of overcharges to
another consumer.
B. Oualitv of Service by SEB
6.20 The inability to meet demand by an electricity utility can be caused by storage ofgenerating capacity, or access to it, or by inadequate means of transmission and distribution.Over recent years, Swaziland has been exposed to both risks. Before the construction of athird ESKOM line in 1990, the two other lines were overloaded. This problem has beenexacerbated as domestic hydropower generation has been adversely affected by low riverflows, increasing the load on ESKOM links.
6.21 In addition, Swaziland is renowned for the frequency of lightning and thunderstorms.Less well known is the view that a higher proportion of strikes is from cloud to ground ratherthan from cloud to cloud, as is the case in Europe. The consequence is that lightning strikes

- 107 -
transmission lines with rather a high frequency''. No records are made by SEB of the actualnumber of occasions lines are struck by lightning, nor of subsequent loss of supply toconsumers.
Consumers' Response
6.22 It is clear that consumers experience frequent interruptions to their electricity supply.It seems that an interruption to supply once a week does not exaggerate the problem. Theinterruptions are not necessarily long and people know that the frequency is to some degreedependent on the number of lightning strikes experienced on the routes of the power lines.
6.23 In the case of a domestic consumer, the low voltage may cause motors to draw morecurrent and become overloaded. There is evidence that action has been taken to mitigate thisproblems generally by large companies, such as the sugar estates; where devices have beenfitted to a number of homes to protect their electrical appliances against low voltages.
6.24 Commercial consumers face additional risks. Computers can be badly affected, notonly in the sense that they can be physically damaged, but also in that records and programscan be destroyed. Shops can be caught trading without adequate lighting and thus be exposedto injury to customers and theft, their tills may be made unworkable and so on. In countrieswhere poor supply has become ingrained, it is common for traders to respond by buying theirown standby generators.
6.25 Hotels have already taken protective measures by installing standby diesel generators.Banks and business firms which have come to rely on computers have installed uninterruptiblepower supply (UPS) systems. These protect only small current users but reduce the risk ofdisruption and allow work to continue.
6.26 In the case of irrigation the timing of supply of water to the fields is not critical to thehour, and hence farmers are perhaps more relaxed than their industrial counterparts about theduration of outages. However, they may be at greater risk than others to voltage excursions,by reason of the remoteness of some of the estates.
6.27 The sugar estates, in particular frequently generate electricity themselves in the cuttingseason if not beyond, and hence have a measure of self-control of when and where to acceptprolonged interruptions. These private generators do not run in synchronization with thenational grid system; rather they take over the supply for part of the system and run itindependently. It is the economic benefits of self generation that has led to this position, notcurrently the inadequacy of the supply. Nevertheless, the need to improve reliability of SEBsystem calls for additional investment in the power sector in future years.
In a study of the phenomenon undertaken jointly with Eskom, instrunents were set up acrossthe RSA, with three sites in Swaziland. One, near Luphohlo Dam, recorded the highest rateof strikes of all, and the trials confirmed the view already held in Swaziland that theisokeraunic level (the number of lightening days per year) is one of the highest in the world.
- 108 -
6.28 In the industrial sector the problem is more serious. A number of large consumersare saying that the standard of supply is so poor that they are incurring financial losses.Those most at risk are continuous process industries where the knock-on effects of aninterruption can greatly exceed the immediate effect. But wherever a company is working tocapacity, interruptions will be costlyz'. Complaints cover two main classes of problem: firstis sudden loss of supply, which may last for a second or two or for several hours, withconsequential loss of production. Second is voltage variation outside the normally acceptablelimits; again it might be a surge passing in moments or a drift which lasts for several hours.The consequence in such cases is more likely to damage equipment. In extreme circumstancethe consumer himself is driven to disconnect the supply.
C. Capital Expenditures
6.29 In the 1985-89 period, SEB undertook limited major plant purchases and constructionof line reinforcements mainly because of cash shortages. However, following thecommissioning in 1990 of the third 132 kV circuit from ESKOM, the supply capacitynominally available to SEB includes a satisfactory margin against risk of outage. The mostpressing problems for SEB now are the improvement of the transmission and distributionsystems, in particular to the consumers on the Matsapa industrial estate.
6.30 Under measures financed by a Danish grant, new switchgear and automatic voltagecontrol system are being introduced into the substations at Matsapa, Mnkinkomo and Manzini.Protection equipment installed when the system was essentially radially based, and inadequatefor the present meshed network, is gradually being phased out so that disconnectionsconsequent on more remote faults will be reduced and voltage variations will be maintainedwithin close limits. Similar improvements at Kent Rock substation were completed in July1992.
6.31 In addition to the above mentioned substation improvements, benefits will be obtainedfrom the installation, now underway, of high voltage links between the four main substationswhich influence supplies to Matsapa. These links will not have consumers directly connectedto them. Thus, following a fault affecting consumers supplied from any one of thesesubstations, re-establishments of supply to that substation will be achieved more quickly andmore surely. The quality of supply should improve significantly once this program iscomplete. For it to be maintained, there will have to be adequate investment in spare partsand management of inventories.
6.32 The SEB does not do long term planning and therefore thus not have a detailed capitalinvestment program. Measures to remedy this are being made by the provision of the
In some cases, companies have recorded the failures systematically. It is likely that suchrecords are the best available. In one case a company suffered badly in 1988 and the recordswere presented to SEB. Substantive improvements in this case followed from the building ofthe 66kV between Ezulwini power station and the M2 station in Matsapa. In another case,the records made by a company from February 1990 to February 1991 reflect the conditionsfor many of the consumers in the Matsapa industrial area.
- 109 -
performance contract signed between Government and SEB. In the interim period, majorinvestments will include extension to Eskom line for power correction and a fourth line toHelehele for 1994.
6.33 In addition, the Maguga project involving the construction of another hydro-statiionunder the Komati River Basin irrigation project is also under consideration by Government.The project is being appraised by external consultants under the supervision of the WorldBanK. The hydro-power component would cost E41 million, over for years, and would add15MW in capacity. The benefits of the project, obtained by displacing energy imported fromSouth Africa, will be small by comparison with the irrigation benefits which is the maincomponent of the project. The total cost of the Komati River project is estimated atE547 million, at 1992 prices, with an economic rate of return of 11.6 percent- based onevaluation of direct costs and benefits.
6.34 Because of the size of the Komati project, careful analysis needs to be made on itheopportunity costs of allocating resources to this project in comparison with projects with ahigher rate of return. SEB should be brought on board in this evaluation, particularlyconsidering its tight financial position.
D. Managsement Systems
Organization and Staff Restructuring
6.35 The organizational structure, effective since 1987, has recently been revised, acting onadvice from ESKOM to rationalize lines of reporting and thus enable more effectivedelegation of duties. The previous structure had too many staff reporting to the chiefengineer and to the financial manager, which split the SEB into technical and finance divisionswith heavy emphasis on technical aspects.
6.36 The new structure has created an entire new department for internal audit, humanresources and business planning while in the technical division, there will be a sectionspecifically for marketing which will aim to improve public relations. Under this revisedstructure, authority can be delegated more effectively, as there will be fewer employeesreporting to each manager, and the sub-departments are more relevant to the functions of themanagers. Senior managers of each department, together with the chief executive, willcomprise a management committee.
6.37 There are fifteen new positions which need to be filled in the new structure. SEIB willbe recruiting externally as few potential candidates of the right caliber have been identifiedwithin the organization. It is essential that this be done as soon as possible so that themanagement team is strengthened as intended and that confusion in lines of reporting isdispelled. Of the new positions, the manning of the internal audit and human resourcesdepartments seem excessive with too many positions in the fourth tier of the hierarchy. Incontrast, provision must be made for additional staff in the systems management section foradequate control and utilization of the data processing function.
6.38 It had been intended that ESKOM provide two senior staff in the positions of co-chiefexecutive and deputy general manager - administration. These two did take up their posts,
- 110-
but have subsequently resigned. Official explanation is dissatisfaction with officeaccommodation and housing. Frustration with the inertia of the Board and inability to useauthority to rationalize the SEB are the more likely explanations. There was a similarresignation of the data processing manager in 1990.
6.39 Morale is very low due to poor organization structure with confused lines ofreporting, inadequate equipment and the general feeling that although senior managementlistens to suggestions, they are not involved in decision making processes, and that theirsuggestions are never acted upon. Lack of delegation and lethargy in management havecaused demotivation and frustration.
6.40 In view of the above, it is essential that the new structure be seen to be implementedby all staff to allay speculation in the lower grades as to the impact of the changes. Thisshould be one of the first tasks of the restructured human resources department.
6.41 A specific training division is to be created to ensure that a continuing trainingprogram is effected so that staff who show potential can be promoted to more senior positionsas they become vacant. This will increase morale with junior staff and strengthen the generalmanagement and ethos of SEB with a loyal, dedicated work force. Liwati Training Institute,based in Mbabane, has been contracted to undertake a major review of staff appraisal andevaluation procedures, job descriptions and salary structures. This should dispeldissatisfaction with the current, seemingly ad hoc, method of pay increases and promotions.
6.42 An extensive training program is needed in the finance and administration sections ofSEB, particularly in data processing and internal audit. Many staff have been studying forprofessional qualifications privately. Guidance and financial encouragement are neededofficially from SEB. Training in the technical areas has been part of a continuing programand appears adequate, but recognition must be given to new skills acquired.
6.43 In general, salaries at SEB are considered competitive. They are very much higherthan similar scales in Government and other parastatals. Staff apparently would like morefringe benefits such as vehicles and housing, but except for the senior managers, this isadministratively impractical, and provision of housing is not recommended.
6.44 Generally, personnel in the junior management and supervisory grades are interestedin their jobs. Specifically, stores personnel have received adequate training and experienceand are able to make cost saving recommendations; the billing staff are highly motivated bothin carrying out their jobs effectively and in public relations for the SEB as an organization;the general ledger accountant has a very good overall view of where improvements can bemade in the systems to improve control and information.
Purchasing and Stock Management
6.45 Since 1990, the purchasing and stock management functions have been divided intotwo departments which is illogical and causing unnecessary delays. The purchasing officerhas been reporting to the commercial engineer. The storekeeper reports to the generation andtransmission manager.
- 111 -
6.46 Systems are in place for procurement of supplies, either direct from suppliers or exstock. Stock and purchasing records are maintained both by stores and accounts departinent.Stores is manual and accounts is computerized. The stores records are in many areasduplicated by the order processing on the computer at Head Office. More effective use of thecomputerized purchasing system will obviate the duplication of records, and provide accurate,up to date reports on such management controls as overdue deliveries, low stock and slowmoving items. Stores items total less than 200, so the PC based system can easilyaccommodate additional requirements.
6.47 Inefficient delivery of supplies have been caused by (i) undue delay in sendingpurchase requisitions from Matsapa to head office due to lack of an interoffice deliveryschedule or vehicle; (ii) inadequate forward planning at construction sites to enable advanceordering of materials required; and (iii) obtaining three quotations for each purchase.
6.48 To solve these problems (i) SEB could use its fleet of vehicles to ensure regular inter-office delivery; (ii) the construction sites should not be ordering materials directly but fromthe drawings of the projects; (iii) excessive requests for tenders should be remedied by theadoption of a planned bulk tender process for commonly used stores items which will reimainvalid for a year.
6.49 The stores area needs attention. Almost all items are in the open. Recovery andiissue has to be done in the open area, irrespective of weather conditions. There are twoentrances - one with a guard, the other open and unattended. Poles were stored outside theperimneter fence. There is lack of materials handling equipment and delivery vehicles and oldstock are subject to rotting and splitting with weathering. Lack of control and properequipment has not encouraged a first-in-first-out approach. Stores items issued to the variousdepots around the country are not controlled at all. It is assumed that these issues are used onspecified jobs, but not physical checks are made.
Financial Manaement
6.50 The financial manager is responsible for the finance department, which, until the veryrecent reorganization, covered the accounts and billing management plus internal audit.
6.51 The accounting system is computerized using packaged software on a PC basednetwork which is adequate for the purpose. This covers general ledger, managementreporting, creditors, purchasing and stock control. Billing is processed by a bureau inSwaziland. Management accounts are produced monthly.
6.52 An annual budget is produced working in cooperation with the deputy generalmanager. The budget for FY1990 was produced in March and approved in May. Budgetingis only done for the following financial year. There is no financial forecast or planning iFormore than one year ahead.
6.53 As an exception, a ten year forecast was produced for the period 31 March 1991 to31 March 2000. This was for the specific purpose of a stock issue of E20 million to financethe repayment of a loan to World Bank loan on 30 March 1990.
- 112-
Billing System
6.54 The billing system of SEB is run by a computer bureau based in Mbabane. It hasbeen known for several years that the system is inadequate having been designed for halfcurrent number of customers and running on outdated and undocumented software.
6.55 SEB has already identified a suitable new system for billing which will be in-house.The system has been developed by ICL and is in operation in Lesotho. It will apparently bepurchased and implemented when the new department for systems management has staffrecruited and trained. It is imperative that the new system be installed as soon as possible.
6.56 In the interim period, a network will be installed in the billing section. This will havedata capture as well as enquiry facilities. Receipts will be entered directly from the cashregister/receipt machines, thereby reducing the workload in data capture. Credit controllerswill have an enquiry facility on screen and hard copy, which will be an improvement uponsearching previous months statements to check on the status of an account. Two more cashreceipts tills are also needed.
6.57 Meter reading staff have been increased to pennit all meters to be read by each monthend, but more staff are needed for the cutting off of supply to bad payers. The situation withthe recording of meters has much improved due to cooperation of the commercial manager,but the loophole still exists in the issue of meters from stores to depots who do not reportback on the installation of meters.
6.58 Debt collection is improving, but statistics of debt and time of debt outstanding areunavailable. Government departments are billed for their electricity consumption but many donot pay. The credit controller has been prevented by the financial manager from cutting offsupply to Government. It would appear that a board directive is needed on the issue urgently.SEB cannot fulfill its mandate if bad debts are sanctioned.
Creditors
6.59 All goods or services required must be ordered on an approved purchase order.Purchase orders are entered into the computer system, with the purchase order being matchedand stock (for stores item) and creditors being updated. Checks are made out from thecomputer listing of invoices entered and matched against creditors invoices in the creditorsmodule. Under this system, any invoice not matched or authorized, or any non stores goodsor services received but not invoiced are not included in the month end financial records.Thus, accruals are not included in the management accounts.
6.60 The system can cater for a proper use of a purchasing ordering, stock and creditorsprocedure, and should be fully utilized to ensure completeness of monthly accounts. Thelarge value of creditors (E2 million) accrued at year end by the external auditors should havealready been included in the financial statements. When the procedures are correct, it will notbe necessary for duplicate records to be maintained in the stores department.
6.61 Problems are encountered with documentation flow. The ledger section does notnecessarily receive all purchase orders and sometimes has difficulty in recovering documents
- 113 -
authorized for payment from other departments. Information is lost resulting in delay insupplier payment and incomplete accounting information.
General Ledger
6.62 The general ledger is maintained on a computerized system, fully integrated wilhpurchasing, stock and creditors. Entries are made from a manual journal or cash paymentvouchers which record all non-creditor payments.
6.63 All input from the accounting system is checked to input documents. However, in thecase of the journal, the original documents are not available. Monthly management accountsare generated from the general ledger and subsidiary ledgers.
Pavroll
6.64 The payroll is run monthly for both salaried and daily rate employees. A PC basedpayroll program, widely used in Swaziland, is managed by the payroll supervisor. There areno apparent problems and, apart from minor improvements in optimizing the reportingcapability of the system, no change need be considered. The system can easily handle moreemployees.
Internal Audit
6.65 Until the reorganization the internal auditor, supported by two staff, had beenreporting to the financial manager and had been very much involved in assisting theaccounting department in checking input data. It was not filling the true function of aninternal audit department as it was not independent of the finance section.
6.66 None of the staff have formal audit training. The internal auditor has a bachelor ofcommerce degree and has attended seminars on internal auditing. The two assistants holddiplomas in business studies which they obtained by private study.
6.67 It is intended to recruit two more staff from auditing firms so that a strongbackground in audit techniques is introduced. The internal auditor will undergo training withESKOM and will in future report directly to the Chief Executive.
E. Conclusions
6.68 The SEB is highly geared, being a public corporation with no share capital. It hasbeen unable to build up adequate reserves from operating income in the past, mainly die toextraordinary losses on foreign exchange and early settlement of offshore loans whichfinanced the construction of the Luphohlo Dam project.
6.69 Considerable investment is required in new transmission lines in the short term and,possibly, to build the Maguga hydropower station towards the end of the 1990s.
6.70 There are basically two alternatives: increase electricity charges or take out moreloans. With a small increase in the cost of electricity in the short term, decreasing in real
- 114 -
terms later, SEB can become self financing. This is considered to be preferable to the burdenof loans and resultant debt service.
6.71 Should there be a major economic downturn in Swaziland, influenced by events inSouth Africa, electricity sales may not rise at the forecast rate in the industrial and irrigationsectors. This will significantly impact pricing policy. It must also be noted that currentirrigation consumers utilize almost all the available water resources and that the majorcustomers who account for 95 percent of irrigation sales are rationalizing their powerutilization to reduce their maximum demand, and thus the unit cost.
6.72 The SEB has been the subject of several management studies in the past few years.On the technical aspect regarding generation and transmission, note has been taken ofrecommendations and improvements to the electricity supply infrastructure are being made.
6.73 SEB is very weak in the area of human resources and extensive programs for trainingand staff appraisal must be combined with the restructuring. Staff morale can be muchimproved by delegation of authority from Board level downwards and recognition ofindividual employee contributions of SEB.
6.74 Financial management is barely adequate and more attention must be given to controland medium term planning. The billing system has major problems and urgent attentiongiven to a replacement system.
- 115 -
VII. THE WATER AND SEWERAGE BOARD
Introduction
7.1 The Water and Sewerage Board Special Fund of 1974 created the Water andSewerage Board (WSB). Under the direction of the Ministry of Natural Resources, LandUtilization and Energy (MNLUE) and, subsequently, the Ministry of Housing and UrbanDevelopment (MHUD), WSB undertakes all transactions relating to the management,operation maintenance and development of public water supplies and water borne seweragefacilities in the principal urban areas. The Board is not an independent body but a departmentof MHUD. In 1985 a Water and Sewerage Board Bill was drafted to convert the Board into asemi-autonomous parastatal organization, but has yet to be implemented. However, the Boardis expected to operate on a commercial and self-financing basis, and though given theauthority to set tariffs to earn a reasonable rate of return on net fixed assets, it has not beenpermitted to increase tariffs in line with inflation.
7.2 Understanding the inadequacies of the existing law and water sector problems, theGovernment, in 1986 requested CIDA's assistance to establish a National Water Authority(NWA) and to prepare a Water Resources Master Plan. The study was completed in 1'988and the recommendation is still being considered by the Government. The NWA would aimto prepare and periodically review a water master plan to allow the optimum uses of thenation's water resources and also to establish a policy for coordinating water resourceavailability and use.
7.3 Presently, the Board supplies 20 water supply systems with water, providing itreatedwater to over 80 percent of the urban population. About 60 percent are served by directconnection and 40 percent from public standpipes. Out of the 20 water supplies systems,three are regarded as viable operations - Mbabane and Manzini/Matsapha. The non viableareas are characterized by low populations which means that high fixed costs would have tobe shared amongst relatively few people. If these areas were to be made viable, the cbargefor water would be significantly higher and may prove unaffordable. Therefore, at present,the government provides a subvention to cover the recurrent deficit and grant for capitalworks for the non viable areas. However the subsidy has not been adequate to cover costs,therefore, the difference is being covered from the Board's revenue from viable schemes.
7.4 WSB is also responsible for four major sewerage schemes in the country, Mbabane,Manzini/Zakhele, Matsapha and Piggs Peak. The sewerage system serves 25 percent cf theurban population.
7.5 The rural water supplies and sanitation were for a short time the responsibility ofWSB. In 1979, at the beginning of the International Drinking Water and Sanitation Decade,the Rural Water Supply Board (RWSB) and the National Action Group were charged withimplementing programs related to the Decade. RWSB is still responsible for water supply forthe rural areas and also for some sanitary facilities. Water is supplied to communities thathave shown commitment to managing it.
- 116-
Government/Water and Sewerage Board Objectives
7.6 The policy objective of the Government is to provide and maintain facilities forensuring availability of adequate water and to provide adequate sewerage disposal service. Asstated in the fifth five year plan, WSB's objectives are: (i) to ensure that 100 percent of theurban population has access to quality piped water service; (ii) to make the Board a financiallyviable organization; and (c) to intensify effort to train local staff. Recognizing that the Board,under the present legal status, would not be able to meet these objectives, the Governmentrequested Wessex Water International financed by U.K. ODA to undertake a detailed reviewof the Board's legal status, organizational structure, manpower strategy and financial systems.The study was completed in 1990 and their recommendations are expected to be implementedin 1993.
A. Intersectoral Allocation
7.7 In its early years, the Board's capital works were financed by: (i) World Bank loans,(ii) government grant, and (iii) internal funds. Since mid-1970, however, the Board has notraised any loans and all major capital works have been financed from the annual governmentbudget and from the Board's internally generated funds. Government's contribution to capitalexpenditures for the non-viable urban areas amounted to E3.8 million between 1985 and1986. This token amount indicates that WSB is expected to finance all capital works in, atleast, the viable areas. The bulk of projected capital expenditure in future years will beconcentrated in rural areas (E1i million from 1991 onwards)!'.
7.8 Government's contribution for capital investments in the sector from 1985 through1989 amounted to E15.1, or about E3.0 million per annum compared with a total annualaverage expenditure for the Government of E70 million. Thus investments in the water sectorhave averaged about 3.7 percent of total investment.
7.9 In 1985 the Government began to grant the Board a subvention to cover the recurrentdeficit on operation of the non viable areas. Government recurrent expenditure, for water andsewerage, between FY1985-90 remained about the same with an average annual share of 0.6percent of total which is the smallest of all the sectors. The subvention has not beenincreased to recognize the effects of inflation and increased volume of water supply to the nonviable areas since FY1985. The average rate of annual increase in water supply to the nonviable areas over the last 5 years has been 4.9 percent. This indicates that there has beencross subsidy from the viable areas. Until a more detailed budget which shows costs byservice for viable and non-viable areas is prepared the amount of subvention required for thenon-viable areas cannot be established.
' The investment is for: (i) drilling of 75 boreholes, (ii) construction of 12 reticulated ruralwater supply schemes, (iii) 5,400 latrines, and (iv) construction of 70 new water supplysystems.
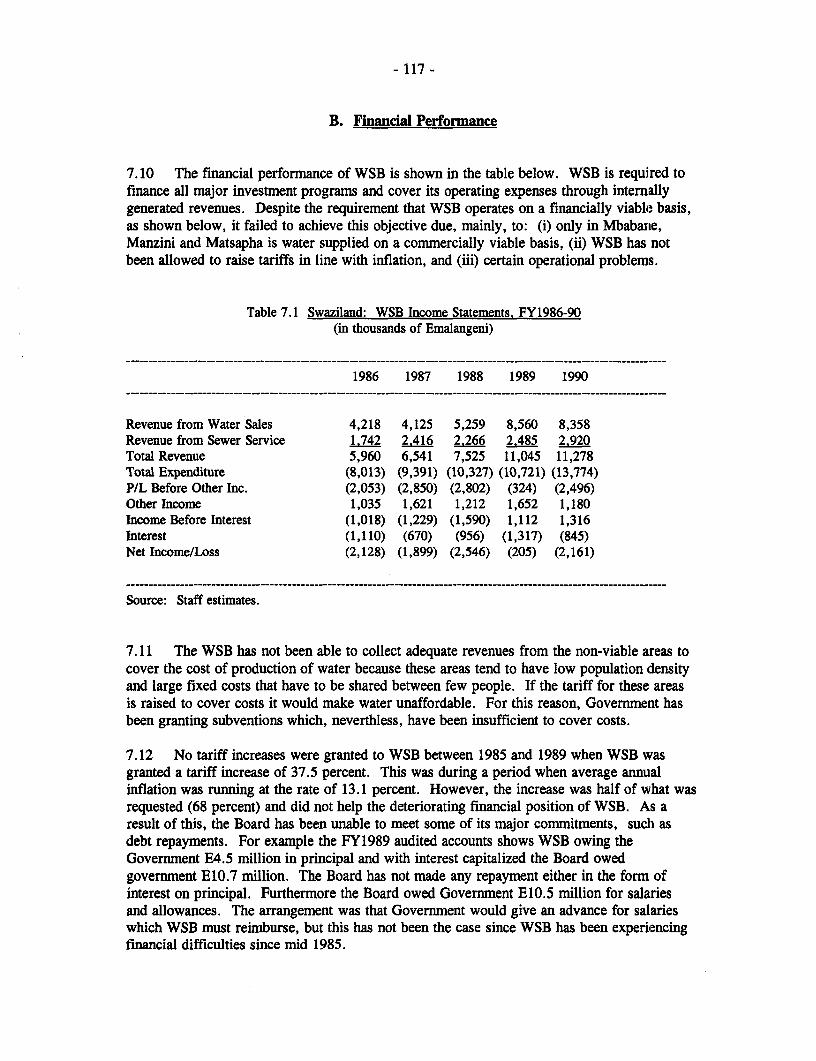
- 117 -
B. Financial Performance
7.10 The financial performance of WSB is shown in the table below. WSB is required tofinance all major investment programs and cover its operating expenses through internallygenerated revenues. Despite the requirement that WSB operates on a financially viable basis,as shown below, it failed to achieve this objective due, mainly, to: (i) only in MbabarLe,Manzini and Matsapha is water supplied on a commercially viable basis, (ii) WSB has notbeen allowed to raise tariffs in line with inflation, and (iii) certain operational problems.
Table 7.1 Swaziland: WSB Income Statements. FY1986-90(in thousands of Emalangeni)
1986 1987 1988 1989 1990
Revenue from Water Sales 4,218 4,125 5,259 8,560 8,358Revenue from Sewer Service 1.742 2.416 2.266 2.485 2.920Total Revenue 5,960 6,541 7,525 11,045 11,278Total Expenditure (8,013) (9,391) (10,327) (10,721) (13,774)P/L Before Other Inc. (2,053) (2,850) (2,802) (324) (2,496)Other Income 1,035 1,621 1,212 1,652 1,180Income Before Interest (1,018) (1,229) (1,590) 1,112 1,316Interest (1,110) (670) (956) (1,317) (845)Net Income/Loss (2,128) (1,899) (2,546) (205) (2,161)
Source: Staff estimates.
7.11 The WSB has not been able to collect adequate revenues from the non-viable areas tocover the cost of production of water because these areas tend to have low population densityand large fixed costs that have to be shared between few people. If the tariff for these areasis raised to cover costs it would make water unaffordable. For this reason, Government hasbeen granting subventions which, neverthless, have been insufficient to cover costs.
7.12 No tariff increases were granted to WSB between 1985 and 1989 when WSB wasgranted a tariff increase of 37.5 percent. This was during a period when average annualinflation was running at the rate of 13.1 percent. However, the increase was half of what wasrequested (68 percent) and did not help the deteriorating financial position of WSB. As aresult of this, the Board has been unable to meet some of its major commitments, such asdebt repayments. For example the FY1989 audited accounts shows WSB owing theGovernment E4.5 million in principal and with interest capitalized the Board owedgovernment E10.7 million. The Board has not made any repayment either in the form ofinterest on principal. Furthermore the Board owed Government E10.5 million for salariesand allowances. The arrangement was that Government would give an advance for salarieswhich WSB must reimburse, but this has not been the case since WSB has been experiencingfinancial difficulties since mid 1985.
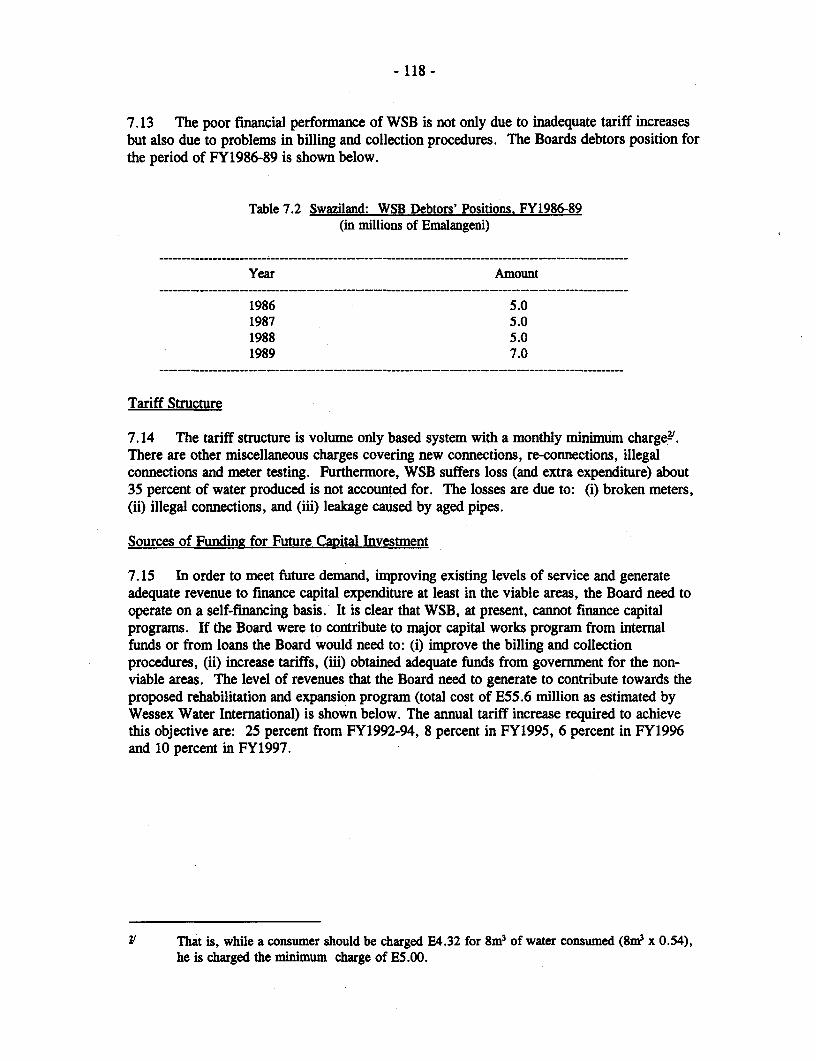
- 118 -
7.13 The poor financial performance of WSB is not only due to inadequate tariff increasesbut also due to problems in billing and collection procedures. The Boards debtors position forthe period of FY1986-89 is shown below.
Table 7.2 Swaziland: WSB Debtors' Positions. FY1986-89(in millions of Emalangeni)
Year Amount
1986 5.01987 5.01988 5.01989 7.0
Tariff Structure
7.14 The tariff structure is volume only based system with a monthly minimum charger'.There are other miscellaneous charges covering new connections, re-connections, illegalconnections and meter testing. Furthermore, WSB suffers loss (and extra expenditure) about35 percent of water produced is not accounted for. The losses are due to: (i) broken meters,(ii) illegal connections, and (iii) leakage caused by aged pipes.
Sources of Funding for Future CaRital Investment
7.15 In order to meet future demand, improving existing levels of service and generateadequate revenue to finance capital expenditure at least in the viable areas, the Board need tooperate on a self-financing basis. It is clear that WSB, at present, cannot finance capitalprograms. If the Board were to contribute to major capital works program from internalfunds or from loans the Board would need to: (i) improve the billing and collectionprocedures, (ii) increase tariffs, (iii) obtained adequate funds from government for the non-viable areas. The level of revenues that the Board need to generate to contribute towards theproposed rehabilitation and expansion program (total cost of E55.6 million as estimated byWessex Water International) is shown below. The annual tariff increase required to achievethis objective are: 25 percent from FY1992-94, 8 percent in FY1995, 6 percent in FY1996and 10 percent in FY1997.
1' That is, while a consumer should be charged E4.32 for 8m3 of water consumed (8m3 x 0.54),he is charged the minimum charge of E5.00.
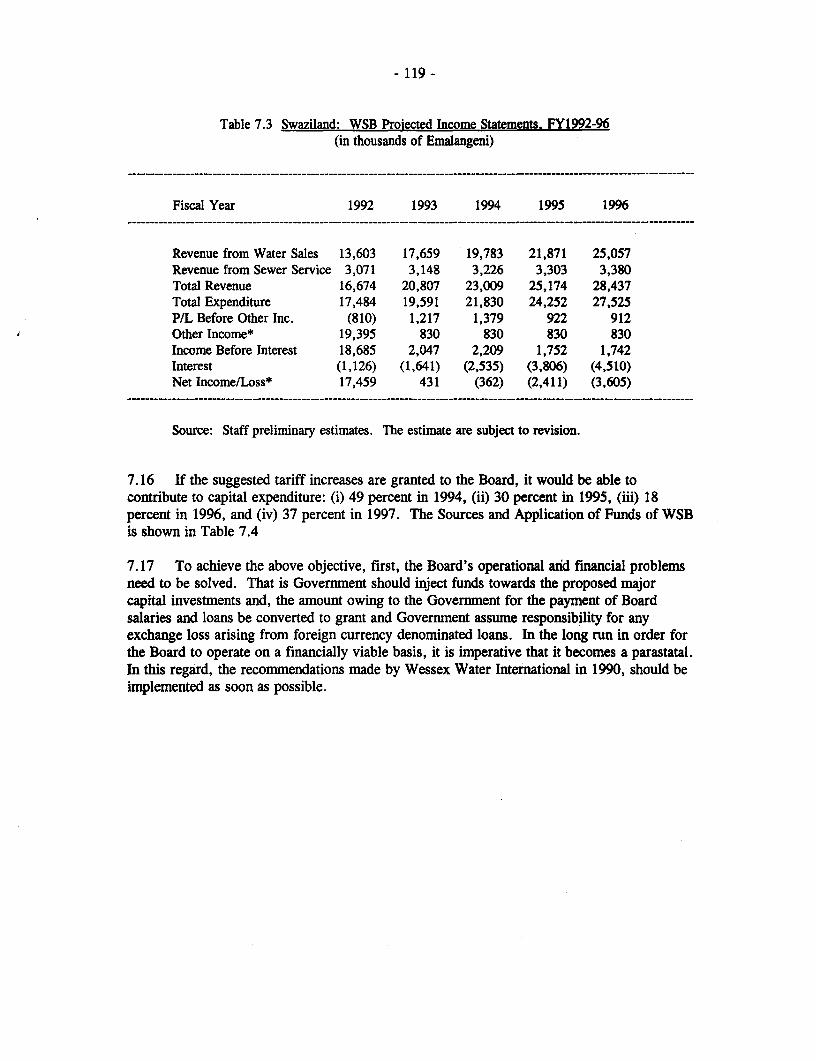
- 119 -
Table 7.3 Swaziland: WSB Proiected Income Statements. FY1992-96(in thousands of Emalangeni)
Fiscal Year 1992 1993 1994 1995 1996
Revenue from Water Sales 13,603 17,659 19,783 21,871 25,057Revenue from Sewer Service 3,071 3,148 3,226 3,303 3,380Total Revenue 16,674 20,807 23,009 25,174 28,437Total Expenditure 17,484 19,591 21,830 24,252 27,525P/L Before Other Inc. (810) 1,217 1,379 922 912Other Income* 19,395 830 830 830 830Income Before Interest 18,685 2,047 2,209 1,752 1,742Interest (1,126) (1,641) (2,535) (3,806) (4,510)Net Income/Loss* 17,459 431 (362) (2,411) (3,605)
Source: Staff preliminary estimates. The estimate are subject to revision.
7.16 If the suggested tariff increases are granted to the Board, it would be able tocontribute to capital expenditure: (i) 49 percent in 1994, (ii) 30 percent in 1995, (iii) 18percent in 1996, and (iv) 37 percent in 1997. The Sources and Application of Funds of WSBis shown in Table 7.4
7.17 To achieve the above objective, first, the Board's operational and financial problemsneed to be solved. That is Govermment should inject funds towards the proposed majorcapital investments and, the amount owing to the Government for the payment of Boardsalaries and loans be converted to grant and Government assume responsibility for anyexchange loss arising from foreign currency denominated loans. In the long run in order forthe Board to operate on a financially viable basis, it is imperative that it becomes a parastatal.In this regard, the recommendations made by Wessex Water International in 1990, should beimplemented as soon as possible.
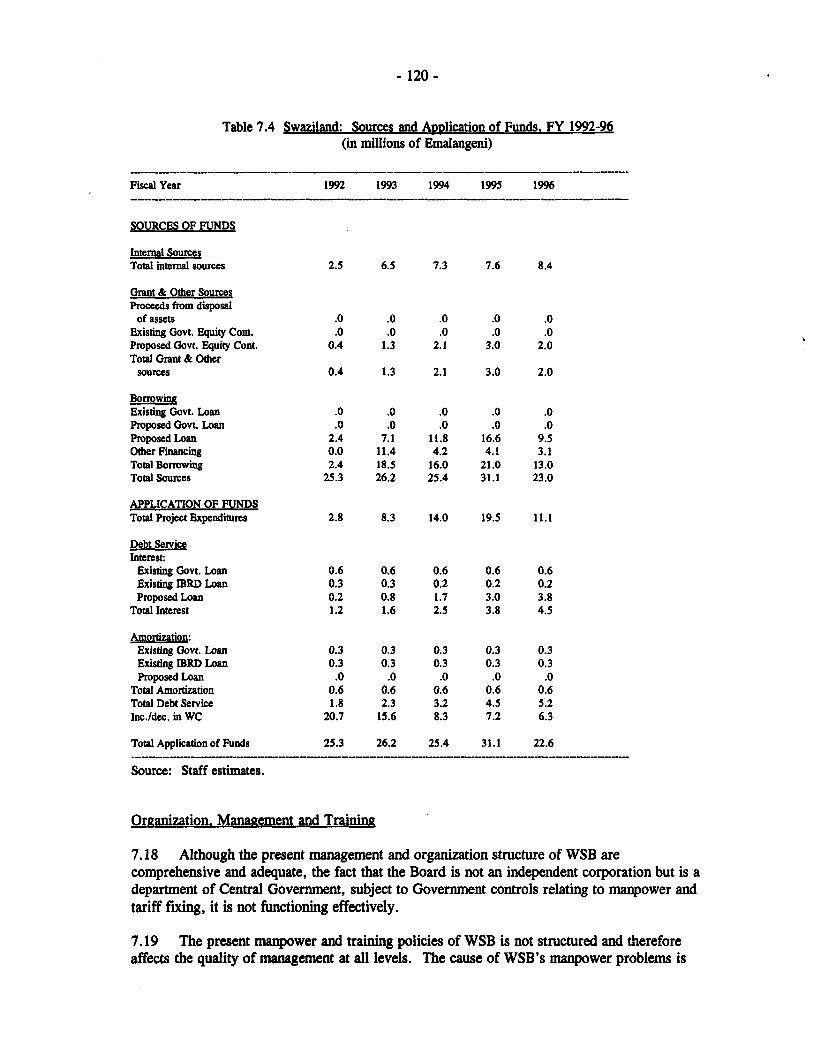
- 120 -
Table 7.4 Swaziland: Sources and Application of Funds. FY 1992-96(in millions of Emalangeni)
Fiscal Year 1992 1993 1994 1995 1996
SOURCES OF FUNDS
Internal SourcesTotal internal sources 2.5 6.5 7.3 7.6 8.4
Grant & Other SourcesProceeds from disposal
of assets .0 .0 .0 .0 .0Existing Govt. Equity Cont. .0 .0 .0 .0 .0Proposed Govt. Equity Cont. 0.4 1.3 2.1 3.0 2.0Total Grant & Other
sources 0.4 1.3 2.1 3.0 2.0
BorrowingExisting Govt. Loan .0 .0 .0 .0 .0Proposed Govt. Loan .0 .0 .0 .0 .0Proposed Loan 2.4 7.1 11.8 16.6 9.5Other Financing 0.0 11.4 4.2 4.1 3.1Total Borrowing 2.4 18.5 16.0 21.0 13.0Total Sources 25.3 26.2 25.4 31.1 23.0
APPLICATION OF FUNDSTotal Project Expenditures 2.8 8.3 14.0 19.5 11.1
Debt Servicentnerest:Existing Govt. Loan 0.6 0.6 0.6 0.6 0.6Existing IBRD Loan 0.3 0.3 0.2 0.2 0.2Proposed Loan 0.2 0.8 1.7 3.0 3.8
Total Interest 1.2 1.6 2.5 3.8 4.5
Amoroization:Existing Govt. Loan 0.3 0.3 0.3 0.3 0.3Existing IBRD Loan 0.3 0.3 0.3 0.3 0.3Proposed Loan .0 .0 .0 .0 .0
Total Amortization 0.6 0.6 0.6 0.6 0.6Total Debt Service 1.8 2.3 3.2 4.5 5.2Inc./dec. in WC 20.7 15.6 8.3 7.2 6.3
Total Application of Funds 25.3 26.2 25.4 31.1 22.6
Source: Staff estimates.
Organization. Management and Training
7.18 Although the present management and organization structure of WSB arecomprehensive and adequate, the fact that the Board is not an independent corporation but is adepartment of Central Govermnent, subject to Government controls relating to manpower andtariff fixing, it is not functioning effectively.
7.19 The present manpower and training policies of WSB is not structured and thereforeaffects the quality of management at all levels. The cause of WSB's manpower problems is
- 121 -
its inability to control the selection and training of existing staff, and appointment of new staffbecause this matter is handled by the Ministry of Labor and Public Service.
7.20 To overcome the organizational and management problem, the following have beenrecommended by Wessex International:
(a) Water Service Corporation be established with full authority to conducl: itsaffairs independently; and
(b) Improved and more structured Management Development program beestablished.
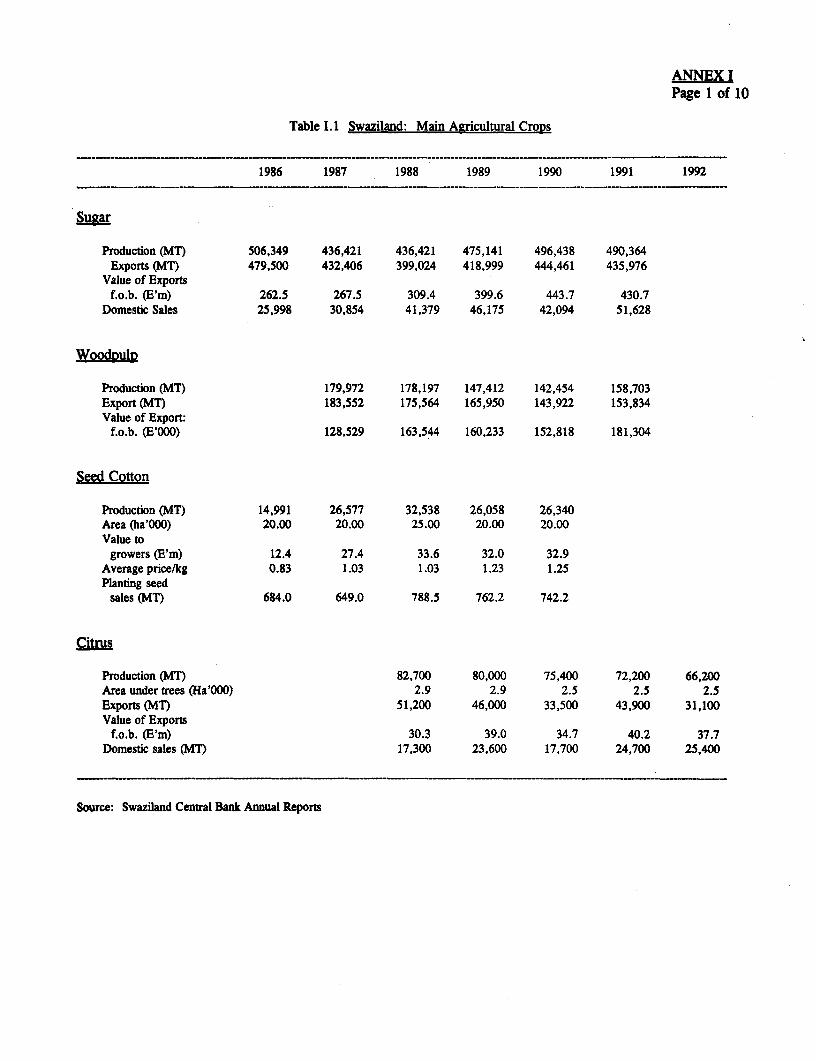
ANNEX IPage 1 of 10
Table 1.1 Swaziland: Main A,eicultural Crogs
1986 1987 1988 1989 1990 1991 1992
Sua
Production (MT) 506,349 436,421 436,421 475,141 496,438 490,364Exports (MT) 479,500 432,406 399,024 418,999 444,461 435,976
Value of Exportsf.o.b. (E'm) 262.5 267.5 309.4 399.6 443.7 430.7
Domestic Sales 25,998 30,854 41,379 46,175 42,094 51,628
WoodpuIp
Production (MT) 179,972 178,197 147,412 142,454 158,703Export (MT) 183,552 175,564 165,950 143,922 153,834Value of Export:
f.o.b. (E'000) 128,529 163,544 160,233 152,818 181,304
Seed Cotton
Production (MT) 14,991 26,577 32,538 26,058 26,340Area (ha'000) 20.00 20.00 25.00 20.00 20.00Value to
growers (E'm) 12.4 27.4 33.6 32.0 32.9Average price/kg 0.83 1.03 1.03 1.23 1.25Planting seed
sales (MT) 684.0 649.0 788.5 762.2 742.2
ctrus
Production (MT) 82,700 80,000 75,400 72,200 66,200Area under trees (Ha'000) 2.9 2.9 2.5 2.5 2.5Exports (MT) 51,200 46,000 33,500 43,900 31,100Value of Exports
f.o.b. (E'm) 30.3 39.0 34.7 40.2 37.7Domestic sales (MT) 17,300 23,600 17,700 24,700 25,400
Source: Swaziland Central Bank Annual Reports
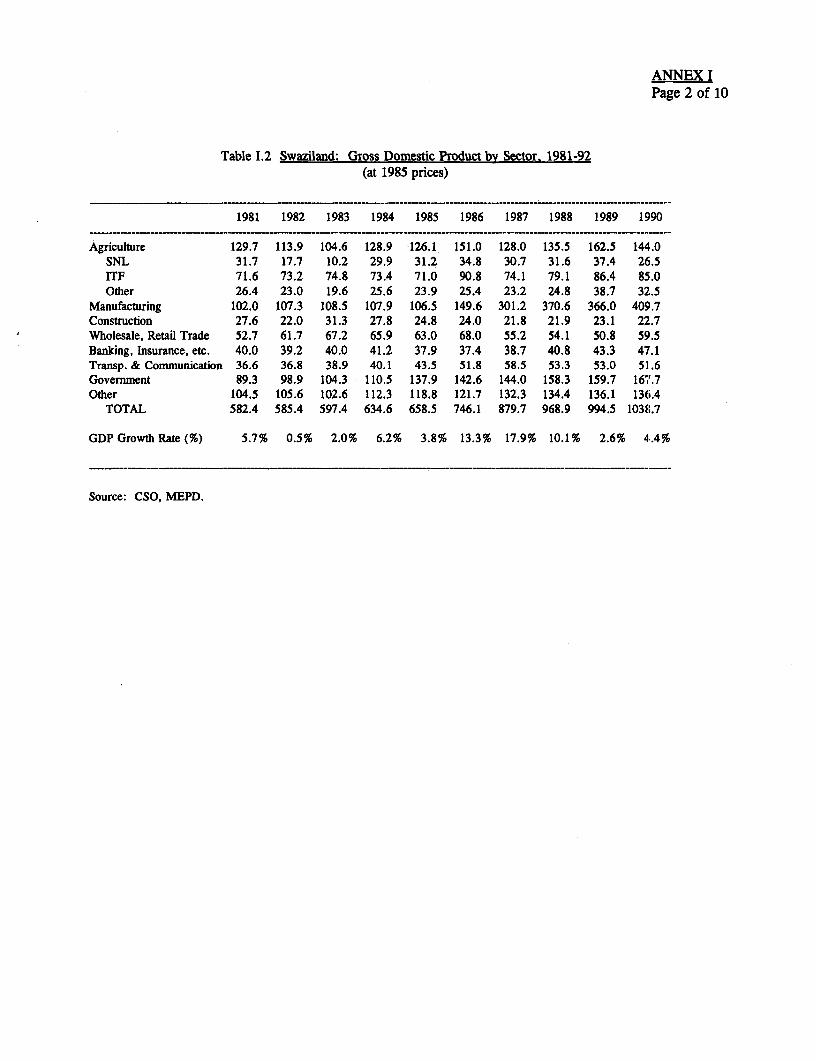
ANNEX IPage 2 of 10
Table 1.2 Swaziland: Gross Domestic Product by Sector. 1981-92(at 1985 prices)
1981 1982 1983 1984 1985 1986 1987 1988 1989 1990
Agriculture 129.7 113.9 104.6 128.9 126.1 151.0 128.0 135.5 162.5 144.0SNL 31.7 17.7 10.2 29.9 31.2 34.8 30.7 31.6 37.4 26.5ITF 71.6 73.2 74.8 73.4 71.0 90.8 74.1 79.1 86.4 85.0Other 26.4 23.0 19.6 25.6 23.9 25.4 23.2 24.8 38.7 32!.5
Manufacturing 102.0 107.3 108.5 107.9 106.5 149.6 301.2 370.6 366.0 409.7Construction 27.6 22.0 31.3 27.8 24.8 24.0 21.8 21.9 23.1 22!.7Wholesale, Retail Trade 52.7 61.7 67.2 65.9 63.0 68.0 55.2 54.1 50.8 59.5Banking, Insurance, etc. 40.0 39.2 40.0 41.2 37.9 37.4 38.7 40.8 43.3 47.1Transp. & Communication 36.6 36.8 38.9 40.1 43.5 51.8 58.5 53.3 53.0 51.6Government 89.3 98.9 104.3 110.5 137.9 142.6 144.0 158.3 159.7 167.7Other 104.5 105.6 102.6 112.3 118.8 121.7 132.3 134.4 136.1 136.4
TOTAL 582.4 585.4 597.4 634.6 658.5 746.1 879.7 968.9 994.5 1038.7
GDP Growth Rate(%) 5.7% 0.5% 2.0% 6.2% 3.8% 13.3% 17.9% 10.1% 2.6% 4.4%
Source: CSO, MEPD.
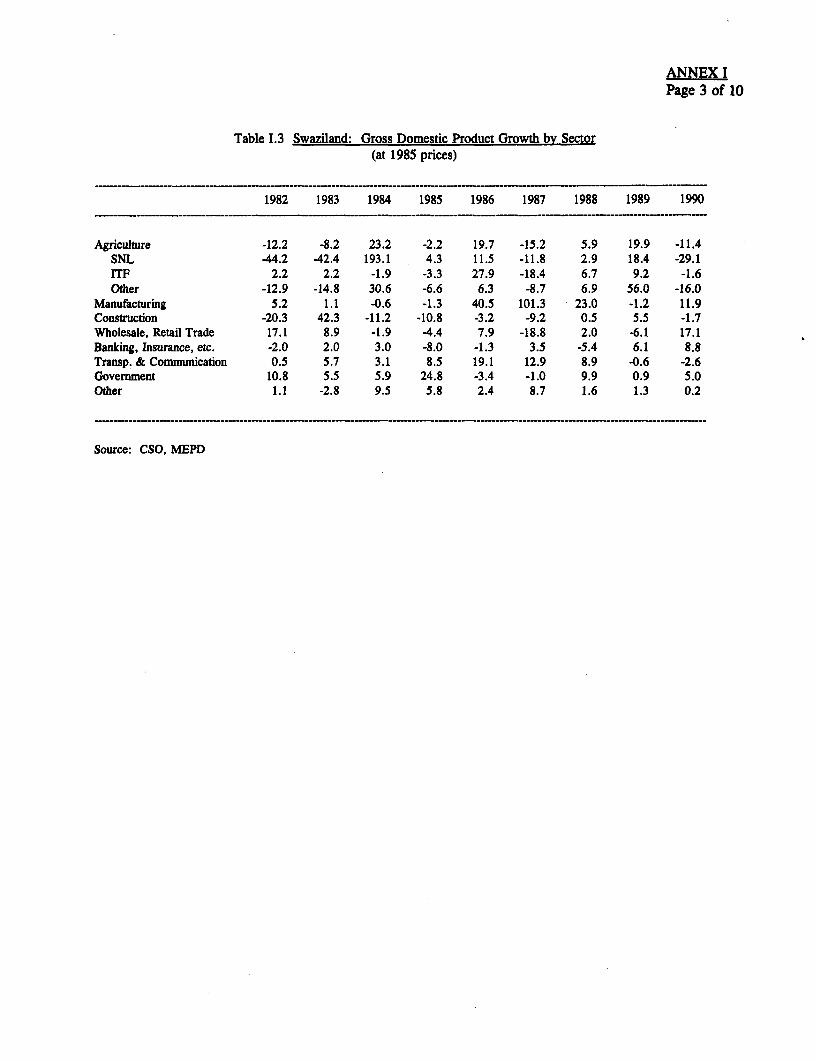
ANNEX IPage 3 of 10
Table 1.3 Swaziland: Gross Domestic Product Growth by Sector(at 1985 prices)
1982 1983 1984 1985 1986 1987 1988 1989 1990
Agriculture -12.2 -8.2 23.2 -2.2 19.7 -15.2 5.9 19.9 -11.4SNL -44.2 -42.4 193.1 4.3 11.5 -11.8 2.9 18.4 -29.1ITF 2.2 2.2 -1.9 -3.3 27.9 -18.4 6.7 9.2 -1.6Other -12.9 -14.8 30.6 -6.6 6.3 -8.7 6.9 56.0 -16.0
Manufacturing 5.2 1.1 -0.6 -1.3 40.5 101.3 23.0 -1.2 11.9Construction -20.3 42.3 -11.2 -10.8 -3.2 -9.2 0.5 5.5 -1.7Wholesale, Retail Trade 17.1 8.9 -1.9 -4.4 7.9 -18.8 2.0 -6.1 17.1Banking, Insurance, etc. -2.0 2.0 3.0 -8.0 -1.3 3.5 -5.4 6.1 8.8Transp. & Communication 0.5 5.7 3.1 8.5 19.1 12.9 8.9 -0.6 -2.6Govermment 10.8 5.5 5.9 24.8 -3.4 -1.0 9.9 0.9 5.0Other 1.1 -2.8 9.5 5.8 2.4 8.7 1.6 1.3 0.2
Source: CSO, MEPD
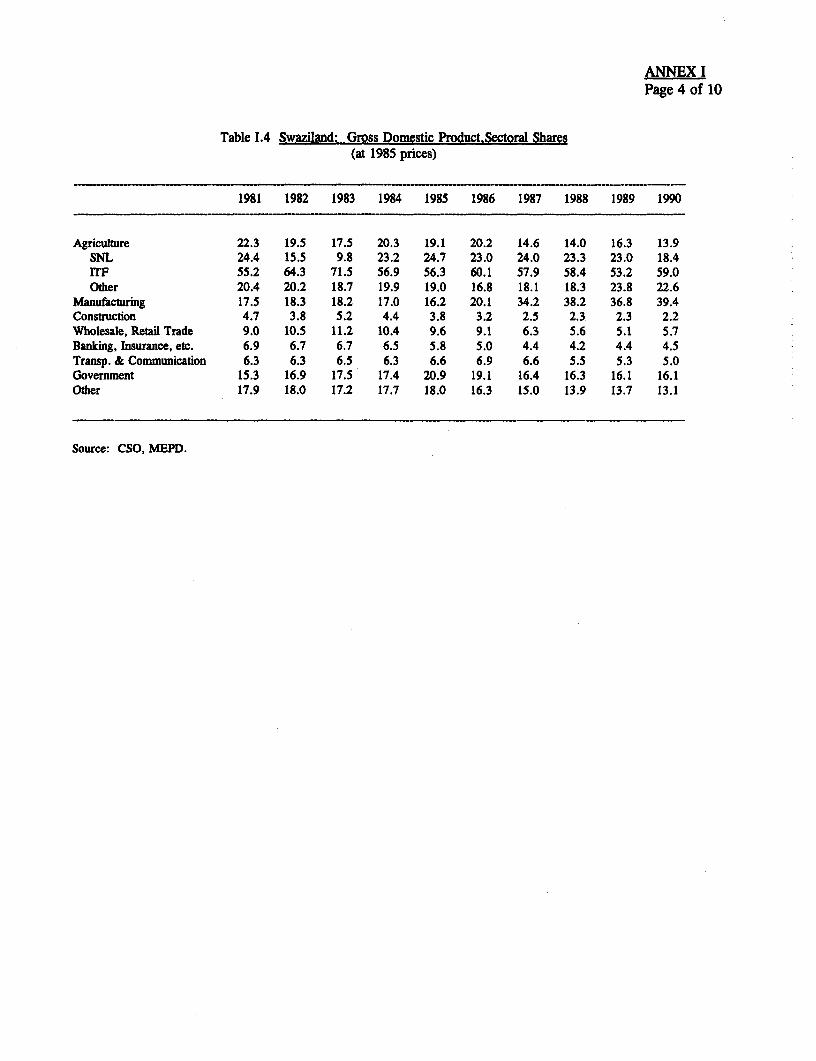
ANNEX IPage 4 of 10
Table L.4 Swaziland: Gross Domestic Product.Sectoral Shares(at 1985 prices)
1981 1982 1983 1984 1985 1986 1987 1988 1989 1990
Agriculture 22.3 19.5 17.5 20.3 19.1 20.2 14.6 14.0 16.3 13.9SNL 24.4 15.5 9.8 23.2 24.7 23.0 24.0 23.3 23.0 18.4ITF 55.2 64.3 71.5 56.9 56.3 60.1 57.9 58.4 53.2 59.0Other 20.4 20.2 18.7 19.9 19.0 16.8 18.1 18.3 23.8 22.6
Manufacturing 17.5 18.3 18.2 17.0 16.2 20.1 34.2 38.2 36.8 39.4Construction 4.7 3.8 5.2 4.4 3.8 3.2 2.5 2.3 2.3 2.2Wholesale, Retail Trade 9.0 10.5 11.2 10.4 9.6 9.1 6.3 5.6 5.1 5.7Banking, Insurance, etc. 6.9 6.7 6.7 6.5 5.8 5.0 4.4 4.2 4.4 4.5Transp. & Communication 6.3 6.3 6.5 6.3 6.6 6.9 6.6 5.5 5.3 5.0Government 15.3 16.9 17.5 17.4 20.9 19.1 16.4 16.3 16.1 16.1Other 17.9 18.0 17.2 17.7 18.0 16.3 15.0 13.9 13.7 13.1
Source: CSO, MEPD.
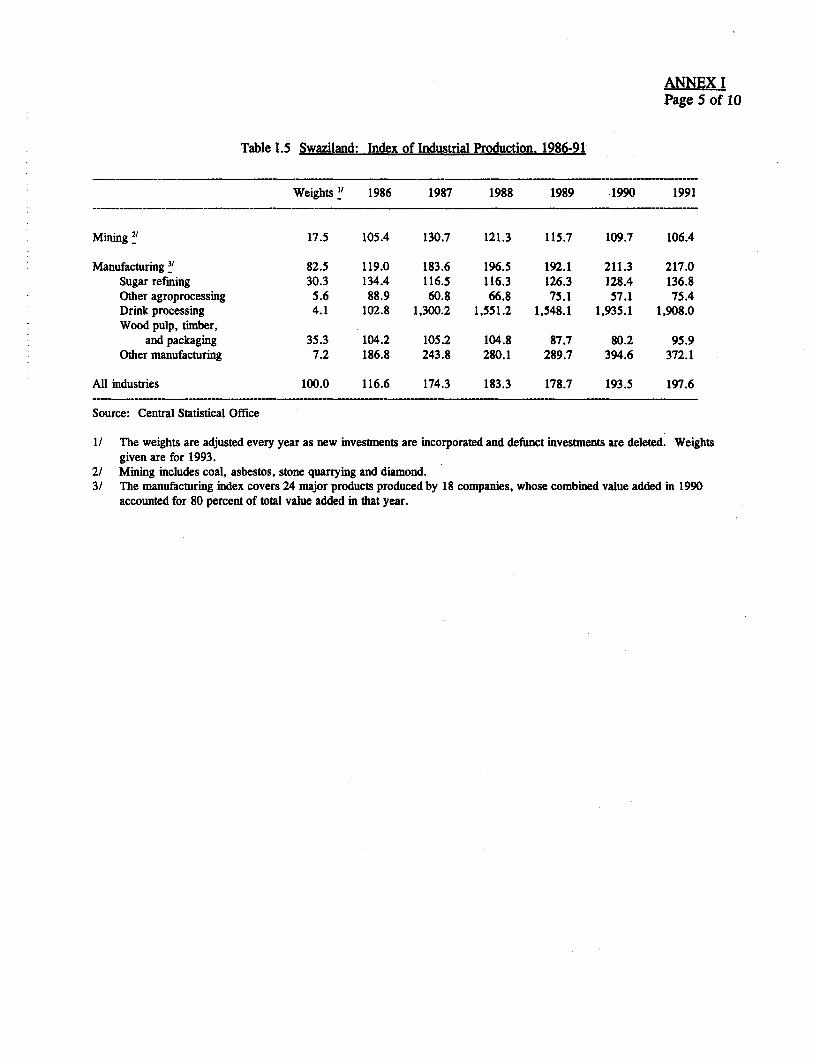
ANNEX IPage 5 of 10
Table 1.5 Swaziland: Index of Industrial Production. 1986-91
Weights " 1986 1987 1988 1989 1990 1991
Mining 2' 17.5 105.4 130.7 121.3 115.7 109.7 106.4
Manufacturing 82.5 119.0 183.6 196.5 192.1 211.3 217.0Sugar refining 30.3 134.4 116.5 116.3 126.3 128.4 136.8Other agroprocessing 5.6 88.9 60.8 66.8 75.1 57.1 75.4Drink processing 4.1 102.8 1,300.2 1,551.2 1,548.1 1,935.1 1,908.0Wood pulp, timber,
and packaging 35.3 104.2 105.2 104.8 87.7 80.2 95.9Other manufacturing 7.2 186.8 243.8 280.1 289.7 394.6 372.1
All industries 100.0 116.6 174.3 183.3 178.7 193.5 197.6
Source: Central Statistical Office
1/ The weights are adjusted every year as new investments are incorporated and defunct investments are deleted. Weightsgiven are for 1993.
2/ Mining includes coal, asbestos, stone quarrying and diamond.3/ The manufacturing index covers 24 major products produced by 18 companies, whose combined value added in 1990
accounted for 80 percent of total value added in that year.
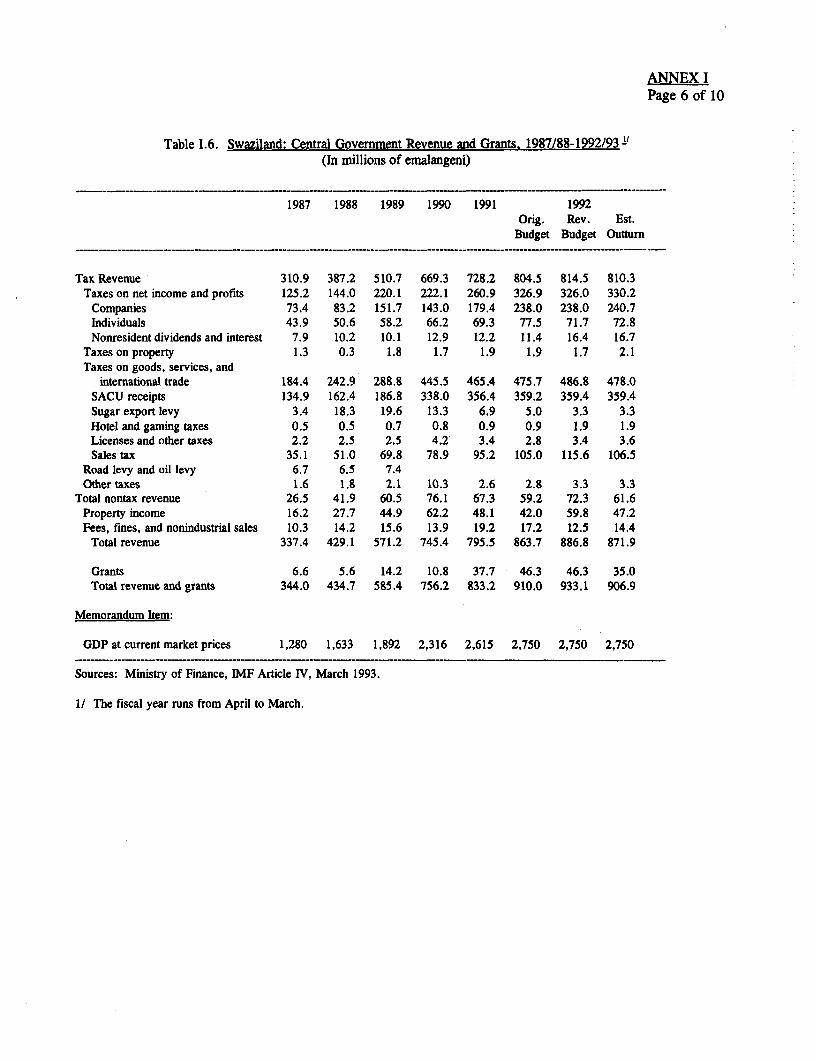
ANNEX IPage 6 of 10
Table 1.6. Swaziland: Central Government Revenue and Grants. 1987/88-1992/93 "(In millions of emalangeni)
1987 1988 1989 1990 1991 1992Orig. Rev. Est.
Budget Budget Outturn
Tax Revenue 310.9 387.2 510.7 669.3 728.2 804.5 814.5 810.3Taxes on net income and profits 125.2 144.0 220.1 222.1 260.9 326.9 326.0 330.2
Companies 73.4 83.2 151.7 143.0 179.4 238.0 238.0 240.7Individuals 43.9 50.6 58.2 66.2 69.3 77.5 71.7 72.8Nonresident dividends and interest 7.9 10.2 10.1 12.9 12.2 11.4 16.4 16.7
Taxes on property 1.3 0.3 1.8 1.7 1.9 1.9 1.7 2.1Taxes on goods, services, and
international trade 184.4 242.9 288.8 445.5 465.4 475.7 486.8 478.0SACU receipts 134.9 162.4 186.8 338.0 356.4 359.2 359.4 359.4Sugar export levy 3.4 18.3 19.6 13.3 6.9 5.0 3.3 3.3Hotel and gaming taxes 0.5 0.5 0.7 0.8 0.9 0.9 1.9 1.9Licenses and other taxes 2.2 2.5 2.5 4.2 3.4 2.8 3.4 3.6Sales tax 35.1 51.0 69.8 78.9 95.2 105.0 115.6 106.5
Road levy and oil levy 6.7 6.5 7.4Other taxes 1.6 1.8 2.1 10.3 2.6 2.8 3.3 3.3
Total nontax revenue 26.5 41.9 60.5 76.1 67.3 59.2 72.3 61.6Property income 16.2 27.7 44.9 62.2 48.1 42.0 59.8 47.2Fees, fines, and nonindustrial sales 10.3 14.2 15.6 13.9 19.2 17.2 12.5 14.4Total revenue 337.4 429.1 571.2 745.4 795.5 863.7 886.8 871.9
Grants 6.6 5.6 14.2 10.8 37.7 46.3 46.3 35.0Total revenue and grants 344.0 434.7 585.4 756.2 833.2 910.0 933.1 906.9
Memorandum Item:
GDP at current market prices 1,280 1,633 1,892 2,316 2,615 2,750 2,750 2,750
Sources: Ministry of Finance, IMF Article IV, March 1993.
1/ The fiscal year runs from April to March.
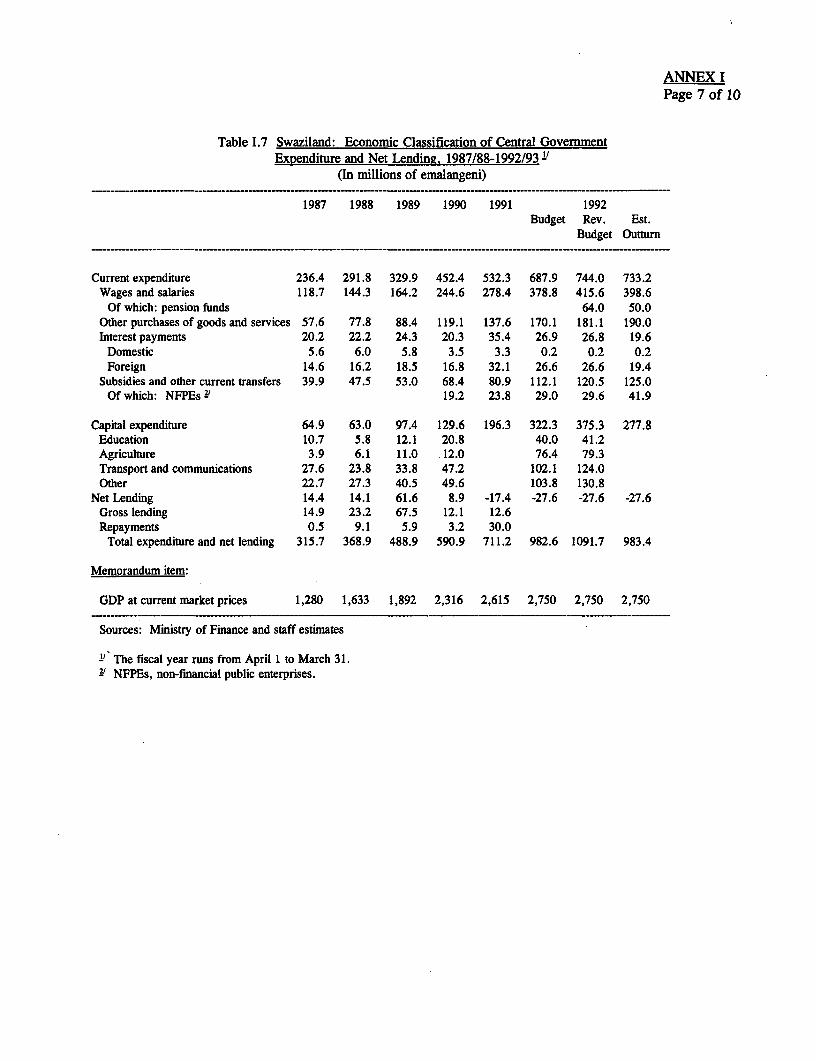
ANNEX IPage 7 of 10
Table 1.7 Swaziland: Economic Classification of Central GovernmentExpenditure and Net Lending. 1987/88-1992/93 l'
(In millions of emalangeni)
1987 1988 1989 1990 1991 1992Budget Rev. Est.
Budget Outturn__ -- -- -- - -- - - -- - --- - -- - - - - - - - - - - - - -_- - - - - - - - - - - - - - - - - - - - - - - - - - - -
Current expenditure 236.4 291.8 329.9 452.4 532.3 687.9 744.0 733.2Wages and salaries 118.7 144.3 164.2 244.6 278.4 378.8 415.6 398.6
Of which: pension funds 64.0 50.0Other purchases of goods and services 57.6 77.8 88.4 119.1 137.6 170.1 181.1 190.0Interest payments 20.2 22.2 24.3 20.3 35.4 26.9 26.8 19.6
Domestic 5.6 6.0 5.8 3.5 3.3 0.2 0.2 0.2Foreign 14.6 16.2 18.5 16.8 32.1 26.6 26.6 19.4
Subsidies and other current transfers 39.9 47.5 53.0 68.4 80.9 112.1 120.5 125.0Of which: NFPEs 2' 19.2 23.8 29.0 29.6 41.9
Capital expenditure 64.9 63.0 97.4 129.6 196.3 322.3 375.3 277.8Education 10.7 5.8 12.1 20.8 40.0 41.2Agriculture 3.9 6.1 11.0 12.0 76.4 79.3Transport and communications 27.6 23.8 33.8 47.2 102.1 124.0Other 22.7 27.3 40.5 49.6 103.8 130.8
Net Lending 14.4 14.1 61.6 8.9 -17.4 -27.6 -27.6 -27.6Gross lending 14.9 23.2 67.5 12.1 12.6Repayments 0.5 9.1 5.9 3.2 30.0
Total expenditure and net lending 315.7 368.9 488.9 590.9 711.2 982.6 1091.7 983.4
Memorandum item:
GDP at current market prices 1,280 1,633 1,892 2,316 2,615 2,750 2,750 2,750
Sources: Ministry of Finance and staff estimates
I' The fiscal year runs from April 1 to March 31.2 NFPEs, non-financial public enterprises.
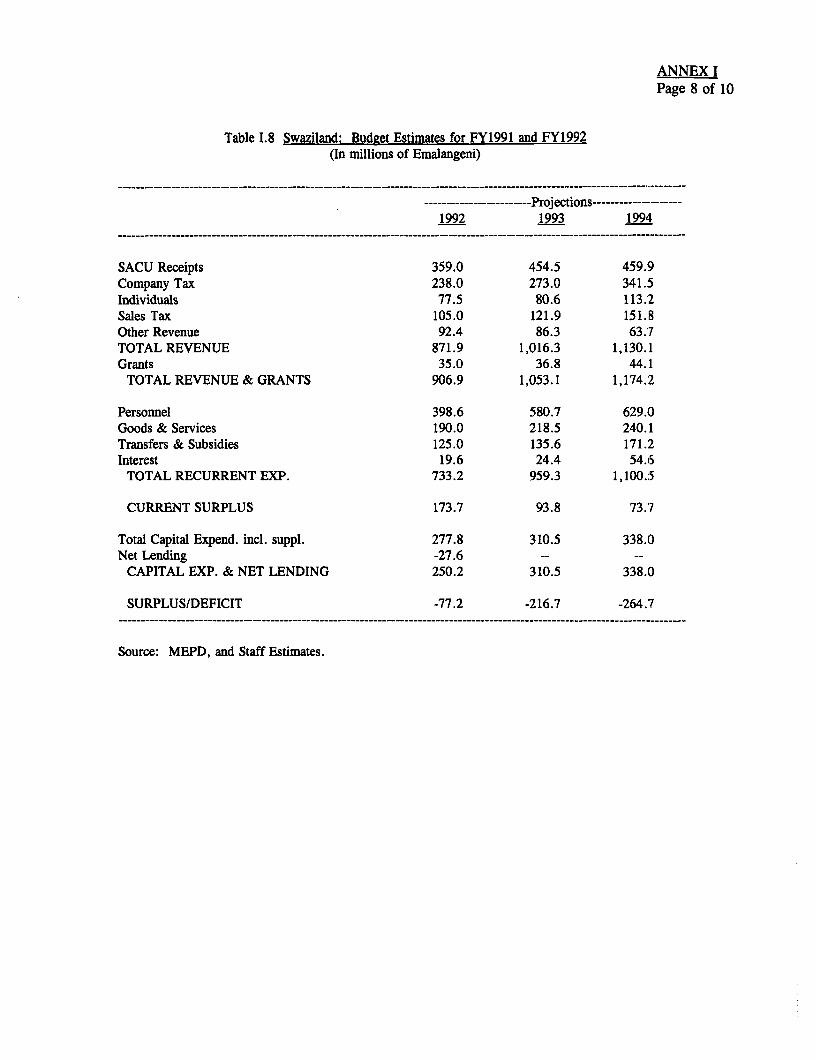
ANNEX IPage 8 of 10
Table 1.8 Swaziland: Budget Estimates for FY1991 and FY1992(In millions of Emalangeni)
------------------------Projections--------------------1992 1993 1994
SACU Receipts 359.0 454.5 459.9Company Tax 238.0 273.0 341.5Individuals 77.5 80.6 113.2Sales Tax 105.0 121.9 151.8Other Revenue 92.4 86.3 63.7TOTAL REVENUE 871.9 1,016.3 1,130.1Grants 35.0 36.8 44.1
TOTAL REVENUE & GRANTS 906.9 1,053.1 1,174.2
Personnel 398.6 580.7 629.0Goods & Services 190.0 218.5 240.1Transfers & Subsidies 125.0 135.6 171.2Interest 19.6 24.4 54.6
TOTAL RECURRENT EXP. 733.2 959.3 1,100.5
CURRENT SURPLUS 173.7 93.8 73.7
Total Capital Expend. incl. suppl. 277.8 310.5 338.0Net Lending -27.6 -- --
CAPITAL EXP. & NET LENDING 250.2 310.5 338.0
SURPLUS/DEFICIT -77.2 -216.7 -264.7
Source: MEPD, and Staff Estimates.
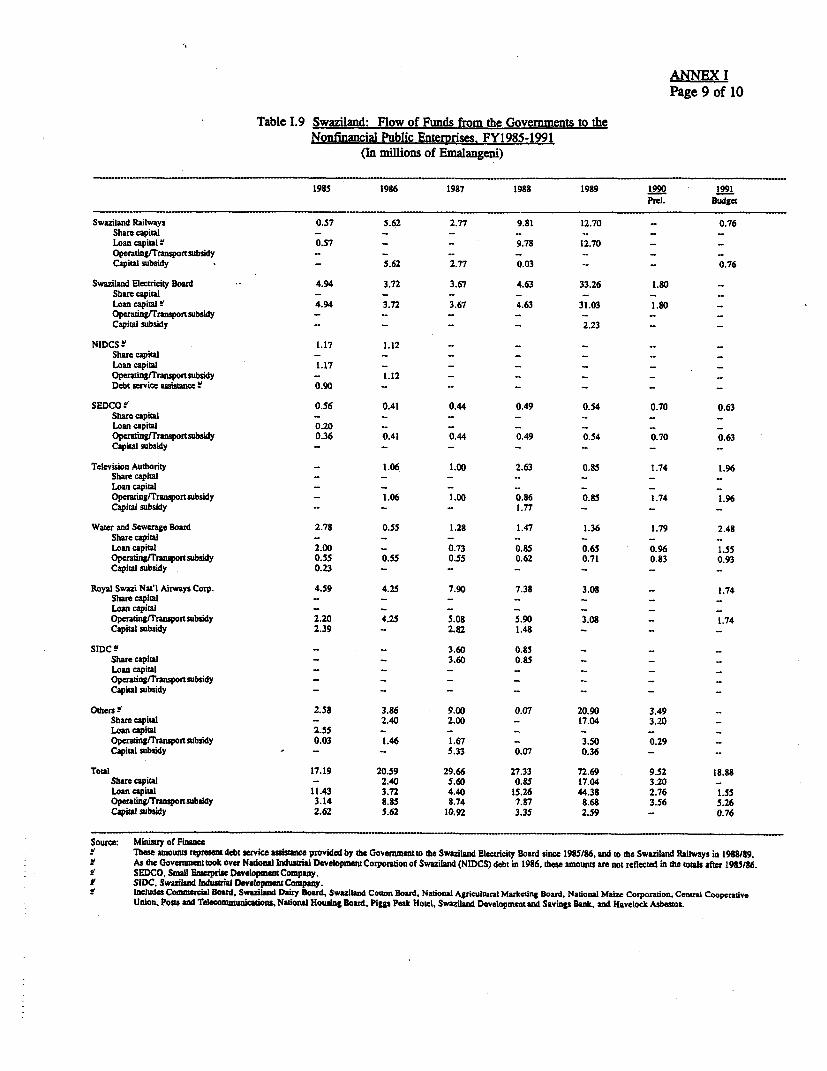
ANNEX IPage 9 of 10
Table 1.9 Swaziland: Flow of Funds from the Governments to theNonfinancial Public Enterprises. FY1985-1991
(In millions of Emalangeni)
1985 1986 1987 1988 1989 1990 1991Prel. Budgat
Swaziland Railways 0.57 5.62 2.77 9.81 12.70 - 0.76Share capitalLoan capitali 0.57 - - 9.78 12.70OperatinglTransportsubsidy _ - - - - - -
Capital subsidy - 5.62 2.77 0.03 - - 0.76
Swaziland Electricity Board 4.94 3.72 3.67 4.63 33.26 1.80 -
Share capital _ _Loan caital p 4.94 3.72 3.67 4.63 31.03 1.80Operating/Transpor subsidy - - - - - -
Capital subsidy - - - - 2.23
NIDCS!' 1.17 1.12 - - - - -
Share capitalLoan capital 1.17 -Operating/Transporsubsidy - 1.12Debt service assisance ! 0.90 - - _- - -
SEDCO d' 0.56 0.41 0.44 0.49 0.54 0.70 0.63Share caital - - - - - -Loan capital 0.20 - - - - - -
Operatg/Trasportsubsidy 0.36 0.41 0.44 0.49 0.54 0.70 0.63Capital subsidy - - - - - -
Television Authority - 1.06 1.00 2.63 0.85 1.74 1.96Shae capital - - - - - -
Loan capital - - - - - -
Operating/Transportsubsidy - 1.06 1.00 0.86 0.85 1.74 1.96Capital subsidy - - 1.77 - - -
Water and Sewerage Board 2.78 0.55 1.28 1.47 1.36 1.79 2.48Share capital - - - - -
Loan capital 2.00 - 0.73 0.85 0.65 0.96 1.55Operating/Transportsubsidy 0.55 0.55 0.55 0.62 0.71 0.83 0.93Capial subsidy 0.23 - - - - - -
Royal Swazi Nat'l Airways Corp. 4.59 4.25 7.90 7.38 3.08 - 1.74Share capital - - - - - -Loan capital - - - - - -
Opeating/Traosportsubsidy 2.20 4.25 5.08 5.90 3.08 - 1.74Capital subsidy 2.39 - 2.82 1.48 - -
SIDC v' -. 3.60 0.85 - - _Share capital - - 3.60 0.85Loan capital - - -Operating/Transportsubsidy - -Capital subsidy _- - - - -_
Others V 2.58 3.86 9.00 0.07 20.90 3.49 -
Share capital - 2.40 2.00 - 17.04 3.20Loan capital 2.55 - - - -
operatlng/Transporsubsidy 0.03 1.46 1.67 - 3.50 0.29Capital subsidy - - - 5.33 0.07 0.36 - -
Total 17.19 20.59 29.66 27.33 72.69 9.52 18.88Share capital - 2.40 5.60 0.85 17.04 3.20 -
Loan capital 11.43 3.72 4.40 15.26 44.38 2.76 1.55Operating/Transportsubidy 3.14 8.85 8.74 7.87 8.68 3.56 5.26Capital subsidy 2.62 5.62 10.92 3.35 2.59 - 0.76
Source: Ministry of Fnantce7These amounts represent debt service assistance provided by the Goverttnte to the Swaziland Electricity Board since 1985/86, and to the Swaziland Railways in 1988/89.
s As the Government took over National Industrial Development Corporation of Swaziland (NIDCS) debt in 1986, these amounts are not reflectd in the totals after 1985/86.B SEDCO, Smaul Entetprise Deveiopment Company.
SIDC. Swazilan ndusial Development Comupny.f Includes Commerial Board. Swaziland Dairy Board, Swaziland Cotton Board, National Agricultural Markcting Board, National Maize Corporation, Central Cooperaive
Union, Posts and Telecommunicatona, Nadonal Howsing Board, Piggs Peak Hotel, Swaziland Developrnenc and Savins Bank, and Havelock Asbestoa.
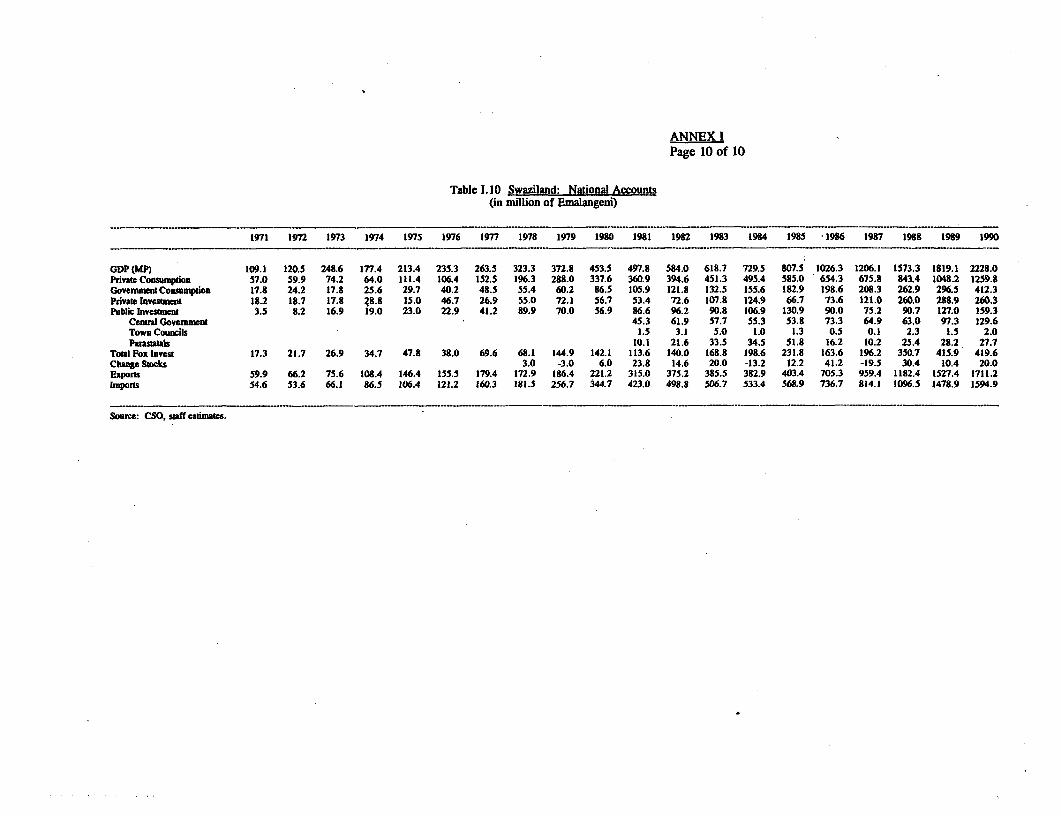
ANNEX IPage 10 of 10
Table 1.10 Swaziland: National Accounts(in million of Emalangeni)
1971 1972 1973 1974 1975 1976 1977 1978 1979 1980 1981 1982 1983 1984 1985 1986 1987 1988 1989 1990
GDP (MP) 109.1 120.5 248.6 177.4 213.4 235.3 263.5 323.3 372.8 453.5 497.8 584.0 618.7 729.5 807.5 1026.3 1206.1 1573.3 1819.1 2228.0Private Consumpdon 57.0 59.9 74.2 64.0 111.4 106.4 152.5 196.3 288.0 337.6 360.9 394.6 451.3 495.4 585.0 654.3 675.8 843.4 1048.2 1259.8GovernmentCon.wmption 17.8 24.2 17.8 25.6 29.7 40.2 48.5 55.4 60.2 86.5 105.9 121.8 132.5 155.6 182.9 198.6 208.3 262.9 296.5 412.3Paivate Invesunent 18.2 18.7 17.8 28.8 15.0 46.7 26.9 55.0 72.1 56.7 53.4 72.6 107.8 124.9 66.7 73.6 121.0 260.0 288.9 260.3Public Invesunent 3.5 8.2 16.9 19.0 23.0 22.9 41.2 89.9 70.0 56.9 86.6 96.2 90.8 106.9 130.9 90.0 75.2 90.7 127.0 159.3
Centr Government 45.3 61.9 57.7 55.3 53.8 73.3 64.9 63.0 97.3 129.6Town Counaits 1.5 3.1 5.0 1.0 1.3 0.5 0.1 2.3 1.5 2.0Parastatals 10.1 21.6 33.5 34.5 51.8 16.2 10.2 25.4 28.2 27.7
Total Fox Invest 17.3 21.7 26.9 34.7 47.8 38.0 69.6 68.1 144.9 142.1 113.6 140.0 168.8 198.6 231.8 163.6 196.2 350.7 415.9 419.6Chane Stocks 3.0 -3.0 6.0 23.8 14.6 20.0 -13.2 12.2 41.2 -19.5 30.4 10.4 20.0Expons 59.9 66.2 75.6 108.4 146.4 155.5 179.4 172.9 186.4 221.2 315.0 375.2 385.5 382.9 403.4 705.3 959.4 1182.4 1527.4 1711.2mports 54.6 53.6 66.1 86.5 106.4 121.2 160.3 181.5 256.7 344.7 423.0 498.8 506.7 533.4 568.9 736.7 814.1 1096.5 1478.9 1594.9
Source: CSO. staff estmates.
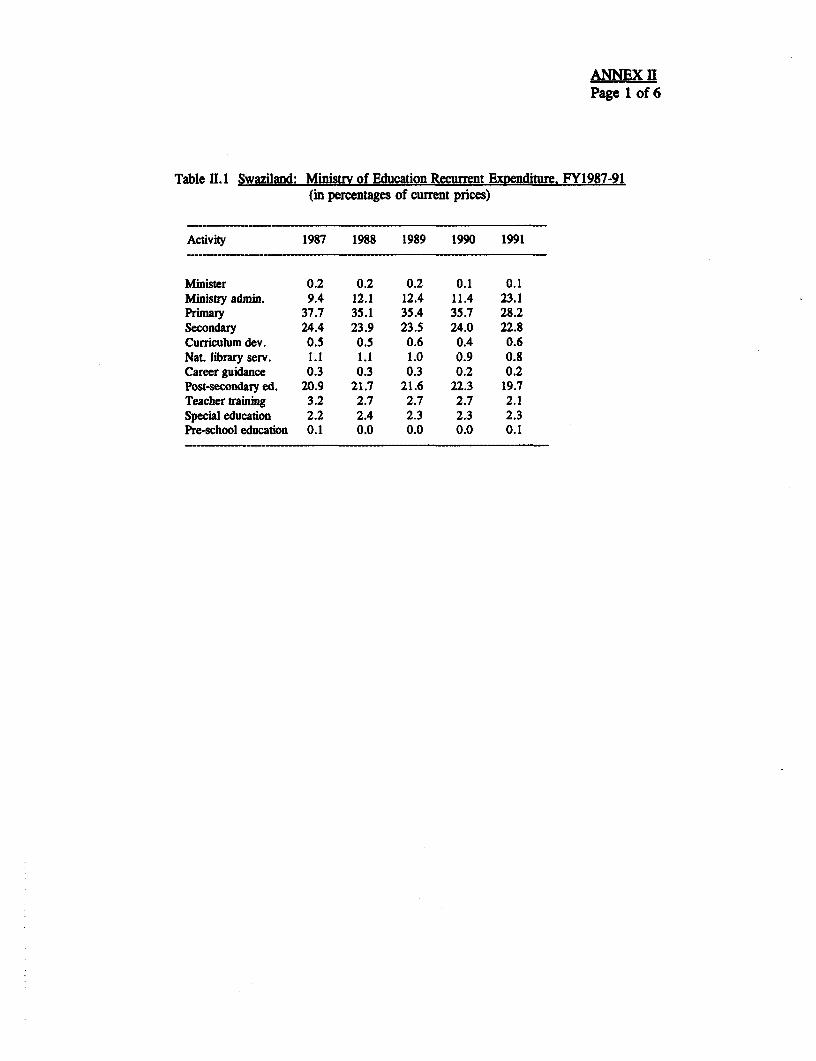
ANNEX IIPage 1 of 6
Table 1. 1 Swaziland: Ministry of Education Recurrent Exoenditure. FY1987-91(in percentages of current prices)
Activity 1987 1988 1989 1990 1991
Minister 0.2 0.2 0.2 0.1 0.1Ministry admin. 9.4 12.1 12.4 11.4 23.1Primary 37.7 35.1 35.4 35.7 28.2Secondary 24.4 23.9 23.5 24.0 22.8Curriculum dev. 0.5 0.5 0.6 0.4 0.6Nat. library serv. 1.1 1.1 1.0 0.9 0.8Career guidance 0.3 0.3 0.3 0.2 0.2Post-secondary ed. 20.9 21.7 21.6 22.3 19.7Teacher training 3.2 2.7 2.7 2.7 2.1Special education 2.2 2.4 2.3 2.3 2.3Pre-school education 0.1 0.0 0.0 0.0 0.1
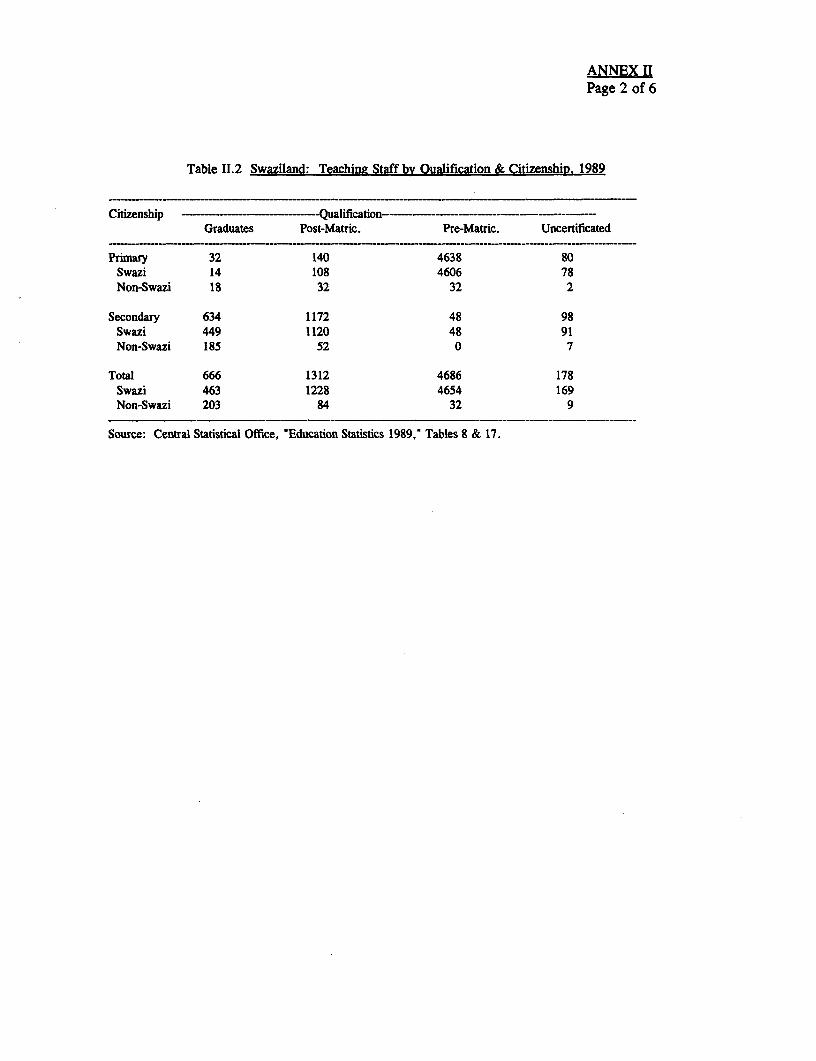
ANNEX IIPage 2 of 6
Table 11.2 Swaziland: Teaching Staff by Oualification & CitizenshiD. 1989
Citizenship -- -- Qualification---------Graduates Post-Matric. Pre-Matric. Uncertificated
Primary 32 140 4638 80Swazi 14 108 4606 78Non-Swazi 18 32 32 2
Secondary 634 1172 48 98Swazi 449 1120 48 91Non-Swazi 185 52 0 7
Total 666 1312 4686 178Swazi 463 1228 4654 169Non-Swazi 203 84 32 9
Source: Central Statistical Office, "Education Statistics 1989," Tables 8 & 17.

ANNEX IIPage 3 of 6
Table I.3 Swaziland: Estimated Enrolment at Post-SecondarvInstitutions. 1991
Instituion Number
University of Swaziland 1716William Pitcher College 428Ngwane Teachers' Training College 372Nazarene Teachers' Training College 139Swaziland Institute of Health Sciences 300Nazarene Nursing College 151Swaziland College of Technology 692Vocational Training Institute, Matsapha 240 '
Total 4038 Y'
Sources: Field interviews; Ministry of EducationI' Maximum at any one time.LR In addition, the privately run Manzini Industrial Training
Center has 250 trainees. Two-thirds of its posts are fundedby the Govermnent.

ANNEX I][Page 4 of 16
Table 11.4 Swaziland: Number of Full-time StudentsUniversity of Swaziland. 1982-87
Year Number % change
1980 866 --1981 966 11.51982 1058 9.51983 1105 4.41984 1198 8.41985 1182 -1.31986 1287 8.91987 1357 5.41988 1422 4.81989 1538 8.21990 1716 11.6
Source: University of Swaziland Development Plan,1988/89-1992/93; University of SwazilandRegistrar's Office.
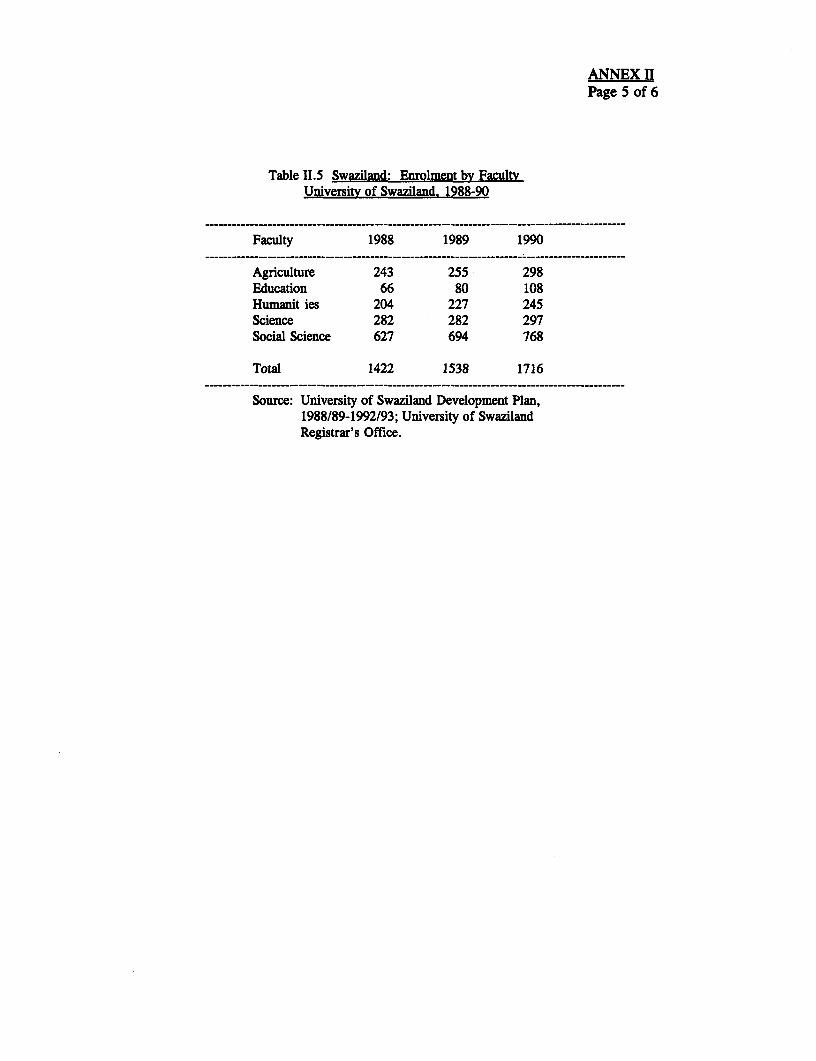
ANNEX IIPage 5 of 6
Table 11.5 Swaziland: Enrolment by FacultyUniversitv of Swaziland. 1988-90
Faculty 1988 1989 1990
Agriculture 243 255 298Education 66 80 108Humanit ies 204 227 245Science 282 282 297Social Science 627 694 768
Total 1422 1538 1716
Source: University of Swaziland Development Plan,1988/89-1992/93; University of SwazilandRegistrar's Office.
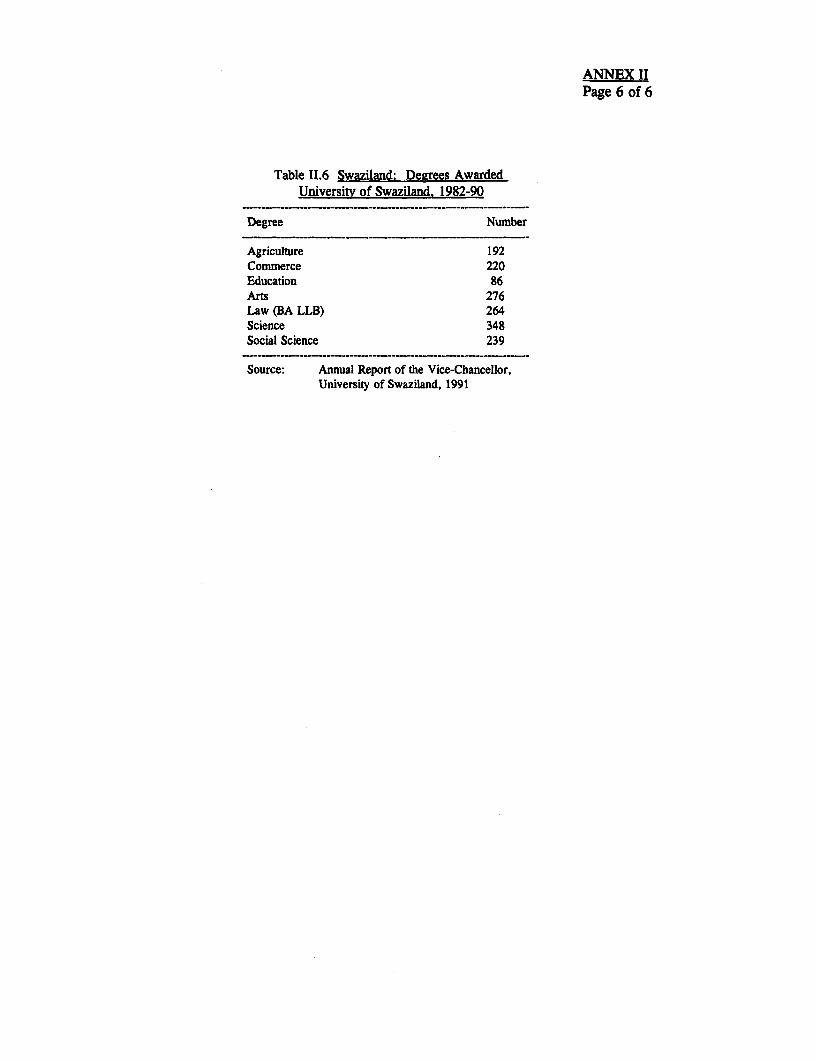
ANNEX I!Page 6 of 6
Table 11.6 Swaziland: Degrees AwardedUniversity of Swaziland. 1982-90
Degree Number
Agriculture 192Commerce 220Education 86Arts 276Law (BA LLB) 264Science 348Social Science 239
Source: Annual Report of the Vice-Chancellor,University of Swaziland, 1991