Embed Size (px)
Citation preview
Making Access Possible (MAP) in Swaziland
Stakeholder presentation: 2 April 2014
A. MAP process and overview
B. Context and regulatory drivers
C. Understanding the target market
D. Provision overview
E. Financial inclusion priorities
F. Imperatives to extend access
G. Towards a roadmap
MAP Swaziland: Agenda
2
A. MAP PROCESS AND OVERVIEW
3
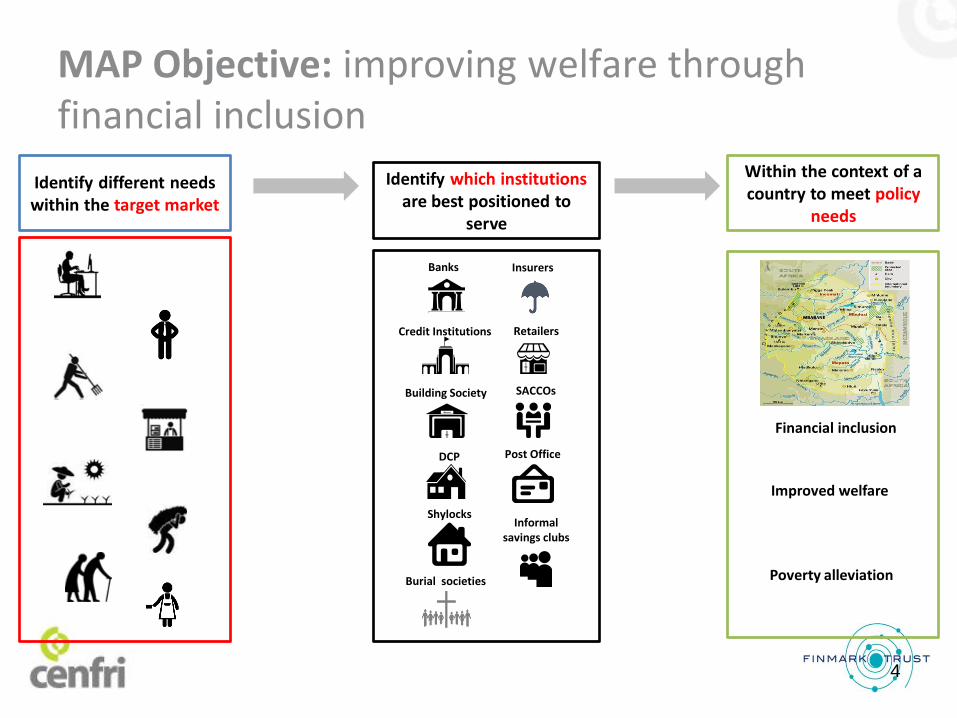
Identify different needs within the target market
Within the context of a country to meet policy
needs
MAP Objective: improving welfare through financial inclusion
Poverty alleviation
Financial inclusion
Improved welfare
Identify which institutions are best positioned to
serve
Shylocks
Retailers
Banks
DCP
Insurers
SACCOs
Burial societies
Informal savings clubs
Credit Institutions
Building Society
Post Office
4
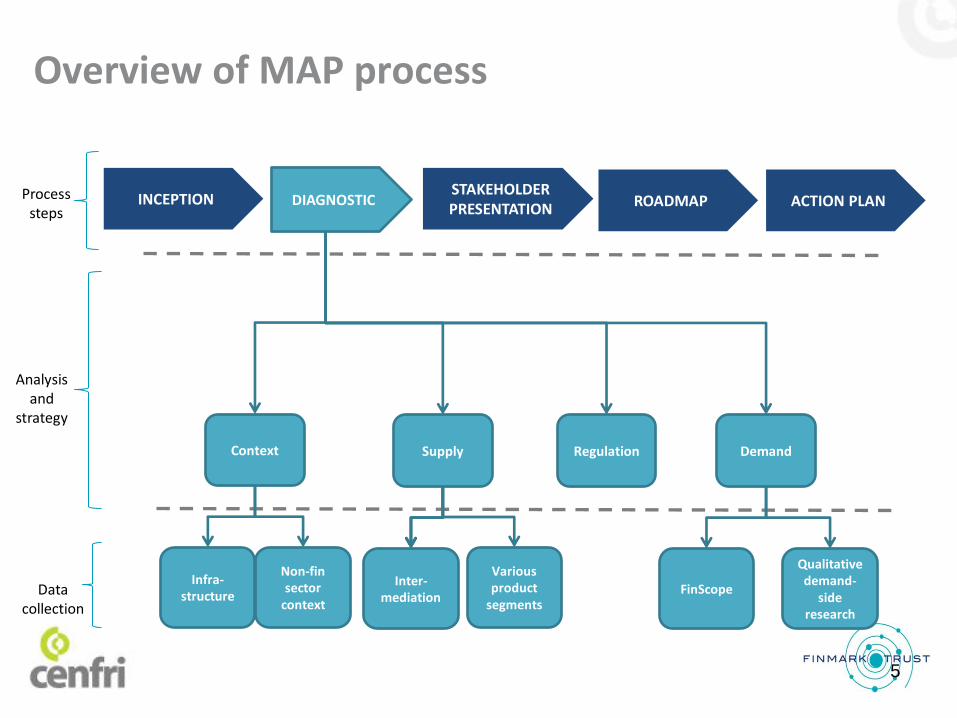
Overview of MAP process
DIAGNOSTIC Process steps
Analysis and
strategy
Data collection
Supply Demand Regulation
Inter-mediation
Various product
segments
Infra-structure
Non-fin sector
context FinScope
Qualitative demand-
side research
INCEPTION STAKEHOLDER PRESENTATION ROADMAP ACTION PLAN
Context
5
B. CONTEXT AND REGULATORY DRIVERS
6
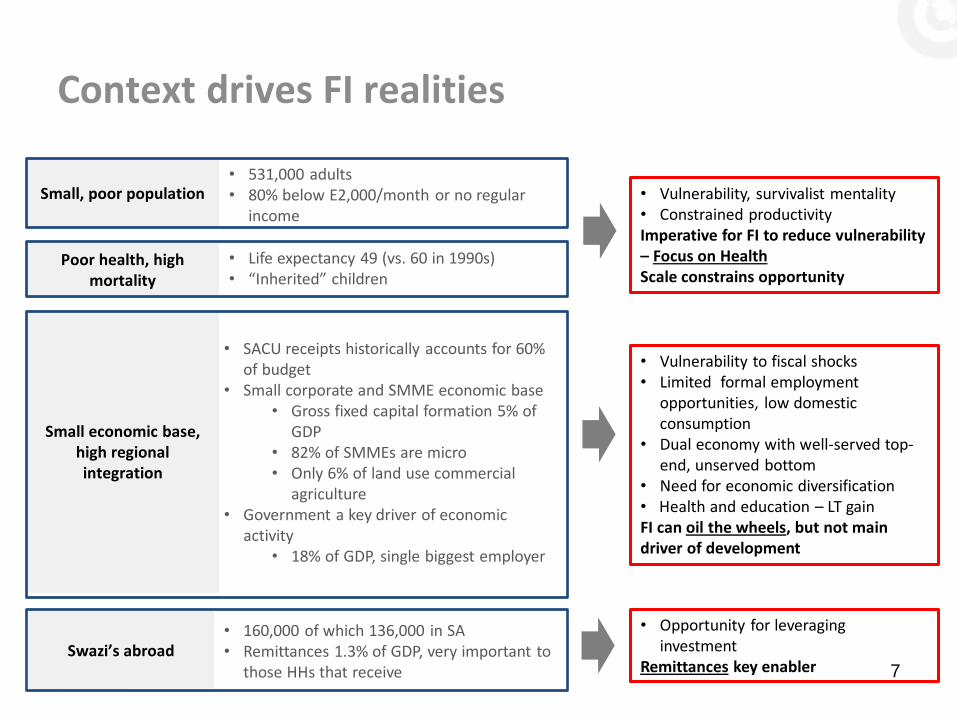
Context drives FI realities
Small, poor population • 531,000 adults • 80% below E2,000/month or no regular
income
Poor health, high mortality
• Life expectancy 49 (vs. 60 in 1990s) • “Inherited” children
Small economic base, high regional integration
• SACU receipts historically accounts for 60% of budget
• Small corporate and SMME economic base • Gross fixed capital formation 5% of
GDP • 82% of SMMEs are micro • Only 6% of land use commercial
agriculture • Government a key driver of economic
activity • 18% of GDP, single biggest employer
• Vulnerability, survivalist mentality • Constrained productivity Imperative for FI to reduce vulnerability – Focus on Health Scale constrains opportunity
• 160,000 of which 136,000 in SA • Remittances 1.3% of GDP, very important to
those HHs that receive Swazi’s abroad
• Vulnerability to fiscal shocks • Limited formal employment
opportunities, low domestic consumption
• Dual economy with well-served top-end, unserved bottom
• Need for economic diversification • Health and education – LT gain FI can oil the wheels, but not main driver of development
• Opportunity for leveraging investment
Remittances key enabler 7
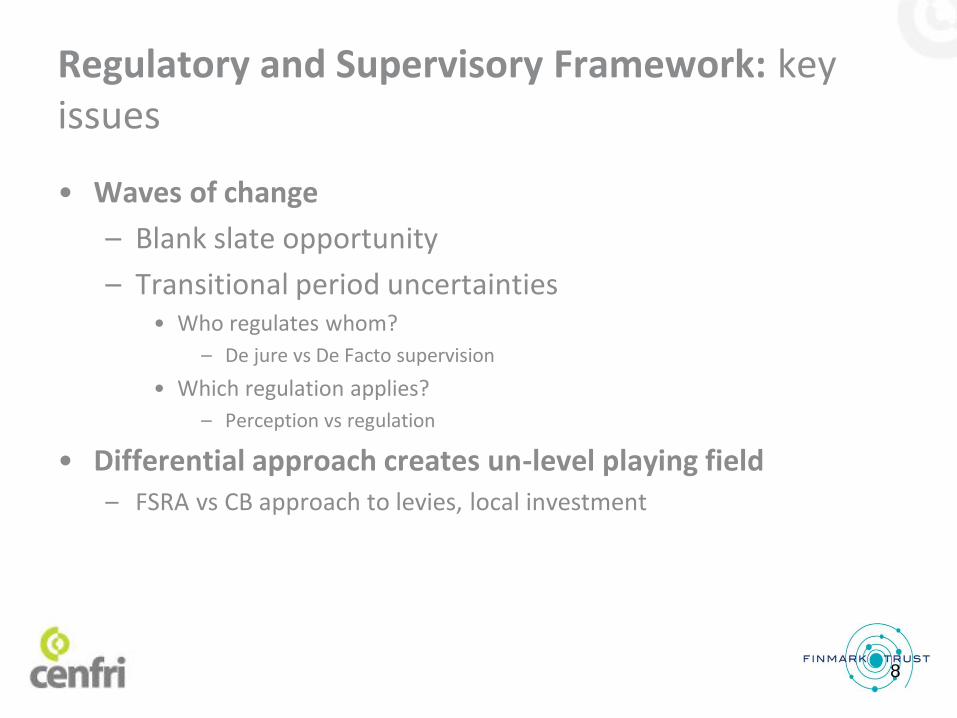
Regulatory and Supervisory Framework: key issues
• Waves of change
– Blank slate opportunity
– Transitional period uncertainties • Who regulates whom?
– De jure vs De Facto supervision
• Which regulation applies?
– Perception vs regulation
• Differential approach creates un-level playing field – FSRA vs CB approach to levies, local investment
8
C. UNDERSTANDING THE TARGET MARKET
9
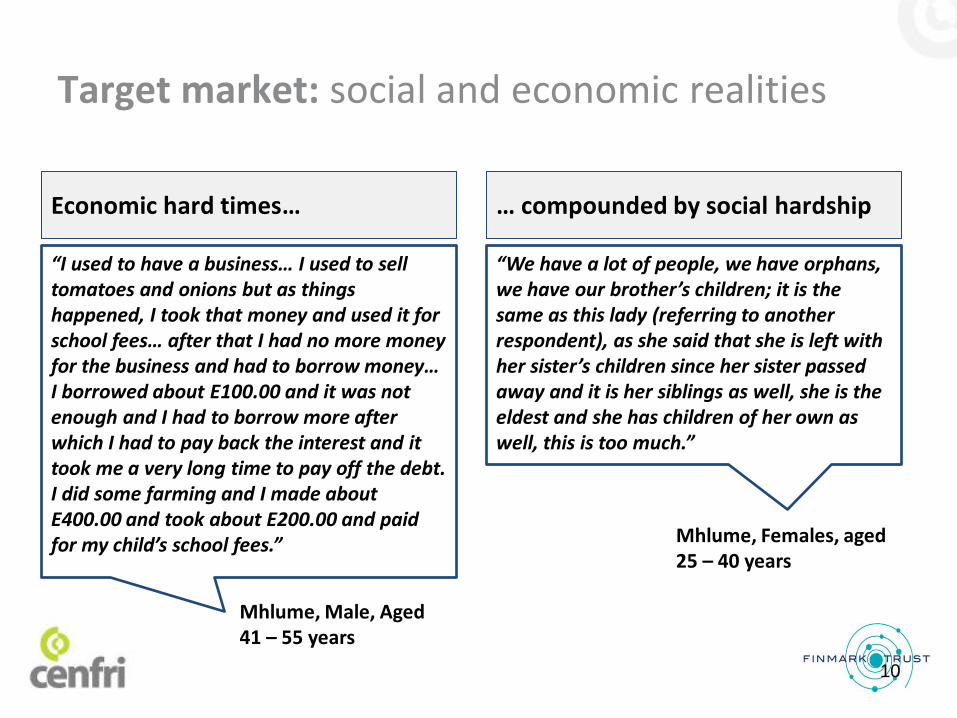
Target market: social and economic realities
Economic hard times… … compounded by social hardship
“We have a lot of people, we have orphans, we have our brother’s children; it is the same as this lady (referring to another respondent), as she said that she is left with her sister’s children since her sister passed away and it is her siblings as well, she is the eldest and she has children of her own as well, this is too much.”
Mhlume, Females, aged 25 – 40 years
“I used to have a business… I used to sell tomatoes and onions but as things happened, I took that money and used it for school fees… after that I had no more money for the business and had to borrow money… I borrowed about E100.00 and it was not enough and I had to borrow more after which I had to pay back the interest and it took me a very long time to pay off the debt. I did some farming and I made about E400.00 and took about E200.00 and paid for my child’s school fees.”
Mhlume, Male, Aged 41 – 55 years
10
Gro
ceri
es
Sch
oo
l Fee
s
Bu
sin
ess
Sto
ck
Tran
spo
rt
Serv
icin
g Lo
ans
Am
enit
ies
Oth
er
Air
tim
e
Savi
ngs
Ren
t
Co
-op
erat
ives
/…
Fin
anci
al s
up
po
rt…
Po
licie
s
Emer
gen
cy f
un
d…
Ente
rtai
nm
ent
Gro
ceri
es
Serv
icin
g L
oan
s
School F
ees
Oth
er
Rent
Busin
ess S
tock
Am
enitie
s
Fin
ancia
l supp
ort
…
Tra
nsport
Savin
gs
Airtim
e
Co-o
pe
rative
s/…
Ente
rtain
me
nt
Em
erg
ency fund…
Polic
ies
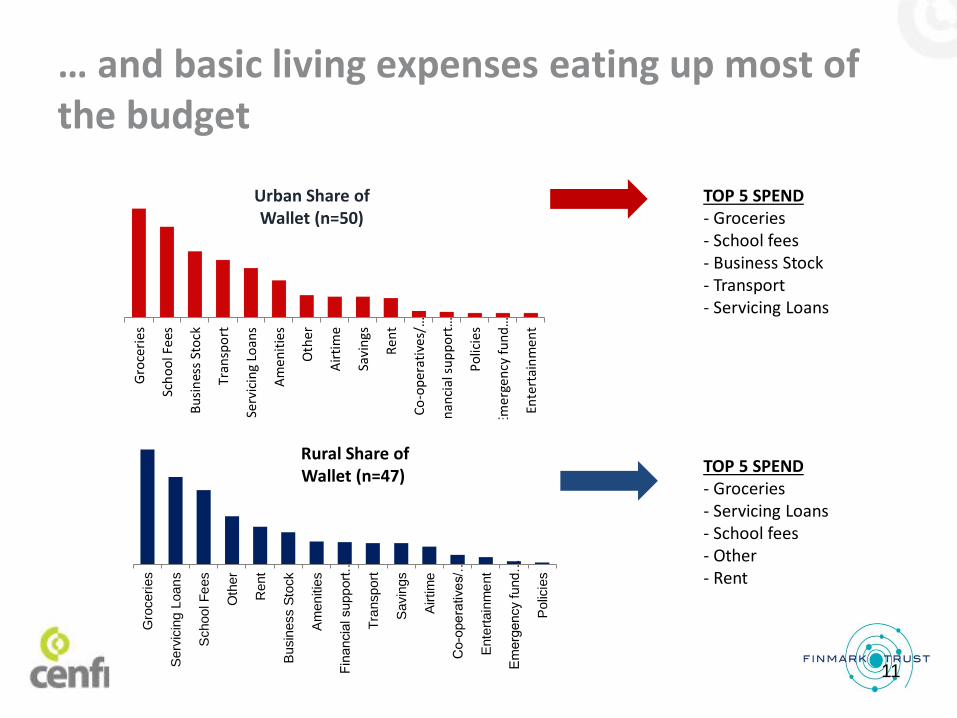
TOP 5 SPEND - Groceries - School fees - Business Stock - Transport - Servicing Loans
TOP 5 SPEND - Groceries - Servicing Loans - School fees - Other - Rent
Urban Share of Wallet (n=50)
Rural Share of Wallet (n=47)
… and basic living expenses eating up most of the budget
11

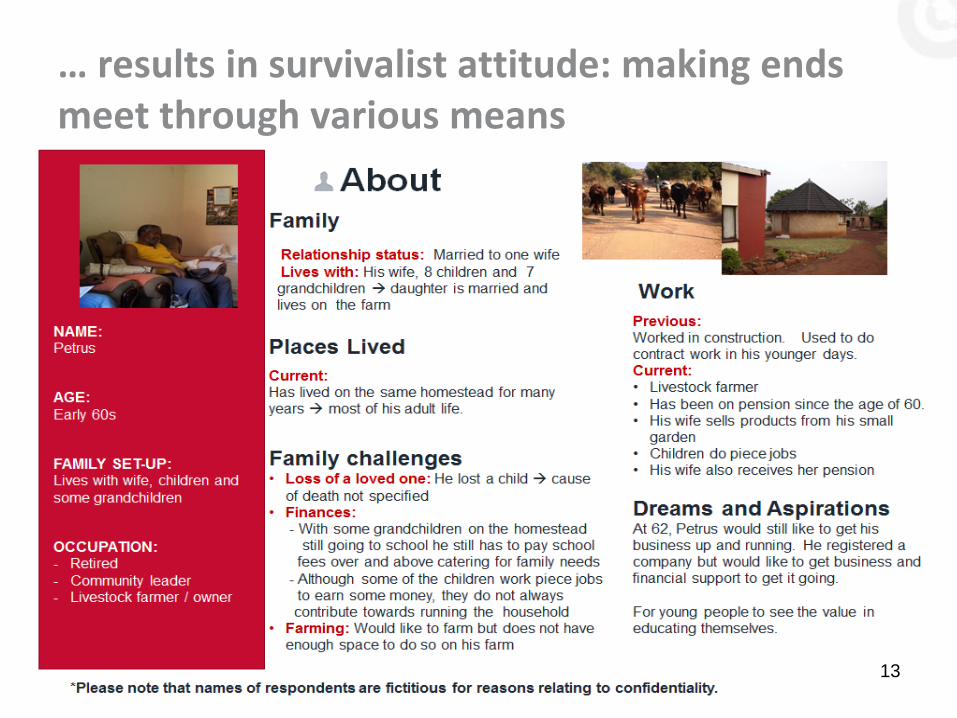
… results in survivalist attitude: making ends meet through various means
“I am self-employed selling fruits and veggies and the amount is R900 and my husband gets R1000 monthly from helping people and I stock up sweets for my kids to sell at school and from that we get R120.”
Manzini, Female, Aged 25 – 40 years
R:I have four sources. M:Tell us about it, what are they? R:The first one is self-employment, they add up to R950. M:Part time jobs. R:Yes. M:Alright. R:And my employer, where I stay, he gives me R700 and there is this other part time job that pays me R60 per day but I asked them to give it to me monthly, which is R280 and when the guy that runs a car wash calls me, it depends on how often I go, he gives me R400 per month.
Mhlume, Males, Aged 25 – 40 years
“I have got 2 sources of income, it’s the one that I am making myself which is R2 000 and then my wife sells eggs, chickens, biscuits and those sorts of things and when she calculates her profit at the end of the month she will have made R500.”
Manzini, Male, Aged 25 – 40 years
12
… results in survivalist attitude: making ends meet through various means
“I am self-employed selling fruits and veggies and the amount is R900 and my husband gets R1000 monthly from helping people and I stock up sweets for my kids to sell at school and from that we get R120.”
Manzini, Female, Aged 25 – 40 years
R:I have four sources. M:Tell us about it, what are they? R:The first one is self-employment, they add up to R950. M:Part time jobs. R:Yes. M:Alright. R:And my employer, where I stay, he gives me R700 and there is this other part time job that pays me R60 per day but I asked them to give it to me monthly, which is R280 and when the guy that runs a car wash calls me, it depends on how often I go, he gives me R400 per month.
Mhlume, Males, Aged 25 – 40 years
“I have got 2 sources of income, it’s the one that I am making myself which is R2 000 and then my wife sells eggs, chickens, biscuits and those sorts of things and when she calculates her profit at the end of the month she will have made R500.”
Manzini, Male, Aged 25 – 40 years
13
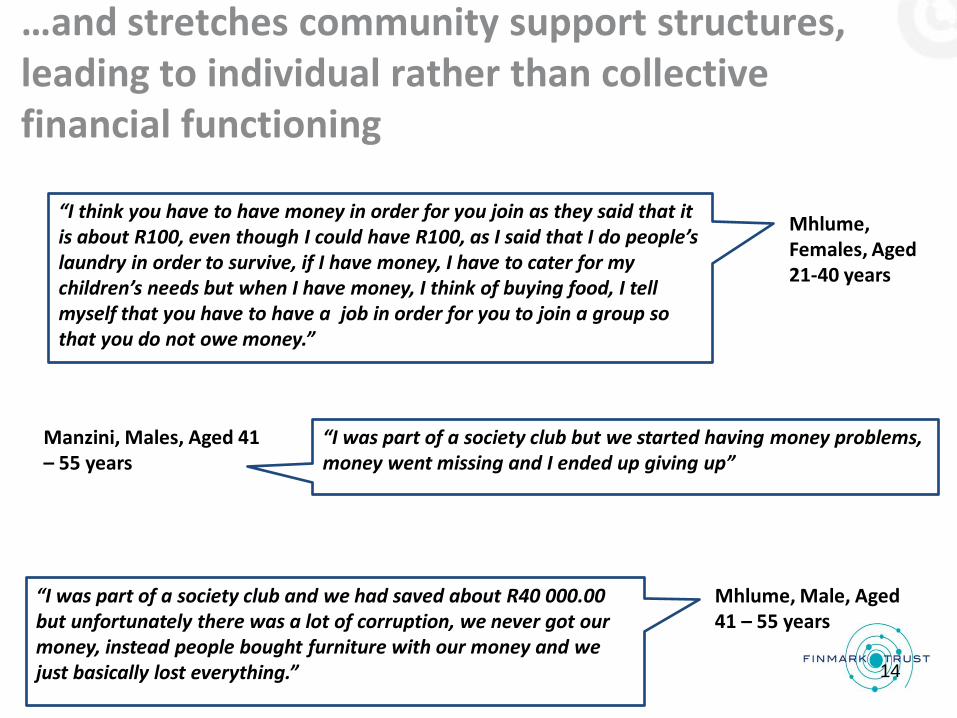
…and stretches community support structures, leading to individual rather than collective financial functioning
“I was part of a society club but we started having money problems, money went missing and I ended up giving up”
Manzini, Males, Aged 41 – 55 years
“I think you have to have money in order for you join as they said that it is about R100, even though I could have R100, as I said that I do people’s laundry in order to survive, if I have money, I have to cater for my children’s needs but when I have money, I think of buying food, I tell myself that you have to have a job in order for you to join a group so that you do not owe money.”
Mhlume, Females, Aged 21-40 years
“I was part of a society club and we had saved about R40 000.00 but unfortunately there was a lot of corruption, we never got our money, instead people bought furniture with our money and we just basically lost everything.”
Mhlume, Male, Aged 41 – 55 years
14
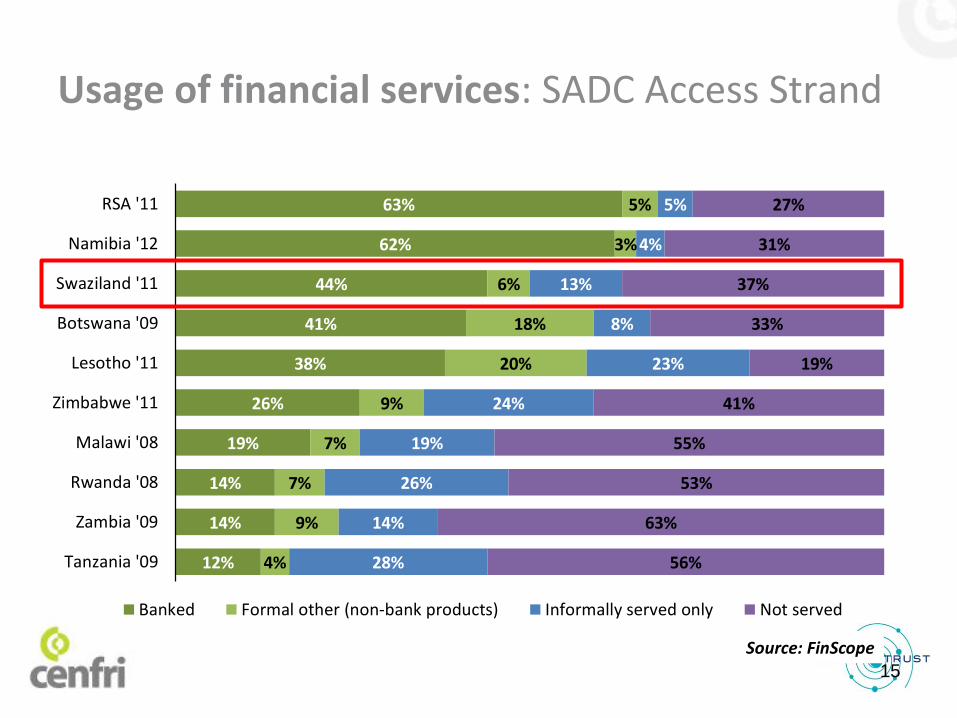
Source: FinScope
Usage of financial services: SADC Access Strand
15
63%
62%
44%
41%
38%
26%
19%
14%
14%
12%
5%
3%
6%
18%
20%
9%
7%
7%
9%
4%
5%
4%
13%
8%
23%
24%
19%
26%
14%
28%
27%
31%
37%
33%
19%
41%
55%
53%
63%
56%
RSA '11
Namibia '12
Swaziland '11
Botswana '09
Lesotho '11
Zimbabwe '11
Malawi '08
Rwanda '08
Zambia '09
Tanzania '09
Banked Formal other (non-bank products) Informally served only Not served

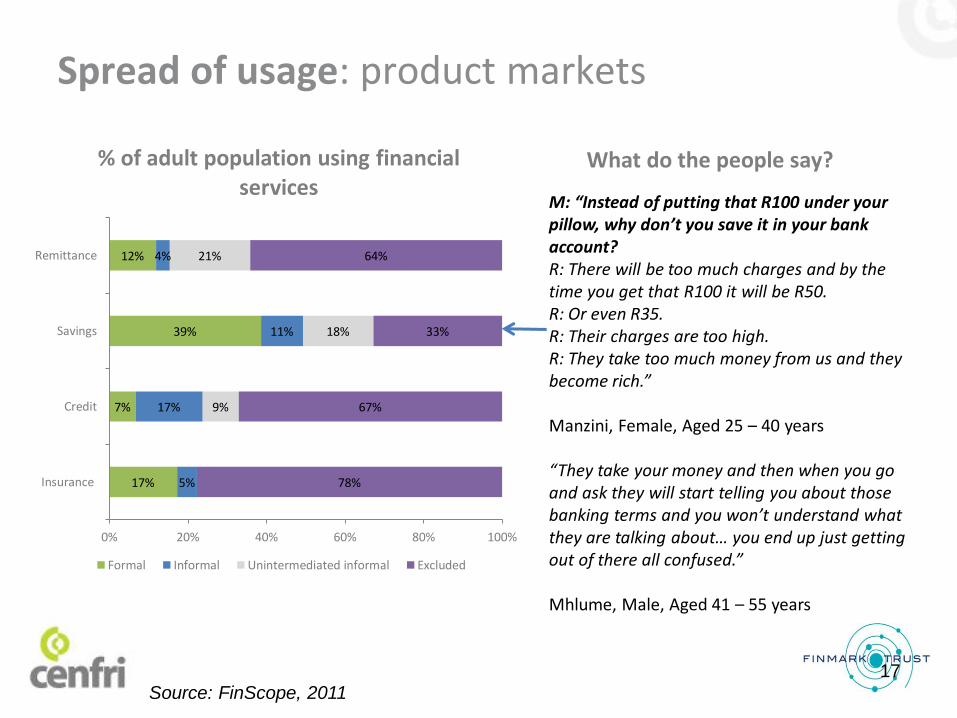
Spread of usage: product markets
17%
7%
39%
12%
5%
17%
11%
4%
9%
18%
21%
78%
67%
33%
64%
0% 20% 40% 60% 80% 100%
Insurance
Credit
Savings
Remittance
% of adult population using financial services
Formal Informal Unintermediated informal Excluded
Source: FinScope, 2011
What do the people say?
M:So what would you say are the advantages of using mobile money, how does it benefit people? R:It cuts down on costs M:Cut down on costs, how? R:Like instead of having to use transport to take money to whoever you are giving the money to you can just send it this way as a very low cost. You just have to inform them to go and collect it via SMS R:Like my bother here was saying there is eWallet and the advantage that it has over mobile money is that with mobile money you have to go to one of their centres to collect the money whereas with eWallet you can go to the ATM to withdraw the money at 11 in the evening, it never closes. So as long as you have got the PIN code you can access your money anytime day or night.
16
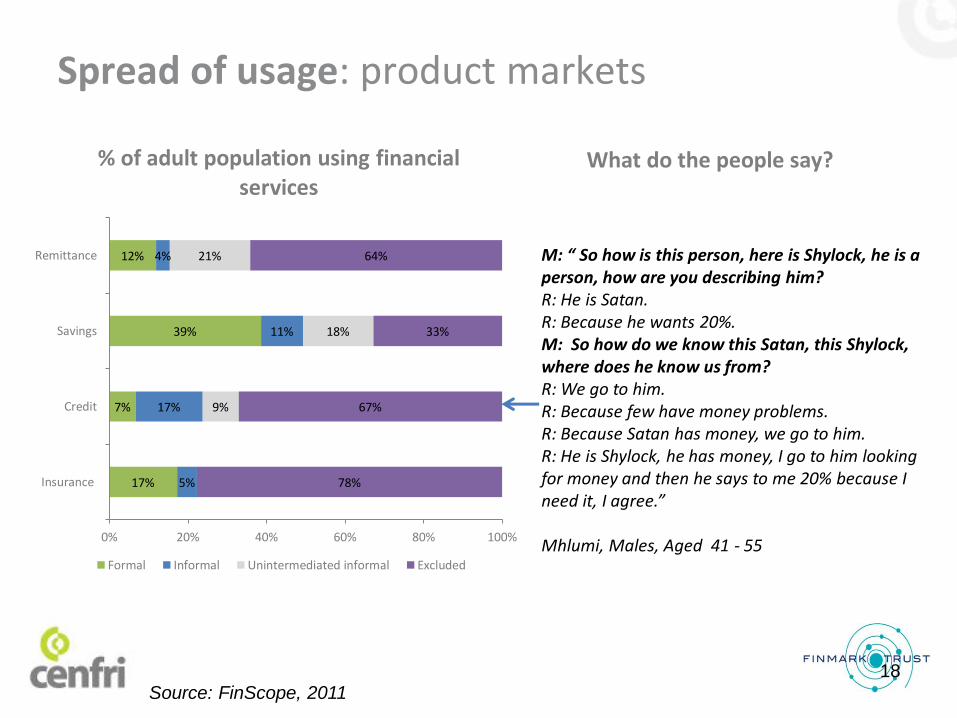
Spread of usage: product markets
17%
7%
39%
12%
5%
17%
11%
4%
9%
18%
21%
78%
67%
33%
64%
0% 20% 40% 60% 80% 100%
Insurance
Credit
Savings
Remittance
% of adult population using financial services
Formal Informal Unintermediated informal Excluded
Source: FinScope, 2011
What do the people say?
M: “Instead of putting that R100 under your pillow, why don’t you save it in your bank account? R: There will be too much charges and by the time you get that R100 it will be R50. R: Or even R35. R: Their charges are too high. R: They take too much money from us and they become rich.” Manzini, Female, Aged 25 – 40 years “They take your money and then when you go and ask they will start telling you about those banking terms and you won’t understand what they are talking about… you end up just getting out of there all confused.” Mhlume, Male, Aged 41 – 55 years
17
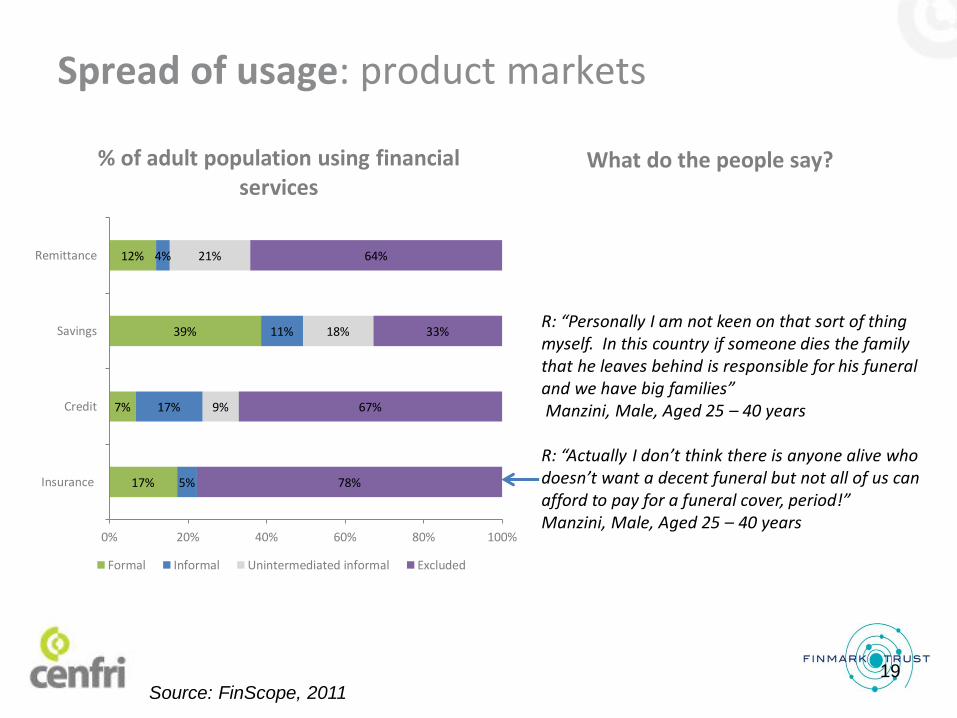
Spread of usage: product markets
17%
7%
39%
12%
5%
17%
11%
4%
9%
18%
21%
78%
67%
33%
64%
0% 20% 40% 60% 80% 100%
Insurance
Credit
Savings
Remittance
% of adult population using financial services
Formal Informal Unintermediated informal Excluded
Source: FinScope, 2011
What do the people say?
M: “ So how is this person, here is Shylock, he is a person, how are you describing him? R: He is Satan. R: Because he wants 20%. M: So how do we know this Satan, this Shylock, where does he know us from? R: We go to him. R: Because few have money problems. R: Because Satan has money, we go to him. R: He is Shylock, he has money, I go to him looking for money and then he says to me 20% because I need it, I agree.” Mhlumi, Males, Aged 41 - 55
18
Spread of usage: product markets
17%
7%
39%
12%
5%
17%
11%
4%
9%
18%
21%
78%
67%
33%
64%
0% 20% 40% 60% 80% 100%
Insurance
Credit
Savings
Remittance
% of adult population using financial services
Formal Informal Unintermediated informal Excluded
Source: FinScope, 2011
What do the people say?
R: “Personally I am not keen on that sort of thing myself. In this country if someone dies the family that he leaves behind is responsible for his funeral and we have big families” Manzini, Male, Aged 25 – 40 years R: “Actually I don’t think there is anyone alive who doesn’t want a decent funeral but not all of us can afford to pay for a funeral cover, period!” Manzini, Male, Aged 25 – 40 years
19
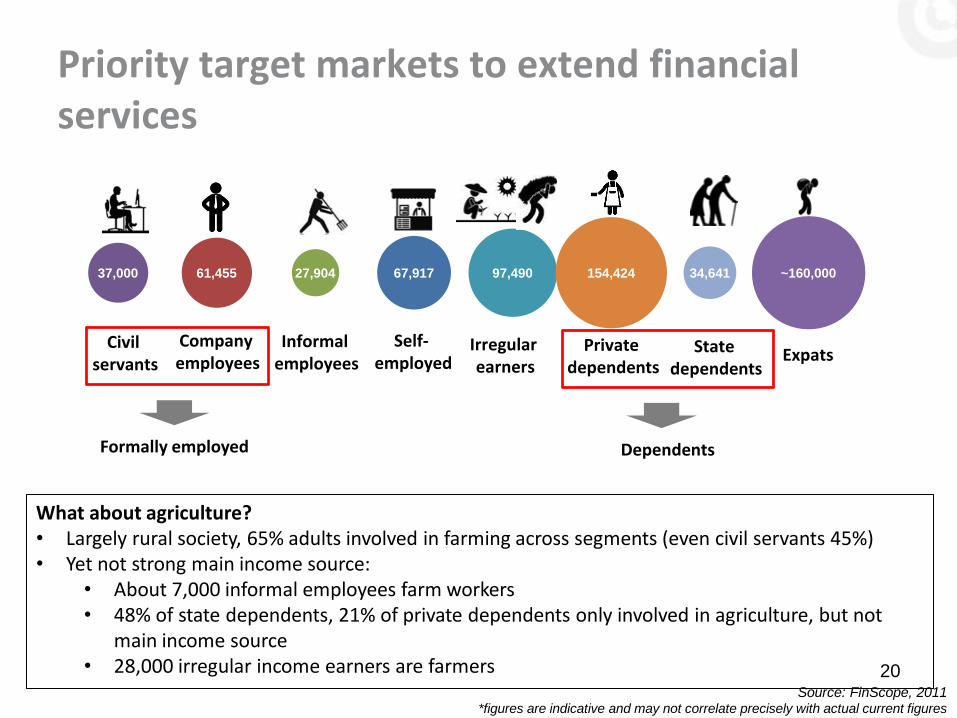
What about agriculture? • Largely rural society, 65% adults involved in farming across segments (even civil servants 45%) • Yet not strong main income source:
• About 7,000 informal employees farm workers • 48% of state dependents, 21% of private dependents only involved in agriculture, but not
main income source • 28,000 irregular income earners are farmers
Source: FinScope, 2011 *figures are indicative and may not correlate precisely with actual current figures
Priority target markets to extend financial services
20
67,91761,455 27,90437,000 97,490 154,424 34,641 ~160,000
Civil servants
Company employees
Informalemployees
Self-employed
Irregular earners
Private dependents
State dependents
Dependents
Expats
Formally employed

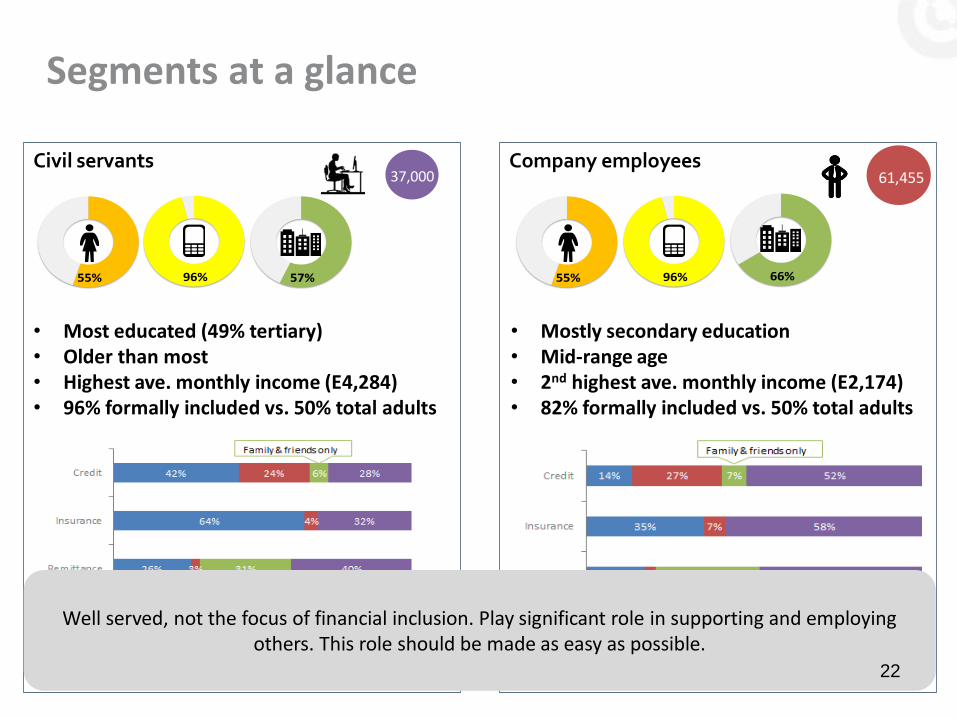
Company employees 61,455
66%96%55%
• Mostly secondary education • Mid-range age • 2nd highest ave. monthly income (E2,174) • 82% formally included vs. 50% total adults
Civil servants 37,000
96%55% 57%
• Most educated (49% tertiary) • Older than most • Highest ave. monthly income (E4,284) • 96% formally included vs. 50% total adults
Segments at a glance
21
Company employees 61,455
66%96%55%
• Mostly secondary education • Mid-range age • 2nd highest ave. monthly income (E2,174) • 82% formally included vs. 50% total adults
Civil servants 37,000
96%55% 57%
• Most educated (49% tertiary) • Older than most • Highest ave. monthly income (E4,284) • 96% formally included vs. 50% total adults
Well served, not the focus of financial inclusion. Play significant role in supporting and employing others. This role should be made as easy as possible.
Segments at a glance
22
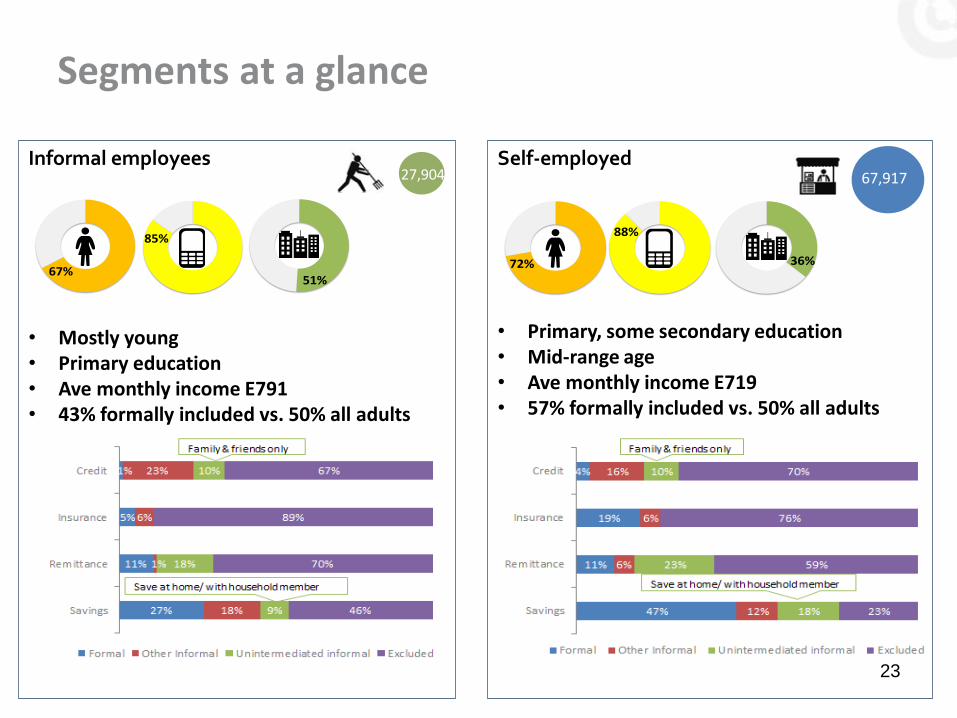
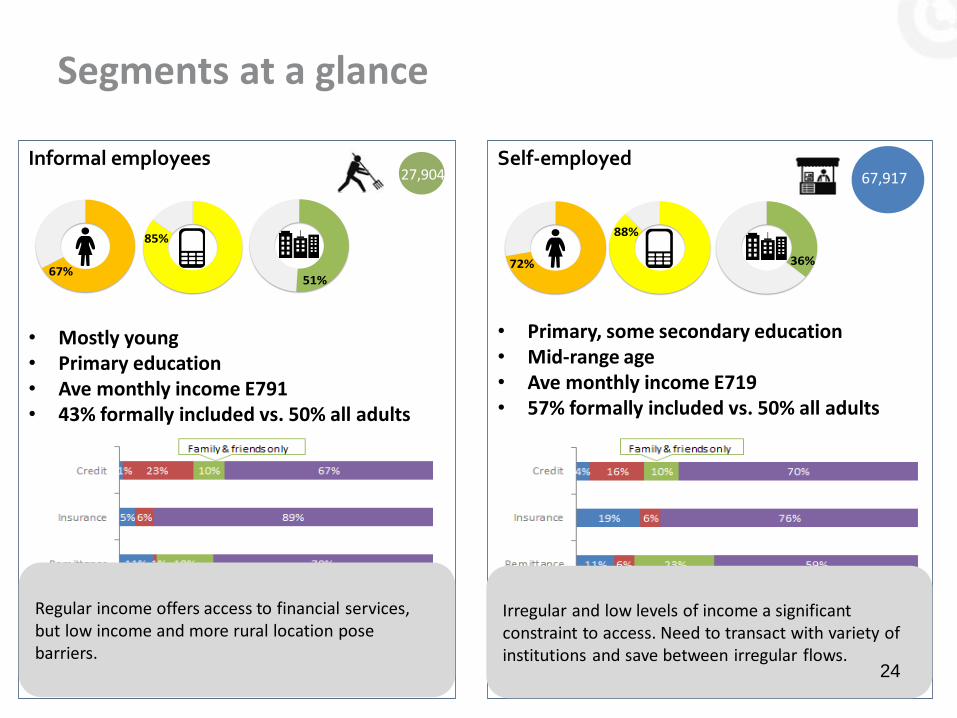
Informal employees 27,904
51%67%
85%
• Mostly young • Primary education • Ave monthly income E791 • 43% formally included vs. 50% all adults
Self-employed 67,917
36%72%
88%
• Primary, some secondary education • Mid-range age • Ave monthly income E719 • 57% formally included vs. 50% all adults
Segments at a glance
23
Informal employees 27,904
51%67%
85%
• Mostly young • Primary education • Ave monthly income E791 • 43% formally included vs. 50% all adults
Self-employed 67,917
36%72%
88%
• Primary, some secondary education • Mid-range age • Ave monthly income E719 • 57% formally included vs. 50% all adults
Regular income offers access to financial services, but low income and more rural location pose barriers.
Irregular and low levels of income a significant constraint to access. Need to transact with variety of institutions and save between irregular flows.
Segments at a glance
24
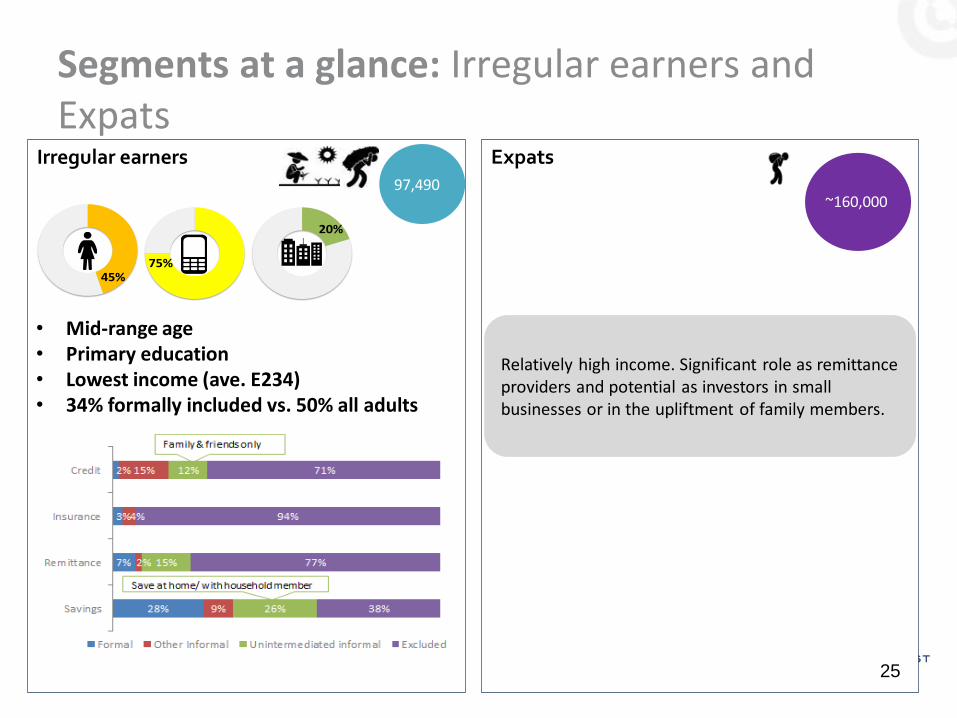
Expats
~160,000
Relatively high income. Significant role as remittance providers and potential as investors in small businesses or in the upliftment of family members.
Irregular earners 97,490
20%
45%75%
• Mid-range age • Primary education • Lowest income (ave. E234) • 34% formally included vs. 50% all adults
Segments at a glance: Irregular earners and Expats
25
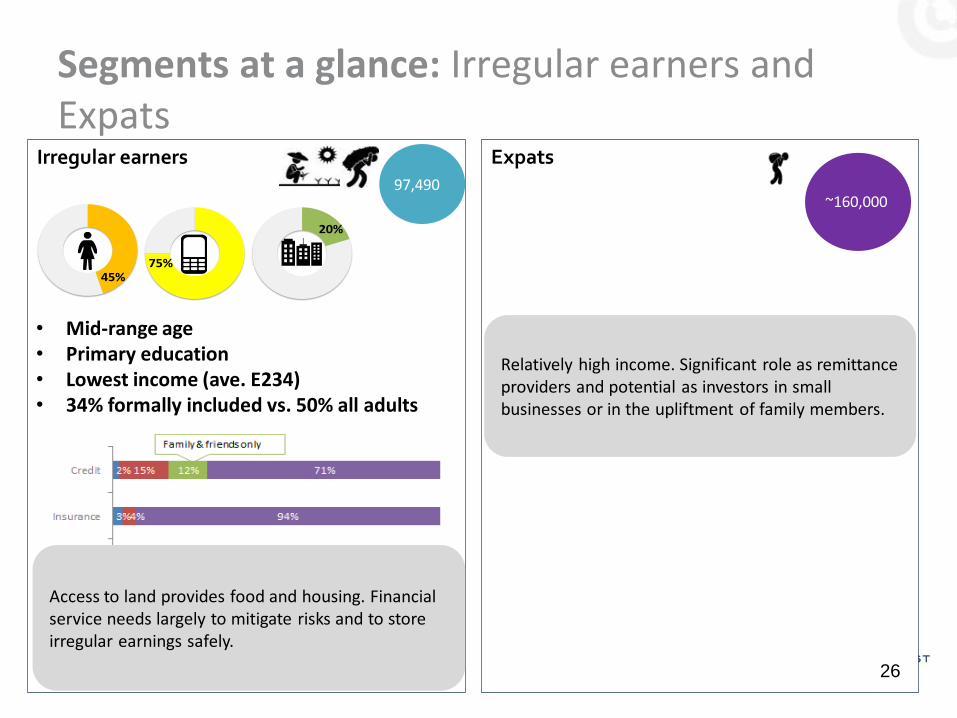
Expats
~160,000
Relatively high income. Significant role as remittance providers and potential as investors in small businesses or in the upliftment of family members.
Irregular earners 97,490
Access to land provides food and housing. Financial service needs largely to mitigate risks and to store irregular earnings safely.
20%
45%75%
• Mid-range age • Primary education • Lowest income (ave. E234) • 34% formally included vs. 50% all adults
Segments at a glance: Irregular earners and Expats
26
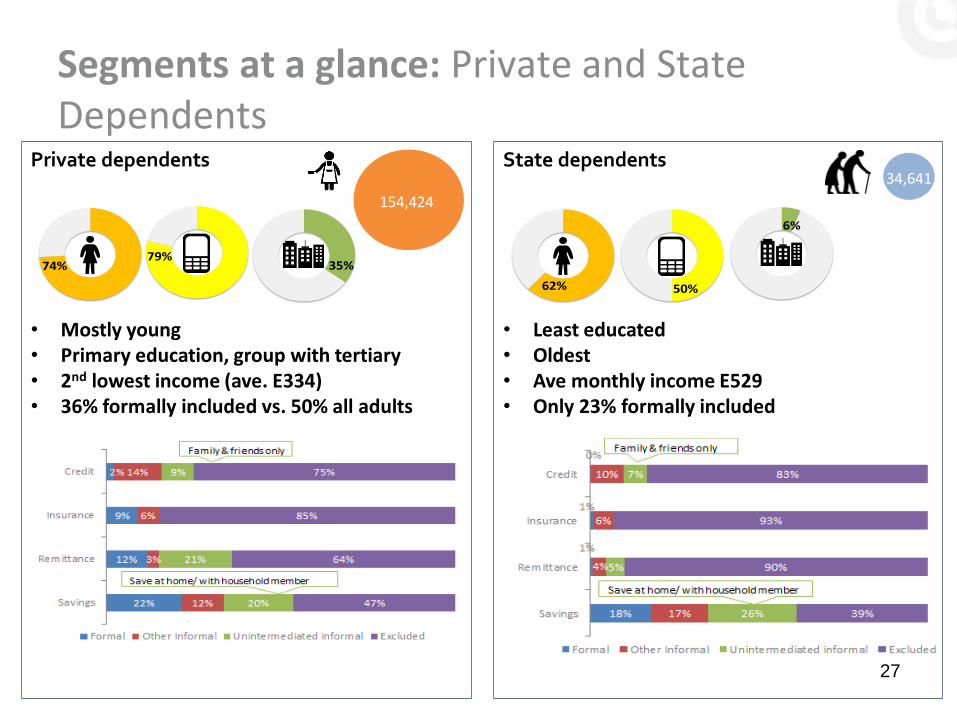
Private dependents
154,424
35%74%79%
• Mostly young • Primary education, group with tertiary • 2nd lowest income (ave. E334) • 36% formally included vs. 50% all adults
State dependents 34,641
6%
62% 50%
• Least educated • Oldest • Ave monthly income E529 • Only 23% formally included
Segments at a glance: Private and State Dependents
27
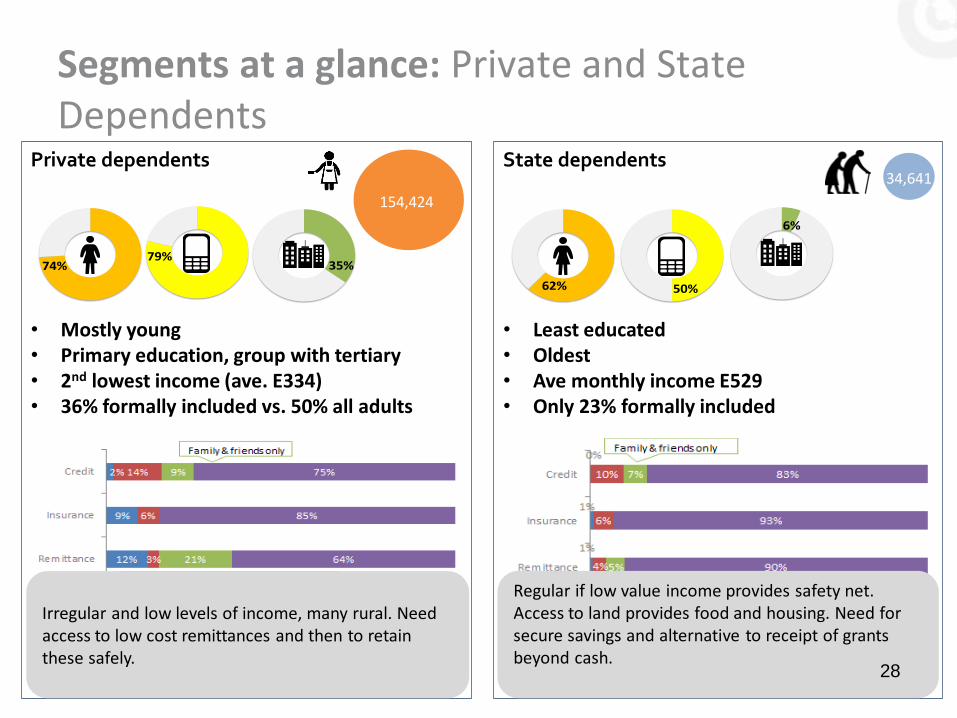
Private dependents
154,424
35%74%79%
• Mostly young • Primary education, group with tertiary • 2nd lowest income (ave. E334) • 36% formally included vs. 50% all adults
Irregular and low levels of income, many rural. Need access to low cost remittances and then to retain these safely.
State dependents 34,641
6%
62% 50%
• Least educated • Oldest • Ave monthly income E529 • Only 23% formally included
Regular if low value income provides safety net. Access to land provides food and housing. Need for secure savings and alternative to receipt of grants beyond cash.
Segments at a glance: Private and State Dependents
28
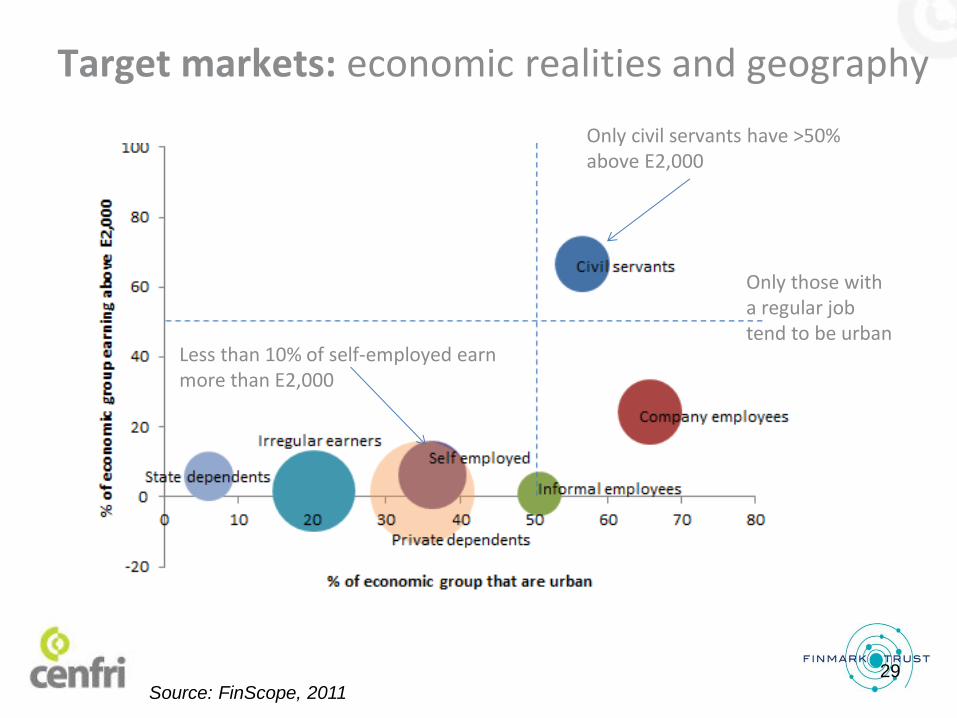
Target markets: economic realities and geography
Less than 10% of self-employed earn more than E2,000
Source: FinScope, 2011
Only civil servants have >50% above E2,000
Only those with a regular job tend to be urban
29
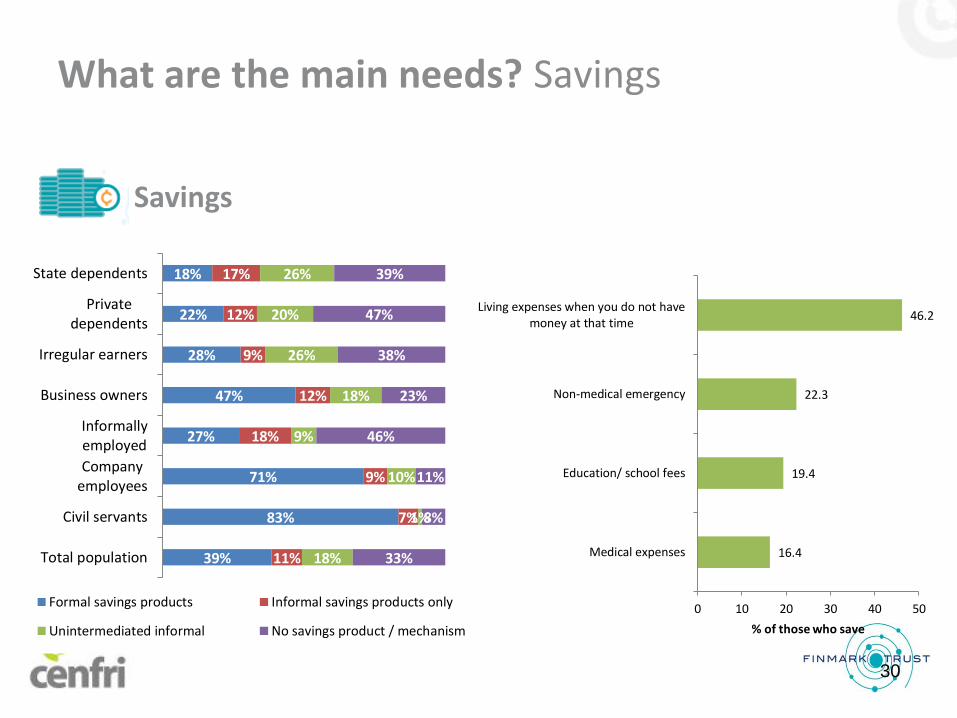
Savings
39%
83%
71%
27%
47%
28%
22%
18%
11%
7%
9%
18%
12%
9%
12%
17%
18%
1%
10%
9%
18%
26%
20%
26%
33%
8%
11%
46%
23%
38%
47%
39%
Total population
Civil servants
Companyemployees
Informallyemployed
Business owners
Irregular earners
Privatedependents
State dependents
Formal savings products Informal savings products only
Unintermediated informal No savings product / mechanism
What are the main needs? Savings
30
16.4
19.4
22.3
46.2
0 10 20 30 40 50
Medical expenses
Education/ school fees
Non-medical emergency
Living expenses when you do not havemoney at that time
% of those who save
Savings
39%
83%
71%
27%
47%
28%
22%
18%
11%
7%
9%
18%
12%
9%
12%
17%
18%
1%
10%
9%
18%
26%
20%
26%
33%
8%
11%
46%
23%
38%
47%
39%
Total population
Civil servants
Companyemployees
Informallyemployed
Business owners
Irregular earners
Privatedependents
State dependents
Formal savings products Informal savings products only
Unintermediated informal No savings product / mechanism
What are the main needs? Savings
31
16.4
19.4
22.3
46.2
0 10 20 30 40 50
Medical expenses
Education/ school fees
Non-medical emergency
Living expenses when you do not havemoney at that time
% of those who save
Main savings needs:
• Consumption smoothing • Risk mitigation • Education

What are the main needs? Credit
32
7%
42%
14%
1%
4%
2%
2%
17%
24%
27%
23%
16%
15%
14%
10%
9%
6%
7%
10%
10%
12%
9%
7%
67%
28%
52%
67%
70%
71%
75%
82%
Total population
Civil servants
Company employees
Informally employed
Business owners
Irregular earners
Private dependents
State dependents
Formal credit Informal credit only
Unintermediated informal No credit products
Credit
5.2
5.8
7.7
22.1
27.0
0 5 10 15 20 25 30
Non-medical emergency
Starting or expanding my business
Medical expenses, planned oremergency
Living expenses in absence of cashat the time
Education/ school fees
% of adults with credit
What are the main needs? Credit
33
7%
42%
14%
1%
4%
2%
2%
17%
24%
27%
23%
16%
15%
14%
10%
9%
6%
7%
10%
10%
12%
9%
7%
67%
28%
52%
67%
70%
71%
75%
82%
Total population
Civil servants
Company employees
Informally employed
Business owners
Irregular earners
Private dependents
State dependents
Formal credit Informal credit only
Unintermediated informal No credit products
Credit
5.2
5.8
7.7
22.1
27.0
0 5 10 15 20 25 30
Non-medical emergency
Starting or expanding my business
Medical expenses, planned oremergency
Living expenses in absence of cashat the time
Education/ school fees
% of adults with credit
Main credit needs:
• Education • Risk mitigation • Consumption smoothing • Asset backed financing (including mortgages)
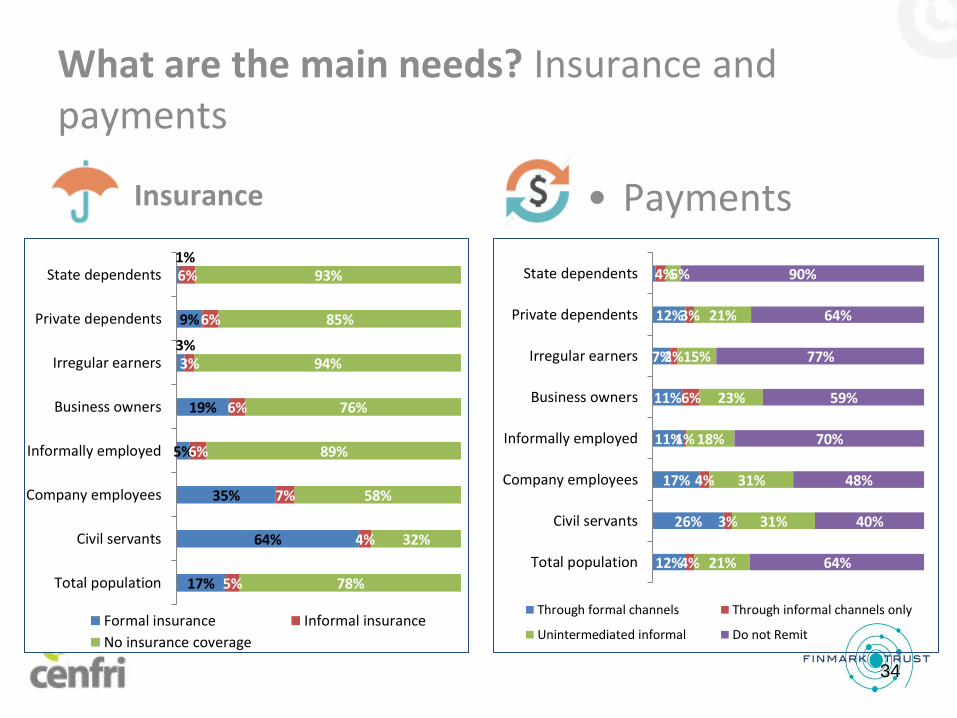
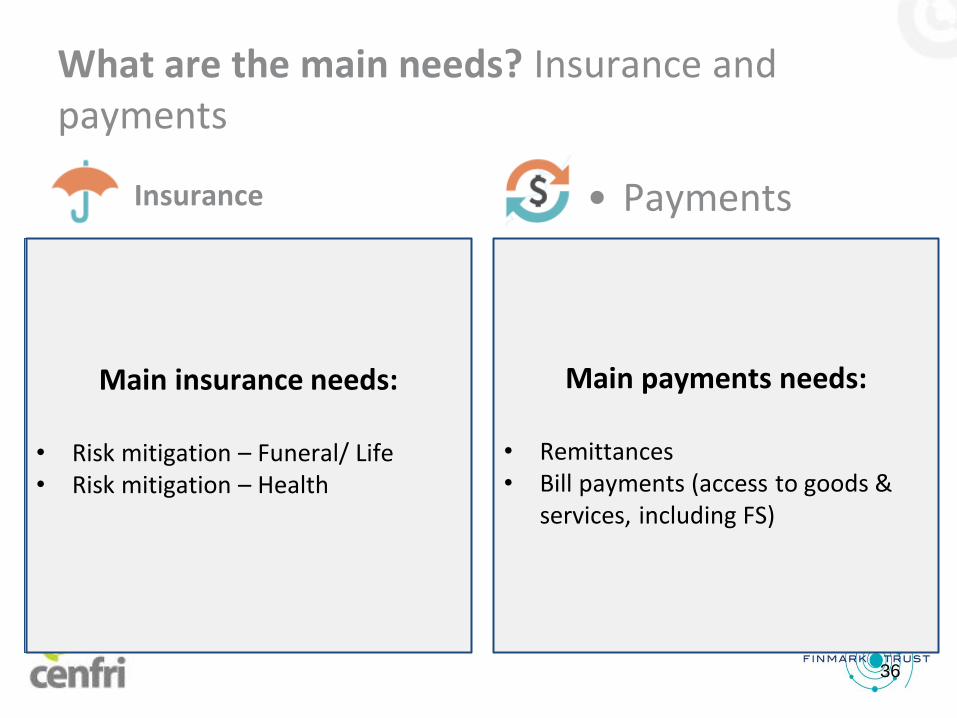
What are the main needs? Insurance and payments
17%
64%
35%
5%
19%
3%
9%
1%
5%
4%
7%
6%
6%
3%
6%
6%
78%
32%
58%
89%
76%
94%
85%
93%
Total population
Civil servants
Company employees
Informally employed
Business owners
Irregular earners
Private dependents
State dependents
Formal insurance Informal insurance
No insurance coverage
Insurance
34
• Payments
12%
26%
17%
11%
11%
7%
12%
1%
4%
3%
4%
1%
6%
2%
3%
4%
21%
31%
31%
18%
23%
15%
21%
5%
64%
40%
48%
70%
59%
77%
64%
90%
Total population
Civil servants
Company employees
Informally employed
Business owners
Irregular earners
Private dependents
State dependents
Through formal channels Through informal channels only
Unintermediated informal Do not Remit

What are the main needs? Insurance and payments
17%
64%
35%
5%
19%
3%
9%
1%
5%
4%
7%
6%
6%
3%
6%
6%
78%
32%
58%
89%
76%
94%
85%
93%
Total population
Civil servants
Company employees
Informally employed
Business owners
Irregular earners
Private dependents
State dependents
Formal insurance Informal insurance
No insurance coverage
Insurance
35
• Payments
Do not have 62%
Have 38%
Swazi adults with transaction accounts
What are the main needs? Insurance and payments
17%
64%
35%
5%
19%
3%
9%
1%
5%
4%
7%
6%
6%
3%
6%
6%
78%
32%
58%
89%
76%
94%
85%
93%
Total population
Civil servants
Company employees
Informally employed
Business owners
Irregular earners
Private dependents
State dependents
Formal insurance Informal insurance
No insurance coverage
Insurance
Main insurance needs:
• Risk mitigation – Funeral/ Life • Risk mitigation – Health
36
• Payments
12%
26%
17%
11%
11%
7%
12%
1%
4%
3%
4%
1%
6%
2%
3%
4%
21%
31%
31%
18%
23%
15%
21%
5%
64%
40%
48%
70%
59%
77%
64%
90%
Total population
Civil servants
Company employees
Informally employed
Business owners
Irregular earners
Private dependents
State dependents
Through formal channels Through informal channels only
Unintermediated informal Do not Remit
Do not have 62%
Have 38%
Swazi adults with transaction accounts
Main payments needs:
• Remittances • Bill payments (access to goods &
services, including FS)
D. PROVISION OVERVIEW
37
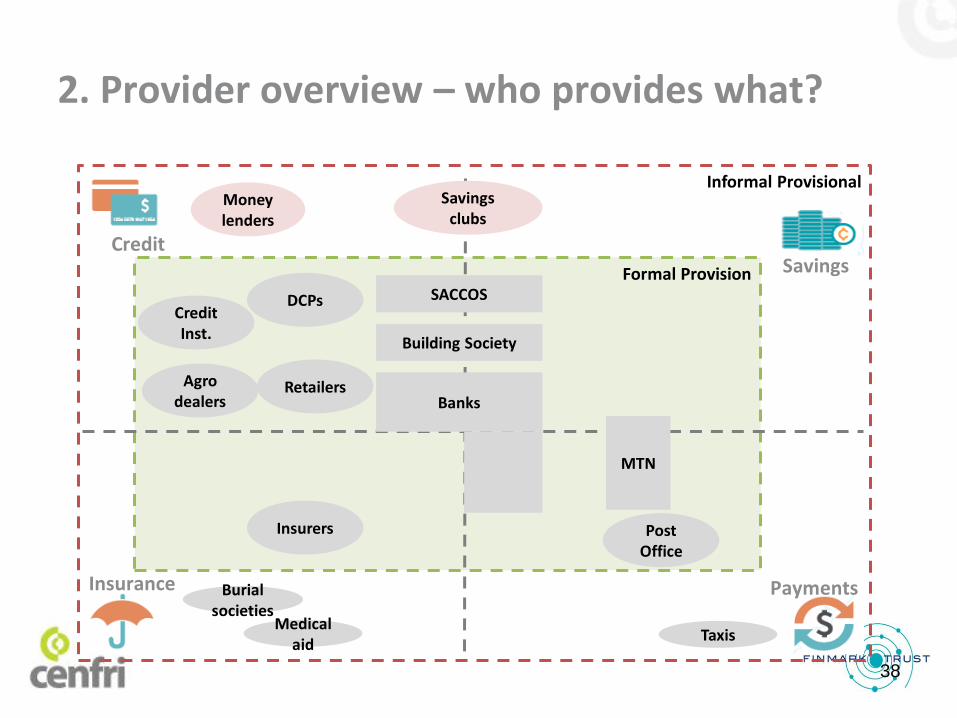
Burial societies
Medical aid
Taxis
Formal Provision
Banks
Building Society
SACCOS
MTN
Retailers
Credit Inst.
DCPs
Savings clubs
Money lenders
Insurers
Informal Provisional
Agro dealers
Post Office
2. Provider overview – who provides what?
38
Savings
Payments Insurance
Credit
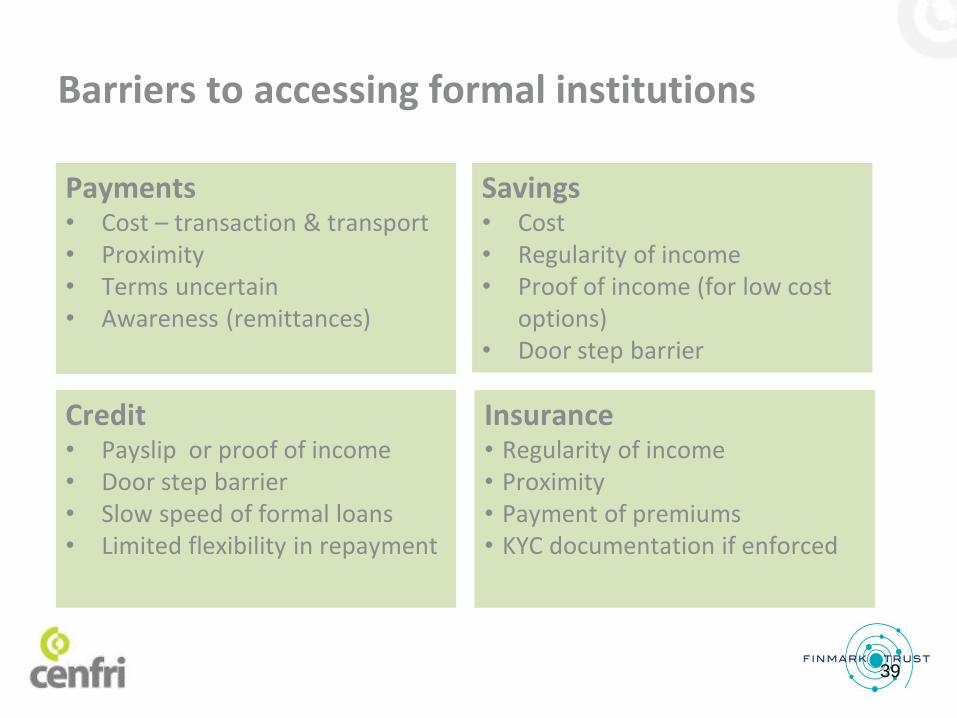
Barriers to accessing formal institutions
39
Payments • Cost – transaction & transport • Proximity • Terms uncertain • Awareness (remittances)
Credit • Payslip or proof of income • Door step barrier • Slow speed of formal loans • Limited flexibility in repayment
Savings • Cost • Regularity of income • Proof of income (for low cost
options) • Door step barrier
Insurance • Regularity of income • Proximity • Payment of premiums • KYC documentation if enforced
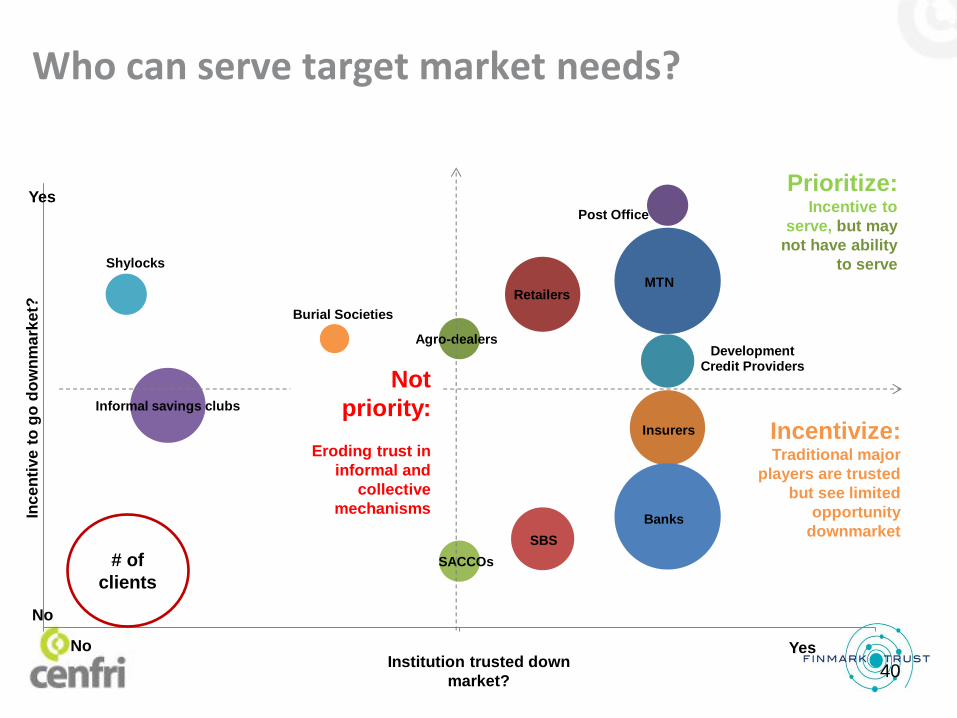
MTN Retailers
Agro-dealers
Post Office
Development Credit Providers
Insurers
Banks
SBS
SACCOs
Informal savings clubs
Shylocks
Burial Societies
Who can serve target market needs?
Prioritize: Incentive to
serve, but may
not have ability
to serve
Incentivize: Traditional major
players are trusted
but see limited
opportunity
downmarket
Inc
en
tive
to
go
do
wn
ma
rke
t?
Yes
No
No Yes Institution trusted down
market?
# of
clients
Not
priority:
Eroding trust in
informal and
collective
mechanisms
40
0
20 000
40 000
60 000
80 000
100 000
120 000
-
500 000
1 000 000
1 500 000
2 000 000
2 500 000
3 000 000
Nu
mb
er
of
clie
nts
Val
ue
of
loan
s ('
00
0)
Total loan book ('000)
Clients
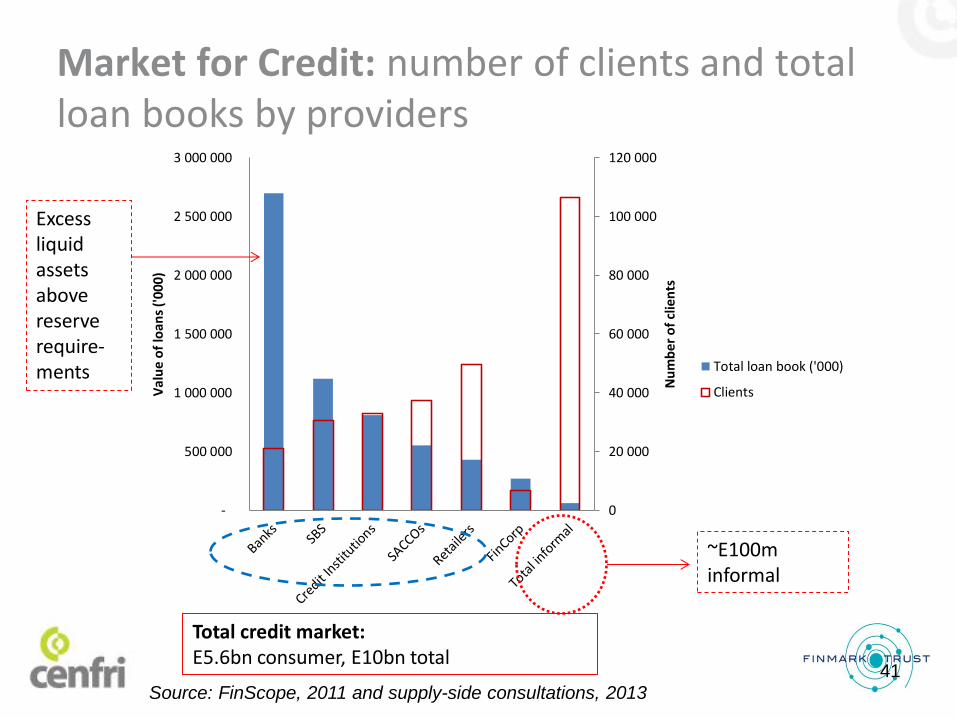
Market for Credit: number of clients and total loan books by providers
~E100m informal
Total credit market: E5.6bn consumer, E10bn total
Excess liquid assets above reserve require-ments
Source: FinScope, 2011 and supply-side consultations, 2013
41
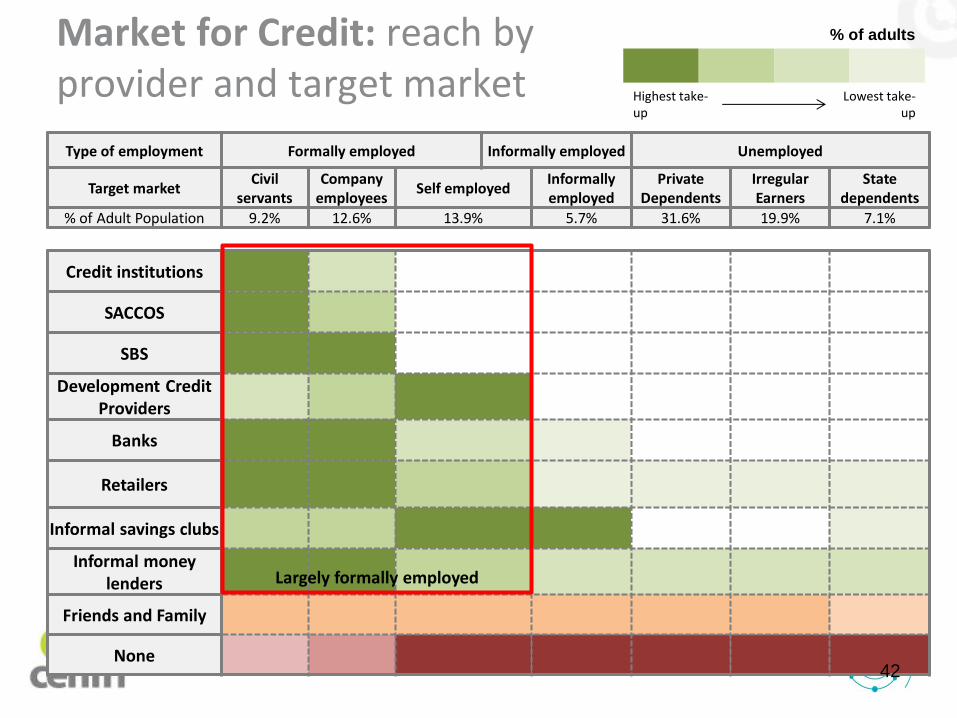
Market for Credit: reach by provider and target market
Type of employment Formally employed Informally employed Unemployed
Target market Civil
servants Company
employees Self employed
Informally employed
Private Dependents
Irregular Earners
State dependents
% of Adult Population 9.2% 12.6% 13.9% 5.7% 31.6% 19.9% 7.1%
Credit institutions
SACCOS
SBS
Development Credit Providers
Banks
Retailers
Informal savings clubs
Informal money lenders
Friends and Family
None
Largely formally employed
% of adults
Highest take-up
Lowest take-up
42
E 7 E 37
E 668
E 1 085 E 1 119
E 17 000
200 000
125 820
37 286
180 630
70 000
42 000
0
50 000
100 000
150 000
200 000
250 000
E 0
E 200
E 400
E 600
E 800
E 1 000
E 1 200
E 1 400
E 1 600
E 1 800
MTNMobileMoney
Subscribers
Informalsavings
club
SACCOs Banks SwazilandBuildingSociety
Pensionfund
Mill
ion
s
Assets/Deposits
Clients
30 000
Active
E 18 000
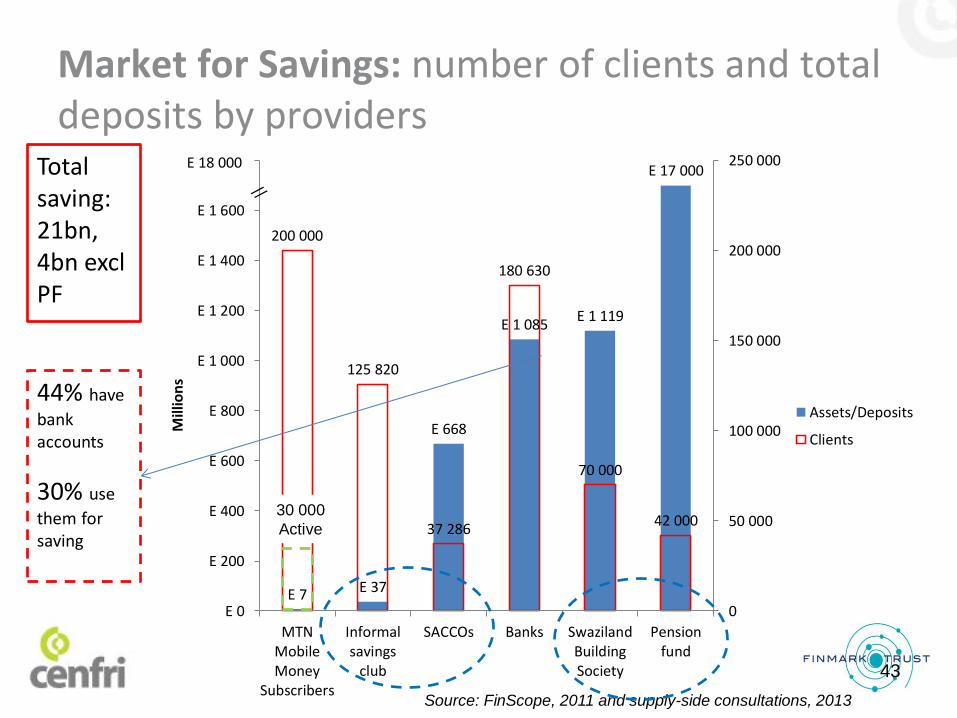
Market for Savings: number of clients and total deposits by providers
44% have
bank accounts
30% use
them for saving
Source: FinScope, 2011 and supply-side consultations, 2013
43
Total saving: 21bn, 4bn excl PF

Market for Savings: reach by provider and target market
Type of employment Formally employed Informally employed Unemployed
Target market Civil
servants Company
employees Self employed
Informally employed
Private Dependents
Irregular Earners
State dependents
% of Adult Population 9.2% 12.6% 13.9% 5.7% 31.6% 19.9% 7.1%
Pension funds
SACCOs
SBS
Banks
MTN
Informal savings clubs
Saving at home
Not saving
Banks, MTN and informal savings clubs only potential channels for savings with significant reach outside of formally employed
% of adults
Highest take-up
Lowest take-up
44
E. FINANCIAL INCLUSION PRIORITIES
45
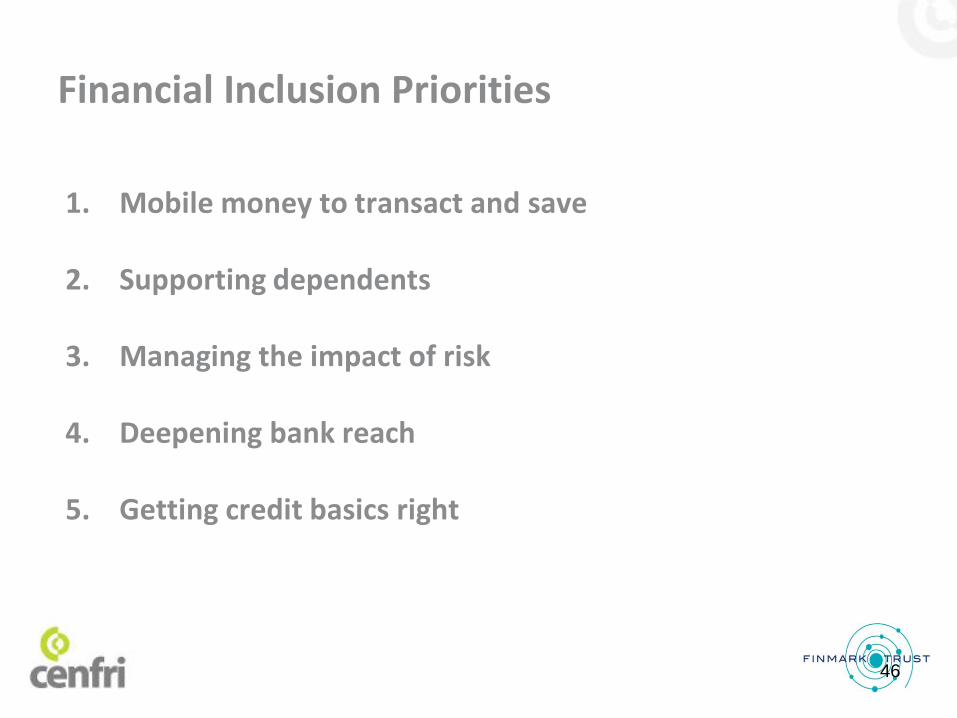
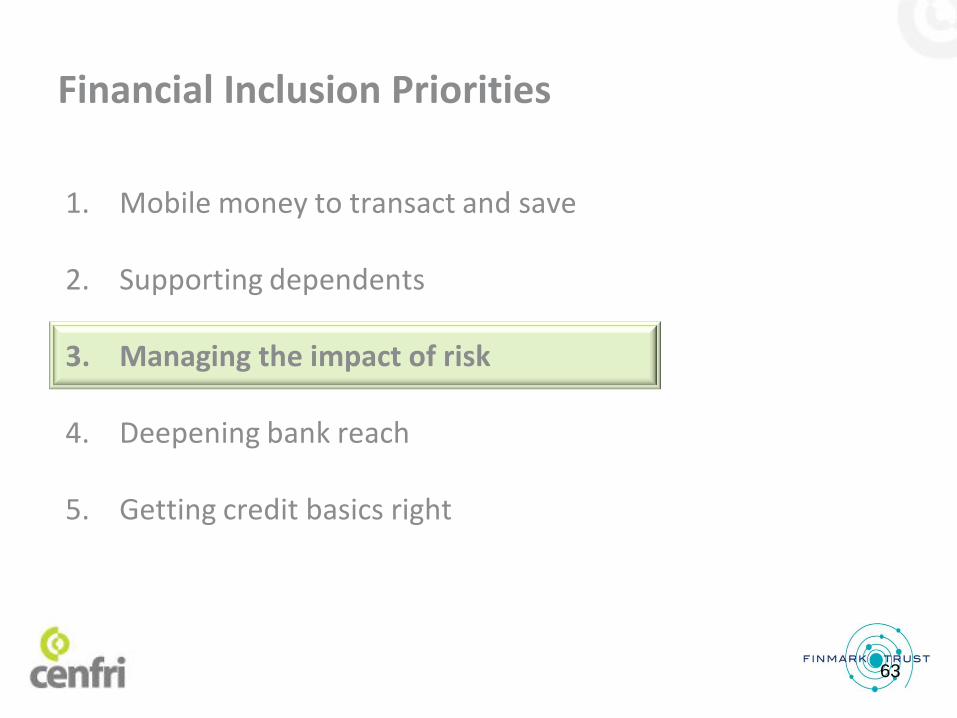
1. Mobile money to transact and save
2. Supporting dependents
3. Managing the impact of risk
4. Deepening bank reach
5. Getting credit basics right
Financial Inclusion Priorities
46
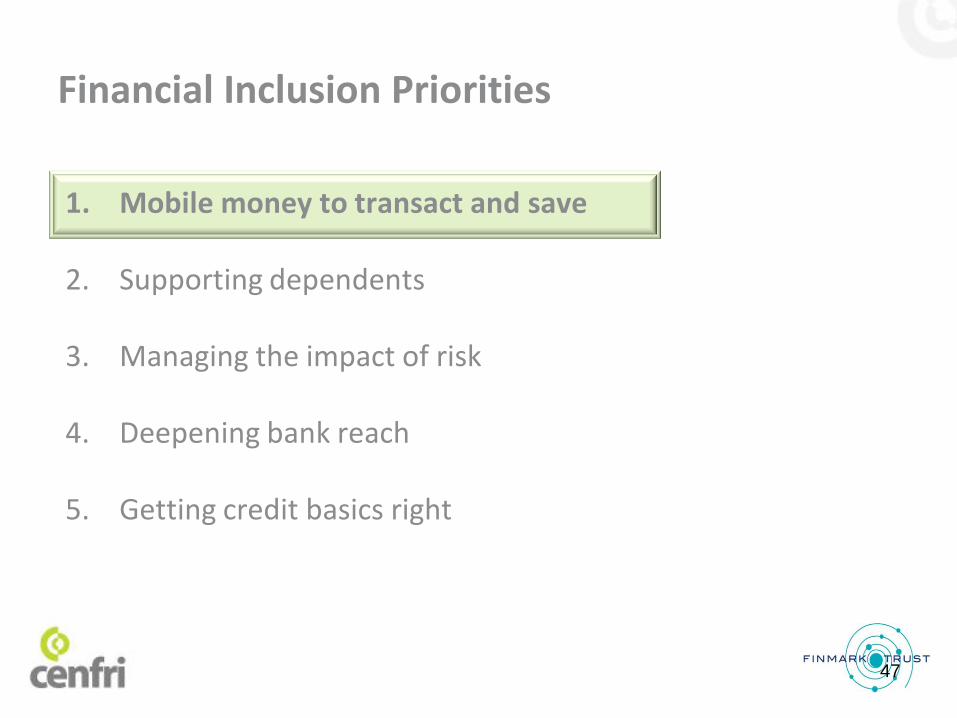
1. Mobile money to transact and save
2. Supporting dependents
3. Managing the impact of risk
4. Deepening bank reach
5. Getting credit basics right
Financial Inclusion Priorities
47
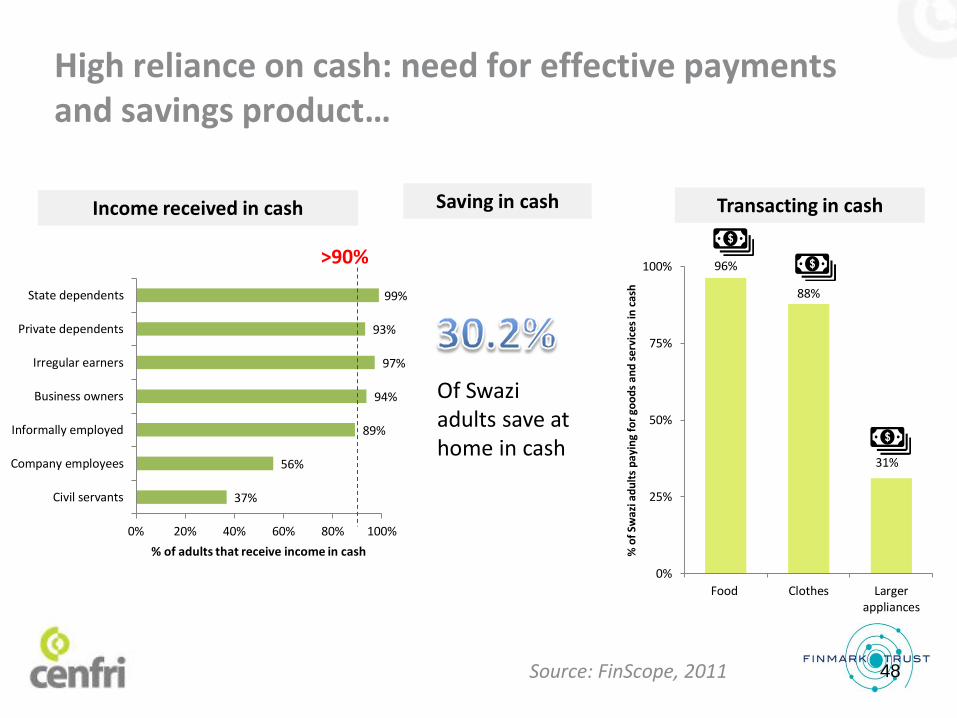
High reliance on cash: need for effective payments and savings product…
48 Source: FinScope, 2011
Transacting in cash Saving in cash Income received in cash
37%
56%
89%
94%
97%
93%
99%
0% 20% 40% 60% 80% 100%
Civil servants
Company employees
Informally employed
Business owners
Irregular earners
Private dependents
State dependents
% of adults that receive income in cash
96%
88%
31%
0%
25%
50%
75%
100%
Food Clothes Largerappliances
% o
f Sw
azi a
du
lts
pay
ing
for
goo
ds
and
ser
vice
s in
cas
h
Of Swazi adults save at home in cash
>90%
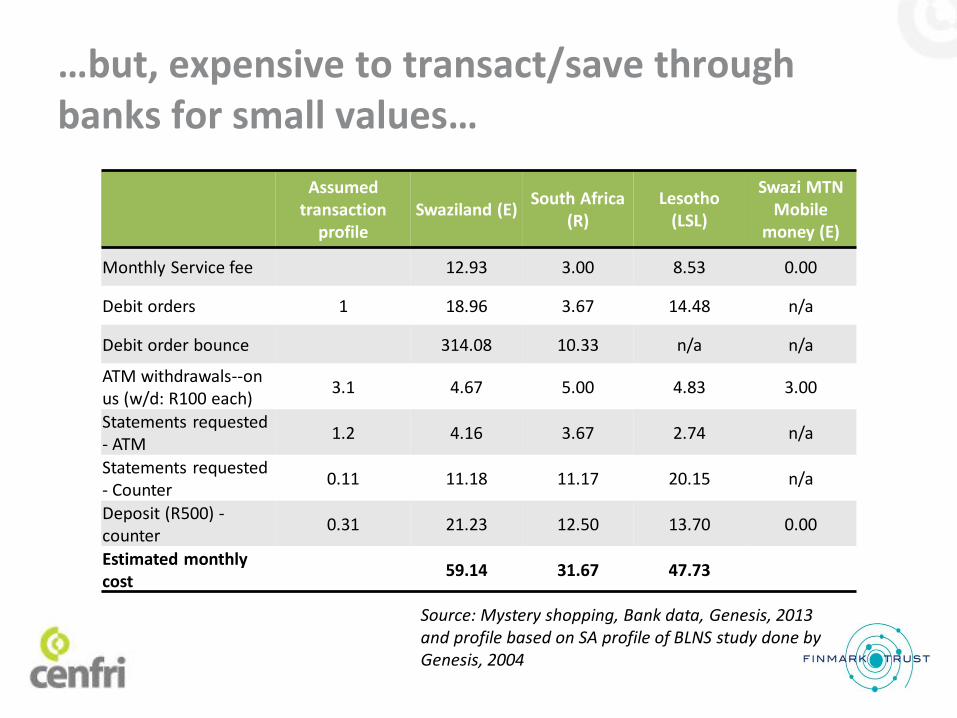
…but, expensive to transact/save through banks for small values…
Assumed transaction
profile Swaziland (E)
South Africa (R)
Lesotho (LSL)
Swazi MTN Mobile
money (E)
Monthly Service fee 12.93 3.00 8.53 0.00
Debit orders 1 18.96 3.67 14.48 n/a
Debit order bounce 314.08 10.33 n/a n/a
ATM withdrawals--on us (w/d: R100 each)
3.1 4.67 5.00 4.83 3.00
Statements requested - ATM
1.2 4.16 3.67 2.74 n/a
Statements requested - Counter
0.11 11.18 11.17 20.15 n/a
Deposit (R500) - counter
0.31 21.23 12.50 13.70 0.00
Estimated monthly cost
59.14 31.67 47.73
Source: Mystery shopping, Bank data, Genesis, 2013 and profile based on SA profile of BLNS study done by Genesis, 2004
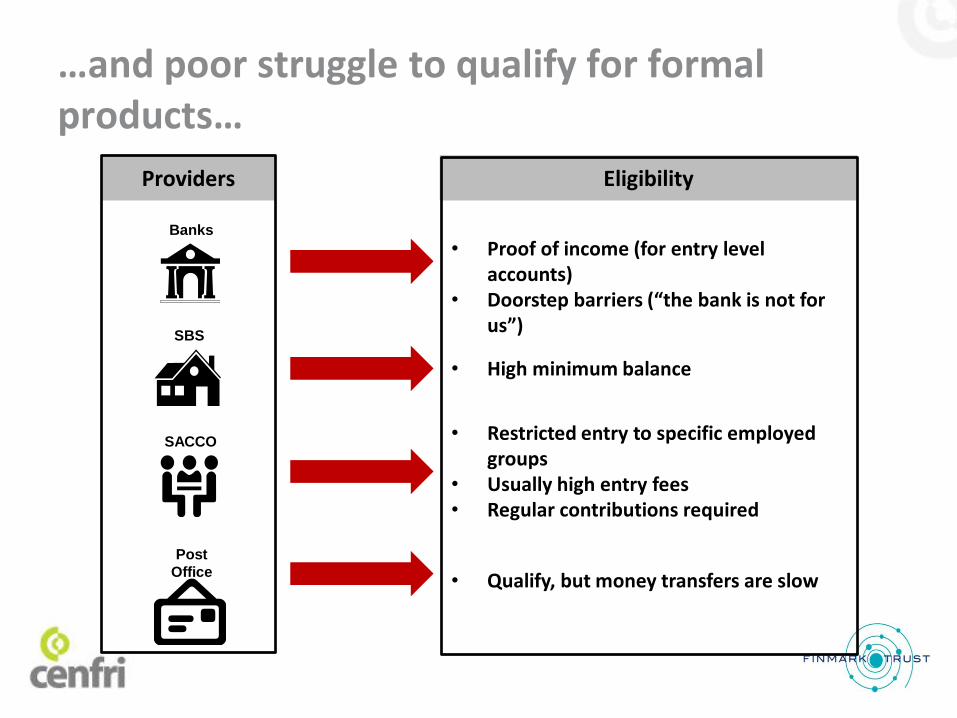
…and poor struggle to qualify for formal products…
Banks
SACCO
s
Post
Office
SBS
• Proof of income (for entry level accounts)
• Doorstep barriers (“the bank is not for us”)
• High minimum balance
• Restricted entry to specific employed groups
• Usually high entry fees • Regular contributions required
• Qualify, but money transfers are slow
Providers Eligibility

Need to travel to access payment infrastructure…
Source: Red Flank, MTN and Central Bank NPS, 2013
81%<30min
34%<30min
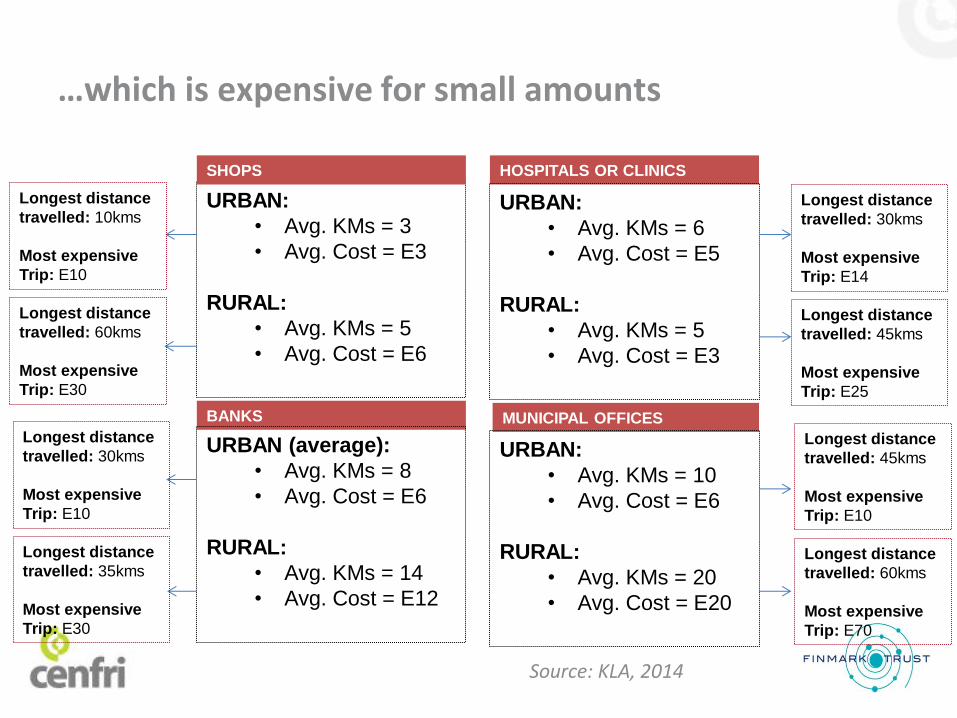
…which is expensive for small amounts
URBAN:
• Avg. KMs = 3
• Avg. Cost = E3
RURAL:
• Avg. KMs = 5
• Avg. Cost = E6
SHOPS
BANKS
HOSPITALS OR CLINICS
MUNICIPAL OFFICES
URBAN (average):
• Avg. KMs = 8
• Avg. Cost = E6
RURAL:
• Avg. KMs = 14
• Avg. Cost = E12
URBAN:
• Avg. KMs = 6
• Avg. Cost = E5
RURAL:
• Avg. KMs = 5
• Avg. Cost = E3
URBAN:
• Avg. KMs = 10
• Avg. Cost = E6
RURAL:
• Avg. KMs = 20
• Avg. Cost = E20
Longest distance
travelled: 10kms
Most expensive
Trip: E10
Longest distance
travelled: 60kms
Most expensive
Trip: E30
Longest distance
travelled: 30kms
Most expensive
Trip: E10
Longest distance
travelled: 35kms
Most expensive
Trip: E30
Longest distance
travelled: 30kms
Most expensive
Trip: E14
Longest distance
travelled: 45kms
Most expensive
Trip: E25
Longest distance
travelled: 45kms
Most expensive
Trip: E10
Longest distance
travelled: 60kms
Most expensive
Trip: E70
Source: KLA, 2014

…which is expensive for small amounts
URBAN:
• Avg. KMs = 3
• Avg. Cost = E3
RURAL:
• Avg. KMs = 5
• Avg. Cost = E6
SHOPS
BANKS
HOSPITALS OR CLINICS
MUNICIPAL OFFICES
URBAN (average):
• Avg. KMs = 8
• Avg. Cost = E6
RURAL:
• Avg. KMs = 14
• Avg. Cost = E12
URBAN:
• Avg. KMs = 6
• Avg. Cost = E5
RURAL:
• Avg. KMs = 5
• Avg. Cost = E3
URBAN:
• Avg. KMs = 10
• Avg. Cost = E6
RURAL:
• Avg. KMs = 20
• Avg. Cost = E20
Longest distance
travelled: 10kms
Most expensive
Trip: E10
Longest distance
travelled: 60kms
Most expensive
Trip: E30
Longest distance
travelled: 30kms
Most expensive
Trip: E10
Longest distance
travelled: 35kms
Most expensive
Trip: E30
Longest distance
travelled: 30kms
Most expensive
Trip: E14
Longest distance
travelled: 45kms
Most expensive
Trip: E25
Longest distance
travelled: 45kms
Most expensive
Trip: E10
Longest distance
travelled: 60kms
Most expensive
Trip: E70
“It [mobile money] eases the burden of having to travel to
relatives every time you want to give them money, and now I
don’t have to spend all that money on bus fare which is R30
to and another R30 to come back so now I can just send the
R100 and only pay R7.”
Manzini, Female, Aged 25 – 40 years
Constitutes a 12% fee on a
small savings contribution
of E50pm
Source: KLA, 2014
Constitutes a 24% fee on a
small savings contribution
of E50pm
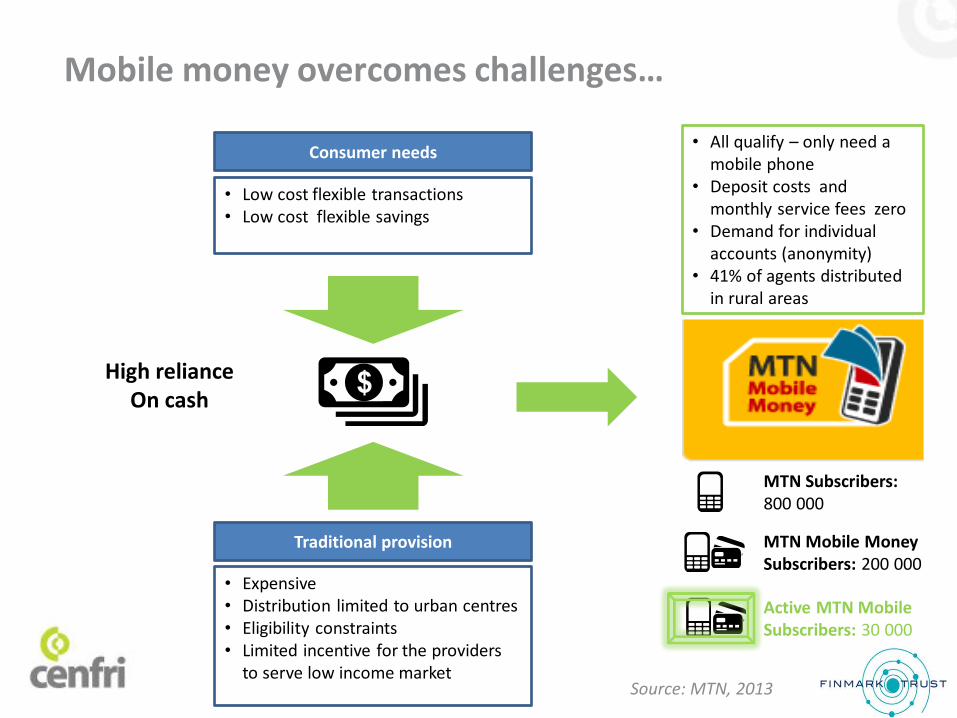
Mobile money overcomes challenges…
• Low cost flexible transactions • Low cost flexible savings
Consumer needs
• Expensive • Distribution limited to urban centres • Eligibility constraints • Limited incentive for the providers
to serve low income market
Traditional provision
• All qualify – only need a mobile phone
• Deposit costs and monthly service fees zero
• Demand for individual accounts (anonymity)
• 41% of agents distributed in rural areas
Source: MTN, 2013
MTN Subscribers: 800 000
MTN Mobile Money Subscribers: 200 000
Active MTN Mobile Subscribers: 30 000
High reliance On cash
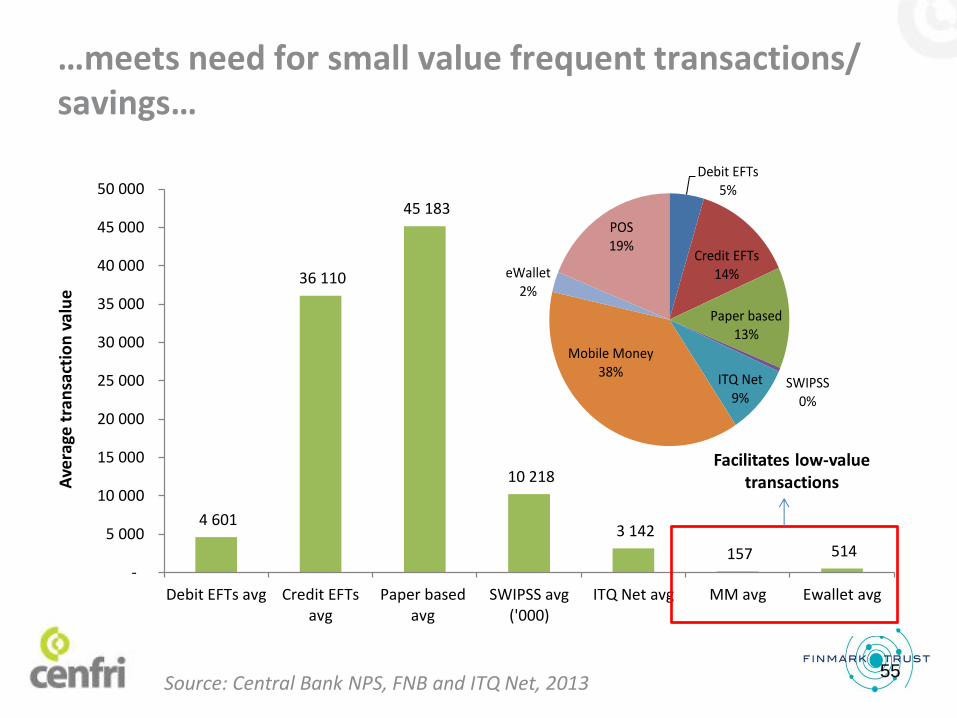
…meets need for small value frequent transactions/ savings…
55
4 601
36 110
45 183
10 218
3 142
157 514 -
5 000
10 000
15 000
20 000
25 000
30 000
35 000
40 000
45 000
50 000
Debit EFTs avg Credit EFTsavg
Paper basedavg
SWIPSS avg('000)
ITQ Net avg MM avg Ewallet avg
Ave
rage
tra
nsa
ctio
n v
alu
e
Source: Central Bank NPS, FNB and ITQ Net, 2013
Debit EFTs 5%
Credit EFTs14%
Paper based13%
SWIPSS0%
ITQ Net9%
Mobile Money 38%
eWallet 2%
POS19%
Facilitates low-value transactions
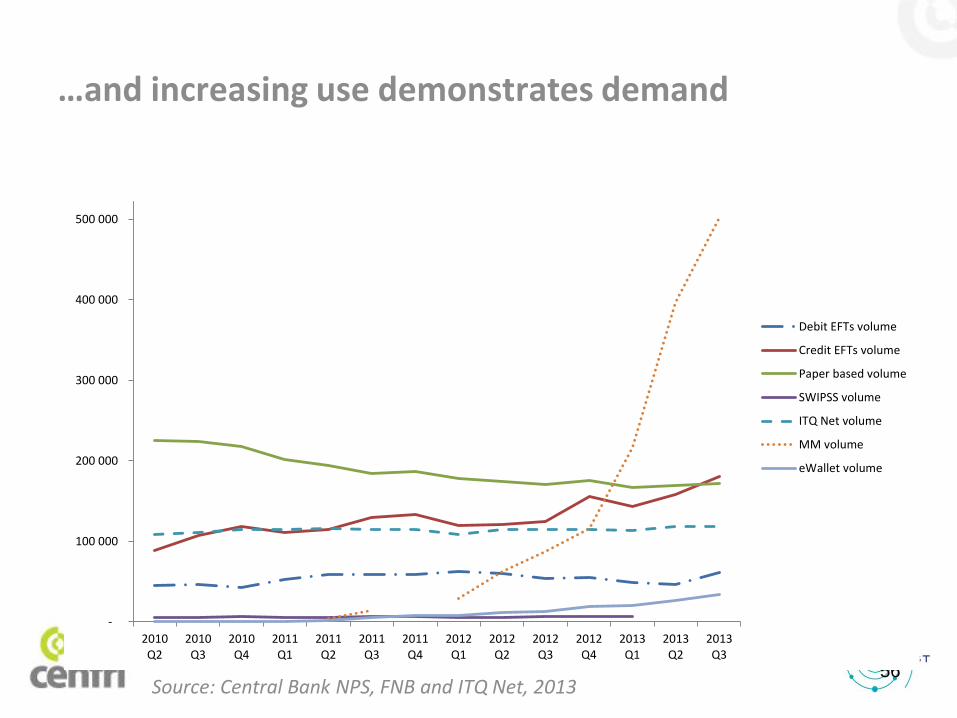
…and increasing use demonstrates demand
56
-
100 000
200 000
300 000
400 000
500 000
600 000
2010Q2
2010Q3
2010Q4
2011Q1
2011Q2
2011Q3
2011Q4
2012Q1
2012Q2
2012Q3
2012Q4
2013Q1
2013Q2
2013Q3
Debit EFTs volume
Credit EFTs volume
Paper based volume
SWIPSS volume
ITQ Net volume
MM volume
eWallet volume
Source: Central Bank NPS, FNB and ITQ Net, 2013
• Allow a tiered account system similar to the banks, exceed cap if fully KYC’ed
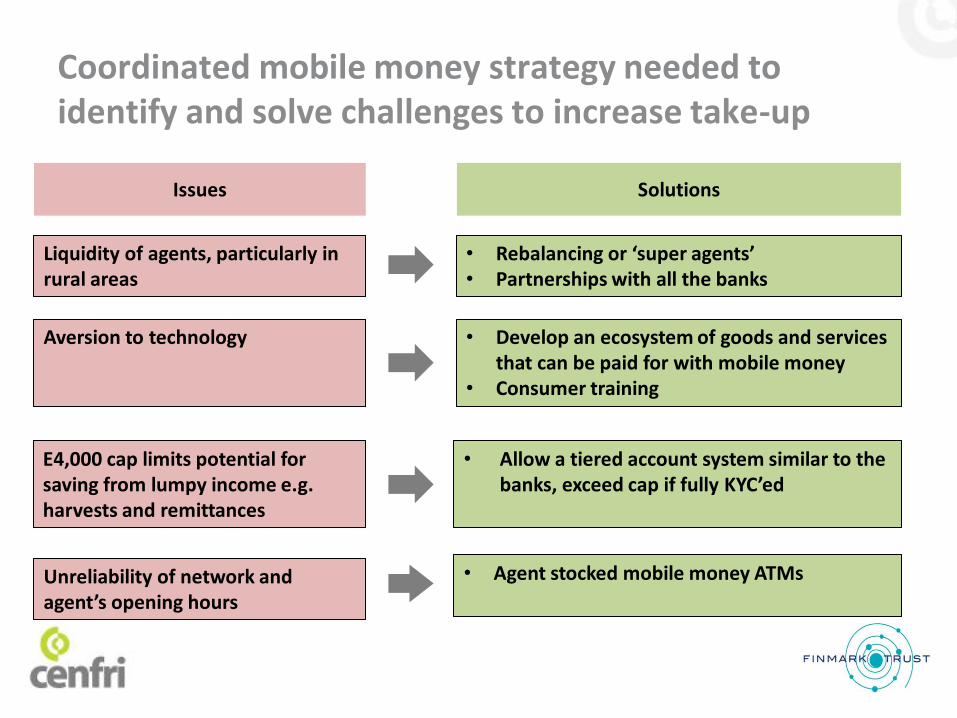
Coordinated mobile money strategy needed to identify and solve challenges to increase take-up
Issues Solutions
Liquidity of agents, particularly in rural areas
Aversion to technology
E4,000 cap limits potential for saving from lumpy income e.g. harvests and remittances
Unreliability of network and agent’s opening hours
• Rebalancing or ‘super agents’ • Partnerships with all the banks
• Develop an ecosystem of goods and services that can be paid for with mobile money
• Consumer training
• Agent stocked mobile money ATMs
• Allow a tiered account system similar to the banks, exceed cap if fully KYC’ed
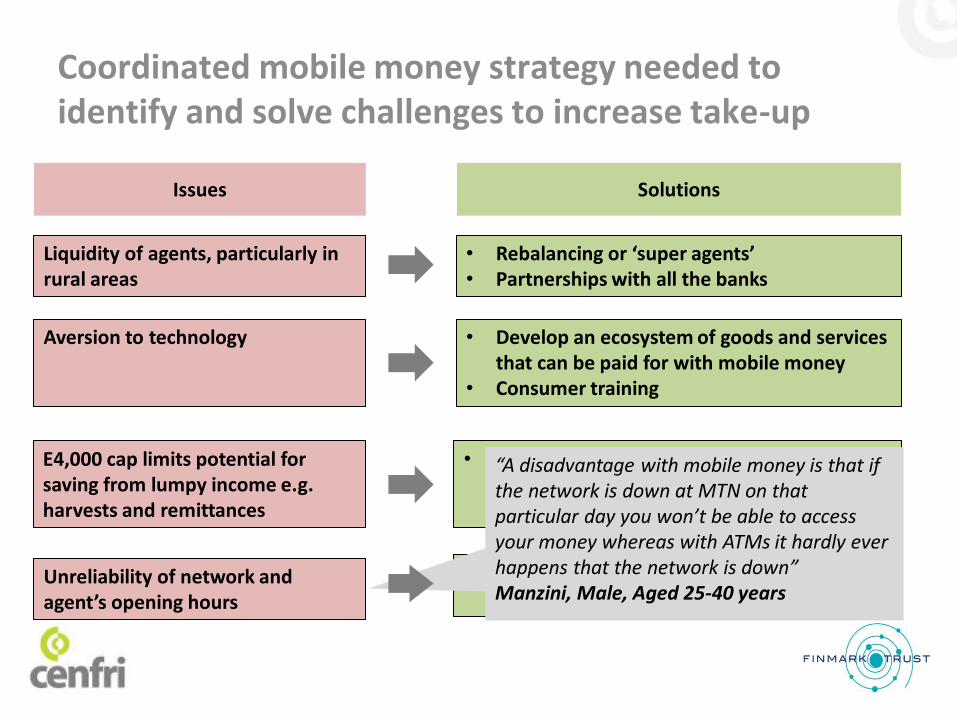
Coordinated mobile money strategy needed to identify and solve challenges to increase take-up
Issues Solutions
Liquidity of agents, particularly in rural areas
Aversion to technology
E4,000 cap limits potential for saving from lumpy income e.g. harvests and remittances
Unreliability of network and agent’s opening hours
• Rebalancing or ‘super agents’ • Partnerships with all the banks
• Develop an ecosystem of goods and services that can be paid for with mobile money
• Consumer training
• Agent stocked mobile money ATMs
“A disadvantage with mobile money is that if the network is down at MTN on that particular day you won’t be able to access your money whereas with ATMs it hardly ever happens that the network is down” Manzini, Male, Aged 25-40 years
1. Mobile money to transact and save
2. Supporting dependents
3. Managing the impact of risk
4. Deepening bank reach
5. Getting credit basics right
Financial Inclusion Priorities
59
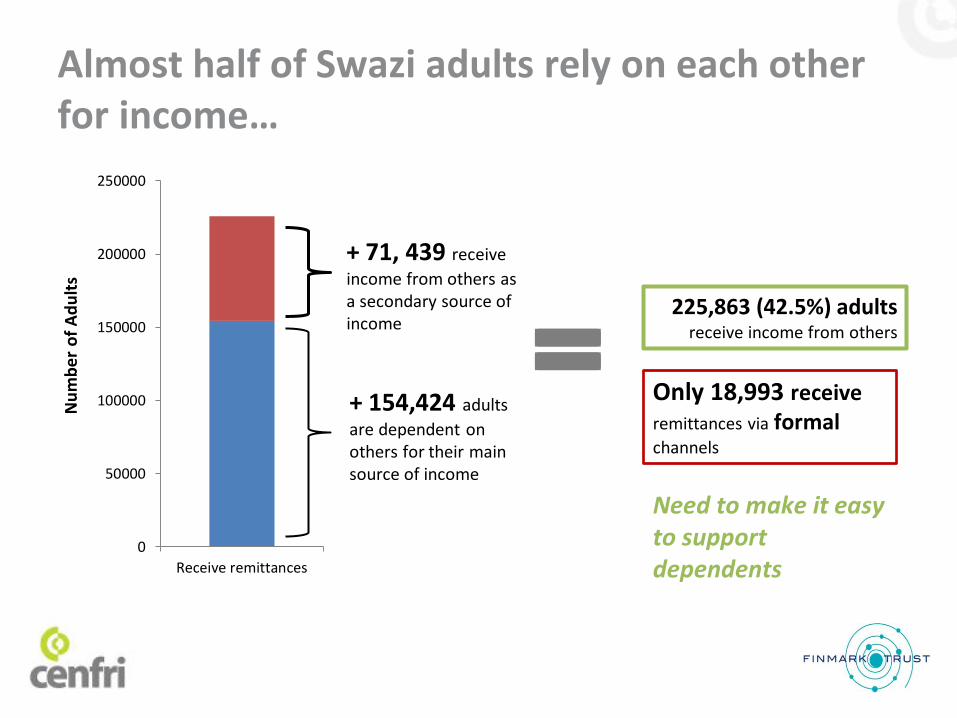
225,863 (42.5%) adults receive income from others
Almost half of Swazi adults rely on each other for income…
Need to make it easy to support dependents Receive remittances
0
50000
100000
150000
200000
250000
Nu
mb
er
of
Ad
ult
s
+ 154,424 adults
are dependent on others for their main source of income
+ 71, 439 receive
income from others as a secondary source of income
Only 18,993 receive remittances via formal channels
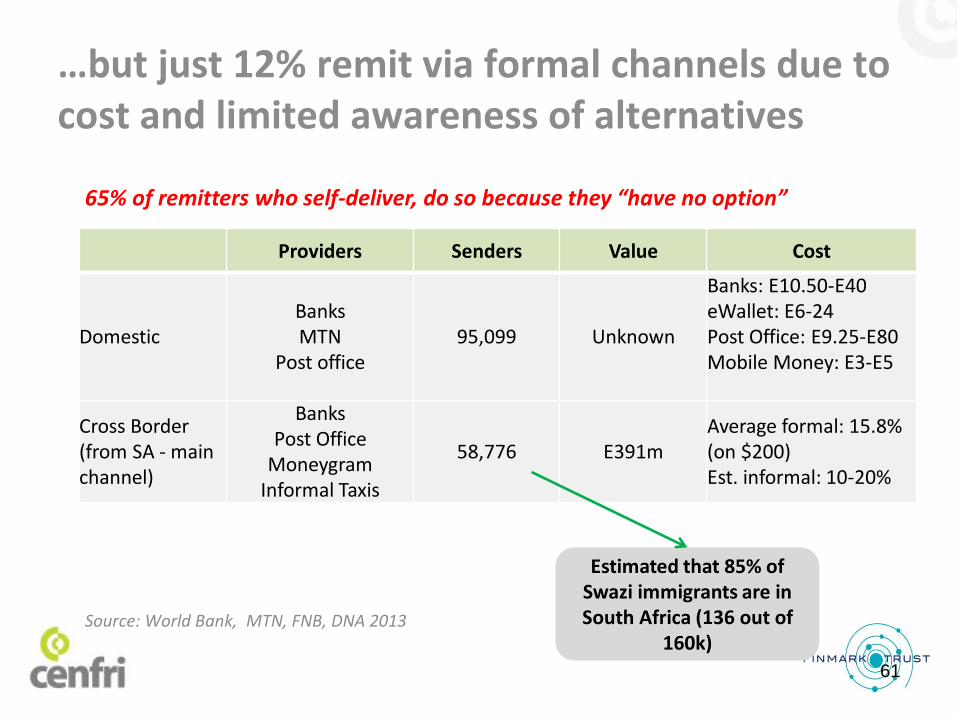
…but just 12% remit via formal channels due to cost and limited awareness of alternatives
61
Providers Senders Value Cost
Domestic Banks MTN
Post office 95,099 Unknown
Banks: E10.50-E40 eWallet: E6-24 Post Office: E9.25-E80 Mobile Money: E3-E5
Cross Border (from SA - main channel)
Banks Post Office
Moneygram Informal Taxis
58,776 E391m Average formal: 15.8% (on $200) Est. informal: 10-20%
Estimated that 85% of Swazi immigrants are in South Africa (136 out of
160k) Source: World Bank, MTN, FNB, DNA 2013
65% of remitters who self-deliver, do so because they “have no option”
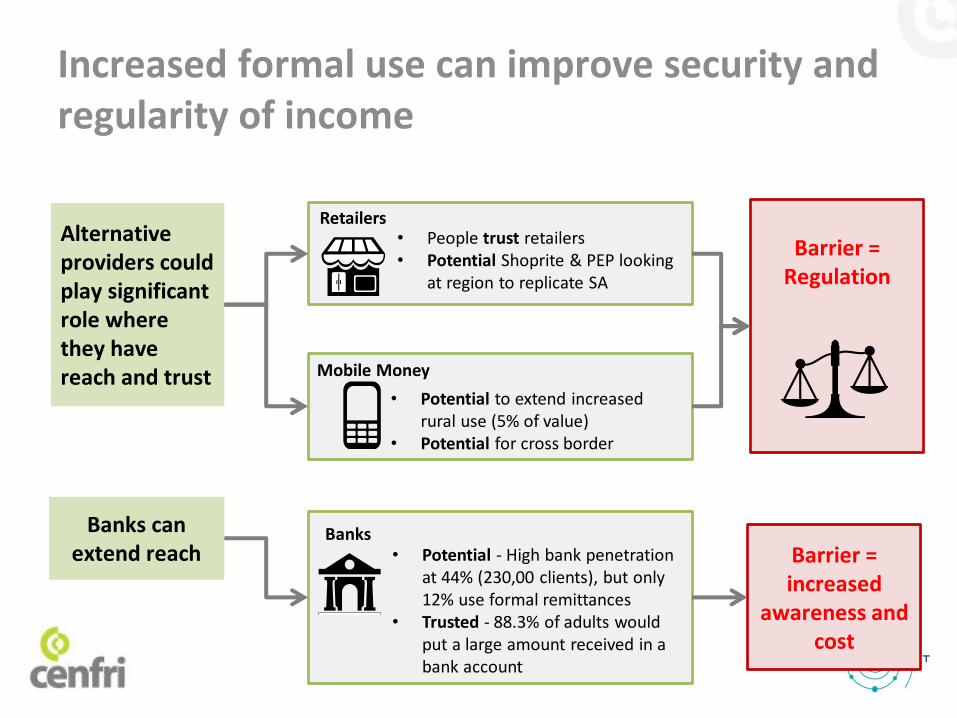
Alternative providers could play significant role where they have reach and trust
• People trust retailers • Potential Shoprite & PEP looking
at region to replicate SA
Retailers
• Potential to extend increased rural use (5% of value)
• Potential for cross border
Mobile Money
• Potential - High bank penetration at 44% (230,00 clients), but only 12% use formal remittances
• Trusted - 88.3% of adults would put a large amount received in a bank account
Banks Banks can extend reach
Barrier =
Regulation
Barrier = increased
awareness and cost
Increased formal use can improve security and regularity of income
1. Mobile money to transact and save
2. Supporting dependents
3. Managing the impact of risk
4. Deepening bank reach
5. Getting credit basics right
Financial Inclusion Priorities
63
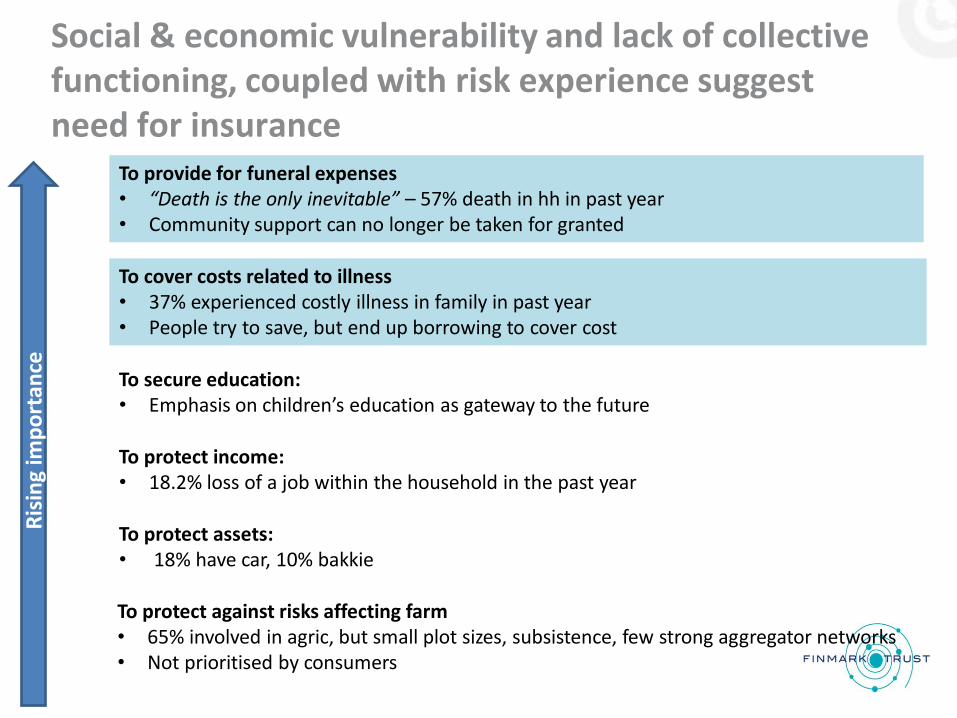
Social & economic vulnerability and lack of collective functioning, coupled with risk experience suggest need for insurance
To provide for funeral expenses • “Death is the only inevitable” – 57% death in hh in past year • Community support can no longer be taken for granted
To cover costs related to illness • 37% experienced costly illness in family in past year • People try to save, but end up borrowing to cover cost
To protect against risks affecting farm • 65% involved in agric, but small plot sizes, subsistence, few strong aggregator networks • Not prioritised by consumers
To protect income: • 18.2% loss of a job within the household in the past year
To secure education: • Emphasis on children’s education as gateway to the future
To protect assets: • 18% have car, 10% bakkie
Ris
ing
imp
ort
ance
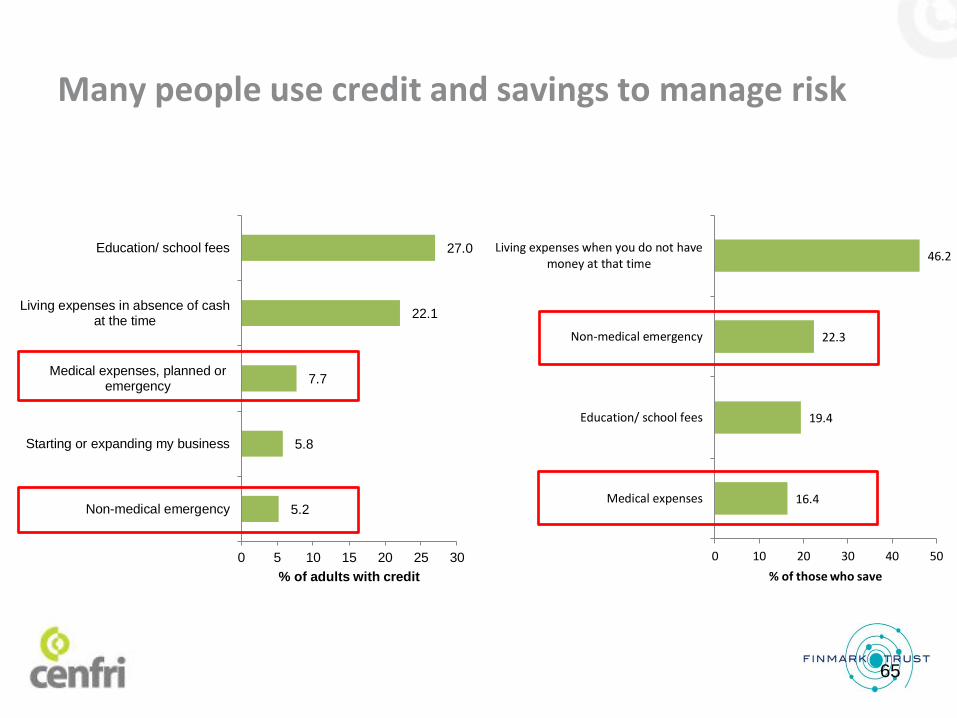
Many people use credit and savings to manage risk
65
16.4
19.4
22.3
46.2
0 10 20 30 40 50
Medical expenses
Education/ school fees
Non-medical emergency
Living expenses when you do not havemoney at that time
% of those who save
5.2
5.8
7.7
22.1
27.0
0 5 10 15 20 25 30
Non-medical emergency
Starting or expanding my business
Medical expenses, planned oremergency
Living expenses in absence of cashat the time
Education/ school fees
% of adults with credit
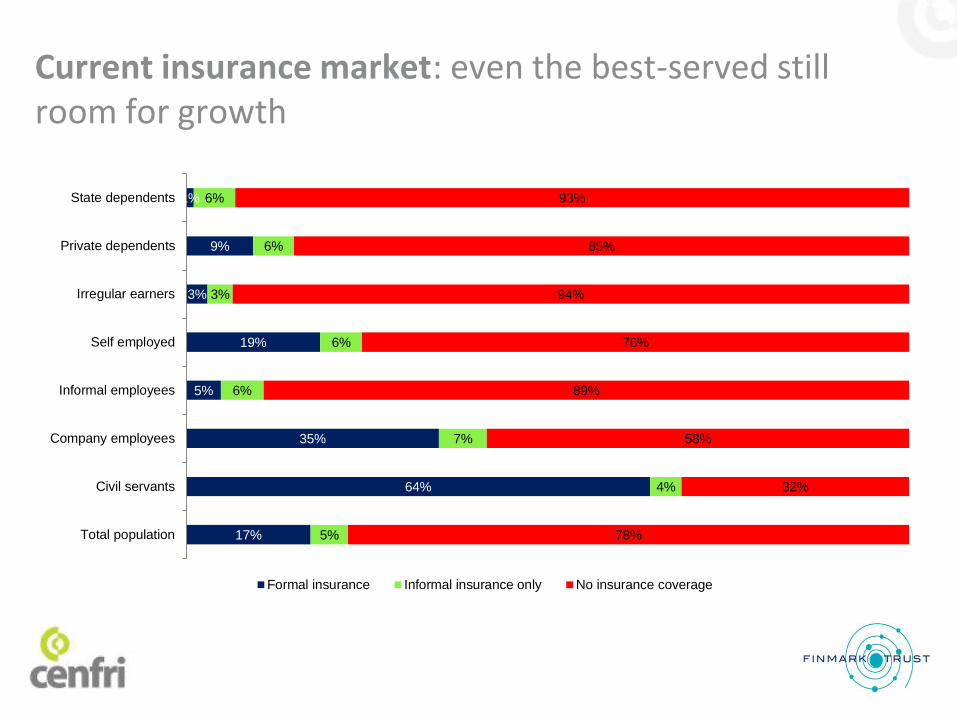
Current insurance market: even the best-served still room for growth
17%
64%
35%
5%
19%
3%
9%
1%
5%
4%
7%
6%
6%
3%
6%
6%
78%
32%
58%
89%
76%
94%
85%
93%
Total population
Civil servants
Company employees
Informal employees
Self employed
Irregular earners
Private dependents
State dependents
Formal insurance Informal insurance only No insurance coverage
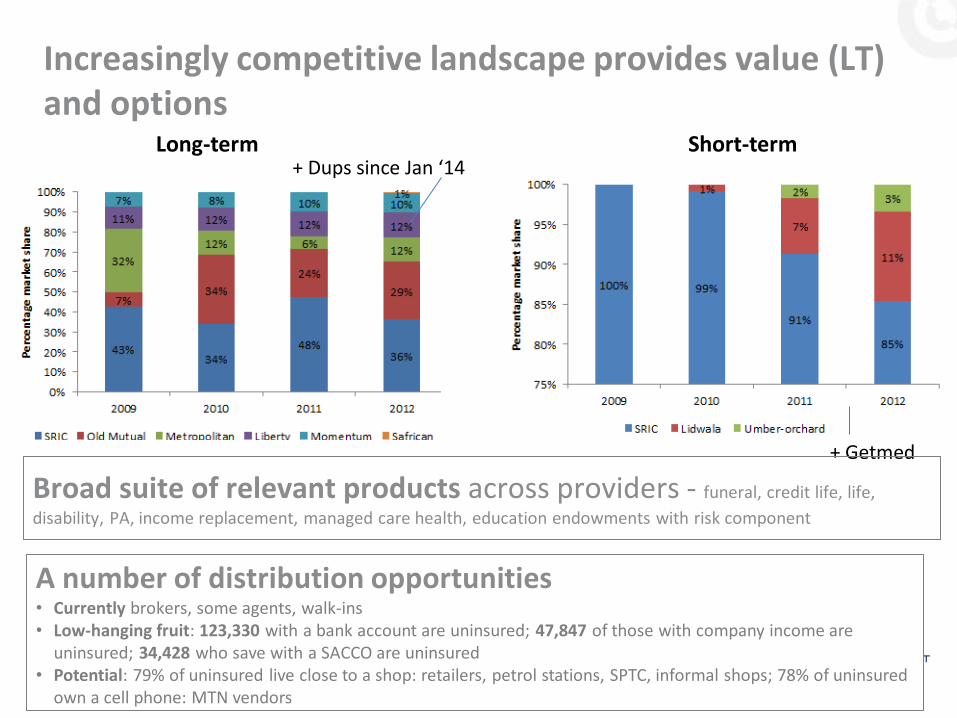
Increasingly competitive landscape provides value (LT) and options
Long-term + Dups since Jan ‘14
Short-term
+ Getmed
Broad suite of relevant products across providers - funeral, credit life, life,
disability, PA, income replacement, managed care health, education endowments with risk component
A number of distribution opportunities • Currently brokers, some agents, walk-ins • Low-hanging fruit: 123,330 with a bank account are uninsured; 47,847 of those with company income are
uninsured; 34,428 who save with a SACCO are uninsured • Potential: 79% of uninsured live close to a shop: retailers, petrol stations, SPTC, informal shops; 78% of uninsured
own a cell phone: MTN vendors
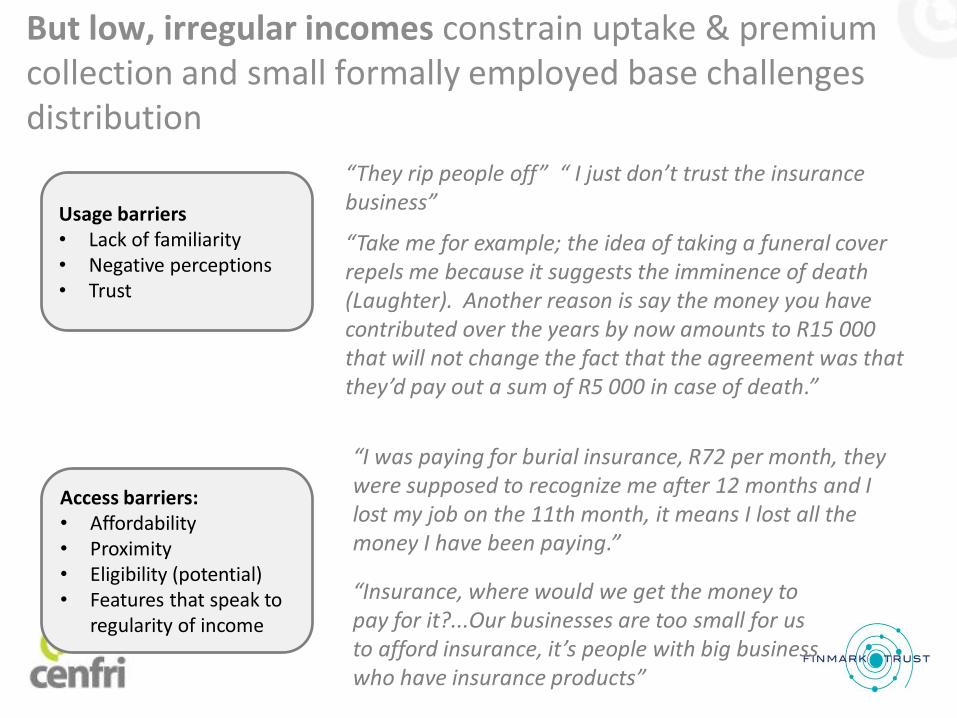
But low, irregular incomes constrain uptake & premium collection and small formally employed base challenges distribution
“They rip people off” “ I just don’t trust the insurance business”
“Take me for example; the idea of taking a funeral cover repels me because it suggests the imminence of death (Laughter). Another reason is say the money you have contributed over the years by now amounts to R15 000 that will not change the fact that the agreement was that they’d pay out a sum of R5 000 in case of death.”
Usage barriers • Lack of familiarity • Negative perceptions • Trust
Access barriers: • Affordability • Proximity • Eligibility (potential) • Features that speak to
regularity of income
“I was paying for burial insurance, R72 per month, they were supposed to recognize me after 12 months and I lost my job on the 11th month, it means I lost all the money I have been paying.”
“Insurance, where would we get the money to pay for it?...Our businesses are too small for us to afford insurance, it’s people with big business who have insurance products”
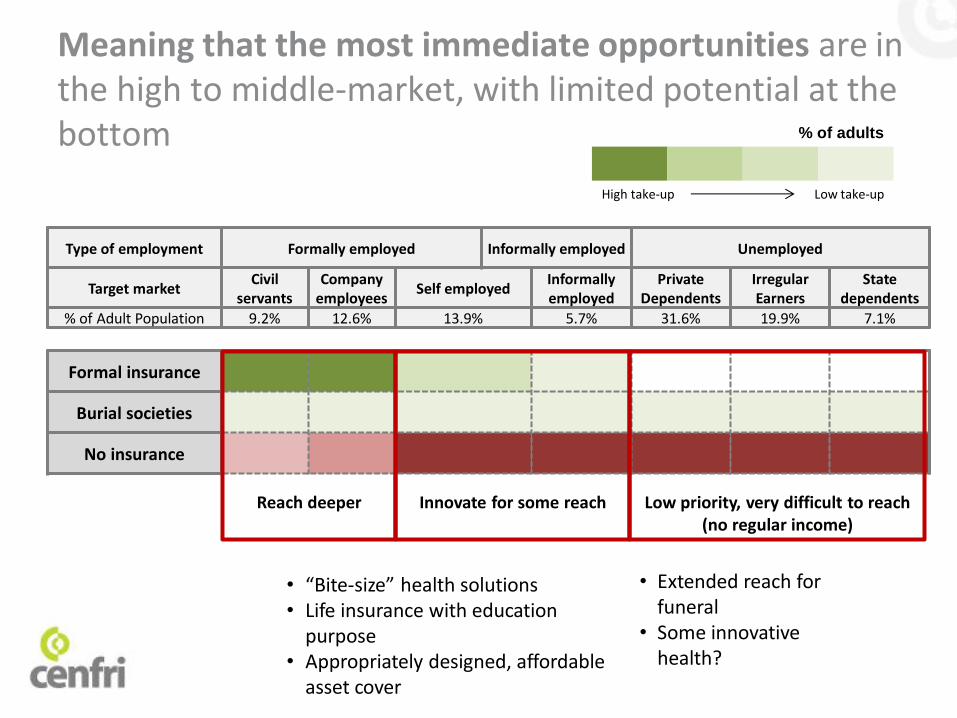
Meaning that the most immediate opportunities are in the high to middle-market, with limited potential at the bottom
Type of employment Formally employed Informally employed Unemployed
Target market Civil
servants Company
employees Self employed
Informally employed
Private Dependents
Irregular Earners
State dependents
% of Adult Population 9.2% 12.6% 13.9% 5.7% 31.6% 19.9% 7.1%
Formal insurance
Burial societies
No insurance
% of adults
High take-up Low take-up
Reach deeper
Low priority, very difficult to reach (no regular income)
Innovate for some reach
• “Bite-size” health solutions • Life insurance with education
purpose • Appropriately designed, affordable
asset cover
• Extended reach for funeral
• Some innovative health?
1. Mobile money to transact and save
2. Supporting dependents
3. Managing the impact of risk
4. Deepening bank reach
5. Getting the credit basics right
Financial Inclusion Priorities
70
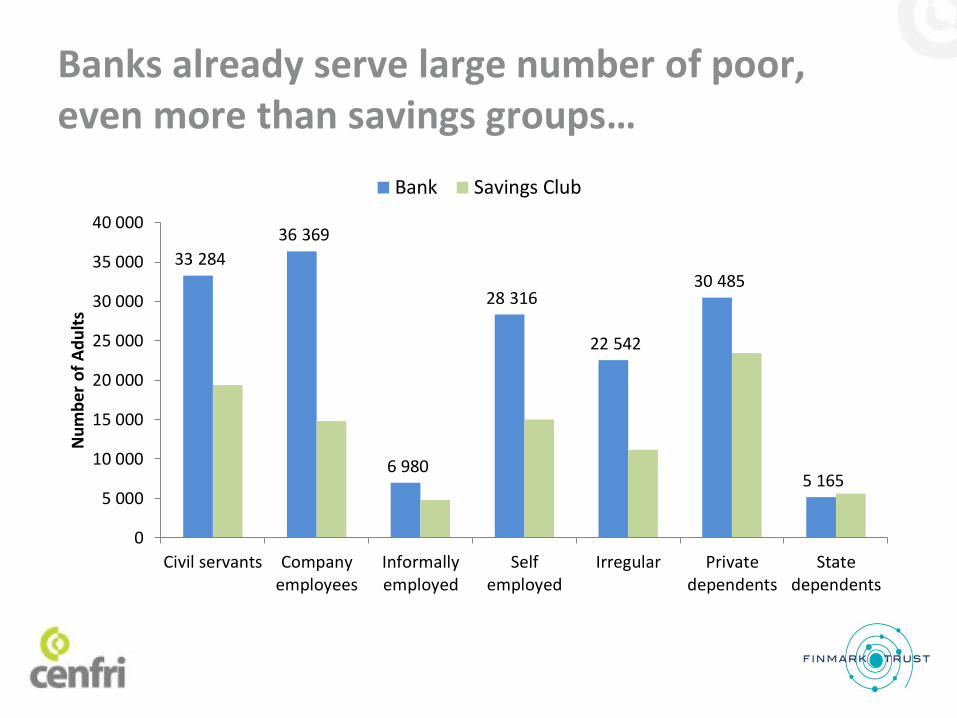
Banks already serve large number of poor, even more than savings groups…
33 284
36 369
6 980
28 316
22 542
30 485
5 165
0
5 000
10 000
15 000
20 000
25 000
30 000
35 000
40 000
Civil servants Companyemployees
Informallyemployed
Selfemployed
Irregular Privatedependents
Statedependents
Nu
mb
er o
f A
du
lts
Bank Savings Club

Formally employed
…but many don’t use banks to transact or save…
>50 000 adults have bank accounts but not savings accounts
Many adults’ savings accounts could be dormant or “postbox”? • Don’t use debit or credit
functionality: 28% have ATM cards, only 3.5% report have a debit or credit card
• Withdrawals are higher than incomes: 59% earn < E2,000, average ATM withdrawals=E740
0
50000
100000
150000
200000
250000
SACCO Accounts Swaziland BuldingSociety Accounts
Bank Accounts
Nu
mb
er
of
Ad
ult
s
Savings in Formal Institutions
All target groups
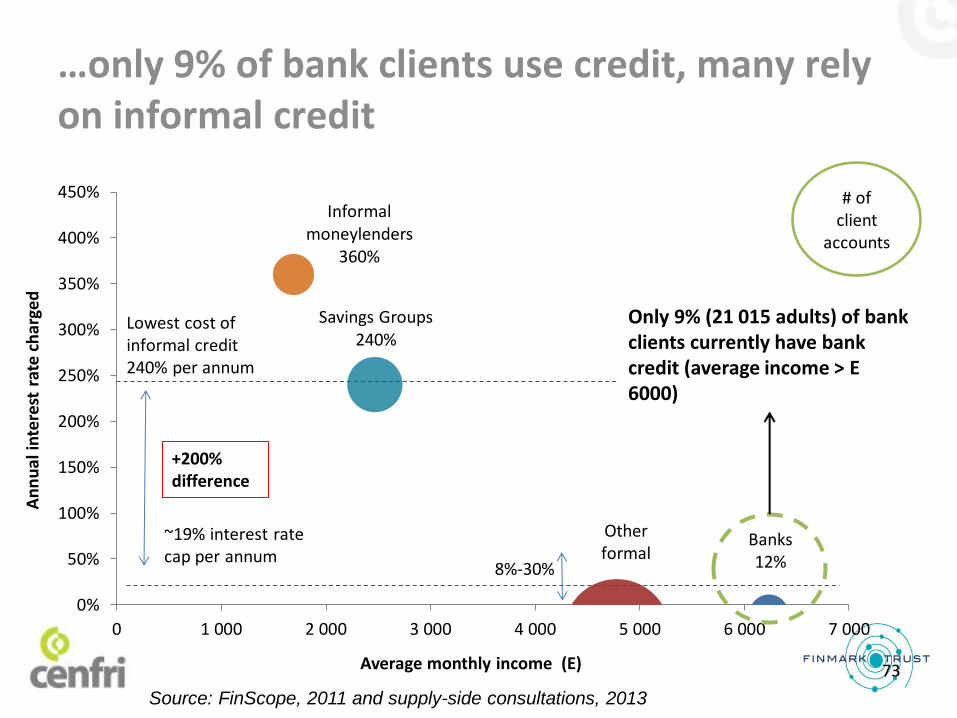
Savings Groups 240%
Informal moneylenders
360%
0%
50%
100%
150%
200%
250%
300%
350%
400%
450%
0 1 000 2 000 3 000 4 000 5 000 6 000 7 000
8%-30%
~19% interest rate cap per annum
+200% difference
Banks 12%
Lowest cost of informal credit 240% per annum
Other formal
…only 9% of bank clients use credit, many rely on informal credit
73 Average monthly income (E)
# of client
accounts
An
nu
al in
tere
st r
ate
ch
arge
d
Source: FinScope, 2011 and supply-side consultations, 2013
Only 9% (21 015 adults) of bank clients currently have bank credit (average income > E 6000)
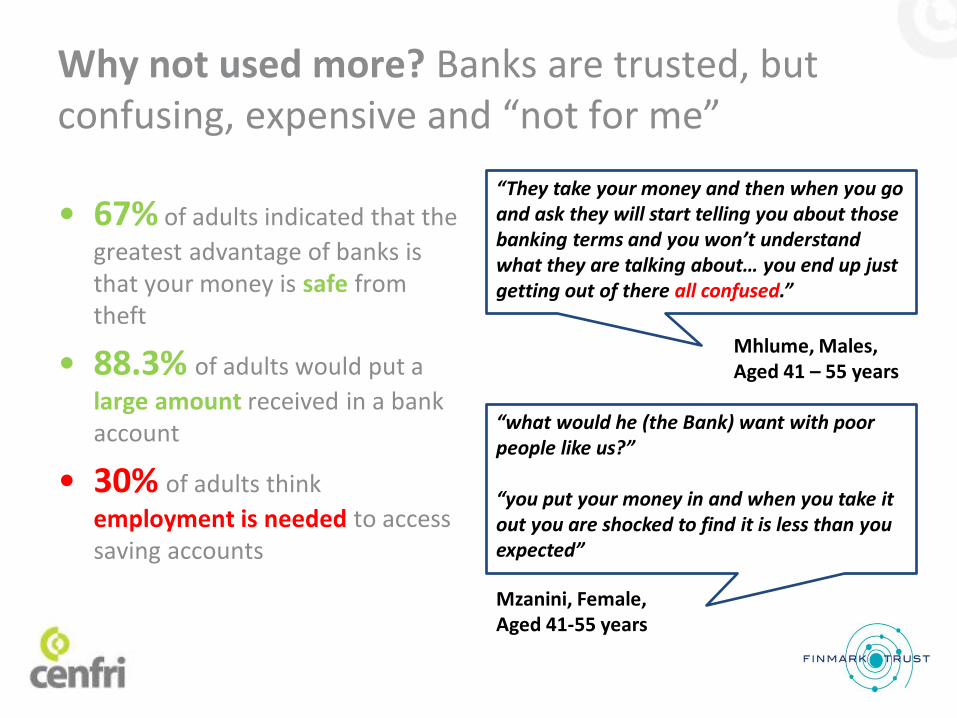
Why not used more? Banks are trusted, but confusing, expensive and “not for me”
• 67% of adults indicated that the
greatest advantage of banks is that your money is safe from theft
• 88.3% of adults would put a
large amount received in a bank account
• 30% of adults think
employment is needed to access saving accounts
“They take your money and then when you go and ask they will start telling you about those banking terms and you won’t understand what they are talking about… you end up just getting out of there all confused.”
Mzanini, Female, Aged 41-55 years
Mhlume, Males, Aged 41 – 55 years
“what would he (the Bank) want with poor people like us?” “you put your money in and when you take it out you are shocked to find it is less than you expected”
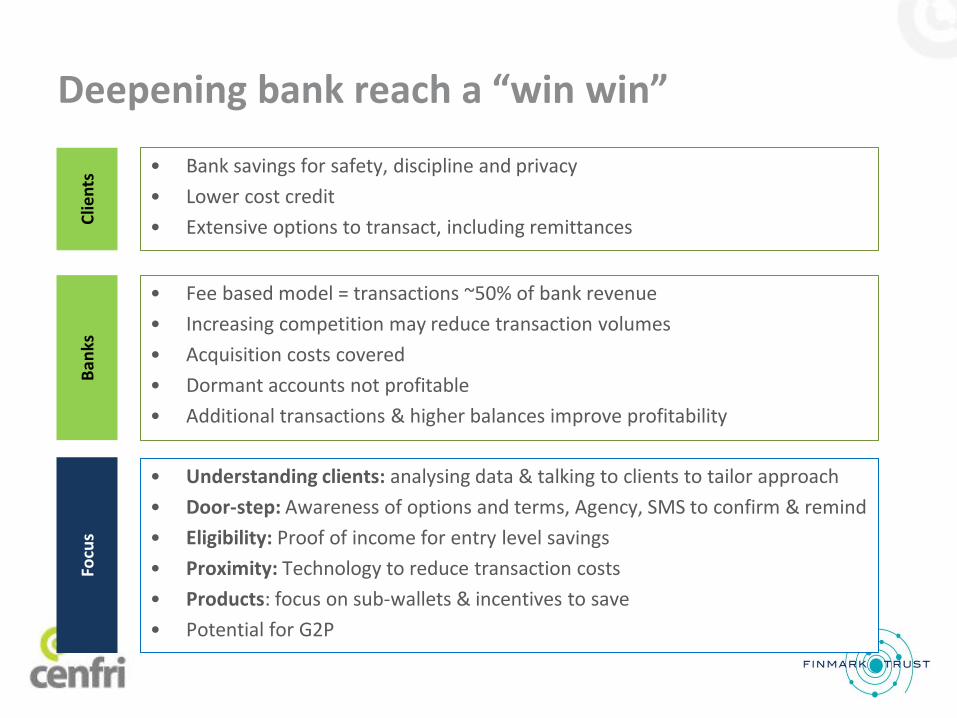
Deepening bank reach a “win win” B
anks
C
lien
ts • Bank savings for safety, discipline and privacy
• Lower cost credit
• Extensive options to transact, including remittances
Focu
s
• Understanding clients: analysing data & talking to clients to tailor approach
• Door-step: Awareness of options and terms, Agency, SMS to confirm & remind
• Eligibility: Proof of income for entry level savings
• Proximity: Technology to reduce transaction costs
• Products: focus on sub-wallets & incentives to save
• Potential for G2P
• Fee based model = transactions ~50% of bank revenue
• Increasing competition may reduce transaction volumes
• Acquisition costs covered
• Dormant accounts not profitable
• Additional transactions & higher balances improve profitability
1. Mobile money to transact and save
2. Supporting dependents
3. Managing the impact of risk
4. Deepening bank reach
5. Getting credit basics right
Financial Inclusion Priorities
76
“What drives us to Shylocks
is our need for money for
school things”
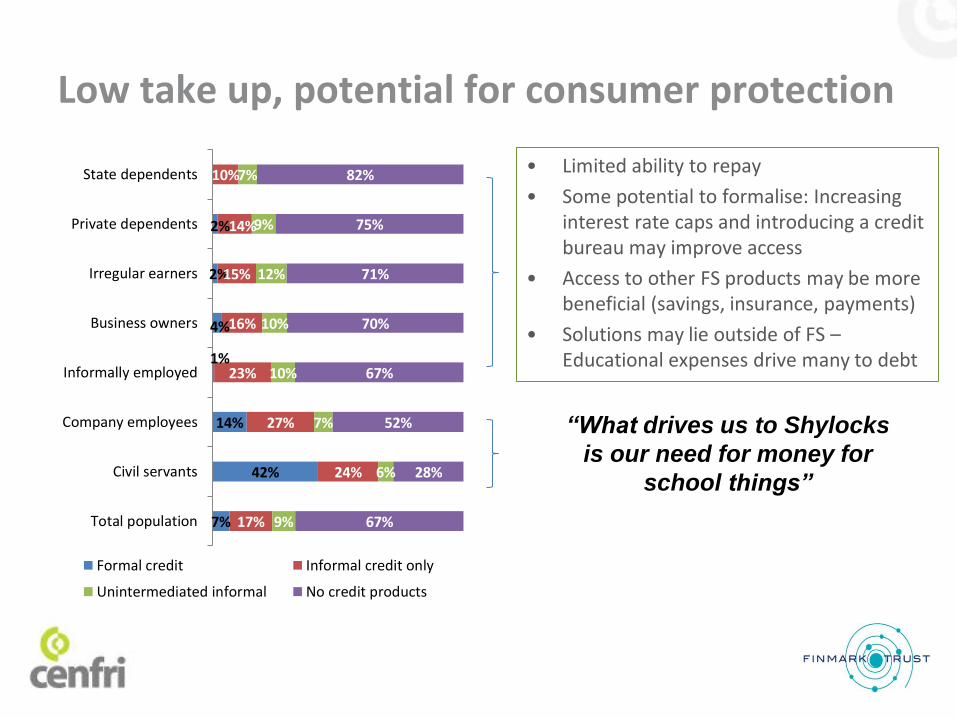
Low take up, potential for consumer protection
7%
42%
14%
1%
4%
2%
2%
17%
24%
27%
23%
16%
15%
14%
10%
9%
6%
7%
10%
10%
12%
9%
7%
67%
28%
52%
67%
70%
71%
75%
82%
Total population
Civil servants
Company employees
Informally employed
Business owners
Irregular earners
Private dependents
State dependents
Formal credit Informal credit only
Unintermediated informal No credit products
• Limited ability to repay
• Some potential to formalise: Increasing interest rate caps and introducing a credit bureau may improve access
• Access to other FS products may be more beneficial (savings, insurance, payments)
• Solutions may lie outside of FS – Educational expenses drive many to debt
“What drives us to Shylocks
is our need for money for
school things”
Low take up, potential for consumer protection
7%
42%
14%
1%
4%
2%
2%
17%
24%
27%
23%
16%
15%
14%
10%
9%
6%
7%
10%
10%
12%
9%
7%
67%
28%
52%
67%
70%
71%
75%
82%
Total population
Civil servants
Company employees
Informally employed
Business owners
Irregular earners
Private dependents
State dependents
Formal credit Informal credit only
Unintermediated informal No credit products
• Limited ability to repay
• Some potential to formalise: Increasing interest rate caps and introducing a credit bureau may improve access
• Access to other FS products may be more beneficial (savings, insurance, payments)
• Solutions may lie outside of FS – Educational expenses drive many to debt
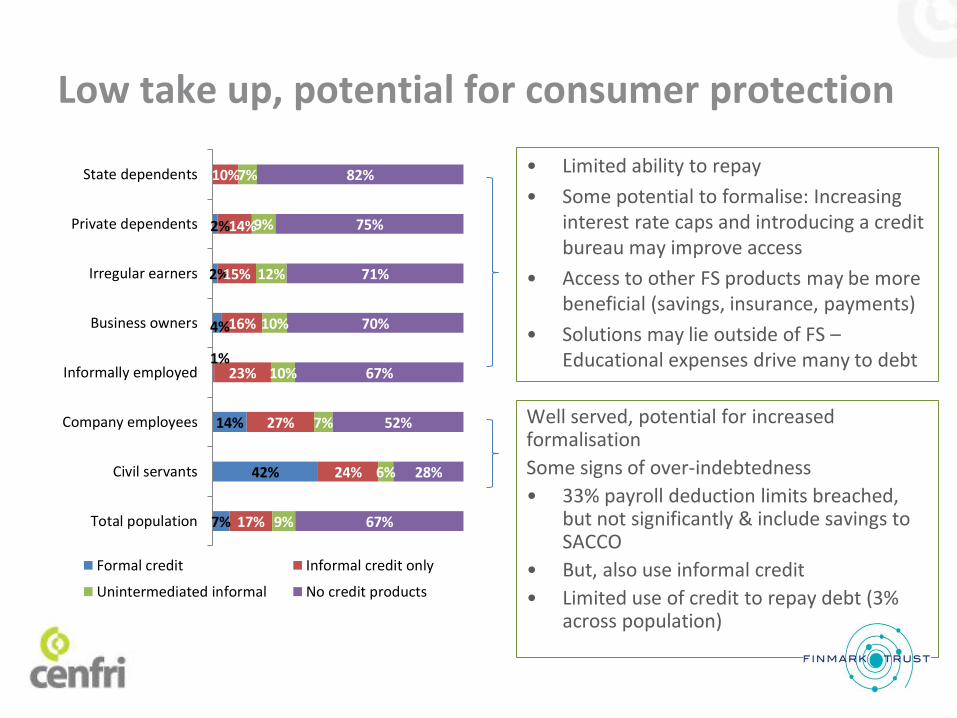
Well served, potential for increased formalisation
Some signs of over-indebtedness
• 33% payroll deduction limits breached, but not significantly & include savings to SACCO
• But, also use informal credit
• Limited use of credit to repay debt (3% across population)
“What drives us to Shylocks
is our need for money for
school things”
Low take up, potential for consumer protection
7%
42%
14%
1%
4%
2%
2%
17%
24%
27%
23%
16%
15%
14%
10%
9%
6%
7%
10%
10%
12%
9%
7%
67%
28%
52%
67%
70%
71%
75%
82%
Total population
Civil servants
Company employees
Informally employed
Business owners
Irregular earners
Private dependents
State dependents
Formal credit Informal credit only
Unintermediated informal No credit products
• Limited ability to repay
• Some potential to formalise: Increasing interest rate caps and introducing a credit bureau may improve access
• Access to other FS products may be more beneficial (savings, insurance, payments)
• Solutions may lie outside of FS – Educational expenses drive many to debt
Well served, potential for increased formalisation
Some signs of over-indebtedness
• 33% payroll deduction limits breached, but not significantly & include savings to SACCO
• But, also use informal credit
• Limited use of credit to repay debt (3% across population)
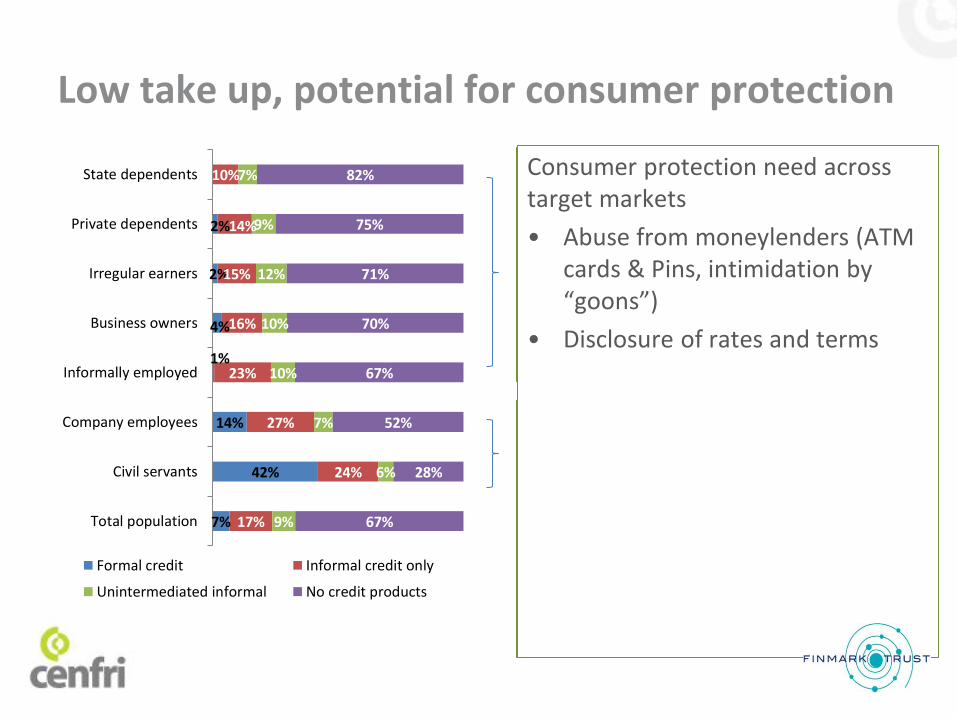
Consumer protection need across target markets
• Abuse from moneylenders (ATM cards & Pins, intimidation by “goons”)
• Disclosure of rates and terms
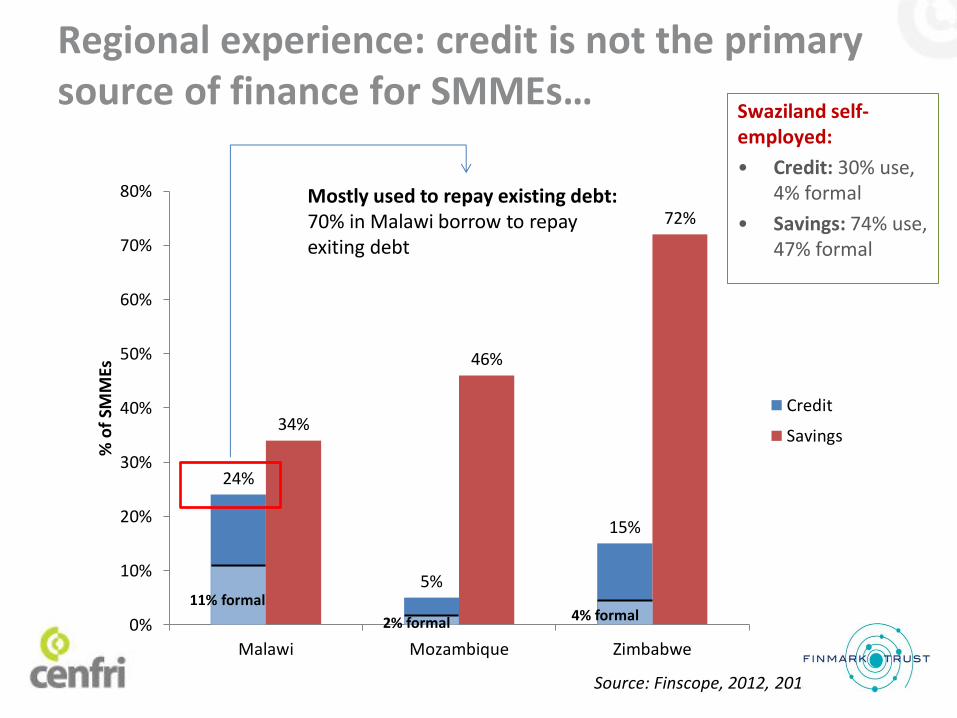
24%
5%
15%
34%
46%
72%
0%
10%
20%
30%
40%
50%
60%
70%
80%
Malawi Mozambique Zimbabwe
% o
f SM
MEs
Credit
Savings
Mostly used to repay existing debt: 70% in Malawi borrow to repay exiting debt
Regional experience: credit is not the primary source of finance for SMMEs…
80 Source: Finscope, 2012, 2013
11% formal 4% formal 2% formal
Swaziland self-employed:
• Credit: 30% use, 4% formal
• Savings: 74% use, 47% formal
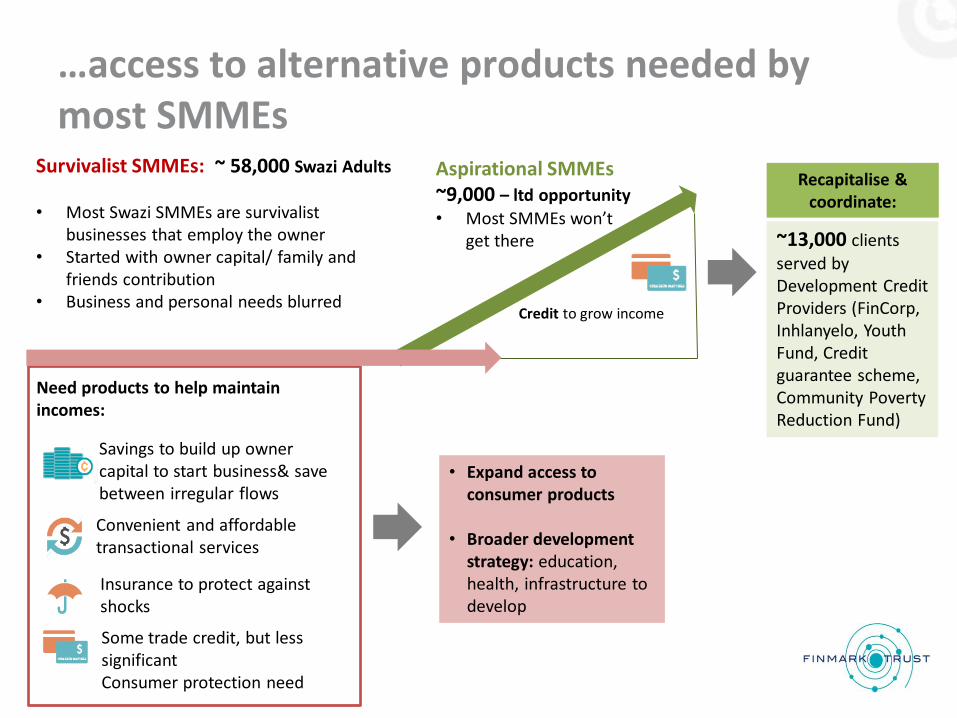
…access to alternative products needed by most SMMEs
• Expand access to consumer products
• Broader development strategy: education, health, infrastructure to develop
Aspirational SMMEs ~9,000 – ltd opportunity
• Most SMMEs won’t get there
Survivalist SMMEs: ~ 58,000 Swazi Adults
• Most Swazi SMMEs are survivalist
businesses that employ the owner • Started with owner capital/ family and
friends contribution • Business and personal needs blurred
Savings to build up owner capital to start business& save between irregular flows
Convenient and affordable transactional services
Insurance to protect against shocks
Credit to grow income
Recapitalise & coordinate:
Some trade credit, but less significant Consumer protection need
~13,000 clients
served by Development Credit Providers (FinCorp, Inhlanyelo, Youth Fund, Credit guarantee scheme, Community Poverty Reduction Fund)
Need products to help maintain incomes:

F. IMPERATIVES TO EXTEND ACCESS
82
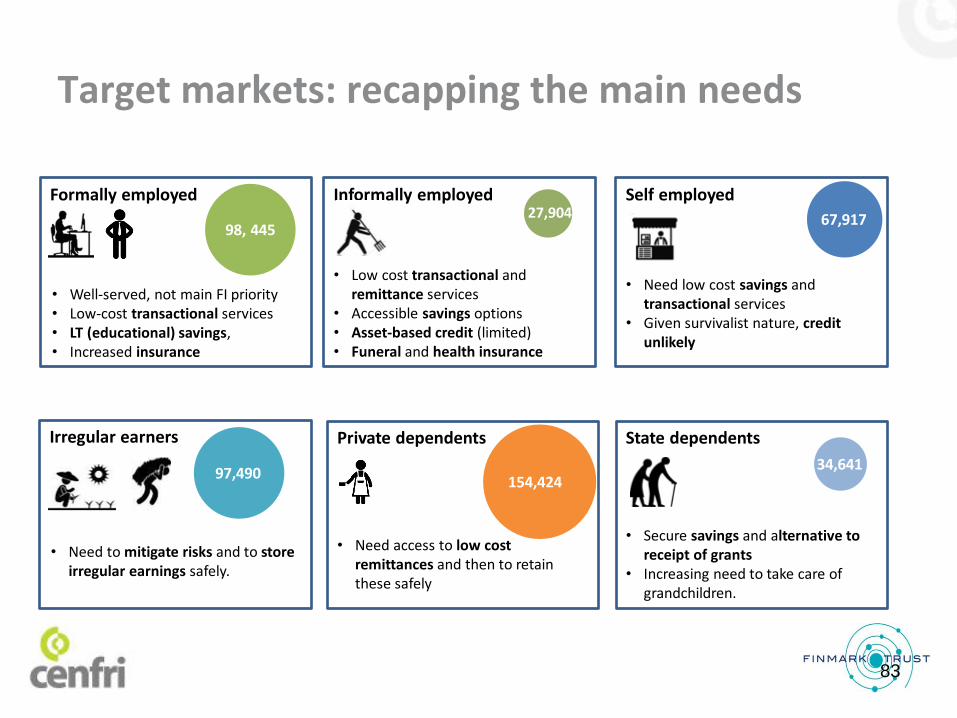
State dependents Private dependents Irregular earners
Informally employed Formally employed
Target markets: recapping the main needs
83
• Well-served, not main FI priority • Low-cost transactional services • LT (educational) savings, • Increased insurance
• Low cost transactional and remittance services
• Accessible savings options • Asset-based credit (limited) • Funeral and health insurance
61,455
Self employed
• Need low cost savings and transactional services
• Given survivalist nature, credit unlikely
27,904
• Need to mitigate risks and to store irregular earnings safely.
67,917
97,490 154,424
• Need access to low cost remittances and then to retain these safely
34,641
• Secure savings and alternative to receipt of grants
• Increasing need to take care of grandchildren.
98, 445
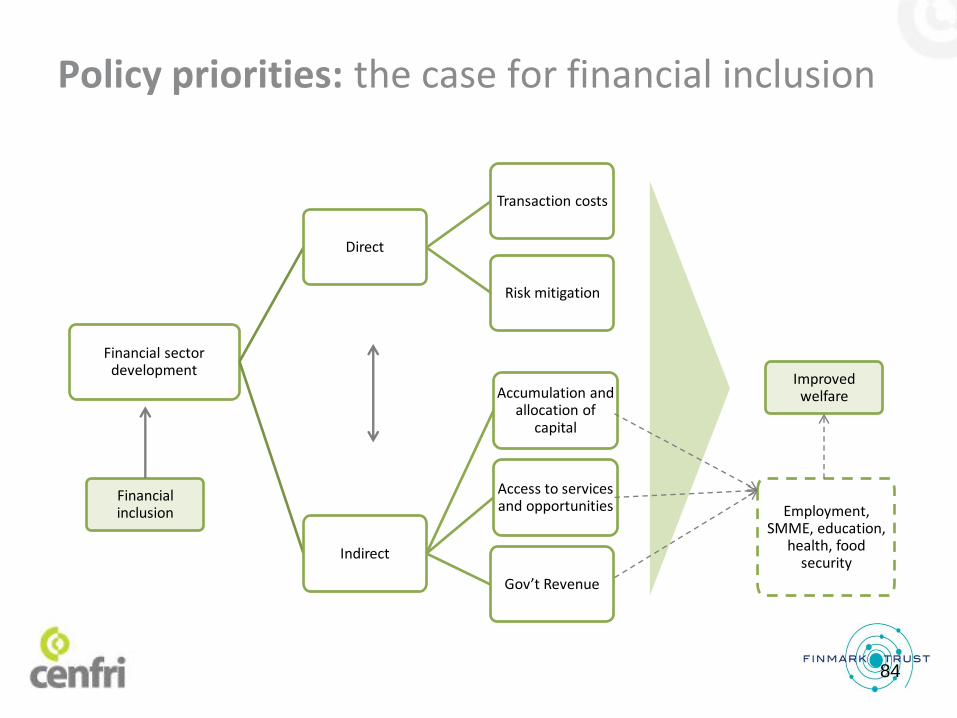
Policy priorities: the case for financial inclusion
Financial sector development
Direct
Transaction costs
Risk mitigation
Indirect
Accumulation and allocation of
capital
Access to services and opportunities
Gov’t Revenue
Improved welfare
Financial inclusion Employment,
SMME, education, health, food
security
84
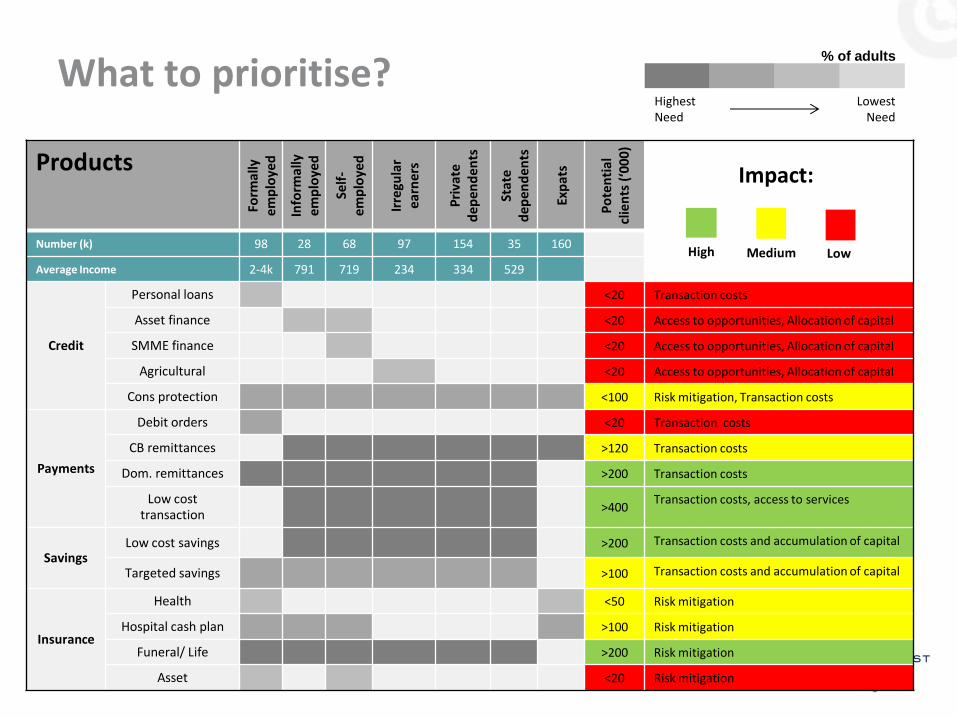
What to prioritise?
85
Products
Form
ally
e
mp
loye
d
Info
rmal
ly
em
plo
yed
Self
- e
mp
loye
d
Irre
gula
r e
arn
ers
Pri
vate
d
ep
en
de
nts
Sta
te
dep
end
ents
Exp
ats
Po
ten
tial
cl
ien
ts (
‘00
0)
Number (k) 98 28 68 97 154 35 160
Average Income 2-4k 791 719 234 334 529
Credit
Personal loans <20 Transaction costs
Asset finance <20 Access to opportunities, Allocation of capital
SMME finance <20 Access to opportunities, Allocation of capital
Agricultural <20 Access to opportunities, Allocation of capital
Cons protection <100 Risk mitigation, Transaction costs
Payments
Debit orders <20 Transaction costs
CB remittances >120 Transaction costs
Dom. remittances >200 Transaction costs
Low cost transaction
>400 Transaction costs, access to services
Savings Low cost savings >200 Transaction costs and accumulation of capital
Targeted savings >100 Transaction costs and accumulation of capital
Insurance
Health <50 Risk mitigation
Hospital cash plan >100 Risk mitigation
Funeral/ Life >200 Risk mitigation
Asset <20 Risk mitigation
% of adults
Highest Need
Lowest Need
High Medium Low
Impact:
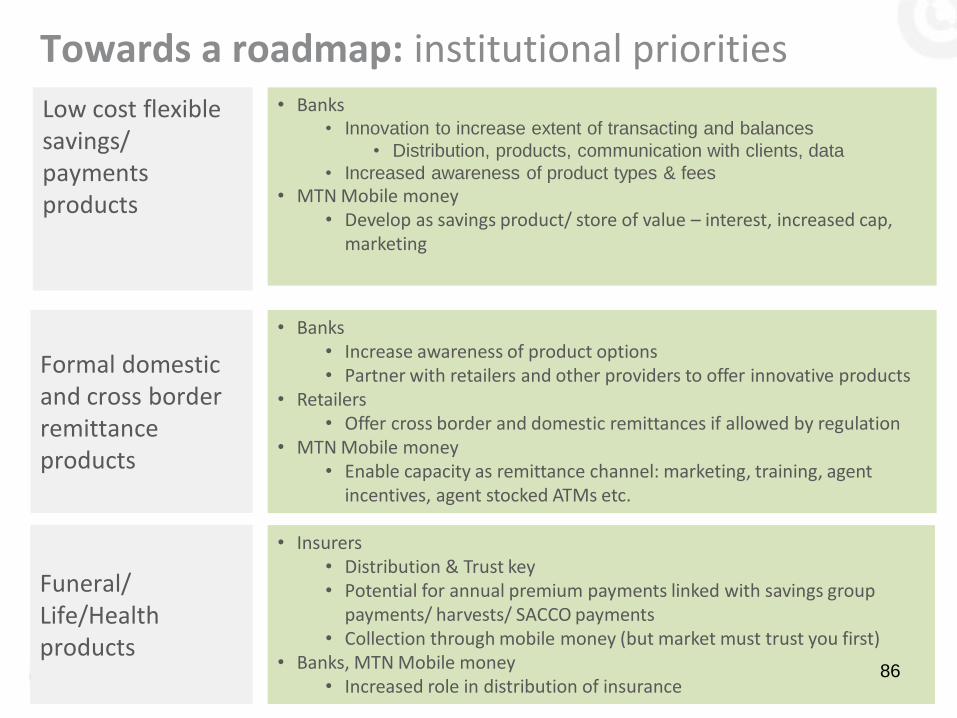
Towards a roadmap: institutional priorities
Funeral/ Life/Health products
Formal domestic and cross border remittance products
• Banks • Innovation to increase extent of transacting and balances
• Distribution, products, communication with clients, data
• Increased awareness of product types & fees
• MTN Mobile money • Develop as savings product/ store of value – interest, increased cap,
marketing
• Banks • Increase awareness of product options • Partner with retailers and other providers to offer innovative products
• Retailers • Offer cross border and domestic remittances if allowed by regulation
• MTN Mobile money • Enable capacity as remittance channel: marketing, training, agent
incentives, agent stocked ATMs etc.
• Insurers • Distribution & Trust key • Potential for annual premium payments linked with savings group
payments/ harvests/ SACCO payments • Collection through mobile money (but market must trust you first)
• Banks, MTN Mobile money • Increased role in distribution of insurance
Low cost flexible savings/ payments products
86
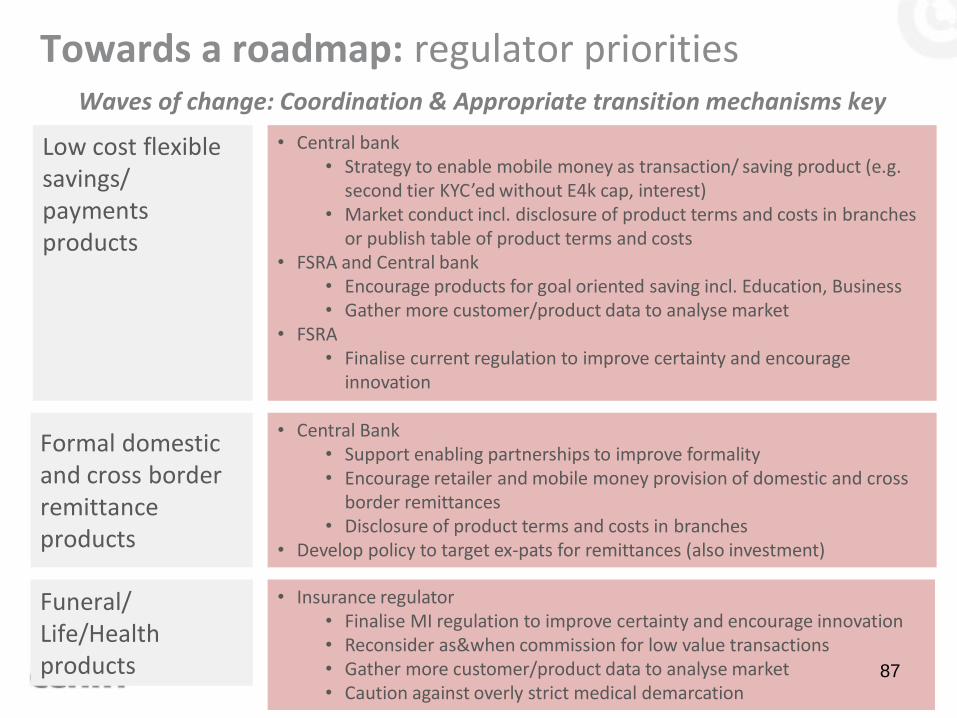
Towards a roadmap: regulator priorities
Funeral/ Life/Health products
Formal domestic and cross border remittance products
• Central bank • Strategy to enable mobile money as transaction/ saving product (e.g.
second tier KYC’ed without E4k cap, interest) • Market conduct incl. disclosure of product terms and costs in branches
or publish table of product terms and costs • FSRA and Central bank
• Encourage products for goal oriented saving incl. Education, Business • Gather more customer/product data to analyse market
• FSRA • Finalise current regulation to improve certainty and encourage
innovation
• Central Bank • Support enabling partnerships to improve formality • Encourage retailer and mobile money provision of domestic and cross
border remittances • Disclosure of product terms and costs in branches
• Develop policy to target ex-pats for remittances (also investment)
• Insurance regulator • Finalise MI regulation to improve certainty and encourage innovation • Reconsider as&when commission for low value transactions • Gather more customer/product data to analyse market • Caution against overly strict medical demarcation
Low cost flexible savings/ payments products
Waves of change: Coordination & Appropriate transition mechanisms key
87
Credit not main strategic focus, but potential to improve current provision by reducing costs and protecting consumers through:
• Address abuse by informal money lenders
• Increase interest rate cap to encourage additional formal provision rather than informal
• Disclosure of total cost of credit
• Encourage establishment of credit bureau to improve information on clients (positive and negative)
• Perform targeted research to understand potential indebtedness of civil servants
• Consolidate and capitalise state funded development credit providers
Towards a roadmap: getting credit basics in place
88
G. TOWARDS A ROADMAP
89

Next steps Stakeholder presentation: 2 April 2014
Draft document for comment to FI Task team: Early May
FI task team meeting to discuss comments: End May
Diagnostic document updated: June
FI task team meeting to plan roadmap process: June
Working groups formed to develop roadmap: End June
FI task team meeting to plan roadmap: July
90
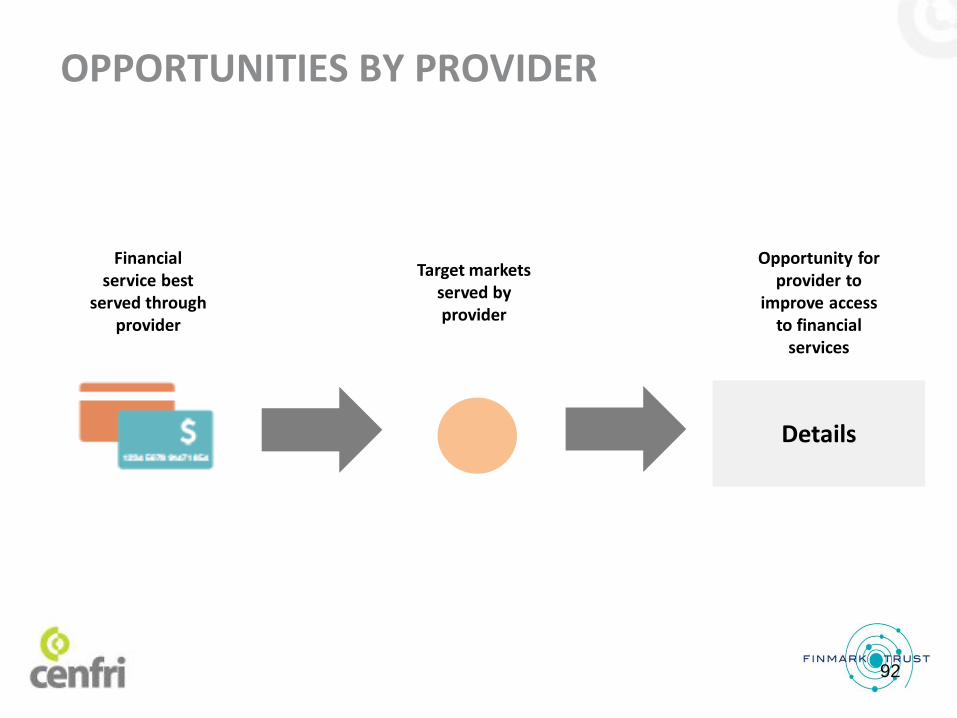
Details
Financial service best
served through provider
Target markets served by provider
Opportunity for provider to
improve access to financial
services
OPPORTUNITIES BY PROVIDER
92
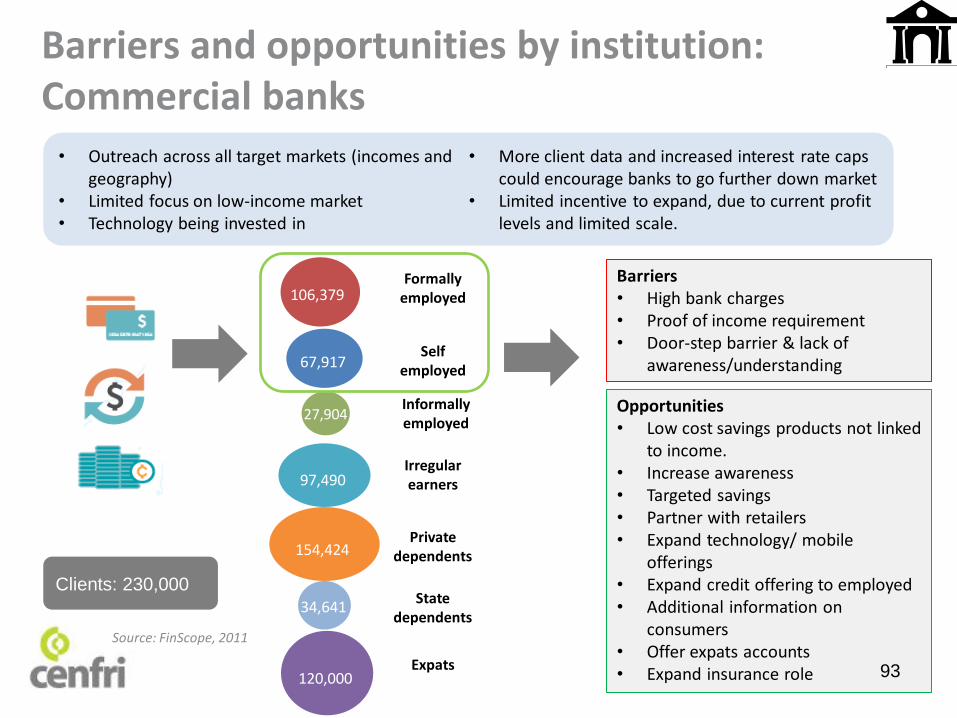
Barriers and opportunities by institution: Commercial banks
Barriers • High bank charges • Proof of income requirement • Door-step barrier & lack of
awareness/understanding
Opportunities • Low cost savings products not linked
to income. • Increase awareness • Targeted savings • Partner with retailers • Expand technology/ mobile
offerings • Expand credit offering to employed • Additional information on
consumers • Offer expats accounts • Expand insurance role
• Outreach across all target markets (incomes and geography)
• Limited focus on low-income market • Technology being invested in
• More client data and increased interest rate caps could encourage banks to go further down market
• Limited incentive to expand, due to current profit levels and limited scale.
Formally employed
Informally employed
Self employed
Irregular earners
Private dependents
106,379
27,904
67,917
97,490
154,424
34,641 State
dependents
Expats
Clients: 230,000
Source: FinScope, 2011
120,000 93
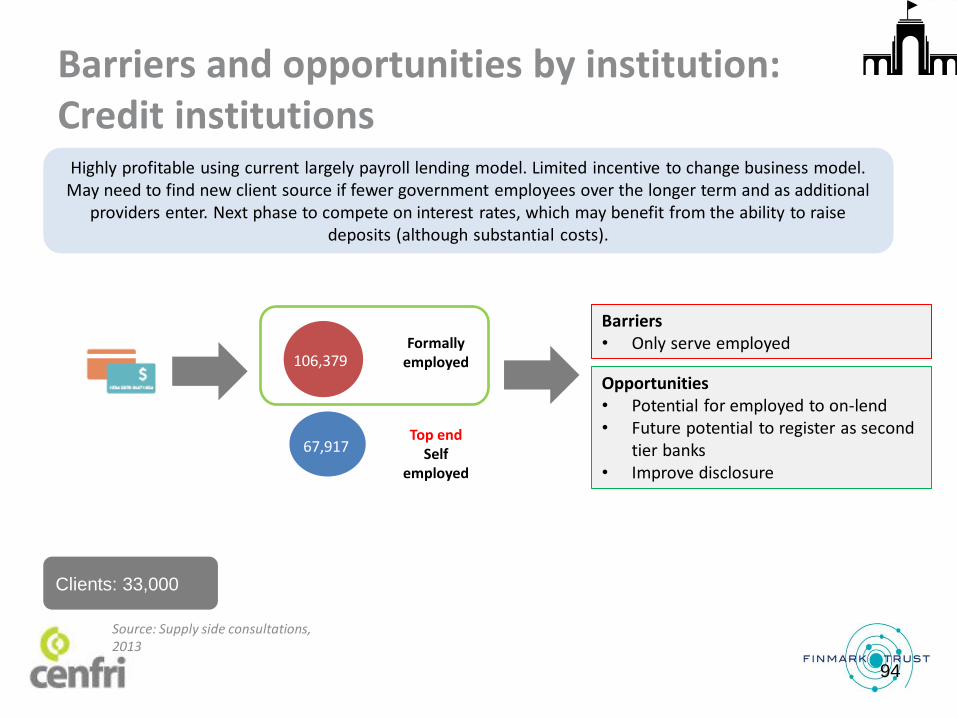
Barriers and opportunities by institution: Credit institutions
Barriers • Only serve employed
Opportunities • Potential for employed to on-lend • Future potential to register as second
tier banks • Improve disclosure
Highly profitable using current largely payroll lending model. Limited incentive to change business model. May need to find new client source if fewer government employees over the longer term and as additional
providers enter. Next phase to compete on interest rates, which may benefit from the ability to raise deposits (although substantial costs).
Formally employed
Top end Self
employed
106,379
67,917
97,490 154,424
Clients: 33,000
Source: Supply side consultations, 2013
94
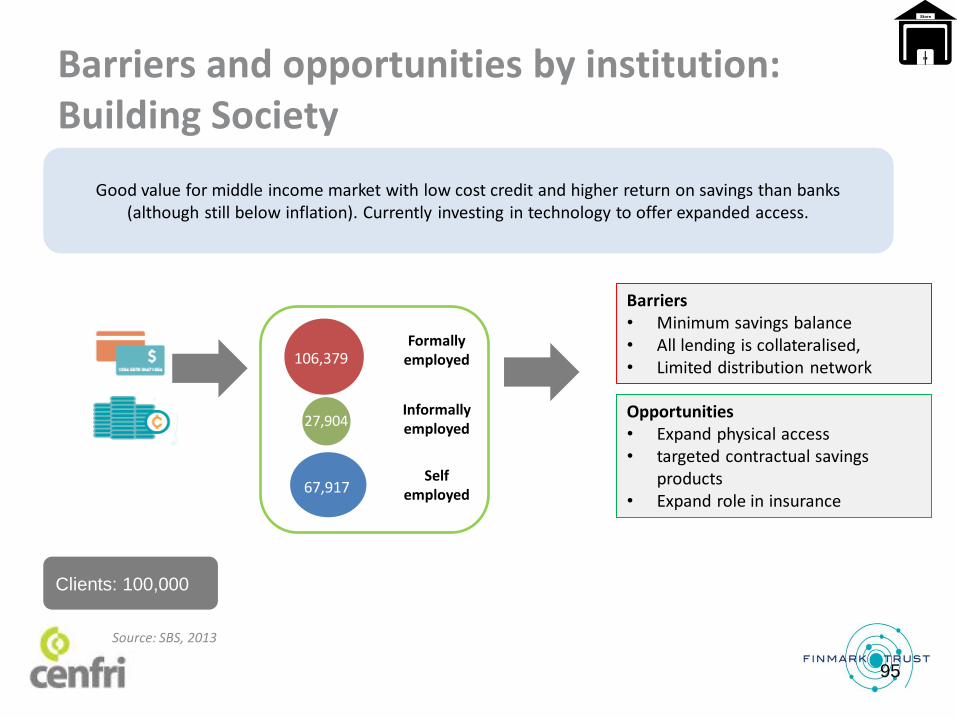
Barriers and opportunities by institution: Building Society
Barriers • Minimum savings balance • All lending is collateralised, • Limited distribution network
Opportunities • Expand physical access • targeted contractual savings
products • Expand role in insurance
Good value for middle income market with low cost credit and higher return on savings than banks (although still below inflation). Currently investing in technology to offer expanded access.
Formally employed
Informally employed
Self employed
106,379
27,904
67,917
Clients: 100,000
Source: SBS, 2013
95
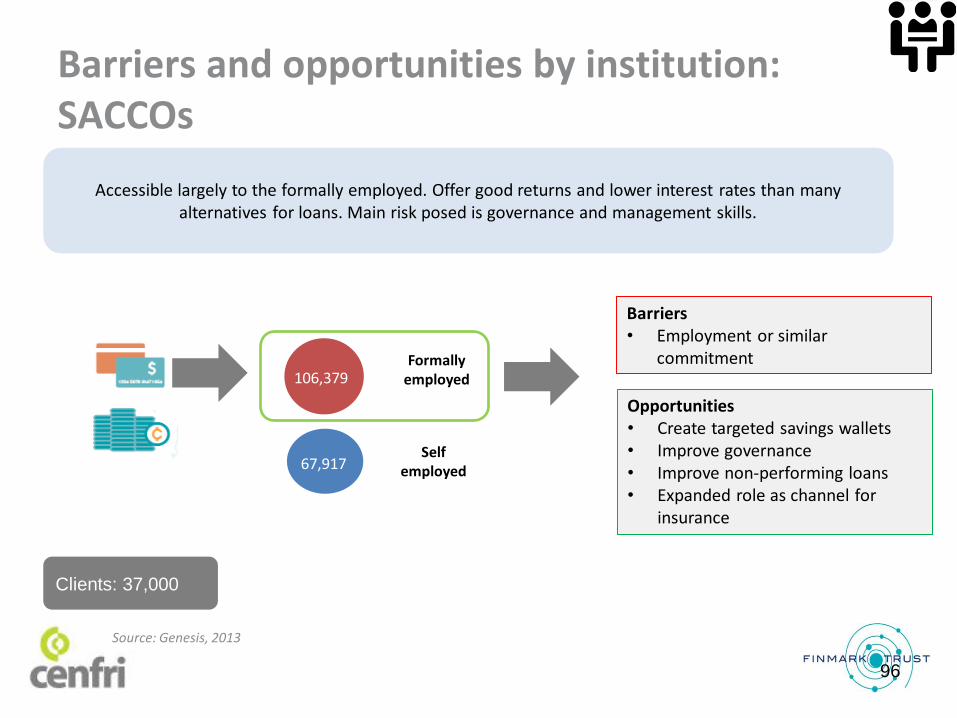
Barriers and opportunities by institution: SACCOs
Barriers • Employment or similar
commitment
Opportunities • Create targeted savings wallets • Improve governance • Improve non-performing loans • Expanded role as channel for
insurance
Accessible largely to the formally employed. Offer good returns and lower interest rates than many alternatives for loans. Main risk posed is governance and management skills.
Formally employed 106,379
67,917
Self employed 67,917
Clients: 37,000
Source: Genesis, 2013
96
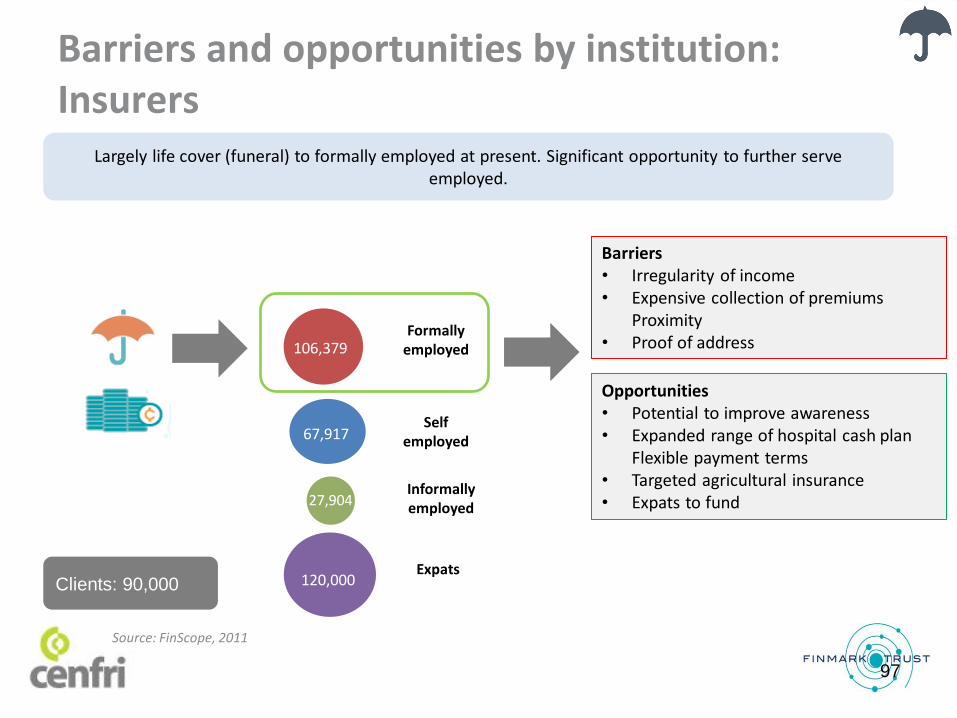
Barriers and opportunities by institution: Insurers
Barriers • Irregularity of income • Expensive collection of premiums
Proximity • Proof of address
Opportunities • Potential to improve awareness • Expanded range of hospital cash plan
Flexible payment terms • Targeted agricultural insurance • Expats to fund
Largely life cover (funeral) to formally employed at present. Significant opportunity to further serve employed.
Formally employed
Self employed
106,379
67,917
97,490 154,424
Clients: 90,000
Source: FinScope, 2011
Informally employed 27,904
120,000 Expats
97
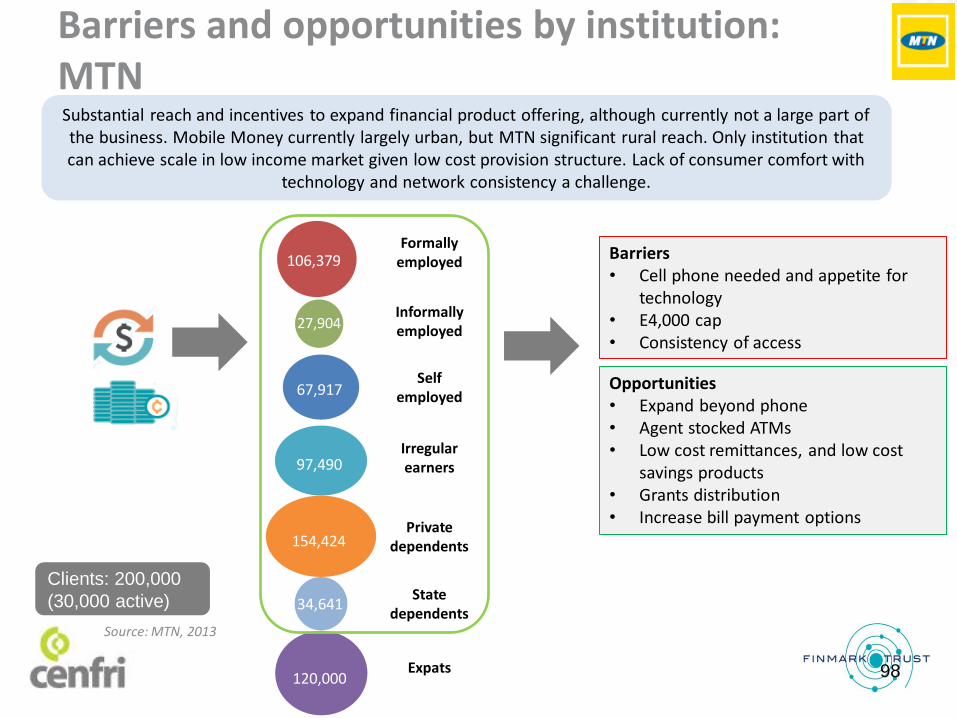
Barriers and opportunities by institution: MTN
Barriers • Cell phone needed and appetite for
technology • E4,000 cap • Consistency of access
Opportunities • Expand beyond phone • Agent stocked ATMs • Low cost remittances, and low cost
savings products • Grants distribution • Increase bill payment options
Substantial reach and incentives to expand financial product offering, although currently not a large part of the business. Mobile Money currently largely urban, but MTN significant rural reach. Only institution that can achieve scale in low income market given low cost provision structure. Lack of consumer comfort with
technology and network consistency a challenge.
Formally employed
Informally employed
Self employed
Irregular earners
Private dependents
106,379
27,904
67,917
97,490
154,424
34,641 State
dependents
120,000 Expats
Clients: 200,000
(30,000 active)
Source: MTN, 2013
98
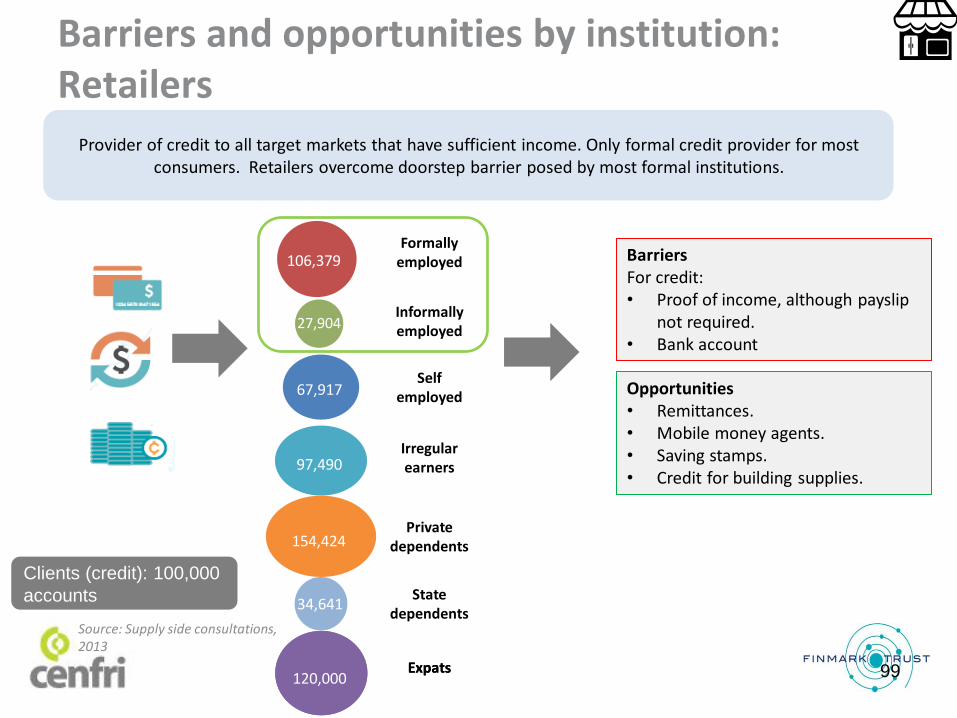
Barriers and opportunities by institution: Retailers
Barriers For credit: • Proof of income, although payslip
not required. • Bank account
Opportunities • Remittances. • Mobile money agents. • Saving stamps. • Credit for building supplies.
Provider of credit to all target markets that have sufficient income. Only formal credit provider for most consumers. Retailers overcome doorstep barrier posed by most formal institutions.
120,000 Expats
Formally employed
Informally employed
Self employed
Irregular earners
Private dependents
106,379
27,904
67,917
97,490
154,424
34,641 State
dependents
120,000 Expats
Clients (credit): 100,000
accounts
Source: Supply side consultations, 2013
99
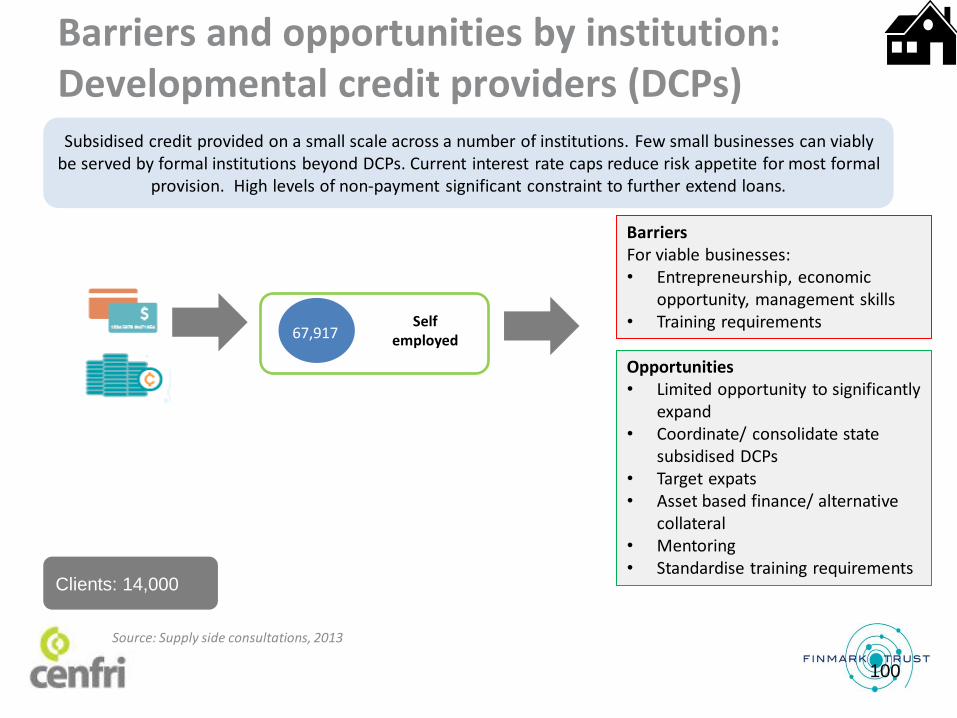
Barriers and opportunities by institution: Developmental credit providers (DCPs)
Barriers For viable businesses: • Entrepreneurship, economic
opportunity, management skills • Training requirements
Opportunities • Limited opportunity to significantly
expand • Coordinate/ consolidate state
subsidised DCPs • Target expats • Asset based finance/ alternative
collateral • Mentoring • Standardise training requirements
Subsidised credit provided on a small scale across a number of institutions. Few small businesses can viably be served by formal institutions beyond DCPs. Current interest rate caps reduce risk appetite for most formal
provision. High levels of non-payment significant constraint to further extend loans.
Self employed 67,917
Clients: 14,000
Source: Supply side consultations, 2013
100
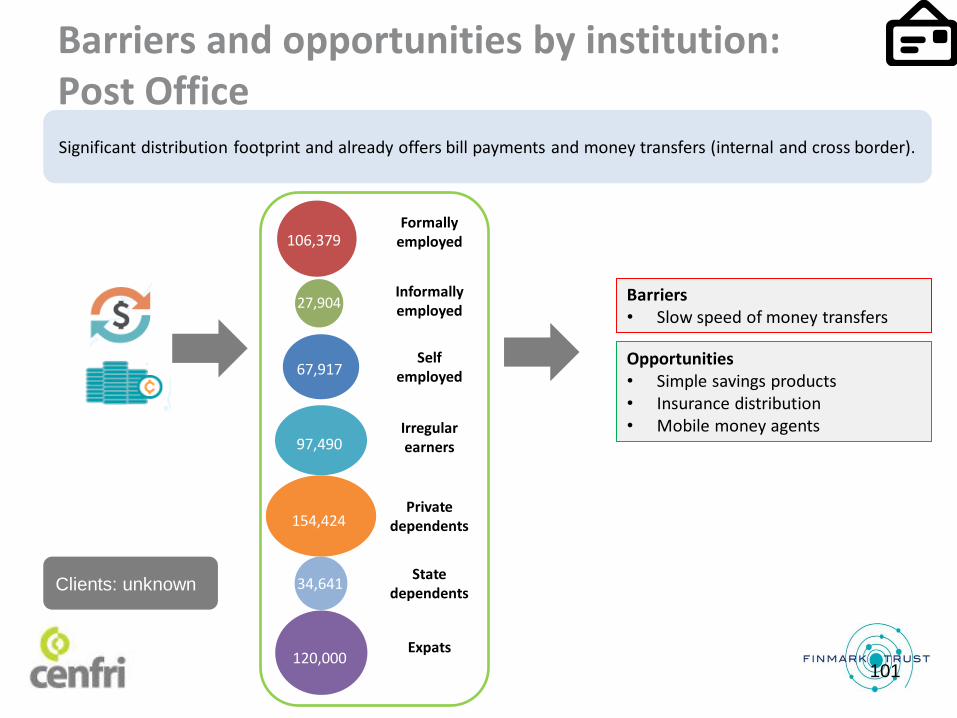
Barriers and opportunities by institution: Post Office
Opportunities • Simple savings products • Insurance distribution • Mobile money agents
Significant distribution footprint and already offers bill payments and money transfers (internal and cross border).
Clients: unknown
Formally employed
Informally employed
Self employed
Irregular earners
Private dependents
106,379
27,904
67,917
97,490
154,424
34,641 State
dependents
120,000 Expats
Barriers • Slow speed of money transfers
101


![SWAZILAND GOVERNMENT GAZETTE EXTRAORDINARY - Swaziland Competition … Commission Regulations... · SWAZILAND GOVERNMENT GAZETTE EXTRAORDINARY VOL. XLVIII] ... \ THE COMPETITION ACT,](https://img.pdfslide.us/doc/110x75/5ad0acb57f8b9a8b1e8e2be8/swaziland-government-gazette-extraordinary-swaziland-competition-commission.jpg)