Embed Size (px)
Citation preview
DATE
Report
NUMÉRO DE PROJET
2
METHODOLOGYMETHODOLOGY
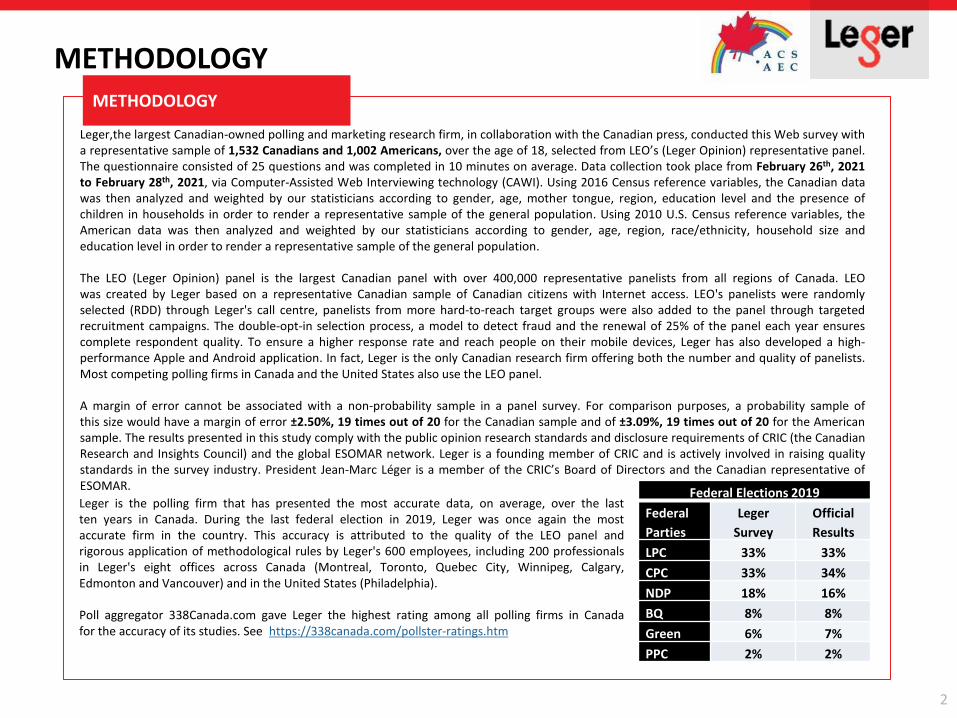
Leger,the largest Canadian-owned polling and marketing research firm, in collaboration with the Canadian press, conducted this Web survey witha representative sample of 1,532 Canadians and 1,002 Americans, over the age of 18, selected from LEO’s (Leger Opinion) representative panel.The questionnaire consisted of 25 questions and was completed in 10 minutes on average. Data collection took place from February 26th, 2021to February 28th, 2021, via Computer-Assisted Web Interviewing technology (CAWI). Using 2016 Census reference variables, the Canadian datawas then analyzed and weighted by our statisticians according to gender, age, mother tongue, region, education level and the presence ofchildren in households in order to render a representative sample of the general population. Using 2010 U.S. Census reference variables, theAmerican data was then analyzed and weighted by our statisticians according to gender, age, region, race/ethnicity, household size andeducation level in order to render a representative sample of the general population.
The LEO (Leger Opinion) panel is the largest Canadian panel with over 400,000 representative panelists from all regions of Canada. LEOwas created by Leger based on a representative Canadian sample of Canadian citizens with Internet access. LEO's panelists were randomlyselected (RDD) through Leger's call centre, panelists from more hard-to-reach target groups were also added to the panel through targetedrecruitment campaigns. The double-opt-in selection process, a model to detect fraud and the renewal of 25% of the panel each year ensurescomplete respondent quality. To ensure a higher response rate and reach people on their mobile devices, Leger has also developed a high-performance Apple and Android application. In fact, Leger is the only Canadian research firm offering both the number and quality of panelists.Most competing polling firms in Canada and the United States also use the LEO panel.
A margin of error cannot be associated with a non-probability sample in a panel survey. For comparison purposes, a probability sample ofthis size would have a margin of error ±2.50%, 19 times out of 20 for the Canadian sample and of ±3.09%, 19 times out of 20 for the Americansample. The results presented in this study comply with the public opinion research standards and disclosure requirements of CRIC (the CanadianResearch and Insights Council) and the global ESOMAR network. Leger is a founding member of CRIC and is actively involved in raising qualitystandards in the survey industry. President Jean-Marc Léger is a member of the CRIC’s Board of Directors and the Canadian representative ofESOMAR.
Federal Elections 2019
Federal
Parties
Leger
Survey
Official
Results
LPC 33% 33%
CPC 33% 34%
NDP 18% 16%
BQ 8% 8%
Green 6% 7%
PPC 2% 2%
Leger is the polling firm that has presented the most accurate data, on average, over the lastten years in Canada. During the last federal election in 2019, Leger was once again the mostaccurate firm in the country. This accuracy is attributed to the quality of the LEO panel andrigorous application of methodological rules by Leger's 600 employees, including 200 professionalsin Leger's eight offices across Canada (Montreal, Toronto, Quebec City, Winnipeg, Calgary,Edmonton and Vancouver) and in the United States (Philadelphia).
Poll aggregator 338Canada.com gave Leger the highest rating among all polling firms in Canadafor the accuracy of its studies. See https://338canada.com/pollster-ratings.htm
3
METHODOLOGY
Notes on Reading this Report
The numbers presented have been rounded. However, the numbers before rounding were used to calculate thesums presented and might therefore not correspond to the manual addition of these numbers.
In this report, data in bold red characters indicate a significantly lower proportion than that of other respondents.Conversely, data in bold green characters indicate a significantly higher proportion that that of other respondents.
A more detailed methodology is presented in the appendix.
If you have questions about the data presented in this report, please contact Christian Bourque, Associate andExecutive Vice-Present at the following e-mail address: [email protected] or Jack Jedwab, President & CEOof the Association for Canadian Studies: [email protected]
COVID-19 VACCINE
5
TOTALCANADA
ATL QC ON MB/SK AB BC 18-34 35-54 55+ UrbanSub-
urbanRural
Weighted n = 1,532 105 359 588 100 172 208 414 526 592 599 603 308
Unweighted n = 1,532 100 406 608 125 132 161 426 611 495 627 595 291
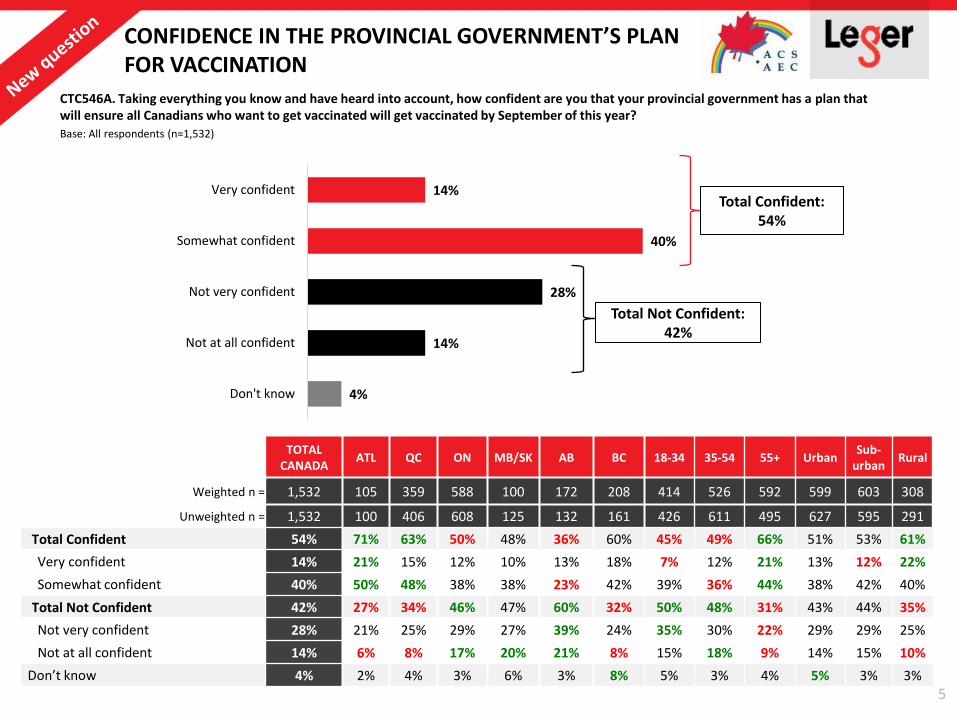
Total Confident 54% 71% 63% 50% 48% 36% 60% 45% 49% 66% 51% 53% 61%
Very confident 14% 21% 15% 12% 10% 13% 18% 7% 12% 21% 13% 12% 22%
Somewhat confident 40% 50% 48% 38% 38% 23% 42% 39% 36% 44% 38% 42% 40%
Total Not Confident 42% 27% 34% 46% 47% 60% 32% 50% 48% 31% 43% 44% 35%
Not very confident 28% 21% 25% 29% 27% 39% 24% 35% 30% 22% 29% 29% 25%
Not at all confident 14% 6% 8% 17% 20% 21% 8% 15% 18% 9% 14% 15% 10%
Don’t know 4% 2% 4% 3% 6% 3% 8% 5% 3% 4% 5% 3% 3%
14%
40%
28%
14%
4%
Very confident
Somewhat confident
Not very confident
Not at all confident
Don't know
CONFIDENCE IN THE PROVINCIAL GOVERNMENT’S PLANFOR VACCINATION
CTC546A. Taking everything you know and have heard into account, how confident are you that your provincial government has a plan that will ensure all Canadians who want to get vaccinated will get vaccinated by September of this year?
Base: All respondents (n=1,532)
Total Confident: 54%
Total Not Confident:42%
6
TOTALCANADA
ATL QC ON MB/SK AB BC 18-34 35-54 55+ UrbanSub-
urbanRural
TOTAL
Feb. 15th Gap
Weighted n = 1,532 105 359 588 100 172 208 414 526 592 599 603 308 1,535
Unweighted n = 1,532 100 406 608 125 132 161 426 611 495 627 595 291 1,535
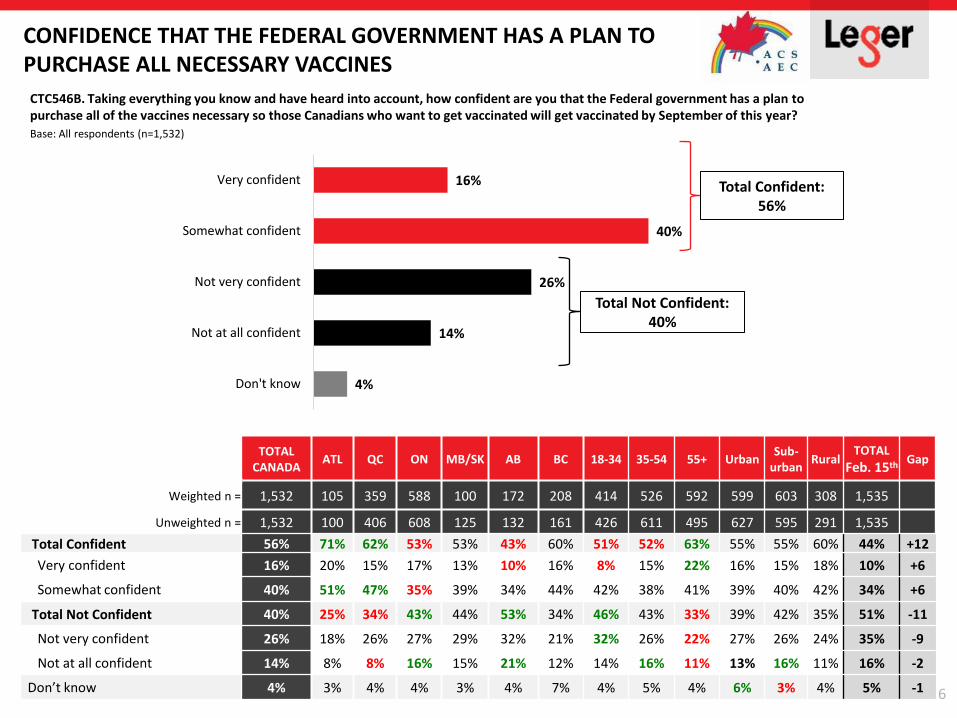
Total Confident 56% 71% 62% 53% 53% 43% 60% 51% 52% 63% 55% 55% 60% 44% +12
Very confident 16% 20% 15% 17% 13% 10% 16% 8% 15% 22% 16% 15% 18% 10% +6
Somewhat confident 40% 51% 47% 35% 39% 34% 44% 42% 38% 41% 39% 40% 42% 34% +6
Total Not Confident 40% 25% 34% 43% 44% 53% 34% 46% 43% 33% 39% 42% 35% 51% -11
Not very confident 26% 18% 26% 27% 29% 32% 21% 32% 26% 22% 27% 26% 24% 35% -9
Not at all confident 14% 8% 8% 16% 15% 21% 12% 14% 16% 11% 13% 16% 11% 16% -2
Don’t know 4% 3% 4% 4% 3% 4% 7% 4% 5% 4% 6% 3% 4% 5% -1
16%
40%
26%
14%
4%
Very confident
Somewhat confident
Not very confident
Not at all confident
Don't know
CONFIDENCE THAT THE FEDERAL GOVERNMENT HAS A PLAN TO PURCHASE ALL NECESSARY VACCINES
CTC546B. Taking everything you know and have heard into account, how confident are you that the Federal government has a plan topurchase all of the vaccines necessary so those Canadians who want to get vaccinated will get vaccinated by September of this year?
Base: All respondents (n=1,532)
Total Confident: 56%
Total Not Confident:40%
7
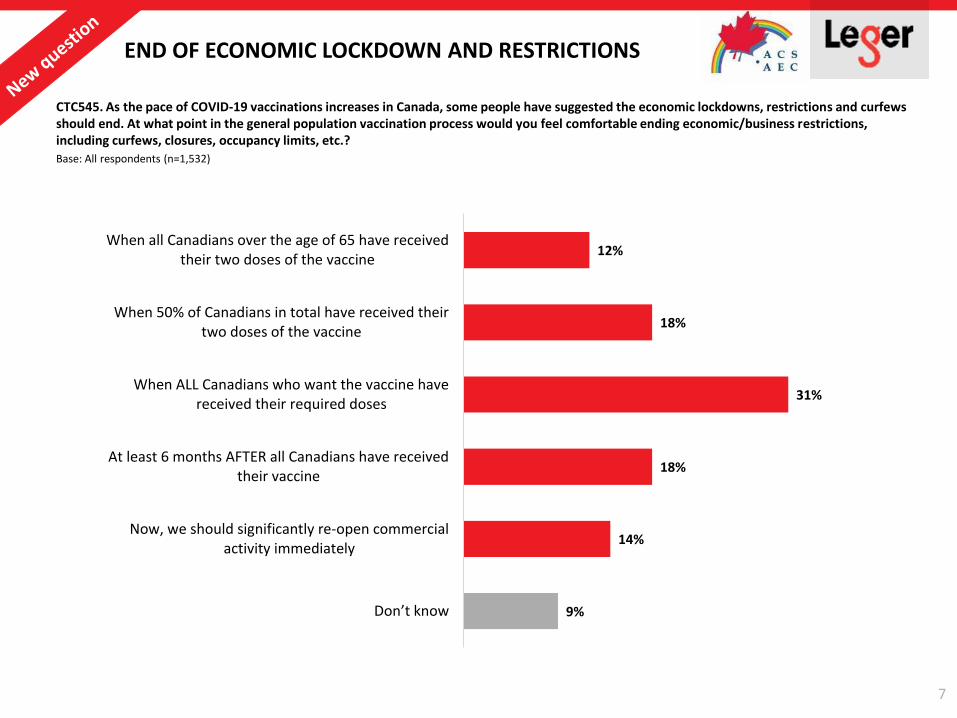
12%
18%
31%
18%
14%
9%
When all Canadians over the age of 65 have receivedtheir two doses of the vaccine
When 50% of Canadians in total have received theirtwo doses of the vaccine
When ALL Canadians who want the vaccine havereceived their required doses
At least 6 months AFTER all Canadians have receivedtheir vaccine
Now, we should significantly re-open commercialactivity immediately
Don’t know
END OF ECONOMIC LOCKDOWN AND RESTRICTIONS
CTC545. As the pace of COVID-19 vaccinations increases in Canada, some people have suggested the economic lockdowns, restrictions and curfews should end. At what point in the general population vaccination process would you feel comfortable ending economic/business restrictions, including curfews, closures, occupancy limits, etc.?
Base: All respondents (n=1,532)
8
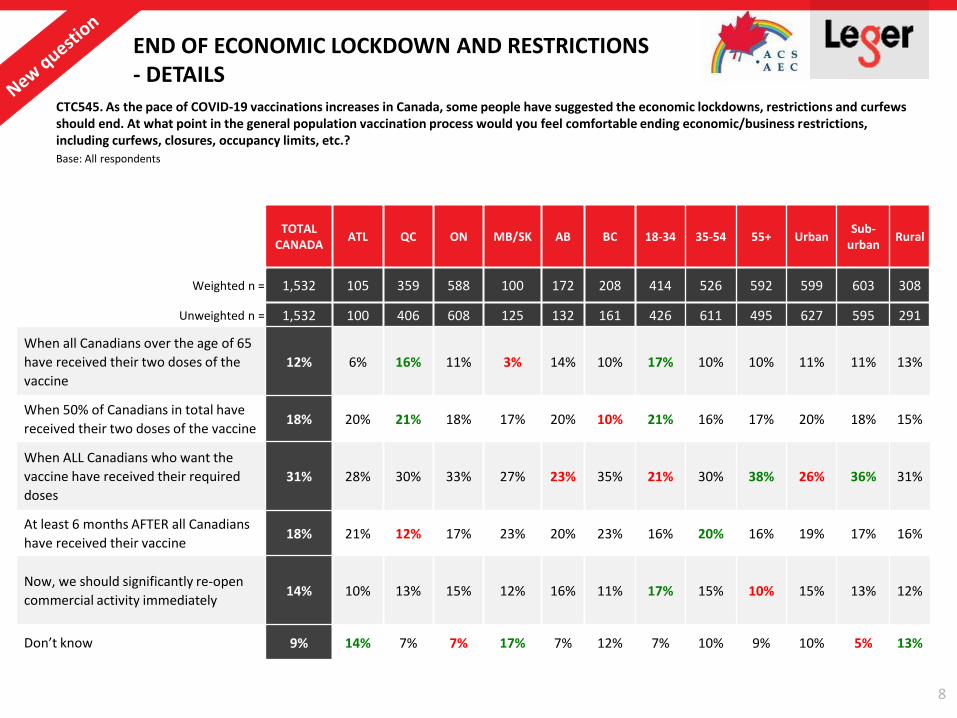
END OF ECONOMIC LOCKDOWN AND RESTRICTIONS - DETAILS
CTC545. As the pace of COVID-19 vaccinations increases in Canada, some people have suggested the economic lockdowns, restrictions and curfews should end. At what point in the general population vaccination process would you feel comfortable ending economic/business restrictions, including curfews, closures, occupancy limits, etc.?
Base: All respondents
TOTALCANADA
ATL QC ON MB/SK AB BC 18-34 35-54 55+ UrbanSub-
urbanRural
Weighted n = 1,532 105 359 588 100 172 208 414 526 592 599 603 308
Unweighted n = 1,532 100 406 608 125 132 161 426 611 495 627 595 291
When all Canadians over the age of 65
have received their two doses of the
vaccine
12% 6% 16% 11% 3% 14% 10% 17% 10% 10% 11% 11% 13%
When 50% of Canadians in total have
received their two doses of the vaccine18% 20% 21% 18% 17% 20% 10% 21% 16% 17% 20% 18% 15%
When ALL Canadians who want the
vaccine have received their required
doses
31% 28% 30% 33% 27% 23% 35% 21% 30% 38% 26% 36% 31%
At least 6 months AFTER all Canadians
have received their vaccine18% 21% 12% 17% 23% 20% 23% 16% 20% 16% 19% 17% 16%
Now, we should significantly re-open
commercial activity immediately14% 10% 13% 15% 12% 16% 11% 17% 15% 10% 15% 13% 12%
Don’t know 9% 14% 7% 7% 17% 7% 12% 7% 10% 9% 10% 5% 13%
9
3%
12%
85%
Yes, I have received a COVID-19 vaccine shot
Yes, one of my immediate family members has received a COVID-19 vaccine shot
No
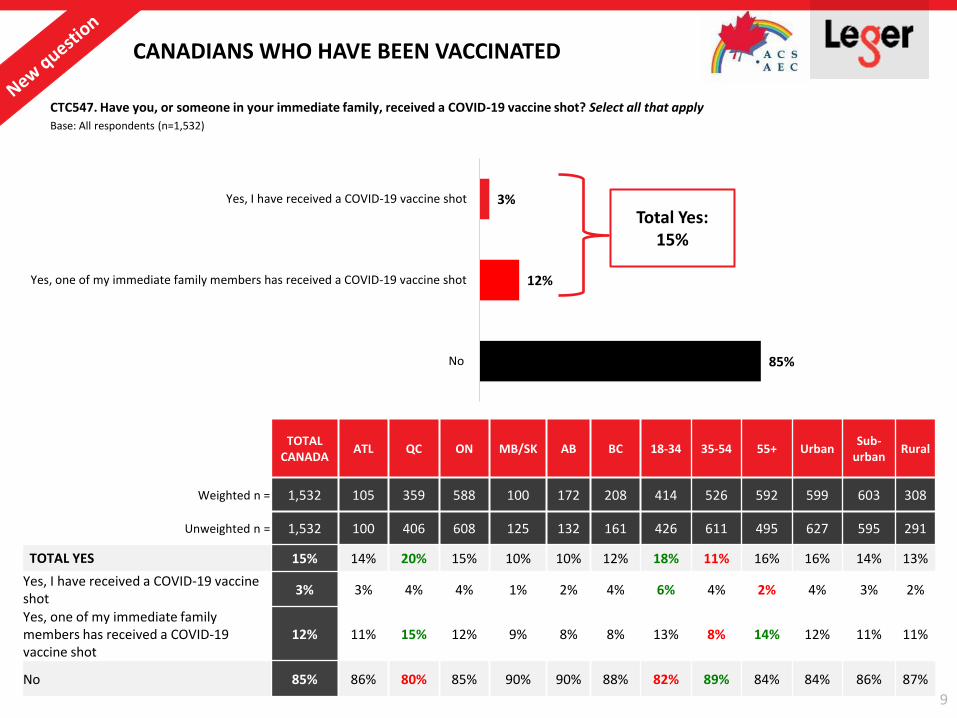
CANADIANS WHO HAVE BEEN VACCINATED
CTC547. Have you, or someone in your immediate family, received a COVID-19 vaccine shot? Select all that apply
Base: All respondents (n=1,532)
Total Yes: 15%
TOTALCANADA
ATL QC ON MB/SK AB BC 18-34 35-54 55+ UrbanSub-
urbanRural
Weighted n = 1,532 105 359 588 100 172 208 414 526 592 599 603 308
Unweighted n = 1,532 100 406 608 125 132 161 426 611 495 627 595 291
TOTAL YES 15% 14% 20% 15% 10% 10% 12% 18% 11% 16% 16% 14% 13%
Yes, I have received a COVID-19 vaccine shot
3% 3% 4% 4% 1% 2% 4% 6% 4% 2% 4% 3% 2%
Yes, one of my immediate family members has received a COVID-19 vaccine shot
12% 11% 15% 12% 9% 8% 8% 13% 8% 14% 12% 11% 11%
No 85% 86% 80% 85% 90% 90% 88% 82% 89% 84% 84% 86% 87%
10
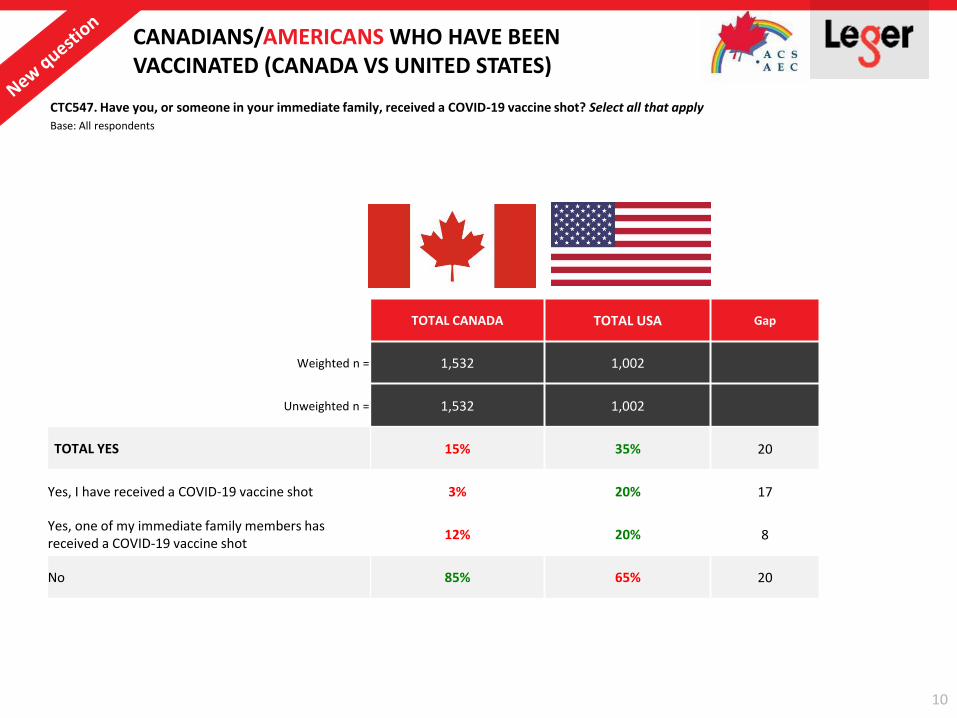
CANADIANS/AMERICANS WHO HAVE BEEN VACCINATED (CANADA VS UNITED STATES)
CTC547. Have you, or someone in your immediate family, received a COVID-19 vaccine shot? Select all that apply
Base: All respondents
TOTAL CANADA TOTAL USA Gap
Weighted n = 1,532 1,002
Unweighted n = 1,532 1,002
TOTAL YES 15% 35% 20
Yes, I have received a COVID-19 vaccine shot 3% 20% 17
Yes, one of my immediate family members has received a COVID-19 vaccine shot
12% 20% 8
No 85% 65% 20
11
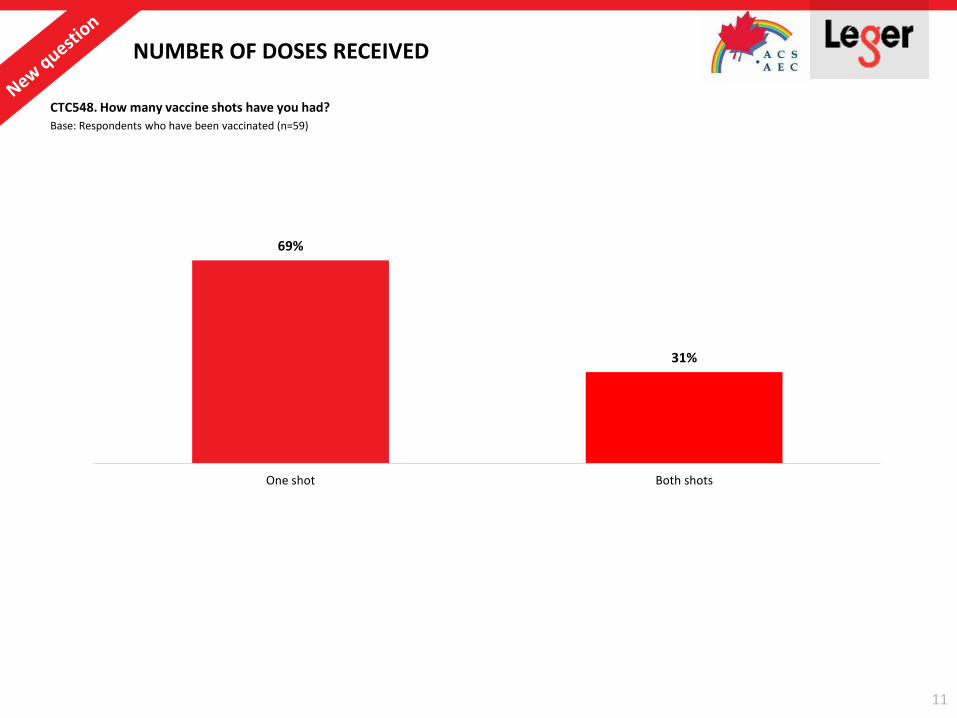
69%
31%
One shot Both shots
NUMBER OF DOSES RECEIVED
CTC548. How many vaccine shots have you had?
Base: Respondents who have been vaccinated (n=59)
12
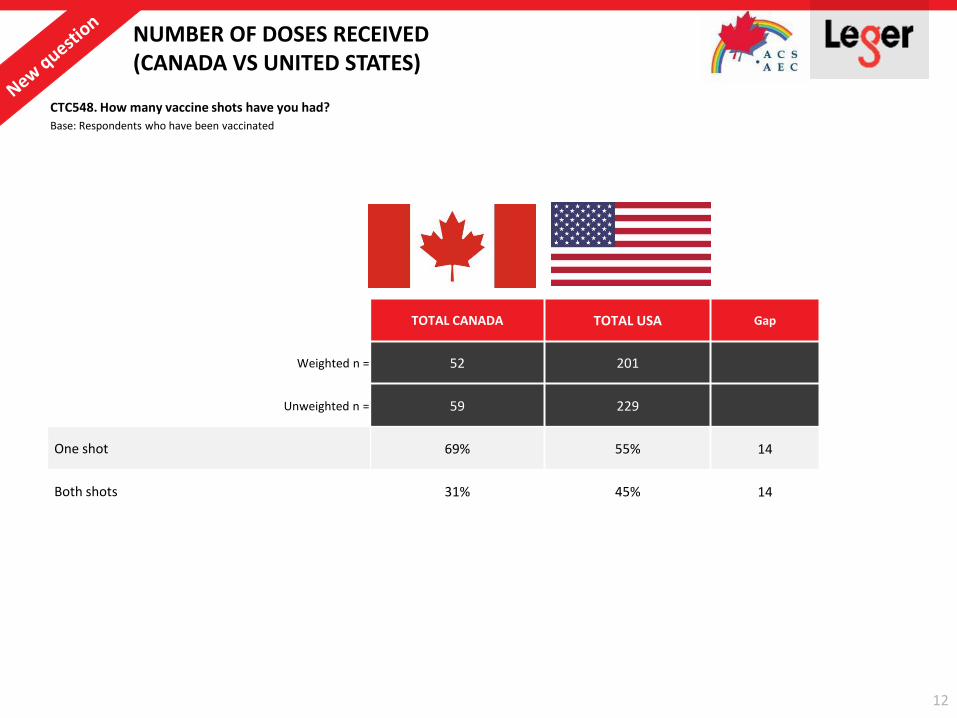
NUMBER OF DOSES RECEIVED(CANADA VS UNITED STATES)
TOTAL CANADA TOTAL USA Gap
Weighted n = 52 201
Unweighted n = 59 229
One shot 69% 55% 14
Both shots 31% 45% 14
CTC548. How many vaccine shots have you had?
Base: Respondents who have been vaccinated
13
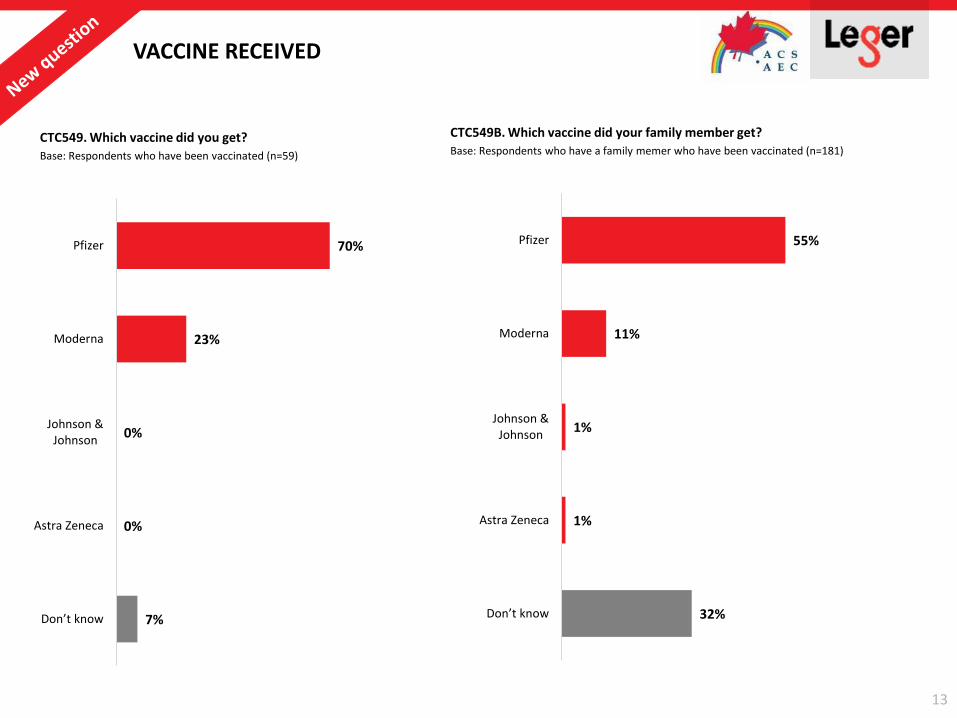
70%
23%
0%
0%
7%
Pfizer
Moderna
Johnson &Johnson
Astra Zeneca
Don’t know
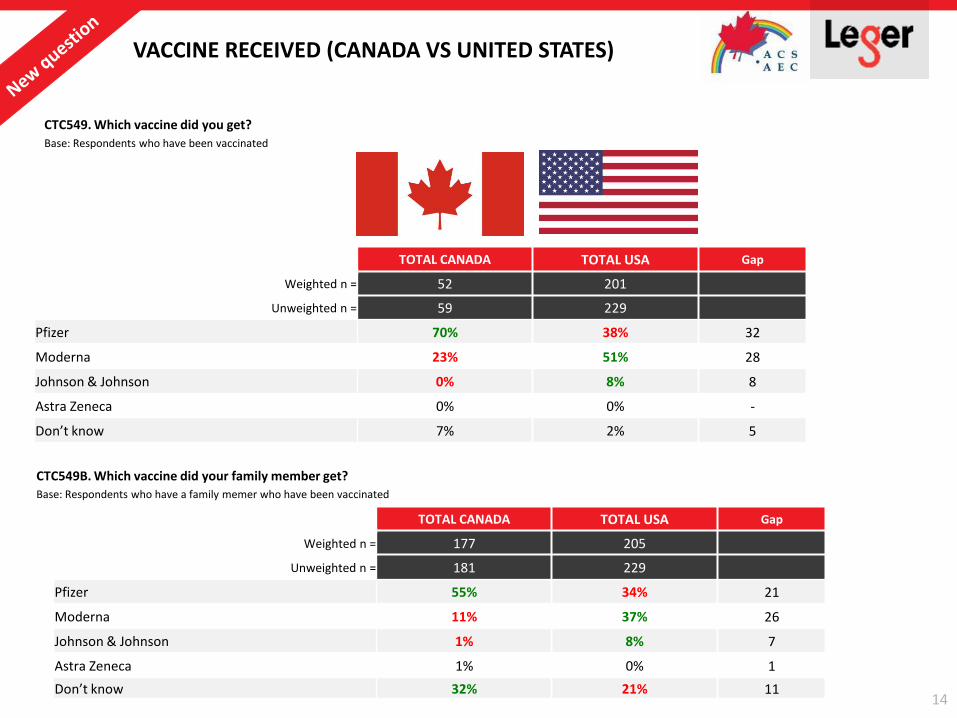
VACCINE RECEIVED
CTC549. Which vaccine did you get?
Base: Respondents who have been vaccinated (n=59)
CTC549B. Which vaccine did your family member get?
Base: Respondents who have a family memer who have been vaccinated (n=181)
55%
11%
1%
1%
32%
Pfizer
Moderna
Johnson &Johnson
Astra Zeneca
Don’t know
14
VACCINE RECEIVED (CANADA VS UNITED STATES)
CTC549. Which vaccine did you get?
Base: Respondents who have been vaccinated
TOTAL CANADA TOTAL USA Gap
Weighted n = 52 201
Unweighted n = 59 229
Pfizer 70% 38% 32
Moderna 23% 51% 28
Johnson & Johnson 0% 8% 8
Astra Zeneca 0% 0% -
Don’t know 7% 2% 5
TOTAL CANADA TOTAL USA Gap
Weighted n = 177 205
Unweighted n = 181 229
Pfizer 55% 34% 21
Moderna 11% 37% 26
Johnson & Johnson 1% 8% 7
Astra Zeneca 1% 0% 1
Don’t know 32% 21% 11
CTC549B. Which vaccine did your family member get?
Base: Respondents who have a family memer who have been vaccinated
15
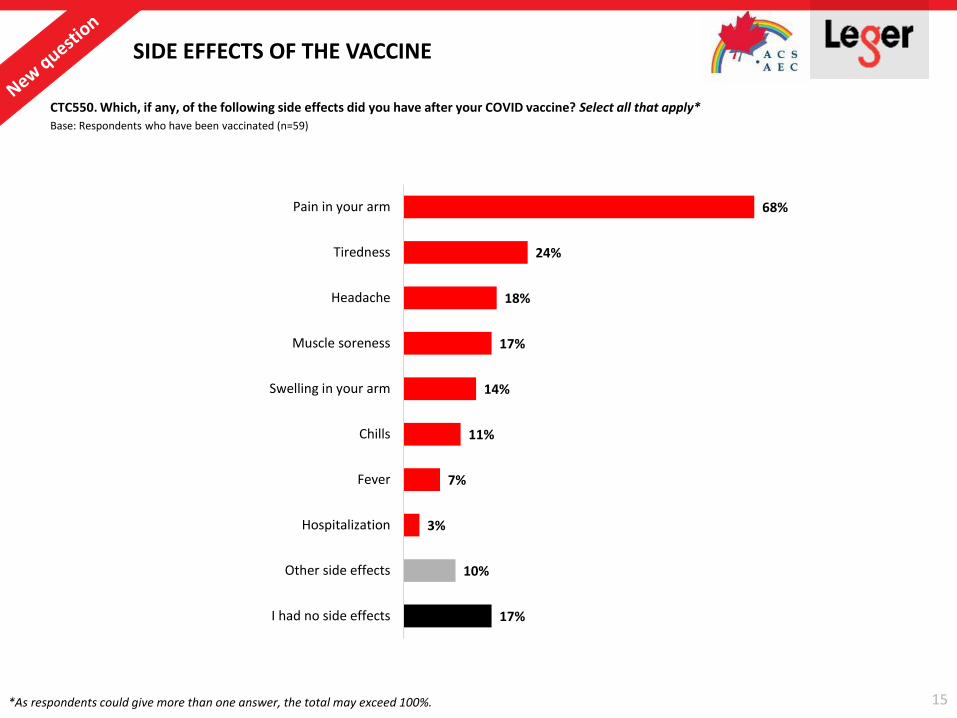
68%
24%
18%
17%
14%
11%
7%
3%
10%
17%
Pain in your arm
Tiredness
Headache
Muscle soreness
Swelling in your arm
Chills
Fever
Hospitalization
Other side effects
I had no side effects
SIDE EFFECTS OF THE VACCINE
CTC550. Which, if any, of the following side effects did you have after your COVID vaccine? Select all that apply*
Base: Respondents who have been vaccinated (n=59)
*As respondents could give more than one answer, the total may exceed 100%.
16
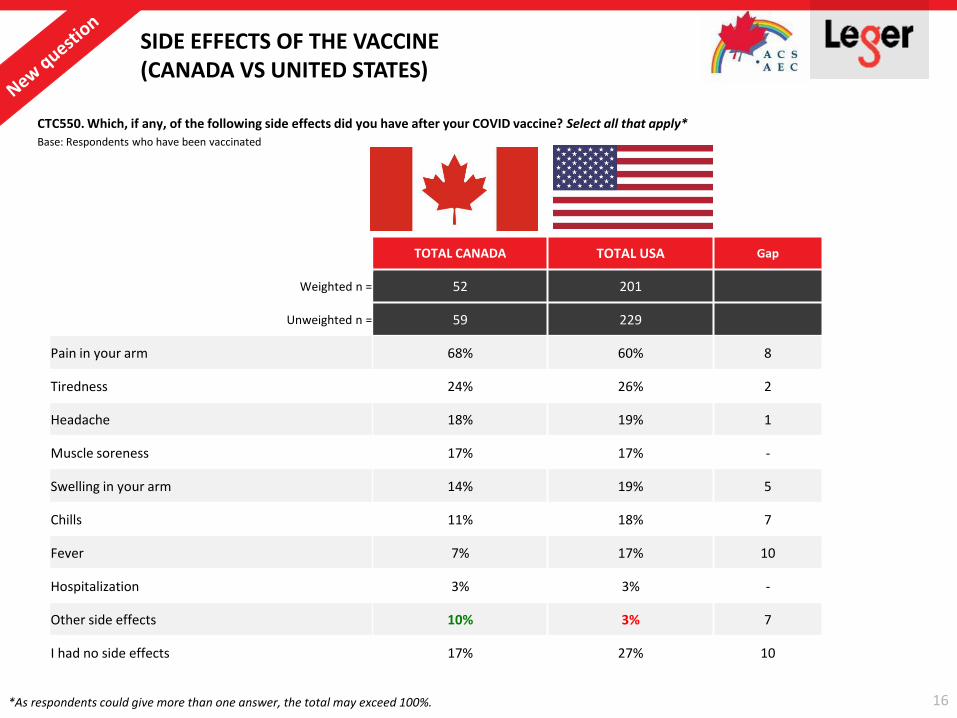
SIDE EFFECTS OF THE VACCINE(CANADA VS UNITED STATES)
CTC550. Which, if any, of the following side effects did you have after your COVID vaccine? Select all that apply*
Base: Respondents who have been vaccinated
TOTAL CANADA TOTAL USA Gap
Weighted n = 52 201
Unweighted n = 59 229
Pain in your arm 68% 60% 8
Tiredness 24% 26% 2
Headache 18% 19% 1
Muscle soreness 17% 17% -
Swelling in your arm 14% 19% 5
Chills 11% 18% 7
Fever 7% 17% 10
Hospitalization 3% 3% -
Other side effects 10% 3% 7
I had no side effects 17% 27% 10
*As respondents could give more than one answer, the total may exceed 100%.
17
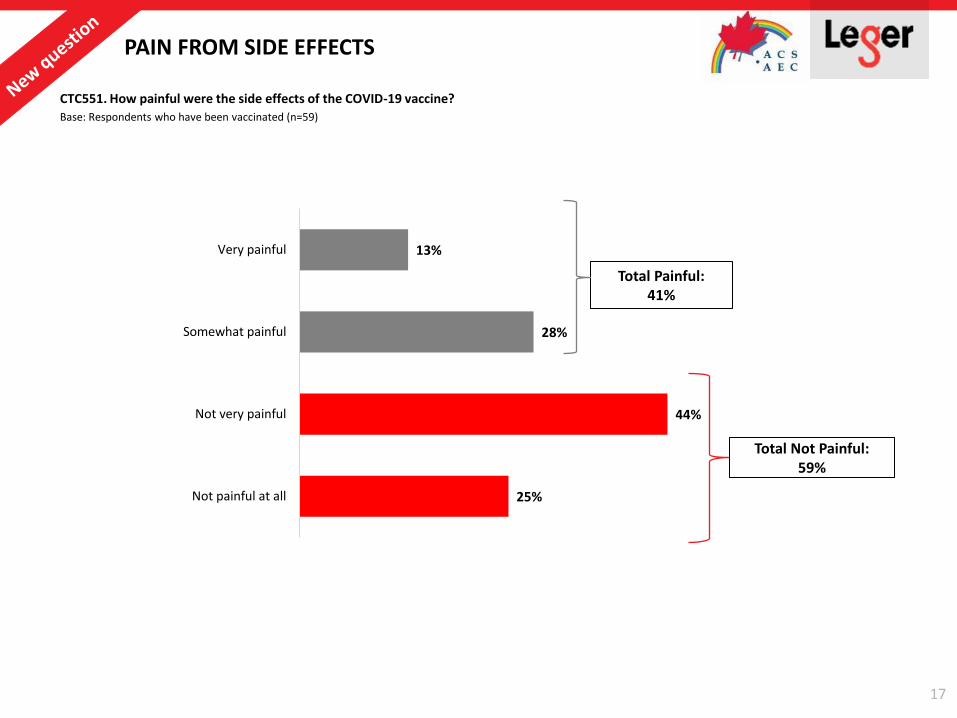
13%
28%
44%
25%
Very painful
Somewhat painful
Not very painful
Not painful at all
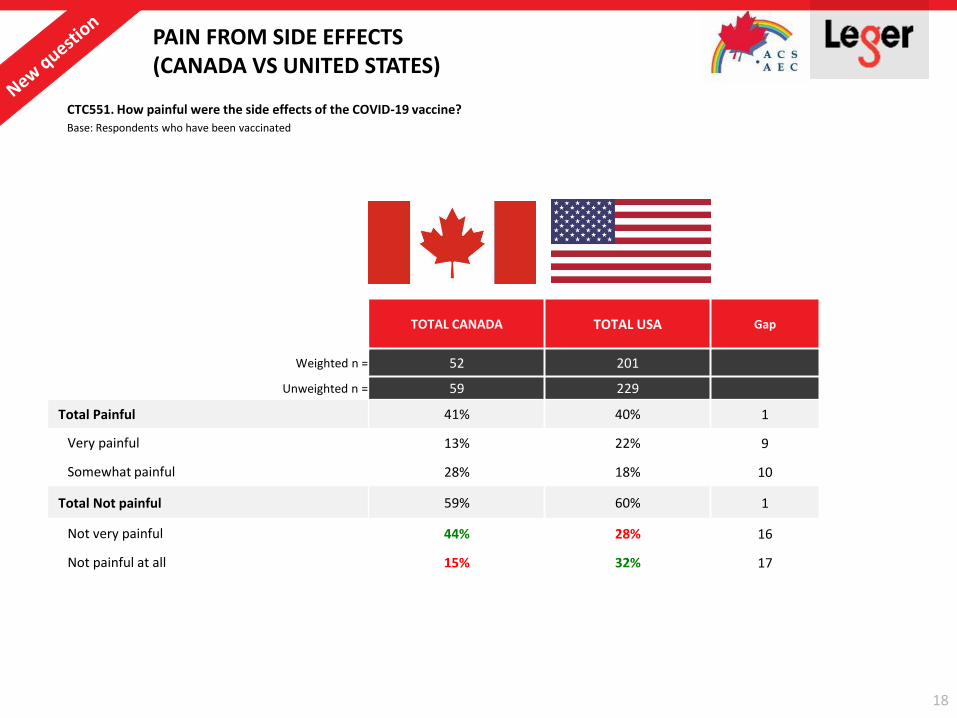
PAIN FROM SIDE EFFECTS
CTC551. How painful were the side effects of the COVID-19 vaccine?
Base: Respondents who have been vaccinated (n=59)
Total Painful: 41%
Total Not Painful:59%
18
PAIN FROM SIDE EFFECTS(CANADA VS UNITED STATES)
TOTAL CANADA TOTAL USA Gap
Weighted n = 52 201
Unweighted n = 59 229
Total Painful 41% 40% 1
Very painful 13% 22% 9
Somewhat painful 28% 18% 10
Total Not painful 59% 60% 1
Not very painful 44% 28% 16
Not painful at all 15% 32% 17
CTC551. How painful were the side effects of the COVID-19 vaccine?
Base: Respondents who have been vaccinated
19
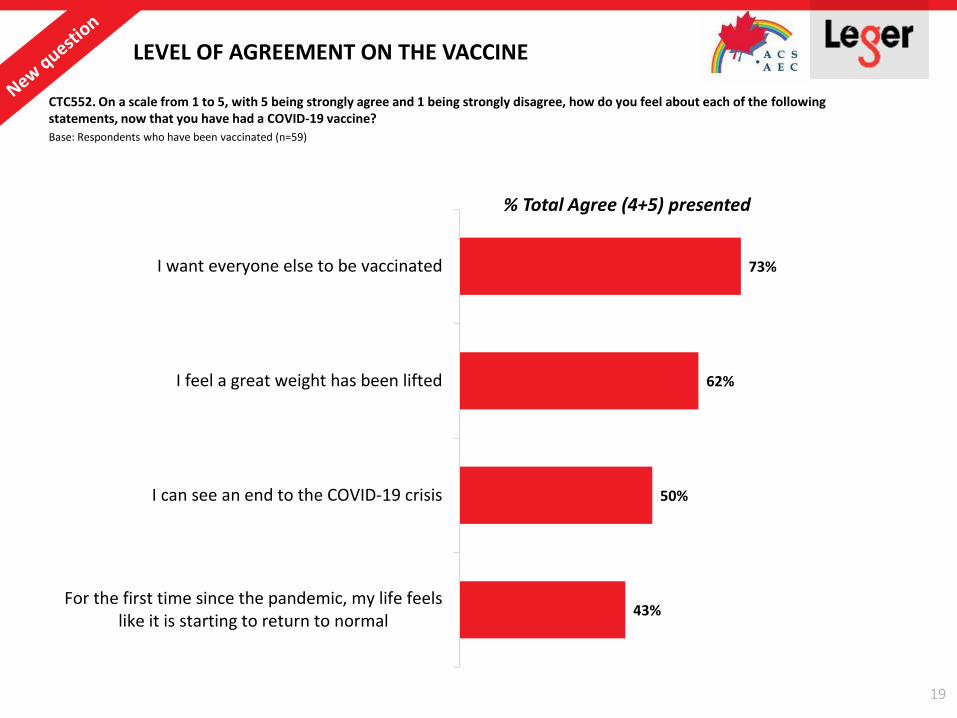
73%
62%
50%
43%
I want everyone else to be vaccinated
I feel a great weight has been lifted
I can see an end to the COVID-19 crisis
For the first time since the pandemic, my life feelslike it is starting to return to normal
LEVEL OF AGREEMENT ON THE VACCINE
CTC552. On a scale from 1 to 5, with 5 being strongly agree and 1 being strongly disagree, how do you feel about each of the following statements, now that you have had a COVID-19 vaccine?
Base: Respondents who have been vaccinated (n=59)
% Total Agree (4+5) presented
20
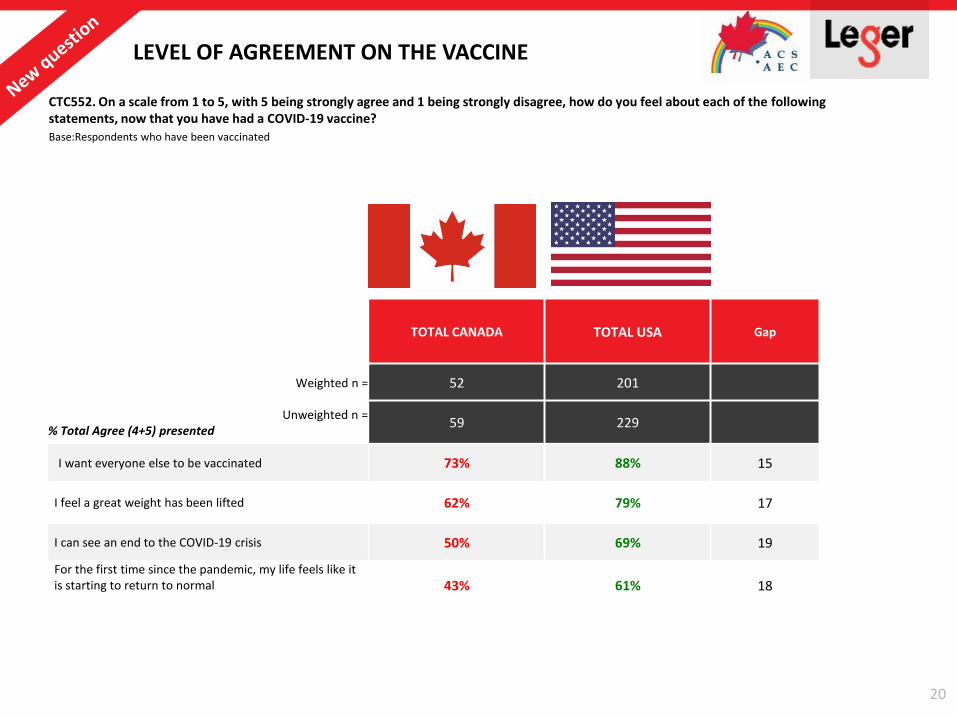
LEVEL OF AGREEMENT ON THE VACCINE
CTC552. On a scale from 1 to 5, with 5 being strongly agree and 1 being strongly disagree, how do you feel about each of the following statements, now that you have had a COVID-19 vaccine?
Base:Respondents who have been vaccinated
TOTAL CANADA TOTAL USA Gap
Weighted n = 52 201
Unweighted n =% Total Agree (4+5) presented
59 229
I want everyone else to be vaccinated 73% 88% 15
I feel a great weight has been lifted 62% 79% 17
I can see an end to the COVID-19 crisis 50% 69% 19
For the first time since the pandemic, my life feels like it is starting to return to normal 43% 61% 18
21
4%
9%
9%
9%
11%
43%
15%
March 2021
April 2021
May 2021
June 2021
July 2021
August 2021 or after
Never, I don’t want to be vaccinated
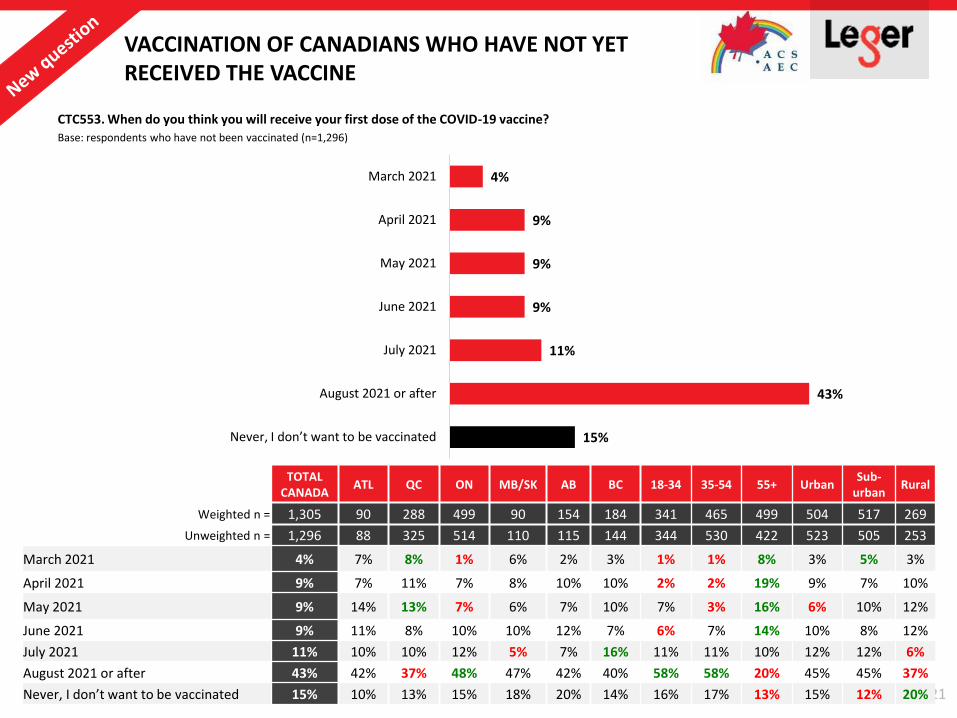
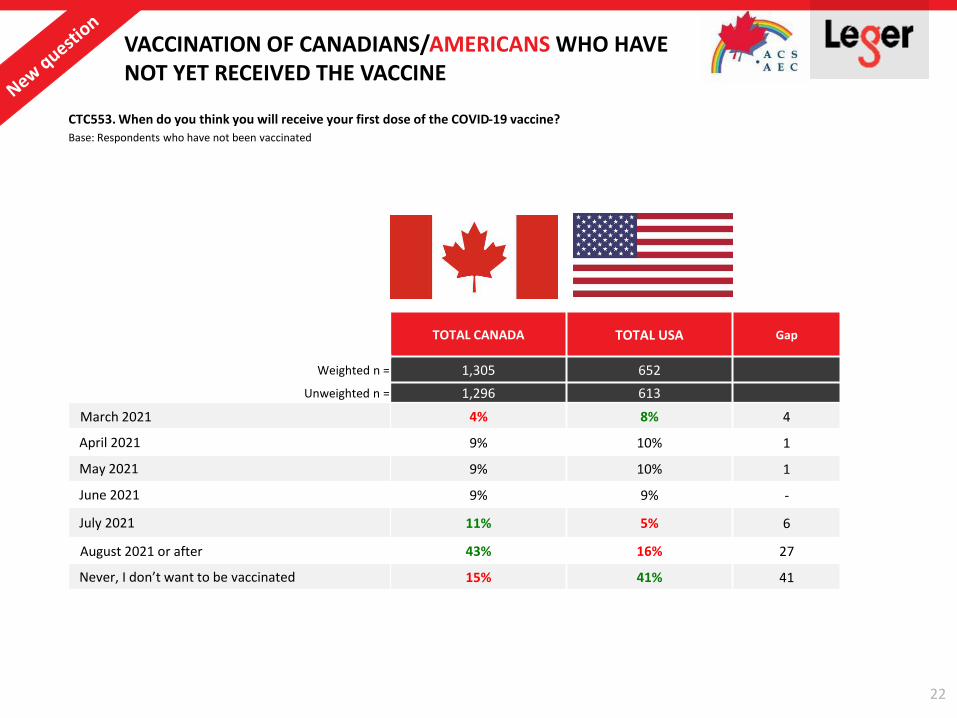
VACCINATION OF CANADIANS WHO HAVE NOT YET RECEIVED THE VACCINE
CTC553. When do you think you will receive your first dose of the COVID-19 vaccine?
Base: respondents who have not been vaccinated (n=1,296)
TOTALCANADA
ATL QC ON MB/SK AB BC 18-34 35-54 55+ UrbanSub-
urbanRural
Weighted n = 1,305 90 288 499 90 154 184 341 465 499 504 517 269
Unweighted n = 1,296 88 325 514 110 115 144 344 530 422 523 505 253
March 2021 4% 7% 8% 1% 6% 2% 3% 1% 1% 8% 3% 5% 3%
April 2021 9% 7% 11% 7% 8% 10% 10% 2% 2% 19% 9% 7% 10%
May 2021 9% 14% 13% 7% 6% 7% 10% 7% 3% 16% 6% 10% 12%
June 2021 9% 11% 8% 10% 10% 12% 7% 6% 7% 14% 10% 8% 12%
July 2021 11% 10% 10% 12% 5% 7% 16% 11% 11% 10% 12% 12% 6%
August 2021 or after 43% 42% 37% 48% 47% 42% 40% 58% 58% 20% 45% 45% 37%
Never, I don’t want to be vaccinated 15% 10% 13% 15% 18% 20% 14% 16% 17% 13% 15% 12% 20%
22
VACCINATION OF CANADIANS/AMERICANS WHO HAVENOT YET RECEIVED THE VACCINE
CTC553. When do you think you will receive your first dose of the COVID-19 vaccine?
Base: Respondents who have not been vaccinated
TOTAL CANADA TOTAL USA Gap
Weighted n = 1,305 652
Unweighted n = 1,296 613
March 2021 4% 8% 4
April 2021 9% 10% 1
May 2021 9% 10% 1
June 2021 9% 9% -
July 2021 11% 5% 6
August 2021 or after 43% 16% 27
Never, I don’t want to be vaccinated 15% 41% 41
23
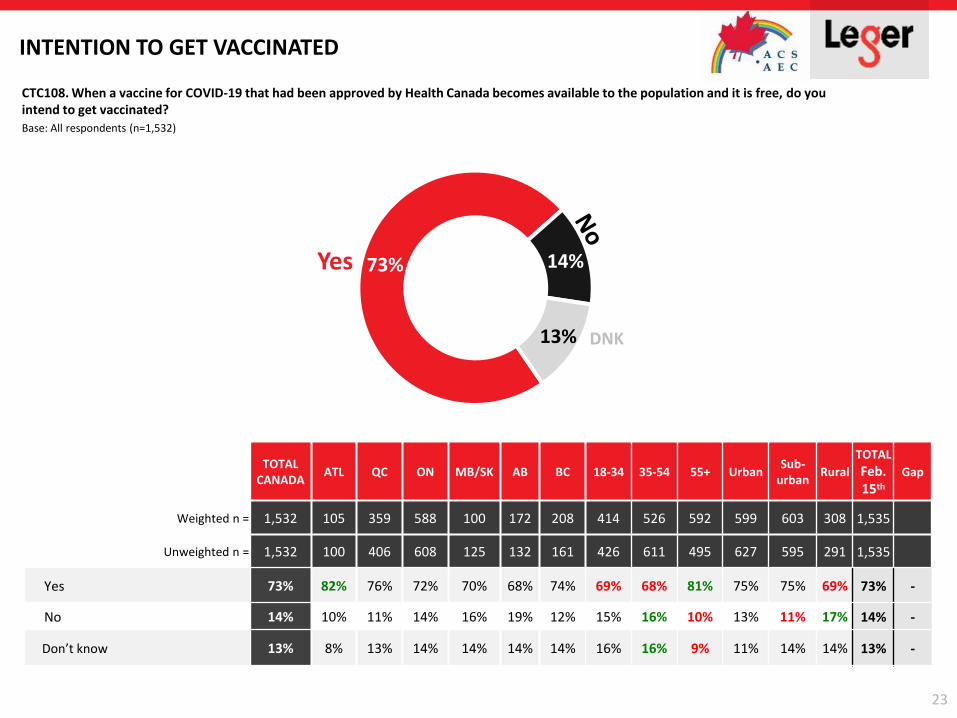
INTENTION TO GET VACCINATED
CTC108. When a vaccine for COVID-19 that had been approved by Health Canada becomes available to the population and it is free, do you intend to get vaccinated?
Base: All respondents (n=1,532)
73% 14%
13%
TOTALCANADA
ATL QC ON MB/SK AB BC 18-34 35-54 55+ UrbanSub-
urbanRural
TOTAL
Feb. 15th
Gap
Weighted n = 1,532 105 359 588 100 172 208 414 526 592 599 603 308 1,535
Unweighted n = 1,532 100 406 608 125 132 161 426 611 495 627 595 291 1,535
Yes 73% 82% 76% 72% 70% 68% 74% 69% 68% 81% 75% 75% 69% 73% -
No 14% 10% 11% 14% 16% 19% 12% 15% 16% 10% 13% 11% 17% 14% -
Don’t know 13% 8% 13% 14% 14% 14% 14% 16% 16% 9% 11% 14% 14% 13% -
Yes
DNK
24
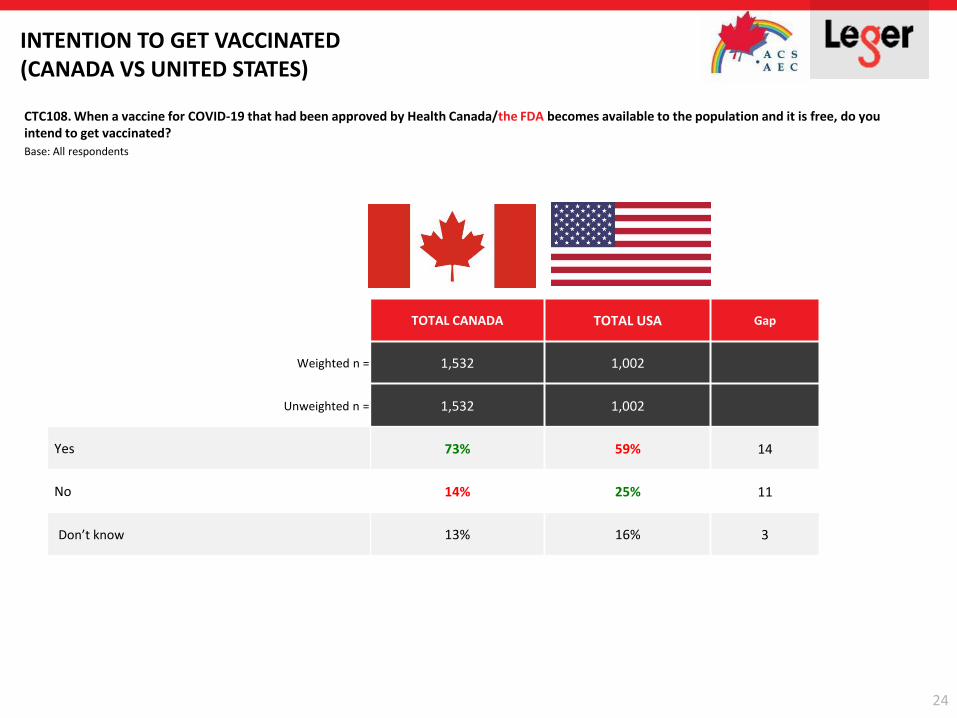
INTENTION TO GET VACCINATED(CANADA VS UNITED STATES)
CTC108. When a vaccine for COVID-19 that had been approved by Health Canada/the FDA becomes available to the population and it is free, do you intend to get vaccinated?
Base: All respondents
TOTAL CANADA TOTAL USA Gap
Weighted n = 1,532 1,002
Unweighted n = 1,532 1,002
Yes 73% 59% 14
No 14% 25% 11
Don’t know 13% 16% 3
25
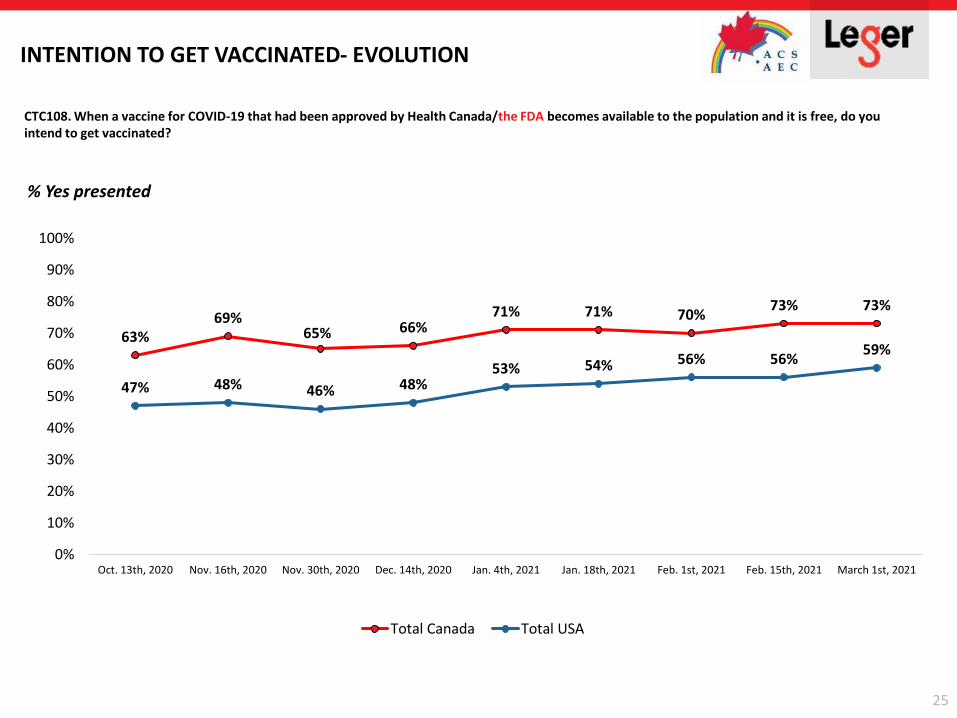
INTENTION TO GET VACCINATED- EVOLUTION
CTC108. When a vaccine for COVID-19 that had been approved by Health Canada/the FDA becomes available to the population and it is free, do you intend to get vaccinated?
63%69%
65% 66%71% 71% 70%
73% 73%
47% 48% 46% 48%53% 54% 56% 56%
59%
0%
10%
20%
30%
40%
50%
60%
70%
80%
90%
100%
Oct. 13th, 2020 Nov. 16th, 2020 Nov. 30th, 2020 Dec. 14th, 2020 Jan. 4th, 2021 Jan. 18th, 2021 Feb. 1st, 2021 Feb. 15th, 2021 March 1st, 2021
Total Canada Total USA
% Yes presented
26
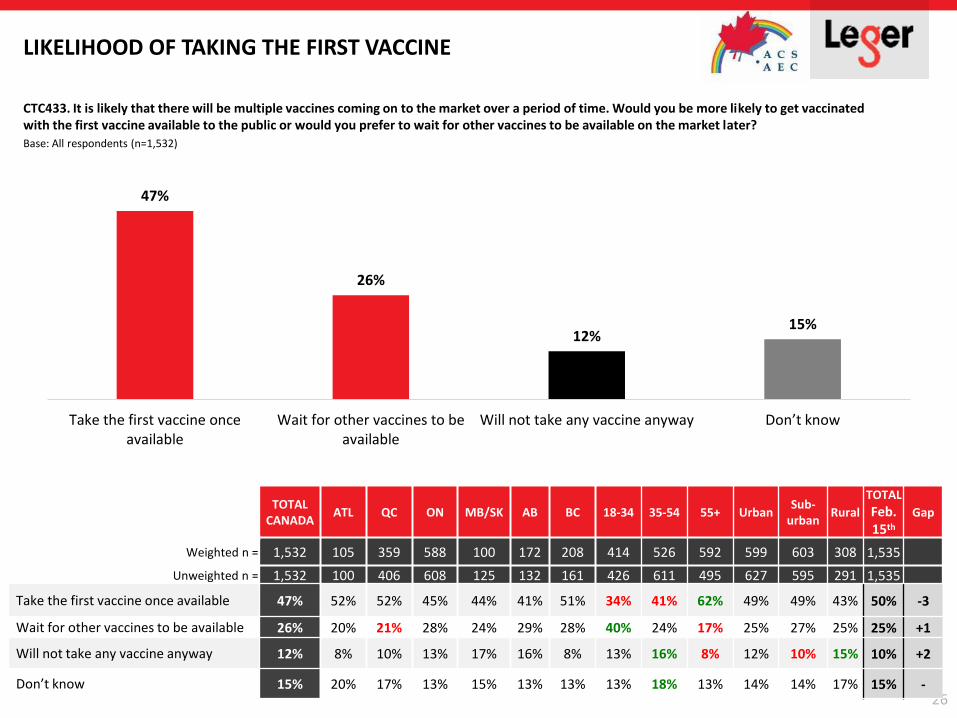
LIKELIHOOD OF TAKING THE FIRST VACCINE
CTC433. It is likely that there will be multiple vaccines coming on to the market over a period of time. Would you be more likely to get vaccinated with the first vaccine available to the public or would you prefer to wait for other vaccines to be available on the market later?
Base: All respondents (n=1,532)
TOTALCANADA
ATL QC ON MB/SK AB BC 18-34 35-54 55+ UrbanSub-
urbanRural
TOTAL
Feb. 15th
Gap
Weighted n = 1,532 105 359 588 100 172 208 414 526 592 599 603 308 1,535
Unweighted n = 1,532 100 406 608 125 132 161 426 611 495 627 595 291 1,535
Take the first vaccine once available 47% 52% 52% 45% 44% 41% 51% 34% 41% 62% 49% 49% 43% 50% -3
Wait for other vaccines to be available 26% 20% 21% 28% 24% 29% 28% 40% 24% 17% 25% 27% 25% 25% +1
Will not take any vaccine anyway 12% 8% 10% 13% 17% 16% 8% 13% 16% 8% 12% 10% 15% 10% +2
Don’t know 15% 20% 17% 13% 15% 13% 13% 13% 18% 13% 14% 14% 17% 15% -
47%
26%
12%15%
Take the first vaccine onceavailable
Wait for other vaccines to beavailable
Will not take any vaccine anyway Don’t know
27
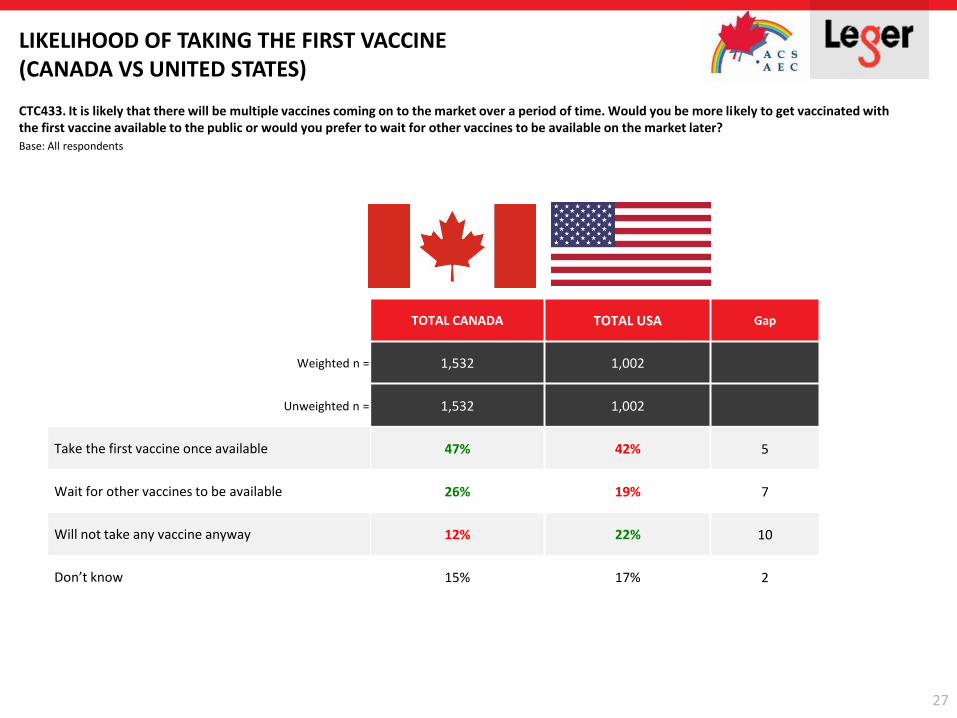
LIKELIHOOD OF TAKING THE FIRST VACCINE (CANADA VS UNITED STATES)
CTC433. It is likely that there will be multiple vaccines coming on to the market over a period of time. Would you be more likely to get vaccinated with the first vaccine available to the public or would you prefer to wait for other vaccines to be available on the market later?
Base: All respondents
TOTAL CANADA TOTAL USA Gap
Weighted n = 1,532 1,002
Unweighted n = 1,532 1,002
Take the first vaccine once available 47% 42% 5
Wait for other vaccines to be available 26% 19% 7
Will not take any vaccine anyway 12% 22% 10
Don’t know 15% 17% 2
28
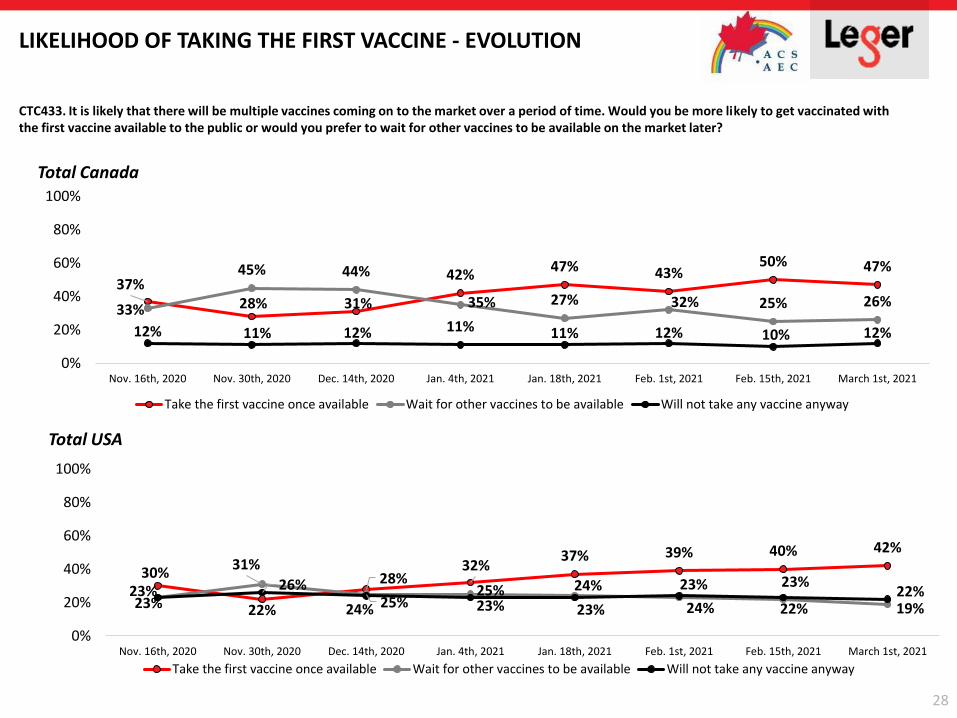
LIKELIHOOD OF TAKING THE FIRST VACCINE - EVOLUTION
CTC433. It is likely that there will be multiple vaccines coming on to the market over a period of time. Would you be more likely to get vaccinated with the first vaccine available to the public or would you prefer to wait for other vaccines to be available on the market later?
37%28% 31%
42%47% 43%
50% 47%
33%
45% 44%
35% 27% 32% 25% 26%
12% 11% 12% 11% 11% 12% 10% 12%
0%
20%
40%
60%
80%
100%
Nov. 16th, 2020 Nov. 30th, 2020 Dec. 14th, 2020 Jan. 4th, 2021 Jan. 18th, 2021 Feb. 1st, 2021 Feb. 15th, 2021 March 1st, 2021
Take the first vaccine once available Wait for other vaccines to be available Will not take any vaccine anyway
30%
22%
28%32%
37% 39% 40% 42%
23%
31%
25%25% 24% 23%
22% 19%23%26%
24% 23% 23% 24%
23%22%
0%
20%
40%
60%
80%
100%
Nov. 16th, 2020 Nov. 30th, 2020 Dec. 14th, 2020 Jan. 4th, 2021 Jan. 18th, 2021 Feb. 1st, 2021 Feb. 15th, 2021 March 1st, 2021
Take the first vaccine once available Wait for other vaccines to be available Will not take any vaccine anyway
Total Canada
Total USA
29
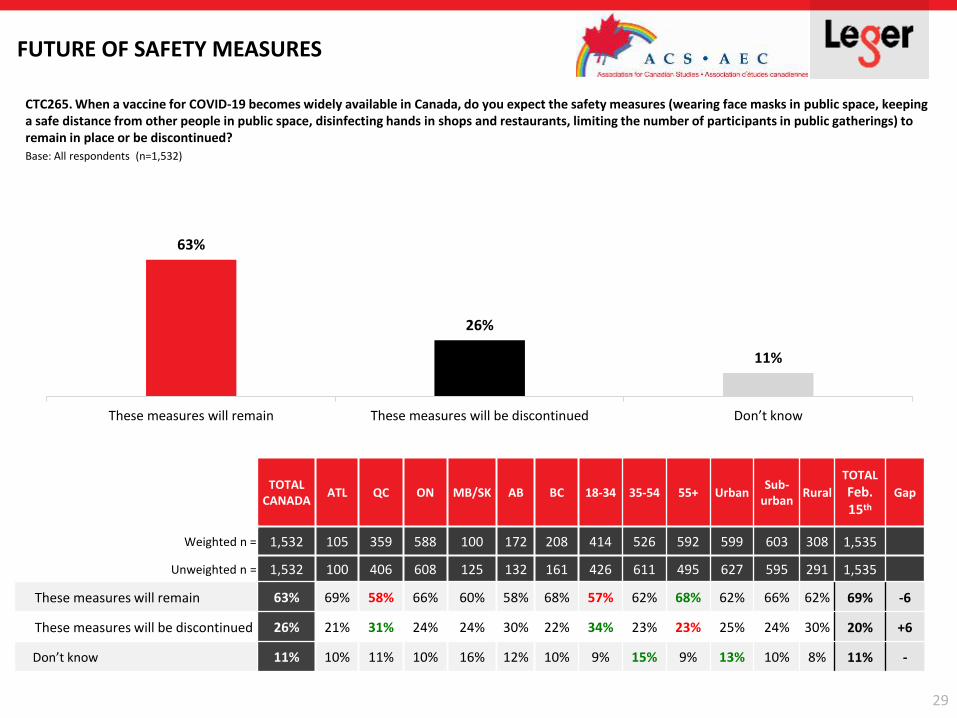
FUTURE OF SAFETY MEASURES
CTC265. When a vaccine for COVID-19 becomes widely available in Canada, do you expect the safety measures (wearing face masks in public space, keeping a safe distance from other people in public space, disinfecting hands in shops and restaurants, limiting the number of participants in public gatherings) to remain in place or be discontinued?
Base: All respondents (n=1,532)
63%
26%
11%
These measures will remain These measures will be discontinued Don’t know
TOTALCANADA
ATL QC ON MB/SK AB BC 18-34 35-54 55+ UrbanSub-
urbanRural
TOTAL
Feb. 15th
Gap
Weighted n = 1,532 105 359 588 100 172 208 414 526 592 599 603 308 1,535
Unweighted n = 1,532 100 406 608 125 132 161 426 611 495 627 595 291 1,535
These measures will remain 63% 69% 58% 66% 60% 58% 68% 57% 62% 68% 62% 66% 62% 69% -6
These measures will be discontinued 26% 21% 31% 24% 24% 30% 22% 34% 23% 23% 25% 24% 30% 20% +6
Don’t know 11% 10% 11% 10% 16% 12% 10% 9% 15% 9% 13% 10% 8% 11% -
30
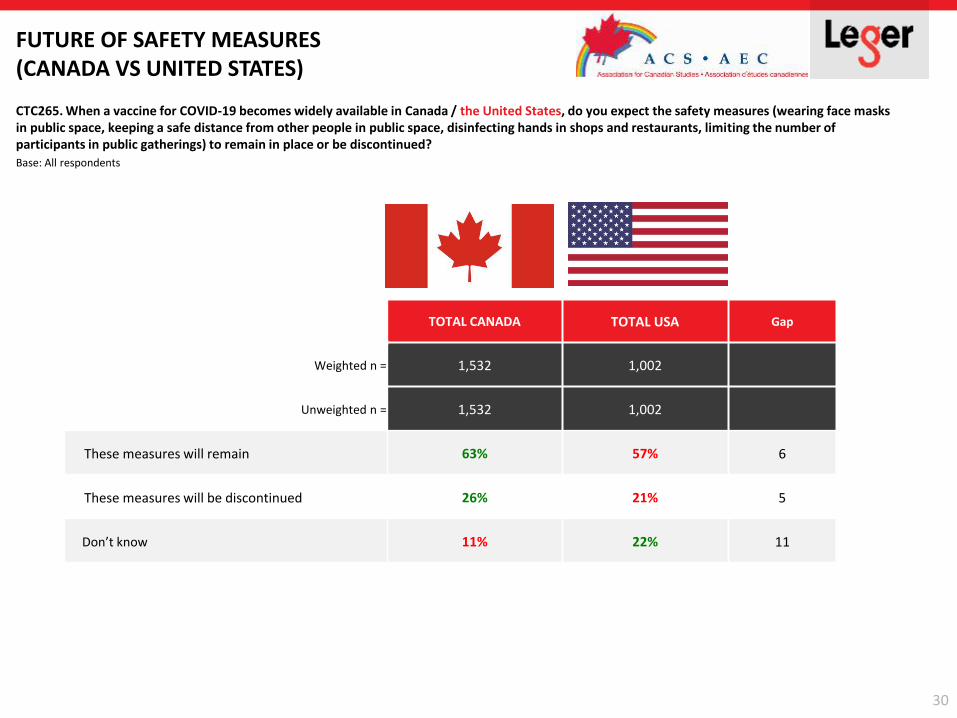
FUTURE OF SAFETY MEASURES(CANADA VS UNITED STATES)
CTC265. When a vaccine for COVID-19 becomes widely available in Canada / the United States, do you expect the safety measures (wearing face masks in public space, keeping a safe distance from other people in public space, disinfecting hands in shops and restaurants, limiting the number of participants in public gatherings) to remain in place or be discontinued?
Base: All respondents
TOTAL CANADA TOTAL USA Gap
Weighted n = 1,532 1,002
Unweighted n = 1,532 1,002
These measures will remain 63% 57% 6
These measures will be discontinued 26% 21% 5
Don’t know 11% 22% 11
31
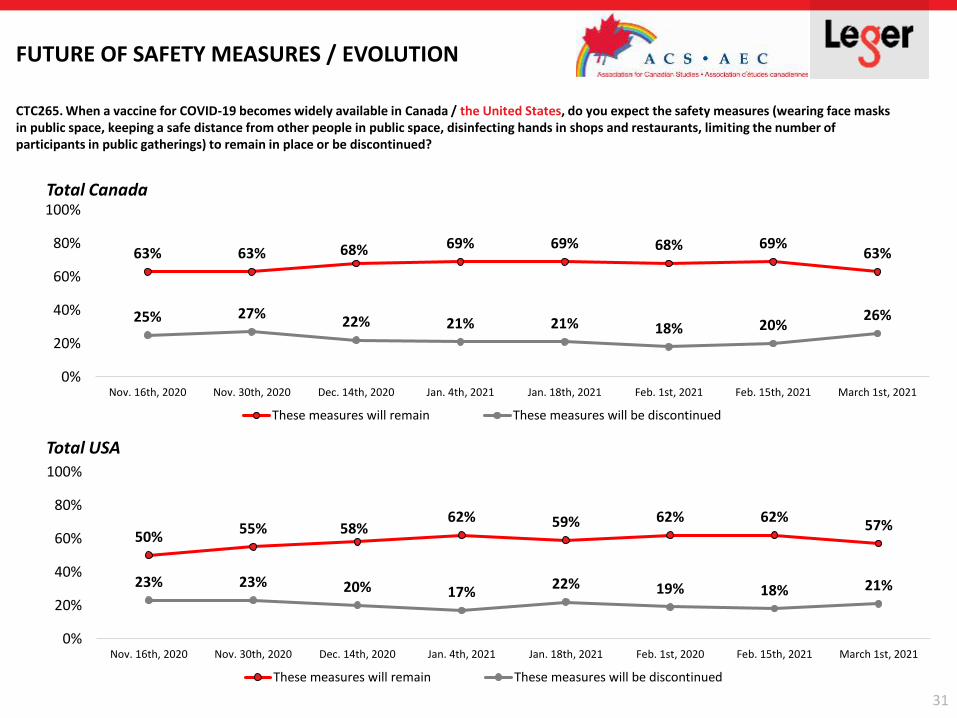
FUTURE OF SAFETY MEASURES / EVOLUTION
CTC265. When a vaccine for COVID-19 becomes widely available in Canada / the United States, do you expect the safety measures (wearing face masks in public space, keeping a safe distance from other people in public space, disinfecting hands in shops and restaurants, limiting the number of participants in public gatherings) to remain in place or be discontinued?
63% 63% 68% 69% 69% 68% 69%63%
25% 27%22% 21% 21% 18% 20%
26%
0%
20%
40%
60%
80%
100%
Nov. 16th, 2020 Nov. 30th, 2020 Dec. 14th, 2020 Jan. 4th, 2021 Jan. 18th, 2021 Feb. 1st, 2021 Feb. 15th, 2021 March 1st, 2021
These measures will remain These measures will be discontinued
50%55% 58%
62% 59% 62% 62%57%
23% 23% 20% 17%22% 19% 18% 21%
0%
20%
40%
60%
80%
100%
Nov. 16th, 2020 Nov. 30th, 2020 Dec. 14th, 2020 Jan. 4th, 2021 Jan. 18th, 2021 Feb. 1st, 2020 Feb. 15th, 2021 March 1st, 2021
These measures will remain These measures will be discontinued
Total Canada
Total USA
32
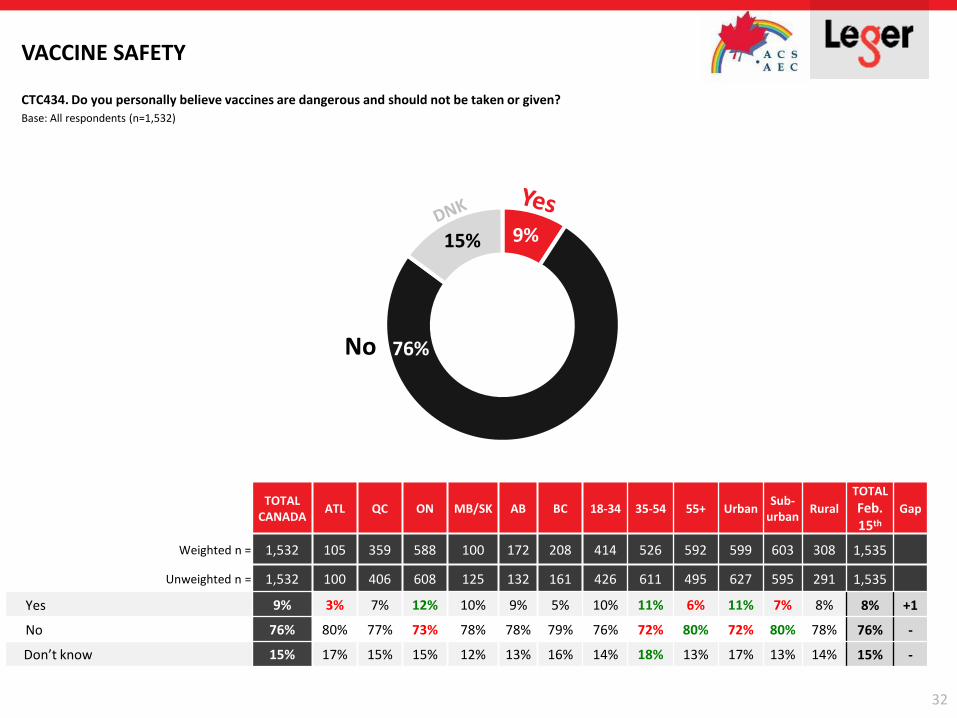
VACCINE SAFETY
CTC434. Do you personally believe vaccines are dangerous and should not be taken or given?
Base: All respondents (n=1,532)
9%
76%
15%
TOTALCANADA
ATL QC ON MB/SK AB BC 18-34 35-54 55+ UrbanSub-
urbanRural
TOTAL
Feb. 15th
Gap
Weighted n = 1,532 105 359 588 100 172 208 414 526 592 599 603 308 1,535
Unweighted n = 1,532 100 406 608 125 132 161 426 611 495 627 595 291 1,535
Yes 9% 3% 7% 12% 10% 9% 5% 10% 11% 6% 11% 7% 8% 8% +1
No 76% 80% 77% 73% 78% 78% 79% 76% 72% 80% 72% 80% 78% 76% -
Don’t know 15% 17% 15% 15% 12% 13% 16% 14% 18% 13% 17% 13% 14% 15% -
No
33
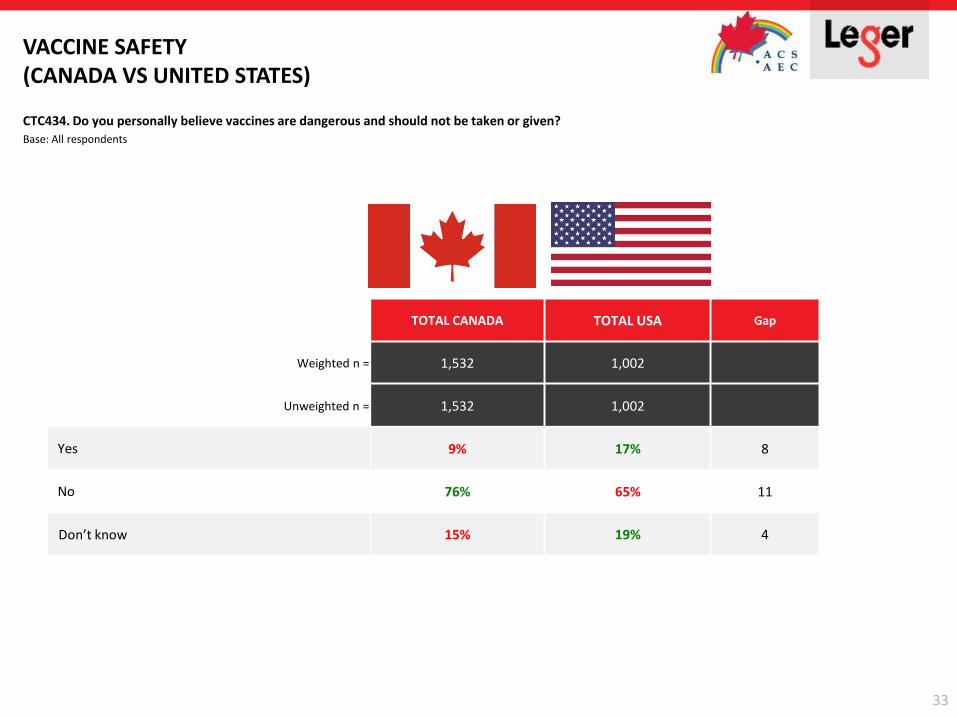
VACCINE SAFETY(CANADA VS UNITED STATES)
CTC434. Do you personally believe vaccines are dangerous and should not be taken or given?
Base: All respondents
TOTAL CANADA TOTAL USA Gap
Weighted n = 1,532 1,002
Unweighted n = 1,532 1,002
Yes 9% 17% 8
No 76% 65% 11
Don’t know 15% 19% 4
34
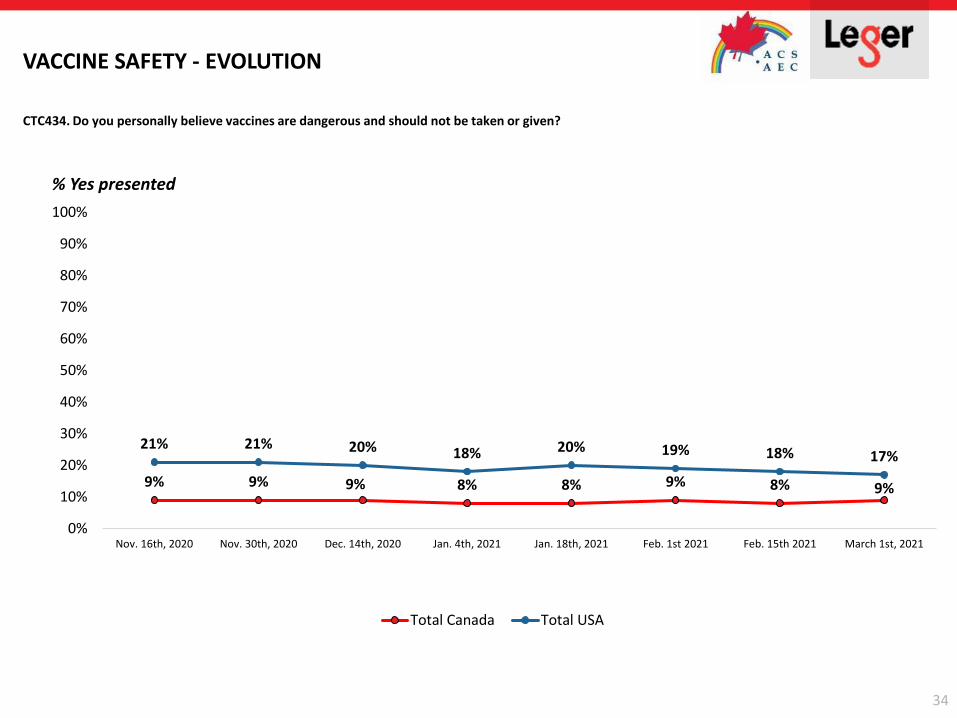
VACCINE SAFETY - EVOLUTION
CTC434. Do you personally believe vaccines are dangerous and should not be taken or given?
9% 9% 9% 8% 8% 9% 8% 9%
21% 21% 20% 18% 20% 19% 18% 17%
0%
10%
20%
30%
40%
50%
60%
70%
80%
90%
100%
Nov. 16th, 2020 Nov. 30th, 2020 Dec. 14th, 2020 Jan. 4th, 2021 Jan. 18th, 2021 Feb. 1st 2021 Feb. 15th 2021 March 1st, 2021
Total Canada Total USA
% Yes presented

U.S. POLITICS
36
48%
38%
15%
Approve Disapprove Don’t know/ Prefer not to answer
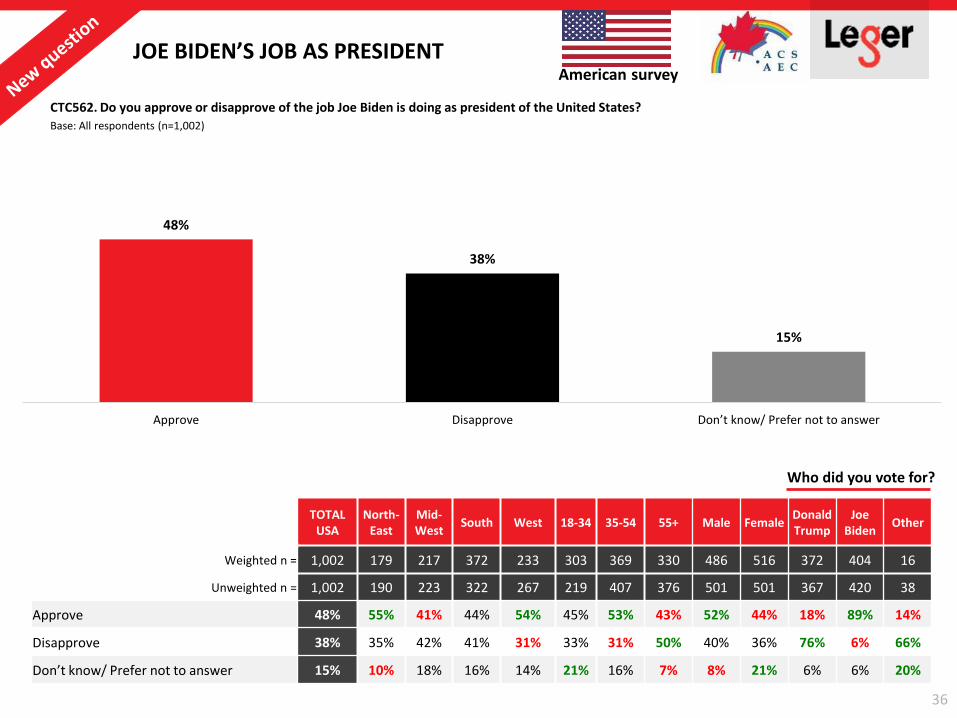
JOE BIDEN’S JOB AS PRESIDENT
CTC562. Do you approve or disapprove of the job Joe Biden is doing as president of the United States?
Base: All respondents (n=1,002)
American survey
TOTALUSA
North-East
Mid-West
South West 18-34 35-54 55+ Male FemaleDonald Trump
Joe Biden
Other
Weighted n = 1,002 179 217 372 233 303 369 330 486 516 372 404 16
Unweighted n = 1,002 190 223 322 267 219 407 376 501 501 367 420 38
Approve 48% 55% 41% 44% 54% 45% 53% 43% 52% 44% 18% 89% 14%
Disapprove 38% 35% 42% 41% 31% 33% 31% 50% 40% 36% 76% 6% 66%
Don’t know/ Prefer not to answer 15% 10% 18% 16% 14% 21% 16% 7% 8% 21% 6% 6% 20%
Who did you vote for?
37
39%
31% 30%
Democratic candidate Republican candidate Don’t know/ Prefer not to answer
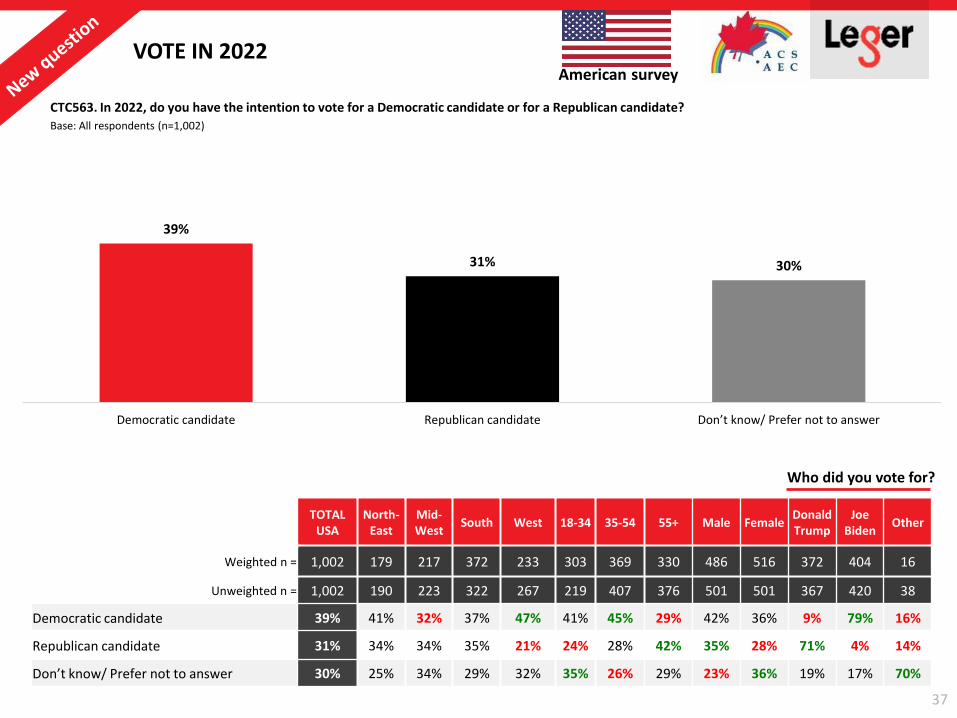
VOTE IN 2022
CTC563. In 2022, do you have the intention to vote for a Democratic candidate or for a Republican candidate?
Base: All respondents (n=1,002)
American survey
TOTALUSA
North-East
Mid-West
South West 18-34 35-54 55+ Male FemaleDonald Trump
Joe Biden
Other
Weighted n = 1,002 179 217 372 233 303 369 330 486 516 372 404 16
Unweighted n = 1,002 190 223 322 267 219 407 376 501 501 367 420 38
Democratic candidate 39% 41% 32% 37% 47% 41% 45% 29% 42% 36% 9% 79% 16%
Republican candidate 31% 34% 34% 35% 21% 24% 28% 42% 35% 28% 71% 4% 14%
Don’t know/ Prefer not to answer 30% 25% 34% 29% 32% 35% 26% 29% 23% 36% 19% 17% 70%
Who did you vote for?
38
77%
10% 13%
Yes No Don’t know/ Prefer not to answer
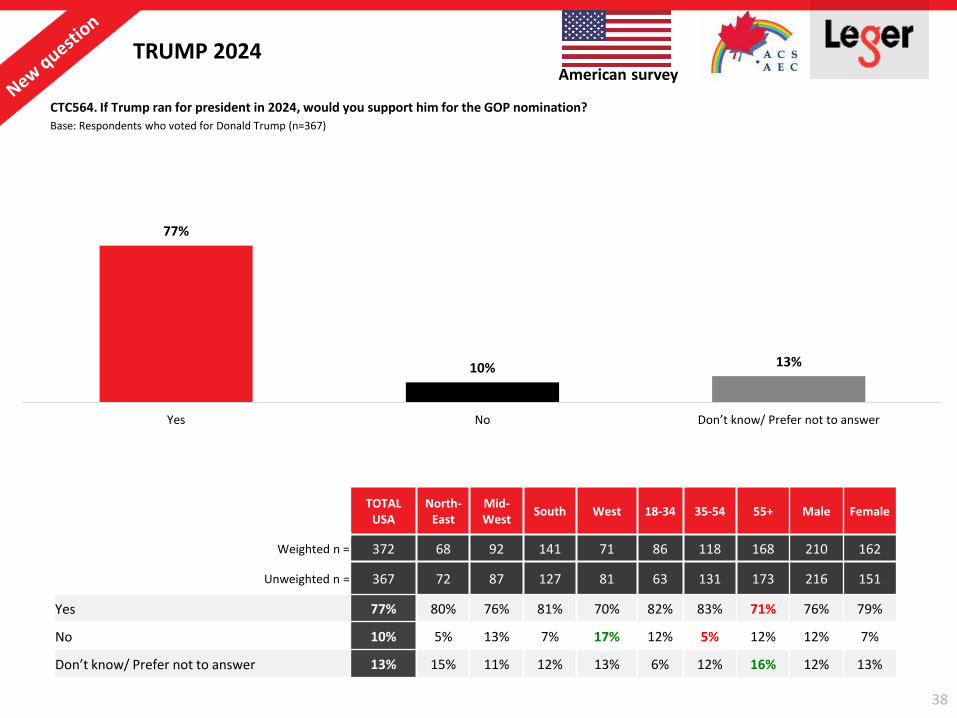
TRUMP 2024
CTC564. If Trump ran for president in 2024, would you support him for the GOP nomination?
Base: Respondents who voted for Donald Trump (n=367)
American survey
TOTALUSA
North-East
Mid-West
South West 18-34 35-54 55+ Male Female
Weighted n = 372 68 92 141 71 86 118 168 210 162
Unweighted n = 367 72 87 127 81 63 131 173 216 151
Yes 77% 80% 76% 81% 70% 82% 83% 71% 76% 79%
No 10% 5% 13% 7% 17% 12% 5% 12% 12% 7%
Don’t know/ Prefer not to answer 13% 15% 11% 12% 13% 6% 12% 16% 12% 13%
39
66%
34%
Donald Trump The Republican party
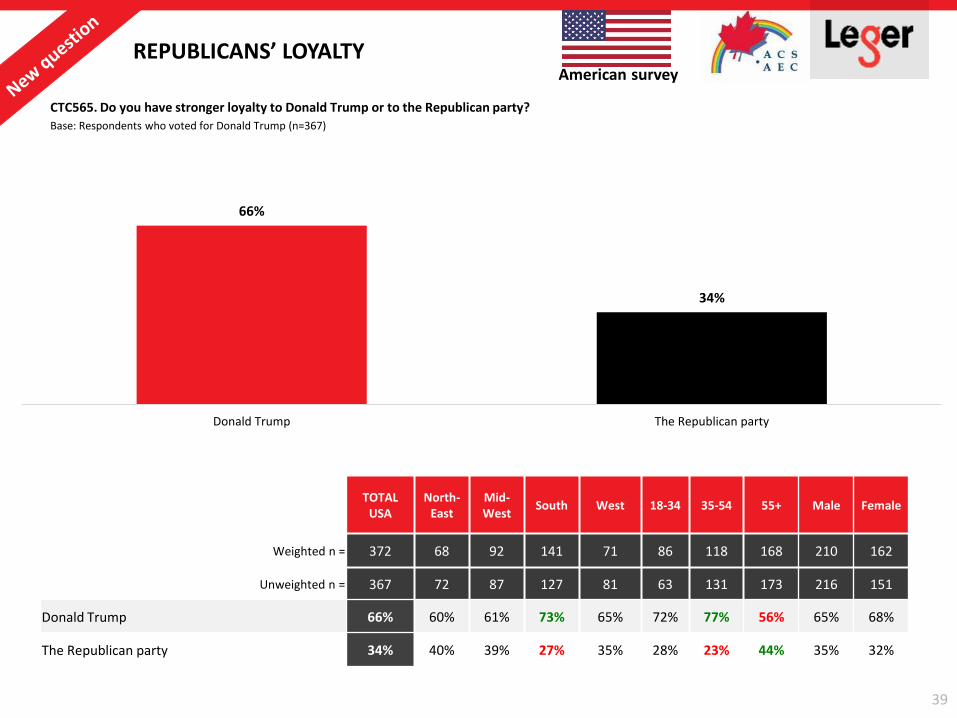
REPUBLICANS’ LOYALTY
CTC565. Do you have stronger loyalty to Donald Trump or to the Republican party?
Base: Respondents who voted for Donald Trump (n=367)
American survey
TOTALUSA
North-East
Mid-West
South West 18-34 35-54 55+ Male Female
Weighted n = 372 68 92 141 71 86 118 168 210 162
Unweighted n = 367 72 87 127 81 63 131 173 216 151
Donald Trump 66% 60% 61% 73% 65% 72% 77% 56% 65% 68%
The Republican party 34% 40% 39% 27% 35% 28% 23% 44% 35% 32%
40
7%
44%49%
Democrats Republicans New Trump party
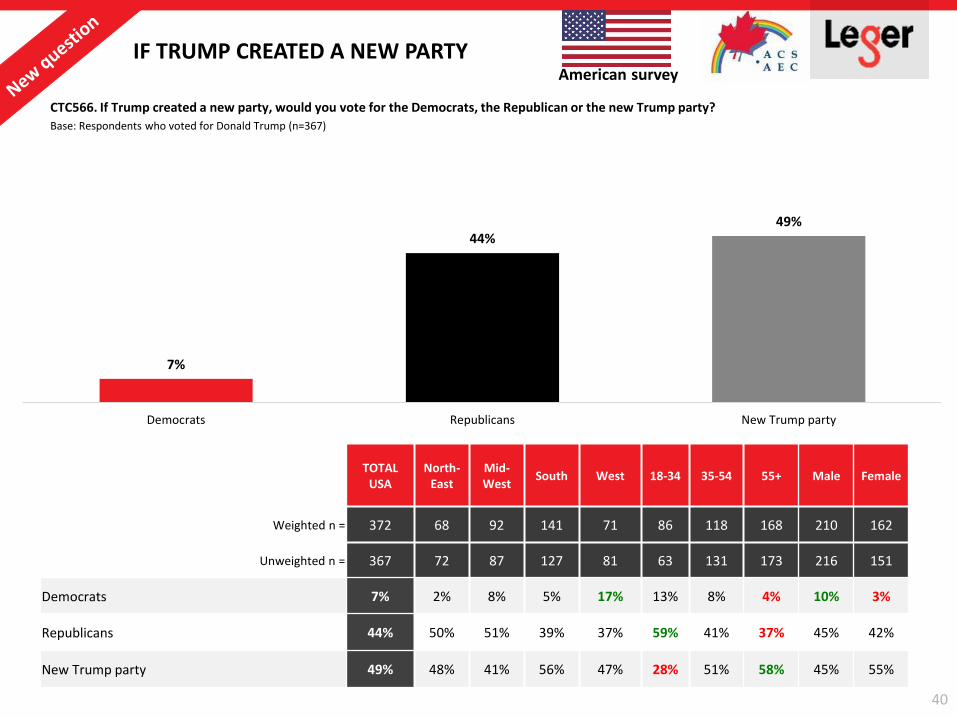
IF TRUMP CREATED A NEW PARTY
CTC566. If Trump created a new party, would you vote for the Democrats, the Republican or the new Trump party?
Base: Respondents who voted for Donald Trump (n=367)
American survey
TOTALUSA
North-East
Mid-West
South West 18-34 35-54 55+ Male Female
Weighted n = 372 68 92 141 71 86 118 168 210 162
Unweighted n = 367 72 87 127 81 63 131 173 216 151
Democrats 7% 2% 8% 5% 17% 13% 8% 4% 10% 3%
Republicans 44% 50% 51% 39% 37% 59% 41% 37% 45% 42%
New Trump party 49% 48% 41% 56% 47% 28% 51% 58% 45% 55%

STRESS AND MENTAL HEALTH
42
TOTALCANADA
ATL QC ON MB/SK AB BC 18-34 35-54 55+ UrbanSub-
urbanRural
TOTAL Feb. 15th
Gap
Weighted n = 1,532 105 359 588 100 172 208 414 526 592 599 603 308 1,535
Unweighted n = 1,532 100 406 608 125 132 161 426 611 495 627 595 291 1,535
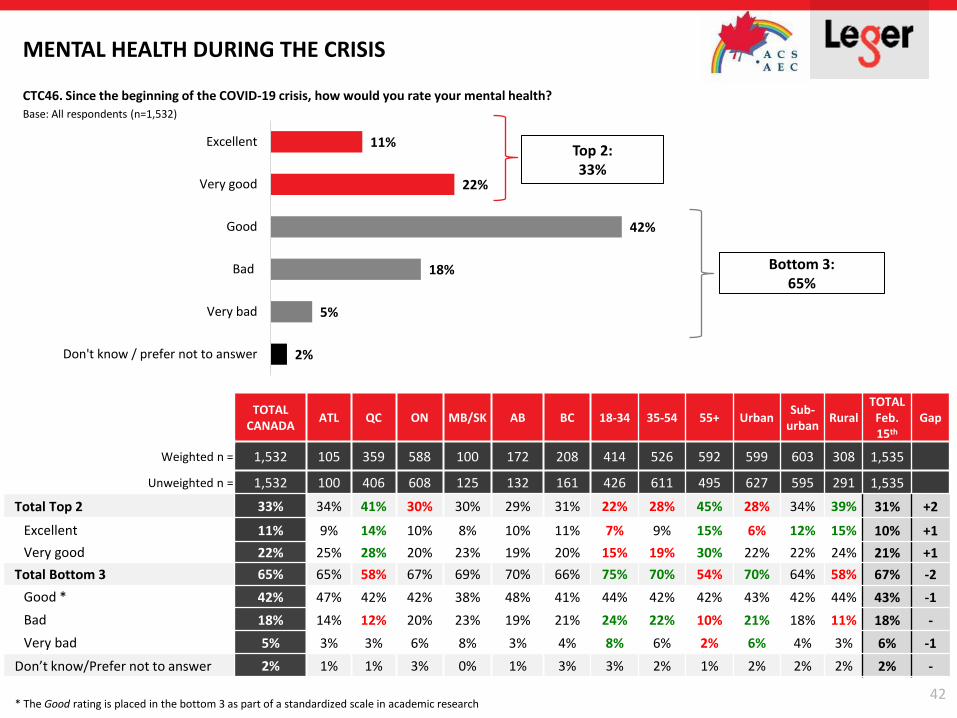
Total Top 2 33% 34% 41% 30% 30% 29% 31% 22% 28% 45% 28% 34% 39% 31% +2
Excellent 11% 9% 14% 10% 8% 10% 11% 7% 9% 15% 6% 12% 15% 10% +1
Very good 22% 25% 28% 20% 23% 19% 20% 15% 19% 30% 22% 22% 24% 21% +1
Total Bottom 3 65% 65% 58% 67% 69% 70% 66% 75% 70% 54% 70% 64% 58% 67% -2
Good * 42% 47% 42% 42% 38% 48% 41% 44% 42% 42% 43% 42% 44% 43% -1
Bad 18% 14% 12% 20% 23% 19% 21% 24% 22% 10% 21% 18% 11% 18% -
Very bad 5% 3% 3% 6% 8% 3% 4% 8% 6% 2% 6% 4% 3% 6% -1
Don’t know/Prefer not to answer 2% 1% 1% 3% 0% 1% 3% 3% 2% 1% 2% 2% 2% 2% -
11%
22%
42%
18%
5%
2%
Excellent
Very good
Good
Bad
Very bad
Don't know / prefer not to answer
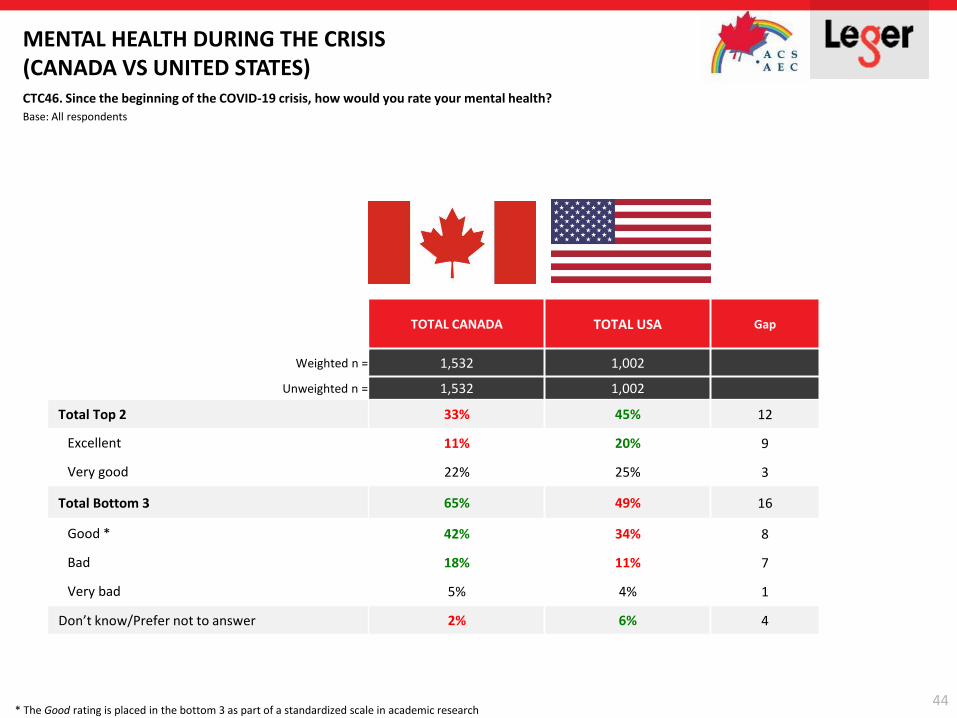
MENTAL HEALTH DURING THE CRISIS
CTC46. Since the beginning of the COVID-19 crisis, how would you rate your mental health?
Base: All respondents (n=1,532)
Top 2: 33%
Bottom 3:65%
* The Good rating is placed in the bottom 3 as part of a standardized scale in academic research
43
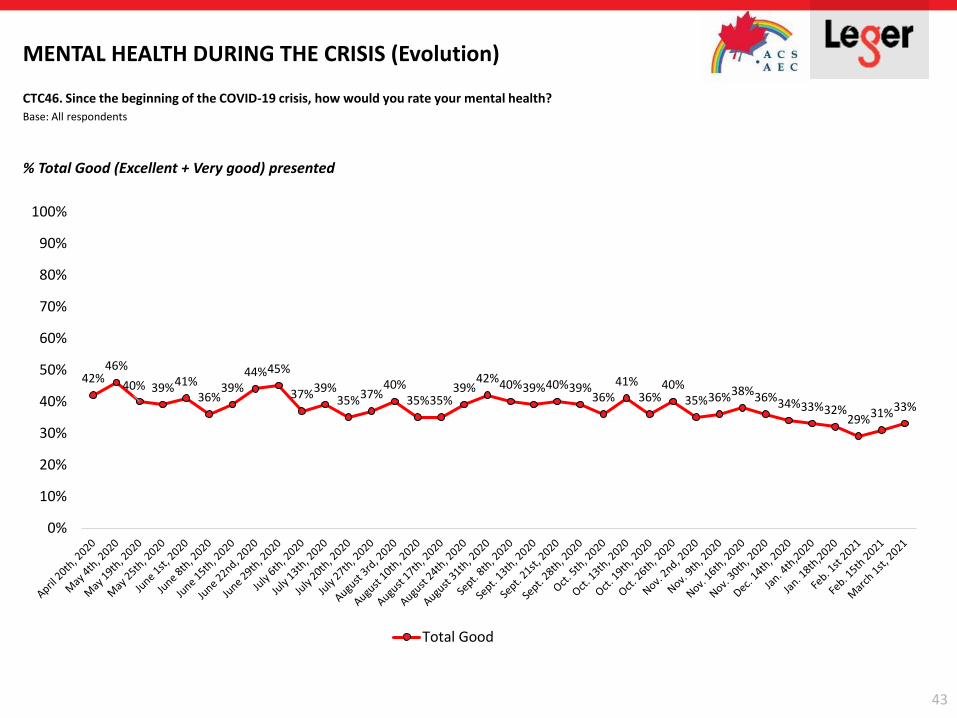
MENTAL HEALTH DURING THE CRISIS (Evolution)
CTC46. Since the beginning of the COVID-19 crisis, how would you rate your mental health?
Base: All respondents
42%46%
40% 39%41%36%
39%44%45%
37%39%35%37%
40%35%35%
39%42%40%39%40%39%
36%41%
36%40%
35%36%38%36%34%33%32%29%31%33%
0%
10%
20%
30%
40%
50%
60%
70%
80%
90%
100%
Total Good
% Total Good (Excellent + Very good) presented
44
MENTAL HEALTH DURING THE CRISIS (CANADA VS UNITED STATES) CTC46. Since the beginning of the COVID-19 crisis, how would you rate your mental health?
Base: All respondents
TOTAL CANADA TOTAL USA Gap
Weighted n = 1,532 1,002
Unweighted n = 1,532 1,002
Total Top 2 33% 45% 12
Excellent 11% 20% 9
Very good 22% 25% 3
Total Bottom 3 65% 49% 16
Good * 42% 34% 8
Bad 18% 11% 7
Very bad 5% 4% 1
Don’t know/Prefer not to answer 2% 6% 4
* The Good rating is placed in the bottom 3 as part of a standardized scale in academic research

FEAR AND SPREAD OF THE VIRUS
46
TOTALCANADA
ATL QC ON MB/SK AB BC 18-34 35-54 55+ UrbanSub-
urbanRural
TOTAL Feb. 15th
Gap
Weighted n = 1,532 105 359 588 100 172 208 414 526 592 599 603 308 1,535
Unweighted n = 1,532 100 406 608 125 132 161 426 611 495 627 595 291 1,535
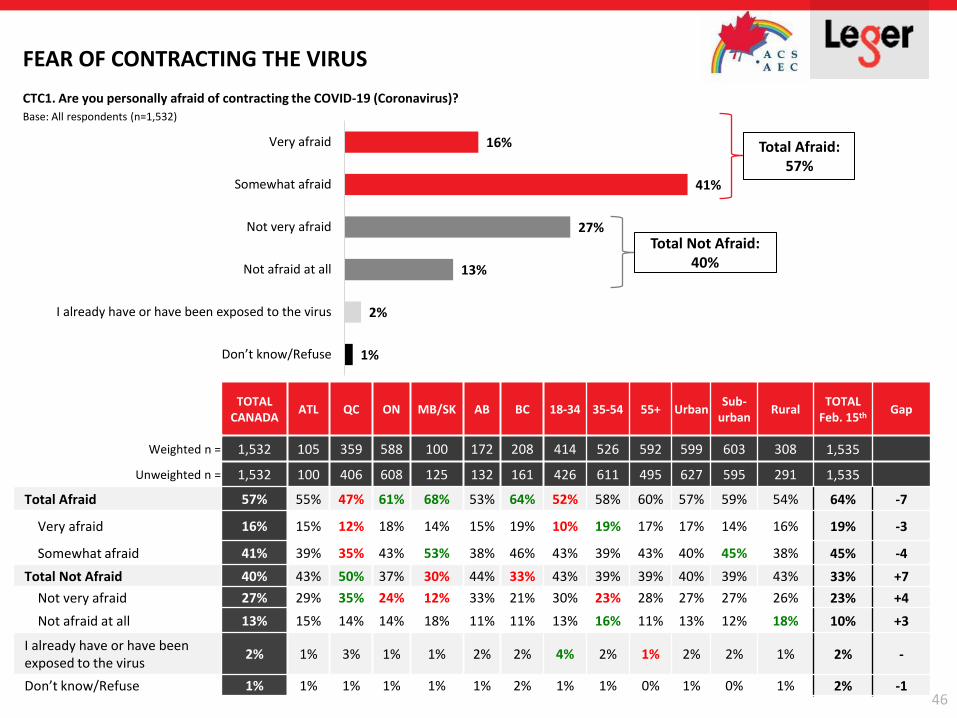
Total Afraid 57% 55% 47% 61% 68% 53% 64% 52% 58% 60% 57% 59% 54% 64% -7
Very afraid 16% 15% 12% 18% 14% 15% 19% 10% 19% 17% 17% 14% 16% 19% -3
Somewhat afraid 41% 39% 35% 43% 53% 38% 46% 43% 39% 43% 40% 45% 38% 45% -4
Total Not Afraid 40% 43% 50% 37% 30% 44% 33% 43% 39% 39% 40% 39% 43% 33% +7
Not very afraid 27% 29% 35% 24% 12% 33% 21% 30% 23% 28% 27% 27% 26% 23% +4
Not afraid at all 13% 15% 14% 14% 18% 11% 11% 13% 16% 11% 13% 12% 18% 10% +3
I already have or have been exposed to the virus
2% 1% 3% 1% 1% 2% 2% 4% 2% 1% 2% 2% 1% 2% -
Don’t know/Refuse 1% 1% 1% 1% 1% 1% 2% 1% 1% 0% 1% 0% 1% 2% -1
16%
41%
27%
13%
2%
1%
Very afraid
Somewhat afraid
Not very afraid
Not afraid at all
I already have or have been exposed to the virus
Don’t know/Refuse
FEAR OF CONTRACTING THE VIRUS
CTC1. Are you personally afraid of contracting the COVID-19 (Coronavirus)?
Base: All respondents (n=1,532)
Total Afraid: 57%
Total Not Afraid: 40%
47
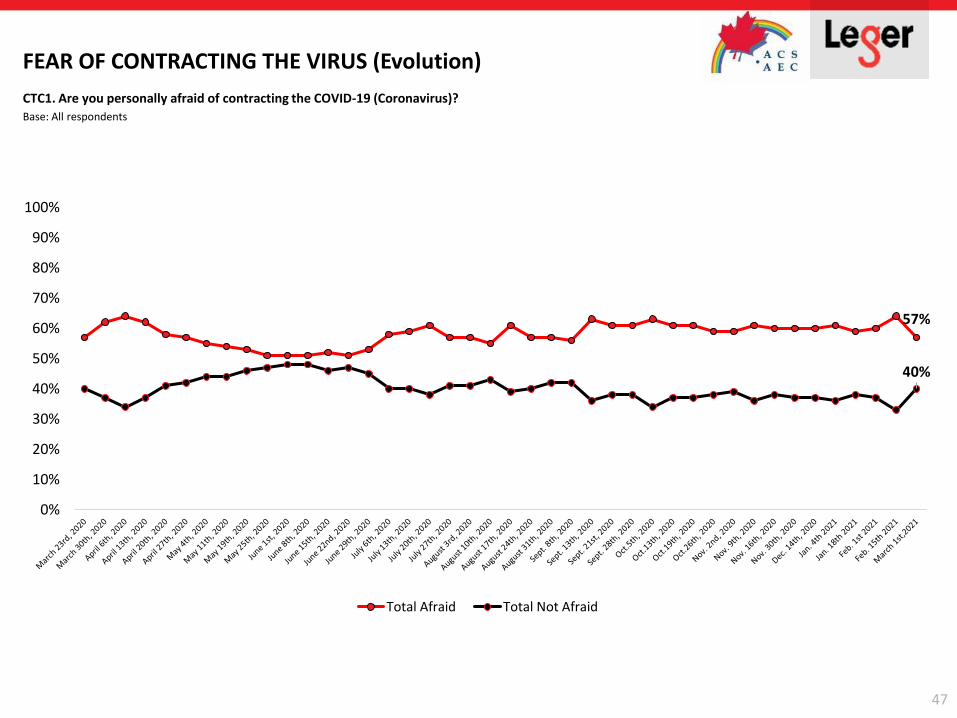
FEAR OF CONTRACTING THE VIRUS (Evolution)
CTC1. Are you personally afraid of contracting the COVID-19 (Coronavirus)?
Base: All respondents
57%
40%
0%
10%
20%
30%
40%
50%
60%
70%
80%
90%
100%
Total Afraid Total Not Afraid
48
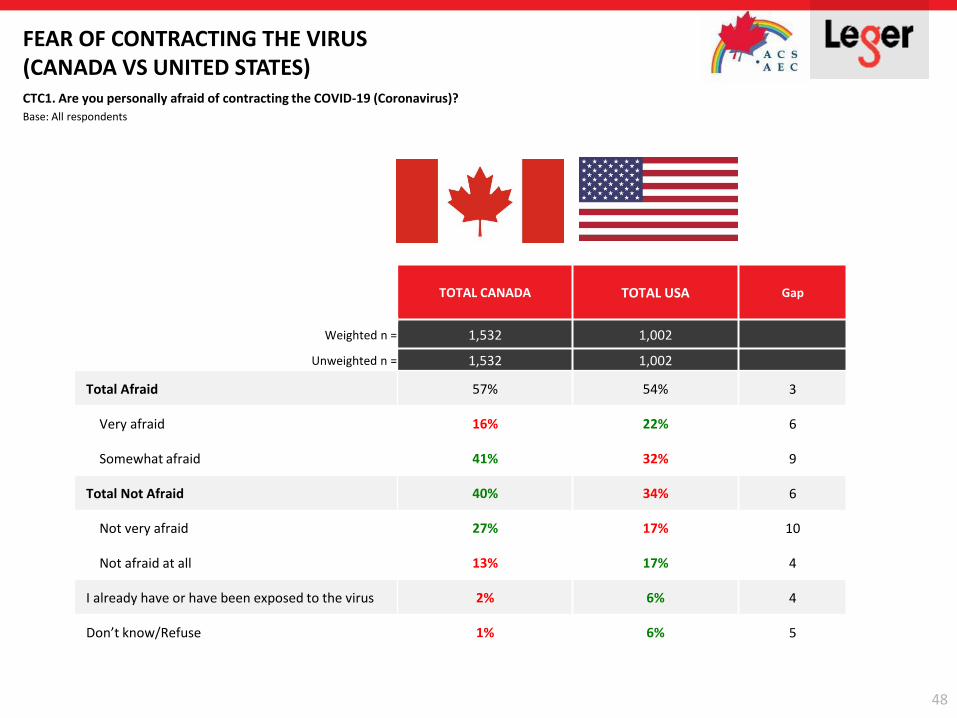
FEAR OF CONTRACTING THE VIRUS (CANADA VS UNITED STATES)CTC1. Are you personally afraid of contracting the COVID-19 (Coronavirus)?
Base: All respondents
TOTAL CANADA TOTAL USA Gap
Weighted n = 1,532 1,002
Unweighted n = 1,532 1,002
Total Afraid 57% 54% 3
Very afraid 16% 22% 6
Somewhat afraid 41% 32% 9
Total Not Afraid 40% 34% 6
Not very afraid 27% 17% 10
Not afraid at all 13% 17% 4
I already have or have been exposed to the virus 2% 6% 4
Don’t know/Refuse 1% 6% 5
49
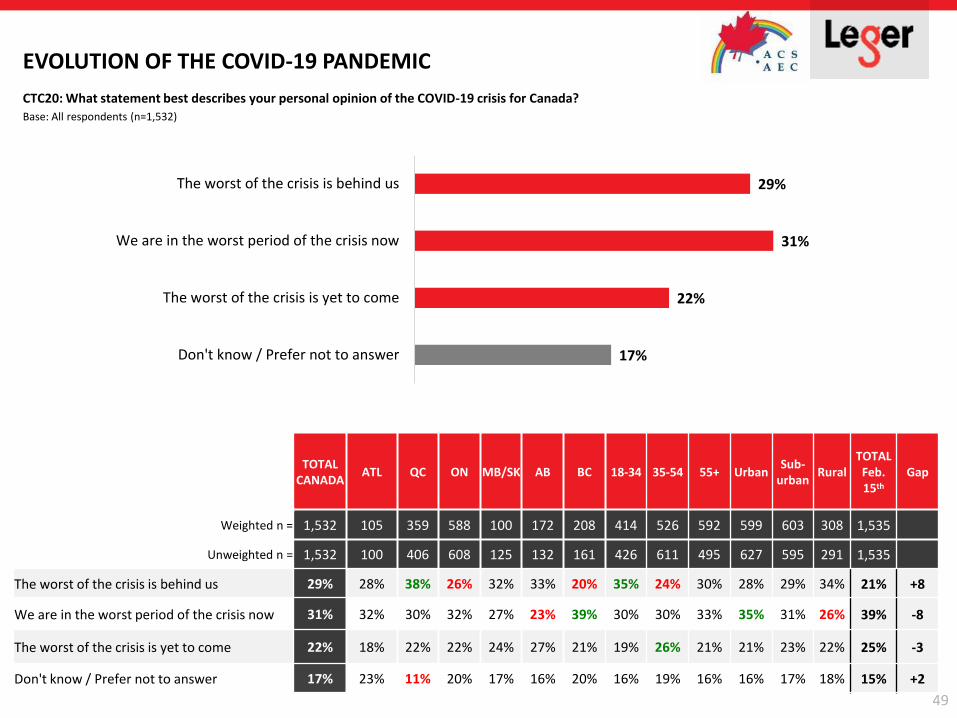
EVOLUTION OF THE COVID-19 PANDEMIC
CTC20: What statement best describes your personal opinion of the COVID-19 crisis for Canada?
Base: All respondents (n=1,532)
29%
31%
22%
17%
The worst of the crisis is behind us
We are in the worst period of the crisis now
The worst of the crisis is yet to come
Don't know / Prefer not to answer
TOTALCANADA
ATL QC ON MB/SK AB BC 18-34 35-54 55+ UrbanSub-
urbanRural
TOTAL Feb. 15th
Gap
Weighted n = 1,532 105 359 588 100 172 208 414 526 592 599 603 308 1,535
Unweighted n = 1,532 100 406 608 125 132 161 426 611 495 627 595 291 1,535
The worst of the crisis is behind us 29% 28% 38% 26% 32% 33% 20% 35% 24% 30% 28% 29% 34% 21% +8
We are in the worst period of the crisis now 31% 32% 30% 32% 27% 23% 39% 30% 30% 33% 35% 31% 26% 39% -8
The worst of the crisis is yet to come 22% 18% 22% 22% 24% 27% 21% 19% 26% 21% 21% 23% 22% 25% -3
Don't know / Prefer not to answer 17% 23% 11% 20% 17% 16% 20% 16% 19% 16% 16% 17% 18% 15% +2
50
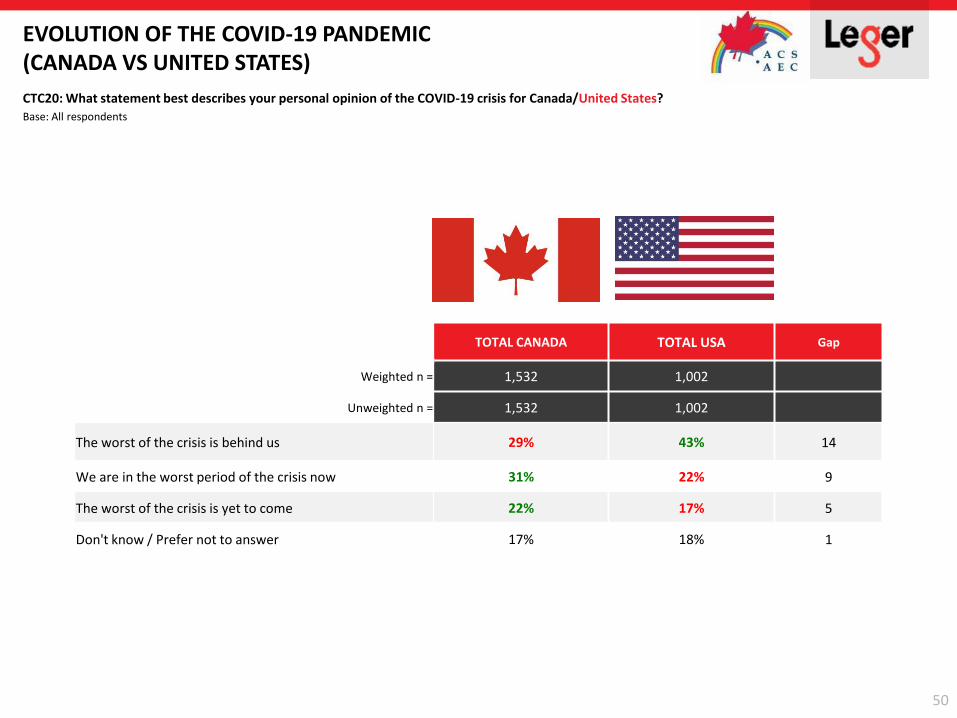
EVOLUTION OF THE COVID-19 PANDEMIC (CANADA VS UNITED STATES)
CTC20: What statement best describes your personal opinion of the COVID-19 crisis for Canada/United States?
Base: All respondents
TOTAL CANADA TOTAL USA Gap
Weighted n = 1,532 1,002
Unweighted n = 1,532 1,002
The worst of the crisis is behind us 29% 43% 14
We are in the worst period of the crisis now 31% 22% 9
The worst of the crisis is yet to come 22% 17% 5
Don't know / Prefer not to answer 17% 18% 1
51
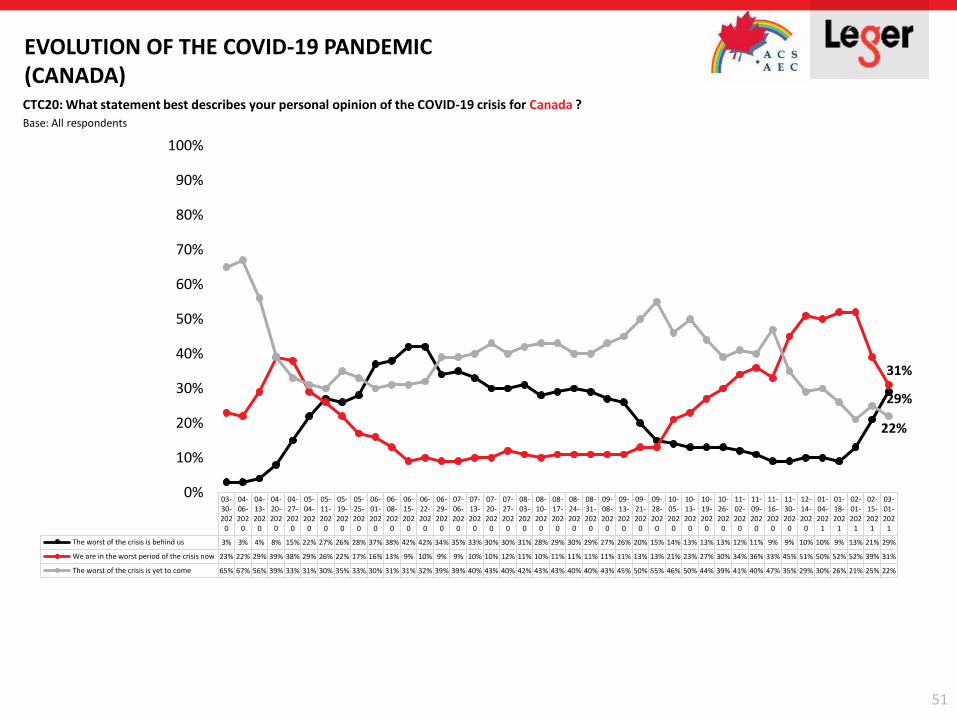
EVOLUTION OF THE COVID-19 PANDEMIC (CANADA)CTC20: What statement best describes your personal opinion of the COVID-19 crisis for Canada ?
Base: All respondents
03-30-202
0
04-06-202
0
04-13-202
0
04-20-202
0
04-27-202
0
05-04-202
0
05-11-202
0
05-19-202
0
05-25-202
0
06-01-202
0
06-08-202
0
06-15-202
0
06-22-202
0
06-29-202
0
07-06-202
0
07-13-202
0
07-20-202
0
07-27-202
0
08-03-202
0
08-10-202
0
08-17-202
0
08-24-202
0
08-31-202
0
09-08-202
0
09-13-202
0
09-21-202
0
09-28-202
0
10-05-202
0
10-13-202
0
10-19-202
0
10-26-202
0
11-02-202
0
11-09-202
0
11-16-202
0
11-30-202
0
12-14-202
0
01-04-202
1
01-18-202
1
02-01-202
1
02-15-202
1
03-01-202
1
The worst of the crisis is behind us 3% 3% 4% 8% 15% 22% 27% 26% 28% 37% 38% 42% 42% 34% 35% 33% 30% 30% 31% 28% 29% 30% 29% 27% 26% 20% 15% 14% 13% 13% 13% 12% 11% 9% 9% 10% 10% 9% 13% 21% 29%
We are in the worst period of the crisis now 23% 22% 29% 39% 38% 29% 26% 22% 17% 16% 13% 9% 10% 9% 9% 10% 10% 12% 11% 10% 11% 11% 11% 11% 11% 13% 13% 21% 23% 27% 30% 34% 36% 33% 45% 51% 50% 52% 52% 39% 31%
The worst of the crisis is yet to come 65% 67% 56% 39% 33% 31% 30% 35% 33% 30% 31% 31% 32% 39% 39% 40% 43% 40% 42% 43% 43% 40% 40% 43% 45% 50% 55% 46% 50% 44% 39% 41% 40% 47% 35% 29% 30% 26% 21% 25% 22%
29%
31%
22%
0%
10%
20%
30%
40%
50%
60%
70%
80%
90%
100%
52
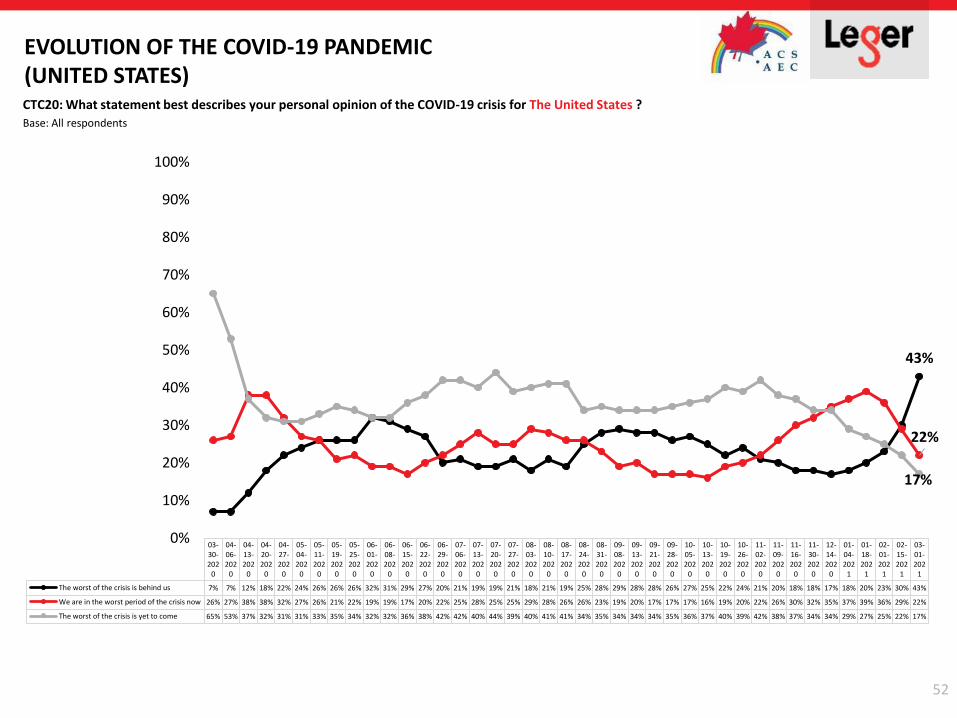
EVOLUTION OF THE COVID-19 PANDEMIC (UNITED STATES)CTC20: What statement best describes your personal opinion of the COVID-19 crisis for The United States ?
Base: All respondents
03-30-202
0
04-06-202
0
04-13-202
0
04-20-202
0
04-27-202
0
05-04-202
0
05-11-202
0
05-19-202
0
05-25-202
0
06-01-202
0
06-08-202
0
06-15-202
0
06-22-202
0
06-29-202
0
07-06-202
0
07-13-202
0
07-20-202
0
07-27-202
0
08-03-202
0
08-10-202
0
08-17-202
0
08-24-202
0
08-31-202
0
09-08-202
0
09-13-202
0
09-21-202
0
09-28-202
0
10-05-202
0
10-13-202
0
10-19-202
0
10-26-202
0
11-02-202
0
11-09-202
0
11-16-202
0
11-30-202
0
12-14-202
0
01-04-202
1
01-18-202
1
02-01-202
1
02-15-202
1
03-01-202
1
The worst of the crisis is behind us 7% 7% 12% 18% 22% 24% 26% 26% 26% 32% 31% 29% 27% 20% 21% 19% 19% 21% 18% 21% 19% 25% 28% 29% 28% 28% 26% 27% 25% 22% 24% 21% 20% 18% 18% 17% 18% 20% 23% 30% 43%
We are in the worst period of the crisis now 26% 27% 38% 38% 32% 27% 26% 21% 22% 19% 19% 17% 20% 22% 25% 28% 25% 25% 29% 28% 26% 26% 23% 19% 20% 17% 17% 17% 16% 19% 20% 22% 26% 30% 32% 35% 37% 39% 36% 29% 22%
The worst of the crisis is yet to come 65% 53% 37% 32% 31% 31% 33% 35% 34% 32% 32% 36% 38% 42% 42% 40% 44% 39% 40% 41% 41% 34% 35% 34% 34% 34% 35% 36% 37% 40% 39% 42% 38% 37% 34% 34% 29% 27% 25% 22% 17%
43%
22%
17%
0%
10%
20%
30%
40%
50%
60%
70%
80%
90%
100%

SATISFACTION WITH GOVERNMENTS DURING THE CRISIS
54
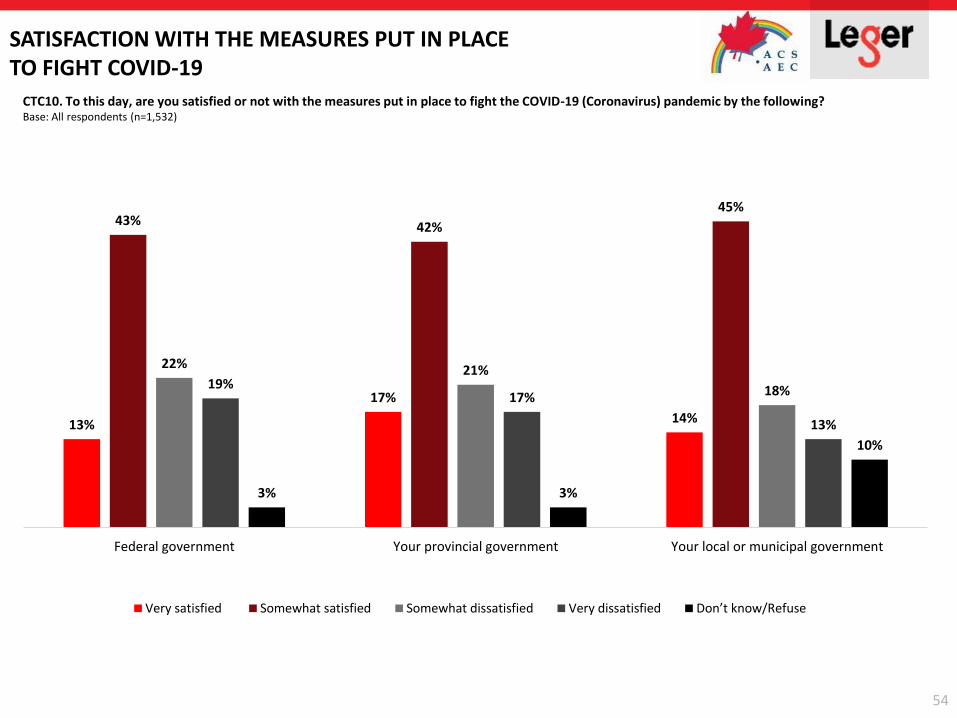
SATISFACTION WITH THE MEASURES PUT IN PLACE TO FIGHT COVID-19
CTC10. To this day, are you satisfied or not with the measures put in place to fight the COVID-19 (Coronavirus) pandemic by the following? Base: All respondents (n=1,532)
13%
17%
14%
43% 42%
45%
22% 21%
18%19%17%
13%
3% 3%
10%
Federal government Your provincial government Your local or municipal government
Very satisfied Somewhat satisfied Somewhat dissatisfied Very dissatisfied Don’t know/Refuse
55
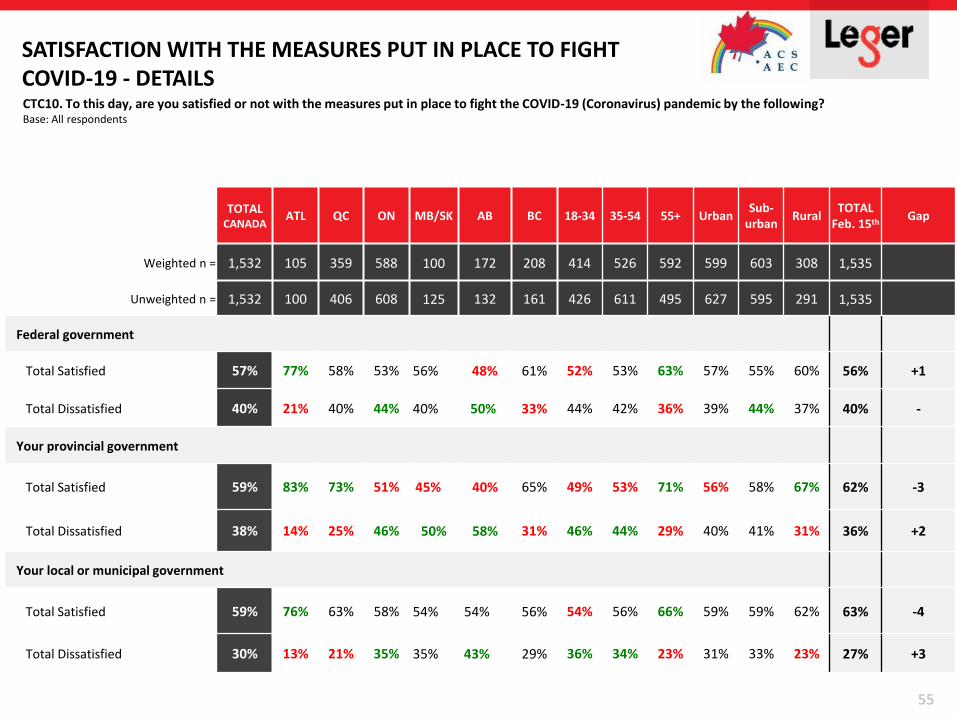
SATISFACTION WITH THE MEASURES PUT IN PLACE TO FIGHT COVID-19 - DETAILSCTC10. To this day, are you satisfied or not with the measures put in place to fight the COVID-19 (Coronavirus) pandemic by the following? Base: All respondents
TOTALCANADA
ATL QC ON MB/SK AB BC 18-34 35-54 55+ UrbanSub-
urbanRural
TOTAL Feb. 15th
Gap
Weighted n = 1,532 105 359 588 100 172 208 414 526 592 599 603 308 1,535
Unweighted n = 1,532 100 406 608 125 132 161 426 611 495 627 595 291 1,535
Federal government
Total Satisfied 57% 77% 58% 53% 56% 48% 61% 52% 53% 63% 57% 55% 60% 56% +1
Total Dissatisfied 40% 21% 40% 44% 40% 50% 33% 44% 42% 36% 39% 44% 37% 40% -
Your provincial government
Total Satisfied 59% 83% 73% 51% 45% 40% 65% 49% 53% 71% 56% 58% 67% 62% -3
Total Dissatisfied 38% 14% 25% 46% 50% 58% 31% 46% 44% 29% 40% 41% 31% 36% +2
Your local or municipal government
Total Satisfied 59% 76% 63% 58% 54% 54% 56% 54% 56% 66% 59% 59% 62% 63% -4
Total Dissatisfied 30% 13% 21% 35% 35% 43% 29% 36% 34% 23% 31% 33% 23% 27% +3
56
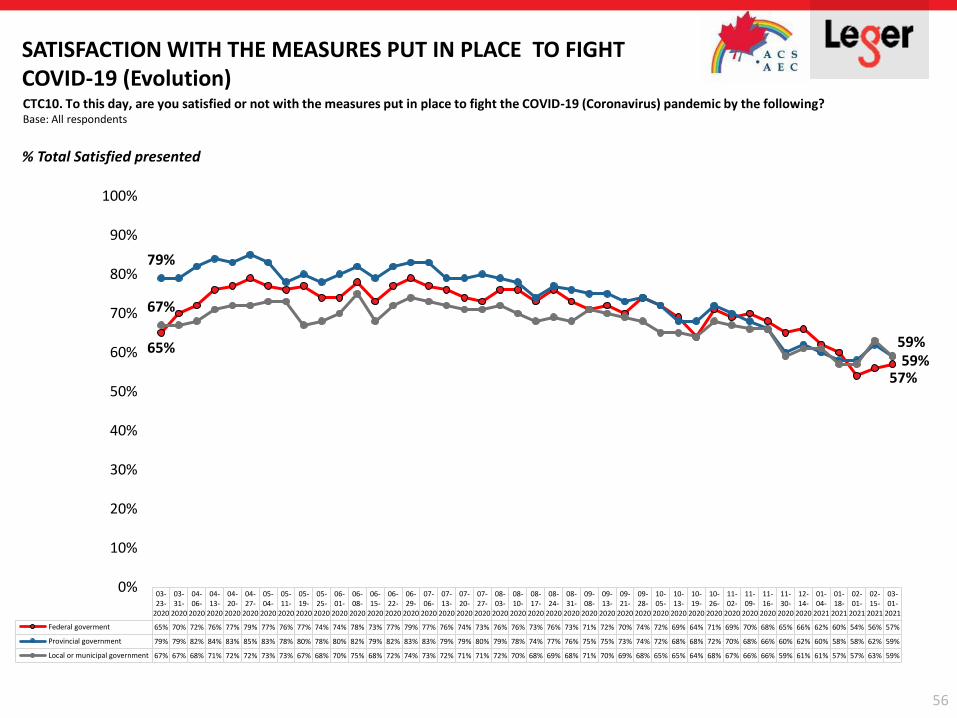
SATISFACTION WITH THE MEASURES PUT IN PLACE TO FIGHT COVID-19 (Evolution)CTC10. To this day, are you satisfied or not with the measures put in place to fight the COVID-19 (Coronavirus) pandemic by the following? Base: All respondents
03-23-
2020
03-31-
2020
04-06-
2020
04-13-
2020
04-20-
2020
04-27-
2020
05-04-
2020
05-11-
2020
05-19-
2020
05-25-
2020
06-01-
2020
06-08-
2020
06-15-
2020
06-22-
2020
06-29-
2020
07-06-
2020
07-13-
2020
07-20-
2020
07-27-
2020
08-03-
2020
08-10-
2020
08-17-
2020
08-24-
2020
08-31-
2020
09-08-
2020
09-13-
2020
09-21-
2020
09-28-
2020
10-05-
2020
10-13-
2020
10-19-
2020
10-26-
2020
11-02-
2020
11-09-
2020
11-16-
2020
11-30-
2020
12-14-
2020
01-04-
2021
01-18-
2021
02-01-
2021
02-15-
2021
03-01-
2021
Federal goverment 65% 70% 72% 76% 77% 79% 77% 76% 77% 74% 74% 78% 73% 77% 79% 77% 76% 74% 73% 76% 76% 73% 76% 73% 71% 72% 70% 74% 72% 69% 64% 71% 69% 70% 68% 65% 66% 62% 60% 54% 56% 57%
Provincial government 79% 79% 82% 84% 83% 85% 83% 78% 80% 78% 80% 82% 79% 82% 83% 83% 79% 79% 80% 79% 78% 74% 77% 76% 75% 75% 73% 74% 72% 68% 68% 72% 70% 68% 66% 60% 62% 60% 58% 58% 62% 59%
Local or municipal government 67% 67% 68% 71% 72% 72% 73% 73% 67% 68% 70% 75% 68% 72% 74% 73% 72% 71% 71% 72% 70% 68% 69% 68% 71% 70% 69% 68% 65% 65% 64% 68% 67% 66% 66% 59% 61% 61% 57% 57% 63% 59%
65%
57%
79%
59%
67%
59%
0%
10%
20%
30%
40%
50%
60%
70%
80%
90%
100%
% Total Satisfied presented
57
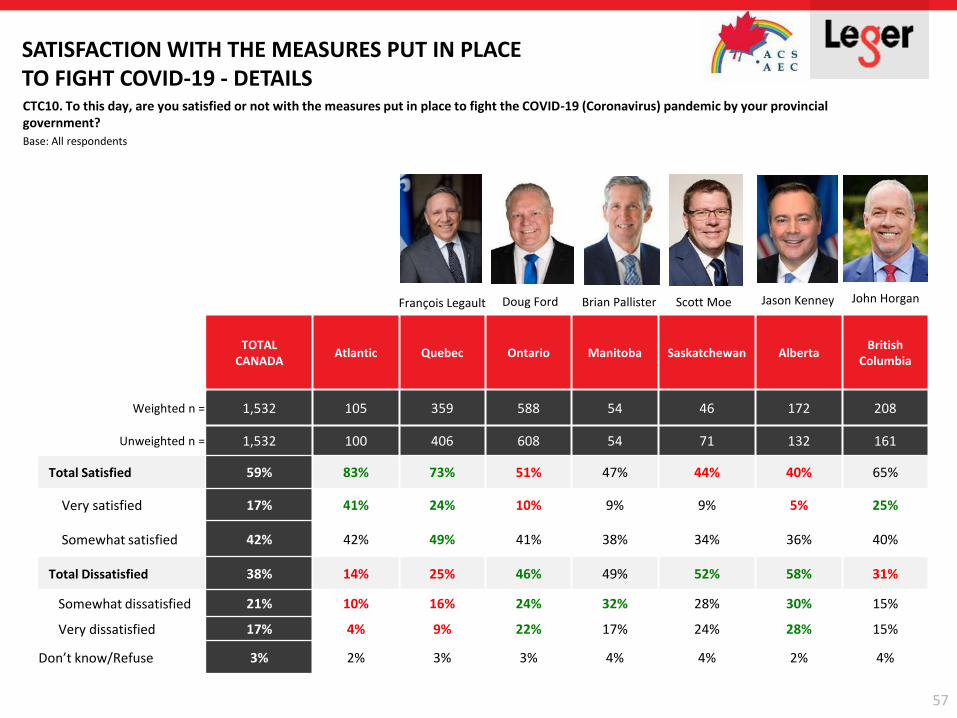
SATISFACTION WITH THE MEASURES PUT IN PLACE TO FIGHT COVID-19 - DETAILSCTC10. To this day, are you satisfied or not with the measures put in place to fight the COVID-19 (Coronavirus) pandemic by your provincial government?
Base: All respondents
TOTALCANADA
Atlantic Quebec Ontario Manitoba Saskatchewan Alberta British
Columbia
Weighted n = 1,532 105 359 588 54 46 172 208
Unweighted n = 1,532 100 406 608 54 71 132 161
Total Satisfied 59% 83% 73% 51% 47% 44% 40% 65%
Very satisfied 17% 41% 24% 10% 9% 9% 5% 25%
Somewhat satisfied 42% 42% 49% 41% 38% 34% 36% 40%
Total Dissatisfied 38% 14% 25% 46% 49% 52% 58% 31%
Somewhat dissatisfied 21% 10% 16% 24% 32% 28% 30% 15%
Very dissatisfied 17% 4% 9% 22% 17% 24% 28% 15%
Don’t know/Refuse 3% 2% 3% 3% 4% 4% 2% 4%
Jason KenneyFrançois Legault Doug Ford John HorganBrian Pallister Scott Moe
58
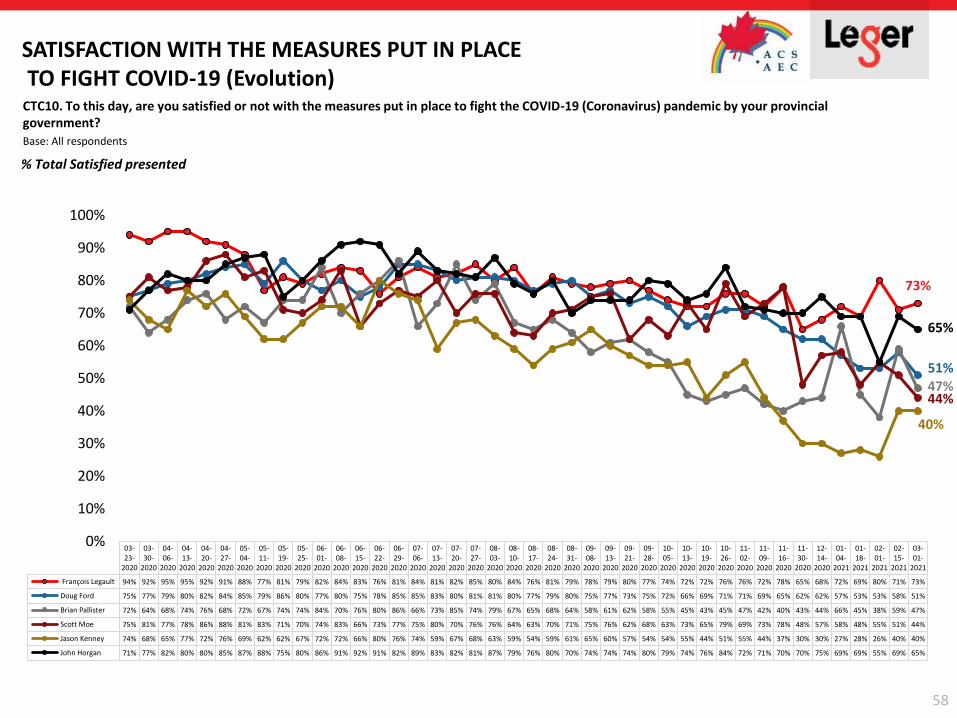
SATISFACTION WITH THE MEASURES PUT IN PLACETO FIGHT COVID-19 (Evolution)
CTC10. To this day, are you satisfied or not with the measures put in place to fight the COVID-19 (Coronavirus) pandemic by your provincial government?
Base: All respondents
03-23-
2020
03-30-
2020
04-06-
2020
04-13-
2020
04-20-
2020
04-27-
2020
05-04-
2020
05-11-
2020
05-19-
2020
05-25-
2020
06-01-
2020
06-08-
2020
06-15-
2020
06-22-
2020
06-29-
2020
07-06-
2020
07-13-
2020
07-20-
2020
07-27-
2020
08-03-
2020
08-10-
2020
08-17-
2020
08-24-
2020
08-31-
2020
09-08-
2020
09-13-
2020
09-21-
2020
09-28-
2020
10-05-
2020
10-13-
2020
10-19-
2020
10-26-
2020
11-02-
2020
11-09-
2020
11-16-
2020
11-30-
2020
12-14-
2020
01-04-
2021
01-18-
2021
02-01-
2021
02-15-
2021
03-01-
2021
François Legault 94% 92% 95% 95% 92% 91% 88% 77% 81% 79% 82% 84% 83% 76% 81% 84% 81% 82% 85% 80% 84% 76% 81% 79% 78% 79% 80% 77% 74% 72% 72% 76% 76% 72% 78% 65% 68% 72% 69% 80% 71% 73%
Doug Ford 75% 77% 79% 80% 82% 84% 85% 79% 86% 80% 77% 80% 75% 78% 85% 85% 83% 80% 81% 81% 80% 77% 79% 80% 75% 77% 73% 75% 72% 66% 69% 71% 71% 69% 65% 62% 62% 57% 53% 53% 58% 51%
Brian Pallister 72% 64% 68% 74% 76% 68% 72% 67% 74% 74% 84% 70% 76% 80% 86% 66% 73% 85% 74% 79% 67% 65% 68% 64% 58% 61% 62% 58% 55% 45% 43% 45% 47% 42% 40% 43% 44% 66% 45% 38% 59% 47%
Scott Moe 75% 81% 77% 78% 86% 88% 81% 83% 71% 70% 74% 83% 66% 73% 77% 75% 80% 70% 76% 76% 64% 63% 70% 71% 75% 76% 62% 68% 63% 73% 65% 79% 69% 73% 78% 48% 57% 58% 48% 55% 51% 44%
Jason Kenney 74% 68% 65% 77% 72% 76% 69% 62% 62% 67% 72% 72% 66% 80% 76% 74% 59% 67% 68% 63% 59% 54% 59% 61% 65% 60% 57% 54% 54% 55% 44% 51% 55% 44% 37% 30% 30% 27% 28% 26% 40% 40%
John Horgan 71% 77% 82% 80% 80% 85% 87% 88% 75% 80% 86% 91% 92% 91% 82% 89% 83% 82% 81% 87% 79% 76% 80% 70% 74% 74% 74% 80% 79% 74% 76% 84% 72% 71% 70% 70% 75% 69% 69% 55% 69% 65%
73%
51%47%44%
40%
65%
0%
10%
20%
30%
40%
50%
60%
70%
80%
90%
100%
% Total Satisfied presented
59
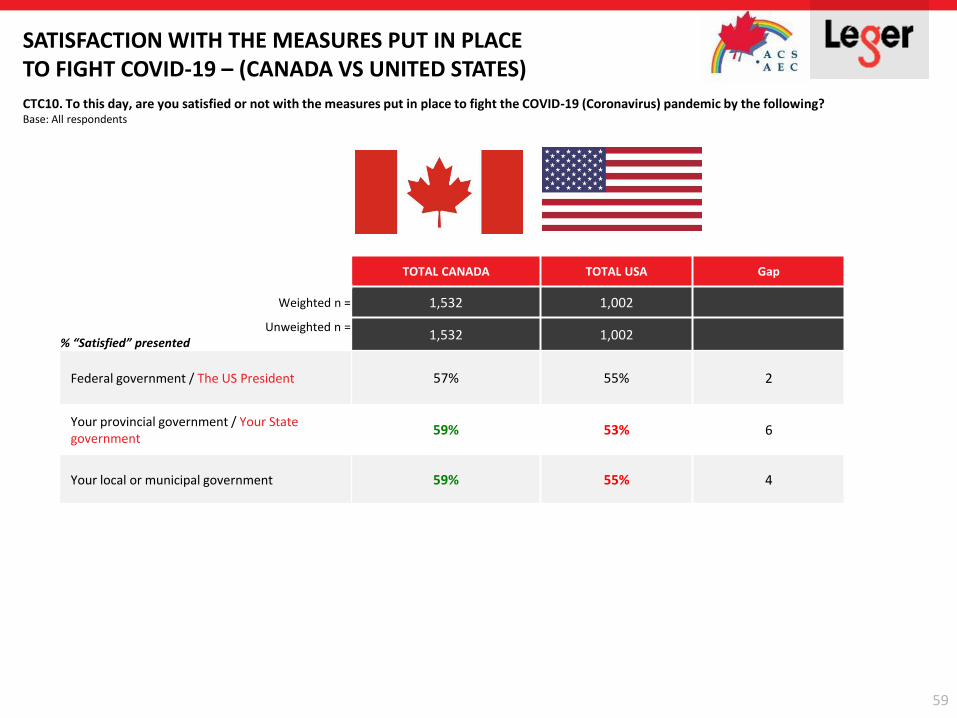
SATISFACTION WITH THE MEASURES PUT IN PLACE TO FIGHT COVID-19 – (CANADA VS UNITED STATES)
CTC10. To this day, are you satisfied or not with the measures put in place to fight the COVID-19 (Coronavirus) pandemic by the following? Base: All respondents
TOTAL CANADA TOTAL USA Gap
Weighted n = 1,532 1,002
Unweighted n =% “Satisfied” presented
1,532 1,002
Federal government / The US President 57% 55% 2
Your provincial government / Your State government
59% 53% 6
Your local or municipal government 59% 55% 4
60
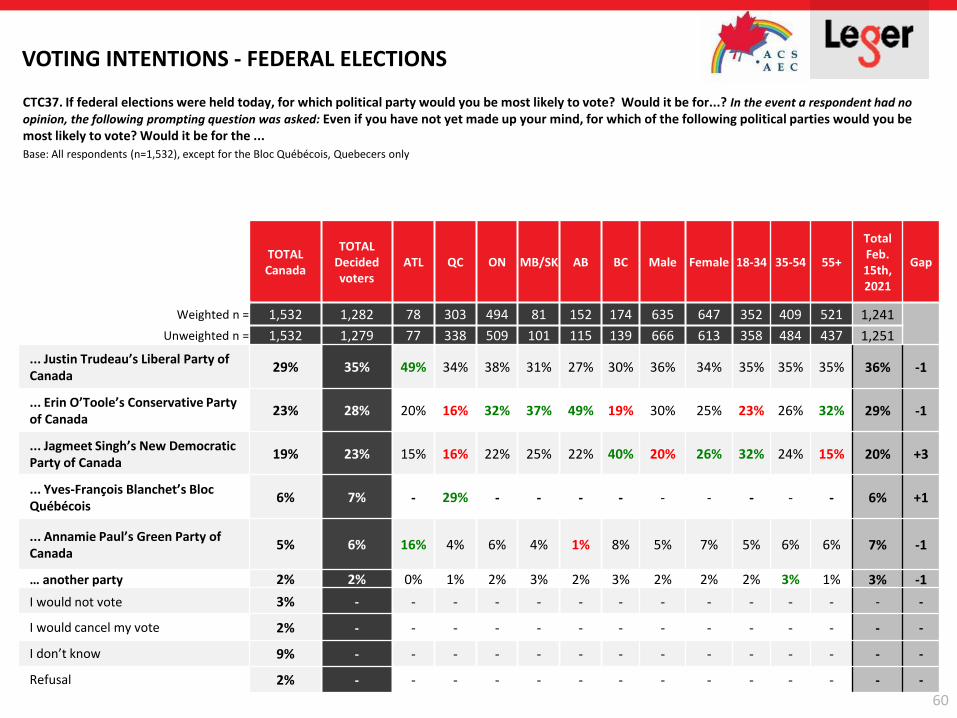
VOTING INTENTIONS - FEDERAL ELECTIONS
CTC37. If federal elections were held today, for which political party would you be most likely to vote? Would it be for...? In the event a respondent had no
opinion, the following prompting question was asked: Even if you have not yet made up your mind, for which of the following political parties would you be most likely to vote? Would it be for the ...
Base: All respondents (n=1,532), except for the Bloc Québécois, Quebecers only
TOTAL Canada
TOTALDecided voters
ATL QC ON MB/SK AB BC Male Female 18-34 35-54 55+
TotalFeb. 15th, 2021
Gap
Weighted n = 1,532 1,282 78 303 494 81 152 174 635 647 352 409 521 1,241
Unweighted n = 1,532 1,279 77 338 509 101 115 139 666 613 358 484 437 1,251
... Justin Trudeau’s Liberal Party of Canada
29% 35% 49% 34% 38% 31% 27% 30% 36% 34% 35% 35% 35% 36% -1
... Erin O’Toole’s Conservative Party of Canada
23% 28% 20% 16% 32% 37% 49% 19% 30% 25% 23% 26% 32% 29% -1
... Jagmeet Singh’s New Democratic Party of Canada
19% 23% 15% 16% 22% 25% 22% 40% 20% 26% 32% 24% 15% 20% +3
... Yves-François Blanchet’s Bloc Québécois
6% 7% - 29% - - - - - - - - - 6% +1
... Annamie Paul’s Green Party of Canada
5% 6% 16% 4% 6% 4% 1% 8% 5% 7% 5% 6% 6% 7% -1
… another party 2% 2% 0% 1% 2% 3% 2% 3% 2% 2% 2% 3% 1% 3% -1
I would not vote 3% - - - - - - - - - - - - - -
I would cancel my vote 2% - - - - - - - - - - - - - -
I don’t know 9% - - - - - - - - - - - - - -
Refusal 2% - - - - - - - - - - - - - -
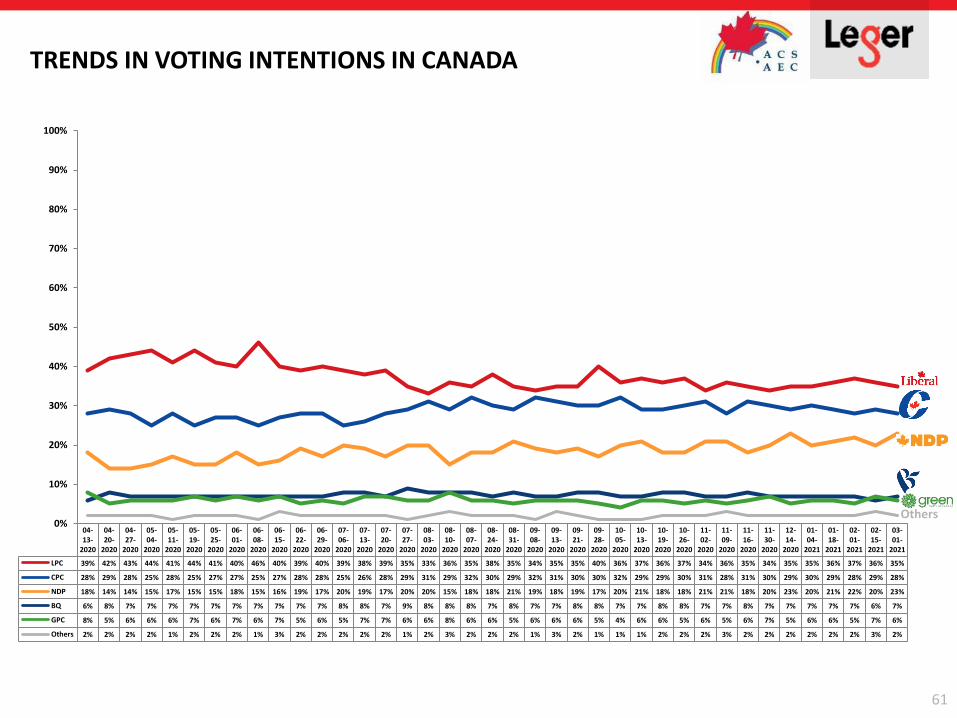
TRENDS IN VOTING INTENTIONS IN CANADA
61
04-13-
2020
04-20-
2020
04-27-
2020
05-04-
2020
05-11-
2020
05-19-
2020
05-25-
2020
06-01-
2020
06-08-
2020
06-15-
2020
06-22-
2020
06-29-
2020
07-06-
2020
07-13-
2020
07-20-
2020
07-27-
2020
08-03-
2020
08-10-
2020
08-07-
2020
08-24-
2020
08-31-
2020
09-08-
2020
09-13-
2020
09-21-
2020
09-28-
2020
10-05-
2020
10-13-
2020
10-19-
2020
10-26-
2020
11-02-
2020
11-09-
2020
11-16-
2020
11-30-
2020
12-14-
2020
01-04-
2021
01-18-
2021
02-01-
2021
02-15-
2021
03-01-
2021
LPC 39% 42% 43% 44% 41% 44% 41% 40% 46% 40% 39% 40% 39% 38% 39% 35% 33% 36% 35% 38% 35% 34% 35% 35% 40% 36% 37% 36% 37% 34% 36% 35% 34% 35% 35% 36% 37% 36% 35%
CPC 28% 29% 28% 25% 28% 25% 27% 27% 25% 27% 28% 28% 25% 26% 28% 29% 31% 29% 32% 30% 29% 32% 31% 30% 30% 32% 29% 29% 30% 31% 28% 31% 30% 29% 30% 29% 28% 29% 28%
NDP 18% 14% 14% 15% 17% 15% 15% 18% 15% 16% 19% 17% 20% 19% 17% 20% 20% 15% 18% 18% 21% 19% 18% 19% 17% 20% 21% 18% 18% 21% 21% 18% 20% 23% 20% 21% 22% 20% 23%
BQ 6% 8% 7% 7% 7% 7% 7% 7% 7% 7% 7% 7% 8% 8% 7% 9% 8% 8% 8% 7% 8% 7% 7% 8% 8% 7% 7% 8% 8% 7% 7% 8% 7% 7% 7% 7% 7% 6% 7%
GPC 8% 5% 6% 6% 6% 7% 6% 7% 6% 7% 5% 6% 5% 7% 7% 6% 6% 8% 6% 6% 5% 6% 6% 6% 5% 4% 6% 6% 5% 6% 5% 6% 7% 5% 6% 6% 5% 7% 6%
Others 2% 2% 2% 2% 1% 2% 2% 2% 1% 3% 2% 2% 2% 2% 2% 1% 2% 3% 2% 2% 2% 1% 3% 2% 1% 1% 1% 2% 2% 2% 3% 2% 2% 2% 2% 2% 2% 3% 2%
0%
10%
20%
30%
40%
50%
60%
70%
80%
90%
100%
Others

APPENDIX
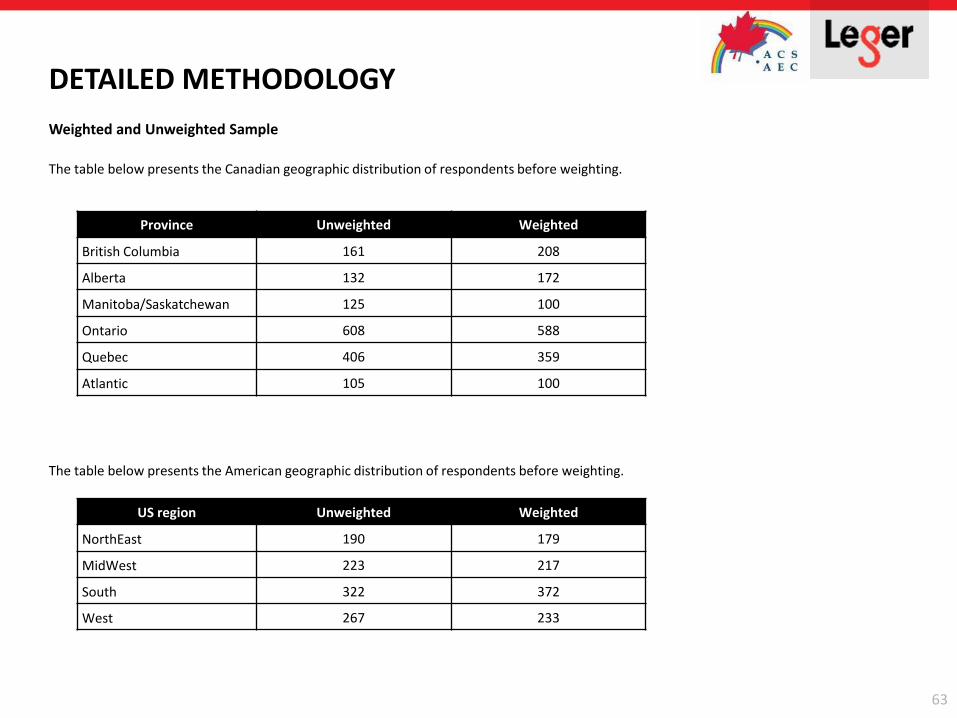
Weighted and Unweighted Sample
The table below presents the Canadian geographic distribution of respondents before weighting.
The table below presents the American geographic distribution of respondents before weighting.
63
Province Unweighted Weighted
British Columbia 161 208
Alberta 132 172
Manitoba/Saskatchewan 125 100
Ontario 608 588
Quebec 406 359
Atlantic 105 100
DETAILED METHODOLOGY
US region Unweighted Weighted
NorthEast 190 179
MidWest 223 217
South 322 372
West 267 233
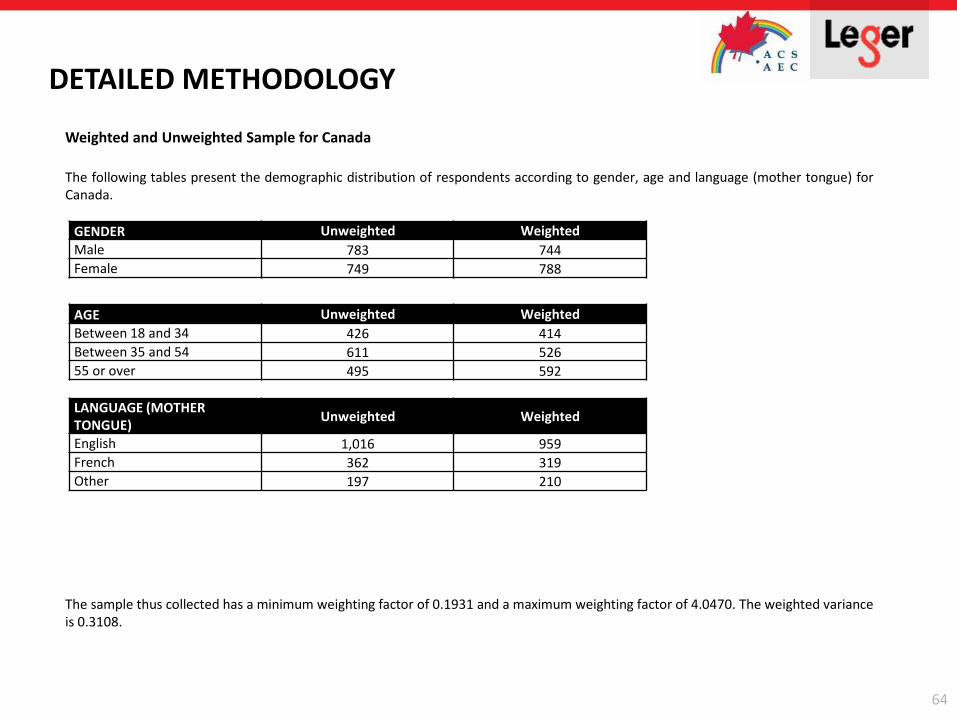
Weighted and Unweighted Sample for Canada
The following tables present the demographic distribution of respondents according to gender, age and language (mother tongue) forCanada.
The sample thus collected has a minimum weighting factor of 0.1931 and a maximum weighting factor of 4.0470. The weighted varianceis 0.3108.
64
GENDER Unweighted Weighted
Male 783 744Female 749 788
AGE Unweighted Weighted
Between 18 and 34 426 414Between 35 and 54 611 52655 or over 495 592
LANGUAGE (MOTHERTONGUE)
Unweighted Weighted
English 1,016 959French 362 319Other 197 210
DETAILED METHODOLOGY
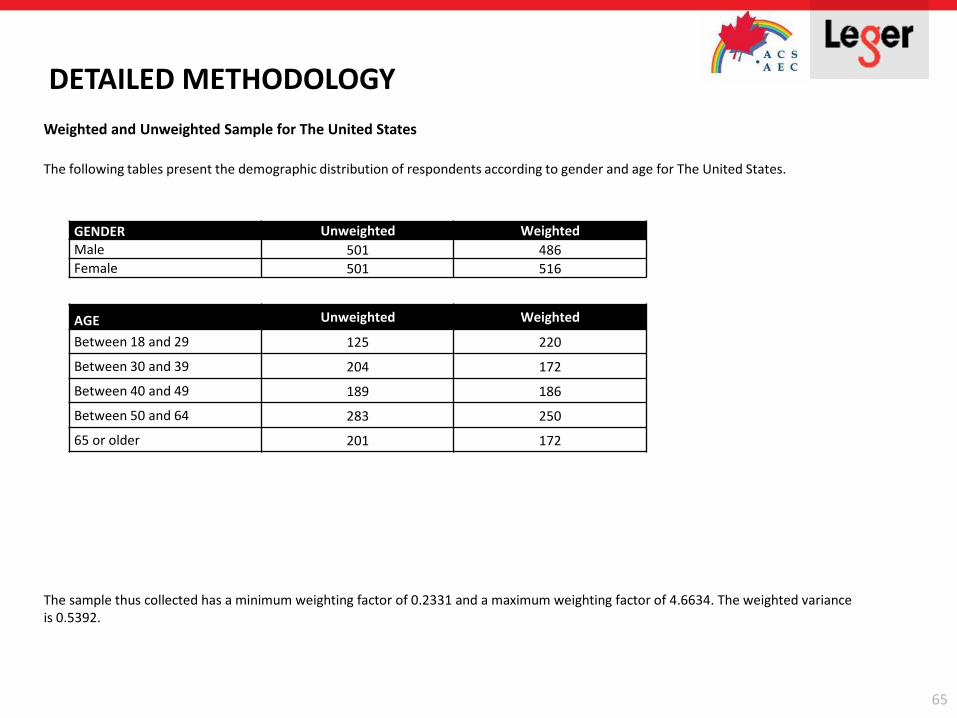
Weighted and Unweighted Sample for The United States
The following tables present the demographic distribution of respondents according to gender and age for The United States.
The sample thus collected has a minimum weighting factor of 0.2331 and a maximum weighting factor of 4.6634. The weighted varianceis 0.5392.
65
GENDER Unweighted Weighted
Male 501 486Female 501 516
AGE Unweighted Weighted
Between 18 and 29 125 220
Between 30 and 39 204 172
Between 40 and 49 189 186
Between 50 and 64 283 250
65 or older 201 172
DETAILED METHODOLOGY

Leger is a member of ESOMAR (European Society for Opinion and
Market Research), the global association of opinion polls and marketing
research professionals. As such, Leger is committed to applying the
international ICC/ESOMAR code of Market, Opinion and Social Research
and Data Analytics.
Leger is also a member of the Insights Association, the American
Association of Marketing Research Analytics.
OUR CREDENTIALS
6666
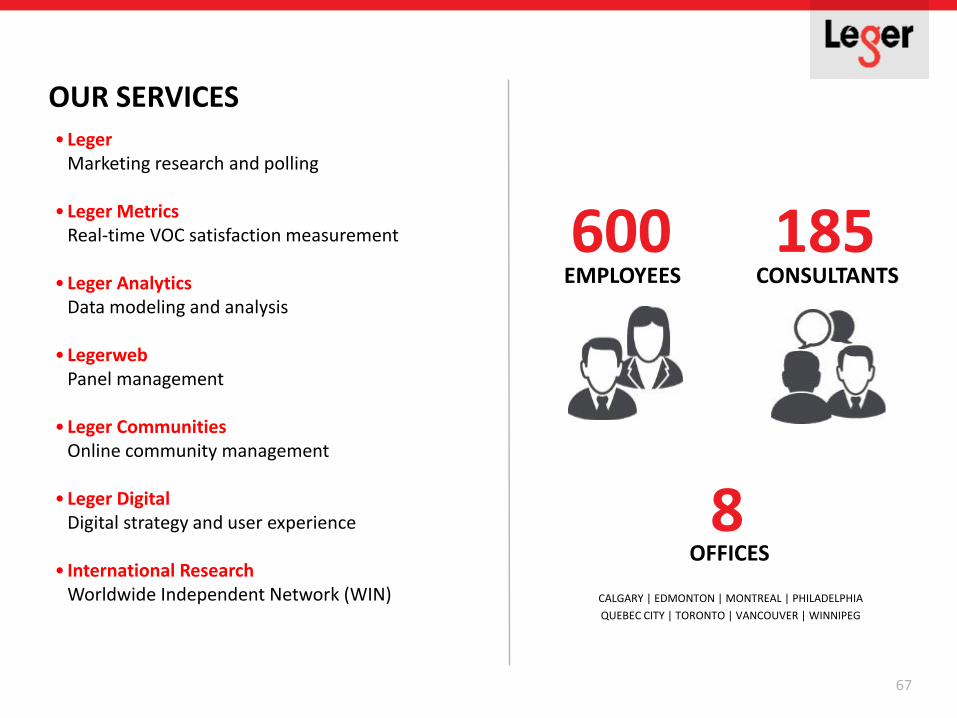
EMPLOYEES CONSULTANTS
600 185
8OFFICES
CALGARY | EDMONTON | MONTREAL | PHILADELPHIA
QUEBEC CITY | TORONTO | VANCOUVER | WINNIPEG
OUR SERVICES• Leger
Marketing research and polling
• Leger MetricsReal-time VOC satisfaction measurement
• Leger AnalyticsData modeling and analysis
• LegerwebPanel management
• Leger CommunitiesOnline community management
• Leger DigitalDigital strategy and user experience
• International ResearchWorldwide Independent Network (WIN)
67