Embed Size (px)
Citation preview
REPORT FOR THE 2ND QUARTER OF 2012
1 August 2012
Page
HIGHLIGHTS
(The corresponding figures for Q - and 1st half 2011 are shown in brackets)
NOCC’s consolidated EBITDA in the quarter was NOK 39.4 million (NOK 26.8 million)
and the consolidated result after tax was NOK -12 million (NOK -1 million). For the
first half 2012 the consolidated EBITDA was NOK 52.0 million (NOK million) and the
consolidated result after tax was NOK -77.4 million (NOK million). The increase in
EBITDA in Q2-2012 is mainly attributable to the addition of the two 6,400 CEU car
carriers “Asian King” and “Asian Emperor” at the end of Q1-2012 which had full P&L
effect from Q2-2012. Non-recurring positive adjustments to charter revenue of NOK 0
million, and NOK million one-off operating and administrative expenses give in total a
negative net impact on EBITDA of NOK 0 million.
During Q2-2012 NOCC refinanced bank debt related to one vessel with a loan amount of
USD 5.0 million. Additionally two vessels were refinanced in early Q3-2012 with an
aggregate loan amount of USD 9.97 million.
On August 30 NOCC took delivery of the large car carrier newbuilding “NOCC Oceanic”,
which subsequently commenced trading under the 12 months time charter concluded in
June 2012. The charter contract is estimated to generate annual EBITDA of approx. NOK
43 million, with full effect from Q4-2012
At the end of August NOCC entered into an agreement for the sale of the 1988 built,
, 0 CEU car carrier “NOCC Caribbean” The sale will generate an estimated book
profit of NOK 2 million including preliminary estimated translation differences according
to IFRS and a net positive liquidity effect of NOK million, which will be booked in Q4-
2012. Delivery of the vessel is scheduled to take place in November 2012.
The charter market for deep sea car carriers remained sound during Q2-2012. In addition
to the fixture of the newbuilding “NOCC Oceanic”, “NOCC Coral” was fixed during Q2-
2012 on a 12 months charter at a charter rate 10% above comparable fixtures during Q4-
2011
Despite macro-economic uncertainties, the outlook for the car carrier market remains
moderately positive. Encouraging developments in the US market, by far the largest
import market, supports shipment volumes, and the fleet growth in the car carrier market
will decline from the second half of 2012 and is expected to remain at low levels through
2013 and into 2014.
Page
FLEET CHANGES, CHARTERING AND OPERATIONS
Fleet changes and vessel ownership As of 30 June 2012, NOCC wholly or partly owned a fleet of 12 vessels in addition to one newbuilding After the delivery of the newbuilding, NOCC’s fleet counts 1 wholly or partly owned vessels at the end of August 2012. During the second quarter of 2012 there were no changes to NOCC’s fleet During Q1-2012 the Company sold one partly owned vessel, redelivered 2 bareboat chartered vessels and took delivery of the two fully owned large PCTCs “Asian Emperor” and “Asian King”
Chartering At the date of this report all vessels, except the partly owned shortsea vessel “Vibeke”, are fully employed on time charters of various durations. In April 2012 a partnership in which NOCC owns 51% entered into a new time charter contract for the shortsea vessel "Vinni" for a period of about 6 months starting in May, at a time charter rate about 10% above the previous charter rate. During the same month NOCC entered into a new time charter contract for the 100% owned vessel "NOCC Coral" for a period of about 12 months. The concluded time charter rate was about 10% higher than comparable fixtures reported in the beginning of 2012. The vessel was delivered to the new charterer in July 2012 and hence there is no P&L effect in Q2-2012 from the increased charter rate. In June 2012 NOCC entered into a time charter contract for the 100% owned large car carrier newbuilding ordered at Hyundai Heavy Industries Co., Ltd. (HHI) for a period of about 12 months. The newbuilding, which has been named "NOCC Oceanic", was delivered from the shipyard 0 August 2012 and will shortly commence trading under the charter . The vessel is estimated to generate NOK ~43.0 million EBITDA during the first year of operation. The three concluded fixtures reflect a stronger charter market for car carriers in the second quarter of 2012 and the market, taking into account normal seasonal variations, has remained steady into the third quarter.
Operations
The operation of NOCC’s fleet in the second quarter of 2012 was satisfactory with an aggregated off-hire limited to 1.8 days. The off-hire relates mainly to “NOCC Atlantic” which went through a scheduled intermediate survey in May 2012. The positive development in operational performance of NOCC’s fleet in 2012 is attributable to an extensive docking program which ended in January 2012 as well as the ongoing fleet renewal.
Page
The off-hire for NOCC’s fleet during the first half of 2012 accumulates to 74.5 days, of which 0.4 days were unscheduled 0 days relates to repairs carried out on “Dyvi Adriatic” and “Dyvi Baltic” in connection with the redelivery under their bareboat charters as well as repairs on “Hyundai 20 ” prior to sale in Q1 “NOCC Kattegat” had a scheduled dry docking carried out and the repositioning represented 41.6 days.
NOCC has no further vessels scheduled for docking in 2012 while three vessels are scheduled for dry docking in 2013.
Administration
NOCC is focused on reducing its administrative expenses. As part of the effort the company is relocating to cost effective offices at Skøyen in December 2012. Further efforts are put into optimizing the organization with emphasis on retaining and build key competence in-house in order to reduce the use of external consultants. The corporate restructuring of NOCC including the discontinuation of the activities in Singapore is coming to an end, which is expected to contribute towards lower administrative expenses going forward.
FINANCING
During the course of Q2-2012 NOCC refinanced the bank facility for the 100% owned vessel “NOCC Coral” The new USD 5.0 million loan is non-amortizing with a bullet repayment upon maturity after 3 years. The refinancing generated a net USD 1.42 million positive liquidity effect at the time of refinancing in Q2-2012 Subsequent to the quarter NOCC has refinanced bank debt for another two vessels. The 100% owned vessel “NOCC Caspian” was refinanced with a new USD 0 million loan on terms identical to that of the “NOCC Coral” mentioned above In addition the USD million bank loan for the “NOCC Caribbean” was refinanced on terms in line with the previous loan arrangements. These two refinancings will generate a USD 2.11 million net positive liquidity effect in Q3-2012 After completing these transactions NOCC has no refinancing requirements until 2015.
Page
RESULTS FOR THE 2ND
QUARTER OF 2012 NORWEGIAN CAR CARRIERS ASA - GROUP
(The corresponding figures for Q - and 1st half 2011 are shown in brackets)
Income statement
NOCC had charter revenues in Q2-2012 of NOK million against NOK million in Q2-2011. The charter revenues in the first half of 2012 was NOK 172.1 million (NOK 181.8 million). The increase in charter revenue in Q2-1012 reflects the addition of the “Asian Emperor” and “Asian King” to the fleet at the end of March 2012 The positive contribution from these two vessels was partly offset by NOCC having two fewer vessels in operation in Q2-2012 (including “Vibeke” in lay-up) compared to the same quarter in 2011. Charter revenues will increase further in Q -2012 following the delivery of “NOCC Oceanic” at the end of August 2012, but the addition of this vessel will only have full P&L effect from Q4-2012
The charter revenues in Q2-2012 included non-recurring positive adjustments to charter earnings in previous quarters of NOK 4.0 million primarily related to reversal of docking accruals.
Total operating expenses in Q2-2012 (including administration expenses and loss on sale of vessels, but excluding depreciation and impairment losses) amounted to NOK 0 1 million (NOK 60. million), while for the six months ended 30 June 2012 the corresponding number was NOK 126.0 million (125.8 million). Non-recurring operating expenses in Q2-2012 amounted to NOK 0 million of which NOK 2.1 million was expenses incurred subsequent to redelivery of the “Dyvi Adriatic” under her bareboat charter in Q1-2012. NOK 0.4 million was expensed in connection with the docking of Hyundai 203 before the sale in January 2012 and NOK 0.5 million relates to late invoicing of owners expenses in connection with a previous charter for “Vinni”.
In Q1 “NOCC Kattegat” was repositioned for its new charter at the expense of NOCC The related cost will be expensed over the term of the charter and NOK 0.8 million has been expensed in Q2, while the remaining cost will be expensed with NOK 0.8 million per quarter in Q3 and Q4 and NOK 0.4 million in Q1-201
Other administrative expenses of NOK 11 0 million (NOK 11 2 million) includes NOK 1 million professional fees incurred in connection with a dispute related to a project that was previously divested.
Earnings before interest, taxes, depreciation and amortization (EBITDA) was NOK million (NOK 2 million) in Q2-2012 For the first half of 2012 EBITDA was NOK 52.0 million (NOK 75.8 million). Due to the addition of the “Asian Emperor” and “Asian King” ordinary depreciation increased to NOK 2 million in Q2-2012 compared to NOK 2 million in the same quarter last year. During the first six months of 2012 ordinary depreciation was NOK 58.0 million (NOK 51.1 million). In Q2-2012 NOK 2 million was ordinary depreciation of vessels, NOK million was depreciation of dry-docking expenses and NOK 1 million was depreciation of surplus value related to the “NOCC Atlantic” charter contract (intangible assets).
Page
The operating result (EBIT) ended at NOK 2 million (NOK 1 million) for the quarter ended 30 June 2012, while for the first half 2012 the EBIT was NOK -90.7 million (NOK 24.8 million).
In Q2-2012 net financial items were NOK -1 .5 million (NOK -1 . million) of which net gain on FX was NOK 3.1 million in Q2-2012 compared to a net loss of NOK -1.6 million in Q2-2011 For the first half of 2012 net financial items were NOK -30.0 million (NOK -29.7 million). Net unrealized losses from financial instruments accounted for NOK - 1 million (NOK -1 million) in Q2-2012, primarily attributable to mark-to-market adjustments of FX contracts.
The result after tax in Q2-2012 amounted to NOK -12 million (NOK -1 million), while for the first half of 2012 the result after tax was NOK -77.4 million (NOK million).
Excluding non-controlling interests the result for shareholders in the quarter was NOK -12 million compared to NOK -1 . million in Q2-2011. The corresponding figure for the first half of 2012 was NOK -67.6 million (NOK -2.3 million).
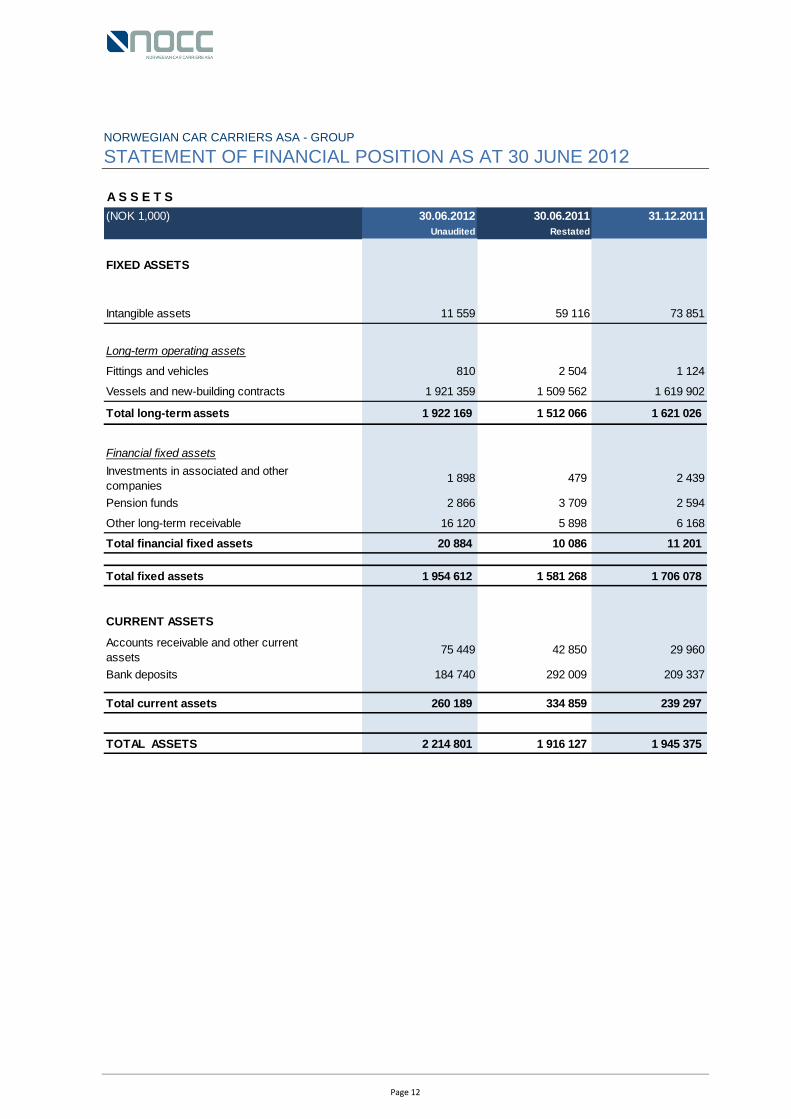
Statement of financial position as at 30 June
Total assets as of 30 June 2012 amounted to NOK 2,21 million against NOK 1, million as of 31 December 2011. Vessels and newbuilding contracts were recorded with a book value of NOK 1, 21 million as of 30 June 2012 against 1, 1 million at the end of 2011. The book value as per end Q2-2012 includes the newbuilding contract with Hyundai Heavy Industries (‘HHI’) with a value of NOK 1 1 million.
Other long-term receivables were NOK 1 1 million at the end of June 2012 of which NOK 12.1 million is related to the long term portion of the sellers credit in connection with the sale of “Hyundai 20 ”. The sellers credit matures in July 2014.
Consolidated cash was NOK 1 . million as of 30 June 2012 compared to NOK 209.4 million as of 31 December 2011.
The book equity including non-controlling interests as of 30 June 2012 was NOK 62 . million against NOK 1 million as of 1 December 2011. The share capital of NOK 36 .0 million includes the proceeds from the private placement in March 2012 and the subsequent share issue in May 2012. The non-controlling interests decreased from NOK 12 million as of 31 December 2011 to NOK 102 million as of 30 June 2012. The decrease in non-controlling interest is primarily attributable to the distribution of cash from partly owned companies, due amongst others to the sale of “Hyundai 20 ” as well as certain impairment charges booked in Q1. Excluding non-controlling interests the book equity was NOK 523.0 million or NOK 2.6 per share as of 30 June 2012. In connection with the private placement in March 2012 the nominal value of the companys share was reduced, as approved at the extraordinary general meeting 13 March 2012 and completed and registered in the Register of Business Enterprises 18 May 2012. Total liabilities as of 30 June 2012 was NOK 1,588.9 million of which NOK 1,330.7 million long-term liabilities and NOK 258.2 million current liabilities. On 31 December 2011 the corresponding figures were NOK 1, . million, of which NOK 1,0 . million long-term liabilities and NOK 259. million current liabilities.
Page
THE CAR CARRIER MARKET
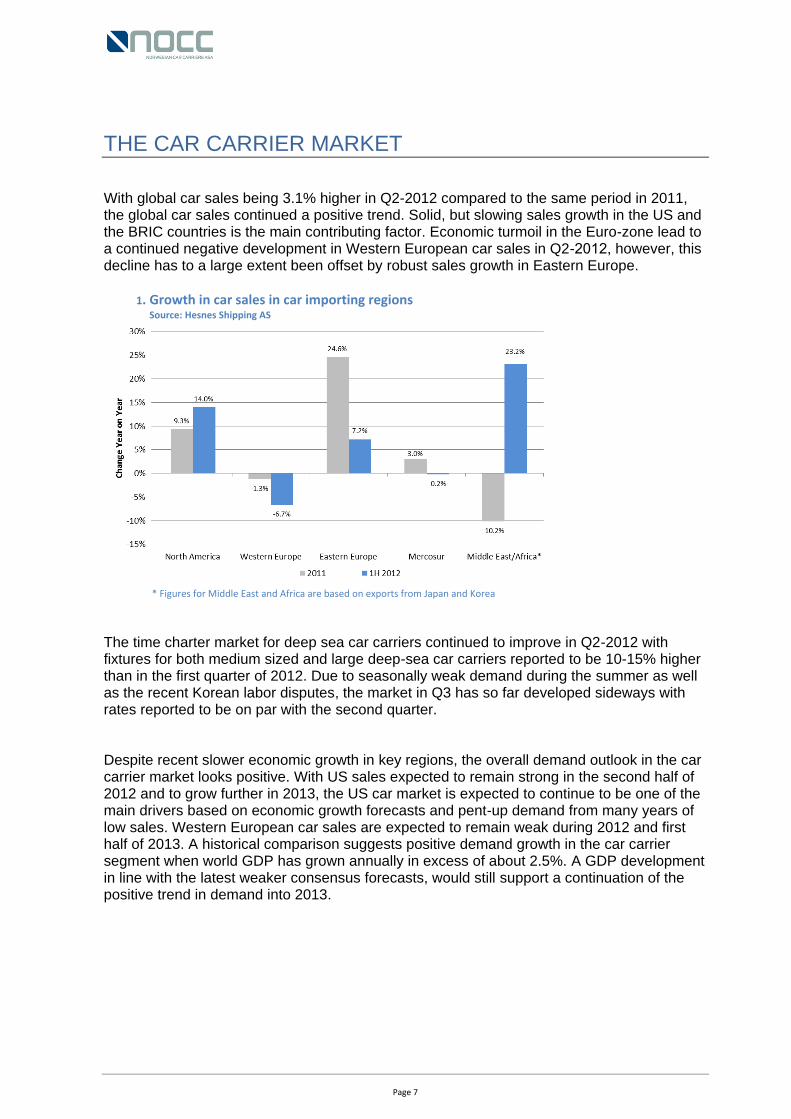
With global car sales being 3.1% higher in Q2-2012 compared to the same period in 2011, the global car sales continued a positive trend. Solid, but slowing sales growth in the US and the BRIC countries is the main contributing factor. Economic turmoil in the Euro-zone lead to a continued negative development in Western European car sales in Q2-2012, however, this decline has to a large extent been offset by robust sales growth in Eastern Europe.
. Growth in car sales in car importing regions Source: Hesnes Shipping AS
* Figures for Middle East and Africa are based on exports from Japan and Korea
The time charter market for deep sea car carriers continued to improve in Q2-2012 with fixtures for both medium sized and large deep-sea car carriers reported to be 10-15% higher than in the first quarter of 2012. Due to seasonally weak demand during the summer as well as the recent Korean labor disputes, the market in Q3 has so far developed sideways with rates reported to be on par with the second quarter. Despite recent slower economic growth in key regions, the overall demand outlook in the car carrier market looks positive. With US sales expected to remain strong in the second half of 2012 and to grow further in 2013, the US car market is expected to continue to be one of the main drivers based on economic growth forecasts and pent-up demand from many years of low sales. Western European car sales are expected to remain weak during 2012 and first half of 2013. A historical comparison suggests positive demand growth in the car carrier segment when world GDP has grown annually in excess of about 2.5%. A GDP development in line with the latest weaker consensus forecasts, would still support a continuation of the positive trend in demand into 2013.
Page
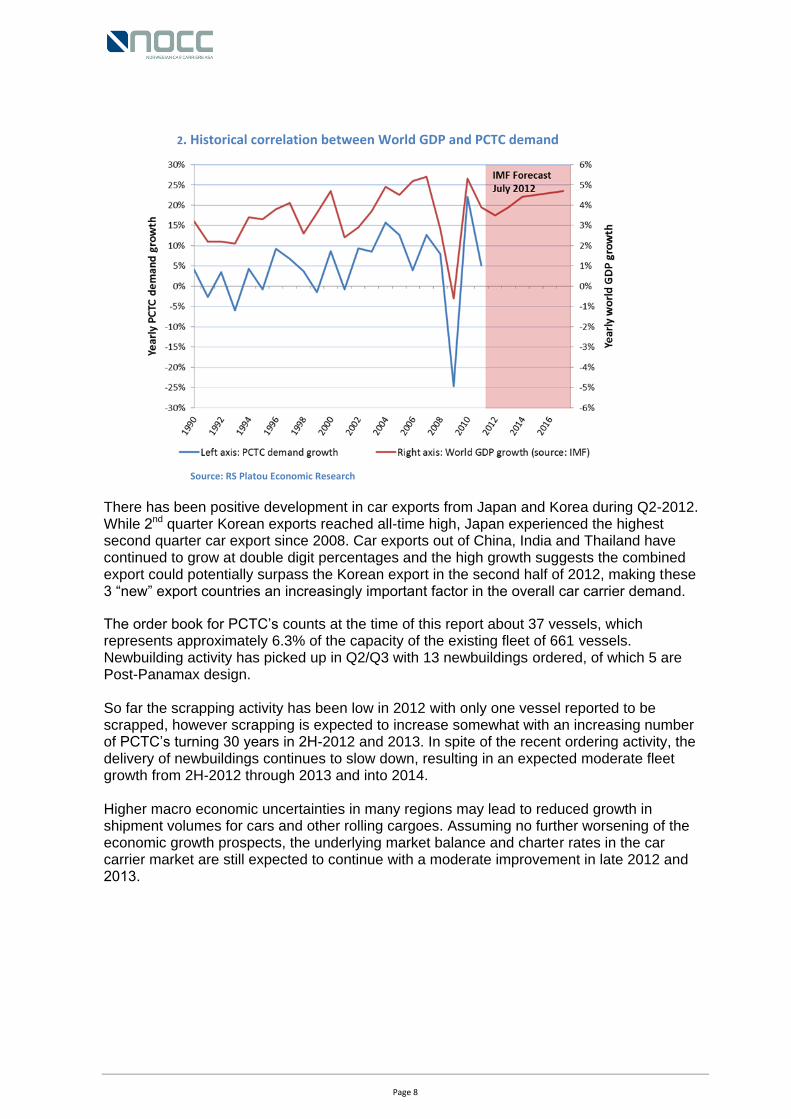
. Historical correlation between World GDP and PCTC demand
Source: RS Platou Economic Research
There has been positive development in car exports from Japan and Korea during Q2-2012. While 2nd quarter Korean exports reached all-time high, Japan experienced the highest second quarter car export since 2008. Car exports out of China, India and Thailand have continued to grow at double digit percentages and the high growth suggests the combined export could potentially surpass the Korean export in the second half of 2012, making these “new” export countries an increasingly important factor in the overall car carrier demand
The order book for PCTC’s counts at the time of this report about 37 vessels, which represents approximately 6.3% of the capacity of the existing fleet of 661 vessels. Newbuilding activity has picked up in Q2/Q3 with 13 newbuildings ordered, of which 5 are Post-Panamax design. So far the scrapping activity has been low in 2012 with only one vessel reported to be scrapped, however scrapping is expected to increase somewhat with an increasing number of PCTC’s turning 0 years in 2H-2012 and 2013. In spite of the recent ordering activity, the delivery of newbuildings continues to slow down, resulting in an expected moderate fleet growth from 2H-2012 through 2013 and into 2014. Higher macro economic uncertainties in many regions may lead to reduced growth in shipment volumes for cars and other rolling cargoes. Assuming no further worsening of the economic growth prospects, the underlying market balance and charter rates in the car carrier market are still expected to continue with a moderate improvement in late 2012 and 201
Page
PROSPECTS
NOCC’s financial performance is expected to continue to improve in Q -2012 and Q4-2012 The new charter on “NOCC Coral” which commenced in July 2012 will have positive impact on the results in Q3-2012. In addition the addition of the newbuilding “NOCC Oceanic”, with full effect from 4Q-2012, will contribute significantly towards turning NOCC into profitability.
Most of NOCC’s fleet is booked until Q -2012 and vessels coming off charters at the end of 2012 and in 2013 are expected to be fixed at higher levels than the current charter rates. The growth in the earnings and the improvement in NOCC’s profitability may be negatively impacted by a weaker than previously expected world economic development.
Page
NORWEGIAN CAR CARRIERS ASA - GROUP
INCOME STATEMENT
(NOK 1,000) Q2 2012 Q2 2011 1.1 - 30.6 2012 1.1 - 30.6 2011 2011
Unaudited Restated Unaudited Restated Audited
OPERATING REVENUES
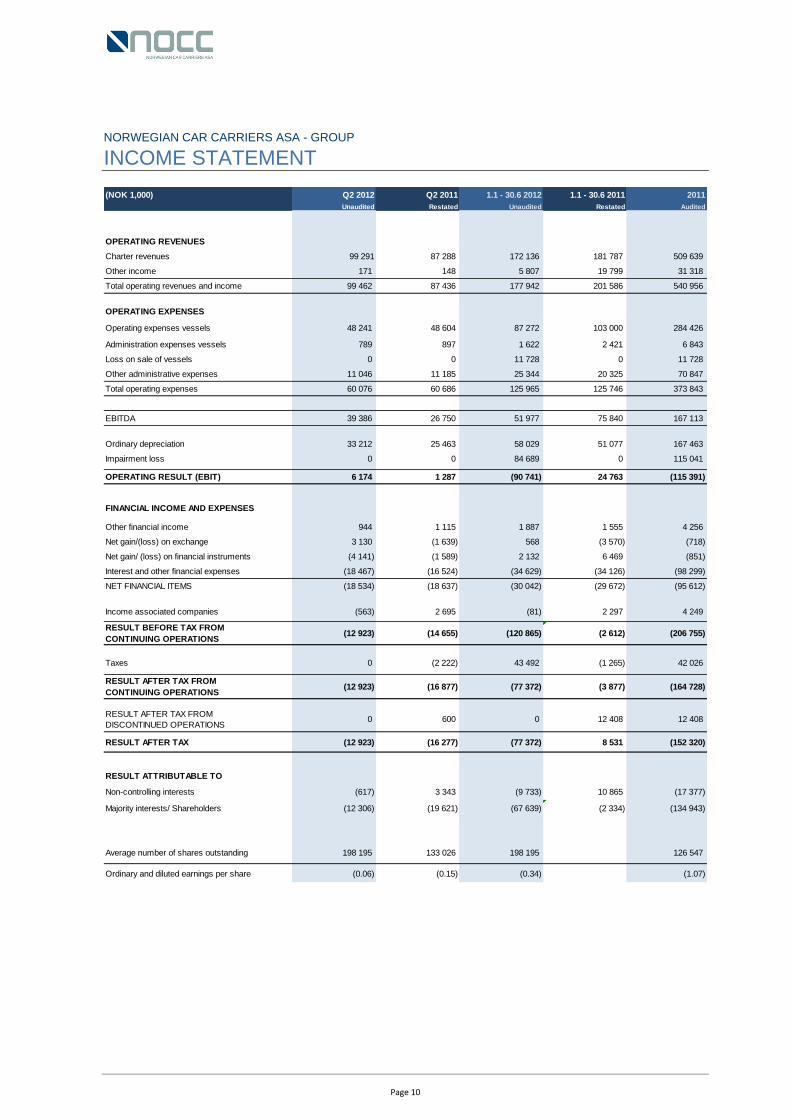
Charter revenues 99 291 87 288 172 136 181 787 509 639
Other income 171 148 5 807 19 799 31 318
Total operating revenues and income 99 462 87 436 177 942 201 586 540 956
OPERATING EXPENSES
Operating expenses vessels 48 241 48 604 87 272 103 000 284 426
Administration expenses vessels 789 897 1 622 2 421 6 843
Loss on sale of vessels 0 0 11 728 0 11 728
Other administrative expenses 11 046 11 185 25 344 20 325 70 847
Total operating expenses 60 076 60 686 125 965 125 746 373 843
EBITDA 39 386 26 750 51 977 75 840 167 113
Ordinary depreciation 33 212 25 463 58 029 51 077 167 463
Impairment loss 0 0 84 689 0 115 041
OPERATING RESULT (EBIT) 6 174 1 287 (90 741) 24 763 (115 391)
FINANCIAL INCOME AND EXPENSES
Other financial income 944 1 115 1 887 1 555 4 256
Net gain/(loss) on exchange 3 130 (1 639) 568 (3 570) (718)
Net gain/ (loss) on financial instruments (4 141) (1 589) 2 132 6 469 (851)
Interest and other financial expenses (18 467) (16 524) (34 629) (34 126) (98 299)
NET FINANCIAL ITEMS (18 534) (18 637) (30 042) (29 672) (95 612)
Income associated companies (563) 2 695 (81) 2 297 4 249
RESULT BEFORE TAX FROM
CONTINUING OPERATIONS(12 923) (14 655) (120 865) (2 612) (206 755)
Taxes 0 (2 222) 43 492 (1 265) 42 026
RESULT AFTER TAX FROM
CONTINUING OPERATIONS(12 923) (16 877) (77 372) (3 877) (164 728)
RESULT AFTER TAX FROM
DISCONTINUED OPERATIONS0 600 0 12 408 12 408
RESULT AFTER TAX (12 923) (16 277) (77 372) 8 531 (152 320)
RESULT ATTRIBUTABLE TO
Non-controlling interests (617) 3 343 (9 733) 10 865 (17 377)
Majority interests/ Shareholders (12 306) (19 621) (67 639) (2 334) (134 943)
Average number of shares outstanding 198 195 133 026 198 195 126 547
Ordinary and diluted earnings per share (0.06) (0.15) (0.34) (1.07)
Page
NORWEGIAN CAR CARRIERS ASA - GROUP
STATEMENT OF COMPREHENSIVE INCOME
(NOK 1,000) Q2 2012 Q2 2011 1.1 - 30.6 2012 1.1 - 30.6 2011 2011
Unaudited Restated Unaudited Restated
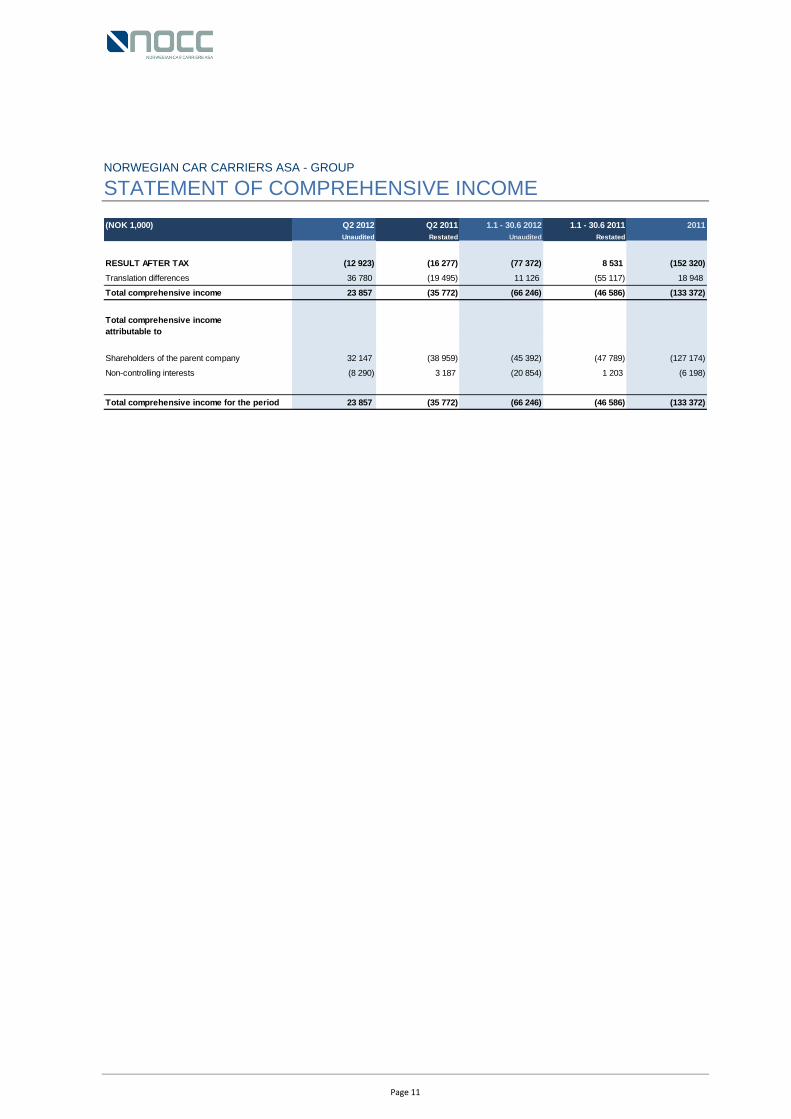
RESULT AFTER TAX (12 923) (16 277) (77 372) 8 531 (152 320)
Translation differences 36 780 (19 495) 11 126 (55 117) 18 948
Total comprehensive income 23 857 (35 772) (66 246) (46 586) (133 372)
Total comprehensive income
attributable to
Shareholders of the parent company 32 147 (38 959) (45 392) (47 789) (127 174)
Non-controlling interests (8 290) 3 187 (20 854) 1 203 (6 198)
Total comprehensive income for the period 23 857 (35 772) (66 246) (46 586) (133 372)
Page
NORWEGIAN CAR CARRIERS ASA - GROUP
STATEMENT OF FINANCIAL POSITION AS AT 30 JUNE 2012
A S S E T S
(NOK 1,000) 30.06.2012 30.06.2011 31.12.2011
Unaudited Restated
FIXED ASSETS
Intangible assets 11 559 59 116 73 851
Long-term operating assets
Fittings and vehicles 810 2 504 1 124
Vessels and new-building contracts 1 921 359 1 509 562 1 619 902
Total long-term assets 1 922 169 1 512 066 1 621 026
Financial fixed assets
Investments in associated and other
companies1 898 479 2 439
Pension funds 2 866 3 709 2 594
Other long-term receivable 16 120 5 898 6 168
Total financial fixed assets 20 884 10 086 11 201
Total fixed assets 1 954 612 1 581 268 1 706 078
CURRENT ASSETS
Accounts receivable and other current
assets75 449 42 850 29 960
Bank deposits 184 740 292 009 209 337
Total current assets 260 189 334 859 239 297
TOTAL ASSETS 2 214 801 1 916 127 1 945 375
Page
NORWEGIAN CAR CARRIERS ASA - GROUP
STATEMENT OF FINANCIAL POSITION AS AT 30 JUNE 2012
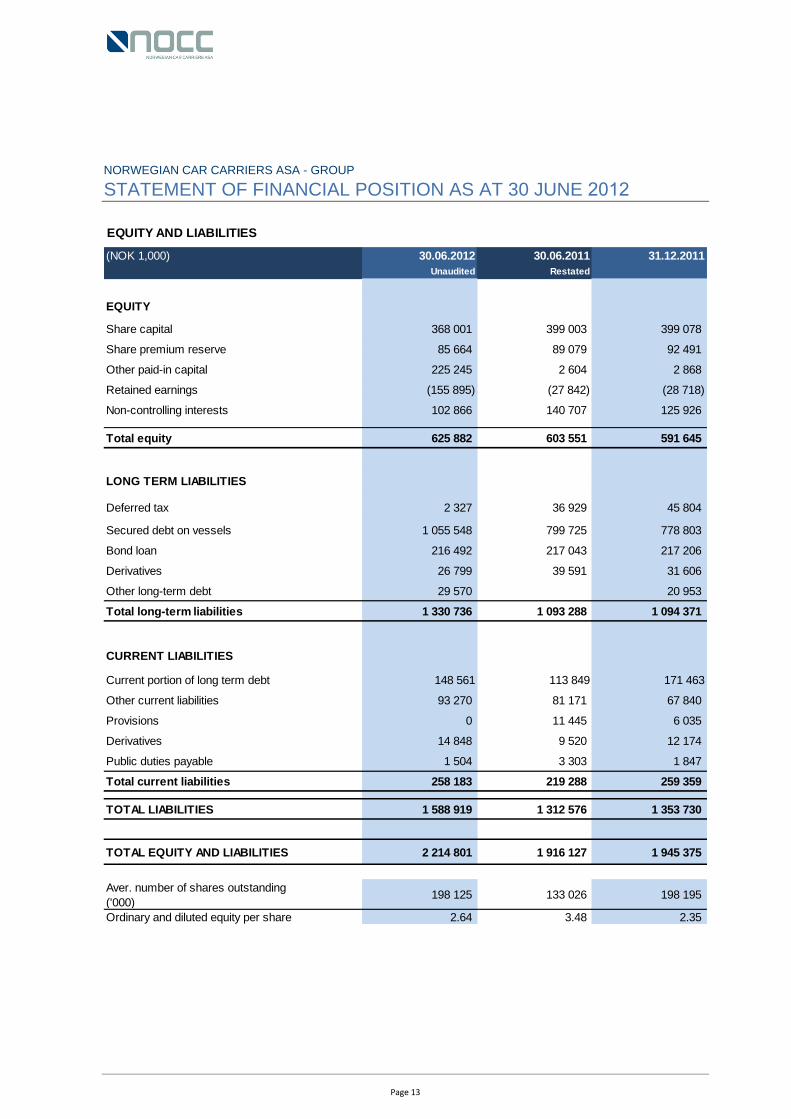
EQUITY AND LIABILITIES
(NOK 1,000) 30.06.2012 30.06.2011 31.12.2011
Unaudited Restated
EQUITY
Share capital 368 001 399 003 399 078
Share premium reserve 85 664 89 079 92 491
Other paid-in capital 225 245 2 604 2 868
Retained earnings (155 895) (27 842) (28 718)
Non-controlling interests 102 866 140 707 125 926
Total equity 625 882 603 551 591 645
LONG TERM LIABILITIES
Deferred tax 2 327 36 929 45 804
Secured debt on vessels 1 055 548 799 725 778 803
Bond loan 216 492 217 043 217 206
Derivatives 26 799 39 591 31 606
Other long-term debt 29 570 20 953
Total long-term liabilities 1 330 736 1 093 288 1 094 371
CURRENT LIABILITIES
Current portion of long term debt 148 561 113 849 171 463
Other current liabilities 93 270 81 171 67 840
Provisions 0 11 445 6 035
Derivatives 14 848 9 520 12 174
Public duties payable 1 504 3 303 1 847
Total current liabilities 258 183 219 288 259 359
TOTAL LIABILITIES 1 588 919 1 312 576 1 353 730
TOTAL EQUITY AND LIABILITIES 2 214 801 1 916 127 1 945 375
Aver. number of shares outstanding
('000)198 125 133 026 198 195
Ordinary and diluted equity per share 2.64 3.48 2.35

Page
NORWEGIAN CAR CARRIERS ASA - GROUP
CONDENSED STATEMENT OF CASH FLOWS
NORWEGIAN CAR CARRIERS ASA - GROUP
CONDENSED STATEMENT OF EQUITY
(NOK 1.000) 1.04.-30.06.2012 1.04.-30.06.2011 1.01.-30.06.2012 1.01.-30.06.2011 31/12/2011
Unaudited Unaudited Unaudited Unaudited
Cash flow from operating activities 47,698 27,131 31,571 37,704 85,696
Interest paid (7,791) (9,544) (37,908) (29,407) (72,906)
Total cash flow from operations 39,907 17,587 (6,337) 8,297 12,790
Cash flow from investments (16,193) (83,775) (367,983) (42,303) (94,758)
Cash-flow from financial activities (19,447) (31,050) 349,156 26,055 (37,540)
Change in cash 4,267 (97,238) (25,164) (7,951) (119,508)
Bank deposits at start of period 177,250 390,518 209,337 303,664 303,664
Cash from purchase of subsidiary 0 0 0 24,242
Net gain/loss on exchange 3,224 (1,271) 568 (3,704) 939
Bank deposits at end of period 184,741 292,009 184,741 292,009 209,337
(NOK 1.000) 30.06.2012 30.06.2011 31.12.2011
Unaudited Restated
Total equity and non-controlling interest int. outgoing balance (625 882) (603 551) (591 645)
Total equity and non-controlling interest int. ingoing balance (591 645) (482 042) (482 042)
Change in the period 34 237 121 509 109 603
Restated estimation adjustment 0 (16 619) 0
Comprehensive income/(loss) of the
period(66 246) (35 772) (56 000)
Issue of shares 121 903 124 997 124 997
Incorporation and issue cost (6 827) (5 047) (4 036)
Options to employees (326) 340 916
Other equity changes 0 0 3 373
Effect of associated company to
subsidiary0 58 081 78 360
Purchase of non-controlling interest
interest(775) 0 (3 647)
Paid in from non-controlling interest 1 965 0 3 852
Dividend to non-controlling interest (15 457) (4 471) (38 212)
Reconciliation of change in the period 34 237 121 509 109 603
Page
NOTES TO THE INTERIM REPORT
Note 1 Accounting
PrinciplesThis consolidated interim financial report has been prepared in accordance with International Accounting Standards (IAS 34),
"Interim Financial Reporting". The interim financial statements are unaudited. The consolidated interim financial reporting should
be read in conjunction with the annual financial statements for the year 2011 for Norwegian Car Carriers ASA Group (NOCC),
which have been prepared in accordance with IFRS as endorsed by the EU. The accounting policies implemented are consistent
with those of the annual financial statements for NOCC for the year ended 31 December 2011.
Note 2 Newbuilding contract
The book value of the newbuilding contract ordered at Hyundai Heavy Industries Co Ltd amounts to NOK 136,095 million as
of 30 June 2012. Remaining payment obligations under the newbuilding contract amounts to NOK 280.2 million with a NOK/USD
exchange rates as per 30 June 2012. The remaining payment obligations will be funded with a NOK 276.4 million bank debt.
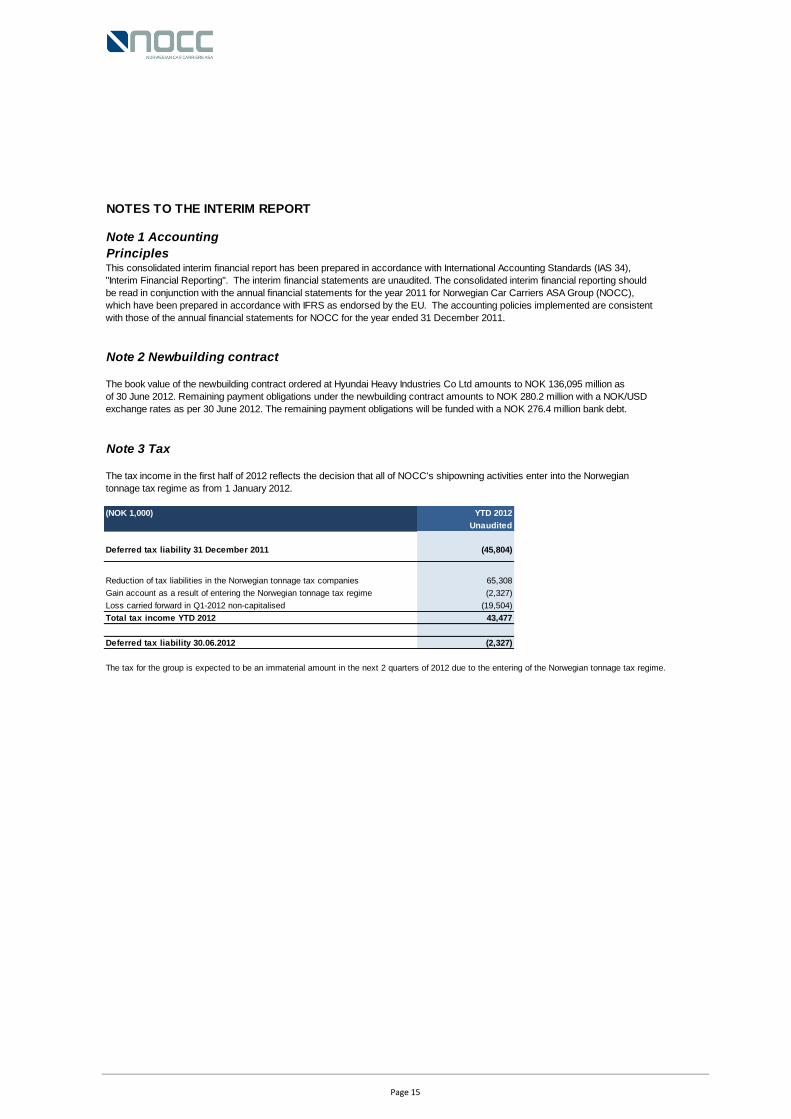
Note 3 Tax
The tax income in the first half of 2012 reflects the decision that all of NOCC's shipowning activities enter into the Norwegian
tonnage tax regime as from 1 January 2012.
(NOK 1,000) YTD 2012
Unaudited
Deferred tax liability 31 December 2011 (45,804)
Reduction of tax liabilities in the Norwegian tonnage tax companies 65,308
Gain account as a result of entering the Norwegian tonnage tax regime (2,327)
Loss carried forward in Q1-2012 non-capitalised (19,504)
Total tax income YTD 2012 43,477
Deferred tax liability 30.06.2012 (2,327)
The tax for the group is expected to be an immaterial amount in the next 2 quarters of 2012 due to the entering of the Norwegian tonnage tax regime.
Page
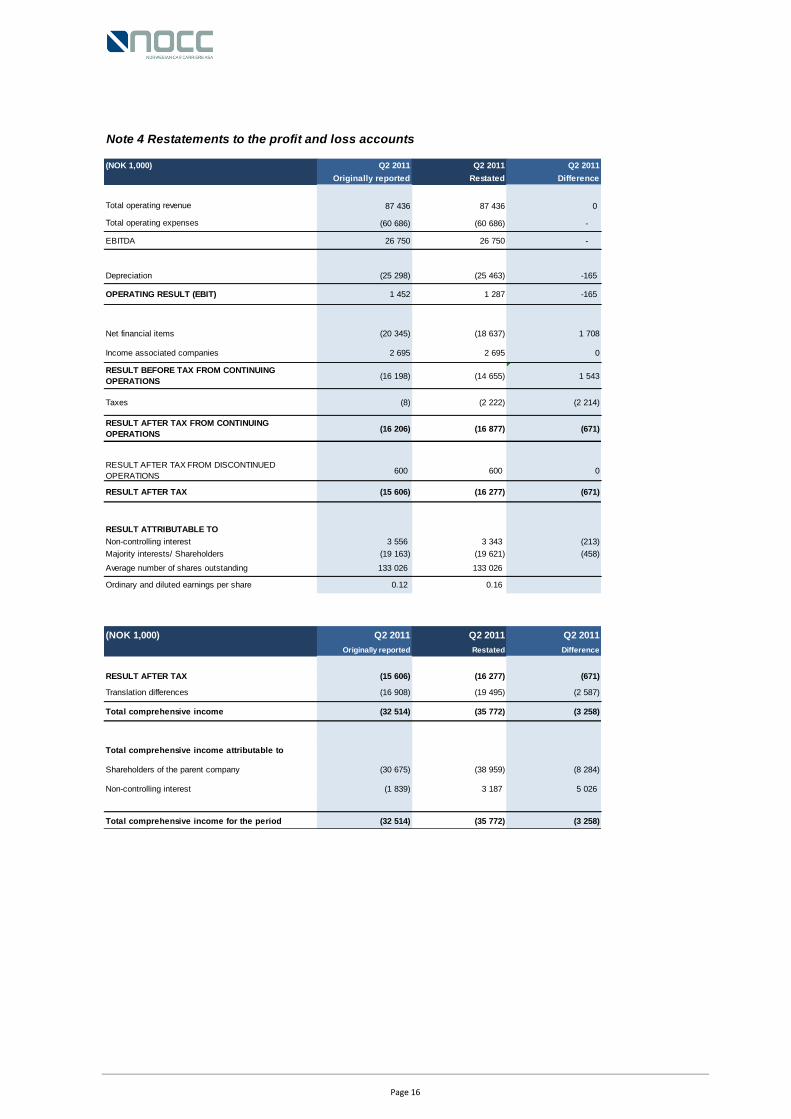
Note 4 Restatements to the profit and loss accounts
(NOK 1,000) Q2 2011 Q2 2011 Q2 2011
Originally reported Restated Difference
87 436 87 436 0
(60 686) (60 686) -
EBITDA 26 750 26 750 -
Depreciation (25 298) (25 463) -165
1 452 1 287 -165
Net financial items (20 345) (18 637) 1 708
2 695 2 695 0
(16 198) (14 655) 1 543
Taxes (8) (2 222) (2 214)
(16 206) (16 877) (671)
600 600 0
RESULT AFTER TAX (15 606) (16 277) (671)
RESULT ATTRIBUTABLE TO
Non-controlling interest 3 556 3 343 (213)
Majority interests/ Shareholders (19 163) (19 621) (458)
133 026 133 026
Ordinary and diluted earnings per share 0.12 0.16
(NOK 1,000) Q2 2011 Q2 2011 Q2 2011
Originally reported Restated Difference
RESULT AFTER TAX (15 606) (16 277) (671)
(16 908) (19 495) (2 587)
Total comprehensive income (32 514) (35 772) (3 258)
(30 675) (38 959) (8 284)
Non-controlling interest (1 839) 3 187 5 026
Total comprehensive income for the period (32 514) (35 772) (3 258)
Total operating revenue
Total operating expenses
Translation differences
Total comprehensive income attributable to
Shareholders of the parent company
OPERATING RESULT (EBIT)
Income associated companies
RESULT BEFORE TAX FROM CONTINUING
OPERATIONS
RESULT AFTER TAX FROM CONTINUING
OPERATIONS
RESULT AFTER TAX FROM DISCONTINUED
OPERATIONS
Average number of shares outstanding
Page
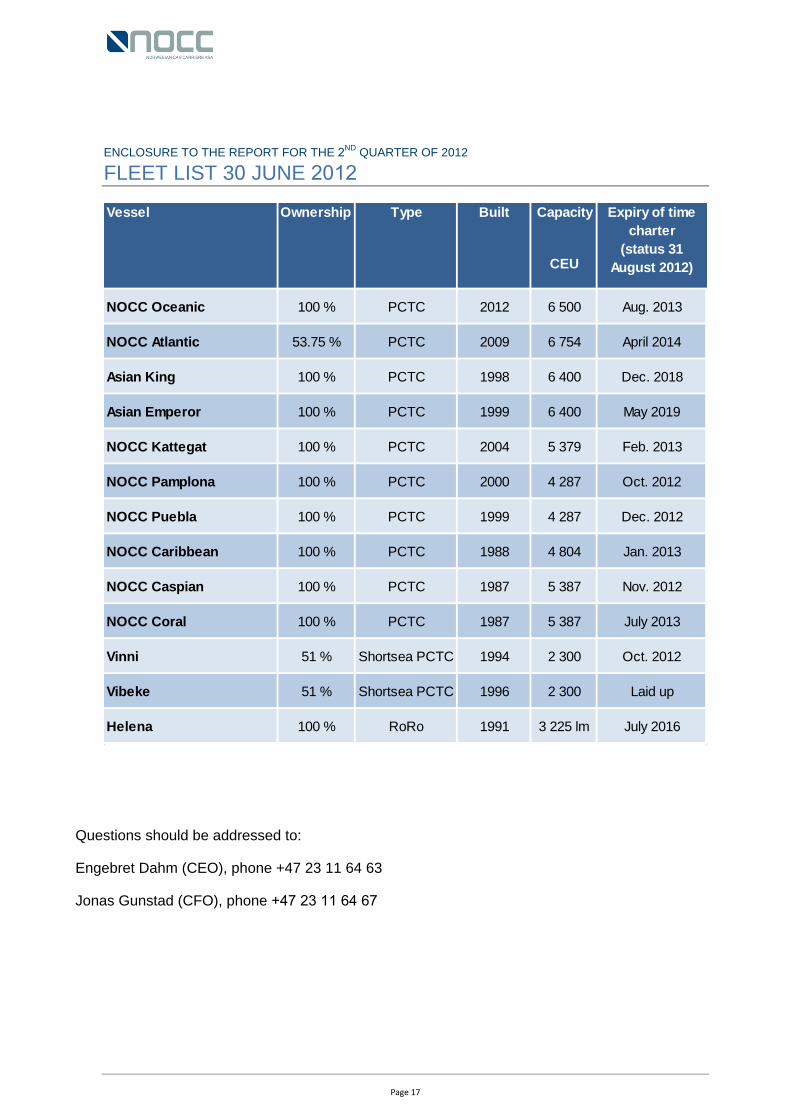
ENCLOSURE TO THE REPORT FOR THE 2ND
QUARTER OF 2012
FLEET LIST 30 JUNE 2012
Questions should be addressed to:
Engebret Dahm (CEO), phone +47 23 11 64 63
Jonas Gunstad (CFO), phone 2 11
Vessel Ownership Type Built Capacity
CEU
NOCC Oceanic 100 % PCTC 2012 6 500 Aug. 2013
NOCC Atlantic 53.75 % PCTC 2009 6 754 April 2014
Asian King 100 % PCTC 1998 6 400 Dec. 2018
Asian Emperor 100 % PCTC 1999 6 400 May 2019
NOCC Kattegat 100 % PCTC 2004 5 379 Feb. 2013
NOCC Pamplona 100 % PCTC 2000 4 287 Oct. 2012
NOCC Puebla 100 % PCTC 1999 4 287 Dec. 2012
NOCC Caribbean 100 % PCTC 1988 4 804 Jan. 2013
NOCC Caspian 100 % PCTC 1987 5 387 Nov. 2012
NOCC Coral 100 % PCTC 1987 5 387 July 2013
Vinni 51 % Shortsea PCTC 1994 2 300 Oct. 2012
Vibeke 51 % Shortsea PCTC 1996 2 300 Laid up
Helena 100 % RoRo 1991 3 225 lm July 2016
Expiry of time
charter
(status 31
August 2012)
Page