Embed Size (px)
Citation preview

Standard Form 298 (Rev 8/98) Prescribed by ANSI Std. Z39.18
Final Report
W911NF-12-1-0161
59129-EG.10
973-596-5751
a. REPORT
14. ABSTRACT
16. SECURITY CLASSIFICATION OF:
This work followed our previous study characterizing ignition of pure metal powders by electrostatic discharge. Here, the experiments are extended to reactive nanocomposite materials, including several thermite compositions prepared by different methods. All experiments used a high voltage spark to ignite materials; optical emission and pressure generated by combustion were monitored in real time. Experiments showed that ignition event for all materials can be described using two stages. First, a fraction of the powder struck by the spark is ignited directly and lifted from the sample holder by a weak shockwave generated by the discharge. This prompt ignition occurs
1. REPORT DATE (DD-MM-YYYY)
4. TITLE AND SUBTITLE
13. SUPPLEMENTARY NOTES
12. DISTRIBUTION AVAILIBILITY STATEMENT
6. AUTHORS
7. PERFORMING ORGANIZATION NAMES AND ADDRESSES
15. SUBJECT TERMS
b. ABSTRACT
2. REPORT TYPE
17. LIMITATION OF ABSTRACT
15. NUMBER OF PAGES
5d. PROJECT NUMBER
5e. TASK NUMBER
5f. WORK UNIT NUMBER
5c. PROGRAM ELEMENT NUMBER
5b. GRANT NUMBER
5a. CONTRACT NUMBER
Form Approved OMB NO. 0704-0188
3. DATES COVERED (From - To)-
Approved for Public Release; Distribution Unlimited
UU UU UU UU
16-03-2016 1-Jun-2012 29-Feb-2016
Final Report: Electro-Static Discharge (ESD) Sensitivity of Reactive Powders and Its Mitigation
The views, opinions and/or findings contained in this report are those of the author(s) and should not contrued as an official Department of the Army position, policy or decision, unless so designated by other documentation.
9. SPONSORING/MONITORING AGENCY NAME(S) AND ADDRESS(ES)
U.S. Army Research Office P.O. Box 12211 Research Triangle Park, NC 27709-2211
reactive materials, nanothermites, ignition sensitivity, reaction rates, ignition mechanism
REPORT DOCUMENTATION PAGE
11. SPONSOR/MONITOR'S REPORT NUMBER(S)
10. SPONSOR/MONITOR'S ACRONYM(S) ARO
8. PERFORMING ORGANIZATION REPORT NUMBER
19a. NAME OF RESPONSIBLE PERSON
19b. TELEPHONE NUMBEREdward Dreizin
Rayon Williams, Ian Monk, Edward L. Dreizin
611102
c. THIS PAGE
The public reporting burden for this collection of information is estimated to average 1 hour per response, including the time for reviewing instructions, searching existing data sources, gathering and maintaining the data needed, and completing and reviewing the collection of information. Send comments regarding this burden estimate or any other aspect of this collection of information, including suggesstions for reducing this burden, to Washington Headquarters Services, Directorate for Information Operations and Reports, 1215 Jefferson Davis Highway, Suite 1204, Arlington VA, 22202-4302. Respondents should be aware that notwithstanding any other provision of law, no person shall be subject to any oenalty for failing to comply with a collection of information if it does not display a currently valid OMB control number.PLEASE DO NOT RETURN YOUR FORM TO THE ABOVE ADDRESS.
New Jersey Institute of TechnologyUniversity Heights
Newark, NJ 07102 -1982

ABSTRACT
Final Report: Electro-Static Discharge (ESD) Sensitivity of Reactive Powders and Its Mitigation
Report Title
This work followed our previous study characterizing ignition of pure metal powders by electrostatic discharge. Here, the experiments are extended to reactive nanocomposite materials, including several thermite compositions prepared by different methods. All experiments used a high voltage spark to ignite materials; optical emission and pressure generated by combustion were monitored in real time. Experiments showed that ignition event for all materials can be described using two stages. First, a fraction of the powder struck by the spark is ignited directly and lifted from the sample holder by a weak shockwave generated by the discharge. This prompt ignition occurs within hundreds of microseconds. The promptly ignited particles are lifted along with particles that are not ignited. Flame propagation through a cloud of lifted particles occurs on the time scale of 1 - 10 ms and is registered as the second, delayed ignition stage. The structure of the reactive material affects critically the ignition and ensuing combustion rates. For fully-dense powders prepared by arrested reactive milling, heterogeneous reactions between components are important in all stages of combustion. Such materials perform best in oxygen depleted environments. For mixed nanopowders, reaction with surrounding oxidizer is important.

(a) Papers published in peer-reviewed journals (N/A for none)
Enter List of papers submitted or published that acknowledge ARO support from the start of the project to the date of this printing. List the papers, including journal references, in the following categories:
07/03/2012
07/16/2015
07/16/2015
08/04/2014
08/04/2014
08/04/2014
08/04/2014
08/13/2013
08/13/2013
Received Paper
1.00
8.00
9.00
4.00
5.00
6.00
7.00
2.00
3.00
E. Beloni, E. L. Dreizin. Model of heating and ignition of conductive polydisperse powder in electrostatic discharge, Combustion Theory and Modelling, (07 2012): 1. doi: 10.1080/13647830.2012.689010
Ian Monk, Rayon Williams, Xinhang Liu, Edward L. Dreizin. Electro-Static Discharge Ignition of Monolayers of Nanocomposite Thermite Powders Prepared by Arrested Reactive Milling, Combustion Science and Technology, (04 2015): 0. doi: 10.1080/00102202.2015.1035373
Rayon A. Williams, Mirko Schoenitz, Alexandre Ermoline, Edward L. Dreizin. Low-temperature exothermic reactions in fully-dense Al/MoO3 nanocomposite powders, Thermochimica Acta, (10 2014): 0. doi: 10.1016/j.tca.2014.08.026
Rayon A. Williams, Mirko Schoenitz, Edward L. Dreizin. Validation of the Thermal Oxidation Model for Al/CuO Nanocomposite Powder, Combustion Science and Technology, (01 2014): 0. doi: 10.1080/00102202.2013.846330
Jaymin V. Patel, Edward L. Dreizin, Rayon A. Williams. Ignition of Fully Dense Nanocomposite Thermite Powders by an Electric Spark, Journal of Propulsion and Power, (05 2014): 0. doi: 10.2514/1.B35073
W L Shaw, R A Williams, E L Dreizin, D D Dlott. Using laser-driven flyer plates to study the shock initiation of nanoenergetic materials, Journal of Physics: Conference Series, (05 2014): 0. doi: 10.1088/1742-6596/500/18/182010
William L. Shaw, Dana D. Dlott, Rayon A. Williams, Edward L. Dreizin. Ignition of Nanocomposite Thermites by Electric Spark and Shock Wave, Propellants, Explosives, Pyrotechnics, (06 2014): 0. doi: 10.1002/prep.201400027
Rayon A. Williams, Jaymin V. Patel, Alexandre Ermoline, Mirko Schoenitz, Edward L. Dreizin. Correlation of optical emission and pressure generated upon ignition of fully-dense nanocomposite thermite powders, Combustion and Flame, (03 2013): 734. doi: 10.1016/j.combustflame.2012.11.021
Rayon A. Williams, Mirko Schoenitz, Alexandre Ermoline, Edward L. Dreizin. ON GAS RELEASE BY THERMALLY-INITIATED FULLY-DENSE 2Al·3CuO NANOCOMPOSITE POWDER, International Journal of Energetic Materials and Chemical Propulsion, (03 2012): 275. doi: 10.1615/IntJEnergeticMaterialsChemProp.2013005606
TOTAL: 9

Number of Papers published in peer-reviewed journals:
Number of Papers published in non peer-reviewed journals:
9.00
(b) Papers published in non-peer-reviewed journals (N/A for none)
Monk, I., Dreizin, E.L., Combustion Regimes for Spark Ignited Nanocomposite Thermites 2015 AIChE Annual Meeting. Salt Lake City, UT November 16-21, 2015 Monk, I., Williams, R., Dreizin, E.L., Spark Ignition of Nanocomposite Thermites. MRS Fall Meeting, Boston MA, December 2014 Monk, I., Williams, R., Dreizin, E.L., Spark Ignition of Nanocomposite Thermites at Varying Conditions. Paper 644f, 2014 AIChE Annual Meeting. Atlanta, GA November 16-21, 2014 Dreizin, E.L., Williams, R., Schoenitz, M., Ermoline, A. Low-Temperature Exothermic Reactions in Fully-Dense Al/MoO3 Nanocomposite Powders. Paper 742g, 2014 AIChE Annual Meeting. Atlanta, GA November 16-21, 2014 Williams, R.A., Monk, I., Liu, X., Schoenitz, M., Dreizin, E.L., Correlating ignition mechanisms of reactive materials with thermoanalytical measurements. HITEMP 2014, Santa Fe, NM September 19, 2014 Williams, R.A., Monk, I., Liu X., Dreizin, E.L., ESD Sensitivity of Reactive Powders and its Mitigation. 2014 Triservice Basic Science Energetic Materials Program Review. Arlington VA, September 15, 2014 Williams R.A., Monk, I., Liu, X., Schoenitz, M., Dreizin, E. L., Ignition of nanocomposite thermites prepared by Arrested Reactive Milling. Iowa State University, College of Engineering, Department of Mechanical Engineering, Ames, Iowa, September 2, 2014. Monk, I., Williams, R., Liu, X., Hossain, N., Dreizin E.L., Ignition of nanocomposite thermites by electro-static discharge. Gordon Research Conference on Energetic Materials, Newry, ME, June 16, 2014 Williams, R., Dreizin E.L., Low-Temperature Exothermic Reactions in Fully-dense Al/MoO3 n-Thermite Powders. Gordon Research Conference on Energetic Materials, Newry, ME, June 16, 2014
(c) Presentations
Number of Presentations:
Non Peer-Reviewed Conference Proceeding publications (other than abstracts):
Received Paper
TOTAL:
Received Paper
TOTAL:

Number of Non Peer-Reviewed Conference Proceeding publications (other than abstracts):
Peer-Reviewed Conference Proceeding publications (other than abstracts):
Number of Peer-Reviewed Conference Proceeding publications (other than abstracts):
Books
Number of Manuscripts:
(d) Manuscripts
Received Paper
TOTAL:
Received Paper
TOTAL:
Received Book
TOTAL:
Patents Submitted
Patents Awarded
Awards
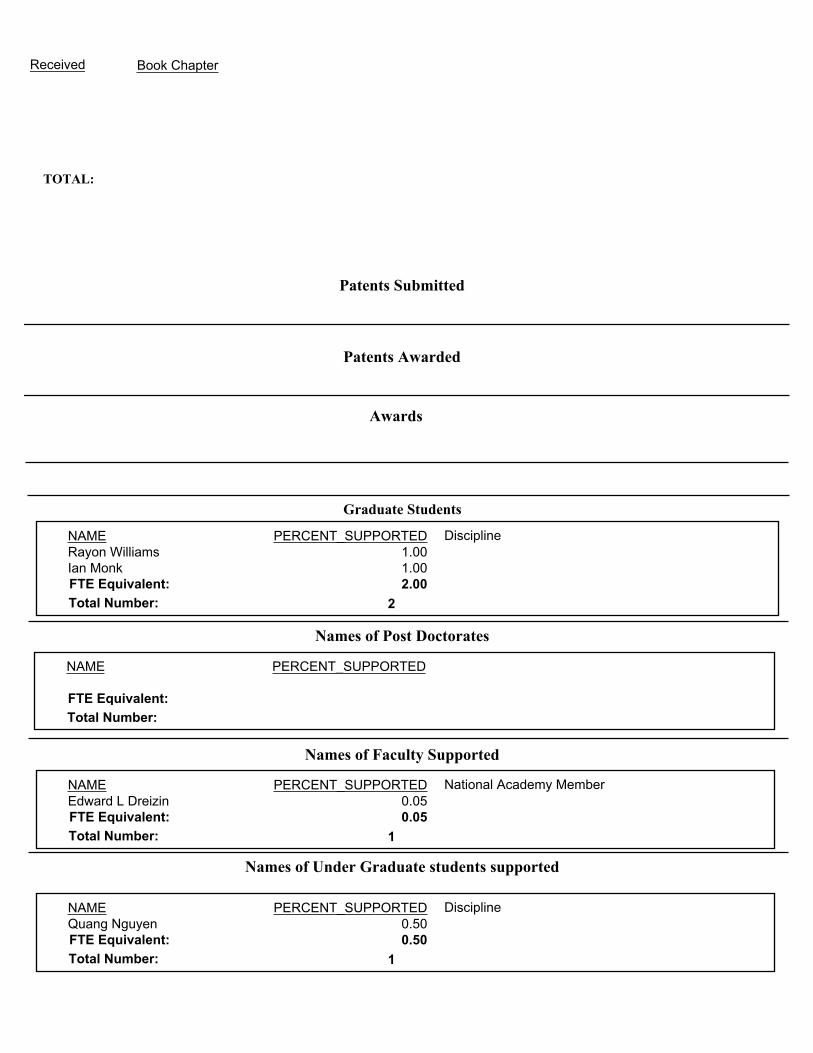
Graduate Students
Names of Post Doctorates
Names of Faculty Supported
Names of Under Graduate students supported
Received Book Chapter
TOTAL:
PERCENT_SUPPORTEDNAME
FTE Equivalent:
Total Number:
DisciplineRayon Williams 1.00Ian Monk 1.00
2.00
2
PERCENT_SUPPORTEDNAME
FTE Equivalent:
Total Number:
PERCENT_SUPPORTEDNAME
FTE Equivalent:
Total Number:
National Academy MemberEdward L Dreizin 0.05
0.05
1
PERCENT_SUPPORTEDNAME
FTE Equivalent:
Total Number:
DisciplineQuang Nguyen 0.50
0.50
1

Sub Contractors (DD882)
Names of Personnel receiving masters degrees
Names of personnel receiving PHDs
Names of other research staff
Inventions (DD882)
Scientific Progress
See attachment
Number of graduating undergraduates who achieved a 3.5 GPA to 4.0 (4.0 max scale):Number of graduating undergraduates funded by a DoD funded Center of Excellence grant for
Education, Research and Engineering:The number of undergraduates funded by your agreement who graduated during this period and intend to work
for the Department of DefenseThe number of undergraduates funded by your agreement who graduated during this period and will receive
scholarships or fellowships for further studies in science, mathematics, engineering or technology fields:
Student MetricsThis section only applies to graduating undergraduates supported by this agreement in this reporting period
The number of undergraduates funded by this agreement who graduated during this period:
1.00
1.00
1.00
0.00
1.00
1.00
1.00
The number of undergraduates funded by this agreement who graduated during this period with a degree in science, mathematics, engineering, or technology fields:
The number of undergraduates funded by your agreement who graduated during this period and will continue to pursue a graduate or Ph.D. degree in science, mathematics, engineering, or technology fields:......
......
......
......
......
NAME
Total Number:
NAME
Total Number:Rayon Williams
1
PERCENT_SUPPORTEDNAME
FTE Equivalent:
Total Number:
......
......

Technology Transfer
This work resulted in a new proposal submitted to AFOSR, attn. of Dr. Jennifer Jordan. The proposal was entitled REACTIVE MATERIALS WITH BURN RATE ADJUSTED BY INITIATION METHOD. It was selected for funding; the effort is expected to begin in 2016. Results of this effort were discussed extensively with the US Army researchers, including Dr. Nirupam Trivedi of Army Research Laboratory, Mr. Elbert Caravaca or RDECOM ARDEC, Picatinny, as well as with researchers of Naval Surface Warfare Center at Indian Head, including Drs. Stamatis, Mohan, and others. This work also helped comparing different materials under development for DTRA-sponsored efforts on reactive materials for agent defeat, including materials developed at NJIT and University of Maryland.

1
ELECTRO-STATIC DISCHARGE (ESD) SENSITIVITY OF REACTIVE POWDERS AND ITS
MITIGATION
Final Report
Submitted to: Dr. Ralph A. Anthenien Jr, PhD, PE
Program Manager, Propulsion & Energetics
U.S. Army Research Office
P.O. Box 12211
Research Triangle Park, NC 27709-2211
Phone: (919) 549-4317
Fax: (919) 549-4354
e-mail: [email protected]
Submitted by: Prof. Edward L. Dreizin
Department of Chemical Biological and Pharmaceutical Engineering
New Jersey Institute of Technology
University Heights
Newark, NJ 07102
Phone: (973) 596-5751
Fax: (973) 596-5855
e-mail: [email protected]
Date of submission: March 16, 2016

2
Contents Introduction ................................................................................................................................................................... 5
Summary of previous research .................................................................................................................................. 5
Summary of the most important results ......................................................................................................................... 7
1. On Gas Release by Thermally-Initiated Fully-Dense 2Al.3CuO Nanocomposite Powder .................................... 9
Introduction ............................................................................................................................................................... 9
Experimental ............................................................................................................................................................ 11
1. Materials .................................................................................................................................................... 11
2. Filament ignition ........................................................................................................................................ 12
3. Thermal analysis ........................................................................................................................................ 14
Computations ........................................................................................................................................................... 14
Results ..................................................................................................................................................................... 16
1. Thermal Analysis and Ignition ................................................................................................................... 16
2. Partial reduction of CuO and ignition ........................................................................................................ 19
Discussion ................................................................................................................................................................ 20
Conclusions ............................................................................................................................................................. 21
2. Correlation of optical emission and pressure generated upon ignition of fully-dense nanocomposite thermite
powders........................................................................................................................................................................ 21
Introduction ............................................................................................................................................................. 21
Experimental Setup .................................................................................................................................................. 22
Materials .................................................................................................................................................................. 23
Results ..................................................................................................................................................................... 25
1. Pressure and Optical Emission Traces ....................................................................................................... 25
2. Effect of heating rate on ignition temperature ............................................................................................ 27
3. Effect of heating rate on pressure measurements ....................................................................................... 28
4. Time delay between the pressure and emission pulses............................................................................... 29
Discussion ................................................................................................................................................................ 29
Conclusions ............................................................................................................................................................. 32
3. Ignition of Fully-Dense Nanocomposite Thermite Powders by an Electric Spark .............................................. 32
Introduction ............................................................................................................................................................. 32
Experimental ............................................................................................................................................................ 33
1. Materials .................................................................................................................................................... 33
2. ESD Apparatus and Diagnostics ................................................................................................................ 36
3. Heated Filament Experiment ...................................................................................................................... 37
Results ..................................................................................................................................................................... 38
1. Minimum Ignition Energy .......................................................................................................................... 38
2. Modes of Ignition ....................................................................................................................................... 38
3. Experiments at Reduced Pressure and in Argon ........................................................................................ 39
4. Ignition Delays for 2Al∙3CuO in Air ......................................................................................................... 40

3
5. Ignition Delays for 8Al∙MoO3 in Air ......................................................................................................... 41
6. Blending Nanocomposite Thermites with Metal Powders ......................................................................... 42
Heated filament ignition experiments ...................................................................................................................... 43
Discussion ................................................................................................................................................................ 45
1. Minimum Ignition Energy .......................................................................................................................... 45
2. Modes of Ignition ....................................................................................................................................... 45
3. Practical Implications ................................................................................................................................. 46
Conclusions ............................................................................................................................................................. 46
4. Electro-static discharge ignition of monolayers of nanocomposite thermite powders prepared by arrested
reactive milling ............................................................................................................................................................ 47
Introduction ............................................................................................................................................................. 47
Materials .................................................................................................................................................................. 47
Experimental Details ............................................................................................................................................... 49
Results ..................................................................................................................................................................... 50
1. Preliminary observations ............................................................................................................................ 50
2. Effect of particle size ................................................................................................................................. 52
3. Effect of milling time ................................................................................................................................. 53
4. Effect of ESD voltage ................................................................................................................................ 54
5. Effect of environment ................................................................................................................................ 55
Discussion ................................................................................................................................................................ 57
Conclusions ............................................................................................................................................................. 62
5. Modes of ignition of powder layers of nanocomposite thermites by electro-static discharge ............................. 62
Introduction ............................................................................................................................................................. 62
Materials .................................................................................................................................................................. 63
Experimental Details ............................................................................................................................................... 63
Results ..................................................................................................................................................................... 65
1. Ignition modes ............................................................................................................................................ 65
2. Prompt ignition .......................................................................................................................................... 68
3. Delayed Ignition ......................................................................................................................................... 70
Discussion ................................................................................................................................................................ 73
1. Prompt ignition .......................................................................................................................................... 73
2. Delayed ignition ......................................................................................................................................... 74
Conclusions ............................................................................................................................................................. 76
6. Combustion characteristics of stoichiometric Al-CuO nanocomposite thermites prepared by different methods
76
Introduction ............................................................................................................................................................. 76
Materials .................................................................................................................................................................. 77
Combustion experiments ......................................................................................................................................... 79
Results ..................................................................................................................................................................... 79
1. Material ejected from the sample holder .................................................................................................... 79

4
2. Emission Data ............................................................................................................................................ 79
3. Temperature and Pressure Data .................................................................................................................. 82
Discussion ................................................................................................................................................................ 87
Conclusions ............................................................................................................................................................. 90
7. References ........................................................................................................................................................... 90

5
Introduction
Testing of electro-static discharge (ESD) ignition sensitivity is the most common safety evaluation for powdered
materials, including energetic and other compounds. However, the mechanisms of ESD ignition sensitivity for
powders are poorly understood and testing methodologies often include subjective identification of the ignition or
non-ignition events. Furthermore, the test methods commonly do not specify humidity, pressure, or other factors
(e.g., presence of fine dust or other impurity in the surroundings) or powder conditioning before the test (e.g.,
drying) which are known to affect the ESD ignition sensitivity measurements. In addition, the tests usually specify
the amount of the powder to be placed in the sample holder; however, the ESD sensitivity for the same material can
be a strong function of the thickness of the powder layer struck by the spark. It has been recognized that a more
meaningful ESD ignition sensitivity test can only be proposed based on understanding of the processes governing
ESD ignition of fine powders. Respectively, a research program aimed to understand and describe quantitatively the
mechanisms of ignition in reactive powders as a result of their stimulation by electrostatic discharge was proposed to
ARO in 2007.
An exploratory effort supported by ARO under grant W911NF-07-1-0575 was focused to develop the understanding
and description of ESD ignition mechanisms for pure Mg and Al powders. In particular, it was of interest to
determine whether the thermal ignition models available for these metals enable one to interpret experimental data
on ESD ignition. Mg and Al were selected as metals most common in combustion applications and materials for
which ignition mechanisms are relatively well understood. It was also important that the thermal ignition
mechanism for Mg involves production and ignition of metal vapor, whereas for Al, ignition occurs
heterogeneously, when the continuity of the protective surface coating of Al2O3 is disrupted.
Summary of previous research
Efforts focused on experimental characterization of ESD ignition for Al and Mg powders. A commercial ESD
testing apparatus was acquired and used to build an experimental setup with extended electrical and optical
diagnostics. A schematic diagram of the experimental setup developed and used for the earlier project (and adapted
for the present effort) is shown in Fig. 1. The commercial ESD tester included a Firing Test System, outlined by a
dashed line in Fig. 1, combined with a sample cup and electrode. Inductance coils were installed to measure voltage
and current of the spark discharge. A modulated laser sheet was used to visualize particles lifted by the spark,
especially particles that were lifted but not ignited. It was also used to measure velocities of the lifted particles.
Spectrometer and several photo-sensors served to separately monitor optical emission signatures produced by the
spark and by the ignited particles. Finally, a still camera or a high-speed video camera, not shown in Fig. 1, were
used to observe the streaks of the ignited particles and document formation of a dust flame above the sample holder.
Several customized sample cups were manufactured and used to enable characterization of ESD ignition for smaller
powder samples and for thin powder layers. In addition, experiments on ESD ignition of a powder monolayer
placed on metal surface or on a carbon tape were performed.
A controlled environment chamber was also designed and built for the ESD ignition experiments. It enables the
experiments to be performed in vacuum or inert environments (of interest for thermites and similar materials capable
of self-sustaining reaction) as well as in environments with mixed oxidizers (e.g., O2/CO2) or with different oxidizer
concentration. However, the ESD ignition experiments with the controlled environment chamber were limited to
feasibility studies and demonstration of its utility due to restrictions on the funding and scope of the previous effort.

6
Fig. 1. Experimental setup developed at NJIT for studies of mechanisms of ESD ignition sensitivity of metal
powders.
Analysis of the experimental data showed that the main challenge in developing a model for ESD ignition is to
understand and describe the energy transfer from the spark to powder. Results suggested that the powder is heated
primarily by the ESD’s Joule heat energy while the effects of heated spark plasma or spark emission are only
secondary. It was further shown that for both Al and Mg, the ESD ignition can indeed be interpreted based on the
available thermal ignition models for these metals.
Statement of the problem studied
Some of the unexpected findings requiring further investigation in order to develop an ESD ignition model for
flammable powders are listed below:
1. Only a portion of the total spark energy is delivered to the powder causing its ignition. This portion is
different for different powders. For the same powder, it depends on the thickness of the powder layers
struck by the spark. It is critical to be able to describe these effects in order to predict the ESD ignition
behavior of different powders.
2. The diameter of the conductive channel produced in the powder layer and directly heated by the electric
current is a function of the powder layer thickness. This diameter defines the energy density and thus the
particle temperatures achieved as a result of powder heating by ESD. Thus, it is also critical for predicting
the ignition behavior.
3. Only a small fraction of the particles lifted by the spark are ignited, while majority of the lifted particles are
not heated.
4. Ignition behavior of mono-layers of Al and Mg powder is qualitatively different from that of commonly
tested multilayer samples. Monolayers are much easier to ignite and they produce substantially brighter
7
dust flames than thicker powder layers. This observation is critical for practical considerations indicating
that monolayers may be much more dangerous and flammable than thicker powder layers considered by
standard tests. This observation is also important for developing a descriptive powder ignition model by
ESD.
5. For polydisperse powders, the ESD energy is not distributed uniformly between particles of different sizes;
smaller particles are typically heated to higher temperatures.
The list above can be considered as a summary of technical challenges addressed in the present program. Note that
the above challenges are identified for ignition of pure metal samples. Additional questions were identified, as
discussed below, that should be answered to understand ignition of reactive materials capable of self-sustaining
reactions.
It is unfortunate that while the ESD ignition test continues to be used very widely in assessment of new and
conventional energetic and reactive materials, we were unable to identify any current or recent research efforts
aimed at understanding of its mechanisms, processes, and their implications, besides the recent work originated from
our group with the ARO support. Therefore, there is substantial lack in published data and results investigating
different aspects of ESD ignition. Because of that, and despite a relatively large number of experiments performed
at NJIT, development of related initiation models, which would usually rely on comparisons with other
measurements and critical assessments of ideas presented in the literature, is quite slow.
A research program described in this report continued focusing on conductive powders. In addition to extending the
range pure metal samples over the previously considering Al and Mg powders, reactive materials capable of self-
sustained reaction in the absence of external oxidizer were considered.
The focus of the effort was to establish the physical and chemical processes governing the ESD ignition and develop
simplified and experimentally validated descriptions enabling one to predict ESD ignition sensitivity for known and
newly developed materials.
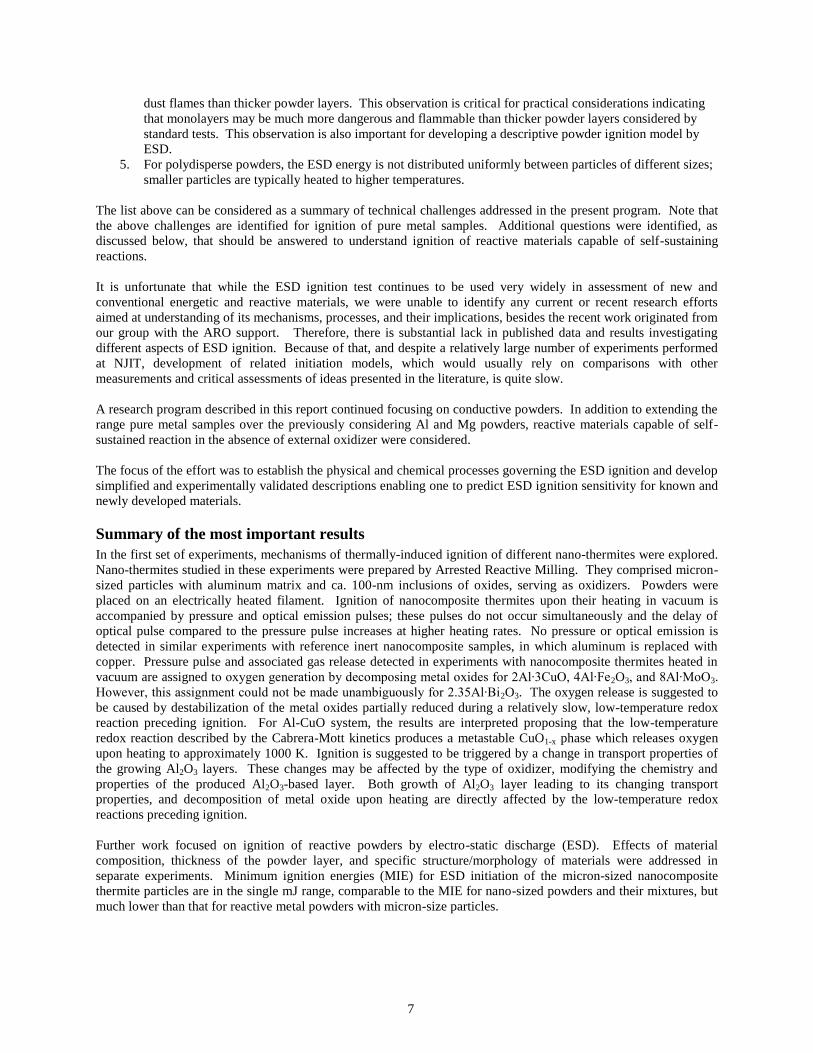
Summary of the most important results
In the first set of experiments, mechanisms of thermally-induced ignition of different nano-thermites were explored.
Nano-thermites studied in these experiments were prepared by Arrested Reactive Milling. They comprised micron-
sized particles with aluminum matrix and ca. 100-nm inclusions of oxides, serving as oxidizers. Powders were
placed on an electrically heated filament. Ignition of nanocomposite thermites upon their heating in vacuum is
accompanied by pressure and optical emission pulses; these pulses do not occur simultaneously and the delay of
optical pulse compared to the pressure pulse increases at higher heating rates. No pressure or optical emission is
detected in similar experiments with reference inert nanocomposite samples, in which aluminum is replaced with
copper. Pressure pulse and associated gas release detected in experiments with nanocomposite thermites heated in
vacuum are assigned to oxygen generation by decomposing metal oxides for 2Al∙3CuO, 4Al∙Fe2O3, and 8Al∙MoO3.
However, this assignment could not be made unambiguously for 2.35Al∙Bi2O3. The oxygen release is suggested to
be caused by destabilization of the metal oxides partially reduced during a relatively slow, low-temperature redox
reaction preceding ignition. For Al-CuO system, the results are interpreted proposing that the low-temperature
redox reaction described by the Cabrera-Mott kinetics produces a metastable CuO1-x phase which releases oxygen
upon heating to approximately 1000 K. Ignition is suggested to be triggered by a change in transport properties of
the growing Al2O3 layers. These changes may be affected by the type of oxidizer, modifying the chemistry and
properties of the produced Al2O3-based layer. Both growth of Al2O3 layer leading to its changing transport
properties, and decomposition of metal oxide upon heating are directly affected by the low-temperature redox
reactions preceding ignition.
Further work focused on ignition of reactive powders by electro-static discharge (ESD). Effects of material
composition, thickness of the powder layer, and specific structure/morphology of materials were addressed in
separate experiments. Minimum ignition energies (MIE) for ESD initiation of the micron-sized nanocomposite
thermite particles are in the single mJ range, comparable to the MIE for nano-sized powders and their mixtures, but
much lower than that for reactive metal powders with micron-size particles.

8
Two ESD-induced ignition regimes were observed for nanocomposite thermites. Powder placed in monolayers
ignited immediately; ignition resulted in individual burning particles ejected from the sample. Powders placed in
thicker layers ignited after a delay and produced burning powder cloud, although prompt ignition also was observed
for some nano-thermites.
Promptly ignited powders began burning immediately during the ESD pulse. Prompt ignition occurred for the
powders using Bi2O3 and Fe2O3 as oxidizers when low-voltage ESD was used. Because these powders were
reported to ignite at lower temperatures compared to other thermites studied here, their prompt ignition indicated
that a threshold ignition temperature was achieved as a result of Joule heating of selected particles even in the
relatively weak, low-voltage ESD. Combustion that followed prompt ignition was dominated by individual burning
particles; however, some of the ejected particles agglomerated causing longer burn times compared to those reported
earlier for the same powders ignited by ESD as monolayers. The burn rates of the promptly ignited particles were
high and their combustion products contained components mixed on a fine scale, comparable to the scale of mixing
in the starting nanocomposite materials prepared by arrested reactive milling.
The cloud ignition occurred similarly in both air and argon at 1 atm. In vacuum, only individual particle streaks
were observed for monolayers as well as for thicker powder samples. The streaks started forming during the spark,
but particles continued to be ejected and burned long after the ESD was over. The area from which ejected particles
were produced in vacuum expanded from the location struck by the spark throughout the entire sample.
The ignition delay for the powder cloud combustion did not depend on the ESD energy, but was affected by the
composition of the nanocomposite thermite, its aging, and presence of a diluent metal powder. It was also observed
that the ignition delays were close to respective delays between onsets of pressure and optical emission pulses
registered during ignition of the nanocomposite powders coated on an electrically heated filament. It is suggested
that the spark pre-heated particles in a thick powder layer to a threshold temperature, at which the heterogeneous
pre-ignition reaction began. This reaction could be accelerated by combined Joule heat and electric current effects
destabilizing the oxidizer, increasing the number of mobile oxygen ions available for reaction. Eventually, the rate
of reaction accelerates to cause formation of gaseous products and particle ejection, resulting in the observed cloud
ignition. It is also noted that convection substantially affects the temperature profile in the powder sample prior to
its ignition, causing nearly simultaneous heating of a group of particles eventually producing burning powder
clouds.
Delayed ignition was observed for all materials when 0.5-mm thick powder layers were ignited. At low voltage
ESD, much stronger delayed ignition pulses were observed for powders with CuO and MoO3 as oxidizers that did
not exhibit prompt ignition. Respective combustion products contained phases mixed on a substantially coarser
scale compared to that in the starting powders, suggesting that the nano-scale fuel-oxidizer structure of the prepared
materials was destroyed upon their ignition. Delayed ignition represents combustion of clouds of interacting powder
particles. Larger clouds were produced for powders with CuO and MoO3 as oxidizers as a result of more
homogeneous self-heating among powder particles pre-heated and ejected by ESD. Larger clouds of burning
nanothermites burned superadiabatically so that their measured flame temperatures exceeded significantly those
predicted by thermodynamic calculations. The effect was particularly strong for 2Al·3CuO, which also showed
higher burn rates for powder clouds.
In a set of experiments focused on prompt ignition, reactive nanocomposite 2Al∙3CuO, 2.35Al∙Bi2O3, 2Al∙Fe2O3,
and 2Al∙MoO3 powders prepared by arrested reactive milling placed in monolayers on a conductive substrate are
ignited by ESD in air, argon, and vacuum, generating multiple individual burning particles. The onset of the
emission pulse produced by the burning particles occurs after the ESD current ceases. The duration of the produced
pulse is in the range of 80 – 250 µs for all materials studied. Many different processes associated with interaction
between ESD and composite powders, as well as specific powder characteristics need to be accounted for in order to
understand experimental results. The longest emission duration is observed for the nanocomposite thermite using
MoO3 as an oxidizer. The reaction rates of the ESD-initiated powders are defined primarily by the scale of mixing
of and reactive interface area between fuel and oxidizer in the composite materials rather than by the external
particle surface or particle dimensions. In vacuum, particles are heated by ESD while remaining on the substrate
until they begin generating gas combustion products. In air and argon, particles initially pre-heated by ESD are
lifted by the generated shock wave and continue self-heating while being airborne due to heterogeneous redox
reactions. Greater ESD voltages result in longer electrical pulses and, respectively, longer lived shock waves.
9
Accordingly, more particles are pre-heated and lifted up at greater ESD voltages in air and argon, producing more
delayed and longer emission pulses. The ESD current diminishes in time, so that particles pre-heated and lifted by
the end of the current pulse are less likely to ignite. Shock-lifted particles move at very high speeds (~100 m/s), so
that cooling by the surrounding gas is substantial. In an oxidizing environment, this cooling is partially offset by an
exothermic particle surface reaction with gas. The Joule energy transferred from ESD to powder depends on both
the gas environment and the particle compositions; in turn, the Joule energy affects the number of the ignited
particles, their initial velocities, and respective temporal characteristics of the produced emission pulses. During the
time comparable to the experimental onset time for the emission peak, kinetic model obtained from thermo-
analytical measurements for nanocomposite thermites using MoO3 and CuO as oxidizers predict appreciable self-
heating for the particles assumed to be pre-heated by ESD instantaneously. This self-heating is more substantial for
the particles with CuO oxidizer; additional processes not accounted for by the present reaction kinetics may assist
ignition for powders with MoO3.
In the final part of this study, three powders with the same nominal composition 2Al-3CuO (numbers representing
moles) but prepared by different methods, including ultrasonic mixing (USM), electro-spraying (ES), and arrested
reactive milling (ARM), were prepared and ignited by ESD. For each powder, experiments were performed in air,
argon, and helium. Both USM and ES powders as prepared comprised porous micron-sized agglomerates of Al and
CuO nanoparticles; ARM-prepared particles consisted of micron-sized fully-dense particles in which Al and CuO
were mixed on the scale of ~ 100 nm. Combustion temperatures measured for all materials optically were higher
than estimated adiabatic flame temperatures and higher than reported earlier for similar materials burning in
different configurations. The unusually high temperatures are tentatively explained considering that a fraction of the
powder was ignited by ESD directly. The promptly ignited material heated the volume above the sample holder and
caused ejection of additional material from the sample holder in a highly pre-heated medium. For all materials,
combustion times, ranging from 2 to 15 ms were longer than expected for individual nanoparticles but in the range,
anticipated for composite particles prepared by ARM or agglomerates present in the USM powder. The shortest
burn times were observed in He consistently for all powders. Pressure generated by combustion of powders
prepared by ARM was least affected by the inert environment. This is interpreted considering that the reaction with
ambient oxidizer is less important for the fully-dense ARM-prepared particles compared to porous ES and USM
materials, in which aluminum is always exposed to the ambient gas. Unlike other materials, ARM-prepared
powders generated lower pressures in air than in He and Ar. This correlated with lower likelihood of formation of
spinel, Al2CuO4 in inert gases than in an oxidizing gas environment; when produced, spinel is expected to impede
further redox reaction. Powders prepared by USM formed large agglomerates; such agglomerates did not react
completely and included multiple nano-Al particles bonded by Cu-rich oxidized phase. It appears that partially
oxidized melt filled pores, blocking unreacted aluminum from further oxidation. Combustion products of the ARM-
prepared powders had dimensions similar to those of the original material particles. The scale of mixing between
Al2O3 and Cu-rich phase in the ARM powder combustion products was coarser than that between Al and CuO in the
initial material. Combustion products of the ES powders consisted of the finest composite particles; their sizes
appeared to be smaller than the sizes of the initial agglomerates observed in the ES powder. The burn rates of the
ES powders were least affected by the gas environment. The latter observation was interpreted considering that ES
materials included gasifying nitrocellulose binder, which could enhance heat and mass transfer between individual
Al and CuO particles in inert environments.
1. On Gas Release by Thermally-Initiated Fully-Dense 2Al.3CuO Nanocomposite Powder
Introduction Multiple recent efforts aimed to understand and model ignition mechanisms of nanocomposite reactive materials [1-
12]. Although significant progress has been made, ignition mechanisms remain elusive. At the same time, a robust
ignition model is required to incorporate these materials in practical energetic formulations. Ignition of
nanocomposite reactive materials needs to be described for a wide range of applications, including propellants,
explosives and pyrotechnics [13-15]. At present, several limitations exist in the proposed relevant ignition models.
In particular, a recent model for low-temperature exothermic reactions in nanocomposite 2Al∙3CuO thermites was
developed [1, 16] based on thermo-analytical studies, microcalorimetry, and single particle ignition experiments. It
is capable of interpreting the thermo-analytical experiments and ignition of individual thermite particles in a laser
beam. However, it does not predict ignition of such particles in experiments where they are coated on an electrically

10
heated filament. The model describes the evolution of the aluminum oxide layer growing between Al and CuO and
respective changes in its diffusion resistance as critically affecting the rate of exothermic redox reaction leading to
ignition.

11
Figure 1.1. Configurations of CuO core, Al matrix, and Al2O3 shells for different reaction progress (see text for
details).
The schematic of Fig.1.1 illustrates a CuO inclusion within a continuous aluminum matrix, separated by an
evolving layer of alumina. Individual phases are shaded differently, and arrows indicate the movement of interfaces.
The unreacted nanocomposite material is characterized by the number and size of CuO inclusions, and by the initial
thickness of the amorphous Al2O3 layer separating CuO and Al. The thin layer of amorphous alumina (shown in
1A) initially grows according to the Cabrera-Mott (CM) mechanism [1, 4, 17]. As the thickness increases, the CM
reaction becomes less significant, and ordinary diffusion dominates. At some critical thickness, the amorphous
alumina transforms into the -Al2O3 polymorph. The transformation is set to begin at the outer radius of the
amorphous shell and propagates radially inwards as shown in Figure 1.1B. After all the amorphous alumina is
consumed, the remaining γ-oxide continues to grow, as illustrated in Figure 1.1C. The model developed by [16]
describes the Al+CuO reaction as rate limited by transport of the reacting species through the evolving alumina film;
thus, it links diffusion rates and rates of phase changes affecting the diffusion resistance of this film with the rate of
reaction. The model describing reaction between Al and CuO does not consider any melting relations that may be
observed in pure Al, or in various Al-Cu alloys once metallic Cu becomes available. The inability of that model to
describe ignition in the heated filament experiments was suggested to be associated with possible gas release
accompanying ignition [1, 10, 12]. This gas release could change thermal diffusivity of the powder layer coated on
the filament; it can also provide gaseous oxidizer, which could alter the reaction mechanism between Al and CuO.
Heated filament experiments were previously conducted using a fully-dense nanocomposite powder of
2Al·3CuO prepared by Arrested Reactive Milling (ARM) [18] to investigate the effect of heating rate on its ignition
behavior [1, 19]. The experiments were conducted at normal pressure and in the presence of an external oxidizer. In
such experiments, pressure is generated upon ignition due to several processes: release of oxygen by decomposing
oxidizer, formation of gaseous combustion products including suboxides of Al and boiling Cu vapors, and expansion
of the gas trapped in pores. Only the former process is relevant to the ignition mechanism of interest in this study.
Recently, heated filament ignition experiments were performed in vacuum for several nanocomposite thermites
prepared by ARM [20]; in those experiments both pressure and optical emission signals were monitored
simultaneously. In this paper, experimental work for 2Al∙3CuO is expanded. Results are reviewed and interpreted
considering the detailed model for heterogeneous redox reaction proposed for this material by [16]. The correlation
of the measured gas release with the described redox reactions and its effect on the ensuing ignition processes are
considered in particular.
Experimental 1. Materials The nanocomposite powder used in this work is 2Al·3CuO produced by ARM [18]. The starting material was a
blend of aluminum and copper oxide powder. Aluminum powder (-325 mesh) of purity 99.5% was provided by
Atlantic Equipment Engineers. Copper oxide powder by Sigma-Aldrich (25 µm) of 99+% purity was used. These
starting components were milled in hexane and under argon environment for 60 min using a Retsch PM 400MA
planetary mill. Additional details on the milling procedure and parameters can be found elsewhere [19]. As a
reference, a chemically inert 2Cu·3CuO nanocomposite was also made under same milling parameters. Aluminum
was replaced by copper powder provided by Alfa Aesar (-325 mesh, 99% purity). The resulting reference composite
powder was expected to have the same particle sizes and morphology of mixing CuO in the metal matrix as the
reactive thermite powder, but stay chemically inert. Scanning electron microscope (SEM) images for both powders
are shown in Fig. 1.2 and a typical particle size distribution (PSD) for 2Al·3CuO given in Fig. 1.3.
CuO
am-Al2O3
-Al2O3
CuO
am-Al2O3
CuO
-Al2O3
(A) (B) (C)
Al matrix
12
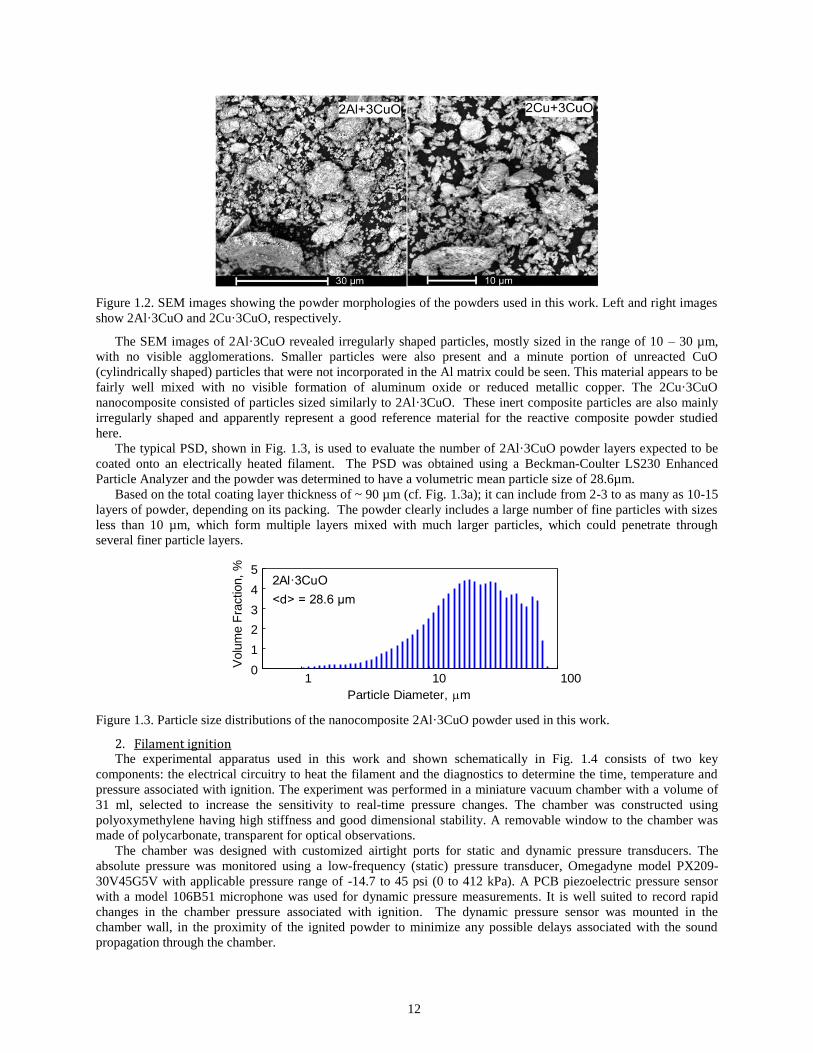
Figure 1.2. SEM images showing the powder morphologies of the powders used in this work. Left and right images
show 2Al·3CuO and 2Cu·3CuO, respectively.
The SEM images of 2Al·3CuO revealed irregularly shaped particles, mostly sized in the range of 10 – 30 µm,
with no visible agglomerations. Smaller particles were also present and a minute portion of unreacted CuO
(cylindrically shaped) particles that were not incorporated in the Al matrix could be seen. This material appears to be
fairly well mixed with no visible formation of aluminum oxide or reduced metallic copper. The 2Cu·3CuO
nanocomposite consisted of particles sized similarly to 2Al·3CuO. These inert composite particles are also mainly
irregularly shaped and apparently represent a good reference material for the reactive composite powder studied
here.
The typical PSD, shown in Fig. 1.3, is used to evaluate the number of 2Al·3CuO powder layers expected to be
coated onto an electrically heated filament. The PSD was obtained using a Beckman-Coulter LS230 Enhanced
Particle Analyzer and the powder was determined to have a volumetric mean particle size of 28.6µm.
Based on the total coating layer thickness of ~ 90 µm (cf. Fig. 1.3a); it can include from 2-3 to as many as 10-15
layers of powder, depending on its packing. The powder clearly includes a large number of fine particles with sizes
less than 10 µm, which form multiple layers mixed with much larger particles, which could penetrate through
several finer particle layers.
2Al·3CuO
<d> = 28.6 µm
Particle Diameter, m
1 10 100
Volu
me F
raction,
%
0
1
2
3
4
5
Figure 1.3. Particle size distributions of the nanocomposite 2Al·3CuO powder used in this work.
2. Filament ignition The experimental apparatus used in this work and shown schematically in Fig. 1.4 consists of two key
components: the electrical circuitry to heat the filament and the diagnostics to determine the time, temperature and
pressure associated with ignition. The experiment was performed in a miniature vacuum chamber with a volume of
31 ml, selected to increase the sensitivity to real-time pressure changes. The chamber was constructed using
polyoxymethylene having high stiffness and good dimensional stability. A removable window to the chamber was
made of polycarbonate, transparent for optical observations.
The chamber was designed with customized airtight ports for static and dynamic pressure transducers. The
absolute pressure was monitored using a low-frequency (static) pressure transducer, Omegadyne model PX209-
30V45G5V with applicable pressure range of -14.7 to 45 psi (0 to 412 kPa). A PCB piezoelectric pressure sensor
with a model 106B51 microphone was used for dynamic pressure measurements. It is well suited to record rapid
changes in the chamber pressure associated with ignition. The dynamic pressure sensor was mounted in the
chamber wall, in the proximity of the ignited powder to minimize any possible delays associated with the sound
propagation through the chamber.

13
The chamber pressure was reduced prior to experiments using a platinum series JB model 0808 vacuum pump.
Figure 1.4. Schematic layout of the heated filament ignition apparatus.
The static pressure transducer provided an initial reading of pressure in the chamber, typically 2.5-5.0 kPa.
Small leaks in the apparatus remained, so that once the pump was turned off, the pressure increased slightly. The
rate of pressure rise did not exceed 1 kPa/min. For consistency, all experiments were started at a static gauge
pressure reading of 5.80 kPa and at least 5 experiments were carried out at each pre-set heating rate.
The filament (nickel-chromium alloy, diameter ≈ 492 µm) was manually strain hardened (stretched) and cut into
6-cm sections prior to attaching it to the electrodes. A thin layer of thermite powder was coated on a 5-mm long
section of the filament. To prevent sagging of the heated filament because of thermal expansion, one of the filament
holders/electrodes was spring loaded. The window of the chamber was specially designed with electrical
feedthroughs for connection of the powder-coated wire to an external circuit. Multiple identically coated filaments
were heated at different rates and ignition was monitored using real time optical emission and pressure
measurements. Variation in the heating rate from 200 to 16,000 K/s was achieved using a voltage source including
up to three car batteries connected in series and a rheostat. A current sensor by F.W. Bell CLN-50 (Inductor coil)
and a voltage divider both powered by Tenma regulated DC power supplies were used to measure current and
voltage through the circuit.
An SEM image of a typical, approximately 90-µm thick powder coating on the wire, and high speed camera
images of the as deposited and ignited powders are shown in Fig. 1.5. The optical emission signals were measured in
real time using a Thorlabs DET110 photodiode placed directly in front of the window of the chamber. Signals from
the dynamic pressure transducer, photodiode, current and voltage measurement devices were recorded by a
LeCroyWaveSurfer 64Xs Series oscilloscope. Current and voltage signals were used to calculate the filament
temperature as a function of time, and thus the heating rate.
Figure 1.5. (a) SEM image of the nickel-chromium wire coated with nanocomposite 2Al·3CuO powders, (b) High
speed camera image of freshly coated wire and (c) High speed camera image of the ignited coating.
A typical experimental record of emission and pressure upon ignition is shown in Fig. 1.6. The data processing
procedure involved determining the heating rate and the ignition temperature.
A
V
Pressure transducers.
Battery
Rheostat(current control)
Heated filamentPowdercoating
To vacuum pump
WindowedChamber31 ml
ToData
AcquisitionPhotodiode
StaticDynamic

14
The heating rate dT dt was calculated assuming that the filament with mass m and specific heat Cp is heated by
electric current adiabatically, so that PIV mC dT dt , where I and V are the measured electric current and
voltage, respectively. This estimate neglects the heat capacity of the coating compared to that of the filament and
assumes a constant value of Cp. This approach was found valid based on earlier comparisons of the calculated
filament temperature with that measured using an infrared pyrometer [21]. The thermal contact between the powder
and filament is assumed to be very good so that the calculated heating rate can be applied to the powder as well as to
the filament. The heating rate was observed to be constant over the duration of the peaks, and the absolute
temperature, obtained by integrating the heating rate was found to be reproducible to within ±25 K.
Since both pressure and emission signals were recorded, the ignition temperature could be determined from the
onset of either one of them. For further analysis, the onset of the emission signal is taken as the time and
corresponding temperature of ignition. The signal onsets were determined by fitting a straight line to a short section
preceding the peaks, and subtracting that baseline from the signals. The root mean square (RMS) noise over the
fitted section was determined, and the signal onset was identified when the signal exceeded the RMS noise by a
factor of three.
heating rate:
660 K/s
T ign
pressure
photodiode
signal
Temperature, K
900 905 910 915
Photo
dio
de S
ignal,
V
Pre
ssure
, kP
a
0
1
2
3
Figure 1.6. Photodiode and pressure signal for an ignited 2Al·3CuO sample
3. Thermal analysis In addition to the ignition experiments, reactions in the prepared powders were characterized using Differential
Scanning Calorimetry, DSC, at heating rates of 5, 10, and 20 K/min. A Netzsch simultaneous thermal analyzer STA
409 was used, samples were heated in argon and the methodology described by [7] was generally followed.
Computations The reaction mechanism for 2Al∙3CuO nanocomposites outlined in the Introduction was implemented in
MATLAB. Critical material parameters influencing the model are the number and size of the CuO inclusions, and
the initial thickness of the alumina layer separating CuO from Al (cf. Fig. 1.1). This thickness was determined
earlier based on low-temperature heat flow calorimetry [1, 4]. The inclusion size was varied between 100 and 200
nm, and the number of inclusions was adjusted to achieve the overall composition of 2Al+3CuO. This
implementation had been used to compute thermal analysis curves in [16], and was applied here as well. The
computation assumed constant heating rates, corresponding to experiments. The heat losses from the sample were
neglected. The temperature-invariant phase changes in the sample, such as aluminum melting, were assumed to
occur fast compared to the rate of temperature change, so that their respective effects on the oxidation kinetics were
neglected. Further details of the algorithm are given by [16].
To model the ignition of particles coated on a filament, heat transfer between filament, coating, and environment
needs to be modeled accurately. An algorithm for this was previously published by [22], and was incorporated in a
separate code. Briefly, the coating was modeled as a close packing of uniformly-sized spheres surrounding the
filament in concentric layers. Heat is allowed to flow via conduction and radiation between adjacent layers and
from and to the filament and the environment. Since the experiments were performed in vacuum, convection was
not allowed in the computations. The size of these spheres represents the average particle size of the powder.
Considering the particle sizes shown in Fig. 1.3 and the measured coating thickness shown in Fig. 1.5, it was
assumed that the coating consisted of three concentric particle layers.

15

16
Results As illustrated in Fig. 1.6, both pressure and optical emission peaks were recorded when the nanocomposite
2Al∙3CuO powders were heated in vacuum, clearly marking ignition events. At low heating rates, the onset of the
pressure signal nearly coincided with the onset of the emission signal; however, the emission was delayed by about
one millisecond at the highest heating rates. Figure 1.7 shows this time difference between the onset of the pressure
and emission signals.
No pressure or optical emission signals were observed upon heating of the prepared reference samples in which
aluminum was replaced with copper.
Heating Rate, K/s
1000 10000
Dela
y o
f em
issio
n o
nset
com
pare
d t
o p
ressure
, m
s
0.0
0.5
1.0
1.5
Figure 1.7. Effect of heating rates on the shift between onsets of pressure and emission pulses
1. Thermal Analysis and Ignition Figure 1.8 shows an experimental heat flow curve recorded at 20 K/min. For comparison, two calculated heat flow
curves are shown as well, with CuO inclusion sizes of 100 and 200 nm, respectively. The experimental curve shows
the following features: a low-temperature onset of the exothermic reaction near 400 K, after which the heat flow
remains nearly constant until it increases slightly starting at about 700 K. An endothermic peak occurs above 800 K,
and was previously attributed to equilibrium melting reactions in the Al-Cu binary system [7]. Finally, a strong
exothermic peak is observed near 900 K.
The computed curves match various aspects of the experiments and help illuminate the underlying processes. To
clarify different features observed in the computed curves, consider Fig. 1.9, which shows the individual processes
contributing to the heat flow according to the current model. The processes identified are: the growth of an
amorphous alumina layer controlled by CM kinetics, growth of amorphous alumina controlled by conventional
diffusion, and growth of alumina also by conventional diffusion.
Growth of only one of the alumina polymorphs is taken as rate-controlling at any given time. As a result of this, the
transition between the amorphous and alumina polymorphs causes a step-wise change in the reaction rate at the
time and temperature when the growth of alumina becomes rate-limiting. This is a simplification chosen for
computational feasibility, since in actuality the amorphous and polymorphs will grow at the same time over some
temperature range, and the reaction rate will be limited by diffusion through both. However, it was previously
shown that this simplification matches the underlying physical process reasonably well for the transition between
amorphous and alumina [23, 24].
The top two plots in Fig. 1.9 show the heat flow under thermal analysis conditions, where heat transfer effects were
neglected. The top curve corresponds to an actual experimental heating rate. The CM reaction dominates at low
temperatures. As the temperature increases, the rate of CM reaction decreases as a result of increasing oxide
thickness. At the same time, the rate of conventional diffusion through amorphous oxide layer increases, resulting
in a first exothermic peak. As the temperature continues to increase, so does the oxide thickness resulting in a
slower rate of diffusion. At some point defined by a combination of temperature and oxide thickness, a polymorphic
phase transition producing alumina occurs. Because alumina is much denser than amorphous alumina, this phase
transition is accompanied by disruption of the oxide layer continuity. Thus, a sharp increase in the reaction rate is

17
observed. As the reaction continues, the openings in the oxide heal and the reaction rate slows down. For the
heating rate corresponding to the top curve in Fig. 1.9, the polymorphic phase change occurs by the end of the first
exothermic peak.
The center curve shows an intermediate heating rate between rates typical for thermal analysis and filament ignition
experiments. For this intermediate heating rate, the conventional diffusion through amorphous oxide accelerates at
higher temperatures, but the phase change yielding alumina is predicted to occur well before the end of this first
exothermic peak.
The bottom curve is calculated for a high heating rate, with heat flow to and heat losses from the powder coating
accounted for. In this calculation, accounting for temporal changes in the sample properties and temperature, the
temperature remained constant during Al melting. As a result, the thickness of the alumina layer continued to
increase at the aluminum melting point of 933 K, causing a reduction in the CM reaction rate and a small step
observed at that temperature. More importantly, the reaction controlled by conventional diffusion through the
amorphous oxide starts accelerating at even higher temperatures and is immediately interrupted by the polymorphic
phase change.
Temperature, K
300 400 500 600 700 800 900 1000
Heat
Flo
w,
mW
/mg
0
1
2
3
4
520 K/min Experiment
Computation withCuO inclusions:100 nm, 200 nm
Figure 1.8. Experimental and computed DSC curves for the nanocomposite 2Al·3CuO powder.

18
CuO: 200 nm
He
at
Flo
w,
W/g
0
20
40
60
80
DSC, 20 K/min = 0.33 K/s
DSC, 600 K/min = 10 K/s
Wire Ignition, 16033 K/s
0.0
0.5
1.0
1.5
2.0
Temperature, K
300 600 900 12000.0E0
5.0E3
1.0E4
1.5E4
am. Al2O3 by Cabrera-Mott
am. Al2O3 by diffusion
Al2O3 by diffusion
total heat flow
Figure 1.9. Computed heat flow curves under thermal analysis conditions (no heat transfer effects), and under
filament ignition conditions (accounting for heat transfer to and from the powder coating). Component reactions are
shown.
To relate thermal analysis experiments at lower heating rates and ignition experiments at high heating rates, it is
instructive to compare suitable reference points on a plot of logarithmic heating rate vs. inverse temperature.
Following our earlier work [7, 25], a plot in Kissinger coordinates [26] is shown in Fig. 1.10. Experimental data are
shown by symbols, and results of computations are shown by lines. The following reference points were chosen:
(1) To track the start of the CM-controlled growth of amorphous alumina, the low-temperature inflection point (peak
of the derivative of the heat flow) was identified in the experimental thermal analysis measurements (circles in Fig.
1.10) as well as in the corresponding computations under DSC heat flow conditions (solid line at low temperatures).
(2) A weak inflection point could be identified in the experiments in the 700-800 K range (referred to as inflection
point before Al melting in Fig. 1.10). It is shown by squares in Fig. 1.10. In the computations for the DSC heat
flow conditions, this inflection point is predicted when the rate at which amorphous alumina grows by diffusion
accelerates (see Fig. 1.9, top curve, the onset of the first exothermic peak). The leading inflection point of the
corresponding peak is shown by a solid line at the respective temperature. The solid line has two nearly straight
sections. The first section, at lower heating rates, corresponds to the inflection point defined by the shape of the
exothermic peak produced by the accelerated diffusion, as shown in top curve in Fig. 1.9. As the heating rates
increase, the peak is interrupted by a phase change (see center curve in Fig. 1.9), and the inflection point coincides
with the resulting sharp spike produced. This effect is represented by the second portion of the calculated line,
showing a smaller change in temperature as a function of the heating rate.
(3) The DSC peak near 1000 K is shown by triangles.
(4) Filament ignition temperatures, as measured in the vacuum chamber, are shown by stars.
(5, 6) Computations under filament ignition conditions are shown by dashed lines: the low-temperature inflection
point leading to the CM growth of amorphous alumina, and the inflection point before Al melting, leading to the
diffusion-controlled growth of amorphous alumina at higher temperatures. Although a detailed heat transfer model
was accounted for in calculations for the filament ignition experiments and neglected for DSC experiments, the
kinetic trends predicted for the two inflection points tracked in both calculations are well consistent with each other.

19
Ignition clearly correlates with the kinetic trend predicted for the sharp spike caused by the polymorphic phase
change in the growing alumina.
(1000/T), K-1
1.0 1.5 2.0 2.5
ln(T
2/
)
4
8
12
16thermalanalysis
filament ignition
low-temperature inflection point
heat flow peak
inflection pointbefore Al melting
observed ignition
Figure 1.10. Summary of experimental DSC features, filament ignition temperatures, and corresponding
computational results (200-nm CuO inclusions). See text for details.
2. Partial reduction of CuO and ignition Despite earlier successful numeric modeling of powder coated on an electrically heated filament [22], and equally
successful prediction of single-particle laser ignition of 2Al∙3CuO composite particles [16], the current calculations
did not predict a thermal runaway for the powder. In many cases, the evolved heat was not even sufficient to raise
the nanocomposite powder temperature above that of the filament. Therefore, ignition was not predicted directly.
At the same time, the model does not account for the gas release, which caused the pressure peak preceding ignition.
The gas release possibly dramatically reduced heat transfer between powder and filament, so that the powder
temperature could have increased much higher than predicted in a model considering the powder coating. Although
not predicting the gas release directly, the model describes the rate of oxygen consumption by the redox reaction
beginning at low temperatures (as specified by the Cabrera-Mott mechanism) and thus predicts a change in the
oxygen concentration in the copper oxide serving as an oxidizer. This partial reduction of copper oxide is suggested
to result in its reduced stability and lead to its eventual decomposition accompanied with the release of gaseous
oxygen. Indeed, without the low-temperature redox reaction, as was the case in experiments with the reference inert
2Cu∙3CuO composite, no CuO decomposition was observed in the entire range of temperatures. Thus, correlations
between observed ignition temperatures and predicted compositions of the partially reduced copper oxide are of
interest. Figure 1.11 shows experimentally observed ignition temperatures as a function of the heating rate. In
addition, curves of constant oxygen consumption are shown for values corresponding to the reduction of CuO to
CuO0.98, CuO0.97, and CuO0.95, respectively. Finally, the temperature of the sharp heat flow peak (see Fig. 1.9,
bottom) is indicated as well.
According to the results summarized in Fig. 1.11, the amount of oxygen consumed at the temperatures where
ignition is experimentally observed is significant. Therefore, it is hypothesized that the copper oxide partially
reduced as a result of low-temperature redox reaction has its properties altered compared to the starting CuO. In
particular, a substantial decrease in the thermal stability is expected for the partially reduced CuO1-x phases, with
0<x<<1. The unstable CuO1-x can decompose with release of gaseous oxygen at temperatures substantially lower
than decomposition of CuO normally occurs. This oxygen release could cause the measured pressure pulse, which
is particularly important to interpret the cases when the pressure onset is observed before optical emission. Note that
the delayed emission pulse cannot be explained by temperature gradients across or along the heated powder.
Calculations do indicate a difference in the temporal temperature profiles for particles in the inner and outer coating
layers; however, these differences as a function of the heating rate do not follow the trend observed for the delay in
experiments.
The curves of constant oxygen consumption in Fig. 1.11 do not correlate directly with the trend for the ignition
temperatures. The temperature effect is greater for the constant consumption curves than it is for the ignition
temperatures. It suggests that the stability of CuO1-x reduces markedly when x increases. For example, the 3%

20
consumption curve is below the ignition curve at low heating rates (cf. Fig. 1.11), suggesting that the respective
oxide CuO0.97 was stable at the temperature at which it was formed under those heating conditions. At higher
heating rates, this same composition is formed at a higher temperature, closely matching that of ignition. It can be
thus suggested that at this higher temperature, CuO0.97 became unstable, resulting in the gas release and ensuing
ignition.
The effect of heating rate on the temperature location of the heat flow spike is relatively weak, which is, in fact,
quite similar to its effect on the ignition temperature, as is also seen in Fig. 1.10.
1000 10000
Heating Rate, K/s
Tem
pera
ture
, K
500
600
700
800
900
1000
1100
1200
oxygen consumed
3%
5%
heat flow spike
2%
Figure 1.11. Effect of heating rate on the experimental ignition temperature and reference points predicted in
calculations. Constant oxygen consumption curves and the trend showing occurrence of a sharp heat flow spike
caused by the polymorphic phase change in alumina are calculated for 200-nm CuO inclusions.
Discussion Results presented in Fig. 1.10 are consistent with previous measurements [1, 4, 7, 16], all suggesting that the
relatively weak, low-temperature exothermic reactions cannot be neglected when describing ignition of fully dense
2Al·3CuO powders at high heating rates. These low-temperature reactions were shown to be well-described by the
CM kinetics [1, 16]. However, applying the current reaction mechanism based on calorimetric measurements does
not result in the temperature runaway, characteristic for ignition. Thus, the effect of concurrent processes, especially
pressure release observed upon ignition should be considered.
The pressure increase due to decomposition of CuO, and release of O2 in the environment can be estimated based
on the volume of the reaction chamber, and the amount of powder typically used. Assuming that the material is
fully dense, the density of individual particles calculated based on densities of Al and CuO is 5.16 g/cm3. Assuming
then the packing fraction of 0.5, the mass of the coating used in each experiment can be estimated for a 5-mm long
and 90-µm thick layer as ~ 0.023 mg. This amount contains about 1.2·10-4
moles of CuO, which, if fully
decomposed would release 0.6·10-4
moles of O2. In the chamber with a volume of 31 cm3, this would generate a
pressure increase of up to 15 kPa at the ignition temperatures near 1000 K. This estimate predicts the highest
possible pressures discounting cooling of the expanding gases. Note that higher pressures may be anticipated after
ignition, when Cu vapors and gaseous aluminum suboxides can form.
From the experimental data, the pressure at the onset of the emission signal can be determined. The observed
trend resembles Fig. 1.7, with values averaging around 0.03 kPa at lower heating rates, eventually increasing to an
average 0.15 kPa at the highest heating rates. According to the pressure estimate above, this corresponds to a
release of approximately 1 % of the oxygen contained in the CuO. In other words, the oxidizer remains largely
intact even after the observed gas release, while the released gas is certainly capable of disrupting the heat transfer
between powder coating and the filament. In fully-dense nanocomposite powders prepared by ARM, this gas
release can also cause particle cracking producing fresh reactive surfaces.

21
The observed delay of the light emission pulse compared to the pressure pulse (Fig. 7) at the onset, where full-
fledged combustion has not yet occurred, clearly indicates that the initial gas release detected in these experiments is
due to CuO decomposition rather than to evaporating Cu. This conclusion is further supported by the low
temperatures at which the gas release is occurring, which do not exceed even the melting point of Cu (1378 K). As
noted above, CuO decomposition did not occur in reference experiments using the chemically inert 2Cu·3CuO
nanocomposite material. Thus, initial, low-temperature redox reaction occurring in the 2Al·3CuO prior to the gas
release by decomposing CuO is essential in forming a metastable CuO1-x phase, which releases oxygen much more
readily compared to CuO when heated to approximately 1000 K.
This work shows that the present mechanism describing exothermic heterogeneous Al/CuO reaction [1, 16] can
be considered as also describing formation of the metastable CuO1-x phase. In order to directly model ignition in the
present coated filament configuration, an additional mechanism, describing decomposition of that phase as a
function of x and temperature must be added. To support development of such a mechanism, additional experiments
are necessary, in which the gas release and ignition temperatures are characterized for powders with different sizes
of CuO inclusions. The improved model must further describe a change in transport properties of the coating caused
by the gas release, e.g., increase in its porosity, which could reduce the efficiency of heat transfer between powder
and filament, and thus result in thermal runaway of the reacting powder particles removed from the filament. Such
model modifications are particularly important for situations when porosity of the material is an essential parameter,
e.g., for ignition of consolidated reactive materials.
Conclusions Experiments with fully-dense 2Al·3CuO nanocomposite powders prepared by ARM and placed on a metal
filament electrically heated in vacuum showed that both optical and pressure pulses accompany onset of
combustion. No gas release or optical emission were observed in similar experiments with reference inert composite
powder, in which Al was replaced with Cu. For the reactive composites, the pressure pulse occurred before the
optical emission could be detected. The delay between the pressure and emission signals increased at higher heating
rates. The results are interpreted proposing that the low-temperature redox reaction described by the Cabrera-Mott
kinetics produces a metastable CuO1-x phase which releases oxygen upon heating to approximately 1000 K. Thus, it
is shown that despite a relatively small heat release, the low-temperature redox reactions in nanocomposite thermites
are important as producing destabilized, partially reduced oxide phases that decompose with a gas release upon
heating. In the present experiments, the gas release changed thermal properties of the powder coating reducing the
efficiency of its heat exchange with the supporting filament and thus enabling its thermal runaway and ignition.
2. Correlation of optical emission and pressure generated upon ignition of fully-dense
nanocomposite thermite powders
Introduction Recently, research on new reactive nanocomposite materials has been active [6, 27]. In particular, fully dense
nanocomposite powders are of interest as combining high reaction rates associated with developed reactive
interfaces and relative simplicity of handling and mixing such materials, typical for conventional micron-sized
powders. Such powders can be made by top-down techniques, such as mechanical milling [18] or cold rolling [28],
as well as by modification of bottom-up methods, such as cutting vacuum-deposited nanofoils [29-31]. Each
particle in a nanocomposite powder is made of solid phases mixed on the scale of ca. 100 nm or less. The large
interface area between components capable of a highly exothermic chemical reaction assures a high reaction rate,
attractive for many applications. Nanocomposite thermites are composed of metal fuels, usually, aluminum, and
metal oxides that are relatively easily reduced. Most previous applications of thermites involved micron-scale or
even coarser powder mixtures, e.g., for railroad welding [32, 33]. Respectively, reaction mechanisms developed and
used described reactions detected at high temperatures, typically above the aluminum melting point [34]. However,
reactions begin at much lower temperatures in nanocomposite thermites [6]. Existing mathematical models for these
reactions are either simplistic or use extrapolation of poorly validated or inappropriate rate expressions. It is
essential to develop a model that reflects true physico-chemical processes occurring in nano-materials.
It has been proposed that ignition in nano-thermites is affected by decomposition of the oxidizer resulting in
release of gaseous oxygen [10]. Alternatively, it has been discussed that ignition in such materials is controlled by
evolution and change in transport properties of the growing Al2O3 layer [4]. In this paper, the correlation of gas
release and ignition is examined for several nanocomposite thermite powders.
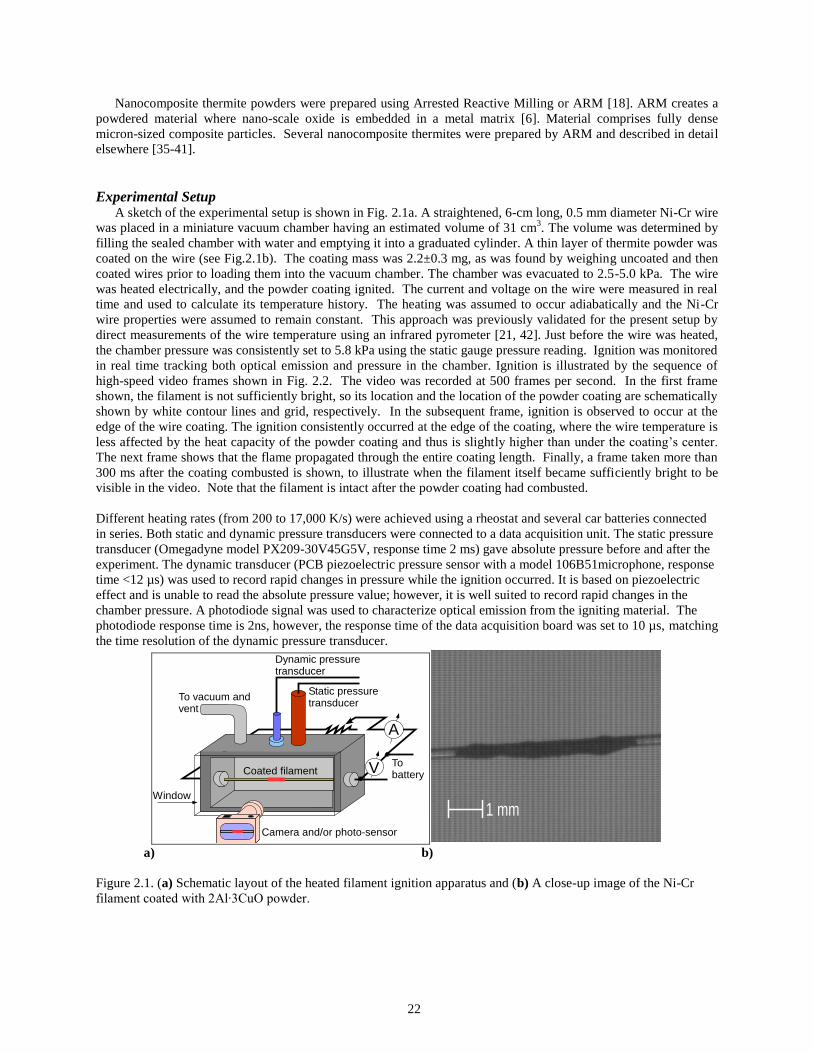
22
Nanocomposite thermite powders were prepared using Arrested Reactive Milling or ARM [18]. ARM creates a
powdered material where nano-scale oxide is embedded in a metal matrix [6]. Material comprises fully dense
micron-sized composite particles. Several nanocomposite thermites were prepared by ARM and described in detail
elsewhere [35-41].
Experimental Setup A sketch of the experimental setup is shown in Fig. 2.1a. A straightened, 6-cm long, 0.5 mm diameter Ni-Cr wire
was placed in a miniature vacuum chamber having an estimated volume of 31 cm3. The volume was determined by
filling the sealed chamber with water and emptying it into a graduated cylinder. A thin layer of thermite powder was
coated on the wire (see Fig.2.1b). The coating mass was 2.2±0.3 mg, as was found by weighing uncoated and then
coated wires prior to loading them into the vacuum chamber. The chamber was evacuated to 2.5-5.0 kPa. The wire
was heated electrically, and the powder coating ignited. The current and voltage on the wire were measured in real
time and used to calculate its temperature history. The heating was assumed to occur adiabatically and the Ni-Cr
wire properties were assumed to remain constant. This approach was previously validated for the present setup by
direct measurements of the wire temperature using an infrared pyrometer [21, 42]. Just before the wire was heated,
the chamber pressure was consistently set to 5.8 kPa using the static gauge pressure reading. Ignition was monitored
in real time tracking both optical emission and pressure in the chamber. Ignition is illustrated by the sequence of
high-speed video frames shown in Fig. 2.2. The video was recorded at 500 frames per second. In the first frame
shown, the filament is not sufficiently bright, so its location and the location of the powder coating are schematically
shown by white contour lines and grid, respectively. In the subsequent frame, ignition is observed to occur at the
edge of the wire coating. The ignition consistently occurred at the edge of the coating, where the wire temperature is
less affected by the heat capacity of the powder coating and thus is slightly higher than under the coating’s center.
The next frame shows that the flame propagated through the entire coating length. Finally, a frame taken more than
300 ms after the coating combusted is shown, to illustrate when the filament itself became sufficiently bright to be
visible in the video. Note that the filament is intact after the powder coating had combusted.
Different heating rates (from 200 to 17,000 K/s) were achieved using a rheostat and several car batteries connected
in series. Both static and dynamic pressure transducers were connected to a data acquisition unit. The static pressure
transducer (Omegadyne model PX209-30V45G5V, response time 2 ms) gave absolute pressure before and after the
experiment. The dynamic transducer (PCB piezoelectric pressure sensor with a model 106B51microphone, response
time <12 µs) was used to record rapid changes in pressure while the ignition occurred. It is based on piezoelectric
effect and is unable to read the absolute pressure value; however, it is well suited to record rapid changes in the
chamber pressure. A photodiode signal was used to characterize optical emission from the igniting material. The
photodiode response time is 2ns, however, the response time of the data acquisition board was set to 10 µs, matching
the time resolution of the dynamic pressure transducer.
Camera and/or photo-sensor
To vacuum andvent
Tobattery
Static pressuretransducer
Dynamic pressuretransducer
Window
Coated filament
A
V
1 mm
1 mm
a) b)
Figure 2.1. (a) Schematic layout of the heated filament ignition apparatus and (b) A close-up image of the Ni-Cr
filament coated with 2Al∙3CuO powder.

23
Figure 2.2. High speed camera images of ignited 2Al∙3CuO coating on a heated Nickel-Chromium filament.
Materials Four different nanocomposite materials were used in this work, 2Al∙3CuO, 2.35Al∙Bi2O3, 4Al∙Fe2O3, and
8Al∙MoO3 produced by ARM. The starting components, elemental aluminum and oxide powders, were milled in
hexane, used as a process control agent (PCA) under argon environment using a Retsch PM 400MA planetary mill.
Custom vials designed to withstand incidental pressure increase were used. The starting materials are listed in Table
2.1. The milling media was 9.4 mm (3/8”) diameter hardened steel balls, powder load was 30 g per vial and ball to
powder mass ratio was 3. Additional details on the milling procedure and parameters can be found elsewhere [6, 19,
37], and a summary is given in Table 2.2.
Scanning electron microscope (SEM) images for all the nanocomposite powders are shown in Fig.2.3. All
materials are composed of irregularly shaped particles ranging from very fine to relatively coarse. As can be seen in
Fig.2.3, 2.35Al∙Bi2O3 appears to be the finest powder.
In addition to chemically reactive nanocomposite thermites, a set of four reference inert samples was prepared by
ball milling with compositions similar to those shown in Table 2.2, but with aluminum replaced by copper. The
same milling conditions as used to prepare nanocomposite thermites were used to prepare these reference samples.
The goal of preparation of such inert reference samples was to observe whether the decomposition of oxide would
occur upon its heating in absence of aluminum, while maintaining the shape, size, and morphology of oxides, which
are important for the rates of their thermal decomposition.

24
Table 2.1. Starting materials used for preparation of nanocomposite thermites.
Material Supplier Particle Size Purity
Al Atlantic Equipment Engineers 325 mesh (<45 µm) 99.5%
CuO Sigma-Aldrich 25 µm 99%
MoO3 Alfa Aesar 325 mesh (<45 µm) 99.95%
Bi2O3 Alfa Aesar 325 mesh (<45 µm) 99%
Fe2O3 Alfa Aesar 325 mesh (<45 µm) 99.5%
Table 2.2. Milling conditions used for preparation of nanocomposite thermites.
Material Milling Time (min)
Volume of PCA, mL of
Hexane
2AlCuO 60 24
2.35AlBi2O3 150 24
8AlMoO3 30 24
4AlFe2O3 60 20

25
Figure 2.3. SEM images showing the powder morphologies for materials studied in this work.
Results 1. Pressure and Optical Emission Traces No pressure or optical signatures were detected in experiments using any of the four prepared reference inert
samples coated onto the electrically heated filaments. Figure 2.4 shows characteristic emission and pressure traces
for each reactive material recorded at low heating rates. All pressure traces shown here and below are generated by
the dynamic (fast response) pressure transducer. Each plot also shows its respective temperature history for the
filament. For consistency, all data are scaled over a 3-ms time interval. The onsets of pressure and emission signals
effectively coincide with each other for each material. Note that scales for temperature, photodiode signal, and
pressure are different for different traces. The ignition temperature for 2.35Al∙Bi2O3 is noticeably lower, while its
pressure pulse is much stronger compared to other materials. Both pressure and photodiode pulses are the sharpest
for 2.35Al∙Bi2O3 followed by 2Al∙3CuO and then by relatively shallow pulses for 4Al∙Fe2O3 and 8Al∙MoO3.
An unexpected observation was made when the heating rates increased: 2.35Al∙Bi2O3 and 8Al∙MoO3coatings did
not ignite when the heating rates exceeded 5,000 and 13,000 K/s, respectively. When ignition experiments were
2Al+3CuO
50μm
2.35Al+Bi2O3
40μm
4Al+Fe2O3
30μm
8Al+MoO3
50μm

26
performed in ambient air (instead of the evacuated chamber), ignition for all nanocomposite thermites was observed
at all heating rates.
Emission and pressure traces recorded for samples igniting at a low pressure at increased heating rates are shown
in Fig. 2.5; traces for 2.35Al∙Bi2O3 and 8Al∙MoO3 coatings are shown for the heating rates below the threshold
values above which ignition was no longer observed. The time scale spans for 10 ms for all traces shown. As in
Fig. 2.4, the scales for photodiode signal, pressure, and temperature are different for different traces. For all traces
shown in Fig. 2.5, except for 2.35Al∙Bi2O3, the pressure pulse begins before the emission pulse. This effect became
more and more noticeable at higher heating rates. Comparing pressure and emission signals in Figs. 2.4 and 2.5, one
observes that the ignition temperatures are higher for all materials at higher heating rates. It is also interesting that
the rates of increase of pressure and photodiode signals are higher at low heating rates. The effect is particularly
strong for 2.35Al∙Bi2O3. Unlike for other materials, the maximum pressure achieved at the low heating rate for
2.35Al∙Bi2O3 is almost an order of magnitude greater than that observed at the high heating rate. The effect of
heating rate on the maximum pressure for other thermites is not pronounced.
1
2
3
Pre
ssu
re, K
Pa
0
4
8
12
667.7
668.0
668.3
0
1
2
0
1
2
Te
mp
era
ture
, K
815.4
815.7
816.0
816.3
2.35Al.Bi2O3
4Al.Fe2O3
8Al.MoO3
0
5
10
0
1
2
860.6
860.9
861.2
861.5
Time, 3 ms
Ph
oto
dio
de
Sig
na
l, V
0
1
2
3
4
0
1
2
3
868.5
868.8
869.12Al.3CuO
=225 K/s
=229 K/s
=236 K/s
=221 K/s
Figure 2.4. Photodiode signal and pressure traces recorded at a low pre-set heating rate for different materials.
Temperature ramp is shown by a straight dotted line. Specific heating rate, , is shown for each set of traces.

27
0.0
0.2
0.4
Pre
ssu
re, K
Pa
0
1
2
740
760
780
800
0.2
0.6
1.0
0
1
2
880
910
940
970
Ph
oto
dio
de
Sig
na
l, V
0
1
2
3
0
1
2
Te
mp
era
ture
, K
900
950
1000
1050
2Al.3CuO
2.35Al.Bi2O3
4Al.Fe2O3
8Al.MoO3
Time, 10 ms
1
2
3
0
1
2
950
1000
1050
1100
=15,600 K/s
=7,400 K/s
=16,400 K/s
=4,900 K/s
Figure 2.5. Photodiode signal and pressure traces recorded at a high pre-set heating rate for different materials.
Temperature ramp is shown by a straight dotted line. Specific heating rate, , is shown for each set of traces.
2. Effect of heating rate on ignition temperature Ignition temperatures were consistently identified as the temperatures when the photodiode signal reached 1% of
its maximum value. The results for different heating rates for all the four materials are shown in Fig. 2.6. Each
point represents at least 4 measurements. Here and below, the error bars show standard deviations of the individual
data points. Note that both vertical and horizontal error bars are shown; however, for many points the horizontal
error bars are smaller than the size of the symbol. Heating rates vary from ~200 to ~17,000 K/s. Note that the
horizontal scale in Figs. 2.6-2.8 is expanded for the heating rates below 2000 K/s. Despite the large vertical error
bars, it is apparent that for all four materials at low heating rates (<2000 K/s), the ignition temperature increases with
the heating rate. However, for all materials (except for 2.35Al∙Bi2O3, for which the high heating rate measurements
were limited) ignition temperatures remain relatively stable for heating rates above 2000 K/s.
For 2.35Al∙Bi2O3, the ignition temperature increases as a function of the heating rate up to about 5000 K/s, just
before the sample stops igniting. The ignition temperature for 2Al∙3CuO is generally the highest of all the materials
followed by 8Al∙MoO3, 4Al∙Fe2O3, and 2.35Al∙Bi2O3. All the materials except 2.35Al∙Bi2O3 ignite in the range of
800 – 950K; 2.35Al∙Bi2O3 ignites in the range of 650 – 800 K.
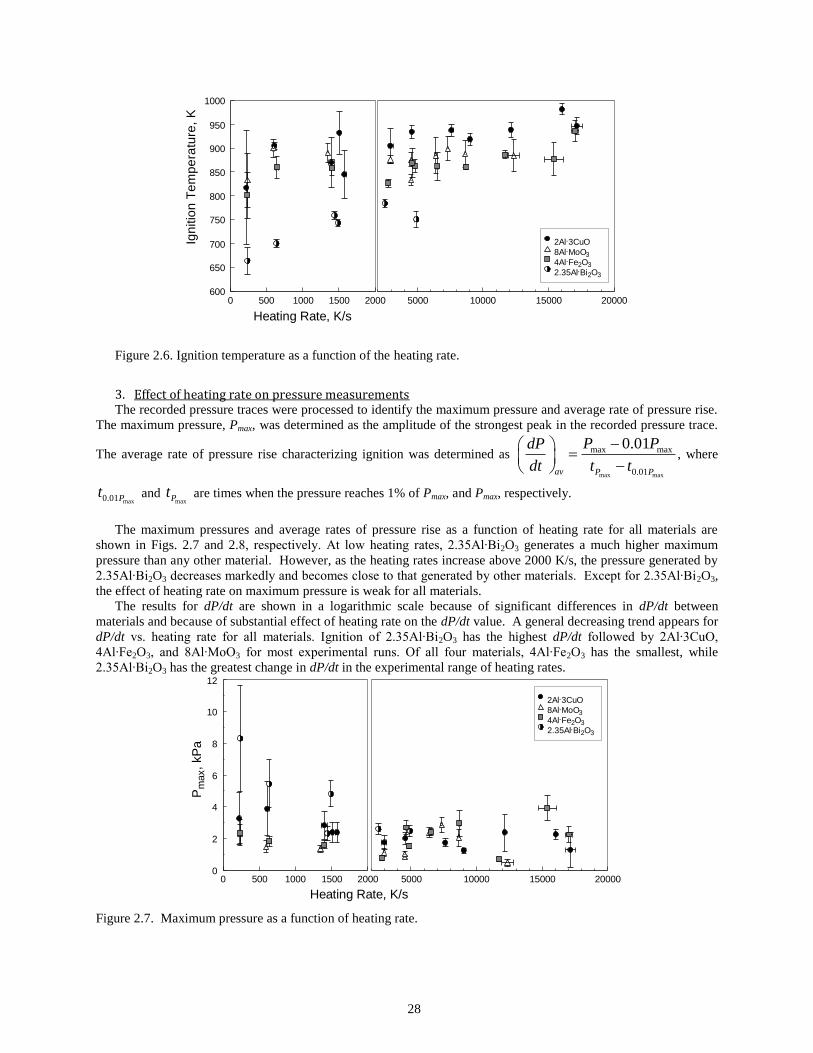
28
5000 10000 15000 20000
2Al.3CuO
8Al.MoO3
4Al.Fe2O3
2.35Al.Bi2O3
Heating Rate, K/s
0 500 1000 1500 2000
Ign
itio
n T
em
pe
ratu
re,
K
600
650
700
750
800
850
900
950
1000
Figure 2.6. Ignition temperature as a function of the heating rate.
3. Effect of heating rate on pressure measurements The recorded pressure traces were processed to identify the maximum pressure and average rate of pressure rise.
The maximum pressure, Pmax, was determined as the amplitude of the strongest peak in the recorded pressure trace.
The average rate of pressure rise characterizing ignition was determined as
max max
max max
0.01
0.01
av P P
P PdP
dt t t
, where
max0.01Pt and maxPt are times when the pressure reaches 1% of Pmax, and Pmax, respectively.
The maximum pressures and average rates of pressure rise as a function of heating rate for all materials are
shown in Figs. 2.7 and 2.8, respectively. At low heating rates, 2.35Al∙Bi2O3 generates a much higher maximum
pressure than any other material. However, as the heating rates increase above 2000 K/s, the pressure generated by
2.35Al∙Bi2O3 decreases markedly and becomes close to that generated by other materials. Except for 2.35Al∙Bi2O3,
the effect of heating rate on maximum pressure is weak for all materials.
The results for dP/dt are shown in a logarithmic scale because of significant differences in dP/dt between
materials and because of substantial effect of heating rate on the dP/dt value. A general decreasing trend appears for
dP/dt vs. heating rate for all materials. Ignition of 2.35Al∙Bi2O3 has the highest dP/dt followed by 2Al∙3CuO,
4Al∙Fe2O3, and 8Al∙MoO3 for most experimental runs. Of all four materials, 4Al∙Fe2O3 has the smallest, while
2.35Al∙Bi2O3 has the greatest change in dP/dt in the experimental range of heating rates.
Heating Rate, K/s
0 500 1000 1500 2000
Pm
ax,
kP
a
0
2
4
6
8
10
12
5000 10000 15000 20000
2Al.3CuO
8Al.MoO3
4Al.Fe2O3
2.35Al.Bi2O3
Figure 2.7. Maximum pressure as a function of heating rate.

29
Heating Rate, K/s
0 500 1000 1500 2000
(dP
/dt)
av,
kP
a/s
101
102
103
104
5000 10000 15000 20000
2Al.3CuO
8Al.MoO3
4Al.Fe2O32.35Al.Bi2O3
Figure 2.8. Average rate of pressure rise as a function of heating rate.
4. Time delay between the pressure and emission pulses
As shown in Fig. 2.5, at higher heating rates the pressure pulse initiated before the detectable emission pulse. A
more systematic presentation of the time shifts between the pressure and emission pulses is given in Fig. 2.9. The
pulse onsets are defined as instants when the respective signals (pressure or photodiode voltage) reach 1% of their
maximum values. The time differences between onsets of the pressure and emission pulses are shown for
experiments performed with different materials and at different heating rates. As in Figs. 2.6-2.8, the time scale of
heating rates from 0 to 2000 K/s is expanded. Overall, the time difference is on the order of 1 ms. A slight increase
in the time difference between the onsets of pressure and optical emission pulses is observed as the heating rate
increases. Consequently, the corresponding onset temperatures for pressure and emission pulses shift to higher
values proportional to the heating rate. The 8Al·MoO3 composites show a noticeable time difference at heating
rates as low as 600 K/s, while the time difference for all other materials becomes significant only at heating rates
above 2000 K/s.
Heating Rate, K/s
0 500 1000 1500 2000
t o
nse
t, m
s
0.0
0.5
1.0
1.5
2.0
2.5
2Al.3CuO
8Al.MoO3
4Al.Fe2O3
2.35Al.Bi2O3
5000 10000 15000 20000
Figure 2.9. Time delay between onsets of the photodiode and pressure pulses as a function of the heating rate. Note
that the temperature scales are different for the lower and higher heating rate sub-ranges.
Discussion Present experiments show a certain correlation between optical emission and pressure pulses generated by
ignited nanocomposite thermites. Several factors contribute to the pressure pulse. After ignition, transient gases are
released that raise the pressure in the chamber. Since the chamber at the beginning of the experiment has a finite
pressure, the high combustion temperature causes the residual gas in the chamber to expand and raise the pressure as
well. Finally, the oxidizer may decompose and release oxygen in the environment, which would also contribute to

30
the pressure pulse. The recorded traces do not allow to distinguish separate features. However, transient gas release
and the temperature effect are not present prior to ignition. The observation that the pressure pulse starts before the
light emission therefore suggests that the oxidizers are decomposing prior to ignition.
Pressure and emission signals are not necessarily detected simultaneously. As the image sequence in Fig. 2.2
shows, ignition of the powder coating starts locally at the edges and propagates along the filament length. In fact,
the first sign of ignition may occur on the side of the filament facing away from the photo sensor, causing delayed
detection of the light emission. This systematic mismatch between pressure and emission never causes emission to
be detected earlier than the pressure pulse, and may contribute to the minor time difference observed for heating
rates up to 5000 K/s for the Bi2O3 and CuO based composites (cf. Fig. 2.9). At heating rates above 5000 K/s for all
composites, and at all heating rates for MoO3 based composites (Fig. 2.9) the time mismatch becomes comparable to
the propagation time of the combustion along the filament direction (cf. Fig. 2.2), and is therefore unlikely to be
caused by any obscuration effect. This provides a convincing argument for early oxidizer decomposition and
oxygen release as the source of the pressure pulse preceding the light emission. This is consistent with observations
reported in Ref. [10].
Further, this early oxidizer decomposition is not caused by thermal decomposition of the oxides, since no
pressure signal was observed when chemically inert nanocomposite powders containing the same oxidizers were
heated in vacuum. Therefore, it is reasonable to propose that the relatively slow, low-temperature reactions
occurring during the powder heating prior to its ignition are not insignificant. Although the effect of such low-
temperature reactions may not be substantial in terms of the added heat release, they are modifying solid oxidizers in
contact with Al, e.g., by partially reducing the metal oxides. The presence of partially reduced oxide layers is
suggested to destabilize the rest of the oxide and cause its further decomposition at relatively low temperatures.
Although this mechanism is speculative at the present point, qualitatively similar behavior has been observed during
the autocatalytic reduction of cuprous oxide to metallic copper at lower reaction rates [43]. Further investigation is
warranted.
Acceleration of redox reactions leading to ignition in fully-dense, nanocomposite thermites was previously
argued to be caused by changes in the transport properties of the growing Al2O3 layer separating the fuel and
oxidizer [4, 44]. Such changes are not directly affected by decomposition of the oxidizer and thus may remain
responsible for ignition. Because oxygen produced by the decomposing oxidizer generates a pressure pulse, it is not
immediately reacting with aluminum. Thus, it is likely that the principal effect of the observed oxygen release is to
disrupt the thermal contact between the filament and powder coating. This, in turn, increases the likelihood of
thermal runaway of the powder coating as a result of an exothermic redox reaction. The secondary effect of oxygen
release, the changing properties of the decomposing oxidizer, could affect the rate of the respective redox reaction.
An increased delay between pressure and optical emission pulses at higher heating rates, as shown in Fig. 2.9,
indicates that different reaction kinetics laws govern changes in the transport properties of Al2O3 layer causing
ignition, and oxygen release by the decomposing oxidizer. Indeed, if changes in transport properties of Al2O3
prompt an exothermic reaction leading to thermal runaway and ignition detected by optical sensor, the effect of
heating rate on the temperature when the emission pulse occurs is governed by the respective kinetics of the Al2O3
evolution. If decomposition of oxidizer is characterized by different kinetics, the time delay between the
decomposition (pressure pulse) and ignition (emission pulse) is expected to change as a function of the heating rate.
However, these two processes are not independent of each other: they both depend on the extent of the preceding
low-temperature redox reaction leading to both growth of the Al2O3 layer and depletion of oxygen from the partially
reduced oxidizer.
It is of interest to discuss why ignition ceased to occur in vacuum for 2.35Al∙Bi2O3 and 8Al∙MoO3 at higher
heating rates, a somewhat unexpected effect observed in the present experiments. Ignition represents a thermal
runaway, e.g., an exothermic process in the powder coating that must be fast enough to raise the powder temperature
substantially above that of the filament. It cannot occur if the thermal conductivity of the powder coating is very
high, so that the powder closely follows the filament temperature. A significant, three orders of magnitude, increase
in thermal conductivity is well-known to occur in Bi2O3 at about 1003 K (730 °C), when a highly conductive, cubic
-Bi2O3 polymorph forms [45]. The reported polymorphic phase change temperature is higher than the ignition
temperatures measured here (see Fig. 2.6). It was recently shown, however, that Bi2O3 polymorphs are oxygen
deficient phases, Bi2O3-x, where x can vary from 0.022 to 0.033, and that different values of oxygen deficiency are
associated with different polymorphs [46]. Changing the level of oxygen deficiency as a result of low-temperature
reaction occurring while the material is heated prior to the detected ignition can alter stability of the initial Bi2O3
phase, reducing both its decomposition temperature and the temperature when the -Bi2O3 polymorph is formed.
For different heating rates, different levels of oxygen deficiency will be reached when the sample is heated to the
same temperature. This can explain why the ignition is observed at low heating rates but stops occurring when the

31
heating rates increase. At low heating rates, the extent of low-temperature reaction is greater resulting in a more
oxygen-deficient phase formed at relatively low temperature. Thus, decomposition of the oxygen-deficient oxide
can occur at a much lower temperature than that expected for the oxide heated without a strong reducing agent
(aluminum in our experiments). In other words, the decomposition would occur prior to the polymorphic phase
change, resulting in the gas release and ensuing ignition. For high heating rates, the oxide is less reduced, so that it
may remain stable while being heated to higher temperatures. It thus approaches the temperature range when the
polymorphic phase change is likely to occur; the temperature of the polymorphic phase change may still be
somewhat reduced because of an increased oxygen deficiency in the oxide rapidly heated in presence of a reducing
agent. If this happens, the thermal conductivity of the composite material would increase markedly and exothermic
reactions occurring upon its further heating would be unable to result in a temperature runaway. Note that when the
same experiment is performed in air, ignition is observed. This is easy to understand noting that the Bi2O3 partially
reduced by low-temperature reaction with Al would quickly re-oxidize reacting with the ambient oxygen, so that the
polymorphic transition would not occur until a higher temperature is reached. The information about thermal
properties of MoO3 is not as readily available as that for Bi2O3; however, multiple slightly oxygen deficient
polymorphs of MoO3 are also known [47] and are likely to have different thermal transport properties. Thus, a
scenario qualitatively similar to that described above for Al-Bi2O3 thermites may also be envisioned for Al-MoO3.
The temperatures at which ignition is observed in the present experiments for 2Al∙3CuO and 4Al∙Fe2O3 can be
compared to those reported in ref. [10] for analogous thermites comprising mixed nanopowders. The heating rates
used in ref. [10] were close to 500,000 K/s, substantially higher than in the present experiments. The onset of gas
release for 2Al∙3CuO nanothermite occurred in the range of 850 – 1250 K [10]. Our results indicate ignition for
2Al∙3CuO in a somewhat narrower (but overlapping) temperature range of 820 – 980 K, corresponding to the lower
heating rate used. The difference between the present experiments and those reported in ref. [10] is relatively small.
This suggests a weak effect of heating rate on ignition of 2Al∙3CuO. For 2Al∙Fe2O3, ignition was reported to occur
in the temperature range of ca. 1100-1700 K. In the present experiments, the ignition occurred at lower
temperatures (800 – 920 K), indicating an increase of ignition temperature with heating rate for this material, as is
expected for a thermally activated initiation mechanism. Note that the Al/Fe2O3 ratio in thermites used in the
present experiments was different from that used in ref. [10]; however this difference is expected to be insignificant
for the initiation reaction, involving only a small fraction of material. Based on a difference in the effect of heating
rate on ignition temperature for nanocomposite thermites using CuO and Fe2O3 as oxidizers, it is suggested that
different processes serve as ignition triggers for these two materials. A heating rate independent process, such as an
invariant phase change may be triggering ignition in the Al-CuO system. However, it appears that a thermally
activated reaction, such as exothermic oxidation accelerating at greater temperatures, may be the ignition trigger for
Al-Fe2O3 nanothermites.
Considering an earlier discussion on the importance of change in transport properties of the growing Al2O3 layer
in triggering ignition, the observed difference in the effect of heating rate on ignition temperature for different
thermites suggests that the respective Al2O3 layers are modified by different oxidizers. In other words, the redox
reaction product may have slightly different compositions (e.g., involving ternary Al-Fe-O or Al-Cu-O phases)
causing differences in its stability and polymorphic phase changes occurring upon its heating.
Finally, it is interesting to consider the observed effect of heating rate on the pressure pulses produced by
different materials. A strong increase in the maximum pressure at lower heating rates was observed for 2Al∙Bi2O3
(cf. Fig. 2.7). Incidentally, this is the only thermite system considered in the present work, for which no large
separation between the pressure and emission pulses upon ignition was observed. Thus, it remains unclear whether
the observed pressure pulse (in the case of Bi2O3) is associated primarily with oxygen release, or it is caused
exclusively by the vapor-phase reaction products and the temperature effect. It is safe to assume that at lower
heating rates, the extent of the low-temperature redox reaction is greater, leading to a greater partial reduction of
Bi2O3 and growth of a thicker interfacial Al2O3 layer. At the same time, because of the relatively long low-
temperature reaction times available at low heating rates, both oxygen concentration and temperature gradients in
the decomposing Bi2O3 may be lower compared to the experiments performed at high heating rates. This would
suggest that when ignited, the decomposition of Bi2O3 will proceed in its entire volume, whereas at high heating
rates, heat and mass transport within the decomposing oxide might be affecting the reaction rate. Note that this
reasoning can apply to other thermites as well, helping one to understand accelerated pressure rise observed
consistently at lower heating rates (cf. Fig. 2.8).
Several other processes could have occurred leading to lower rates of pressure rise consistently observed at
higher heating rates. The rate of pressure rise can be negatively affected by temperature gradients in the powder
coating increased at higher heating rates [22]. The increase in the temperature gradient would cause particles in
immediate contact with the wire to ignite sooner than the particles located in the external layers of the coating. This
32
process would generate a lower and less sharp pressure pulse compared to that produced by the entire powder
coating ignited simultaneously. For the powders exhibiting a pressure pulse ahead of the emission pulse, part of the
sample might be blown off the filament, so that the stronger the shift between pressure and emission, the less
material may remain on the filament to ignite. In addition, an early release of gaseous oxygen by decomposing oxide
(occurring prior to ignition, with greater shift in oxygen release and ignition events at higher heating rates) can
change the overall sample stoichiometry. Part of the gasified oxygen can diffuse away from the aluminum surface,
thus reducing the amount of the oxidizer available for the thermite reaction.
Conclusions Ignition of nanocomposite thermites upon their heating in vacuum is accompanied by pressure and optical
emission pulses; these pulses do not occur simultaneously and the delay of optical pulse compared to the pressure
pulse increases at higher heating rates. No pressure or optical emission is detected in similar experiments with
reference inert nanocomposite samples, in which aluminum is replaced with copper. Pressure pulse and associated
gas release detected in experiments with nanocomposite thermites heated in vacuum are assigned to oxygen
generation by decomposing metal oxides for 2Al∙3CuO, 4Al∙Fe2O3, and 8Al∙MoO3. However, this assignment could
not be made unambiguously for 2.35Al∙Bi2O3. The oxygen release is suggested to be caused by destabilization of
the metal oxides partially reduced during a relatively slow, low-temperature redox reaction preceding ignition.
Ignition is suggested to be triggered by a change in transport properties of the growing Al2O3 layers. These changes
may be affected by the type of oxidizer, modifying the chemistry and properties of the produced Al2O3-based layer.
Both growth of Al2O3 layer leading to its changing transport properties, and decomposition of metal oxide upon
heating are directly affected by the low-temperature redox reactions preceding ignition.
3. Ignition of Fully-Dense Nanocomposite Thermite Powders by an Electric Spark
Introduction
Electro-static discharge (ESD) ignition sensitivity is one of the most important characteristics considered in the
development and utilization of flammable materials. Usefulness of materials with high ESD sensitivities is limited
due to dangers associated with their handling and storage. ESD is a common ignition stimulus for various
flammable substances and testing the ESD ignition sensitivity is a widely accepted practice in many industries
dealing with a broad range of materials [48-50]. Multiple tests, standards, and evaluation methodologies have been
and continue being developed, such as American National Standards Institute ANSI/ESD S20.20, European
Standard EN 13821, British Standard CLC TR 50404, National Fire Protection Association NFPA 77, and
International Electrotechnical Commission IEC R60079-32, to investigate ignition behavior of different substances
struck by a spark [51-54]. In particular, ESD ignition sensitivity is routinely characterized for powder-like energetic
components and additives to propellants, explosives, and pyrotechnics, such as metals, oxidizers, and composite
materials.
Most ESD ignition testing standards, including those used for propellants and energetic materials [55, 56],
employ sparks produced by discharge of a high-voltage capacitor [57]. A commonly used measure of powder
sensitivity is the so-called minimum ignition energy (MIE). MIE is defined, somewhat loosely, as the minimum
energy stored in the capacitor, for which ignition following the ESD can be visually detected. This parameter may
be useful for a practical assessment of danger associated with the ESD-ignited material; however, it is poorly suited
for experiments aimed to identify the ignition mechanism. The energy stored in the capacitor may not necessarily
represent the energy transferred from the spark to the igniting material. Another deficiency of MIE deals with a
broad range of optical signatures, which may or may not be considered as visually detectable, and thus qualified as
ignition depending on the surrounding lighting and the operator’s experience.
Work has been conducted recently to understand which discharge characteristics and material parameters affect
ignition for flammable metals [58-65]. Studies with powders of Mg, Al, and Ti examined correlations between ESD
energy, energy transfer to the powder, ignition delays, and sizes of the ignited particles [58, 59, 61]. It was shown
that only a fraction of the energy stored in the capacitor is delivered to the powder [58, 59].The experimental
observations were described adequately by a simplified model assuming that most of the discharge energy is
transferred to the powder as a Joule energy released at selected particle-particle contacts, presenting the main
electrical resistance to the electric current through the metal powder layer. These contacts can be identified and their
resistance can be estimated considering how a polydisperse powder is packed and taking into account Paschen
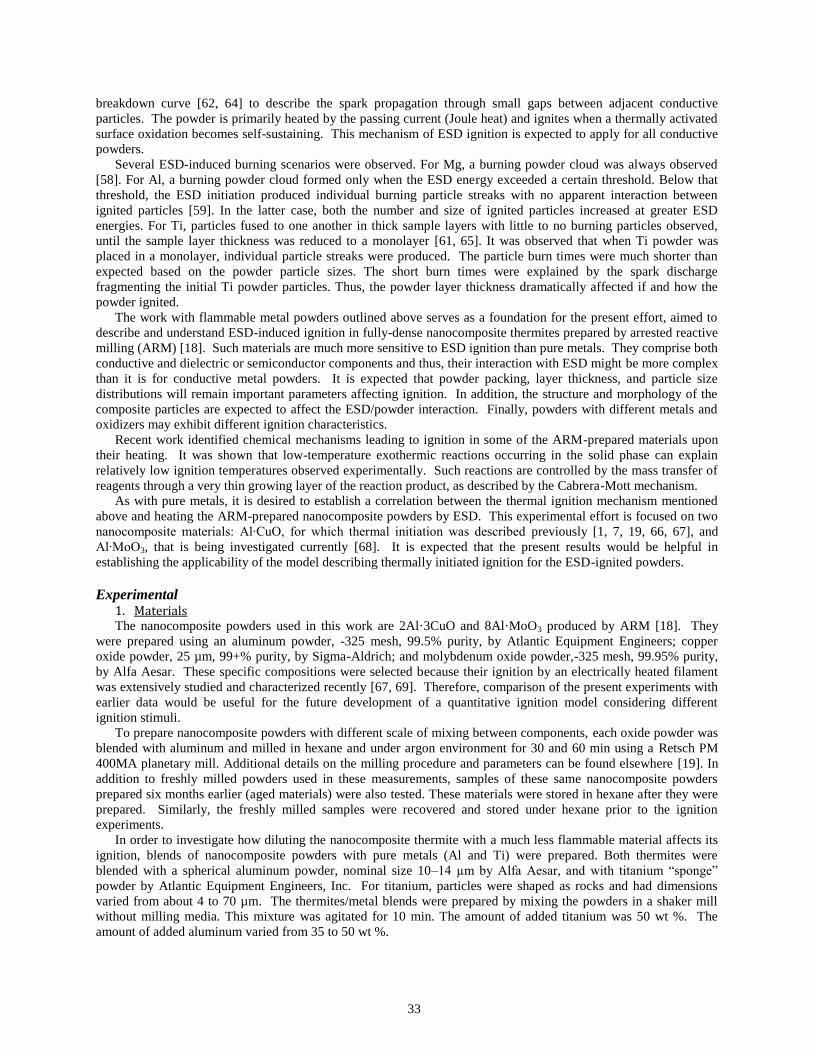
33
breakdown curve [62, 64] to describe the spark propagation through small gaps between adjacent conductive
particles. The powder is primarily heated by the passing current (Joule heat) and ignites when a thermally activated
surface oxidation becomes self-sustaining. This mechanism of ESD ignition is expected to apply for all conductive
powders.
Several ESD-induced burning scenarios were observed. For Mg, a burning powder cloud was always observed
[58]. For Al, a burning powder cloud formed only when the ESD energy exceeded a certain threshold. Below that
threshold, the ESD initiation produced individual burning particle streaks with no apparent interaction between
ignited particles [59]. In the latter case, both the number and size of ignited particles increased at greater ESD
energies. For Ti, particles fused to one another in thick sample layers with little to no burning particles observed,
until the sample layer thickness was reduced to a monolayer [61, 65]. It was observed that when Ti powder was
placed in a monolayer, individual particle streaks were produced. The particle burn times were much shorter than
expected based on the powder particle sizes. The short burn times were explained by the spark discharge
fragmenting the initial Ti powder particles. Thus, the powder layer thickness dramatically affected if and how the
powder ignited.
The work with flammable metal powders outlined above serves as a foundation for the present effort, aimed to
describe and understand ESD-induced ignition in fully-dense nanocomposite thermites prepared by arrested reactive
milling (ARM) [18]. Such materials are much more sensitive to ESD ignition than pure metals. They comprise both
conductive and dielectric or semiconductor components and thus, their interaction with ESD might be more complex
than it is for conductive metal powders. It is expected that powder packing, layer thickness, and particle size
distributions will remain important parameters affecting ignition. In addition, the structure and morphology of the
composite particles are expected to affect the ESD/powder interaction. Finally, powders with different metals and
oxidizers may exhibit different ignition characteristics.
Recent work identified chemical mechanisms leading to ignition in some of the ARM-prepared materials upon
their heating. It was shown that low-temperature exothermic reactions occurring in the solid phase can explain
relatively low ignition temperatures observed experimentally. Such reactions are controlled by the mass transfer of
reagents through a very thin growing layer of the reaction product, as described by the Cabrera-Mott mechanism.
As with pure metals, it is desired to establish a correlation between the thermal ignition mechanism mentioned
above and heating the ARM-prepared nanocomposite powders by ESD. This experimental effort is focused on two
nanocomposite materials: Al∙CuO, for which thermal initiation was described previously [1, 7, 19, 66, 67], and
Al∙MoO3, that is being investigated currently [68]. It is expected that the present results would be helpful in
establishing the applicability of the model describing thermally initiated ignition for the ESD-ignited powders.
Experimental 1. Materials The nanocomposite powders used in this work are 2Al·3CuO and 8Al·MoO3 produced by ARM [18]. They
were prepared using an aluminum powder, -325 mesh, 99.5% purity, by Atlantic Equipment Engineers; copper
oxide powder, 25 µm, 99+% purity, by Sigma-Aldrich; and molybdenum oxide powder,-325 mesh, 99.95% purity,
by Alfa Aesar. These specific compositions were selected because their ignition by an electrically heated filament
was extensively studied and characterized recently [67, 69]. Therefore, comparison of the present experiments with
earlier data would be useful for the future development of a quantitative ignition model considering different
ignition stimuli.
To prepare nanocomposite powders with different scale of mixing between components, each oxide powder was
blended with aluminum and milled in hexane and under argon environment for 30 and 60 min using a Retsch PM
400MA planetary mill. Additional details on the milling procedure and parameters can be found elsewhere [19]. In
addition to freshly milled powders used in these measurements, samples of these same nanocomposite powders
prepared six months earlier (aged materials) were also tested. These materials were stored in hexane after they were
prepared. Similarly, the freshly milled samples were recovered and stored under hexane prior to the ignition
experiments.
In order to investigate how diluting the nanocomposite thermite with a much less flammable material affects its
ignition, blends of nanocomposite powders with pure metals (Al and Ti) were prepared. Both thermites were
blended with a spherical aluminum powder, nominal size 10–14 µm by Alfa Aesar, and with titanium “sponge”
powder by Atlantic Equipment Engineers, Inc. For titanium, particles were shaped as rocks and had dimensions
varied from about 4 to 70 µm. The thermites/metal blends were prepared by mixing the powders in a shaker mill
without milling media. This mixture was agitated for 10 min. The amount of added titanium was 50 wt %. The
amount of added aluminum varied from 35 to 50 wt %.

34
Scanning electron microscope (SEM) images for the powders used are shown in Fig. 3.1. Differences in SEM
images between the nanocomposite thermites samples milled for 30 and 60 min were difficult to observe, therefore
only images for the samples milled for 30 min are shown in Fig. 3.1 for both 2Al·3CuO and 8Al·MoO3 powders.
Images of the blends prepared using the same nanocomposite thermites mixed with the pure metals are also shown.
For both 2Al·3CuO and 8Al·MoO3, metal and oxidizer appear to be well mixed with no visible formation of
aluminum oxide or reduced metallic phase. Both nanocomposite thermites are composed of irregularly shaped
particles ranging from very fine to relatively coarse. For the nanocomposite thermite powders blended with Al, the
nanocomposite powder particles can be easily differentiated in the SEM images shown in Fig. 3.2 from spherical
particles of Al. The powders appear to be well mixed with each other; some small thermite particles appear to be
deposited onto aluminum surface. It is more difficult to distinguish nanocomposite thermite from Ti sponge powder
particles because both powders have irregular particle shapes. Titanium particles appear a bit brighter in the images
obtained using backscattered electrons. They are also generally coarser than nanocomposite thermite particles for
both 2Al·3CuO and 8Al·MoO3.
The particle size distributions (PSD’s) were obtained using a Beckman-Coulter LS230 Enhanced Particle
Analyzer and are shown in Fig. 3.2. For both 2Al·3CuO and 8Al·MoO3 longer milling times resulted in a reduction
in the volumetric mean particle size. The mean size of 2Al·3CuO was generally smaller compared to that of
8Al·MoO3. These observations agree with the respective SEM images. Specific values of volumetric mean particle
sizes for all samples are shown in Fig. 3.2. The volumetric mean particle sizes for the pure metal powders used in
blends were measured as 21.5 and 30 µm for Al and Ti, respectively.

35
Figure 3.1. Typical SEM images showing the particle shapes and surface morphologies for the prepared
nanocomposite powders and powder blends.

36
Milling time: 30 min
<d> = 9.5 µm
1 10 100
Milling time: 30 min
<d> = 21.8 µm
2Al·3CuOMilling time: 60 min
<d> = 7.6 µm
8Al·MoO3 Milling time: 60 min
<d> = 15.6 µm
2
4
6
8
0
Particle size, m
0.1 1 10 1000
2
4
6
Vo
lum
e F
ractio
n, %
Figure 3.2. Particle size distributions for the prepared nanocomposite powders.
2. ESD Apparatus and Diagnostics A detailed description of the experimental set up used for this work was previously given in Refs. [58, 59]. Some
modifications were made for the present measurements. Figure 3.3 shows the set up including the Model 931 Firing
Test System (FTS) by Electro-Tech Systems Inc., used to generate spark discharges.
The powder is placed in a custom-made polished brass sample holder [65]. The sample holder was grounded; a
silver paste by Ted Pella, Inc., was applied to the bottom of the holder to ensure a good electrical contact. A needle-
electrode is fixed approximately 0.2 mm above the powder surface, following a standard methodology [57]. A spark
is triggered using FTS.
The electrodes were mounted inside a stainless steel chamber equipped with removable polycarbonate windows.
The chamber was designed to be airtight with an outlet connected to a vacuum pump and fitted with pipes and
valves with capabilities of evacuating the chamber or filling it with any desired gas. The experiments were
performed in surrounding air, in argon (at 1 atm), and in vacuum. The chamber volume is estimated as 564 ml based
on its geometric dimensions. For experiments carried out under vacuum, the chamber was evacuated to a pressure of
3 kPa prior to the start of each experiment. To reduce contamination of the ultra-high purity argon (99.999% purity)
used for experiments, the chamber was evacuated and refilled with argon at least three times. The estimated purity
of argon in the chamber was ca. 98%, considering the residual air left in after purging.
Different techniques were used to prepare samples with three powder layer thicknesses. A nominal monolayer
was produced by depositing a small amount of powder on a double-sided carbon tape adhered to an 18-mm-diam
brass support. Excess powder was blown away, and the powder remaining on the tape formed a monolayer, as was
confirmed by inspection of the prepared samples using an SEM. A sample with thickness of several mean particle
diameters was made by depositing a powder suspension onto the surface of a 6-mm-diam brass sample holder and
drying it out. The suspension was made by mixing 0.2 g of powder with 3 ml of hexane. The coating was allowed to
dry for 5 min before ESD ignition testing. The 0.5-mm-thick samples were prepared by filling the powder into a
brass sample holder with a 6-mm diameter, 0.5-mm deep cavity. Excess powder was scraped away to ensure an even
layer.
The thickness of the powder sample prepared as a monolayer was assumed to be equal to the mean particle
diameter obtained from the volume-based particle size distribution. For the samples prepared by drying out a
powder suspension, the thickness was determined using an optical microscope. The coated surface was turned to
observe the coating thickness; at least three images were taken for each coating thickness measurement. An image
processing software, the University of Texas Health Science Center at San Antonio (UTHSCSA) Image Tool,
version 3.0, was used. The powder layer thicknesses produced from the dried suspensions were approximately
192±25 and 262±22 µm for 2Al·3CuO and 8Al·MoO3, respectively. The thickness of the samples prepared using a
cavity in the sample holder was assumed to be equal to the depth of the cavity, 500±150 µm.
In all present experiments, ESD’s were produced using a 2000-pF capacitor in FTS. The capacitor was charged
to a voltage varied from 1 to 8 kV to change the discharge energy. Typically, three to five experiments were
performed for each voltage.
An inductance coil model 110 A with a 1 V/10 A ratio by Pearson Electronics was used to measure spark
current. Current traces were visualized and recorded by a LeCroy WaveSurfer 64Xs Series oscilloscope.

37
As in the previous work [58, 61, 65], the powder resistance, Rp, was determined based on the current traces
recorded for the same ESD settings for the sample holders with and without powder. For each experiment, the
current trace, showing a decaying oscillatory pattern, was matched with that calculated for an R-C circuit connected
in series (where the capacitance, C, is close to 2000 pF). The traces were matched to each other by adjusting the
circuit impedance, so that the equivalent resistance for each experiment was obtained. The circuit impedance was
assumed to remain constant during the discharge. The current traces were matched with a 95% confidence interval.
The difference between resistances for the powder-loaded and empty sample holders was assumed to represent the
powder resistance. Joule heating energy was obtained by numerical integration of:
(1)
where I is the recorded ESD current and t is time.
Two types of ignition were observed. In some cases, a dust cloud flame was observed; in other cases only
individual streaks of burning particles could be seen. The emission produced by the igniting powder was measured
using two photomultiplier tubes (PMT) equipped with interference filters. Both PMT’s were illuminated using a
bifurcated fiber optics cable. The optical emission was filtered at the wave-lengths of 589 and 486 nm. The PMT
outputs were also recorded using the LeCroy WaveSurfer 64Xs Series oscilloscope. It was observed that both
emission signals consistently correlated with each other.
Figure 3.3. Schematic of the experimental set-up.
3. Heated Filament Experiment This experiment was discussed in detail elsewhere recently [67, 69] and the methodology was not altered in the
present project. Very briefly, about 1-cm length of a 5-cm long, 0.5 mm diameter Nickel-Chromium wire is coated
with a thin powder layer. The wire is mounted in a small chamber, which is evacuated. The wire is heated
electrically. Both optical emission and the pressure pulse produced in the chamber when the powder ignites are
monitored using optical and pressure transducers.
2
pI t R dt

38
Results 1. Minimum Ignition Energy
The MIE values identified based on visual detection of ignition are shown in Table 3.1. These data were obtained
following the standardized testing methodology [57], using a standard sample holder and a spark gap of 0.2 mm. In
these tests, whenever the powder ignited, a dust cloud flame rather than individual particle ignition was observed.
Thus, ignition was readily identified by a bright flame observed for all discharge energies, down to MIE. The MIE
value was taken in the case of no ignition for 5 consecutive runs.
It was not feasible to calculate the energy delivered directly to the powder at the MIE due to the extremely weak
current and voltage signals obtained. Therefore, the MIE values reported in Table 3.1 were obtained following the
conventional methodology and represent the energy of the charged capacitor. In addition, MIE values were assessed
for nanocomposite thermite powders prepared with different layer thickness; for all cases, the visually detected
ignition occurred at the same energies as shown in Table 3.1.
Low values for MIE in the range of single mJ were determined, which are consistent with those reported in the
literature for similar, nanocomposite thermites. Values of 0.000125, 0.050 and 1.25 mJ were reported for Al+Bi2O3,
Al+MoO3 and Al+Fe2O3, respectively [70]. For Al+CuO, values of <0.14 mJ [71]and 4 mJ [72] have been reported
while a value of less than 1 mJ was reported for nano-sized Al [73]. In a previous study with aluminum-rich
nanocomposite thermites prepared by ARM, MIE values of 8Al·MoO3 and 8Al·3CuO were determined to be <0.8
mJ and 3.8 mJ, respectively [14]. It was also shown that ESD sensitivity could be reduced for Al+CuO and
Al+Bi2O3 by combining them with Viton A and guar gum, respectively [70, 71]. Similarly reduced ESD sensitivity
resulted for the thermite/metal blends prepared in this work. For 8Al·MoO3 and 2Al·3CuO blended with metal
powders, MIE values were respectively in the ranges of 9.3-16.2 and 3.8-6.8 mJ.
Table 3.1. MIE based on ESD for the nanocomposite thermites.
Material Milling Time (min) MIE (mJ)
8AlMoO3 30 3.81
2Al3CuO 30 1.24
8AlMoO3 60 1.24
2Al3CuO 60 0.95
2. Modes of Ignition Ignition experiments carried out for powder monolayers always produced individual burning particles resulting
in an emission signal similar to that shown in Fig. 3.4, with no detectable ignition delay (note the time scale in µs).
The overall duration of the recorded emission signal, corresponding to the time of combustion varied from ca. 70 to
100 µs. The corresponding image in Fig. 3.4 shows individual burning particle streaks observed upon ignition of the
monolayers of the nanocomposite thermites.
A qualitatively different mode of ignition and, respectively, different emission signals were observed for ignition
of thicker powder layers. Instead of individual particle streaks, a burning cloud was observed. It formed after a
certain delay following the discharge. For example, for a 500-µm thick layer, typical emission signals are shown in
Fig. 3.5 for both prepared nanocomposite thermite powders. Powder ignition producing a dust cloud flame was
observed in both cases; the optical signals produced by the ignited powder were noticeably delayed following the
applied spark. Specifically, a small spike in the optical signal correlating with the spark current directly was
observed, after which the optical signal returned to its zero level. After a while, the signal increased again. The
ignition delays were taken as the time difference between the spike corresponding to the spark and the first
inflection point in the optical signals increasing after the zero level observed following the spark. This processing
was performed using a custom Matlab subroutine. The signal at a shorter wavelength, 486 nm, was always
increasing faster than that at 589 nm, which may simply indicate that the initial emission was stronger at the shorter
wavelength. It can be seen from Fig. 3.5, that the ignition delay for 8Al·MoO3 is significantly longer than for
2Al·3CuO, which represents a consistent trend.
The ignition leading to a delayed dust cloud flame was consistently observed for the powders placed in layers
with thickness varied from several particle diameters to 500 µm. Because such delays apparently indicate the
development of an exothermic reaction in the reactive materials, they were investigated in more detail as discussed
below.
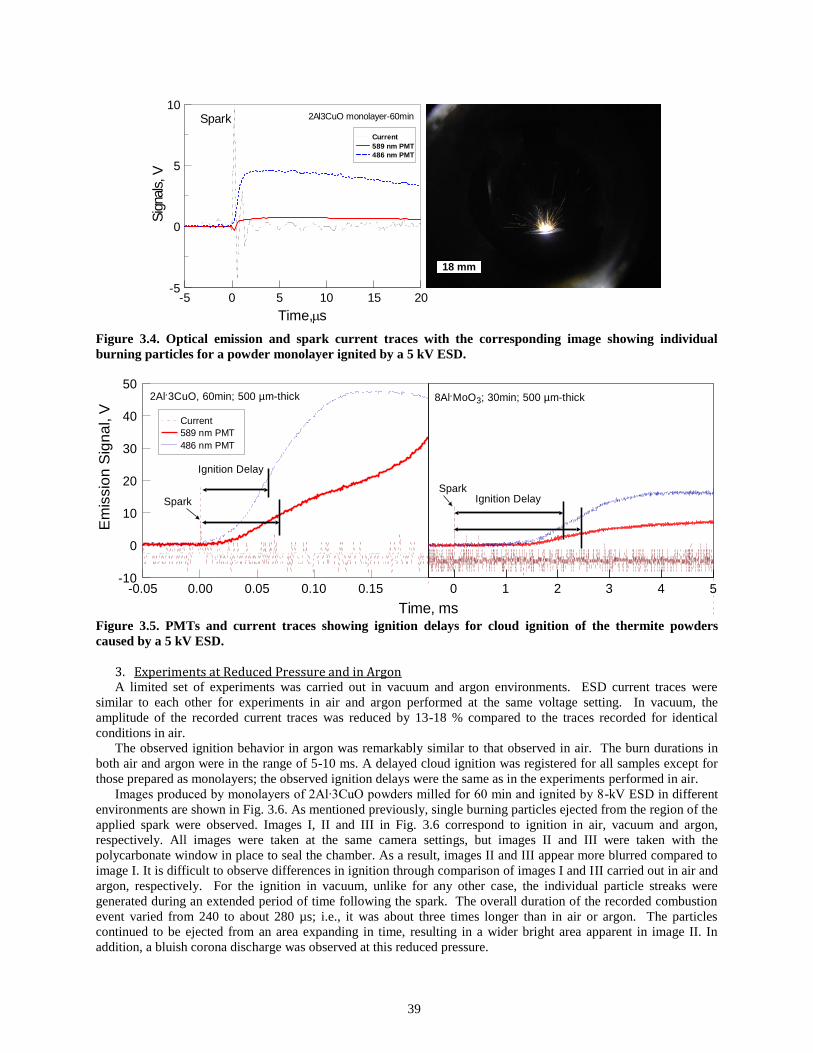
39
18 mm
Sig
nals
, V
-5
0
5
102Al3CuO monolayer-60min
Time, s
-5 0 5 10 15 20
Spark
Current
589 nm PMT
486 nm PMT
Figure 3.4. Optical emission and spark current traces with the corresponding image showing individual
burning particles for a powder monolayer ignited by a 5 kV ESD.
Time, ms
-0.05 0.00 0.05 0.10 0.15
Em
issio
n S
ign
al, V
-10
0
10
20
30
40
50
0 1 2 3 4 5
2Al.3CuO, 60min; 500 µm-thick
Spark
Ignition Delay
Ignition DelaySpark
8Al.MoO3; 30min; 500 µm-thick
Current
589 nm PMT
486 nm PMT
Figure 3.5. PMTs and current traces showing ignition delays for cloud ignition of the thermite powders
caused by a 5 kV ESD.
3. Experiments at Reduced Pressure and in Argon A limited set of experiments was carried out in vacuum and argon environments. ESD current traces were
similar to each other for experiments in air and argon performed at the same voltage setting. In vacuum, the
amplitude of the recorded current traces was reduced by 13-18 % compared to the traces recorded for identical
conditions in air.
The observed ignition behavior in argon was remarkably similar to that observed in air. The burn durations in
both air and argon were in the range of 5-10 ms. A delayed cloud ignition was registered for all samples except for
those prepared as monolayers; the observed ignition delays were the same as in the experiments performed in air.
Images produced by monolayers of 2Al∙3CuO powders milled for 60 min and ignited by 8-kV ESD in different
environments are shown in Fig. 3.6. As mentioned previously, single burning particles ejected from the region of the
applied spark were observed. Images I, II and III in Fig. 3.6 correspond to ignition in air, vacuum and argon,
respectively. All images were taken at the same camera settings, but images II and III were taken with the
polycarbonate window in place to seal the chamber. As a result, images II and III appear more blurred compared to
image I. It is difficult to observe differences in ignition through comparison of images I and III carried out in air and
argon, respectively. For the ignition in vacuum, unlike for any other case, the individual particle streaks were
generated during an extended period of time following the spark. The overall duration of the recorded combustion
event varied from 240 to about 280 µs; i.e., it was about three times longer than in air or argon. The particles
continued to be ejected from an area expanding in time, resulting in a wider bright area apparent in image II. In
addition, a bluish corona discharge was observed at this reduced pressure.

40
Figure 3.6. Images of ignited 2Al∙3CuO powders milled for 60 min carried out as a monolayer in different
environments: I) air, II) vacuum and III) argon.
Figure 3.7 shows two sets of consecutive images from high-speed videos recorded for a 192-µm thick layer of
2Al∙3CuO powder milled for 30 min and ignited in both air and in vacuum. In both experiments, the capacitor was
charged to 5 kV. A delayed combustion of a cloud of burning particles is observed in air (images A, B, and C).
However, in vacuum, (images D, E, and F) multiple individual particle streaks are observed. The streaks begin
immediately following the spark and the process continues for about 16 – 20 ms, with the area from which the
ignited particles are ejected propagating from the spark location radially outward.
Qualitatively, the same ignition behavior was observed in vacuum for both materials. There was no ignition
delay and multiple individual particle streaks were produced. The entire sample was consumed as was confirmed by
examination of the sample holder following the experiment.
Figure 3.7. Consecutive images of the high speed video showing ignition of a 192-µm thick layer of
nanocomposite powder of 2Al∙3CuO milled for 30 min in air (images A-C) and vacuum (images D-E).
4. Ignition Delays for 2Al∙3CuO in Air Figure 3.8, describes ignition delay observed in air for two prepared 2Al·3CuO samples as a function of the
measured ESD energy. The data are for powder layers with thicknesses of both 192 and 500 µm. Sets of
experiments with both layer thicknesses yielding a delayed powder cloud combustion were combined in the same
plot after noting that the ignition delays were effectively identical for these two sample preparations. The results are
shown for both freshly milled (filled symbols) and 6-month old (open symbols) nanocomposite powders with
identical compositions. Five runs were carried out at for each powder and at each powder layer thickness, so a total

41
of 10 runs for each powder are represented in Fig. 3.8. Except for a few outliers, delays measured at 486 and 589
nm are well correlated with each other in individual experiments, which can be identified by identical Joule energies
for both squared and round symbols. Some outliers were observed at both layer thicknesses.
The plot on the left corresponds to the sample milled for 30 min while the plot on right represents the 60-min
milled sample. The results were obtained for the Joule energies ranging from approximately 9 to 21 mJ; the
capacitor was always charged to 5 kV. Note that both somewhat higher and lower capacitor voltages were also
tested in a limited number of experiments. The ignition delays were not affected by the variation in the voltage.
Joule energy, mJ
8 10 12 14 16 18 20
Ign
itio
n D
ela
y, m
s
10-4
10-3
10-2
10-1
100
101
30 min
10 12 14 16 18 20 22
60 min
589 nm; fresh
486 nm; fresh
589 nm; aged
486 nm; aged
Figure 3.8. Ignition delay as a function of Joule energy in air for 2Al∙3CuO samples prepared as coatings with
thicknesses of 192 and 500 µm.
The aged samples for both milling times had longer ignition delays compared to the freshly milled sample. The
delays shifted from 10-100 µs for the freshly milled samples to approximately 1 ms for the aged samples. This effect
appears to be relevant to samples milled for both 30 and 60 min. No clear trend for the effect of other parameters on
the ignition delay was evident. As seen in Fig. 3.8, Joule energy does not appear to affect the observed delay.
Neither it is clear that the milling time makes a noticeable difference in the ignition delays for both fresh and 6-
month aged samples. Both sets of points shown in the left and right sides of Fig. 3.8 fall into the same range of
ignition delays.
5. Ignition Delays for 8Al∙MoO3 in Air Results on ignition delays for the freshly milled and aged 8Al∙MoO3 samples are summarized in Fig. 3.9. All runs
were carried out with the capacitor charged to 5 kV. Three runs were made for each of the layer thicknesses of 252
and 500 µm.

42
Joule energy, mJ
8 10 12 14 16 18 20
Ign
itio
n D
ela
y, m
s
10-1
100
101
30 min 60 min
10 12 14 16 18 20 22
589 nm; fresh
486 nm; fresh
589 nm; aged
486 nm; aged
Figure 3.9. Ignition delay as a function of Joule energy in air for 8Al∙MoO3, samples prepared as coatings
with thicknesses of 252 and 500 µm. Milling times are 30 and 60 min for the data shown respectively in the
left and right side panels.
Note that the vertical scales in Figs. 3.9 and 3.8 are different because of substantially longer ignition delays
observed for 8Al∙MoO3 samples compared to 2Al∙3CuO. The effect of aging for 8Al∙MoO3 samples is remarkably
different from that of 2Al∙3CuO. For samples milled for 30 min, the aged 8Al∙MoO3 had shorter ignition delays (1 –
2 ms) compared to the fresh material (8 – 9 ms.) Also, unlike 2Al∙3CuO, no clear effect of aging was evident for the
samples milled for 60 min. Finally, and again unlike 2Al∙3CuO, it is observed that for 8Al∙MoO3 longer milling
results in shorter ignition delays.
Similar to the observation for 2Al∙3CuO, there was no clear effect of Joule energy or powder layer thickness on
the ignition delay for 8Al∙MoO3. It is noted, however, that somewhat greater Joule energies were observed for the
fresh samples, caused by altered sample impedance.
6. Blending Nanocomposite Thermites with Metal Powders As in the other tests, these experiments were carried out with the capacitor charged to 5 kV. The powder layer
thickness was consistently close to 500 µm. The ignition delay data are shown in Fig. 3.10, using for clarity only the
traces recorded at 589 nm.
Freshly prepared powders of both 2Al∙3CuO and 8Al∙MoO3 milled for 30 min were initially blended 50/50% by
weight with either spherical powder of Al, or with Ti sponge powders, see Fig. 3.1.
Ignition delays observed for the blends using 8A∙MoO3 are shown in the right side of Fig. 3.10. The ignition
delays increased from 1 – 2 ms for pure 8Al∙MoO3 to 4 – 10 ms for the 50:50 wt. % blends with both Al and Ti. The
blend with Al appeared to have a slightly longer delay compared to that with Ti.
The ignition delays of the 2Al∙3CuO blends were significantly longer than those observed for pure 2Al∙3CuO.
The delays for the 50/50 blend of 2Al∙3CuO with Ti ranged from 20 to 50 ms. The 50/50 blend of 2Al∙3CuO with
Al did not ignite as a dust cloud. A new blend was then prepared with the thermite to metal mass ratio of 65/35.
The latter blend ignited producing a burning cloud, and the ignition delays of the order of 7 – 10 ms were observed.
These delays are substantially longer than about 1 ms delays observed for the pure thermite powder.
Limited experiments exploring blending higher fractions of thermites to pure metals or using blends with the
thermite powders milled for 60 min yielded ignition delays similar to those for the pure thermite samples.

43
Joule Energy, mJ
5 10 15 20 25
Ign
itio
n D
ela
ys, m
s
10-1
100
101
102
10 15 20 25 30
8Al.MoO3 blends2Al.3CuO blends
pure thermite
blend with Al (65:35 wt.%)
blend with Ti (50:50 wt.%)
pure thermite
blend with Al (50:50 wt.%)
blend with Ti (50:50 wt.%)
Figure 3.10. Ignition delays in air determined using emission traces recorded at 589 nm as a function of Joule
energy for thermite powders prepared by 30-min milling and blended with Al and Ti powders. All powder
samples are prepared as 500-µm thick layers.
Heated filament ignition experiments ESD induced ignition experiments were supplemented by ignition of the same materials using an electrically
heated filament. The filament was placed in a miniature chamber, and experiments were performed at a low
pressure (5.8 kPa). Both optical emission and pressure signatures accompanying ignition were recorded, following
earlier work [66, 67].
Ignition temperatures in the range of 800-950 K were consistent with those reported previously [67, 69]. As in
the earlier measurements, the onset of optical emission signal was delayed compared to the onset of pressure pulse.
Interestingly, these delays were of the same order of magnitude as ESD ignition delays observed in the present study
(cf. Figs. 3.8, 3.9). For more detailed comparison, the measured delays for the emission onset times compared to the
pressure onset for the freshly prepared and aged nanocomposite powders are shown in Fig. 3.11. Generally, delays
for the optical emission onset following the pressure pulse are longer for 8Al∙MoO3 compared to 2Al∙3CuO, in
qualitative agreement with data shown in Figs. 3.8 and 3.9. Aging for 8Al∙MoO3 results in shorter delays, similar to
the effect observed from Fig. 3.9. No substantial effect of aging on the measured delays was observed for
2Al∙3CuO. The similarity between delays shown in Figs. 3.8 and 3.9 and Fig. 3.11 may be indicative of a similar
rate-controlling process, such as heterogeneous reactions between solid fuel and oxidizer, affecting ignition in both
ESD and filament ignition experiments.
Heating Rate, K/s
0 2000 4000 6000 8000 10000 12000 14000
0
2
4
6
8
0 2000 4000 6000 8000 10000 12000 14000
t o
nse
t, m
s
0.0
0.4
0.8
1.28Al.MoO32Al.3CuO
fresh
aged
fresh
aged
Figure 3.11. Shift between onsets of pressure and emission pulses in vacuum based on heated filament
experiment at different heating rates for 2Al∙3CuO milled for 60 min and 8Al∙MoO3 milled for 30 min.
To observe the effect of blending thermites with metal powder on their ignition, two samples containing 75 wt %
of thermite, either 2Al∙3CuO or 8A∙MoO3, and 25 wt % of aluminum were prepared and ignited on a hot wire. The

44
results are shown in Fig. 3.12. The time shift between pressure and emission pulse increases noticeably for both
blended samples compared to thermites alone.
Both 2Al∙3CuO and 8A∙MoO3 nanocomposite powders used in the tests illustrated in Fig. 3.12 were milled for
60 min; note that powder blends containing nanocomposite thermites prepared by 30-min milling did not ignite in
wire experiments. For the powders milled during 60 min, blends containing more than 25 wt % of aluminum did not
ignite either.
Heating Rate, K/s
7000 8000 9000 10000 11000 12000
t o
nse
t, m
s
10-1
100
101
8000 9000 10000 11000 12000 13000
2Al+3CuO 8Al+MoO3
pure thermite
blend with Al (75:25 %wt.)
pure thermites
blend with Al (75:25 %wt.)
Figure 3.12. Comparison of time shift between onsets of pressure and emission pulses in vacuum for as
prepared 2Al∙3CuO and 8Al∙MoO3 nanocomposite powders milled for 60 min and corresponding blends
(75:25%wt.) with Al at different heating rates.

45
Discussion
1. Minimum Ignition Energy Despite relatively coarse particle sizes of the prepared composite materials (Figs. 3.1, 3.2), the values of MIE
shown in Table 3.1, are much lower than those characterizing similarly sized metal powders [58, 59, 61, 65].
Instead, the MIE for the thermites prepared here are consistent with those reported for nano-materials comprising
mixed nano-particles, e.g., see Ref. 26.
The observed effect of reduced MIE at longer milling times (cf. Table 3.1) cannot be attributed to a change in the
particle sizes, which is very small, as shown in Fig. 3.2. It was also shown previously that the sizes of oxide
inclusions remain nearly unchanged at different milling times [66]. Instead, longer milling times were shown to
result in an enhanced mixing homogeneity within the nanocomposite particles and in a powder with fewer particles
with compositions heavily dominated by either fuel or oxidizer. Thus, reduced MIE is attributed to this improved
mixing homogeneity achieved at longer milling times.
The MIE is also affected by both composition of the prepared thermites and by the presence of additional
blended powder. For the stoichiometric mixture of 2Al∙3CuO (60-min milling time) prepared in this work MIE was
1.24 mJ, compared to 3.8 mJ reported for a similarly prepared but fuel rich 8Al∙3CuO nanocomposite [14]. For
nanocomposite powders blended with metal, MIE increased three-four times compared to the values shown in Table
3.1.
2. Modes of Ignition Two observed modes of ignition resulting in formation of either individual burning particles ejected from the
powder sample or burning powder cloud were similar to those observed for pure metal powders [58, 59, 61, 65].
However, there were significant differences. For composite thermites, individual particle combustion was only
observed for the powder monolayers and in experiments in vacuum. Conversely, for both pure aluminum and
titanium powders, ignition of monolayers could generate a burning cloud, whereas ignition of thicker powder
samples generated individual burning particles. Independently of material, the specific (per unit mass) energy
transferred to the powder from the spark is substantially greater for the monolayers compared to thicker powder
samples. Because of lower ESD sensitivity, the absolute energy required for ignition of metal powders was much
greater than that for the thermites. For pure metal powders, this high energy was suggested to cause particle
fragmentation and ignition of a large number of fine particle fragments ejected from the sample.
For nano-composite thermites, ignition is observed at very low ESD energy, so that fragmentation of the
particles in the spark is unlikely even for the monolayers. Instead, particles in a monolayer can be heated and
ignited nearly instantaneously causing the observed individual particle streaks, unlike the case of thicker powder
sample, where the energy is distributed in the powder layer so that the instantaneous heating of the powder by the
spark is less significant.
For a thicker layer, after the ESD is over, a cloud ignition is observed after a noticeable delay. It can be
interpreted assuming that the powder initially heated by ESD to a relatively low temperature undergoes self-heating
due to an exothermic, heterogeneous redox reaction, which slowly raises its temperature and eventually leads to its
ignition. In the present context, ignition signifies a transition to a rapid reaction generating substantially increased
temperatures and gas-phase products, such as boiling Cu, suboxides of aluminum, e.g., AlO, Al2O, and AlO2, and
other species. The slow self-heating must involve multiple particles heated to approximately the same temperature
in order to explain the observed formation of a burning particle cloud. The cloud can form when multiple particles
are ignited nearly simultaneously. Consistently with experiments, this cloud ignition mechanism involves a delay
associated with the finite rate of the heterogeneous reaction causing the particle self-heating. Kinetics of such
reactions for the fully-dense nanocomposite thermites is investigated elsewhere based on detailed calorimetric
studies coupled with the heated filament ignition experiments [1, 16, 67-69]. A somewhat similar cloud ignition
mechanism was proposed for the pure metal powders, for which the delay was attributed to a surface oxidation,
which was rate- limited by the oxidizer availability in vicinity the powder layer [65]. In the latter case, the ignition
delay was associated with a finite rate of gas phase diffusion of oxidizer to the powder layer.
Interestingly, the cloud ignition was observed in both air and argon environments, but not in vacuum. In
vacuum, ignition resulted in multiple individual particles being ejected from the sample for tens of ms after the spark
(cf. Fig. 3.7). This qualitative difference in the ignition mode of powders in vacuum compared to other
environments is unlikely to be explained by a relatively small change in the spark current; instead, it is proposed that
the ignition mode is affected by the convective heat transfer, that is present in both air and argon but not in vacuum.

46
Convection enables a relatively fast energy dissipation from the powder region struck by the spark directly, so that a
larger portion of the powder is heated to a lower temperature compared to the case in vacuum, when a few particles
struck by the spark directly may become very hot with the rest of the sample almost unaffected. Because of lack of
convection, the most significant way of heat transfer in the powder bed in vacuum is through conduction. Therefore,
large temperature gradients develop in the powder. When a particle ignites, it heats its immediate neighbors rapidly,
while the heat is not propagated over a large distance. On the other hand, in air or argon, convection helps to
remove the heat from the hottest particles and distribute it over a larger sample area. Thus, the temperature
gradients are reduced and the entire sample area may be heated due to slow exothermic reactions nearly
simultaneously, resulting eventually in the observed cloud ignition mode.
3. Practical Implications The ignition delays for the cases when cloud ignition was observed were nearly independent on the spark energy.
This somewhat unexpected result can be interpreted, consistently with the discussion above, assuming that in all
ignition cases, a certain threshold temperature was achieved by the energy transferred from ESD, after which the
exothermic reaction became self-sustaining. The ignition delay is determined by the rate of the pre-ignition
exothermic reaction. If that initial threshold temperature is substantially lower than the temperature at which the
reaction accelerates to generate gas products, causing ejected particles, a small difference in the initial temperature
will not result in an appreciable change in the observed cloud ignition delay.
The ignition delays depended on the type of material and on the material aging. Generally, effect of material on
the observed ignition delay is not unexpected considering that the ignition delay is determined by low-temperature
heterogeneous exothermic reactions. The rates of such reactions certainly are affected by the reaction chemistry and
heat transfer characteristics of the sample. The latter effect is well illustrated by longer ignition delays observed for
the blends of nanocomposite thermites with metals (Fig. 10).
The effect of aging observed for the nanocomposite thermites with CuO as an oxidizer is qualitatively consistent
with the reaction model for this material [16]. For the aged powder, the thickness of the inert interface between Al
and CuO increases, slowing down the exothermic reaction controlled by the transport of reacting species through
that interface. For nanocomposite thermites using MoO3 as an oxidizer, the aging results in shorter delays indicating
that a different process is affecting ignition, which is not significant in the CuO-based materials. Recent thermo-
analytical measurements reported in detail elsewhere [68], suggest that 8Al∙MoO3 absorbs moisture forming a
hydrated form of MoO3; aged samples appear to absorb more moisture than freshly prepared powders. The
absorbed moisture is released upon heating as evidenced by weight loss and a correlating endothermic feature
observed in the measured heat flow curves. Release of the absorbed moisture could accelerate ignition explaining
the observed aging effect for this material.
Finally a correlation between ignition delays in ESD experiments and delays between pressure and optical
emission pulses in the heated filament ignition tests should be discussed. Both delays are close to each other in
terms of absolute times; in both cases, the times are longer for 8Al∙MoO3; aging of 8Al∙MoO3 results in reduced
delays for both cases. The interpretation of the delay between pressure and emission signals in the filament ignition
experiments proposed in Refs. [67, 69] suggests that the initial decomposition of the oxide (CuO or MoO3) results in
gas release causing the onset of pressure pulse. The same initial decomposition of the oxides occurring in vicinity of
the metal/oxide boundary can destabilize the remaining condensed oxide. The destabilization of the oxide
effectively increases the concentration of mobile oxygen ions and thus accelerates the pre-ignition exothermic
reaction. In other words, the delay between the pressure and optical emission in the heated filament ignition
experiments can be assigned to the finite rate of one of several processes leading to ignition, namely, to pre-ignition
exothermic reaction occurring when the oxidizer has been partially decomposed. It can, therefore, be suggested that
the ESD also destabilizes the oxidizer, although the effect may be a combination of the Joule heating and electrical
interaction of the spark with material. Once the oxidizer is destabilized, qualitatively similar exothermic reaction
begins for both ESD and heated filament ignition experiments, resulting in similar ignition delays observed in both
cases.
Conclusions Minimum ignition energies for ESD initiation of the micron-sized nanocomposite thermite particles are in the
single mJ range, comparable to the MIE for nano-sized powders and their mixtures, but much lower than that for
reactive metal powders with micron-size particles. Two ESD-induced ignition regimes were observed for
nanocomposite thermites. Powder placed in monolayers ignited immediately; ignition resulted in individual burning
particles ejected from the sample. Powders placed in thicker layers ignited after a delay and produced burning
powder cloud. The same cloud ignition was observed in both air and argon at 1 atm. In vacuum, only individual

47
particle streaks were observed for monolayers as well as for thicker powder samples. The streaks started forming
during the spark, but particles continued to be ejected and burned long after the ESD was over. The area from which
ejected particles were produced in vacuum expanded from the location struck by the spark throughout the entire
sample.
The ignition delay for the powder cloud combustion did not depend on the ESD energy, but was affected by the
composition of the nanocomposite thermite, its aging, and presence of a diluent metal powder. It was also observed
that the ignition delays were close to respective delays between onsets of pressure and optical emission pulses
registered during ignition of the nanocomposite powders coated on an electrically heated filament. It is suggested
that the spark pre-heated particles in a thick powder layer to a threshold temperature, at which the heterogeneous
pre-ignition reaction began. This reaction could be accelerated by combined Joule heat and electric current effects
destabilizing the oxidizer, increasing the number of mobile oxygen ions available for reaction. Eventually, the rate
of reaction accelerates to cause formation of gaseous products and particle ejection, resulting in the observed cloud
ignition.
Finally, it is noted that convection substantially affects the temperature profile in the powder sample prior to its
ignition, causing nearly simultaneous heating of a group of particles eventually producing burning powder clouds.
Experimental data presented in this paper are expected to be useful for development and validation of detailed
quantitative models describing ignition of nanocomposite thermites by different stimuli. In particular, the
comprehensive models are expected to describe quantitatively the observed effects of powder composition, aging,
and presence of inert diluent in the powder blends on the measured ignition delays.
4. Electro-static discharge ignition of monolayers of nanocomposite thermite powders
prepared by arrested reactive milling
Introduction Electrostatic discharge (ESD) or spark is a well-known and ubiquitous ignition stimulus for energetic and reactive
materials [56, 74-76]. However, related ignition mechanisms remain poorly understood. The issue of ESD ignition
sensitivity became particularly important for nano-energetic composites [75, 77, 78], including those considered for
use in lead-free electric primers [71, 79]. For composite reactive powder mixtures [77] and for pure metals [62, 64,
65], it was recently shown that Joule heating is the primary mechanism of energy transfer from the ESD to the
powder. Respectively, the electrical conductivity of powder was found to affect the ESD ignition sensitivity
substantially. It was also reported that different ignition regimes, involving individual burning particles or
aerosolized powder clouds, were observed when the thickness of a metal powder layer struck by ESD varied [65].
Most recently, ESD ignition of reactive nanocomposite thermite powders prepared by Arrested Reactive Milling
(ARM) [18] was studied [80, 81]. Such powders contain particles with dimensions in the range of 1 – 100 µm, in
which metal and oxidizer are mixed on the scale of ca. 100 nm; they are of interest as potential additives to solid
propellants [14], reactive structural materials [82], and components of other energetic formulations. It was reported
that two distinct spark-initiated ignition regimes were observed for nanocomposite thermites using Al as a fuel and
CuO and MoO3 as oxidizers: monolayers of composite particles ignite within 100-200 ns after the spark discharge
onset producing multiple individually burning particles [81], whereas thicker powder layers ignite following a
substantial (~ 0.1-5 ms) delay after the spark discharge and generate burning powder clouds [80]. In addition to
vastly different ignition delays, the burn times observed for individual particle and cloud combustion were very
different. The burn times for clouds were on the order of several ms, well comparable to the burn times of
individual particles of the same thermites ignited by a CO2 laser beam [83]. However, the particle burn times
observed in the monolayer ESD ignition experiments were as short as 100 – 200 µs. It remains unclear what are the
causes of different ignition regimes, varied ignition delays, and widely varied burn times, which may be observed
for the same nanocomposite powders. Experimental data on ESD ignition of nanocomposite thermite powders
remain limited, effects of particle sizes, morphology of the mixed components, surrounding environment, and
different material compositions have not been explored systematically. This work is aimed to begin addressing the
above deficiencies focusing on ignition of monolayers of different nanocomposite thermites prepared by ARM.
Materials Four aluminum-based nanocomposite thermite powders were prepared by ARM. The starting powders used were:
aluminum −325 mesh, 99.5% purity by Atlantic Equipment Engineers; copper(II) oxide, 25 μm, 99+ % purity by

48
Sigma Aldrich; bismuth(III) oxide, -325 mesh, 99% purity by Alfa Aesar; molybdenum trioxide, -325 mesh, 99.95%
purity by Alfa Aesar; iron(III) oxide, -325 mesh, 99.5% purity by Alfa Aesar. All prepared composite powders had
compositions close to stoichiometric thermites: 2Al∙3CuO, 2.35Al∙Bi2O3, 2Al∙Fe2O3, and 2Al∙MoO3. They were
prepared using a customized Retsch PM400 planetary mill, 3/8” diameter hardened steel balls as milling media, and
hexane as a process control agent. Custom-made hardened steel vials were used capable of withstanding a pressure
increase that might occur if the material reacts during the milling run. Each vial was loaded with 30 g of powder;
the ball to powder mass ratio was 3 and the amount hexane varied from 24 to 48 ml per vial. Milling times are given
in Table 4.1. Prepared powders were kept under hexane. The storage time varied from several months to two years;
no aging was noted for the powders stored under hexane based on differential scanning calorimetry. Particle sizes were characterized using a Beckman-Coulter LS230 Enhanced Particle Analyzer. Average particle
sizes are listed in Table 4.1. Scanning electron microscope (SEM) images of the nanocomposite powders used in
experiments are shown in Fig. 4.1. All materials include powders with characteristic shapes and broad size
distributions, typical of materials prepared by ball milling. Oxide inclusions can be identified as lighter in color (for
backscattered electron images), and as having characteristic crystalline shapes. For 2Al∙Fe2O3, ultrafine particles,
which could be unattached Fe2O3 appear in images in addition to the composite particles. Almost no individual
oxide particles are visible for both 2Al∙3CuO and 2.35Al∙Bi2O3 powders, which are very well mixed. For
2Al∙MoO3, some micron-sized MoO3 crystallites can be seen along with the composite particles.
Table 4.1. Milling times and average particle sizes for the materials used in experiment
Material composition (Moles)
Milling time, min
Average particle size (volume based), µm
2Al∙3CuO 30 16.3
60 10.6
80 9.9
2.35Al∙Bi2O3 150 10.2
2Al∙Fe2O3 60 9.3
2Al∙MoO3 60 9.4

49
Fig. 4.1. SEM images obtained using backscattered electrons and showing nanocomposite thermite powders used in
experiments.
Experimental Details The ESD ignition apparatus based on model 931 firing test system by Electro-Tech Systems, Inc., was described
previously [65, 80]. Briefly, a selected capacitor is charged to a high voltage in the range of 1 – 20 kV. An
electronic trigger is activated to enable the capacitor’s discharge through a high-voltage pin-electrode to the powder
sample. Powder is placed in a holder attached to the second grounded electrode. The high-voltage pin electrode
was connected to a positive plate of the capacitor. Both electrodes were mounted inside a sealed test-chamber,
enabling the experiments to be performed in different environments. In this study, powder samples were prepared as
monolayers adhered to a double-sided carbon tape attached to a brass substrate. The spark gap was maintained close
to 1 mm in all experiments. Induction coils by Pearson Electronics were used to monitor the spark current and
voltage in real time. Optical emission produced by the ignited samples was recorded using filtered photomultipliers
(PMTs). Emission traces as well as the current and voltage traces were recorded using a LeCroy WaveSurfer 64Xs
Series oscilloscope. PMTs were used with and without a fiber optics cable for different measurements. The fiber
optics cable placed about 5 cm from the sample, was coupled to the PMTs for measurements addressing the effect of
particle size and ESD voltage on emission traces. The cable was also used in initial measurements comparing
emission produced at different wavelengths to one another. For the measurements addressing the effect of
environment and powder milling time, a PMT was placed outside of the experimental chamber about 15 cm from the
sample and did not use fiber optics. The former configuration was better suited to distinguish details of radiation
originated from the sample surface, while the latter captured better the emission produced away from the sample.
The results were qualitatively consistent between themselves for both configurations; however, specific temporal
characteristic between emission traces recorded with and without fiber optics were not compared directly to each
other.

50
Prior to an experiment, a slurry of powder in hexane was prepared; the slurry was applied to a double-sided carbon
tape attached to a brass substrate using a small paintbrush. After the slurry dried, compressed air was used to blow
off excess powder to achieve a monolayer coating. The prepared sample was placed under the ESD needle in the
test-chamber. For experiments in vacuum, the chamber was sealed and evacuated. For experiments in argon, the
chamber was evacuated and flushed with argon three times before being refilled with argon to atmospheric pressure.
All experiments used a 2000 pF capacitor. A discharge voltage was selected, the capacitor was charged, and the
spark was triggered. For each voltage, a blank shot with uncoated carbon tape adhered to the brass substrate was
also performed; respective current, voltage, and optical traces were recorded. For each experimental condition, at
least five runs were repeated. The standard deviations of the obtained emission and current pulse characteristics are
shown as error bars while presenting the results.
Results 1. Preliminary observations
Scanning electron microscope images of the imprints left by ESD produced at different voltages on a powder-coated
carbon tape are shown in Fig. 4.2. For a 5-kV discharge, a blank spot, from which the powder was removed has
dimensions of about 200 – 300 µm. Multiple spots indicating the presence of several discharge channels are
observed at increased ESD voltages. Powder outside of the blank spots appears to be undisturbed, although strips of
carbon tape are ejected from the areas struck by the spark and land on the unburned powder. The images are shown
for only one nanocomposite powder; however, similar spark imprints were observed for all materials.
Fig. 4.2. Imprints produced by ESD discharges with different voltages on carbon tape coated with 2.35Al∙3Bi2O3
powder.
Photographs of spark discharges igniting different materials at different spark voltages obtained using a still camera
with an open shutter are shown in Fig. 4.3. An inset in the top left image illustrates the shape of the sample holder
and pin electrode. It also shows the fiber optics cable placed behind the sample. The image in the inset was taken
with an external light source, whereas all spark discharges were photographed in the dark. In all discharge images,
individual particle streaks are visible originating from the powder coating on the carbon tape. The lengths of
particle streaks are greater for the discharges produced at higher voltages. In many streaks, brightness jumps
characteristic of metal combustion [84, 85] are observed. Almost all streaks are observed to end before reaching the
walls of the test-chamber. Somewhat surprisingly, the shortest streaks are observed for 2.35Al∙Bi2O3 material.

51
Fig. 4.3. Pictures of the four powders being ignited with 8kV and 20kV sparks. An inset in the top left image shows
the sample holder/electrode configuration.
Typical recorded traces representing the ESD current, emission produced by the igniting powder, and emission
produced by an empty sample holder are shown in Fig. 4.4. The initial rise in the emission signal is observed within
100 – 200 ns after the initiation of the ESD, in agreement with [81]. For the example shown in Fig. 4.4, the spark
duration equal to the duration of the current trace, is about 2 µs. The blank emission signal decays after about 10 µs.
The emission signal produced by the ignited powder peaks at about 40 µs and remains above the noise level up to
ca. 200 µs. For further processing, the blank signal emission was subtracted from the emission trace obtained with
the powder sample, as illustrated in Fig. 4.4. For the obtained, blank-corrected trace, a peak onset instant was
identified as the inflection point leading to the maximum. In addition, peak position and peak width measured when
the signal was at one half of its maximum value were obtained. Finally, the overall duration of the combustion
event or burn time, was identified (not shown in Fig. 4.4) as the time from the instant of the spark initiation until the
blank-corrected signal decreased to 10% of its peak value.
Fig. 4.4. Top: experimental current and emission traces with (signal) and without powder on the carbon tape (blank).
Capacitor charged to 8 kV. Bottom: experimental emission trace corrected for the blank emission signal.
In preliminary experiments, emission of the igniting samples was monitored using photomultipliers filtered in both
infra-red (700 – 900 nm) and visible (486 – 589 nm) ranges. The traces recorded at different wavelengths did not
have the same shapes, as illustrated in Fig. 4.5, where blank-corrected traces filtered at both 568 and 900 nm are
shown for all four tested materials. The 900-nm signals exhibit broad peaks with their maxima located between 2
Em
issio
n (
a.u
.)
Time, µs
0.1 1 10 100
2Al.Fe2O3As measured
Signal minus blank
Peak onset
Spark current
Peak Position
Peak Width
Signal
Blank-200 A
200 A

52
and 15 µs after the spark initiation. The emission filtered at 568 nm has a small peak at very short times, below 1
µs, followed by a stronger peak occurring at around 20 – 50 µs. Aluminum combustion does not exhibit strong
molecular or atomic emission bands in the infrared emission range suggesting that the signal filtered at 900 nm
tracks mostly thermal radiation of the heated particles and combustion products. The emission filtered at 568 nm,
was selected to not coincide with characteristic AlO emission [86], nonetheless, it could be affected by nearby AlO
bands as indicated by the time-integrated spectra produced by different ignited samples and collected using an
EPP2000 High Resolution Spectrometer by StellarNet Inc. The time-integrated spectra are omitted for brevity.
Emission signals filtered at 568 nm were used in all of the following data analyses as useful indicators of
combustion reactions of interest.
Fig. 4.5. Emission traces filtered at 568 and 900 nm produced by igniting monolayers of different nanocomposite
thermite powders.
2. Effect of particle size One of the prepared powders, 2Al∙Fe2O3, was size classified using a 325 Mesh sieve (opening size of 44 µm).
Ignition experiments were then performed with both coarse and fine fractions of the powder. Results are illustrated
in Figs. 4.6 and 4.7. Somewhat surprisingly, the streaks produced by the ignited finer particles are longer compared
to those generated by the ignited coarse powder fraction (Fig. 4.6). The peak onset occurs earlier for the finer
particles; however, there is no significant difference between the fine and coarse fractions in peak positions, peak
widths, and the overall burn times (Fig.4.7).

53
Fig. 4.6. Photographs of the ignited fine and coarse fractions of the 2Al∙Fe2O3 nanocomposite powder taken with a
camera with an open shutter.
Peak Onset Peak Position Peak Width Burn Time
Tim
e, s
101
102
8kV; 568nm Fine
Coarse
Fig. 4.7. Temporal characteristics of the emission signals produced by fine and coarse fractions of the 2Al∙Fe2O3
nanocomposite powder.
3. Effect of milling time Powders with nominal composition 2Al∙3CuO were prepared with three different milling times: 30, 60, and 80 min.
It was shown by [66] that varied milling times result in different numbers of oxide inclusions per unit mass of the
composite material, whereas the sizes of oxide inclusions remain nearly unchanged. In other words, at shorter
milling times, some of the CuO particles remain unattached to the composite, and the composite is more metal rich
compared to the bulk material composition.
As illustrated in Fig. 4.8, for the ESD produced at 8 kV, the only difference observed between powders prepared at
different milling times is for the peak onset. All other temporal characteristics of the emission signal are effectively
identical for different materials. However, at a higher ESD voltage, 20 kV, there is a consistent increase in the peak
onset delay, in the peak position, and peak width observed for the powders prepared using longer milling times. The
total burn times remain the same for all materials.

54
101
102
103
8kV
Tim
e,
s
101
102
103
20 kV
Peak Peak Peak Burn
onset position width time
Milling Time
30min
60min
80min
Fig. 4.8. Temporal characteristics of the emission signals produced by the 2Al∙3CuO nanocomposite powders
prepared using different milling times.
4. Effect of ESD voltage When the voltage to which the capacitor was charged was increased from 5 to 20 kV, the spark current pulse
duration respectively increased in the range of 1 – 5 µs. Effect of ESD voltage on temporal characteristics of
recorded emission traces for different thermites is illustrated in Fig. 4.9. For all materials, all characteristic emission
times become longer at higher voltages. Comparing different materials to one another, it is apparent that the peak
onset is consistently more delayed and peak width is greater for the 2Al∙MoO3 nanocomposite powder compared to
other materials. Furthermore, the total burn time for the 2Al∙MoO3 nanocomposite powder is consistently longer
than for other powders, for all ESD voltages.

55
0
10
20
30Peak Onset (568nm)
5kV 8kV 20kV
Discharge voltage
0
100
200
300 Burn Time 0
40
80
120 Peak Width
Tim
e,
s
0
20
40
60
80Peak Position
Oxidizer
Bi2O3
CuO
Fe2O3
MoO3
Fig. 4.9. Temporal characteristics of the emission signals produced by different nanocomposite powders initiated by
ESD at different voltages.
5. Effect of environment Characteristic emission traces recorded for different materials ignited in vacuum, argon, and air are shown in Fig.
4.10. Blank signals are subtracted for all traces. For all traces, plotted with a logarithmic time scale, initial
oscillatory patterns show interference with the ESD. It appears that the main emission peak observed in argon
begins consistently later than the peaks in air and vacuum for all materials. Peak amplitudes vary; for 2Al∙3CuO and
2.35Al∙Bi2O3, the strongest peaks are observed in argon. For 2Al∙MoO3 and 2Al∙Fe2O3, the strongest peaks occur in
air.

56
Fig. 4.10. Characteristic emission traces recorded for different materials ESD-ignited in different environments.
Results of processing the recorded emission traces are shown in Fig. 4.11. Peak onset times are consistently short
for vacuum and air, and are much longer for ignition in argon. This is in agreement with the delayed main peak
observed in Fig. 4.12 for traces recorded in argon.
The shortest times for both the peak width and position are observed for ESD ignition in vacuum for all materials.
For the nanocomposite thermites with oxidizers CuO and Bi2O3, the peaks are more delayed and wider in argon
compared to air. Conversely, for the nanocomposite thermites with oxidizers Fe2O3 and MoO3, the peaks occur at
an earlier time and are narrower in argon compared to air.
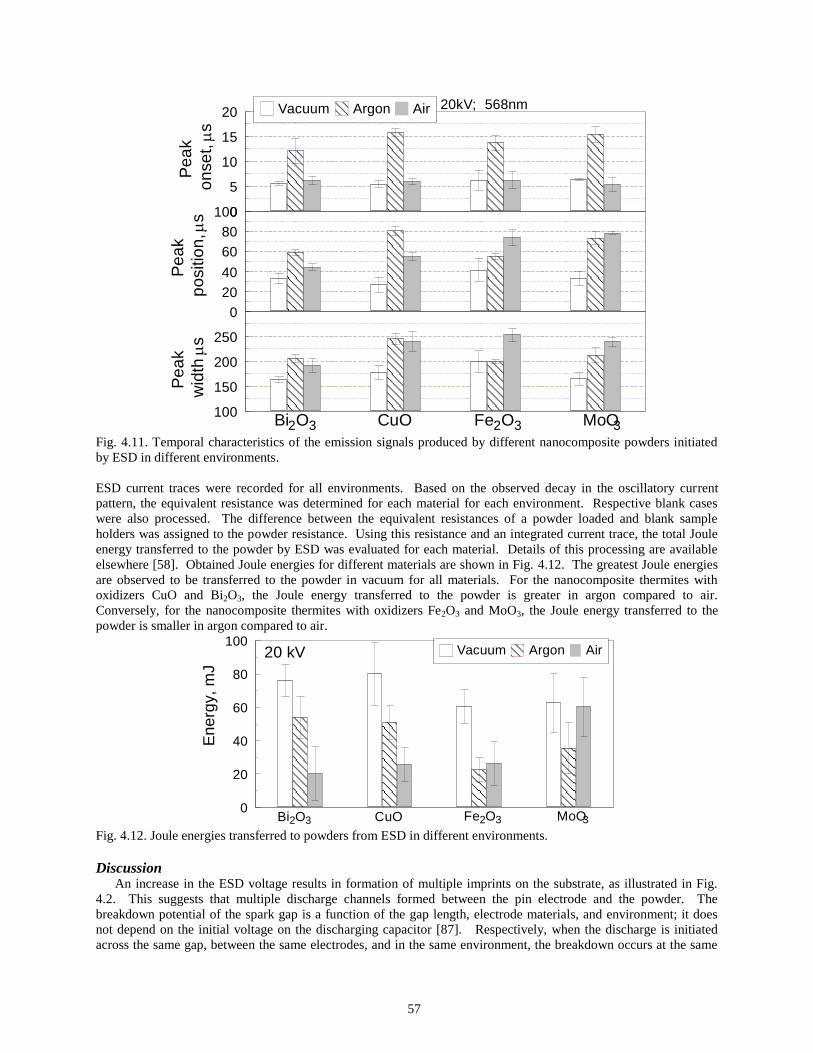
57
0
20
40
60
80
Pe
ak
po
sitio
n,
s 100
Pe
ak
wid
th
s
100
150
200
250
Bi2O3 CuO Fe2O3 MoO3
0
5
10
15
Pe
ak
on
se
t,
s
2020kV; 568nmVacuum Argon Air
Fig. 4.11. Temporal characteristics of the emission signals produced by different nanocomposite powders initiated
by ESD in different environments.
ESD current traces were recorded for all environments. Based on the observed decay in the oscillatory current
pattern, the equivalent resistance was determined for each material for each environment. Respective blank cases
were also processed. The difference between the equivalent resistances of a powder loaded and blank sample
holders was assigned to the powder resistance. Using this resistance and an integrated current trace, the total Joule
energy transferred to the powder by ESD was evaluated for each material. Details of this processing are available
elsewhere [58]. Obtained Joule energies for different materials are shown in Fig. 4.12. The greatest Joule energies
are observed to be transferred to the powder in vacuum for all materials. For the nanocomposite thermites with
oxidizers CuO and Bi2O3, the Joule energy transferred to the powder is greater in argon compared to air.
Conversely, for the nanocomposite thermites with oxidizers Fe2O3 and MoO3, the Joule energy transferred to the
powder is smaller in argon compared to air.
En
erg
y,
mJ
0
20
40
60
80
10020 kV
Bi2O3 CuO
Vacuum AirArgon
Fe2O3 MoO3 Fig. 4.12. Joule energies transferred to powders from ESD in different environments.
Discussion An increase in the ESD voltage results in formation of multiple imprints on the substrate, as illustrated in Fig.
4.2. This suggests that multiple discharge channels formed between the pin electrode and the powder. The
breakdown potential of the spark gap is a function of the gap length, electrode materials, and environment; it does
not depend on the initial voltage on the discharging capacitor [87]. Respectively, when the discharge is initiated
across the same gap, between the same electrodes, and in the same environment, the breakdown occurs at the same

58
voltage. A higher capacitor voltage causes a greater discharge current and a longer discharge duration. At some
voltages, greater current causes parallel channels to form through the discharge gap and through the powder.
An electric spark results in a rapid gas expansion from the discharge kernel, producing a shock wave, which
rapidly decays after the current ceases [88]. This rapid gas expansion explains why the spark-ignited particles are
lifted from the substrate, as shown in Fig. 2 and why they are rapidly accelerated, as evidenced by their long
luminous streaks shown in Fig. 4.3. The characteristic size of the spark imprint is 0.3 mm (determined from SEM
images), it is consistent with a sound wave expanding at ~ 340 m/s for approximately 1 µs, a characteristic spark
duration time. The velocities of the lifted particles can be roughly evaluated by the length of their luminous streaks
and taking into account the overall emission times, measured optically. For ESD at 20 kV, the streak lengths are in
the order of 20 mm, whereas characteristic emission times are limited by approximately 200 µs for all materials.
This yields a particle velocity of about 100 m/s. Considering particle deceleration, this is consistent with particles
being lifted by a shock wave generated by the spark.
The above discussion indicates that particles can only be heated by the spark’s Joule energy during a fraction of
the total spark duration. As soon as the particles are lifted and removed from the substrate, they are no longer
exposed to the ESD current. Note, however, that the spark streamers may move along the substrate and heat
different particles at different times. Because not all particles are lifted or heated simultaneously, the particles that
are lifted and heated later in time, are exposed to a decaying spark current, and thus to a reduced Joule energy,
compared to the particles that were heated as soon as the spark commenced.
With the above understanding of the interaction between the spark and powder, different observations reported
here can be consistently interpreted. The effect of particle sizes on the lengths of the produced luminous streaks
shown in Fig. 4.6 is explained by a greater acceleration caused by the shock wave produced by the spark for smaller
particles compared to larger ones. A shorter time leading to the peak onset for smaller particles (Fig. 4.7) is also
explained by a faster direct heating of smaller particles by the ESD’s Joule energy due to their lower per-particle
heat capacity.
The lack of difference in the peak position, peak width, and the total burn time between fine and coarse particles can
be understood considering that, as suggested earlier [81], the burn time of these nanocomposite particles ignited by
the ESD is likely controlled by heterogeneous reactions within the particles rather than reactions involving the
external particle surface. In other words, the reaction is initiated before the scale of mixing between aluminum and
metal oxide inclusions can be substantially changed, despite aluminum melting. Thus, composite particles continue
reacting nearly volumetrically, with reaction products forming inside composite particles, at the interfaces between
metal and oxidizer. This reaction scenario also explains very short total burn times observed in this work and earlier
[81] for all nanocomposite materials placed in a monolayer and initiated by ESD.
Schematically, the difference between reactions occurring for slowly and rapidly initiated composite particles is
illustrated in Fig. 4.13. A starting particle contains an aluminum matrix with embedded nano-scale oxidizer
inclusions. When heated slowly, so that the temperature gradients in the heated particle are negligible, an aluminum
molten drop is formed that is in contact with agglomerated or coalesced oxidizer inclusions. Aluminum surface
tension pools the metal into a single droplet, pushing oxide inclusions together. The area of the reaction interface
between aluminum and oxidizer is markedly reduced. The reaction occurs both at the surface of the formed
aluminum particle and across the reduced aluminum/oxidizer interface. When the particle is heated rapidly, and
when the temperature gradients are significant inside the particle, it is possible that a portion of the particle is molten
and even heated above the melting point, while the rest of the particle remains solid. Thus, reaction between
aluminum and oxidizer will initiate across initial metal-oxide interfaces existing in the nanocomposite material. A
characteristic time, , separating fast and slow cooling can be roughly evaluated as that necessary for the
temperature to equilibrate across the particle, 𝜏 =𝑑2
𝜅, where d is characteristic particle dimension, e.g., 10 µm, and
is the characteristic thermal diffusivity, that can be conservatively evaluated taking it as characteristic of pure
aluminum, e.g., 9.6∙10-5
m2/s. This estimate yields 𝜏 ≈ 1 µs; for composite particles, this time would certainly be
noticeably longer because of lower thermal diffusivity. Characteristic time of ESD heating for thermite powder
monolayers is of the order of 1 µs or shorter (compare to the spark duration and location of the first peak in Figs.
4.4, 4.5); therefore, the heating is fast and the nanostructure existing in the starting material is likely to be preserved.

59
Al Oxidizer
Fastheating
Slowheating
Molten Al
Al/oxidizerreactioninterface
Agglomerated or coalescedoxidizer inclusions
Fig. 4.13. Schematic illustration of structures of reacting composite particles initiated at different heating rates.
The effect of milling time on the temporal characteristics of the emission signals produced by the 2Al∙3CuO
nanocomposite powders shown in Fig. 4.8 appears somewhat surprising. The lack of difference in the peak position
time, peak width, and the overall burn time for the particles prepared using different milling times and initiated by a
8-kV ESD suggests that all of the listed characteristic times are controlled by the heterogeneous reaction between
CuO inclusions and Al matrix. The dimensions of the CuO inclusions do not depend on the milling time [66], and
thus characteristic times of their reactions are also expected to be the same for different composite powders.
However, a noticeable increase in all characteristic times is observed for particles prepared with longer milling times
when the powder is initiated by a 20-kV ESD. At 20 kV, the discharge pulse lasts longer; respectively, a larger
number of particles from the substrate are heated by its Joule energy and lifted by the produced shock wave. The
interaction between the discharge and powder is extended in time; however, at longer times, the discharge current
diminishes and the Joule energy transferred to the particles becomes smaller. It is thus reasonable to suggest that the
particles prepared using shorter milling times and containing a more metal-rich composite may be more difficult to
ignite. For such less reactive powders, the ESD-powder interaction leading to generation of ignited particles may
cease sooner than for particles milled longer, which will continue igniting even when the ESD current is
substantially reduced. As a result, for the powders prepared with shorter milling times, the generation of ignited
particles by the spark will stop sooner than that for the powders prepared with longer milling times. This can
explain the shift of both emission peak position and peak width to shorter times, as observed in Fig. 4.8.
The effect of ESD voltage on the temporal characteristics of powder emission shown in Fig. 9 can be understood
considering that the higher voltage can lift a greater number of particles. Also, at higher voltage particles can be
accelerated to a greater velocity, and larger size particles can be lifted. A delayed ignition is associated with lifting
larger size particles; in addition, particles moving faster in a cold environment are cooled more effectively, also
leading to an extended ignition delay. The burn times extended at higher ESD voltages can be explained by an
increased effect of interaction between burning particles, in the cases when more particles were lifted and ignited by
the ESD.
It is also interesting to consider the effect of environment on the observed particle emission traces. Spark discharges
produce shock waves in both air and argon; however, no similar shock could have formed in vacuum. Respectively,
ESD heated but not yet burning powder particles could have been lifted in air and argon; such lifted particles would
then be expected to self-heat due to exothermic redox reactions up to the vapor phase flame combustion
temperature. On the other hand, in vacuum the particles were not lifted until they were burning generating volatile
combustion products. Thus, particle velocities must be substantially reduced compared to air and argon. Particles
would also be expected to be ESD heated to higher temperatures in vacuum because, unlike in air or argon, they
remained on the substrate in the absence of a shock wave.

60
In agreement with the above discussion, all characteristic times for the emission signatures produced by all powders
ignited in vacuum in Fig. 4.11 are short. The peak onset occurs sooner because the particles remaining on the
substrate can be heated longer in the ESD, and reach high temperatures faster compared to particles lifted by the
shock in air and argon, and igniting due to their continuing self-heating. Particles that were more significantly pre-
heated by remaining on the substrate and lifted due to generation of the vapor phase products would also be more
consumed before being airborne, generating respectively shorter ensuing emission pulses.
Shorter peak onset times observed for the powders ignited in air compared to those in argon can be explained
considering that during these times lifted particles self-heat due to redox reaction. In argon, such reactions are
limited to those between aluminum and oxide inclusions, whereas in air the particle surface can also react with
surrounding oxygen. It is proposed that the additional reaction with air accelerates self-heating. Note that in
addition to direct aluminum-oxygen reaction, oxide inclusions exposed to air can be re-oxidized readily while being
simultaneously reduced by reaction with aluminum.
Relative values of peak positions and peak widths of the emission pulses generated in air and argon can be
correlated with the respective Joule energies of ESD measured in these environments. In both cases, the data show
different trends for different materials. For both composites using Bi2O3 and CuO as oxidizers, a greater Joule
energy is supplied from ESD to the powder in argon than in air. Respectively, both emission peak width and peak
position for these materials are greater in argon. Conversely, for the composites with Fe2O3 and MoO3 as oxidizers,
the ESD in air generates more Joule energy than in argon (Fig. 4.12). Both emission peak width and peak position
for these materials are greater in air. It is generally understood that a greater Joule energy causes more particles to
ignite, generating respectively longer burn times. The difference in Joule energies transferred to different powders
in different environments must be assigned to individual properties of powder particles serving as the discharge
electrodes.
Because correlations between observed Joule energies and emission peak characteristics are noted, these
correlations are shown graphically in Fig. 4.14. The plot shows peak position vs. Joule energy for all materials; a
similar plot could have been made for the peak width. It is interesting that two distinct correlations are observed.
For vacuum, a greater Joule energy causes shorter times for the emission peak position. This trend is, indeed
expected for the particles that are more heated and more consumed directly by the spark while remaining on the
substrate, resulting in shorter emission pulses associated with their ensuing vapor phase combustion. An opposite
trend, with longer times for the emission peak position for greater Joule energies is observed for both air and argon.
At greater Joule energies, it is expected that a stronger shock was generated by ESD, lifting more particles and
accelerating them to greater speeds. Respectively, longer emission pulses were produced in these environments.
Joule energy, mJ
0 20 40 60 80 100
Pe
ak p
ositio
n,
s
0
20
40
60
80
100
Air
Argon
Vacuum
Fig. 4.14. Correlation between ESD Joule energy and emission peak position for different environments (each
symbol represents a different material, cf. Figs. 4.12, 4.13).
Finally, it is discussed whether the present observations correlate with recently quantified kinetics of thermally
activated reactions in nanocomposite thermites [16, 66] [68]. Based on thermo-analytical measurements, the models
for Al·CuO [16, 69] and for Al·MoO3 [68] nanocomposite thermites presented the redox reaction as a sequence of

61
individual steps. At low temperatures, the reaction was described by Cabrera Mott mechanism [89], in which the
reaction rate decreases with the increase in thickness of the produced layer of product, Al2O3. For higher
temperatures and thicker oxide layers, polymorphic phase changes in the growing Al2O3 are considered, affecting its
diffusion resistance. It is interesting whether the models derived based on the very low heating rate measurements
can predict a meaningful self-heating of the nanocomposite thermite powders pre-heated by the ESD at very high
rates. In order to be meaningful, the self-heating should raise the powder temperature substantially, enabling an
accelerated redox reaction and formation of vapor-phase species expected during combustion of these materials. In
addition, the self-heating should occur in the time frame comparable to the experimental peak onset times.
The self-heating anticipated based on the proposed reaction kinetics is estimated here with several simplifying
assumptions. It is first assumed that the particles are pre-heated by the ESD instantaneously to a specific initial
temperature, so that no redox reaction has occurred during this pre-heating. It is further assumed that only Cabrera-
Mott kinetics should be accounted for, considering that the reactions of interest occur with very thin initially formed
aluminum oxide layers.
With the assumptions above, it was first established that particles of 2Al·3CuO and 2Al·MoO3 should be pre-
heated to 449 and 540 K, respectively, in order for them to continue self-heating due to the redox reaction while
being exposed to the quiescent room temperature air. This threshold temperature increases when particle motion in
air is accounted for. Separate estimates considering the experimental spark energies suggest that such low
temperatures can be reached after only 15 – 20 ns exposure of composite particles to the ESD. Particles are
expected to be lifted by the shock wave after about 3-30 ns, once they are shifted by a distance comparable to their
diameter, 1 – 10 µm, by a shock wave propagating at about 300 m/s. Thus, a very rapid initial heating of composite
particles is indeed expected to occur in the ESD, leading to their further self-heating due to heterogeneous
exothermic reactions.
The initial self-heating may be very slow from the threshold temperature, although its rate increases when the initial
pre-heating temperature becomes higher. As the initial particle temperature becomes greater, the particles were
predicted to self-heat faster and reach higher temperatures.
Results of calculations for both 2Al·3CuO and 2Al·MoO3 nanocomposite thermites are shown in Fig. 4.15.
Particles with average sizes shown in Table 4.1 were considered in a room temperature environment. All curves
show an increase in the particle temperature due to heterogeneous exothermic reactions followed by cooling, when
most of the material is consumed and reaction slows down. Vertical lines show times when peak onset and peak
positions are observed experimentally, cf. Fig. 4.11. When a 2Al·3CuO particle is initially heated to about 550 K, it
begins to self-heat appreciably only after 100 µs. Such a particle is, therefore, unlikely to ignite. However, if the
same particle is pre-heated to about 900 K, it self-heats much faster and may rich about 1200 K after a few
microseconds, in time comparable to the experimental delay until the peak onset. Still greater initial temperatures
do not affect the self-heating rate noticeably, while leading to the proportionately greater particle temperatures
achieved in a several microseconds. For 2Al·MoO3 particles, the initial temperatures should be greater in order for
the predicted self-heating to become substantial. This is consistent with the observed greater Joule energies that
must be transferred to the powder in air prior to its ignition (cf. Fig. 4.12). During several microseconds, particles
are predicted to self-heat by about 100 K, when their initial temperatures vary from 1000 to 1500 K. This self-
heating is relatively weak, implying that additional processes, not accounted for in the reaction model, may assist
ignition. Such processes may involve accelerated transport mechanisms of reacting species, Al and O ions, through
a very thin Al2O3 layer, which can be heated to high temperatures without appreciable increase in its thickness, a
situation that cannot be achieved in thermo-analytical experiments.

62
Te
mp
era
ture
, K
0
500
1000
1500
20002Al.3CuO
Time, s
10-9
10-8
10-7
10-6
10-5
10-4
10-3
10-2
0
500
1000
1500
20002Al.MoO3
Experimental peak onset Peak position
Fig 4.15. Temperatures predicted to be achieved at different times as a result of self-heating of 2Al·3CuO and
2Al·MoO3 particles pre-heated by ESD instantaneously to various starting temperatures.
Conclusions Reactive nanocomposite 2Al∙3CuO, 2.35Al∙Bi2O3, 2Al∙Fe2O3, and 2Al∙MoO3 powders prepared by arrested reactive
milling placed in monolayers on a conductive substrate are ignited by ESD in air, argon, and vacuum, generating
multiple individual burning particles. The onset of the emission pulse produced by the burning particles occurs after
the ESD current ceases. The duration of the produced pulse is in the range of 80 – 250 µs for all materials studied.
Many different processes associated with interaction between ESD and composite powders, as well as specific
powder characteristics need to be accounted for in order to understand experimental results. The longest emission
duration is observed for the nanocomposite thermite using MoO3 as an oxidizer. The reaction rates of the ESD-
initiated powders are defined primarily by the scale of mixing of and reactive interface area between fuel and
oxidizer in the composite materials rather than by the external particle surface or particle dimensions. In vacuum,
particles are heated by ESD while remaining on the substrate until they begin generating gas combustion products.
In air and argon, particles initially pre-heated by ESD are lifted by the generated shock wave and continue self-
heating while being airborne due to heterogeneous redox reactions. Greater ESD voltages result in longer electrical
pulses and, respectively, longer lived shock waves. Accordingly, more particles are pre-heated and lifted up at
greater ESD voltages in air and argon, producing more delayed and longer emission pulses. The ESD current
diminishes in time, so that particles pre-heated and lifted by the end of the current pulse are less likely to ignite.
Shock-lifted particles move at very high speeds (~100 m/s), so that cooling by the surrounding gas is substantial. In
an oxidizing environment, this cooling is partially offset by an exothermic particle surface reaction with gas. The
Joule energy transferred from ESD to powder depends on both the gas environment and the particle compositions; in
turn, the Joule energy affects the number of the ignited particles, their initial velocities, and respective temporal
characteristics of the produced emission pulses. During the time comparable to the experimental onset time for the
emission peak, kinetic model obtained from thermo-analytical measurements for nanocomposite thermites using
MoO3 and CuO as oxidizers predict appreciable self-heating for the particles assumed to be pre-heated by ESD
instantaneously. This self-heating is more substantial for the particles with CuO oxidizer; additional processes not
accounted for by the present reaction kinetics may assist ignition for powders with MoO3.
5. Modes of ignition of powder layers of nanocomposite thermites by electro-static
discharge
Introduction Recent work suggested that two different ignition modes occur for nanocomposite thermite powders ignited by
electrostatic discharge (ESD) [90]. Monolayers of powders ignited instantaneously as reported in detail in Ref. [91].
It was also shown that timing of such instantaneous ignition is comparable to that of shock initiation in the same
materials [92, 93]. Respective burn times did not exceed 100 – 200 µs. Thicker layers of nanocomposite thermite
powders were observed to ignite with certain delays; the burn times were also longer, spanning several ms. These

63
longer burn times were comparable to those observed for individual nanocomposite thermite particles of the same
materials ignited by a laser beam [83]. Qualitative differences between the observed ignition modes are interesting
and indicative of different combustion mechanisms. Because of a wide range of potential applications for thermite
combustion, including pyrotechnic compositions [94, 95], propellants [14, 96], and explosives [97-99],
understanding related combustion mechanisms would enable one to tune and control the burn rate and other
parameters, such as flame temperature of the respective energetic materials.
The objectives of this study are twofold. First, it is desired to expand the range of available experimental data
describing ignition of reactive nanocomposite thermite powders by ESD. These data are useful for better
understanding of the ESD ignition mechanisms. In particular, it is of interest whether a recently developed model of
ESD ignition of metal powders [62] is applicable for describing ignition of nanothermites. Second, it is of interest to
understand why the same nanocomposite thermites can burn differently depending on the mode of their initiation.
Mechanisms of combustion of nanocomposite thermites are poorly understood; better experimental characterization
aimed to understand such mechanisms would enable one to design energetic systems and devices using novel
nanocomposite thermites with broadly variable and tunable performance.
Materials Following our recent work [91], four aluminum-based nanocomposite thermite powders were prepared by Arrested-
Reactive Milling (ARM) (2.35Al∙Bi2O3, 2Al∙Fe2O3, 2Al∙3CuO and 2Al∙MoO3). The starting powders used were:
aluminum -325 mesh, 99.5% purity by Atlantic Equipment Engineers; copper(II) oxide, 25 μm, 99+% purity by
Sigma Aldrich; bismuth(III) oxide, -325 mesh, 99% purity by Skylighter; molybdenum trioxide, -325 mesh, 99.95%
purity by Alfa Aesar; and iron(III) oxide, -325 mesh, 99.5% purity by Alfa Aesar. All prepared composite powders
had compositions close to stoichiometric thermites: 2Al·3CuO, 2.35Al·Bi2O3, 2Al·Fe2O3, and 2Al·MoO3. They
were prepared using a customized Retsch PM400 planetary mill, 9.525 mm (3/8”)-diameter hardened steel balls as
milling media, and hexane as a process control agent. The custom-made hardened steel vials used were capable of
withstanding a pressure increase that might occur if the material reacts during the milling. Each vial was loaded with
30 g of powder; the ball to powder mass ratio was 3 and the amount of hexane varied from 24 to 48 ml per vial. The
milling times are shown in Table 5.1. Prepared powders were kept under hexane. The storage time varied from
several months to 2 years; no change was observed by differential scanning calorimetry for the powders stored under
hexane. Particle sizes were characterized using a Beckman-Coulter LS230 Enhanced Particle Analyzer. Average
particle sizes are listed in Table 5.1. The size distributions are consistent with previously published results [90],[91].
All powders have broad size distributions and characteristic shapes typical of materials prepared by ball milling.
Electron microscopy images of the prepared powders were presented elsewhere, showing characteristic produced
structures of aluminum matrix with nano-sized oxide inclusions [19, 37].
Table 5.1 Average particle sizes and milling times for the composites used in the experiments
Material Composition (Moles)
Milling Time, min
Average Particle Size (volume based), µm Standard Deviation in parentheses
2Al∙3CuO 60 10.6 (7.9) 2.35Al∙Bi2O3 150 10.2 (7.9) 2Al∙Fe2O3 60 9.3 (9.1) 2Al∙MoO3 60 9.3 (8.3)
Experimental Details The ignition device used was a 931 model firing test system from Electro-Tech Systems, Inc. ESD apparatus. A
capacitor was charged to a voltage between 1 and 20 kV. The capacitor was then discharged through a high-voltage
pin-electrode placed about 1 mm above the powder sample. The pin-electrode was connected to the positive plate of
the capacitor. The negative plate of the capacitor was grounded. The powder was placed in a 0.5-mm deep, 6.7-mm
diameter cylindrical cavity in a brass plate serving as a grounded sample holder. Powder filled the cavity
completely; a razor blade was used to remove excess material from the holder and obtain a flat top surface for the
loaded powder. Using this sample holder ensured a powder layer thickness of 0.5 mm for all experiments. The
discharge was triggered electronically. A 2,000 pF capacitor was used in most experiments. In selected
experiments, 10,000 pF capacitors were used as specified below.

64
This setup was described in further detail elsewhere [65, 90]. For particle collection, an aluminum foil cleaned with
acetone was placed 18 – 22 mm away from the sample holder. The aluminum foil was mounted on scanning electron
microscopy (SEM) stubs with double-adhesive carbon tape in order to not unnecessarily disturb the particles after
collection. The electrode, sample holder, and the ESD chamber walls were also cleaned using acetone before and
after every use to ensure no contamination between samples. The brass sample holder was weighed before and after
each experiment using an Acculab ALC-80.4 balance. Thus, the portion of the powder consumed during the
ignition test was quantified.
Two types of photo sensors were used. A set of measurements relied on a single Hamamatsu E849-34
photomultiplier tube (PMT) equipped with an interference filter centered at 568 nm. The PMT output was
connected to a LeCroy WaveSurfer 64Xs Series oscilloscope. The signal was acquired with a time step of 0.1 µs.
For other measurements, a 32-channel H7260 series linear array multianode PMT assembly by Hamamatsu was
used. The PMT assembly was combined with a spectrometer; the wavelength range covered was 373.4 – 641.0 nm.
The signal output from each anode was sent to a separate channel of a 32-channel data acquisition system combining
four NI PCI-6133 DAQ-boards by National Instruments. The data acquisition system was coupled to a virtual
instrument custom-designed using LabView 8.5 software. The 32-signal sets were acquired with a time step of 5 µs,
limited by the DAQ board speed. Data processing was performed in MATLAB using a custom-designed code.
For temperature measurements, spectra recorded for each acquired time step were matched with Planck’s law
treating temperature as an adjustable variable. The emissivity, , was assumed to be constant, implying a gray body
emission. A wavelength-depending emissivity, e.g., following a ~-2.94
trend [100] was tried; however, the
goodness of fit for the respective Planck’s curves (see below for details) was substantially reduced; thus the gray
body assumption was maintained. Before the measurements the output of the 32-channel spectrometer was
calibrated. For calibration, emission spectra produced by a tungsten filament lamp were recorded and compared to
those obtained using a StellarNet EPP-2000 spectrometer. A calibration function adjusting output of each channel
was generated and applied for all subsequent measurements. Calibration was performed for the range of
temperatures 1500-2800 K.
An example of recorded emission signals and respective spectra matched with different Planck’s curves is shown in
Fig. 5.1. It is apparent that the Planck’s curve is shifting for different times, indicating a change in the inferred gray
body temperature. Goodness of fit of the measured spectra with the Planck’s curve was evaluated using the
coefficient of multiple determination, or R2 calculated in MATLAB. The R
2 values became greater than 0.9 at the
emission peaks for all spectra. The values of R2 ranged between 0.9 and 1.0 while the emission signals decayed from
their peak values. R2 smaller than 0.9 but greater than 0.8 were noted at earlier times, in particular, when very high
temperatures were implied by the Planck’s curves.

65
Fig. 5.1. Emission traces obtained using the 32-channel PMT/spectrometer assembly and spectra recovered at three
characteristic times along with respective Planck’s blackbody fits. The signal is recorded for the ESD-ignited
2Al·3CuO nanocomposite thermite.
Results 1. Ignition modes
Emission traces recorded by a single PMT filtered at 568 nm are shown in Fig. 5.2. Note that the signals produced
by the spark without a powder load are much weaker than those shown and decay well before 10 µs. Two distinct
ignition modes for the nanothermites were observed; they will be referred to as prompt and delayed ignition.
Prompt ignition resulted in an optical emission with an onset of less than 10 µs, immediately after the electric spark.
The onset was defined as the leading inflection point. This timing was comparable to that observed in experiments
where the same thermite powders were ESD-ignited as monolayers [91]. Prompt ignition was observed for
2Al∙Fe2O3 and 2.35Al∙Bi2O3 powders at 12 kV, but for 2Al·3CuO and 2Al·MoO3 only at 20 kV and using a 10,000
pF capacitor. Delayed ignition caused an emission peak around 1 ms or later. Delayed ignition was observed for all
powders. Powders with CuO and MoO3 serving as oxidizers showed only delayed ignition at lower ignition
voltages.
Ignition was generally accompanied by sound. At 12 kV and 2,000 pF, the sound produced by the ignited powder
was substantially stronger when only delayed ignition occurred (oxidizers CuO and MoO3) compared to cases of
prompt ignition (oxidizers Bi2O3 and Fe2O3).
0
2
4
6600 µs: before emission peak. R
2=0.761
Inte
nsity, V
0
2
4
6995 µs: at rmission peak. R
2=0.840
0
1
2
2000 µs: after emission peak. R2=0.946
Wavelength, nm
350 400 450 500 550 600 650
Time, s100 1000
1
3
5
Inte
nsity,
V
2Al-3CuO - 10kV - Air 995 µs
2000 µs
600 µs

66
Figure 5.2 illustrates differences in signals produced by experiments, in which prompt ignition was or was not
observed. For 2Al∙Fe2O3 and 2.35Al∙Bi2O3 powders, the prompt ignition peak originated during the ESD discharge
pulse. The discharge pulse has a duration in the range of 0.5 – 5 µs, depending on the voltage. For 2Al·3CuO and
2Al·MoO3, ignited at 10 and 12 kV, respectively, emission was only detected more than 100 µs after the end of the
ESD discharge. Emission signals are normalized in Fig. 2, so it is not apparent that the overall intensities of the
emission signals produced by delayed peaks for 2Al·3CuO and 2Al·MoO3 were much greater than those for
2Al∙Fe2O3 and 2.35Al∙Bi2O3.
When the ESD voltage was increased to 20 kV and the capacitor used was 10,000 pF, emission signal for the
ignited 2Al·3CuO and 2Al·MoO3 originated immediately after the spark, indicating prompt ignition. The delayed
ignition still occurred in those experiments following the prompt ignition, as illustrated in Fig. 5.2, where large
secondary peaks are observed for the signals describing experiments with 20-kV discharges. Respective traces
shown in Fig. 5.2 were acquired with a reduced voltage applied to the PMT, to accommodate a much stronger
overall light intensity.
For 2Al∙Fe2O3, emission traces always included two overlapped peaks. To determine the characteristics for
prompt and delayed ignition separately, the signal was curve-fitted with two separate peaks. Free software, Fityk,
was used for the curve fitting; it was found that two log-normal peaks can describe the experimental traces relatively
well, as illustrated in Fig. 5.2.
For 2.35Al∙Bi2O3, only the prompt ignition peak was observed in most experiments. In some cases, however, a
second, well delayed emission peak was observed. When the delayed peak was observed, it was noted that the
entire powder load was ejected from the brass holder resulting in the formation of a large burning aerosol cloud. As
further discussed below, delayed ignition is attributed to the combustion of aerosolized powder cloud in this and
other cases. The example shown in Fig. 5.2 includes a portion of such a delayed peak. The shape of the prompt peak
did not appear to change whether or not the delayed emission was observed. Attempts to identify specific conditions
for which the delayed peak occurred reproducibly were not successful.

67
Fig. 5.2. Normalized emission traces recorded at 568 nm for different nanocomposite thermite powders ignited by
ESD. Sensitivity of the PMT is reduced for the thermites with CuO and MoO3 as oxidizers to accommodate
substantially brighter emission. For 2Al·Fe2O3, results of curve-fitting using two lognormal functions are also
shown.
In addition to different optical emission signatures, different ignition modes ejected different amounts of powder in a
single experiment. In a set of experiments, the sample holder containing powder was weighed before and after each
ignition test. Table 5.2 shows the results of the powder loss measurements. For experiments at a lower voltage and
using 2,000 pF capacitor, the powders that did not show a prompt ignition peak lost the most material, with only a
small amount of powder remaining in the sample holder. Conversely, powders exhibiting prompt ignition lost less
than a third of the available mass; thus most of the material remained in the sample holder after the ESD ignition
test.
0.2
0.4
0.6
0.8
1.02.35Al-Bi2O3; 12 kV
No
rma
lize
d E
mis
sio
n
0.2
0.4
0.6
0.8
1.02Al-Fe2O3; 12 kV
0.2
0.4
0.6
0.8
1.0
2Al-3CuO; 10 kV
Time, s
1 10 100 1000 10000
0.0
0.2
0.4
0.6
0.8
1.0
2Al-MoO3; 12 kV
2Al-3CuO; 20 kV, 10,000 pF
2Al-MoO3; 20 kV, 10,000 pF
Lognormal functionsused for curve-fitting

68
Table 5.2. Portion of material lost after ignition of the powders by ESD
Material Ignition
Voltage (kV) Capacitor,
pF Runs
Material loaded (mg)
Percentage of Material Lost
Prompt ignition
2Al·Fe2O3 12 2,000 4 12.2 ± 1.5 23.5 ± 10.4 Yes
2.35Al·Bi2O3 12 2,000 4 15.8 ± 1.1 32.6 ± 22.6 Yes
2Al·3CuO 10 2,000 5 17.8 ± 4.6 89.0 ± 1.1 No
2Al·MoO3 12 2,000 4 7.8 ± 1.4 81.4 ± 3.9 No
2Al·3CuO 20 10,000 2 14.7 ± 0.1 89.0 ± 6.4 Yes
2Al·MoO3 20 10,000 2 14.6 ± 0.1 71.7 ± 3.8 Yes
2. Prompt ignition Traces recorded using a single filtered PMT, such as those shown in Fig. 5.2, were used to determine temporal
characteristics of the prompt ignition peaks. These characteristics were the same as identified in Ref. [91] for
emission signals produced by the ignited monolayers of the same powders. The peak onset was determined as the
inflection point leading to the maximum. The peak position was obtained from the signal directly, or from the curve
fit in the case of overlapping prompt and delayed emission peaks. The peak width was measured when the signal
was at one half of its maximum value. Finally, the burn time was found as the time from the instant of the spark
initiation until the signal decreased to 10% of its peak value.
For 2Al·Fe2O3, the temporal characteristics of the prompt ignition were based on the first of the overlapping
lognormal peaks obtained as a result of curve fitting. Results are shown in Fig. 5.3, where for comparison, similar
temporal characteristics are also shown for the ignited powder monolayers [91]. General trends are the same for
both 2Al·Fe2O3 and 2.35Al·Bi2O3 powders. The present data for prompt ignition for 0.5 – mm thick powder layers
indicate a faster peak onset compared to the respective monolayers. It is possible that, at least partially, the
accelerated onset of reaction is associated with a higher ESD voltage: 12 kV and 10 kV (depending on the thermite,
see table 5.2) for 0.5-mm thick layer vs. 8 kV for monolayer. Conversely, all other characteristic times
corresponding to the peak position, width, and duration of the emission signal are somewhat greater for the 0.5-mm
thick powder layers.
For 2Al·3CuO and 2Al·MoO3 powders, the onset of the prompt ignition peak occurs very rapidly, within a few µs,
and is difficult to distinguish from the end of the ESD. The onsets are shifted to somewhat longer times for the 0.5-
mm thick powder layers. The peak positions are similar to those observed for respective monolayers, as well as to
those of the other materials. As for the other powders, peak widths and duration are greater for 0.5-mm thick
powder layers compared to those of monolayers.
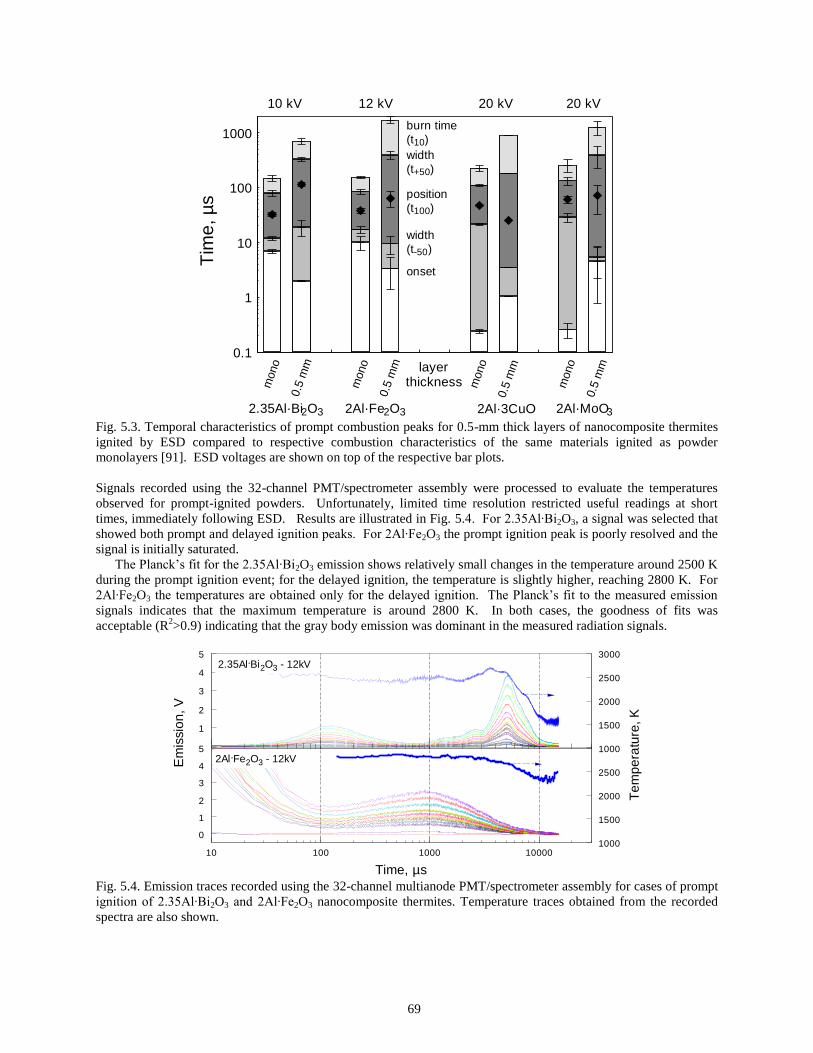
69
mono
0.5
mm
mono
0.5
mm
mono
0.5
mm
mono
0.5
mm
Tim
e, µ
s
0.1
1
10
100
1000
layerthickness
width
(t+50)
width
(t-50)
position
(t100)
burn time
(t10)
onset
10 kV 12 kV 20 kV 20 kV
2Al·Fe2O32.35Al·Bi2O3 2Al·3CuO 2Al·MoO3 Fig. 5.3. Temporal characteristics of prompt combustion peaks for 0.5-mm thick layers of nanocomposite thermites
ignited by ESD compared to respective combustion characteristics of the same materials ignited as powder
monolayers [91]. ESD voltages are shown on top of the respective bar plots.
Signals recorded using the 32-channel PMT/spectrometer assembly were processed to evaluate the temperatures
observed for prompt-ignited powders. Unfortunately, limited time resolution restricted useful readings at short
times, immediately following ESD. Results are illustrated in Fig. 5.4. For 2.35Al∙Bi2O3, a signal was selected that
showed both prompt and delayed ignition peaks. For 2Al∙Fe2O3 the prompt ignition peak is poorly resolved and the
signal is initially saturated.
The Planck’s fit for the 2.35Al∙Bi2O3 emission shows relatively small changes in the temperature around 2500 K
during the prompt ignition event; for the delayed ignition, the temperature is slightly higher, reaching 2800 K. For
2Al∙Fe2O3 the temperatures are obtained only for the delayed ignition. The Planck’s fit to the measured emission
signals indicates that the maximum temperature is around 2800 K. In both cases, the goodness of fits was
acceptable (R2>0.9) indicating that the gray body emission was dominant in the measured radiation signals.
Em
issio
n, V
1
2
3
4
5
1000
1500
2000
Te
mp
era
ture
, K
2500
30002.35Al.Bi2O3 - 12kV
Time, µs
10 100 1000 10000
0
1
2
3
4
5
1000
1500
2000
2500
2Al.Fe2O3 - 12kV
Fig. 5.4. Emission traces recorded using the 32-channel multianode PMT/spectrometer assembly for cases of prompt
ignition of 2.35Al∙Bi2O3 and 2Al∙Fe2O3 nanocomposite thermites. Temperature traces obtained from the recorded
spectra are also shown.

70
Combustion products collected on aluminum foil placed in proximity of the sample holder were examined using an
SEM; characteristic images are shown in Fig. 5.5. Combustion products of both 2.35Al∙Bi2O3 and 2Al∙Fe2O3
contain molten and oxidized particles, which clearly experienced high temperatures, mixed with particles that appear
unignited and thus could have remained cold. The latter particles have the same shapes, sizes, and surface
morphology as the powders originally prepared by ARM. Some of the molten and oxidized particles, especially for
products of 2.35Al∙Bi2O3, have interesting shapes showing precipitation of a brighter, Bi-rich phase from the melt.
No large scale separation between aluminum oxide and bismuth or iron-rich phases was observed, similar to the
products obtained from the powder monolayers [91]. It is also interesting that many molten and unignited particles
were observed to be in direct contact with each other. Such contacts could cause ignition of the colder particles and,
conversely, quenching of the burning particles.
Fig. 5.5. SEM images of product particles collected after prompt combustion events
3. Delayed Ignition Characteristic emission traces recorded using a 32-channel multianode PMT/spectrometer assembly are shown in
Fig. 5.6 for both nanocomposite thermite powders, which exhibited only delayed ignition at reduced ESD voltages.
Respective temperatures are also shown for both materials. The Planck’s formula did not fit the experimental spectra
well at earlier times, when the emission intensity was increasing (R2<0.9). The goodness of fits improved
substantially for the decaying parts of the emission traces (R2 approaching 1.0). This suggests that the growing
portion of the emission traces was accompanied by substantial vapor phase reaction generating optical emission
different from the gray body radiation. Respectively, the temperatures inferred from fitting the recorded spectra by
Planck’s curve prior to the emission peak may be erroneous. The accuracy of temperature measurements for the
decaying portions of the traces is better. Observed temperatures are substantially greater than those shown in Fig.
5.4 for promptly ignited powders.

71
Time, µs
100 1000 10000
Em
issio
n, V
0
1
2
3
2Al-MoO3 - 12kV
Te
mp
era
ture
, K
1000
2000
3000
4000
0
2
4
6
8
102Al-3CuO - 10kV
1000
2000
3000
4000
5000
Fig. 5.6. Emission traces recorded using the 32-channel multianode PMT/spectrometer assembly for cases of
delayed ignition of 2Al∙3CuO and 2Al∙MoO3 nanocomposite thermites. Temperature traces obtained from the
recorded spectra are also shown.
Average temperatures obtained from such traces as shown in Figs. 5.4 and 5.6 are shown in Fig. 5.7. Clearly, the
powders exhibiting prompt ignition have substantially lower flame temperatures compared to those, which only
show delayed ignition pattern.
2Al-3CuO 2Al-MoO3 2.35Al-Bi2O3 2Al-Fe2O3
Te
mp
era
ture
, K
0
1000
2000
3000
4000
5000
6000
R2 (
Me
asu
re o
f g
oo
dn
ess o
f fit)
0.80
0.85
0.90
0.95
1.00
Fig. 5.7. Temperatures corresponding to the delayed ignition peak position obtained from the measured emission
spectra.
Temporal characteristics of the emission pulses produced by the delayed combustion are shown in Fig. 5.8. For all
materials, peaks recorded using a single PMT filtered at 568 nm were used for this analysis. For 2Al·Fe2O3, the
processing used the second peak inferred from the curve-matching (see Fig. 5.2). Aside from substantial differences
in the peak onset, other characteristics are fairly similar for all materials. The peak position shifts within a few ms.
Similarly consistent between materials are the peak width and burn time. Overall, the characteristic times are
longest for the nanocomposites with MoO3 as an oxidizer.

72
Tim
e, µ
s
100
1000
10000
Al-3CuO Al-MoO3 Al-Bi2O3 Al-Fe2O3
width (t+50)
width (t-50)
position (t100)
burn time (t10)
onset
Fig. 5.8. Temporal characteristics of the emission signals produced from ESD ignitions
Combustion products quenched on an aluminum foil placed about 18 mm away from the powder are shown in Fig.
5.9 for both materials, for which only delayed ignition peaks were observed at reduced ESD voltages. Unlike
combustion products shown in Fig. 5.5, almost no unreacted particles are found. Shapes of most particles are
indicative of solidification of high-temperature molten droplets. For products of both 2Al·3CuO and 2Al·MoO3,
aluminum oxide is separated from the reduced metal or its oxide. Darker portions of the particles in both left and
right images in Fig. 8 show Al2O3, while brighter portions show compositions rich in Cu and Mo, respectively. The
scale of separation between phases is substantially greater for these materials compared to the products collected for
the powders exhibiting prompt ignition (cf. Fig. 5.5). This coarser structure suggests that the nano-scaled structure
of the ARM-prepared materials was destroyed upon their ignition. The separation of molten aluminum and oxidizer
inclusions caused longer characteristic reaction times, consistently with the experimental optical emission traces.
For products of 2Al·3CuO, product particles are very close to one another, indicating that agglomeration could have
been substantial. Particles are also more deformed from spherical shapes, suggesting that they struck the substrate
with relatively high velocities. Conversely, products of 2Al·MoO3 are fairly spherical. Their shapes suggest that
particles could have solidified before striking the surface. It is also possible that they did not move at appreciable
velocities before the impact. It is also noted that particles are further apart from one another.
2 Al.3CuO 2 Al.MoO3
Fig. 5.9. SEM images of combustion products for 2Al·3CuO and 2Al·MoO3 composite powders, exhibiting only
delayed ignition.
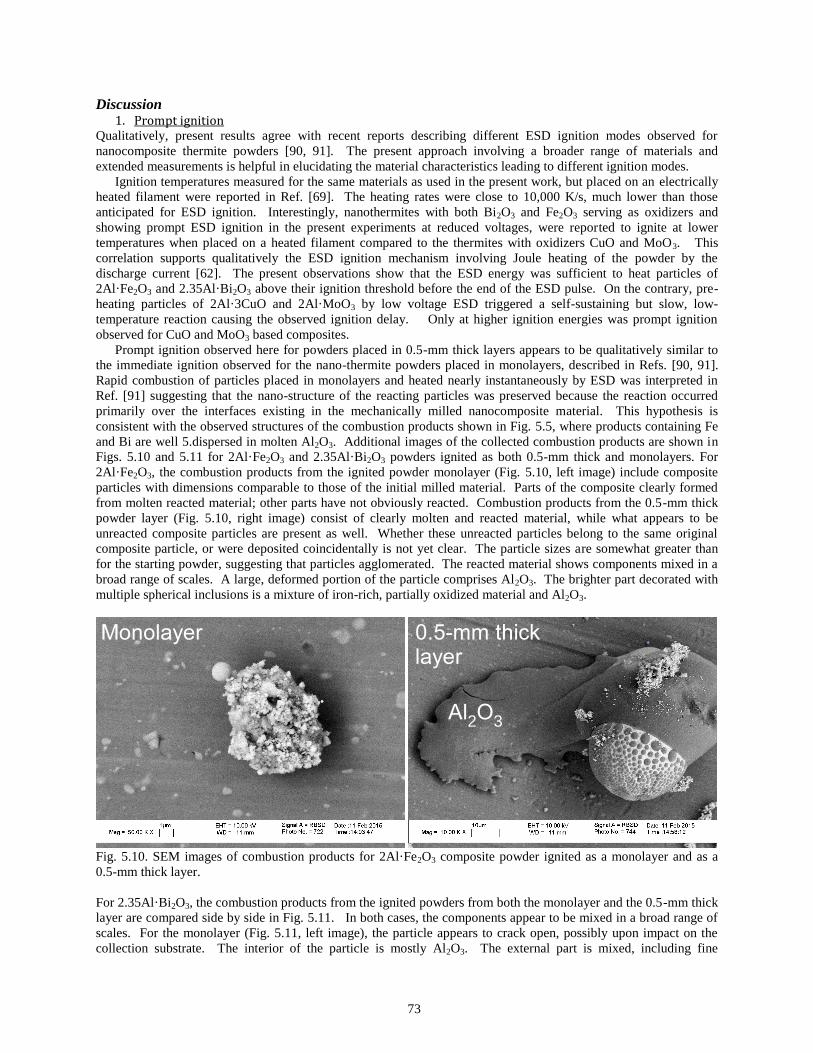
73
Discussion 1. Prompt ignition
Qualitatively, present results agree with recent reports describing different ESD ignition modes observed for
nanocomposite thermite powders [90, 91]. The present approach involving a broader range of materials and
extended measurements is helpful in elucidating the material characteristics leading to different ignition modes.
Ignition temperatures measured for the same materials as used in the present work, but placed on an electrically
heated filament were reported in Ref. [69]. The heating rates were close to 10,000 K/s, much lower than those
anticipated for ESD ignition. Interestingly, nanothermites with both Bi2O3 and Fe2O3 serving as oxidizers and
showing prompt ESD ignition in the present experiments at reduced voltages, were reported to ignite at lower
temperatures when placed on a heated filament compared to the thermites with oxidizers CuO and MoO3. This
correlation supports qualitatively the ESD ignition mechanism involving Joule heating of the powder by the
discharge current [62]. The present observations show that the ESD energy was sufficient to heat particles of
2Al·Fe2O3 and 2.35Al·Bi2O3 above their ignition threshold before the end of the ESD pulse. On the contrary, pre-
heating particles of 2Al·3CuO and 2Al·MoO3 by low voltage ESD triggered a self-sustaining but slow, low-
temperature reaction causing the observed ignition delay. Only at higher ignition energies was prompt ignition
observed for CuO and MoO3 based composites.
Prompt ignition observed here for powders placed in 0.5-mm thick layers appears to be qualitatively similar to
the immediate ignition observed for the nano-thermite powders placed in monolayers, described in Refs. [90, 91].
Rapid combustion of particles placed in monolayers and heated nearly instantaneously by ESD was interpreted in
Ref. [91] suggesting that the nano-structure of the reacting particles was preserved because the reaction occurred
primarily over the interfaces existing in the mechanically milled nanocomposite material. This hypothesis is
consistent with the observed structures of the combustion products shown in Fig. 5.5, where products containing Fe
and Bi are well 5.dispersed in molten Al2O3. Additional images of the collected combustion products are shown in
Figs. 5.10 and 5.11 for 2Al·Fe2O3 and 2.35Al·Bi2O3 powders ignited as both 0.5-mm thick and monolayers. For
2Al·Fe2O3, the combustion products from the ignited powder monolayer (Fig. 5.10, left image) include composite
particles with dimensions comparable to those of the initial milled material. Parts of the composite clearly formed
from molten reacted material; other parts have not obviously reacted. Combustion products from the 0.5-mm thick
powder layer (Fig. 5.10, right image) consist of clearly molten and reacted material, while what appears to be
unreacted composite particles are present as well. Whether these unreacted particles belong to the same original
composite particle, or were deposited coincidentally is not yet clear. The particle sizes are somewhat greater than
for the starting powder, suggesting that particles agglomerated. The reacted material shows components mixed in a
broad range of scales. A large, deformed portion of the particle comprises Al2O3. The brighter part decorated with
multiple spherical inclusions is a mixture of iron-rich, partially oxidized material and Al2O3.
2 3
Fig. 5.10. SEM images of combustion products for 2Al·Fe2O3 composite powder ignited as a monolayer and as a
0.5-mm thick layer.
For 2.35Al·Bi2O3, the combustion products from the ignited powders from both the monolayer and the 0.5-mm thick
layer are compared side by side in Fig. 5.11. In both cases, the components appear to be mixed in a broad range of
scales. For the monolayer (Fig. 5.11, left image), the particle appears to crack open, possibly upon impact on the
collection substrate. The interior of the particle is mostly Al2O3. The external part is mixed, including fine

74
composite structure and larger molten particles, with mixed oxide phases. Similarly, for the products collected from
the 0.5-mm thick layer, some particles include Bi-rich exterior and Al2O3-rich interior. In Fig. 5.11, right image,
that for one of the particles, the interior is exposed in a fracture in the particle. The Bi-rich surface layer itself is not
homogeneous and consists of mixed oxide phases. The structure with Bi-rich shell and Al2O3 filled core is likely
produced as a result of a difference in surface tension of the respective molten phases, with the surface tension of
molten Al2O3 being substantially higher (~0.6 N/m [101]) compared to that of Bi-rich liquid (~0.37 N/m [102]).
Parts of the product, similar to those for monolayers, consist of finely mixed, composite particles with structures
similar to those of the starting ball-milled materials. As for 2Al·Fe2O3, the products collected from the 0.5-mm
thick layer include somewhat coarser particles, suggesting that some agglomeration had occurred.
2 3
2 3
Fig. 5.11. SEM images of combustion products for 2.35Al·Bi2O3 composite powder ignited as a monolayer and as a
0.5-mm thick layer.
Similarities in the product structures for the mono-layers and 0.5-mm thick layers of the same thermites suggest that
most promptly-ignited particles react heterogeneously while preserving their nano-structure generated by milling.
However, presence of larger particles suggests that agglomeration occurred; larger particles explain somewhat
delayed peak positions and longer overall burn times for thicker layers, as shown in Fig. 5.3. Interaction among a
large number of particles directly heated and ejected by the spark may also explain the accelerated peak onset,
observed for the thicker layers. Particles located in the middle of the ejected powder cloud were surrounded and
thus thermally shielded by other igniting particles. Such shielded particles would heat up faster because of reduced
heat losses. This faster heating would cause a faster increase in the optical emission, registered as the emission peak
onset. For monolayers, the number of ejected particles is much smaller, and thus interactions between different
igniting and burning particles are negligible.
2. Delayed ignition Delayed ignition was observed for all materials and the differences in timing of the delayed emission pulses were
relatively minor. For a characteristic delay of the peak position of about 1 ms, the heat in air can propagate over
about 1 mm. As observed from Fig. 5.9, the density of the ejected powder cloud is sufficiently large to include
many particles within a 1-mm radius. Thus, delayed ignition likely represents a collective or group combustion
within clouds of ejected particles. The intensity of the produced emission (and sound) pulses is most likely
associated with the size of the burning powder cloud.
For 2Al·3CuO and 2Al·MoO3, for which only delayed ignition was observed at lower ignition energies, the
igniting clouds must have been substantially greater compared to those of 2Al·Fe2O3 and 2.35Al·Bi2O3. This
difference is likely associated with a greater disparity in the temperatures and speeds of ejected particles between the
two groups of materials.
For the powders experiencing prompt ignition, some of the ejected particles are burning. Such particles are
expected to move faster than cold ejected particles. The difference in speed is due to both natural convection and
self-propulsion due to ejected gases, well documented in the early literature for metal particle combustion [103-108].
Because of the difference in speed, the zone of thermal influence for such burning particles is relatively narrow and
is lined along their trajectories.

75
If the discharge does not trigger prompt ignition, many ejected particles are instead pre-heated; however, none of
them are burning. Preheated ejected particles produce a cloud that is initially heated rather homogeneously. The
temperature of such a pre-heated cloud continues to increase nearly uniformly throughout the entire group of lifted
particles. This leads to nearly simultaneous ignition of a much greater number of particles compared to those heated
by a few rapidly moving hot particles for the promptly igniting powders. It is further likely that ignition of a
relatively large powder cloud causes ejection and ignition of powder remaining in the sample holder. This
secondary ejection and ignition are more likely when the size of the initially ignited cloud is greater, in agreement
with the data in Table 5.2.
It is interesting to compare temperatures achieved at the delayed ignition peak with the adiabatic flame
temperatures anticipated for respective materials. Such adiabatic temperatures were calculated using NASA CEA
code [109] and are shown in Table 5.3 (99 wt. % air (O2/N2 mixture) and 99 wt. % N2 were used for diluents). Two
calculations were performed for each material, except for 2.35Al·Bi2O3, because of lacking necessary
thermodynamic data. In both calculations, constant pressure configurations were considered at 1 atm. In one
calculation, 1 atm of air was included in the reaction; in the other, the thermites were considered to react in nitrogen.
For completeness, reaction temperatures reported in Ref. [110] for all the studied thermites are also shown. These
latter temperatures represent the adiabatic thermite reactions without heat exchange with surroundings. For
2Al·Fe2O3, the experimental flame temperature (Fig. 5.7) is between the values shown in Table 5.3. However, for
both 2Al·3CuO and 2Al·MoO3, the experimental temperatures are higher; the discrepancy is particularly significant
for 2Al·3CuO. The implied temperatures are outside of the calibrated temperature range and thus are extrapolated
using the obtained calibration. Experimental values were obtained from fitting a rather broad portion of the
emission spectra with Planck’s formula and the fits were quite good, especially at the peak and the decaying portion
of the measured emission traces. Therefore, even if there is an error due to extrapolation, it is likely that the
measurements represent superadiabatic heating achieved in the burning nano-thermite clouds in these experiments.
Such superadiabatic combustion could occur if powder, which was being ejected from the sample holder, was
entering air, substantially pre-heated by combustion of the powder ejected and ignited previously. Clearly, the
temperature distribution was non-uniform, whereas optical temperature measurements must have been biased to the
highest temperature in optically thin clouds.

76
Table 5.3. Adiabatic flame temperatures for thermite predicted by NASA CEA code [109].
Material
Adiabatic flame temperature, K
Ref. [110] Experiment, K In air In nitrogen
2Al·3CuO 2460 2530 2843 4400 - 5100
2Al·MoO3 2957 2612 3253 3500 - 4400
2Al·Fe2O3 2916 2360 3135 2600 - 3100
2.35Al·Bi2O3
3253 2400 - 2700
Conclusions Two distinct ESD-induced ignition regimes were observed for aluminum-based nanocomposite thermite powders
placed in 0.5-mm thick powder layers. Promptly ignited powders began burning immediately during the ESD pulse.
Prompt ignition occurred for the powders using Bi2O3 and Fe2O3 as oxidizers when low-voltage ESD was used.
Because these powders were reported to ignite at lower temperatures compared to other thermites studied here, their
prompt ignition indicated that a threshold ignition temperature was achieved as a result of Joule heating of selected
particles even in the relatively weak, low-voltage ESD. Combustion that followed prompt ignition was dominated
by individual burning particles; however, some of the ejected particles agglomerated causing longer burn times
compared to those reported earlier for the same powders ignited by ESD as monolayers. The burn rates of the
promptly ignited particles were high and their combustion products contained components mixed on a fine scale,
comparable to the scale of mixing in the starting nanocomposite materials prepared by arrested reactive milling.
Delayed ignition was observed for all materials. At low voltage ESD, much stronger delayed ignition pulses were
observed for powders with CuO and MoO3 as oxidizers that did not exhibit prompt ignition. Respective combustion
products contained phases mixed on a substantially coarser scale compared to that in the starting powders,
suggesting that the nano-scale fuel-oxidizer structure of the prepared materials was destroyed upon their ignition.
Delayed ignition represents combustion of clouds of interacting powder particles. Larger clouds were produced for
powders with CuO and MoO3 as oxidizers as a result of more homogeneous self-heating among powder particles
pre-heated and ejected by ESD. Larger clouds of burning nanothermites burned superadiabatically so that their
measured flame temperatures exceeded significantly those predicted by thermodynamic calculations. The effect was
particularly strong for 2Al·3CuO, which also showed higher burn rates for powder clouds.
6. Combustion characteristics of stoichiometric Al-CuO nanocomposite thermites
prepared by different methods
Introduction Nanocomposite thermites have attracted attention recently due to a range of their potential applications, especially
those in pyrotechnics, e.g., see [6, 111-114]. Their fast energy release combined with high energy densities make
nano-thermites more attractive than conventional thermites made of micron-scale powder particles [115-117]. The
increased reactivity of nanocomposite thermite is due to a highly developed interface between metal fuel, typically
aluminum, and an oxidizer comprising a metal oxide, most commonly, CuO, Fe2O3, MoO3, Bi2O3, etc.
Many different methods have been recently developed to prepare nanocomposite thermites; each method
generates a material with a specific structure. The most common technique employs mixing individual component
nanopowders [118, 119]. The powders suspended in a liquid, commonly hexane, are mixed using ultrasonic
agitation. The liquid is subsequently dried out. Produced materials, often referred to as metastable intermolecular
composites or MIC, are explored as potential reactive or energetic materials. Because of lack of binder and possible
agglomeration of nanopowders, handling such materials may affect their reactivity. A modified method exploiting
nanopowders mixed in a liquid solvent involves addition of an organic binder and dispersing the generated
suspension using electrospraying [120, 121]. When the solvent is dried from the electrosprayed droplets, composite
particles are obtained. In each particle, metal and oxidizer nanoparticles are mixed and held together by a small
amount of the added binder. The composite particles are micron-sized and thus are easier to handle than the
nanopowders. Upon ignition, however, the binder is gasified generating well-mixed burning nanoparticles. Yet

77
another method resulting in preparation of distinctly different nanocomposite material is called Arrested Reactive
Milling or ARM [18]. It uses high energy ball milling of starting micron-sized components. As a result of milling,
fully dense composite powders are prepared. Sizes of produced composite powder particles vary in the range of 1 –
100 µm. Each particle contains starting materials mixed on the nanoscale.
In most previous efforts, ignition and combustion characteristics were analyzed for one type of nanocomposite
thermite. Even though the bulk chemical compositions for materials prepared by different techniques might be
similar, there are no side by side comparisons of their characteristics, which would emphasize the effect of the
material structure and morphology on its ignition and combustion. Such comparisons are desired, in order to guide
further development of material preparation technologies as well as enable fine-tuning of characteristics of different
materials.
This work is aimed to characterize differences between combustion behaviors of reactive materials containing
the same nanocomposite thermite, stoichiometric 2Al-3CuO (based on the mole composition), prepared in three
distinct ways. The methods of preparation include traditional ultrasonic mixing (USM) of nano-powders [114, 122-
124], electrospraying (ES) [120, 125, 126], and ARM [18, 127, 128]. The relationship of the resulting nanothermite
structures and their respective ignition and combustion characteristics can be used to further tune up the preparation
techniques; it is may also be important to understand for potential applications of different types of nanothermites.
Materials The ES and USM composites were created using 50-nm copper oxide from Sigma-Aldrich and 50-nm aluminum
from Argonide Corporation. The USM materials were prepared through the ultrasonication of copper oxide in
ethanol for 1 hr before aluminum was added; whereby an additional 1 hr of ultrasonication was performed to ensure
good physical mixing of particles. For the ES material, the mixing procedure was similar. Upon the addition of
aluminum to the copper oxide, a collodion solution of 4-8wt.% in ethanol/diethyl ether from Fluka Corp and diluted
with a diethyl ether (99.8%)/ethanol (99.8%) mixture (1:3 volume ratio) was added. Then, additional 1-hr
sonication took place followed by 24 hrs of magnetic stirring. The produced suspension was loaded into a syringe
pump and electro-sprayed. A more detailed explanation of the process can be found in Ref. [120].
The ARM materials were prepared as described elsewhere [127]. The starting materials were aluminum -325
mesh, 99.5% purity by Atlantic Equipment Engineers and copper (II) oxide, 25 μm, 99+% purity by Sigma Aldrich.
A Retsch PM400 planetary mill was used with custom-made thick-walled hardened steel vials. The Al and CuO
were milled using 3/8”-diameter hardened steal balls with the ball to powder mass ratio of 3:1. Hexane was used as
a process control agent (24 mL per vial). The material was milled for approximately 60 min and stored under
hexane. The powder used in the experiments was stored for up to 2 years. Its reaction was preliminarily examined
using differential scanning calorimetry (DSC) in argon, which showed no detectable effect of aging on the observed
thermite reactions.
Figure 6.1 shows scanning electron microscope images of all three types of powders placed on an aluminum foil.
The images were taken using backscattered electrons. The brightness difference between Al and CuO is detectable,
with CuO particles generally appearing slightly brighter than Al. Mixing between Al and CuO appears to be
somewhat more homogeneous for ES and USM materials compared to the ARM-prepared composite. Individual
inclusions of CuO in the ARM material are slightly coarser than particles of CuO in both ES and USM composites.
USM composite appears to be most porous, although substantial porosity is also observed in the ES particles.
Conversely, most of the ARM particles are fully dense.

78
CuO
A
Al
CuO
B
Al
CuO
C
Al
Figure 6.1. SEM images of different 2Al-3CuO nanocomposite powders: A: ES, B: USM; C: ARM.

79
Combustion experiments All powders were ignited using an experimental setup based on a 931 model Firing Test System by Electro-Tech
Systems, Inc. The experiment was discussed in detail earlier [65, 90, 91] and only a brief summary is given here.
The powders were loaded to completely fill a 0.5-mm deep, 6.7-mm diameter cylindrical void in a brass sample
holder. Excess powder was removed using a razor blade to ensure a flat top surface. The mass of the loaded powder
depended on porosity of the sample. Typically, the mass loads of the ES, USM, and ARM composites varied in the
ranges of 1.38 – 1.43, 1.6 - 3, and 5.1 – 6.2 mg, respectively. The powder-filled sample holder was placed 1-mm
away from a pin-electrode. Experiments were performed inside a sealed chamber filled with air, argon, or helium.
For experiments in argon and helium, the chamber was evacuated to -67.7 kPa and then filled with the
corresponding gas. This process was repeated three times to minimize the oxygen concentration down to 1.55
mol/m3 or to a total of 8.85 x 10
-4 mol of oxygen in the chamber. In most experiments, the electro-static discharge
(ESD) was produced by discharge of a 2000-pF capacitor, preliminarily charged to a voltage of 10 kV. To ignite the
ES powder in helium, it was necessary to increase the voltage to 20 kV and use a 10000-pF capacitor. The capacitor
discharge was triggered electronically.
Aluminum foil preliminarily cleaned with acetone was mounted onto SEM stubs using double-sided carbon tape to
collect combustion products. The foil was placed 18-22 mm from the powder-loaded sample holder. All parts of the
ESD apparatus were cleaned with acetone prior to each test to avoid cross contamination between products of
different materials. Samples were weighed before and after ignition using an Acculab ALC-80.4 balance, in order to
determine the amount of powder removed from the sample holder and thus participated in each combustion event.
Emission signals produced by ignited materials were collected using a 32-channel spectrometer based on a
Hamamatsu H7260 series linear array multianode photo-multiplier tube (PMT). The wavelengths for the 32 channels
were in the range of 373.4 - 641.0 nm. The time resolution of the individual emission traces recorded for each
wavelength was 5 μs, which was determined by the National Instruments PCI-6133 DAQ-boards used for data
acquisition. National Instrument’s Labview 8.5 software was used to collect the data; the results were processed
using a customized code in MATLAB. The data processing included calculation of the temperature based on the
recorded spectrally resolved emission traces using Planck’s formula. The spectrometer output was calibrated using
a tungsten filament lamp and a NIST traceable StellarNet EPP-2000 spectrometer. Additional details are available
elsewhere [129]. Pressure measurements were made using a PCB Piezotronics Model 482A21 Pressure Transducer
installed in the ESD chamber and connected to a signal conditioner and to a LeCroy WaveSurfer 64Xs Series
oscilloscope.
Results 1. Material ejected from the sample holder
Fractions of the powder mass ejected from the sample holder for different materials are shown in Table 6.1. It is
observed that most of the loaded powder was ejected and thus expected to burn in all experiments. The effect of gas
environment on the fraction of the powder ejected from the sample holder is relatively minor. Note that the absolute
masses of the powders ejected for each material are affected by the density of the sample. The densities are also
shown in Table 6.1; the ARM-prepared powder has the highest density, followed by the USM, and then by ES
materials.
Table 6.1. The percent of powder ejected upon ESD ignition.
Composite type
Loading Density (g/cm3)
Percent of 2Al-3CuO lost after ignition
Environment
Air Argon Helium
ES 0.080 + 0.012 76.1 + 9.0 83.6 + 8.9 90.3 + 6.0
USM 0.13 + 0.04 91.8 + 2.9 85.7 + 7.8 87.5 + 2.1
ARM 0.32 + 0.03 88.2 + 1.2 87.6 + 1.1 82.9 + 2.9
2. Emission Data An example of the light emission traces collected using the 32-channel spectrometer is shown in Fig. 6.2. Emission
intensity peaks between 500 and 600 nm. It is also apparent that the emission at longer wavelengths becomes
stronger for longer times, indicating a decreasing temperature. For clarity, comparisons between different types of
thermite powders are illustrated in Fig. 6.3 using one selected emission trace corresponding to 567.7 nm. This
wavelength was chosen due to its similarity to the filtered emission traces recorded in previous experiments [91,

80
129]. It is also not expected to interfere significantly with molecular emission bands of AlO [130]. Typical traces
of all three composite powders (ES, USM, and ARM) ignited in various environments (air, argon, and helium) are
shown in Fig. 6.3. Signal amplitudes differ, with the signal produced in air being the strongest for all powders.
Comparison of pulse amplitudes for different materials may be misleading because of systematic difference in the
total amount of burning material caused by the difference in densities among different types of powders filling the
sample holder. As shown in Table 6.1, the density was highest for the ARM-prepared powder. Respectively, more
material was loaded and ignited in each test, causing stronger overall emission intensity.
The signals peak at the shortest times for the USM powder; the peak position is most delayed for the ES material
(except for ignition in He, when a higher ESD energy was used). It appears that the preparation method affects the
peak position stronger than the gas environment.
Figure 6.2. Characteristic emission traces recorded using the 32-channel spectrometer for a USM-prepared 2Al-
3CuO nanocomposite thermite ignited in air.
Time, s Wavelength, nm
Emission, V
102
103
104
400
450
500
550
600
650
0.0
0.5
1.0
1.5
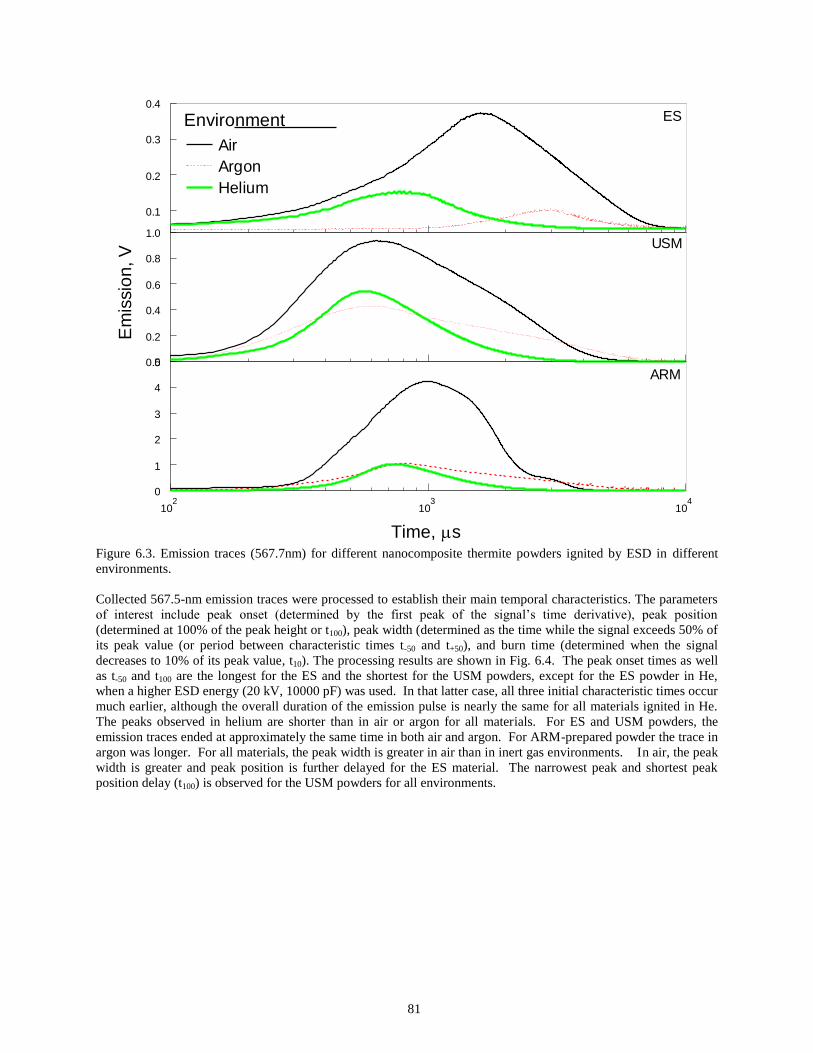
81
Figure 6.3. Emission traces (567.7nm) for different nanocomposite thermite powders ignited by ESD in different
environments.
Collected 567.5-nm emission traces were processed to establish their main temporal characteristics. The parameters
of interest include peak onset (determined by the first peak of the signal’s time derivative), peak position
(determined at 100% of the peak height or t100), peak width (determined as the time while the signal exceeds 50% of
its peak value (or period between characteristic times t-50 and t+50), and burn time (determined when the signal
decreases to 10% of its peak value, t10). The processing results are shown in Fig. 6.4. The peak onset times as well
as t-50 and t100 are the longest for the ES and the shortest for the USM powders, except for the ES powder in He,
when a higher ESD energy (20 kV, 10000 pF) was used. In that latter case, all three initial characteristic times occur
much earlier, although the overall duration of the emission pulse is nearly the same for all materials ignited in He.
The peaks observed in helium are shorter than in air or argon for all materials. For ES and USM powders, the
emission traces ended at approximately the same time in both air and argon. For ARM-prepared powder the trace in
argon was longer. For all materials, the peak width is greater in air than in inert gas environments. In air, the peak
width is greater and peak position is further delayed for the ES material. The narrowest peak and shortest peak
position delay (t100) is observed for the USM powders for all environments.
0.0
0.2
0.4
0.6
0.8
1.0USM
Time, s
102
103
104
Em
issio
n, V
0
1
2
3
4
5
ARM
0.1
0.2
0.3
0.4
ESEnvironment
Air
Argon
Helium

82
Time, s
102 103 104
Air
Argon
Helium
Air
Argon
Helium
Air
Argon
Helium
ES
AR
MU
SM
onset t-50 t100 t+50 t10
Figure 6.4. Temporal characteristics of Al-CuO powders at 567.7nm wavelength in various environments.
3. Temperature and Pressure Data Emissivity was assumed to be independent of the wavelength to obtain black body emission temperatures using all
32 recorded filtered emission traces. A wavelength-depending emissivity, e.g., following a ~-2.94
trend [100] was
considered; however, the goodness of fit for the respective Planck’s curves was substantially reduced; thus the gray
body assumption was maintained. Figure 6.5 shows a typical set of traces overlaid with the respective temperature.
The temperature is very high, exceeding 4000 K and nearly constant during the first few ms; it decays slowly at
longer times, after the individual emission traces pass through their respective peaks. The temperature implied by
the emission traces exceeds the boiling temperature of Al2O3 (3250 K), the main reaction product. It also exceeds
2810 K, the temperature predicted for the stoichiometric Al-CuO reaction by the CEA equilibrium code [109]. The
presently measured temperatures exceed substantially the combustion temperatures reported to be in the range of
2250 – 2400 K for the USM-prepared Al-CuO nanothermites burning in an unconfined pile or in an open tube [131].
Furthermore, the present temperatures exceed ca. 2300 K obtained for individual ARM-prepared 2Al-3CuO particles
[83]. However, the present measurements are generally consistent with recently reported superadiabatic
temperatures for ESD-ignited ARM-prepared thermites [132], where the experimental methodology was similar to
that employed in the present paper.
Time, s10
210
310
4
USM, Air
0
1000
2000
Tem
pera
ture
, K
3000
4000
5000
Emissiontraces, a.u.
Figure 6.5. Temperature (in bold red) overlaid with a respective set of filtered emission traces.

83
For comparisons between materials, the single temperature value at the peak position (t100) of the emission trace
filtered at 567.7 nm was considered for all samples. Temperatures for different powders ignited in different gas
environments are shown in Fig. 6.6. For both USM and ARM materials, temperatures in air are somewhat lower
than in argon or helium. A strong effect of gas environment on the temperature is observed only for ES powder: a
noticeably reduced temperature is measured for the powder ignited in argon compared to that ignited in air or
helium. The error bars for the temperatures are greatest for the ES powder and smallest for ARM-prepared powder.
This suggests that the experimental reproducibility correlated with the total mass and the error in identifying the
mass load for different materials. The mass load was lowest and thus the relative error in the mass was greatest for
the ES material; conversely, the highest total mass load and lowest error in the mass was measured for the ARM-
powder.
Air Argon Helium
Te
mp
era
ture
, K
2500
3000
3500
4000
4500
5000
5500
6000
USM
ARM
ES
Figure 6.6. Temperatures taken at the emission peak measured for the 567.7-nm emission for different materials
ignited in different environments.
Pressures recorded for different powders ignited in air are shown in Fig. 6.7 along with filtered 567.7-nm emission
traces. The pressures are normalized per unit mass of the powder ejected from the sample holder, and thus expected
to participate in the reaction. Thus, normalized pressures shown can be directly compared for different types of
powders. The pressure signals are expected to be delayed from the emission by the time the sound wave needs to
travel from the ignited powder to the pressure transducer. This time can be estimated as approximately 0.6 ms,
assuming the speed of sound in the chamber to be 340 m/s and the distance to the pressure transducer to be close to
the chamber characteristic dimension, e.g., 20 cm. Indeed, the pressure trace begins after a 0.6-0.7 ms delay.
However, the pressure peak is observed some 10 ms following the peak of the emission signal, indicating a truly
delayed signal. This delay suggests that the exothermic reaction continues for the entire duration of the observed
emission signal, even during its decay, causing further heating of the gas inside the chamber and respective pressure
rise. Oscillatory patterns observed in the pressure traces occur with an approximately 0.5-ms period, and thus are
likely to represent reflections of the soundwave within the chamber. The oscillations are stronger for signals with
higher overall pressures.
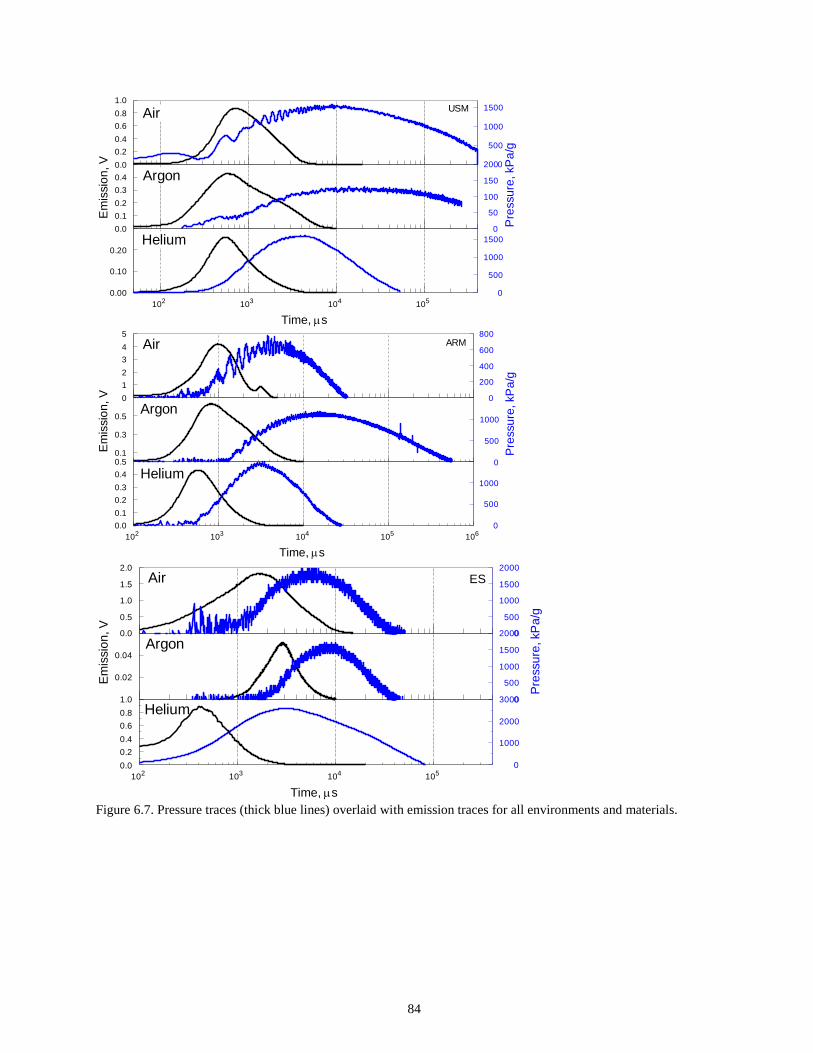
84
Figure 6.7. Pressure traces (thick blue lines) overlaid with emission traces for all environments and materials.
Time, s
102 103 104 1050.00
0.10
0.20Helium
0
500
1000
1500
0.0
0.2
0.4
0.6
0.8
1.0
Air
0
500
1000
1500E
mis
sio
n, V
0.0
0.1
0.2
0.3
0.4 Argon
Pre
ssu
re, kP
a/g
0
50
100
150
200
USM
0
1
2
3
4
5
Air
0
200
400
600
800
Em
issio
n, V
0.1
0.3
0.5Argon
Pre
ssu
re, kP
a/g
0
500
1000
Time, s
102 103 104 105 1060.0
0.1
0.2
0.3
0.4
0.5
Helium
0
500
1000
ARM
0.0
0.5
1.0
1.5
2.0
Air
Pre
ssu
re, kP
a/g
0
500
1000
1500
2000
Em
issio
n, V
0.02
0.04Argon
0
500
1000
1500
2000
ES
Time, s
102 103 104 1050.0
0.2
0.4
0.6
0.8
1.0
Helium
0
1000
2000
3000

85
The temporal characteristics of pressure traces are summarized in Fig. 6.8, similar to the analogous plot for the
emission traces in Fig. 6.4. The onset of the pressure pulse occurs sooner for USM materials, except for the case of
ES powder ignited in He, when a higher voltage was used. Aside from the case of ES powder ignited in He, the
onset of the pressure pulse occurs sooner in air than in inert gases. The pressure peak positions (t100) follow the
same trend for all materials: pressures first peak in He, then in air, and finally in Ar. For the ES powder, despite a
delayed pressure peak position observed in Ar, the overall pressure signal in Ar is shorter than in other gases.
Conversely, for ARM powder the duration of pressure peak in Ar is much longer than in air and He. For USM
powder, the pressure peaks have approximately the same duration in Ar and air; the peak in He is much shorter.
Time, s
101 102 103 104 105 106
Air
Ar
He
Air
Ar
He
Air
Ar
He
Onset t-50t+50
t100 t10
US
MA
RM
ES
Figure 6.8. Temporal characteristics for pressure traces for all powders in different environments.
Pressure peak values normalized per unit mass of the ignited material are compared for different powders in Fig. 6.9.
The effect of gas environment is different for different powders. For USM powders, the highest pressure is observed
in air. Ignition becomes difficult for this sample in Ar; very low pressures were observed in some tests, causing a
very large error bar. Conversely, in He, USM powder ignited readily and generated pressure that was nearly as high
as in air. For the ARM powder, the pressure in air is lower than in both Ar and He. In both inert gases, the
pressures for ARM powder are close to each other. The ES powders generated the highest pressures in both air and
Ar; however, they did not ignite in He when the same ESD energy was used. When an increased ESD voltage was
applied, ignition occurred and the pressure was substantially higher than for other materials.

86
Air Argon Helium
Pre
ssu
re, kP
a/g
0
500
1000
1500
2000
2500
3000
USM
ARM
ES
Figure 6.9. Maximum pressures obtained from the ESD ignition of various Al-CuO powders under different
environments.
Combustion product morphology
Ignited particles in air were collected and examined under SEM. Characteristic images for ES-prepared, USM, and
ARM particles are shown in Fig. 6.10. In addition to relatively coarse particles as shown in Fig. 6.10, much finer
spheres, representing typical smoke particles, were observed for all materials; few such particles can be seen in Fig.
10A.
In Fig. 6.10, a particle most representative of the combustion products was selected among many acquired SEM
images for each material. For all combustion product particles, phases containing primarily Al2O3 (darker gray) and
Cu (bright) can be readily distinguished. In many cases, Cu-rich phase forms a characteristic “cap”, somewhat
similar to an oxide cap observed on quenched aluminum particles [133]. Prevalent particle sizes are different for
products of different materials. The finest particles were observed for the ES powders; the particle size varied in the
range of 1 – 2 µm. For both ARM and USM powders, particles were mostly coarser, with a characteristic dimension
in the order of 10 µm. It appears that the morphology of the original composite material is completely lost for both
ARM and ES powders. The particle shapes, scale of mixing among products, and surface morphology are likely
representative of cooling fairly well homogenized mixed molten products. However, in Fig. 6.10B, an agglomerate
of original aluminum nano-particles can be distinguished for the USM powder. The agglomerated particles appear
to be “bonded” together with a brighter, Cu-rich melt, apparently percolating through the pores in the initially
agglomerated particles.

87
Figure 6.10. SEM images of combustion products of different 2Al-3CuO powders ignited in air. A: ES; B: USM; C:
ARM.
Discussion It is of interest to consider substantial differences in the ignition and combustion behaviors among 2Al—3CuO
powders prepared by different methods and ignited by ESD, as described above. Further, the present results can be
compared to earlier measurements, employing the same technique for igniting nanothermite powders [132] as well
A
B
C

88
as to reports describing combustion of Al-CuO nanocomposite ignited in different experimental configurations [83,
131].
Ignition of a layer of a nanothermite powder in ESD involves several reaction steps, as discussed earlier [132]. The
discharge generates a weak shock wave (Fig. 6.11A), lifting a relatively small portion of the powder from the
sample holder (Fig. 6.11B). This initially lifted powder is heated by the spark and ignites, following a short, sub-
millisecond delay (so called prompt ignition) (Fig. 6.11C). The initial reaction causes secondary pressure wave and
leads to additional ejection of the powder from the sample holder. The newly ejected powder is exposed to a pre-
heated environment (Fig. 6.11D), it ignites (i.e., delayed ignition) (Fig. 6.11E), and in its turn causes further powder
ejection. Thus, reaction characteristics reflect multiple processes, including combustion of individual ejected
particles, heat and mass transfer in the ejected particle cloud, and heat and mass transfer between the burning
particle cloud and powder that is being ejected from the sample holder.
Figure 6.11. ESD cloud combustion steps. A: Static shock discharged; B: Shockwave disperses powder; C: Initial
small cloud combustion; D: Heated environment and additional powder liftoff; E: Main cloud combustion.
The initial ignition delay, reflecting ignition of particles heated directly by ESD is best represented by the initial
emission onset time, shown for all materials in Fig. 6.4. Aside from the experiment with ES powder in He, when a
higher ESD power was used, the delays are longer for ES powder, indicating most likely a slower initial low-
temperature solid-solid reaction between Al and CuO, which may be separated in this material by binder.
It may be difficult to correlate temporal characteristics of the optical emission traces, as summarized in Fig. 6.4
for different materials with events occurring in respective combustion experiments. In experiments, involving
relatively large numbers of particles combustion products may remain incandescent for an extended period of time,
because they form a relatively large cloud. The end of incandescence is expected to indicate the cooling of the cloud
and end of the reaction; however, interpreting this incandescence is difficult because it is affected by both size and
brightness of the cloud. However, the measured pressure traces represent fairly accurately the heat released in the
reaction. The pressure can only be rising when the heat is released; thus the peak of the recorded pressure signal
represents the end of the exothermic reaction rather accurately. Indeed, the peak pressure roughly coincides with the
end of the optical emission trace for all powders.
It is interesting that the peak pressures occur at approximately the same times for all powders ignited in He. The
trend in Fig. 6.8, showing the peak position as a function of the gas environment is also the same for all powders.
The times are shortest in He (~ 2 ms) and longest in Ar (7 – 15 ms). It may suggest that the duration of a
combustion event is affected by heat and mass transfer over the volume occupied by the ejected powder cloud,
which is roughly the same for all powders. The durations of the combustion events are similar to those measured for

89
individual ARM-prepared Al-CuO particles in Ref. [83]. This observation suggests that for ARM-prepared
powders, the burn times of individual particles may be close to the characteristic transport time in the cloud of the
ESD-ejected powder. However, the present burn times are much longer than reported for ES and USM materials,
ignited in a miniature combustion cell [120].
The temperatures inferred from the emission traces for all materials are substantially higher than those reported
earlier for similar nanothermites [83, 131] ignited in different experimental configurations. However, the present
high temperatures are similar to those reported earlier for the ARM-prepared nanothermites ignited in the same
setup [132]. It was proposed that the observed super-adiabatic temperatures could occur if the volume above the
sample holder is pre-heated by the powder promptly ignited by direct heating by ESD [132]. The powder that
continues to be ejected into that volume is thus exposed to and ignited at a much higher temperature environment,
than assumed in the equilibrium calculation. The difference in the temperatures observed for different powders in
various environments may be caused by both pressure wave affecting ejection of unignited powder and by rate of
heat loss from the burning particle cloud to the rest of the chamber. A difference in the initial density of differently
prepared powder samples may affect their ejection, and thus affect the measured temperature. The low density of
ES powder may therefore explain a lower temperature observed for this material in Ar, when much smaller amounts
of this powder are being ejected and thus produce clouds, which are smaller in size and cool faster despite the
relatively low thermal diffusivity of Ar.
Finally, it is interesting to correlate differences in the observed combustion behavior and morphologies of the
combustion products collected for different powders.
Dimensions of agglomerates observed in the as prepared USM powder (Fig. 6.1B) are roughly similar to the
dimensions of agglomerated combustion products of the same material (Fig. 6.10B). The porosity of the original
agglomerates is reduced and pores are seen to be filled by molten Cu-rich material. CuO melts at about 1600 K, a
temperature that is expected to be above the ignition point of nano-aluminum. A partially reduced oxide, Cu2O
melts at a lower temperature (ca. 1500 K); it may start forming even before aluminum melts. Even more
importantly, the eutectic in the mixed Al2O3 – CuO system occurs at around 1100 K [134], so that the produced
liquid spinel phase may block the surface of aluminum, reducing the rate of its further reaction at a much lower
temperature. The melt apparently wets the aluminum surface, stabilizing the agglomerates for this material.
Presence of relatively large agglomerates may also explain an inconsistent ignition and large spread among
measured pressure values observed for USM powder in Ar, as opposed to air and He. In air, the thermite reaction is
assisted by aluminum oxidation with ambient oxygen. Thus, reaction rate may be high even for porous agglomerated
particles, in which aluminum remains exposed to ambient oxygen. In He, the rate of heat transfer is very high,
making it easy to ignite particles ejected in a cloud containing burning particle agglomerates. Conversely, in Ar, the
rate of heat transfer is low, so that substantial ignition delays may occur for particles ejected from the sample holder.
For larger agglomerates, ignition may or may not be achieved, depending on their size and specific direction in
which they are ejected from the sample holder. As a result, substantial variation in the measured pressure may be
observed.
For the ARM-prepared powder (Fig. 6.10C), the size of the particles found in combustion products is roughly
similar to the sizes of the initial fully dense particles (Fig. 6.1C). Low-magnification SEM overviews of the
collected ARM powders (not shown for brevity) indicated that particles were burning in close proximity of one
another, some agglomeration of the burning particles was also observed. The mixing between Cu-rich and Al2O3
phases was observed to be on a much coarser scale compared to the initial nanocomposite material. This suggests
that the particles lose their nano-structure upon ignition. The pressure amplitudes for ARM powder are higher in Ar
and He (Fig. 6.9), unlike for ES and USM powders. This may be explained by relative independence of combustion
of ARM particles on the presence of the external gas oxidizer. In fact, when such an oxidizer is present (in air), it is
likely that partially reduced CuO forming Cu2O reoxidizes generating Al2CuO4 spinel, which slows down ensuing
oxidation of aluminum. This reoxidation of copper is qualitatively supported by the color of the smoke created by
the combustion event. A yellow/green smoke was observed in air, suggesting a mix of various copper oxidation
products. However, in both inert environments the smoke was a brilliant red indicative of a pure metallic copper. In
these environments the lack of external oxidizer may be hypothesized to prevent formation of the spinel, making
reaction of Al with CuO and Cu2O more favorable.
Finally, for the ES powder, the sizes of product particles are noticeably finer than for both USM and ARM
materials (Fig. 6.10A). Individual product product particles were relatively far from one another, suggesting no or
insignificant agglomeration between them. This is consistent with the ES particle structure, including a gasifying
binder (nitrocellulose), which disperses initially agglomerated particles. It is further consistent with the relatively
low total mass of the particle loads for this powder. The effect of gas environment on the burn time (time t100 for

90
pressure, for example) is the weakest for this powder, suggesting that the gasifying nitrocellulose may actively affect
the heat and mass transfer between dispersed Al and CuO particles.
The need for a higher ESD voltage required to ignite the ES powder in He may be explained by combination of
small particle sizes, high rate of heat losses, and low initial density of the powder in the sample holder. The
particles ignited directly by ESD at 10 kV did not generate sufficient pressure to eject and ignite additional
materials. When the ESD energy was increased (20kV at 10000 pF), more material was ignited directly by ESD, so
that the energy produced by the initially ignited cloud was sufficient to lift and ignite more material.
Conclusions Three powders with the same nominal composition 2Al-3CuO (numbers representing moles) but prepared by
different methods, including ultrasonic mixing (USM), electro-spraying (ES), and arrested reactive milling (ARM),
were prepared and ignited by ESD. For each powder, experiments were performed in air, argon, and helium. Both
USM and ES powders as prepared comprised porous micron-sized agglomerates of Al and CuO nanoparticles;
ARM-prepared particles consisted of micron-sized fully-dense particles in which Al and CuO were mixed on the
scale of ~ 100 nm. Combustion temperatures measured for all materials optically were higher than estimated
adiabatic flame temperatures and higher than reported earlier for similar materials burning in different
configurations. The unusually high temperatures are tentatively explained considering that a fraction of the powder
was ignited by ESD directly. The promptly ignited material heated the volume above the sample holder and caused
ejection of additional material from the sample holder in a highly pre-heated medium. For all materials, combustion
times, ranging from 2 to 15 ms were longer than expected for individual nanoparticles but in the range, anticipated
for composite particles prepared by ARM or agglomerates present in the USM powder. The shortest burn times
were observed in He consistently for all powders. Pressure generated by combustion of powders prepared by ARM
was least affected by the inert environment. This is interpreted considering that the reaction with ambient oxidizer is
less important for the fully-dense ARM-prepared particles compared to porous ES and USM materials, in which
aluminum is always exposed to the ambient gas. Unlike other materials, ARM-prepared powders generated lower
pressures in air than in He and Ar. This correlated with lower likelihood of formation of spinel, Al2CuO4 in inert
gases than in an oxidizing gas environment; when produced, spinel is expected to impede further redox reaction.
Powders prepared by USM formed large agglomerates; such agglomerates did not react completely and included
multiple nano-Al particles bonded by Cu-rich oxidized phase. It appears that partially oxidized melt filled pores,
blocking unreacted aluminum from further oxidation. Combustion products of the ARM-prepared powders had
dimensions similar to those of the original material particles. The scale of mixing between Al2O3 and Cu-rich phase
in the ARM powder combustion products was coarser than that between Al and CuO in the initial material.
Combustion products of the ES powders consisted of the finest composite particles; their sizes appeared to be
smaller than the sizes of the initial agglomerates observed in the ES powder. The burn rates of the ES powders were
least affected by the gas environment. The latter observation was interpreted considering that ES materials included
gasifying nitrocellulose binder, which could enhance heat and mass transfer between individual Al and CuO
particles in inert environments.
7. References
[1] A. Ermoline, D. Stamatis, E.L. Dreizin, Low-temperature exothermic reactions in fully dense Al-CuO
nanocomposite powders, Thermochimica Acta 527 (2012) 52-58.
[2] D. Stamatis, E.L. Dreizin, K. Higa, Thermal initiation of Al-MoO3 nanocomposite materials prepared by
different methods, Journal of Propulsion and Power 27 (2011) 1079-1087.
[3] D. Stamatis, E.L. Dreizin, Thermal initiation of consolidated nanocomposite thermites, Combustion and Flame
158 (2011) 1631-1637.
[4] A. Ermoline, M. Schoenitz, E.L. Dreizin, Reactions leading to ignition in fully dense nanocomposite Al-oxide
systems, Combustion and Flame 158 (2011) 1076-1083.
[5] B. Dikici, M.L. Pantoya, V. Levitas, The effect of pre-heating on flame propagation in nanocomposite thermites,
Combustion and Flame 157 (2010) 1581-1585.
[6] E.L. Dreizin, Metal-based reactive nanomaterials, Progress in Energy and Combustion Science 35 (2009) 141-
167.
[7] S.M. Umbrajkar, M. Schoenitz, E.L. Dreizin, Exothermic reactions in Al-CuO nanocomposites, Thermochimica
Acta 451 (2006) 34-43.

91
[8] B.J. Henz, T. Hawa, M.R. Zachariah, On the role of built-in electric fields on the ignition of oxide coated
nanoaluminum: Ion mobility versus fickian diffusion, Journal of Applied Physics 107 (2010).
[9] S. Chowdhury, K. Sullivan, N. Piekiel, L. Zhou, M.R. Zachariah, Diffusive vs explosive reaction at the
nanoscale, Journal of Physical Chemistry C 114 (2010) 9191-9195.
[10] L. Zhou, N. Piekiel, S. Chowdhury, M.R. Zachariah, Time-resolved mass spectrometry of the exothermic
reaction between nanoaluminum and metal oxides: The role of oxygen release, Journal of Physical Chemistry C 114
(2010) 14269-14275.
[11] K.T. Sullivan, W.A. Chiou, R. Fiore, M.R. Zachariah, In situ microscopy of rapidly heated nano-Al and nano-
Al/ WO3 thermites, Applied Physics Letters 97 (2010).
[12] K. Sullivan, M.R. Zachariah, Simultaneous pressure and optical measurements of nanoaluminum thermites:
Investigating the reaction mechanism, Journal of Propulsion and Power 26 (2010) 467-472.
[13] K.K. Kuo, G.A. Risha, B.J. Evans, E. Boyer, Potential usage of energetic nano-sized powders for combustion
and rocket propulsion, in: R. Armstrong, N. Thadhani, W. Wilson, J. Gilman, R. Simpson (Eds.)Boston, MA., 2003,
pp. 3-14.
[14] D. Stamatis, X. Jiang, E. Beloni, E.L. Dreizin, Aluminum burn rate modifiers based on reactive nanocomposite
powders, Propellants, Explosives, Pyrotechnics 35 (2010) 260-267.
[15] M.F. Gogulya, M.N. Makhov, M.A. Brazhnikov, A.Y. Dolgoborodov, V.I. Arkhipov, A.N. Zhigach, I.O.
Leipunskii, M.L. Kuskov, Explosive characteristics of aluminized HMX-based nanocomposites, Combustion,
Explosion and Shock Waves 44 (2008) 198-212.
[16] D. Stamatis, A. Ermoline, E.L. Dreizin, A Multi-Step Reaction Model for Ignition of Fully-Dense Al•CuO
Nanocomposite Powders, Combustion Theory and Modelling 16 (2012) 976-993.
[17] A. Ermoline, E.L. Dreizin, Equations for the Cabrera-Mott kinetics of oxidation for spherical nanoparticles,
Chemical Physics Letters 505 (2011) 47-50.
[18] E.L. Dreizin, M. Schoenitz, Nano-composite energetic powders prepared by arrested reactive milling, US
Patent 7,524,355 2009.
[19] D. Stamatis, Z. Jiang, V.K. Hoffmann, M. Schoenitz, E.L. Dreizin, Fully dense, aluminum-rich Al-CuO
nanocomposite powders for energetic formulations, Combustion Science and Technology 181 (2009) 97-116.
[20] R.A. Williams, J.V. Patel, A. Ermoline, M. Schoenitz, E.L. Dreizin, Correlation of optical emission and
pressure generated upon ignition of fully-dense nanocomposite thermite powders, Combustion and Flame under
review (2012).
[21] T. Mohan S., M.A., Dreizin, E.L., Characterization of Aluminum Powder Ignition, The 2003 Technical
Meeting of the Eastern States Section of the Combustion Institute, The Combustion Institute, University Park, PA,
2003, pp. 329-332.
[22] T.S. Ward, M.A. Trunov, M. Schoenitz, E.L. Dreizin, Experimental methodology and heat transfer model for
identification of ignition kinetics of powdered fuels, International Journal of Heat and Mass Transfer 49 (2006)
4943-4954.
[23] M.A. Trunov, M. Schoenitz, E.L. Dreizin, Effect of polymorphic phase transformations in alumina layer on
ignition of aluminium particles, Combustion Theory and Modelling 10 (2006) 603-623.
[24] M. Schoenitz, B. Patel, O. Agboh, E.L. Dreizin, Oxidation of aluminum powders at high heating rates,
Thermochimica Acta 507-508 (2010) 115-122.
[25] M. Schoenitz, S. Umbrajkar, E.L. Dreizin, Kinetic analysis of thermite reactions in Al-MoO3 nanocomposites,
Journal of Propulsion and Power 23 (2007) 683-687.
[26] M.J. Starink, The determination of activation energy from linear heating rate experiments: A comparison of the
accuracy of isoconversion methods, Thermochimica Acta 404 (2003) 163-176.
[27] R.A. Yetter, G.A. Risha, S.F. Son, Metal particle combustion and nanotechnology, Montreal, QC, 2009, pp.
1819-1838.
[28] P.E. Specht, N.N. Thadhani, A.K. Stover, T.P. Weihs, Meso-scale computational study of the shock-
compression of cold-rolled Ni-Al laminates, Nashville, TN, 2009, pp. 57-60.
[29] A. Duckham, S.J. Spey, J. Wang, M.E. Reiss, T.P. Weihs, E. Besnoin, O.M. Knio, Reactive nanostructured foil
used as a heat source for joining titanium, Journal of Applied Physics 96 (2004) 2336-2342.
[30] E. Besnoin, S. Cerutti, O.M. Knio, T.P. Weihs, Effect of reactant and product melting on self-propagating
reactions in multilayer foils, Journal of Applied Physics 92 (2002) 5474.
[31] A.B. Mann, A.J. Gavens, M.E. Reiss, D. Van Heerden, G. Bao, T.P. Weihs, Modeling and characterizing the
propagation velocity of exothermic reactions in multilayer foils, Journal of Applied Physics 82 (1997) 1178-1188.
[32] X.Y. Yuan, C.B. Zhan, H.B. Jin, K.X. Chen, Novel method of thermite welding, Science and Technology of
Welding and Joining 15 (2010) 54-58.

92
[33] C. Meriç, T. Engez, Understanding the thermite welding process: The metallurgical specifications and hardness
profile of thermite welds were examined to better understand this process commonly used in the railroad industry,
Welding Journal (Miami, Fla) 78 (1999) 33-36.
[34] J. Mei, R.D. Halldearn, P. Xiao, Mechanisms of the aluminium-iron oxide thermite reaction, Scripta Materialia
41 (1999) 541-548.
[35] E.L. Dreizin, Schoenitz, M., Ermoline, A., Clawson, R., Harrigan, M. , Solid propellant burn rate modifiers
based on reactive nanocomposite materials prepared by arrested reactive milling, 36th Propellant and Explosives
Development and CharacterizationOrlando FL, 2010.
[36] C. Badiola, M. Schoenitz, X. Zhu, E.L. Dreizin, Aluminum Rich Al-CuO nanocomposite materials prepared by
arrested reactive milling at cryogenic and room temperatures, Orlando, FL, 2009.
[37] S.M. Umbrajkar, S. Seshadri, M. Schoenitz, V.K. Hoffmann, E.L. Dreizin, Aluminum-rich Al-MoO3
nanocomposite powders prepared by arrested reactive milling, Journal of Propulsion and Power 24 (2008) 192-198.
[38] S.M. Umbrajkar, M. Schoenitz, E.L. Dreizin, Fuel-rich Al-MoO3 nanocomposite powders prepared by arrested
reactive milling, Reno, NV, 2007, pp. 3590-3595.
[39] S. Umbrajkar, M.A. Trunov, M. Schoenitz, E.L. Dreizin, R. Broad, Arrested reactive milling synthesis and
characterization of sodium-nitrate based reactive composites, Propellants, Explosives, Pyrotechnics 32 (2007) 32-41.
[40] T.S. Ward, W. Chen, M. Schoenitz, E.L. Dreizin, R. Dave, Nano-composite energetic powders prepared by
arrested reactive milling, Reno, NV, 2005, pp. 11049-11056.
[41] M. Schoenitz, T. Ward, E.L. Dreizin, Preparation of energetic metastable nano-composite materials by arrested
reactive milling, in: R. Armstrong, N. Thadhani, W. Wilson, J. Gilman, R. Simpson (Eds.)Boston, MA., 2003, pp.
85-90.
[42] Y.L. Shoshin, M.A. Trunov, X. Zhu, M. Schoenitz, E.L. Dreizin, Ignition of aluminum-rich Al-Ti mechanical
alloys in air, Combustion and Flame 144 (2006) 688-697.
[43] F. Yang, Y. Choi, P. Liu, J. Hrbek, J.A. Rodriguez, Autocatalytic reduction of a Cu 2O/Cu(111) surface by CO:
STM, XPS, and DFT studies, Journal of Physical Chemistry C 114 (2010) 17042-17050.
[44] A.E. D. Stamatis, E.L. Dreizin, A Multi-Step Reaction Model for Ignition of Fully-Dense Al•CuO
Nanocomposite Powders, Combustion Theory and Modelling (2012).
[45] E.M. Levin, R.S. Roth, Polymorphism of Bismuth Sesquioxide. 1. Pure Bi203, JOURNAL OF RESEARCH of
the National Bureau of Standards-A. Physics and Chemistry 68A (1964) 189-195.
[46] L.A. Klinkova, V.I. Nikolaichik, N.V. Barkovskii, V.K. Fedotov, Thermal stability of Bi2O3, Russian Journal
of Inorganic Chemistry 52 (2007) 1822-1829.
[47] P.F. Carcia, E.M. McCarron Iii, Synthesis and properties of thin film polymorphs of molybdenum trioxide,
Thin Solid Films 155 (1987) 53-63.
[48] V. Ebadat, Dust explosion hazard assessment, Journal of Loss Prevention in the Process Industries 23 (2010)
907-912.
[49] V. Ebadat, Minimize electrostatic hazards during process operations, Chemical Engineering Progress 109
(2013) 39-43.
[50] M. Glor, Ignition hazard due to static electricity in particulate processes, Powder Technology 135–136 (2003)
223-233.
[51] C.J. Dahn, A.G. Dastidar, Requirements for a minimum ignition energy standard, Process Safety Progress 22
(2003) 43-47.
[52] J. Smallwood, Standardisation of electrostatic test methods and electrostatic discharge prevention measures for
the world market, Journal of Electrostatics 63 (2005) 501-508.
[53] U. von Pidoll, An overview of standards concerning unwanted electrostatic discharges, Journal of Electrostatics
67 (2009) 445-452.
[54] L. Perrin, A. Laurent, V. Falk, O. Dufaud, M. Traoré, Dust and electrostatic hazards, could we improve the
current standards?, Journal of Loss Prevention in the Process Industries 20 (2007) 207-217.
[55] S. Zeman, J. Kočí, Electric spark sensitivity of polynitro compounds: Part IV. A relation to thermal
decomposition parameters, Hanneng Cailiao/Energetic Materials 8 (2000) 23-26.
[56] D. Skinner, D. Olson, A. Block-Bolten, Electrostatic discharge ignition of energetic materials, Propellants,
Explosives, Pyrotechnics 23 (1998) 34-42.
[57] U.S.D.o. Defense, Manual of Data Requirements and Tests for the Qualification of Explosive Materials for
Military Use, Allied Ordnance Publications, 2003, pp. 547.
[58] E. Beloni, E.L. Dreizin, Experimental study of ignition of magnesium powder by electrostatic discharge,
Combustion and Flame 156 (2009) 1386-1395.

93
[59] E. Beloni, E.L. Dreizin, Ignition of aluminum powders by electro-static discharge, Combustion and Flame 157
(2010) 1346-1355.
[60] E. Beloni, E.L. Dreizin, Ignition of metal powder by electrostatic discharge, in: V. Boddu, P. Redner (Eds.)
Energetic Materials, CRC Press, Boca Raton, FL, 2010, pp. 107-138.
[61] E. Beloni, E.L. Dreizin, Ignition of titanium powder layers by electrostatic discharge, Combustion Science and
Technology 183 (2011) 823-845.
[62] E. Beloni, E.L. Dreizin, Model of heating and ignition of conductive polydisperse powder in electrostatic
discharge, Combustion Theory and Modelling 16 (2012) 976-993.
[63] E. Beloni, V.K. Hoffmann, E.L. Dreizin, Combustion of decane-based slurries with metallic fuel additives,
Journal of Propulsion and Power 24 (2008) 1403-1411.
[64] E. Beloni, P.R. Santhanam, E.L. Dreizin, Electrical conductivity of a metal powder struck by a spark, Journal of
Electrostatics 70 (2012) 157-165.
[65] R.A. Williams, E. Beloni, E.L. Dreizin, Ignition of metal powder layers of different thickness by electrostatic
discharge, Journal of Propulsion and Power 28 (2012) 132-139.
[66] R.A. Williams, M. Schoenitz, E.L. Dreizin, Validation of the thermal oxidation model for Al/CuO
nanocomposite powder, Combustion Science and Technology 186 (2014) 47-67.
[67] R.A. Williams, M. Schoenitz, A. Ermoline, E.L. Dreizin, On gas release by thermally-initiated fully-dense
2Al·3CuO nanocomposite powder. , International Journal of Energetic Materials and Chemical Propulsion 11 (2012)
275-292.
[68] R.A. Williams, M. Schoenitz, A. Ermoline, E.L. Dreizin, Low-temperature exothermic reactions in fully-dense
Al/MoO3 nanocomposite powders, Thermochimica Acta 594 (2014) 1-10.
[69] R.A. Williams, J.V. Patel, A. Ermoline, M. Schoenitz, E.L. Dreizin, Correlation of optical emission and
pressure generated upon ignition of fully-dense nanocomposite thermite powders, Combustion and Flame 160
(2013) 734-741.
[70] J.A. Puszynski, C.J. Bulian, J.J. Swiatkiewicz, Ignition Characteristics of Nanothermite Systems, 7 (2008) 73-
86.
[71] T. Foley, A. Pacheco, J. Malchi, R. Yetter, K. Higa, Development of nanothermite composites with variable
electrostatic discharge ignition thresholds, Propellants, Explosives, Pyrotechnics 32 (2007) 431-434.
[72] C. Weir, M.L. Pantoya, G. Ramachandran, T. Dallas, D. Prentice, M. Daniels, Electrostatic discharge
sensitivity and electrical conductivity of composite energetic materials, Journal of Electrostatics 71 (2013) 77-83.
[73] M. Steinkrauss, H. Fierz, P. Lerena, G. Suter, Fire and explosion properties of synthetic nanomaterials: Initial
investigations for major accident prevention, in: F.O.f.t.E. FOEN (Ed.), Initial investigations for major accident
prevention, 2010.
[74] S. Manea, R.F.B. Gonçalves, F.B.C. Machado, K. Iha, J.A.F.F. Rocco, M.E.V. Suárez Iha, Electrical and
electrostatic discharge solid rocket booster ignition, 45th AIAA/ASME/SAE/ASEE Joint Propulsion Conference
and Exhibit, 2009.
[75] C.J. Bulian, J.A. Puszynski, J.J. Swiatkiewicz, Ignition sensitivity of nanoenergetics produced by various
processing methods, AIChE Annual Meeting, Conference ProceedingsSalt Lake City, UT, 2007.
[76] M. Roux, M. Auzanneau, C. Brassy, Electric spark and ESD sensitivity of reactive solids (primary or secondary
explosive, propellant, pyrotechnics) part one: experimental results and reflection factors for sensitivity test
optimization, Propellants, Explosives, Pyrotechnics 18 (1993) 317-324.
[77] C. Weir, M.L. Pantoya, M.A. Daniels, The role of aluminum particle size in electrostatic ignition sensitivity of
composite energetic materials, Combustion and Flame 160 (2013) 2279-2281.
[78] C.E. Johnson, K.T. Higa, T.T. Tran, W.R. Albro, Thermite initiation processes and thresholds, Materials
Research Society Symposium Proceedings, 2011, pp. 37-42.
[79] K.T. Higa, Energetic nanocomposite lead-free electric primers, Journal of Propulsion and Power 23 (2007) 722-
727.
[80] R.A. Williams, J.V. Patel, E.L. Dreizin, Ignition of Fully Dense Nanocomposite Thermite Powders by an
Electric Spark, Journal of Propulsion and Power in press (2014).
[81] W.L. Shaw, D.D. Dlott, R.A. Williams, E.L. Dreizin, Ignition of nanocomposite thermites by electric spark and
shock wave, Propellants, Explosives, Pyrotechnics in press (2014).
[82] D. Stamatis, X. Zhu, M. Schoenitz, E.L. Dreizin, P. Redner, Consolidation and mechanical properties of
reactive nanocomposite powders, Powder Technology 208 (2011) 637-642.
[83] E.L. Dreizin, C. Badiola, S. Zhang, Y. Aly, Particle Combustion Dynamics of Metal-Based Reactive Materials,
International Journal of Energetic Materials and Chemical Propulsion 10 (2011) 22.

94
[84] E.L. Dreizin, A.V. Suslov, M.A. Trunov, General trends in metal particles heterogeneous combustion,
Combustion science and technology 90 (1993) 79-99.
[85] E.L. Dreizin, Phase changes in metal combustion, Progress in Energy and Combustion Science 26 (2000) 57-
78.
[86] R.W.B. Pearse, G. A.G., The Identification of Molecular Spectra, Fourth Edition ed., Chapman and Hall,
London, 1976.
[87] J.M. Meek, A theory of spark discharge, Physical Review 57 (1940) 722-728.
[88] H.L. Olsen, R.B. Edmonson, E.L. Gayhart, Microchronometric schlieren study of gaseous expansion from an
electric spark, Journal of Applied Physics 23 (1952) 1157-1162.
[89] N. Cabrera, N.F. Mott, Theory of the oxidation of metals, Reports on Progress in Physics 12 (1949) 163-184.
[90] R.A. Williams, J.V. Patel, E.L. Dreizin, Ignition of fully dense nanocomposite thermite powders by an electric
spark, Journal of Propulsion and Power 30 (2014) 765-774.
[91] I. Monk, R. Williams, X. Liu, E.L. Dreizin, Electro-static discharge ignition of monolayers of nanocomposite
thermite powders prepared by arrested reactive milling, Combustion Science and Technology 187 (2015) 1276-
1294.
[92] W.L. Shaw, R.A. Williams, E.L. Dreizin, D.D. Dlott, Using laser-driven flyer plates to study the shock
initiation of nanoenergetic materials, 18th Biennial Intl. Conference of the APS Topical Group on Shock
Compression of Condensed Matter, APS, Seattle, Washington, 2013, pp. in press.
[93] W.L. Shaw, D.D. Dlott, R.A. Williams, E.L. Dreizin, Ignition of nanocomposite thermites by electric spark and
shock wave, Propellants, Explosives, Pyrotechnics 39 (2014) 444-453.
[94] P. Wang, J. Zhang, Review on pyrotechnic cutting technology, Hanneng Cailiao/Chinese Journal of Energetic
Materials 18 (2010) 476-480.
[95] S. Knapp, V. Weiser, S. Kelzenberg, N. Eisenreich, Modeling ignition and thermal wave progression in binary
granular pyrotechnic compositions, Propellants, Explosives, Pyrotechnics 39 (2014) 423-433.
[96] A. Gromov, L.T. DeLuca, A.P. Il'in, U. Teipel, A. Petrova, D. Prokopiev, Nanometals in energetic systems:
achievements and future, Int. J. Energ. Mater. Chem. Propul. 13 (2014) 399-419.
[97] K.S. Martirosyan, Nanoenergetic Gas-Generators: Principles and applications, Journal of Materials Chemistry
21 (2011) 9400-9405.
[98] R.H.B. Bouma, D. Meuken, R. Verbeek, M.M. Pacheco, L. Katgerman, Shear initiation of Al/MoO3-based
reactive materials, Propellants, Explosives, Pyrotechnics 32 (2007) 447-453.
[99] J. Feng, G. Jian, Q. Liu, M.R. Zachariah, Passivated iodine pentoxide oxidizer for potential biocidal
nanoenergetic applications, ACS Applied Materials and Interfaces 5 (2013) 8875-8880.
[100] E.L. Dreizin, D.J. Allen, N.G. Glumac, Depression of melting point for protective aluminum oxide films,
Chemical Physics Letters 618 (2014) 63-65.
[101] N. Ikemiya, J. Umemoto, S. Hara, K. Ogino, Surface tensions and densities of molten Al2O3, Ti2O3, V2O5
and Nb2O5, ISIJ International 33 (1993) 156-165.
[102] A.-H.K. Abdel-Aziz, M.B. Kirshah, The density and temperature dependence of the surface tension of molten
bismuth, lead, and bismuth-lead alloys, Z. Metallkd. 68 (1977) 437-439.
[103] R. Friedman, A. Macek, Ignition and combustion of aluminum particles in hot, ambient gases, Combust.
Flame 6 (1962) 9-19.
[104] R. Friedman, A. Macek, Combustion studies of single aluminum particles, Symp. (Int.) Combust., [Proc.]
(1963) 703-712.
[105] A. Macek, Fundamentals of combustion of single aluminum and beryllium particles, 1967, pp. 203-214,
discussion 214-217.
[106] A. Macek, J.M. Semple, Combustion of boron particles at atmospheric pressure, Combust. Sci. Technol. 1
(1969) 181-191.
[107] J.L. Prentice, On the combustion of single aluminium particles, Combustion and Flame 9 (1965) 208-210.
[108] E.L. Dreizin, Experimental study of aluminum particle flame evolution in normal and micro-gravity,
Combustion and Flame 116 (1998) 323-333.
[109] B.J. McBride, S. Gordon, Computer Program for Calculation of Complex Chemical Equilibrium
Compositions and Applications II. Users Manual and Program Description., NASA RP 1311, 1996.
[110] S.H. Fischer, M.C. Grubelich, Theoretical energy release of thermites, intermetallics, and combustible metals,
Proc. Int. Pyrotech. Semin. 24th (1998) 231-286.
[111] D. Spitzer, M. Comet, C. Baras, V. Pichot, N. Piazzon, Energetic nano-materials: Opportunities for enhanced
performances, Journal of Physics and Chemistry of Solids 71 (2010) 100-108.

95
[112] M. Comet, V. Pichot, B. Siegert, F. Schnell, F. Ciszek, D. Spitzer, Phosphorus-based nanothermites: A new
generation of energetic materials, Journal of Physics and Chemistry of Solids 71 (2010) 64-68.
[113] M. Comet, B. Siegert, F. Schnell, V. Pichot, F. Ciszek, D. Spitzer, Phosphorus-based nanothermites: A new
generation of pyrotechnics illustrated by the example of n-CuO/Red P mixtures, Propellants, Explosives,
Pyrotechnics 35 (2010) 220-225.
[114] D.A. Reese, D.M. Wright, S.F. Son, CuO/Al thermites for solid rocket motor ignition, Journal of Propulsion
and Power 29 (2013) 1194-1199.
[115] M.L. Pantoya, J.J. Granier, Combustion behavior of highly energetic thermites: Nano versus micron
composites, Propellants, Explosives, Pyrotechnics 30 (2005) 53-62.
[116] S.H. Kim, M.R. Zachariah, Enhancing the rate of energy release from nanoenergetic materials by
electrostatically enhanced assembly, Advanced Materials 16 (2004) 1821-1825.
[117] R.A. Yetter, G.A. Risha, S.F. Son, Metal particle combustion and nanotechnology, Proceedings of the
Combustion Institute 32 II (2009) 1819-1838.
[118] J. Sun, M.L. Pantoya, S.L. Simon, Dependence of size and size distribution on reactivity of aluminum
nanoparticles in reactions with oxygen and MoO3, Thermochimica Acta 444 (2006) 117-127.
[119] V.E. Sanders, B.W. Asay, T.J. Foley, B.C. Tappan, A.N. Pacheco, S.F. Son, Reaction propagation of four
nanoscale energetic composites (Al/M0O 3, Al/WO3, Al/CuO, and Bi2O3), Journal of Propulsion and Power 23
(2007) 707-714.
[120] H. Wang, G. Jian, G.C. Egan, M.R. Zachariah, Assembly and reactive properties of Al/CuO based
nanothermite microparticles, Combustion and Flame 161 (2014) 2203-2208.
[121] X. Li, P. Guerieri, W. Zhou, C. Huang, M.R. Zachariah, Direct deposit laminate nanocomposites with
enhanced propellent properties, ACS Applied Materials and Interfaces 7 (2015) 9103-9109.
[122] S.F. Son, B.W. Asay, T.J. Foley, R.A. Yetter, M.H. Wu, G.A. Risha, Combustion of nanoscale Al/MoO3
thermite in microchannels, Journal of Propulsion and Power 23 (2007) 715-721.
[123] G.M. Dutro, R.A. Yetter, G.A. Risha, S.F. Son, The effect of stoichiometry on the combustion behavior of a
nanoscale Al/M0O3 thermite, Proceedings of the Combustion Institute 32 II (2009) 1921-1928.
[124] B.S. Bockmon, M.L. Pantoya, S.F. Son, B.W. Asay, J.T. Mang, Combustion velocities and propagation
mechanisms of metastable interstitial composites, Journal of Applied Physics 98 (2005) 1-7.
[125] H. Wang, J.B. DeLisio, G. Jian, W. Zhou, M.R. Zachariah, Electrospray formation and combustion
characteristics of iodine-containing Al/CuO nanothermite microparticles, Combustion and Flame 162 (2015) 2823-
2829.
[126] G. Young, H. Wang, M.R. Zachariah, Application of nano-aluminum/nitrocellulose mesoparticles in
composite solid rocket propellants, Propellants, Explosives, Pyrotechnics 40 (2015) 413-418.
[127] M. Schoenitz, T.S. Ward, E.L. Dreizin, Arrested reactive milling for in-situ production of energetic
nanocomposites for propulsion and energy-intensive technologies in exploration missions, Reno, NV, 2005, pp.
3001-3006.
[128] E.L. Dreizin, M. Schoenitz, Reactive and Metastable Nanomaterials Prepared by Mechanical Milling, Metal
Nanopowders, Wiley-VCH Verlag GmbH & Co. KGaA2014, pp. 227-278.
[129] I. Monk, E. Dreizin, M. Schoenitz, Modes of ignition of powder layers of nanocomposite thermites by electro-
static discharge, Journal of Energetic Materials (2016).
[130] S. Goroshin, J. Mamen, A. Higgins, T. Bazyn, N. Glumac, H. Krier, Emission spectroscopy of flame fronts in
aluminum suspensions, Heidelberg, 2007, pp. 2011-2019.
[131] M.R. Weismiller, J.G. Lee, R.A. Yetter, Temperature measurements of Al containing nano-thermite reactions
using multi-wavelength pyrometry, Proc. Combust. Inst. 33 (2011) 1933-1940.
[132] I. Monk, M. Schoenitz, E.L. Dreizin, Modes of ignition of powder layers of nanocomposite thermites by
electro-static discharge, Journal of Energetic Materials in press (2016).
[133] E.L. Dreizin, Experimental study of stages in aluminum particle combustion in air, Combustion and Flame
105 (1996) 541-556.
[134] U.S.N.B.o. Standards, A.C. Society, I.f.M. Science, E.C. Division, M. Science, E.L.C. Division, Phase
Diagrams for Ceramists, American Ceramic Society1981.