Embed Size (px)
Citation preview
Report and Accounts 2003
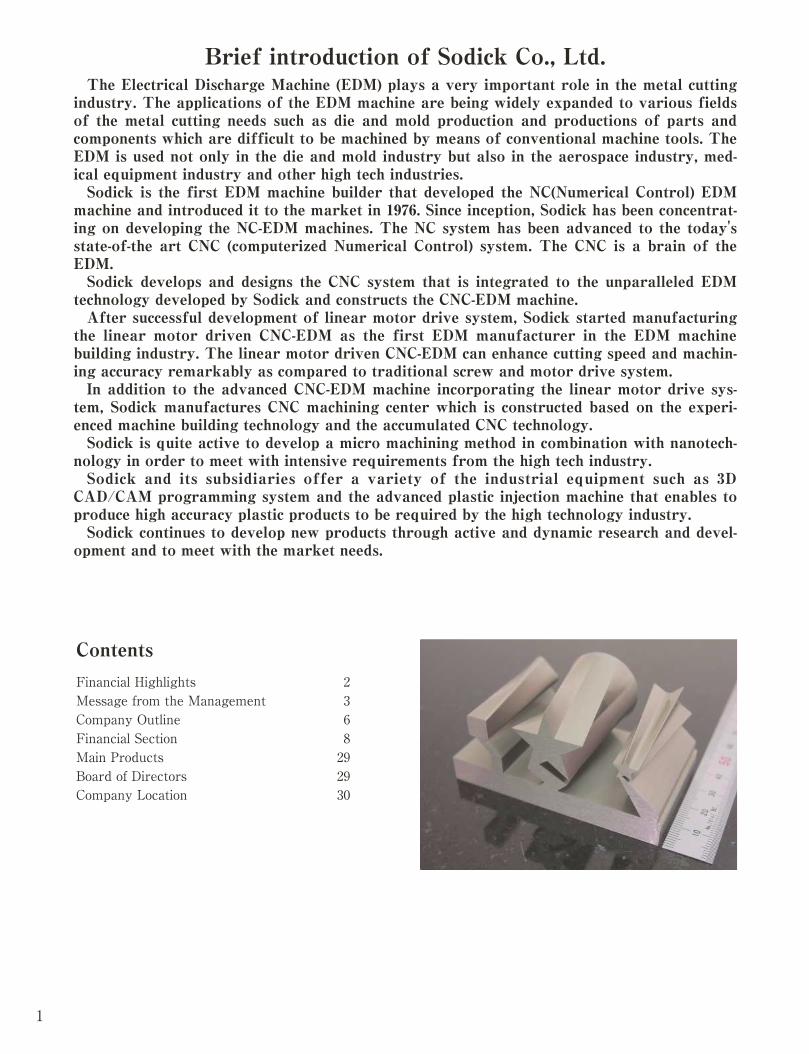
Brief introduction of Sodick Co., Ltd.The Electrical Discharge Machine (EDM) plays a very important role in the metal cuttingindustry. The applications of the EDM machine are being widely expanded to various fieldsof the metal cutting needs such as die and mold production and productions of parts andcomponents which are difficult to be machined by means of conventional machine tools. TheEDM is used not only in the die and mold industry but also in the aerospace industry, med-ical equipment industry and other high tech industries.Sodick is the first EDM machine builder that developed the NC(Numerical Control) EDMmachine and introduced it to the market in 1976. Since inception, Sodick has been concentrat-ing on developing the NC-EDM machines. The NC system has been advanced to the today'sstate-of-the art CNC (computerized Numerical Control) system. The CNC is a brain of theEDM.Sodick develops and designs the CNC system that is integrated to the unparalleled EDMtechnology developed by Sodick and constructs the CNC-EDM machine.After successful development of linear motor drive system, Sodick started manufacturingthe linear motor driven CNC-EDM as the first EDM manufacturer in the EDM machinebuilding industry. The linear motor driven CNC-EDM can enhance cutting speed and machin-ing accuracy remarkably as compared to traditional screw and motor drive system.In addition to the advanced CNC-EDM machine incorporating the linear motor drive sys-tem, Sodick manufactures CNC machining center which is constructed based on the experi-enced machine building technology and the accumulated CNC technology.Sodick is quite active to develop a micro machining method in combination with nanotech-nology in order to meet with intensive requirements from the high tech industry.Sodick and its subsidiaries offer a variety of the industrial equipment such as 3DCAD/CAM programming system and the advanced plastic injection machine that enables toproduce high accuracy plastic products to be required by the high technology industry.Sodick continues to develop new products through active and dynamic research and devel-opment and to meet with the market needs.
1
Contents
Financial Highlights 2Message from the Management 3Company Outline 6Financial Section 8Main Products 29Board of Directors 29Company Location 30
Financial Highlights (Consolidated)Sodick Co.,Ltd. and Consolidated SubsidiariesYears ended 31st March, 2003 and 2002
2
Thousands ofMillions of yen U.S. dollars*
2003 2002 2003 2002
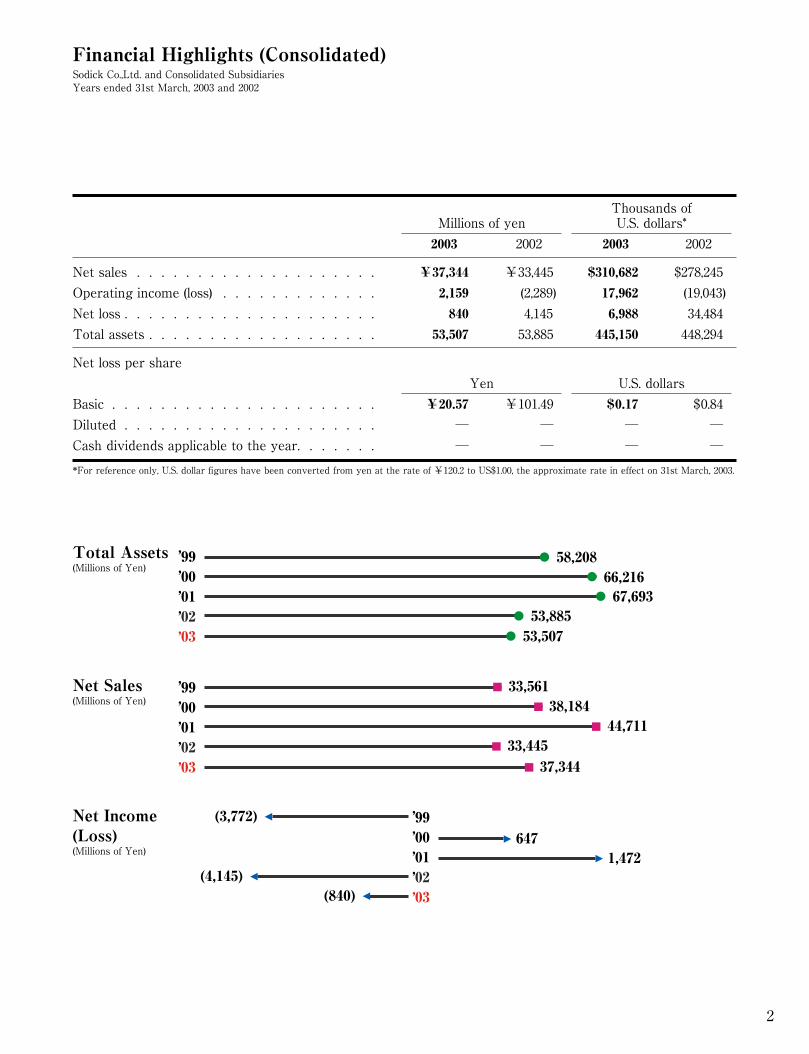
Net sales . . . . . . . . . . . . . . . . . . . . ¥37,344 ¥33,445 $310,682 $278,245
Operating income (loss) . . . . . . . . . . . . . 2,159 (2,289) 17,962 (19,043)
Net loss . . . . . . . . . . . . . . . . . . . . . 840 4,145 6,988 34,484
Total assets . . . . . . . . . . . . . . . . . . . 53,507 53,885 445,150 448,294
Net loss per share
Yen U.S. dollars
Basic . . . . . . . . . . . . . . . . . . . . . . ¥20.57 ¥101.49 $0.17 $0.84
Diluted . . . . . . . . . . . . . . . . . . . . . ― ― ― ―
Cash dividends applicable to the year. . . . . . . ― ― ― ―
*For reference only, U.S. dollar figures have been converted from yen at the rate of ¥120.2 to US$1.00, the approximate rate in effect on 31st March, 2003.
99 00 01 02 03
58,20866,216
33,56138,184
Total Assets (Millions of Yen)
Net Sales (Millions of Yen)
67,69353,88553,507
44,71133,445
37,344
Net Income (Loss) (Millions of Yen)
6471,472
(3,772)
(4,145)(840)
99 00 01 02 03
99 00 01 02 03
Messagefrom the Management
Let me take this opportunity to report onthe business results of Sodick Co., Ltd. andsubsidiaries for the fiscal year ended 31stMarch, 2003.(1) AchievementThe Japanese government declared that theJapanese economic condition had bottomed-outin May last year, but in this consolidated fiscalyear in Japan our company still faced a harshenvironment. We could not escape the viciouscircle of the aggravation of the employmentenvironment due to assets deflation and reduc-tion in private sector capital investment.In overseas countries, although there waseconomic expansion in East Asian countriesincluding China, North America Europe con-tinued to remain in the sluggish economicalcicumstance. In addition, the state of theworld was tense due to the war on Iraq, withincreased uncertainty in world economic con-ditions.In the machine industry, each prospectivecustomer clearly recognized that investment innew machines is indispensable for improvingproductivity. However, since cash flow did notimprove under the above-mentioned economicconditions, the trend toward downward revis-ing and postponing investment plan strength-ened, severely curtailing our business results.Under such environment, our companygroup (our company, consolidated sub-sidiares, and companies to which the equitymethod was applied), while striving to openup potential demand, pushed forward in thefield of the next-generation technology. Wefocused on successfully developing nanotechnology machine and assertively promot-ing our new products. Our newly developedproducts were featured in various machineexhibitions including the Japan InternationalMachine Tool Trade Fair in October, and theInternational Plastics Fair in November, heldin Japan last year.In overseas countries, we strove toincrease earnings by establishing sales cen-ters in Shanghai and Tengin in China where
new plant investment is flourishing, forexample.As a result of these efforts, our consolidat-ed sales during this fiscal year reached37,344 million yen, an increase of 3,899 millionyen (11.7%) compared with the previous year.Although in terms of profits and losses weachieved a substantial, we reckoned up 840million yen in consolidation net losses duringthis fiscal year.The situation for each product sector is asfollows:•Machine tool business: In this business, westrove to reinforce our domestic sales activiesand accommodate increased demand inChina. This yielded some fruits, but therewas also a dull tone in domestic demandbecause of the deflation economy. As a result,the sales amount of this sector figured 26,310million yen, an increase of 650 million yen(2.5%) compared with the previous year.
•Industrial machine business: In this sector,thanks to promoting the sales of our highlytechnically evaluated small size and preci-sion plastic injection molding machines, weenjoyed especially good sales of injectionmolding machines that are adapted tomanufacture plastic lenses loaded on cellu-lar phones. As a result, we reckoned up asales amount of 6,451 million yen, anincrease of 2,365 million yen (57.9%) com-pared with the previous year.
•Other business ... In this sector, the saleswere up in our newly-formed precisiontrust machining business and softwarebusiness. Thanks to this, we earned 4,765million yen, an increase of 796 million yen(20.1%) compared with the previous year.Our situation by region are as follows:
•Japan . . . The Japanese Governmentdeclared that the Japanese economy hadbottomed out in May last year, some enter-prises in the electric device related industryresumed, and the yen was up during andafter the summer. Nevertheless, the problemof financial institution’s bad debts made a
3
come-back, and than investment in the capi-tal equipment slowed, putting a damper onsales.Faced with such business conditions, ourconsolidated companies group promotedpositive strategies to sales activities anddevelop new products.As a result, sales in this region reached30,265 million yen, an increase of 4,416 mil-lion yen (17.1%) compared with the previ-ous year.
•North and South America ... In this region,a distrust in the business-accounting systemslowed down the American economy, whichled to the uncertainty in economies in SouthAmerican countries. Faced with such challenging conditions,
we have taken measures to enhance thesales activities in machine tool business andindustrial machine business. As a result, thesales amount of this region figured 2,915 mil-lion yen, a decrease of 711 million yen(19.6%) compared with the previous year.
•Europe ... In this region, plant investmentincreased steadily mainly in SouthEuropean countries after the introduction ofthe single currency Euro. In addition, our
machines with linear servo motor drivenmachine lead the industry, and enjoy a veryhigh technical reputation. Nevertheless, adecline in business activity started in thesecond half of this consolidated fiscal year.As a result, the sales amount in this
region reached 3,851 million yen, adecrease of 71 million yen (1.8%) comparedwith the previous year.
•Asia ... Economic growth is continuing inparticular in China, and resulting in dra-matic increase in the investment in manu-facturing. We could incease our earnings inKorea, too, thanks to plant investment inthe electronic device related industry andthe liquid crystal related industry in particu-lar.As a result, the sales amount in this
region figured at 14,008 million yen, anincrease of 1,590 million (12.8%) comparedwith the previous year.(2) Outlook for the next fiscal yearThe general economical forecast for Japancontinues to be the most severe ever. Themain factors are sluggish consumer spendingdue to insecurity about the financial system, adrop in earnings, and continued assets deflation.Plant investment in private companies will con-tinue to fall off.We must conclude then that manufactur-ing companies, the costomers of our prod-ucts, will transplant their prodution facilitesto East Asian countries, and to China in par-ticular. Plant investment policies will changeas EMS (Electric Manufacturing Service)grows focused on electric machines anddevice industries. The time interval betweenboom and depression will be shortened withthese changes in plant investment policy.Our company group will accordingly furtherstrengthen our management foundation bywrestling with structural reform to copewith changes in the market, and effectivelyputting our potential resources effectivelyand adequately.Concretely, in light of market trends, we will
4
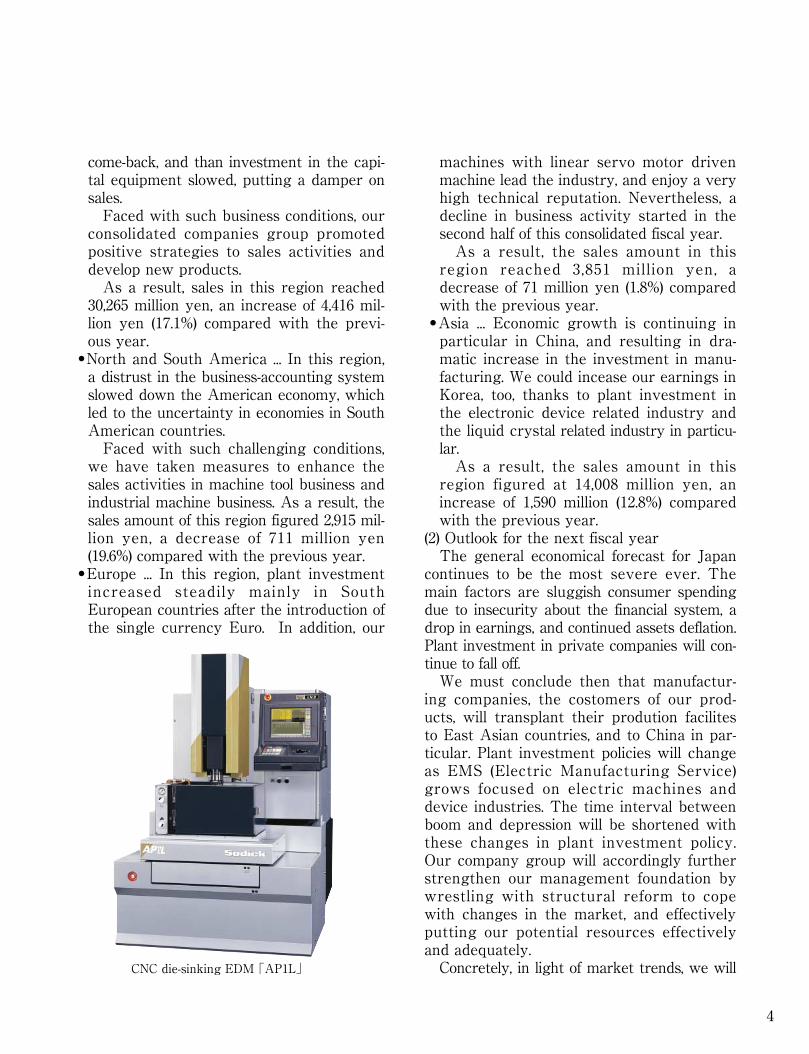
CNC die-sinking EDM「AP1L」
strive to expand our market for high valueadded new products such as CNC-EDMs withthree dimensional functions. We will also devel-op new products incorporating technologycapable of high level factory automation to copewith IT (information technology) factories.Finally, we will expand our nano technologybusiness, as this is regarded as an essentialnext generation technology.Furthermore, in China economic growth isremarkable. Here we are becoming wellknown as the leading manufacture in the estab-lishment of a business unit system in themachine tool industry.In order to strengthen our business opera-tions in china, we are now preparing to estab-lish a holding company in Hong Kong. Thiswill help to oversee our business in China,speed up managerial decisions and raise localfunds.In addition, in the machine industry, towhich our company belongs, innovation racesalong and demand also fluctuates at a highspeed. We understand that “speed” manage-ment is an important factor and a very basicpolicy for the corporate governance of ourcompany.Therefore, we have established a morestrong management system and enriched thesystem to comply with customer require-ments. We have reinforced the board of cor-porate auditors and have wrestled with com-pleting corporate governance from early on,by extending positive investor relation activi-ties to domestic and foreign investors.From now on, we will place importance onconsolidating management, strengthening thefunction of the board of directors to fulfill the“social and public mission” of our company,and enhancing corporate governance. Wewill also strive to flesh out the business man-agement system of the company by introduc-ing a multi-platform operational control sys-tem for each of our group companies.In the long-term, we will focus on the East
Asian region where we enjoy a reputation as
an industry pioneer and great demand forour products. Our group companies will pro-duce products in Thailand and China, andput our resources there, more and more.We will strive to find new markets for ourunique nano technology machines. We willforge ahead in blue-ray (blue laser) technology,which is regarded as the next generation largecapacity memory device technology, and opticalhigh speed communication. We will also pro-mote our new products such as CNC-EDMswith the world’s first 3-dimensional function, lin-ear motor driven CNC machining centers, andhigh precision injection molding machines.Furthermore, we will open up a new marketfor medical equipment.Into the future, we will continue to ridethe wave of globalization, establishing ourstronghold in the area of next generationproductive goods, developing our companygroup into these high value added business-es, and expanding our business to overseascountries.We will do our best to enrich the compa-nies of the Sodick group to lay a foundationfor the future in 2003.
5
President
Shigeo ShiodaPresident
6
Company OutlineEDM Market in Economically Active China
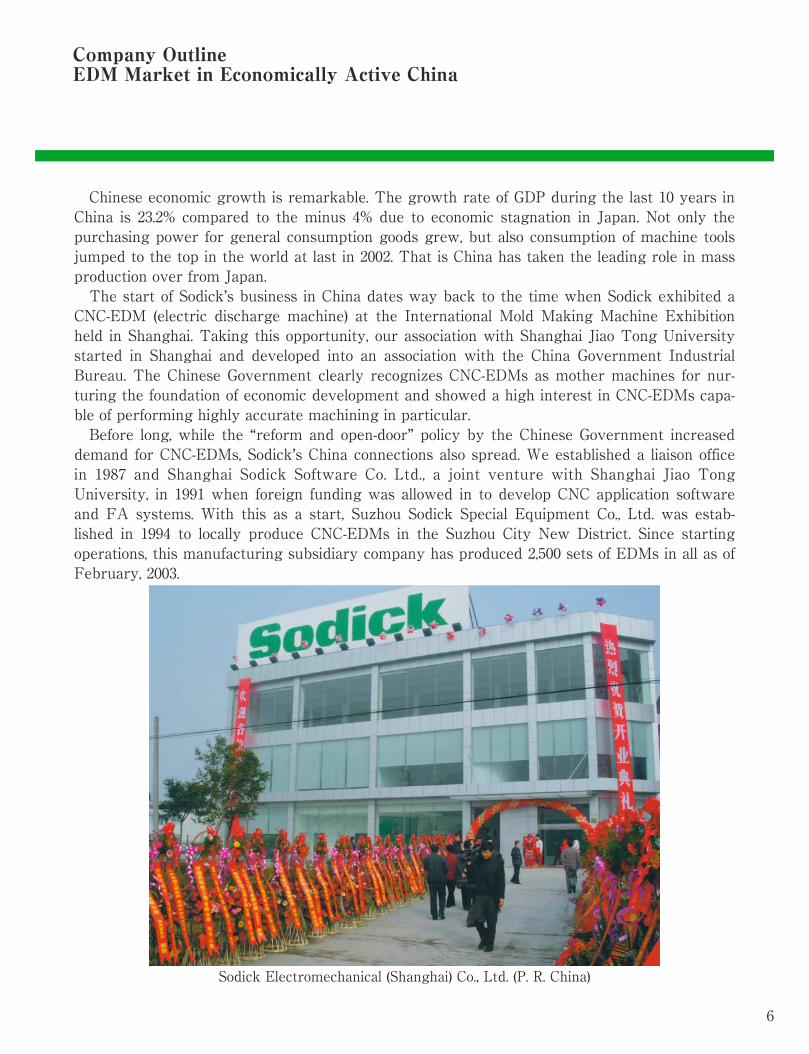
Chinese economic growth is remarkable. The growth rate of GDP during the last 10 years inChina is 23.2% compared to the minus 4% due to economic stagnation in Japan. Not only thepurchasing power for general consumption goods grew, but also consumption of machine toolsjumped to the top in the world at last in 2002. That is China has taken the leading role in massproduction over from Japan.The start of Sodick’s business in China dates way back to the time when Sodick exhibited aCNC-EDM (electric discharge machine) at the International Mold Making Machine Exhibitionheld in Shanghai. Taking this opportunity, our association with Shanghai Jiao Tong Universitystarted in Shanghai and developed into an association with the China Government IndustrialBureau. The Chinese Government clearly recognizes CNC-EDMs as mother machines for nur-turing the foundation of economic development and showed a high interest in CNC-EDMs capa-ble of performing highly accurate machining in particular.Before long, while the “reform and open-door” policy by the Chinese Government increaseddemand for CNC-EDMs, Sodick’s China connections also spread. We established a liaison officein 1987 and Shanghai Sodick Software Co. Ltd., a joint venture with Shanghai Jiao TongUniversity, in 1991 when foreign funding was allowed in to develop CNC application softwareand FA systems. With this as a start, Suzhou Sodick Special Equipment Co., Ltd. was estab-lished in 1994 to locally produce CNC-EDMs in the Suzhou City New District. Since startingoperations, this manufacturing subsidiary company has produced 2,500 sets of EDMs in all as ofFebruary, 2003.
Sodick Electromechanical (Shanghai) Co., Ltd. (P. R. China)
7
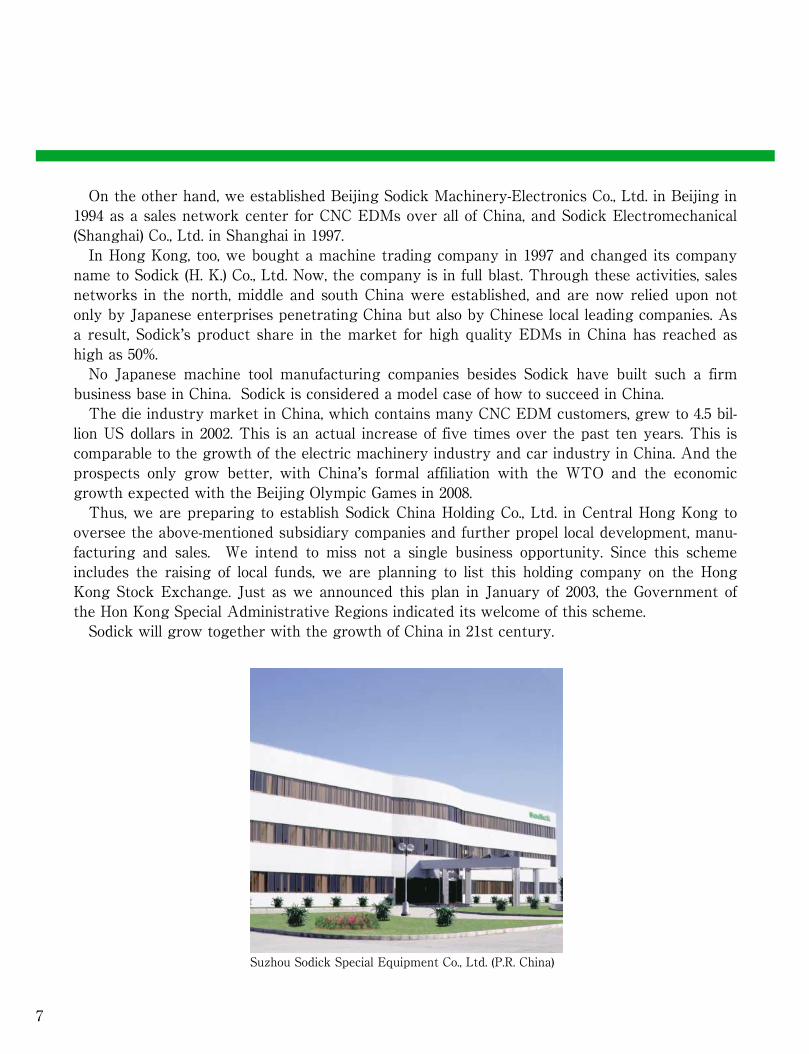
On the other hand, we established Beijing Sodick Machinery-Electronics Co., Ltd. in Beijing in1994 as a sales network center for CNC EDMs over all of China, and Sodick Electromechanical(Shanghai) Co., Ltd. in Shanghai in 1997. In Hong Kong, too, we bought a machine trading company in 1997 and changed its companyname to Sodick (H. K.) Co., Ltd. Now, the company is in full blast. Through these activities, salesnetworks in the north, middle and south China were established, and are now relied upon notonly by Japanese enterprises penetrating China but also by Chinese local leading companies. Asa result, Sodick’s product share in the market for high quality EDMs in China has reached ashigh as 50%.No Japanese machine tool manufacturing companies besides Sodick have built such a firmbusiness base in China. Sodick is considered a model case of how to succeed in China.The die industry market in China, which contains many CNC EDM customers, grew to 4.5 bil-lion US dollars in 2002. This is an actual increase of five times over the past ten years. This iscomparable to the growth of the electric machinery industry and car industry in China. And theprospects only grow better, with China’s formal affiliation with the WTO and the economicgrowth expected with the Beijing Olympic Games in 2008.Thus, we are preparing to establish Sodick China Holding Co., Ltd. in Central Hong Kong tooversee the above-mentioned subsidiary companies and further propel local development, manu-facturing and sales. We intend to miss not a single business opportunity. Since this schemeincludes the raising of local funds, we are planning to list this holding company on the HongKong Stock Exchange. Just as we announced this plan in January of 2003, the Government ofthe Hon Kong Special Administrative Regions indicated its welcome of this scheme. Sodick will grow together with the growth of China in 21st century.
Suzhou Sodick Special Equipment Co., Ltd. (P.R. China)

9
ConsolidatedBalance SheetsSodick Co., Ltd. and Consolidated Subsidiaries
31st March, 2003 and 2002
Thousands ofMillions of Yen U.S.Dollars (Note 1)
ASSETS 2003 2002 2003 2002
Current assets :Cash and cash equivalents (Notes 2 and 8) . . . . ¥ 7,921 ¥ 4,627 $ 65,898 $ 38,494Time deposits . . . . . . . . . . . . . . . . . 369 927 3,070 7,712Trade notes and accounts receivable (Notes 2 and 8) . 13,360 13,371 111,148 111,240Less-allowance for doubtful accounts (Note 2) . . . (1,461) (1,242) (12,155) (10,333)
Inventories (Note 2)―Finished goods . . . . . . . . . . . . . . . . 3,202 4,417 26,639 36,747Work in process and raw materials . . . . . . 6,272 5,679 52,180 47,246
Other current assets (Notes 6, 8 and 13) . . . . . 3,595 4,177 29,909 34,750Total current assets . . . . . . . . . . . . 33,258 31,956 276,689 265,856
Property, plant and equipment, at cost (Notes 2 and 8) :Land. . . . . . . . . . . . . . . . . . . . . . 7,730 7,760 64,309 64,559Buildings and structures . . . . . . . . . . . . 12,451 12,745 103,586 106,031Machinery and equipment . . . . . . . . . . . 8,311 8,617 69,143 71,688Leased equipment . . . . . . . . . . . . . . . 2,288 2,343 19,035 19,493Construction in progress . . . . . . . . . . . . 17 21 141 175
30,797 31,486 256,214 261,946
Less-accumulated depreciation . . . . . . . . (13,624) (13,261) (113,344) (110,324)17,173 18,225 142,870 151,622
Investments and other assets :Investment securities (Notes 2, 3 and 8) . . . . . 1,140 1,483 9,484 12,338Other (Notes 2 and 6). . . . . . . . . . . . . . 1,936 2,221 16,107 18,478
3,076 3,704 25,591 30,816Total assets . . . . . . . . . . . . . . . . . ¥ 53,507 ¥ 53,885 $ 445,150 $ 448,294
The accompanying notes to the consolidated financial statements are an integral part of these balance sheets.
10
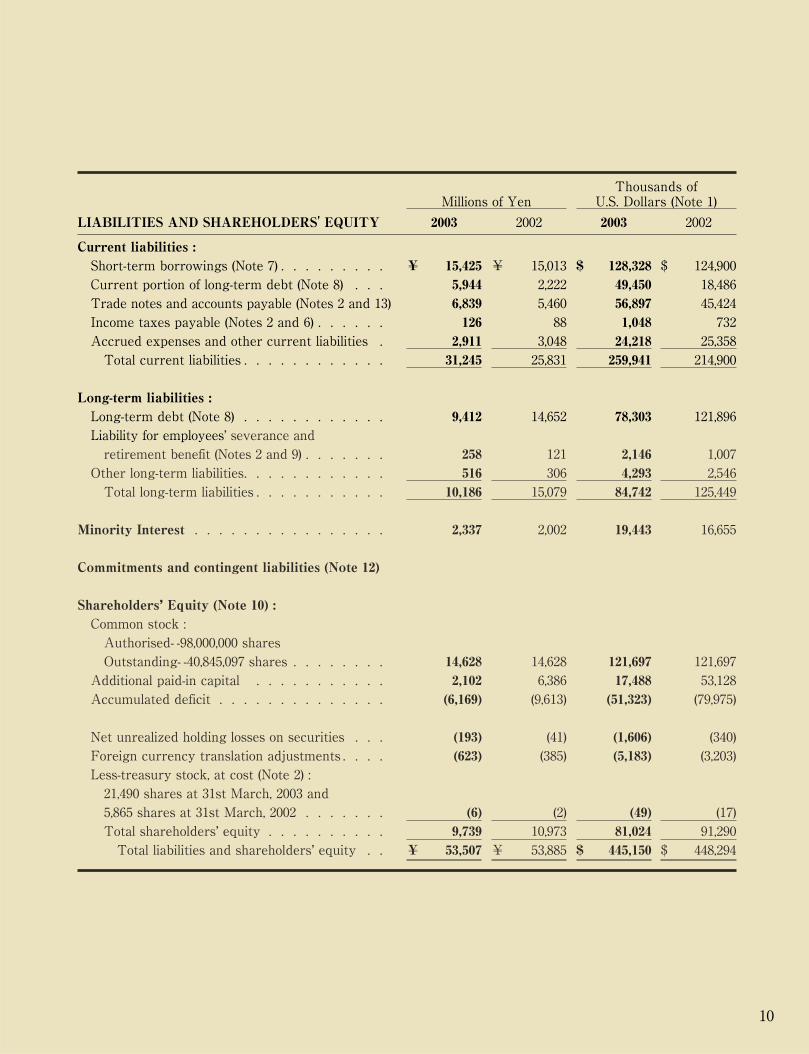
Thousands ofMillions of Yen U.S. Dollars (Note 1)
LIABILITIES AND SHAREHOLDERS' EQUITY 2003 2002 2003 2002
Current liabilities :Short-term borrowings (Note 7) . . . . . . . . . ¥ 15,425 ¥ 15,013 $ 128,328 $ 124,900Current portion of long-term debt (Note 8) . . . 5,944 2,222 49,450 18,486Trade notes and accounts payable (Notes 2 and 13) 6,839 5,460 56,897 45,424Income taxes payable (Notes 2 and 6) . . . . . . 126 88 1,048 732Accrued expenses and other current liabilities . 2,911 3,048 24,218 25,358Total current liabilities . . . . . . . . . . . . 31,245 25,831 259,941 214,900
Long-term liabilities :Long-term debt (Note 8) . . . . . . . . . . . . 9,412 14,652 78,303 121,896Liability for employees’ severance and retirement benefit (Notes 2 and 9) . . . . . . . 258 121 2,146 1,007Other long-term liabilities. . . . . . . . . . . . 516 306 4,293 2,546Total long-term liabilities . . . . . . . . . . . 10,186 15,079 84,742 125,449
Minority Interest . . . . . . . . . . . . . . . . 2,337 2,002 19,443 16,655
Commitments and contingent liabilities (Note 12)
Shareholders’ Equity (Note 10) :Common stock :Authorised- -98,000,000 sharesOutstanding- -40,845,097 shares . . . . . . . . 14,628 14,628 121,697 121,697
Additional paid-in capital . . . . . . . . . . . 2,102 6,386 17,488 53,128Accumulated deficit . . . . . . . . . . . . . . (6,169) (9,613) (51,323) (79,975)
Net unrealized holding losses on securities . . . (193) (41) (1,606) (340)Foreign currency translation adjustments . . . . (623) (385) (5,183) (3,203)Less-treasury stock, at cost (Note 2) :21,490 shares at 31st March, 2003 and5,865 shares at 31st March, 2002 . . . . . . . (6) (2) (49) (17)Total shareholders’ equity . . . . . . . . . . 9,739 10,973 81,024 91,290Total liabilities and shareholders’ equity . . ¥ 53,507 ¥ 53,885 $ 445,150 $ 448,294
11
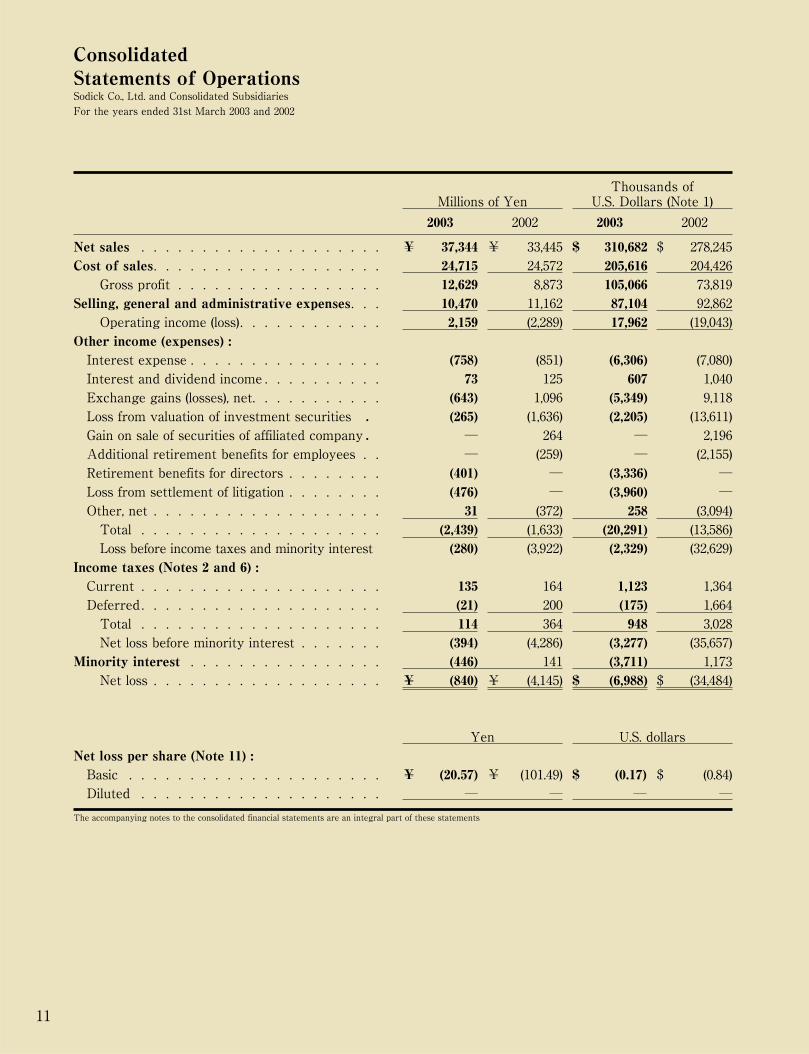
ConsolidatedStatements of OperationsSodick Co., Ltd. and Consolidated Subsidiaries
For the years ended 31st March 2003 and 2002
Thousands ofMillions of Yen U.S. Dollars (Note 1)
2003 2002 2003 2002
Net sales . . . . . . . . . . . . . . . . . . . . ¥ 37,344 ¥ 33,445 $ 310,682 $ 278,245Cost of sales . . . . . . . . . . . . . . . . . . . 24,715 24,572 205,616 204,426Gross profit . . . . . . . . . . . . . . . . . 12,629 8,873 105,066 73,819
Selling, general and administrative expenses . . . 10,470 11,162 87,104 92,862Operating income (loss). . . . . . . . . . . . 2,159 (2,289) 17,962 (19,043)
Other income (expenses) :Interest expense . . . . . . . . . . . . . . . . (758) (851) (6,306) (7,080)Interest and dividend income . . . . . . . . . . 73 125 607 1,040Exchange gains (losses), net. . . . . . . . . . . (643) 1,096 (5,349) 9,118Loss from valuation of investment securities . (265) (1,636) (2,205) (13,611)Gain on sale of securities of affiliated company. ― 264 ― 2,196Additional retirement benefits for employees . . ― (259) ― (2,155)Retirement benefits for directors . . . . . . . . (401) ― (3,336) ―Loss from settlement of litigation . . . . . . . . (476) ― (3,960) ―Other, net . . . . . . . . . . . . . . . . . . . 31 (372) 258 (3,094)Total . . . . . . . . . . . . . . . . . . . . (2,439) (1,633) (20,291) (13,586)Loss before income taxes and minority interest (280) (3,922) (2,329) (32,629)
Income taxes (Notes 2 and 6) :Current . . . . . . . . . . . . . . . . . . . . 135 164 1,123 1,364Deferred . . . . . . . . . . . . . . . . . . . . (21) 200 (175) 1,664Total . . . . . . . . . . . . . . . . . . . . 114 364 948 3,028Net loss before minority interest . . . . . . . (394) (4,286) (3,277) (35,657)
Minority interest . . . . . . . . . . . . . . . . (446) 141 (3,711) 1,173Net loss . . . . . . . . . . . . . . . . . . . ¥ (840) ¥ (4,145) $ (6,988) $ (34,484)
Yen U.S. dollarsNet loss per share (Note 11) :Basic . . . . . . . . . . . . . . . . . . . . . ¥ (20.57) ¥ (101.49) $ (0.17) $ (0.84)Diluted . . . . . . . . . . . . . . . . . . . . ― ― ― ―
The accompanying notes to the consolidated financial statements are an integral part of these statements
12
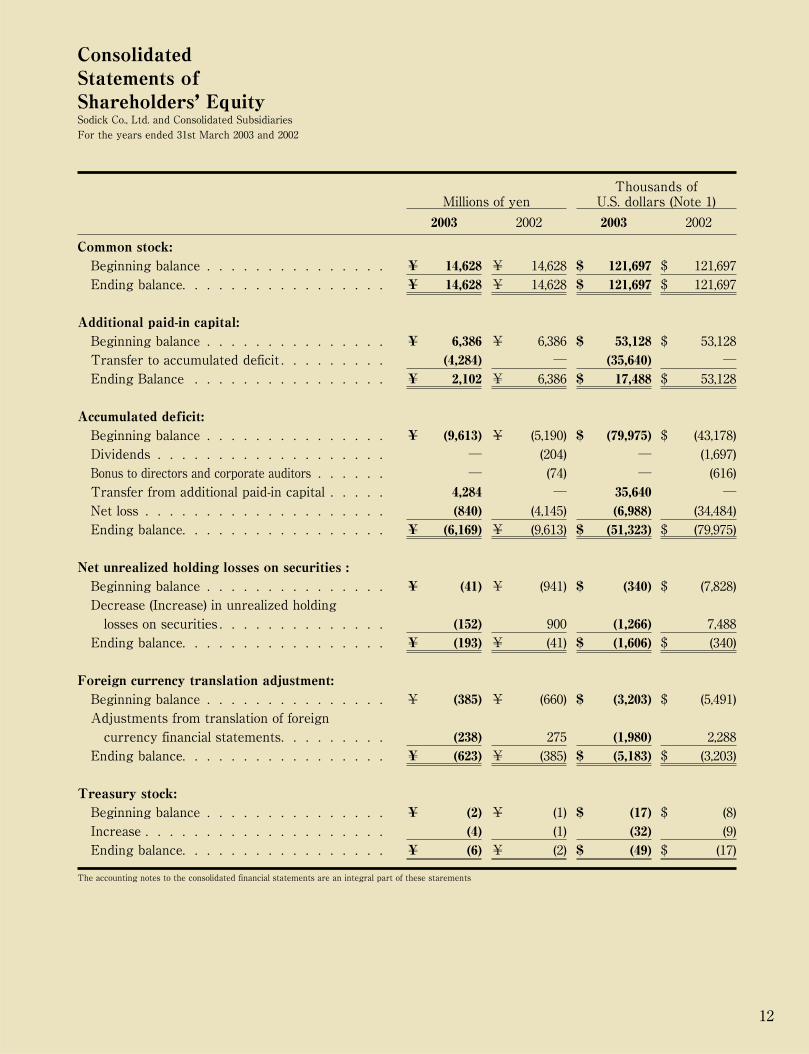
ConsolidatedStatements ofShareholders’ EquitySodick Co., Ltd. and Consolidated Subsidiaries
For the years ended 31st March 2003 and 2002
Thousands ofMillions of yen U.S. dollars (Note 1)
2003 2002 2003 2002
Common stock:Beginning balance . . . . . . . . . . . . . . . ¥ 14,628 ¥ 14,628 $ 121,697 $ 121,697Ending balance. . . . . . . . . . . . . . . . . ¥ 14,628 ¥ 14,628 $ 121,697 $ 121,697
Additional paid-in capital:Beginning balance . . . . . . . . . . . . . . . ¥ 6,386 ¥ 6,386 $ 53,128 $ 53,128Transfer to accumulated deficit . . . . . . . . . (4,284) ― (35,640) ―Ending Balance . . . . . . . . . . . . . . . . ¥ 2,102 ¥ 6,386 $ 17,488 $ 53,128
Accumulated deficit:Beginning balance . . . . . . . . . . . . . . . ¥ (9,613) ¥ (5,190) $ (79,975) $ (43,178)Dividends . . . . . . . . . . . . . . . . . . . ― (204) ― (1,697)Bonus to directors and corporate auditors . . . . . . ― (74) ― (616)Transfer from additional paid-in capital . . . . . 4,284 ― 35,640 ―Net loss . . . . . . . . . . . . . . . . . . . . (840) (4,145) (6,988) (34,484)Ending balance. . . . . . . . . . . . . . . . . ¥ (6,169) ¥ (9,613) $ (51,323) $ (79,975)
Net unrealized holding losses on securities :Beginning balance . . . . . . . . . . . . . . . ¥ (41) ¥ (941) $ (340) $ (7,828)Decrease (Increase) in unrealized holdinglosses on securities . . . . . . . . . . . . . . (152) 900 (1,266) 7,488Ending balance. . . . . . . . . . . . . . . . . ¥ (193) ¥ (41) $ (1,606) $ (340)
Foreign currency translation adjustment:Beginning balance . . . . . . . . . . . . . . . ¥ (385) ¥ (660) $ (3,203) $ (5,491)Adjustments from translation of foreigncurrency financial statements. . . . . . . . . (238) 275 (1,980) 2,288Ending balance. . . . . . . . . . . . . . . . . ¥ (623) ¥ (385) $ (5,183) $ (3,203)
Treasury stock:Beginning balance . . . . . . . . . . . . . . . ¥ (2) ¥ (1) $ (17) $ (8)Increase . . . . . . . . . . . . . . . . . . . . (4) (1) (32) (9)Ending balance. . . . . . . . . . . . . . . . . ¥ (6) ¥ (2) $ (49) $ (17)
The accounting notes to the consolidated financial statements are an integral part of these starements
13
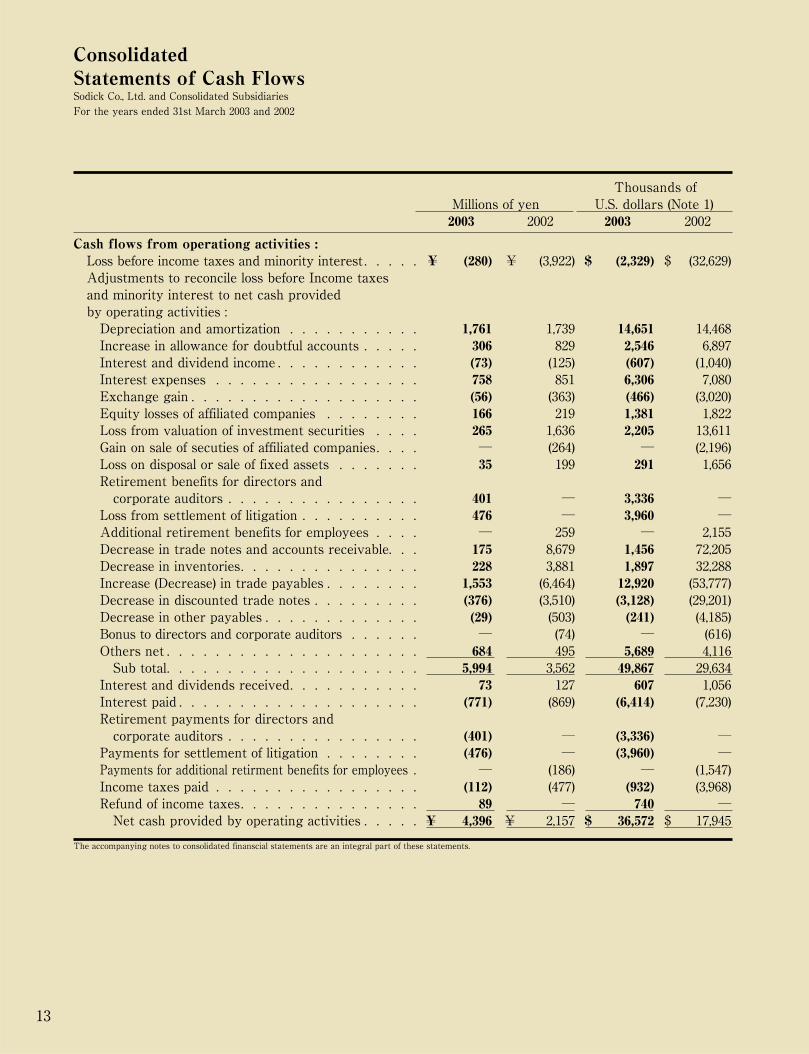
ConsolidatedStatements of Cash FlowsSodick Co., Ltd. and Consolidated Subsidiaries
For the years ended 31st March 2003 and 2002
Thousands ofMillions of yen U.S. dollars (Note 1)2003 2002 2003 2002
Cash flows from operationg activities :Loss before income taxes and minority interest . . . . . ¥ (280) ¥ (3,922) $ (2,329) $ (32,629)Adjustments to reconcile loss before Income taxesand minority interest to net cash providedby operating activities :Depreciation and amortization . . . . . . . . . . . 1,761 1,739 14,651 14,468Increase in allowance for doubtful accounts . . . . . 306 829 2,546 6,897Interest and dividend income . . . . . . . . . . . . (73) (125) (607) (1,040)Interest expenses . . . . . . . . . . . . . . . . . 758 851 6,306 7,080Exchange gain . . . . . . . . . . . . . . . . . . . (56) (363) (466) (3,020)Equity losses of affiliated companies . . . . . . . . 166 219 1,381 1,822Loss from valuation of investment securities . . . . 265 1,636 2,205 13,611Gain on sale of secuties of affiliated companies. . . . ― (264) ― (2,196)Loss on disposal or sale of fixed assets . . . . . . . 35 199 291 1,656Retirement benefits for directors and corporate auditors . . . . . . . . . . . . . . . . 401 ― 3,336 ―
Loss from settlement of litigation . . . . . . . . . . 476 ― 3,960 ―Additional retirement benefits for employees . . . . ― 259 ― 2,155Decrease in trade notes and accounts receivable. . . 175 8,679 1,456 72,205Decrease in inventories. . . . . . . . . . . . . . . 228 3,881 1,897 32,288Increase (Decrease) in trade payables . . . . . . . . 1,553 (6,464) 12,920 (53,777)Decrease in discounted trade notes . . . . . . . . . (376) (3,510) (3,128) (29,201)Decrease in other payables . . . . . . . . . . . . . (29) (503) (241) (4,185)Bonus to directors and corporate auditors . . . . . . ― (74) ― (616)Others net . . . . . . . . . . . . . . . . . . . . . 684 495 5,689 4,116Sub total. . . . . . . . . . . . . . . . . . . . . 5,994 3,562 49,867 29,634Interest and dividends received. . . . . . . . . . . 73 127 607 1,056Interest paid . . . . . . . . . . . . . . . . . . . . (771) (869) (6,414) (7,230)Retirement payments for directors and corporate auditors . . . . . . . . . . . . . . . . (401) ― (3,336) ―
Payments for settlement of litigation . . . . . . . . (476) ― (3,960) ―Payments for additional retirment benefits for employees . ― (186) ― (1,547)Income taxes paid . . . . . . . . . . . . . . . . . (112) (477) (932) (3,968)Refund of income taxes. . . . . . . . . . . . . . . 89 ― 740 ―Net cash provided by operating activities . . . . . ¥ 4,396 ¥ 2,157 $ 36,572 $ 17,945
The accompanying notes to consolidated finanscial statements are an integral part of these statements.
14
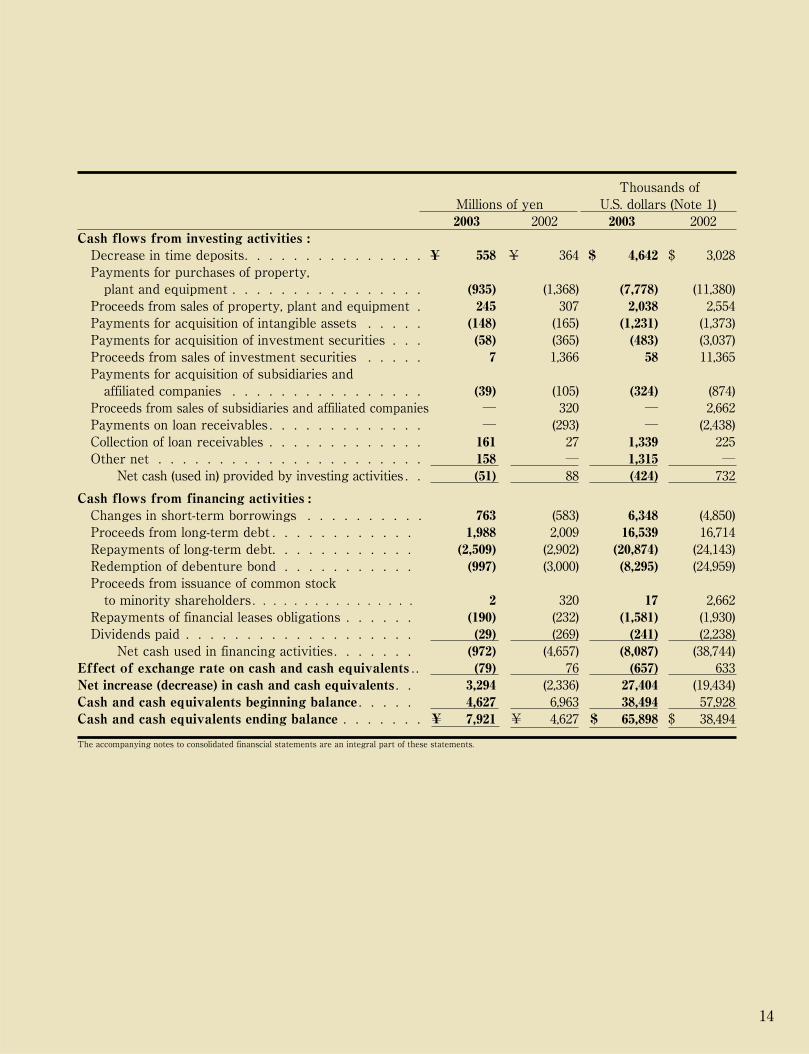
Thousands ofMillions of yen U.S. dollars (Note 1)2003 2002 2003 2002
Cash flows from investing activities :Decrease in time deposits. . . . . . . . . . . . . . . ¥ 558 ¥ 364 $ 4,642 $ 3,028Payments for purchases of property, plant and equipment . . . . . . . . . . . . . . . . (935) (1,368) (7,778) (11,380)Proceeds from sales of property, plant and equipment . 245 307 2,038 2,554Payments for acquisition of intangible assets . . . . . (148) (165) (1,231) (1,373)Payments for acquisition of investment securities . . . (58) (365) (483) (3,037)Proceeds from sales of investment securities . . . . . 7 1,366 58 11,365Payments for acquisition of subsidiaries and affiliated companies . . . . . . . . . . . . . . . . (39) (105) (324) (874)
Proceeds from sales of subsidiaries and affiliated companies ― 320 ― 2,662Payments on loan receivables . . . . . . . . . . . . . ― (293) ― (2,438)Collection of loan receivables . . . . . . . . . . . . . 161 27 1,339 225Other net . . . . . . . . . . . . . . . . . . . . . . 158 ― 1,315 ―
Net cash (used in) provided by investing activities . . (51) 88 (424) 732
Cash flows from financing activities :Changes in short-term borrowings . . . . . . . . . . 763 (583) 6,348 (4,850)Proceeds from long-term debt . . . . . . . . . . . . 1,988 2,009 16,539 16,714Repayments of long-term debt. . . . . . . . . . . . (2,509) (2,902) (20,874) (24,143)Redemption of debenture bond . . . . . . . . . . . (997) (3,000) (8,295) (24,959)Proceeds from issuance of common stock to minority shareholders . . . . . . . . . . . . . . . . 2 320 17 2,662
Repayments of financial leases obligations . . . . . . (190) (232) (1,581) (1,930)Dividends paid . . . . . . . . . . . . . . . . . . . (29) (269) (241) (2,238)Net cash used in financing activities . . . . . . . (972) (4,657) (8,087) (38,744)
Effect of exchange rate on cash and cash equivalents . . (79) 76 (657) 633Net increase (decrease) in cash and cash equivalents . . 3,294 (2,336) 27,404 (19,434)Cash and cash equivalents beginning balance . . . . . 4,627 6,963 38,494 57,928Cash and cash equivalents ending balance . . . . . . . ¥ 7,921 ¥ 4,627 $ 65,898 $ 38,494
The accompanying notes to consolidated finanscial statements are an integral part of these statements.
15
1. Basis of Presenting Consolidated FinancialStatements
Sodick Co., Ltd. (the “Company”) and itsconsolidated domestic subsidiaries maintaintheir official accouting records in Japaneseyen, and in accordance with the provisionsset forth in the Japanese Commercial Codeand accounting principles and practices gen-erally accepted in Japan (“Japanese GAAP”).The accounts of overseas subsidiaries arebased on their accounting records maintainedin conformity with generally acceptedaccounting principles and practices prevailingin the respective countries of domicile .Certain accounting principles and practicesgenerally accepted in Japan are differentfrom International Accounting Standards andstandards in other countries in certainrespects as to application and disclosurerequirements. Accordingly, the accompanyingconsolidated financial statements are intendedfor use by those who are informed aboutJapanese accounting principles and practices.The accompanying consolidated financialstatements have been restructured and trans-lated into English(with some expandeddescriptions and the inclusion of consolidatedstatements of shareholders’ equity) from theconsolidated financial statements of theCompany prepared in accordance withJapanese GAAP and filed with the appropri-ate Local Finance Bureau of the Ministry ofFinance as required by the Securities andExchange Law. Some supplementary informa-tion included in the statutory Japanese lan-guage consolidated financial statements, butnot required for fair presentation, is not pre-sented in the accompanying consolidatedfinancial statements.The translation of the Japanese yen amountsinto U.S.dollars are included solely for the con-venience of readers outside Japan, using theprevailing exchange rate at 31st March, 2003,which was ¥120.20 to U.S. $1. The conveniencetranslations should not be construed as repre-sentations that the Japanese yen amounts havebeen, could have been, or could in the futurebe, converted into U.S.dollars at this or anyother rate of exchange.
2. Significant Accounting and Reporting Policies
(a) Principles of ConsolidationThe consolidated financial statements includethe accounts of the Company and all of its sub-sidiaries, except for certain minor subsidiaries.All significant intercompany transactions andaccount balances are eliminated.
The Company consolidates all significantinvestees which are controlled through sub-stantial ownership of majority voting rightsor existence of certain conditions.In the elimination of investments in sub-
sidiaries, the assets and liabilities of the sub-sidiaries, including the portion attributable tominority shareholders, are evaluated usingthe fair value at the time the Companyacquired control of the respective sub-sidiaries.Investments in affiliated companies (20% to
50% owned) are accounted for by the equitymethod. And, investments in companies ofwhich the Company has at least 15% and lessthan 20% of the voting rights are alsoaccounted for using the equity method in thecases where the Company has ability to exer-cise significant influence over operating andfinancial policies of the investees.The excess of cost over the underlying
equity at acquisition dates of investments insubsidiaries and affiliates is being amortizedusing the straight-line method over five years.
(b) Cash and Cash EquivalentsCash and cash equivalents include, cash on
hand, readily available deposits and short-termhighly liquid investments with original maturi-ties of three months or less.
(c) Foreign Currency TranslationForeign currency receivables and payables
are translated into Japanese yen at appropriateyear-end rates.Financial statements of consolidated overseas
subsidiaries are translated into Japanese yen atthe year-end rate, except that shareholders’equity accounts are translated at historicalrates and income statement items resultingfrom transactions with the Company at therate used by the Company.
(d) Allowance for Doubtful AccountsThe Company and its consolidated sub-
sidiaries provide the allowance for doubtfulaccounts in an amount sufficient to cover possi-ble losses on collection by estimating individu-ally uncollectible amounts and applying a per-centage based on collection experience to theremaining accounts.
(e) InventoriesFinished goods and work in process are stat-
ed at cost determined using the specific identi-fication method. Raw materials are stated atcost, being determined by the first-in, first-outmethod.
(f) SecuritiesBased on the intent of holding, securities
are classified as (a) securities held for trading
Notes toConsolidatedFinancial StatementsSodick Co., Ltd. and Consolidated Subsidiaries
16
purposes (hereafter, “trading securities”), (b)debt securities intended to be held to maturity(hereafter, “held-to-maturity debt securities”), (c)equity securities issued by subsidiaries andaffiliated companies, on (d) all other securitiesthat are not classified in any of the above cate-gories (hereafter, “available-for-sale securities”).Equity securities issued by subsidiaries andaffiliated companies which are not consolidat-ed or accounted for using the equity methodare stated at moving-average cost. Available-for-sale securities with available fair marketvalues are stated at fair market value.Unrealized gains and unrealized losses onthese securities are reported, net of applicableincome taxes, as a separate component ofshareholders’ equity. Realized gains and loss-es on sale of such securities are computedusing moving-average costs. Other securitieswith no available fair market value are statedat moving-average cost.If equity securities issued by unconsolidat-ed subsidiaries and affiliated companies, andavailable-for-sale securities, declines signifi-cantly, such securities are stated at fair mar-ket value and the difference between fairmarket value and the carrying amount is rec-ognized as loss in the period of the decline. Ifthe fair market value of equity securitiesissued by unconsolidated subsidiaries andaffiliated companies not on the equity methodis not readily available, such securities shouldbe written down to net asset value with acorresponding charge in the income statementin the event net asset value declines significant-ly. In these cases, such fair market value or thenet asset value will be the carrying amount ofthe securities at the beginning of the next year.
(g) DepreciationDepreciation of buildings is computed pri-marily using the straight-line method anddepreciation of other plant and equipment isprimarily provided on the declining-balancemethod over their estimated useful lives.The estimated useful lives are as follows;Buildings and structures 3 to 50 yearsMachinery and equipment 2 to 17 yearsOrdinary maintenance and repairs arecharged to costs as incurred.Major replacements and betterments arecapitalized.
(h) Software CostsAmortization of software for internal use iscomputed using the straight-line method overthe estimated useful l ives (5 years) .Amortization of software for sales is providedat the greater of the amounts computed using(a) the ratio that current unit sales for a prod-
uct bear to the total of current and anticipat-ed future unit sales for that product or (b) thestraight-line method over the remaining esti-mated economic life of the product (3 years).
(i) LeaseFinance leases (excpet those that deem to
transfer ownership of the leased property tothe lessee) are accounted for in the samemanner as operating leases.
(j) Employees’ Severance and Retirement BenefitsThe Company and certain subsidiaries have
a funded pension plan covering all its employ-ees. Under the funded plan, the employeesare entitled to lump-sum payments or pensionpayments.The liabilities and expenses for severance
and retirement benefits are determined basedon the amounts actuarially calculated usingcertain assumptions. The Company and its consolidated sub-
sidiaries provided allowance for employees’severance and retirement benefits at 31stMarch, 2003 and 2002 based on the estimatedamounts of projected benefit obligation andthe fair value of the plan assets at thosedates.The excess of the projected benefit obliga-
tion over the total of the fair value of pensionassets as of 1st April, 2000 and the liabilitiesfor severance and retirement benefits record-ed as of 1st April, 2000, has been recognizedas expenses in equal amounts over 5 yearscommencing with the year ended 31st March,2001. Actuarial gains and losses are recog-nized as income or expenses using the declin-ing-balance method over 10 years commenc-ing with the following period.
(k) Research and DevelopmentResearch and development costs are charged
to costs as incurred.Total amounts charged to costs were ¥1,112
million ($9,251 thousand) and ¥1,131 million($9,409 thousand) in 2003 and 2002, respectively.
(l) Income TaxesThe Company and its consolidated sub-
sidiaries recognize tax effects of temporary dif-ferences between the carrying amounts ofassets and liabilities for tax and financialreporting. The provision for income taxes iscomputed based on the pretax income includedin the consolidated statement of operations.The asset and liability approach is used to rec-ognize defferred tax assets and liabilities forthe expected future tax consequences of tem-porary differences.
(m) Derivatives and hedge accountingThe Company and its consolidated sub-
17
sidiaries are required to state derivativefinancial instruments at fair value and to rec-ognize changes in the fair value as gains orlosses unless derivative financial instrumentsare used for hedging purposes. If derivative financial instruments are usedas hedges and meet certain hedging criteria,the Company and its consolidated subsidiariesdefer recognition of gains or losses resultingfrom changes in fair value of derivative finan-cial instruments until the related losses orgains on the hedged items are recognized.However, in cases where forward foreignexchange contracts are used as hedges andmeet certain hedging criteria, forward foreignexchange contracts and hedged items areaccounted for in the following manner: If a forward foreign exchange contract isexecuted to hedge an existing foreign curren-cy receivable or payable, (a) the difference, if any, between theJapanese yen amount of the hedged foreigncurrency receivable or payable translatedusing the spot rate at the inception date ofthe contract and the book value of the receiv-able or payable is recognized in the state-ment of operations in the period whichincludes the inception date, and(b) the discount or premium on the contract(that is, the difference between the Japanese yenamount of the contract translated using the con-tracted forward rate and that translated usingthe spot rate at the inception date of the con-tract) is recognized over the term of the contract.If a forward foreign exchange contract is exe-cuted to hedge a future transaction denominat-ed in a foreign currency, the future transactionwill be recorded using the contracted forwardrate, and no gains or losses on the forward for-eign exchange contract are recognized. Also, if interest rate swap contracts areused as hedge and meet certain hedging cri-teria, the net amount to be paid or receivedunder the interest rate swap contract isadded to or deducted from the interest on theassets or liabilities for which the swap con-tract was executed.
(n) Effect of Bank Holiday on 31st March, 2002As financial institutions in Japan wereclosed on 31st March, 2002, ¥109 million ($907thousands) of trade notes receivable, ¥417million ($3,469 thousands) of trade notespayable and ¥297 million ($2,471 thousands)of trade notes discounted on 31st March,2002, were settled on the following businessday, 1st April, 2002 and accounted for accord-ingly.
(o) Accounting standard for treasury stock andreversal of statutory reservesEffective 1st April, 2002, the Company and
its consolidated domestic subsidiaries adoptedthe new accounting standard for treasurystock and reversal of statutory reserves(Accounting Standards Board Statement No.1, “Accounting Standard for Treasury Stockand Reversal of Statutory Reserves”, issuedby the Accunting Standards Board of Japanon 21st February, 2002). The adoption of thenew accounting standard had no impact onthe financial statments.
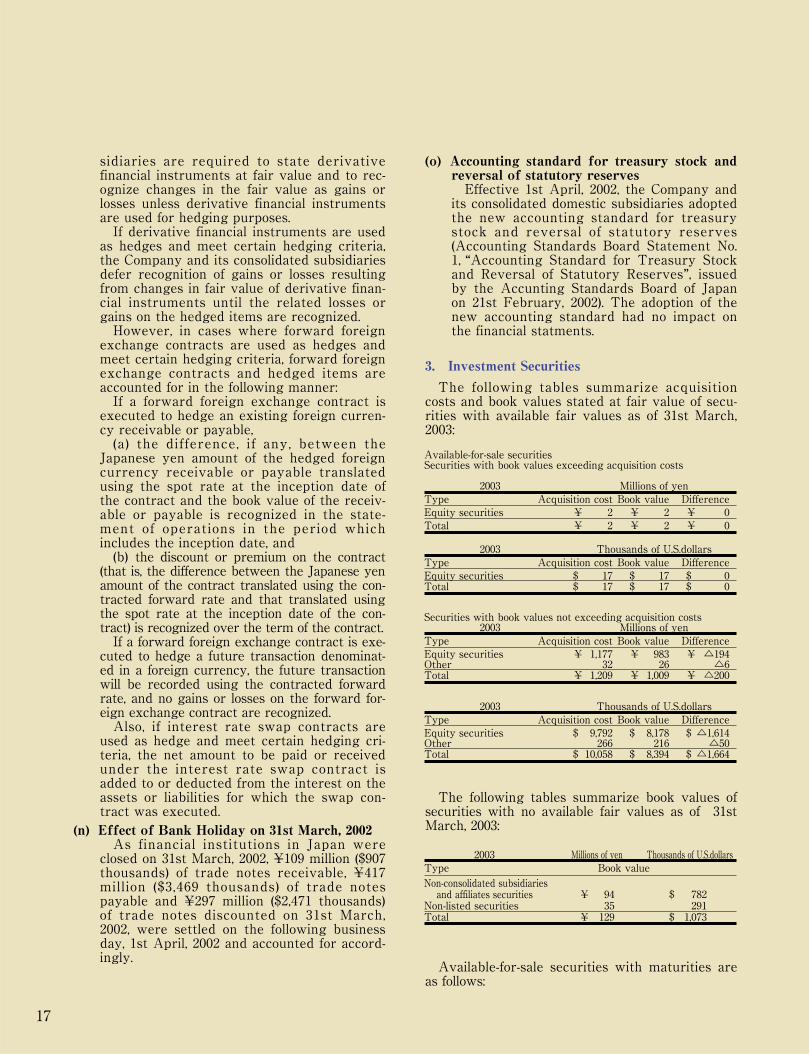
3. Investment Securities
The following tables summarize acquisitioncosts and book values stated at fair value of secu-rities with available fair values as of 31st March,2003:
The following tables summarize book values ofsecurities with no available fair values as of 31stMarch, 2003:
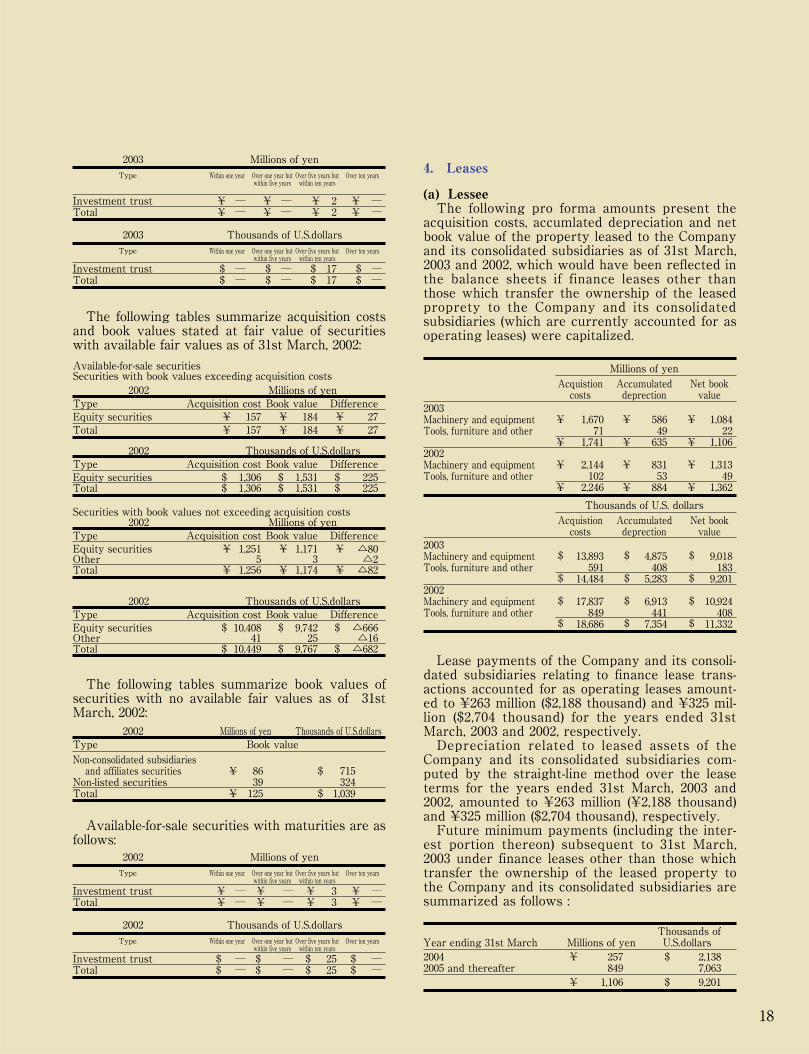
Available-for-sale securities with maturities areas follows:
2003 Millions of yen Thousands of U.S.dollarsType Book value
Non-consolidated subsidiaries and affiliates securities ¥ 94 $ 782
Non-listed securities 35 291Total ¥ 129 $ 1,073
Securities with book values not exceeding acquisition costs2003 Millions of yen
Type Acquisition cost Book value DifferenceEquity securities ¥ 1,177 ¥ 983 ¥ △194Other 32 26 △6Total ¥ 1,209 ¥ 1,009 ¥ △200
2003 Thousands of U.S.dollarsType Acquisition cost Book value DifferenceEquity securities $ 9,792 $ 8,178 $ △1,614Other 266 216 △50Total $ 10,058 $ 8,394 $ △1,664
Available-for-sale securitiesSecurities with book values exceeding acquisition costs
2003 Millions of yenType Acquisition cost Book value DifferenceEquity securities ¥ 2 ¥ 2 ¥ 0Total ¥ 2 ¥ 2 ¥ 0
2003 Thousands of U.S.dollarsType Acquisition cost Book value DifferenceEquity securities $ 17 $ 17 $ 0Total $ 17 $ 17 $ 0
18
The following tables summarize acquisition costsand book values stated at fair value of securitieswith available fair values as of 31st March, 2002:
The following tables summarize book values ofsecurities with no available fair values as of 31stMarch, 2002:
Available-for-sale securities with maturities are asfollows:
4. Leases
(a) LesseeThe following pro forma amounts present the
acquisition costs, accumlated depreciation and netbook value of the property leased to the Companyand its consolidated subsidiaries as of 31st March,2003 and 2002, which would have been reflected inthe balance sheets if finance leases other thanthose which transfer the ownership of the leasedproprety to the Company and its consolidatedsubsidiaries (which are currently accounted for asoperating leases) were capitalized.
Lease payments of the Company and its consoli-dated subsidiaries relating to finance lease trans-actions accounted for as operating leases amount-ed to ¥263 million ($2,188 thousand) and ¥325 mil-lion ($2,704 thousand) for the years ended 31stMarch, 2003 and 2002, respectively.Depreciation related to leased assets of the
Company and its consolidated subsidiaries com-puted by the straight-line method over the leaseterms for the years ended 31st March, 2003 and2002, amounted to ¥263 million (¥2,188 thousand)and ¥325 million ($2,704 thousand), respectively.Future minimum payments (including the inter-
est portion thereon) subsequent to 31st March,2003 under finance leases other than those whichtransfer the ownership of the leased property tothe Company and its consolidated subsidiaries aresummarized as follows :
2002 Millions of yen Thousands of U.S.dollarsType Book value
Non-consolidated subsidiaries and affiliates securities ¥ 86 $ 715
Non-listed securities 39 324Total ¥ 125 $ 1,039
Securities with book values not exceeding acquisition costs2002 Millions of yen
Type Acquisition cost Book value DifferenceEquity securities ¥ 1,251 ¥ 1,171 ¥ △80Other 5 3 △2Total ¥ 1,256 ¥ 1,174 ¥ △82
2002 Thousands of U.S.dollarsType Acquisition cost Book value DifferenceEquity securities $ 10,408 $ 9,742 $ △666Other 41 25 △16Total $ 10,449 $ 9,767 $ △682
2002 Millions of yen
Type Within one year Over one year but Over five years but Over ten yearswithin five years within ten years
Investment trust ¥ ― ¥ ― ¥ 3 ¥ ―Total ¥ ― ¥ ― ¥ 3 ¥ ―
2002 Thousands of U.S.dollars
Type Within one year Over one year but Over five years but Over ten yearswithin five years within ten years
Investment trust $ ― $ ― $ 25 $ ―Total $ ― $ ― $ 25 $ ―
Available-for-sale securitiesSecurities with book values exceeding acquisition costs
2002 Millions of yenType Acquisition cost Book value DifferenceEquity securities ¥ 157 ¥ 184 ¥ 27Total ¥ 157 ¥ 184 ¥ 27
2002 Thousands of U.S.dollarsType Acquisition cost Book value DifferenceEquity securities $ 1,306 $ 1,531 $ 225Total $ 1,306 $ 1,531 $ 225
2003 Millions of yen
Type Within one year Over one year but Over five years but Over ten yearswithin five years within ten years
Investment trust ¥ ― ¥ ― ¥ 2 ¥ ―Total ¥ ― ¥ ― ¥ 2 ¥ ―
2003 Thousands of U.S.dollars
Type Within one year Over one year but Over five years but Over ten yearswithin five years within ten years
Investment trust $ ― $ ― $ 17 $ ―Total $ ― $ ― $ 17 $ ―
Millions of yen
Acquistion Accumulated Net bookcosts deprection value
2003Machinery and equipment ¥ 1,670 ¥ 586 ¥ 1,084Tools, furniture and other 71 49 22
¥ 1,741 ¥ 635 ¥ 1,1062002Machinery and equipment ¥ 2,144 ¥ 831 ¥ 1,313Tools, furniture and other 102 53 49
¥ 2,246 ¥ 884 ¥ 1,362
Thousands of U.S. dollars
Acquistion Accumulated Net bookcosts deprection value
2003Machinery and equipment $ 13,893 $ 4,875 $ 9,018Tools, furniture and other 591 408 183
$ 14,484 $ 5,283 $ 9,2012002Machinery and equipment $ 17,837 $ 6,913 $ 10,924Tools, furniture and other 849 441 408
$ 18,686 $ 7,354 $ 11,332
Thousands ofYear ending 31st March Millions of yen U.S.dollars2004 ¥ 257 $ 2,1382005 and thereafter 849 7,063
¥ 1,106 $ 9,201
19
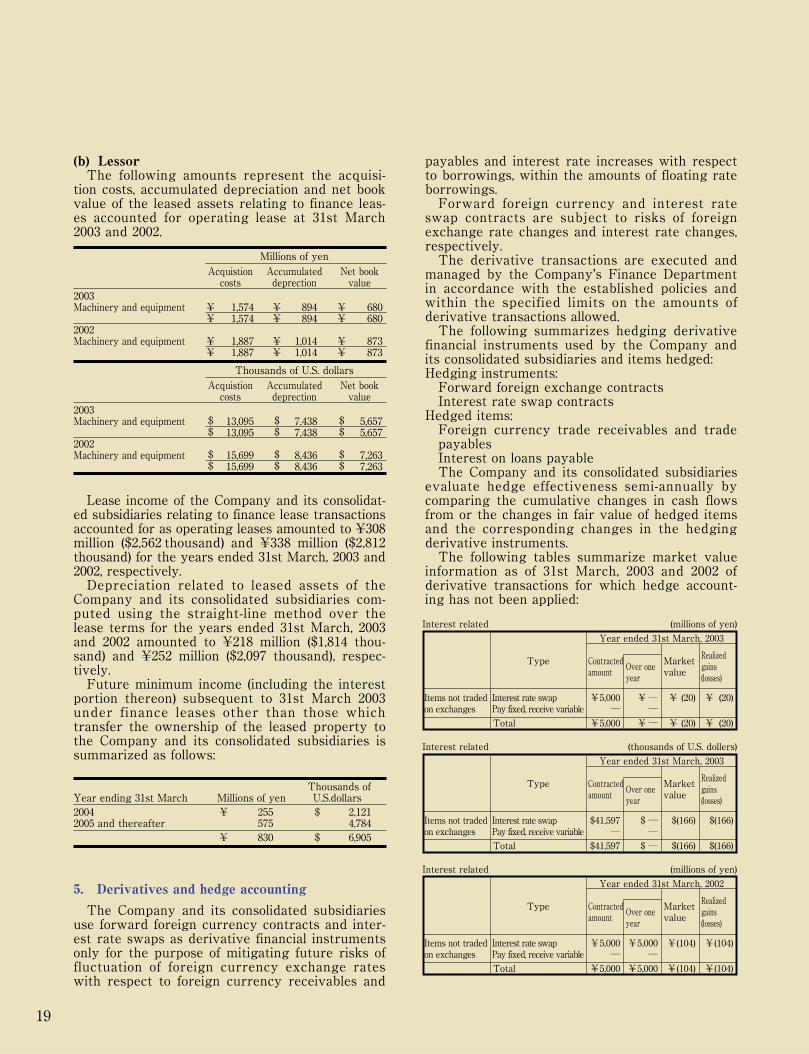
(b) LessorThe following amounts represent the acquisi-tion costs, accumulated depreciation and net bookvalue of the leased assets relating to finance leas-es accounted for operating lease at 31st March2003 and 2002.
Lease income of the Company and its consolidat-ed subsidiaries relating to finance lease transactionsaccounted for as operating leases amounted to ¥308million ($2,562 thousand) and ¥338 million ($2,812thousand) for the years ended 31st March, 2003 and2002, respectively.Depreciation related to leased assets of theCompany and its consolidated subsidiaries com-puted using the straight-line method over thelease terms for the years ended 31st March, 2003and 2002 amounted to ¥218 million ($1,814 thou-sand) and ¥252 million ($2,097 thousand), respec-tively.Future minimum income (including the interestportion thereon) subsequent to 31st March 2003under finance leases other than those whichtransfer the ownership of the leased property tothe Company and its consolidated subsidiaries issummarized as follows:
5. Derivatives and hedge accounting
The Company and its consolidated subsidiariesuse forward foreign currency contracts and inter-est rate swaps as derivative financial instrumentsonly for the purpose of mitigating future risks offluctuation of foreign currency exchange rateswith respect to foreign currency receivables and
payables and interest rate increases with respectto borrowings, within the amounts of floating rateborrowings.Forward foreign currency and interest rate
swap contracts are subject to risks of foreignexchange rate changes and interest rate changes,respectively. The derivative transactions are executed and
managed by the Company’s Finance Departmentin accordance with the established policies andwithin the specified limits on the amounts ofderivative transactions allowed.The following summarizes hedging derivative
financial instruments used by the Company andits consolidated subsidiaries and items hedged: Hedging instruments: Forward foreign exchange contractsInterest rate swap contracts
Hedged items: Foreign currency trade receivables and tradepayablesInterest on loans payableThe Company and its consolidated subsidiaries
evaluate hedge effectiveness semi-annually bycomparing the cumulative changes in cash flowsfrom or the changes in fair value of hedged itemsand the corresponding changes in the hedgingderivative instruments. The following tables summarize market value
information as of 31st March, 2003 and 2002 ofderivative transactions for which hedge account-ing has not been applied:
Millions of yen
Acquistion Accumulated Net bookcosts deprection value
2003Machinery and equipment ¥ 1,574 ¥ 894 ¥ 680
¥ 1,574 ¥ 894 ¥ 6802002Machinery and equipment ¥ 1,887 ¥ 1,014 ¥ 873
¥ 1,887 ¥ 1,014 ¥ 873
Thousands of U.S. dollars
Acquistion Accumulated Net bookcosts deprection value
2003Machinery and equipment $ 13,095 $ 7,438 $ 5,657
$ 13,095 $ 7,438 $ 5,6572002Machinery and equipment $ 15,699 $ 8,436 $ 7,263
$ 15,699 $ 8,436 $ 7,263
Thousands ofYear ending 31st March Millions of yen U.S.dollars2004 ¥ 255 $ 2,1212005 and thereafter 575 4,784
¥ 830 $ 6,905
Interest related
Items not tradedon exchanges
Total
Interest rate swapPay fixed, receive variable
Type
Year ended 31st March, 2003
Marketvalue
Over oneyear
Contractedamount
¥5,000
¥5,000―
¥―
¥――
¥ (20)
¥ (20)
¥ (20)
¥ (20)
Realizedgains(losses)
(millions of yen)
Interest related
Items not tradedon exchanges
Total
Interest rate swapPay fixed, receive variable
Type
Year ended 31st March, 2003
Marketvalue
Over oneyear
Contractedamount
$41,597
$41,597―
$ ―
$ ――
$(166)
$(166)
$(166)
$(166)
Realizedgains(losses)
(thousands of U.S. dollers)
Interest related
Items not tradedon exchanges
Total
Interest rate swapPay fixed, receive variable
Type
Year ended 31st March, 2002
Marketvalue
Over oneyear
Contractedamount
¥5,000
¥5,000―
¥5,000
¥5,000―
¥(104)
¥(104)
¥(104)
¥(104)
Realizedgains(losses)
(millions of yen)
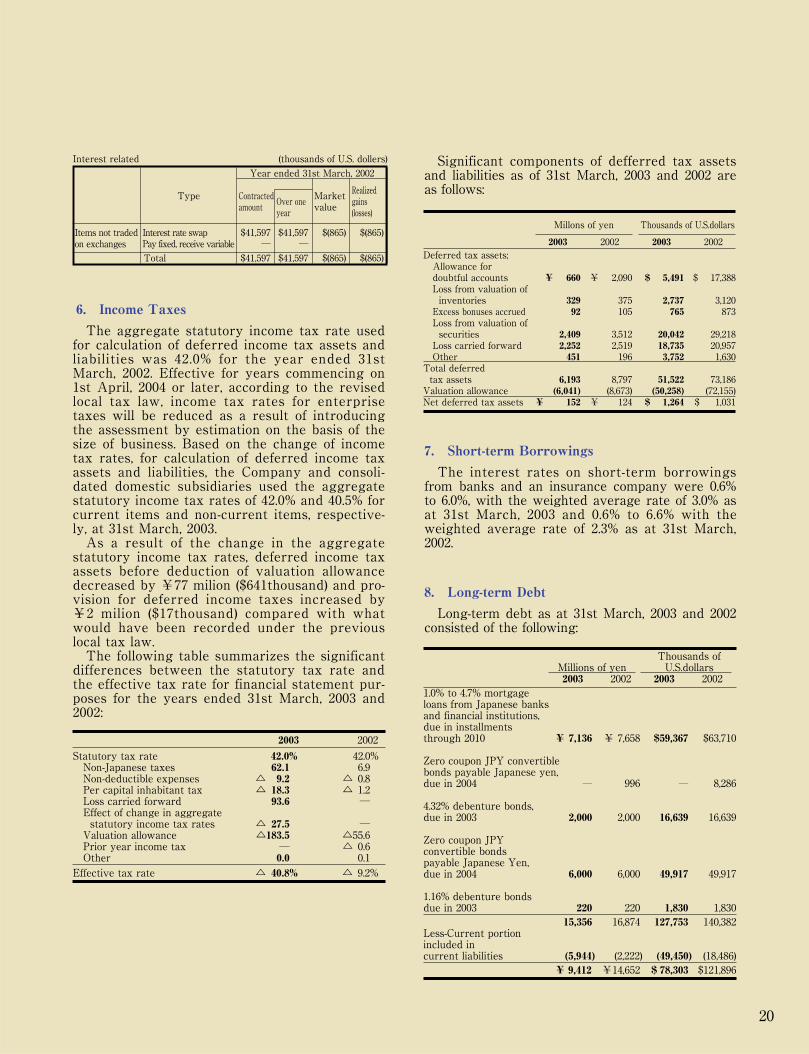
6. Income Taxes
The aggregate statutory income tax rate usedfor calculation of deferred income tax assets andliabilities was 42.0% for the year ended 31stMarch, 2002. Effective for years commencing on1st April, 2004 or later, according to the revisedlocal tax law, income tax rates for enterprisetaxes will be reduced as a result of introducingthe assessment by estimation on the basis of thesize of business. Based on the change of incometax rates, for calculation of deferred income taxassets and liabilities, the Company and consoli-dated domestic subsidiaries used the aggregatestatutory income tax rates of 42.0% and 40.5% forcurrent items and non-current items, respective-ly, at 31st March, 2003.As a result of the change in the aggregate
statutory income tax rates, deferred income taxassets before deduction of valuation allowancedecreased by ¥77 milion ($641thousand) and pro-vision for deferred income taxes increased by¥2 milion ($17thousand) compared with whatwould have been recorded under the previouslocal tax law.The following table summarizes the significant
differences between the statutory tax rate andthe effective tax rate for financial statement pur-poses for the years ended 31st March, 2003 and2002:
Significant components of defferred tax assetsand liabilities as of 31st March, 2003 and 2002 areas follows:
7. Short-term Borrowings
The interest rates on short-term borrowingsfrom banks and an insurance company were 0.6%to 6.0%, with the weighted average rate of 3.0% asat 31st March, 2003 and 0.6% to 6.6% with theweighted average rate of 2.3% as at 31st March,2002.
8. Long-term Debt
Long-term debt as at 31st March, 2003 and 2002consisted of the following:
20
2003 2002
Statutory tax rate 42.0% 42.0%Non-Japanese taxes 62.1 6.9Non-deductible expenses △ 9.2 △ 0.8Per capital inhabitant tax △ 18.3 △ 1.2Loss carried forward 93.6 ―Effect of change in aggregatestatutory income tax rates △ 27.5 ―Valuation allowance △183.5 △55.6Prior year income tax ― △ 0.6Other 0.0 0.1
Effective tax rate △ 40.8% △ 9.2%
2003
Millons of yen
¥ 660
32992
2,4092,252451
6,193(6,041)
¥ 152
¥ 2,090
375105
3,5122,519196
8,797(8,673)
¥ 124
$ 5,491
2,737765
20,04218,7353,752
51,522(50,258)$ 1,264
$ 17,388
3,120873
29,21820,9571,630
73,186(72,155)
$ 1,031
2002Deferred tax assets;Allowance for doubtful accountsLoss from valuation of inventoriesExcess bonuses accruedLoss from valuation ofsecuritiesLoss carried forwardOtherTotal deferred tax assetsValuation allowanceNet deferred tax assets
2003
Thousands of U.S.dollars
2002
Interest related
Items not tradedon exchanges
Total
Interest rate swapPay fixed, receive variable
Type
Year ended 31st March, 2002
Marketvalue
Over oneyear
Contractedamount
$41,597
$41,597―
$41,597
$41,597―
$(865)
$(865)
$(865)
$(865)
Realizedgains(losses)
(thousands of U.S. dollers)
Thousands ofMillions of yen U.S.dollars2003 2002 2003 2002
1.0% to 4.7% mortgageloans from Japanese banksand financial institutions,due in installmentsthrough 2010 ¥ 7,136 ¥ 7,658 $59,367 $63,710
Zero coupon JPY convertiblebonds payable Japanese yen,due in 2004 ― 996 ― 8,286
4.32% debenture bonds,due in 2003 2,000 2,000 16,639 16,639
Zero coupon JPYconvertible bondspayable Japanese Yen,due in 2004 6,000 6,000 49,917 49,917
1.16% debenture bondsdue in 2003 220 220 1,830 1,830
15,356 16,874 127,753 140,382Less-Current portionincluded incurrent liabilities (5,944) (2,222) (49,450) (18,486)
¥ 9,412 ¥14,652 $ 78,303 $121,896
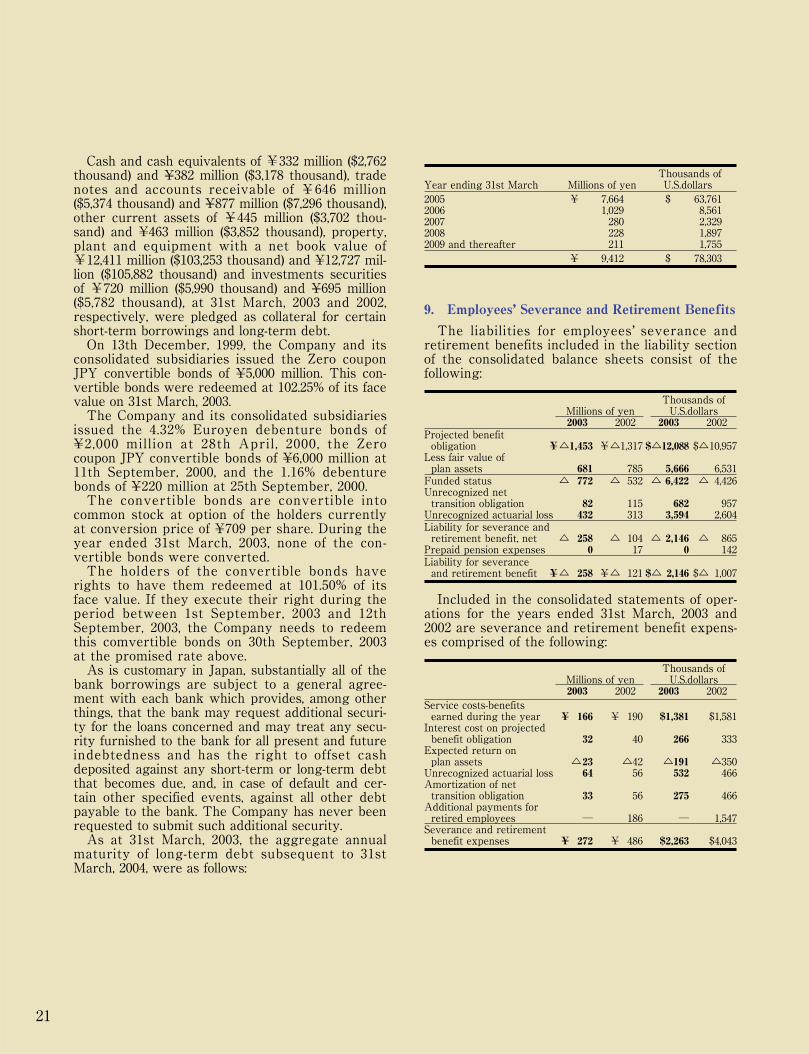
Cash and cash equivalents of ¥332 million ($2,762thousand) and ¥382 million ($3,178 thousand), tradenotes and accounts receivable of ¥646 million($5,374 thousand) and ¥877 million ($7,296 thousand),other current assets of ¥445 million ($3,702 thou-sand) and ¥463 million ($3,852 thousand), property,plant and equipment with a net book value of¥12,411 million ($103,253 thousand) and ¥12,727 mil-lion ($105,882 thousand) and investments securitiesof ¥720 million ($5,990 thousand) and ¥695 million($5,782 thousand), at 31st March, 2003 and 2002,respectively, were pledged as collateral for certainshort-term borrowings and long-term debt.On 13th December, 1999, the Company and itsconsolidated subsidiaries issued the Zero couponJPY convertible bonds of ¥5,000 million. This con-vertible bonds were redeemed at 102.25% of its facevalue on 31st March, 2003.The Company and its consolidated subsidiariesissued the 4.32% Euroyen debenture bonds of¥2,000 mill ion at 28th April , 2000, the Zerocoupon JPY convertible bonds of ¥6,000 million at11th September, 2000, and the 1.16% debenturebonds of ¥220 million at 25th September, 2000.The convertible bonds are convertible intocommon stock at option of the holders currentlyat conversion price of ¥709 per share. During theyear ended 31st March, 2003, none of the con-vertible bonds were converted.The holders of the convertible bonds haverights to have them redeemed at 101.50% of itsface value. If they execute their right during theperiod between 1st September, 2003 and 12thSeptember, 2003, the Company needs to redeemthis comvertible bonds on 30th September, 2003at the promised rate above. As is customary in Japan, substantially all of thebank borrowings are subject to a general agree-ment with each bank which provides, among otherthings, that the bank may request additional securi-ty for the loans concerned and may treat any secu-rity furnished to the bank for all present and futureindebtedness and has the right to offset cashdeposited against any short-term or long-term debtthat becomes due, and, in case of default and cer-tain other specified events, against all other debtpayable to the bank. The Company has never beenrequested to submit such additional security.As at 31st March, 2003, the aggregate annualmaturity of long-term debt subsequent to 31stMarch, 2004, were as follows:
9. Employees’ Severance and Retirement Benefits
The liabilities for employees’ severance andretirement benefits included in the liability sectionof the consolidated balance sheets consist of thefollowing:
Included in the consolidated statements of oper-ations for the years ended 31st March, 2003 and2002 are severance and retirement benefit expens-es comprised of the following:
21
Thousands ofYear ending 31st March Millions of yen U.S.dollars2005 ¥ 7,664 $ 63,7612006 1,029 8,5612007 280 2,3292008 228 1,8972009 and thereafter 211 1,755
¥ 9,412 $ 78,303
Thousands ofMillions of yen U.S.dollars2003 2002 2003 2002
Service costs-benefits earned during the year ¥ 166 ¥ 190 $1,381 $1,581Interest cost on projected benefit obligation 32 40 266 333Expected return on plan assets △23 △42 △191 △350Unrecognized actuarial loss 64 56 532 466Amortization of net transition obligation 33 56 275 466Additional payments forretired employees ― 186 ― 1,547Severance and retirement benefit expenses ¥ 272 ¥ 486 $2,263 $4,043
Thousands ofMillions of yen U.S.dollars2003 2002 2003 2002
Projected benefit obligation ¥△1,453 ¥△1,317 $△12,088 $△10,957Less fair value of plan assets 681 785 5,666 6,531Funded status △ 772 △ 532 △ 6,422 △ 4,426Unrecognized net transition obligation 82 115 682 957Unrecognized actuarial loss 432 313 3,594 2,604Liability for severance and retirement benefit, net △ 258 △ 104 △ 2,146 △ 865Prepaid pension expenses 0 17 0 142Liability for severance and retirement benefit ¥△ 258 ¥△ 121 $△ 2,146 $△ 1,007
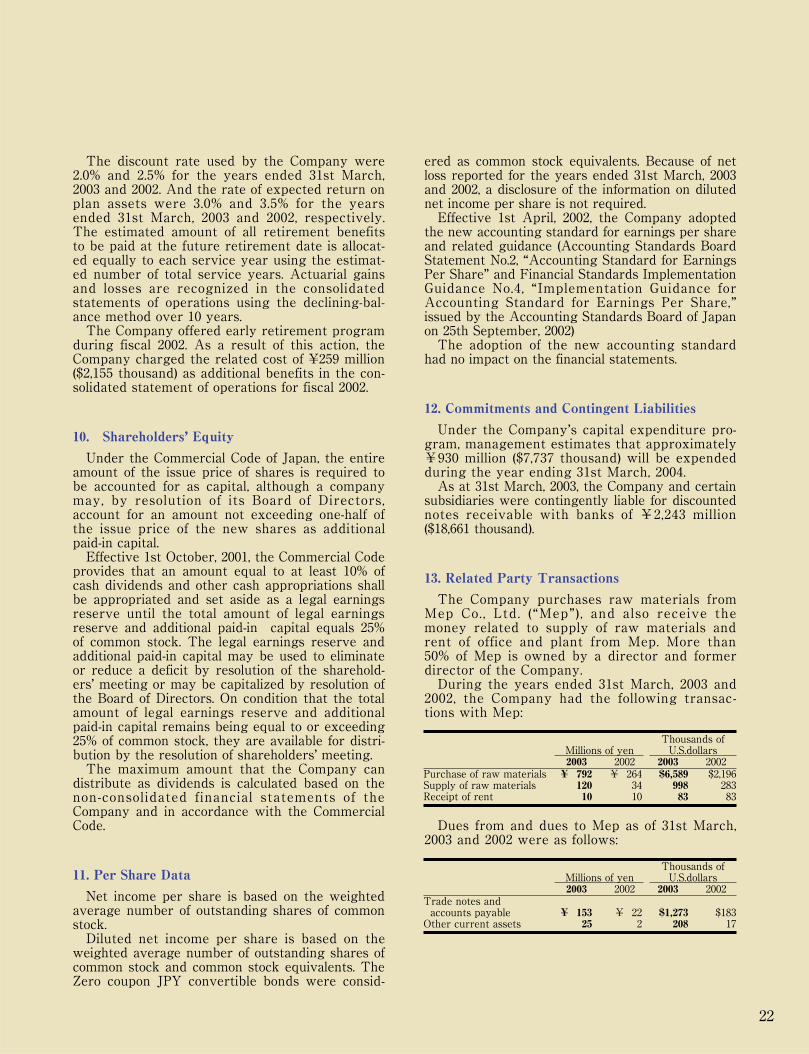
The discount rate used by the Company were2.0% and 2.5% for the years ended 31st March,2003 and 2002. And the rate of expected return onplan assets were 3.0% and 3.5% for the yearsended 31st March, 2003 and 2002, respectively.The estimated amount of all retirement benefitsto be paid at the future retirement date is allocat-ed equally to each service year using the estimat-ed number of total service years. Actuarial gainsand losses are recognized in the consolidatedstatements of operations using the declining-bal-ance method over 10 years.The Company offered early retirement program
during fiscal 2002. As a result of this action, theCompany charged the related cost of ¥259 million($2,155 thousand) as additional benefits in the con-solidated statement of operations for fiscal 2002.
10. Shareholders’ Equity
Under the Commercial Code of Japan, the entireamount of the issue price of shares is required tobe accounted for as capital, although a companymay, by resolution of its Board of Directors,account for an amount not exceeding one-half ofthe issue price of the new shares as additionalpaid-in capital.Effective 1st October, 2001, the Commercial Code
provides that an amount equal to at least 10% ofcash dividends and other cash appropriations shallbe appropriated and set aside as a legal earningsreserve until the total amount of legal earningsreserve and additional paid-in capital equals 25%of common stock. The legal earnings reserve andadditional paid-in capital may be used to eliminateor reduce a deficit by resolution of the sharehold-ers’ meeting or may be capitalized by resolution ofthe Board of Directors. On condition that the totalamount of legal earnings reserve and additionalpaid-in capital remains being equal to or exceeding25% of common stock, they are available for distri-bution by the resolution of shareholders’ meeting.The maximum amount that the Company can
distribute as dividends is calculated based on thenon-consolidated financial statements of theCompany and in accordance with the CommercialCode.
11. Per Share Data
Net income per share is based on the weightedaverage number of outstanding shares of commonstock.Diluted net income per share is based on the
weighted average number of outstanding shares ofcommon stock and common stock equivalents. TheZero coupon JPY convertible bonds were consid-
ered as common stock equivalents. Because of netloss reported for the years ended 31st March, 2003and 2002, a disclosure of the information on dilutednet income per share is not required.Effective 1st April, 2002, the Company adopted
the new accounting standard for earnings per shareand related guidance (Accounting Standards BoardStatement No.2, “Accounting Standard for EarningsPer Share” and Financial Standards ImplementationGuidance No.4, “Implementation Guidance forAccounting Standard for Earnings Per Share,”issued by the Accounting Standards Board of Japanon 25th September, 2002)The adoption of the new accounting standard
had no impact on the financial statements.
12. Commitments and Contingent Liabilities
Under the Company’s capital expenditure pro-gram, management estimates that approximately¥930 million ($7,737 thousand) will be expendedduring the year ending 31st March, 2004.As at 31st March, 2003, the Company and certain
subsidiaries were contingently liable for discountednotes receivable with banks of ¥2,243 million($18,661 thousand).
13. Related Party Transactions
The Company purchases raw materials fromMep Co. , Ltd. (“Mep” ) , and also receive themoney related to supply of raw materials andrent of office and plant from Mep. More than50% of Mep is owned by a director and formerdirector of the Company.During the years ended 31st March, 2003 and
2002, the Company had the following transac-tions with Mep:
Dues from and dues to Mep as of 31st March,2003 and 2002 were as follows:
22
Thousands ofMillions of yen U.S.dollars2003 2002 2003 2002
Purchase of raw materials ¥ 792 ¥ 264 $6,589 $2,196Supply of raw materials 120 34 998 283Receipt of rent 10 10 83 83
Thousands ofMillions of yen U.S.dollars2003 2002 2003 2002
Trade notes and accounts payable ¥ 153 ¥ 22 $1,273 $183Other current assets 25 2 208 17
23
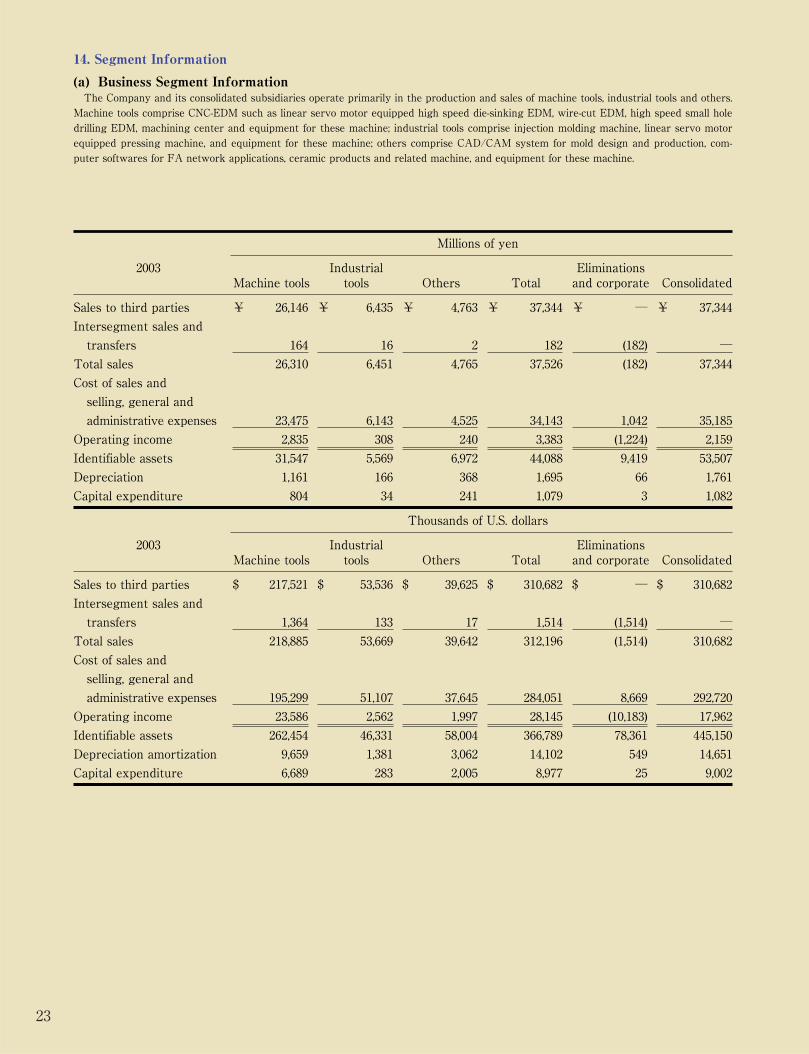
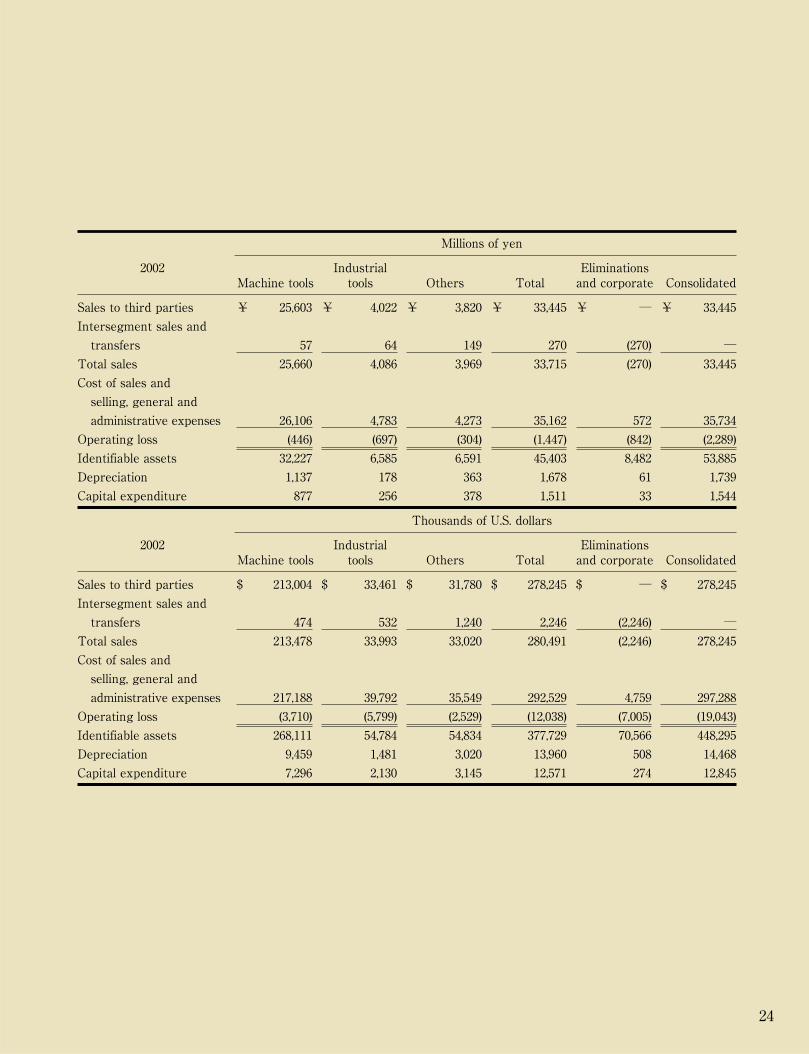
14. Segment Information
(a) Business Segment InformationThe Company and its consolidated subsidiaries operate primarily in the production and sales of machine tools, industrial tools and others.
Machine tools comprise CNC-EDM such as linear servo motor equipped high speed die-sinking EDM, wire-cut EDM, high speed small hole
drilling EDM, machining center and equipment for these machine; industrial tools comprise injection molding machine, linear servo motor
equipped pressing machine, and equipment for these machine; others comprise CAD/CAM system for mold design and production, com-
puter softwares for FA network applications, ceramic products and related machine, and equipment for these machine.
Millions of yen
2003 Industrial Eliminations Machine tools tools Others Total and corporate Consolidated
Sales to third parties ¥ 26,146 ¥ 6,435 ¥ 4,763 ¥ 37,344 ¥ ― ¥ 37,344
Intersegment sales and
transfers 164 16 2 182 (182) ―
Total sales 26,310 6,451 4,765 37,526 (182) 37,344
Cost of sales and
selling, general and
administrative expenses 23,475 6,143 4,525 34,143 1,042 35,185
Operating income 2,835 308 240 3,383 (1,224) 2,159
Identifiable assets 31,547 5,569 6,972 44,088 9,419 53,507
Depreciation 1,161 166 368 1,695 66 1,761
Capital expenditure 804 34 241 1,079 3 1,082
Thousands of U.S. dollars
2003 Industrial Eliminations Machine tools tools Others Total and corporate Consolidated
Sales to third parties $ 217,521 $ 53,536 $ 39,625 $ 310,682 $ ― $ 310,682
Intersegment sales and
transfers 1,364 133 17 1,514 (1,514) ―
Total sales 218,885 53,669 39,642 312,196 (1,514) 310,682
Cost of sales and
selling, general and
administrative expenses 195,299 51,107 37,645 284,051 8,669 292,720
Operating income 23,586 2,562 1,997 28,145 (10,183) 17,962
Identifiable assets 262,454 46,331 58,004 366,789 78,361 445,150
Depreciation amortization 9,659 1,381 3,062 14,102 549 14,651
Capital expenditure 6,689 283 2,005 8,977 25 9,002
24
Millions of yen
2002 Industrial Eliminations Machine tools tools Others Total and corporate Consolidated
Sales to third parties ¥ 25,603 ¥ 4,022 ¥ 3,820 ¥ 33,445 ¥ ― ¥ 33,445
Intersegment sales and
transfers 57 64 149 270 (270) ―
Total sales 25,660 4,086 3,969 33,715 (270) 33,445
Cost of sales and
selling, general and
administrative expenses 26,106 4,783 4,273 35,162 572 35,734
Operating loss (446) (697) (304) (1,447) (842) (2,289)
Identifiable assets 32,227 6,585 6,591 45,403 8,482 53,885
Depreciation 1,137 178 363 1,678 61 1,739
Capital expenditure 877 256 378 1,511 33 1,544
Thousands of U.S. dollars
2002 Industrial Eliminations Machine tools tools Others Total and corporate Consolidated
Sales to third parties $ 213,004 $ 33,461 $ 31,780 $ 278,245 $ ― $ 278,245
Intersegment sales and
transfers 474 532 1,240 2,246 (2,246) ―
Total sales 213,478 33,993 33,020 280,491 (2,246) 278,245
Cost of sales and
selling, general and
administrative expenses 217,188 39,792 35,549 292,529 4,759 297,288
Operating loss (3,710) (5,799) (2,529) (12,038) (7,005) (19,043)
Identifiable assets 268,111 54,784 54,834 377,729 70,566 448,295
Depreciation 9,459 1,481 3,020 13,960 508 14,468
Capital expenditure 7,296 2,130 3,145 12,571 274 12,845

25
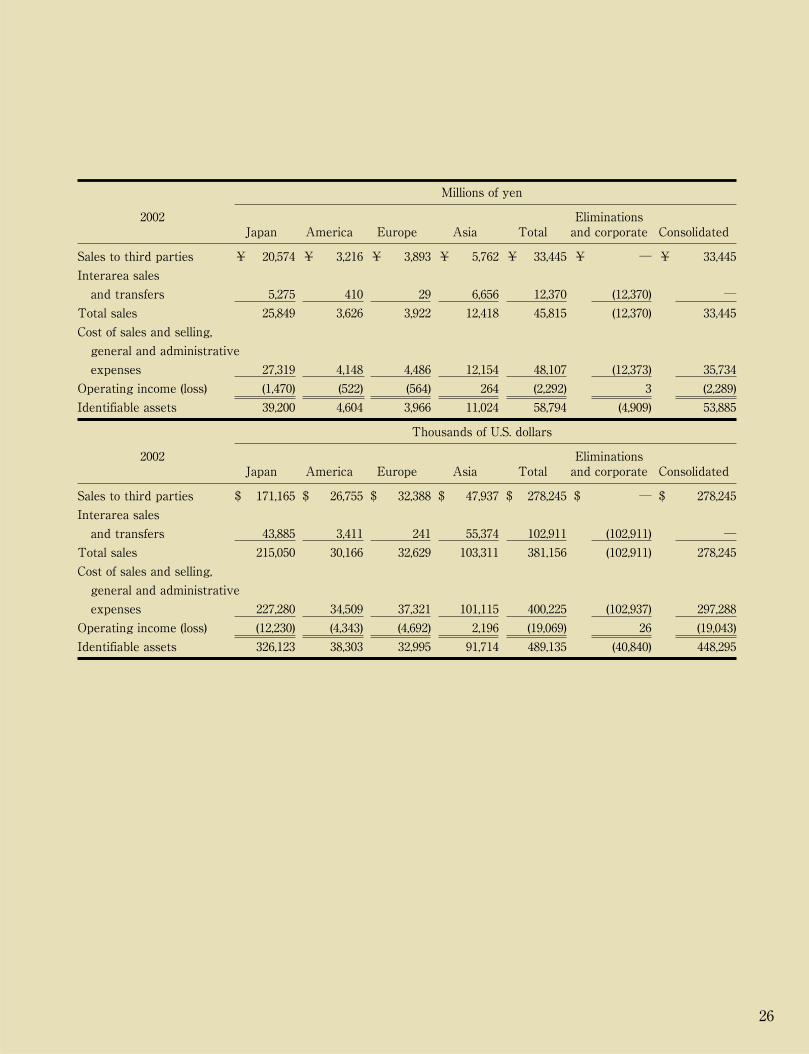
(b) Geographical Segment InformationGeographical segment information for the years ended 31st March, 2003 and 2002 was as follows
Millions of yen
2003 EliminationsJapan America Europe Asia Total and corporate Consolidated
Sales to third parties ¥ 23,885 ¥ 2,709 ¥ 3,733 ¥ 7,017 ¥ 37,344 ¥ ― ¥ 37,344
Interarea sales and
transfers 6,380 206 118 6,991 13,695 (13,695) ―
Total sales 30,265 2,915 3,851 14,008 51,039 (13,695) 37,344
Cost of sales and selling,
general and administrative
expenses 27,416 3,457 4,187 13,153 48,213 (13,028) 35,185
Operating income (loss) 2,849 (542) (336) 855 2,826 (667) 2,159
Identifiable assets 35,271 2,765 3,883 11,563 53,482 25 53,507
Thousands of U.S. dollars
2003 EliminationsJapan America Europe Asia Total and corporate Consolidated
Sales to third parties $ 198,710 $ 22,537 $ 31,057 $ 58,378 $ 310,682 $ ― $ 310,682
Interarea sales
and transfers 53,079 1,714 981 58,161 113,935 (113,935) ―
Total sales 251,789 24,251 32,038 116,539 424,617 (113,935) 310,682
Cost of sales and selling,
general and administrative
expenses 228,087 28,760 34,833 109,426 401,106 (108,386) 292,720
Operating income (loss) 23,702 (4,509) (2,795) 7,113 23,511 (5,549) 17,962
Identifiable assets 293,436 23,003 32,305 96,198 444,942 208 445,150
26
Millions of yen
2002 EliminationsJapan America Europe Asia Total and corporate Consolidated
Sales to third parties ¥ 20,574 ¥ 3,216 ¥ 3,893 ¥ 5,762 ¥ 33,445 ¥ ― ¥ 33,445
Interarea sales
and transfers 5,275 410 29 6,656 12,370 (12,370) ―
Total sales 25,849 3,626 3,922 12,418 45,815 (12,370) 33,445
Cost of sales and selling,
general and administrative
expenses 27,319 4,148 4,486 12,154 48,107 (12,373) 35,734
Operating income (loss) (1,470) (522) (564) 264 (2,292) 3 (2,289)
Identifiable assets 39,200 4,604 3,966 11,024 58,794 (4,909) 53,885
Thousands of U.S. dollars
2002 EliminationsJapan America Europe Asia Total and corporate Consolidated
Sales to third parties $ 171,165 $ 26,755 $ 32,388 $ 47,937 $ 278,245 $ ― $ 278,245
Interarea sales
and transfers 43,885 3,411 241 55,374 102,911 (102,911) ―
Total sales 215,050 30,166 32,629 103,311 381,156 (102,911) 278,245
Cost of sales and selling,
general and administrative
expenses 227,280 34,509 37,321 101,115 400,225 (102,937) 297,288
Operating income (loss) (12,230) (4,343) (4,692) 2,196 (19,069) 26 (19,043)
Identifiable assets 326,123 38,303 32,995 91,714 489,135 (40,840) 448,295
27
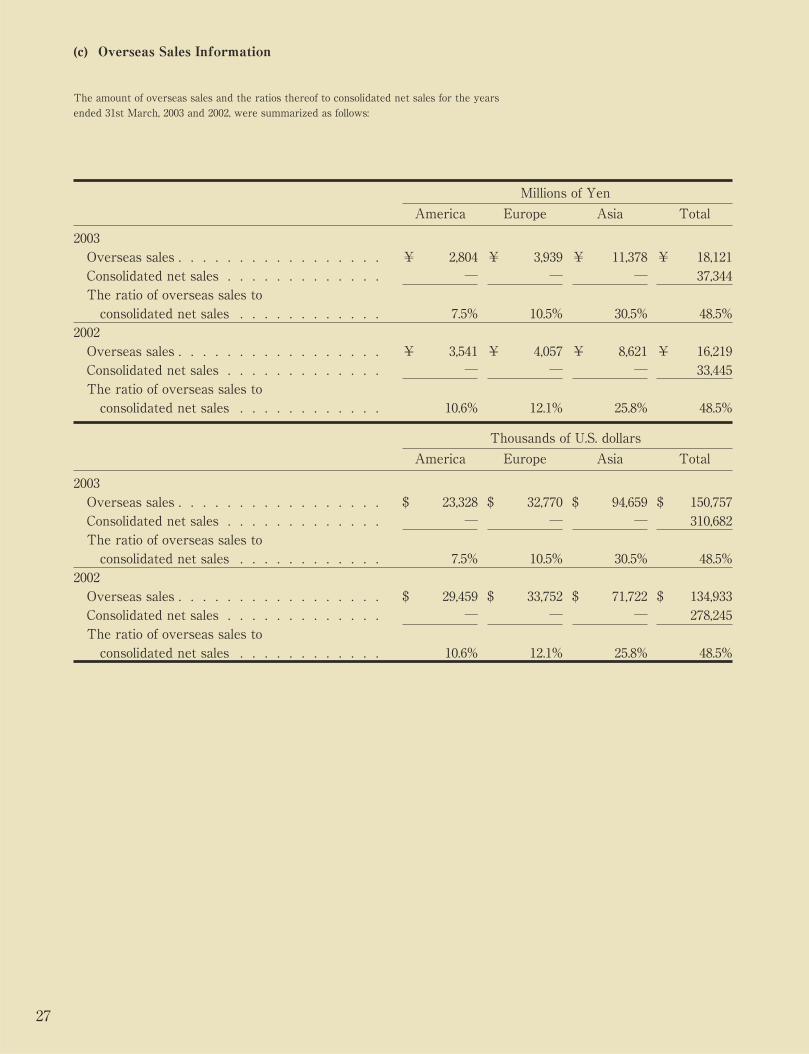
(c) Overseas Sales Information
The amount of overseas sales and the ratios thereof to consolidated net sales for the years
ended 31st March, 2003 and 2002, were summarized as follows:
Millions of Yen
America Europe Asia Total
2003Overseas sales . . . . . . . . . . . . . . . . . ¥ 2,804 ¥ 3,939 ¥ 11,378 ¥ 18,121Consolidated net sales . . . . . . . . . . . . . ― ― ― 37,344The ratio of overseas sales toconsolidated net sales . . . . . . . . . . . . 7.5% 10.5% 30.5% 48.5%
2002Overseas sales . . . . . . . . . . . . . . . . . ¥ 3,541 ¥ 4,057 ¥ 8,621 ¥ 16,219Consolidated net sales . . . . . . . . . . . . . ― ― ― 33,445The ratio of overseas sales toconsolidated net sales . . . . . . . . . . . . 10.6% 12.1% 25.8% 48.5%
Thousands of U.S. dollars
America Europe Asia Total
2003Overseas sales . . . . . . . . . . . . . . . . . $ 23,328 $ 32,770 $ 94,659 $ 150,757Consolidated net sales . . . . . . . . . . . . . ― ― ― 310,682The ratio of overseas sales toconsolidated net sales . . . . . . . . . . . . 7.5% 10.5% 30.5% 48.5%
2002Overseas sales . . . . . . . . . . . . . . . . . $ 29,459 $ 33,752 $ 71,722 $ 134,933Consolidated net sales . . . . . . . . . . . . . ― ― ― 278,245The ratio of overseas sales toconsolidated net sales . . . . . . . . . . . . 10.6% 12.1% 25.8% 48.5%
28
To the Shareholders and Board of Directors ofSodick Co., Ltd. :
We have audited the accompanying consolidatedbalance sheets of Sodick Co., Ltd. and subsidiariesas of 31st March, 2003 and 2002, and the relatedconsolidated statements of operations, shareholers’equity and cash flows for the years then ended,expressed in Japanese yen. These consolidatedfinancial statements are the responsibility of theCompany’s management. Our responsibility is toexpress an opinion on these consolidated financialstatements based on our audits.We conducted our audits in accordance with
auditing standards generally accepted in Japan.Those standards require that we plan and performthe audit to obtain reasonable assurance aboutwhether the financial statements are free of materi-al misstatement. An audit includes examining, on atest basis, evidence supporting the amounts anddisclosures in the financial statements. An auditalso includes assessing the accounting principlesused and significant estimates made by manage-ment, as well as evaluating the overall financialstatement presentation. We believe that our auditsprovide reasonable basis for our opinion.In our opinion, the consolidated financial state-
ments referred to above present fairly, in all materi-al respects, the consolidated financial position ofSodick Co., Ltd. and subsidiaries as of 31st March,2003 and 2002, and the consolidated results of theiroperations and their cash flows for the years thenended, in conformity with accounting principlesgenerally accepted in Japan as described in Note 1to the consolidated financial statements.The consolidated financial statements as of and
for the years ended 31st March, 2003 and 2002 havebeen translated into United States dollars solely forthe convenience of the reader. We have recomput-ed the translation and, in our opinion, the consoli-dated financial statements expressed in Japaneseyen have been translated into United States dollarson the basis set forth in Note 1 to the consolidatedfinancial statements.
Tokyo, Japan26th June, 2003
Independent Auditors’ Report
29
Main Products
CNC die-sinking EDMFINE Sodick AQ, AM and A Series
CNC wire-cut EDMFINE Sodick AQ, AP and EXC Series
High-speed Small Hole Drilling EDMK Series
Nano MachineNANO-100
Machining CenterMC Series
Automatic 3D Mold Design System (CAD/CAM)and Computer Softwares for FA network appli-cationsDiPro and PRMSystems Series
Injection Molding MachinesTUPARL Series
Linear Servo Motor and Motion ControllerSL, ST and SC Series
Pressing CenterSP Series
High-quality CeramicsFINEXCERA
Board of Directors(As of 26th June, 2003)
ChairmanMasaaki Suzuki
PresidentShigeo Shioda
Vice-PresidentYoshitaka Maruta
Senior Managing DirectorAkio Hosaka
Managing DirectorsTakashi YamamotoKazuo Kato
DirectorsTakeshi IchikawaKousaku KaratoKeisuke Takagi
Corporate Standing Statutory AuditorHaruhiko Nishijima
Corporate Statutory AuditorsSadao Simoyama Sakuo UenoSaeji Kusunoki
30
Company Location
Sodick Co., Ltd.3-12-1 Nakamachidai, Tsuzuki-ku,Yokohama, Kanagawa 224-8522, JapanTel: 045-942-3111Fax: 045-943-7881E-mail: [email protected] URL: http://www.sodick.co.jp
Overseas SubsidiariesSodick Europe GmbHNordendstrasse 57-61, D-64546, Moerfelden-Walldorf,GermanyTel: 49-610-596190Fax: 49-610-5961921
Sodick (H.K.) Co., Ltd.Unit 1201, One Peking, No. 1 Peking Rood,Tsim Sha Tsui,Kowloon, Hong KongTel: 852-2721-0200Fax: 852-2612-0562
Sodick Singapore Pte., Ltd.71 Ubi Crescent, #01-03/04,Excalibur Centre,Singapore 408571Tel: 65-746-9089Fax: 65-746-9048
Sodick Electromechanical (Shanghai)Co., Ltd.No. 1058, Hu Qing Ping High Way, MinhangDistrict, Shanghai, 201105, P.R.ChinaTel: 86-21-64216069Fax: 86-21-54471840
Sodick International Trading (Shenzhen) Co., Ltd.3-127 Honghua Road, International Commerce Center, Futian Free Trade Zone, Shenzhen, P.R.ChinaTel: 86-755-3595937Fax: 86-755-3591751
Suzhou Sodick Special Equipment Co., Ltd.18 Zhuyuan Road, New District,Suzhou, 215011, P.R. ChinaTel: 86-512-68253533Fax: 86-512-68253405
Sodick (Thailand) Co., Ltd.60/84 Moo-19, Soi-19, Navanakorn Industrial EstateZone 3,Phaholyothin Road,Klongneung, Klongluang,Patumthani 12120,ThailandTel: 66-2-529-2450̃6Fax: 66-2-529-2459
Sodick Inc.851 Feehanville Drive,Mount Prospect, IL. 60056, U.S.A.Tel: 1-847-759-6700Fax: 1-847-759-6701
Sodick America Corporation2182 Bering Drive, San Jose,CA 95131, U.S.A.Tel: 1-408-943-1693Fax: 1-408-943-1694
Sodick (Taiwan) Co., Ltd.No. 138, Lane52, Pa-Teh Road,Lin-Kou Hsiang,Taipei Hsian, Taiwan, R.O.C.Tel: 88-6-2-2600-6648Fax: 88-6-2-2609-7224
Sodick (Malaysia) Sdn., Bhd.No.18 Jalan Rotan Tanah Taman Ria,Plentong 81750 Masai, Johor Bahru Takzim,MalaysiaTel: 60-7-388-8661Fax: 60-7-388-8663
Shanghai Sodick Software Co., Ltd.471 Gui Ping Road, Xu Hui District, Shanghai,200233, P.R. ChinaTel: 86-21-64851533Fax: 86-21-64851785
Suzhou Sodick-Sanguong Machinery ElectricCo., Ltd.158 Chuangye Road, New District,Suzhou, 215011, P.R. ChinaTel: 86-512-68252800Fax: 86-512-68253925
Suzhou STK Foundry Co., Ltd.37 Xiyuan Road, Suzhou, 215008, P.R. ChinaTel: 86-512-67232998Fax: 86-512-67231461
Sodick Engineering Service(Thailand) Co., Ltd.344/1 344/4 Soi Soonvijai 4, Rama 9 Road, Bangkapi,Huaykwang, Bangkok 10320, ThailandTel: 66-2-716-8350Fax: 66-2-716-8360
This reports printed on
the tree free paper for the
environmental conservation
Printed in Japan
3-12-1 Nakamachidai, Tsuzuki-Ku
Yokohama, Kanagawa 224-8522,
Japan
Tel : 045-942-3111
URL : http://www.sodick.co.jp