Embed Size (px)
Citation preview

Communications report 2011–12 seriesReport 3—Smartphones and tablets Take-up and use in Australia

Canberra Purple Building Benjamin Offices Chan Street Belconnen ACT PO Box 78 Belconnen ACT 2616 T +61 2 6219 5555 F +61 2 6219 5353
Melbourne Level 44 Melbourne Central Tower 360 Elizabeth Street Melbourne VIC PO Box 13112 Law Courts Melbourne VIC 8010 T +61 3 9963 6800 F +61 3 9963 6899
Sydney Level 5 The Bay Centre 65 Pirrama Road Pyrmont NSW PO Box Q500 Queen Victoria Building NSW 1230 T +61 2 9334 7700 1800 226 667
F +61 2 9334 7799
© Commonwealth of Australia 2013
This work is copyright. Apart from any use as permitted under the Copyright Act 1968, no part may be reproduced
by any process without prior written permission from the Commonwealth. Requests and inquiries concerning reproduction
and rights should be addressed to the Manager, Editorial Services, Australian Communications and Media Authority,
PO Box 13112 Law Courts, Melbourne Vic 8010.
Published by the Australian Communications and Media Authority

Contents
Executive summary 1
Introduction 3
Definitions 4
The changing communications landscape 6
Overview 6
Global developments in the smartphone and tablet market 8
Overview 8
Market share by manufacturer 8
Market share by operating system 9
Provision of smartphone and tablet devices and services in Australia 13
Smartphone and tablet supply chains in Australia 13
Tablets in Australia 16
Smartphone and tablet apps 19
Take-up and use of smartphones and tablets 22
Smartphone and tablet take-up 22
Smartphone service arrangements 24
Activities undertaken via mobile phones 26
Reasons for not using mobile handsets for internet access 29
The future of handheld smart devices in Australia 31
New smart devices 31
Emerging services 31
Infrastructure developments—LTE (4G) 35
Market challenges 35
Smartphones and tablets as assistive technology 36
Research methodology 38
Overview of research resources 38
Endnotes 39


Executive summary
In 2011–12, the mobile phone market appeared to be reaching saturation level, with the number of mobile services in operation increasing by only three per cent compared with 13 per cent during 2010–11. The major mobile marketplace changes were driven by the rapid take-up of smartphones and tablets as mobile devices were being upgraded and new tablets acquired by consumers, and by ongoing improvements in internet access. In response to this challenge to existing business models, Australian mobile telecommunications service providers have sought to diversify revenue streams through this smartphone and tablet services market, by supporting take-up and use.
This strategy has seen considerable success in identifying and meeting consumer
demand, with an estimated 8.67 million smartphone and 4.37 million tablet users in
Australia at May 2012. Also, consumers are using these devices to provide
complementary services, with 3.65 million using both a mobile phone and a tablet to
access the internet.
The growth in smartphone usage has given rise to significant growth in mobile phone
internet access and data usage. In comparison to other mobile phone users,
smartphone users are:
nine times more likely to go online via their handsets
four times more likely to purchase goods online
three times more likely to stream or download audio or video content
three times more likely to pay bills online
twice as likely to access social networking sites.
The upgrading of mobile networks to support 4G services and the expansion of WiFi
networks, have been key facilitators for the development of the smartphone/tablet
market in Australia. The three mobile carriers are either in the process of upgrading
their networks to support 4G or are planning for this to occur in 2013, and two million
Australians used a WiFi hotspot in the June 2012 quarter.
The functionality and ease of internet access provided by smartphones and tablets
has been greatly enhanced by the proliferation of applications (apps). During June
2012, an estimated 4.5 million Australians downloaded a mobile app.
The extension of smartphone and tablet take-up and functionality drives innovation
and emerging services, such as developments in mobile payments (mobile wallet),
mobile cloud computing and near-field communications—facilitating services such as
micropayments, location-based information services and ticketing. However, the
growth in take-up of smartphones and tablets is also disruptive, presenting challenges
to both industry and consumers.
Mobile phone voice over internet protocol (VoIP) has already seen significant growth in
2011–12 with an estimated 616,000 users at June 2012—an increase of 133 per cent
since June 2011, leading to erosion of carriers‘ voice and messaging revenue streams.
The increasing use of mobile apps has seen a rise in mobile data usage and an increase in the number of consumers experiencing ‗bill shock‘—receiving an unexpectedly high mobile phone bill. This was a key issue addressed by the ACMA in its Reconnecting the Customer public inquiry and the subsequent registration of the industry‘s new Telecommunications Consumer Protections code in September 2012, which aim to improve service provider performance in areas such as billing, advertising and complaint-handling.

Table 1 Smartphone and tablet market, Australia—key indicators, 2011–12
Key indicator June 2011 June 2012 % change
Mobile services in operation 29.28 m 30.20 m +3.1%
Mobile internet subscribers 18.11 m 22.05 m +21.8%
Persons 18 years+ with a smartphone 4.25 m 8.67 m
(May 2012) +104%
Persons 14 years+ using WiFi
hotspots during the June quarter 1.56 m 2.06 m +32.1%
Smartphone users aged 18 years+
downloading mobile apps during June 2.41 m 4.45 m +85%
Persons 18 years+ going online via*: May 2012
mobile phones 9.19 m
tablets 4.37 m
a mobile phone and a tablet 3.65 m
Persons 18 years+ undertaking select
online activities via mobile phone
handsets*:
Non-smartphone
mobile internet
users
Smartphone
internet users
browsing websites or search for
information 46% 90%
accessed news, sports, weather
updates 40% 84%
used a social networking site 31% 71%
streaming audio or video content 19% 55%
paid bills 11% 38%
downloaded audio or video content 10% 33%
purchased goods or services 8% 33%
Reasons for not going online via
mobile phone handset:
no need 61% 41%
easier to use the internet via a
computer than a mobile phone 37% 29%
Note: Mobile internet subscribers include subscribers using dongles, USB modems, datacards and mobile phone handsets.
m=millions.
*Relates to activities in the six months to May 2012.

Introduction
Report 3—Smartphone and tablets: Take-up and use in Australia is the third in a
series of three research reports published as part of the ACMA‘s Communications
report 2011–12 series. The other research reports are:
Report 1—Online video content services in Australia: Latest developments in the
supply and use of professionally produced online video services, released on 10
October 2012
Report 2—Australia’s progress in the digital economy: Participation, trust and
confidence, released on 15 November 2012.
This suite of reports is designed to complement the ACMA Communications report
2011–12, which is produced to fulfil reporting obligations under section 105 of the
Telecommunications Act 1997. These four reports make up the Communications
report series.
The series aims to better inform ACMA stakeholders about convergence and the
digital economy, and their impact on communications and media services and
consumer behaviour. As an evidence-based regulator, the ACMA is interested in
analysing the digital economy and the role digital communications and media are
playing in its development.
This report provides an overview of the smartphone and tablet market in Australia from
two key perspectives:
the supply of these services, their delivery models and products available to
consumers in 2012
the take-up of these services in 2012, including current levels of service use, and
related drivers and barriers to take-up, including the willingness to pay for these
services.
The report draws on a range of sources, including annual reports, industry papers and
consumer research, including an ACMA-commissioned survey conducted in May
2012, to track developments in the supply and use of smartphones and tablets.
Definitions Cloud storage: Internet-based data storage capacity which can be purchased or is available free of charge; usually available on an as-needed basis and generally expandable as more storage capacity is required.
Data usage: Data usage includes all data transferred via uploads and downloads from
a smartphone or tablet. This data may be transferred through one of a number of
connections that the smartphone or tablet can utilise, including a WiFi connection or a
mobile network connection supplied by a mobile network provider such as Telstra,
Optus or Vodafone Hutchison Australian (VHA).
Mobile networks: Mobile networks are wireless networks which are used for
communications and are capable of transmitting data over significant distances. In
Australia, mobile networks are owned and operated by Telstra, Optus and VHA. Data
speeds over mobile networks can vary and may be defined as 2G, 3G or 4G.
2G: Second generation mobile network (analog being the first) and first generation
digital mobile network which allows download speeds roughly comparable with dial-
up internet access. Users outside the range of 3G and 4G networks, but still with
mobile coverage, will generally be able to transfer data at 2G speeds.
3G: Third generation mobile network which facilitates data transfer speeds faster
than speeds over a 2G network. Data transfer speed over 3G networks in good
coverage areas is roughly equivalent to speed over a fixed ADSL connection.
Network coverage varies between providers, but Telstra‘s 3G network (called Next
G) covers up to 99 per cent of the population.
4G: Fourth generation mobile network which facilitates data transfer speeds faster
than 3G and 2G networks. Data transfer speed over 4G networks in good coverage
areas is faster than speeds over a fixed ADSL connection and may be as fast as
some cable internet connections. 4G coverage in Australia is currently limited to
the CBD of major cities but it is expected providers will greatly expand coverage in
the coming years.
Mobile apps: Mobile apps (short for applications) are software-based tools which can
be downloaded and installed on a smartphone or tablet to enhance the device‘s
functionality. A piece of software that allows a user to view their banking information
on a smartphone or tablet is an example of a mobile app.
Operating system: The software that supports a computer‘s basic functions such as
scheduling tasks, executing applications, receiving input from the user and controlling
the display. In Australia, the two most common operating systems for smartphones
and tablets are:
iOS: proprietary software used by Apple devices such as the iPhone and iPad. iOS
content is limited to content directly supported by Apple.
Android: an open-source platform that is used by a variety of smartphone devices,
including some of those manufactured by HTC, Motorola and Samsung.
Other operating systems available in Australia include:
Windows, including the newly released Windows 8: Microsoft‘s latest operating
system, Windows 8, is now the primary operating system of Nokia smartphones
and Microsoft‘s Surface tablet.
Blackberry OS: operating system of the Blackberry smartphone.
Symbian: Until 2011, Symbian was the operating system of Nokia smartphones,
which have since migrated to Windows 8 as their primary operating system. It is
still used as the operating system for some older model Nokia smartphones.

Smartphone: A smartphone is a mobile phone built on a mobile operating system,
with more advanced computing capability and connectivity. In particular, smartphones
are often characterised by the ease with which they can access information online and
their ability to have their functionality expanded through custom-designed apps.
Examples of smartphones include Apple iPhones, Android phones, such as HTC
Desire and Samsung Galaxy, Windows mobile phones, such as the Nokia Lumia 800
and HTC Mozart, and Blackberries.
Tablet: A handheld, internet-enabled, wireless personal computer usually having a
touchscreen or a digital pen-enabled interface, and no hardware keyboard. Tablets
may have WiFi-only or WiFi connection plus mobile internet connectivity. Most non-
iOS tablets can also connect to the internet through a USB port.
The changing communications landscape
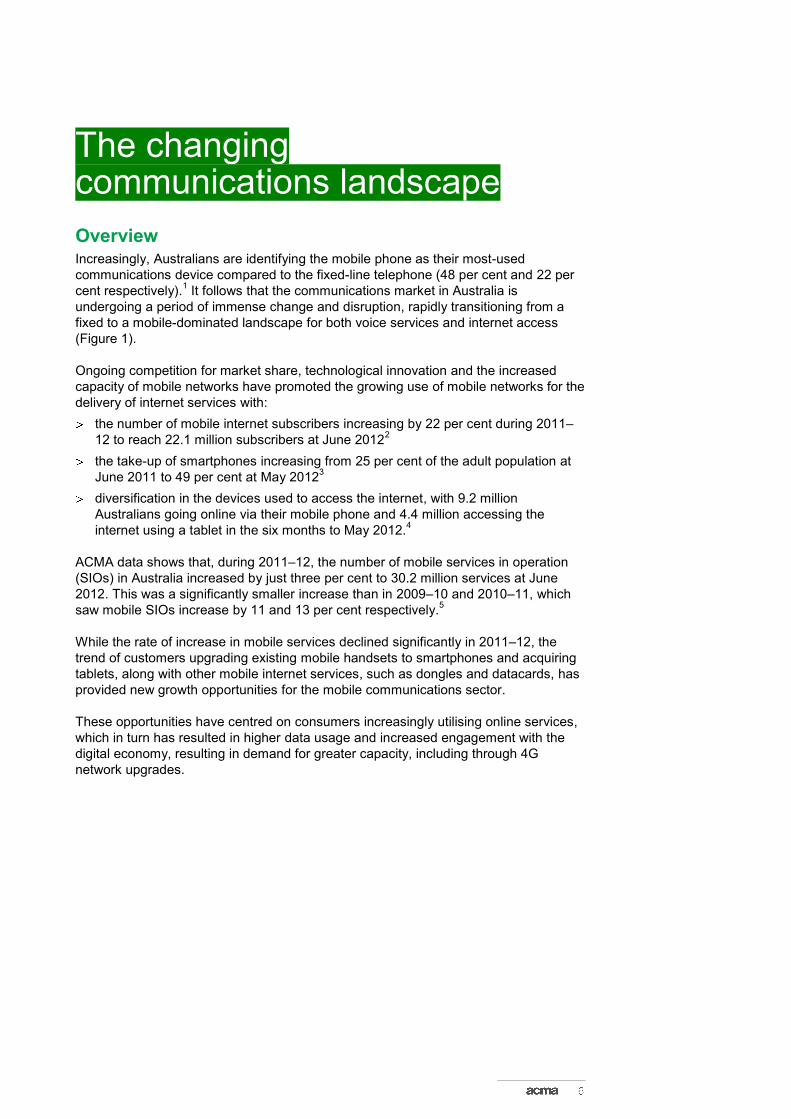
Overview Increasingly, Australians are identifying the mobile phone as their most-used
communications device compared to the fixed-line telephone (48 per cent and 22 per
cent respectively).1 It follows that the communications market in Australia is
undergoing a period of immense change and disruption, rapidly transitioning from a
fixed to a mobile-dominated landscape for both voice services and internet access
(Figure 1).
Ongoing competition for market share, technological innovation and the increased
capacity of mobile networks have promoted the growing use of mobile networks for the
delivery of internet services with:
the number of mobile internet subscribers increasing by 22 per cent during 2011–
12 to reach 22.1 million subscribers at June 20122
the take-up of smartphones increasing from 25 per cent of the adult population at
June 2011 to 49 per cent at May 20123
diversification in the devices used to access the internet, with 9.2 million
Australians going online via their mobile phone and 4.4 million accessing the
internet using a tablet in the six months to May 2012.4
ACMA data shows that, during 2011–12, the number of mobile services in operation
(SIOs) in Australia increased by just three per cent to 30.2 million services at June
2012. This was a significantly smaller increase than in 2009–10 and 2010–11, which
saw mobile SIOs increase by 11 and 13 per cent respectively.5
While the rate of increase in mobile services declined significantly in 2011–12, the
trend of customers upgrading existing mobile handsets to smartphones and acquiring
tablets, along with other mobile internet services, such as dongles and datacards, has
provided new growth opportunities for the mobile communications sector.
These opportunities have centred on consumers increasingly utilising online services,
which in turn has resulted in higher data usage and increased engagement with the
digital economy, resulting in demand for greater capacity, including through 4G
network upgrades.

Figure 1 Mobile phone/fixed-line telephone adoption, Australia, June 2007 to June 2012
Base=Total population 14 years and over.
Source: Roy Morgan Single Source.
82% 83%85%
85%87%
88%90%
89% 87%
84%
82% 80%
6% 7%9%
12%14%
16%
0%
10%
20%
30%
40%
50%
60%
70%
80%
90%
100%
Jun-07 Jun-08 Jun-09 Jun-10 Jun-11 Jun-12
Per
cent
of
tota
l popula
tion a
ged 1
4 y
ears
+ Own or use a mobile phone
Have a home fixed-line telephone
Have a mobile phone and no home fixed-line telephone
Global developments in the smartphone and tablet market
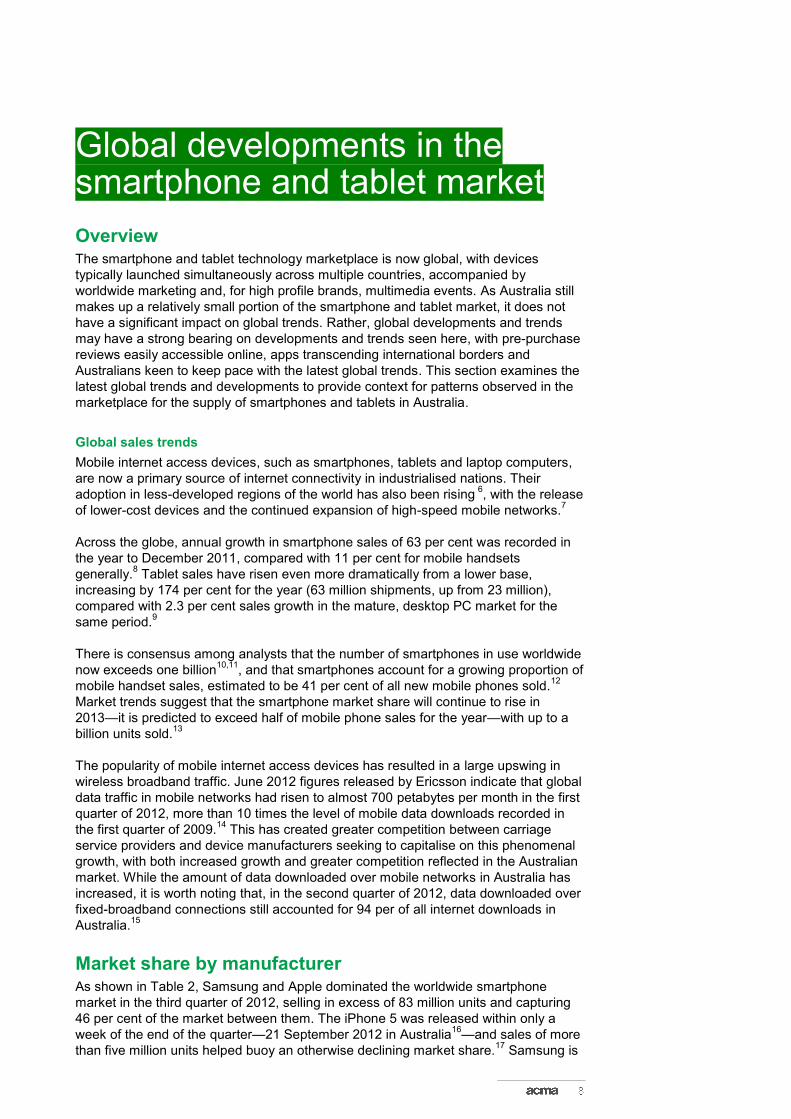
Overview The smartphone and tablet technology marketplace is now global, with devices
typically launched simultaneously across multiple countries, accompanied by
worldwide marketing and, for high profile brands, multimedia events. As Australia still
makes up a relatively small portion of the smartphone and tablet market, it does not
have a significant impact on global trends. Rather, global developments and trends
may have a strong bearing on developments and trends seen here, with pre-purchase
reviews easily accessible online, apps transcending international borders and
Australians keen to keep pace with the latest global trends. This section examines the
latest global trends and developments to provide context for patterns observed in the
marketplace for the supply of smartphones and tablets in Australia.
Global sales trends
Mobile internet access devices, such as smartphones, tablets and laptop computers,
are now a primary source of internet connectivity in industrialised nations. Their
adoption in less-developed regions of the world has also been rising 6, with the release
of lower-cost devices and the continued expansion of high-speed mobile networks.7
Across the globe, annual growth in smartphone sales of 63 per cent was recorded in
the year to December 2011, compared with 11 per cent for mobile handsets
generally.8 Tablet sales have risen even more dramatically from a lower base,
increasing by 174 per cent for the year (63 million shipments, up from 23 million),
compared with 2.3 per cent sales growth in the mature, desktop PC market for the
same period.9
There is consensus among analysts that the number of smartphones in use worldwide
now exceeds one billion10,11
, and that smartphones account for a growing proportion of
mobile handset sales, estimated to be 41 per cent of all new mobile phones sold.12
Market trends suggest that the smartphone market share will continue to rise in
2013—it is predicted to exceed half of mobile phone sales for the year—with up to a
billion units sold.13
The popularity of mobile internet access devices has resulted in a large upswing in
wireless broadband traffic. June 2012 figures released by Ericsson indicate that global
data traffic in mobile networks had risen to almost 700 petabytes per month in the first
quarter of 2012, more than 10 times the level of mobile data downloads recorded in
the first quarter of 2009.14
This has created greater competition between carriage
service providers and device manufacturers seeking to capitalise on this phenomenal
growth, with both increased growth and greater competition reflected in the Australian
market. While the amount of data downloaded over mobile networks in Australia has
increased, it is worth noting that, in the second quarter of 2012, data downloaded over
fixed-broadband connections still accounted for 94 per of all internet downloads in
Australia.15
Market share by manufacturer As shown in Table 2, Samsung and Apple dominated the worldwide smartphone
market in the third quarter of 2012, selling in excess of 83 million units and capturing
46 per cent of the market between them. The iPhone 5 was released within only a
week of the end of the quarter—21 September 2012 in Australia16
—and sales of more
than five million units helped buoy an otherwise declining market share.17
Samsung is
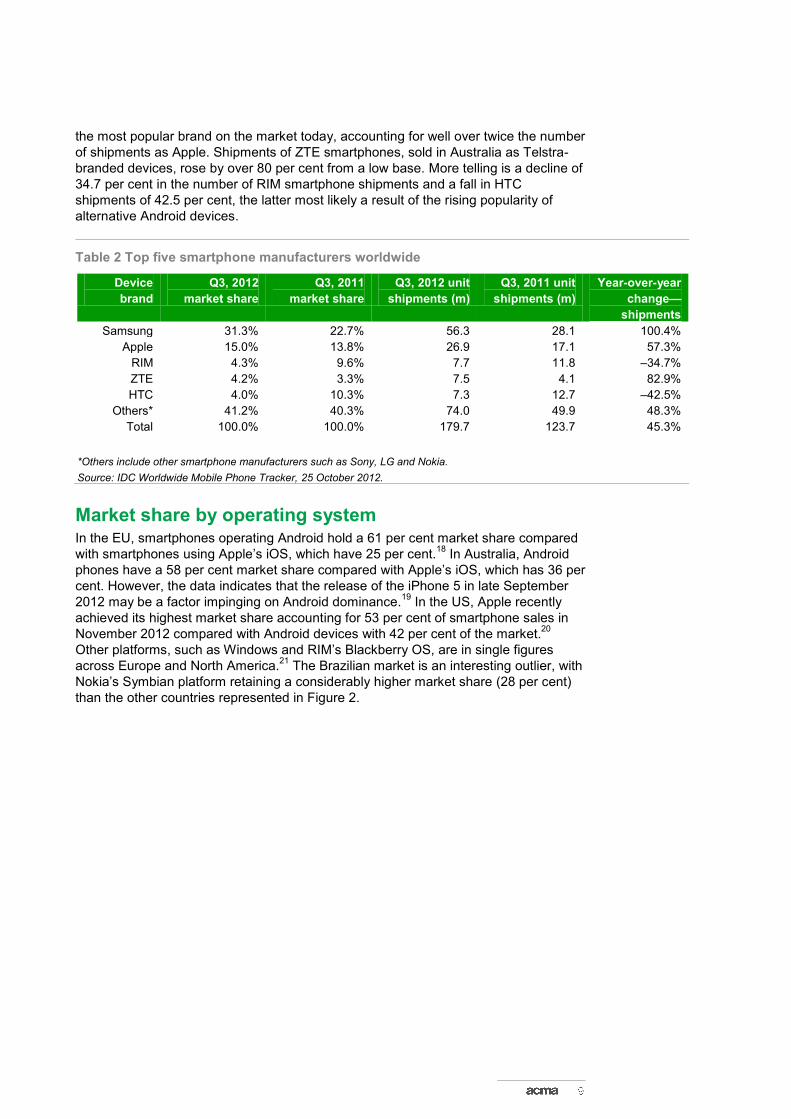
the most popular brand on the market today, accounting for well over twice the number
of shipments as Apple. Shipments of ZTE smartphones, sold in Australia as Telstra-
branded devices, rose by over 80 per cent from a low base. More telling is a decline of
34.7 per cent in the number of RIM smartphone shipments and a fall in HTC
shipments of 42.5 per cent, the latter most likely a result of the rising popularity of
alternative Android devices.
Table 2 Top five smartphone manufacturers worldwide
Device
brand
Q3, 2012
market share
Q3, 2011
market share
Q3, 2012 unit
shipments (m)
Q3, 2011 unit
shipments (m)
Year-over-year
change—
shipments
Samsung 31.3% 22.7% 56.3 28.1 100.4%
Apple 15.0% 13.8% 26.9 17.1 57.3%
RIM 4.3% 9.6% 7.7 11.8 –34.7%
ZTE 4.2% 3.3% 7.5 4.1 82.9%
HTC 4.0% 10.3% 7.3 12.7 –42.5%
Others* 41.2% 40.3% 74.0 49.9 48.3%
Total 100.0% 100.0% 179.7 123.7 45.3%
*Others include other smartphone manufacturers such as Sony, LG and Nokia.
Source: IDC Worldwide Mobile Phone Tracker, 25 October 2012.
Market share by operating system In the EU, smartphones operating Android hold a 61 per cent market share compared
with smartphones using Apple‘s iOS, which have 25 per cent.18
In Australia, Android
phones have a 58 per cent market share compared with Apple‘s iOS, which has 36 per
cent. However, the data indicates that the release of the iPhone 5 in late September
2012 may be a factor impinging on Android dominance.19
In the US, Apple recently
achieved its highest market share accounting for 53 per cent of smartphone sales in
November 2012 compared with Android devices with 42 per cent of the market.20
Other platforms, such as Windows and RIM‘s Blackberry OS, are in single figures
across Europe and North America.21
The Brazilian market is an interesting outlier, with
Nokia‘s Symbian platform retaining a considerably higher market share (28 per cent)
than the other countries represented in Figure 2.

Figure 2 Market share of smartphone platforms in selected countries and geographic areas
Note: EU includes France, Germany, Great Britain, Italy and Spain.
Source: Kantar World Panel ComTech, 25 November 2012 data.
Android’s operating system dominance
The Android operating system, developed by Google, is based on the open source Linux operating system for PCs. Because the Android operating system is available, its licensing is relatively non-restrictive and manufacturers are able to change the system to suit their device, many manufacturers have chosen to use it. Consequently, Android smartphones dominate the market. Released in October 2008, the T-Mobile G1 (manufactured by HTC) was the first Android device. However, the number of Android devices did not expand significantly until October and November 2009 when six phones were released.
22 At the same time,
Motorola released the first device with the updated Android 2.0 (Eclair) operating system, demonstrating Google‘s willingness to refine its software to improve useability.
23 Sales of Android phones released in this period were extremely strong
with over 250,000 sold in the US the first week after release.24
Since then, there has been a steady release of smartphones using various versions of the Android operating system. Figure 3 shows Android smartphones releases since 2008.
42
5861 61
53
36
25
21 04
23 4 5 40 1 3
28
1 1 24
0
10
20
30
40
50
60
70
US Australia EU Brazil
Per
cen
t
Android iOS Blackberry OS Windows Symbian Other (inc Bada)

Figure 3 Android smartphone releases (worldwide) by Android version—September 2008 to
November 2012
Note: The chart does not include all Android smartphones released during the period nor does it include tablets. Multiple device
releases in a month may be indicated by a single marker.
Sources: CNET, Wikipedia
0
20
40
60
80
100
120
140
160
180
200
Nu
mb
er o
f A
nd
roid
sm
artp
ho
nes
Android 1.0 Cupcake (1.5) Donut (1.6)
Eclair (2.0-2.1) Froyo (2.2) Gingerbread (2.3)
Ice Cream Sandwich (4.0) Jelly Bean (4.1-4.2)

Tablet market share
The tablet market is also dominated by Android and iOS devices but, unlike for
smartphones, Apple devices maintain a market share advantage over Android
devices. As shown in Figure 4, Apple iOS devices accounted for approximately 57 per
cent of the 24.7 million tablets sold worldwide in the third quarter of 2012. However,
this figure has dropped from 65 per cent in the third quarter of 2011. Android tablets
make up 41 per cent of the market, having risen from 29 per cent 12 months earlier.25
Figure 4 Number of shipments and percentage share of total shipments for major tablet
manufacturers Q3 2011 and 2012
Source: Strategy analytics.
11
5
<1 1
14
10
<1 <1
65%
29%
2% 4%
57%
41%
2% 0%0%
10%
20%
30%
40%
50%
60%
70%
80%
90%
100%
0
2
4
6
8
10
12
14
16
Apple iOS Android Microsoft Others
Ship
men
ts (
mill
ion
s o
f u
nit
s)
Global tablet shipments Q3 2011 Global tablet shipments Q3 2012
Global tablet market share % Q3 2011 Global tablet market share % Q3 2012

Provision of smartphone and tablet devices and services in Australia
Mobile telephony has long been part of the Australian communications environment.
However, it was the introduction of the smartphone, particularly Apple‘s iPhone in
2007, which revolutionised mobile phone design and catalysed industry growth and
development.26
This disruptive change was mirrored with the introduction of the iPad in
2010. In Australia, competitive plans, and the expansion of the smartphone and tablet
market, have further encouraged consumer take-up and use of smartphone devices. In
June 2012, the market was estimated to be worth over $15 billion per annum.27
Australia‘s smartphone and tablet market is reflective of trends in other developed
countries and is currently dominated by Apple and Android devices. Sales typically
surge following the release of new device models and the surrounding publicity
accompanying their launch.
Smartphone and tablet supply chains in Australia The supply chain model of smartphones and tablets is not dissimilar to that used historically in the supply of mobile phones.
Manufacturing smartphones and tablets
Device manufacturers such as Samsung, Apple and Nokia manufacture smartphones
and tablets to supply to retailers for subsequent sale to consumers. As discussed
previously, device manufacturers must utilise an operating system for their
smartphone. Device manufacturers may either use their own designed and tested
operating systems (for example, Apple uses its iOS operating system for its devices)
or the manufacturer may use a third-party operating system for its devices, such as
Google‘s Android.
Smartphone and tablet retailers
In Australia, consumers may purchase smartphones and tablets either:
outright through an online or physical retail outlet
as a bundled package with a network access plan.
Consumers who choose to purchase a smartphone or tablet outright will generally pay significantly more upfront than if they buy the device as part of a network access plan. The cost of purchasing a smartphone or tablet outright will generally depend on the features of the device, with newer devices incorporating more advanced features and usually costing more. Consumers who buy devices bundled with a network access plan typically subscribe to a communications service for a fixed-term, usually 12 or 24 months, with minimum network access charges and, for some devices, payments are made by instalments. These plans commonly include a voice and/or data allowance which, if exceeded, can attract additional charges. This model seeks to guarantee recovery of the cost of the device and enables additional revenue via network usage charges for the term of the contract. By enabling the consumer to pay for a device in smaller instalments, post-paid plans are regarded as having been instrumental in the development of mobile devices as affordable and functional communications technology. However, by locking consumers

into fixed-term contracts, post-paid plans may elongate the replacement purchase cycle, delaying device upgrades and potentially reducing revenue from consumers who are eager to enjoy the latest innovations.
28
If consumers buy their smartphone or tablet outright, they must connect to a communications service separately in order to use the device to access the internet. Generally, consumers may connect to the internet via:
a private internet service or a public hotspot (WiFi)
a post-paid subscription to a communications service through a service provider
a prepaid service supplied by a service provider.
Smartphone availability from major service providers in Australia
Smartphones are rapidly becoming the most commonly owned consumer electronic
device in Australia. They are offered at a range of prices and functionality levels (see
Table 3). Premium smartphones, such as the 4G compatible iPhone 5 and the
Samsung Galaxy SIII, can be bought outright from $788 and $688 respectively.29
They
are available from the major service providers as part of a post-paid plan from
approximately $50 per month, which typically includes a voice, SMS and data service.
The handsets usually come with the latest software and technological innovations, and
are accompanied by multimedia marketing campaigns to ensure that they remain
competitive among other similarly priced phones. Apple has been particularly
aggressive in this area.
The battle for market share between Apple and Android smartphones and tablets is
one that is being played out in industrialised countries across the globe. In Australia,
sales of Android devices first exceeded those of the iPhone in December 2011.30
In
November 2012 they stood at 58 per cent to the iPhone‘s 36 per cent (see Figure 2).
The impact of the much-anticipated arrival of the Windows 8 phones is yet to be felt,
with Telstra releasing the Windows 8 Nokia Lumia 920 smartphone in late November
2012.31
At the lower end of the smartphone market, a number of manufacturers now offer
budget versions of touchscreen devices, usually with reduced functionality or smaller
screen size. For example, at the time of writing, HTC, Samsung and Nokia all offered
Android smartphones for less than a quarter of the price of their top model. These
have much of the functionality of more expensive devices, but a smaller internal
memory and more basic operating system.
As shown in Table 3, the smartphone market has been the subject of key business
partnerships that have encouraged network service providers to support specific
manufacturers. Optus maintains a close relationship with Samsung, launching its 4G
network and promoting Samsung‘s Galaxy SIII 4G model in a joint event in September
2012.32
Telstra has formed numerous business partnerships with device
manufacturers, among them HTC and Nokia. The distribution rights to the Nokia
Lumia, for example, have been subject to an exclusivity contract, with Telstra winning
the sole sales rights for the flagship 4G model, the Lumia 920.33
Telstra was also able
to sell the Lumia 920 several weeks before the release of the Lumia 820, a
smartphone with 4G capability, but with less functionality, sold by Optus and VHA.

Table 3 Selected smartphones available from major mobile network operators available to Australian consumers at January 2013
Network provider
Prepaid access Post-paid BYOD* plan
Apple iPhone 5
Operating system –
iOS
Device only – from
$788
Network – 4G
Samsung Galaxy
SIII
Operating system –
Android
Device only – from
$688
Network – 4G
Blackberry Bold
Touch 9900
Operating system –
Blackberry OS 7
Device only – from
$499
Network – 3G
HTC One XL, SV, X
Operating system –
Android
Device only – from
$469 (X), $479 (SV),
$489 (XL)
Network – 4G
Nokia Lumia 820,
920
Operating system –
Windows 8
Device only – from
$575 (820), $696 (920)
Network: 4G
Telstra Starter SIM card $2 Recharge $30–$100 Data inclusion per recharge 400MB to 3GB Recharge expires in 30 days
12 or 24-month plan $50–$100 minimum per month Data inclusion 1GB to 3GB Access to best available network for handset (4G or 3G) Excess data charged at 10c/MB
$67–$130 minimum per month 24-month plan Data inclusion 1GB to 3GB Excess data charged 10c/MB
$66–$130 minimum per month 24-month plan Data inclusion 1GB to 3GB Excess data charged 10c/MB
Not currently directly available through Telstra website. Available through Telstra Shop.
HTC One XL (Telstra only) $60–$130 minimum per month 24-month plan Data inclusion 1GB to 3GB Excess data charged 10c/MB
Nokia 920 $65–$130 minimum per month 24-month plan Data inclusion 1GB to 3GB Excess data charged 10c/MB
Optus Prepaid Starter Pack $29.95 Recharge $30–$100 Data inclusion per recharge 500MB–5GB Recharge expires in 28 days
12-month plan $20–$70 minimum per month Data inclusion 200MB to 3GB Access to best available network for handset (4G or 3G) Excess data charged at 10c/MB–25c/MB
$53–$130 minimum per month 24-month plan Data inclusion 200MB to 4GB Excess data charged at 10c/MB–25c/MB
$51–$130 minimum per month 24-month plan Data inclusion 200MB to 4GB Excess data charged at 10c/MB–25c/MB
$47–$130 minimum per month 24-month plan Data inclusion 200MB to 4GB Excess data charged at 10c/MB–25c/MB
HTC One SV $41–$130 minimum per month 24-month plan Data inclusion 200MB to 4GB Excess data charged at 10c/MB–25c/MB
Nokia 820 $37–$130 minimum per month 24-month plan Data inclusion 200MB to 4GB Excess data charged at 10c/MB–25c/MB
VHA Starter SIM card $1 ($31 with $30 credit) Recharges $10–$70 Data inclusion 0MB to 2GB Recharge expires in 28 days
One-month plan $20–$85 minimum per month Data inclusion 200MB to 3GB 3G access only Excess data charged 25c/MB
$48–$100 minimum per month 24-month plan Data inclusion 200MB to 3GB (some plans include additional data for first 12 months) Excess data charged 25c/MB
$56–$100 minimum per month 24-month plan Data inclusion 200MB to 3GB (some plans include additional data for first 12 months) Excess data charged 25c/MB
Not available directly through VHA website.
HTC One x $38–$100 minimum per month 24-month plan Data inclusion 200MB to 3GB (some plans include additional data for first 12 months) Excess data charged 25c/MB
Nokia 820 $37–$100 minimum per month 24-month plan Data inclusion 200MB to 3GB (some plans include additional data for first 12 months) Excess data charged 25c/MB
*Bring your own device.
Note: Prices are subject to regular change and may not be correct at the time of viewing.
Source: Company websites.

Tablets in Australia While versions of tablet-style computers with touchscreen hardware have been
available for over ten years, it was the 2010 launch of the iPad that saw the tablet
become a mass-market device in Australia and across the globe. Not surprisingly, the
world‘s other electronics manufacturers have sought to replicate the iPad‘s success
with their own tablets, with the result that the number of tablet devices has proliferated.
According to a study by Boston Consulting, more than 100 tablets have been
introduced to the market since the iPad was launched, with expected sales of 370
million units by 2015.34
In Australia, Telsyte forecast that 2.37 million tablets will have
been sold by the end of 2012 and, by 2016, the penetration of tablets will be
comparable to current adoption levels for smartphones.35
As shown in Table 4, Australian consumers have access to a range of both budget
and premium tablet devices, available in screen sizes from 17.8 to 26.9 centimetres.36
Connectivity
Almost all tablet models are offered with WiFi connectivity, that is, the device connects to the internet via a personal or public hotspot, or via an external modem. For an extra cost, tablets can be equipped with an internal 3G or 4G-enabled modem, providing the user with mobile network access. In July 2012, 50 per cent of tablet owners used a WiFi-only device, 47 per cent used a device with WiFi and mobile network access and the remainder had mobile-network-only devices.
37
With the cost of mobile data significantly higher than that for fixed data services, the way in which users choose to connect to the internet may have implications for network service provider revenues. Providers have encouraged consumers to adopt tablets with monthly data access plans. However, the proliferation of free WiFi hotspots in cafes, libraries and shopping centres across Australia, and the high use of private WiFi in homes, enables consumers, at times, to avoid using the mobile network for internet access, diminishing the network service provider–consumer relationship. Research in the United States indicates that, even with a WiFi connection and mobile network access on a single device, most consumers (90 per cent) are opting to use the device only on WiFi.
38 However, growing 4G network coverage, and the launch of
4G-compatible tablets in late 2012, may have a positive impact on the propensity of consumers to use mobile networks with their faster traffic speeds. At this stage, the fixed-line networks are still used for the overwhelming percentage of data downloads.
Growth in use of WiFi hotspots
While home and work sites continue to account for the majority of internet users in Australia—15.4 million and 7.5 million respectively during the second quarter of 2012—internet use through WiFi hotspots has seen the highest proportional increases in Australia.
39 During the second quarter of 2012, an estimated 2.06 million Australians
used WiFi internet hotspots, a 32 per cent increase in activity compared to the second quarter of 2011.
40 People aged 18–34 accounted for 45 per cent of users of WiFi
hotspots, followed by those aged 35–44 at 18 per cent (Figure 5).
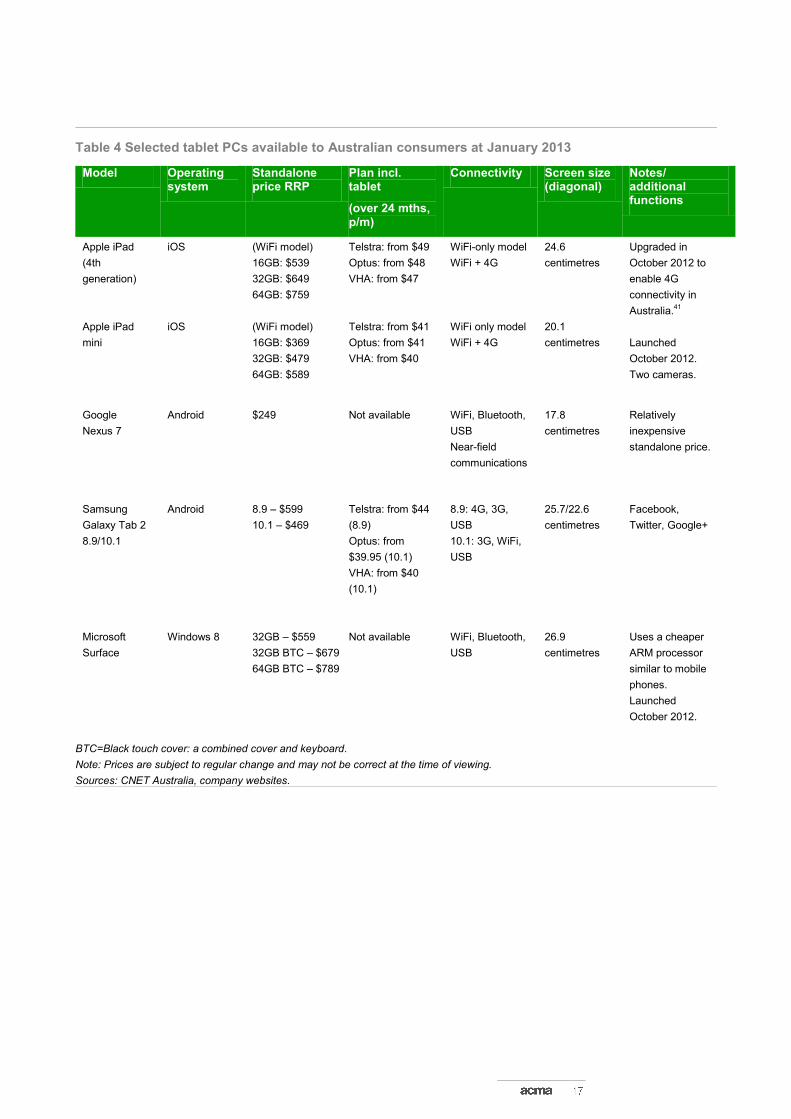
Table 4 Selected tablet PCs available to Australian consumers at January 2013
Model Operating system
Standalone price RRP
Plan incl. tablet
(over 24 mths, p/m)
Connectivity Screen size (diagonal)
Notes/ additional functions
Apple iPad
(4th
generation)
iOS (WiFi model)
16GB: $539
32GB: $649
64GB: $759
Telstra: from $49
Optus: from $48
VHA: from $47
WiFi-only model
WiFi + 4G
24.6
centimetres
Upgraded in
October 2012 to
enable 4G
connectivity in
Australia.41
Apple iPad
mini
iOS (WiFi model)
16GB: $369
32GB: $479
64GB: $589
Telstra: from $41
Optus: from $41
VHA: from $40
WiFi only model
WiFi + 4G
20.1
centimetres
Launched
October 2012.
Two cameras.
Nexus 7
Android $249 Not available WiFi, Bluetooth,
USB
Near-field
communications
17.8
centimetres
Relatively
inexpensive
standalone price.
Samsung
Galaxy Tab 2
8.9/10.1
Android 8.9 – $599
10.1 – $469
Telstra: from $44
(8.9)
Optus: from
$39.95 (10.1)
VHA: from $40
(10.1)
8.9: 4G, 3G,
USB
10.1: 3G, WiFi,
USB
25.7/22.6
centimetres
Facebook,
Twitter, Google+
Microsoft
Surface
Windows 8 32GB – $559
32GB BTC – $679
64GB BTC – $789
Not available WiFi, Bluetooth,
USB
26.9
centimetres
Uses a cheaper
ARM processor
similar to mobile
phones.
Launched
October 2012.
BTC=Black touch cover: a combined cover and keyboard.
Note: Prices are subject to regular change and may not be correct at the time of viewing.
Sources: CNET Australia, company websites.

Figure 5 Profile of users of WiFi hotspots in Australia
Note: Relates to smartphone users aged 14 years and over.
Source: Roy Morgan Single Source.
Device brand share and prices
Apple continues to dominate tablet ownership in Australia, with a July 2012 survey finding that over three quarters (77 per cent) of consumers who use a tablet own an iPad (Figure 6).
42 This is a 10 percentage point increase over the year before. Other
brands used by Australian consumers in July 2012 included Samsung (seven per cent), Acer (three per cent), Motorola (two per cent) and Toshiba (one per cent).
14–17 years13%
18–24 years21%
25–34 years24%
35–44 years18%
45–54 years15%
55–64 years7%
65+3%

Figure 6 Brand share of existing tablets owned by Australian consumers
Source: Mackay, M., Australian Mobile Phone Lifestyle Index, 8
th Edition, September 2012.
As consumer demand for tablets has risen, prices at the lower end of the market have become increasingly competitive, with low-end devices flooding the market. Product offerings include entry level tablets priced from $79, though with reduced functionality, shorter battery life and a less responsive, resistive screen.
43
At the higher end of the tablet market, several manufacturers have released a range of tablets that are both smaller and cheaper than their full-sized models.
Miniaturisation
The recent releases of smaller screen tablets by major manufacturers indicate a shift in demand toward lighter and more portable devices, though often at the expense of processing power or pixel density. At $170 cheaper than the equivalent capacity full-sized iPad, the iPad Mini, released in October 2012, has proven popular with consumers, with the initial stock selling out in its first weekend.
44 Other smaller tablet
devices have been in high demand, including the Google Nexus. While a comparison between the take-up and use of tablets by size is yet to be completed, some analysts have suggested that the smaller tablets may ‗cannibalise‘ sales from the full size devices, potentially reducing revenues for those who sell the larger devices.
45 Others
have indicated that the smaller devices will likely occupy a different market niche, their light weight making them more suitable for use while outside the home, such as in restaurants, at the beach and other locations where a larger screen is more cumbersome.
46 This, in turn, may heighten the potential for mobile network use among
tablet users.
Smartphone and tablet apps This rise in mobile internet connectivity has led to a parallel boom in innovation and
sales of software apps created specifically for smartphones and tablets. Apps enhance
the operation of a smartphone or tablet by increasing its functionality and may be free
or purchased. Free apps will generally include some form of advertising which
provides the app developer with revenue. Purchased apps will generally be free of
advertising as the app developer earns revenue through its sale.
In Australia, increasing numbers of smartphone users are downloading mobile apps, a reflection of the critical role apps are playing in making it easier for consumers to
Apple iPad, 77%
Samsung, 7%
Acer, 3%
Motorola, 2%
Toshiba, 1% Sony, 1%
Other, 9.50%

access services online via mobiles and facilitating the growth of the online economy. During June 2012, 4.45 million smartphone users aged 18 years and over downloaded a mobile app, compared with 2.41 million during June 2011—an 85 per cent increase (see Figure 7).
47
Globally, Apple reported that downloads from its App Store passed 25 billion in March
2012, while the number of Android apps downloaded reached ten billion in December
2011. One billion downloads are added to that figure each month.48
Until recently, the number of Apple iOS apps available for download exceeded those
for other platforms. However, in October 2012, the number of unique Android apps
passed Apple when the number available for download from Google Play, Google‘s
official app store for Android devices, passed 700,000.49
Taking into account apps
available for Android and third-party app stores, it is likely there are now significantly
more apps available for Android than Apple‘s iOS.50
This may be the result of
increased popularity of devices running on the Android platform. It could also partly
reflect software limitations for Apple device users who are not able to access apps
from a third-party app stores unless they manually remove limitations included with
Apple‘s iOS using a process known as ‗jailbreaking‘.51
This ability to access apps from a variety of sources outside the official app store may
be one factor that improves the attractiveness of Android devices to potential users.
However, it also increases the risk that Android devices will be exploited through
malicious software and apps. In September 2012, it was reported that there may be up
to 175,000 dangerous and high-risk Android apps available for download through
Google Play and third-party app stores.52

Figure 7 Number of smartphone users downloading mobile apps, Australia
Source: Roy Morgan Single Source.
2,408
2,810
3,087
2,712
3,1993,195
3,7993,731
3,6063,510
3,977
4,099
4,454
0
500
1,000
1,500
2,000
2,500
3,000
3,500
4,000
4,500
5,000
Num
ber
of
pers
ons a
ged 1
4 y
ears
and o
ver
('000s)

Take-up and use of smartphones and tablets
Smartphone and tablet take-up Take-up of mobile phones in Australia appears to be reaching near saturation levels
for most age groups. ACMA research shows that an estimated 92 per cent of the adult
population (those aged 18 years and over) used a mobile phone at May 2012. Mobile
phone usage ranged from a comparative low of 77 per cent for people aged 65 years
and over to a high of 99 per cent for those aged 18–24 years.
Figure 8 Mobile phone, smartphone and tablet usage
Note: Mobile phone and tablet internet use relates to use in the six months to May 2012.
Base: Persons with a fixed-line telephone and/or a mobile telephone.
Source: ACMA-commissioned research, May 2012.
Smartphones and tablets not substituting other devices to access the internet
While consumers have been eager to take up smartphones and tablets, these devices
are being used as an additional device to access the internet rather than as a
substitute for other devices already used to access the internet. ACMA commissioned
research (see Figure 9) found that, in the six months to May 2012, 90 per cent of tablet
users surveyed also accessed the internet using a laptop computer. More than 80 per
cent also accessed the internet using a desktop computer or smartphone.
Forty-nine per cent of the adult population (8.67 million people) were estimated to be
using a smartphone at May 2012 compared with 25 per cent (4.25 million people) at
June 2011—a 104 per cent increase. At May 2012, smartphone usage ranged from a
49
74 74
57
48
33
15
51
76 78
63
50
30
17
92
99 98 9794
88
77
25
3330
3330
18
8
ALL 18–24 25–34 35–44 45–54 55–64 65+
% o
f p
erso
ns
aged
18
yea
rs a
nd
ove
r
Age range
Have a smartphone Use the internet via their mobile
Use a mobile phone Access the internet via a tablet computer (e.g. iPad)

low of 15 per cent for people aged 65 years and over to a high of 74 per cent for those
aged 18–34 years
Figure 9 Percentage of tablet users who used another device to access the internet
Note: Relates to tablet users aged 18 years and over.
Source: ACMA-commissioned research, May 2012.
Approximately 25 per cent of the adult population (4.37 million people) used a tablet
such as an iPad to access the internet in the six months to May 2012. Tablet usage
was highest among those aged 18–54, with usage varying between 30 and 33 per
cent (see Figure 9). Time series data for tablet usage is not available.
Smartphone and tablet users are more likely to be higher income earners, reside in
households with a partner and children or shared households, and live in metropolitan
areas of Australia (see Table 5).
In May 2012, 3.65 million people (approximately 20 per cent of adults) used both a
smartphone and a tablet.53
0%
18%
26%
27%
30%
81%
84%
90%
Other
Portable games console (e.g. PSP, Nintendo DS)
Mp3 player (e.g. iPod touch)
Other games console (e.g. Xbox, Playstation, Wii)
Television
Desktop computer
Mobile phone
Laptop computer

Table 5 Demographic profile of smartphone and tablet users in Australia
% using smartphones % using a tablet
Income per annum
<$50,000 44 19
$50,000 to less than $100,000 62 29
$100,000 or more 77 45
Living arrangements
Live alone 34 10
Partner no children 47 21
Single parent 48 22
Partner and children 62 34
Shared household 69 28
Gender
Male 54 27
Female 51 23
Location
Metropolitan areas (capital cities) 54 28
Non-metropolitan areas 39 17
Note: Smartphone figures represents proportion of total mobile phone users whose handset is a smartphone. Tablet figures relate to
the proportion of the Australian population who used a tablet to access the internet in the six months to May 2012.
Base: Australians aged 18 years and over.
Source: ACMA-commissioned survey, May 2012
Smartphone service arrangements Smartphone users are more likely to provide higher returns for communication services providers, than other mobile phone users. Smartphones are often only available for a substantial upfront cost or through higher cost post-paid plans (see Table 3). Additionally, smartphones generally encourage users to access the internet more often and significantly increase their data usage. In turn, this prompts users to select plans with higher data allowances, which also usually have a higher cost. As can be seen from Figure 10, the majority of smartphone users are on post-paid plans (85 per cent) compared with other mobile phone users.

Figure 10 Consumer payment type by mobile handset device
Source: ACMA-commissioned consumer survey, May 2012.
The rapid take-up of smartphones in Australia has also been reflected in significant
increases in the demand for higher mobile phone data allowances, with many
smartphone consumers shifting to higher data allowances in the 12 months to June
2012. At June 2012, 54 per cent of smartphone users were on mobile phone plans
with data allowances of one gigabyte or more, compared with 42 per cent at June
2011 (see Figure 11).
Figure 11 Amount of data allowance on smartphone
Note: Relates to smartphone users aged 14 years and over. Percentages may not add to 100 per cent due to rounding.
Source: Roy Morgan Single Source
14
4145
85
5853
Smartphone Non-smartphone 3G 2G handset
% o
f m
ob
ile p
ho
ne
use
rs a
ged
18
yea
rs a
nd
o
ver
Prepaid Post-paid
13%
2%
1%
8%
12%
31%
10%
22%
13%
2%
1%
6%
9%
24%
13%
32%
Don't know
Unlimited – any content
Unlimited – provider's content
3GB or more but not unlimited
2GB to less than 3GB
1GB to less than 2GB
500MB to 999MB
Less than 500MB
Per cent of smartphone users aged 14 years and over
Jun-11
Jun-12

The dramatic growth in smartphone take-up and increases in data download over mobile networks has also highlighted the potential for increased incidences of bill shock—a term used to describe unexpectedly high bills. Research undertaken by Macquarie University indicates that about 40 per cent of mobile phone users in Australia experienced bill shock, with excess data usage the most frequently cited reason.
54
The issue of bill shock was also of critical concern to the ACMA‘s Reconnecting the Customer public inquiry into the customer service and complaints-handling practices of
Australian telecommunications providers. The inquiry found that:
Customers frequently experience ‗bill shock‘, which occurs when a consumer receives a higher than expected bill or sees their prepaid credit run down faster than expected. This appears to be commonly caused by either the consumer having a poor understanding of the charging arrangements for their service at the time they purchased it or because they are
unable to track how charges are accumulating under a plan.55
On 1 September 2012, the ACMA registered the new Telecommunications Consumer Protections (TCP) Code. The TCP Code, developed by the Communications Alliance, provides improved protection for telecommunications consumers in complaints-handling, advertising, billing and financial hardship. The code applies to all carriage service providers in Australia.
Activities undertaken via mobile phones The growth in smartphone data allowances is further reflected in the type and scope of
activities performed both online and offline via these devices in Australia. Smartphone
users are more likely than non-smartphone mobile users to engage in voice and data
activities using their mobiles (Figure 12). This is particularly the case for online
activities, with smartphone users nine times more likely to have gone online through
their mobile phone handsets during June 2012, than non-smartphone mobile phone
users.

Figure 12 Activities undertaken via mobile phones during June 2012 by handset type
Note: Relates to consumers in households with a fixed-line telephone service.
Source: Roy Morgan Single Source.
5%
6%
8%
13%
16%
16%
31%
32%
35%
36%
36%
48%
50%
54%
59%
66%
83%
89%
96%
96%
98%
1%
1%
1%
7%
6%
4%
3%
6%
1%
18%
11%
7%
12%
9%
30%
7%
33%
72%
75%
78%
85%
Video messaging
Global roaming
Made video calls
Entered a competition or voted using SMS
Made overseas calls
Listening to the radio
Using as a personal organiser or PDA
Taking videos
GPS (Global Positional System) functions
Made interstate calls
Bluetooth functions
Playing music/MP3s
Picture messaging/MMS
Playing games
Received voice mail
Undertook activities online
Taking photos
Made local calls
Sent SMS
Received SMS
Made calls to mobiles
% of mobile phone users aged 18 years and over
Non-smartphone users
Smartphone users

The divergence between smartphone and non-smartphone users is further
demonstrated in the nature and scope of activities performed online, with smartphone
users more likely than other mobile phone internet users to undertake multiple
activities online (Figure 13). For example, in the six months to May 2012, smartphone
internet users were:
four times more likely to purchase goods online than other mobile internet users
three times more likely to stream or download audio or video content
three times more likely to pay bills online
twice as likely to access social networking sites.
Much of this increase can be attributed to the rapid growth in smartphone adoption,
with smartphone users accounting for 46 per cent of mobile phone users at June
2012, up from 28 per cent at June 2011.56
This increase in adoption, and the higher
level of activities undertaken online by smartphone users compared to non-
smartphone users, may be further attributed to tech-savvy users moving to
smartphones because these devices provide better access to online services. In turn,
smartphones themselves are attracting new users due to their increased functionality
and ease of use.
While mobile phone handset internet use has seen dramatic growth in Australia, the
volume of data downloaded via mobile phone handsets accounted for less than two
per cent of total data downloads in Australia in the three months to June 2012.57
This
may reflect the fact that, while the number of persons with a smartphone has
increased significantly over recent years, nearly 57 per cent of smartphone users also
have a fixed-line broadband service at home, which they are likely to use to access
high-bandwidth services.58
Figure 13 Activities undertaken online via mobile phones by handset type
Note: Relates to consumers in households with a fixed-line telephone service. Relates to online activities
undertaken in the six months to May 2012.
Source: ACMA-commissioned consumer survey, May 2012.
8%
10%
11%
19%
31%
32%
31%
40%
46%
33%
33%
38%
55%
71%
76%
81%
84%
90%
Purchased goods or services
Downloaded audio or video content
Paid bills
Streamed audio or video content
Used a social networking site
Get directions, recommendations, or other information related to your present location
Sent or received email
Accessed news, sport and weather updates
Browsing websites or search for information
% of persons 18 years and over using the internet via their mobile phone handset
Smartphone usersOther mobile phone users

Reasons for not using mobile handsets for internet access Significant numbers of Australians have not used the internet using their mobiles and
are unlikely to do so in the short term, despite the growing focus on the development
of internet services targeting mobile phone users.
ACMA research (Figure 14) shows that consumers most frequently identified factors
associated with need, useability and cost as reasons for not using the internet through
their mobile phones.
Reasons for not using a mobile phone to access the internet were generally consistent
across all age groups, although a higher proportion of persons aged 55 years and over
also said that they did not know how to access the internet from their mobile phone.
These factors were dominant regardless of handset type. Of Australians not using the
internet via their mobile phones:
41 per cent of smartphone users reported no need to use the internet using their
mobile, compared to 61 per for other mobile phone users
29 per cent of smartphone users reported that it was easier to use the internet
through a computer than a mobile phone, compared to 37 per cent for other mobile
phone users.

Figure 14 Reasons for not using internet via mobile phone
Note: Between two and seven per cent of non-mobile-phone internet users reported their phone was not internet enabled. Multiple responses allowed. *It is too hard to navigate around internet using buttons on a mobile phone. Source: ACMA-commissioned consumer survey, May 2012.
47%
36%
47%
50%
56%
25%
31%
33%
29%
27%
16%
16%
11%
11%
6%
15%
21%
19%
21%
18%
14%
18%
21%
23%
17%
13%
13%
9%
7%
6%
12%
11%
12%
10%
5%
12%
15%
15%
14%
10%
11%
14%
16%
19%
13%
7%
11%
17%
16%
28%
18–24
25–34
35–44
45–54
55 years+
% of persons not using the internet via their mobile phone in the six months to May 2012
Age
ran
ge
I don't know how
Screen too small
Too hard to navigate*
Internet speed is too slow
Poor mobile coverage
It's too expensive
Not included in my plan
No time
Computer is easier to use
No need

The future of handheld smart devices in Australia
New smart devices The release of the iPhone 5 showed that the launch of new smart devices can
stimulate the take-up of handheld communications devices. Manufacturers are
consistently looking to gain a competitive edge by increasing the functionality and
capability of their device. For example, both Samsung and Apple are predicted to
release new versions of their current flagship smartphones in 2013, with Samsung
developing its Galaxy S4 and Apple rumoured to be developing the iPhone 5S. Both
phones are expected to include powerful upgrades to current models to create
consumer interest and generate strong sales.59
Some features that are forecast to be
included in new high-end smartphones include larger 12.7 centimetre screens and
screens with improved resolution.60
Other manufacturers have also announced new devices scheduled for release in early
2013. These include:
RIM‘s (creator of Blackberry) Blackberry 10 smartphone which will include software
changes to improve useability. Some versions of the device will include a full touch
screen similar to other popular smartphones.61
Microsoft‘s Surface tablet with Windows 8 Pro.62
In addition, Microsoft will continue
seeking greater market share for its smartphone operating system through its
agreement with smartphone manufacturer Nokia.
Emerging services In addition to continued innovation in smartphone and tablet functionality and
useability, there have been parallel developments relating to the services accessible
through these devices. Some key developments are explored in this section of the
report.
Mobile payments and mobile wallets
A variety of factors are driving the push to mobile payments. Banks and credit card
companies are in favour of the additional security features embedded in new payment
technologies, while retailers and consumers are attracted by the fact that goods and
services can be paid for quickly, securely and easily.
The digital wallet has emerged as an increasingly popular method for consumers to
pay for goods and services. The wallet may contain a consumer‘s bank and credit card
details, as well as other important information, such as a driver‘s licence and Medicare
or health insurance details.
An account with an organisation such as PayPal is an example of a digital wallet.
Consumers who have accounts with PayPal provide banking and credit card details to
the organisation.63
They are then able to use the account to pay for goods and
services, primarily purchased over the internet. PayPal pays the merchant and debits
funds from the consumer‘s preferred account. This process eliminates the need for the
consumer to provide banking details directly to the merchant. PayPal is also beginning
to be used for non-internet transactions. For example, a Sydney taxi-booking service
app allows customers to pay fares using a smartphone. PayPal reported that it had
three million active accounts in Australia in 2010)64
and expects to make mobile
payments worth over $10 billion this year.65

Google and Apple have also introduced new products aimed at further expanding the
use of digital wallets by consumers. Apple launched its new Passbook feature with the
recent release of iOS 6 and Google has released Google Wallet. Apple‘s Passbook is
an app-style service that is primarily designed to facilitate ease of access to tickets
and vouchers on a consumer‘s iPhone. For example, if a consumer buys an airline
ticket with a partner airline that utilises Passbook, the ticket will appear in Passbook on
the consumer‘s iPhone. When boarding the flight, the consumer then only needs to
scan the flight boarding pass that is stored on the phone.66
Recently, Apple and
Qantas jointly announced that iPhone users are now able to use Passbook for
boarding Qantas domestic flights.67
The Passbook service can also be used for
‗customer loyalty‘, such a coffee store offerings. It is also envisaged that consumers
will be able to purchase music through Passbook, with charges made to their iTunes
Store account. At present, the service can also be used to make purchases from Apple
retail outlets.68
The Google Wallet service is currently only available in the US for use with a small
number of near-field, communication-enabled smartphones.69
Google Wallet can be
used to store a user‘s bank account and credit card details securely and remotely. The
service allows users to pay for goods and services using their Android device (with
near-field communication capability) by tapping the device on a point-of-sale terminal
to complete a transaction.70
This service, in its current format, is limited to devices that
are capable of near-field communications. However, Google has indicated that it will
shortly be introducing the ‗Google Wallet Card‘ which will allow users with Android
phones, that are not enabled for near-field communications, to use the Google Wallet
service for purchases.71
Mobile computing and the cloud
Mobile cloud services are online data-storing services accessible from a smartphone
where most of the data (including user files) is stored remotely and subsequently
accessible on demand via the internet. The advantage of cloud services are that they
do not require users to utilise storage space on their device and that content stored in
the cloud can then be accessed from a number of devices, such as the user‘s PC,
tablet and smartphone. The provision of cloud services is also attractive to service
providers because it provides an opportunity to develop an additional revenue stream.
In the six months to May 2012, 71 per cent of the adult population in Australia used a
cloud service.72
Table 6 shows the percentage of cloud service users who undertook
various cloud service activities, disaggregated by age group.
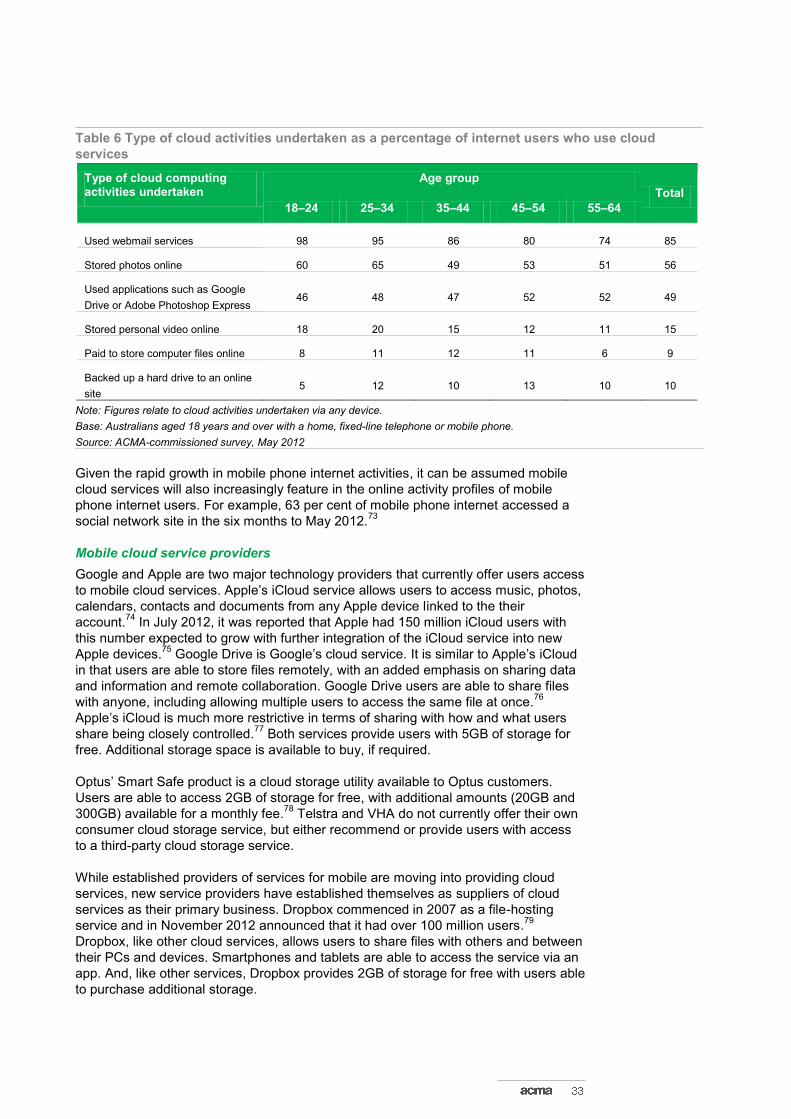
Table 6 Type of cloud activities undertaken as a percentage of internet users who use cloud
services
Type of cloud computing activities undertaken
Age group
Total
18–24 25–34 35–44 45–54 55–64
Used webmail services 98 95 86 80 74 85
Stored photos online 60 65 49 53 51 56
Used applications such as Google
Drive or Adobe Photoshop Express 46 48 47 52 52 49
Stored personal video online 18 20 15 12 11 15
Paid to store computer files online 8 11 12 11 6 9
Backed up a hard drive to an online
site 5 12 10 13 10 10
Note: Figures relate to cloud activities undertaken via any device.
Base: Australians aged 18 years and over with a home, fixed-line telephone or mobile phone.
Source: ACMA-commissioned survey, May 2012
Given the rapid growth in mobile phone internet activities, it can be assumed mobile
cloud services will also increasingly feature in the online activity profiles of mobile
phone internet users. For example, 63 per cent of mobile phone internet accessed a
social network site in the six months to May 2012.73
Mobile cloud service providers
Google and Apple are two major technology providers that currently offer users access
to mobile cloud services. Apple‘s iCloud service allows users to access music, photos,
calendars, contacts and documents from any Apple device linked to the their
account.74
In July 2012, it was reported that Apple had 150 million iCloud users with
this number expected to grow with further integration of the iCloud service into new
Apple devices.75
Google Drive is Google‘s cloud service. It is similar to Apple‘s iCloud
in that users are able to store files remotely, with an added emphasis on sharing data
and information and remote collaboration. Google Drive users are able to share files
with anyone, including allowing multiple users to access the same file at once.76
Apple‘s iCloud is much more restrictive in terms of sharing with how and what users
share being closely controlled.77
Both services provide users with 5GB of storage for
free. Additional storage space is available to buy, if required.
Optus‘ Smart Safe product is a cloud storage utility available to Optus customers.
Users are able to access 2GB of storage for free, with additional amounts (20GB and
300GB) available for a monthly fee.78
Telstra and VHA do not currently offer their own
consumer cloud storage service, but either recommend or provide users with access
to a third-party cloud storage service.
While established providers of services for mobile are moving into providing cloud
services, new service providers have established themselves as suppliers of cloud
services as their primary business. Dropbox commenced in 2007 as a file-hosting
service and in November 2012 announced that it had over 100 million users.79
Dropbox, like other cloud services, allows users to share files with others and between
their PCs and devices. Smartphones and tablets are able to access the service via an
app. And, like other services, Dropbox provides 2GB of storage for free with users able
to purchase additional storage.

Near-field communications using smartphones
Near-field communications is a technology that allows smartphones and other
communications devices to communicate with each other by either touching the
devices together or holding the devices within a short distance of one another. The
use of near-field communications for mobile devices is still in its infancy in Australia
but it is expected that, like ATMs and EFTPOS, Australia will adopt this technology
rapidly in the coming years.80
Currently, a quarter of consumers find the prospect of
making payments via a smartphone with in-built, near-field communications
capabilities appealing.81
At this time, relatively few retailers and organisations have
adopted near-field communications for mobile devices. Some of the early
implementations include the Commonwealth Bank‘s Kaching iPhone app82
while other
large organisations, such as Coles, Woolworths and Telstra, are running trials of the
technology‘s functionality.83
The obvious aim of the implementation of near-field communications is to allow ease
of access to information and the processing of transactions. While currently using a
near-field communications app may appear cumbersome, it is not too difficult to see
the potential benefits of contactless payment mechanisms. As part of its program to
trial new payment technologies, Woolworths found that it took on average 6.4 seconds
to process a contactless payment compared with 30.6 seconds for a traditional
payment.84
Payments are not the only functionality for which near-field communications are being
utilised. Like quick response (QR) codes discussed below, companies are using small
sticker-type markings to show consumers where they are able to tap their near-field
communications enabled device to interact with their environment. In the Sydney area
of Surry Hills, Tapit Media has placed Tapit stickers at a number of restaurants. The
stickers can be used by consumers for a range of functions including viewing a menu,
seeing the day‘s specials or ‗liking‘ or ‗checking-in‘ to the restaurant on Facebook.85
For contactless payments to become the new norm for paying for goods and services,
it will be not only necessary for retailers to adopt the technology on a large scale, but it
will also be necessary for the consumer to have a device that is capable of making
contactless payments. Current iPhone models (including the new iPhone 5) do not
include near-field communications functionality.86
Some industry stakeholders, such as
PayPal president, David Marcus, predict that the technology will fail to take hold as it is
debatable how much easier it is to pay with a phone over a card.87
However, recent
announcements suggest that the widespread adoption of near-field communications
as a payment option may not be too far away. Some new devices (including
Samsung‘s Galaxy S3 and Nexus) incorporate near-field communications functionality.
Also, VHA announced recently that it would commence a new mobile payments
system—in partnership with Visa and ANZ bank—in 2013 and that near-field
communications capabilities will be included with 80 per cent of the phones it sells
during the year.88
QR codes
QR (quick response) codes are patterns of small black squares arranged on a white
background. They work like barcodes and their use is popular in some areas because
they can store a greater amount of data than standard barcodes.89
The use of QR
codes has increased in Australia due to growth in the number of Australians with
smartphones capable of reading QR codes. Approximately three per cent of mobile
phone users in Australia (480,000) were estimated to have used a QR code reader via
their mobile phone during June 2012.90
While the use of QR codes is not widespread
in Australia, the most predominant use to date has been through print advertising. The
benefit of using these codes in print advertising is that it allows consumers to quickly
visit a website linked to an advertisement.

Infrastructure developments—4G As outlined in a number of recent reports by the ACMA, the increased popularity of
wireless internet access in Australia is likely to continue with the rollout of new, user-
friendly devices, higher data speeds and generous data plans.91
Wireless service speeds are increasing, with the 4G network delivering internet
download and streaming speeds that are up to 25 times faster than those offered by
3G services when they were launched.92
Pioneered in Australia by Telstra, 4G
services are now being offered by other providers, including Optus and iiNet, which
sells services over the Optus network.93,94
VHA has announced plans to roll out a 4G
network in 2013 but has not yet outlined any definite rollout timings.95
While 4G
coverage in Australia is currently restricted to metropolitan areas and a few regional
centres, Telsyte has forecast that there will be almost seven million 4G connections by
2016, accounting for 19 per cent of the market.96
The adoption of 4G technology by Australian consumers is likely to encourage the
take-up of services such as mobile television, especially longer, high-definition films
and television series. It is also likely that, with the continued rollout of 4G services, the
capacity for providers to offer live events to mobile audiences will increase, enabling
consumers to view live concerts, sport or newscasts whenever or wherever it is
convenient.97
Market challenges Telecommunications service providers in Australia face potential challenges which
threaten to erode traditional revenue streams based on the widespread adoption of the
mobile phone. Mobile network operators earn significant revenue from users sending
SMS messages and making phone calls carried over a mobile network. To date,
Australian consumers have made extensive use of these services. In June 2012, the
percentage of Australians mobile phone users (aged 14 and over) sending 50 or more
SMSs per week increased 2.1 percentage points to 18.1 per cent while the percentage
sending fewer than five SMSs per week declined 2.2 percentage points to 23.2 per
cent, compared with the same period in 2011.98
Overall, Telstra reported a 21.6 per
cent increase in the number of SMSs sent in 2011–12, compared with the previous
year.99
While consumers may be currently making more use of these services, this increase
has not necessarily been reflected in revenue increases for providers. Increased
competition has forced them to lower prices and include more in service offerings to
entice consumers. The result is some providers reporting a reduction in average
revenue per user (ARPU) which impacts on profitability. Optus reported that its mobile
ARPU declined by $2 to $45 in 2011–12.100
Telstra said its mobile ARPU dropped by
$2.44 in the year to June 2012 and fell by $4.28 in the six months to June 2012.101
Faced with declining ARPU figures, providers have looked to increase prices for some
services while offering fewer inclusions for others. In some cases, they have reduced
the amount of data included with some service plans while in other cases, the prices of
plans have increased and some smaller and cheaper plans have been removed
altogether.102
For example, Telstra announced in July 2012 that it would no longer
offer its cheapest post-paid mobile plan ($29 per month).103
In addition, Optus‘ $80
plan currently offers half the data allowance (2GB per month) of its $79 plan, which
was available in 2011.104
Declining revenues have also given providers a strong incentive to expand further into
data and content services.105
Providers have developed several strategies to
encourage demand for data and content services, including providing broadband-
speed internet access to mobile devices, and access to popular content.106
Non-
messaging data services made up an estimated 28 per cent of mobile revenues in the

2010–11 financial year107
, with these services expected to drive revenue for the five
years until 2016–17.108
Over-the-top services
The introduction of over-the-top (OTT) phone call and messaging services that utilise a
smartphone‘s data connection further threaten provider revenue. Ovum recently
predicted that OTT services such as VoIP will cost the global telecommunications
industry $479 billion in lost cumulative revenues by 2020.109
It was also reported that
the number of SMSs sent in the US during the September 2012 quarter declined for
the first time—a consequence of increased use of mobile internet protocol services.110
OTT services are generally available for use on a smartphone through an app. These
services can be beneficial to the consumer in situations where calls may have
traditionally been quite expensive, such as international calls, or where a user would
like to send a large number of messages. A VoIP service, such as Skype, allows users
to complete video and voice calls to other Skype users via an internet connection,
bypassing the need for the call to be carried over the voice communications channels
of a mobile network. Skype calls between users are free and they only need to pay for
their internet connection. While Skype has been available for some time for use on a
PC as a replacement for a fixed-line voice service, it is now available as an app on
mobile devices.
A service such as Skype also threatens traditional revenue streams as users are able
to buy credits to call mobiles and landlines worldwide, often at prices much lower than
those offered by established telecommunications providers.111
Skype looks set to
attempt to push further into Australia with a recent announcement that it will sell
prepaid cards with credit for the service in up to 10,000 retail and convenience store
outlets across Australia by March 2013.112
In Australia, there were an estimated
616,000 mobile phone VoIP users at June 2012, an increase of 133 per cent since
June 2011.113
Non-SMS messaging
Mobile network operators are also at risk of losing SMS revenue as consumers switch
to alternative methods of sending text-based messages. Facebook users have been
able to send messages using the social networking service since its early days.
However, Facebook has recently introduced smartphone apps which aim to improve a
user‘s experience when sending Facebook messages. The apps are available for iOS,
Android and RIM‘s Blackberry OS operating systems. They incorporate real-time alerts
for incoming messages and an interface that is similar to the in-built messaging app on
smartphones.114
The Google Play store indicates that there have been more than 50
million downloads of the Facebook Messenger Android app.115
Apple has also introduced its own data-based OTT messaging system for iOS devices
that allows users to send free text messages to other users with iOS devices over an
internet connection. Users are able to send messages based on their Apple account
ID to and from devices that do not have a phone number or access to a mobile phone
network but do have access to the internet.116
Smartphones and tablets as assistive technology While developments in the smartphone and tablet market have largely focused on
commercial applications, these devices are also being touted as having the potential
to improve access to information and services for people with a disability. The principle
of equivalence is being reflected around the world through service trends and
approaches to accessibility being adopted by government agencies.

According to the United Nations, approximately 10 per cent of the world‘s population—
650 million people—live with some form of disability, such as vision, hearing, physical,
mental or intellectual impairment. Australia also has an ageing population that will
increasingly have eyesight, hearing and mobility problems.
In Australia, accessibility measures are underpinned by the Disability Discrimination
Act 1992, which has led to improved website, telecommunications, broadcasting and
financial services accessibility. A report, Measuring Progress of eAccessibility in
Europe, commissioned by the European Commission, included survey data from
Australia rating it well above the European average.117
The Department of Broadband,
Communications and the Digital Economy (DBCDE) has sponsored trials to evaluate
and demonstrate telecommunications technologies that can provide accessible
options to the elderly and disabled, by employing IP-based services to remotely
support specific disability groups.118
DBCDE has also examined accessibility issues by
completing the Review of Access to Telecommunications Services by People with
Disability, Older Australians and People Experiencing Illness, which was released in
July 2012. One recommendation of the review aims to improve the information
available to people with a disability to support them in making use of general
telecommunications consumer products and services with accessibility features.119
People with a disability or communications impairment can use a smartphone or tablet
to download a range of apps. They can also take advantage of built-in features to help
them with a wide range of communications, e-commerce and navigation, as well as to
support many day-to-day activities that other people take for granted. This includes
using SMS and instant messaging apps, such as Google Translate, to translate a
message into another language, and GPS paired with voice navigation apps.120
The vision-impaired can use apps on these devices to scan currency and read
barcodes.121
One such device has a large touchscreen interface, providing a
completely accessible system from which to navigate and communicate more
easily.122
According to Media Access Australia, the blind and vision-impaired
community recognises the Apple iPhone as the most accessible smartphone, given
that it includes accessibility features like a sophisticated screen reader, full-screen
magnifier and white-on-black display for higher contrast.123
The user can scan their
finger across the audible touchscreen and simultaneously tap with another finger to
enter a character or select an object; while the GPS-enabled navigation app features
speech directions, as well as reading out street and business names or landmarks.124
The combination of these technologies found in smartphones and tablets provides
access to mainstream services and can be easier to use than the highly specialised
legacy equipment.125

Research methodology
Overview of research resources The data used in this report is drawn from a number of research sources including the
following.
ACMA-commissioned consumer research in the form of a telephone survey
conducted in May 2012. Undertaken by Roy Morgan Research, the survey sampled
2,205 adult respondents aged 18 and over, comprising 1,800 with a home fixed-line
telephone and 400 with a mobile phone and no home fixed-line telephone (mobile-only
users)—see Table 7. The survey asked respondents questions regarding their
telecommunications service use in the six months to May 2012.
Table 7 ACMA-commissioned consumer survey sample breakdown (unweighted)
Sample size
Gender Male 1,102
Female 1,103
Total 2,205
Age 18–24 years 258
25–34 370
35–44 397
45–54 398
55–64 357
65 and over 425
Total 2,205
State NSW/ACT 722
Vic. 562
Qld 437
WA 242
SA/NT 189
Tas. 53
Total 2,205
Location Metropolitan 1,518
Regional 687
Total 2,205
Roy Morgan Single Source, June 2012, for additional estimates relating to the
population in Australia 14 years and over, and Australians 18+, drawn from a large
base survey sample of more than 25,000 per year in Australia.
Data analysis
Results from the consumer survey were analysed using descriptive analysis
techniques, and by socioeconomic and demographic factors, to identify any areas with
significant patterns or differences. Only results with significant differences are reported
in this research.
Desktop research
Research conducted by staff examining publicly available reports, articles and industry
journals.
Endnotes
1 AMCA-commissioned survey, May 2012.
2 ABS, 8153-Internet Activity, Australia, June 2012
3 AMCA-commissioned survey, May 2012 and Roy Morgan Single Source, June 2012.
4 ibid.
5 ACMA, Communications report 2011–12
6 Anderson, J., and Rainie, L., ‗The Future of Apps and Web‘, Pew Internet, 23 March 2012, ,.
7 Ericsson predicts that within five years, 85 per cent of the globe will be covered by high speed (3G) mobile
broadband, and half by 4G (LTE). 8 Canalys, ‗Smartphones over take client PCs in 2011‘. 3 February 2012.
9 ibid.
10 Ahonen, T., ‗A look at the handset industry, market and Installed base in 2012‘, 4 October 2012.
11 Reisinger, D., ‗Worldwide smartphone user base hits 1bn‘, CNET Australia, 18 October 2012.
12 Ahonen, T., ‗A look at the handset industry, market and Installed base in 2012‘, 4 October 2012.
13 Juliette Garside, ‗Smartphones up, smart uses steady’, The Age, 8 January 2013.
14 Ericsson, Traffic and Market Report: On the pulse of the networked society, June 2012.
15 Australian Bureau of Statistics, Internet Activity, Australia June 2012.
16 Fairfax media, ‗Apple unveils iPhone 5’, The Sydney Morning Herald, 13 September 2012.
17 IDC, ‗Smartphones drive Third Quarter growth in the worldwide mobile phone market, according to IDC‘,
25 October 2012, 18
Kantar World Panel, ‗Apple achieves its highest ever Smartphone share in US‘, 21 December 2012. 19
ibid. 20
ibid. 21
Diaconescu, A., ‗Android remains top dog in US and Europe, market share down however in the States‘, Android Authority, 30 October 2012. 22
Kent German, ‗A brief history of Android phones‘, cnet.com, 2 August 2011. 23
Joshua, Topolsky, Motorola DROID review, Endgadget, 30 October 2009. 24
JR Raphael, ‗Droid Sales and the Android Explosion‘, PC World, 16 November 2009. 25
Fingas, J., ‗Strategy Analytics claims Android reached 41 per cent of tablets in Q3, iPad may have felt the heat‘, 25 October 2012. 26
Reisinger, D., ‗Worldwide smartphone user base hits 1 bn‘, CNET Australia, 18 October 2012. 27
Telsyte, Australian Smartphone Market Study 2012, 14 June 2012. 28
Reilly, C., ‗GfK trends: Ultrathin PCs and the ubiquitous smartphone‘, Current, 22 August 2012. 29
JB Hi-Fi Outright Phones, page viewed 3 January 2013. 30
Turner, A., ‗Apple and Android in smartphone photo finish‘, The Sydney Morning Herald, 21 December 2011. 31
Michael, D., ‗Telstra to launch Nokia Lumia 920‘, 30 October 2012. 32
Jager, C., ‗In Pictures: Optus launches 4G Network, Samsung Galaxy S III 4G,‘ PC Authority, 4 September 2012. 33
Hopewell, L., ‗Nokia Lumia 920: Here‘s who will be selling it In Australia‘ Gizmodo, 27 September 2012. 34
Field, D., A Mei-Pochtier and J., Stephan, ‗The Tablet Market: Not carved in stone. Consumer trends and market segmentation‘, BCG Perspectives, 23 January 2012. 35
The, T., ‗Telsyte: Media Tablet usage on the rise.‘ iTech Report, 5 September 2012. 36
Tablet devices with even smaller screen sizes are on the market but have not been as successful, save the 5.1 inch hybrid ‗phablet‘, the Samsung Galaxy Note. 37
Mackay, M., Australian Mobile Phone Lifestyle Index. Eighth edition, Mobile Industry Group, Australian Interactive Media Industry Association, September 2012. 38
Fried, I., ‗Mobile data use surging, but tablets largely a WiFi-only affair‘, All Things D., 20 March 2012. 39
ibid. 40
ibid. 41
'Not just a shrunken down iPad': Apple unveils mini tablet‖, The Sydney Morning Herald, 24 October 2012. 42
Mackay, M., Australian Mobile Phone Lifestyle Index. Eighth edition, Mobile Industry Group, Australian Interactive Media Industry Association, September 2012. 43
Android Tablets Australia, page viewed 4 January 2013. 44
Chaudhuri, S., ‗Apple in iPad sales record‘, The Australian, 6 November 2012. 45
Keizer, G., ‗Half of iPad Mini sales will be cannibalisations?‘, Macworld, 12 November 2012. 46
Elgan, M., ‗Why small tablets will dominate the tablet market‘, Computerworld, 7 July 2012. 47
Roy Morgan Single Source. 48
Anderson, J., and Rainie, L., ‗The Future of Apps and Web‘, Pew Internet, 23 March 2012. 49
Mark Serrels, Kotaku Australia, page viewed 31 October 2012. 50
Chaffin, B., ‗Google matches apple app store with 700,000 Android apps‘, The Mac Observer, 30 October 2012. 51
Ginny Miles, PCWorld, 15 November 2010, website viewed 1 November 2012. 52
Stuart Corner, Android malware up, thanks to market forces, Exchange Daily, 31 October 2012. 53
ACMA-commissioned survey, May 2012. 54 Adam Bender, ‗Mobile bills still confusing, shocking: Macquarie University‘, Computerworld, 27 November 2012. 55
www.acma.gov.au 56
Roy Morgan Single Source. 57
ABS, 8153-Internet Activity, Australia, June 2012.

58 Roy Morgan Single Source, June 2012.
59 Adam Mills, ‗8 Exciting Smartphones for 2013‘, GottaBeMobile.Com, 20 November 2012.
60 Scott Nichols, ‗Samsung and LG smartphones reportedly going 1080p in 2012‘, Techradar, 23 October
2012. 61
Rob Gillies, ‗RIM to unveil new BlackBerry phones on January 30‘, The Sydney Morning Herald, 13 November 2012. 62
CNET Editors‘ Take, ‗Surface Pro aims to sidestep RT compromises‘, cnet.com, 5 November 2012. 63
How PayPal works, PayPal website viewed 5 November 2012. 64
PayPal reports 3 million active Australia users, eCommerce Report, 22 April 2012. 65
Rolfe Winkler, ‗Today‘s digital tsunami – mobile‘, The Australian, 25 October 2012. 66
Apple iOS 6 Features (Passbook), page viewed on 7 November 2012. 67
Alex Zaharov-Reutt, ‗Apple and Qantas announce Passbook app for mobile Qantas check-in on iPhone‘, Exchange Daily, 28 November 2012. 68
Adam Turner, ‗Apple‘s digital wallet opens up retail possibilities‘, The Sydney Morning Herald, 2 October 2012. 69
Google Wallet, page viewed 7 November 2012. 70
Why – Google Wallet, Google, page viewed 7 November 2012. 71
Kellex, ‗Google‘s Help Site Basically Confirms ―Google Wallet Card‖‘, Droid Life, 6 November 2012. 72
ACMA, Communications report 2011–12; Report 2— Australia’s progress in the digital economy: Participation, trust and confidence 73
ACMA-commissioned survey, May 2012. 74
Apple iCloud features. 75
Frederic Lardinois, ‗Apple Now Has 150 Million iCloud Users‘, Tech Crunch, 24 July 2012. 76
Google Drive features. 77
Dan Moren, ‗iCloud: Sharing done wrong‘, Macworld, 18 October 2012. 78
Optus Smart Safe. 79
Dropbox. 80
Graeme Philipson, ‗The Right Angle (comment)‘, Exchange Daily, 19 October 2012. 81
Graeme Philipson, ‗Young v old – Australian consumers split on age lines over mobile payments‘, Exchange Daily, 30 October 2012 (2012 HP Australian Payments Research Report). 82
CommBank Kaching, Commonwealth Bank, page viewed 5 November 2012. 83
‗NFC trials, pilots, tests and live services around the world‘, NFC World, page viewed 5 November 2012. 84
Beverley Head, ‗Woolies accepts the inevitable – contactless is the future of payments‘, Exchange Daily, 19 October 2012. 85
David Frith, ‗Near-field communications apps are still quite far away‘, The Australian, 19 June 2012. 86
Matt Myftiu, ‗iPhone 5 vs. Galaxy S3: Who wins the battle between the two hottest phones on the market?‘, Daily News Los Angeles, 9 October 2012. 87
Adam Bender, ‗PayPal predicts imminent demise for NFC, but analysts are split‘, Computerworld, 18 December 2012. 88
Petroc Wilson, ‗VHA, Visa tap NFC for smartphone payments‘, Communications Day, 21 November 2012. 89
QR Codes, Wikipedia, page viewed 7 November 2012. 90
Roy Morgan Single Source, June 2012. 91
ACMA, Communications report 2010–11; Report 3—The emerging mobile telecommunications service market in Australia. 92
Telstra, Australia‘s first 4G smartphone hits stores today, 24 January 2012. 93
Optus media release, ‗Optus launches 4G network across Newcastle and Hunter region‘, 26 April 2012. 94
iiNet announced its intention to offer 4G broadband services over the Optus network in September 2012. Hopewell, L., ‗iiNet is bringing out 4G services of its own‘, Gizmodo, 17 September 2012. 95
VHA press release, 26 June 2012. 96
Telsyte, ‗4G mobile broadband to be used by 7 million mobile devices in Australia by 2016‘, 24 April 2012. 97
Jeffries, A., ‗4G and the Future of Mobile Streaming Video‘, ReadWriteWeb, September 2010. 98
Roy Morgan Product Poll (Australia) : July 2010–June 2012 99
Telstra Annual Report 2012. 100
David Edwards, ‗Optus posts modest FY results‘, Communications Day, 11 May 2012. 101
Telstra Annual Report 2012. 102
Lucy Battersby, ‗Mobile phone costs rise as price war ends‘, The Sydney Morning Herald, 30 July 2012. 103
Renai LeMay, ‗Telstra increases mobile, fixed phone costs‘, Delimiter, 31 July 2012. 104
Orantia Jenneth, ‗Telcos slash data on mobile plans‘, The Sydney Morning Herald, 5 November 2012. 105
Richard Jeremiah from IBIS attributes the decreasing ARPU to increase in take-up of capped call plans. See IBIS, Mobile Telecommunications Carriers in Australia, August 2011. 106
For more information refer to ACMA, Communications report 2009–10 series, Report 4—Changing business models in the Australian communication and media sectors: Challenges and response strategies, January 2011. 107
Voice services made up 36 per cent. 108
R. Jeremiah, Mobile Telecommunications Carriers in Australia, IBIS, August 2011. 109
Jeremy Green, ‗Ovum reveals ―death of telephone‖ is exaggerated as OTT VoIP predicted to cost telcos $479bn by 2020‘, Ovum, 25 October 2012. 110
Stephen Lawson, ‗US mobile users sending fewer text messages: 678 per month‘, Computerworld, 12 November 2012. 111
Skype – What is Skype? 112
Petroc Wilson, ‗Skype sets sights on a new ANZ retail push‘, Communications Day, 21 November 2012. 113
Roy Morgan Single Source. 114
Facebook – Messenger for Mobile. 115
Google Play – Download Facebook Messenger for Android.

116 iOS – Messages.
117 www.eaccessibility-progress.eu.
118 DBDCE, Accessible Telecommunications Trials, 20 August 2010, viewed 7 September 2011.
119 Department of Broadband, Communications and Digital Economy, Review of access to
telecommunications by people with a disability, older Australians and people experiencing illness. 120
G. Ostrovsky, ‗Android Smartphone Apps Help Blind Navigate Around‘, med Gadget, October 2010. 121
Youtube, Smartphones Becomes Essential Accessories for the Blind, viewed 15 September 2011. 122
Youtube, iPhone Apps for the Blind, viewed 15 September 2011. 123
Media Access Australia, Smartphones, viewed 15 September 2011. 124
G. Ostrovsky, loc. cit. 125
S. Collerton, ‗Touchscreen tech helping people with disabilities‘, ABC News, 23 September 2011.

SydneyLevel 5 The Bay Centre 65 Pirrama Road Pyrmont NSW
PO Box Q500 Queen Victoria Building NSW 1230
T +61 2 9334 7700 1800 226 667 F +61 2 9334 7799
MelbourneLevel 44 Melbourne Central Tower 360 Elizabeth Street Melbourne VIC
PO Box 13112 Law Courts Melbourne VIC 8010
T +61 3 9963 6800 F +61 3 9963 6899
CanberraPurple Building Benjamin Offices Chan Street Belconnen ACT
PO Box 78 Belconnen ACT 2616
T +61 2 6219 5555 F +61 2 6219 5353
acma.gov.au engage.acma.gov.au


![Comms presentation[1]](https://img.pdfslide.us/doc/110x75/54590343af79594f558b5456/comms-presentation1.jpg)