Embed Size (px)
Citation preview
Renault Mégane dCi 110
TEST PLAN
Prepared by eTV December 2009
2
Disclaimer Notice Transport Canada’s ecoTECHNOLOGY for Vehicles program (“eTV”) tests emerging vehicle technologies to assess their performance in accordance with established Canadian motor vehicle standards. The test plan presented herein does not, in itself, represent an official determination by Transport Canada regarding fuel consumption or compliance with safety and emission standards of any motor vehicle or motor vehicle component. Transport Canada does not certify, approve or endorse any motor vehicle product. Technologies selected for evaluation, and test results, are not intended to convey policy or recommendations on behalf of Transport Canada or the Government of Canada.
Transport Canada and more generally the Government of Canada make no representation or warranty of any kind, either express or implied, as to the technologies selected for testing and evaluation by eTV, nor as to their fitness for any particular use. Transport Canada and more generally the Government of Canada do not assume nor accept any liability arising from any use of the information and applications contained or provided on or through these test results. Transport Canada and more generally the Government of Canada do not assume nor accept any liability arising from any use of third party sourced content. Any comments concerning its content should be directed to: Transport Canada Environmental Initiatives (AHEC) ecoTECHNOLOGY for Vehicles (eTV) Program 330 Sparks Street Place de Ville, Tower C Ottawa, Ontario K1A 0N5 E-mail: [email protected] © Her Majesty the Queen in Right of Canada, as represented by the Minister of Transport, 2010
3
Table of Contents 1.0 Definitions ................................................................................................................................... 4 2.0 Introduction ................................................................................................................................ 6 3.0 Pre-Test Verification Procedure ............................................................................................... 7 4.0 Methodology ............................................................................................................................... 8
4.1 Phase 1: Laboratory Fuel Consumption and Emissions Testing ....................................... 8 4.2 Phase 2: Dynamic Performance Testing .............................................................................. 8 4.3 Phase 3: On-road Evaluations .............................................................................................. 9
5.0 Fuel Consumption and Emissions Testing and Analysis ........................................................ 9 5.1 U.S. FTP-72 (UDDS) Cycle ................................................................................................. 10 5.2 US06 Supplemental Federal Test Procedure ..................................................................... 11 5.3 US SC03 Speed Correction Driving Schedule ................................................................... 11 5.4 U.S. HWFET Cycle .............................................................................................................. 12 5.5 Steady-State Driving Conditions ........................................................................................ 13
6.0 Dynamic Performance Testing ................................................................................................ 15 6.1 Environmental Conditions .................................................................................................. 15 6.2 Tire Conditions .................................................................................................................... 15 6.3 Track Conditions ................................................................................................................. 15 6.4 Calculation of Power ........................................................................................................... 15
6.4.1 Trap-Speed Method ....................................................................................................... 16 6.4.2 Elapsed-Time Method ................................................................................................... 16 6.4.3 Calculation of Torque ................................................................................................... 16
6.5 Acceleration Evaluation ...................................................................................................... 16 6.5.1 Manual Transmission .................................................................................................... 17
6.6 Maximum Speed in Gear .................................................................................................... 17 6.7 Top Speed ............................................................................................................................. 17 6.8 Handling ............................................................................................................................... 17
6.8.1 Lateral Skid Pad ............................................................................................................ 17 6.8.2 Emergency Lane Change Manoeuvre ........................................................................... 18 6.8.3 Turning Circle ............................................................................................................... 20 6.8.4 Slalom ........................................................................................................................... 21
6.9 Noise ...................................................................................................................................... 21 6.10 Braking ............................................................................................................................. 22 6.11 Test Instrumentation ....................................................................................................... 23 6.12 Records ............................................................................................................................. 24
7.0 Applicable Publications ........................................................................................................... 24 7.1 SAE Publications.................................................................................................................. 24 7.2 Code of Federal Regulations ............................................................................................... 25 7.3 Motor Vehicle Safety Standards ......................................................................................... 25 7.4 International Organization for Standardization ............................................................... 25 7.5 American Society of Testing and Materials (ASTM) ....................................................... 25
4
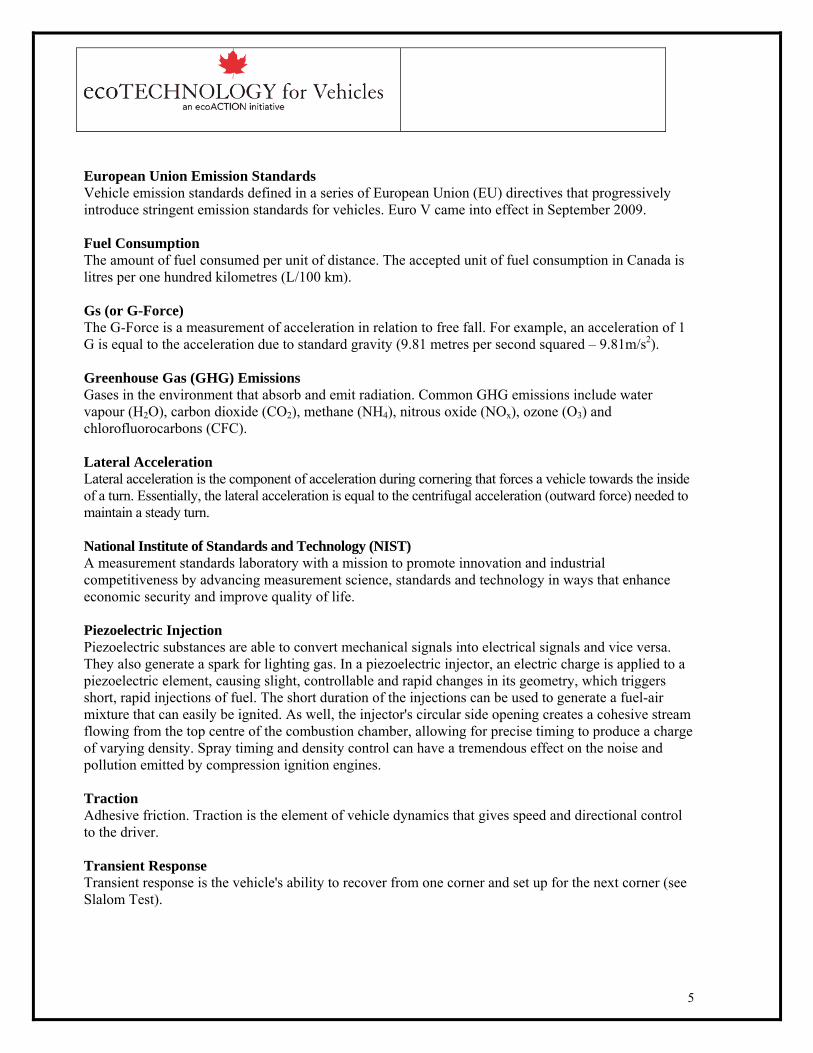
1.0 Definitions
A-Weighting Scale (dBA) Decibels with the sound pressure scale adjusted to conform to the frequency response of the human ear. A sound level meter that measures A-weighted decibels has an electrical circuit that allows the meter to have the same sound sensitivity at different frequencies as the average human ear. There are also B-weighted and C-weighted scales, but the A-weighted scale is the one most commonly used for measuring noise. Ambient Temperature It is the temperature of the air surrounding an object. Anti-Lock Braking System (ABS) An anti-lock braking system is a safety system that prevents a vehicle’s wheels from locking up during heavy braking. Essentially, the ABS regulates the braking pressure on the wheel, allowing it to continuously have traction on the driving surface. Barometric Pressure Barometric pressure is the pressure (force over area) exerted by a column of air above a fixed point, expressed in kilopascals (kPa). Burnout Burnout results from an incorrect method of warming up the tires of a vehicle, normally by pressing the accelerator pedal and applying the emergency brakes of a vehicle at the same time. Carbon Footprint The amount of carbon emissions created from a process. Compression Ratio The ratio of the volume of the combustion chamber when the piston is at bottom dead centre (end of intake stroke) to the volume of the combustion chamber when the piston is at top dead centre (end of compression stroke). Criteria Air Contaminants (CAC) A group of pollutants that includes sulphur oxides (SOx), nitrogen oxides (NOx), particulate matter (PM), volatile organic compounds (VOC), carbon monoxide (CO) and ammonia (NH3). Data Acquisition System (DAS) A device designed to measure and log parameters over a given time period, either continually or continuously. Drive Train The components of an automotive vehicle that connect the transmission with the driving axles, including the universal joint and drive shaft. Electric Governor It is a device that electronically regulates the amount of fuel injected by a fuel injection pump.
5
European Union Emission Standards Vehicle emission standards defined in a series of European Union (EU) directives that progressively introduce stringent emission standards for vehicles. Euro V came into effect in September 2009. Fuel Consumption The amount of fuel consumed per unit of distance. The accepted unit of fuel consumption in Canada is litres per one hundred kilometres (L/100 km). Gs (or G-Force) The G-Force is a measurement of acceleration in relation to free fall. For example, an acceleration of 1 G is equal to the acceleration due to standard gravity (9.81 metres per second squared – 9.81m/s2). Greenhouse Gas (GHG) Emissions Gases in the environment that absorb and emit radiation. Common GHG emissions include water vapour (H2O), carbon dioxide (CO2), methane (NH4), nitrous oxide (NOx), ozone (O3) and chlorofluorocarbons (CFC). Lateral Acceleration Lateral acceleration is the component of acceleration during cornering that forces a vehicle towards the inside of a turn. Essentially, the lateral acceleration is equal to the centrifugal acceleration (outward force) needed to maintain a steady turn. National Institute of Standards and Technology (NIST) A measurement standards laboratory with a mission to promote innovation and industrial competitiveness by advancing measurement science, standards and technology in ways that enhance economic security and improve quality of life. Piezoelectric Injection Piezoelectric substances are able to convert mechanical signals into electrical signals and vice versa. They also generate a spark for lighting gas. In a piezoelectric injector, an electric charge is applied to a piezoelectric element, causing slight, controllable and rapid changes in its geometry, which triggers short, rapid injections of fuel. The short duration of the injections can be used to generate a fuel-air mixture that can easily be ignited. As well, the injector's circular side opening creates a cohesive stream flowing from the top centre of the combustion chamber, allowing for precise timing to produce a charge of varying density. Spray timing and density control can have a tremendous effect on the noise and pollution emitted by compression ignition engines. Traction Adhesive friction. Traction is the element of vehicle dynamics that gives speed and directional control to the driver. Transient Response Transient response is the vehicle's ability to recover from one corner and set up for the next corner (see Slalom Test).

6
Tread Depth The distance measured in the major tread groove nearest to the centre line of the tire, from the base of the groove to the top of the tread. 2.0 Introduction Several innovations are beginning to change the paradigm of traditional gasoline-powered light-duty vehicles. With growing concerns about the impact of greenhouse gas emissions on global warming, governments are starting to implement more stringent regulations. Consumers are beginning to consider the carbon footprint of their transportation. In response to consumer and regulatory requirements, manufacturers are striving to produce more fuel-efficient vehicles – and produce them in a more environmentally responsible way. To determine the carbon footprint of a single light-duty vehicle, many factors and variables must be taken into consideration. For example, how energy intensive are the processes used to produce the vehicle? What technologies are employed in the vehicle to reduce emissions during its operation? How recyclable is the vehicle? Technologies such as idle start-stop for gasoline powered, hybrid-electric, battery electric, hydrogen fuel-cell electric, and even diesel-powered vehicles, offer options for reducing carbon emissions during operational use. But the question remains: which technology has the best carbon footprint? Historically, diesel fuel has contained more energy per litre than gasoline, and diesel engines are more efficient than gasoline engines due to higher compression ratios. These conditions have made diesel engines favourable for reducing fuel consumption in vehicles, particularly during highway driving. For this reason, diesel has been the primary energy source for heavy-duty vehicles, such as tractor-trailers, that make long highway trips. However, diesel as a light-duty vehicle power source has been perceived as dirty, loud and impractical for starting in cold climates. In the past, diesel-powered vehicles have had challenges in meeting Canadian emissions regulations with regards to particulate matter and nitrogen oxide emissions. Advanced diesel particulate filters and selective catalytic reduction (SCR) converters have helped to reduce particulate matter and nitrogen oxide emissions. Common rail direct fuel injection has been used to create a more efficient combustion by injecting diesel fuel into the cylinders at a higher pressure. Piezoelectric injectors have helped regulate injection timing and fuel quantity. And advanced glow plugs have been used to improve cold weather starts. The result has been a cleaner, quieter and more practical diesel-powered vehicle for Canadian climates. The objective of this study is to examine the benefits of an advanced diesel-powered vehicle – the Renault Mégane dCi110 eco2. The 2009 Renault Mégane dCi110 is a light-duty passenger vehicle featuring an advanced diesel engine with common rail direct fuel injection, advanced glow plugs (to facilitate cold starts), and a diesel particulate filter with regeneration. The vehicle has been designed to meet stringent Euro V emissions standards that came into effect in September 2009 in Europe. In addition, the Mégane dCi110 meets Renault’s eco2 criteria for improved manufacturing, CO2 reduction and recycling. The vehicle was assembled in an ISO 14001 certified plant, offers less than 140 grams of CO2 per kilometre, and is 95% recyclable by mass―standard vehicles are usually about 75% recyclable by mass.
7
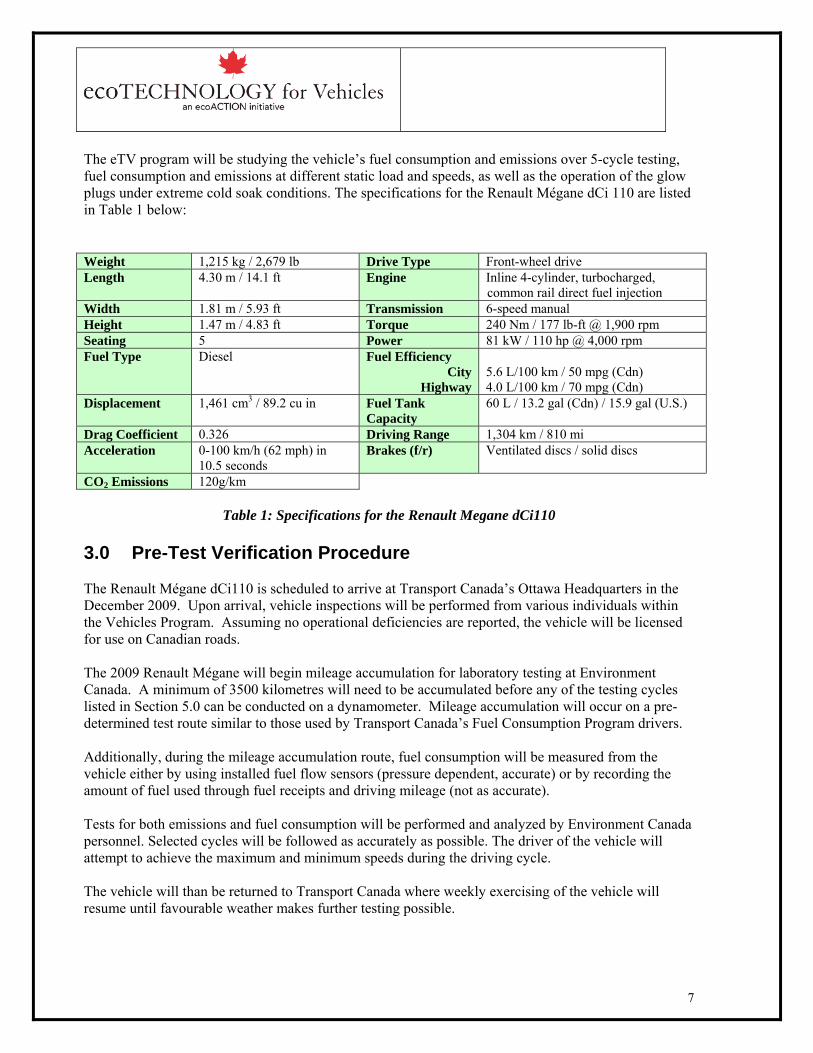
The eTV program will be studying the vehicle’s fuel consumption and emissions over 5-cycle testing, fuel consumption and emissions at different static load and speeds, as well as the operation of the glow plugs under extreme cold soak conditions. The specifications for the Renault Mégane dCi 110 are listed in Table 1 below: Weight 1,215 kg / 2,679 lb Drive Type Front-wheel drive Length 4.30 m / 14.1 ft Engine Inline 4-cylinder, turbocharged,
common rail direct fuel injection Width 1.81 m / 5.93 ft Transmission 6-speed manual Height 1.47 m / 4.83 ft Torque 240 Nm / 177 lb-ft @ 1,900 rpm Seating 5 Power 81 kW / 110 hp @ 4,000 rpm Fuel Type Diesel Fuel Efficiency
CityHighway
5.6 L/100 km / 50 mpg (Cdn) 4.0 L/100 km / 70 mpg (Cdn)
Displacement 1,461 cm3 / 89.2 cu in Fuel Tank Capacity
60 L / 13.2 gal (Cdn) / 15.9 gal (U.S.)
Drag Coefficient 0.326 Driving Range 1,304 km / 810 mi Acceleration 0-100 km/h (62 mph) in
10.5 seconds Brakes (f/r) Ventilated discs / solid discs
CO2 Emissions 120g/km
Table 1: Specifications for the Renault Megane dCi110 3.0 Pre-Test Verification Procedure The Renault Mégane dCi110 is scheduled to arrive at Transport Canada’s Ottawa Headquarters in the December 2009. Upon arrival, vehicle inspections will be performed from various individuals within the Vehicles Program. Assuming no operational deficiencies are reported, the vehicle will be licensed for use on Canadian roads. The 2009 Renault Mégane will begin mileage accumulation for laboratory testing at Environment Canada. A minimum of 3500 kilometres will need to be accumulated before any of the testing cycles listed in Section 5.0 can be conducted on a dynamometer. Mileage accumulation will occur on a pre-determined test route similar to those used by Transport Canada’s Fuel Consumption Program drivers. Additionally, during the mileage accumulation route, fuel consumption will be measured from the vehicle either by using installed fuel flow sensors (pressure dependent, accurate) or by recording the amount of fuel used through fuel receipts and driving mileage (not as accurate). Tests for both emissions and fuel consumption will be performed and analyzed by Environment Canada personnel. Selected cycles will be followed as accurately as possible. The driver of the vehicle will attempt to achieve the maximum and minimum speeds during the driving cycle. The vehicle will than be returned to Transport Canada where weekly exercising of the vehicle will resume until favourable weather makes further testing possible.

8
4.0 Methodology The Renault Megane dCi110, herein referred to as the “test vehicle”, will undergo the following three phases of testing and evaluation:
• Phase 1: Laboratory Fuel Consumption and Emissions Testing • Phase 2: Dynamic Performance Testing • Phase 3: On-road Evaluations
4.1 Phase 1: Laboratory Fuel Consumption and Emissions Testing Emissions and fuel consumption testing at Environment Canada’s Emissions Research and Measurement Section (ERMS) of the Environmental Science and Technology Centre located in Ottawa, Ontario will be performed using ultra-low sulphur diesel (ULSD) fuel. This facility is Canada’s national vehicle emissions and fuel consumption testing laboratory. Apart from testing fuel consumption and emissions against Canadian and U.S. standards, ERMD is also involved in joint research efforts with other government departments and private industry. Emissions and fuel consumption tests will be performed as per the procedures listed in the Code of Federal Regulations (CFR) titles cited in Section 7.2. Section 5.0 outlines the duty cycles over which the testing will be performed, as well as the pollutant and emissions being measured and analyzed. 4.2 Phase 2: Dynamic Performance Testing Dynamic performance tests will be performed at the Transport Canada testing facility located in Blainville, Québec. The facility has been operated by PMG Technologies for more than 15 years. PMG performs testing for the Road Safety group of Transport Canada as well as individual manufacturers or groups that wish to avail themselves of the lab’s facilities. PMG will perform all controlled track tests for the test vehicle, as outlined in Section 6.0
Figure 1: Test Centre Track, Location Blainville, Québec
9
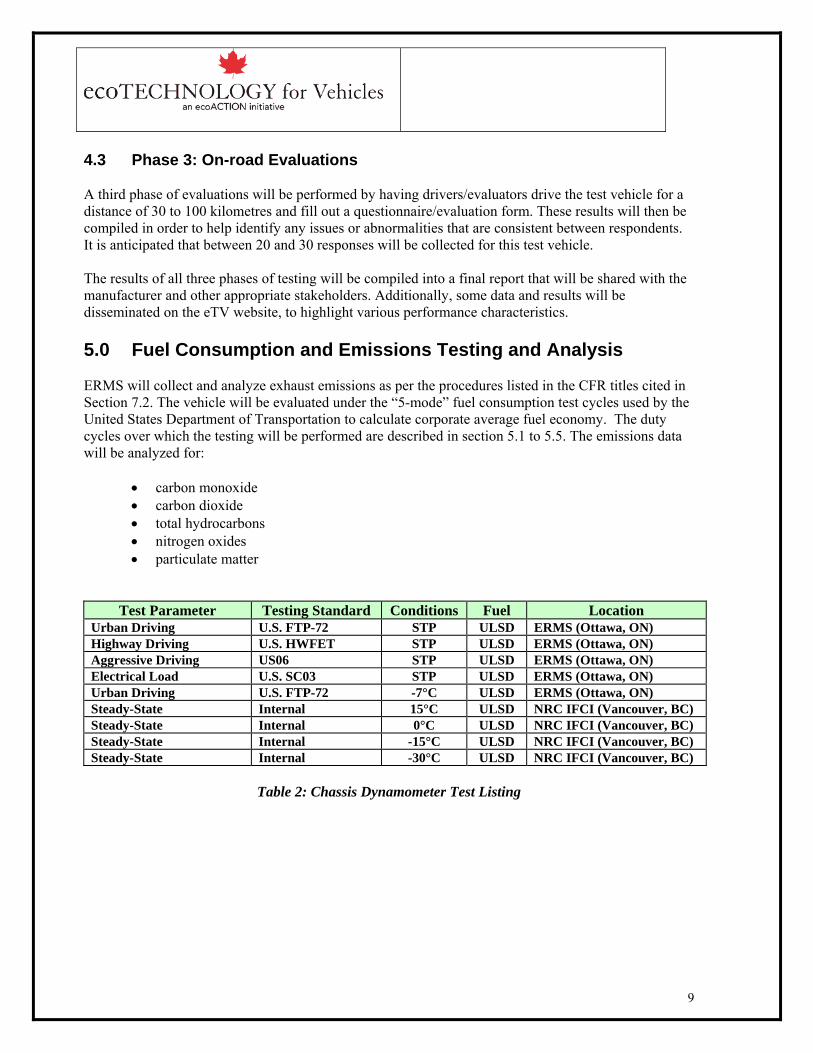
4.3 Phase 3: On-road Evaluations A third phase of evaluations will be performed by having drivers/evaluators drive the test vehicle for a distance of 30 to 100 kilometres and fill out a questionnaire/evaluation form. These results will then be compiled in order to help identify any issues or abnormalities that are consistent between respondents. It is anticipated that between 20 and 30 responses will be collected for this test vehicle. The results of all three phases of testing will be compiled into a final report that will be shared with the manufacturer and other appropriate stakeholders. Additionally, some data and results will be disseminated on the eTV website, to highlight various performance characteristics. 5.0 Fuel Consumption and Emissions Testing and Analysis ERMS will collect and analyze exhaust emissions as per the procedures listed in the CFR titles cited in Section 7.2. The vehicle will be evaluated under the “5-mode” fuel consumption test cycles used by the United States Department of Transportation to calculate corporate average fuel economy. The duty cycles over which the testing will be performed are described in section 5.1 to 5.5. The emissions data will be analyzed for:
• carbon monoxide • carbon dioxide • total hydrocarbons • nitrogen oxides • particulate matter
Test Parameter Testing Standard Conditions Fuel Location Urban Driving U.S. FTP-72 STP ULSD ERMS (Ottawa, ON) Highway Driving U.S. HWFET STP ULSD ERMS (Ottawa, ON) Aggressive Driving US06 STP ULSD ERMS (Ottawa, ON) Electrical Load U.S. SC03 STP ULSD ERMS (Ottawa, ON) Urban Driving U.S. FTP-72 -7°C ULSD ERMS (Ottawa, ON) Steady-State Internal 15°C ULSD NRC IFCI (Vancouver, BC) Steady-State Internal 0°C ULSD NRC IFCI (Vancouver, BC) Steady-State Internal -15°C ULSD NRC IFCI (Vancouver, BC) Steady-State Internal -30°C ULSD NRC IFCI (Vancouver, BC)
Table 2: Chassis Dynamometer Test Listing
10
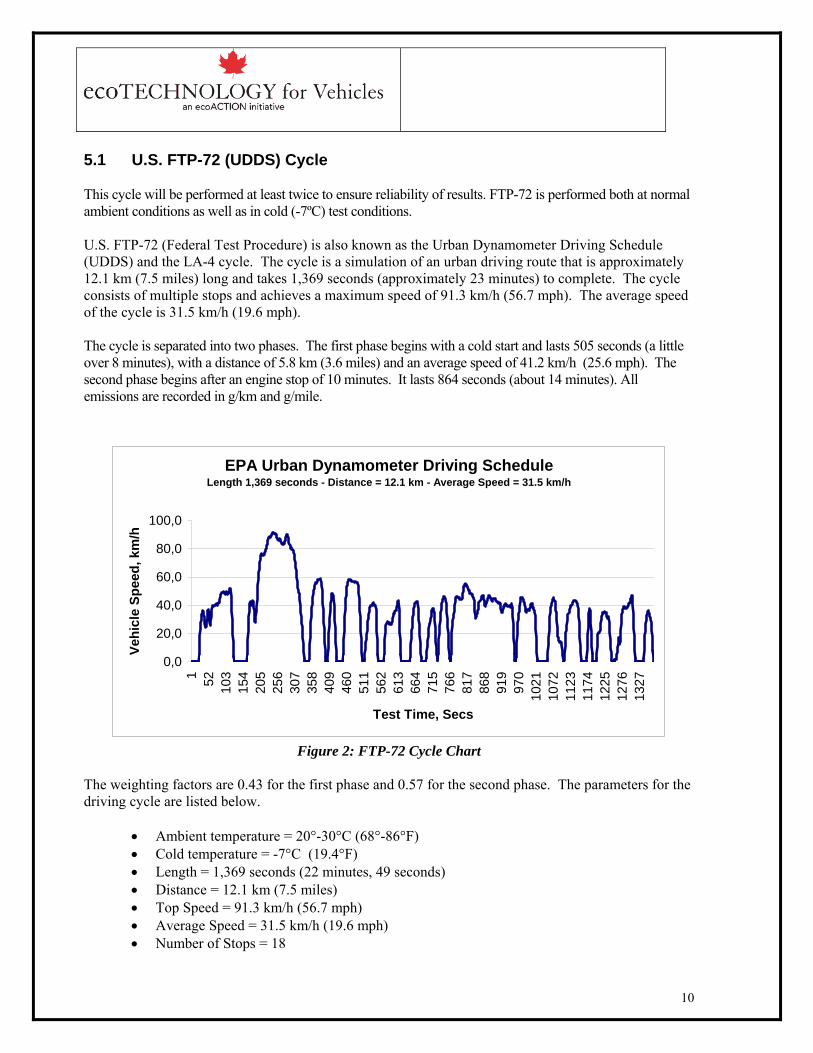
5.1 U.S. FTP-72 (UDDS) Cycle This cycle will be performed at least twice to ensure reliability of results. FTP-72 is performed both at normal ambient conditions as well as in cold (-7ºC) test conditions.
U.S. FTP-72 (Federal Test Procedure) is also known as the Urban Dynamometer Driving Schedule (UDDS) and the LA-4 cycle. The cycle is a simulation of an urban driving route that is approximately 12.1 km (7.5 miles) long and takes 1,369 seconds (approximately 23 minutes) to complete. The cycle consists of multiple stops and achieves a maximum speed of 91.3 km/h (56.7 mph). The average speed of the cycle is 31.5 km/h (19.6 mph). The cycle is separated into two phases. The first phase begins with a cold start and lasts 505 seconds (a little over 8 minutes), with a distance of 5.8 km (3.6 miles) and an average speed of 41.2 km/h (25.6 mph). The second phase begins after an engine stop of 10 minutes. It lasts 864 seconds (about 14 minutes). All emissions are recorded in g/km and g/mile.
EPA Urban Dynamometer Driving ScheduleLength 1,369 seconds - Distance = 12.1 km - Average Speed = 31.5 km/h
0,0
20,0
40,0
60,0
80,0
100,0
1 52 103
154
205
256
307
358
409
460
511
562
613
664
715
766
817
868
919
970
1021
1072
1123
1174
1225
1276
1327
Test Time, Secs
Vehi
cle
Spee
d, k
m/h
Figure 2: FTP-72 Cycle Chart
The weighting factors are 0.43 for the first phase and 0.57 for the second phase. The parameters for the driving cycle are listed below.
• Ambient temperature = 20°-30°C (68°-86°F) • Cold temperature = -7°C (19.4°F) • Length = 1,369 seconds (22 minutes, 49 seconds) • Distance = 12.1 km (7.5 miles) • Top Speed = 91.3 km/h (56.7 mph) • Average Speed = 31.5 km/h (19.6 mph) • Number of Stops = 18
11
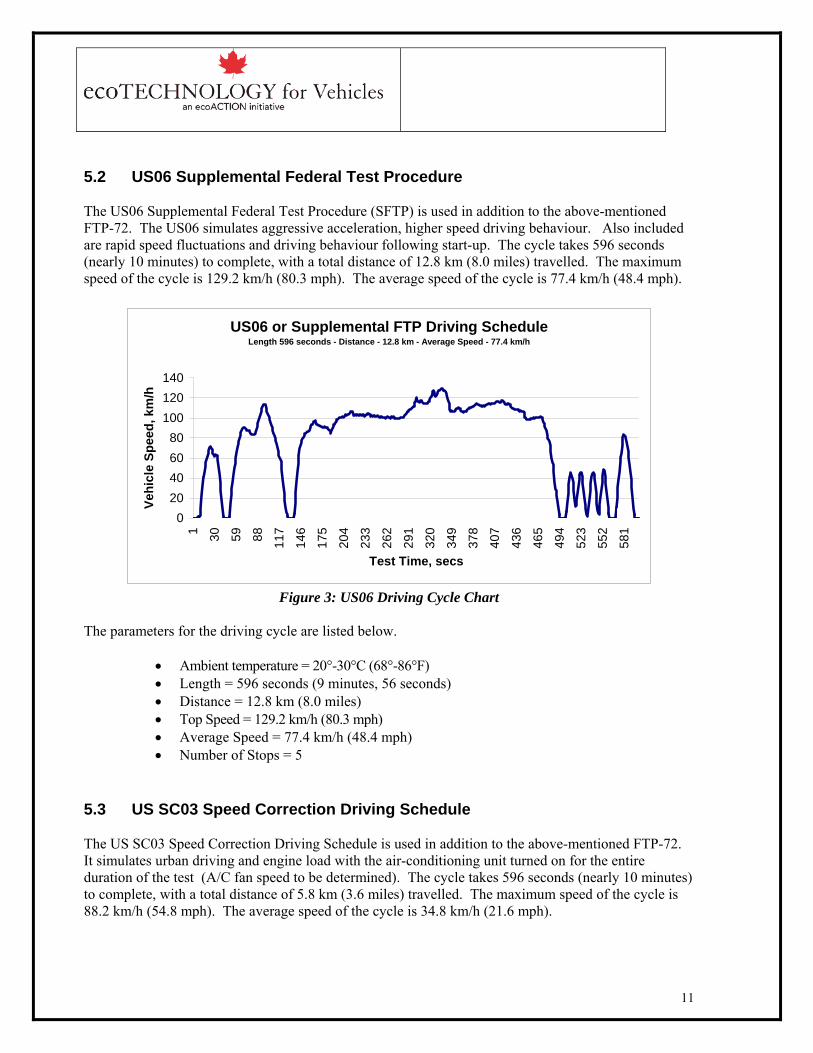
5.2 US06 Supplemental Federal Test Procedure The US06 Supplemental Federal Test Procedure (SFTP) is used in addition to the above-mentioned FTP-72. The US06 simulates aggressive acceleration, higher speed driving behaviour. Also included are rapid speed fluctuations and driving behaviour following start-up. The cycle takes 596 seconds (nearly 10 minutes) to complete, with a total distance of 12.8 km (8.0 miles) travelled. The maximum speed of the cycle is 129.2 km/h (80.3 mph). The average speed of the cycle is 77.4 km/h (48.4 mph).
US06 or Supplemental FTP Driving ScheduleLength 596 seconds - Distance - 12.8 km - Average Speed - 77.4 km/h
020406080
100120140
1 30 59 88 117
146
175
204
233
262
291
320
349
378
407
436
465
494
523
552
581
Test Time, secs
Vehi
cle
Spee
d, k
m/h
Figure 3: US06 Driving Cycle Chart
The parameters for the driving cycle are listed below.
• Ambient temperature = 20°-30°C (68°-86°F) • Length = 596 seconds (9 minutes, 56 seconds) • Distance = 12.8 km (8.0 miles) • Top Speed = 129.2 km/h (80.3 mph) • Average Speed = 77.4 km/h (48.4 mph) • Number of Stops = 5
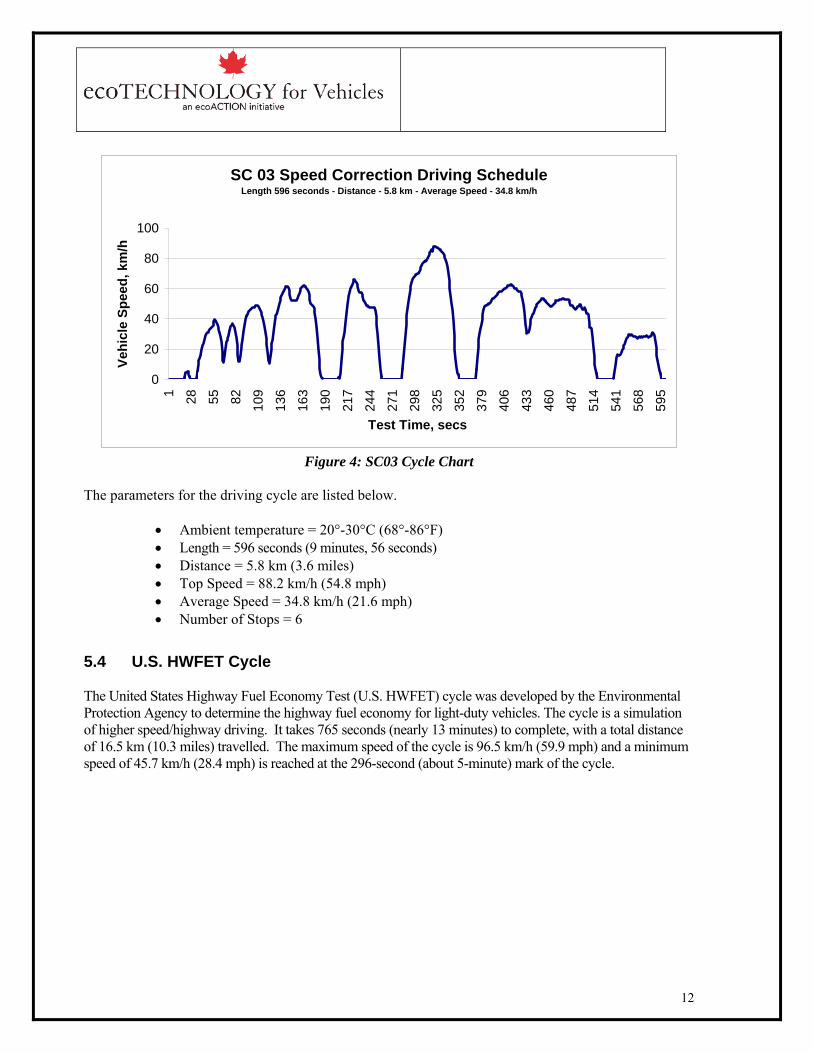
5.3 US SC03 Speed Correction Driving Schedule The US SC03 Speed Correction Driving Schedule is used in addition to the above-mentioned FTP-72. It simulates urban driving and engine load with the air-conditioning unit turned on for the entire duration of the test (A/C fan speed to be determined). The cycle takes 596 seconds (nearly 10 minutes) to complete, with a total distance of 5.8 km (3.6 miles) travelled. The maximum speed of the cycle is 88.2 km/h (54.8 mph). The average speed of the cycle is 34.8 km/h (21.6 mph).
12
SC 03 Speed Correction Driving ScheduleLength 596 seconds - Distance - 5.8 km - Average Speed - 34.8 km/h
0
20
40
60
80
100
1 28 55 82 109
136
163
190
217
244
271
298
325
352
379
406
433
460
487
514
541
568
595
Test Time, secs
Vehi
cle
Spee
d, k
m/h
Figure 4: SC03 Cycle Chart
The parameters for the driving cycle are listed below.
• Ambient temperature = 20°-30°C (68°-86°F) • Length = 596 seconds (9 minutes, 56 seconds) • Distance = 5.8 km (3.6 miles) • Top Speed = 88.2 km/h (54.8 mph) • Average Speed = 34.8 km/h (21.6 mph) • Number of Stops = 6
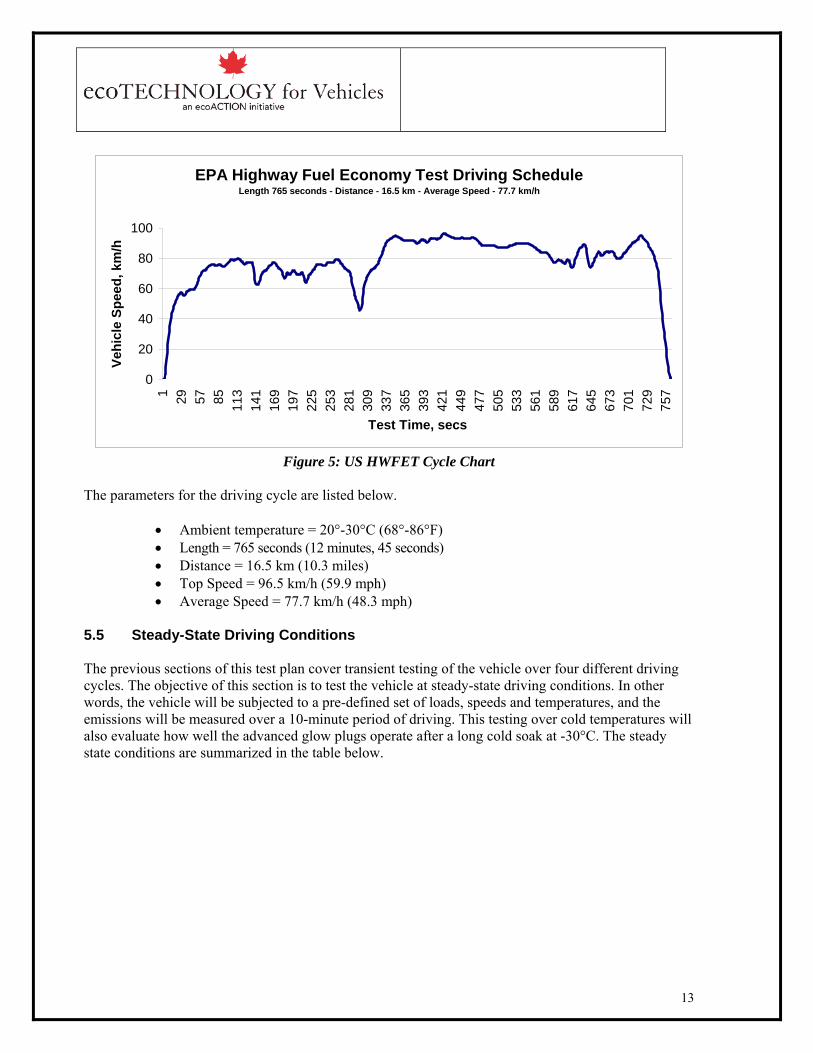
5.4 U.S. HWFET Cycle The United States Highway Fuel Economy Test (U.S. HWFET) cycle was developed by the Environmental Protection Agency to determine the highway fuel economy for light-duty vehicles. The cycle is a simulation of higher speed/highway driving. It takes 765 seconds (nearly 13 minutes) to complete, with a total distance of 16.5 km (10.3 miles) travelled. The maximum speed of the cycle is 96.5 km/h (59.9 mph) and a minimum speed of 45.7 km/h (28.4 mph) is reached at the 296-second (about 5-minute) mark of the cycle.
13
EPA Highway Fuel Economy Test Driving ScheduleLength 765 seconds - Distance - 16.5 km - Average Speed - 77.7 km/h
0
20
40
60
80
100
1 29 57 85 113
141
169
197
225
253
281
309
337
365
393
421
449
477
505
533
561
589
617
645
673
701
729
757
Test Time, secs
Vehi
cle
Spee
d, k
m/h
Figure 5: US HWFET Cycle Chart
The parameters for the driving cycle are listed below.
• Ambient temperature = 20°-30°C (68°-86°F) • Length = 765 seconds (12 minutes, 45 seconds) • Distance = 16.5 km (10.3 miles) • Top Speed = 96.5 km/h (59.9 mph) • Average Speed = 77.7 km/h (48.3 mph)
5.5 Steady-State Driving Conditions The previous sections of this test plan cover transient testing of the vehicle over four different driving cycles. The objective of this section is to test the vehicle at steady-state driving conditions. In other words, the vehicle will be subjected to a pre-defined set of loads, speeds and temperatures, and the emissions will be measured over a 10-minute period of driving. This testing over cold temperatures will also evaluate how well the advanced glow plugs operate after a long cold soak at -30°C. The steady state conditions are summarized in the table below.
14
Test Temperature Speed Load
15°C
20 km/h 5 hp, 15 hp, 25 hp 40 km/h 5 hp, 15 hp, 25 hp 60 km/h 5 hp, 15 hp, 25 hp 80 km/h 5 hp, 15 hp, 25 hp
0°C
20 km/h 5 hp, 15 hp, 25 hp 40 km/h 5 hp, 15 hp, 25 hp 60 km/h 5 hp, 15 hp, 25 hp 80 km/h 5 hp, 15 hp, 25 hp
-15°C
20 km/h 5 hp, 15 hp, 25 hp 40 km/h 5 hp, 15 hp, 25 hp 60 km/h 5 hp, 15 hp, 25 hp 80 km/h 5 hp, 15 hp, 25 hp
-30°C
20 km/h 5 hp, 15 hp, 25 hp 40 km/h 5 hp, 15 hp, 25 hp 60 km/h 5 hp, 15 hp, 25 hp 80 km/h 5 hp, 15 hp, 25 hp
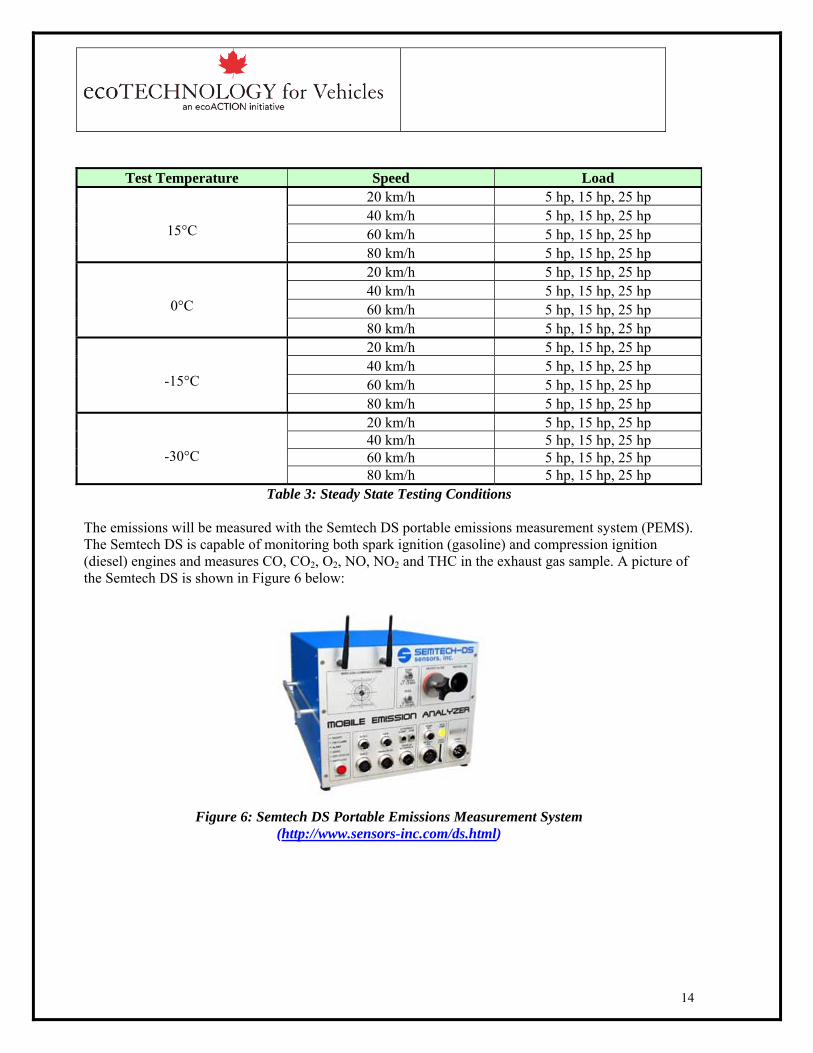
Table 3: Steady State Testing Conditions The emissions will be measured with the Semtech DS portable emissions measurement system (PEMS). The Semtech DS is capable of monitoring both spark ignition (gasoline) and compression ignition (diesel) engines and measures CO, CO2, O2, NO, NO2 and THC in the exhaust gas sample. A picture of the Semtech DS is shown in Figure 6 below:
Figure 6: Semtech DS Portable Emissions Measurement System
(http://www.sensors-inc.com/ds.html)
15
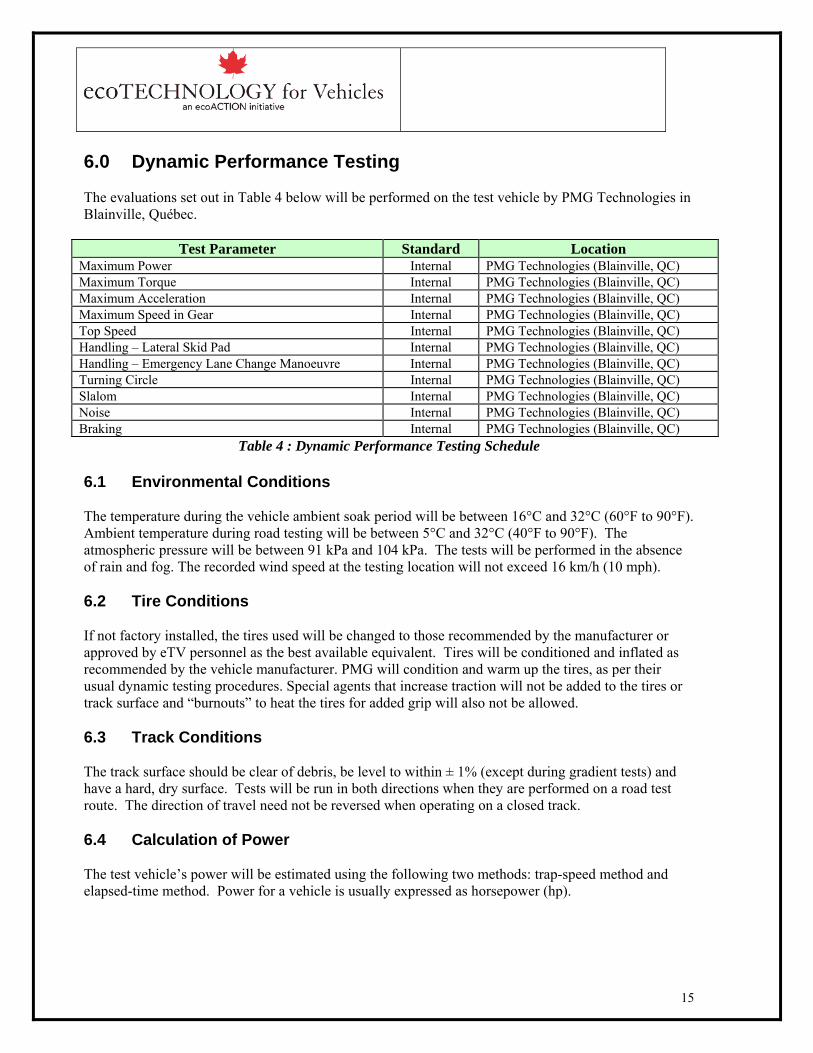
6.0 Dynamic Performance Testing The evaluations set out in Table 4 below will be performed on the test vehicle by PMG Technologies in Blainville, Québec.
Test Parameter Standard Location Maximum Power Internal PMG Technologies (Blainville, QC) Maximum Torque Internal PMG Technologies (Blainville, QC) Maximum Acceleration Internal PMG Technologies (Blainville, QC) Maximum Speed in Gear Internal PMG Technologies (Blainville, QC) Top Speed Internal PMG Technologies (Blainville, QC) Handling – Lateral Skid Pad Internal PMG Technologies (Blainville, QC) Handling – Emergency Lane Change Manoeuvre Internal PMG Technologies (Blainville, QC) Turning Circle Internal PMG Technologies (Blainville, QC) Slalom Internal PMG Technologies (Blainville, QC) Noise Internal PMG Technologies (Blainville, QC) Braking Internal PMG Technologies (Blainville, QC)
Table 4 : Dynamic Performance Testing Schedule 6.1 Environmental Conditions The temperature during the vehicle ambient soak period will be between 16°C and 32°C (60°F to 90°F). Ambient temperature during road testing will be between 5°C and 32°C (40°F to 90°F). The atmospheric pressure will be between 91 kPa and 104 kPa. The tests will be performed in the absence of rain and fog. The recorded wind speed at the testing location will not exceed 16 km/h (10 mph).
6.2 Tire Conditions If not factory installed, the tires used will be changed to those recommended by the manufacturer or approved by eTV personnel as the best available equivalent. Tires will be conditioned and inflated as recommended by the vehicle manufacturer. PMG will condition and warm up the tires, as per their usual dynamic testing procedures. Special agents that increase traction will not be added to the tires or track surface and “burnouts” to heat the tires for added grip will also not be allowed.
6.3 Track Conditions The track surface should be clear of debris, be level to within ± 1% (except during gradient tests) and have a hard, dry surface. Tests will be run in both directions when they are performed on a road test route. The direction of travel need not be reversed when operating on a closed track.
6.4 Calculation of Power The test vehicle’s power will be estimated using the following two methods: trap-speed method and elapsed-time method. Power for a vehicle is usually expressed as horsepower (hp).
16
6.4.1 Trap-Speed Method
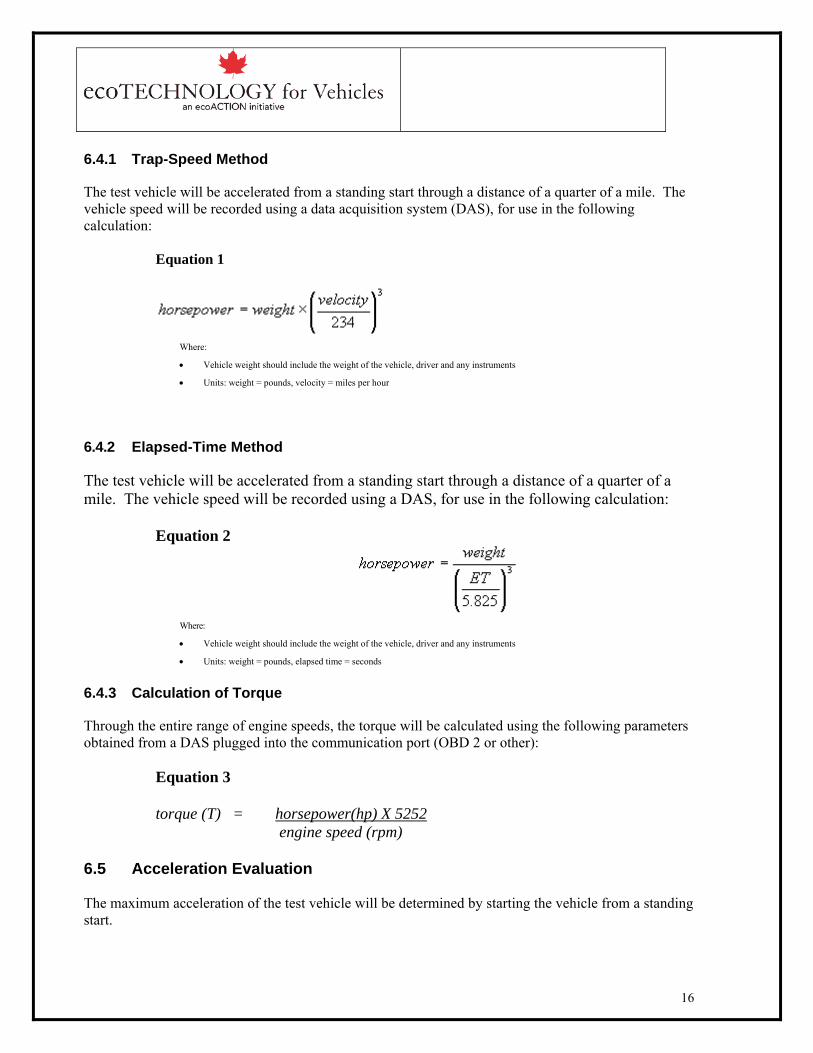
The test vehicle will be accelerated from a standing start through a distance of a quarter of a mile. The vehicle speed will be recorded using a data acquisition system (DAS), for use in the following calculation:
Equation 1
Where:
• Vehicle weight should include the weight of the vehicle, driver and any instruments
• Units: weight = pounds, velocity = miles per hour
6.4.2 Elapsed-Time Method
The test vehicle will be accelerated from a standing start through a distance of a quarter of a mile. The vehicle speed will be recorded using a DAS, for use in the following calculation:
Equation 2
Where:
• Vehicle weight should include the weight of the vehicle, driver and any instruments
• Units: weight = pounds, elapsed time = seconds
6.4.3 Calculation of Torque
Through the entire range of engine speeds, the torque will be calculated using the following parameters obtained from a DAS plugged into the communication port (OBD 2 or other):
Equation 3
torque (T) = horsepower(hp) X 5252 engine speed (rpm)
6.5 Acceleration Evaluation The maximum acceleration of the test vehicle will be determined by starting the vehicle from a standing start.
17
• The vehicle will be evaluated by accelerating to the maximum attainable speed in a quarter of a mile (1,320 ft).
• The vehicle will be evaluated by accelerating to the maximum attainable speed in a kilometre (1,000 m).
Speed points will be recorded beginning at 0 km/h and in 10-km/h intervals thereafter, to the maximum speed attained. Time versus distance travelled will also be recorded using a DAS. The maximum acceleration of the test vehicle will be determined by starting the vehicle from a rolling start.
• The vehicle will be evaluated by accelerating to a velocity of 8 km/h (5 mph). At the minimum required velocity, the throttle will be depressed “full open”. Acceleration will continue until a maximum velocity of 98 km/h (60 mph) is reached.
6.5.1 Manual Transmission
The acceleration of the test vehicle will be determined by starting the vehicle from a standing start. The vehicle will be evaluated in gears two and higher by accelerating in each gear to a selected speed interval. Upshifting will occur at the engine’s red line. Short shifting may also occur, depending on the amount of torque that the engine produces. 6.6 Maximum Speed in Gear The maximum speed attainable in each gear will be tested and recorded. The driver will start from a standing start for first gear only. The vehicle will be accelerated, changing gears only when the vehicle’s engine speed has reached its maximum peak rpm – as indicated by the tachometer or by the DAS if calibrated correctly – with no increase in revolutions per minute for at least three seconds. The maximum speed and revolutions per minute for each gear will be recorded. 6.7 Top Speed The overall top speed will be tested and recorded. The vehicle’s speed will be recorded from the DAS and not the vehicle’s speedometer. Because the vehicle’s top speed is affected by wind, this test will be run in both directions and averaged. The highest speed occurring at the red line of the gear will be noted as “red line limited”; if the highest speed occurs before the red line, it will be noted as “drag limited”. If an electronic governor is used, the top speed will be recorded at the electronically limited speed. The top speed will be recorded in the top two gears, as the final gear is usually intended for cruising. 6.8 Handling 6.8.1 Lateral Skid Pad
The lateral skid pad test will be used to determine the maximum speed that the test vehicle can achieve in a cornering situation. Lateral acceleration is measured in Gs, where 1.0 G is equal to the net effect of this acceleration and the acceleration imparted by natural gravity. When the vehicle reaches its
18
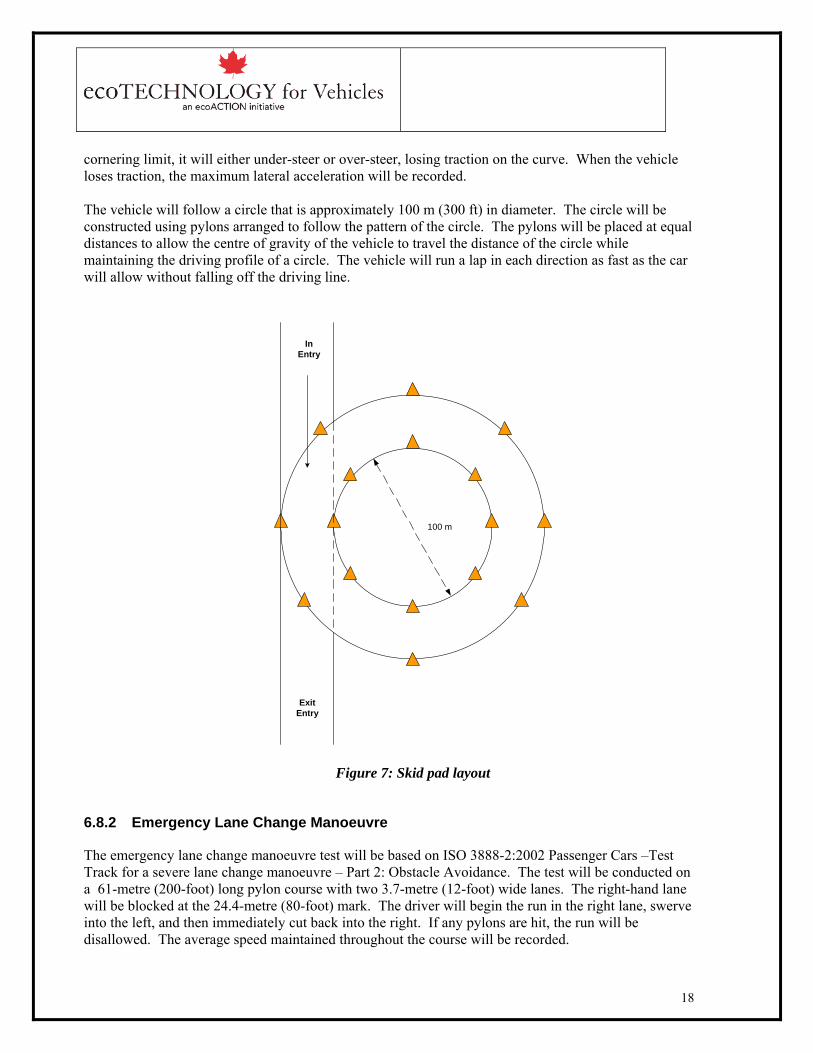
cornering limit, it will either under-steer or over-steer, losing traction on the curve. When the vehicle loses traction, the maximum lateral acceleration will be recorded. The vehicle will follow a circle that is approximately 100 m (300 ft) in diameter. The circle will be constructed using pylons arranged to follow the pattern of the circle. The pylons will be placed at equal distances to allow the centre of gravity of the vehicle to travel the distance of the circle while maintaining the driving profile of a circle. The vehicle will run a lap in each direction as fast as the car will allow without falling off the driving line.
100 m
InEntry
ExitEntry
Figure 7: Skid pad layout
6.8.2 Emergency Lane Change Manoeuvre
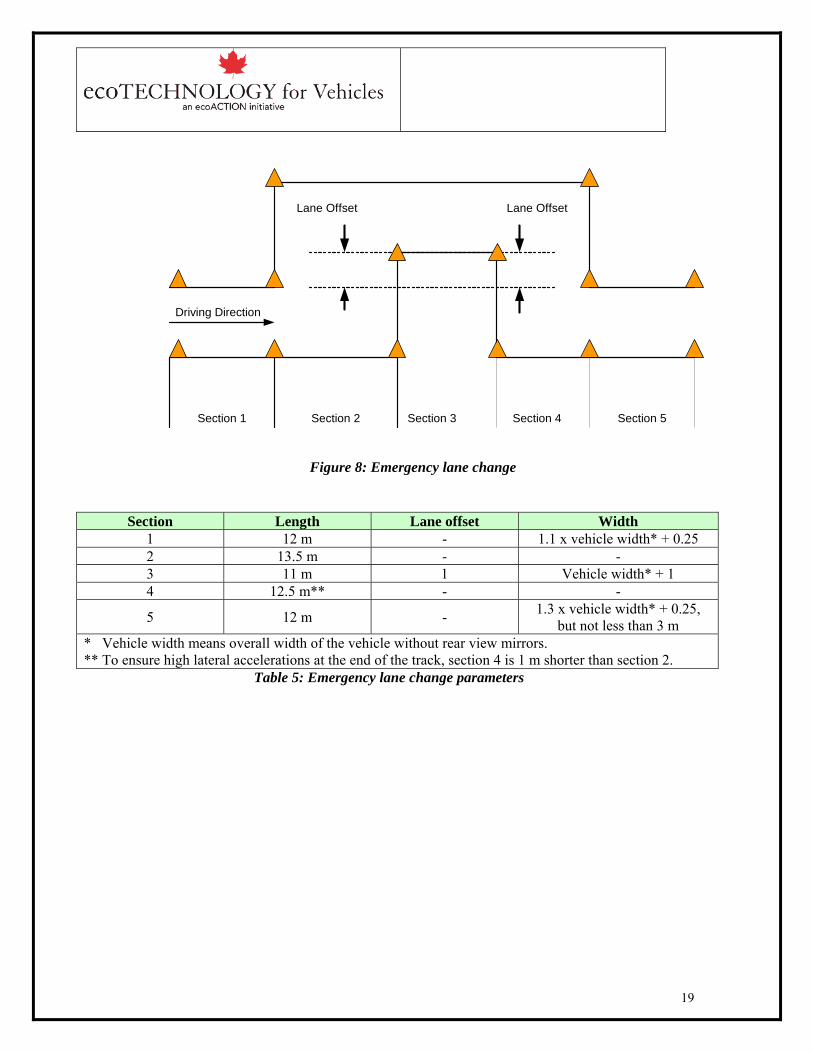
The emergency lane change manoeuvre test will be based on ISO 3888-2:2002 Passenger Cars –Test Track for a severe lane change manoeuvre – Part 2: Obstacle Avoidance. The test will be conducted on a 61-metre (200-foot) long pylon course with two 3.7-metre (12-foot) wide lanes. The right-hand lane will be blocked at the 24.4-metre (80-foot) mark. The driver will begin the run in the right lane, swerve into the left, and then immediately cut back into the right. If any pylons are hit, the run will be disallowed. The average speed maintained throughout the course will be recorded.
19
Lane Offset Lane Offset
Section 1 Section 2 Section 3 Section 4 Section 5
Driving Direction
Figure 8: Emergency lane change
Section Length Lane offset Width 1 12 m - 1.1 x vehicle width* + 0.25 2 13.5 m - - 3 11 m 1 Vehicle width* + 1 4 12.5 m** - -
5 12 m - 1.3 x vehicle width* + 0.25, but not less than 3 m
* Vehicle width means overall width of the vehicle without rear view mirrors. ** To ensure high lateral accelerations at the end of the track, section 4 is 1 m shorter than section 2.
Table 5: Emergency lane change parameters
20
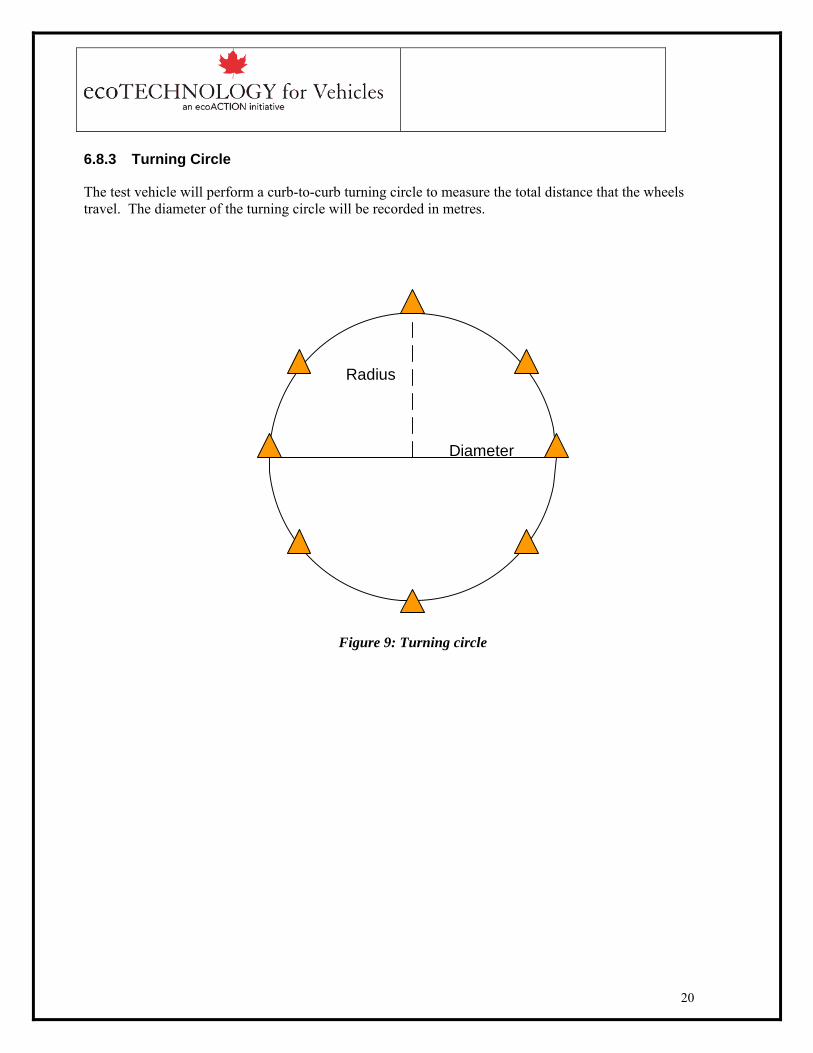
6.8.3 Turning Circle
The test vehicle will perform a curb-to-curb turning circle to measure the total distance that the wheels travel. The diameter of the turning circle will be recorded in metres.
Diameter
Radius
Figure 9: Turning circle
21
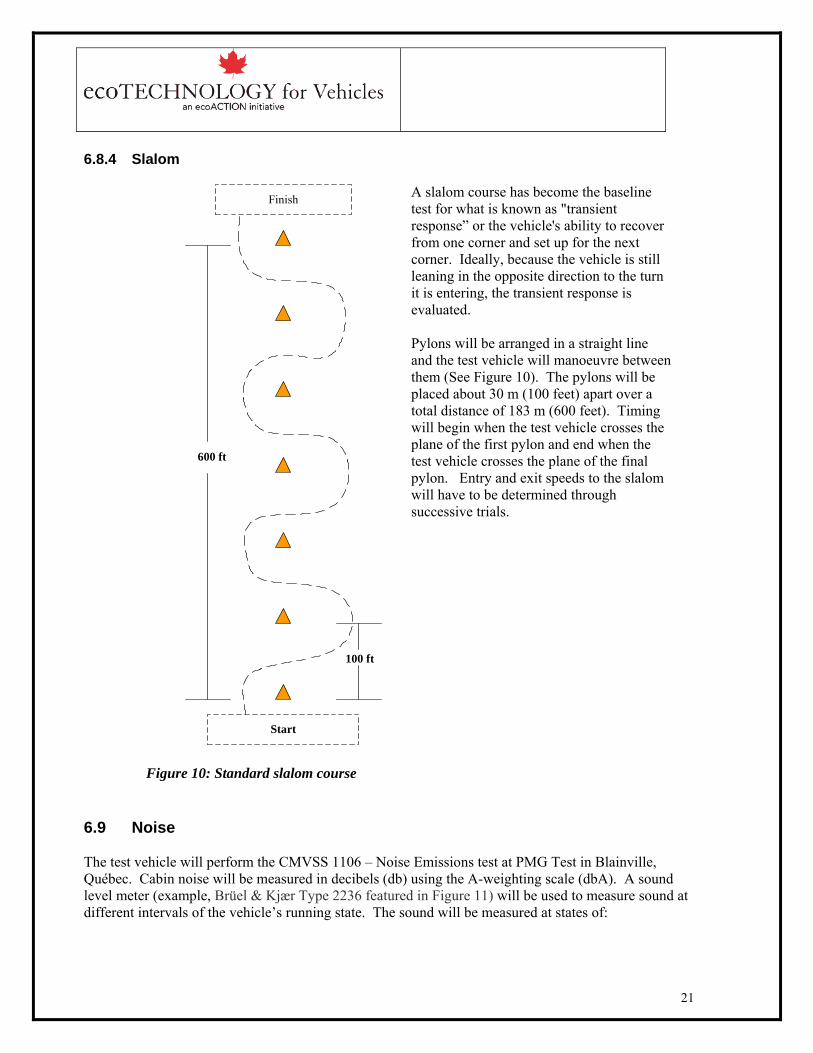
6.8.4 Slalom
100 ft
600 ft
Start
Finish
Figure 10: Standard slalom course
A slalom course has become the baseline test for what is known as "transient response” or the vehicle's ability to recover from one corner and set up for the next corner. Ideally, because the vehicle is still leaning in the opposite direction to the turn it is entering, the transient response is evaluated.
Pylons will be arranged in a straight line and the test vehicle will manoeuvre between them (See Figure 10). The pylons will be placed about 30 m (100 feet) apart over a total distance of 183 m (600 feet). Timing will begin when the test vehicle crosses the plane of the first pylon and end when the test vehicle crosses the plane of the final pylon. Entry and exit speeds to the slalom will have to be determined through successive trials.
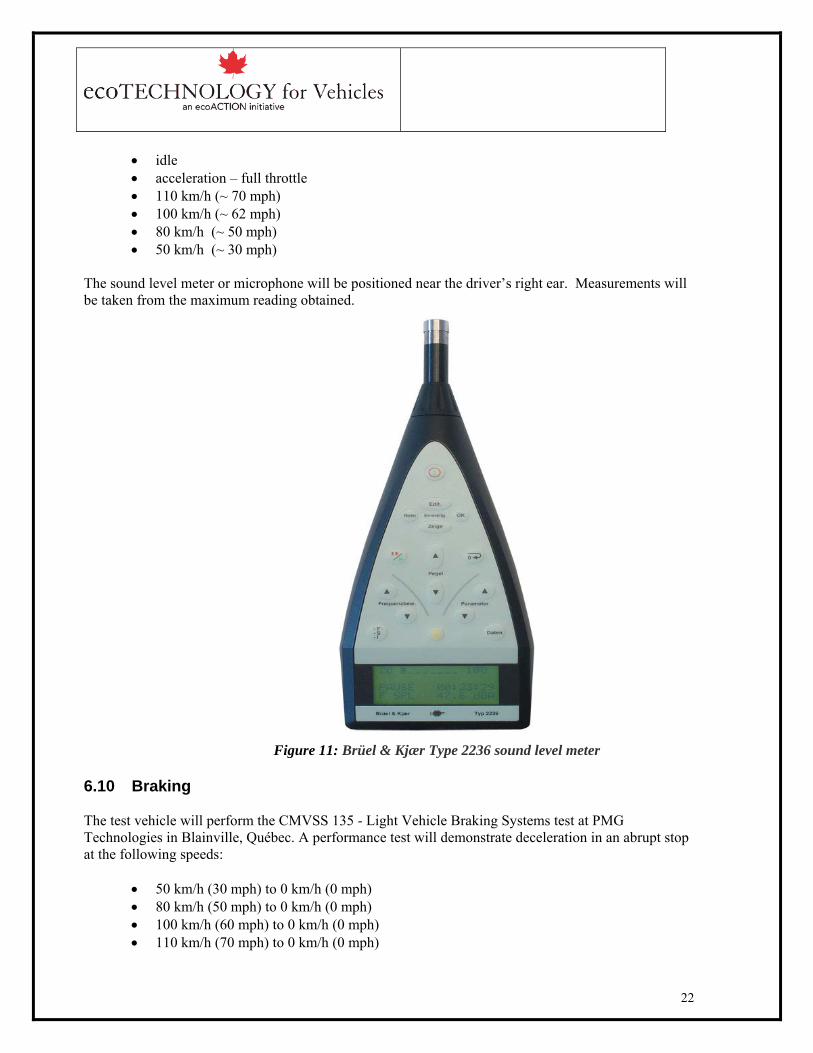
6.9 Noise The test vehicle will perform the CMVSS 1106 – Noise Emissions test at PMG Test in Blainville, Québec. Cabin noise will be measured in decibels (db) using the A-weighting scale (dbA). A sound level meter (example, Brüel & Kjær Type 2236 featured in Figure 11) will be used to measure sound at different intervals of the vehicle’s running state. The sound will be measured at states of:
22
• idle • acceleration – full throttle • 110 km/h (~ 70 mph) • 100 km/h (~ 62 mph) • 80 km/h (~ 50 mph) • 50 km/h (~ 30 mph)
The sound level meter or microphone will be positioned near the driver’s right ear. Measurements will be taken from the maximum reading obtained.
Figure 11: Brüel & Kjær Type 2236 sound level meter
6.10 Braking The test vehicle will perform the CMVSS 135 - Light Vehicle Braking Systems test at PMG Technologies in Blainville, Québec. A performance test will demonstrate deceleration in an abrupt stop at the following speeds:
• 50 km/h (30 mph) to 0 km/h (0 mph) • 80 km/h (50 mph) to 0 km/h (0 mph) • 100 km/h (60 mph) to 0 km/h (0 mph) • 110 km/h (70 mph) to 0 km/h (0 mph)

23
The vehicles total braking distance in metres and time in seconds will be recorded. Since the test vehicle is equipped with ABS brakes, the test driver will fully depress the brake pedal, allowing the computer to modulate the callipers. 6.11 Test Instrumentation An instrument to measure vehicle speed as a function of elapsed time will be used in all of the procedures described in Section 6. As with all equipment used during testing, the device must meet the following specifications: • Be installed so that it does not hinder the driver or alter the operating characteristics of the vehicle; • Be NIST traceable. The following conditions must be met for each of the parameters listed below:
Atmospheric Conditions (using a barometer) Accuracy ± 0.7 kPa or ± 0.2 inches of Hg
Temperature
Accuracy ± 1 °C (± 2°F) Resolution 1°C (2°F)
Time
Accuracy ± 0.1% of total coast down time interval Resolution 0.1 seconds
Tire Pressure (tire pressure gauge) Accuracy ± 3 kPa (± 0.5 psi) Speed
Accuracy ± 0.4 km/h (± 0.25 mph) Resolution ± 0.2 km/h (0.1 mph)
Vehicle Weight
Accuracy ± 5 kg (± 10 lb) per axle Wind
Determination of average longitudinal and crosswind components to within an accuracy of ± 1.6 km/hr (± 1 mph)
24
6.12 Records The following test parameters will be recorded for all of the procedures described in Section 6:
• Ambient temperature • Barometric pressure • Date and time of test • Damage (if applicable) • Deviations from any procedures • Drive train ratios and those used during testing • Duration of test, start and end • Overall vehicle dimensions • Tire pressure (to be recorded before and after each test) • Test weight (including passengers, cargo and DAS equipment) • Vehicle accumulated mileage at the start and end of testing • Vehicle’s direction of travel • Vehicle identification • Vehicle’s speed (vs. time, as recorded by DAS) • Wind direction (hourly average) • Wind speed (hourly average)
7.0 Applicable Publications The following publications provide the specifications as indicated. While different versions may exist, only the latest version available at the time of writing this document is cited below.
7.1 SAE Publications Available from Society of Automotive Engineers, 400 Commonwealth Drive, Warrendale, PA 15096-0001. http://www.sae.org SAE J 1263 Road Load Measurement and Dynamometer Simulation Using Coastdown Techniques SAE J 1470 Measurement of Noise Emitted by Accelerating Highway Vehicles SAE J 1492 Measurements of Light Vehicle Stationary Exhaust System Sound Level Engine Sweep
Method
25
7.2 Code of Federal Regulations Available from the Superintendent of Documents, U.S. Government Printing Office, Washington, DC 20402 http://www.gpoaccess.gov/cfr/index.html
40CFR 86 – EPA; Control of Emissions from New and In-Use Highway Vehicles and Engines; Certification and Test Procedures
40CFR 600 – EPA; Fuel Economy of Motor Vehicles
7.3 Motor Vehicle Safety Standards Available from the Department of Transport, Federal Government of Canada. http://www.tc.gc.ca/roadsafety/mvstm_tsd/index_e.htm
CMVSS 135 Light Vehicle Brake Systems CMVSS 214 Side Door Strength CMVSS 216 Roof Intrusion Protection CMVSS 209 Seat Belt Assemblies CMVSS 305 Fuel System Integrity CMVSS 1106 Noise Emissions
7.4 International Organization for Standardization Available at http://www.iso.org/iso/iso_catalogue/catalogue_tc/catalogue_detail.htm?csnumber=31310
ISO 3888-2:2002 Passenger cars – Test track for a severe lane-change manoeuvre Part 2: Obstacle avoidance
7.5 American Society of Testing and Materials (ASTM) Available from the American Society of Testing and Materials (ASTM) 100 Barr Harbor Drive, West Conshohocken, Pennsylvania, USA. http://www1.eere.energy.gov/vehiclesandfuels/avta/light_duty/hicev/hicev_tests.html
ASTM D6751 Standard Specification for Biodiesel Fuel Blend Stock (B100) for Middle Distillate Fuels