Embed Size (px)
Citation preview

11/18/2016
1
RenAAPro – The cost effective solution to optimizing Lys and Met supply
Shane Fredin, PhD
Presentation Outline
1. Overview of Smartamine M
2. “Methionine: More than milk” story
3. Amino acid (AA) balancing economics
4. Ration examples with RenAAPro

11/18/2016
2
CH3 – S – (CH2)2 – CH – C
|
NH2
//
\
O
OH
Encapsulated Methionine (DL-Met)
Methionine and Methionine Analogs
Smartamine M contains a core of DL-Met plus ethylcellulose
covered with a coat of stearic acid containing small amounts
of poly-2-vinylpyridine-co-styrene
Bioavailability of Smartamine M
Original plasma free AA dose-response study
Actual bioavailability:
Smartamine M – 82.8%
Chirgwin et al. 2015

11/18/2016
3
Bioavailability of Smartamine M
• 2 replicated 5 × 5 Latin square design (10 cows)
• 30 g/d dose of Methionine from four products
1) Smartamine M from original plant (UDS)
2) Smartamine M from new plant (SmartUP)
3) Mepron
4) AminoShure M
• Products fed 3 times daily (0500, 1300, and 2100 h) in equal portions
• Diets formulated to be methionine deficient (~12 g of Metabolizable Met)
• 7 day periods
• Measurements collected last 3 days of each period
1) DMI, milk yield and composition
2) Blood sampling from tail vein (0700, 0900, 1100, 1300 h)
Whitehouse et al., 2016
Bioavailability of Smartamine M
Relative bioavailability:
SmartUP – 100%
Mepron – 28%
Aminoshure M – 22%
Actual bioavailability:
UDS – 80%
SmartUP – 80%
Mepron – 22.4%
Aminoshure M – 17.6%

11/18/2016
4
Bioavailability of Smartamine M
Methionine levels, g/d
Item 0 g 30 g SEM P-value
DMI, lb/d
UDS 60.8 60.8 0.95 0.75
SmartUP 60.8 60.4 1.24 0.79
Mepron 60.8 59.9 0.95 0.42
AminoShure M 60.8 60.6 1.24 0.77
Milk yield, lb/d
UDS 102.2 102.9 1.77 0.62
SmartUP 102.2 103.1 1.70 0.55
Mepron 102.2 99.5 1.92 0.27
AminoShure M 102.2 101.3 2.46 0.73
Whitehouse et al., 2016
Bioavailability of Smartamine M
Methionine levels, g/d
Item 0 g 30 g SEM P-value
Protein %
UDS 2.87 3.00 0.04 <0.01
SmartUP 2.87 2.98 0.03 <0.01
Mepron 2.87 2.93 0.03 0.01
AminoShure M 2.87 2.89 0.03 0.50
Protein yield, lb/d
UDS 2.92 3.07 0.03 0.04
SmartUP 2.92 3.07 0.03 0.03
Mepron 2.92 2.90 0.03 0.77
AminoShure M 2.92 2.92 0.04 0.95
Whitehouse et al., 2016

11/18/2016
5
Presentation Outline
1. Overview of Smartamine M
2. “Methionine: More than milk” story
3. Amino acid (AA) balancing economics
4. Ration examples with RenAAPro
2012 and 2014 Dairy Industry Survey
A dairy industry survey was conducted through Dairy Herd Management in in 2012
and 2014
The purpose of the survey is to gain insight into the amino acid balancing opinions
in the dairy industry.
796 nutritionists, producers and DVM’s 678 nutritionists, DVMs, and producers
2014 Participants

11/18/2016
6
Nutritionists and producers were asked the same question:
Rank the benefits of amino acid balancing
Nutritionists highest rankings
were for more milk protein,
milk volume, and MP efficiency
2012
2014
Nutritionists and producers were asked the same question:
Rank the benefits of Amino Acid balancing
Producers highest rankings were
for improved reproduction, fewer
transition cow problems and
increased milk volume
2012
2014

11/18/2016
7
“Required Amino Acids”:
Milk production
Milk composition
Reduce CP in the diet
“FUNCTIONAL” Amino Acids
Transition:
- Health
Reproduction:
-Embryo survival
Genetics:
- Gene expression
19
70
’s to
20
10
’s2
01
0’s
an
d fo
rdw
ard
Methionine: More than Milk
Control (Con)
Con + MS
Con + SM
Calving
Control (Con)
Con + SM
Con + MS
Osorio et al. (2013, 2014a,b, 2015)

11/18/2016
8
Diets fed during the close-up and early lactation period
Close-up Lactation
Corn silage 35.9 33.0
Alfalfa silage 8.2 5.0
Alfalfa hay 3.5 4.0
Wheat straw 15.4 4.0
Cottonseed --- 3.5
Wet brewers grains 6.0 10.0
Ground shelled corn 13.0 22.2
Soy hulls 4.0 4.0
SBM, 48% CP 3.1 3.3
Expeller SBM 2.0 6.2
SoyChlor 3.8 ---
Blood meal 1.0 0.3
Urea 0.3 0.14
Rumen-inert fat --- 1.0
NRC (2001) evaluation of diets(based on actual DMI)
Close-up Lactation
CON MS SM CON MS SM
CP, % 15.1 15.1 15.1 17.4 17.4 17.4
RDP, % 10.0 10.0 10.0 10.9 10.7 10.6
RUP, % 5.1 5.1 5.1 6.5 6.7 6.8
MP supplied, g 1,191 1,248 1,208 1,535 1,745 1,790
Lys, % MP 6.66 6.60 6.62 6.17 6.09 6.06
Met, % MP 1.86 2.35 2.38 1.81 2.15 2.15
MP-Lys, g 79 82 80 96 110 113
MP-Met, g 22 29 29 28 39 40
Lys/Met 3.59/1 2.82/1 2.76/1 3.43/1 2.82/1 2.82/1
CON = Control diet; MS = MetaSmart (0.19% of DMI); SM = Smartamine M (0.07% of DMI)

11/18/2016
9
DMI – Pre and Post calving
Day relative to calving Day relative to calving
Diet P = 0.67
Time P <.001
DxT P = 0.42
Diet P = 0.18
Time P <.001
DxT P = 0.78
Met P = 0.06
Control
MetaSmart
Smartamine
Met = Control vs MetaSmart + Smartamine
ECM: Energy Corrected Milk
Met: Contrast statement of Control vs. MetaSmart + Smartamine M
Results: DMI, milk production and composition
Osorio et al. 2013 J Dairy Sci. 96:6248
Osorio et al. (2013)
Treatment P-value
Item CON MS SM Met
DMI, lb/d 29.4 33.6 34.5 0.06
Milk, lb/d 78.6 83.9 88.1 0.08
Milk protein, % 3.04 3.26 3.19 0.05
Milk fat, % 4.27 4.68 4.09 0.36
ECM, lb/d 90.3 98.6 99.1 0.03

11/18/2016
10
Frequency of occurrence of health problems
Diet
CON MS SM
Assigned cows 24 15 17
Cows removed 10 3 4
Twins 2 0 1
Ketosis 6 1 2
Displaced
abomasum
3 2 2
Retained placenta 0 1 1
Cows completing
study
14 12 13
Osorio et al. (2013)
-45 -21 0 30
Far-off Close Up Lactation
Con: Lys:Met = 3.4:1
Met: Lys:Met = 2.8:1
Cho: ReaShure @ 60 g/d
Mix: Met (2.8:1)+ Cho (60 g/d
Data collection:
Feed intake
Milk production
Milk composition
BW and BCS
Sample collection:
Biopsy samples: (Gene expression) Liver, Adipose and Muscle
Milk samples: Protein, Fat, Lactose, Choline, Methionine?
Blood samples: (Immunology), Acute phase proteins, Ketones
Vaginal swab samples and uterine biopsies (Reproduction)
Zhou et al., 2016

11/18/2016
11
Diet
Ingredient (% of DM) Far-off Close-up Fresh
Alfalfa silage 12.00 8.34 5.07
Alfalfa hay - 4.29 2.98
Corn silage 33.00 36.40 33.41
Wheat straw 36.00 15.63 2.98
Cottonseed - - 3.58
Wet Brewers grains - 4.29 9.09
Ground shelled corn 4.00 12.86 23.87
Soy hulls 2.00 4.29 4.18
Soybean meal, 48% CP 7.92 2.57 2.39
Expeller Soybean meal - 2.57 5.97
Soychlor 0.15 3.86 -
Blood meal 1.00 - -
ProVAAl AADvantage - 0.86 1.50
Urea - 0.30 0.18
Minerals and Vitamins 3.48 3.75 3.77
Ingredient composition for the Far-off (-50 to -22), Close-up
(-21 d to calving) and Fresh (calving to 30 d) diets.
Zhou et al. (2016)
NRC (2001) evaluation of consumed diets
Close-up Fresh
CON MET CHO MIX CON MET CHO MIX
CP, % 15.3 15.4 15.2 15.2 17.4 17.5 17.3 17.3
RDP, %DM 9.6 9.6 9.5 9.5 10.0 10.0 9.9 9.9
RUP, %DM 5.7 5.8 5.7 5.7 7.4 7.5 7.4 7.4
MP supplied, g 1,225 1,230 1,210 1,214 2,304 2,312 2,289 2,297
Lys, %MP 6.63 6.60 6.65 6.62 6.21 6.20 6.22 6.20
Met, %MP 1.87 2.39 1.87 2.35 1.81 2.18 1.81 2.18
MP-Lys, g 81 81 80 80 143 142 142 142
MP-Met, g 23 29 23 28 42 50 41 50
Lys/Met 3.52/1 2.79/1 3.48/1 2.86/1 3.40/1 2.86/1 3.46/1 2.84/1
CON = control; MET = Smartamine M (0.08% of DMI); CHO = ReaShure (60 g/cow/d), MIX = both supplements
Zhou et al., 2016

11/18/2016
12
Pre- and postpartum BW, BCS, and DMI
Zhou et al. (2016)
Methionine Choline P-value
Without With Without With MET CHO
Prepartum
BW, lb 1,705 1,709 1,718 1,697 0.92 0.54
BCS 3.49 3.55 3.54 3.50 0.42 0.54
DMI, lb/d 28.5b 31.6a 29.4 30.7 0.02 0.22
Postpartum
BW, lb 1,480 1,506 1,502 1,484 0.38 0.55
BCS 3.10 3.20 3.16 3.14 0.27 0.74
DMI, lb/d 38.0b 42.0a 40.3 40.3 0.04 0.88
Pre- and postpartum BW, BCS, and DMI
Zhou et al. (2016)
Methionine Choline P-value
Without With Without With MET CHO
Milk, lb/d 88.5b 97.3a 94.0 91.8 0.03 0.56
ECM, lb/d 90.0b 98.9a 95.3 93.6 < 0.01 0.57
Protein, % 3.13b 3.32a 3.19 3.26 < 0.01 0.32
Protein, lb/d 2.74b 3.16a 2.99 2.94 < 0.01 0.70
Fat % 3.75 3.74 3.74 3.77 0.92 0.84
Fat, lb/d 3.16b 3.49a 3.36 3.32 0.02 0.76

11/18/2016
13
Frequency of occurrence of health problems of cows
completing the experiment
8/20 4/20
Control Methionine Choline
Methionine
plus choline
Cows 20 21 20 20
Ketosis1 8 3 5 4
Displaced
abomasum2 0 4 1
Retained placenta2 3 2 5 1
Endometritis 0 0 0 1
Mastitis 0 1 0 01 Defined as cows have moderate (~40 mg/dL) or large ketone concentration (< 80 mg/dL) in
urine, as detected using a reagent strip and treated by veterinarians with oral propylene glycol
or intravenous dextrose
2 Defined as fetal membranes retained >24 h
Zhou et al. (2016)
Conclusions from the University of Illinois research
- Increased Dry Matter Intake* by 2 lb pre-fresh and 4 lb post-fresh
-Increased Milk Production by 6-8 lbs
Increased milk protein by 0.2%
Increased milk fat 0.1%
- Improved the immune metabolic status
- Decreased inflammation
- Had better liver function
- Altered hepatic gene expression of antioxidant capacity, inflammation,
oxidative stress and DNA methylation
5 g of additional metabolizable Met during the close-up period
10 g of additional metabolizable Met during early lactation

11/18/2016
14
Presentation Outline
1. Overview of Smartamine M
2. “Methionine: More than milk” story
3. Amino acid (AA) balancing economics
4. Ration examples with RenAAPro
2016 Milk and Cheese prices
Source: Brian Gould, Agricultural and Applied Economics, UW-Madison

11/18/2016
15

11/18/2016
16

11/18/2016
17
11/18/2016
18
Presentation Outline
1. Overview of Smartamine M
2. “Methionine: More than milk” story
3. Amino acid (AA) balancing economics
4. Ration examples with RenAAPro
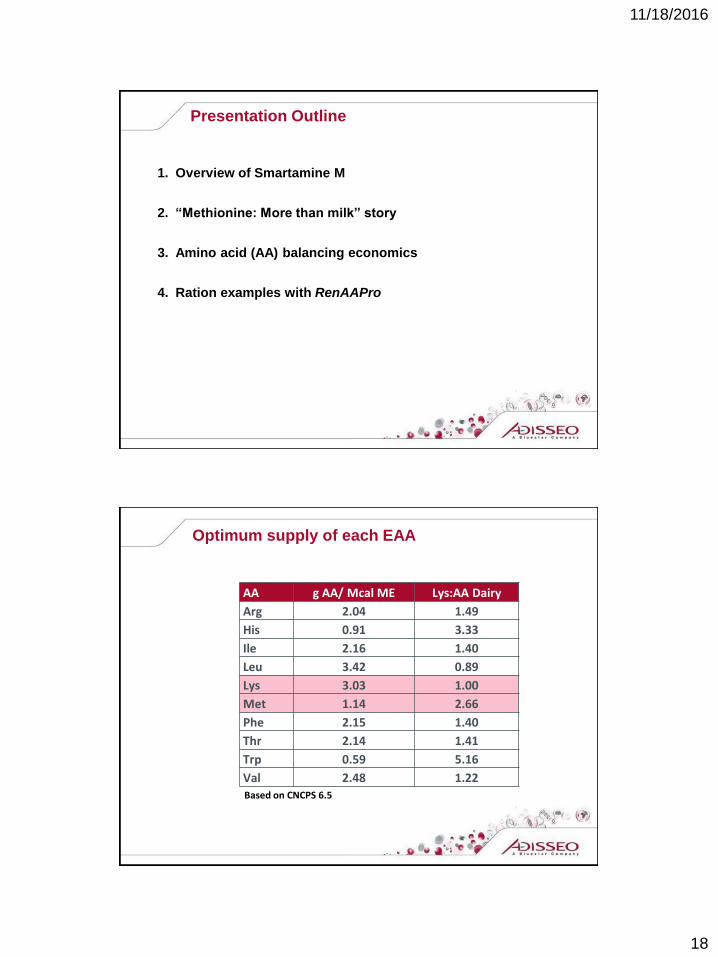
Optimum supply of each EAA
AA g AA/ Mcal ME Lys:AA Dairy
Arg 2.04 1.49
His 0.91 3.33
Ile 2.16 1.40
Leu 3.42 0.89
Lys 3.03 1.00
Met 1.14 2.66
Phe 2.15 1.40
Thr 2.14 1.41
Trp 0.59 5.16
Val 2.48 1.22Based on CNCPS 6.5

11/18/2016
19
Optimal Lys and Met concentrations in MP for maximal
milk protein yield in CNCPS v6.5
Model Lys Met
Optimal Lys/Met
ratio
% of MP1 7.00 2.60 2.69
g/Mcal of ME2 3.03 1.14 2.66
1Foskolos et al. (2014), 2Higgs (2015)
Ration containing blood meal

11/18/2016
20
Ration containing RenAAPro

11/18/2016
21

11/18/2016
22
Modified MP diet with RenAAPro

11/18/2016
23
Conclusions
Increased ROI with AA balancing based on current milk price
Met supplementation & AA balancing improves metabolic
health and function
RenAAPro provides much improved supply of limiting AA and
allows for reduced supply of MP
Combined, these ration balancing strategies will increase
nitrogen efficiency and reduce dietary costs