Embed Size (px)
Citation preview

Early evaluation of the VIIRS calibration, cloud mask and surfacereflectance Earth data records
Eric Vermote a,⁎, Chris Justice b, Ivan Csiszar c
a NASA Goddard Space Flight Center, Terrestrial Information Systems Laboratory, Mail Code 619, Bldg 32, S036H, Greenbelt, MD 20771, USAb University of Maryland, Dept. of Geographical Sciences, USAc NOAA/NESDIS, Center for Satellite Applications and Research, USA
a b s t r a c ta r t i c l e i n f o
Article history:Received 22 August 2013Received in revised form 21 March 2014Accepted 25 March 2014Available online xxxx
Keywords:Remote sensingAtmospheric correctionSurface reflectance
Surface reflectance is one of the key products fromVIIRS and aswithMODIS, is used in developing several higher-order landproducts. The VIIRS Surface Reflectance (SR) Intermediate Product (IP) is based on the heritageMODISCollection 5 product (Vermote, El Saleous, & Justice, 2002). The quality and character of surface reflectance de-pend on the accuracy of the VIIRS Cloud Mask (VCM), the aerosol algorithms and the adequate calibration ofthe sensor. The focus of this paper is the early evaluation of the VIIRS SR product in the context of the maturityof the operational processing system, the Interface Data Processing System (IDPS). After a brief introduction,the paper presents the calibration performance and the role of the surface reflectance in calibration monitoring.The analysis of the performance of the cloud mask with a focus on vegetation monitoring (no snow conditions)shows typical problems over bright surfaces and high elevation sites. Also discussed is the performance of theaerosol input used in the atmospheric correction and in particular the artifacts generated by the use of theNavy Aerosol Analysis and Prediction System. Early quantitative results of the performance of the SR productover the AERONET sites show that with the few adjustments recommended, the accuracy is within the thresholdspecifications. The analysis of the adequacy of the SR product (Land PEATE adjusted version) in applications ofsocietal benefits is then presented. We conclude with a set of recommendations to ensure consistency and con-tinuity of the JPSS mission with the MODIS Land Climate Data Record.
Published by Elsevier Inc.
1. Introduction
The directional surface reflectance product is a critical input for gen-erating Vegetation Indices (VI), Leaf Area Index (LAI), Fraction ofAbsorbed Photosynthetically Active Radiation (FPAR), Bidirectional Re-flectance Distribution Function (BRDF), Albedo, and Land Cover. The di-rectional surface reflectance is obtained after the correction of thevarious atmospheric effects that affect the top of the atmosphere signal.The scattering by molecules and aerosols in the atmosphere is clearlyevident in the comparison of top of the atmosphere and corrected re-flectance in the visible part of the Electromagnetic Spectrum, as seenin Fig. 1.
The first requirement for accurate atmospheric correction is a properabsolute calibration of the instrument. Calibration errors propagatethrough the whole atmospheric correction chain, in particular throughthe aerosol inversion and impact most of the bands in the visible partof the Spectrum, and will impact subsequent downstream products. Itis very important therefore for the Surface Reflectance product teamto keep assessing the instrument performance and independentlymon-itoring the calibration. The procedurewe have been using in the past for
AVHRR NOAA16 and MODIS Aqua/Terra has been implemented forVIIRS, so that a continuous near real-time monitoring of VIIRS/Aquacross-calibration can be achieved (Section 2).
One of the aspects which are often underestimated in generating asatellite derived product is the correct flagging of data that are sub-optimal to enable users to include data quality considerations in theiranalysis (Roy et al., 2002). For surface reflectance no reliable retrievalcan be done in the presence of cloud, cloud shadow, high aerosol or athigh solar zenith angles. Although the detection of high aerosol is insome way straighforward (although high aerosol could be confusedwith clouds), the validation of cloud or cloud shadow detection algo-rithm remains quite challenging, although the availability of high qualityremote sensing derived cloud information fromCALIPSO (Winker, Pelon,& McCormick, 2003) with global coverage (although limited to a swathof 5 km) makes the assessment less problematic. We will present inSection 3 our evaluation of the VIIRS Cloud Mask, focusing on snow-free land by comparison to both CALIPSO data and the Aqua CloudMask.
Quantitative information on aerosols is a critical input to the atmo-spheric correction and by far the one that introduces the most uncer-tainties in the SR product. Both aerosol optical thickness and theaerosol model (size distribution, multispectral real and imaginary re-fractive indices and non-sphericity) have to be determined to performaccurate atmospheric correction. There is also some limitation to the
Remote Sensing of Environment 148 (2014) 134–145
⁎ Corresponding author. Tel.: +1 301 614 5413; fax: +1 301 614 5269.E-mail address: [email protected] (E. Vermote).
http://dx.doi.org/10.1016/j.rse.2014.03.0280034-4257/Published by Elsevier Inc.
Contents lists available at ScienceDirect
Remote Sensing of Environment
j ourna l homepage: www.e lsev ie r .com/ locate / rse
https://ntrs.nasa.gov/search.jsp?R=20150000275 2020-04-10T17:22:05+00:00Z

aerosol retrieval algorithm (over snow and bright surfaces) that neces-sitates the use of default values for correction. For MODIS, those valuesare fixed (aerosol optical thickness of 0.05, urban clean aerosol model),but for the VIIRS operational production system, they are currently readfrom the output of an aerosol transport model, the Navy Aerosol Analy-sis and Prediction System (NAAPS), the accuracy, spatial and temporalresolution of which are shown in this study to be inadequate for thepurpose of atmospheric correction over land and cause obvious artifactsin the current SR product (Section 4).
One critical task in developing a data product is providing an accura-cy assessment. The directional surface reflectance fromMODIS has beenvalidated through the various stage defined by the MODIS land valida-tion approach (up to Stage III) (Morisette, Privette, & Justice, 2002). Inparticular, careful attention has been paid to the accuracy of the 6S radi-ative transfer code (Kotchenova & Vermote, 2007; Kotchenova,Vermote, Levy, & Lyapustin, 2008; Kotchenova, Vermote, Matarrese, &Klemm, 2006), used to correct atmospheric effects by a comprehensivecomparison to a Monte Carlo model (Bréon, 1992). Both the Aqua andTerra Collection 5 Surface Reflectance products have been extensively
compared to a reference reflectance dataset obtained for the AERONETsites (Holben et al., 1998), which gives ancillary inputs for atmosphericcorrection such as water vapor, aerosol optical thickness, size distribu-tion and refractive indices. A preliminary assessment for Terra usingdata from 2003was published (Vermote & Kotchenova, 2008), showingthat the accuracy of the Surface Reflectance productwas satisfactory ex-cept for band 3 (470 nm) which is used for aerosol inversion. The anal-ysis has been completed for both Terra and Aqua for the 2000 to 2009period. In summary, the study used c. 50,000 matchups betweenAERONET and MODIS, spread out over 200 locations, which translatesto analysis of more than a million individual pixels. Using this robustdataset, the performance of the MODIS Collection 5 product has beenconfirmed to be well within the theoretical error bars: ±(0.01 + 10%)for threshold and: ±(0.005 + 5%) for objective. Using this protocol,we have derived the performance metrics of the VIIRS Surface Reflec-tance and compared them to the equivalent MODIS metrics (Section 5).
The performance of the surface reflectance is an importantmetric fora broad variety of science users as well as for long term applications ofsocietal benefits. In this context, the MODIS daily climate modeling
Fig. 1. The VIIRS first light image acquired on November 21, 2011 in the visible bands; top is the top of the atmosphere (RGB) image and bottom is the prototype VIIRS corrected surfacereflectance product.
135E. Vermote et al. / Remote Sensing of Environment 148 (2014) 134–145

grid product (M[Y,O]D09CMG) corrected for BRDF effects in bands 1and 2 (Bréon & Vermote, 2012; Vermote, Justice, & Breon, 2009) hasproven to be a valuable asset for global agriculture monitoring(Becker-Reshef, Justice, et al., 2010), agricultural yield predictionmodeling (Becker-Reshef, Vermote, Lindeman, & Justice, 2010), anddrought monitoring (Karl et al., 2012). In Section 6, we describe onesuch application, namely the readiness of the VIIRS product to assessthe agricultural drought of July 2012, which occurred over most of theNorthern Hemisphere and had an important impact on several sectorsof US agriculture and global commodity prices.
In Section 7,wewill focus on improvements needed to theVIIRS sur-face reflectance algorithm and upstream products that are critical to en-sure MODIS Land Climate Data Record continuity. For more details onthese issues we refer the reader to Justice et al. (2013). Some of theserecommendations have already been implemented in the Land ProductEvaluation and Analysis Tool Element's (PEATE) system (http://landweb.nascom.nasa.gov/NPP_QA) (Read et al., 2007) and have dem-onstrated their usefulness but have yet to be implemented in NOAA'snear-real time Interface Data Processing Segment (IDPS), which pro-vides data for archive and distribution to the NOAA's ComprehensiveLarge Array-data Stewardship System (CLASS), the data portal availableto VIIRS data users.
2. VIIRS calibration monitoring
Accurate radiometric calibration is a prerequisite to creating a sci-ence quality, time-series of surface reflectance and consequently, higherorder downstream products. Calibration errors can propagate directlyinto the surface reflectance and create artificial variations that can bemisinterpreted as trends, especially if these variations are due to aslow decay in the calibrationmechanism. Vicarious calibration providesan additional source of calibration information, to verify and evaluateon-board calibration. We are using the approach we developed forcross calibration of MODIS (Vermote & Saleous, 2006a) to monitor thecalibration in the visible to shortwave infrared bands and to providecorrection terms as needed. The approach relies on using the multi-year Terra MODIS data set to derive spectral and directional character-izations of stable desert sites that can be used as invariant targets. A can-didate list of such targets is provided in Cosnefroy, Leroy, and Briottet(1996). Subsets of Terra MODIS data are collected and undergo a rigor-ous screening based on the quality flags (no cloud, cloud shadow, adja-cent cloud, high aerosol or snow). The spectral characterization isobtained by averaging the surface reflectance for each site and spectralband over the acquisition period. The directional characterization is de-rived using the MODIS Bidirectional Reflectance Distribution Function(BRDF) algorithm that relies on a kernel-driven linear BRDF model
defined as a weighted sum of an isotropic parameter, RossThick andLiSparseReciprocal kernels (Schaaf et al., 2002).
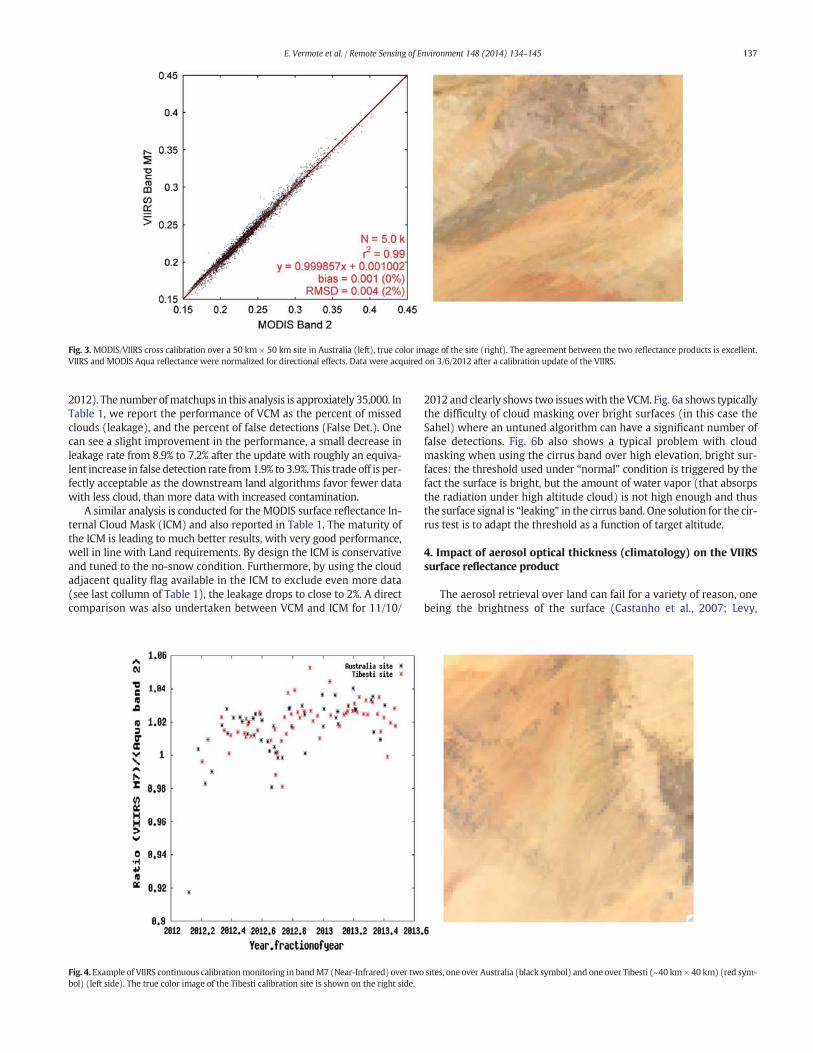
Using the site directional characterization, we compute a MODIS-like surface reflectance at the MODIS acquisition time. Atmospheric pa-rameters (surface pressure, gaseous content, water vapor, aerosol opti-cal thickness) obtained from assimilated data, MODIS data, MODIS-likeand/or ground measurements are then used in conjunction with the 6Sradiative transfer code (Vermote, Tanré, Deuze, Herman, & Morcette,1997) to determine the MODIS Top Of Atmosphere (TOA) reflectance.The computed reflectance is compared to the acquired reflectance toinfer changes in the instrument calibration. To assess this approach,we applied it to transfer the Terra MODIS calibration to the AquaMODIS instrument. When applied to a stable ground site in Niger, theresults of this approach agreed to within 1% of the Aqua MODIS on-board solar diffuser (Vermote & Saleous, 2006b). We also have appliedthis method to assess the calibration of ASTER (which acquired data inthe same geometry as Terra) and VIIRS. For ASTER, the method has en-abled us to highlight a problem with the saturation of the red bandfound for the desert site (Fig. 2, left) as well as issues with the on-board calibration system (Fig. 2, right). By comparing Aqua to VIIRS(Fig. 3), also using this technique,we have confirmed that the rapid deg-radation of themirror in the red and near-infrared wavelengths (due toa deficient cleaning process just before launch) for details see (Barrieet al., 2012) was well accounted for by the on-board calibration system.We are now continuously monitoring the VIIRS calibration at two “cal-ibration” sites using this technique (Fig. 4, right side), one overAustralia (shown in Fig. 3, left side) and one over the Saharan Tibesti re-gion (shown in Fig. 4, left side).
3. VIIRS cloud mask performance over Land (snow free)
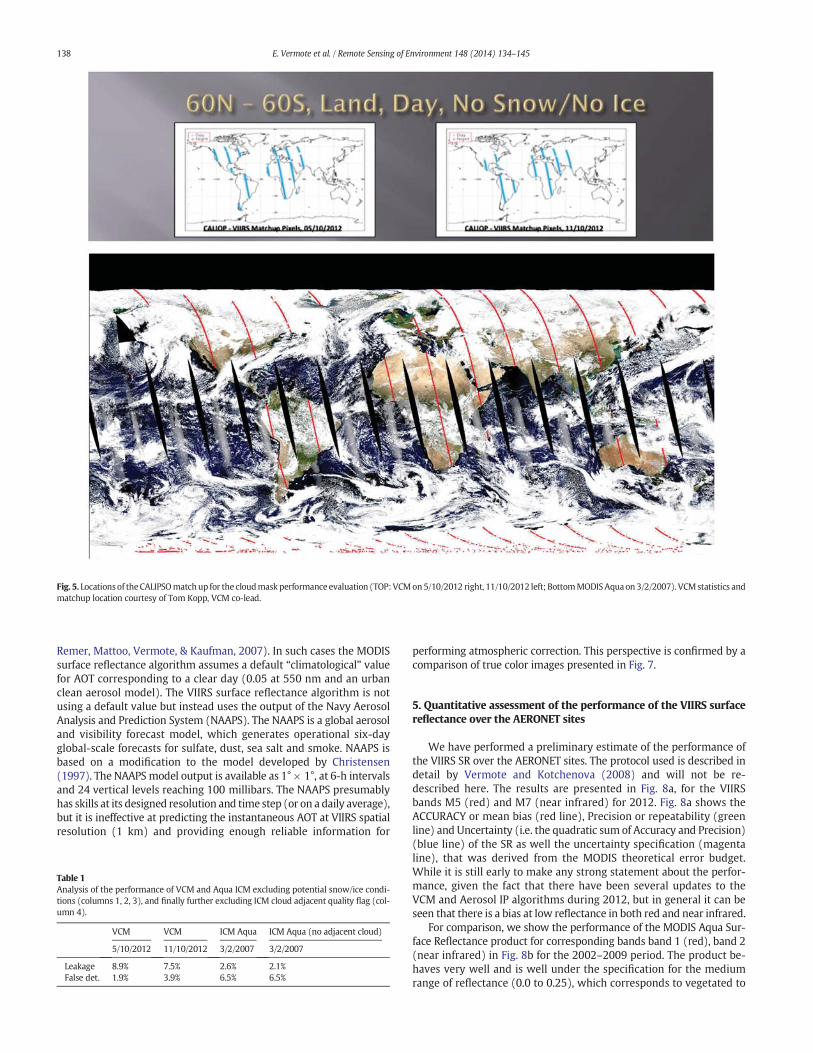
While the validation of surface reflectance is greatly facilitated byAERONET data, the validation of the cloud mask remains a significantchallenge. The CALIPSO mission and in particular the Cloud-AerosolLidarwithOrthogonal Polarization (CALIOP) provides a unique, indepen-dent opportunity to evaluate cloud mask products. Despite its relativelynarrow footprint (330 m to 5 km depending on the altitude of the layersensed), CALIOP is acquiring data about 2 min after Aqua MODIS whichmakes it ideal for cloud mask evaluation. The VIIRS matchup withCALIPSO is less favorable with up to 12 minute difference between thetwo observations. Using the fraction of cloud at 330 m, 1 km and 5 kmin the CALIOP footprint, we classify the footprint as cloudy if any ofthese three levels has a non-zero fraction of cloud. Two examples ofthematchup analysis are shown in Fig. 5 (top) and Table 1 for two differ-ent dates corresponding respectively to data acquired prior to an impor-tant algorithm update to VCM (5/10/2012) and after the update (11/10/
Fig. 2. ASTER/MODIS multi-date comparison over a calibration site showing a saturation problem in the ASTER dataset (left), and an anomaly with the on-board calibration procedure(right).
136 E. Vermote et al. / Remote Sensing of Environment 148 (2014) 134–145
2012). The number ofmatchups in this analysis is approxiately 35,000. InTable 1, we report the performance of VCM as the percent of missedclouds (leakage), and the percent of false detections (False Det.). Onecan see a slight improvement in the performance, a small decrease inleakage rate from 8.9% to 7.2% after the update with roughly an equiva-lent increase in false detection rate from1.9% to 3.9%. This trade off is per-fectly acceptable as the downstream land algorithms favor fewer datawith less cloud, than more data with increased contamination.
A similar analysis is conducted for theMODIS surface reflectance In-ternal Cloud Mask (ICM) and also reported in Table 1. The maturity ofthe ICM is leading to much better results, with very good performance,well in line with Land requirements. By design the ICM is conservativeand tuned to the no-snow condition. Furthermore, by using the cloudadjacent quality flag available in the ICM to exclude even more data(see last collumn of Table 1), the leakage drops to close to 2%. A directcomparison was also undertaken between VCM and ICM for 11/10/
2012 and clearly shows two issueswith the VCM. Fig. 6a shows typicallythe difficulty of cloud masking over bright surfaces (in this case theSahel) where an untuned algorithm can have a significant number offalse detections. Fig. 6b also shows a typical problem with cloudmasking when using the cirrus band over high elevation, bright sur-faces: the threshold used under “normal” condition is triggered by thefact the surface is bright, but the amount of water vapor (that absorpsthe radiation under high altitude cloud) is not high enough and thusthe surface signal is “leaking” in the cirrus band. One solution for the cir-rus test is to adapt the threshold as a function of target altitude.
4. Impact of aerosol optical thickness (climatology) on the VIIRSsurface reflectance product
The aerosol retrieval over land can fail for a variety of reason, onebeing the brightness of the surface (Castanho et al., 2007; Levy,
Fig. 3. MODIS/VIIRS cross calibration over a 50 km × 50 km site in Australia (left), true color image of the site (right). The agreement between the two reflectance products is excellent.VIIRS and MODIS Aqua reflectance were normalized for directional effects. Data were acquired on 3/6/2012 after a calibration update of the VIIRS.
Fig. 4. Example of VIIRS continuous calibrationmonitoring in bandM7 (Near-Infrared) over two sites, one over Australia (black symbol) and one over Tibesti (~40 km× 40 km) (red sym-bol) (left side). The true color image of the Tibesti calibration site is shown on the right side.
137E. Vermote et al. / Remote Sensing of Environment 148 (2014) 134–145
Remer, Mattoo, Vermote, & Kaufman, 2007). In such cases the MODISsurface reflectance algorithm assumes a default “climatological” valuefor AOT corresponding to a clear day (0.05 at 550 nm and an urbanclean aerosol model). The VIIRS surface reflectance algorithm is notusing a default value but instead uses the output of the Navy AerosolAnalysis and Prediction System (NAAPS). The NAAPS is a global aerosoland visibility forecast model, which generates operational six-dayglobal-scale forecasts for sulfate, dust, sea salt and smoke. NAAPS isbased on a modification to the model developed by Christensen(1997). The NAAPSmodel output is available as 1° × 1°, at 6-h intervalsand 24 vertical levels reaching 100 millibars. The NAAPS presumablyhas skills at its designed resolution and time step (or on a daily average),but it is ineffective at predicting the instantaneous AOT at VIIRS spatialresolution (1 km) and providing enough reliable information for
performing atmospheric correction. This perspective is confirmed by acomparison of true color images presented in Fig. 7.
5. Quantitative assessment of the performance of the VIIRS surfacereflectance over the AERONET sites
We have performed a preliminary estimate of the performance ofthe VIIRS SR over the AERONET sites. The protocol used is described indetail by Vermote and Kotchenova (2008) and will not be re-described here. The results are presented in Fig. 8a, for the VIIRSbands M5 (red) and M7 (near infrared) for 2012. Fig. 8a shows theACCURACY or mean bias (red line), Precision or repeatability (greenline) and Uncertainty (i.e. the quadratic sum of Accuracy and Precision)(blue line) of the SR as well the uncertainty specification (magentaline), that was derived from the MODIS theoretical error budget.While it is still early to make any strong statement about the perfor-mance, given the fact that there have been several updates to theVCM and Aerosol IP algorithms during 2012, but in general it can beseen that there is a bias at low reflectance in both red and near infrared.
For comparison, we show the performance of the MODIS Aqua Sur-face Reflectance product for corresponding bands band 1 (red), band 2(near infrared) in Fig. 8b for the 2002–2009 period. The product be-haves very well and is well under the specification for the mediumrange of reflectance (0.0 to 0.25), which corresponds to vegetated to
Fig. 5. Locations of theCALIPSOmatchup for the cloudmask performance evaluation (TOP:VCMon5/10/2012 right, 11/10/2012 left; BottomMODISAquaon 3/2/2007). VCMstatistics andmatchup location courtesy of Tom Kopp, VCM co-lead.
Table 1Analysis of the performance of VCM and Aqua ICM excluding potential snow/ice condi-tions (columns 1, 2, 3), and finally further excluding ICM cloud adjacent quality flag (col-umn 4).
VCM VCM ICM Aqua ICM Aqua (no adjacent cloud)
5/10/2012 11/10/2012 3/2/2007 3/2/2007
Leakage 8.9% 7.5% 2.6% 2.1%False det. 1.9% 3.9% 6.5% 6.5%
138 E. Vermote et al. / Remote Sensing of Environment 148 (2014) 134–145

Fig. 6. a: An issuewith the VIIRS CloudMask (VCM) over Sahel on 11/10/2012, due to the seedfile currently used. The top image is theVIIRS IDPS generatedproduct (clouds arewhite filledvalues), themiddle is theVIIRS Land PEATE adjusted product (which is theproduct generated by the Land PEATE using theNASA Land Science Teamadjusted version of the IDPS software),where the cloud are not set to filled values, the bottom is theMODIS Aqua product. The red circle outlines the false cloud detection in VCM due to a problem in the seed file used; the bluecircle outlines an area of aerosol over-correction due to the use of the Navy Aerosol climatology (see Section 5.). b: An issue with the VIIRS CloudMask (VCM) over the Tibetan Plateau on11/10/2012due to the cirrus reflective test. The top image is the IDPS generatedproduct (clouds arewhitefilled value); themiddle image is the Land PEATE adjusted product,where cloudsare not set to filled values, the bottom is the equivalent MODIS Aqua data. The red circle outlines false cloud detections in VCM, due to problem in the cirrus reflective test over high el-evation bright surfaces.
139E. Vermote et al. / Remote Sensing of Environment 148 (2014) 134–145

Fig. 6 (continued).
140 E. Vermote et al. / Remote Sensing of Environment 148 (2014) 134–145
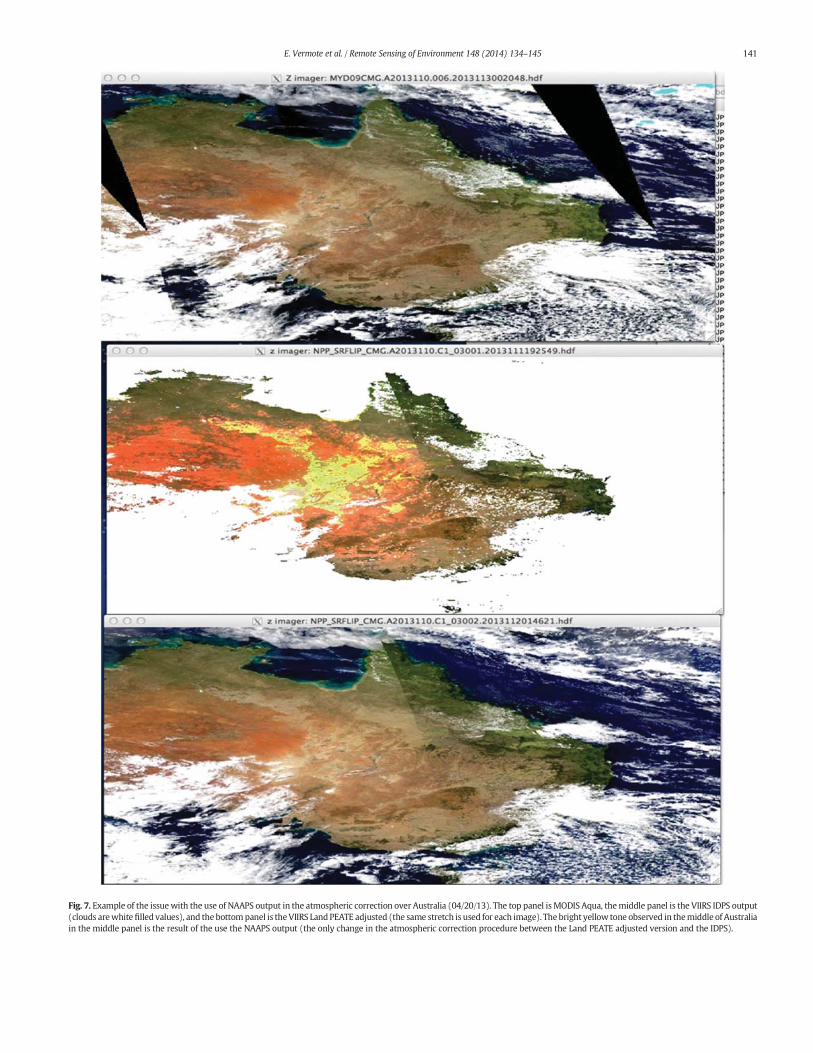
Fig. 7. Example of the issuewith the use of NAAPS output in the atmospheric correction over Australia (04/20/13). The top panel isMODIS Aqua, themiddle panel is the VIIRS IDPS output(clouds arewhitefilled values), and the bottompanel is theVIIRS Land PEATE adjusted (the same stretch is used for each image). The bright yellow tone observed in themiddle of Australiain the middle panel is the result of the use the NAAPS output (the only change in the atmospheric correction procedure between the Land PEATE adjusted version and the IDPS).
141E. Vermote et al. / Remote Sensing of Environment 148 (2014) 134–145
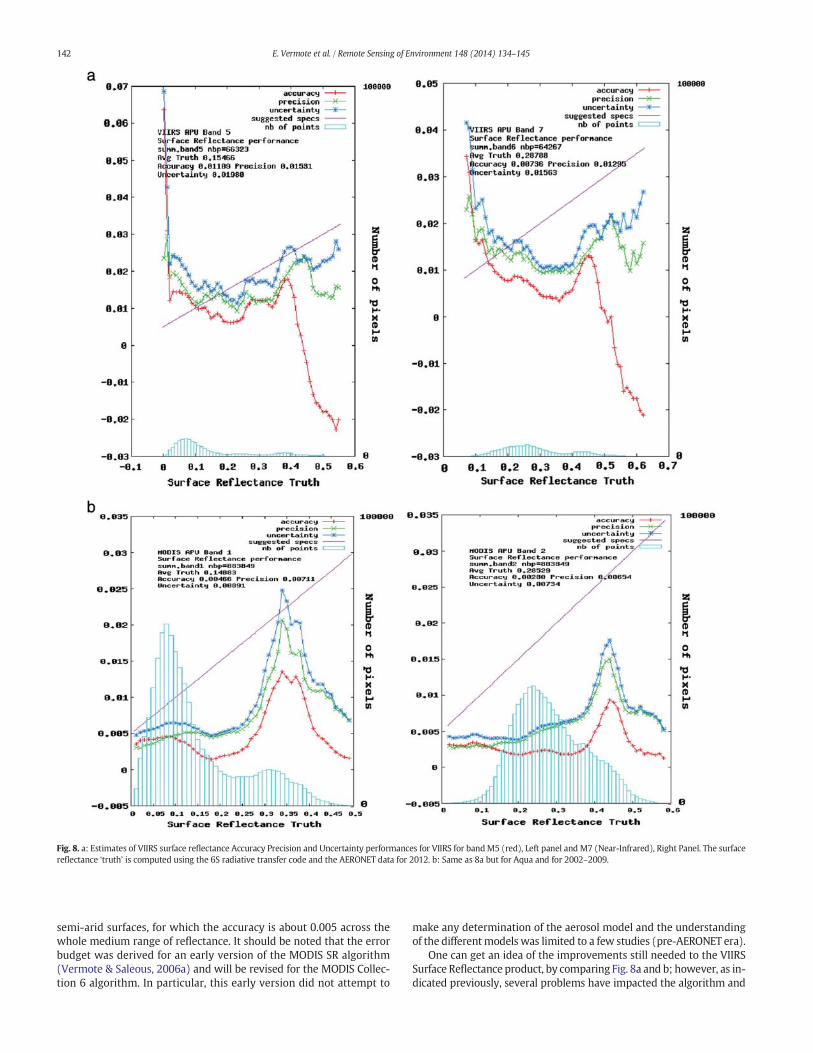
semi-arid surfaces, for which the accuracy is about 0.005 across thewhole medium range of reflectance. It should be noted that the errorbudget was derived for an early version of the MODIS SR algorithm(Vermote & Saleous, 2006a) and will be revised for the MODIS Collec-tion 6 algorithm. In particular, this early version did not attempt to
make any determination of the aerosol model and the understandingof the differentmodels was limited to a few studies (pre-AERONET era).
One can get an idea of the improvements still needed to the VIIRSSurface Reflectance product, by comparing Fig. 8a and b; however, as in-dicated previously, several problems have impacted the algorithm and
Fig. 8. a: Estimates of VIIRS surface reflectance Accuracy Precision and Uncertainty performances for VIIRS for bandM5 (red), Left panel and M7 (Near-Infrared), Right Panel. The surfacereflectance ‘truth’ is computed using the 6S radiative transfer code and the AERONET data for 2012. b: Same as 8a but for Aqua and for 2002–2009.
142 E. Vermote et al. / Remote Sensing of Environment 148 (2014) 134–145
the general complexity of the IDPS system, resulting in delays inmakingchanges, makes it difficult to get a large enough sample of consistentlycalibrated and processed surface reflectance data. The Land PEATE iscurrently planning a complete reprocessing of the VIIRS products withupdated calibration and adjusted algorithms that will be a crucialinput to future assessment of the products.
6. Adequacy of VIIRS surface reflectance production in an applica-tion of societal benefit
With evidence of climate change and global warming, the accelera-tion of the hydrological cycle is a strong possibility, translating in an in-creased number of “extreme” weather events such as flooding or
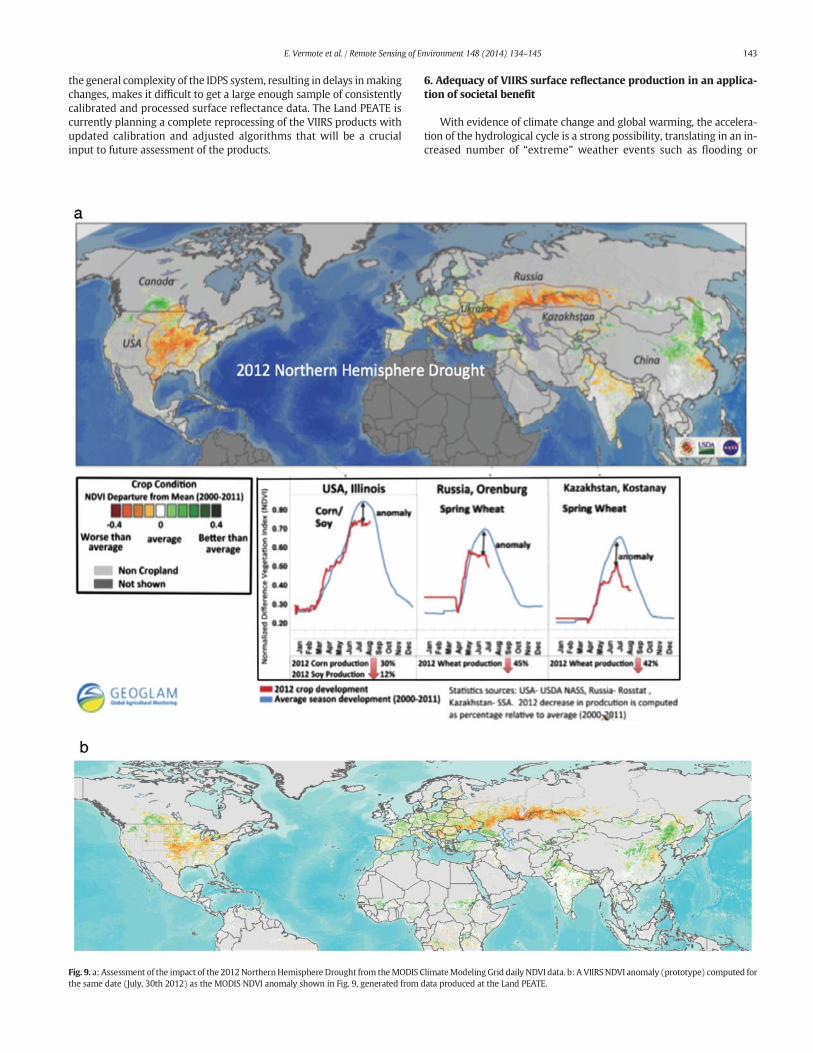
Fig. 9. a: Assessment of the impact of the 2012NorthernHemisphere Drought from theMODIS ClimateModeling Grid daily NDVI data. b: A VIIRS NDVI anomaly (prototype) computed forthe same date (July, 30th 2012) as the MODIS NDVI anomaly shown in Fig. 9, generated from data produced at the Land PEATE.
143E. Vermote et al. / Remote Sensing of Environment 148 (2014) 134–145

drought occurrence. The need to monitor the Earth system under thesecircumstances is extremely important, in particular in the area of foodproduction. In the global economy, it is necessary to provide global,timely and unbiased assessments and forecasts of global agricultureproduction, to avoid large variations in commodity prices and organizefood aid to prevent civil unrest in at-risk countries. The GLAM (GlobalAgricultural Monitoring) system developed by NASA and USDA at theDepartment of Geographical Sciences atUniversity ofMaryland has pro-vided such amonitoring capability for the past 10 years (Becker-Reshef,Vermote, et al., 2010). An example of the GLAM input to the GEO agri-cultural monitoring community of practice, is shown on Fig. 9a at thepeak of the crisis generated by the exceptional drought of 2012 (Karlet al., 2012).
As a prototype for the transition of VIIRS data into the GLAM system,we are using the VIIRS adjusted Land PEATE processing stream, postprocessing filtering and a preliminary adaptation of the MODIS SurfaceReflectance Internal Cloud Mask algorithm and NDVI (ratio betweenthe difference in the near-infrared and the red and the sum) anomaly,computed from the VIIRS daily observations in band I1 (red) and I2(near-infrared) (closer to MODIS band 1 and 2 than M5 and M7) andcorrected for BRDF effects. Those bands are extracted from the VIIRS/NPP Daily Surface Reflectance Level 3 Global Diagnostic Data Record(DDR) at climate modeling grid (CMG - 0.05 degree) resolution(NPP_SRFLIP_CMG) available through NASA's Level 1 and AtmosphereArchive and Distribution System (LAADS): http://laadsweb.nascom.nasa.gov/data/search.html.
Fig. 9a and b shows an example of the GLAM product and its adapta-tion to VIIRS. The anomaly image in Fig. 9a shows the croplandNDVI de-parture from the average (2000–2011) on July 30th 2012, highlightinghotspots of crops under stress during the 2012 droughts that affectedthe United States and the Black Sea region. The time-series curvesbelow compare the daily development of croplands in 2012 (red) to av-erage (2000–2011) in 3 important crop growing regions: Illinois, USA;Orenburg Oblast, Russia; Kostanay Oblast, Kazakhstan. The crop devel-opment through the season depicted by theNDVI shows consistent neg-ative anomalies with regard to a ten year average, with highestdiscrepancies during the crop peak development period. In 2012 cropsin the US, southern Europe and the Black Sea region suffered fromprolonged high temperatures and lack of moisture, which resulted insignificantly reduced production. This information was available onemonth prior to harvest and several months before the release of officialstatistics. The VIIRS NDVI anomaly is computed for the same day as theone presented in Fig. 9a and is shown in Fig. 9b. The similar spatial pat-terns of NDVI anomalies are obvious.
7. Conclusions and recommendations
The S-NPP VIIRS instrument was planned to generate data that willprovide continuity in land observations from EOS MODIS. This meetsan important requirement from the science community that is con-cerned with studying global change and application communities re-quiring multi-year comparisons. This also bodes well, as S-NPP wasdesigned as a bridging-mission to the JPSS suite of operational instru-ments, which will have the same capability. The VIIRS advance overthe previous NOAA operational polar orbiter, the Advanced Very HighResolution Radiometer is truly significant, with many of the MODIS ca-pabilities and some improvements added. If we are successful in thelaunch of JPSS-1 with the same VIIRS instrument, then the research tooperational transition in terms of instrument capabilities can be claimeda significant success.
The observations being collected by the VIIRS can provide continuityin observations fromMODIS and are of sufficient quality for both scienceand operational applications; however, significant challenges need to beaddressed so that the generated products do cover the full suite ofMODIS land products or take full advantage of the capabilities providedby the instrument (Justice et al., 2013).
A performance evaluation of the SR IP is described above. After thispreliminary product evaluation, we have made a number of suggestedimprovements to the product. However the operational system wasnot designed for extensive chain-testing of algorithm updates and as aresult changes are slow to be made and can in turn create further prob-lems. Todevelop the best possible SRproduct for science use,we recom-mend that rather than trying to transition an operational system (theIDPS) to research use, a purpose for which it was clearly not intended,a separate science research production system should be establishedwith a dedicated testing system to allow improvements to be developedand tested in a Beta-Provisional, Stage 1 validation period with periodicreprocessing from Level 1 (calibration, geolocation) data, as was thecase for MODIS. The MODIS LANCE (Land Atmosphere Near real-timeCapability for EOS) experience has shown that science quality algo-rithms can be easily adapted for near real-time production (Murphy,Justice, Lowe, Maiden, & Davies, 2012). The VIIRS operational systemand products could also benefit from new or improved algorithms de-veloped and tested by the science community.
One critical consideration is that the IDPSwas not designed to repro-cess the data record but instead is designed for near real-time delivery.The need for a consistent product record from the start of operations isimportant for global change research but as shown above is also neces-sary for operational applications that are dependent on in multiyearcomparison or establishing trends. The development of climate data re-cords (CDRs) from VIIRS will require a dedicated system outside of theIDPS. We therefore recommend that a CDR processing capability be de-veloped for VIIRS with a science team driving the system requirements.
In summary, the VIIRS instrument is providing data from which ascience quality SR product can be developed. The SR product currentlyrunning in the IDPS will we believe meet the needs of the operationalcommunity for which it was intended but a more flexible system isneeded for implementing and testing the necessary improvements tothe product.
This paper presents the basic tools andmethods to fully evaluate SR-IP and its upstream dependencies. The evaluation will need to be re-iterated as improvements are implemented and reprocessing is com-pleted. After reprocessing, the scope of the cloud mask evaluationneeds also to be broadened and a more statistically robust analysisneeds to take place, to mimic the way the performance metrics are de-rived for SR-IP (Stage III validation), at a minimum a year of global coin-cident matches with CALIPSO data needs to be analyzed to fully coverthe temporal/spatial variability in cloud and land systems.
References
Barrie, J. D., Fuqua, P. D., Meshishnek, M. J., Ciofalo, M. R., Chu, C. T., Chaney, J. A., et al.(2012). Root cause determination of on-orbit degradation of the VIIRS rotating tele-scope assembly. Proceedings of the SPIE, Earth Observing Systems XVII, 8510, http://dx.doi.org/10.1117/12.933276 (85101B-85101B).
Becker-Reshef, I., Justice, C., Sullivan,M., Vermote, E., Tucker, C., Anyamba, A., et al. (2010).Monitoring global croplands with coarse resolution earth observations: The GlobalAgriculture Monitoring (GLAM) project. Remote Sensing, 2(6), 1589–1609.
Becker-Reshef, I., Vermote, E., Lindeman, M., & Justice, C. (2010). A generalizedregression-based model for forecasting winter wheat yields in Kansas and Ukraineusing MODIS data. Remote Sensing of Environment, 114(6), 1312–1323.
Bréon, F. M. (1992). Reflectance of broken cloud fields: Simulation and parameterization.Journal of the Atmospheric Sciences, 49(14), 1221–1232.
Bréon, F. M., & Vermote, E. (2012). Correction of MODIS surface reflectance time series forBRDF effects. Remote Sensing of Environment, 125, 1–9.
Castanho, A. D. D., Prinn, R., Martins, V., Herold, M., Ichoku, C., & Molina, L. T. (2007). Anal-ysis of Visible/SWIR surface reflectance ratios for aerosol retrievals from satellite inMexico City urban area. Atmospheric Chemistry and Physics, 7(20), 5467–5477.
Christensen, J. H. (1997). The Danish Eulerian hemispheric model—A three-dimensionalair pollution model used for the arctic. Atmospheric Environment, 31(24), 4169–4191.
Cosnefroy, H., Leroy, M., & Briottet, X. (1996). Selection and characterization of Saharanand Arabian desert sites for the calibration of optical satellite sensors. RemoteSensing of Environment, 58(1), 101–114.
Holben, B. N., Eck, T. F., Slutsker, I., Tanré, D., Buis, J. P., Setzer, A., et al. (1998). AERONET—A federated instrument network and data archive for aerosol characterization.Remote Sensing of Environment, 66, 1–16, http://dx.doi.org/10.1016/S0034-4257(98)00031-5.
144 E. Vermote et al. / Remote Sensing of Environment 148 (2014) 134–145

Justice, C. O., Román, M. O., Csiszar, I., Vermote, E., Wolfe, R., Hook, S. J., et al. (2013). Landand cryosphere products from Suomi NPP VIIRS: Overview and status. Journal ofGeophysical Research-Atmospheres, 118, 1–13, http://dx.doi.org/10.1002/jgrd.50771.
Karl, T. R., Gleason, B. E., Menne, M. J., McMahon, J. R., Heim, R. R., Jr., Brewer, M. J., et al.(2012). U.S. temperature and drought: Recent anomalies and trends. EOS,Transactions of the AGU, 93, 473–474, http://dx.doi.org/10.1029/2012EO470001.
Kotchenova, S. Y., & Vermote, E. F. (2007). Validation of a vector version of the 6S radiativetransfer code for atmospheric correction of satellite data. Part II. HomogeneousLambertian and anisotropic surfaces. Applied Optics, 46(20), 4455–4464.
Kotchenova, S. Y., Vermote, E. F., Levy, R., & Lyapustin, A. (2008). Radiative transfer codesfor atmospheric correction and aerosol retrieval: Intercomparison study. AppliedOptics, 47(13), 2215–2226.
Kotchenova, S. Y., Vermote, E. F., Matarrese, R., & Klemm, F. J., Jr. (2006). Validation of avector version of the 6S radiative transfer code for atmospheric correction of satellitedata. Part I: Path radiance. Applied Optics, 45(26), 6762–6774.
Levy, R. C., Remer, L. A., Mattoo, S., Vermote, E. F., & Kaufman, Y. J. (2007). Second-generation operational algorithm: Retrieval of aerosol properties over land from in-version of Moderate Resolution Imaging Spectroradiometer spectral reflectance.Journal of Geophysical Research-Atmospheres, 112(D13).
Morisette, J. T., Privette, J. L., & Justice, C. O. (2002). A framework for the validation ofMODIS land products. Remote Sensing of Environment, 83, 77–96, http://dx.doi.org/10.1016/S0034-4257(02)00088-3.
Murphy, K., Justice, C., Lowe, D., Maiden, M., & Davies, D. (2012). LANCE user workinggroup meeting summary. The Earth Observer, 24(3), 19–21 (NASA GSFC).
Read, S.M., Wolfe, R., Devadiga, S., Ye, G., Isaacman, A., Davidson, C., & Masuoka, E. (2007).LAND PEATE VIIRS science data processing software system description version 1.2.In NASA/GSFC (Ed.).
Roy, D. P., Borak, J. S., Devadiga, S., Wolfe, R. E., Zheng, M., & Descloitres, J. (2002). TheMODIS Land product quality assessment approach. Remote Sensing of Environment,83, 62–76, http://dx.doi.org/10.1016/S0034-4257(02)00087-1.
Schaaf, C. B., Gao, F., Strahler, A. H., Lucht, W., Li, X., Tsang, T., et al. (2002). First operation-al BRDF, albedo nadir reflectance products from MODIS. Remote Sensing ofEnvironment, 83(1), 135–148.
Vermote, E. F., El Saleous, N. Z., & Justice, C. O. (2002). Atmospheric correction of MODISdata in the visible to middle infrared: First results. Remote Sensing of Environment,83(1), 97–111.
Vermote, E., Justice, C. O., & Breon, F. M. (2009). Towards a generalized approach for cor-rection of the BRDF effect in MODIS directional reflectances. IEEE Transactions onGeoscience and Remote Sensing, 47(3), 898–908.
Vermote, E. F., & Kotchenova, S. (2008). Atmospheric correction for the monitoring ofland surfaces. Journal of Geophysical Research: Atmospheres (1984–2012),113(D23).
Vermote, E. F., & Saleous, M. N. (2006a). Operational atmospheric correction ofMODIS visible to middle infrared land surface data in the case of an infiniteLambertian target. Earth Science Satellite Remote Sensing (pp. 123–153). BerlinHeidelberg: Springer.
Vermote, E. F., & Saleous, N. Z. (2006b). Calibration of NOAA16 AVHRR over a desert siteusing MODIS data. Remote Sensing of Environment, 105(3), 214–220.
Vermote, E. F., Tanré, D., Deuze, J. L., Herman, M., & Morcette, J. J. (1997). Second simula-tion of the satellite signal in the solar spectrum, 6S: An overview. IEEE Transactions onGeoscience and Remote Sensing, 35(3), 675–686.
Winker, D. M., Pelon, J., & McCormick, M. P. (2003, October). The CALIPSO mission:Spaceborne lidar for observation of aerosols and clouds. Proc. Spie, Vol. 4893, No. 1.(pp. 11).
145E. Vermote et al. / Remote Sensing of Environment 148 (2014) 134–145