Embed Size (px)
Citation preview
7/27/2019 Reliability of a test report latest.doc
http://slidepdf.com/reader/full/reliability-of-a-test-report-latestdoc 1/18
Reliability
What do we mean by the reliability of a measuring instrument?
Contrary to its usual meaning in common parlance, in scientific measurement if
something is reliable it is not necessarily good. (A security guard who fallsasleep in the middle of his watch at exactly the same time every night would be areliable sleeper, but he would undoubtedly be fired for his lack of alertness.) Areliable instrument is one that produces consistent measurements, which may or may not be worth anything. For example, a thermometer that reads 105 degreesFahrenheit every time it is inserted in the mouth of a child who has no fever isreliable; it is consistent from one insertion to the next, but it is not a very goodthermometer because it implies that the child has a high fever when (s)heactually does not.
The matter of consistency of measurement is not referred to as “reliability” in all
scientific disciplines. Some people prefer “accuracy”, “precision”, “agreement”,“dependability”, “reproducibility”, “repeatability”, or the term “consistency” itself.
Reliability is defined as the extent to which a questionnaire, test, observation or any measurement procedure produces the same results on repeated trials. Inshort, it is the stability or consistency of scores over time or across raters. Keepin mind that reliability pertains to scores not people. Thus, in research we wouldnever say that someone was reliable. As an example, consider judges in aplatform diving competition. The extent to which they agree on the scores for each contestant is an indication of reliability. Similarly, the degree to which an
individual’s responses (i.e., their scores) on a survey would stay the same over time is also a sign of reliability.
An important point to understand is that a measure can be perfectly reliable andyet not be valid. Consider a bathroom scale that always weighs you as being 5lbs. heavier than your true weight. This scale (though invalid as it incorrectlyassesses weight) is perfectly reliable as it consistently weighs you as being 5 lbs.heavier than you truly are. A research example of this phenomenon would be aquestionnaire designed to assess job satisfaction that asked questions such as,“Do you like to watch basketball games?”, “What do you like to eat more, pizzaor hamburgers?” and “What is your favorite movie?”. As you can readily imagine,the responses to these questions would probably remain stable over time, thus,demonstrating highly reliable scores. However, are the questions valid when oneis attempting to measure job satisfaction? Of course not, as they have nothing todo with an individual’s level of job satisfaction.
7/27/2019 Reliability of a test report latest.doc
http://slidepdf.com/reader/full/reliability-of-a-test-report-latestdoc 2/18
Reliability Versus Validity
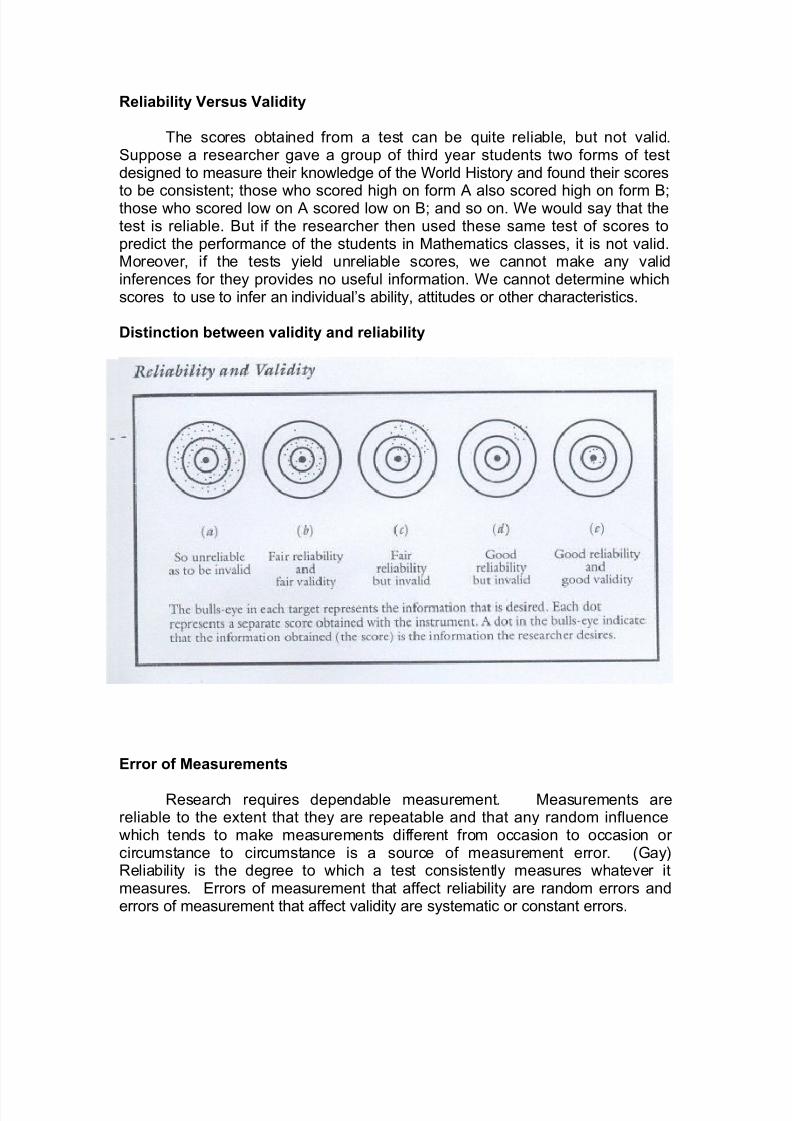
The scores obtained from a test can be quite reliable, but not valid.Suppose a researcher gave a group of third year students two forms of testdesigned to measure their knowledge of the World History and found their scores
to be consistent; those who scored high on form A also scored high on form B;those who scored low on A scored low on B; and so on. We would say that thetest is reliable. But if the researcher then used these same test of scores topredict the performance of the students in Mathematics classes, it is not valid.Moreover, if the tests yield unreliable scores, we cannot make any validinferences for they provides no useful information. We cannot determine whichscores to use to infer an individual’s ability, attitudes or other characteristics.
Distinction between validity and reliability
Error of Measurements
Research requires dependable measurement. Measurements arereliable to the extent that they are repeatable and that any random influencewhich tends to make measurements different from occasion to occasion or circumstance to circumstance is a source of measurement error. (Gay)Reliability is the degree to which a test consistently measures whatever itmeasures. Errors of measurement that affect reliability are random errors anderrors of measurement that affect validity are systematic or constant errors.
7/27/2019 Reliability of a test report latest.doc
http://slidepdf.com/reader/full/reliability-of-a-test-report-latestdoc 3/18
A participant’s score on a particular measure consists of 2 components:
Observed score = True score + Measurement Error
A participant’s true score is the score that the participant would have obtained if
measurement was perfect—i.e., we were able to measure without error.Measurement error is the component of the observed score that is the result of factors that distort the score from its true value.
Both the true score and error score are unobserved and must be estimated. Theconcept of error score is at the heart of reliability. The goal of good measurementdesign is to minimize the error component. Note: In the simple model above,error is thought to occur randomly. The importance of random error may berecognized if an assessment is used repeatedly to measure the same individual.The observed score would not be the same on each repeated assessment. In
fact, scores are more or less variable, depending on the reliability of theassessment instrument. The best estimate of an examinee’s true score is theaverage of observed scores obtained from repeated measures. The variabilityaround the mean is the theoretical concept of error, also called error variance.
As noted earlier, measurement error can occur in the form of either systematicbias, which deals with construct validity, or random error, which deals withreliability. Random error can never be eliminated completely
Factors that Influence Measurement Error
There are several factors that can influence measurement error in test scores.
For example:
Time Sampling Error: Time Sampling Error is the fluctuation in test scoresobtained from repeat testing of the same individual. How an individual performstoday may differ on how they will perform on tomorrow. The list below is not anexhaustive list, however, the list below are some things to think about regardingpossible sources of measurement error:
1) Personality & Abilities: do not change as much over time2) Learning maturation: will change in individuals over time3) Intervening experiences: An individual might learn new information
from one administration of an assessment to another administration of an assessment.
4) Carry-over effect: less time between testing can impact one’s testscore
5) Practice effect: your skills tend to increase with practice
7/27/2019 Reliability of a test report latest.doc
http://slidepdf.com/reader/full/reliability-of-a-test-report-latestdoc 4/18
Other sources of Measurement Errors:
6) Length of the test. Longer tests generally have better reliability.7) Variability in the group of examinees. Generally, the more diversity in
the group of test takers, the more reliable the test.
8) Degree of difficulty of test items impacts reliability. Items must be “justright,” and not too easy or difficult.9) Situational factors of the research setting (room temperature, lighting,
crowding, etc.).
The above factors are typical considerations in test construction in an effort todevelop reliable tests.
The reliability of a measure is an inverse function of measurement error. Themore error, the less reliable the measure and reliable measures provide
consistent measurement from occasion to occasion
How reliable should tests be? There are no absolute standards on what isgood or bad reliability. For example, if you are creating a new drug to curediseases, you may want your reliability to be a little higher than generallyaccepted standards. The below are some guidelines for gauging reliability.
.70 or higher is considered Acceptable Reliability
.60-.69 is considered Marginally Acceptable ReliabilityBelow .60 is considered Unreliable Reliability
When a reliability coefficient equals 0, the scores reflect nothing butmeasurement error
Reliability Coefficients
Due to a variety of factors such cited previously , some people take thesame test twice will seldom perform exactly the same; thus, results in error of measurements. Since error of measurements are always present to somedegree, researchers expect some variation of test scores; reliability estimatesprovides them an idea of how much variation to expect. Such estimates areknown as reliability Coefficients.
Four Ways to Obtain A Reliability Coefficients
1. Test- Retest Method (Coefficient of Stability)
It involves administering the same test twice to the same groupafter a certain time interval has elapsed. The reliability coefficient is thencalculated to indicate the relationship between the two sets of scores obtained
7/27/2019 Reliability of a test report latest.doc
http://slidepdf.com/reader/full/reliability-of-a-test-report-latestdoc 5/18
using the Pearson Moment Correlation. Test-retest reliability is the degree towhich scores are consistent over time. It indicates score variation that occursfrom testing session to testing session as a result of errors of measurement
2. Equivalent or parallel Forms Method (Coefficient of Equivalence)
When the equivalent-forms method is used, two different but equivalentforms of a test are administered to the same group of individuals during the sametime period. Although the questions are different, they should sample the samecontent and they should be constructed separately from each other. Used when itis likely that test takers will recall responses made during the first session and when alternate forms are available. A reliability coefficient is then calculatedbetween the two sets of scores obtained. The problem with this method is that itis difficult to construct two forms of test or instrument that are essentiallyequivalent.
3. Equivalence and Stability
When a researcher needs to give a pretest and posttest to assess achange in behavior, reliability of equivalence and stability should be established.In this procedure, reliability data are obtained by administering to the same groupof individuals one form of an instrument at one time and a second form at a latedate. If an instrument has this type of reliability, the researcher can be confidentthat a change in score across time reflects an actual difference in the trait beingmeasured.
4. Internal-Consistency Methods
There are several internal-consistency methods of estimating reliability,however, unlike the two mentioned above, it requires only a single administrationof the test.
a. Split-half Procedure- involves scoring two halves (usually odd itemsversus even items) of a test separately for each person and thencalculating a correlation coefficient for the two sets of scores. Thecoefficient indicates the degree to which the two halves of the testprovide the same results. The reliability coefficient is calculated usingSpearman-Brown prophecy formula.
Reliablity of scores test for yreliabilit xtest for yreliabilit x
2/11
2/12=
7/27/2019 Reliability of a test report latest.doc
http://slidepdf.com/reader/full/reliability-of-a-test-report-latestdoc 6/18
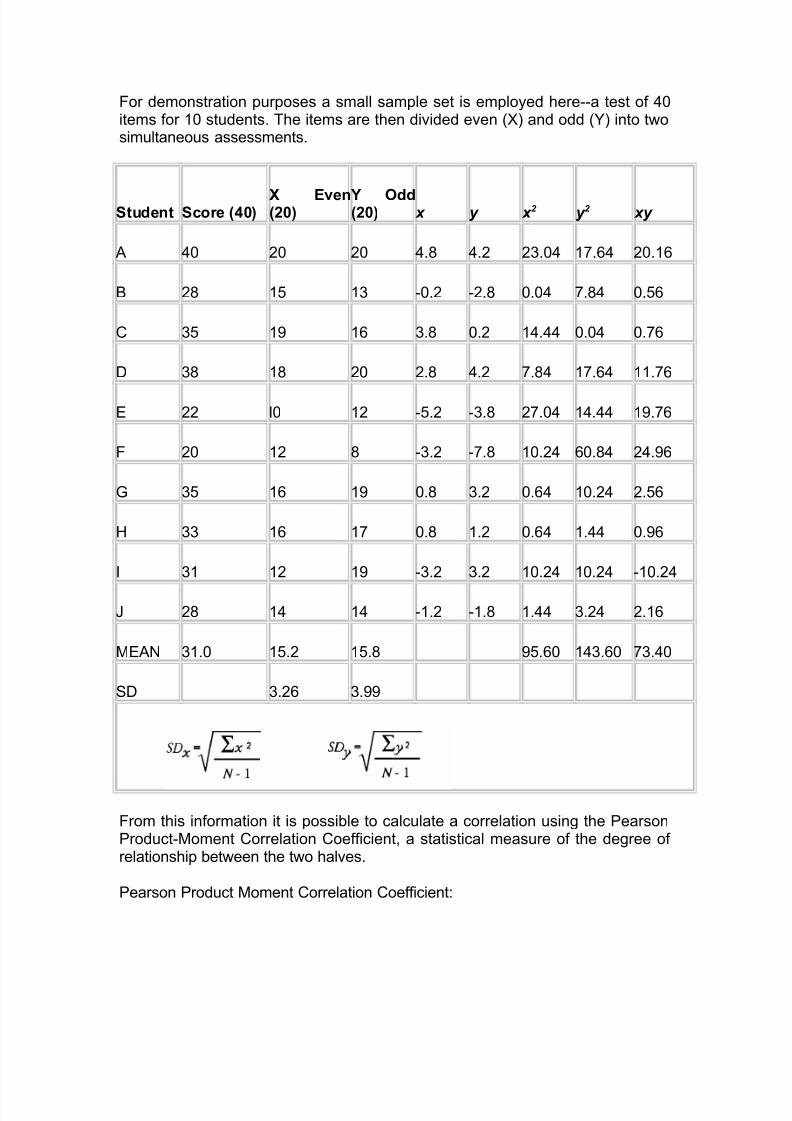
For demonstration purposes a small sample set is employed here--a test of 40items for 10 students. The items are then divided even (X) and odd (Y) into twosimultaneous assessments.
Student Score (40) X Even(20)
Y Odd(20) x y x 2 y 2 xy
A 40 20 20 4.8 4.2 23.04 17.64 20.16
B 28 15 13 -0.2 -2.8 0.04 7.84 0.56
C 35 19 16 3.8 0.2 14.44 0.04 0.76
D 38 18 20 2.8 4.2 7.84 17.64 11.76
E 22 l0 12 -5.2 -3.8 27.04 14.44 19.76
F 20 12 8 -3.2 -7.8 10.24 60.84 24.96
G 35 16 19 0.8 3.2 0.64 10.24 2.56
H 33 16 17 0.8 1.2 0.64 1.44 0.96
I 31 12 19 -3.2 3.2 10.24 10.24 -10.24
J 28 14 14 -1.2 -1.8 1.44 3.24 2.16
MEAN 31.0 15.2 15.8 95.60 143.60 73.40
SD 3.26 3.99
From this information it is possible to calculate a correlation using the PearsonProduct-Moment Correlation Coefficient, a statistical measure of the degree of relationship between the two halves.
Pearson Product Moment Correlation Coefficient:
7/27/2019 Reliability of a test report latest.doc
http://slidepdf.com/reader/full/reliability-of-a-test-report-latestdoc 7/18
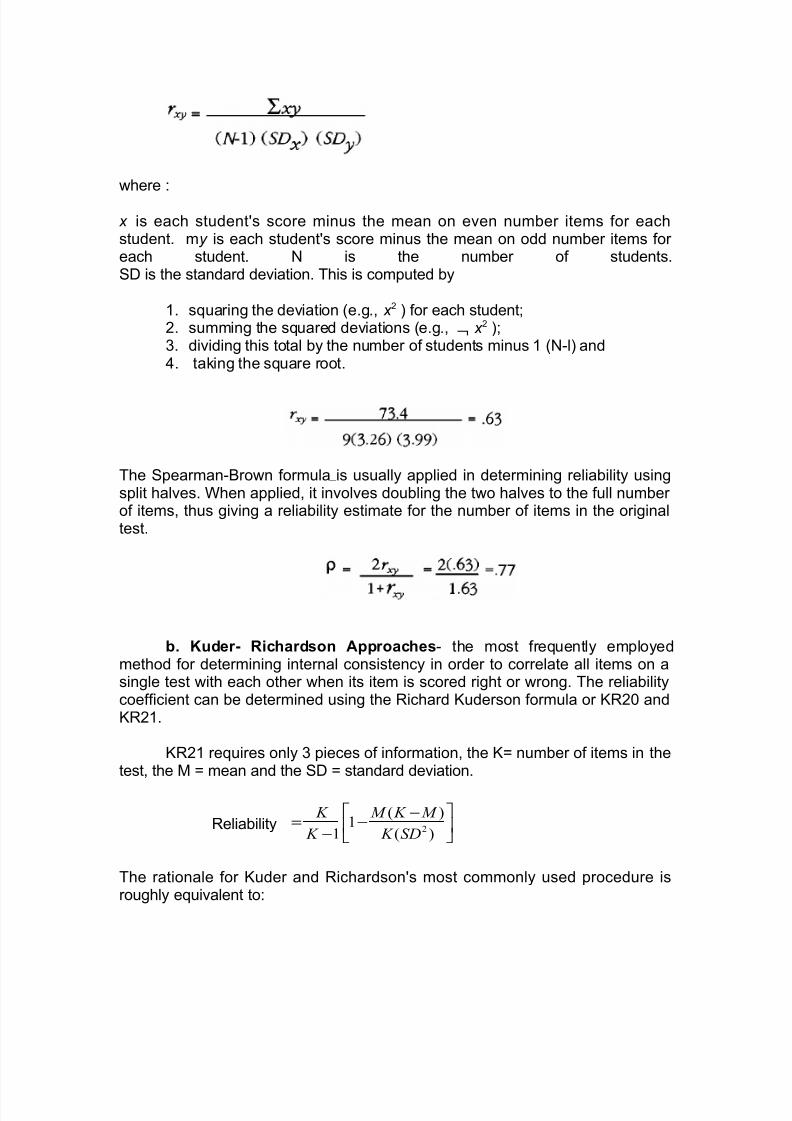
where :
x is each student's score minus the mean on even number items for eachstudent. my is each student's score minus the mean on odd number items for each student. N is the number of students.SD is the standard deviation. This is computed by
1. squaring the deviation (e.g., x 2 ) for each student;2. summing the squared deviations (e.g., x 2 );3. dividing this total by the number of students minus 1 (N-l) and4. taking the square root.
The Spearman-Brown formula is usually applied in determining reliability usingsplit halves. When applied, it involves doubling the two halves to the full number of items, thus giving a reliability estimate for the number of items in the originaltest.
b. Kuder- Richardson Approaches- the most frequently employedmethod for determining internal consistency in order to correlate all items on asingle test with each other when its item is scored right or wrong. The reliabilitycoefficient can be determined using the Richard Kuderson formula or KR20 andKR21.
KR21 requires only 3 pieces of information, the K= number of items in thetest, the M = mean and the SD = standard deviation.
Reliability
The rationale for Kuder and Richardson's most commonly used procedure isroughly equivalent to:
−−
−=
)(
)(1
1 2SD K
M K M
K
K
7/27/2019 Reliability of a test report latest.doc
http://slidepdf.com/reader/full/reliability-of-a-test-report-latestdoc 8/18
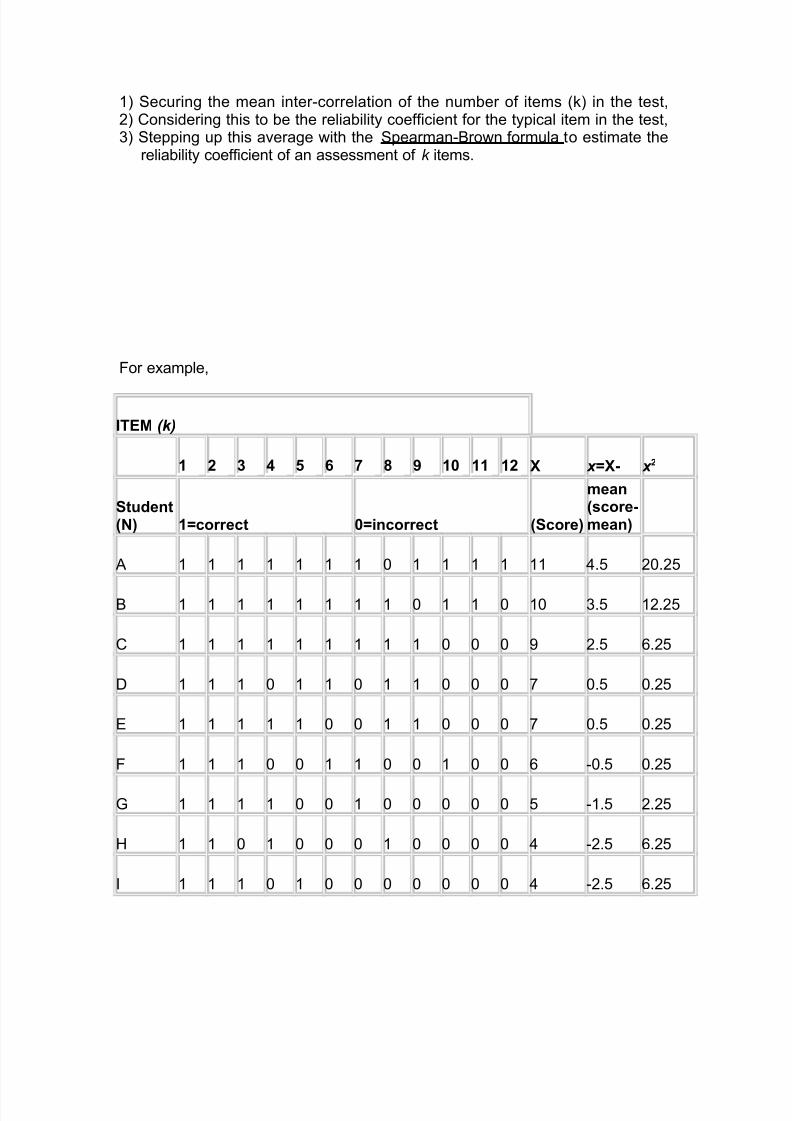
1) Securing the mean inter-correlation of the number of items (k) in the test,2) Considering this to be the reliability coefficient for the typical item in the test,3) Stepping up this average with the Spearman-Brown formula to estimate the
reliability coefficient of an assessment of k items.
For example,
ITEM (k)
1 2 3 4 5 6 7 8 9 10 11 12 X x =X- x 2
Student(N) 1=correct 0=incorrect (Score)
mean(score-mean)
A 1 1 1 1 1 1 1 0 1 1 1 1 11 4.5 20.25
B 1 1 1 1 1 1 1 1 0 1 1 0 10 3.5 12.25
C 1 1 1 1 1 1 1 1 1 0 0 0 9 2.5 6.25
D 1 1 1 0 1 1 0 1 1 0 0 0 7 0.5 0.25
E 1 1 1 1 1 0 0 1 1 0 0 0 7 0.5 0.25
F 1 1 1 0 0 1 1 0 0 1 0 0 6 -0.5 0.25
G 1 1 1 1 0 0 1 0 0 0 0 0 5 -1.5 2.25
H 1 1 0 1 0 0 0 1 0 0 0 0 4 -2.5 6.25
I 1 1 1 0 1 0 0 0 0 0 0 0 4 -2.5 6.25
7/27/2019 Reliability of a test report latest.doc
http://slidepdf.com/reader/full/reliability-of-a-test-report-latestdoc 9/18
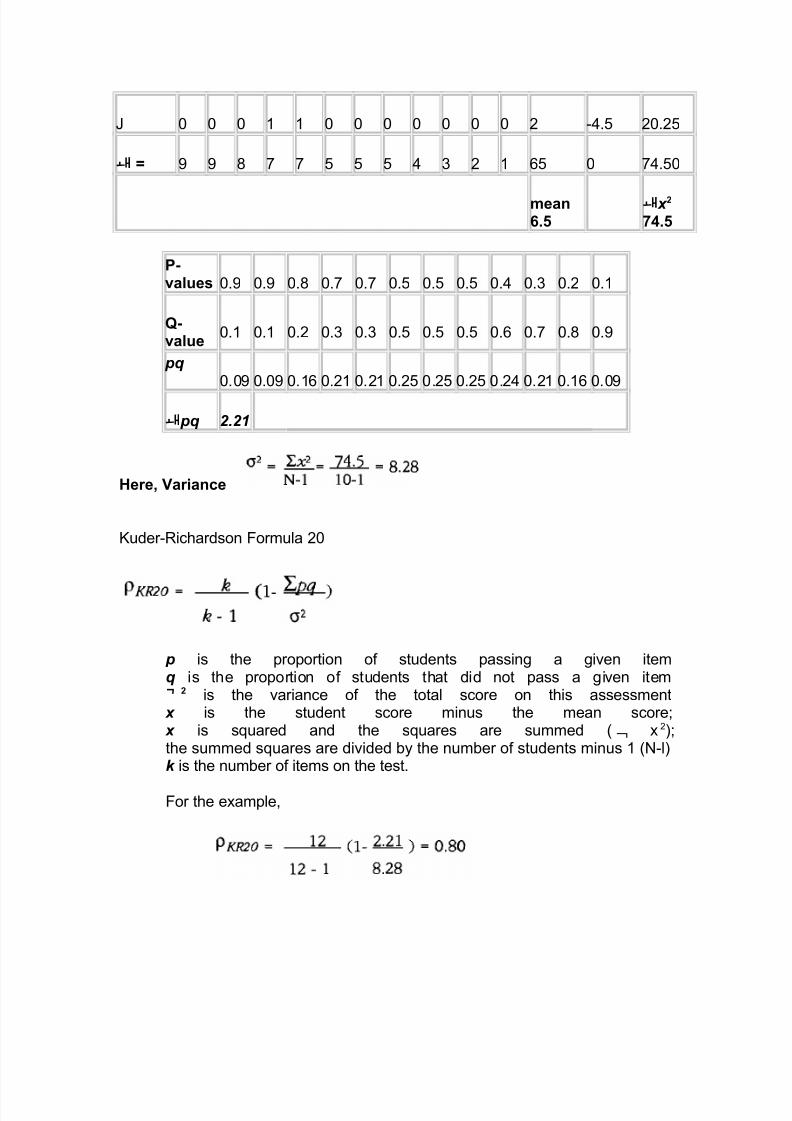
J 0 0 0 1 1 0 0 0 0 0 0 0 2 -4.5 20.25
= 9 9 8 7 7 5 5 5 4 3 2 1 65 0 74.50
mean6.5
x 2 74.5
P-values 0.9 0.9 0.8 0.7 0.7 0.5 0.5 0.5 0.4 0.3 0.2 0.1
Q-value
0.1 0.1 0.2 0.3 0.3 0.5 0.5 0.5 0.6 0.7 0.8 0.9
pq
0.09 0.09 0.16 0.21 0.21 0.25 0.25 0.25 0.24 0.21 0.16 0.09
pq 2.21
Here, Variance
Kuder-Richardson Formula 20
p is the proportion of students passing a given itemq is the proportion of students that did not pass a given item
2 is the variance of the total score on this assessment x is the student score minus the mean score; x is squared and the squares are summed ( x
2);the summed squares are divided by the number of students minus 1 (N-l)k is the number of items on the test.
For the example,
7/27/2019 Reliability of a test report latest.doc
http://slidepdf.com/reader/full/reliability-of-a-test-report-latestdoc 10/18
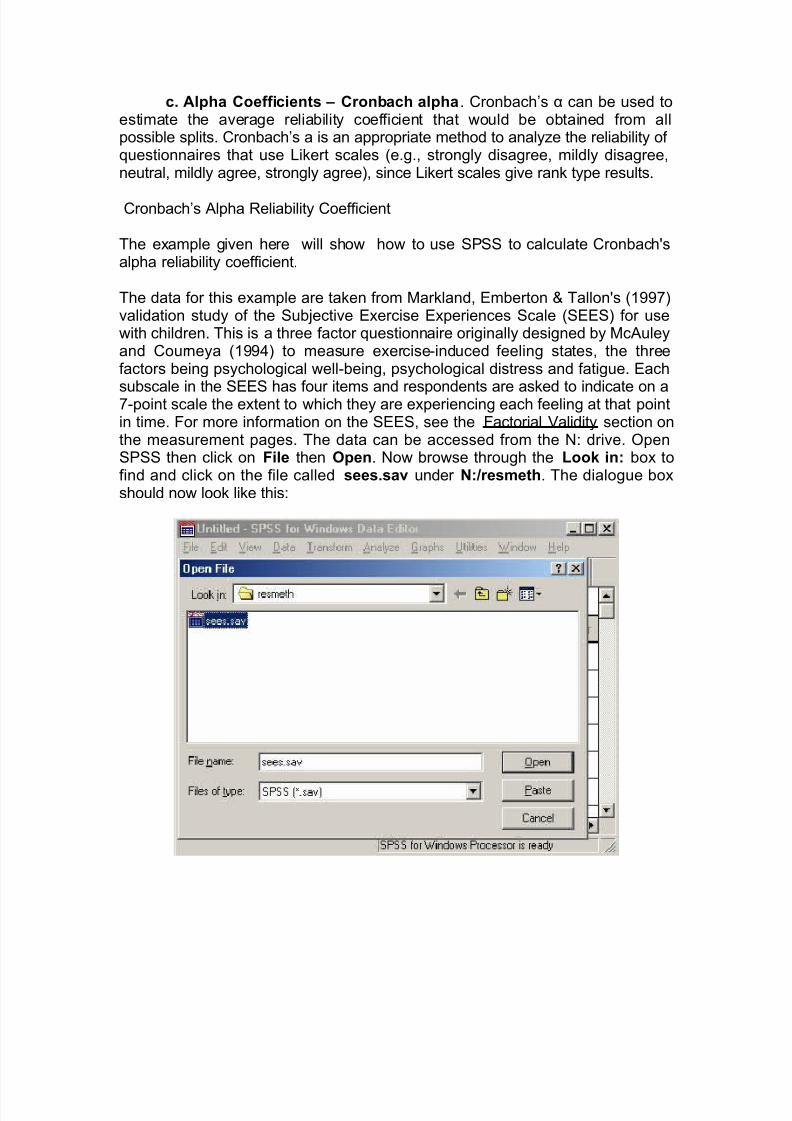
c. Alpha Coefficients – Cronbach alpha. Cronbach’s α can be used toestimate the average reliability coefficient that would be obtained from allpossible splits. Cronbach’s a is an appropriate method to analyze the reliability of questionnaires that use Likert scales (e.g., strongly disagree, mildly disagree,neutral, mildly agree, strongly agree), since Likert scales give rank type results.
Cronbach’s Alpha Reliability Coefficient
The example given here will show how to use SPSS to calculate Cronbach'salpha reliability coefficient.
The data for this example are taken from Markland, Emberton & Tallon's (1997)validation study of the Subjective Exercise Experiences Scale (SEES) for usewith children. This is a three factor questionnaire originally designed by McAuleyand Courneya (1994) to measure exercise-induced feeling states, the threefactors being psychological well-being, psychological distress and fatigue. Each
subscale in the SEES has four items and respondents are asked to indicate on a7-point scale the extent to which they are experiencing each feeling at that pointin time. For more information on the SEES, see the Factorial Validity section onthe measurement pages. The data can be accessed from the N: drive. OpenSPSS then click on File then Open. Now browse through the Look in: box tofind and click on the file called sees.sav under N:/resmeth. The dialogue boxshould now look like this:
7/27/2019 Reliability of a test report latest.doc
http://slidepdf.com/reader/full/reliability-of-a-test-report-latestdoc 11/18
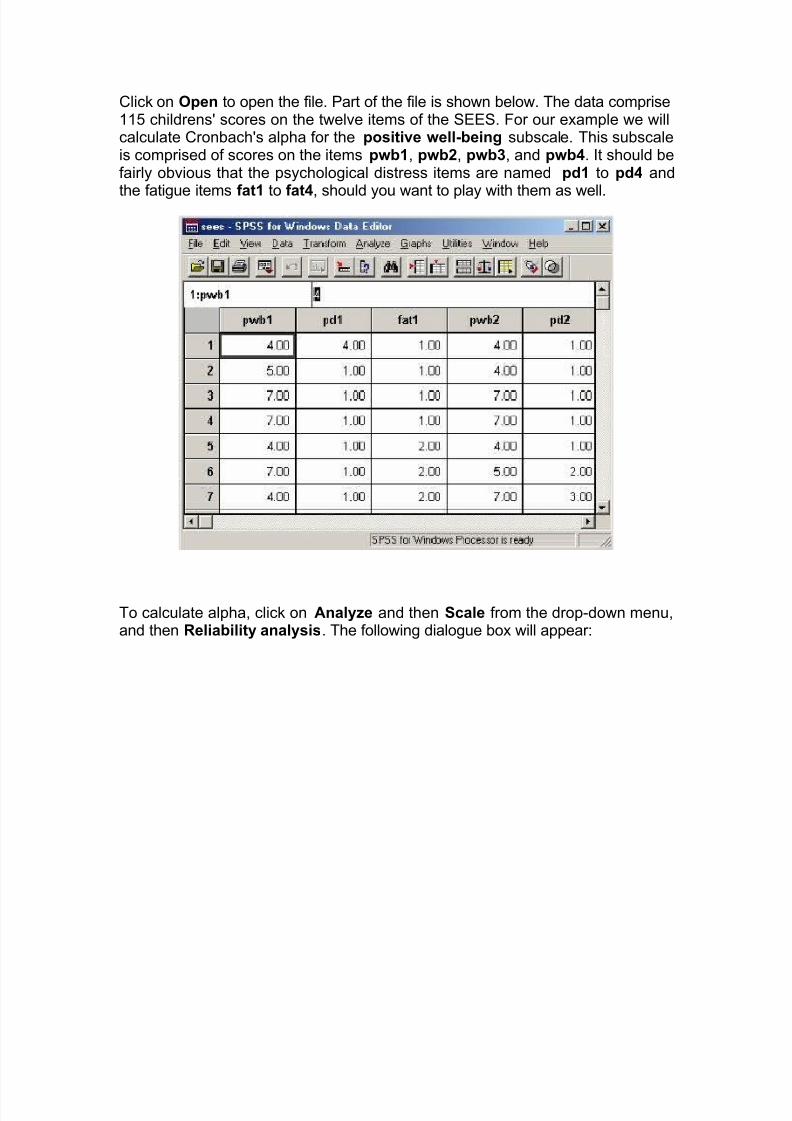
Click on Open to open the file. Part of the file is shown below. The data comprise115 childrens' scores on the twelve items of the SEES. For our example we willcalculate Cronbach's alpha for the positive well-being subscale. This subscaleis comprised of scores on the items pwb1, pwb2, pwb3, and pwb4. It should befairly obvious that the psychological distress items are named pd1 to pd4 and
the fatigue items fat1 to fat4, should you want to play with them as well.
To calculate alpha, click on Analyze and then Scale from the drop-down menu,and then Reliability analysis. The following dialogue box will appear:
7/27/2019 Reliability of a test report latest.doc
http://slidepdf.com/reader/full/reliability-of-a-test-report-latestdoc 12/18
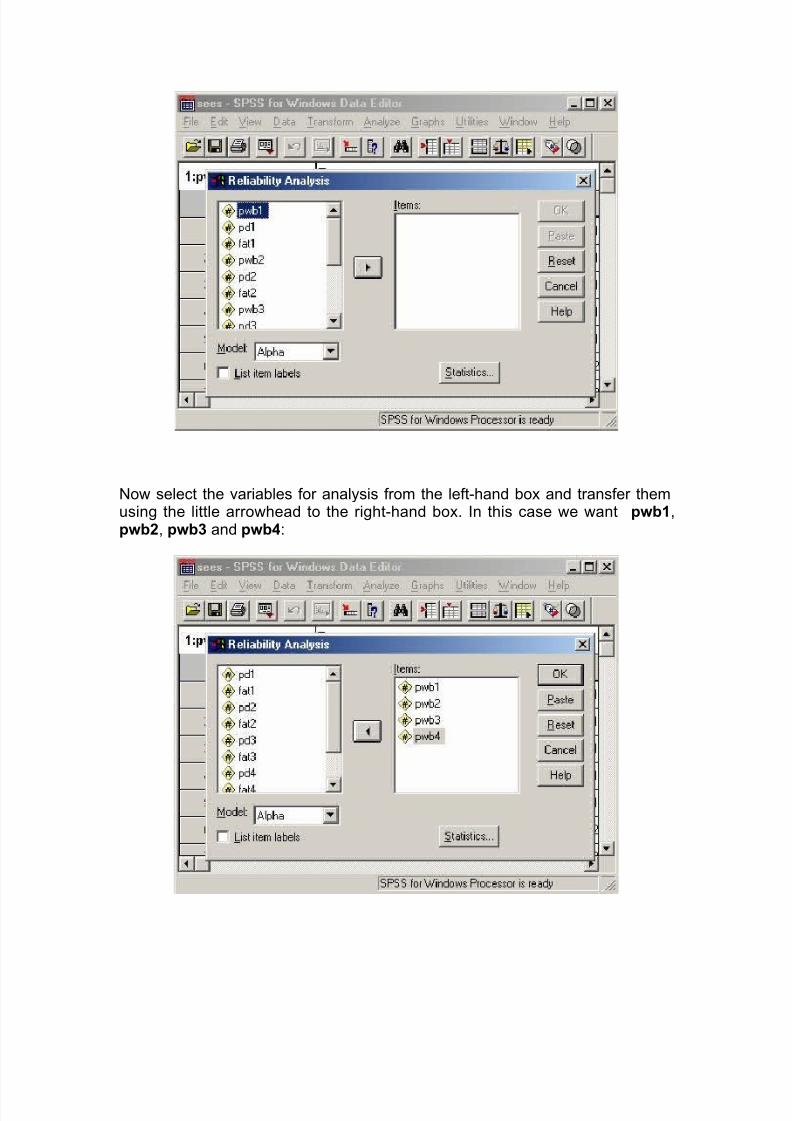
Now select the variables for analysis from the left-hand box and transfer themusing the little arrowhead to the right-hand box. In this case we want pwb1,pwb2, pwb3 and pwb4:
7/27/2019 Reliability of a test report latest.doc
http://slidepdf.com/reader/full/reliability-of-a-test-report-latestdoc 13/18
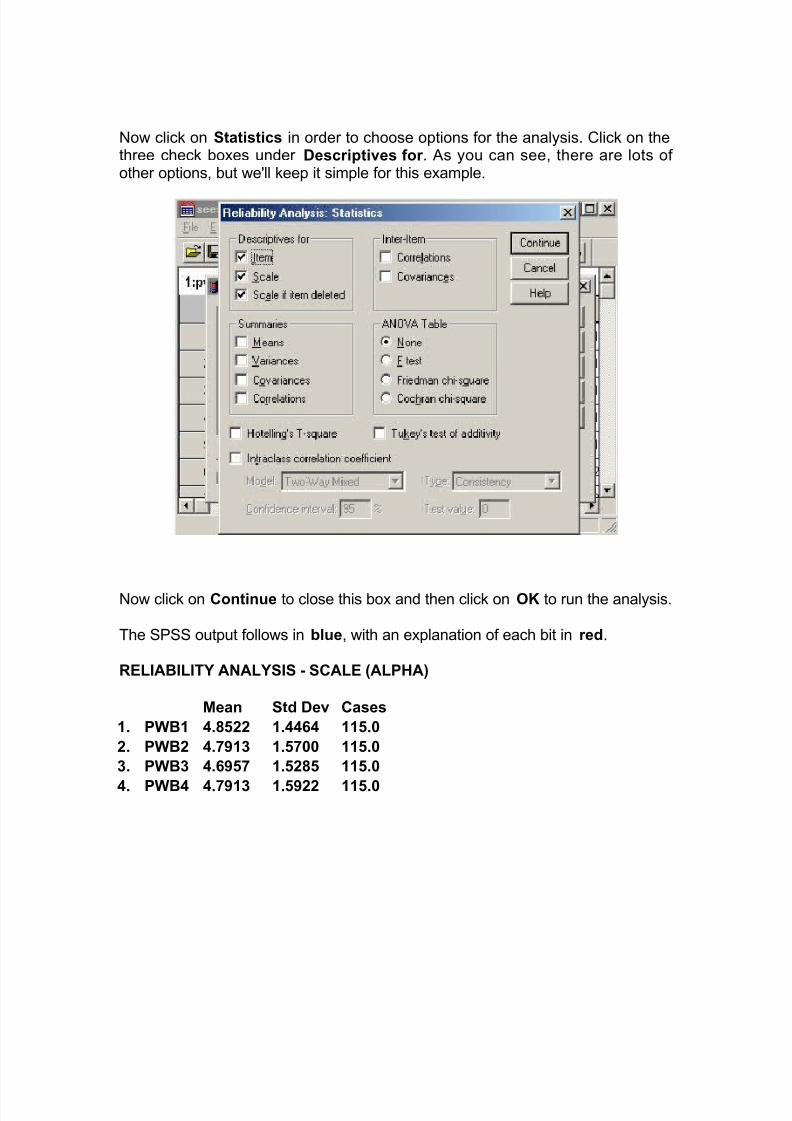
Now click on Statistics in order to choose options for the analysis. Click on thethree check boxes under Descriptives for . As you can see, there are lots of other options, but we'll keep it simple for this example.
Now click on Continue to close this box and then click on OK to run the analysis.
The SPSS output follows in blue, with an explanation of each bit in red.
RELIABILITY ANALYSIS - SCALE (ALPHA)
Mean Std Dev Cases
1. PWB1 4.8522 1.4464 115.0
2. PWB2 4.7913 1.5700 115.0
3. PWB3 4.6957 1.5285 115.0
4. PWB4 4.7913 1.5922 115.0
7/27/2019 Reliability of a test report latest.doc
http://slidepdf.com/reader/full/reliability-of-a-test-report-latestdoc 14/18
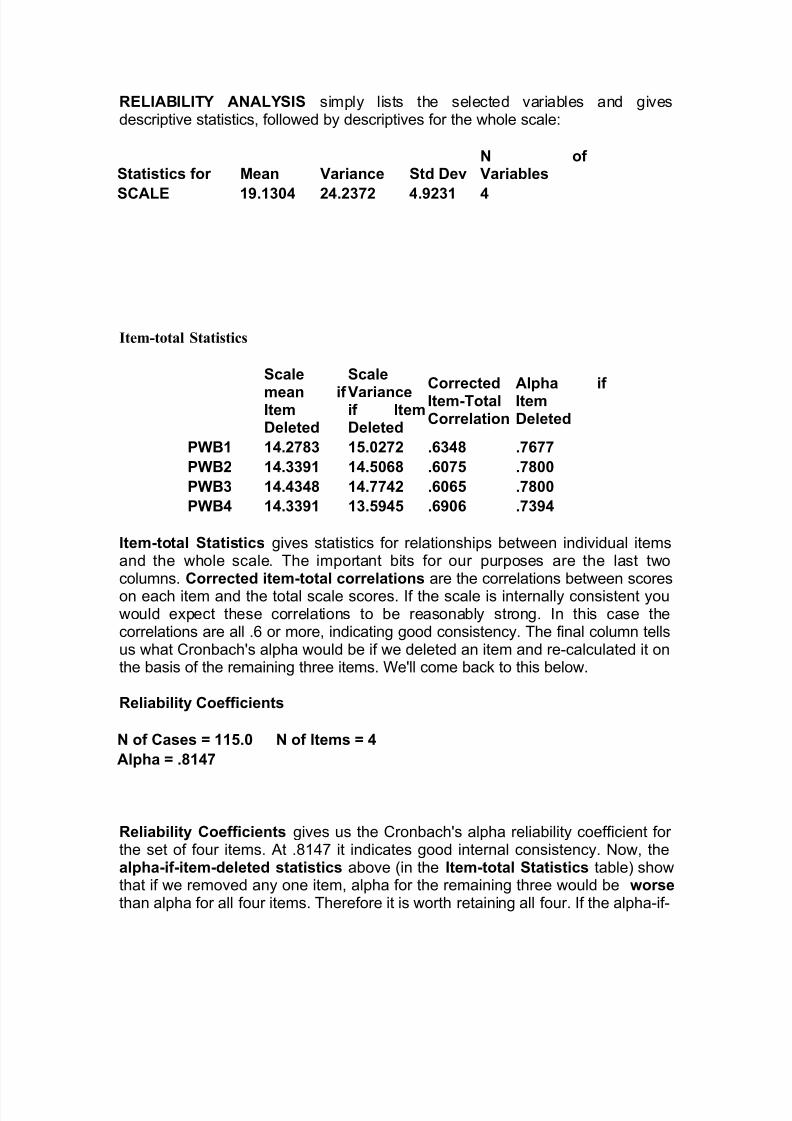
RELIABILITY ANALYSIS simply lists the selected variables and givesdescriptive statistics, followed by descriptives for the whole scale:
Item-total Statistics
Scale
mean if ItemDeleted
Scale
Varianceif ItemDeleted
CorrectedItem-TotalCorrelation
Alpha if ItemDeleted
PWB1 14.2783 15.0272 .6348 .7677
PWB2 14.3391 14.5068 .6075 .7800
PWB3 14.4348 14.7742 .6065 .7800
PWB4 14.3391 13.5945 .6906 .7394
Item-total Statistics gives statistics for relationships between individual itemsand the whole scale. The important bits for our purposes are the last twocolumns. Corrected item-total correlations are the correlations between scoreson each item and the total scale scores. If the scale is internally consistent youwould expect these correlations to be reasonably strong. In this case thecorrelations are all .6 or more, indicating good consistency. The final column tellsus what Cronbach's alpha would be if we deleted an item and re-calculated it onthe basis of the remaining three items. We'll come back to this below.
Reliability Coefficients
Reliability Coefficients gives us the Cronbach's alpha reliability coefficient for the set of four items. At .8147 it indicates good internal consistency. Now, thealpha-if-item-deleted statistics above (in the Item-total Statistics table) showthat if we removed any one item, alpha for the remaining three would be worsethan alpha for all four items. Therefore it is worth retaining all four. If the alpha-if-
Statistics for Mean Variance Std DevN of Variables
SCALE 19.1304 24.2372 4.9231 4
N of Cases = 115.0 N of Items = 4
Alpha = .8147
7/27/2019 Reliability of a test report latest.doc
http://slidepdf.com/reader/full/reliability-of-a-test-report-latestdoc 15/18
item-deleted statistics showed that removing an item would lead to an increasein alpha, then we would consider doing that in order to improve the internalconsistency of the scale. Try re-running the analysis but including the variable"fat1" and you will see what I mean.
5. Agreement
The coefficient of agreement is established by determining the extent towhich two or more persons agree about what they have seen, heard, or rated.This type of reliability is commonly used for observational research and studiesinvolving performance-based assessments in which professional judgment aremade about participants’ performance.
Two important decisions which precede the establishment of a rater agreementpercentage are:
1. How close do scores by raters have to be to count as in "agreement?" In alimited holistic scale, (e.g., 1-4 points) it is most likely that you will requireexact agreement among raters. If an analytic scale is employed with 30 to40 points, it may be determined that exact and adjacent scores will countas being in agreement.
2. What percentage of agreement will be acceptable to ensure reliability?80% agreement is promoted as a minimum standard above, butcircumstances relative to the use of the scale may warrant exercising alower level of acceptance. The choice of an acceptable percentage of
agreement must be established by the school or district. It is advisablethat the decision be consultative.
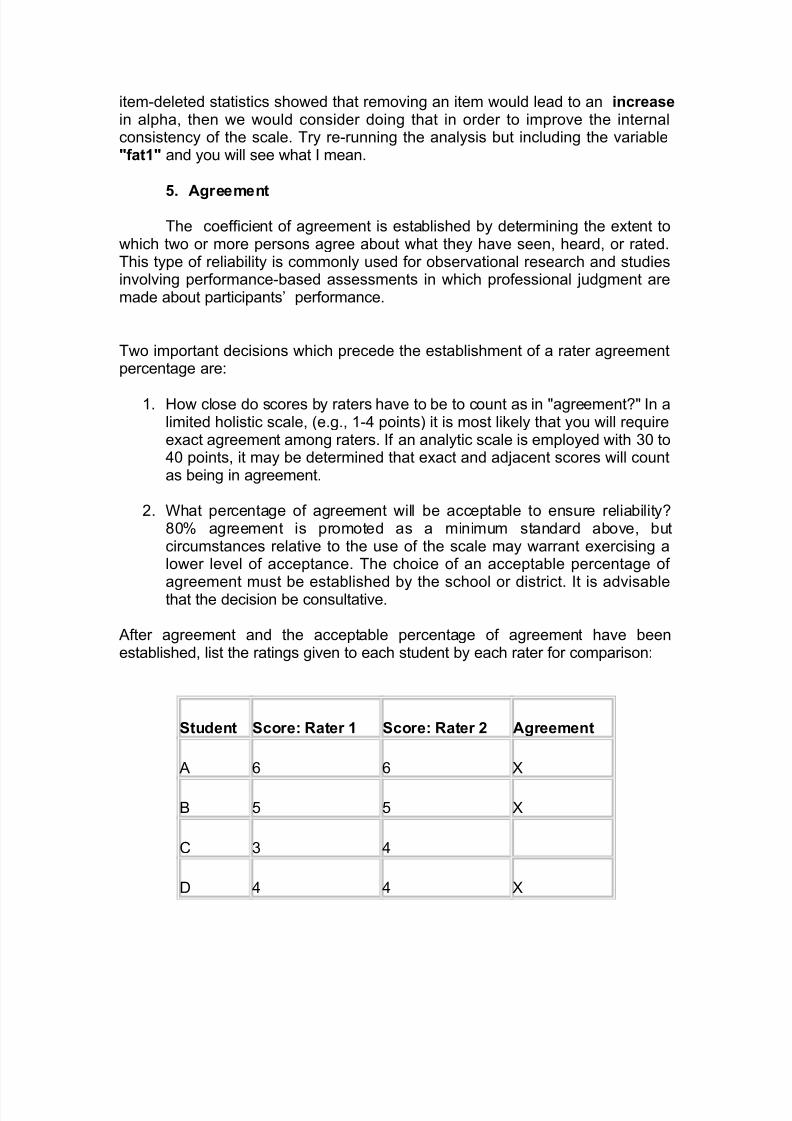
After agreement and the acceptable percentage of agreement have beenestablished, list the ratings given to each student by each rater for comparison:
Student Score: Rater 1 Score: Rater 2 Agreement
A 6 6 X
B 5 5 X
C 3 4
D 4 4 X

7/27/2019 Reliability of a test report latest.doc
http://slidepdf.com/reader/full/reliability-of-a-test-report-latestdoc 16/18
E 2 3
F 7 7 X
G 6 6 X
H 5 5 X
I 3 4
J 7 7 X
Dividing the number of cases where student scores between the raters are inagreement (7) with the total number of cases (10) determines the rater agreement percentage (70%).
When there are more than two teachers, the consistency of ratings for twoteachers at a time can be calculated with the same method. For example, if threeteachers are employed as raters, rater agreement percentages should becalculated for
Rater 1 and Rater 2
Rater 1 and Rater 3
Rater 2 and Rater 3
All calculations should exceed the acceptable reliability score. If there is occasionto use more than two raters for the same assessment performance or product, ananalysis of variance using the scorers as the independent variable can becomputed using the sum of squares.
Interpretation of Reliability Coefficients
1. The more heterogeneous the group is on the trait that is measured, the
higher the reliability.
2. The more items there are in an instrument, the higher the reliability.
3. The greater the range of scores, the higher the reliability.
4. Achievement test with a medium difficulty level will result in a higher reliability than either very hard or very easy tests.
7/27/2019 Reliability of a test report latest.doc
http://slidepdf.com/reader/full/reliability-of-a-test-report-latestdoc 17/18
5. Reliability like validity, when based on a norming group, is demonstratedonly for subjects whose characteristics are similar to those of the norminggroup.
6. The more the items discriminate between high and low achievers, thegreater the reliability.
Remember that our ability to answer our research question is only as good asthe instruments we develop our data collection procedure. Well-trained andmotivated observers or a well-developed survey instrument will better provide uswith quality data with which to answer a question or solve a problem. Finally, wemust be aware that reliability is necessary but not sufficient for validity. That is,for something to be valid it must be reliable but it must also measure what it isintended to measure.
References
Berk, R., 1979. Generalizability of Behavioral Observations: A Clarification of
Interobserver Agreement and Interobserver Reliability. American Journal
of Mental Deficiency , Vol. 83, No. 5, p. 460-472.
Cronbach, L., 1990. Essentials of psychological testing. Harper & Row, New
York.
Carmines, E., and Zeller, R., 1979. Reliability and Validity Assessment . Sage
Publications, Beverly Hills, California.

7/27/2019 Reliability of a test report latest.doc
http://slidepdf.com/reader/full/reliability-of-a-test-report-latestdoc 18/18
Gay, L., 1987. Eductional research: competencies for analysis and application.
Merrill Pub. Co., Columbus.
Guilford, J., 1954. Psychometric Methods. McGraw-Hill, New York.
Nunnally, J., 1978. Psychometric Theory. McGraw-Hill, New York.
Winer, B., Brown, D., and Michels, K., 1991. Statistical Principles in
Experimental Design, Third Edition. McGraw-Hill, New York.