Embed Size (px)
Citation preview
RELEVANT & RELIABLE
ROYAL VOPAK
EELCO HOEKSTRA, CHAIRMAN & CEO
16 JUNE 2016
Vopak employee witnessing the commissioning of the Vlissingen LPG expansion project
Capital Markets Days 2016
2
FORWARD LOOKING STATEMENTS
The presentations contain ‘forward-looking statements’, based on currently available plans and forecasts.
By their nature, forward-looking statements involve risks and uncertainties because they relate to events and
depend on circumstances that may or may not occur in the future, and Vopak cannot guarantee the accuracy
and completeness of forward-looking statements.
These risks and uncertainties include, but are not limited to, factors affecting the realization of ambitions and
financial expectations, developments regarding the potential capital raising, exceptional income and expense
items, operational developments and trading conditions, economic, political and foreign exchange
developments and changes to IFRS reporting rules.
Vopak’s outlook does not represent a forecast or any expectation of future results or financial performance.
Statements of a forward-looking nature issued by the company must always be assessed in the context of the
events, risks and uncertainties of the markets and environments in which Vopak operates. These factors
could lead to actual results being materially different from those expected, and Vopak does not undertake to
publicly update or revise any of these forward-looking statements.
Capital Markets Days 2016
2
Capital Markets Days 2016
3
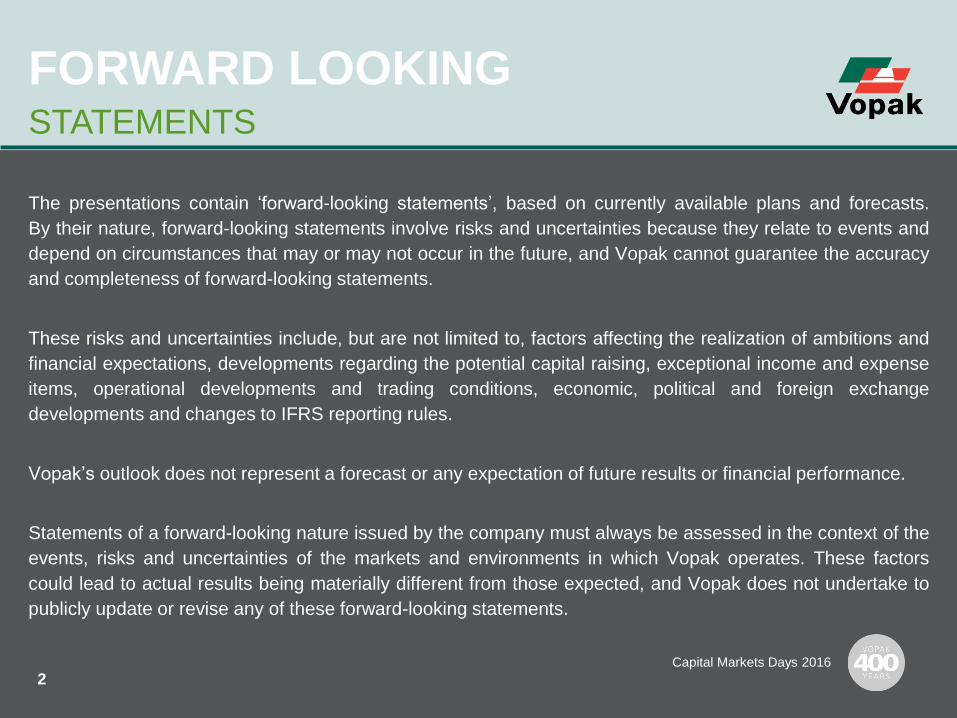
SUMMARY KEY TOPICS
Looking back at 400 years of history
o Historic overview
o Value creation journey
Strategic pillars – what we believe in and why
o Growth, operational and customer leadership
o Fit for the future
Looking forward with confidence
o Mega trends impacting economies and end-markets relevant to Vopak
o Changing market dynamics – outlook oil, chemicals and gas flows
LOOKING BACK 400 YEARS OF EXPERIENCE
Capital Markets Days 2016
5
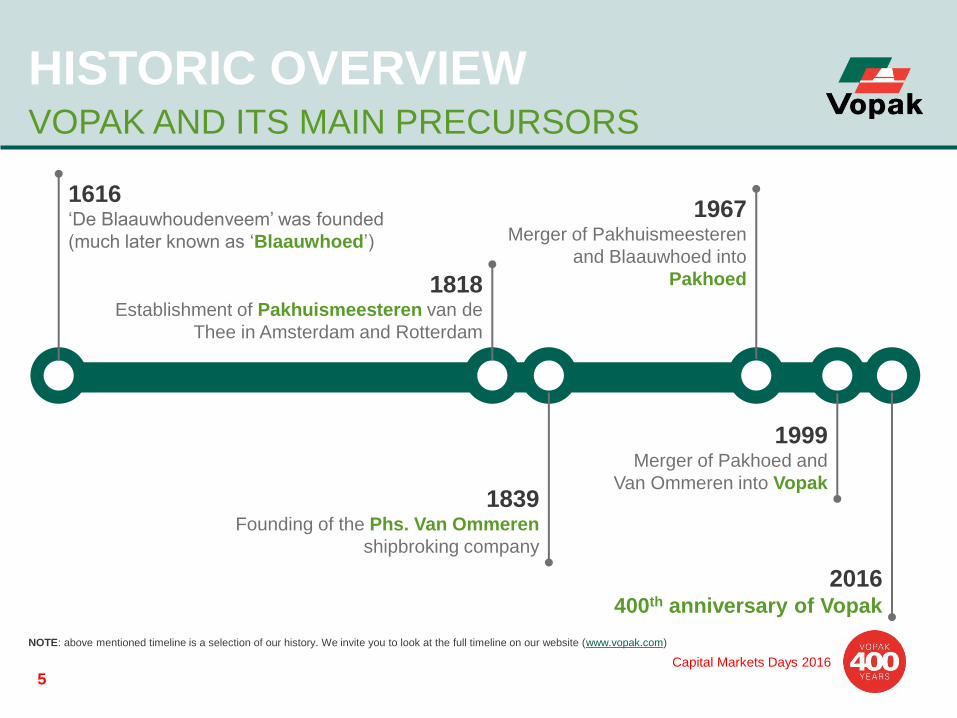
1616 ‘De Blaauwhoudenveem’ was founded
(much later known as ‘Blaauwhoed’)
2016 400th anniversary of Vopak
1818 Establishment of Pakhuismeesteren van de
Thee in Amsterdam and Rotterdam
1839 Founding of the Phs. Van Ommeren
shipbroking company
1967 Merger of Pakhuismeesteren
and Blaauwhoed into
Pakhoed
1999 Merger of Pakhoed and
Van Ommeren into Vopak
NOTE: above mentioned timeline is a selection of our history. We invite you to look at the full timeline on our website (www.vopak.com)
HISTORIC OVERVIEW VOPAK AND ITS MAIN PRECURSORS
Capital Markets Days 2016
6
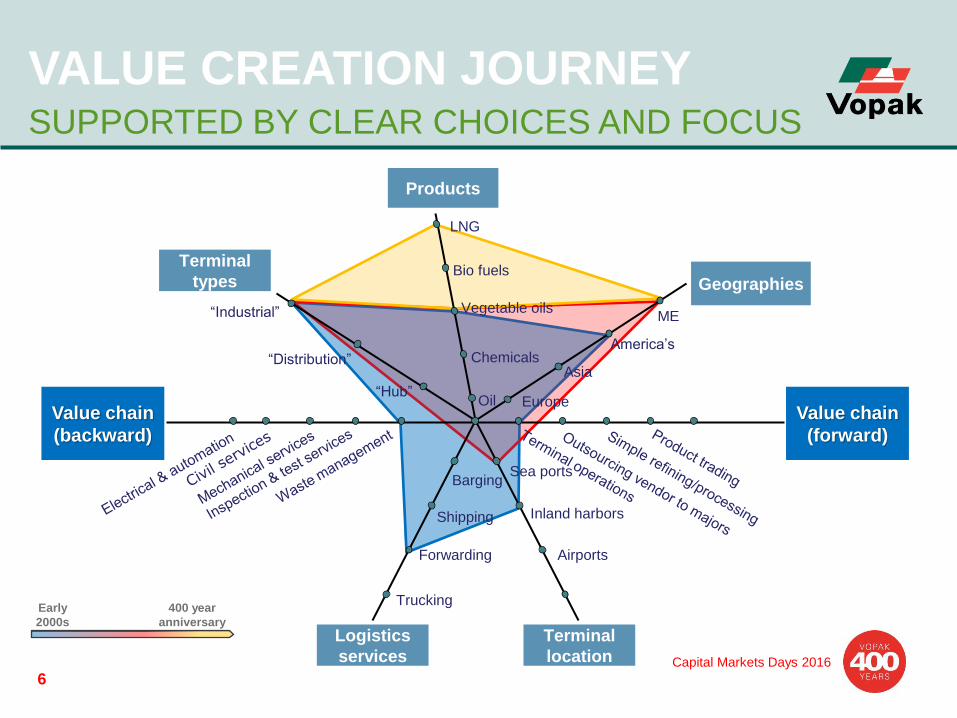
Geographies
VALUE CREATION JOURNEY SUPPORTED BY CLEAR CHOICES AND FOCUS
Products
Logistics
services
Terminal
location
Value chain
(forward)
Terminal
types
LNG
Bio fuels
Vegetable oils
Chemicals
Oil
ME
America’s
Asia
Europe
“Industrial”
“Distribution”
“Hub”
Barging
Shipping
Forwarding
Sea ports
Inland harbors
Airports
Trucking
Value chain
(backward)
Early
2000s
400 year
anniversary
Capital Markets Days 2016
7
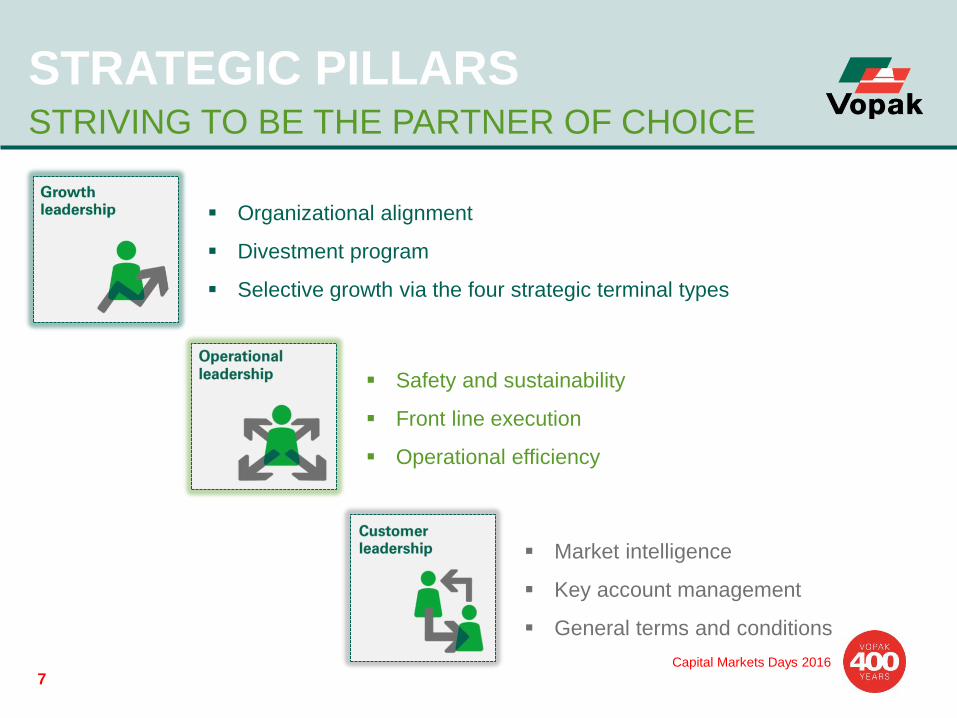
STRATEGIC PILLARS STRIVING TO BE THE PARTNER OF CHOICE
Organizational alignment
Divestment program
Selective growth via the four strategic terminal types
Safety and sustainability
Front line execution
Operational efficiency
Market intelligence
Key account management
General terms and conditions
Capital Markets Days 2016
8
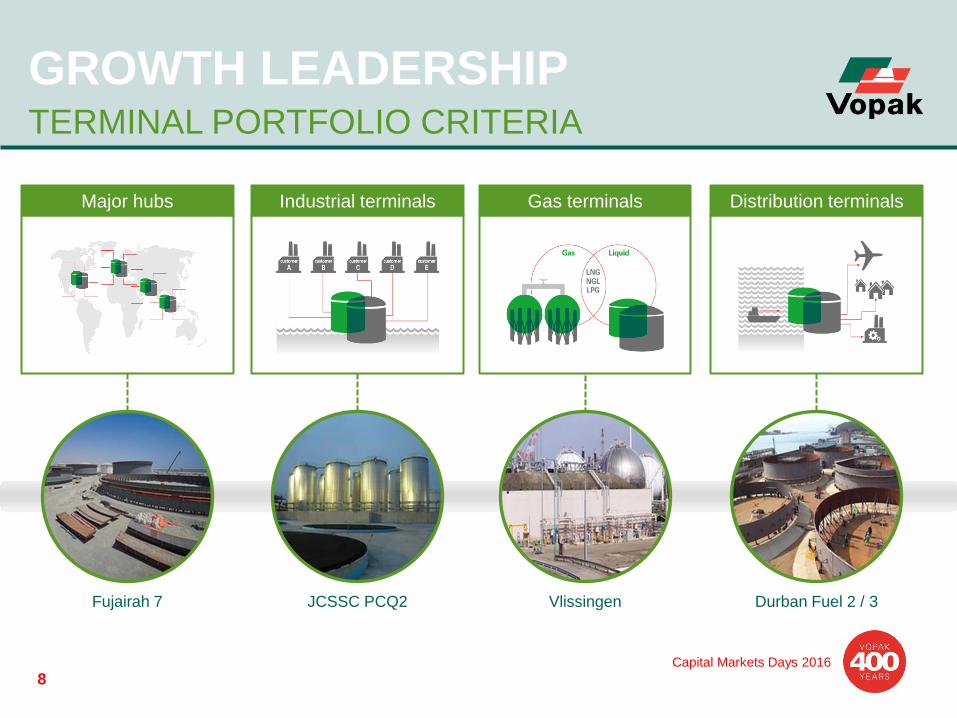
GROWTH LEADERSHIP TERMINAL PORTFOLIO CRITERIA
JCSSC PCQ2 Durban Fuel 2 / 3 Vlissingen Fujairah 7
Distribution terminals Gas terminals Industrial terminals Major hubs
Capital Markets Days 2016
9
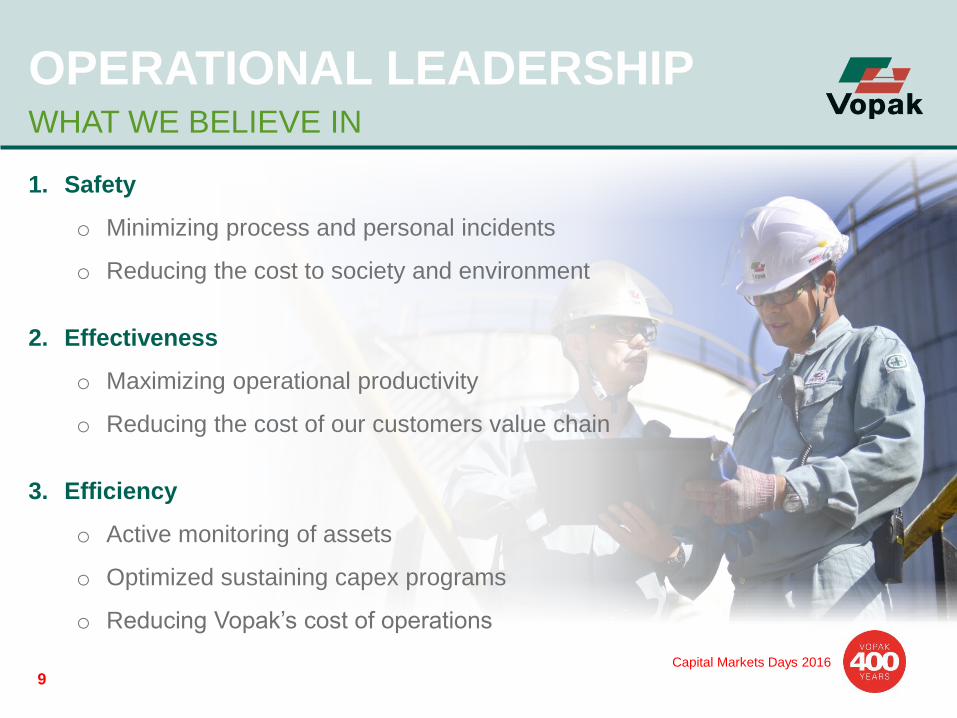
OPERATIONAL LEADERSHIP WHAT WE BELIEVE IN
1. Safety
o Minimizing process and personal incidents
o Reducing the cost to society and environment
2. Effectiveness
o Maximizing operational productivity
o Reducing the cost of our customers value chain
3. Efficiency
o Active monitoring of assets
o Optimized sustaining capex programs
o Reducing Vopak’s cost of operations
Capital Markets Days 2016
10
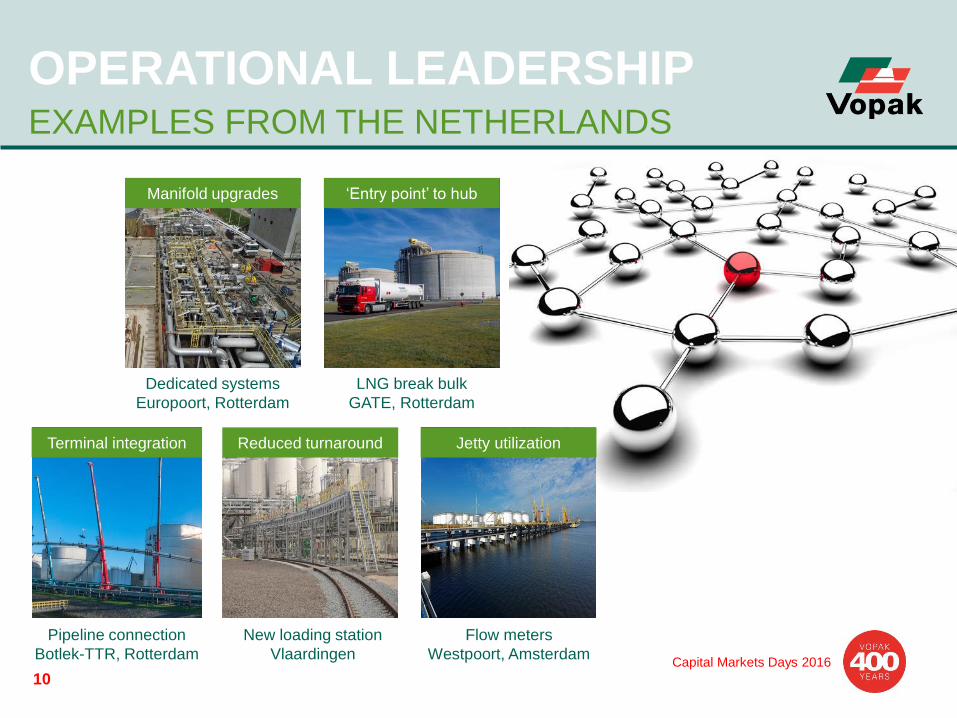
OPERATIONAL LEADERSHIP EXAMPLES FROM THE NETHERLANDS
New loading station
Vlaardingen
Pipeline connection
Botlek-TTR, Rotterdam
LNG break bulk
GATE, Rotterdam
Dedicated systems
Europoort, Rotterdam
Flow meters
Westpoort, Amsterdam
Manifold upgrades
Terminal integration
‘Entry point’ to hub
Reduced turnaround Jetty utilization
Capital Markets Days 2016
11
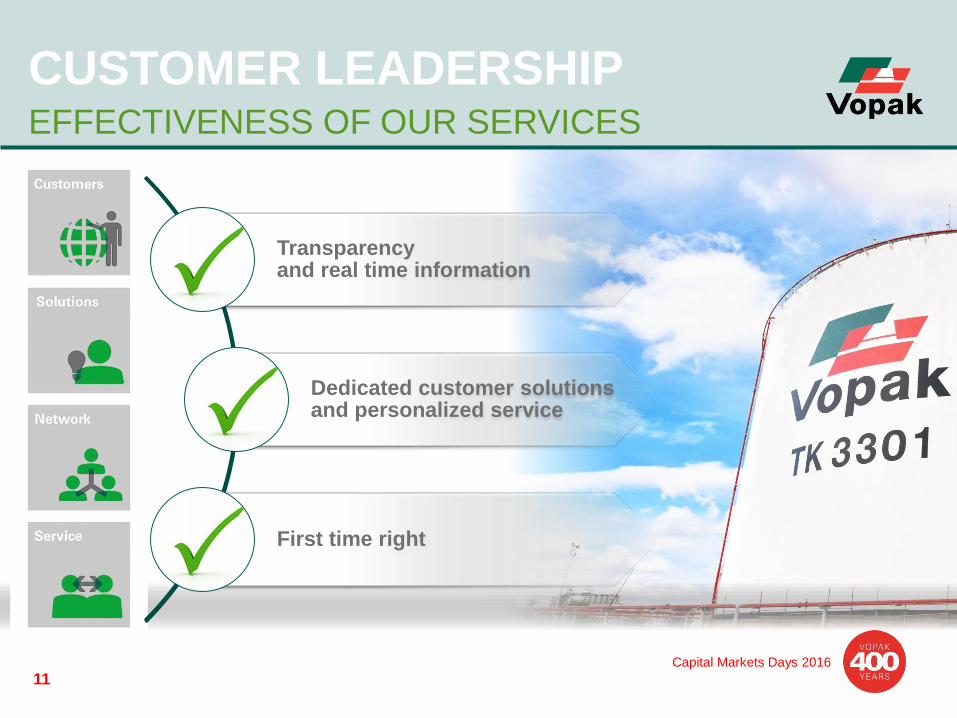
CUSTOMER LEADERSHIP EFFECTIVENESS OF OUR SERVICES
Transparency and real time information
Dedicated customer solutions and personalized service
First time right
Capital Markets Days 2016
12
D H
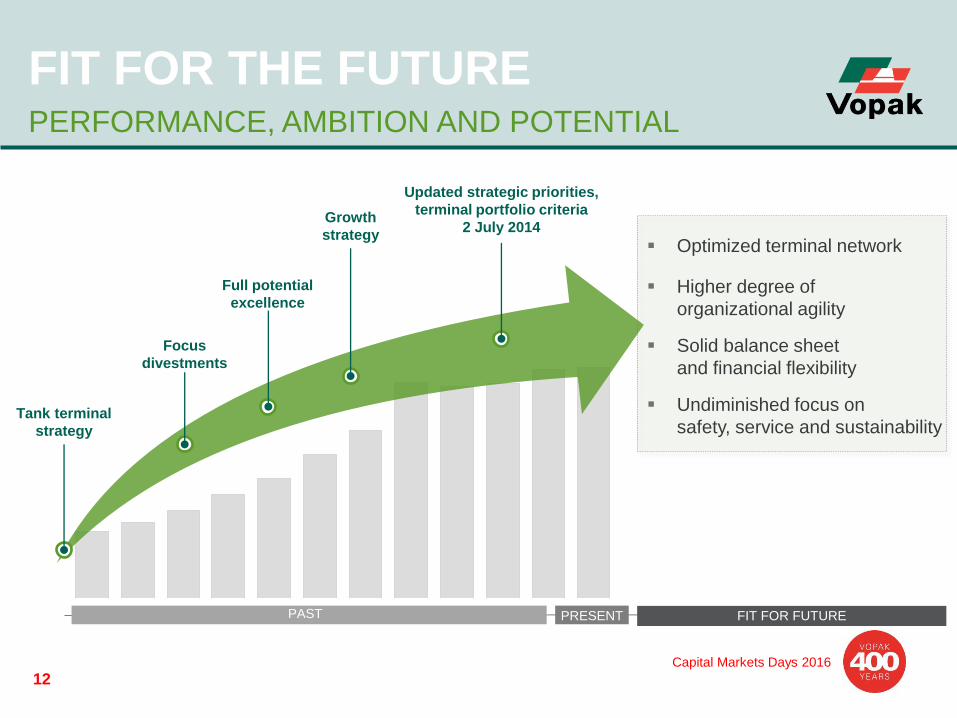
FIT FOR THE FUTURE PERFORMANCE, AMBITION AND POTENTIAL
Tank terminal
strategy
Focus
divestments
Full potential
excellence
Updated strategic priorities,
terminal portfolio criteria
2 July 2014 Growth
strategy
PAST PRESENT FIT FOR FUTURE
Optimized terminal network
Higher degree of
organizational agility
Solid balance sheet
and financial flexibility
Undiminished focus on
safety, service and sustainability
13
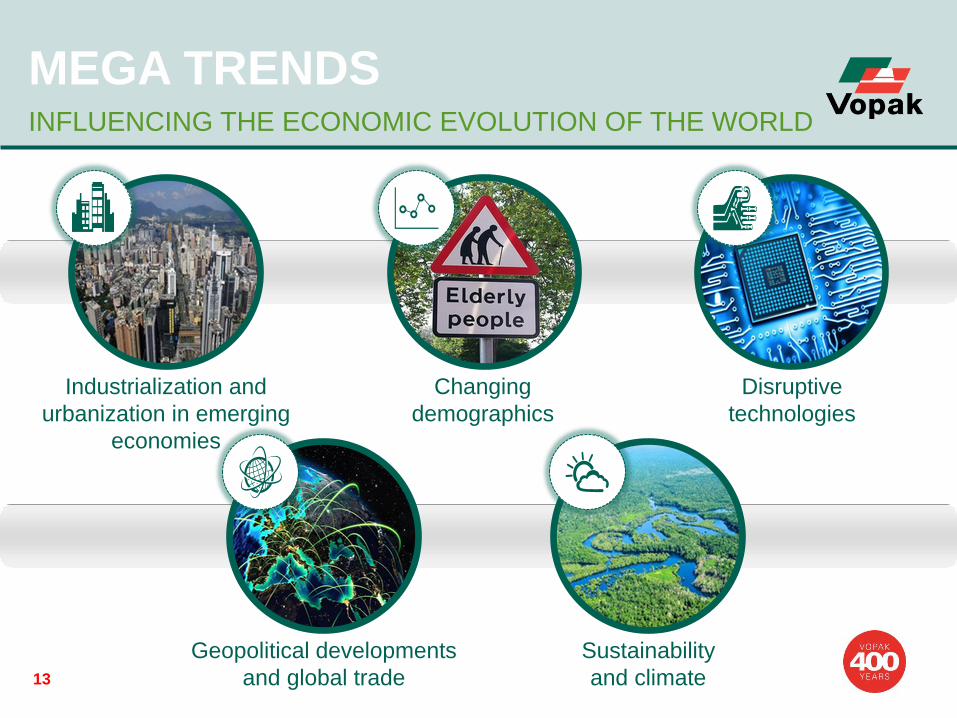
MEGA TRENDS INFLUENCING THE ECONOMIC EVOLUTION OF THE WORLD
Industrialization and
urbanization in emerging
economies
Changing
demographics
Disruptive
technologies
Geopolitical developments
and global trade
Sustainability
and climate
Capital Markets Days 2016
14
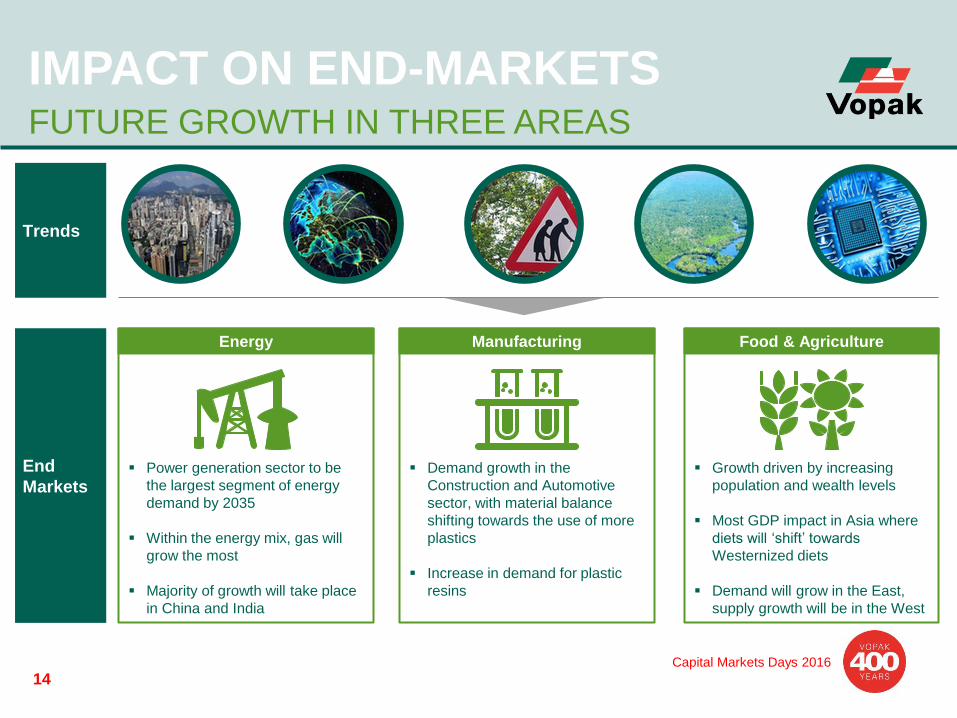
IMPACT ON END-MARKETS FUTURE GROWTH IN THREE AREAS
Trends
End
Markets Growth driven by increasing
population and wealth levels
Most GDP impact in Asia where
diets will ‘shift’ towards
Westernized diets
Demand will grow in the East,
supply growth will be in the West
Energy Manufacturing Food & Agriculture
Demand growth in the
Construction and Automotive
sector, with material balance
shifting towards the use of more
plastics
Increase in demand for plastic
resins
Power generation sector to be
the largest segment of energy
demand by 2035
Within the energy mix, gas will
grow the most
Majority of growth will take place
in China and India
Capital Markets Days 2016
15
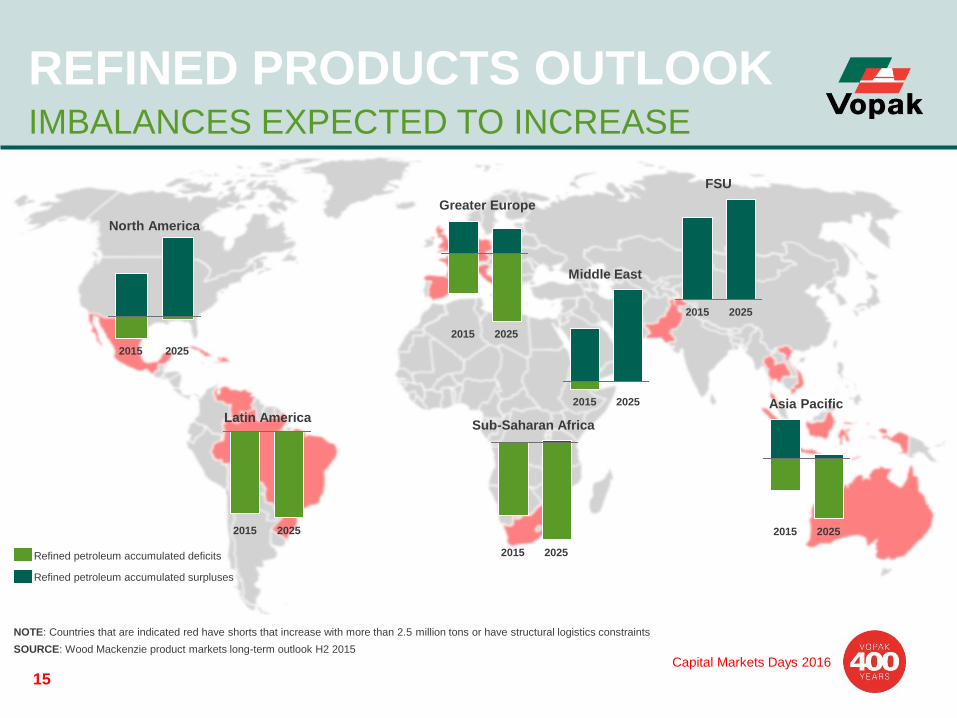
REFINED PRODUCTS OUTLOOK IMBALANCES EXPECTED TO INCREASE
SOURCE: Wood Mackenzie product markets long-term outlook H2 2015
NOTE: Countries that are indicated red have shorts that increase with more than 2.5 million tons or have structural logistics constraints
North America
2015 2025
2025 2015
Latin America
2025 2015
Greater Europe
2025 2015
Sub-Saharan Africa
2025 2015
Middle East
2025 2015
FSU
2025 2015
Asia Pacific
Refined petroleum accumulated surpluses
Refined petroleum accumulated deficits
Capital Markets Days 2016
16
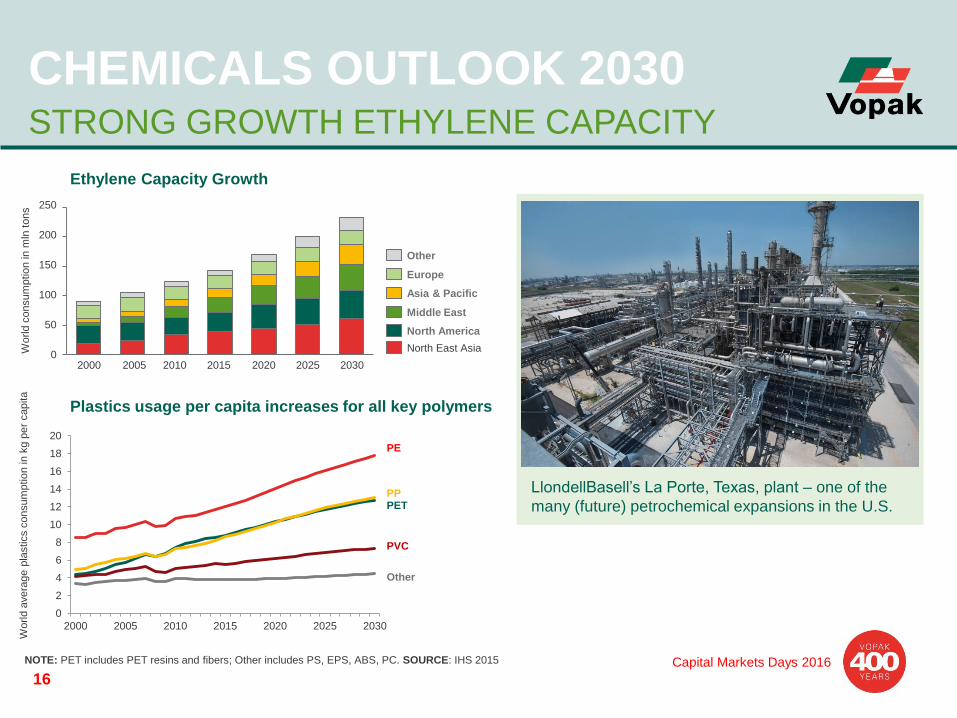
CHEMICALS OUTLOOK 2030 STRONG GROWTH ETHYLENE CAPACITY
250
200
150
100
50
0 2020 2030 2005 2025 2010 2015
World
consum
ptio
n in
mln
tons
2000
Other
PVC
PP PET
PE
North East Asia
Other
Asia & Pacific
Europe
Middle East
North America
Ethylene Capacity Growth
Plastics usage per capita increases for all key polymers
0
2
4
6
8
10
12
14
16
18
20
2000 2005 2010 2015 2020 2025 2030
World
avera
ge p
lastics c
onsum
ptio
n in
kg p
er
capita
NOTE: PET includes PET resins and fibers; Other includes PS, EPS, ABS, PC. SOURCE: IHS 2015
LlondellBasell’s La Porte, Texas, plant – one of the
many (future) petrochemical expansions in the U.S.
Capital Markets Days 2016
17
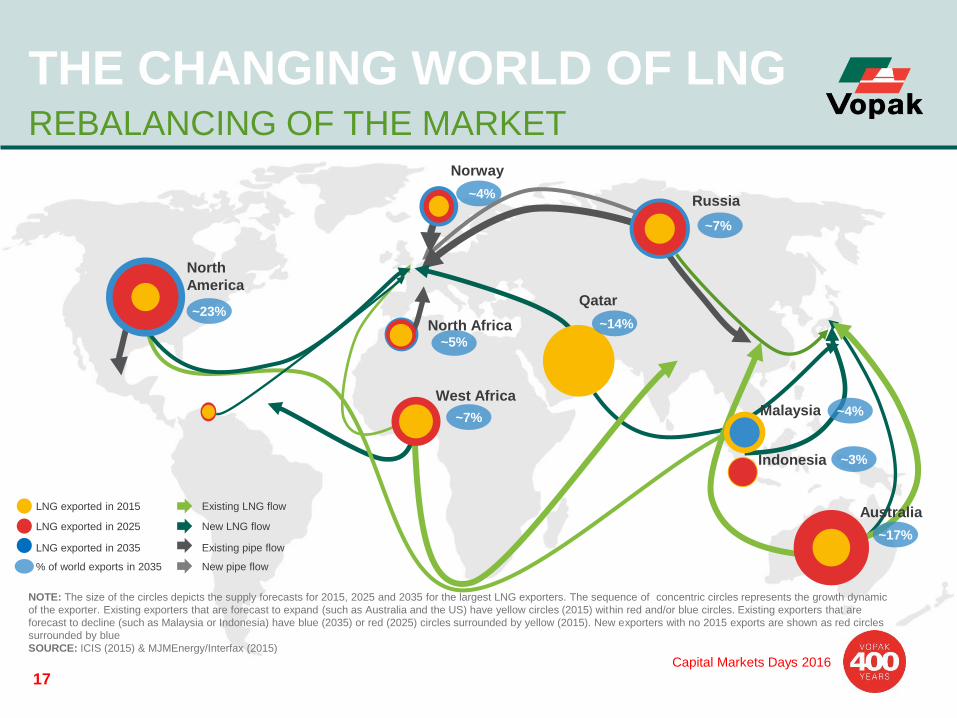
~7%
Russia
~7%
~23%
THE CHANGING WORLD OF LNG REBALANCING OF THE MARKET
North
America
Indonesia
LNG exported in 2015
LNG exported in 2025
LNG exported in 2035
NOTE: The size of the circles depicts the supply forecasts for 2015, 2025 and 2035 for the largest LNG exporters. The sequence of concentric circles represents the growth dynamic
of the exporter. Existing exporters that are forecast to expand (such as Australia and the US) have yellow circles (2015) within red and/or blue circles. Existing exporters that are
forecast to decline (such as Malaysia or Indonesia) have blue (2035) or red (2025) circles surrounded by yellow (2015). New exporters with no 2015 exports are shown as red circles
surrounded by blue
SOURCE: ICIS (2015) & MJMEnergy/Interfax (2015)
% of world exports in 2035
~14%
~4% Malaysia
~3%
West Africa
~17%
Australia Existing LNG flow
New LNG flow
Existing pipe flow
New pipe flow
Norway
~4%
Qatar
North Africa ~5%
Capital Markets Days 2016
18
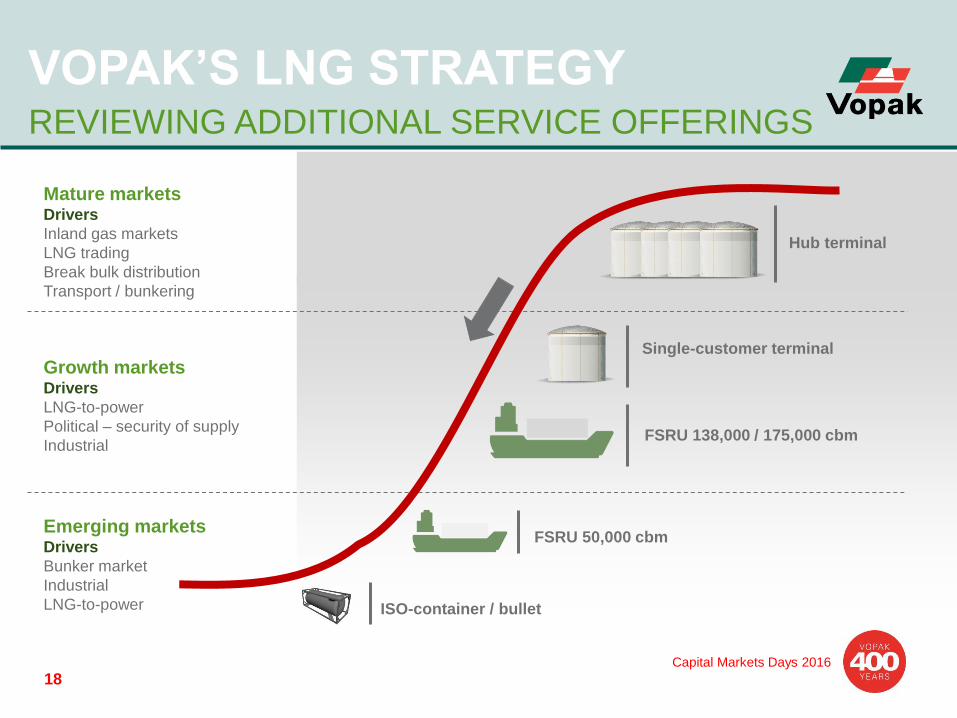
VOPAK’S LNG STRATEGY REVIEWING ADDITIONAL SERVICE OFFERINGS
Hub terminal
Single-customer terminal
FSRU 138,000 / 175,000 cbm
FSRU 50,000 cbm
ISO-container / bullet
Mature markets Drivers
Inland gas markets
LNG trading
Break bulk distribution
Transport / bunkering
Growth markets Drivers
LNG-to-power
Political – security of supply
Industrial
Emerging markets Drivers
Bunker market
Industrial
LNG-to-power
Capital Markets Days 2016
19
KEY TAKE AWAYS FIT FOR THE FUTURE
Vopak’s extensive history shows ability to stay relevant and open-minded
towards changes in society
Our strategic pillars continue to be key value drivers
Well-positioned to continue to create value at existing locations and
capture future growth opportunities
Continuing to be aware of mega trends and future flow developments
regarding all major liquid commodities
Vopak sees significant need for infrastructure in the next decade
20
QUESTIONS AND ANSWERS