Embed Size (px)
Citation preview
RELATIONSHIPS BETWEEN SAFETY CLIMATE FACTORS
AND OCCUPATIONAL SAFETY AND HEALTH LEVEL OF
AWARENESS IN MALAYSIAN GOVERNMENT AGENCIES
ABU HANIPAH BIN RAMLI
FACULTY OF ENGINEERING UNIVERSITY OF MALAYA
KUALA LUMPUR
2014

RELATIONSHIPS BETWEEN SAFETY CLIMATE FACTORS AND
OCCUPATIONAL SAFETY AND HEALTH LEVEL OF
AWARENESS IN MALAYSIAN GOVERNMENT AGENCIES
ABU HANIPAH BIN RAMLI
THESIS SUBMITTED IN FULFILMENT
OF THE REQUIREMENTS
FOR THE DEGREE OF DOCTOR OF PHILOSOPHY
FACULTY OF ENGINEERING
UNIVERSITY OF MALAYA
KUALA LUMPUR
2014

ii
UNIVERSITY OF MALAYA
ORIGINAL LITERACY WORK DECLARATION
Name of Candidate : ABU HANIPAH BIN RAMLI
Matric No :
Name of Degree : DOCTOR OF PHILOSPHY
Title of Project Paper/Research Report/Dissertation/Thesis (“this Work”) :
RELATIONSHIPS BETWEEN SAFETY CLIMATE FACTORS AND OCCUPATIONAL
SAFETY AND HEALTH LEVEL OF AWARENESS IN MALAYSIAN GOVERNMENT
AGENCIES
Field of Study : OCCUPATIONAL SAFETY AND HEALTH
I do solemnly and sincerely declare that:
(1) I am the sole author/writer of this Work;
(2) This Work is original;
(3) Any use of any work in which copyright exists was done by way of fair dealing and for
permitted purposes and excerpt or any excerpt or extract from, or reference to or
reproduction of any copyright work has been disclosed expressly and sufficiently and
the title of the Work and its authorship have been acknowledged in this Work;
(4) I do not have any actual knowledge nor do I ought reasonably to know that the making
of this work constitutes an infringement of any copyright work;
(5) I hereby assign all and every rights in the copyright to this Work to the University of
Malaya (“UM” ), who henceforth shall be owner of the copyright in this Work and that
any reproduction or use in any form or by any means whatsoever is prohibitted without
the written concern of UM having been first had and obtained;
(6) I am fully aware that if in the course of making this Work I have infringed any
copyright whether intentionally or otherwise, I may be subject to legal action or any
other action as may be determined by UM.
Candidate’s Signature Date:10.07.2014
Subscribed and solemnly declared before,
Witness’s Signature Date: 10.07.2014
Name:
Designation:

iii
ABSTRACT
Construction work is dangerous and it is essential that safety of workers be guaranteed.
Safety studies in the public sector are limited compared with the private sector. This
study surveyed the influence of safety climate and adoption of OHSAS 18000 on safety
of construction supervisors in the Department of Irrigation and Drainage (DID)
Malaysia, the Public Works Department, Malaysia (PWD), and the Rescue and Fire
Department, Malaysia (FRDM). A methodology is developed in diagnosing the Level of
Awareness (LoA) on Occupational Safety and Health which includes questionnaire
design, observation, data collection, statistical analysis, multiple-regression analysis and
model validation.
One-hundred-sixty-four personnel took part in the survey from DID, one-hundred and
four from PWD and one-hundred and six from FRDM. The mean work experience for
DID was 14.1 years, for PWD was 17.4 years and for FRDM was 10.5 years.
Management commitment, employee participation, training and education and
communication were tested. Level of Awarenes included safety orientation, company
policy, monitoring, risk assessment and review. Data were collected using self-
administered questionnaire.
Anova tests were applied to data collected. Regression analysis showed that for DID
communication was the most significant factor influencing safety among construction
supervisors. Results showed there were significant influences of management
commitment, employee participation and training and education on LoA. Results also
showed work experience had a significant influence on LoA. Designation, education
level and age had no significant influence on LoA. The adoption of OHSAS 18000 did
not seem to result in any marked enhancement in LoA of OSH Management.

iv
The developed model was then validated by testing the significant factors namely
communication, training and education, employees’ participation and management
commitment on two other different government agencies namely PWD and FRDM.
PWD is a supervisory agency doing similar jobs with DID and FRDM is an agency
doing work which is more towards rescue. Regression analysis showed that for both
PWD and FRDM, communication was the most significant factor influencing LoA
among front liner personnel.
Results showed in both PWD and FRDM, there were significant influences of
management commitment, employee participation and training and education and
communication on LoA. Results also showed work experience had a significant
influence on LoA. Designation, education level and age had no significant influence on
LoA.
These results highlight that Communication, Training and Education, Employee
Participation and Management Commitment are the predicted factors in the study of
LoA on OSH Management for government agencies and also for private companies in
Malaysia.
v
ABSTRAK
Kerja-kerja pembinaan adalah berbahaya dan ia adalah penting bahawa keselamatan
pekerja terjamin. Kajian keselamatan dalam sektor awam adalah terhad berbanding
dengan sektor swasta. Kajian ini meninjau pengaruh iklim keselamatan dan penggunaan
OHSAS 18000 ke atas keselamatan penyelia pembinaan dalam Jabatan Pengairan dan
Saliran (JPS) Malaysia, Jabatan Kerja Raya, Malaysia (JKR), Jabatan Bomba dan
Penyelamat Malaysia (BOMBA ). Metodologi dibangunkan dalam mendiagnosis tahap
kesedaran pengurusan keselamatan dan kesihatan pekerjaan yang termasuk reka bentuk
soal selidik, pemerhatian, pengumpulan data, analisis statistik, analisis regresi pelbagai
dan pengesahan model.
Seratus enam puluh empat orang telah mengambil bahagian dalam kaji selidik daripada
JPS, seratus empat dari JKR dan seratus enam dari BOMBA. Pengalaman kerja min
bagi JPS adalah 14.1 tahun, JKR adalah 17.4 tahun dan BOMBA adalah 10.5 tahun.
Komitmen pengurusan, penglibatan pekerja, latihan dan pendidikan dan komunikasi
telah diuji. Tahap kesedaran keselamatan termasuk orientasi keselamatan, dasar
syarikat, pemantauan, penilaian risiko dan kajian semula. Data telah dikumpulkan
menggunakan soal selidik yang di tadbir sendiri.
Ujian ANOVA telah digunakan untuk data yang dikumpul. Analisis regresi
menunjukkan bahawa bagi JPS, komunikasi adalah faktor yang paling penting yang
mempengaruhi keselamatan di kalangan para penyelia pembinaan. Keputusan
menunjukkan terdapat pengaruh ketara komitmen pengurusan, penglibatan pekerja dan
latihan dan pendidikan mengenai tahap kesedaran keselamatan. Keputusan juga
menunjukkan pengalaman kerja mempunyai pengaruh yang besar ke atas tahap
kesedaran keselamatan. Jawatan, tahap pendidikan dan umur tidak mempunyai
pengaruh yang besar ke atas tahap kesedaran keselamatan.

vi
Pemakaian OHSAS 18000 tidak menunjukkan sebarang tambahan yang ketara dalam
tahap kesedaran keselamatan. Model yang dibangunkan kemudian disahkan dengan
menguji faktor penting iaitu komunikasi, latihan dan pendidikan, penglibatan pekerja
dan komitmen pengurusan pada dua lagi agensi kerajaan yang berbeza, JKR dan
BOMBA. JKR adalah sebuah agensi penyeliaan yang melakukan kerja yang sama
dengan JPS dan BOMBA adalah agensi yang melakukan kerja yang lebih kepada kerja-
kerja menyelamat. Analisis regresi menunjukkan bahawa untuk kedua-dua JKR dan
BOMBA, komunikasi adalah faktor yang paling penting yang mempengaruhi
keselamatan di kalangan kakitangan barisan hadapan.
Keputusan menunjukkan di kedua-dua JKR dan BOMBA, terdapat pengaruh ketara
komitmen pengurusan, penglibatan pekerja dan latihan dan pendidikan dan komunikasi
terhadap tahap kesedaran keselamatan. Keputusan juga menunjukkan pengalaman kerja
mempunyai pengaruh yang besar ke atas tahap kesedaran keselamatan. Jawatan,tahap
pendidikan dan umur tidak mempunyai pengaruh yang besar ke atas tahap kesedaran
keselamatan.
Keputusan ini menyerlahkan bahawa Komunikasi, Latihan dan Pendidikan, Penyertaan
Pekerja dan Komitmen Pengurusan adalah faktor-faktor yang diramalkan dalam kajian
tahap kesedaran Keselamatan dan Kesihatan Pekerjaan (KKP) untuk agensi-agensi
kerajaan dan juga untuk syarikat-syarikat swasta di Malaysia.

vii
ACKNOWLEDGEMENT
First and foremost, grateful thanks to Allah S.W.T. for guiding and helping me in
the completion of this thesis.
I would like to extend my deepest gratitude and appreciation to my supervisors,
Assoc. Prof. Dr Che Rosmani Che Hassan and Assoc.Prof. Dr Zubaidah Ismail
for their continous guidances, ideas, suggestion, support and valuable advices
throughout the period of this PhD Project.
My recognition goes also to all following organizations/institute and their
representatives for the grant, precious cooperation, and/or their willingness to
provide me the necessary material for realizing the experiments, documents,
information, practical insight, explanations and/or pictures for my research:
Department of Occupational Safety and Health Malaysia
Department of Public Works Malaysia
Department of Fire and Rescue Malaysia
INTAN
NIOSH
PERKESO
I am also thankful to the Department of Irrigation and Drainage Malaysia for
giving me the opportunity to further my studies in Occupational Safety and
Health Management and also for providing the data for this research. Due
appreciation also to the Public Service Department for sponsoring my study.
Last but not least is my appreciation and gratitude to my beloved wife,
Norashikin Abdul Wahid and my kids for their love, encouragement, support and
also for believing in me. I would like to thank all my friends especially those
providing me with all the materials required to complete all the assignments.

viii
TABLE OF CONTENTS Page No.
Declaration......................................................................................................... ii
Abstrak............................................................................................................... iii
Abstract.............................................................................................................. v
Acknowledgement............................................................................................. vii
Table of Contents.............................................................................................. viii
List of Appendices............................................................................................. x
List of Tables...................................................................................................... xi
List of Figures.................................................................................................... xiii
List of Abbreviations......................................................................................... xix

ix
CHAPTER 1: BACKGROUND OF THE STUDY..................................................
1
1.1 Problem statement......................................................................................... 2
1.2 Study Objectives ......................................................................................... 15
1.3 Research significance ................................................................................... 15
1.4 Research Methodology..................................................................................
18
1.5 Limitation of the study ..................................................................................
19
1. 6 Outline of Chapters ..... ..................................................................................
20
1. 7 Scope of study ......... ......................................................................................
21
1. 8 Concluding remarks........................................................................................
23
CHAPTER 2: THE CONCEPT OF OSH PERFORMANCES.................................. 24
2.1 Components of Safety Culture......................................................................... 25
2.1.1 Definition......................................................................................................... 26
2.1.1.1 Organizational culture...................................................................................... 27
2.1.1.2 Safety Culture................................................................................................... 28
2.1.1.3 Safety Climate.................................................................................................. 31
2.2 Performance Measurement.............................................................................. 32
2.3 Measuring the Health and Safety Culture........................................................ 34
2.4 Method of Measurement.................................................................................. 36
2.5 Factors Affecting Safety and Health Programs............................................... 37
2. 6 Selection of Osh Culture Assesment Tools...................................................... 47
2. 6.1 Score Your Safety Culture Checklist............................................................... 48

x
2. 6.2 Safety Climate Assesment Toolkit and User Guide (LSCAT)........................ 49
2. 6.3 Safety Health of Maintenance Engineering ( SHoMe) Tool............................ 51
2. 6.4 Nordic Occupational Safety Climate Questionnaire (NOSACQ)................... 53
2. 6.5 The Railway Safety Standard Board – (RSSB Safety Culture Toolkit............ 56
2. 6.5.1 The Assesment Toolkit.................................................................................... 57
2. 7 Proposed Measuring Safety Culture/Climate Toolkit...................................... 59
2. 8 Dependent factor.............................................................................................. 62
2. 8.1 Level of Awareness(LoA) of OSH.................................................................. 62
2. 9 Independent factors......................................................................................... 64
2. 9.1 Management Commitment............................................................................... 65
2. 9.2 Employees Participation................................................................................... 67
2. 9.3 Training and Education................................................................................... 69
2. 9.4 Communication............................................................................................... 72
2. 10 Concluding Remarks........................................................................................ 74
CHAPTER 3: RESEARCH METHODOLOGY..................... .................................. 75
3. 1 Research Design.............................................................................................. 77
3. 2 Research Respondents.................................................................................... 78
3. 3 Research Instrument....................................................................................... 79
3. 4 Questionnaire Design..................................................................................... 80
3.4.1 Respondent Personal Profile ( Section 1 )...................................................... 84
3.4.2 Safety Climate Factors ( Section 2 ).............................................................. 85
3. 4.2.1 Management Commitment............................................................................ 85

xi
3. 4.2.2 Employee Participation.................................................................................. 87
3. 4.2.3 Training and Education.................................................................................. 89
3. 4.2.4 Communication.............................................................................................. 90
3.4.3 Level of Awareness ( Section 3 ).................................................................. 92
3. 5 Validation and Pilot Testing.......................................................................... 94
3. 6 Data Collection and Procedures..................................................................... 96
3. 7 Technique of Data Analysis........................................................................... 97
3. 8 Concluding Remarks..................................................................................... 102
CHAPTER 4 :RESULTS AND DISCUSSION........................................................ 103
4.1 Demographic Characteristic Data................................................................ 103
4.1.1 Respondent’s Position.................................................................................... 103
4.1.2 Education Level............................................................................................. 106
4.1.3 Age of Respondents....................................................................................... 109
4.1.4 Respondent’s Working Experiences.............................................................. 112
4.1.5 Summary........................................................................................................ 114
4.2 Findings of Survey......................................................................................... 115
4.2.1 Safety Climate Factors................................................................................... 115
4.2.1.1 Management Commitment............................................................................. 115
4.2.1.2 Employees’ Participation................................................................................ 116
4.2.1.3 Training and Education.................................................................................. 117
4.2.1.4 Communication.............................................................................................. 118
4.2.2 Level of Awareness of OSH Management System....................................... 119

xii
4.2.3 Summary........................................................................................................ 123
4.3 Overall LoA of OSH Management System.................................................. 124
4.4 Statistical Analysis.......................................................................................... 125
4.4.1 Validity of Questionnaire................................................................................ 125
4.4.1.1 Content Validity............................................................................................. 125
4.4.1.2 Construct Validity............................................................................................. 127
4.4.1.3 Criterion Validity............................................................................................. 129
4.4.1.4 Repeatability of the Questionnaire................................................................... 130
4.4.2 Reliability Measures......................................................................................... 131
4.4.3 Testing of Hypotheses..................................................................................... 133
4.4.3.1 Analysis of Differences Between Groups...................................................... 133
4.4.3.2 Test of Correlations........................................................................................ 140
4.4.4 Summary........................................................................................................ 146
4.5 Regression Analysis....................................................................................... 147
4.5.1 Regression Analysis- Model Summary for DEP1 and DEP2....................... 147
4.5.2 Regression Analysis- Linearity Test (ANOVA) for DEP1 and DEP2......... 149
4.5.3 Regression Analysis- Ceofficient Factor for DEP1 and DEP2.................... 151
4.5.3.1 Regression Equation (DEP1 and DEP2)...................................................... 151
4.5.3.2 Accuracy of the Equations (DEP1 and DEP2)............................................. 152
4.5.4 Hypotheses Tests – about the population regression line............................. 153
4.5.5 Summary....................................................................................................... 155
4. 6 Validation of the Models.............................................................................. 156
4. 6.1 Survey Results for DEP3 and DEP4............................................................ 156
4. 6.1.1 Demographic Characteristic Data for DEP3 and DEP4............................. 156

xiii
4. 6.1.1.1 Respondent’s Position for DEP3 and DEP4............................................ 157
4. 6.1.1.2 Education Level for DEP3 and DEP4..................................................... 159
4. 6.1.1.3 Age of Respondents for DEP3 and DEP4............................................... 162
4. 6.1.1.4 Respondent’s Working Experience for DEP3 and DEP4....................... 165
4. 6.1.2 Safety Climate Factors............................................................................... 168
4. 6.1.2.1 Management Commitment for DEP3 and DEP4.................................... 168
4. 6.1.2.2 Employees’ Participation for DEP3 and DEP4...................................... 169
4. 6.1.2.3 Training and Education for DEP3 and DEP4........................................ 170
4. 6.1.2.4 Communication for DEP3 and DEP4.................................................... 171
4. 6.1.3 Level of Awareness of Occupational Safety and Health............................ 172
4. 6.1.4 Overall LoA of Occupational Safety and Health........................................ 177
4. 6.2 Statistical Analysis for DEP3 and DEP4....................................................... 178
4. 6.2.1 Realibility Measures for DEP3 and DEP4................................................. 178
4. 6.2.2 Testing of Hypotheses for DEP3 and DEP4.............................................. 179
4. 6.2.2.1 Analysis of Differences Between Groups for DEP3 and DEP4............. 180
4. 6.2.2.2 Test of Correlations for DEP3 and DEP4............................................... 184
4. 6.2.3 Regression Analysis.................................................................................... 185
4. 6.2.3.1 Regression Analysis-Model Summary for DEP3 and DEP4................. 185
4. 6.2.3.2 Regression Analysis-Linearity Test(ANOVA) for DEP3 and DEP4.... 187
4. 6.2.3.3 Regression Analysis-Ceofficient Factor for DEP3 and DEP4............... 189
4. 6.2.3.4 Accuracy of Equations for DEP3 and DEP4......................................... 190
4. 6.3 Hypothesis Tests About The Population Regression Line.......................... 191

xiv
4. 7 Discussion..................................................................................................... 192
4. 7.1 Objective No.1-Determination of Effects of Employee`s Demographic
Background on The Perception of Level of Awareness (LoA) on
Ocupational Safety and Health.....................................................................
192
4. 7.2 Objective No.2- Measuring The Level of Awareness on Occupational
Health and Safety Performances of The Agencies.......................................
194
4. 7.3 Objective No.3- Developing of Statistical Analytical Tool for Measuring
and Correlating the Level of Awareness of Occupational Health and Safety
and Safety Climate Factors ..........................................................................
198
4. 7.3.1 LoA of OSH Has Correlation with Management Commitment................. 200
4. 7.3.2 LoA of OSH Has Correlation with Employees’ Participation................... 202
4. 7.3.3 LoA of OSH Has Correlation with Training and Education..................... 205
4. 7.3.4 LoA of OSH Has Correlation with Communication................................. 207
4. 7.4 Objective No.4- To Identify the significant factors influencing
Occupational Health And Safety Level of Awareness using Multiple
Regression Analysis....................................................................................
210
4. 7.5 Objective No.5-Model Validation for Evidence to Support The Relationship
Between Dependent and Independent Variables.........................................
212
4. 8 Concluding Remarks................................................................................... 215
CHAPTER 5 : CONCLUSIONS AND RECOMMENDATIONS........................
216
5. 1 Conclusions.................................................................................................
216
5. 2 Recommendations.......................................................................................
220
5.3 Problems Encounfered................................................................................
222
5.4 Contribution to Industry..............................................................................
223
5.5 Future Research...........................................................................................
224
REFERENCES....................................................................................................... 225

xv
LIST OF APPENDICES
APPENDIX Page No.
A ACT 514-OSHA 1994 Part IV ……............................................................... 233
B DID Divisions And Functions ……................................................................ 234
C Safety Culture/Climate Reseacrh (1980 to 2010) .......................................... 242
D Recommendation Letter ……....................................................................... 250
E Questionnaire Form ( English Version)........................................................ 251
F Questionnaire Form ( Malay Version) ......................................................... 233
G DOSH Letter of Authorization …................................................................. 267
H INTAN Letter of Authorization .................................................................. 268
I Letter of Authorization to carry-out Pilot Study .......................................... 269
J DID Director General –Letter of Authorization ........................................... 270
K Test of Normality Results …….................................................................. 271
L Safety Climate Factors Identified by DID Top Management........................ 272
M Letter to Top Manegement .............................................................................. 273
N Content Validity Treshold......................................................................... 275
O Content Validity Ratio Test Results .......................................................... 276
P Accuracy of Equation For DEP1 and DEP2 .............................................. 279
Q PWD Director General - Letter of Authorization........................................ 280
R FRDM Director General - Letter of Authorization...................................... 281
S Accuracy of Equation For DEP3 and DEP4 ............................................... 282
T OSH LoA Calculation................................................................................ 284
U Meanscore for Safety Climate Factors ....................................................... 286

xvi
LIST OF TABLES
Table Title Page
1.1 Accident Reported to DOSH , JTK , SOCSO ( 2001 – 2010 )……..................... 3
1.2 Industrial and Construction Accident Statistics ( 1000s )..................................... 9
2.1 Factors affecting the implementation of safety programs.................................... 38
2.2 Safety Dimensions................................................................................................ 44
2.3 Different of Perspective on Safety Culture Relating Assessment Methods of
LSCAT.........................................................................................................
49
2.4 Overview of The Three Questionnaires of The SHoMe Tool.............................. 51
2.5 Key Element , Factor and Sub Factor in RSSB Toolkit....................................... 57
2. 6 Characteristics of The Safety Culture.................................................................. 60
2. 7 Management Commitment Factors...................................................................... 65
2. 8 Employees Participation Factors.......................................................................... 67
2. 9 Training and Education........................................................................................ 69
2. 10 Communication Factors....................................................................................... 72
3. 1 Breakdown of Respondents Representing Different Positions............................ 79
3. 2 Questionnaire Variables and Ttypes of Measurement......................................... 83
3. 3 Personal Profile Questions................................................................................... 84
3. 4 Management Commitment Questions................................................................. 86
3. 5 Employees Participator Questions...................................................................... 88
3. 6 Training and Education Questions........................................................................ 90
3. 7 Communication Questions................................................................................... 91
3. 8 Level of Awareness of OSH Questions.............................................................. 93
3. 9 Level of Awareness of OSH Questions.............................................................. 98

xvii
3.10 Interpretation of The Values of Correlation Coefficient ..................................... 100
4.1 Designation in DEP1............................................................................................ 104
4.2 Designation in DEP2............................................................................................ 105
4.3 Education Level in DEP1..................................................................................... 107
4.4 Education Level in DEP2..................................................................................... 108
4.5 Age in DEP1 ....................................................................................................... 110
4.6 Age in DEP2 ....................................................................................................... 111
4.7 Working Experience in DEP1............................................................................... 113
4.8 Working Experience in DEP2............................................................................... 114
4. 9(a) LoA of OSH- Orientation ............................................................................... 119
4. 9(b) LoA of OSH- Policy......................................................................................... 120
4. 9(c) LoA of OSH- Monitoring................................................................................. 121
4. 9(d) LoA of OSH- Risk Assessment........................................................................ 122
4. 9(e) LoA of OSH- Review....................................................................................... 123
4.10 Overall LoA of OSH.... ....................................................................................... 124
4.11 Level of Agreement for CVR................................................................................ 126
4.12 Results Derived from Factor Analysis.................................................................... 128
4.13 Result derived from Pearson Correlation Test....................................................... 129
4.14 Repeatability of Factor of Assessment Questionnaire........................................... 130
4.15 Result for Reliability Measures................. ........................................................... 132
4.16 Result for the difference of employees’ perception level on Occupational
Safety Awareness based on their Designation......................................................
134
4.17 Result for the difference of employees’ perception level on Occupational
Safety Awareness based on their Educational Level..........................................
135

xviii
4.18 Result for the difference of employees’ perception level on Occupational
Safety Awareness based on their Age..............................................................
137
4.19 Result for the difference of employees’ perception level on Occupational
Safety Awareness based on their Experience.....................................................
138
4.20 Correlation between Occupational Safety and Health Awareness and Safety
Climate Factors for DEP1 and DEP2..................................................................
140
4.21 Model Summary for DEP1 and DEP2............................................................... 148
4.22 Coefficient Factor for DEP1............................................................................... 154
4.23 Coefficient Factor for DEP2 ............................................................................. 154
4.24 Designation in DEP3............. ............................................................................. 157
4.25 Designation in DEP4............. ............................................................................. 158
4.26 Education Level in DEP3...... ............................................................................. 160
4.27 Education Level in DEP4...... ............................................................................. 161
4.28 Age in DEP3........................... ............................................................................. 163
4.29 Age in DEP4........................... ............................................................................. 164
4.30 Working Experience in DEP3............................................................................... 166
4.31 Working Experience in DEP4............................................................................... 167
4.32(a) LoA of OSH in DEP3 and DEP4-Orientation ................................................. 172
4.32(b) LoA of OSH in DEP3 and DEP4- Policy......................................................... 173
4.32(c) LoA of OSH in DEP3 and DEP4- Monitoring ................................................. 174
4.32(d) LoA of OSH in DEP3 and DEP4- Risk Assessment........................................ 175
4.32(e) LoA of OSH in DEP3 and DEP4- Review....................................................... 176
4.33 Overall LoA of Occupational Safety and Health................................................... 177
4.34 Result for Reliability Measures for DEP3 and DEP4............................................ 179

xix
4.35 Result for the difference of employees’ perception level on Occupational
Safety Awareness based on their designation......................................................
180
4.36 Result for the difference of employees’ perception level on Occupational
Safety Awareness based on their Education Level...............................................
181
4.37 Result for the difference of employees’ perception level on Occupational
Safety Awareness based on their Age.................................................................
182
4.38 Result for the difference of employees’ perception level on Occupational
Safety Awareness based on their Work Experience...........................................
183
4.39 Correlation between LoA of Occupational Safety and Health and Safety
Climate factors for DEP3 and DEP4..................................................................
185
4.40 Model Summary for DEP3 and DEP4.............................................................. 186
4.41 Coefficient Factors for DEP3 and DEP4............................................................. 189
4.42 Significant values (p) for all models................................................................... 192
4.43 Overall LoA of OSH........................................................................................... 194
4.44 LoA of OSH using equation ( model : all models).............................................. 196
4.45 Correlation coefficient (r ) for all models............................................................. 198
4.46 Model equations.................................................................................................... 210
4.47 Model Summary.................................................................................................... 212
4.48 Model Coefficient................................................................................................. 214

xx
LIST OF FIGURES
Figure Title Page
1.1 Frequency of Reported Accidents in Year 2002-2010............................................... 5
1.2 Number of Temporary Disablement Benefit Recipients and the Total Payment
for Temporary Disablement Benefit..........................................................................
6
1.3 Number of Permanent Disablement Recipients and the Total Payment for
Permanent Disablement Benefit ...............................................................................
7
1.4 Number of Permanent Disablement Recipients and the Total Payment for
Invalidity Pension Benefit.......................................................................................
8
1.5 Proposed model; Effect of Safety climate factors on level of Awareness on
Occupational Safety and Health .............................................................................
14
2.1 The three aspects of a safety culture presented by Cooper (2000).......................... 25
2.2 The Proposed Safety Climate Factors..................................................................... 46
2.3 Example of a NOSACQ diagram ........................................................................... 55
3.1 Flow Chart of Research Methodology.................................................................... 76
4.1 Designation in DEP1............................................................................................... 104
4.2 Designation in DEP2............................................................................................... 105
4.3 Education Level in DEP1.......................................................................................... 107
4.4 Education Level in DEP2.......................................................................................... 108
4.5 Age in DEP1.............................................................................................................. 110
4.6 Age in DEP2.............................................................................................................. 111
4.7 Working Experiences in DEP1.................................................................................. 113
4.8 Working Experiences in DEP2................................................................................. 114
4.9 Management Commitment....................................................................................... 115
4.10 Employees’ Participation....................................................................................... 116

xxi
4.11 Training and Education......................................................................................... 117
4.12 Communication..................................................................................................... 118
4.13 Correlation between Occupational Safety and Health Awareness and Safety
factors for DEP1and DEP2....................................................................................
145
4.14 Scatter Plot of Regression Standardized Value against Regression Standardized
Residual for DEP1.................................................................................................
149
4.15 Scatter Plot of Regression Standardized Value against Regression Standardized
Residual for DEP2..................................................................................................
150
4.16 Designation in DEP3............................................................................................. 157
4.17 Designation in DEP4............................................................................................. 158
4.18 Education Level in DEP3 ...................................................................................... 160
4.19 Education Level in DEP4 ...................................................................................... 161
4.20 Age in DEP3.................... ...................................................................................... 163
4.21 Age in DEP4.................... ...................................................................................... 164
4.22 Working Experiences in DEP3............................................................................... 166
4.23 Working Experiences in DEP4............................................................................... 167
4.24 Management Commitment in DEP3 and DEP4..................................................... 168
4.25 Employees’ Participation in DEP3 and DEP4....................................................... 169
4.26 Training and Education in DEP3 and DEP4.......................................................... 170
4.27 Communication in DEP3 and DEP4...................................................................... 171
4.28 Scatter Plot of Occupational Safety and Health Performances against Regression
Studentized Deleted (Press) Residual for DEP3......................................................
187
4.29 Scatter Plot of Occupational Safety and Health Performances against Regression
Studentized Deleted (Press) Residual for DEP4......................................................
188

xxii
LIST OF ABBREVIATIONS
ABBREVIATIONS
ACSNI Advisory Committee on the safety of Nuclear Installations
ANOVA Analysis of Variance
BOMBA Bomba dan Penyelamat
CSFs Critical Safety Factors
CVR Content Validity Ratio
DID Department of Irrigation and Drainage
DOSH Department of Occupational Safety and Health
FRDM Fire and Rescue Department Malaysia
GDP Gross Domestic Product
HSC Health and Safety Commission
HSE Health and Safety Ececutive
IAEA International Atomic Energy Agency
INTAN Institut Tadbiran Awam Negara
INSAG International Nuclear Safety Group
ISO International Standard Organisation
JKR Jabatan Kerja Raya Malaysia
JTK Jabatan Tenaga Rakyat
JPS Jabatan Pengairan dan Saliran
KKP Keselamatan Kesihatan Pekerjaan
KPIs Key Performance Indicators
KRAs Key Result Areas

xxiii
LoA Level of Awareness
LSCAT Loughbrough Safety Climate Assessment Tool
MAMPU Malaysia Administrative and Management Planning Units
MSCOMM Meanscore of Communication
MSEP Meanscore of Employee Participation
MSMC Meanscore of Management Commitment
MSTE Meanscore of Training and Education
NIOSH National Institute Of Occupational Safety and Health
NOSACQ Nordic Occupational Safety Climate Questionnaire
OSH Occupational Safety and Health
OSHA Occupational Safety and Health Act
PWD Public Works Department
RSSB Railway Safety Standard Board
SIRIM Standard and Industrial Research Institute of Malaysia
SPM Sijil Pelajaran Malaysia
SPSS Standard Package Social Science
SOCSO Social Security Organisation
S&H Safety and Health
TQM Total Quality Management
USD United States Dollars

1
CHAPTER 1: BACKGROUND OF THE STUDY
The aim of this study is to research on issues pertaining to the various criteria and
factors governing safety climate and to highlight its influence on Level of Awareness
(LoA) of Occupational Safety and Health (OSH). The study will identify the significant
factors that will influence the LoA of Occupational Safety and Health (OSH) among
supervisory workers in the construction industry in Malaysia. This chapter establishes
the study by introducing the background of the problem. On the onset, the statement of
the problem highlights both the importance and the ills of the construction industry that
will eventually lead to the area of the study namely Level of Awareness (LoA). It
further states the objectives, research statement, significances of the study and the
parameters of the study.
Malaysia has been classified as one of the potential developing countries (Bahari,
2011). The changes from an agriculture-based to an industry-based economy brought a
lot of improvement to the country (Ismail et al., 2010). It brings a lot of new investors to
be involved in the small, medium and major industries. The importance of the
construction industry in nation building has been discussed at length as the construction
industry creates wealth and affects the gross domestic product of a country. The
enormous expenditure allocated and spent for development projects make it imperative
to ensure projects are a success for the development of the country.

2
1.1 Problem Statement
The importance of the construction industry and its vital link to the national gross
domestic product and huge development expenditure necessitates that projects
implemented achieve project success. However, according to Abdul Rashid (2002), the
level of risk in any construction work is considerably much higher than in other
economic undertaking. Safety of workers becomes a matter of great concern.
Most workers in developed countries generally assume the organization for which they
work will take all necessary measures to ensure that they will return to their homes
safely at the end of the working day (Abdul Rahim et al., 2008). Despite this
assumption, work related injuries and deaths continue to occur at a high rate (DOSH,
2010). Department of Occupational Safety and Health (DOSH) as a controlling body for
industrial accidents on behalf of the government produce a yearly accident report as in
Table 1.1.
Data showed a decrease in the number of accidents reported since enforcement of the
Act 514 in 2001. Data for 2001 are reported to SOCSO from 87,389 down to 64,363 in
the year 2010. Nevertheless, the number of accidents reported was still at a very high
ratio (SOCSO, 2010). Table 1.1 also shows the data on fatal accidents reported an
increase from ten years release of the act. The number of fatal accidents reported in
2001 was 993 and the number increased to 1,717 in 2010. This indicates a very
worrying statistics and a drastic and comprehensive action needs to be taken by all
parties including the government, especially those who manage the related jobs. The
record proved that Malaysia is one of the countries that have a high number of industrial
accidents (DOSH, 2010).

3
There is a difference between the statistical figures released by SOCSO and DOSH, this
is because SOCSO reports are based on the amount of insurance compensation claims
made by victims or their beneficiaries while DOSH statistics are based on the number of
accidents reported and there were no proper and accurate reports of construction
accidents, due to fear of assumed reprisal by the authorities.
Table 1.1: Accident Reported to DOSH, JTK, SOCSO (2001-2010)
No. Year Accident SOCSO/JTK DOSH
1. 2010 Death
Total Report
1,717
64,363
185
2,354
2. 2009 Death
Total Report
1,739
61,161
224
2,386
3. 2008 Death
Total Report
1,432
61,710
239
2,535
4. 2007 Death
Total Report
1,303
63,600
219
3,395
5. 2006 Death
Total Report
1,337
68,008
209
4,731
6. 2005 Death
Total Report
1,292
70,690
196
3,837
7. 2004 Death
Total Report
1,291
77,742
174
3,550
8. 2003 Death
Total Report
1,073
81,003
190
3,304
9. 2002 Death
Total Report
907
85,513
137
3,032
10. 2001 Death
Total Report
993
87,389
146
2,889
Source:(DOSH, 2010; Malaysia, 2007a)

4
The construction industry is currently being recognized as a major economic force in
Malaysia (Malaysia, 2007a). With the rapid growth of the construction industry for the
past decade, injuries and fatalities resulting from accidents at construction sites seems to
have grown as well. Based on the Social Security Organization SOCSO (2010), the
fatality rate in the construction industry in Malaysia was more than three times of all
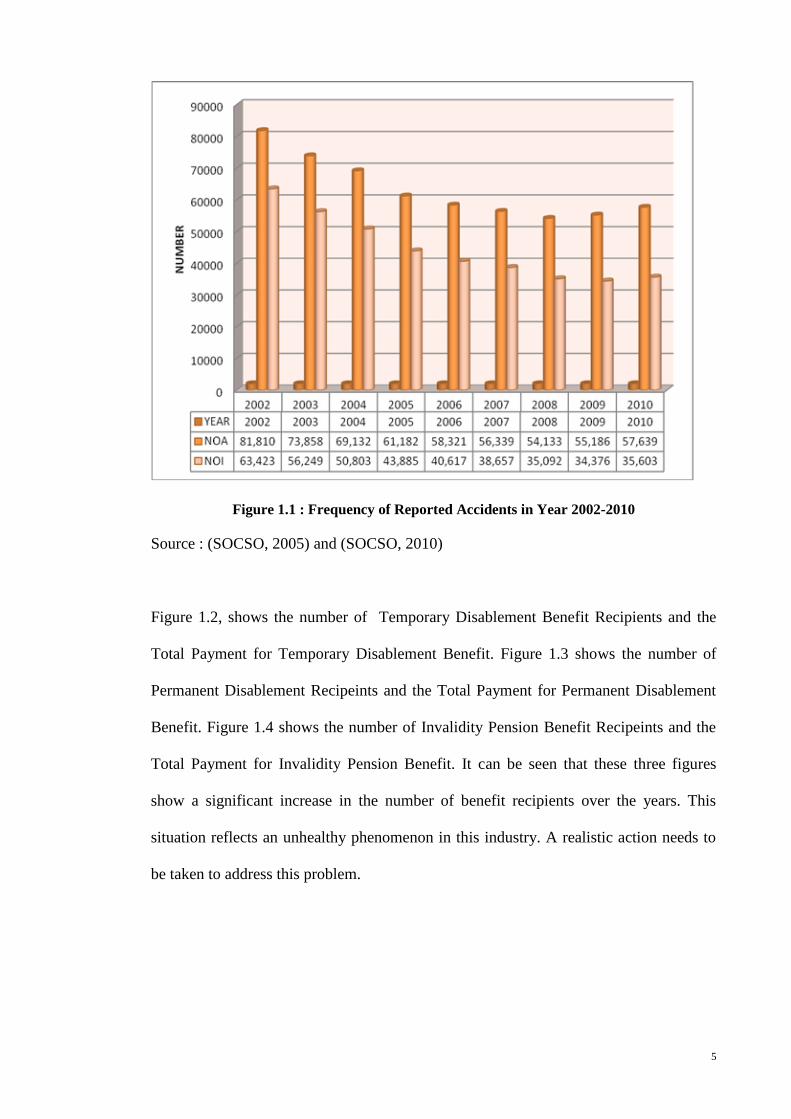
workplaces. Figure 1.1 shows the frequency of reported accidents in year 2002 to 2010.
Although statistics which is Number of Accident Report (NOA) and Number of
Industrial Accident (NOI) show a decrease compared to the figures in the early 20s, it is
still at an alarming level (SOCSO, 2010). Statistics also show an increase again
occurred starting in 2008 until 2010. This phenomenon should be taken seriously by the
parties involved in this industry. Compensation costs paid out by SOCSO for industrial
accidents and diseases accounted for almost RM650 Million (SOCSO, 2009).
The fatality rate of construction related activities in the United States is among the
highest of all industries (Toole, 2002). On the average it bears approximately USD2
billion per year in direct cost such as hospitalization, workers compensation and
subsistence payment (Toole, 2002). It covers repair cost, replacement of damaged
materials and machines, unproductive labor time, spoiled works, adverse publicity, legal
expenses, unscheduled disruptions and other expensive side effect.
5
Figure 1.1 : Frequency of Reported Accidents in Year 2002-2010
Source : (SOCSO, 2005) and (SOCSO, 2010)
Figure 1.2, shows the number of Temporary Disablement Benefit Recipients and the
Total Payment for Temporary Disablement Benefit. Figure 1.3 shows the number of
Permanent Disablement Recipeints and the Total Payment for Permanent Disablement
Benefit. Figure 1.4 shows the number of Invalidity Pension Benefit Recipeints and the
Total Payment for Invalidity Pension Benefit. It can be seen that these three figures
show a significant increase in the number of benefit recipients over the years. This
situation reflects an unhealthy phenomenon in this industry. A realistic action needs to
be taken to address this problem.

6
Construction accidents are a burden and have hidden or indirect cost. The hidden or
indirect cost of an accident is eight to thirty-three times more than the direct costs, so
much so that the total cost of accidents can run into billions of ringgit. In Holland, the
total medical cost of handling accidents is almost USD 11 Billion in 2004 (Lillie-
Blanton et al., 2008).
Figure 1.2 : Number of Temporary Disablement Benefit Recipients and the Total
Payment for Temporary Disablement Benefit.
Source : (SOCSO, 2005) and (SOCSO, 2010)

7
Figure 1.3: Number of Permanent Disablement Recipeints and the Total
Payment for Permanent Disablement Benefit.
Source : (SOCSO, 2005) and (SOCSO, 2010)

8
Figure 1.4: Number of Invalidity Pension Recipients and the Total Payment for
Invalidity Pension Benefit.
Source : (SOCSO, 2005) and (SOCSO, 2010)

9
Internationally the level of industrial and construction reporting might not be very
different with Malaysia as shown in the global report in Table 1.2.
Table 1.2: Industrial and Construction Accident Statistics ( 1000s)
Country 1994 1995 1996 1997 Average
Egypt 60.7 57.3 55.4 50.9 56.1
South Africa 9.0 10.5 9.6 6.3 8.9
Namibia 5.0 3.9 4.2 4.9 4.5
Panama 16.8 16.8 16.5 15.8 16.5
Canada 429.7 411.2 378.6 380.7 400.1
Mexico 442.7 401.8 428.9 424.5
United State 3061.0 2967.4 2832.5 2866.2 2931.8
Venezuela 8.0 7.6 6.5 5.2 6.8
Puerto Rico 28.0 25.6 27.2 26.0 26.7
China 16.3 28.5 29.0 26.4 25.1
Hong Kong 64.4 59.4 59.5 62.8 61.5
Israel 84.2 88.3 92.3 83.8 87.2
Jordan 13.7 15.3 14.8 13.4 14.3
Norway 24.0 30.1 27.8 34.1 29.0
Utd
Kingdom
159.6 150.3 158.3 167.3 158.9
Australia 135.7 139.1 133.4 123.9 133.1
New
Zealand
31.6 40.0 42.6 36.5 37.7
Source: (Barling et al., 2002)

10
The data in the Table 1.2 from selected countries indicate the number of accidents in the
industrial and construction industry during the period of 1994 through 1997. The data
suggest that the level of industrial accidents was high internationally (Barling, et al.,
2002).
This illustrates a high cost of occupational injuries and fatalities for organizations in
terms of production, but more importantly, in terms of lives altered and lost by work-
related events. Fortunately, the issue of occupational safety at international level keeps
attracting the attention in both the media and at the workplace (Barling, et al., 2002).
This might come from the result of large scale industrial accidents such as Chernobyl
and Bhopal where the events were highly publicized to the general public which led to
increased level of safety awareness.
Chernobyl also was the first disaster where the term ‘safety culture’ first made its
appearance in the International Atomic Energy Agency’s initial report (IAEA). Since
then, other major disasters like King’s Cross fire and Piper Alpha have been cited as
related to the organizational structure and safety management failure to ensure the
importance of safety culture being highlighted. It is not surprising that workers start to
consider safety and health during their work time to be as important as their salary,
allowance and other benefits.
Davies et al.( 2000), however, argued that the current focus on work-related accidents is
more a function of the threat they pose for the general population than their threat to the
workers’ safety. They observed that despite the alarming number of work-related
accidents and interest in the issue, occupational safety remains an underdeveloped area
in the management of companies. The conclusion of the study below shows the
importance of management commitment, employee participation, training and education
and communication towards a high level of safety awareness;

11
‘The effect of corporate culture on injury and illness rates within the organization
showed that those elements most predictive of high level of safety awareness include a
positive management commitment to safety and to employees, open communication,
encouragement of employee innovation and suggestions, and management feedback to
employees, among others elements’ (Erickson, 2001).
The statement shows the importance of factors in organization culture to improve the
the level of safety awareness of the company. There are several important factors for
measuring LoA of OSH which can provide easy-to-understand LoA information to
technical and non-technical persons. Measuring LoA of OSH was also useful to provide
indicators to access behavior and trends in key areas of safety management so as to
allocate resources in an effective and efficient manner. Finally, it would help the
organization to facilitate communication between regulators and company’s
management and facilitate them to improve their LoA of OSH through contacts with
appropriate national and international bodies and inform the public of the plant’s safety.
The management of LoA of OSH assessment should be able to discover the overall
safety and health objectives and controlling of hazards and risks. It is normally done by
comparing with other management units to see whether the company is getting better or
worse over time. The effectiveness of the program arranged would also be known. As
the above statement discussed the general benefit of measuring LoA of OSH, there are
several potential benefits of such a comprehensive set of LoA of OSH assessment
directly to the organization.

12
The first benefit is to ensure that the organization will be able to identify the objective,
auditable and non-disputable set of safety parameters. Secondly, when used as a set, it
provides an insight as to what is important to safety. Another benefit is to provide
information that is easy-to-understand to all stakeholders, to provide an additional basis
for self-assessment and to take corrective action accordingly. It also provides an
additional basis for investigations by regulators of any incident or accident which
happens and enables comparisons to be made, especially in the framework of a small set
of internationally agreed safety indicators.
The level of safety climate will give an indication and act as an indirect evaluation of
the level of safety culture (CANSO, 2008).It should be noted that there is no entirely
satisfactory methodology for evaluating safety culture yet developed. As previously
stated, safety climate is often used as an approximate evaluation of safety culture.
Evaluating safety climate is much simpler than evaluating safety culture. The main
reason for this is that it can be done by using only quantitative methods (CANSO, 2008;
Denison, 1996; Lardner, 2003).
From observation, researcher found most of Malaysian companies do not really take
safety aspects into their business activity. They always put the importance of production
and profit first without much concern for the status of their safety aspects. Safety of
employees was solely handed to them with the belief that their employees have to take
care of their own safety. This is totally different from the concept implemented by most
multi-national companies operating in Malaysia, with their safety culture adapted from
their parent company overseas. They always believed that the safety culture
implemented by the management will positively affect their employee’s safety
performance (Bakar, 2006).

13
Construction is one of the most hazardous industries due to its unique nature. It is
highly fragmented, which marginalizes efforts to safeguard safety and health (S&H)
standards. Unlike manufacturing, construction site activities are physically dispersed
across various locations, thus supervising and monitoring S&H issues in the workplace
is much more challenging (Cheah, 2007). In comparison, construction is often classified
as high risk because historically it is plagued with higher and unacceptable injury rates.
Therefore, as one of the central purposes of this survey is to understand how office
safety climate factors affect the employees LoA of OSH and further understand the
means by which positive or negative effects may occur. In order to investigate this
relationship, there is a need to understand the factors of employees’ LoA of OSH which
is their trust in management, effective commitment to the organization and perceptions
of safety culture. These factors have been hypothesized to have positive impact on LoA
at the employees’ level. LoA of OSH has been conceptualized to extend beyond simply
the numbers of lost time injuries, but rather to include employees’ personal safety
orientation (comprised of safety knowledge, motivation, safety initiatives and safety
compliances) and involvement in safety incidents (such as those requiring first aid as
well as near-misses).
Moreover, this study was conducted with the hope that it becomes a useful reference for
any government agency to incorporate the safety culture of the management with their
employee’s LoA of OSH. Figure 1.5 shows that, the proposal of this study is to
investigate the relationship of four factors of Safety climate on the Employees’ LoA of
OSH. The factors of Safety Climate consist of Management Commitment, Employee
Participation, Training, Education and Communication. The factors of LoA were safety
orientation, safety and health policies in the department, risk assessment
implementation, the monitoring systems used and review of all S&H related matters.

14
Figure 1.5: Proposed model: Effect of safety climate factors on Level of
Awareness on Occupational Safety and Health
According to Amat (2008), Occupational Safety and Health at a construction site covers
a wide scope of issues and problem statements. Among the prominent issues are:
a) Construction involves multi-tasking and mixed tasks in a dynamic environment
(with this situation the construction personnel are faced with ever-changing
hazards);
b) The implementation of construction projects revolves around three main
elements namely quality construction, cost implication and work schedule (with
these aspects every contractor and project team are motivated in getting the job
done fast to gain from early completion of the projects);
c) Contractors and their workers tend to make do with available material at site and
in different kinds of environment;
d) Lack of systematic hazard identification and elimination implemented at
construction sites;
e) Lack of knowledge and training among construction workers and contractors;
f) Lack of safety management and monitoring at construction sites;
g) Injuries, illness and construction incidents are under-reported;
h) Safety and health issues are not explicitly spelt out in the contract and viewed as
a financial and human resource burden.
Safety Climate Factors
1.Management Commitment
2.Employee Participation
3.Training and Education
4.Communication
Level of Awareness of OSH
1. Orientation
2. Policy
3. Monitoring
4. Risk Assessment
5. Review

15
1.2 Study Objectives
The objectives of the study are:
1) Determination of effects of employee`s demographic background on the
perception of Level of Awareness (LoA) on OSH;
2) Measuring the Level of Awareness on Occupational Health and Safety of the
agencies;
3) Developing statistical analytical tool for measuring and correlating the Level of
Awareness of Occupational Safety and Health and Safety Climate Factors;
4) Identifying significant factors influencing the Level of Awareness of OSH using
Multiple Regression Analysis;
5) Model Validation for evidence to support the relationship between dependent
and independent variables.
1.3 Research Significance
A lack of studies in safety climate/safety culture research has been highlighted in the
literature, for example,(Glendon et al., 2006; Huang, 2010; Lu, 2007). Therefore, the
focus of this thesis is concerned with the degree to which safety climate factors impacts
and influences safety performance (via level of safety awareness of OSH), particularly
with regards to the improvemence of safety outcomes in the Malaysian construction
industry over a period of time. This unique study has not been done before, in a
developed country or in a developing country. With regards to the research publications,
research in safety issues (for example, safety management and safety climate(or culture)
has been predominantly published by western scholars that focused their research on
western countries such as the UK, US, Australia, Canada, Scandinavian countries and
European countries.

16
Very little research related to safety management has been conducted in eastern
countries, especially in Malaysia (Bahari, 2011). Furthermore, through literature review,
it is found that the theoretical and empirical understanding of safety climate research
that has been conducted in Malaysia or other eastern countries was based on the
theories, conceptions and contributions of western scholars. Due to this fact, the
findings of this current study are believed to be unique in that they contribute to a
significant development of safety management research, especially in safety
performance and safety climate (or culture) research in an eastern developing country
which differs in terms of national culture. The findings of this study have contributed
theoretically to a small but growing body of knowledge on safety performance
effectiveness and safety climate factors. In this study, it has been hypothesised that
safety climate factors impacts would influence the level of awareness of OSH at four
government agencies, reflecting changes in the underlying safety culture in the
Malaysian construction industry under study. In this construction industry scenario,
safety is highly prominent and in all the agencies studied, both level of safety awareness
impacts and the safety climate perceptions improved considerably.
The department under study was operating on the basis that providing employees with
safety training would facilitate improvement of the safety culture over a period of time,
as asserted in the literature (Cooper, 1998; Harvey et al., 2001). Whilst the safety
training impacts on improving knowledge, skill and hazards awareness are well
established in the literature, there is little literature evaluation of safety performnce on
its impact on organisational variables, such as safety climate (or culture). The findings
of this study revealed that significant improvements in the safety climate factors related
to Management Attitude and Management Action, indicate that the management role
has been viewed as crucial in improving and supporting employees’ and organisation’s
safety.

17
Over a period of time, the positive correlation between safety climate factors and safety
awareness became stronger with a significant correlation in all the agencies studied.
This finding adds to the theoretical proposition that level of awareness is an antecedent
in improving safety climate. There is no doubt that safety awareness appears to be a
powerful mechanism that has positive effects on safety culture and workplace accidents
within an organisation over time. The findings of this current study add to the position
that safety climate is not universal and stable, as pointed out by Ismail, et al. (2010),
safety climate factor structure failed to be replicated in the Malaysian context. The
findings of this study also strongly support the notion that there is more than one safety
culture within an organisation. The subgroup differences suggest that a large group
within the organisation as a whole do not share an overall perception of safety within
organisations and lead to an absence of safety culture (Hopkins, 2006). Therefore, this
chapter commences, by discussing the findings according to the five research objectives
addressed in this study. The nature of the findings is such that they need to be
considered mainly in terms of consequences for each hypothesis and its implications
with regards to each objective.
As to be concluded, construction accidents have been causing many human tragedies,
loss of life and property; lower productivity, and delayed projects. The main reason for
selecting this topic is the need for improving safety management implemented in the
DID Malaysia. Other reasons are:
a) The lack of studies about the safety issues of construction industry in Malaysia.
b) There has been very little research carried out by academics and practitioners on
the Occupational Safety and Health (OSH) problems faced by the local
construction industry.
c) To provide some ways to help government agencies improve safety management
at the workplace.

18
d) To provide some ways to help companies improve safety management at the
construction sites.
e) To comply to Act 514- OSHA 1994 Part IV- General Duties of Employers and
Self-Employed Persons- under sections 15( see Appendix A).
According to Rampal et al. (2004), LoA among labor in Palm Oil Industries were still
low although the act had been implemented for almost ten years.
1.4 Research Methodology
The study begins with exploratory work to focus on current and pertinent issues that
will enable the identification of a clear and precise statement of the problem.
Subsequently, the research performs a through literature review on the area of study and
adopts a quantitative survey method by conducting a preliminary study and field survey
as the strategy for data collection. All data were analyzed by quantitative techniques
namely descriptive statistics, statistical analysis, regression analysis and Pearson
correlation. Statistical Package for Social Science (SPSS) version (16), is the main tool
in assisting the data analysis. The research methodology is further discussed in
Chapter 3. It is to be noted that all the figures and tables shown in this thesis are based
on this research unless otherwise stated.
19
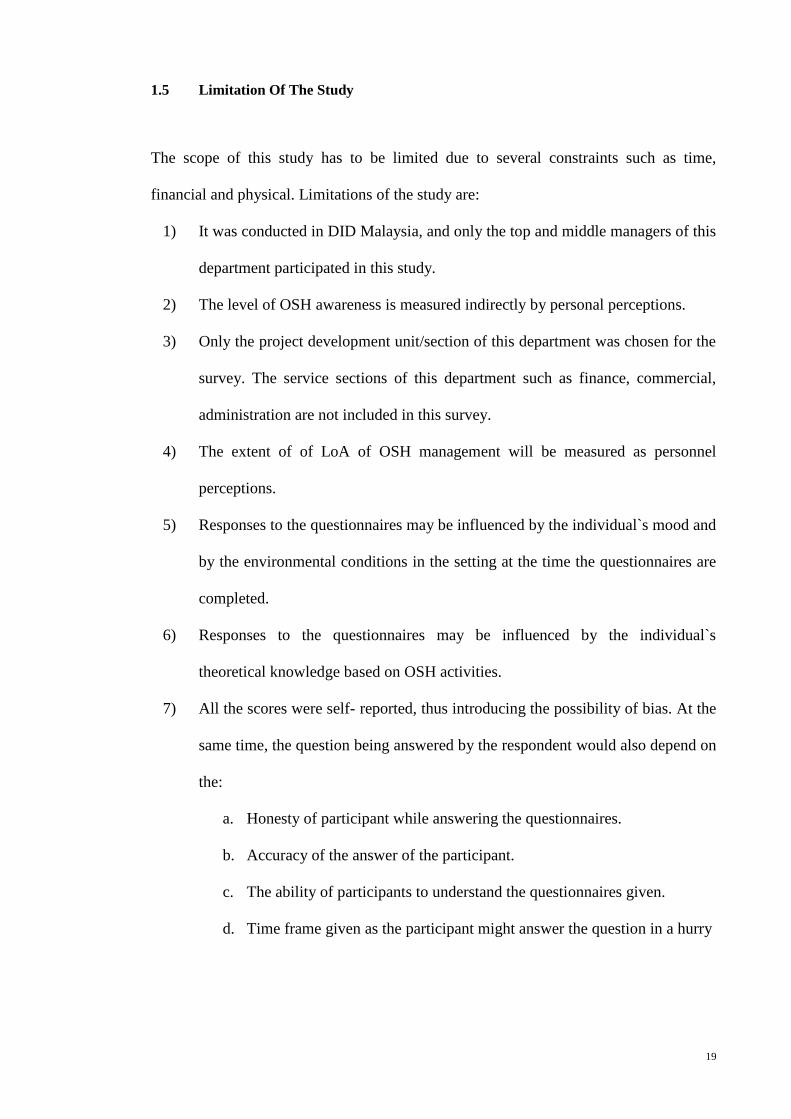
1.5 Limitation Of The Study
The scope of this study has to be limited due to several constraints such as time,
financial and physical. Limitations of the study are:
1) It was conducted in DID Malaysia, and only the top and middle managers of this
department participated in this study.
2) The level of OSH awareness is measured indirectly by personal perceptions.
3) Only the project development unit/section of this department was chosen for the
survey. The service sections of this department such as finance, commercial,
administration are not included in this survey.
4) The extent of of LoA of OSH management will be measured as personnel
perceptions.
5) Responses to the questionnaires may be influenced by the individual`s mood and
by the environmental conditions in the setting at the time the questionnaires are
completed.
6) Responses to the questionnaires may be influenced by the individual`s
theoretical knowledge based on OSH activities.
7) All the scores were self- reported, thus introducing the possibility of bias. At the
same time, the question being answered by the respondent would also depend on
the:
a. Honesty of participant while answering the questionnaires.
b. Accuracy of the answer of the participant.
c. The ability of participants to understand the questionnaires given.
d. Time frame given as the participant might answer the question in a hurry
20
In an effort to counter-balance the specified limitations, the researcher made a clear
explanation to survey respondents about the purpose of this study, the meaning of each
question asking for honesty and sincerity and cooperation from the respondents in
answering the questions. Despite all those limitations, this study should reveal findings
of both theoretical and practical significance. The results will suggest the determinants
of good safety culture among employees and their safety management system.
1.6 Outline Of Chapters
This thesis is structured as follows:
Chapter 1: Introduction. A brief discussion of the topic
Chapter 2: The concept of Level of Awareness of OSH management. This chapter
provides the definition of Level of LoA of OSH management,
organizational culture, safety culture, safety climates. It will also discuss
dependent and independent variables.
Chapter 3: Methodology. Explanation of research methodology used in this study
including Research Design, Research Instrument, Questionnaire Design,
Data Collection and Procedures, Technique of Data Analysis and
Validation of the model developed.
Chapter 4: Results and Discussions. Indicate the survey results obtained from this
study. This chapter describes the measurement of OSH LoA, statistical
analysis to test on correlation between variables, multiple regression
analysis between dependent variable and independents variables and
validation of the model to ensure that the model was validated and
reliable.

21
Chapter 5: Conclusions and Recommendations. Describes the conclusions of the
study and chapter will also highlight the problems faced and proposes
some effective recommendations. Proposed future studies are also
presented.
1.7 Scope of Study
This study was conducted at two offices in the Department of Irrigation and Drainage
Malaysia (DID), referred to as DEP1 and DEP2. For the purposes of this study, the
overall DID was divided into two groups. Each office manages the Occupational Safety
and Health (OSH) Management System differently. DEP1 used normal management
practices such as Total Quality Management Systems (TQM) while DEP2 manages the
OSH management system under ISO 18000 certificates issued by Standard and
Industrial Research Institute of Malaysia (SIRIM) since year 2005.
In general, DID has five major functions which are River Basin Management and
Coastal Zone, Water Resources Management and Hydrology, Special Projects, Flood
Management and Eco-Friendly Drainage (see Appendix B). In dealing with these five
major functions, there are various types of work performed, including physical work
such as construction works for flood mitigation projects, providing agricultural
channels, construction of office buildings and a variety of laboratory-related work. In
carrying out the work of supervision, a front-line technician is constantly exposed to the
danger of accidents. From the management side, it shows the initiative taken by them to
monitor performance by using a specific indicator while promoting the management’s
own process improvements.

22
The focal problems addressed by this study can be summarized into three parts as
presented below:
a) There is a need for an evaluation of the level of awareness of OSH in DID.
b) There is the need to develop a model to measure LoA among the workforces.
c) There is a need for specific recommendations on what to do in order to improve
the level of awareness of OSH Management system.
This study will mainly focus on the evaluation of the safety climate and not the direct
evaluation of the safety culture per se. This is intended to narrow the scope and to
enhance the quality of the study. Due to the very broad scope of safety culture, it is
difficult for researcher to conduct a study with a very limited capacity. Therefore, the
researcher reduced the scope of this study, by measuring the safety climate only in
selected organizations. Previous study showed that the measure of safety climate is
enough to reflect the level of safety culture in an organization (Antonsen, 2009; Flin et
al., 2000).
Consequently, it was found later, in terms of position, the technician formed a large
proportion of respondents in this study. Answers they provide should be considered
based on their work experiences.

23
1.8 Concluding Remarks
Chapter 1 discusses the topic and research scopes of the thesis. This research is to
determine the level of employees’ perception on Safety Climate factors and Level of
Awareness (LoA) at the same time to test the relationship between safety climate factors
and the LoA of OSH management system. It could be used to improve safety culture
and safety management system implementation at the workplace.
The following chapter explores the literature review with regard to the topic in general
and LoA of OSH management system in particular.
24
CHAPTER 2: THE CONCEPT OCCUPATIONAL SAFETY AND HEALTH
(OSH) PERFORMANCE
Measuring health and safety is not easy and there are no simple answers to this problem.
Measurement is a necessary step in any process management for continuous
improvement. If the measurement is not performed correctly and accurately, the
effectiveness of a health and safety management system is not clear and there is no
reliable information to inform managers how well health and safety risks can be
controlled (Lingard, 2011). Although there is much information that can be obtained
from the performance measurement process generally, there is little that can lead to
health and safety aspects. HSE’s experience shows that organizations find health and
safety performance measurement a difficult job. They struggled to develop measures of
health and safety performance measurement that is not based solely on injury and illness
statistics (HSC, 1993).
There are several methods of measuring safety performance. Traditionally, it is made
using accident statistics such as minor accidents, near-miss accidents and fatalities.
However, this method has the disadvantage of available recorded data quality because
there found no accidents reported by the employer for any reason, for example due to
fear of legal action for default to the safety regulations gazetted in the act. Now, the
collection of information on respondents' experience and perception are becoming
increasingly popular study, done by researchers because it was found very effective
impact on the safety management system (Lingard, 2011). Safety performance within an
organization can also be evaluated through the implementation of safety culture in the
workplace. Accordingly, the components in the safety culture were described.

25
2.1 The Component of Safety Culture
Figure 2.1 The three aspect of a safety culture presented by Cooper (2000). (The
figure is adapted from CANSO (2008)
The components of safety culture is also a topic that scientists have not yet agreed on.
This thesis is based on the concepts of safety culture described by Cooper (2000);
Guldenmund (2010); Reason (1997). Cooper (2000), refers to Bandura’s (1986) model
of reciprocal determinism when he describes safety culture. The model consists of three
interrelated aspects of safety culture, the psychological aspects, the behavioural aspects
and the situational aspects. The psychological aspects of a safety culture refer to the
safety climate or in other words ― how people feel about safety and safety management
systems. According to Cooper (2000), this aspect concerns individual and group values
as well as attitudes and perceptions of safety. Safety climate has though been defined in
several ways in the literature and not all definitions include values, attitudes and
perceptions. The behavioural aspects of a safety culture are concerned with ― what
people do. This includes safety-related activities, actions and behaviours but also the
Safety Culture
Psychological Aspects
“How People Feel”
Can be described as the
“safety climate”. This
aspect concern individual
and group values as well as
attitudes and perceptions
of safety.
Behavioural Aspects
“What people do”
This aspect concern safety-
related activities,actions
and behaviours but also the
managements`commitment
to safety.
Situational Aspects
“What the organisation has”
This aspects concern e.g.
policies,procedures,regulati
ons,organizational
structures,management
syatems,control syatems
and communication
systems.

26
managements’ commitment to safety. The situational aspects refer to ― what the
organization has. This includes e.g. policies, procedures, regulations, organizational
structures, management systems, control systems and communication systems. An
overview of the concept can be found in Figure 2.1 CANSO (2008); Cooper (2000);
HSC (1993). According to Cooper (2000), Bandura’s (1986) reciprocal model is the
perfect model to use when analyzing safety culture. This study will focus on assessing
the psychological aspects of ‘how people feel’ which can be measured through safety
climate factors. This aspect concerns about individual and group values as well as
attitudes and perceptions of safety management.
2.1.1 Definition
A problem with safety culture and safety climate is that there exists no universal
agreement on the definitions of these concepts. The concept of safety culture was first
truly introduced and defined after the Chernobyl accident. The lack of theoretical
background to this definition resulted in a development of numerous definitions
(Cooper, 2000). There is also on going academic debate about the differences and
similarities between these two concepts (Clarke, 2000). Attempts have though been
made to find commonalities in the definitions of both safety culture and safety climate
in order to find consensus regarding the concepts. Accordingly, the definitions of
organizational culture, safety culture and safety climate will be discussed in the
subsection below.

27
2.1.1.1 Organizational culture
The concept of safety culture has it origin in the concept of organizational culture
(Nordên-Hágg et al., 2010). In order to understand what safety culture is, it is therefore
important to understand the concept of organizational culture. The concept of
organizational culture was truly developed during 1970s even though the ideas already
existed earlier. Unfortunately, no standard definition of organizational culture has yet
been developed and accepted. In fact, there is a controversy among scientists today
whether organizational culture is something an organizational “is” or something an
organization “has”. The former view considers organizational culture as a way of
describing the organization. This is often preferred by academics and social scientists.
The latter view implies that culture is a variable that can be changed. This approach is
often favoured by managers and management consultants (Davies, et al., 2000; Nordên-
Hágg, et al., 2010; Reason, 1997).
Reason (1997), defines organizational culture as “a shared values (what is important)
and beliefs (how things work) that interact with an organizational structure and control
systems to produce behavioural norms (the way we do things around here)”.
Cooper (2000), defines organizational culture as “a concept often used to describe
shared corporate values that affect and influence members` attitudes and behaviours”.
Guldenmund (2010), presents a framework for safety culture which was based on
Schein`s research and therefore also partly based on Schein`s definition of
organizational culture. Schein (2010), defines organizational culture as “ a pattern of
shared basic assumptions that the group learned as it solved its problems of external
adaptation and internal integration, that has worked well enough to be considered valid
and, therefore, to be taught to new members as the correct way to perceive, think and
feel in relation to those problems”.

28
2.1.1.2 Safety Culture
“The trend around safety culture originated after the Chernobyl disasters brought
attention to the important of safety culture and the impact of managerial and human
factors on the outcome of safety performance”(Flin, et al., 2000; IAEA, 1986). The term
`safety culture` was first used in International Nuclear Safety Group (INSAG`s 1988)
Summary Report on the Post-Accident Review Meeting on the Chernobyl Accident
where safety culture was described as: “That assembly of characteristics and attitudes
in organizations and individuals which establishes that, as an overriding priority,
nuclear plant safety issues received the attention warranted by their significance”. The
idea was introduced to explain how lacking of knowledge and ‘indifferent attitude’ of
risk and safety by the employees and organization contributed to the disaster”(Flin, et
al., 2000).
The presented concept of safety culture was then left open to interpretation without any
reference to literature. The lack of theoretical background together with the fact that the
concept was not based on organizational culture theory has led to a development of
numerous definitions of safety culture. In fact, both the definition of safety culture and
its relationship to organizational; culture is something that is not yet agreed on
(Choudhry et al., 2007; Guldenmund, 2010; Mohamed, 2002). Since then, a number of
definitions of safety culture have been published. The U.K. Health and Safety
Commission developed one of the most commonly used definitions of safety culture:
“The product of individual and group values, attitudes, perceptions, competencies, and
patterns of behavior that determine the commitment to, and the style and proficiency of,
an organization`s health and safety management” (HSC, 1993).

29
Advisory Committee on the Safety of Nuclear Installations (ACSNI), developed another
widely used definition of safety culture, describes as:
“The safety culture of an organization is the product of individual and group values,
attitudes, perceptions, competencies and patterns of behavior that determine the
commitment to, and the style and proficiency of, an organization`s health and safety
management. Organizations with a positive safety culture are characterized by
communications founded on mutual trust, by shared perceptions of the importance of
safety and by confidence in the efficacy of preventive measures.”
Since the 1980's, there has been a large amount of research done in the area of safety
culture. However, the concept remains largely ‘ill- defined’ (Guldenmund, 2000). In the
literature there are several different definitions of safety culture with specific arguments.
The above definition, from the International Atomic Energy Agency (IAEA) and the
UK Health and Safety Commission (HSC), are two of the most prominent definitions
and most commonly used definitions (Yule et al., 2007). However, there are some
common characteristics that are shared by other definitions. Several features related to
safety culture, including the establishment of beliefs, values and attitudes that are shared
by a group. Glendon, et al. (2006), emphasized that several definitions of Flin, et al.
(2000), safety culture depend on individual perceptions which are shared within the
group, the organization, or the community. For example, Cox (1991; HSC (1993);
Pidgeon (1991); Schein (1992), all refer to ‘shared perceptions of safety’. Reason
(1998), stressed that safety culture "is a concept whose time has come", states that there
are challenges and opportunities to "develop a clear theoretical understanding of these
organizational issues to create a principled basis for more effective culture-enhancing
practices”.

30
There is a trend to be specified in terms of safety culture attitudes or behaviors.
Glendon, et al. (2006), emphasized that when defining safety culture premise of some
researchers is to focus on attitude, where others emphasize safety culture being
expressed through their behaviors and work activities. In other words, organizational
safety culture is used as a guide as to how employees behave at work. Of course, their
behaviors will be influenced or determined by any consideration reward received in the
workplace. For example, Clarke (2006), stated that safety culture is not only observed
within the "general state of premises and conditions of the machinery but in the attitudes
and behaviors of employees towards safety". Perceptions of organizational safety
culture are important to be identified because it is a critical factor that influences many
aspects of human performance and safety organizations. One of the most concise and
usable definitions of safety culture has been discussed by von Thaden (2008).
Safety culture is defined as the enduring value and prioritization of workers and public
safety by each member of each group and in every level of the organization. It refers to
the extent to which individuals and groups will commit to personal responsibility for
safety; act to preserve, enhance and communicate safety concerns, strive to actively
learn, adapt and modify (both individual and organizational) behavior based on lessons
learned from mistakes; and strive for the honor in association with these values. This
definition incorporates the key issues such as personal commitment, responsibility,
communication, and learning in a way that are not only influenced by the top
management level, but also the behavior of everyone in the organization. It shows that
the organization has some sort of safety culture, but this culture is expressed with
varying degrees of quality and follow-through.

31
Comparing the definitions of safety culture, it is evident that there are some similarities
between each other. With the exception of the definition provided by the Health and
Safety Commission (1993), the similarity is that the definitions tend to reflect the notion
that safety culture is something that the organization ‘is’ rather than something that the
organization ‘has’ (De Witte, 1999; Deal, 1982; Ogbonna, 1996) cited by Ferraro
(2002). This view was shared by many authors when they characterized the safety
culture as “something to do with the people and unique quality and style of
organization”. Kilman (1985), quoted by Marcoulides (1993), “the way we do things
around here” (Deal, 1982), or the expressive ‘non-rational qualities or an organization`.
Until recently, culture has been examined with performance and effectiveness.
According to Cooper (2000); Reicher (1990), while culture researchers have devoted
numerous articles to the nature and definitions of culture, relatively fewer articles have
been contributed towards culture and performance research. One reason for this was the
difficulty in operationalizing the culture construct.
2.1.1.3 Safety Climate
Safety climate is of current interest to construction practitioners and researchers. The
concept of safety climate has been actively explored in the field of industrial and
organizational psychology but is just gaining popularity in the construction industry
(Lingard, 2011). A positive and strong safety culture is important for ensuring worker
safety. For example if team members feel unable to speak freely about errors or risks
they see, then this is likely to delay identification and action to reduce risks. As with
organizational culture and safety culture no standard definition of safety climate exists.
There is also confusion concerning the relationship and the differences between safety
culture and safety climate.

32
Consequently, the term safety climate is sometimes used interchangeably with the term
safety culture (Guldenmund, 2010). One of the more common descriptions of safety
climate is that it is a “snapshot” of safety culture (CANSO, 2008; Wiegmann et al.,
2001; Zhang et al., 2002). This means that safety climate reflects the safety culture at a
given time and place. In contrast to safety culture, safety climate often refers to the
features and not to the deeper context (Denison, 1996).
Nordên-Hágg, et al. (2010), concluded in her doctorial’ thesis that it can be considered
that the organizational culture is expressing itself through the organizational climate.
Wiegmann, et al. (2001), formulated, what they call, as a global definition.
The definition states that “Safety climate is the temporal state measure of safety culture,
subject to commonalities among individual perceptions of the organization. It is
therefore situational based, refers to the perceived state of safety at a particular place
at a particular time, is relatively unstable, and subject to change depending on the
features of the current environment or prevailing conditions.”
2.2 Performance Measurement
Monitoring of Occupational Health and Safety performance has traditionally focused on
the measurement results, such as lost time injuries and number of accident records
(Australia, 1994; Department of Employment and Workplace Relations Office of
Australian Safety and Compensation, 2005; Lingard, 2011; Wales, 2001). Management
usually measure performance to determine whether the set objectives or goals are
achieved (Wadsworth, 2009). There are various areas in which monitoring of
performance management can be made. Some examples include the production,
financial and cost aspects of the environment and the health and safety of workers
(Cooper, 2001). For this study, performance measured through survey among
supervisory workers in few selected government agencies regarding their Level of

33
Awareness (LoA) of Occupational Safety and Health Management System implemented
in their daily routine work. Performance measurement is an important aspect of
monitoring and evaluating the effectiveness of an Occupational Health and Safety
program in the company and/or industry (Redinger, 2002). One of the main objectives
of the performance measurement on Occupational Health and Safety program is to
provide feedback on the health and safety management.
Health and safety are different from many aspects measured by managers because
success depends on the number of cases (injury or illness) than it actually is. But even
with the rate of total injuries and ill-health rates being low in the last few years, there is
no guarantee that risks are controlled and that it will not lead to injury or illness in the
future. This is particularly true in organizations where there is a low probability of
accidents, but the main danger is present. The historical record can thereby be a
misleading indicator of safety performance. Organizations need to recognize that there
is no reliable single method to measure the performance of health and safety
performance. What is needed is a ‘basket’ step or ‘balanced scorecard’ which provides
information about various health and safety activities. Because there are disadvantages
associated with the use of data and ill-health injuries only as a way to measure
performance, some organizations recognize they need to be more proactive or adopt
‘up-stream’ performance measures. Generally this translates into the things that can be
easily measured, such as the number of training courses or number of inspections.
Identifying deficiencies is a systematic approach to derive these measures and show
how they relate to the risk control process. This is similar to the period before the
emergence of a model for health and safety management system, when there is activity
on the health and safety but little understanding of the activities done in the framework
of health and safety management as a whole (Smith, 2009).

34
According to HSE (2001), the benefits associated with the introduction of a
performance measurement system for Occupational Health and Safety includes:
1) The ability to provide an indication of how the management is performing in
relation to Occupational Health and Safety issues;
2) The ability to identify problem areas where adverse outcomes are occurring and
subsequently to identify where preventive action should take place;
3) The ability to document effects of attempts to improve Occupational Health and
Safety performance. For example, a measurement system could provide
feedback as to whether implemented safety interventions are operating
adequately;
4) The ability to promote Occupational Health and Safety reviews of existing work
practices and work organisation; and
5) The ability to benchmark performance measures or comparative performance
assessments.
2.3 Measuring the Health and Safety Culture
In order to ensure the effectiveness of risk control in an organization it is found that the
health and safety culture is an important key factor. Systematic health and safety
management system significantly influences the safety culture of an organization.
Measuring aspects of safety culture is a part of the whole process of measuring health
and safety performance. According to Bergh (2011), there are a lot of activities that
support the development of a positive safety culture that should be measured. They fall
under the heading (‘4Cs’): control, communication, co-operation and competence.

35
The term ‘health and safety climate’ has been used to describe the tangible output of
organizational culture of safety and health as perceived by the individual or the group at
a point in time. Health and safety climate can be measured. There are many tools
available to measure safety climate developed, tested and used after the pioneering by
Zohar (1980), around the world, in various sectors to enable organisations to canvass the
views of their employees on some key aspects of health and safety within their
organisation. Several research publications have been collected, evaluated and
compared. Safety climate questionnaires are available to analyze the underlying
definitions, theories, the factors (dimensions), their predictive validity, etc.
The health and safety related behaviour of individuals at all levels of the organisation is
influenced by the health and safety culture, and the behaviours in turn shape the culture.
Behaviours which support and promote a positive health and safety culture and an
effective health and safety management system need to be included within the
measurement process.
‘There are a variety of methods that have been used to assess safety culture and safety
climate. Unfortunately, however, there are no standardized or “off the shelf” tools that
can be used across domains or even within a single domain’ (Flin, et al., 2000).
However, several factors should be considered in assessing the safety culture, including
methods of measurement, the level of analysis, and implementation constraints.
36
2.4 Method of Measurement
Tools for assessing safety culture is divided into two namely, qualitative and
quantitative methods. Qualitative methods including observation employees, focus
group discussions, review of historical information, and case studies (Wreathall, 1995).
With qualitative measurement methods, organization members usually serve as
informants, which interact directly or indirectly with the researchers, using their own
terminology and concepts to express their thoughts, as in a focus group discussion
(Rousseau, 1990). Thus, by measuring qualitative, intensive and in-depth information
can be obtained using the focal group`s own language. Meanwhile, the quantitative
methods attempt to numerically measure or score safety culture using procedures which
is highly standardized and calibrated, such as highly structured interviews, surveys and
questionnaires (Wreathall, 1995). In the quantitative measurement approach, the
members of the organization usually acts as respondents who had responded to a
standard set of stimuli or questions provided by the researcher (Rousseau, 1990).
Quantitative method is relatively easy to use in cross-sectional comparisons, generally
easy to implement in different organizations and by other researchers, and
straightforward according to common, articulated frame of reference (Wreathall, 1995).
There is an agreement among researchers that both qualitative and quantitative methods
have a unique potential for the evaluation and testing of theories and that there are
benefits to combining methods to gain a thorough understanding of safety culture.
However, quantitative approach, especially individual survey responses, often more
practical, in terms of time and cost effectiveness (Glendon, et al., 2006; Wreathall,
1995). Thus, the available surveys and questionnaires have been widely used to assess
the safety culture in a variety of industries, such as chemicals, construction,
transportation, and manufacturing.

37
As presented by Cox (1991), safety culture can be likened to personality, whereas
climate is likened to mood. Both can change within an organisation. However, like
one’s personality, safety culture takes time to grow and change; you can not
“implement” a safety culture but it can be re-directed through concerted effort and
action by an organisation. Safety climate, as with one’s mood, can change more quickly
and dramatically given the circumstances and current conditions being faced by an
organisation and the resulting actions taken. You try to shape the culture over time by
changing the climate.
2.5 Factors Affecting Occupational Safety and Health Programs
As will be further discussed in Chapter 3, safety climate is assessed by means of
quantitative, psychometric questionnaire surveys, so-called 'safety climate scales',
measuring the shared perceptions/opinions of a group of workers on certain safety
related dimensions or factors. Examples are perceptions towards management,
commitment to safety, leadership safety support, worker communication, participation
and competence (including training aspects) with regard to safety, safety systems
(policies, rules, reporting, preventive measures, etc.), risks, and work pressure (Flin, et
al., 2000; Seo, 2005). The outcome of such safety climate scales are regarded by many
researchers as a predictor or indicator of safety awareness..
There are few studies which have been done by scholars all over the world on
workplace safety management, level of awareness of occupational safety and health
management, safety program issues, etc. In order to effectively gain from safety
programs, factors that affect its implementation need to be studied.

38
The following in Table 2.1, is the list of factors/dimensions of safety scales identified
by the researcher, from several studies that have been done throughout the world on
safety issues. Accordingly, we will have the safety climate factors that can be used as
the tool to measure LoA in the current study.
Table 2.1: Factors affecting the implementation of safety programs
No. Places Factors Comments
1. Thailand
(Aksorn, 2008); (Pipitsupaphol,
2000)
i. Clear and realistic goals
ii. Good communication
iii Delegation of authority and
responsibility
iv. Management Support
v. Program Evaluation
vi. Continuing Participation of
employees
vii. Personal Motivation
viii. Personal Competency
ix. Teamwork
x. Positive group norms
xi. Personal attitude
xii. Effective enforcement scheme
xiii. Safety equipment acquisition
and maintenance
xiv. Appropriate supervision
xv. Sufficient resource allocation
xvi. Appropriate safety education
And training.
16 Factors were
grouped into 4
dimensions:
i. Management
commitment
ii. Worker involvement
iii. Safety arrangement
iv. Safety prevention
and control system

39
‘Table 2.1, continued’
No. Places Factors Comments
2. Singapore
(Cheah, 2007);(Evelyn et al.,
2005)
- To establish worksite safe should
be shared by developer,
consultant and government.
- lack of integration of safety
consideration in the upstream
construction activities.
- the role of government
- poor chain of command and
management
- role of workers
- negligence by contractor
- inadequate company policies
- unsafe practices
- poor in attitudes
- insufficient safety knowledge
and training.
The challenge of
making worksites safe
should be shared by all
parties affecting the
value chain of
construction including
the developers, the
consultants and the
government.

40
‘Table 2.1, continued’
No. Places Factors Comments
3. Indonesia
(Yusuf Latief et al., 2011)
i. working condition
ii .management failure
iii. unsafe acts of workers
iv. non-human related events
v. improper PPE equipment
vi .failure to follow instruction and
SOP
vii. careless
4. Malaysia
(Abdul Rahim, et al., 2008);
(Abdul Razak et al., 2010);(Che
Hassan, 2007)
i. workers` negligence
ii .improper PPE
iii. poor site management
iv .lack of knowledge
v. poor attitude
vi. organizational commitment
vii. communication among
workers
viii .obstacles to safety
Analysis of key
functional areas like
operations management,
R&D, and OSH
administration provide
insights into
improvement.
5. China
(Tam et al., 2004)
i. poor safety awareness of top
management
ii. lack of training
iii. poor safety awareness of
project manager
iv .reluctant to input resources to
safety
v .reckless operation
vii .poor equipment

41
‘Table 2.1, continued’
No. Places Factors Comments
6. Hong Kong
(Fang et al., 2006)
i. Management commitment
ii. employees involvement
iii. resources and training
iv. inappropriate safety procedures
v. work pressure
vi .competence
vii. appraisal of hazard and
reporting
There is significant
statistical relationships
between safety climate
and personal
characteristics including
safety knowledge, direct
employer and individual
safety behavior
7. Kuwait
(Katram et al., 2000)
i. disorganised labour
ii. extensive use of subcontractor
iii. lack of safety regulation and
legislation
iv. low priority given to safety
v. competitive tendering
vi. severe weather condition
vii. poor accident record keeping
and reporting systems
xiii. extensive use of foreign labor
ix. small size of most construction
firms.
8. Libya
(Al-Kilani, 2011)
i. management commitment
ii. role of workers
iii. safety knowledge
iv. safety awareness
v .lack of training
vi. delivery system
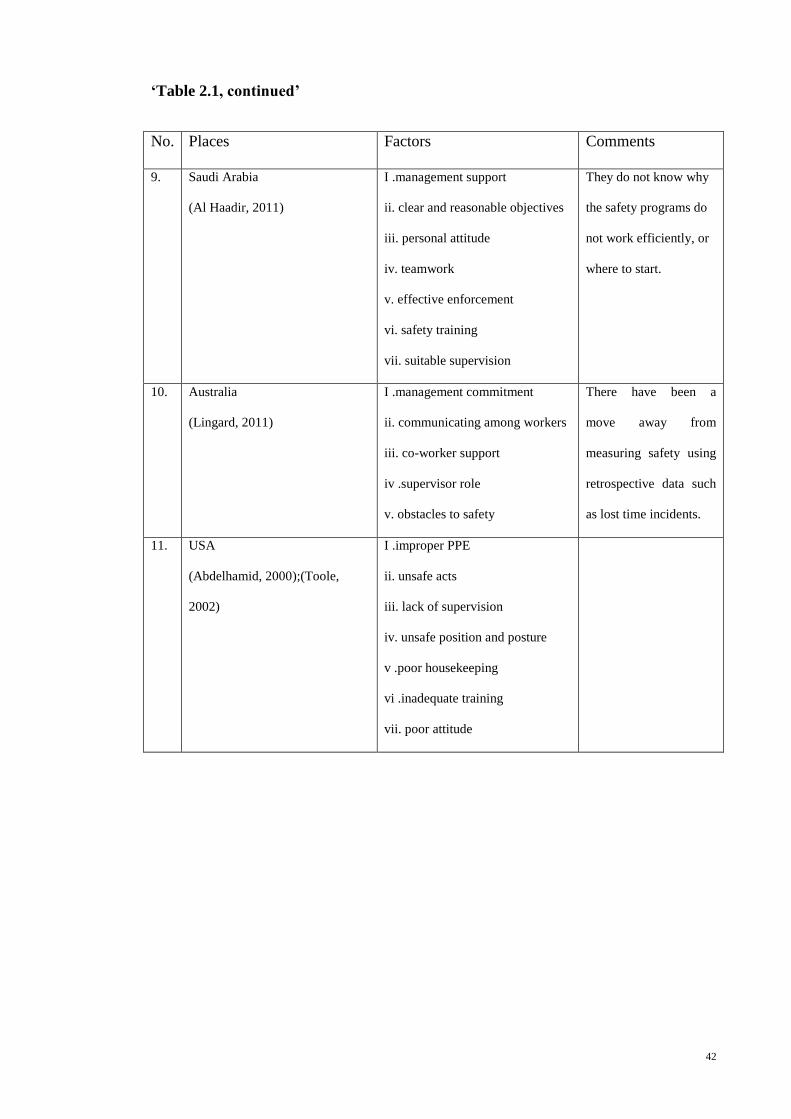
42
‘Table 2.1, continued’
No. Places Factors Comments
9. Saudi Arabia
(Al Haadir, 2011)
I .management support
ii. clear and reasonable objectives
iii. personal attitude
iv. teamwork
v. effective enforcement
vi. safety training
vii. suitable supervision
They do not know why
the safety programs do
not work efficiently, or
where to start.
10. Australia
(Lingard, 2011)
I .management commitment
ii. communicating among workers
iii. co-worker support
iv .supervisor role
v. obstacles to safety
There have been a
move away from
measuring safety using
retrospective data such
as lost time incidents.
11. USA
(Abdelhamid, 2000);(Toole,
2002)
I .improper PPE
ii. unsafe acts
iii. lack of supervision
iv. unsafe position and posture
v .poor housekeeping
vi .inadequate training
vii. poor attitude

43
‘Table 2.1, continued’
No. Places Factors Comments
12. Jordan
(Mohammad et al., 2010)
i. lack of safety regulation
awareness
ii .lack of enforcement
iii. incompetent personnel
iv. mechanical failure
v. chemical impairment
13. Turkey
(Colak et al., 2004)
poor attitude
ii. unsafe site condition
iii. Lack of knowledge and
training
iv. defective material used
v improper PPE
14. Uganda
(Lubega et al., 2000)
i. lack of safety regulation
awareness
ii .lack of enforcement
iii .incompetent personnel
iv. poor attitude
v. improper PPE
Some researchers have tried to identify the common characteristics between surveys,
particularly on dimensions as shown in Table 2.2.

44
Table 2.2: Safety Dimensions
No. Researcher Dimensions Comments
1. (Clarke, 2000) i. safety management systems
ii. individual responsibility and
involvement
iii. work task/work environment
iv. management attitudes
v. management actions.
Reviewed 16 studies on
safety climate and found a
variation in the safety
climate dimension used.
2. (Flin, et al., 2000) i. management / supervision
ii. safety system
iii. risk
iv. work pressure
v. competence
vi. procedures / rules
6 common themes in safety
climate questionnaire were
identified.
3. (Guldenmund, 2010) i. management
ii. risk
iii safety arrangements
iv. procedures
v training
vi. work pressure

45
‘Table 2.2, continued’
No. Researcher Dimensions Comments
4. Nordic Safety Climate
Questionnaire
(NOSACQ-50,2010)
i management safety priority
commitment, and competence
ii. management safety
empowerment
iii .management safety justice
iv. worker`s safety commitment
v. worker`s safety priority and risk
non-acceptance
vi. safety communication, learning,
and trust in co-workers safety
competence
vii. worker`s trust in the efficacy of
safety systems
A team of Nordic OSH
researchers has developed a
NOSACQ-50 based on
organizational and safety
climate theory,
psychological theory,
previous empirical research
and results acquired
through international
studies.
5. (Flin, et al., 2000) i. management
ii. risk
iii .safety arrangements
Draw the conclusion that
there are approximately
three core themes.
Moreover, there are lists of safety culture and safety climate studies collected from year
1980 to 2010 in Appendix C. Using factor analysis (FA), author grouped and renamed
all the (16) sixteen identified variables which are affecting the safety programs and
safety climate into FOUR (4) groups namely (i) management commitment; (ii)
employees participation; (iii) training and education; and (iv) communication as in
Figure 2.2. This will be discussed later in Chapter 3.

46
Figure 2.2: The Proposed Safety Climate Factors
OSH Level of Awaren
ess
(Dependent
Variable)
Management
Commitment
Management support
Teamwork
Clear and Realistic Goals
Employees
Participation
Positive Group Norms
Personal Attitude
Personal Motivation
Continuing Participation of Employees
Training and
Education
Effective Enforcement Scheme
Appropriate Supervision
Appropriate Safety Education and Training
Safety Equipment Acquisition and Maintenance
Personal Competency
Program Evaluation
Communication
Delegation of Authority and Responsibility
Sufficient Resource Allocation
Good Communication

47
2.6 Selection Of OSH Culture Asseeement Tools
In this subsection, the selection of tools that can be used to measure the LoA of
organizational safety culture is discussed. First, the criteria for selection and search
strategies are discussed. Next, each tool with features and specific approaches are
described in detail. Finally, the common features of these devices are discussed and
practical advice on the selection of the most appropriate tools given and implementation
issues regarding the device. It should be noted a number of the proposal selection tools
to measure the LoA that will be discussed is not an absolute recommendation by
researcher. Selected tools should be considered merely with these considerations in
mind and had to comply with the following criteria:
The Tool should be available within the public domain, and preferably accessible
through the Internet.
The Tool should preferably be free of charge at the point of use (i.e. not commercial)
The Tool should be primarily aimed at OSH practitioners, and also as information to
business managers in organisations.
Therefore the tool should at least have some guidelines to facilitate the use of OSH
culture assessment in the organization. Prior to getting the appropriate approach to
measure safety climate, five tools have been selected, namely:
1) Score Your Safety Culture Checklist
2) Safety Climate Assessment Toolkit and User Guide (LSCAT)
3) Safety Health of Maintenance Engineering (SHoMe) Tool
4) Nordic Occupational Safety Climate Questionnaire (NOSACQ-50)
5) Railway Safety Standard Board-( RSSB Safety Culture Toolkit)

48
2.6.1 Score Your Safety Culture Checklist
The ‘Checklist for Assessing Institutional Resilience’, was developed by James Reason
and John Wreathall. It was first time presented at the 2000 Manley Conference in
Sydney, Australia, and published in the January-February 2001 edition of Flight Safety
Australia. Confusingly, this tool is also known as the ‘Score Your Safety Culture
Checklist’.
This instrument consists of 20 statements that describe various aspects of safety manner,
such as how organizational safety culture is considered by senior management. The
respondents were asked to read the statements given and evaluate each as either a ‘Yes’,
‘No’ or ‘Do not know’. Scoring is analyzed and generated single-digit scores that
summarize the state of organizational safety culture/institutional resilience. Rating
interpreted according to the following criteria:
16-20: So healthy as to be barely credible!
11-15: You’re in good shape, but don’t forget to be uneasy.
6-10 : No at all bad, but there is still a long way to go.
1-5 : The organisation is very vulnerable.
0 : Jurassic Park!
Compared with other safety culture assessment tools, Score Checklist for Your Safety
Culture is relatively uncomplicated in terms of its structure and scoring system. This
makes it very easy to use, especially for new and inexperienced users. However, there is
still a lack of it in the following areas:
a) A lack of benchmarking data and the potential for collecting it.
b) The complexity of the language used in the items.
In addition, this checklist should be modified if is to be used more effectively in other
industrial sectors.

49
2.6.2 Safety Climate Assessment Toolkit and User Guide (LSCAT)
The Loughborough Safety Climate Assessment Toolkit (LSCAT) is 'free at the point of
use' tools. It has been designed to enable organizations to measure safety culture
practiced by combining quantitative and qualitative methods. This kit uses the principle
of triangulation, comprising a combination of data obtained from the survey with
additional data sources as follows:
a) informal discussions within individual
b) focus groups
c) document analysis
d) inspection records and data bases
Respondents can exploit a variety of methods of data collection of safety climate
assessment through triangulation approach. The advantage of using a variety of methods
to assess the safety culture allows different aspects of safety culture to be evaluated
(see Table 2.3).
Table 2.3: Different perspectives on safety culture relating assessment
methods of LSCAT
Safety culture viewed as Assessment methods
Objective organisational attribute Observation, audit
Perceptions of the organisation Interviews, questionnaires, etc.
Individual perceptions Questionnaires, observation, etc.
Source :(Guldenmund, 2010)
50
The questionnaire consists of 47 items that evaluate the following organizational factors
such as organizational content, the social environment, individual appreciation, the
work environment, and the organization specific factors. Initially, the Toolkit has been
developed for use in the offshore oil and gas, but with some modifications it has been
used in other sectors e.g. in the health sector in the UK by the Royal College of
Nursing. A comprehensive guideline for users can be downloaded from the
Loughborough University website for free. This document is very comprehensive
covering all the basic information needed by the user, on how to evaluate the elements
contained in the questionnaire. Results of the evaluation are displayed by using ‘radar
plots', together with the relevant information that serves as a useful guideline to
understand the safety culture and issues that exist in the organization.
This document also outlines the procedure on how to set up and conduct interviews and
use behavioral indicators to support the collection and interpretation of data such as
direct observation of unsafe acts, and other documentation. However the use of this tool
can create problems for respondents with limited training or no training in qualitative
research methods. Given the relatively simple use of quantitative methods over
qualitative methods, the questionnaire is potentially the most useful component for
evaluating OSH. Potential users may be attracted to this Toolkit for benchmarking data
which are available from the University of Loughborough. However, given that the
Toolkit users will require at least a basic level of expertise and commitment,
compatibility Toolkits for use in very small (i.e. micro-organization less than five
employees) are questionable.
Web link: http://www.lboro.ac.uk/departments/sbe/downloads/pmdc/safety-
climate-assessment-toolkit.pdf.

51
2.6.3 Safety Health of Maintenance Engineering (SHoMe) Tool
Safety Health Maintenance Engineering Tools (SHoMe) was developed on behalf of the
UK Civil Aviation Authority by the Health and Safety Engineering Consultants
Limited. The purpose of this tool was to identify the indicators of 'health safety' in
aviation engineering maintenance organizations. This device is suitable for use either
for larger or smaller organizations. In this context, 'health safety' is understood as the
property of the organization, and is not related to the behavior of individual employee’s
health and safety. SHoMe tool designed in three sets of questionnaires, each set aims to
evaluate one of the working groups listed below. Set of questions which will be
conducted on different groups of workers as shown in Table 2.4.
Table 2.4: Overview of the three questionnaires of the SHoMe Tool
Worker group Generic
questionnaire
Job difficulty
questionnaire
Organisational
questionnaire
Technical certifying
staff
Version 1 Standard Standard
Technical non-
certifying staff
Version 2 Standard Standard
Management and
technical support staff
Version 3 Not applicable Not applicable
Source :(Guldenmund, 2010)

52
Each set of questions consisted of three parts, namely in the form of Generic, Job
Difficulties Questionnaire survey and Organization Questionnaire. Generic
questionnaires, which consists of 83 questions that require respondents to answer using
a five point Likert scale where 1 = Strongly disagree and 5 = Strongly agree.
The ‘Job Difficulties Questionnaire’ which consists of 32 statements that requires the
answer ‘Yes’ or ‘No’ to indicate if the task forms part of the respondents. If the answer
‘Yes’ is given, respondents are asked to rate the level of difficulty experienced from the
following three options: (1) ‘No problem’, (2) ‘Some problems’ or (3) ‘Major problem’.
The ‘Organizational Questionnaire’ which consisted of 92 statements pertaining to
various circumstances that might occur in the organization. These could include e.g.
‘Noisy working environments’ or ‘the general space in and around an aircraft’. The
respondents were asked to respond if any of these statements have caused them or a
colleague to make a mistake or cause them or colleagues’ confusion or uncertainty over
a job or otherwise affected airworthiness.
ShoMe uses a scoring system in the form of software that requires a lot of procedures
when using the tools. The results are shown in the format that was developed to help
senior managers to identify the most pressing concerns of the human factor. Decisions
involving 19 separate human factors "root issues" that have the potential to affect the
performance of safe and reliable maintenance, including the provision of resources,
training, fatigue, satisfaction, job stress, and others.
Documentation ‘Introduction to Device’ and ‘User Guide’ supplied with reference to
the user. This includes all levels of use of tools such as how to use the software, how to
handle the questionnaire, data entry, how to analyze the data and interpretation of
results. User Guide supplied helped in stating the obvious criteria to interpret the output.
However, these tools do not have benchmarking data.

53
This tool can be used by management as part of the audit process ‘health safety’, or as a
pro-active step in assessing ‘health safety’. The main purpose of this tool is to identify
and highlight safety issues within the organization that may potentially cause problems,
may occur beyond the control or knowledge of senior management.
However, a key limitation of SHoMe is that it is designed for use in aviation
maintenance industry. However, it could be changed to make this tool relevant to other
industries/other sectors. It is assumed that the consent of the developer will be required
to do this.
Weblink: http://www.caa.co.uk/application.aspx?catid=33&pagetype=65&appid
=11&mode= detail&id=1129
2.6.4 Nordic Occupational Safety Climate Questionnaire (NOSACQ)
The Nordic Occupational Safety Climate Questionnaire (NOSACQ-50) was developed
by a team of occupational safety researchers from respectively Scandinavian countries
including Denmark (NRCWE), Finland (FIOH), Iceland (Administration of
Occupational Safety and Health Administration), Norway (University of Stavanger) and
Sweden (University of Gothenburg). The tool is based on the theory of organizational
climate and safety, psychological theory, previous empirical research, and empirical
results obtained through international research and continuous development process.
NOSACQ-50 has been pilot tested in a variety of industries in all the Nordic countries,
and the results confirm the reliability and validity of the questionnaire. It is available in
many languages including: Chinese (simplified), Czech, Dutch (Belgium and
Netherlands), Danish, English, Finnish, French (Belgium), Germany, Hungary, Iceland,
Italy, Norwegian, Persian, Polish, Russian, Slovene, Spain and Sweden, versions and
other languages versions are being prepared. This makes it easy applied in companies
that have a multilingual workforce and/or multinational. The results using this tool from

54
all over the world are collected in an international database to enable benchmarking
made for the purpose of further development of this tool. Questionnaires have been used
in some of the high risk of injury, such as construction, manufacturing, healthcare,
transportation, etc. Safety climate is defined as the shared perceptions of work group
manager and group safety policy related work, procedures and practices. In other words,
the safety climate reflects employees' perception about the true value of safety in an
organization.
The tool consists of 50 items across seven dimensions, i.e. shared perceptions of:
a) management safety priority, commitment, and competence
b) management safety empowerment
c) management safety justice
d) workers’ safety priority and risk non-acceptance
e) workers’ safety commitment
f) workers’ trust in the efficacy of safety systems
g) safety communication, learning, and trust in co-workers' safety competence

55
An example of a resulting NOSACQ-50 diagram is shown in Figure 2.3.
Figure 2.3: Example of a NOSACQ diagram.
NOSACQ-50 in full version can be used or tailored to obtain research tools that meet
the research situation. This is important to obtain the results desired. Use of this tool is
free of charge for the purposes of exchange of the information (data and experience),
and it cannot be used commercially.
Weblink: http://www.arbejdsmiljoforskning.dk/Spørgeskemaer/NOSACQ-
50.aspx?lang=en

56
2.6.5 The Railway Safety Standard Board-(RSSB Safety Culture Toolkit).
This toolkit has been designed for the rail industry but will also be of relevance to non-
rail companies. It provides public access to background information on safety culture,
guidance on conducting analyses and development. The RSSB safety culture assessment
survey was first developed in 1997 for the Railway Safety and Standards Board and had
been used by many rail companies. It comprised a standard questionnaire that was
analysed by RSSB and they produced a report for the assessed company. This provided
a comprehensive safety culture, self-assessment package which included the following
features:
a) Useful background information on safety culture;
b) On-line and/or paper-based safety culture self-assessment using a standardised
questionnaire;
c) Automated analysis of results and production of graphical outputs;
d) Access to assessment-specific improvement solutions;
e) Industry benchmarking;
f) Links to solutions and good practice
This site is designed for safety managers and supervisors involved in planning and
implementing safety policy and safety management systems. It is relevant to all
companies (rail and non-rail) regardless of their current level of safety culture: there is
always room for improvement and the site will offer advice and good practice guidance
specific to their current level of safety culture development.

57
2.6.5.1 The Assessmet ToolKit
There are many differing models of safety culture, however they all tend to focus on
very similar areas. The RSSB safety culture assessment approach reflects consideration
of these and is based around the following 4 key elements (of a ‘positive’ safety
culture), 11 ‘factors’ and associated 'sub-factors' as shown in Table 2.5
Table 2.5: Key Element, Factor and Sub Factor In RSSB Toolkit
Source: http://rssb.info-exchange.com/?=130071
The main assessment tool is the survey that includes 54 questions to assess employee
attitudes, values and perceptions towards safety and safety management systems across
the 11 safety culture ‘factors’. The survey can be tailored to an individual company by
defining the job roles, departments and locations to be included in the survey.

58
The survey is distributed and completed, either via hard copy or directly on-line. The
software then allows a range of analyses to be conducted that automatically generates
results-specific guidance.
The specific guidance is generated automatically by the toolkit from analysis of the
survey responses. This provides:
An overall assessment of the organisation’s safety culture level
Identification of the overall priority ‘enablers’ for safety culture improvement
Identification of detailed areas to address and potential “quick wins”
Identification of issues that require further investigation
Links to improvement examples
The main overview is obtained by:
Selecting the default options in the ‘Standard reports’ Function menu to run an
overall assessment report for the whole company. This will provide an
indication of the overall/company average safety culture development level and
relative strengths and weaknesses across all factors/questions, roles, locations
and departments
Comparing up to 6 roles, departments or locations to identify relative strengths
and weaknesses across all factors
Generate an industry benchmarking report to compare anonymous company
results against companies in the same sector

59
2.7 Proposed Measuring Safety Culture/Climate Toolkit
Since there are contextual differences between and within the organization, then the
approach to adopt the standard, ‘one size fits all’ strategy cannot be practiced. Measure
and diagnose the safety culture of an organization cannot just ‘take from the shelf
devices’. It needs to have a tailored approach taking into account the local context.
Therefore, merging several methods and tools to measure safety climate is highly
recommended during the assessment process. This approach is recommended to ensure
that the safety culture assessment process would produce the best results as expected
and can help organizations create a work environment that is safe and conducive.
Most of the tools are ‘free at the point of use’ to help organizations in the assessment
process of safety culture/climate. There are advantages and disadvantages in the five
methods discussed. Based on the advantages and disadvantages that are shown in
Table 2.6, the author decided to select the tool from Loughborough Safety Culture
Assessment Toolkit( LSCAT) issued by Health and Safety Executive (HSE), United
Kingdom. It is the collaboration between the Offshore Safety Division of the HSE,
Chevron UK and the Railway Safety Standard Board (RSSB Safety Culture Toolkit)
which led to the creation of a set of tools that will be used in the study.
Both of these methods were chosen because it was easy to use and the questions were
short but clear. These types of questions are related to the current study and have been
widely used in previous studies and the results confirm their reliability and validity of
the questionnaire. Several reasons have been mentioned in previous subsections. Almost
all the research questions used in this research were research independent and dependent
variables. Types of questions chosen were according to the suitability to the study and
local conditions.

60
Table 2.6 Characteristics of the Safety Culture/Climate Toolkits
Tools Advantages Disadvantages
Score Your Safety culture
Checklist (developed by James
Reason and John Wreathall,2000
in Australia)
-Structure and Scoring system Is
uncomplicated.
-Easy to use for beginners and
inexperienced user.
-Lacking of benchmarking data
-complexity of languages used
-need to be modify to be used
more effective in other industrial
Loughborough Safety Culture
Assessment Toolkit( LSCAT)
( developed by Loughborough
University)
-it was developed initially for use
in oil and gas.
-benchmarking data available
from Loughborough University
--need to be modify to be used
more effective in other industrial
-need some knowledge to use it.
Safety Health of Maintenance
Engineering (SHoMe) Tool
( was developed by UK Civil
Aviation Authority)
-initially was developed to
identify indicators of `safety
health` in aviation engineering
maintenance organization.
- need to be modify to be used
more effective in other industrial
Railway Safety Standard Board
(RSSB Safety Culture Toolkit)
( developed by Railway Safety
and Standard Board )
-This toolkit has been designed
for the rail industry but will also
be of relevance to non-rail
companies.
- It provides public access to
background information on
safety culture, guidance on
conducting analyses and
development.
- provided a comprehensive
safety culture self-assessment
package.
- provided a comprehensive
safety culture self-assessment
package, need to be modify to
be used more effective in other
industrial
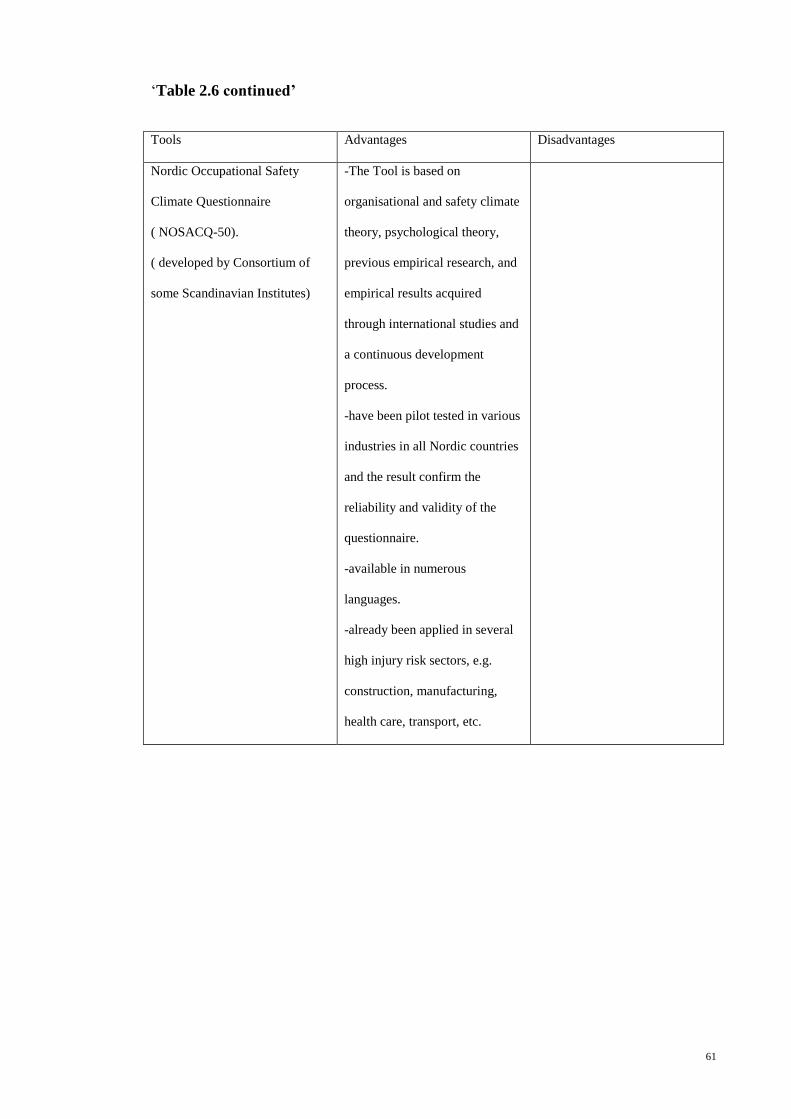
61
‘Table 2.6 continued’
Tools Advantages Disadvantages
Nordic Occupational Safety
Climate Questionnaire
( NOSACQ-50).
( developed by Consortium of
some Scandinavian Institutes)
-The Tool is based on
organisational and safety climate
theory, psychological theory,
previous empirical research, and
empirical results acquired
through international studies and
a continuous development
process.
-have been pilot tested in various
industries in all Nordic countries
and the result confirm the
reliability and validity of the
questionnaire.
-available in numerous
languages.
-already been applied in several
high injury risk sectors, e.g.
construction, manufacturing,
health care, transport, etc.

62
In preparing the assessment tool, several factors were involved such as independent and
dependent factors. Accordingly, the explanation about these factors will be discussed in
the subsection below.
2.8 Dependent Factor
Dependent variable is the result or effect in the relationship between the variables
(Chua, 2006). Level of Awareness is the dependent factor in this study, and explanation
about it will be found in the next subsection.
2.8.1 Level of Awareness (LoA) of OSH
It is important to measure LoA and improve the health and safety of a company
(HSE, 2001). A positive and high compliance on safety aspects is important in carrying
out the work. This is for ensuring worker safety. Several studies Brown et al. (2000);
Department of Employment and Workplace Relations Office of Australian Safety and
Compensation (2005); Hofman (1996); Seo (2005); Thomas (1999), focused on
discovering mechanisms between particular organizational factors and individual safety
awareness.
In UK and Australia, there has been a move away from measuring safety using
retrospective data such as lost time incidents. ‘There is currently a move towards
predictive assessments of the safety climate of the organization or worksite’ (Australia,
1994; Department of Employment and Workplace Relations Office of Australian Safety
and Compensation, 2005; Lingard, 2011; Wales, 2001).

63
A number of methods have been developed to measure awareness. One method is to use
five common factors which are: 1) perceptions of management’s commitment to safety;
2) perceptions of safety management systems; and 3) perceptions of risk; 4) work
pressure and 5) competence as propose by (Flin, et al., 2000).
‘Management commitment to safety would lead to active promotion of safety activities
(Zhang, et al., 2002) and more supervision’ (Zohar, 2000).
Management has a key influence on the organization safety culture. A review revealed
that workers’ perceptions of management attitude and behavior towards safety are
useful measures of an organization’s safety climate. Production planning and discipline
are also important.
“More devotion to safety training would increase workers’ competence. More
supervisors’ involvement would enhance employees’ awareness and behavior” (Simard,
1994).
The main issue is clearly that the safety culture approach is to identify and clarify the
relationship between the organization’s safety culture and safety awareness (i.e. how the
features of organizational safety culture affects safety). The accident records (self-
reported accident statistics, observed incidents/near miss), compliance with safety
regulations and employee behavior could be an indication of an organization’s safety
awareness.
‘The underlying reasoning is that by enforcing and enhancing an organization’s safety
culture-assuming that this is feasible – workers’ behavior compliance and participation
(i.e. their willingness and motivation to contribute to safety beyond the minimum
requirements) would be influenced positively, eventually leading to higher level of
safety in organization”(Guldenmund, 2010).

64
Based among others on the meta-analysis review, there is growing evidence that the
safety climate (i.e. shared perceptions of workers, as measured by the survey) is a
predictor of safety awareness, and it is found across industries and countries (Christian
et al., 2009; Clarke, 2006; Kuenzi, 2009; Nahrgang et al., 2006).
A recent study by Smith (2009), found that studies conducted not only shows the
relationship between safety climate and safety awareness while working alone but more
focused on a more consistent and independent integration between employees at all
times.
Based on the results of previous studies it is shown that safety climate can be used as
predictors of safety awareness, and it can form the basis of the more pro-active
preventive actions before a work-related accident really happened (Antonsen, 2009;
Flin, et al., 2000).
2.9 Independent Factors
Independent variables are the causes or factors that existed before the change in the
dependent variable (Chua, 2006). Based on the literature review made and through
validation, researcher had identified 16 potential variables that affect the safety
awareness to make the survey questions. Furthermore, based on factor analysis test, the
16 variables were grouped into fours dimensions: management commitment,
employee’s participation, training and education and communication in which will be
discussed in next subsection.

65
2.9.1 Management Commitment
There are three factors in this group: management support, teamwork, clear and realistic
goals. Details in Table 2.7.
Table 2.7: Management Commitment Factors
Factors Description References
Management Support It is evident that management
plays a very important role in an
efficient and effective safety
program. Management must fully
and actively translate ideas into
safety actions, including issuing a
written comprehensive safety
policy, allocating sufficient
resources, promptly reacting to
safety suggestions and
complaints, attending regular
safety meetings and training,
regularly visiting the workplace
following the same safety rules
as others, etc.
Pierce(1995b), Blake(1997),
Stranks (2000), Rowlinson
(2003), Rechenthin (2004),
Abudayyeh et al.(2006), Herrero
et al.(2006), Aksorn and
Hadikusumo ( 2008)
Teamwork A safety program succeeds when
all concerned parties from top to
bottom hierarchical levels realize
that preventing accidents is
everyone`s responsibility.
McGowan and
Norton(1989),Krause (1997),
Ulloa and Adams (2004)
Adapted from Aksorn (2008)
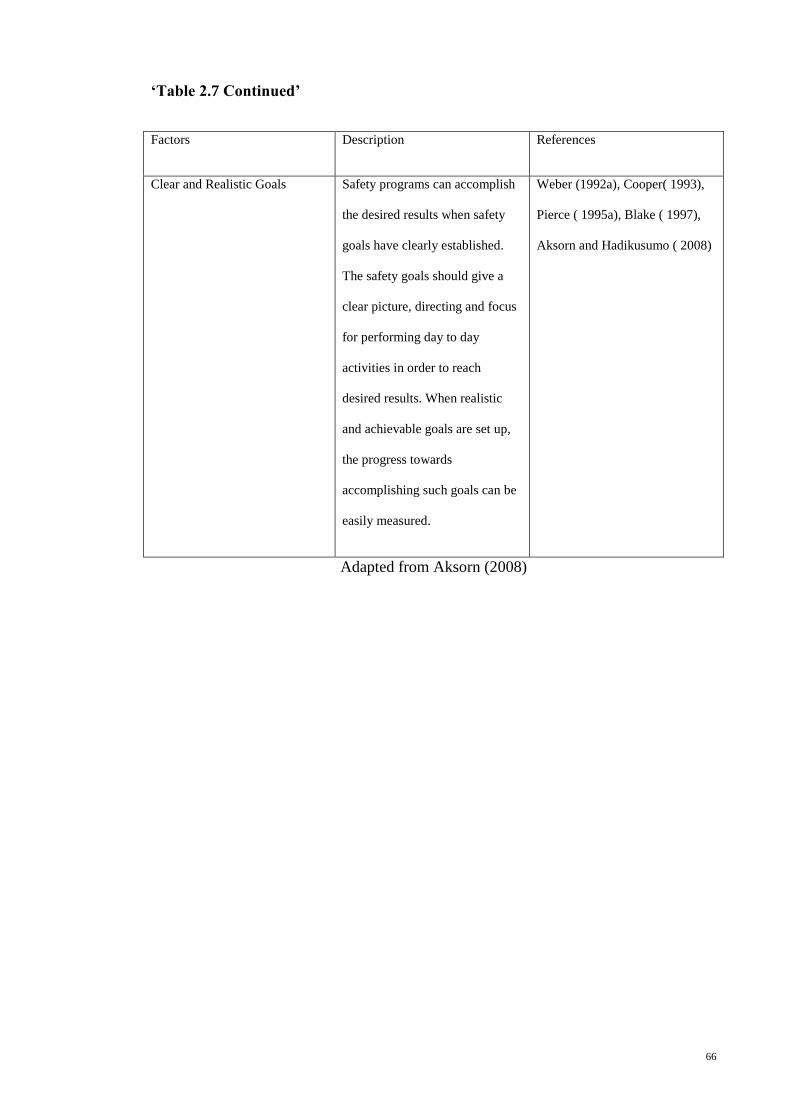
66
‘Table 2.7 Continued’
Factors Description References
Clear and Realistic Goals Safety programs can accomplish
the desired results when safety
goals have clearly established.
The safety goals should give a
clear picture, directing and focus
for performing day to day
activities in order to reach
desired results. When realistic
and achievable goals are set up,
the progress towards
accomplishing such goals can be
easily measured.
Weber (1992a), Cooper( 1993),
Pierce ( 1995a), Blake ( 1997),
Aksorn and Hadikusumo ( 2008)
Adapted from Aksorn (2008)

67
2.9.2 Employees participation
There are four factors in this group: positive group, personal attitude, personal
motivation and continuing participation of employees as shown in Table 2.8.
Table 2.8: Employees’ Participation Factors
Factors Description References
Positive group norms Group norms are the accepted
attitudes about various things
amongst a group of people. In
practice, members of a group
conform to certain attitudes
simply to avoid sanctions. If
positive attitudes towards safety
can be built and embedded within
group, safety can then be
managed successfully.
Petersen (1984), Sarkus
(1977), Stranks (2000),
Johnson (2003)
Personal attitude Attitude is a tendency to respond
positively and/or negatively to
certain persons, objects or
situations and is normally built
up through experience.
Individuals, however, differ in
their perception of risks and
willingness to take risks.
Successful safety programs can
be achieved if the positive
attitudes of employees toward
safety are reinforced.
Levitt and Samelson (1993),
Stranks ( 1994), Tam et
al.(2001), Johnson ( 2003),
Schultz ( 2004), Fang et al.
(2006).

68
‘Table 2.8 Continued’
Factors Description References
Personal motivation Although workers have adequate
knowledge and skills to
accomplish their jobs safely they
will not however, work in such
manner unless they are motivated
to do so. To ensure commendable
safety records, all personnel in
the workplace must be motivated
to carry out their job
responsibilities safely, by the
possibilities of achievement and
recognition, opportunity for
additional responsibilities,
rewards, and personal growth.
Petersen (1984), Levitt and
Samelson ( 1993), Stranks
( 1994), Neal and Griffin
( 2002), Johnson (2003)
Continuing participation of
employees
-Successfully safety programs
largely depend on employee
involvement as workers tend to
support the activities that they
themselves help to create.
-Workers should be given
opportunities to provide input
into the design and
implementation of safety
programs such as being a
member of the safety committee,
reporting hazards and unsafe
practices to supervisors and
identifying training needs,
investigating an accidents , etc.
Peyton and Rubio (1991),
Harper and Koehn (1998),
Ariss (2003), Smith ( 2003),
Abudayyeh et al.(2006).
Adapted from Aksorn (2008)
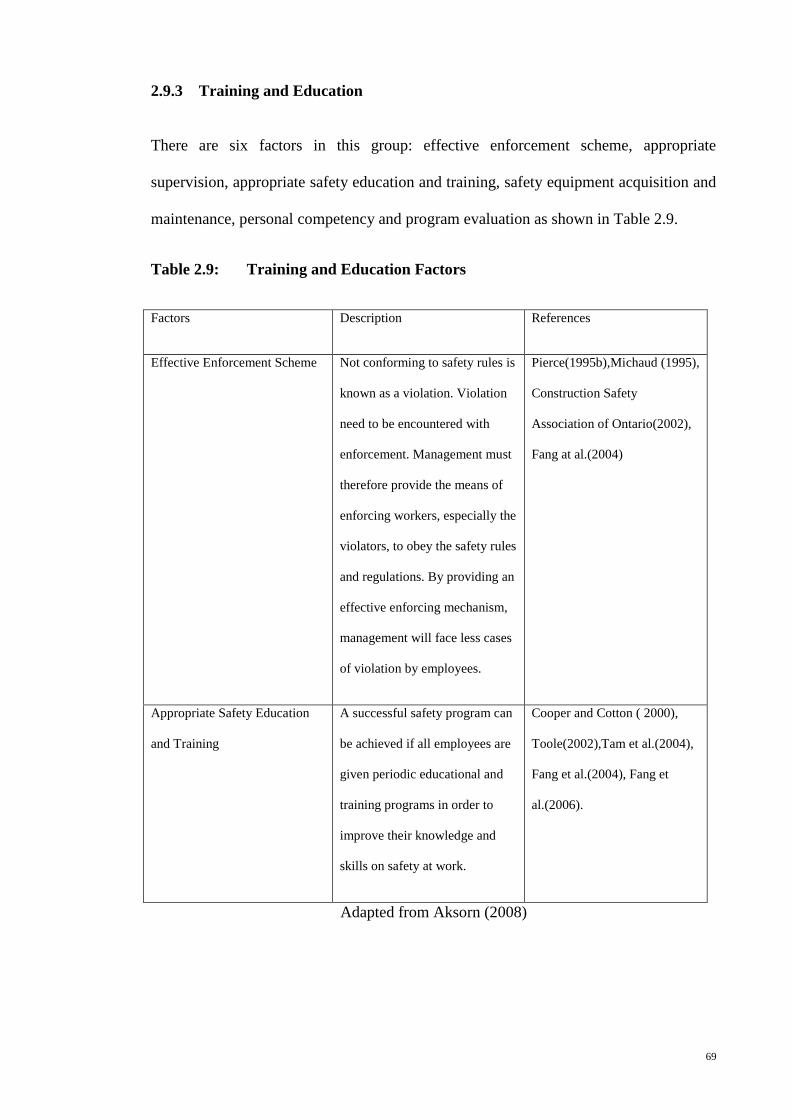
69
2.9.3 Training and Education
There are six factors in this group: effective enforcement scheme, appropriate
supervision, appropriate safety education and training, safety equipment acquisition and
maintenance, personal competency and program evaluation as shown in Table 2.9.
Table 2.9: Training and Education Factors
Factors Description References
Effective Enforcement Scheme Not conforming to safety rules is
known as a violation. Violation
need to be encountered with
enforcement. Management must
therefore provide the means of
enforcing workers, especially the
violators, to obey the safety rules
and regulations. By providing an
effective enforcing mechanism,
management will face less cases
of violation by employees.
Pierce(1995b),Michaud (1995),
Construction Safety
Association of Ontario(2002),
Fang at al.(2004)
Appropriate Safety Education
and Training
A successful safety program can
be achieved if all employees are
given periodic educational and
training programs in order to
improve their knowledge and
skills on safety at work.
Cooper and Cotton ( 2000),
Toole(2002),Tam et al.(2004),
Fang et al.(2004), Fang et
al.(2006).
Adapted from Aksorn (2008)

70
‘Table 2.9 Continued’
Factors Description References
Safety equipment acquisition
and Maintenance
The workplace must be carefully
assessed to determine possible
hazards on order for proper
selection of safety equipment.
An effective safety program
results in fewer injuries due to
proper safety equipment
acquisition and maintenance.
Managing a safety equipment
program takes up not only a
large percentage of time for
purchasing the correct
equipment, maintaining them
good condition, and inventory
control, but it also requires a
good cooperation amongst the
safety manager/head purchasing,
production, warehouse
supervisor, maintenance
manager, etc.
Toole (2002), Tam et al.(2004)
Personal Competency A successful safety program also
results from placing the right
person on the right job. The right
person is defined as the
person(s) who are physically and
mentally capable for carrying out
the assigned tasks with the right
knowledge, experience and
skills.
Top (1991), Mohamed (2002),
Tam et al.(2004), Fang et al.
( 2006).
Adapted from Aksorn (2008)
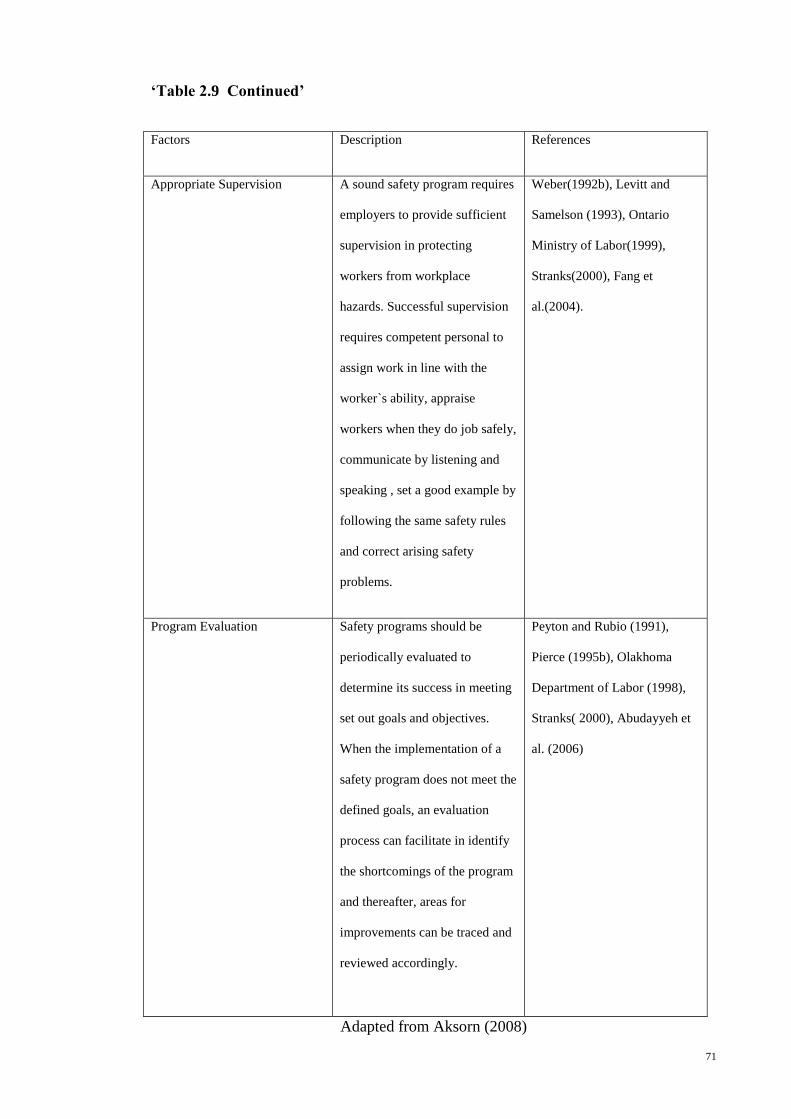
71
‘Table 2.9 Continued’
Factors Description References
Appropriate Supervision A sound safety program requires
employers to provide sufficient
supervision in protecting
workers from workplace
hazards. Successful supervision
requires competent personal to
assign work in line with the
worker`s ability, appraise
workers when they do job safely,
communicate by listening and
speaking , set a good example by
following the same safety rules
and correct arising safety
problems.
Weber(1992b), Levitt and
Samelson (1993), Ontario
Ministry of Labor(1999),
Stranks(2000), Fang et
al.(2004).
Program Evaluation Safety programs should be
periodically evaluated to
determine its success in meeting
set out goals and objectives.
When the implementation of a
safety program does not meet the
defined goals, an evaluation
process can facilitate in identify
the shortcomings of the program
and thereafter, areas for
improvements can be traced and
reviewed accordingly.
Peyton and Rubio (1991),
Pierce (1995b), Olakhoma
Department of Labor (1998),
Stranks( 2000), Abudayyeh et
al. (2006)
Adapted from Aksorn (2008)

72
2.9.4 Communication
There are three factors in this group: delegation of authority and responsibility and good
communication as shown in Table 2.10.
Table 2.10: Communication Factors
Factors Description References
Delegation of Authority and
Responsibility
Any one individual cannot make
a safety program successful.
Therefore, responsibilities to
safely accomplish activities must
be transferred to individuals at
lower levels of authorities.
Effective delegation involves
granting adequate authorities and
assigning clear responsibilities to
perform specific tasks with
enough resources such as
appropriate completion time,
money and cooperation of all
involved parties.
Anton (1989), Oklahoma
Department of Labor (1998),
Rue and Byars ( 2001),
Abudayyeh et al.(2006)
Adapted from Aksorn (2008)

73
‘Table 2.10 Continued’
Factors Description References
Sufficient Resource Allocation The goals of safety programs
cannot be accomplished without
adequate resources. An effective
safety program results from the
commitment of the top
management to providing an
appropriate level of resources.
Management must consider and
allocate sufficient resources to
carry out day to day activities to
accomplish both short- term and
long-term goals. The resources
required for effective safety
program may include sufficient
staff, time, money, information,
methods used in safety works,
facilities, machine, etc.
Erikson (1997), Olakhoma
Department of Labor (1998),
Rollenhagen and Kahibom
(2001), Rechenthin
(2004),Abudayyeh et al.
(2006).
Good Communication When the lines or
communications between
management and workforce are
open, workers can bring reports
of unsafe working practices and
hazardous environments to
management`s attention.
Management in turn can
communicate their concerns and
priorities of safety to gain
employee’s compliance and
awareness.
Peyton and Rubio ( 1991),
Stranks (1994 ),
Vredenburgh ( 2002), Fang et
al.(2004), Abudayyeh et
al.(2006).
Adapted from Aksorn (2008)

74
2.10 Concluding Remarks
In this chapter discussed the importance of measuring the LoA of implementation
occupational safety and health program in an organization, approach to measuring
awareness, the factors involved, the definition and the selection of appropriate
measurement methods. The next chapter will discuss the methodology used in this
study.

75
CHAPTER 3: RESEARCH METHODOLOGY
This chapter describes the methodology used in this study. This is an important part of
the research as it will eventually determine the reliability of the analysis and the
findings. It describes all the approaches used in this study. Based on literature review, a
theoretical model is then developed. The proposed theoretical model can be used by
practitioners and stakeholders in the selection of the factors for LoA of OSH
management system. For data collection, this research carried out pilot study and field
survey using self-explanatory questionnaires. Data were then analyzed based on the
multivariate analysis.
The study emphasizes on respondents` knowledge and perception based on their vast
experience in supervising projects in their daily work activities at construction sites. It is
postulated that a set of significant safety factors will emerge from the study and as such,
the lesson learnt by the respondents on what are the inter-related key areas that are of
critical importance are captured in this study. This study then, correlates the safety
factors relevant to the Malaysian construction industry.
The research methodology is based on the Flow Chart shown in Figure 3.1.
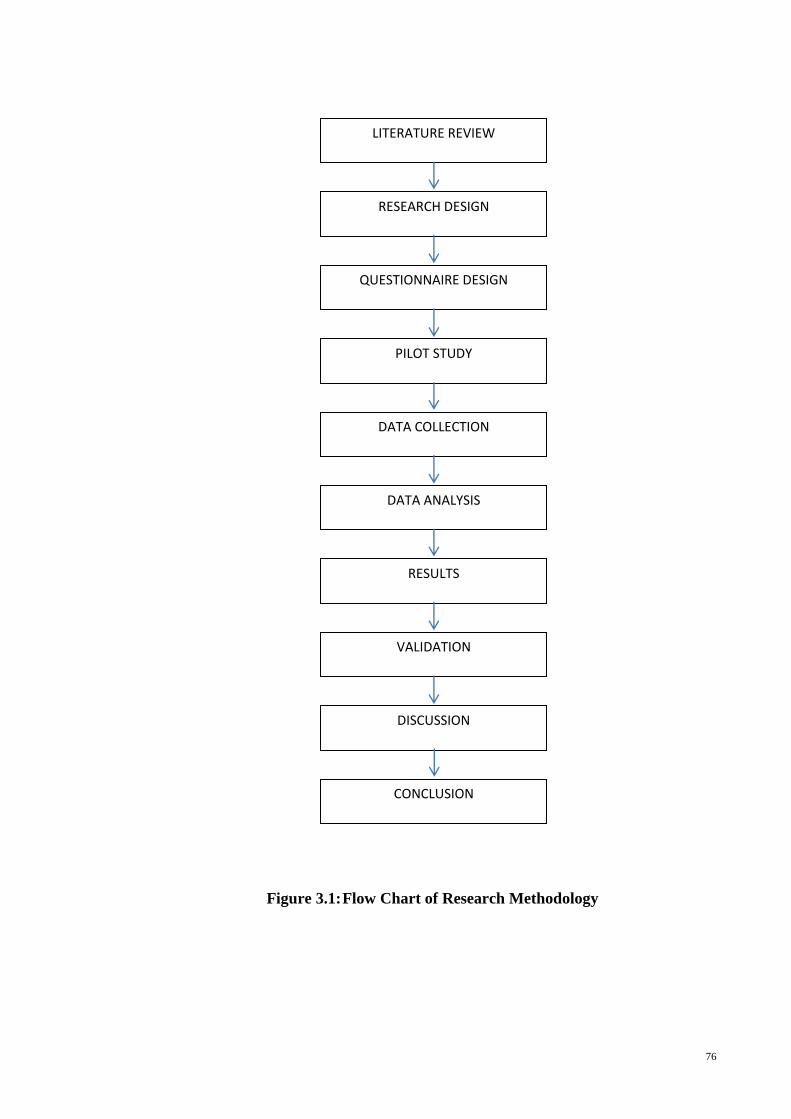
76
Figure 3.1: Flow Chart of Research Methodology
LITERATURE REVIEW
RESEARCH DESIGN
QUESTIONNAIRE DESIGN
PILOT STUDY
DATA COLLECTION
DATA ANALYSIS
RESULTS
VALIDATION
DISCUSSION
CONCLUSION

77
3.1 Research Design
This study was set to examine all the objectives stated in Section 1.2, among
supervisory workers in DID Malaysia. Factors of the organization’s safety climate was
determined as management commitment, training and education, communication, and
employees’ participation whereas the factors of LoA was identified with policy of the
organization, safety orientation among employees, risk assessment done within the
organization and also review of all the factors stated before.
The research started with the gathering of information through literature review, in
which factors that might affect the safety and health standards of construction industry
in general were identified. A pilot study questionnaire was then prepared based on this
preliminary list of factors. The draft questionnaire was first sent to various levels of
supervisory employees in Department of Irrigation and Drainage Malaysia for review
and comment. Feedback sessions were then conducted with these participants to refine
the questionnaire. The amended version was then distributed to the target group in the
department for filling out. The sampling technique for each respondent group is largely
random. Quantitative techniques were subsequently employed to analyze the feedback
before the research findings were organized and concluded in a more meaningful
manner.
The study was inclined towards the management of safety and health issues, rather than
the scientific and technologies facets. Literature related to this research topic was
identified for a more in-depth review. The following subsections provided insights into
the appropriate research methodology, design of the questionnaire and analytical
techniques. However, the methodology and findings of this research should be
referenced with caution, since they were designed to suit localities and conditions of the
countries where the research were conducted. The industrial context of Malaysian
construction must be duly considered.

78
The entire samples were selected using simple random sampling techniques and they
responded to the questionnaires with guidance from researcher to ensure that they
understood the meaning of the questions. They were seated in one room to answer the
questionnaires. Every respondent was free to ask questions if they were in doubt or
unable to comprehend the questions.
3.2 Research Respondents
Employees of Department of Irrigation and Drainage Malaysia (DID) have been
selected for this study. Those included as samples were between ages of 24 to 57 years
and with mean supervisory work experiences of 14.1 years with respect to department
construction projects. They consist of various levels of position, who conducting
supervision work at the construction site and had a background of education levels that
range from SPM (C-Level) to bachelor's degree. The department was selected as a study
case because it is one of the largest government departments in Malaysia and had been
in operation since 1932. The department is also involved with construction work
involving the use of human resources as implementers who are exposed to a variety of
hazards that can cause accidents that cause serious injuries also lost their lives, which
requires systematic safety management. DID provides professional and quality services
in the planning, design, implementation and management of all irrigation, drainage,
river engineering, coastal engineering and hydrology and water resources programs and
projects . The service provided was based on best engineering practices with regard to
environmental sustainability, economic and social. Moreover, this study was highly
recommended by Human Capital Development Division, DID Malaysia (see Appendix
D). Table 3.1 shows the breakdown of respondents who participated in this study.

79
Table 3.1: Breakdown of respondents representing different positions
Number of Respondents / Percentages
DEP1 ( % ) DEP2 ( % )
Technician(J17-J26)
38 ( 45.8 ) 49 ( 60.5 )
Assistant Engineer
( J29-J38 )
11 ( 13.3 ) 17 ( 21 )
Engineer ( J41-J52 )
33 ( 39.8 ) 15 ( 18.5 )
Manager ( J54-
above)
1 ( 1.2 ) 0 ( 0 )
TOTAL
83 ( 100 ) 81 ( 100 )
3.3 Research Instrument
Data for this study consisted of primary data (obtained from questionnaires) and
secondary data obtained from sources like journals, books, publication and the internet.
The questionnaire used was designed to be self-explanatory to ensure that respondents
can complete the questionnaire by themselves. However, the researcher believes that the
best way to get a hundred percent response from the entire selected respondents was
through personally assisting them on the questionnaires by inviting all of them for a
face-to-face meeting. By doing so, the researcher was able to assist, monitor and resolve
any questions that might arise. Naoum (1998), claims that this is the best method of data
collection as it not only ensures a high response rate but also an accuracy of results.

80
A token of appreciation was given to each participant before he was asked to fill up the
questionnaires. It might help to increase the return rate of the survey as participants may
feel that the researcher valued the time they spent completing the survey (Dillman,
2000). It was a specially designed ball-pen that looks attractive and most of the
participants used it to fill up the questionnaires.
The questionnaires were divided into three sections, Section 1: requires respondents to
fill in their personnel particulars; Section 2: focusses on the factors of the safety climate
as practiced in the offices. The intention of Section 3 is to gather information on the
factors of LoA of OSH management in the department. All respondents were expected
to complete the questionnaire within 30 minutes. However, with personal guidance from
the researcher, most of them were able to complete it within 20 minutes.
3.4 Questionnaire Design
The type of population, the nature of the research questions and availability of resources
will determine the type of questionnaire to be used to conduct the survey.
Having taken cognizance of both merits and demerits of using various questionnaires, it
was decided that combination of self-administered questionnaire with the guidance from
researcher would be the most appropriate survey instrument to be used in this
exploratory study. According to Glendon, et al. (2006), employed quantitative methods
with self-administered survey is the most favourable among researchers because it is
convenient, practical and cost effectiveness. Considering the contextual differences
between and within organisations, it is not feasible to adopt a standard, ‘one size fits all’
strategy. Addressing and diagnosing an organisation’s safety culture comprises thus
more than just simply ‘taking a tool from the shelf’. It implies a tailored approach,
taking into account the local context (Bergh, 2011).

81
In addition, when investigating the feasibility of developing a standard tool for the
current study, it is recommended, therefore, to combine several methods and tools
during the assessment process. Based on the advantages and disadvantages that were
shown in Table 2.8, thereby the Loughborough Safety Culture Assessment Toolkit
(LSCAT) and Railway Safety Standard Board (RSSB) Safety Culture Toolkit appeared
to be the most suitable for this purpose. Some changes were made through discussion
among senior management of the department to suit the situation of the study.
Moreover, both Toolkits had been pilot tested and widely used in a variety of industries
by many companies all over the world. They had been analysed by appropriate boards;
and they provided comprehensive guidelines and reports for users covering all the basic
information needed. In other words, they were fully established and questions taken
from the two toolkits, can be considered to be valid and reliable.
Peterson (2000), states that as the questionnaire is the ‘heart and soul’ of a research, it
must be constructed effectively to ensure the respondents decode the research questions
as intended by the researcher and the answers are encoded to provide the relevant
information. As such, in drafting the questionnaires, several points are considered to
ensure reliability, accuracy and unbiased responses. The questionnaires are simple, brief
and specific (Peterson, 2000), relevant, accurate and not leading, loaded, ambiguous, or
double-barrel questions (Zigmund, 2000), uplifting and not boring so as to motivate
respondents to become involved and involves ‘selling’ as to why it is important to
participate in the survey to encourage cooperation (Ticker, 2001).

82
A total of 56 questions were used in research independent and dependent variables. It is
simple and bilingual (see Appendix E and Appendix F) to help the respondents to
answer questions correctly. The diagnosis of an organisation’s safety culture requires a
close collaboration between the organisation’s internal resource and outside expertise.
So one important consideration is the actions that can be taken internally, and the
extent to which external consultancy and support is needed. Expert guidance can add
significant value - not only for steering and supporting the assessment phase, but also
for interpreting the different assessment outcomes and advising which actions could be
useful to achieve improvements and change in OSH management (Naoum, 2003).
Therefore, experts from the Department Of Occupational Safety and Health (DOSH),
En Sharul Nizam Shaharudin ( Appendix G), Madam Ho Chong Peng from INTAN (see
Appendix H) were also involved to confirm that the questionnaire is constructed
effectively. It was also reviewed by DID top management and by the university
lecturers.
The questionnaire that was developed comprises of three parts: Respondents Personal
Profile, Safety Climate, Safety and Health Awareness as practiced in the department.
Respondent Personal Profile section was designed at section one followed by the second
section of the questionnaire which covered four variables to gather information on
management commitment, workers participation, training and education; and
communication towards safety and health.

83
The final section of the questionnaire was developed to gauge namely factors pertaining
to employees’ personal orientation, company’s policy, risk assessment and review. The
respondents were requested to rate each of the 56 questions on a five-point Likert scale.
It ranges from 1 (strongly disagree) to 5 (strongly agree). Data collected through Likert
scale are highly reliable compared with other scales such as Thurstone and Guttman
(Likert, 1932).
The summary of the variables and type of measurement used are shown in Table 3.2.
Table 3.2 : Questionnaire variables and types of measurement.
Variables Question numbers Measurement
Management commitment 9 Rating of 1 for ‘strongly
disagree’
Rating of 2 for ‘disagree’
Rating of 3 for ‘moderate’
Rating of 4 for ‘agree’
Rating of 5 for ‘strongly
agree’
Employees participation 11
Training and education 8
Communication 11
OSH orientation 3
Policy 3
Monitoring 4
Risk assessment 5
Review 2

84
3.4.1 Respondent Personal Profile (Section 1)
The first part consists of questions about personal detail to get the information about
their level of position starting from Manager (J54 –above), Engineer (J41-J52),
Assistant Engineer (J29-J38) and Technician (J17-J26). In this study the code ‘J’ is
used to show engineering services in the Malaysian government civil service. The
second part consists of questions to determine their level of education either they
finish their study at SPM and below, Technical Certificate, Diploma or Degree and
above. SPM is equivalent to medium secondary level. Other answers from respondents
were their current age and participant’s working experiences. Table 3.3 shows the
details.
Table 3.3: Personal Profile Questions.
1 Position [a] Manager
[b] Engineer
[c] Assistant Engineer
[d] Technician
2 Education
Level
[a] SPM- below ( C-Level)
[b] Technical Certificate
[c] Diploma
[d] Degree
[e] Master and above
3
4.
Age ________ years old.
Working Experiences ________ years.
.

85
3.4.2 Safety Climate factors (Section 2)
The questions in this section of the questionnaire were designed to measure the level of
organization safety climate. It started with questions about management commitment,
which comprise of nine questions starting from Q1 to Q9. Q10 to Q20 gather
information about workers participation towards safety and health in the organization.
Q21 until Q28 gather information on training and education and its relation to safety
and health among employees. The final part of this section consisted of Q29 until Q39,
which were designed to study the communication of safety and health in the
organization.
3.4.2.1 .Management commitment
Nine questions were used to study the management commitment towards the
implementation of Safety and Health. The answers gathered will show the level of
current management with regard to the safety and health of their employees. According
to Mowday (1979), he defines organizational commitment as the relative strength of and
individual identification with and involvement in a particular organization. The
relationship factor to this definition was identified as a strong belief in an acceptance of
the organization’s goal and values, a willingness to exert considerable effort on behalf
of the organization and finally a strong desire to maintain membership in the
organization.
All of the nine questions were positive, stated item except Q6 where it was a negative
stated question. Q1 was to gather the information on how serious the management put
their resources in safety. This included all type of resources especially financial, time,
human and also the property of the company.

86
As all the senior management included in the team of management, Q2 was to ensure
that every senior manager understood the importance of safety in every aspect of work
and the level of their awareness towards safety thinking.
Q3 and Q4 were about responses given by the general management and immediate
manager of employees in term of receiving an idea or suggestion from employees to
improve their safety and health condition. In managerial employees, technician is the
nearest person to the hazard that existed in their workplace and their suggestions should
be taken into consideration in order to improve the level of safety and health in the
workplace.
Q5 was intended to know that employees were provided with Personal Protection
Equipment by the management to protect them from any work related injury. Q6 to Q9
were the questions on priority, action, recognition and promotion done by the
management for safety and health. Table 3.4 shows the details of management
commitment questions which had been used in the study.
Table 3.4: Management Commitment Questions
1 The company puts sufficient resources into safety.
2 Senior managers take safely issues into account when making
decisions.
3 Management readily acts upon safety suggestions from staff.
4 I get a good response from my manager when I raise a safety issues to
him.
5 I am provided with suitable and sufficient PPE for my job.
6 Management places low priority on Health and Safety Training.
7 Management only bothers to look on OSH after there has been an
accident.
8 There is a reward and recognition program for innovation in safety.
9 Management’s promotion of a work culture is supportive of safety.

87
3.4.2.2 Employee Participation
Employee participation is one of the factors studied in this survey. For this purpose, 11
questions have been developed to get wide view of workers participation in the
company. Generally the questions used to get the information about the level of
awareness among employees and how they perceived the importance of safety and
health in their work. This includes on how they believe that they are the one who is
responsible for the safety of themselves, their own workplace including their colleagues.
If they positively believe in the importance of safety and health at workplace, they
should know all the safety measures and issues before they start work.
Besides that, it was to gather the team work spirit among employees and superiors. The
questions were developed to study on how employees discussed the workplace safety
issues among their colleagues and superiors. Some companies might implement open
and frank type of discussions and some companies might do it adversely.
The other questions under this section were to identify employees’ personal perception
of their role in ensuring their workplace safety and health. They might be selfish to
ensure that they are the only ones who work safely or at the same time to ensure that
everybody’s safety was their shared responsibility. This included on how they react
when they see their colleagues break safety and health procedures, how they behave
during work time without any supervision by their superior and also their willingness to
avoid any dangerous work especially to perform short cut work which clearly violated
safety and health procedures. Table 3.5 shows the details of Employees Participation
questions which had been used in the study.

88
Table 3.5: Employees Participant Questions
10 I have responsibilities for the safety of myself and my colleagues.
11 I am aware of the safe system of the work before I start a job.
12 Discussion about safety at meetings (team and safety related meeting)
was frank and open.
13 I have opportunity to discuss the day-to-day job plan with my manager
or immediate superior.
14 Management and the workforce will work together as a team to tackle
safety and other work related problems.
15 Everybody understands their safety responsibilities and acts accordingly.
16 When see potential safety hazard, I am willing to correct it myself if
possible.
17 My workmates would react strongly against person who breaks safety
and health procedures/rules.
18 People here always work safely even though they are not being
supervised.
19 I am willing to warn my co-worker about working unsafely.
20 I sometimes take shortcut in performing my job when it’s sensible to do
so.

89
3.4.2.3 Training and education
Training is considered as one of the contributions where management will spend
financial and other resources to ensure the awareness and understanding regarding
safety and health. Q21 was designed to study either the training organized by the
management covered the area needed especially based on employees personal work
environment or the training does not cover the area needed. It will show how
management study the need of training based for their employees work and to ensure
the effectiveness of the training. The next question was specifically to gather
information about emergency procedures that training should be given to all employees
to face with any emergency situation.
The question asks about the existing accident investigation process to identify hazard
and briefing done continuously by the management to ensure that all the hazards
discovered were communicated to all employees. This is considered as part of how
management can educate the employees to understand the hazard and to avoid any
unsafe behavior and the unsafe condition. Q25 and Q26 were developed to ascertain the
education related to safety and health given to employees starting from the senior
leaders in the department until the lowest employees’ level. It was also to find out
whether the education or training was given right from the first day of the employees’
report for duty from Q27.
Finally, to close this section, questions were asked whether the training given generally
start from identifying and reporting near misses, adverse events and errors. The entire
questions designed were intentionally to discover the level of training and education
contributed by the management. Table 3.6 shows the details of Training and Education
questions which had been used in the study.

90
Table 3.6 : Training and Education Questions
21 The training had covered all the safety and Health risks associated
with the work for which I am responsible.
22 I have received training in the emergency procedures and
arrangements for my workplace.
23 Accident investigation is mainly used to identify safety hazards in the
workplace.
24 I have been briefed to identify safety hazards in the work place.
25 Organization’s senior leaders received specific safety education.
26 Employees were given specific safety education.
27 Safety components are included in all new employee member
orientation programs.
28 All staff members, workers, and managers receive specific training in
procedures to identify and report safety concerns, adverse events, near
misses, and errors.
3.4.2.4 Communication
The fourth part of the second section was related to the questions about safety and
health communication from top to the bottom and bottom to top. The first two questions
asked about general communication of safety and health whether it was well managed
and were all employees receiving useful and accurate information from the
management. The next four questions start to explore the promotion done by the
management to encourage employees’ communicating regarding their opinion in safety
and health which can improve the condition of safety and health in the department.

91
This includes the feedback from the management upon receiving the opinion and how
the workers feel when expressing their opinion. The department shows their acceptance
of employees’ suggestion if the answer on Q33 proved that employees expressed their
opinion without any fear. Q34 was created to discover the level of accident reported by
employees to management.
The next three questions from Q35 to Q37 were to discover the other version of
communication called top to bottom, including if any safety and health decision and
vision made by the management are shared with the employees. The final two questions
in this section were developed to get opinion from employees about whether the safety
and health procedures were practically designed by the management and the system
being used in the organization is good. Table 3.7 below shows the details of
Communication questions which have been used in the study.
Table 3.7: Communication Questions
29 There are good communications here about Safety and Health issues.
30 I received useful and accurate OSH information.
31 The company encourages suggestions on how to improve safety and health
conditions.
32 There is good feedback from management on reported OSH issues.
33 I can report an accident or near-miss without fear of blame of retribution.
34 Accidents which happen here are always reported.
35 Information on current level of awareness of OSH is easily available.
36 I am given sufficient information on management’s decisions regarding
matters of OSH.
37 I believe that management has communicated a clear vision of OSH to
them.
38 Some safety and health procedures/rules are not really practical.
39 The company has a good system for identifying and dealing with OSH
problems.

92
3.4.3 Level of Awareness (LoA) (Section 3)
The final section was developed solely to study the employees’ level of awareness of
OSH safety management. There are several factors which need to be considered. Those
factors were employees’ personel safety orientation, policy of the company, risk
assessment being conducted, monitoring level and management consideration to review
the policy regulation and implementation of safety and health. The first and second
question in this section were intended to get information on the level of employees
confidence toward their workplace safety and health and whether they believe that the
management took enough effort to ensure their safety during work time.
Next, three questions were developed to gather information about safety and health
policy of the department. It started from the existence of the policy until the
implementation of the policy and status of the policy being reviewed. The third factor of
monitoring level was captured by the next four questions starting from Q46 until Q49.
The entire questions asked respondents about information of safety and health provided
by the management to employees and whether the objectives set up by the management
were well spread out to every employee. The other question was about the existence of
safety and health committee and whether it always considered as the discussion field
between management and employees’ on the safety and health matters.
Risk assessment was the fourth factor. The questions related to this factor that was
developed starting from Q50 until Q54. The entire questions analyze the risk
assessment, safety inspection, accident reports and audit carried out in the department.
Finally, the last two questions developed were to ensure the availability of safety and
health procedures and whether the procedures were being reviewed or just left as what
originally existed. Table 3.8 below shows the details of LoA of OSH management
questions which had been used in the study.

93
Table 3.8: Level of Awareness of OSH Questions
40 I feel safe at workplace.
41 My organization takes all OSH measure to ensure employees safety.
42 My organization has Occupational Safety and Health policy.
43 The policy meets the legal requirements and best practice of occupational
safety and health.
44 The policy is up to date.
45 The policy being implemented effectively.
46 My organization provides safety and health information to employees.
47 My organization has a safety and health committee.
48 My organization sets safety and health objectives based on an
organizational level.
49 My organizational sets safety and health objectives based on an individual
level.
50 The workplace risk assessments are being carried out.
51 The systems are in place to ensure risk assessments are reviewed when
appropriate.
52 OSH inspections are being carried out.
53 My organization has a system for reporting accidents.
54 My organization has an audit system in place.
55 My organization has procedures for safety and health.
56 My organization reviews safety and health implementation.

94
3.5 Validity And Reliability
The questionnaire developed as a survey tool in this study was a combination of
questionnaires taken from the Loughborough Safety Culture Assessment Toolkit
(LSCAT) and Railway Safety Standard Board (RSSB) Safety Culture Toolkit. Both
toolkits have been validated and widely used in a variety of industries by many
companies all over the world. Based on this, through content validity, construct validity
and criterion validity testings were not mandatory. Nevertherless, some validity testing
and reliability testings were carried-out in this study. (Detailed explanation in
subsection 4.4). The repeatability of the questionnaires was also evaluated by using the
Intra-class correlation coefficient (ICC), which takes values between -1 and +1. Values
proximate to +1 show high repeatability of the questionnaire. Additionally, evaluation
of the internal consistency of the sub-scales for the safety climate questionnaire was
carried out by calculating the Cronbach Alpha coefficient. This coefficient ranges from
0 - 1. Large Cronbach Alpha values indicate a high consistency of the questions of
which the sub-scale is consisted of.
As a further check on the suitalility of the questionnaires, discussion sessions were
conducted with Heads of Departments and officers of the Department of Occupational
Safety anf Health. A pilot study, which is considered as a best practice (Liaw, 2002) and
(Naoum, 1998), was also conducted prior to the actual field study. A pilot study is
beneficial as it sets and paves the way to achieve the objectives of the study (MAMPU,
1987). According to Ahmad Mahdzan (1992), a pilot study is carried out to test the
relevance and clarity of the questionnaire, the suitability of scales used, and the duration
and cost of the study. This will then be the basis of the actual field study.

95
Thirty sets of questionnaires were distributed to the targeted group of respondents. The
group was from various levels of position (grade J17 to grade J54) in the mechanical
and electrical services unit in DID Malaysia ( see Appendix I). It was found that their
demographic data showed similar demographic data with the respondents in this study.
Their jobs are related to the design and maintenance of mechanical work and electrical
departments. This is to check for errors and ambiguity.
The researcher distributes the questionnaire and explains the purpose of the
questionnaire for a pilot test. The response was 100 percent as all employees filled up
and submitted the given questionnaires. The researcher stayed in the meeting room to
assist respondents in filling up the questionnaires and immediately collected the
questionnaires upon completion. This was to ensure that the respondents were able to
understand clearly the meaning of each question. The collected data were analyzed
using the appropriate analysis using SPSS program and based on the results and the role
played by the pilot study, it showed that the questionnaire used has high reliability and
validity and can be used in this study.
96
3.6 Data Collection And Procedures
According to Sekaran (2000) and Zigmund (2000), data sources can either be primary or
secondary data. This study uses both primary data and secondary data. The principal
sources of secondary data are from documentary sources namely books, periodicals,
professional journals, conference papers, referred publications, research papers,
economic reports, statistical sources, government sources, internet information articles
and magazines. Primary data are obtained through the pilot studies and field studies.
After the respondents in the department were selected, an approval was needed before
the survey could be run and the questionnaires could be distributed to the respondents.
A letter was sent to the Director General of the department seeking his approval (see
Appendix J). After being briefed by the researcher, approval was given. Several terms
and conditions were imposed and it was agreed by both parties. One of them stipulated
that this study should be used for academic purposes only, and should be classified as
private and confidential. Once the approval was given, researcher distributed the
questionnaires to all respondents. They were grouped together in the meeting room and
assisted by the researcher in case they encountered difficulties. Completed questionnaire
forms were collected at the end of every session.
It was accepted that the main constraint in conducting this survey was the time available
to the respondents. During the selection of managerial level employees there were some
difficulties as more than half of them cannot be part of the sampling due to their work
load and time constraints.

97
3.7 Technique of Data Analysis
Analysis of data would generate acceptable conclusive results through statistical means
(Norusis, 1999a) and able to construct a detail description of phenomenon, to provide
recommendations to problems identified (Kamarudin, 1990). In this study, data
collected from the questionnaires were treated and analyzed using Statistical Package
for Social Science (SPSS) Version 16. It employed multivariate statistical comprising
descriptive statistics, Pearson`s correlation coefficient, analysis of variance (ANOVA)
and regression analysis. According to Zulkarnain (2001), SPSS is a popular statistical
package used in the field of science namely management, education and economics.
Descriptive statistics were used to identify the sample based on the data provided in the
Respondents Information Sheet. Analyses for frequencies, means and standard
deviations were calculated to describe demographic of the respondents and on the
questions that have options. Descriptive analysis converts raw data by rearranging,
ordering and manipulating for easy interpretation (Zigmund, 2000). According to
Johnson (2002), a large set of data will be difficult to extract relevant information unless
the data are assessed by a summary number, measure of location or central value, or a
measure of spread or variation. Descriptive statistic provides such summary by
calculating the percentages, frequency distribution, average, mean and standard
deviation.
Even though Chan (1997), opined that descriptive statistics namely the mean score does
not reflect relationship between attributes and as such are not an appropriate technique
to access overall ranking, others disagree as they used the technique for such purpose.
This technique is amongst that used in studies by Belassi (1966); Collins (2004);
Hartman (2002); Hartman et al. (1998); Iyer (2005); Nguyen et al. (2004) and Wang

98
(2005), to rank safety factors. Level of Awareness of Occupational Safety and Health
management can be determined using the overall mean score.
The summaries are shown in Table 3.9.
Table 3.9: Mean Score for Determining Level of Awareness of Occupational Health
and Safety Management.
Group
Code
Mean score range
Consistency Level
1. 3.68-5.00
High
2. 2.34-3.67
Moderate
3. 1.00-2.33
Low
Source: (Bergh, 2011; Idrus et al., 2004)
Statistical method used to get the result of the hypotheses were one way ANOVA-Test
and Pearson Correlation, r, was utilized as data were parametric and normally
distributed. ANOVA-Test was used to differentiate between the mean scores for the
study samples. Pearson Correlation Test measured the strengths of the relationship
between the research variables and employees safety awareness. Correlation analysis
establishes and describes the strength and direction of relationship between two
variables. The common statistic methods are the Pearson correlation and Spearman’s
Rho correlation (Williams, 2001). Correlation coefficients reveal the magnitude of
relationships (Cooper, 2001). The sign of the correlation coefficient (+, -) defines the
direction of the relationship, either positive or negative.

99
A positive correlation coefficient means that as the value of one variable increases, the
value of the other variable increases; as one decreases the other decreases. A negative
correlation coefficient indicates that as one variable increases, the other decreases, and
vice-versa.
The computation of the Pearson product-moment correlation used is as follows:
where
Cov(y, x) = the covariance of y and x
Var(x) = the variance of x
Var(y) = the variance of y
This study applied Pearson’s correlation coefficient to investigate the relationship
between variables. For example, it investigates whether the position of employees will
differently affect their level of safety climate and safety awareness. Another example is
whether the management commitment significantly affects the level of awareness of
OSH management. The interpretation of the values of correlation coefficient as
compiled by Chua (2006), is shown in Table 3.10. The interpretation of the values
ranges from 0 to +/ 1, where the absence of a relationship is expressed by a coefficient
of zero and a perfect positive or negative correlation is expressed by a coefficient of
+/ 1.
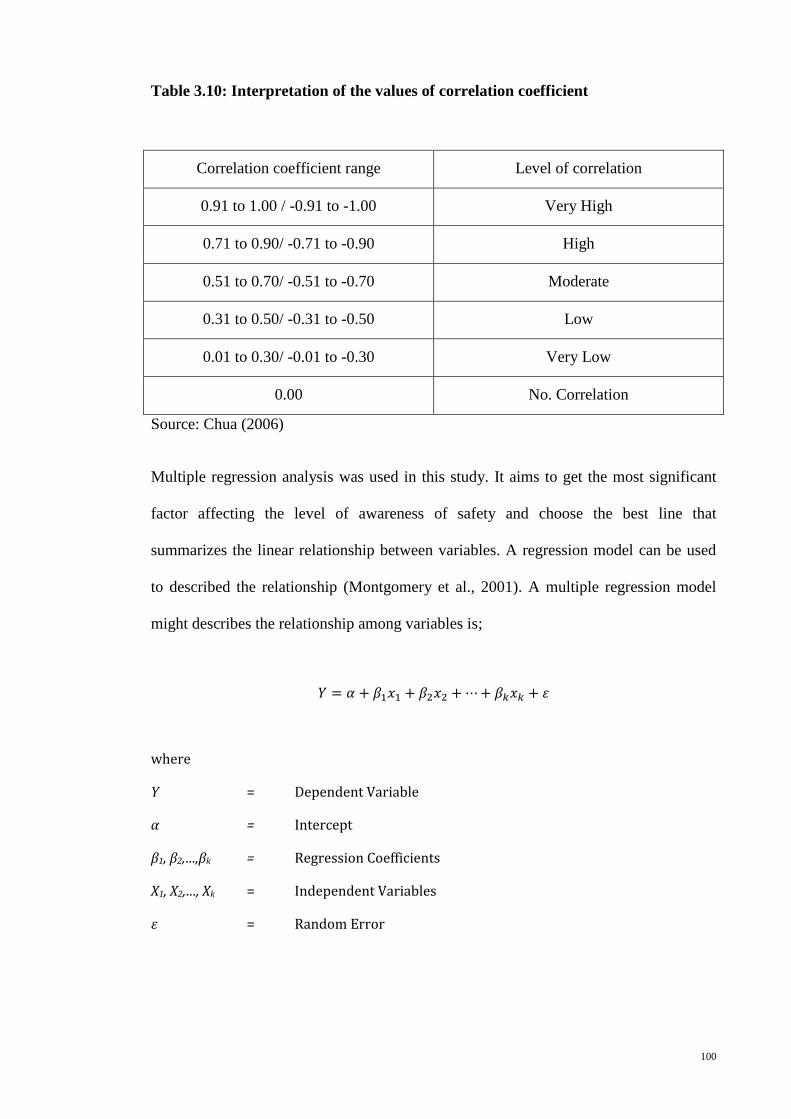
100
Table 3.10: Interpretation of the values of correlation coefficient
Correlation coefficient range Level of correlation
0.91 to 1.00 / -0.91 to -1.00 Very High
0.71 to 0.90/ -0.71 to -0.90 High
0.51 to 0.70/ -0.51 to -0.70 Moderate
0.31 to 0.50/ -0.31 to -0.50 Low
0.01 to 0.30/ -0.01 to -0.30 Very Low
0.00 No. Correlation
Source: Chua (2006)
Multiple regression analysis was used in this study. It aims to get the most significant
factor affecting the level of awareness of safety and choose the best line that
summarizes the linear relationship between variables. A regression model can be used
to described the relationship (Montgomery et al., 2001). A multiple regression model
might describes the relationship among variables is;
where
Y = Dependent Variable
α = Intercept
β1, β2,…,βk = Regression Coefficients
X1, X2,…, Xk = Independent Variables
= Random Error

101
Based on the results of statistical analyzes that have been made, is found only a model
developed for this study. Model to be developed is as follows:
where
OSH = Occupational Safety and Health
LoA = Level of Awareness
α = Intercept
β1, β2, β3, β4 = Regression Coefficients
MC = Management Commitment
EP = Employee Participation
TE = Training and Education
COMM = Communication
Based on the literature review, most previous studies in project management use
multivariate statistical analysis. This method is abled to analyze data to explain the
relationship between different variables of LoA of OSH management system and to
identify the key factors that would not be ascertained by other methods (Shenhar et al.,
2002).

102
Internal consistency condition of the data set or internal coherence of data is important
in any data evaluation (Hair et al., 1998) and (Aripin, 2004). This condition is necessary
since any comparative assessment to be valid has to be made on equal basis, that is
comparing like against like and that data are not biased. In this condition, whatever
conclusion is derived should be able to reflect the correct situation of the problem being
investigated. As such in order to achieve the requirement of high level trustworthiness
of the research findings, internal consistency tests are performed on the data set. Data
consistency is thus measured by the value of alpha coefficient obtained. This means that
the higher the value of the coefficient obtained the more consistent will be the data set.
A mark below 0.70 is considered as lack of internal consistency (Nunnaly, 1978).
3.8 Concluding Remarks
The explanation of this chapter provides the details of the methodology used to
complete this study. It begins with the research design, research instrument,
questionnaires design and data collection procedures and ended with technique of the
data analysis. The researcher believes that after completing this chapter the reader
would be able to understand the process of this study. The next chapter will present the
results of the survey conducted.

103
CHAPTER 4: RESULTS AND DISCUSSION
This chapter is divided into six major sections including the demographic characteristic
data in the first section. In the second section, findings of survey are presented. In
section three, the overall Level of Awareness of Occupational Safety and Health
management system is summarized. In section four the statistical analyses are presented
and in section five regression analyses are presented. Finally, the chapter ends with a
section on validation of the models.
4.1 Demograpic Characteristic Data
There were 164 respondents who participated in this study (83 in DEP1 and 81 in
DEP2). They were selected based on the different categories of position, academic
background, ages and working experiences. The demographic information of the
samples is shown below.
4.1.1 Respondent’s Position
One percent of the respondents are managers grade J54 and above in DEP1, while there
were no managers grade J54 and above in DEP2. Forty percent are engineers grade J41
to J52 in DEP1 and nineteen percent in DEP2. For assistant engineers grade J29 to J38,
thirteen percent were in DEP1 and twenty one percent in DEP2. Forty six percent
technicians grade J17 to J26 in DEP1 while sixty one percent in DEP2. It could be seen
that technicians were the largest group in both departments involved in this study.
Detailed information are given in Table 4.1, Figure 4.1,Table 4.2 and Figure 4.2.

104
Table 4.1: Designation in DEP1
DEP1 Frequency ( % ) Valid Percent
Cumulative
Percent
Valid Manager ( J54 -
above ) 1 (1.2) 1.2 1.2
Engineer( J41-
J52 ) 33 (39.8) 39.8 41.0
Assistant
Engineer ( J29 -
J38 )
11 (13.3) 13.3 54.2
Technician ( J 17
- J26 ) 38 (45.8) 45.8 100.0
Total 83 (100.0) 100.0
Figure : 4.1: Designation in DEP1

105
Table 4.2: Designation in DEP2
DEP2 Frequency ( % ) Valid Percent
Cumulative
Percent
Valid Engineer( J41-
J52 ) 15 (18.5) 18.5 18.5
Assistant
Engineer ( J29 -
J38 )
17 (21.0) 21.0 39.5
Technician ( J 17
- J26 ) 49 (60.5) 60.5 100.0
Total 81 (100.0) 100.0
Figure 4.2: Designation in DEP2

106
4.1.2 Education Level
The respondents were from different academic background. Table 4.3 shows about
twenty-four percent were with SPM and below. Twelve percent of them had technical
certificates, about twenty four percent were diploma holders and thirty five percent were
degree holders. For masters and above level there were only five percent of them in
DEP1. Table 4.4 shows that the number of respondents with SPM and below was seven
percent. Twenty five percent of them were with technical certificates. Forty seven
percent were diploma holders and finally the balance of twenty one percent had degrees
in DEP2. In terms of educational background it was found that the proportion in DEP1
was quite balanced, but it was clear in DEP2 that diploma holders represented almost
half of the respondents’ ratio. Detailed information are given in Table 4.3, Table 4.4,
Figure 4.3 and Figure 4.4.

107
Table 4.3:Education Level in DEP1
DEP1 Frequency ( % ) Valid Percent
Cumulative
Percent
Valid SPM - below 20 (24.1) 24.1 24.1
Technical
certificate 10 (12.0) 12.0 36.1
Diploma 20 (24.1) 24.1 60.2
Degree 29 (34.9) 34.9 95.2
Master and
above .. 4 (4.8) 4.8 100.0
Total 83 (100.0) 100.0
Figure 4.3 : Educational Level in DEP1

108
Table 4.4:Education Level in DEP2
DEP2 Frequency ( % ) Valid Percent
Cumulative
Percent
Valid SPM - below 6 (7.4) 7.4 7.4
Technical
certificate 20 (24.7) 24.7 32.1
Diploma 38 (46.9) 46.9 79.0
Degree 17 (21.0) 21.0 100.0
Total 81 (100.0) 100.0
Figure 4.4 : Education Level in DEP2

109
4.1.3 Age of Respondents
In terms of age, respondents were segregated into four age groups. First group covered
the respondents’ aged between 20 to 29 years old which was nineteen percent in DEP1
and thirty six percent in DEP2. The second group between 30 to 39 years old was thirty
three percent in DEP1 and thirty seven percent in DEP2. The group of respondents in
the ages of 40 to 49 years old was eighteen percent in DEP1 and nine percent in DEP2.
Finally, thirty percent and nineteen percent of the respondents came from the group of
more than 50 years old in DEP1 and DEP2 respectively. It can be seen that the
proportion of the respondents in DEP1 was fairly balanced compared to DEP2, in which
the majority consisted of a group of young people under the age of 40 years. Detailed
information is given in Table 4.5, Figure 4.5, Table 4.6 and Figure 4.6.

110
Table 4.5: Age in DEP1
DEP1 Frequency ( % ) Valid Percent Cumulative Percent
Valid
20-29 16 (19.3) 19.3 19.3
30-39 27 (32.5) 32.5 51.8
40-49 15 (18.1) 18.1 69.9
50-
above
25 (30.1) 30.1 100.0
Total 83 (100.0) 100.0
Figure 4.5: Age in DEP1

111
Table 4.6: Age in DEP2
DEP2 Frequency ( % ) Valid Percent Cumulative Percent
Valid
20-29 29 (35.8) 35.8 35.8
30-39 30 (37.0) 37.0 72.8
40-49 7 (8.6) 8.6 81.5
50-
above
15 (18.5) 18.5 100.0
Total 81 (100.0) 100.0
Figure 4.6: Age in DEP2

112
4.1.4 Respondent’s Working Experiences
Another variable of personal profile in question was the respondents working
experiences. In this section, the respondents were segregated into four groups; the first
group was for employees who worked less than five years and the percentage of
respondents was twenty eight percent in DEP1 and thirty three percent in DEP2. The
second group with 6 to 10 years working experiences covered eighteen percent in DEP1
and twenty eight percent of respondents in DEP2, followed by the third group with 11
to 15 years of experiences formed eight percent in DEP1 and eleven percent in DEP2.
The final group who worked more than 16 years formed forty six percent in DEP1 and
twenty seven percent among the respondents in DEP2. It was clear that the respondents
in the DEP1 were more experienced than respondents in DEP2. Detailed information is
given in Table 4.7, Figure 4.7, Table 4.8 and Figure 4.8.

113
Table 4.7: Working Experience in DEP1
DEP1 Frequency Percent Valid Percent Cumulative Percent
Valid 5-below 23 27.7 27.7 27.7
6-10 15 18.1 18.1 45.8
11-15 7 8.4 8.4 54.2
16-above 38 45.8 45.8 100.0
Total 83 100.0 100.0
Figure 4.7: Work Experience in DEP1

114
Table 4.8: Working Experience in DEP2
DEP2 Frequency Percent Valid Percent Cumulative Percent
Valid 5-below 27 33.3 33.3 33.3
6-10 23 28.4 28.4 61.7
11-15 9 11.1 11.1 72.8
16-above 22 27.2 27.2 100.0
Total 81 100.0 100.0
Figure 4.8: Work Experience in DEP2
4.1.5 Summary
Demographic data showed that the proportion of respondents in DEP1 have age group
and level of education fairly balanced and were more experienced than respondents in
DEP2 who consisted of younger, less experienced but highly educated workers.
Demographic data shows that the technician group represented the greatest proportion
in the both departments.

115
4.2 Findings of Survey
Subsequently, the findings from the surveys that were conducted in both departments
are shown. It is divided into two parts which are Safety Climate factors and Level of
Awareness of Occupational Safety and Health management system.
4.2.1 Safety Climate Factors
Safety climates factors comprise of management commitment, employee participation,
training, education and communication.
4.2.1.1 Management Commitment
Results show that data were normally distributed.From figure 4.9, about 34% and 35%
of the respondents from DEP1 and DEP2 had chosen a Likert-scale 3 for management
commitment and about 41% and 47% of them had chosen a Likert-scale 4. About 47%
of the respondents in DEP1 and 52% in DEP2 agreed with the statement given in the
questionnaire. This indicates that they are ‘moderately satisfied’ with their employer’s
role.
Figure 4.9: Management Commitment

116
4.2.1.2 Employees’ Participation
Results show that data were normally distributed. From Figure 4.10, the responses
indicate that, about 52% and 54% of the respondents from DEP1 and DEP2 had chosen
a Likert scale 4 for employees’ participation. The second highest in percentages was a
Likert scale 3 which was 29% in DEP1 and 33% in DEP2. About 61% of the
respondents in both DEP1 and DEP2 agreed with the statement given in the
questionnaire. This shows that they are ‘moderately satisfied’ with their participation in
the department.
Figure 4.10: Employees’ Participation

117
4.2.1.3 Training and Education
Results show that data were normally distributed. From Figure 4.11, about 34% of the
respondents from DEP1 and 51% of the respondents from DEP2 had chosen a Likert
scale 4 for training and education. For a Likert scale 3, there were about 44% of the
respondents in DEP1 and 41% of the respondents in DEP2. About 38% of the
respondents in DEP1 and 56% in DEP2 agreed with the statement given. Generally, this
shows that they are ‘moderately satisfied’ to ‘satisfied’ with the training and education
program in their department.
Figure 4.11: Training and Education

118
4.2.1.4 Communication
Results show that data were normally distributed. From Figure 4.12, the responses
indicate that, about 43% of the respondents from DEP1 and 59% in DEP2 had chosen a
Likert scale 4 for communication in the department. The second highest in percentage
was a Likert scale 3 which was 38% in DEP1 and 30% in DEP2. About 50% of the
respondents in DEP1 and 66% in DEP2 agreed with the statement given to them. This
shows that they are ‘moderately satisfied’ with communications in the department.
Figure 4.12: Communication

119
4.2.2 Level of Awareness of OSH Management System
In this study, LoA measured by orientation, policies, monitoring, risk assessment and review of
all the above factors.The data obtained were processed using descriptive analysis method
comprising the table of mean score, standard deviation and the percentage. This analysis is used
to explain the demographics of respondents to the questions that have options. Table 4.9 (a, b, c,
d and e) shows the data collected to measure the LoA of OSH management system for both the
departments.
Table 4.9(a): LoA of OSH-Orientation
SD D M A SA MS/
SD
40 I feel safe at workplace.
DEP1
(f) 0
% 0
2
2.4
24
28.9
48
57.8
9
10.8
3.77
0.669
DEP2
(f) 0
% 0
1
1.2
17
21
49
60.5
14
17.3
3.94
0.659
41 My organization takes all OSH measure to ensure
employees safety.
DEP1
(f) 2
% 2.4
4
4.8
29
34.9
43
51.8
5
6.0
3.54
0.786
DEP2
(f) 0
% 0
0
0
15
18.5
59
72.8
7
8.6
3.90
0.515
42 My organization has Occupational Safety and
Health policy.
DEP1
f) 3
% 3.6
9
10.8
29
34.9
26
31.3
16
19.3
3.52
1.040
DEP2
(f) 0
% 0
0
0
15
18.5
42
51.9
24
29.6
4.11
0.689
About 57 (68.6%) and 63 (77.8%) of the respondents in DEP1 and DEP2, respectively, felt safe
at the work site. The results show that, about 48 (57.8%) in DEP1 and 66 (81.4%) of the
respondents in DEP2, respectively, agreed that their organization had taken all Occupational
Safety measures to ensure employees safety. About 42 (50.6%) respondents in DEP1 and
66 (81.5%) respondents in DEP2 agreed that their organization had the safety policies.

120
Table 4.9(b): LoA of OSH-Policy
SD D M A SA MS/SD
43 The policy meets the legal requirements and best
practice of occupational safety and health.
DEP1
f) 4
% 4.8
7
8.4
24
28.9
41
49.4
7
8.4
3.48
0.942
DEP2
(f) 0
% 0
0
0
15
18.5
53
65.4
13
16.0
3.98
0.591
44 The policy is up to date.
DEP1
f) 5
% 6.0
13
15.7
26
31.3
38
45.8
1
1.2
3.20
0.934
DEP2
(f) 0
% 0
2
2.5
26
32.1
43
53.1
10
12.3
3.75
0.699
45 The policy being implemented effectively.
DEP1
f) 5
% 6.0
10
12.0
32
38.6
33
39.8
3
3.6
3.23
0.928
DEP2
(f) 0
% 0
1
1.2
29
35.8
44
54.3
7
8.6
3.70
0.641
About 48 (57.85) in DEP1 and 66 (81.4%) of the respondents in DEP2, agreed that the policy
meets the legal requirements and best practices of OSH. The responses also indicated that
39 (47%) in DEP1 and 53 (65.4%) respondents in DEP2 agreed that the policy is up to date.
About 36 (43.4%) in DEP1 and 51 (62.9%) respondents in DEP2 agreed that the policy is being
implemented effectively.

121
Table 4.9(c): LoA of OSH-Monitoring
SD D M A SA MS/S
D
46 My organization provides safety and health
information to employees.
DEP1
f) 4
% 4.8
10
12.0
27
32.5
39
47.0
3
3.6
3.33
0.912
DEP2
(f) 0
% 0
0
0
23
28.4
53
65.4
5
6.2
3.78
0.548
47 My organization has a safety and health
committee.
DEP1
f) 4
% 4.8
11
13.3
26
31.3
30
36.1
12
14.5
3.42
1.049
DEP2
(f) 0
% 0
0
0
16
19.8
40
49.4
25
30.9
4.11
0.707
48 My organization sets safety and health
objectives on an organizational level.
DEP1
f) 4
% 4.8
15
18.1
22
26.5
35
42.2
7
8.4
3.31
1.023
DEP2
(f) 0
% 0
0
0
16
19.8
49
60.5
16
19.8
4.00
0.632
49 My organizational sets safety and health
objectives on an individual levels.
DEP1
f) 4
% 4.8
14
16.9
29
34.9
33
39.8
3
3.6
3.20
0.934
DEP2
(f) 0
% 0
5
6.2
25
30.9
45
55.6
6
7.4
3.64
0.713
About 42 (50.6%) in DEP1 and 58 (71.6%) of respondents in DEP2 agreed that their
organization provided safety and health information to them. The responses also indicated
42 (50.6%) and 65 (80.3%) of respondents in DEP1 and DEP2, respectively, agreed that their
organization had a safety and health committee. About 42 (50.6%) and 65 (80.3%) of
respondents in DEP1 and DEP2, respectively, agreed that their organization had set safety and
health objectives on an organization level. About 36 (43.2%) and 51 (63%) of respondents in
DEP1 and DEP2, respectively, agreed that their organization had set safety and health
objectives on an individual level.
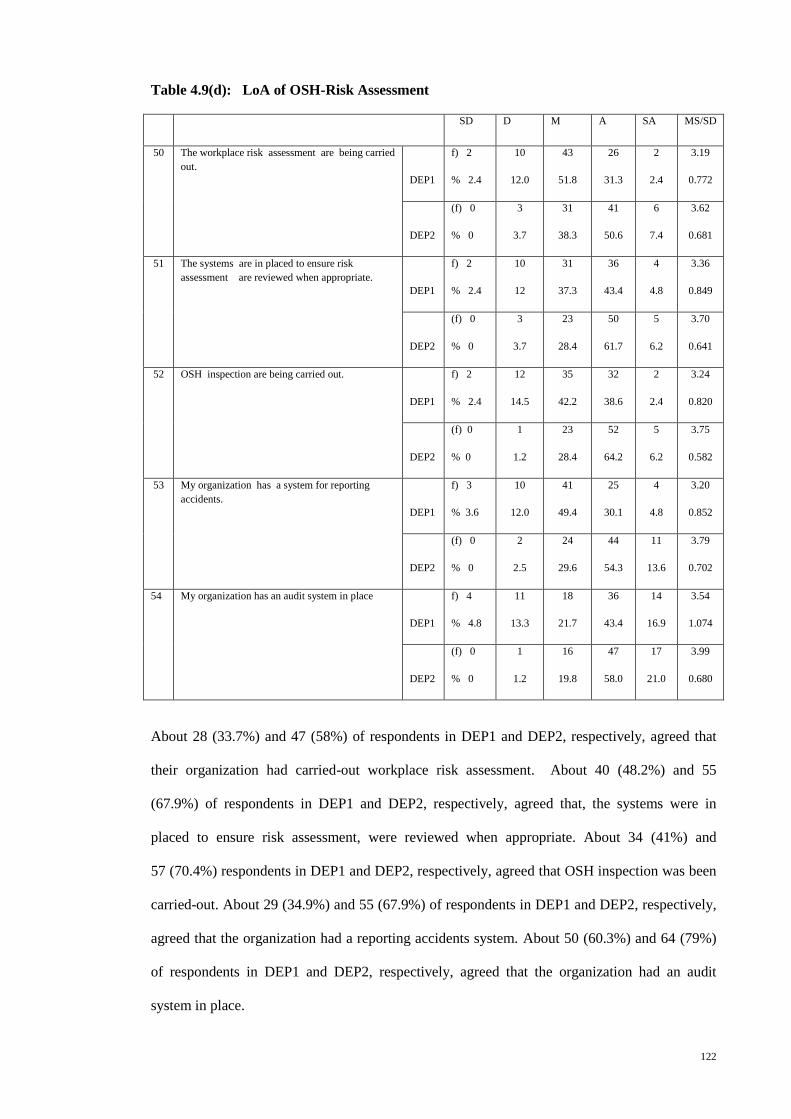
122
Table 4.9(d): LoA of OSH-Risk Assessment
SD D M A SA MS/SD
50 The workplace risk assessment are being carried
out.
DEP1
f) 2
% 2.4
10
12.0
43
51.8
26
31.3
2
2.4
3.19
0.772
DEP2
(f) 0
% 0
3
3.7
31
38.3
41
50.6
6
7.4
3.62
0.681
51 The systems are in placed to ensure risk
assessment are reviewed when appropriate.
DEP1
f) 2
% 2.4
10
12
31
37.3
36
43.4
4
4.8
3.36
0.849
DEP2
(f) 0
% 0
3
3.7
23
28.4
50
61.7
5
6.2
3.70
0.641
52 OSH inspection are being carried out.
DEP1
f) 2
% 2.4
12
14.5
35
42.2
32
38.6
2
2.4
3.24
0.820
DEP2
(f) 0
% 0
1
1.2
23
28.4
52
64.2
5
6.2
3.75
0.582
53 My organization has a system for reporting
accidents.
DEP1
f) 3
% 3.6
10
12.0
41
49.4
25
30.1
4
4.8
3.20
0.852
DEP2
(f) 0
% 0
2
2.5
24
29.6
44
54.3
11
13.6
3.79
0.702
54 My organization has an audit system in place
DEP1
f) 4
% 4.8
11
13.3
18
21.7
36
43.4
14
16.9
3.54
1.074
DEP2
(f) 0
% 0
1
1.2
16
19.8
47
58.0
17
21.0
3.99
0.680
About 28 (33.7%) and 47 (58%) of respondents in DEP1 and DEP2, respectively, agreed that
their organization had carried-out workplace risk assessment. About 40 (48.2%) and 55
(67.9%) of respondents in DEP1 and DEP2, respectively, agreed that, the systems were in
placed to ensure risk assessment, were reviewed when appropriate. About 34 (41%) and
57 (70.4%) respondents in DEP1 and DEP2, respectively, agreed that OSH inspection was been
carried-out. About 29 (34.9%) and 55 (67.9%) of respondents in DEP1 and DEP2, respectively,
agreed that the organization had a reporting accidents system. About 50 (60.3%) and 64 (79%)
of respondents in DEP1 and DEP2, respectively, agreed that the organization had an audit
system in place.

123
Table 4.9(e): ): LoA of OSH-Review
SD D M A SA MS/SD
55 My organization has procedure for safety and
health
DEP1
(f) 5
% 6.0
7
8.4
26
31.3
39
47.0
6
7.2
3.41
0.963
DEP2
(f) 0
% 0
0
0
16
19.8
48
59.3
17
21.0
4.01
0.642
56 My organization reviews safety and health
implementation.
DEP1
f) 3
% 3.6
9
10.8
34
41.0
31
37.3
6
7.2
3.34
0.901
DEP2
(f) 0
% 0
1
1.2
19
23.5
49
60.5
12
14.8
3.89
0.652
About 45 (54.2%) and 65 (80.3%) of respondents in DEP1 and DEP2, respectively, agreed that
the organization had the procedures for safety and health. About 37 (44.5%) and 61 (75.3%) of
respondents in DEP1 and DEP2, respectively, were satisfied that the organization reviewed
safety and health implementation.
4.2.3 Summary
Results showed that all factors of management commitment, employee participation,
training and education and communication are normally distributed ( see Appendix K).
Evaluation for normality of distribution of the continuous variables was tested by the
Kolmogorov-Smirnov test. It means that data collected from the survey seems to be of
high quality to be used in this study. This is important because most of the analysis
require data that are normally distributed for good analysis results. Respondents in both
departments showed that they were ‘moderately satisfied’ to ‘satisfied’ with the
management commitment. They were also ‘moderately satisfied’ to ‘satisfied’ with their
involvement in safety activities organized by their department. Respondents in both
departments indicated they were ‘moderately satisfied’ to ‘satisfied’ with the training
and education programs conducted by their department, while they are also ‘moderately
satisfied’ with the communication process adopted by the department.

124
4.3 Overall LoA of OSH Management System
Data obtained from the survey were analyzed and using the mean score, the overall LoA
of OSH management system is obtained as shown in Table 4.10. The results indicate
that LoA of OSH are between ‘moderately agreed’ to ‘highly agreed’ in the department
based on overall mean score of 3.37 in DEP1 and 3.86 in DEP2.
Table 4.10: Overall LoA of OSH
MEAN SCORE
OVERALL OF
OSH LoA
(MEAN SCORE)
ORIENTATION POLICY MONITORING RISK
ASSESSMENT
REVIEW
DEP1 3.61 3.30 3.32 3.31 3.38 3.37
(MODERATE)
DEP2 3.98 3.81 3.88 3.77 3.95 3.86
( HIGH )

125
4.4 Statistical Analysis
In this section, the statistical analysis is divided into six sub-sections including the
introduction in the first sub-section. Validity of the questionnaire used as a survey tool
in this study will be discussed in second sub-section. Reliability measures of tested
factors are presented in the sub-section three. Then, analysis of differences perception
LoA of OSH management system between groups are presented and discussed in sub-
section four. Correlation results are illustrated and summarized in sub-section five.
Finally, the section ends with a discussion.
4.4.1 Validity of Questionnaire
As mentioned in the ealier sub-section, the developed questionnaire was build using
combination of questions taken from established and widely used safety climate survey
tools, and that a through validity testing is not mandatory. The extent of validity testing
conducted for the current study is presented as follows:
4.4.1.1 Content Validity
From the literature, the researcher has compiled a list of variables that affect the
effectiveness of the safety program (refer to Table 2.1, Table 2.2, and Appendix C).
Discussions and brainstorming were conducted among top management of the
department. Twenty-five factors/variables had been identified (Appendix L), in term of
meaning similarity, word repetition, the appropriateness of the exact term and suitability
to the study situation and environment. To ensure the appropriateness of the variables to
be used as a factor in this study, an evaluation process called content validity ratio
(CVR) based on Lawshe’s equation was then done among panels of top management of
the departments (see Appendix M). The panels were asked to rank the variables listed in
three stages as shown in Table 4.11.

126
Table 4.11: Level of Agreement for CVR
No. Level Level explanation
1. 1 Essential
2. 2 Useful but not essential
3. 3 Not necessary
Source :(Lawshe, 1975)
The data collected were then analyzed to obtain the content validity ratio (CVR).
(Lawshe, 1975) stated that content validity threshold depends on the number of panels
(see Appendix N). Apart from this, Lawshe provided a minimum CVR value for
different sizes of the panelist based on a one-tailed test at α = 0.05 significance level. As
a result, with a panel size of 30 respondents, the minimum value of 0.33 CVR was to be
considered as acceptable. Thus, for any of the variables with value of CVR less than
0.33 will not be included in the questionnaire. Results of this preliminary study showed
that only 16 of the tested variables had values greater than 0.33 (0.33 to 0.73) as shown
in Appendix O. Thus, it can be concluded that only sixteen (16) variables are strongly
accepted.

127
4.4.1.2 Construct Validity
As mentioned earlier, factor analysis was performed for the evaluation of the construct
validity of the questionnaire used (Cronbach, 1955; Mohsen, 2011). Initially, the
relevance of the data used for the factor analysis was confirmed. The statistical criteria
Kaiser-Meyer-Olkin (KMO = 0.948) and the Bartlett Test of sphericity (value
20,230.187, p < 0.001), indicated that the raw data were suitable for the implementation
of factor analysis and values of KMO > 0.8 indicate a fairly high correlation and
therefore, factor analysis is meaningful (Field, 2005).
From the 39 original questions used in the factor analysis, using the Kaiser criterion and
Varimax orthogonal rotation, FOUR (4) main factors emerged, referred to as
‘management commitment’, ‘employees participation’, ‘training and education’ and
‘communication’. As shown in Table 4.12, the “management commitment” factor
consists of 9 questions. This factor explains 44.2% of the variability of the original data.
The “employees participation” consists of 11 questions. The percentage of variability in
the data interpretation by this factor is estimated to be 7.9%. The “training and
education” consists of 8 questions. This particular factor explains 4.5% of the variability
of the data.
Finally, the “communication” factor consists of 11 questions. This particular factor
explains 3.8% of the variability of the data.

128
Table 4.12: Results Derived from Factors Analysis
Dimension Eigenvalue % of
variance
Interpreted
Component Sub-component
Factor
Loading
1 5.420 32.426 Management
commitment
-Management
support
-Teamwork
-Clear and realistic
goals
0.887
0.622
0.579
2 1.856 11.565 Employee
Participation
-Positive group
norms -Personal attitude
-Personal motivation
-Continuing
participation
0.850
0.825
0.670
0.533
3 1.850 10.864 Training and
Education
-Effective
enforcement
scheme
-Appropriate safety
education and
training
-Equipment
acquisition and
maintenance
-Personal
competency
-Appropriate
supervision
Program evaluation
0.770
0.725
0.658
0.610
0.585
0.540
4 1.240 7.676 Communication
-Good
communication
-Delegation of
authority and
responsibility
-Sufficient resource
allocation
0.910
0.826
0.740

129
4.4.1.3 Criterion Validity
Criterion validity is a measure of how well one variable or set of variables predicts an
outcome based on information from other variables. Since criterion validation focuses
on the relationship between test score and level of awareness (LoA), the key to
validation using this approach is the use of a statistical test known as the “correlation
coefficient” where each respondent’s test score is correlated with his LoA. If the
correlation coefficient equals or exceeds r = 0.20, it means the test is sufficiently related
to LoA to make judgments about a suitability of the survey tool. Note that a correlation
of r = 0.20 is the minimum that should be considered acceptable (Field, 2005).
Ordinarily, one would like to see a correlation that is larger which indicates the
relationship between test score and level of awareness is stronger. The larger the
correlation, the better.
In this study, the criterion test is analyzed using a simple correlation between factors
related obtained from the pilot study. Results from Table 4.13 indicate that the
correlation coefficients, r, are from 0.60 to 0.810 which shows large correlation between
factors. Its mean the survey tool is suitable and sufficient to predict the criterion
variables in this study (Radhakrishna, 2007).
Table 4.13: Results Derived from Pearson Correlation Test
No. Factors Correlation Coeffcient
1. Management Commitment 0.604
2. Employees Participation 0.584
3. Training & Education 0.723
4. Communication 0.810

130
4.4.1.4 Repeatability of the Questionnaire
The repeatability of the questionnaire was evaluated by using the Intra-class correlation
coefficient, ICC, (Takao, 2007). The ICC’s results and their 95% confidence intervals,
95% CI, for all factors are tabulated in Table 4.14. The results showed that all ICCs are
greater than 0.8 and lie in the 95% confidence interval. This evaluation of repeatability
showed that all factors of the questionnaire were highly repeatable.
Table 4.14: Repeatability of Factors of Assessment Questionnaire
Safety Climate Factors ICC 95% CI
Management Commitment 0.870 0.754 - 0.952
Employees Participation 0.920 0.835 - 0.970
Training and Education 0.900 0.775 - 0.947
Communication 0.890 0.735 - 0.953
Level of Awareness (LoA) 0.970 0.900 - 0.993
ICC : Intraclass correlation coefficient
CI : Confidence interval

131
4.4.2 Reliability Measures
Reliability refers to stability or consistency of a measurement to produce identical,
similar and repeatable results when repeated measurements are made (DeVellis, 2003;
Field, 2005; Norland-Tilburg, 1990). In this study, questionnaire reliability was tested
using Cronbach’s (alpha (α). Cronbach’s alpha is derived from the average correlation
of all items on the scale (Rodeghier, 1996). The most common test of reliability analysis
is Cronbach’s Coefficient α (Salkind, 2000). This is to achieve the requirement of high
level trustworthiness of the research findings. The reliability measures of the
questionnaire on management commitment, employees’ participation, training and
education, communication and Level of Awareness(LoA) of OSH management system,
have been tested as shown in Table 4.15.
The results indicate that the reliability was high for management commitment in both
departments with values from 0.695 to 0.704. As for employees’ participation the
results show that the reliability was high in both departments with values of 0.693 to
0.821. Training and Education is considered high in reliability with values of 0.831 to
0.909. The results also indicate communication is considered high in reliability with
values of 0.837 to 0.930. Finally, LoA of OSH shows high reliabilities for both
departments with values of 0.928 to 0.954.
This means that the higher the value of the coefficient obtained the more consistent will
be the data set. A mark below 0.70 is considered as lack of internal consistency
(Cronbach, 1955; DeVellis, 2003; Nunnaly, 1978). This shows the reliability and
validity of the questionnaire used in this study.

132
Table 4.15 : Result for Reliability Measures
SAFETY FACTORS
DEP1
DEP2
Management Commitment
0.695
0.704
Employees` Participation
0.693
0.821
Training and Education
0.831
0.909
Communication
0.837
0.930
OSH Performance
0.928
0.954
In SPSS, if the value of the coeficient exceeds 0.7, then the scale is said to have internal
consistency, hence reliable to be used. In this study, it was found that all the coefficient
values are greater than 0.7, which showed that all the questions used in the
questionnaire were consistent and reliable.

133
4.4.3 Testing of Hypotheses
There were a few research questions to be answered in this study. Four hypotheses
tested were to cater for the third study objective and another four were to cater for the
fourth objective.
4.4.3.1 Analysis of Differences Between Groups
To test the differences in perception between the groups on LoA of OSH based on
demographic data, four hypotheses were made. This is necessary to test whether
demographic data affecting their perceptions of safety awareness.
Hypothesis 1: There is difference of perception Level of Awareness(LoA) on
Occupational Safety and Health based on their designation.
The hypothesis is designed to test whether the designation of employees affects their
perception towards occupational safety awareness.
The hypotheses (null hypothesis, H0, and alternative hypothesis, HA) to be tested are:
H0 : There is no difference in perception level on Occupational Safety
Awareness among employees based on their designations.
HA : There is difference in perception level on Occupational Safety
Awareness among employees based on their designations.
One way ANOVA Tests were conducted and Table 4.16 shows the test outputs. The test
results are further discussed as follows.

134
Table 4.16: Result for the Difference of Employees’ Perception Level on
Occupational Safety Awareness Based on Their Designation
LoA-DEP1
Sum of Squares Df Mean Square F Sig.(p)
Between Groups 1.082 3 .361 .748 .527
Within Groups 38.085 79 .482
Total 39.168 82
LoA-DEP2
Sum of Squares Df Mean Square F Sig.(p)
Between Groups
Within Groups
Total
.445
15.140
15.585
2
78
80
.223
.194
1.147
.323
Note: Degree of freedom = Df
Table 4.16, shows F = 0.748 (with df = 3,79; p = 0.53) for DEP1 and F = 1.147 (with
df = 2,78; p = 0.32) for DEP2. As the p-value is more than 0.05 in both departments,
there was no significance difference in the perception level on occupational safety and
health awareness based on their designations.
This means that employees’ designations does not influence their difference in
perception of the occupational safety awareness. Thus, the statement of H0 cannot be
rejected.

135
Hypothesis 2: There is difference of perception Level of Awareness(LoA) on
Occupational Safety and Health based on their educational
background.
The hypothesis was designed to test whether the educational background of employees
affects their perception towards Occupational Safety Awareness.
The hypotheses to be tested are:
H0 : There is no difference in perception level on Occupational Safety
Awareness among employees is based on their educational
background.
HA : There is difference in perception level on Occupational Safety
Awareness among employees based on their educational background.
One way ANOVA Tests were conducted and the test outputs are shown in Table 4.17.
The test results are further discussed as follows.
Table 4.17: Result for the Difference of Employees’ Perception Level on
Occupational Safety Awareness, Based on their Education Level.
LoA-DEP1
Sum of
Squares Df Mean Square F Sig.(p)
Between Groups 1.354 4 .338 .698 .596
Within Groups 37.814 78 .485
Total 39.168 82
LoA-DEP2
Sum of
Squares Df Mean Square F Sig.(p)
Between Groups .464 3 .155 .788 .504
Within Groups 15.120 77 .196
Total 15.585 80
Note: Degree of freedom = Df

136
Table 4.17 shows F = 0.698 (with df = 4,78; p = 0.59) for DEP1 and F = 0.788 (with
df = 3,77; p = 0.50) for DEP2. As the p-value is more than 0.05 in both DEP1 and
DEP2, there was no significance difference in the perception level on occupational
safety awareness based on their educational level.
This means that employees’ educational background does not influence their difference
in perception on occupational safety awareness. Thus, the statement of H0 cannot be
rejected.
Hypothesis 3: There is difference of perception Level of Awareness(LoA) on
Occupational Safety and Health based on their age.
The hypothesis was designed to test whether the age of employees affects their
perception toward occupational safety awareness.
The hypotheses to be tested are:
H0 : There is no difference in perception level on Occupational Safety
Awareness among employees based on their age.
HA : There is difference in perception level on Occupational Safety
Awareness among employees based on their age.
One way ANOVA Tests were conducted and the test outputs are shown in Table 4.18.
The test results are further discussed as follows.

137
Table 4.18: Result for the difference of employees` perception level on
Occupational Safety Awareness based on their age.
LoA-DEP1
Sum of
Squares Df Mean Square F Sig.(p)
Between Groups 2.424 3 .808 1.737 .166
Within Groups 36.744 79 .465
Total 39.168 82
LoA-DEP2
Sum of
Squares Df Mean Square F Sig.(p)
Between Groups .108 3 .036 .179 .911
Within Groups 15.477 77 .201
Total 15.585 80
Note: Degree of freedom = Df
Table 4.18, shows F = 1.737 (with df = 3,79; p = 0.166) for DEP1 and F = 0.179
(with df = 3,77; p = 0.911) for DEP2. As the p-value is more than 0.05 in both DEP1
and DEP2, there was no significance difference in the perception level on occupational
safety awareness based on their age.
This means that employees’ age does not influence their difference in perception on
occupational safety awareness. Thus, the statement of H0 cannot be rejected.

138
Hypothesis 4: There is difference of perception Level of Awareness(LoA) on
Occupational Safety and Health based on their work experience.
The hypothesis was designed to test whether the work experience of employees affect
their perception towards occupational safety awareness.
The hypotheses to be tested are:
H0 : There is no difference in perception level on Occupational Safety
Awareness among employees based on their work experience.
HA : There is difference in perception level on Occupational Safety
Awareness among employees based on their work experience.
One way ANOVA Tests were conducted and the test outputs were in highlighted in
Table 4.19. The test results are further discussed as follows.
Table 4.19: Result for the Difference of Employees’ Perception Level on
Occupational Safety Awareness Based on Their Work Experience.
LoA-DEP1
Sum of
Squares Df Mean Square F Sig.(p)
Between Groups 8.438 3 2.813 7.231 .000
Within Groups 30.730 79 .389
Total 39.168 82
LoA-DEP2
Sum of
Squares Df Mean Square F Sig.(p)
Between Groups 1.531 3 .510 2.795 .046
Within Groups 14.054 77 .183
Total 15.585 80
Note: Degree of freedom = Df

139
Table 4.19 shows F =7.231 (with df = 3,79; p = 0.00) for DEP1 and F = 2.795 (with
df = 3,77; p = 0.046) for DEP2. As the p-value is less than 0.05 in both DEP1 and
DEP2, there was significance difference in the perception level on occupational safety
awareness based on their work experiences. This means that employees working
experience greatly influence their differences in perception on occupational safety
awareness in DEP1 and DEP2. Thus, the statement of H0 can be rejected for both DEP1
and DEP2.
In summary, the results indicated that the respondent demographic data did not
influence the difference in the perception level of safety awareness except on working
experience factor. This means more experienced workers influenced the perception
levels of safety awareness.

140
4.4.3.2 Test of Correlations
Pearson correlation, r, tests were conducted to analyze the significance in relationship
between management commitment, employees participation, training and education and
communication towards occupational safety and health awareness. The test outputs are
shown in Table 4.20. The test results will be further discussed as follows.
Table 4.20: Correlation Between Level of Occupational Safety and Health
Awareness and Safety Climate factors for DEP1 and DEP2
LoA1 LoA2
LoA Pearson
Correlation 1 1
Sig. (2-tailed) . .
N 83 81
MSMC Pearson
Correlation .579(**) .443(**)
Sig. (2-tailed) .000 .000
N 83 81
MSEP Pearson
Correlation .545(**) .409(**)
Sig. (2-tailed) .000 .000
N 83 81
MSTE Pearson
Correlation .697(**) .503(**)
Sig. (2-tailed) .000 .000
N 83 81
MSCOMM Pearson
Correlation .725(**) .666(**)
Sig. (2-tailed) .000 .000
N 83 81
** Correlation is significant at the 0.01 level (2-tailed)

141
Hypothesis 5: There is Relationship Between Management Commitment and
Employees’ Occupational Safety Awareness.
The hypothesis was designed to test the significance of the relationship between the
Management Commitment toward Employees’ Occupational Safety Awareness.
The hypotheses to be tested are:
H0 : There is no relationship between the Management Commitment and
Employees’ Occupational Safety Awareness.
HA : There is a relationship between the Management Commitment and
Employees’ Occupational Safety Awareness.
Table 4.20 answers the question in hypothesis five where the results show r = 0.579
(with p = 0.000) in DEP1. As p-value was smaller than 0.05 there is significant
influence between management commitments and occupational safety awareness. This
means that the level of employees’ safety awareness was influenced by management
commitment. Thus, H0’s statement can be rejected for DEP1.
Table 4.20 answers the other question in hypothesis five where the results show
r = 0.443 (with p = 0.000) in DEP2. As p-value was smaller than 0.05 there is
significant influence between management commitments and occupational safety
awareness. This means that the level of employees’ occupational safety awareness was
influenced by management commitment. Thus, H0’s statement can be rejected for
DEP2.

142
Hypothesis 6: There is Relationship Between Employees’ Participation and
Employees’ Occupational Safety Awareness
The hypothesis was designed to test the significant of relationship between the
Workers’ Participation towards Employees’ Safety Awareness.
The hypotheses to be tested are:
H0 : There is no relationship between the Employees’ Participation and
Employees’ Occupational Safety Awareness.
HA : There is a relationship between the Employees’ Participation and
Employees’ Occupational Safety Awareness.
Table 4.20 answers the question in hypothesis six where the results show r = 0.545
(with p = 0.000) in DEP1. As p-value was smaller than 0.05 there is significant
influence between employees’ participation and safety awareness. This means that the
level of employees’ occupational safety awareness was influenced by employees’
participation. Thus, the statement of H0 can be rejected for DEP1.
Table 4.20 answers the other question in hypothesis six where the results show
r = 0.409 (with p = 0.000) in DEP2. As p-value was smaller than 0.05 there is
significant influence between employees’ participation and occupational safety
awareness. This means that the level of employees’ occupational safety awareness was
influenced by employees’ participation. Thus, the statement of H0 can be rejected for
DEP2.
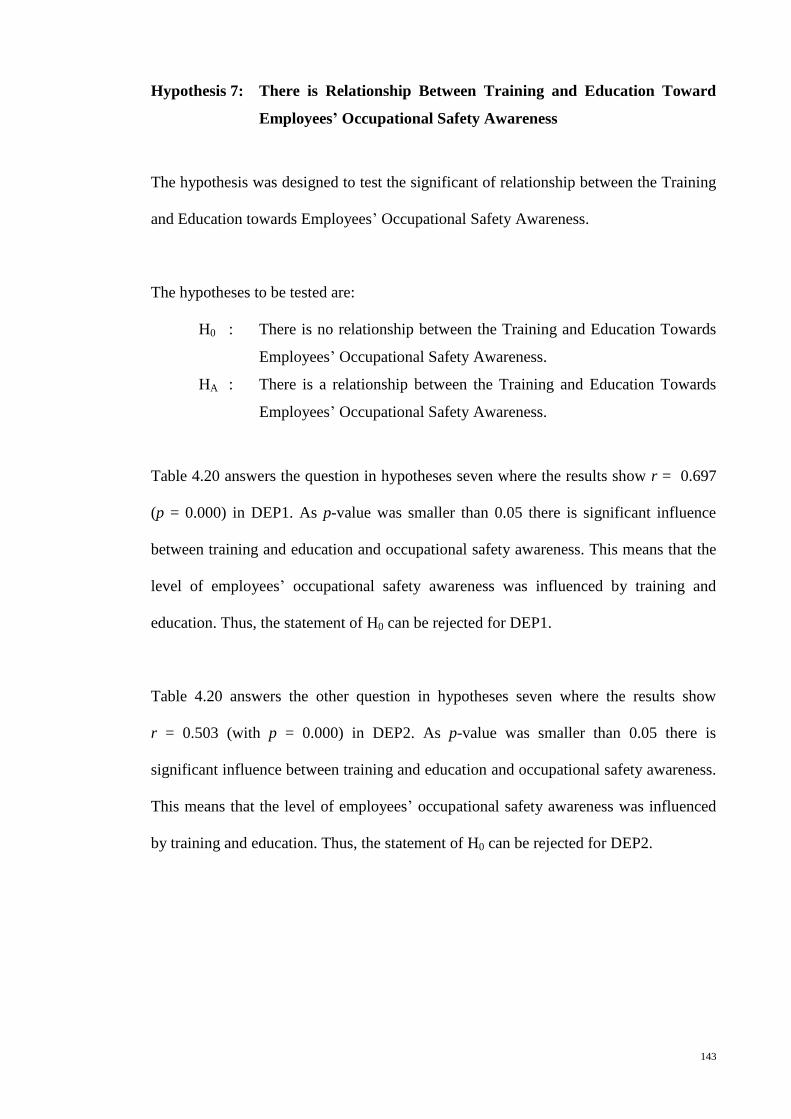
143
Hypothesis 7: There is Relationship Between Training and Education Toward
Employees’ Occupational Safety Awareness
The hypothesis was designed to test the significant of relationship between the Training
and Education towards Employees’ Occupational Safety Awareness.
The hypotheses to be tested are:
H0 : There is no relationship between the Training and Education Towards
Employees’ Occupational Safety Awareness.
HA : There is a relationship between the Training and Education Towards
Employees’ Occupational Safety Awareness.
Table 4.20 answers the question in hypotheses seven where the results show r = 0.697
(p = 0.000) in DEP1. As p-value was smaller than 0.05 there is significant influence
between training and education and occupational safety awareness. This means that the
level of employees’ occupational safety awareness was influenced by training and
education. Thus, the statement of H0 can be rejected for DEP1.
Table 4.20 answers the other question in hypotheses seven where the results show
r = 0.503 (with p = 0.000) in DEP2. As p-value was smaller than 0.05 there is
significant influence between training and education and occupational safety awareness.
This means that the level of employees’ occupational safety awareness was influenced
by training and education. Thus, the statement of H0 can be rejected for DEP2.

144
Hypothesis 8: There is Relationship between Communication and Employees’
Occupational Safety Awareness.
The hypothesis was designed to test the significant of relationship between the
Communication and Employees’ Occupational Safety Awareness.
The hypotheses to be tested are:
H0 : There is no relationship between the Communication and Employees’
Occupational Safety Awareness.
HA : There is a relationship between the Communication and Employees’
Occupational Safety Awareness.
Table 4.20 answers the question in hypotheses eight where the results show r = 0.725
(with p = 0.000) in DEP1. As p-value was smaller than 0.05 there is significant
influence between communications and occupational safety awareness. This means that
the level of employees’ occupational safety awareness was influenced by
communication. Thus, the statement of H0 can be rejected for DEP1.
Table 4.20 answers the other question in hypotheses eight where the results show
r = 0.666 (with p = 0.000 ) in DEP2. As p-value was smaller than 0.05 there is
significant influence between communications and occupational safety awareness. This
means that the level of employees’ occupational safety awareness was influenced by
communication. Thus, the statement of H0 can be rejected for DEP2.

145
In summary, the results indicated there were significant relationship between the tested
factors. The correlation coefficient, r, values were between 0.5 to.0.7. The p-value was
smaller than 0.05, in both departments. From Table 4.20, it was found that correlations
between the factors tested are statistically strong and balance in DEP1. Communication
has a high value, 0.725, followed by training and education with 0.697. The values, for
employee’s participation and management commitment are almost the same with 0.545
and 0.579, respectively. In DEP2, communication had a correlation coefficient of 0.666,
followed by training and education, with 0.503 and management commitment and
employee involvement with 0.443 and 0.409, respectively. Summaries of relationship
between the tested factors are shown in Figure 4.13. In terms of safety climate factors,
the results indicate that communication has the highest correlation, followed by training
and education, employee participation and management commitment as shown in
Table 4.20.
Figure 4.13: Correlation between Level of Occupational Safety and Health
Awareness and Safety Climate factors for DEP1 and DEP2.

146
4.4.4 Summary
Results of statistical analysis show that demographic data tested did not influence
respondents’ perception of safety awareness in DEP1 and DEP2, accept work
experience when the value of p is greater than 0.05. Work experience was found to
significantly influence the respondents’ perception of safety awareness in both
departments when the value of p is less than 0.05. Although DEP1 practiced safety
without the guidelines of OHSAS, there was no difference in the occupational safety
awareness compared with DEP2 whereas about 50% of the respondents from DEP1 had
more than 16 years experiences while DEP2 had only 30%. This is shown in test of
hypotheses and analyses of differences between groups. Knowledge and skill are
acquired through education, training and general exposure of the respondents. (Ismail,
2011) found length of experiences relates to skill and knowledge gained. This shows the
importance of work experience in finding employees perception of occupational safety
awareness at construction sites. While the correlation test results showed that all the
tested factors had significant correlations with safety awareness with different values of
r as shown in Figure 4.13; and communication to be found the highest factor corelated
with safety awareness in the both departments.

147
4.5 Regression Analysis
Regression analyses were carried out to find the most significant factors that influence
Occupational Safety Awareness. This section focuses on the regression analysis that
leads to safety climate. The section is divided into eight sub-sections including
introduction. The second sub-section presents a model summary of the models for
regression analysis. In sub-section three, linearity tests are discussed. In the fourth sub-
section, coefficient factors are explained. In sub-section five, regression model
validation are presented and explained. In sub-section six, hypotheses tests about the
population regression line are discussed. The subsection ends with a discussion.
4.5.1 Regression Analysis - Model Summary for DEP1 and DEP2
One of the first steps to take when running a regression model is to look at how well the
model fits (Sweet, 1999). A summary of the models in Table 4.21 indicates R = 0.751
and R = 0.666 for DEP1 and DEP2, respectively, as the correlation coefficient between
the predictor factors combined and the dependent factor based on the regression model.
A value of 1 means that the dependent variables can be perfectly predicted from the
independent variables. A value close to 0 means that the independent variables are not
linearly related to the dependent variable (Norusis, 2007). The values are quite large,
indicating that the model fits and the linear regression models can be predicted from
independent variables.

148
Table 4.21: Model Summary for DEP1 and DEP2
Model R R-Square Adjusted
R-Square
Std. Error
of the Estimate
DEP1 0.751 0.564 0.553 0.4789
DEP2 0.666 0.443 0.436 0.3314
Dependent Factor: Level of OSH Awareness
R-square is the proportion of the variability in the dependent factor which is taken into
account by the regression model. Table 4.21 shows that data analysis results using
SPSS, which are R-square = 0.564 for DEP1 and R-square = 0.443 for DEP2, indicate
that all the four factors are identified to be significant for OSH awareness in both DEP1
and DEP2. The factors are communication, employees’ participation, training and
education and management commitment. The results indicate that about 56% of the
variability of OSH awareness in both DEP1 and DEP2 are explained by factors
mentioned. The values are quite high and indicating only the remainder of about 44% is
not explained. Therefore, it can be concluded that communication, employees’
participation, training and education and management commitment influence OSH
awareness in DEP1 and DEP2.
Adjusted R-square is a better reflection of the proportion of variability explained by the
regression model than R-square (Montgomery, et al., 2001). In this case, from Table
4.21, there are no significant difference on the values of “R-square” and “Adjusted R-
square” for both models.

149
4.5.2 Regression Analysis-Linearity Test ( ANOVA ) for DEP1 and DEP2
The purpose of analyzing the Variance (ANOVA) is to find the relationship between the
predictor and the dependent factors. The results show that F statistic is significant at
p < 0.005 and it can be concluded that R-square is significantly different from zero. This
means that there is a linear relationship between the predictor and the dependent factor
in the models (Foster, 2001).
Scatter plots of Regression Standardized Predicted Value against Regression
Standardized Residual for DEP1 and DEP2 are shown in Figure 4.14 and Figure 4.15.
Level of Awareness (LoA) is the dependent variable. Both plots show evidence that the
relationship between the dependent and independent factors were also linear.
Figure 4.14: Scatter Plot of Regression Standardized Predicted Value Against
Regression Standardized Residual for DEP1
-4 -3 -2 -1 0 1 2 3
Regression Standardized Residual
-4
-3
-2
-1
0
1
2
3
Re
gre
ss
ion
Sta
nd
ard
ize
d P
red
icte
d V
alu
e
Dependent Variable: MSOSH1
Scatterplot
LoA
LoA
Dependent Variable: LoA

150
Figure 4.15: Scatter Plot of Regression Standardized Predicted Value against
Regression Standardized Residual for DEP2
* The factors are scattered without showing any pattern giving evidence that the
dependent and independent factors are linear (Foster, 2001).
-3 -2 -1 0 1 2 3
Regression Standardized Residual
-4
-2
0
2
4
Reg
ressio
n S
tan
dard
ized
Pre
dic
ted
Valu
e
Dependent Variable: MSOSH2
Scatterplot
Dependent Variable: LoA

151
4.5.3 Regression Analysis - Coefficient Factor for DEP1 and DEP2
Table 4.22 depicts the predictor factors and some statistics associated with each one. B
is the regression coefficient for the factor. The importance of the predictor factors are
shown by Beta. t values and the probabilities, Sig, indicate whether the regression
coefficient for each factor is greater than zero. The results show that the t values for all
the predictor factors considered are significant at p < 0.05. Therefore, it can be
concluded that the predictor factors predict OSH awareness in DEP1 and DEP2.
4.5.3.1 Regression Equation (DEP1 and DEP2)
From Table 4.22, the regression equation for DEP1 is found to be:
From Table 4.23, the regression equation for DEP2 is found to be :
The coefficient variables imply that the predicted OSH awareness increases by the
associated coefficient for a change of 1 of the Likert scale of the indicated variable.
With reference to Beta, communication is in the first rank in both models. It
contributed about 51% to 77% of OSH LoA for both offices. This indicates that
communication is the most important factor influencing Occupational Safety and Health
Awareness at construction sites. This analysis highlighted the important variables for
the model; the variables with little or no influence will not appear in the model
equation.
152
4.5.3.2 Accuracy of the Equations for DEP1 and DEP2
The immediate task is testing the accuracy of equations obtained from the regression
analysis. This study that involves Likert-scales of 1 to 5 were used as measurement
tools, therefore all the five ranges are tested in order to evaluate the accuracy of the
model equation. Evaluation of Likert-scales 1 and 5 are shown here, the rest of the
evaluations are shown in Appendix P. The coefficient variables imply that the predicted
occupational safety awareness increases by the associated coefficient for a change of 1
of the Likert scale of the indicated variable. For example, if the value of communication
in DEP1 model changed from 1 to 2, the value of safety awareness will change from
0.510 to 1.02 on the Likert scale. Based on this, assumptions are made to test the
equation as given below.
Prediction values on occupational safety awareness for minimum (1) Likert scale:
DEP1: The assumed value of 1 on the Likert scale for occupational safety
awareness and significant factors in the model gives a total value of
0.836, thus a 0.164 deviation from the assumption.
DEP2: The assumed value of 1 on the Likert scale for occupational safety
awareness and significant factors in the model gives a total value of
0.770, thus a 0.23 deviation from assumption.
Prediction values on occupational safety awareness for maximum (5) Likert scale:
DEP1: The assumed value of 5 on the Likert scalefor occupational safety
awareness and significant factors in the model gives a total value of 4.22,
thus a 0.82 deviation from the assumption.
DEP2: The assumed value of 5 on the Likert scale for occupational safety
awareness and significant factors in the model gives a total value of 3.85,
thus a 1.15 deviation from assumption.

153
The average percentages of the deviation are:
DEP1 = 16 % less than assumption
DEP2 = 23 % less than assumption.
Since the accuracy of both equations is about 80%, statistically both models can be used
to predict occupational safety awareness (Norusis, 1999b). It was noted that in
manufacturing and construction industries design, design efficiency values of less than
50% were generally considered to indicate potential for rationalization (Corbett et al.,
1991). The above models offer consistency accuracy values and therefore offer good
prediction on occupational safety and health awareness.
4.5.4 Hypotheses Tests on the Population Regression Line.
Hypotheses test is done for the population regression line to determine if there is strong
evidence to support the existing of linear relationship between dependent and
independent variables. Regression models of DEP1 and DEP2 statistically predict
Occupational Safety and Health awareness in technical department. Did the model
reflect the population regression line?
The population regression line is the line that describes the relationship between the
dependent variables and independent variables in the population (Norusis, 1999b). It is
equivalent to test the null hypotheses that the population regression line slope is zero
(Norusis, 2007).
H0 : The population slope is zero
H1 : The population slope is not zero

154
Table 4.22 shows the sample slopes for communication and training and education are
4.0 and 3.0 for DEP1, respectively (e.g. for communication factor its standard error is
0.135, so the value for t statistic is 0.510/0.135 which is 4.0 in DEP1). It can be seen
that the sample slopes are above the hypothesized of zero, therefore, we can reject the
null hypothesis. There appears to be a linear relationship between communication and
training and education and Occupational Safety and Health Awareness in DEP1.
Table 4.22: Coefficient Factor for DEP1
Coefficients(a)
Model
Unstandardized
Coefficients
Standardized
Coefficients t
Sig.
95% Confidence Interval
for B
B
Std.
Error Beta
Lower
Bound
Upper
Bound
DEP1
(Constant)
0.588
0.291
2.084
.040
.144
.982
MSCOMM
.510
.135
.465
3.788
.000 .242
.779
MSTE
.326
.123
.325
2.648
.010
.132
.526
Dependent Variable: LoA1
Table 4.23 : Coefficient Factor for DEP2
Coefficientsa
Model
Unstandardized
Coefficients
Standardized
Coefficients
t Sig.
95% Confidence Interval for
B
B Std. Error Beta
Lower
Bound
Upper
Bound
DEP2
(Constant)
1.016
.361
2.815
.006
.297 1.734
MSCOMM2 .770 .097 .666 7.932 .000 .577 .963
a. Dependent Variable: LoA2

155
Table 4.23 shows the sample slopes for communication is 8.0 for DEP2 (e.g. for
communication factor its standard error is 0.097, so the value for t statistic is
0.770/0.097 which is 8.0 in DEP2). It can be seen that the sample slopes are above the
hypothesized of zero, therefore, the null hypothesis can be rejected. There appears to be
a linear relationship between Communication and Occupational Safety and Health
Awareness in DEP2.
4.5.5 Summary
The regression analysis can predict the importance of each factor in the equation. It can
also assist in manipulating the factors in determining occupational safety awareness as
the relative advantages of one factor over another may be clearly defined in work
design. The occupational safety awareness equation described in section 4.3 is intended
to provide an insight into how occupational safety awareness can be determined by
manipulating various factors. The model highlights that the most significant factors in
both departments is communication with R-square = 0.526 for DEP1 and
R-square = 0.443 for DEP2. Training and Education appears only in DEP1 model
reflecting the importance of Training and Education in the organization.
Effective communication is very important to ensure the success of a program or task
performed. Through effective communication process, a procedure, work instructions,
rules, announcements can be reached to the target group successfully. When all of these
delivery systems can be properly received by then all the instructions, assignments, etc.
are implemented properly. Safety climate measures can find the root causes of OSH
problems. Safety climate in construction has been measured through surveys. A four-
factor structure has shown the validity and consistency of the components used in the
model by Glendon (2001) and Siu et al. (2004).

156
4.6 Validation of the Models
This section will discuss the validation of the model obtained. This process is important
to ensure that the model was validated and reliable. The significant factors found in the
regression analysis above are then tested for other departments. Two different
departments are chosen. The first sample is Public Work Department (PWD), a
technical department with similar type of work (construction site supervision). The
second department is Fire and Rescue Department (FRDM), more related to rescue
work. The tested departments were addressed as DEP3 and DEP4. Letters were sent to
the both Director General of the departments seeking theirs approvals (see Appendix Q
and Appendix R). After being briefed by the researcher, approval was given. Once the
approval was given, researcher distributed the questionnaires to all respondents. In this
section, the validation process is divided into five sub-sections including the
introduction in the first sub-section. The survey results for DEP3 and DEP4 are shown
in sub-section two. Statistical analysis and regression analysis were carried-out in sub-
sections three and four. The section ends with a discussion.
4.6.1 Survey Results for DEP3 and DEP4
To enable the reader to fully understand the validation process, the results of a study
conducted in DEP3 and DEP4 are accordingly presented.
4.6.1.1 Demographic Characteristic Data for DEP3 and DEP4
There were 210 respondents who participated as the sample in this validation survey
(104 in DEP3 and 106 in DEP4). They were selected based on the different categories
of position, academic background, ages and working experiences. The demographic
information of the samples is shown below.

157
4.6.1.1.1 Respondent’s Position for DEP3 and DEP4
Six per cent of the respondents were manager’s grade J41 to J52 in DEP3 and four per
cent in DEP4. For assistant engineer grade J29 to J38, there were thirteen per cent in
DEP3 and seventeen per cent in DEP4. Eighty two per cent of technicians grade J17 to
J26 in DEP3 while seventy nine per cent in DEP4. As it can be seen technicians formed
the biggest group in both departments who took part in the survey. Detailed information
is given in Table 4.24, Table 4.25, Figure 4.16, and Figure 4.17.
Table 4.24: Designation in DEP3
DEP3 Frequency ( % ) Valid Percent
Cumulative
Percent
Valid
Engineer
(J41-J52 ) 6 (5.8) 5.8 5.8
Assistant
Engineer
(J29 - J38 )
13 (12.5) 12.5 18.3
Technician
(J17 - J26 ) 85 (81.7) 81.7 100.0
Total 104 (100.0) 100.0
Figure 4.16: Designation in DEP3

158
Table 4.25: Designation in DEP4
DEP4 Frequency ( % ) Valid Percent
Cumulative
Percent
Valid Engineer
(J41-J52 ) 4 (3.8) 3.8 3.8
Assistant
Engineer
(J29 - J38 )
18 (17) 17 20.8
Technician
(J17 - J26 ) 84 (79.2) 79.2 100.0
Total 106 (100.0) 100.0
Figure 4.17: Designation in DEP4

159
4.6.1.1.2 Education Level for DEP3 and DEP4
The respondents were from different academic backgrounds. Table 4.26 shows about
thirty per cent with SPM and below. Twenty per cent of them hold technical certificates;
about forty one per cent were diploma holders and nine per cent were degree holders.
For master’s level and above, there were none of them in DEP3. Table 4.27 shows that
the number of respondents with SPM and below was sixty eight per cent. Eight per cent
of them possessed technical certificates. Twenty per cent were diploma holders and the
balance of five per cent had degrees in DEP4. In terms of educational level, it seems
fairly balanced proportions between groups except degree holders and above in DEP3.
In DEP4 it was found that more than half of them had passed the SPM compared with
other groups. Detailed information is given in Table 4.26, Figure 4.18, Table 4.27 and
Figure 4.19.

160
Table 4.26: Education Level in DEP3
DEP3 Frequency ( % ) Valid Percent Cumulative Percent
Valid SPM -
below 31 (29.8) 29.8 29.8
Technical
certificate 21 (20.2) 20.2 50
Diploma 43 (41.3) 41.3 91.3
Degree 9 (8.7) 8.7 100
Total 104 (100.0) 100.0
Figure 4.18: Education Level in DEP3

161
Table 4.27: Education Level in DEP4
DEP4 Frequency ( % ) Valid Percent Cumulative Percent
Valid SPM –
below 72 (67.9) 67.9 67.9
Technical
certificate 8 (7.5) 7.5 75.4
Diploma 21 (19.8) 19.8 95.2
Degree 5 (4.8) 4.8 100.0
Total 106 (100.0) 100.0
Figure 4.19: Education Level in DEP4

162
4.6.1.1.3 Age of Respondents for DEP3 and DEP4
In terms of age, the respondents were segregated into four age groups. First group
covered the respondents` between the ages of 20 to 29 years old, which was thirty one
per cent in DEP3 and thirty seven per cent in DEP4. The second group were between
the ages of 30 to 39 years old, which was twenty three per cent in DEP3 and forty three
per cent in DEP4. In the third group were the respondents between the ages of 40 to 49
years old, with nine per cent in DEP3 and fifteen per cent in DEP4. Finally, thirty eight
per cent and five per cent of the respondents came from the group aged more than 50
years old in DEP3 and DEP4. In general, the proportion of the age groups was quite
balanced in DEP3 while in DEP4 it seemed to consist of young people under the ages of
40 years, representing seventy percent of the total percentages. Detailed information is
given in Table 4.28, Figure 4.20, Table 4.29 and Figure 4.21.

163
Table 4.28: Age in DEP3
DEP3 Frequency ( % ) Valid Percent Cumulative Percent
Valid 20-29 32 (30.8) 30.8 30.8
30-39 24 (23.1) 23.1 53.9
40-49 9 (8.7) 8.7 62.6
50-above 39 (37.5) 37.5 100
. 100.0
Total 104 (100.0) 100.0
Figure 4.20: Age in DEP3

164
Table 4.29: Age in DEP4
DEP4 Frequency ( % ) Valid Percent Cumulative Percent
Valid 20-29 39 (36.8) 36.8 36.8
30-39 46 (43.4) 43.4 80.2
40-49 16 (15.1) 15.1 95.3
50-above
5 (4.7) 4.7 100.0
Total 106 (100.0) 100.0
Figure 4.21: Age in DEP4

165
4.6.1.1.4 Respondent’s Working Experience for DEP3 and DEP4
Another variable of personal profile in question was the respondents working
experience. In this section, the respondents were segregated into four groups; the first
group was for employees who worked less than five years and the percentage of
respondents was twenty two per cent in DEP3 and twenty six per cent in DEP4. The
second group with 6 to 10 years of working experience, covered twenty nine per cent in
DEP3 and thirty six per cent of respondents in DEP4.The third group with 11 to 15
years of experience, formed three per cent in DEP3 and seventeen per cent in DEP4.
The last group had respondents who worked for more than 16 years and formed forty
six per cent in DEP3 and made up twenty two per cent of the respondents in DEP4.
In terms of work experience, it was found that respondents in DEP3 were experienced
workers while respondents in DEP4 were those who lacked experience. These estimates
are taken based on the work term. Detailed information is given in Table 4.30, Figure
4.22, Table 4.31 and Figure 4.23.

166
Table 4.30: Working Experience in DEP3
DEP3 Frequency ( % ) Valid Percent Cumulative Percent
Valid 5 - below 23 (22.1) 22.1 22.1
6-10 30 (28.8) 28.8 50.9
11-15 3 (2.9) 2.9 53.8
16-above 48 (46.2) 46.2 100
.
Total 104 (100.0) 100.0
Figure 4.22: Work Experience in DEP3

167
Table 4.31: Working Experience in DEP4
DEP4 Frequency ( % ) Valid Percent Cumulative Percent
Valid 5 – below 27 (25.5) 25.5 25.5
6-10 38 (35.8) 35.8 61.3
11-15 18 (17) 17 78.3
16-above
23 (21.7) 21.7 100
Total 106 (100.0) 100.0
Figure 4.23: Work Experience in DEP4

168
4.6.1.2 Safety Climate Factors
The safety climate factors are the independent variables in this study. It includes
management commitment, employee participation, training and education, and
communication. Each of these variables will be shown and discussed in the following
subsections.
4.6.1.2.1 Management Commitment for DEP3 and DEP4
From Figure 4.24, about 48% of respondents in both DEP3 and DEP4 had chosen a
Likert-scale 4 for management commitment and about 8% in DEP3 and 14% in DEP4
had chosen a Likert scale 5. For Likert scale 3 about 29% were obtained in DEP3 and
25% in DEP4. There were about 2%-14% of respondents in both departments who had
chosen Likert Scale 1 and Likert Scale 2.
The overall results showed that about 56% in DEP3 and 62% in DEP4 agreed with the
statement given. This indicates that they are ‘moderately satisfied to satisfied’ with their
employers.
Figure 4.24: Management Commitment in DEP3 and DEP4

169
4.6.1.2.2 Employees’ Participation for DEP3 and DEP4
From Figure 4.25, the responses indicate that, about 53% of the respondents from DEP3
and DEP4 had chosen a Likert scale 4 for employees` participation. About 14% in
DEP3 and 15% in DEP4 had chosen Likert scale 5. Likert scale 3 was chosen by about
24% in both departments had chosen. About less than 10% of the respondents in both
departments had chosen Likert scale 1 and Likert scale 2. The overall results showed
that about 67% of respondents in both departments agreed with the statement given.
This shows that they are ‘moderately satisfied’ to ‘satisfied’ with their participation in
the department.
Figure 4.25: Employees’ Participation in DEP3 and DEP4

170
4.6.1.2.3 Training and Education for DEP3 and DEP4
From Figure 4.26, about 44% of the respondents from DEP3 and 58% of respondents
from DEP4 had chosen Likert scale 4 for training and education. Likert scale 5, was
chosen by about 7% of the respondents in DEP3 and 17% of the respondents in DEP4 .
About 33% of respondents in DEP3 and 21% of respondents in DEP4 had chosen Likert
scale 3. Less than 10% chose Likert scale 1, 2 and 3. The overall results showed that
about 51% in DEP3 and 75% in DEP4 agreed with the statement given. Generally, this
shows that they are ‘moderately satisfied to satisfied’, with the training and education
programs in their department.
Figure 4.26: Training and Education in DEP3 and DEP4

171
4.6.1.2.4 Communication for DEP3 and DEP4
From Figure 4.27, the responses indicated that, about 48% of the respondents from
DEP3 and 57% in DEP4 had chosen a Likert scale 4 for communication in the
department. About 9% in DEP3 and 12% in DEP4 of the respondents had chosen Likert
scale 5. For Likert scale 3, about 34% in DEP3 and 25% in DEP4. Likert scale 1 and 2
was chosen by less than 10% of the respondents. The overall results showed about 57%
in DEP3 and 69% in DEP4 agreed with the statement given. This shows that they are
‘moderately satisfied’ to ‘satisfied’, with communications in the department.
Figure 4.27: Communication in DEP3 and DEP4

172
4.6.1.3 Level of Awareness of Occupational Safety and Health
The data obtained were processed using descriptive analysis method comprising the
table of mean score, standard deviation and the percentage. This analysis was used to
explain the demographics of respondents to the questions that have options. Table 4.32
(a, b, c, d and e) shows the data collected to measure the occupational safety awareness
for DEP3 and DEP4.
Table 4.32(a): LoA of Occupational Safety and Health in DEP3 and DEP4 -
Orientation
SD D M A SA MS/S
D
40 I feel safe at workplace.
DEP3
(f) 0
% 0
1
1.0
18
17.3
71
68.3
14
13.5
3.94
0.588
DEP4
(f) 1
% 1.0
1
1.0
19
17.9
63
59.4
22
20.7
3.98
0.717
41 My organization takes all OSH measure to
ensure employees safety.
DEP3
(f) 0
% 0
2
1.9
25
24.0
60
57.7
17
16.3
3.88
0.687
DEP4
(f) 1
% 1.0
2
1.8
16
15.1
64
60.3
23
21.7
4.00
0.730
42 My organization has Occupational Safety and
Health policy.
DEP3
(f) 0
% 0
6
5.8
37
35.6
49
47.1
12
11.5
3.64
0.762
DEP4
(f) 1
% 1.0
4
3.8
17
16.0
65
61.3
19
17.9
3.92
0.757
About 85 (81.8%) and 85 (80.1%) respondents in DEP3 and DEP4 felt safe at the work
site. Their responses indicated that, about 77 (74%) in DEP3 and 87 (82%) respondents
in DEP4 agreed that their organization had taken all Occupational Safety and Health
measurements to ensure employees safety. About 61 (58.6%) respondents in DEP3 and
84 (79.2%) respondents in DEP4 agreed that their organization had the safety policies.
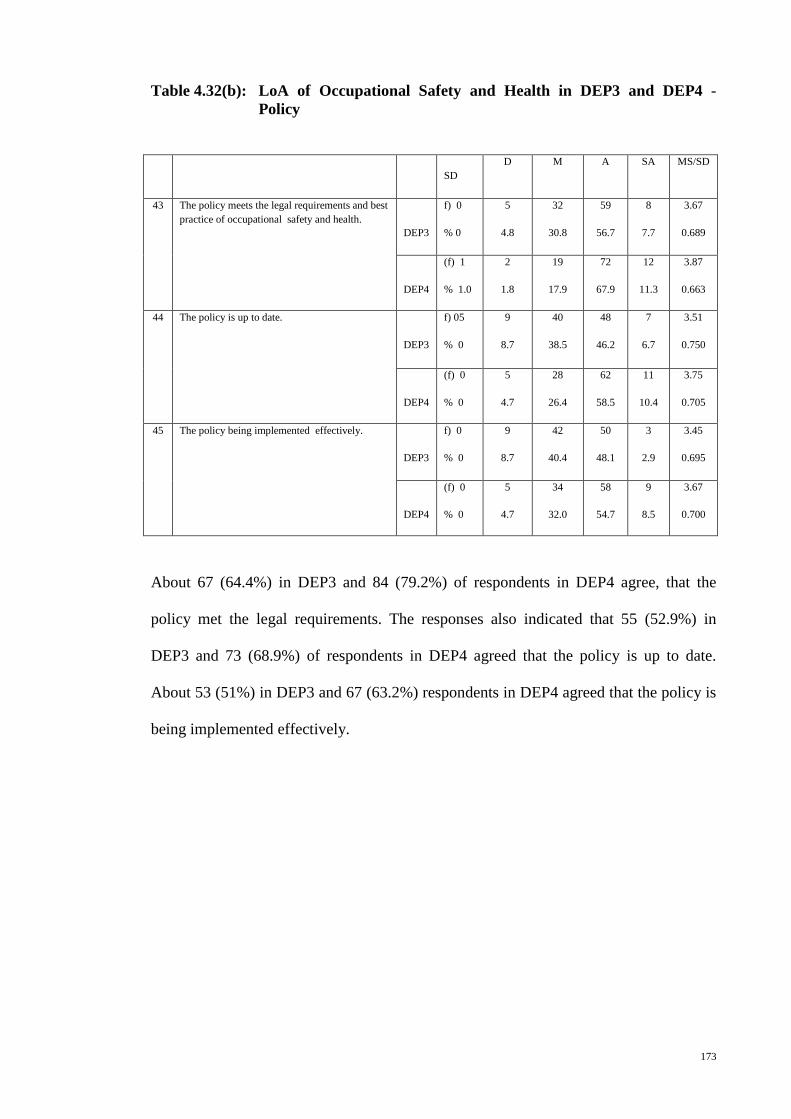
173
Table 4.32(b): LoA of Occupational Safety and Health in DEP3 and DEP4 -
Policy
SD
D M A SA MS/SD
43 The policy meets the legal requirements and best
practice of occupational safety and health.
DEP3
f) 0
% 0
5
4.8
32
30.8
59
56.7
8
7.7
3.67
0.689
DEP4
(f) 1
% 1.0
2
1.8
19
17.9
72
67.9
12
11.3
3.87
0.663
44 The policy is up to date.
DEP3
f) 05
% 0
9
8.7
40
38.5
48
46.2
7
6.7
3.51
0.750
DEP4
(f) 0
% 0
5
4.7
28
26.4
62
58.5
11
10.4
3.75
0.705
45 The policy being implemented effectively.
DEP3
f) 0
% 0
9
8.7
42
40.4
50
48.1
3
2.9
3.45
0.695
DEP4
(f) 0
% 0
5
4.7
34
32.0
58
54.7
9
8.5
3.67
0.700
About 67 (64.4%) in DEP3 and 84 (79.2%) of respondents in DEP4 agree, that the
policy met the legal requirements. The responses also indicated that 55 (52.9%) in
DEP3 and 73 (68.9%) of respondents in DEP4 agreed that the policy is up to date.
About 53 (51%) in DEP3 and 67 (63.2%) respondents in DEP4 agreed that the policy is
being implemented effectively.

174
Table 4.32(c): LoA of Occupational Safety and Health in DEP3 and DEP4 -
Monitoring
SD
D M A SA MS/S
D
46 My organization provides safety and health
information to employees.
DEP3
f) 0
% 0
9
8.7
41
39.4
47
45.2
7
6.7
3.50
0.750
DEP4
(f) 0
% 0
3
2.8
32
30.2
62
58.5
9
8.5
3.73
0.655
47 My organization has a safety and health
committee.
DEP3
(f) 2
% 1.9
14
13.5
40
38.5
41
39.4
7
6.7
3.36
0.869
DEP4
(f) 0
% 0
9
8.5
24
22.6
65
61.3
8
7.5
3.68
0.737
48 My organization sets safety and health
objectives on the organizational level.
DEP3
f) 1
% 1.0
15
14.4
33
31.7
49
47.1
6
5.8
3.42
0.844
DEP4
(f) 0
% 0
4
3.8
22
20.7
70
66.0
10
9.4
3.81
0.649
49 My organizational sets safety and health
objectives on the individual levels.
DEP3
f) 1
% 1.0
13
12.5
39
37.5
47
45.2
4
3.8
3.38
0.792
DEP4
(f) 0
% 0
5
4.7
30
28.3
57
53.8
14
13.2
3.75
0.741
About 42 (50.6%) in DEP3 and 58 (71.6%) of respondents in DEP4 agreed that their
organization provided safety and health information to them. Their responses also
indicated 42 (50.6%) and 65 (80.3%) of respondents in DEP3 and DEP4 agreed that
their organization had a safety and health committee. About 42 (50.6%) and 65 (80.3%)
of respondents in DEP3 and DEP4 agreed that their organization had set safety and
health objectives on an organization level. About 36 (43.2%) 51 (63%) of respondents
in DEP3 and DEP4 agreed that their organization had set a safety and health objectives
on an individual level.

175
Table 4.32(d): LoA of Occupational Safety and Health in DEP3 and DEP4 -
Risk Assessment
SD D M A SA MS/SD
50 The workplace risk assessment are being carried
out.
DEP3
f) 1
% 1.0
9
8.7
44
42.3
43
41.3
7
6.7
3.44
0.786
DEP4
(f) 2
% 1.8
2
1.8
27
25.5
65
61.3
10
9.4
3.75
0.731
51 The systems are in placed to ensure risk
assessments are reviewed when appropriate.
DEP3
f) 1
% 1.0
9
8.7
30
28.8
59
56.7
5
4.8
3.56
0.761
DEP4
(f) 0
% 0
5
4.7
29
27.3
61
57.5
11
10.4
3.74
0.708
52 OSH inspection are being carried out.
DEP3
f) 1
% 1.0
13
12.5
33
31.7
48
46.2
9
8.7
3.49
0.859
DEP4
(f) 0
% 0
3
2.8
28
26.4
58
54.7
17
16.0
3.84
0.719
53 My organization has a system for reporting
accidents.
DEP3
f) 0
% 0
13
12.5
50
48.1
36
34.6
5
4.8
3.32
0.754
DEP4
(f) 0
% 0
4
3.8
29
27.3
55
51.9
18
17.0
3.82
0.753
54 My organization has an audit system in place
DEP3
f) 1
% 1.0
8
7.7
27
26.0
50
48.1
18
17.3
3.73
0.873
DEP4
(f) 0
% 0
3
2.8
17
16.0
59
55.6
27
25.5
4.04
0.729
About 28 (33.7%) and 47 (58%) of respondents in DEP3 and DEP4 agreed that their
organization had carried-out workplace risk assessments. About 40 (48.2%) and 55
(67.9%) of respondents in DEP3 and DEP4 agreed that the systems were in place to
ensure risk assessment and were reviewed when appropriate. About 34 (41%) and 57
(70.4%) of respondents in DEP3 and DEP4 agreed that OSH inspection was being
carried-out.

176
About 29 (34.9%) and 55 (67.9%) of respondents in DEP3 and DEP4 agreed that the
organization had an accident reporting system. About 50 (60.3%) and 64 (79%) of
respondents in DEP3 and DEP4 agreed that the organization had an audit system in
place.
Table 4.32(e): LoA of Occupational Safety and Health in DEP3 and DEP4 -
Review
SD D M A SA MS/SD
55 My organization has procedure for safety and
health
DEP3
(f) 0
% 0
8
7.7
41
39.4
48
46.2
7
6.7
3.52
0.737
DEP4
(f) 0
% 0
3
2.8
21
19.8
63
59.4
19
17.9
3.92
0.700
56 My organization reviews safety and health
implementation.
DEP3
f) 0
% 0
11
10.6
43
41.3
46
44.2
4
3.8
3.41
0.732
DEP4
(f) 0
% 0
3
2.8
27
25.5
60
56.6
16
15.1
3.84
0.706
About 45 (54.2%) and 65 (80.3%) of respondents in DEP3 and DEP4 agreed that the
organization had the procedure for safety and health. About 37 (44.5%) and 61 (75.3%)
of respondents in DEP3 and DEP4 were satisfied with the organization for reviewing
safety and health implementations.

177
4.6.1.4 Overall LoA of Occupational Safety and Health
Table 4.33 shows that respondents in DEP3 provided answers that showed they had
high LoA of OSH with 3.83 compared to 3.54 given by respondents in DEP4 who
indicated they were at a moderate level. This may be influenced by a number of
demographic data and other factors which will be discussed later.
Table 4.33: Overall LoA of Occupational Safety and Health
MEAN SCORE
OVERALL LoA
of OSH
(MEAN SCORE)
ORIENTATION POLICY MONITORING RISK
ASSESSMENT
REVIEW
DEP3 3.97 3.76 3.74 3.84 3.88 3.83
(HIGH)
DEP4 3.82 3.54 3.42 3.51 3.47 3.54
(MODERATE)

178
4.6.2 Statistical Analysis for DEP3 and DEP4
The statistical analysis is required to identify the relationship between the variables
studied. Analysis was done including the reliability of the questionnaire, tested several
hypotheses of the study, identifying the differences between groups and identifying
correlations between the independent variables and the dependent variable. This is to
ensure that the studies done have high reliability and validity.
4.6.2.1 Reliability Measures for DEP3 and DEP4
In order to ensure high level of trustworthines of the research findings, the questionnaire
reliability was tested using Cronbach’s alpha, α. Cronbach’s alpha is derived from the
average correlation of all items on the scale (Rodeghier, 1996). The reliability measures
of the questionnaire on management commitment, employees’ participation, training
and education, communication and occupational safety performance, have been tested
as shown in Table 4.34.
The results indicate that the reliability was high for management commitment in both
departments with values from 0.656 to 0.701. As for employees’ participation the
results show that the reliability was high in both departments with values 0.738 to
0.752. Training and Education is considered high in reliability with values 0.918 and
0.916. The results also indicated that communication is considered high in reliability
with values 0.891 and 0.880. Finally, LoA of Occupational Safety and Health shows
high reliabilities for both departments with values 0.947 and 0.943. This means that the
higher the value of the coefficient obtained the more consistent will be the data set. A
mark below 0.70 is considered as lack of internal consistency (Chua, 2006; Nunnaly,
1978). This shows the reliability and validity of the questionnaire used in this study.
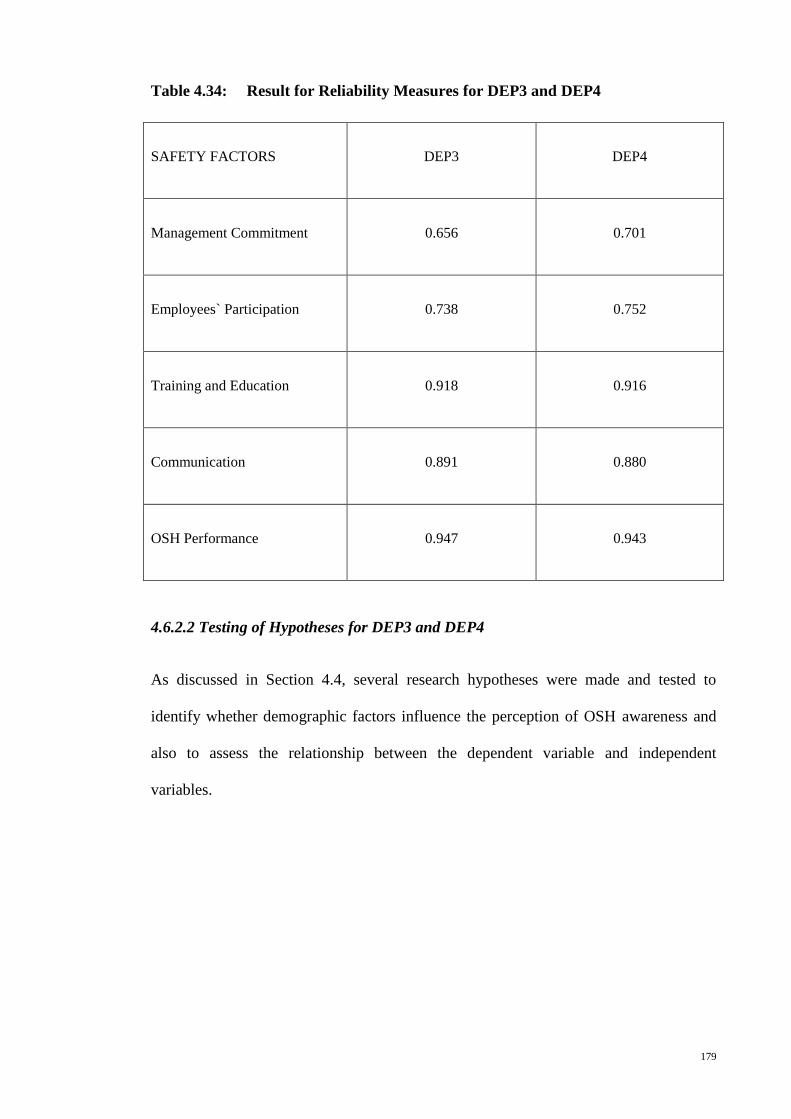
179
Table 4.34: Result for Reliability Measures for DEP3 and DEP4
SAFETY FACTORS
DEP3
DEP4
Management Commitment
0.656
0.701
Employees` Participation
0.738
0.752
Training and Education
0.918
0.916
Communication
0.891
0.880
OSH Performance
0.947
0.943
4.6.2.2 Testing of Hypotheses for DEP3 and DEP4
As discussed in Section 4.4, several research hypotheses were made and tested to
identify whether demographic factors influence the perception of OSH awareness and
also to assess the relationship between the dependent variable and independent
variables.

180
4.6.2.2.1 Analysis of Differences Between Groups
Hypothesis 9: There is difference of perception level on LoA of Occupational
Safety and Health based on their designation.
The hypothesis is designed to test whether the designation of employees affects their
perception toward occupational safety awareness.
One way ANOVA Tests was conducted and the test outputs were in Table 4.35.
Table 4.35: Result for the difference of employees` perception level on LoA of
Occupational Safety and Health based on their designation
ANOVA
LoA-DEP3 Sum of Squares Df Mean Square F Sig.(p)
Between Groups .400 2 .200 .628 .535
Within Groups 32.123 101 .318
Total 32.522 103
LoA-DEP4
Sum of Squares Df Mean Square F Sig.(p)
Between Groups Within Groups Total
.347 27.519 27.865
2 103 105
.173
.267
.648
.525
As shown in Table 4.35, the results indicate that there is no difference in perception
level on occupational safety and health awareness based on their designations as the
p-value is more than 0.05 in both departments. This means that employees’ designations
do not influence their differences on perception of the occupational safety awareness.

181
Hypothesis 10: There is difference of perception level on LoA of Occupational
Safety and Health based on their education background.
The hypothesis was designed to test whether the education background of employees
affects their perception toward Occupational Safety awareness.
One way ANOVA Tests were conducted and the test outputs were in Table 4.36.
Table 4.36: Result for the difference of employees’ perception level on LoA of
Occupational Safety and Healths, based on their education level.
ANOVA
LoA-DEP3
Sum of Squares Df Mean Square F Sig.(p)
Between Groups 2.007 3 .669 2.192 .094
Within Groups 30.516 100 .305
Total 32.522 103
LoA-DEP4
Sum of Squares Df Mean Square F Sig.(p)
Between Groups .873 3 .291 1.100 .353
Within Groups 26.992 102 .265
Total 27.865 105
As shown in Table 4.36, the results indicate that there is no difference in perception
level on occupational safety and health awareness based on their educational levels as
the p-value is more than 0.05 in both departments. This means that employees’
educational level does not influence their difference on perception of the occupational
safety awareness.

182
Hypothesis 11: There is difference of perception level on LoA of Occupational
Safety and Health based on their age.
The hypothesis was designed to test whether the age of employees affects their
perception toward occupational safety awareness.
One way ANOVA Tests were conducted and the test outputs are shown in Table 4.37.
Table 4.37: Result for the Difference of Employees’ Perception Level on LoA of
Occupational Safety and Health Based on Their Age
ANOVA
LoA-DEP3
Sum of Squares Df Mean Square F Sig.(p).
Between Groups 1.838 3 .613 1.997 .119
Within Groups 30.684 100 .307
Total 32.522 103
LoA-DEP4
Sum of Squares Df Mean Square F Sig.(p)
Between Groups .976 3 .325 1.235 .301
Within Groups 26.889 102 .264
Total 27.865 103
As shown in Table 4.37, the results indicate that there is no difference in perception
level on occupational safety and health awareness based on their age as the p-value is
more than 0.05 in both departments. This means that employees’ age does not influence
their difference on perception of the occupational safety awareness.

183
Hypothesis 12: There is difference of perception level on LoA of Occupational
Safetyand Health based on their work experience.
The hypothesis was designed to test whether the work experience of employees affects
their perception toward occupational safety awareness.
One way ANOVA Tests were conducted and the test outputs are shown in Table 4.38.
Table 4.38: Result for the Difference of Employees’ Perception Level on LoA of
Occupational Safety and Health Based on Their Work Experience
ANOVA
LoA-DEP3
Sum of Squares Df Mean Square F Sig. .(p)
Between Groups 1.902 3 .432 1.575 .044
Within Groups 30.621 100 .274
Total 32.522 103
LoA-DEP4
Sum of Squares Df Mean Square F Si.(p)
Between Groups 1.616 3 .368 1.577 .046
Within Groups 17.665 102 .233
Total 27.865 105
As shown in Table 4.38, the results indicate that there was difference perception level
on occupational safety awareness based on their work experiences as the p-value is less
than than 0.05 in both DEP3 and DEP4. This means that employees working experience
perfectly influences their differences of perception on occupational safety awareness in
DEP3 and DEP4.

184
4.6.2.2.2 Test of Correlations for DEP3 and DEP4
As discussed in section 4.4.3.2, Pearson, r, tests were conducted to analyze the
significance of relationship between management commitment, employees
participation, training and education and communication towards occupational safety
awarenesss. The four hypotheses to be tested are:
Hypothesis 13: There is Relationship between Management Commitment and
Employees’ Level of Awareness of Occupational Safety and Health
Hypothesis 14: There is Relationship between Employees’ Participation and
Employees’ Level of Awareness of Occupational Safety and Health
Hypotheses 15: There is Relationship between Training and Education Toward
Employees’ Level of Awareness of Occupational Safety and Health.
Hypotheses 16: There is Relationship between Communication and Employees’
Level of Awareness of Occupational Safety and Health.
The test outputs are given in Table 4.39. The test results will be discussed accordingly.
Table 4.39 answers the questions asked in all the hypotheses tested, where the results
show the correlation coefficient is significant at the 0.01 level ( 2-tailed ) in both DEP3
and DEP4. As p-value was smaller than 0.05 there is significant influence between
management commitment, employee participation, training and education and
communication on occupational safety awareness. This means that the level of
employees’ occupational safety awareness was influenced by all the factors tested.

185
Table 4.39: Correlation between LoA of Occupational Safety and Health and
Safety Climate factors for DEP3 and DEP4
Correlations
LoA3 LoA4
LoA Pearson
Correlation 1 1
Sig. (2-tailed) . .
N 104 106
MSMC Pearson
Correlation .469(**) .383(**)
Sig. (2-tailed) .000 .000
N 104 106
MSEP Pearson
Correlation .710(**) .525(**)
Sig. (2-tailed) .000 .000
N 104 106
MSTE Pearson
Correlation .754(**) .634(**)
Sig. (2-tailed) .000 .000
N 104 106
MSCOMM Pearson
Correlation .807(**) .673(**)
Sig. (2-tailed) .000 .000
N 104 106
** Correlation is significant at the 0.01 level (2-tailed).
4.6.2.3 Regression Analysis
Regression analyses were carried out to find the most significant factors that influence
LoA of Occupational Safety and Health.
4.6.2.3.1 Regression Analysis-Model Summary for DEP3 and DEP4
A summary of the models in Table 4.40 indicates R = 0.842 for DEP3 and R = 0.707 for
DEP4 as the correlation between the predictor factors combined and the dependent
factors. The values are quite large, indicating that the linear regression models can be
predicted from independent variables.

186
Table 4.40: Model Summary for DEP3 and DEP4
Model R R-Square Adjusted
R-Square
Std. Error of
the Estimate
DEP3 0.842 0.708 0.700 0.3079
DEP4 0.707 0.500 0.491 0.3676
Data analysis result using SPSS indicates that all the four factors identified are
significant for OSH awareness in both DEP3 and DEP4. The factors are
communication, employees’ participation, training and education and management
commitment which is R-Square = 0.708 in DEP3 and R-Square = 0.500 in DEP4 from
Table 4.40. The results indicate that about 70% in DEP3 and 50% in DEP4 of the
variability of OSH awareness are explained by factors mentioned. The values are quite
high and indicating only the remainder of about 30% to 50% is not explained.
Therefore, it can be concluded that communication, employees’ participation, training
and education and management commitment also influenced OSH awareness in DEP3
and DEP4.
Adjusted R-square is a better reflection of the proportion of variability explained by the
regression model than R-square (Montgomery, et al., 2001). In this case, from Table
4.40, there are no significant difference on the values of “R-square” and “Adjusted R-
square” for both models.

187
4.6.2.3.2 Regression Analysis-Linearity Test ( ANOVA) for DEP3 and DEP4
As mentioned before, the purpose of analysis of Variance (ANOVA) is to find whether
there is a linear relationship between the predictor and the dependent factors. The results
show that F statistic is significant at p < 0.005 and it can be concluded that R-Square is
significantly different from zero. This means that there is a linear relationship between
the predictor and the dependent factor in both models (Foster, 2001).
Scatter plots of Regression Standardized Predicted Value against Regression
Standardized Residual for DEP3 and DEP4 are shown in Figure 4.28 and Figure 4.29.
Occupational Safety Awareness is a dependent variable. Both plots show evidence that
the relationship between the dependent and independent factors were also linear.
Figure 4.28 : Scatter Plot of Regression Standardized Predicted Value against
Regression Standardized Residual for DEP3
-3 -2 -1 0 1 2 3
Regression Standardized Residual
-4
-2
0
2
4
Reg
ress
ion
Sta
ndar
dize
d P
redi
cted
Val
ue
Dependent Variable: MSOSH3
Scatterplot
Dependent Variable: LoA

188
Figure 4.29 : Scatter Plot of Regression Standardized Predicted Value against
Regression Standardized Residual for DEP4
* The factors are scattered without showing any pattern giving evidence that the
dependent and independent factors are linear (Foster, 2001).
-6 -4 -2 0 2 4
Regression Standardized Residual
-4
-2
0
2
Reg
ress
ion
Sta
nd
ard
ized
Pre
dic
ted
Val
ue
Dependent Variable: MSOSH4
Scatterplot
Dependent Variable: LoA

189
4.6.2.3.3 Regression Analysis - Coefficient Factor
Table 4.41 shows the coefficient factors for DEP3 and DEP4. t values and the
probabilities,Sig, indicate whether the regression coefficient for each factor is greater
than zero. The results show that the t values for all the predictor factors considered are
significant at p < 0.05. Therefore, it can be concluded that the predictor factors predict
OSH awareness in DEP3 and DEP4.
Table 4.41: Coefficient Factors for DEP3 and DEP4
Model Unstandardized Coefficients
Standardized
Coefficients T Sig.
B Std. Error Beta
DEP3 (Constant) -.108 .299
-.362 .718
MSCOMM3 .462 .111 .424 4.145 .000
MSTE3 .233 .075 .277 3.091 .003
MSEP3 .325 .118 .222 2.755 .007
DEP4 (Constant) .373 .364
1.025 .308
MSCOMM4 .597 .088 .547 6.803 .000
MSEP4 .327 .104 .252 3.131 .002
a Dependent Variable: MSOSH3 and MSOSH4
Therefore, from Table 4.41, the regression equation for DEP3 is found to be:
And the regression equation for DEP4 is found to be:

190
4.6.2.3.4 Accuracy of the Equations for DEP3 and DEP4
The accuracy of equations obtained from the regression analysis was tested to ensure
that the model is satisfactory to predict the safety awareness. As Likert-scales of 1 to 5
were used as measurement tools, therefore all the five ranges are tested in order to
evaluate the accuracy of the model equation. The evaluation of Likert-scales of 1 to 5 is
shown in Appendix S. The coefficient variables imply that the predicted occupational
safety awareness increases by the associated coefficient for a change of 1 of the
indicated variable. For example, if the value of communication in DEP3 model changed
from 1 to 2, the value of safety awareness will change from 0.462 to 0.924 on the Likert
scale. Based on this, assumptions are made to test the equation as shown in Appendix T.
As the results, the average percentage of deviation is:
DEP3 = 2% more than assumption
DEP4 = 8% less than assumption
The accuracy of equations for both models was more than 90%. Equation model for
DEP3 reflect significant factors for the construction department and also offers less and
consistent deviation from the assumption. Although, the equation model for DEP4 did
not reflect significant factors for supervising construction sites, it offers less and
consistent deviation from the assumption. Statistically, regression model for DEP3 and
DEP4 are thus satisfactory for predicting occupational safety awareness, therefore this
validates the previous models.

191
4.6.3 Hypotheses Tests About the Population Regression Line.
As discussed in 4.5.4, hypotheses test is done for the population regression line to
determine if there is strong evidence to support the existing of linear relationship
between dependent and independent variables in DEP3 and DEP4. As mentioned
before, the population regression line is the line that describes the relationship between
the dependent variables and independent variables in the population (Norusis, 1999b).
According to Norusis (2007), it is equivalent to test the null hypotheses that the
population regression line slope is zero.
Table 4.41 shows the coefficients for DEP3 and DEP4. It can be seen that in both
departments the sample slopes are above the hypothesized of zero, therefore the null
hypothesis again can be rejected. There appears to be a linear relationship between
communication, training and education and employee participation and LoA of
Occupational Safety and Health in DEP3 and DEP4.

192
4.7 Discussion
The discussion starts by assessing the findings of this study. A study has been carried-
out to validate the findings, the write up and result of the validation exercise as shown
in the middle of this chapter generally supports the findings of this study.
4.7.1 Objective No.1: Determination of Effects of Employee`s Demographic
Background on the Perception of Level of Awareness (LoA) on Ocupational
Safety and Health
Table 4.42: Significant Values, p, for All Models.
DEMOGRAPHIC
DATA
DEP1
(sig, p)
DEP2
(sig, p)
DEP3
(sig, p)
DEP4
(sig, p)
DESIGNATION 0.527 0.323 0.535 0.525
EDUCATION LEVEL 0.596 0.504 0.094 0.353
AGE 0.166 0.911 0.119 0.301
WORK EXPERIENCE 0.000 0.046 0.044 0.046
The results in Table 4.42, show a position held no influence perceptions of safety
awareness when available values of p > 0.05 in all departments studied. This means that
even if a person has a high level positions in the organization, it does not influence the
difference in perceptions of safety awareness than those at lower levels of employment.
For level of education, it was found that there were no significant difference in the
perception of safety awareness, which means that even if a person has a high level of
education it does not affect the perception of safety awareness shown by the value of
p > 0.05 in all departments studied.

193
While tests on age shows no significant difference on the perception of safety
awareness, although the older one, but it does not influence their perception of safety
awareness shown by the value of p > 0.05 in all departments tested. Work experience
was found to highly influence the perceptions of safety awareness with the value of
p < 0.05 in all departments tested. This means that a more experienced person gets
different perception of safety awareness. This is inline with the study by Yasin (2008),
who found the influence of being exposed to different types of safety and health
programs organized by the organization.

194
4.7.2 Objective No.2: Measuring the Level of Awareness on Occupational Safety
and Health of the Agencies.
To measure the level of safety awareness, there are two methods used, the first measures
directly the perception of the respondents and uses the questions in section three of the
questionnaire. The second method uses the equation obtained as a result of the analysis.
Table 4.43: Overall LoA of OSH
MEAN SCORE
OVERALL LoA
of OSH
(MEAN SCORE)
ORIENTATION POLICY MONITORING RISK
ASSESSMENT
REVIEW
DEP1 3.61 3.30 3.32 3.31 3.38 3.37
(MODERATE)
DEP2 3.98 3.81 3.88 3.77 3.95 3.86
( HIGH )
DEP3 3.97 3.76 3.74 3.84 3.88 3.83
(HIGH)
DEP4 3.82 3.54 3.42 3.51 3.47 3.54
(MODERATE)
The results in Table 4.43 derived through descriptive analysis made on the data
obtained from the survey that directly measures the safety awareness using the
questions in Section three of the set of survey questionnaires. Analysis was conducted
on the mean scores for orientation, policy, monitoring, risk assessment and a review of
all the factors mentioned.

195
The results showed that the overall safety awareness in DEP1 and DEP4 was found to
be in the moderate level while in DEP2 and DEP3 showed a high level. Safety
management procedures are in a systematic practice in DEP2 under OHSAS 18000. The
workers in DEP2 have applied formal safety practices and they were exposed to various
aspects of management and good practices in safety. This is supported from previous
studies that found that the high level of safety aspects among those who have heard the
safety terms and among those who have an understanding of safety practices (Bergh,
2011). Whereas in DEP3, arguably the majority of respondents are employees who have
more work experience. With extensive work experiences they easily understood the
intricacies of their jobs. Thus, they tend to give answers that led to a positive safety
culture. This is supported by the results of the study which showed that work experience
has a big influence on the respondents’ perceptions of their current safety awareness on
daily duties.
For respondents in DEP1, even if they do not adopt specific safety management systems
but they are made up of workers with long work experience. Therefore, work
experience, has helped them to carry out their duties in a more secure manner because
they understood the procedures for a good job. In terms of safety awareness they are at a
moderate level. While in DEP4, although respondents from the group are young people,
their nature of work always exposes them to occupational hazards which causes them to
be careful always when performing their duties. They are also always exposed to
systematic safety management system that is practiced in their department. However,
referring to the answers they had given, they are at a moderate level. This is consistent
with past studies that say people who had experienced dangerous situations, or
accidents, at work had a lower level of safety awareness compared to those who had not
experienced any of this (Milczarek, 2004).

196
When reviewing the job description, it was found that, DEP4’s workers experienced
more accidents or hazardous events compared to respondents in other departments.
Routine scope of work includes rescue work and fire-fighting which is always exposed
to occupational hazards. This could explain why the level of safety awareness in DEP4
is moderate.
Table 4.44: LoA of OSH using Equation (Model: all models)
MODEL EQUATION LoA of OSH
DEP1 3.36 ( 67%)
DEP2 3.86 ( 77%)
DEP3 3.54 ( 70%)
DEP4 3.83 (76%)
Table 4.44, shows the equations gathered from analysis conducted on the data obtained
from the survey. Using the mean values obtained for each of the variables measured, are
included in the equation, then the value of the safety awareness of each model is
obtained as shown in Table 4.44 (see the example below)

197
Sample calculations are made: For Model DEP1 (for other models please refer to
Appendix T)
The mean score for Communications for DEP1 = 3:41 ( taken from Appendix S)
The mean score for Training and Education for DEP1= 3.18 ( taken from Appendix U )
Replace the mean score values COMM and TE in the equation:
=
To obtain the percentages:
LoA O
Referring to Table 4.44, the results show the percentages of safety awareness hovered
between 60 to 80 percent. This can be concluded that the safety awareness in all
departments tested showed safety awareness is moderately high. This means that on the
whole implementation of safety aspect is at an acceptable level but there is still room
for improvement by all parties involved; management and workers together bringing
energy and effort towards creating a more conducive working environment.

198
4.7.3 Objective No.3:Developing of Statistical Analytical Tool for Measuring and
Correlating the Level of Awareness of Occupational Safety and Health and
Safety Climate Factors
Table 4.45: Correlation coefficient, r, for all models
DEP1 DEP2 DEP3 DEP4
NUMBER OF
RESPONDENTS
83 81 104 106
MANAGEMENT
COMMITMENT
0.579 0.443 0.469 0.383
EMPLOYEE
PARTICIPATION
0.545 0.409 0.710 0.525
TRAINING AND
EDUCATION
0.697 0.503 0.754 0.634
COMMUNICATION 0.725
0.666 0.807 0.673
From the correlation test results shown in Table 4.45, that there was a correlation
between the variables tested. The results demonstrate management commitment has the
lowest correlations values in all departments. This means that the workers felt
management commitment does not greatly affect the awareness level of safety, because
they are likely to have been satisfied with the contribution made by the management to
ensure they can work safely. For them, their management has provided all the necessary
requirements as stipulated in the Act.

199
Employee participation ranked second lowest in all the departments that were tested.
The test results showed low correlation value of around 0.5. This means that
respondents felt their involvement did not significantly influence safety awareness.
They feel that they had contributed the best in all the safety activities practiced by the
department during duties. The test results indicate they are very satisfied with their
contribution to safety activities undertaken.
Next, training and education have a relatively large correlation value of around 0.7. This
indicates that the respondent feels that training and education have a great influence on
the perception of safety awareness. They feel that level of training and education given
did not reach the level for them to work safely. The results gives a signal to
management that the organization needs to add and organize better safety programs to
be given to all employees. Thus they would feel more confident to work in difficult
conditions.
Communication showed the highest correlation in all the variables tested in all
departments studied. Correlation value obtained is around 0.8. This indicates that
communication is affecting the respondents’ perceptions of safety awareness.
Respondents think communication is very important in all work done. Effective
communication is very essential to ensure that transactions can be done properly and
safely. Each instruction/procedure needs to be fully understood by the individuals who
receive them, so that they can undertake assigned tasks properly and safely.
Next, the following subsections, discusses the relationship between the predictor with
LoA of OSH in the study.

200
4.7.3.1 LoA of OSH has Correlation with Management Commitment.
Results showed that there were relationships between LoA of OSH with Management
Commitment. However, the results in Table 4.45, showed a weak relationship
(DEP1 = 0.579, DEP2 = 0.443, DEP3 = 0.469 and DEP4 = 0.383). This means that, in
this study, management commitment does not so influence respondents’ views on the
OSH awareness. They feel the management has played a pivotal role in establishing
appropriate safe work environment and climate. The results of this study illustrates that
the respondents were satisfied with the role played by their employers. This is
consistent with studies that have been done before. Most scholars believe management
commitment was one of major factors towards safety awareness. The most influential
factor is management support (Aksorn, 2008). Cullen et al. (1993); Piccolo et al. (2010),
concluded that management has ethical and moral responsibilities to ensure that
employees and others are not exposed to risks or experience harm as a result of a firm’s
activities. Furthermore, Ogbonna (1990), had demonstrated that companies with the
lowest lost-time injury rates were those with the highest level of management
commitment and employee involvement.
Similarly, Erickson (2001), doing nation-wide scientific study found that the effect of
corporate culture on injury and illness rates within the organization, showed that those
elements most predictive of high safety awareness included a positive management
commitment to safety and to employees, open communication, encourage employee
innovation and suggestions and management feedback to employee among other
elements. In fact, according to these professionals, active, continuous and genuine
management support is the key to providing a safe, healthy working environment for
employees.

201
All of the above statements were supported by Enz (1986); James (1993), echoes this
view when she claims’ clearly, top management is a critical group in examining values
because of its control over organizational design and functioning. To understand the
role of values in an organizational context requires close examination of the
organizational leaders and how their beliefs operate to influence activities within the
firm`. The influence of leaders of LoA on OSH of their organizations may be summed
up as follow:
“Organizational design-maker, managers and professionals alike hope to ensure that
their central values and beliefs influence the LoA of OSH of their organizations by
designing functional arrangements and hierarchies to facilitate and support those
views.” (Abudayyeh et al., 2006; Hinings et al., 1996; Ranson et al., 1980).
The examples on how management shows its support by being committed to the safety
and health efforts, including financial and human resource support. The management
also can manage the safety and health in the same manner that productivity and quality
are managed. There are a lot of companies that consider safety and health as part of
their business. Incorporating safety and health into all organizational functions like
strategic planning is another way. Becoming personally involved in the safety and
health effort by being visibly seen doing so is another way. All of the examples given
above will prove that the management had given their full support to ensure high
performance of safety and health (Thomas, 2002).

202
4.7.3.2 LoA of OSH has Correlation with Employees’ Participation
Results in Table 4.45 showed that there were relationships between LoA of OSH with
Employees Participation. However, again the results in Table 4.46 showed a weak
relationship (DEP1 = 0.545, DEP2 =0.409, DEP3 = 0.710 and DEP4 = 0.525). This
means that, in this study, employees’ participation does not so influence respondents’
views on the OSH awareness. They feel they have equally contributed and played a
pivotal role in establishing appropriate safe work environment and climate. The results
of this study illustrate that the respondents were satisfied with the role played by them.
One of the human resource practice that is often included and the description of high
performance work system, is that of employee’s involvement or participation. The
importance of employee participation as a business strategy was first stressed in the late
1920 and early 1930. The Hawthorne studies Bramel (1981); Mayo (2003), gave rise to
and increasing interest in the human determinants of productivity. The human relations
approach to management emphasized the importance of communication between
employees and their superiors. More recently management practice has kindled a
renewed interest in this issue. This is due to growing evidence that employee
participation increases effort, which subsequently improves efficiency and productivity;
it reduces the cost of monitoring employees and leads to increased commitment
(Doucouliagos, 1995; Thomas, 2002).

203
Employee participation can take the form of a variety of management practices for
example, participative management, employee involvement programs, empowerment or
workplace democracy. Each of these practices attempted, in some way to involve
employees in the sharing of information and/or making of decisions. Participation may
be direct or indirect. Direct participation involves the employees themselves; whereas
indirect participation takes place by acting as an intermediary of employee
representative bodies, such as workers’ councils or trade union (Cooper, 1998; Sisson,
1997).
Two main forms of direct participation include consultative participation and delegate
participation (Geary, 1994; Gill, 2000; Gonzalez, 2010). Consultative participation
refers to practices where management encourages employees to share their opinions
regarding work-related concerns, yet retains the right to make all final decisions.
Examples of consultative participation include regular meetings with supervisors,
attitude surveys and employees’ suggestion plans. Delegate participation, on the other
hand, gives employees increased responsibility and autonomy to organize and perform
their jobs as they see fit. Two theoretical models addressed proved the potential
advantages of direct employee participation. According to cognitive models of
participative effects Anthony (1978); Miller (1986); Wagner (1994), employee
involvement increases the flow of information in organizations. Often employees
performing seemingly unimportant tasks have access to valuable information. Higher-
level managers are more likely to gain access to this information through participative
management practices. Therefore, practices that encourage employees to more freely
share information lead to higher levels of safety awareness (Lawler et al., 1995).

204
Employees are the people who live inside the operation area where there are a lot of
occupational hazards. They face hazards everyday and know better in term of the
effects and how to prevent it. This is an important aspect of the management to ensure
that their employees’ participation is highly encouraged. Management support will
further increase the level of employees confident at work place.
Eric (2000), quoted that “Employee involvement, when employees are aware of
management genuine interest in them, they will respond in kind. In this type of
environment, employee innovative thinking, suggestions and decision-making evolve, to
the benefit of the employee and the organization alike. One tangible benefit is fewer
injuries.”
Thus, it shows how important is employee’ participation to reduce the number of
accidents in the organization. Other than that, the statement supported by Pascale
(1984), with the statement that “behaviors that are rewarded will be repeated; as they
are rewarded and repeated, they become unconscious.” Gardner (1999), believes that
employee involvement, participation and input would expect that team-based or highly
participate firms are more productive and more positive than traditional counterparts.
However, it is true that an appropriate level of employee input involvement and
participation is a key element in long-term success of the change effort.
Finally, the Gallop Organization, which studied employee engagement in 7,939
business units in 36 companies, found that employee engagement was positively
associated with performance in a variety of areas, including increased customer
satisfaction, profitability and productivity, and reduce employee turnover (Clifton,
2003)

205
4.7.3.3 LoA of OSH has Significant Correlation with Training and Education
The results show that there is a significant correlation between OSH Awareness with
Training and Education. Thus the results in Table 4.45, showed a high relationship
(DEP1 = 0.697, DEP2 = 0.503, DEP3 = 0.754 and DEP4 = 0.634). This means that, in
this study training and education is greatly affecting respondents’ views on the OSH
awareness. They felt that the level of training and education available is still not enough
to guarantee safe working conditions. The management should give priority to this
matter. The management must review the training and education programs that have
been carried out and modify the system. This is to ensure that employees are satisfied
with training and education programs that have been planned. This could also convince
the staff to perform their duties safely.
Safety and health training and education programs can provide several advantages in
preventing accidents at workplaces. Organizations have to focus more on formal
training and education programs on safety and health to minimize construction related
accidents. Training and education programs on safety at work can lead to improving
safety behavior and attitudes as shown by Tam, et al. (2004) and Toole (2002). A safety
program can succeed if all employees undergo periodic educational and training
programs. As occupational safety training is likely the most researched issue and
practiced technique in safety management, and employees who receive safety training
suffer fewer work-related injuries than their untrained counterparts (Cohen, 1990) cited
by Zohar (2007). This view was supported by studies made by Osterman (1995), who
found that training will directly increase the problem-solving skills of employees.
206
Furthermore, Barling, et al. (2002), agreed with the study results, noted that training
allows employees to acquire greater competencies to control their work, leading them to
perform their jobs safely.
Safety training remains the fundamental method for attempting to effect self-protection
against workplace hazards. Most safety manuals advocate training as the means of
accident prevention, while safety legislation demands the appointing and training of the
competent persons to carry out particularly dangerous tasks. It has been found that low
accident rate at companies with a strong safety culture had developed integrated job and
safety training programs ( i.e. the job training included elements of safety training that
was specific and relevant to the job). This highlights a general point that the content of
safety training has to be relevant to the jobs of the trainees. Of particular importance is
the safety training of managers to ensure they are up to date with current safety
practices and legal requirements.
However, it must be noted that the implicit assumption of much safety training is that in
itself, it is a good thing, because safety trained personnel who know what to do will
automatically conduct themselves in a safe manner for extended periods of time,
regardless of the consequences on the job. This assumption is inaccurate because
normal everyday practice will almost inevitably negate the effects of this training,
unless it is reinforced by management and practiced by everyone on a daily basis.

207
4.7.3.4 LoA of OSH has Significant Correlation with Communication.
The results show there are significant correlation between OSH awareness with
Communication. Thus the results in Table 4.45, showed a strong relationship
(DEP1 = 0.725, DEP2 = 0.666, DEP3 = 0.807 and DEP4 = 0.673). This means that, in
this survey communication is greatly affecting respondents’ views on the OSH
awareness. Respondents think the guarantee of a safety program achieves the goal it
should be understood by all relevant parties. Effective communication is very vital that
all directives, regulations, work procedures can be delivered properly, with that the
employees can do their jobs safely.
From the psychological perspective of communication theory, communication quality
can be defined either as the difference between states, such as the gap between the
employees perceived awareness of OSH programs and the organization’s
communication of the actual performance (Hardie, 1994). Communication in
organization included all types of information passing so called delivery system such as
meeting, telephone conversation, e-mail, writing memo, information board and face to
face communication.
In terms of organization, Erickson (2001), quoted that miscommunication is common in
organizations. Open, honest, understandable communication is evident in high safety-
performing companies. Information flows in all directions, and the reporting of near
misses are encouraged. It was differently quoted by researchers in term of production
line where most of them agreed that supervisors are the most important communication
tools between management and employees. Breslin (2009); Heron (1947), have cited
that “no medium for carrying information can duplicate or displace the supervisor who
lives with employees in their daily work”.

208
Pierce (1995), quoted that good communication is vital to successful safety and health
programs and to business in general. An organization’s culture is defined first by the
way we talk-the language, nature and quality of the dialogue we engage in. So, to
change the culture, change the conversation. Friedman et al. (2000); Mohr (1995), share
their findings that communication quality is a perceptual outcome of the communication
exchange. The quality of the communication is one of the most critical aspects of the
business relationship (Lira et al., 2006; Mohr et al., 1996). Yet, as Maltz (2000), so
aptly concluded in his study on communication modes, all communication is not created
equal. The receivers’ perception of the communication quality has an influence on the
receiver’s response to the information (Maltz, 2000; O'Reilly et al., 1998).
To ensure the effectiveness of communication within the organization, two mechanisms
improve the quality of the communication need to be considered; the repetition of the
message, which decreases the amount of distortion or variance around the message, and
the verification of the content, which reduces the bias in the message (Guetzkow, 1954;
Lira, et al., 2006).
This is a situation where the communication leads the organization sharing business
important information as employees need to understand the relationship of safety and
health to the actual business operations that they perform (Eric, 2000).
Organizations with good safety culture can be characterized by a good safety
communication system that flows from top to bottom, bi-directionally through both
formal and informal communication channels throughout an organization. Recognizing
and harnessing the informal channel has been shown to be a feature of low accident
facilities, as questions about safety tend to become a part of everyday work-related
conversation.

209
However, both formal and informal communication between line-management and shop
floor is one of the most crucial areas for safety information to be disseminated.
Unfortunately, this area of communication is often the most neglected as perceived
work pressures result only in ‘crisis communications’ when a specific issue needs to be
addressed. The greater visibility of management on the shop floor to discuss safety
contributes enormously to a positive safety culture and morale in general. Moreover, as
dialogue flows between the groups, providing useful feedback to management,
improvements in safety are likely to increase at an even greater rate. A related area of
safety communications that requires careful preparation is the development of written
safety procedures, so that they can be easily understood and followed by the end user. If
the language is complex or not clear, or the procedure has vital steps missing, accidents
are likely to occur. A company with a strong safety culture tends to enhance all forms of
safety communications by involving personnel in every aspect.

210
4.7.4 Objective No.4: Identifying the significance factors influencing the Level of
Awareness of OSH using Multiple Regression Analysis
Table 4.46: Model Equations
NO. OFFICE EQUATION
1. DEP1
2. DEP2
3. DEP3
4. DEP4
Regression analyses in Table 4.46, show in DEP1 communications, and training and
education are variables that influence respondents’ perceptions of safety awareness
while in DEP2 only communication that influences the perception of respondents. For
DEP3 found three variables involved communication, employee involvement and
training and education. Communication and employee involvement influenced
respondents’ perceptions of safety awareness in DEP4. Here it can be seen that all of
these three variables have a significant influence in all of the developed model.
However, the result indicates that communication is the most significant variable in
influencing respondents’ perceptions of awareness. This shows how essential
communication is a factor in the way how businesses operate. Good and effective
communication will be able to produce quality work and safe environment. Results of
multiple regression analysis show management’s commitment does not influence
respondents’ perceptions of safety awareness in all of the developed model. This is
because the respondents think the management has contributed as stipulated in the act
and they give a clear picture that they are very satisfied with their management role.

211
This means that when the company states that they want to improve their safety culture
there is a great variance in what the employees believes is going to be improved.
Researchers have emphasized the importance of an effective communication in order to
obtain commonly understood goals (Clarke, 2004; Misnan, 2007). In order to illustrate
the importance of communicating the safety goals and visions Roughton (2002),
compared this with if an airline pilot taking off from an airport without having a written
flight plan. If there is failure to communicate a shared and coherent understanding of
what the goal is, e.g. what it is that the company wants to improve, then this may have a
negative impact on the effectiveness of the safety culture improvements (HSC, 2001;
Roughton, 2002). In order to effectively improve a safety culture it is therefore
important that everyone refers to the same definition when talking about safety culture
and also that they have the same goal in mind (HSC, 2001). Since communication plays
an important part in the work on safety culture and safety climate improvements,
consideration can be made to review the communication paths within an organization.

212
4.7.5 Objective No.5: Model Validation for Evidence to Support the Relationship
Between Dependent and Independent Variables
For this purpose, there are a number of tests conducted including identifying the R
value, Analysis of Variance, Scatter plot and 95% Interval Confidence Level.
A summary of the models in Table 4.47 indicates R values as the correlation between
the predictor factors combined and the dependent factor. It is found that the values are
quite large, indicating that the linear regression models can be predicted from
independent variables. The results indicate that about 80% in all models of the
variability of OSH awareness are explained by factors mentioned. The values are quite
high and indicating only the remaining of about 20% is not explained. The observed
value of 0.80 indicates the linear regression models predict well (Norusis, 1999b).
Therefore, it can be concluded that communication, employees’ participation, training
and education and management commitment influence OSH awareness in all the four
departments.
Table 4.47: Model Summary
Model R R-Square Adjusted
R-Square
Std. Error of
the Estimate
DEP1 0.751 0.564 0.553
0.4789
DEP2 0.666 0.443 0.436
0.3314
DEP3 0.842 0.708 0.700 0.3079
DEP4 0.707 0.500 0.491 0.3676
Dependent Factor: LoA of OSH

213
The purpose of analysis of Variance (ANOVA) is to find the relationship between the
predictor and the dependent factors. The results show that F statistic is significant at
p < 0.005 and it can be concluded that R-Square is significantly different from zero.
This mean that there is a linear relationship between the predictor and the dependent
factor in all the models (Foster, 2001).
Scatter Plot of Regression Standardized Predicted Value against Regression
Standardized Residual for all the models explained in subsection 4.5.2 and subsection
4.6.2.3.2. Level of Awareness (LoA) of Occupational Safety and Health is dependent
variable. All the plots show evidence that the relationship between the dependent and
independent factors were also linear. The factors are scattered without showing any
pattern giving evidence that the dependent and independent factors are linear (Foster,
2001).
It is noted that the 95% confidence interval does not include the value 0 for all factors
except constants in all the four models. The 95% confidence interval will include the
value 0 only if the observed significance level for the test of the slope 0 is greater than
0.05 and if this the case the null hypothesis cannot be rejected that the population slope
is any of the values within the confidence interval (Norusis, 2007). For example
(DEP1) the lower limit of the 95% confidence interval for the slope is 0.242 and upper
limit is 0.779 as shown in Table 4.48. Therefore, communication, with 0.510, falls
within these intervals and which are plausible population values (Norusis, 2007). Thus,
the hypothesis that the population regression line is based on the sample results is true
for DEP1. It can be seen that the conditions are also true for DEP2, DEP3 and DEP4.
Therefore, it is concluded that the relationship between dependent variable and
independent variables reflect the population of regression line.

214
Table 4.48: Model Coefficients
Model Unstandardized
Coefficients
B
Std.Error
Standardized
Coefficients
Beta
t
Sig.
95% Confidence
Interval for B
Lower Upper
Bound Bound
DEP1 (Constant)
MSCOMM1
MSTE1
0.588 0.282
0.510 0.135
0.326 0.123
0.465
0.325
2.084
3.788
2.648
0.040
0.000
0.010
0.144
0.242
0.132
0.982
0.779
0.526
DEP2 (Constant)
MSCOMM2
1.016 0.361
0.770 0.097
0.666
2.815
7.932
0.006
0.000
0.297
0.577
1.734
0.963
DEP3 (Constant)
MSCOMM3
MSTE3
MSEP3
-0.108 0.299
0.462 0.111
0.233 0.075
0.325 0.118
0.424
0.277
0.222
-0.362
4.145
3.091
2.755
0.718
0.000
0.003
0.007
-0.701
0.241
0.083
0.091
0.484
0.683
0.382
0.559
DEP4 (Constant)
MSCOMM4
MSEP4
0.373 0.364
0.597 0.088
0.327 0.104
0.547
0.252
1.025
6.803
3.131
0.308
0.000
0.002
0.349
0.423
0.120
1.095
0.770
0.534

215
4.8 Concluding Remarks
This chapter discusses features and demographic data, findings, statistical analysis,
regression analysis and verification of the overall model. Researcher describes each part
in detail to ensure the reader can understand the study as a whole. At the end of this
chapter, the researcher explains in the public service delivery system that has a
relationship with communication factor accounting for the most significant factor in
influencing the respondents’ perceptions of safety awareness. This is to prove that an
effective delivery system is very important in ensuring the success of the work
undertaken.
The next chapter will draw conclusions about the study, highlights the problems
encountered, contribution to the industry, future research and few recommendations on
creating a systematic and effective of safety program to ensure the welfare of the
employee while on duty.
216
CHAPTER 5: CONCLUSIONS AND RECOMMENDATIONS
This chapter describes the overall results of this study, demonstrating the problems
encountered in the course of the study, showing the contribution of this study to the
construction industry, and offer and recommendations and suggest the future research to
improve Level of Awareness of OSH management system among the government
agencies.
The analyses indicate that the regression models give the best description of supervising
safety aspect in construction work design in Malaysia. All models give an accuracy of
more than 80%, therefore statistically all the models are satisfactory for predicting LoA
of OSH in supervising safety aspects especially at construction sites. The above models
offer consistency accuracy values and therefore offer good prediction on LoA of OSH
management system.
5.1 Conclusions
This study was carried-out in some selected government departments consisting of
respondents with different demographic data. They were selected based on the different
categories of position, academic background, ages and working experiences. The mean
work experiences were between 10.5 years to 17.4 years. Research tools used is the set
of survey questions that was designed to be self-explanatory to ensure that respondents
can complete the questionnaire by themselves. During surveys conducted, they were
gathered in the meeting room and assisted by researcher if they facing difficulty in
answering the questions. This will not only reduce errors while answering questions but
can ensure a high response ratio, in which questions are collected once the respondents
answered the survey.

217
A set of tool methodology, to measure safety awareness is developed for government
agencies offices’ management in Malaysia. This tool also can be used by various
companies in Malaysia. The methodology used, i.e. questionnaire design, observation,
measurements, data collection, statistical analysis, regression analysis and model
validation and also a basic tool of safety awareness measurement have the potential to
diagnose workplace safety management and thus improve LoA of OSH at the
workplace in return.
The survey required all respondents to answer four questions about demographic data
and to rate each of (56) fifty-six questions using a five –point Likert scale about the
safety aspects implemented in their departments. It ranges from 1 (strongly disgree) to 5
(strongly agree). Data collected from the survey were treated and analyzed using SPSS
version 16. It employed multivariate statistical comprising descriptive statistics,
Pearson’s correlation coefficient, analysis of variance (ANOVA) and multiple
regression analysis.
The results showed that demographic factors such as position, level of education and
age did not influence respondents’ perceptions of safety awareness except work
experience factors which heavily influence the differences of respondents’ perception in
safety awareness. This means that the more experienced the employee is the more
perfectly their differences in perception influence the occupational safety awareness in
all departmenst studied.
It was found that overall LoA of OSH in all departments tested were at between
‘moderately agreed’ to ‘highly agree’ level. To measure the level of safety awareness,
there are two methods used, the first measures directly the perception of the respondents
and uses the questions in section three of the questionnaire. The second method uses the
equation obtained as a result of the analysis.

218
This means that on the whole implementation of safety aspect is at an acceptable level
but there is still room for improvement by all parties involved; management and
workers together bringing energy and effort towards creating a more conducive working
environment.
From the statistical analysis it was found that there were positive and significant
correlations between LoA of OSH and the four Safety Climate factors i.e. management
commitment, employees participation, training and education and communication at
different levels of correlation between each other. This shows that all four the climate
factors correlated with safety awareness at different rates between each other. The
results of multiple regression analysis showed that communication is the most
significant factor influencing safety awareness of all developed models. Communication
in the organization included all type of information passing so called delivery systems
such as meeting, telephone conversation, e-mail, writing memo, information board and
face to face communication.
From multiple regression analysis, the model was developed to measure safety
awareness. This model has been tested down to the two agencies which have different
scope of duties. Results obtained from the validation process at two other agencies
showed the model to be accurate within 80% to 90%. This shows that statistically, the
model developed in this study has high reliability and validity. The results also indicate
similar job concept and practices have similar pattern and model.

219
Finally, model validation for evidence to support the relationship between dependent
and independent variables was done. For this purpose, there are a number of tests
conducted including identifying the R value, Analysis of Variance, Scatter plot and
95% Interval Confidence Level.
Results of tests carried out, can be concluded as follows:
Its indicate that the linear regression models can be predicted from independent
variables
The observed value of 0.80 indicates the linear regression models predict well
Therefore, it can be concluded that communication, employees’ participation, training
and education and management commitment influence OSH awareness in all the four
departments.
There is a linear relationship between the predictor and the dependent factor in
all the models
The factors are scattered without showing any pattern giving evidence that the
dependent and independent factors are linear
The hypothesis that the population regression line is based on the sample results
is true
Therefore, it is concluded that the relationship between dependent variable and
independent variables reflect the population of regression line.

220
5.2 Recommendations
Using this model, Level of Awareness of Occupational Safety and Health of a
department or organization can be measured. Therefore, the developed model will help
an organization to measure safety awareness. By knowing the level of safety awareness,
the management will be able to act to review the existing system accordingly. If there
are weaknesses then process improvements can be done to ensure that all individuals
involved in this industry can work more comfortably and safely.
Results from this study also showed that overall safety awareness is moderately high
level in the range of 70% - 80% in all departments tested. This indicates that the level is
still acceptable and there is still room in order to enhance the level to get better in the
future.
For this purpose a number of improvements are proposed:
1. The management plays a more proactive and innovative role in enhancing
participation to provide a more conducive and safe work environment.
2. The employee can be given more opportunities to be involved in the planning
and implementation of safety management systems better and systematically to
ensure their welfare in carrying out their daily tasks.
3. Effective planning and implementation of training and education always to be
evaluated from time to time to ensure that the program is constantly evolving in
line with technological developments and the current system, to provide
competent individuals in every field or scope of work performed.

221
4. This study shows that work experience had a great influence in determining the
respondents’ perceptions of safety awareness. Work experience can be obtained
through various methods such as courses, practical training, discussions, visits
and so on. Thus the systematic training and education program are inextricably
linked with career advancement of an employee in producing a competent
worker.
5. Communication is a very important factor in determining the effectiveness of a
program and is designed to be implemented properly. The importance of
effective communication cannot be denied in ensuring success in any matter or
activity performed. Failure to communicate well will cause the failure of a
planned activity despite having sufficient financial, the efficiency of training and
support from management. Furthermore this can lead to the occurrence of
accidents resulting in loss of life and loss of property. Therefore it is clear that
the effectiveness of the communication is very important in ensuring the success
of programs that have been planned. Since communication plays an important
part in the work on safety awareness improvements, it is essential to review the
communication paths within an organization.
6. Occupational Health and Safety (OH&S) issues, particularly in the construction
industry are still problematic and need to be addressed by all parties concerned.
In Malaysia, from literature review , the legislation to address the OH&S issues
is deemed sufficient but legislative enforcement is still lacking. To redress this
situation, the practical approach shall be to raise the awareness of construction
companies regarding the importance of OH&S and implementation of
occupational safety and health management system in the construction industry.

222
5.3 Problems Encountered
There were no complex problems encountered in the conduct of this study. The main
problems that occurred were when developing the theoretical framework and in the
course of field work. Difficulties encountered in the formulation of the theory in this
study was a framework to capture various and different variables in measuring the OSH
awareness as perceived by various researchers and show the relationship between the
variables. The challenge was in making the framework simple enough to be understood
but multifaceted enough that would show correlation.
The problem which arose in the course of fieldwork was the difficulty in fixing
appointments due to the busy schedule especially among senior management. These
were overcome by relying on networking between intermediate superiors and
persistently pursuing the respondents. In addition, some respondents’ could have
different understanding of the structured questionnaires. With the researcher present
while the forms were being filled gave the opportunity to explain to the respondents and
maintain motivation and cooperation of the respondents.
223
5.4 Contribution to Industry
The followings are a few contributions of the study in the industry:
1. The study has developed a methodology in diagnosing Level of Awareness of
OSH programs in workplace management which can be used for government
agencies. Methods include questionnaire design, data collection, statistical
analysis, multiple regression analysis and model validation.
2. This study has also developed a model appropriate to be used for private
company to diagnose current industrial workplace safety management or as a
reference to the future planning.
3. The Multiple Regression Models developed are case specific for data collected
from the four organizations examined in this study. The approach of using this
model can be applied in other agencies or bodies, by collecting a new set of data
in order to get the new model which is applicable to the relevant agencies or
bodies. The model can highlight the significant factors that have the greatest
influence for level of awareness of safety culture in the particular organization.
4. Finally, the research results provide new insight into the important issues of
safety awareness in workplace management system in Malaysia.

224
5.5 Future Research
This study deals with public sector projects in Malaysia. It is acknowledged that the
findings may differ for private sector projects. As such it is recommended that for future
research, a similar study be carried out for private sector projects. This will complete the
research on project safety management for construction projects implemented in
Malaysia.
The results of this research also show that among the factors, communication is very
significant in influencing the effectiveness of the safety awareness of an agency. It is
proposed a more comprehensive study to be done on these factors to determine how
strong communication factor is in influencing the effectiveness of the safety awareness.
Demographic data may have an impact on respondents' perceptions of safety awareness.
In this study only four demographic data were assessed via the position, educational
background, age and work experience. It was found that only work experience is
affecting the respondents' views on the safety awareness of the four factors tested. It is
recommended to test more demographic data including gender, race, religion, marital
status, annual income, and so on. Therefore, it is hoped that the findings will later give a
clearer picture of the level of safety awareness among employees in the public and
private sectors in the country.

225
REFERENCES
Abdelhamid, T., and Everett, J (2000). Identifying Root Causes of Construction Accidents. J.
Constr. Eng. Manage, 126(1), 52-60. doi: 10.1061/(ASCE)0733-9364(2000)126:1(52) Abdul Rahim, A. H., Muhd Zaimi, A. M., & Singh, B. (2008). Causes of Accidents At
Construction Sites. Malaysian Journal of Civil Engineering, 20(2), 242-259. Abdul Rashid, K. (2002). Construction Procurement in Malaysia : International Islamic
University Malaysia. Abdul Razak, I., Ali Hussein, Z., & Veera Pandiyan, S. (2010). Supply Chain Management
Practices and Firm Performance: An Empirical Study of the Electronics Industry in Malaysia. International Journal of Technology Diffusion, 1 (3), 56-63.
Abudayyeh, O., Federicks, T., Butt, S., & Shaar, A. (2006). An investigation of management’s commitment to construction safety. Journal of International Project Management, 24(2), 167-174.
Ahmad Mahdzan, A. (1992). Kaedah Penyelidikan sosioekonomi. Kuala Lumpur: DBP. Aksorn, T., and Hadikusomo. B.W.H. (2008). Critical success factors influencing safety program
performance in Thai construction projects. Safety Science, 46(4), 709-727. Al-Kilani, F. M. (2011). Improving Safety Performance In Construction Projects In Libya (Case
Study : In Tripoli City). Master Thesis, Diponegoro University Indonesia, Semarang. Al Haadir, S., and Panuwatwanich, K (2011). Critical success factors for safety program
implementation among construction companies in Saudi Arabia. Procedia Engineering, 14, 148-155.
Amat, S. C. (2008). A Study on Trend of Safety and Health Awareness Among Construction Personnel In Malaysia. Master, University of Malaya, Kuala Lumpur.
Anthony, W. P. (1978). Participative management. Reading,MA: Addison-Wesley Antonsen, S. (2009). ”Safety Culture Assessment: A Mission Impossible?”. Journal of
Contingencies and Crisis Management, 17(4), 242-254. Aripin, R. (2004). A guide to data management and analysis.: University Teknologi MARA. Australia, W. S. (1994). Positive performance indicators for OHS: beyond lost time injuries.
Canberra: Government Publishing Service. Bahari, S. F. (2011). An Investigation of Safety Training, Safety Climate and Safety Outcomes: A
Longitudinal Study in a Malaysian Manufacturing Plant. Doctor Philosophy, University of Manchester.
Bakar, J. A. (2006). Strategic Human Resources Management in Prevention of Industrial Accidents in Organisations. . Journal of Occupational Safety and Health, 3, 27-34.
Barling, J., C.Loughlin, & E.Kelloway. (2002). Development and test of a model linking safety-specific transformational leadership and occupational safety. Journal of Applied Psychology, 87(3), 488-496.
Belassi, W., and Tukel, O.I (1966). A new framework for determining critical success/failure factors projects. International Journal of Project Management 14(3), 141-151.
Bergh, M. (2011). An evaluation of the safety climate at Akzo Nobel Site Stenungsund. Master Thesis, Chalmers University Of Technology, Sweden, Goteberg, Sweden.
Bramel, D. F., Ronald. (1981). Hawthorne, the myth of the docile worker, and class bias in psychology. American Psychologist, 36(8), 867-878.
Breslin, T. (2009). When social networking enters the workplace. (Vol. 80): Massachusetts Nurse.
Brown, K. A., Willis, P. G., & Prussia, G. E. (2000). Predicting safe employee behavior in the steel industry: Development and test of a sociotechnical model. Journal of Operations Management, 18, 445– 465.
CANSO. (2008). Safety Culture Definition & Enhancement Process Model.: The Civil Air Navigation Services Organisation

226
Chan, D. W. M., and Kumaraswamy,M. (1997). A comparative study of causes of time overruns in Hong Kong construction projects. International Journal of Project Management 15(1), 55-63.
Che Hassan, C. R., and Basha,O (2007). Perception of Building Construction Workers Towards Safety, Health and Environment.” Journal of Engineering Science and Technology, 2(3), 271-279.
Cheah, Y. J. (2007). Construction Safety and Health Factors at the Industry Level: The case of Singapore. Journal of Construction in Developing Countries, 12(2), 81-99.
Choudhry, R. M., Fang, D., & Mohamed, S. (2007). Developing a model of construction culture. Journal of Management in Engineering, 23(4), 207-212.
Christian, M., Bradley, J., Wallace, C., & Burke, M. (2009). Workplace Safety: A Meta-Analysis of the Roles of Person and Situation Factors. Journal of Applied Psychology, 4, 1103-1127.
Chua, Y. P. (2006). Research Basic Statistic(Book 1-5). McGraw-Hill(Malaysia) Sdn.Bhd. Clarke, S. (2006). Safety climate in an automobile manufacturing plant. The effects of work
environment, job communication and safety attitudes on accidents and unsafe behavior. Personnel Review 35(4), 413-430.
Clarke, S. G. (2000). Safety Culture. Under-Spesified and overrated? International Journal of Management Reviews., 2, 65-90
Clarke, S. G., & Cooper,C.L. (2004). Managing The Risk of Workplace Stress: Health and Safety Hazards. London: Routledge.
Clifton, D. O., & Harter, J. K (2003). Investing In Strengths.In K.S.Cameron,B.J.E. Dutton & C.R.E. Quinn ( Eds.) (pp. 111-121). San Francisco.
Cohen, D. J. (1990). What Motivates Trainees? Training and development journal, 44(11), 91-93.
Colak, B., Etiler, N., & Bicer, U. (2004). Fatal Occupational Injuries in the construction sector in Kocaeli,Turkey, 1990-2001. Industrial Health, 42(4), 424-430.
Collins, D., and Baccarini,D. (2004). Project Success- A survey. Journal of Construction Research. Journal of Construction Research 5(2), 211-231.
Cooper, D. R., and Schindler, S.P. (2001). Business Research Methods. (7th. ed.) New York: McGraw- Hill Companies.
Cooper, M. D. (1998). Improving Safety Culture: A Practical Guide. Cooper, M. D. (2000). Towards a model of safety culture. Safety Science, 36, 111-136. Corbett, J., Dooner, M., Meleke, J., & Pym, C. (1991). Design For Manufacture: Strategies,
Principles And Techniques.: Addison-Wesley Publishing Company. Cox, S. J., and Cox,T. (1991). The structure of employee attitudes to safety: A European
example. Work Stress 5, 93-106. Cronbach, L. J., & Meehl, P. E. (1955). Construct Validity in Psychological Tests. Psychological
Bulletin, 52, 281-302. Cullen, J. B., Bart, V., & James, W. B. (1993). The Ethical Climate Questionnaire:An Assessment
of Its Development and Validity. Psychological Reports, 73, 667-674. Davies, H., Nutley, S., & Mannion, R. (2000). Organisational culture and quality of healthcare.
Journal of Quality Health Care, 9(2), 111-119. De Witte, K., and van Muijen,J.J. (1999). Organizational culture:Critical questions for
researchers and practioners. European Journal of Work and Organizational Psychology, 8(4), 583-595.
Deal, T. E., & Kennedy, A. A. (1982). Corporate cultures: The rites and rituals of corporate life. Menlo Park,CA: Addison-Wesley.
Denison, D. R. (1996). What is the difference between organizational culture and organizational climate? A native`s point of view on a decade of paradigm wars. Academy of Management Review, 21(3), 619-654.
Department of Employment and Workplace Relations Office of Australian Safety and Compensation, C. (2005). Guidance on the Use of Positive Performance Indicators to Improve Workplace Health and Safety. Canberra.

227
DeVellis, R. F. (2003). Scale development: Theory and applications. (Second ed.) Thousand Oaks: Sage Publications.
Dillman, D. A. (Ed.). (2000). Mail and internet surveys: The tailored design method. (Second ed. ed.). New York: John Wiley & Sons.
DOSH. (2010). Data and Information. (Third ed.): Department of Occupational Safety and Health Malaysia.
Doucouliagos, C. (1995). Worker participation and productivity in labour-managed and participatory capitalist firms: A meta-analysis. Industrial and Labour Relations Review, 49, 58-77.
Enz, C. A. (1986). Power and shared values in the corporate culture. Ann Arbor. Eric, S. N. (2000). EH&S Makeover Made Simple. Occupational Hazards, 62, 172-195. Erickson, R. J., & Ritter,C (2001). Emotional labor,burnout, and inauthenticity: Does gender
matter? Journal of Social Psychology Quarterly, 64(2), 146-163. Evelyn, A. L. T., Florence, Y. Y. L., & Adrian, F. W. C. (2005). Framework for project managers to
manage construction safety. International Journal of Project Management 23(4), 329-341.
Fang, D. P., Chen, Y., & Wong, L. (2006). Safety climate in construction industry: a case study in Hong Kong. Journal of Construction Engineering and Management, 132(6), 573-584.
Ferraro, L. (2002). Measuring safety climate: the implications for safety performance. Thesis for Doctor of Psychology, University of Melbourne, Melbourne.
Field, A. P. (2005). Discovering statistics using SPSS. (Vol. 2). London: Sage Flin, R., Mearns, K., O’Connor, P., & Bryden, R. (2000). Measuring safety climate:identifying the
common features. Safety Science, 34(1-3), 177-194. Foster, J. J. (2001). Data Analysis using SPSS for windows version 8 to 10. London: Sage
Publication Ltd. Friedman, R. A., Tidd, S. T., Currall, S. C., & Tsai, J. C. (2000). "What goes around comes around:
the impact of personal conflict styles on work conflict and stress". International Journal of Conflict Management, 11, 32-55.
Gardner, R. L. (1999). Profesional Safety, 44, 26-32. Geary, J., and Sisson,K. (1994). Conceptualising direct participation in organisational change :
the EPOC Project.: Loughlinstown House (Shankill, Co., Dublin, Ireland and Luxembourg and Lanham, MD).
Gill, C., and Hubert,K. (2000). Recent Survey on Paticipation in Europe:Towards a European Model? European Journal of Industrial Relation, 6(1), 109-132.
Glendon, A. I., Clarke, S. G., & McKenna, E. (2006). Human Safety and risk management. (2nd ed.). Boca Raton: CRC Press.
Glendon, A. I., Litherland, D.K. (2001). Safety climate factors,group differences and safety behavior in road construction. Safety Science, 39(3), 157-188.
Gonzalez, M. C. (2010). Workers’ direct participation at the workplace and job quality in Europe. Journal of European Social Policy, 20, 160-168.
Guetzkow, H., & Gyr, J. (1954). An analysis of conflict in decision-making groups. Human Relations, 7, 367-381.
Guldenmund, F. W. (2000). The nature of safety culture:A review of theory and research. Safety Science 34, 215-217.
Guldenmund, F. W. (2010). Understanding and exploring safety culture. PhD Thesis, Delt University, The Netherlands.
Hair, J. F., Anderson, R. E., Tatham, R. L., & Black, W. C. (1998). Multivariate data analysis. (5th. ed.). New Jersey: Prentice-Hall International, Inc. .
Hardie, N., Walsh,P. (1994). Towards a Better Understanding of Quality. International Journal of Quality & Reliability Management, 11(4), 53-63.
Hartman, F., and Ashrafi, R.A. (2002). Project management in the information systems and information technologies industries. Project Management Journal, 33(3), 5-15.

228
Hartman, F., Ashrafi, R., & Jergeas, G. (1998). Project management in the live entertainment industry: what`s different? . International Journal of Project Management 16(5), 269-281.
Harvey, J., Bolam, H., Gregory, J., & Erdos, G. (2001). The effectiveness of training to change safety culture and attitudes within a highly regulated environment. Personnel Review, 30(6), 615-636.
Heron, A. R. (1947). Sharing information with employees.: Stanford University Press. Hinings, C. R., Thibault, L., Slack, T., & Kikulis, L. M. (1996). Values and Organizational structure.
Journal of Human Relations, 49, 885-916. Hofman, D. A., and Stetzer,A. (1996). A cross-level investigation of factors influencing unsafe
behaviors and accidents. Personnel Psychology, 49, 307-339. Hopkins, A. (2006). Studying organisational cultures and their effects on safety. Safety Science,
44, 875-889. HSC. (1993). Third Report: Organizing for safety. London: ACSNI. Study Group on Human
Factors.HMSO,London. HSC. (2001). A Guide to measuring health and Safety performance. London: HMSO. Huang, Y.-H., Chen, P. Y., & Grosch, J. W (2010). Safety climate: New developments in
conceptualization, theory, and research. Accident Analysis and Prevention, 42, 1411-1422.
IAEA. (1986). Summary report on the post accident review meeting on the chernobyl accident (75-insag-1). Vienna: International Atomic Energy Authority.
Idrus, D., Ab. Rahman, H., Ashari, H., Zaini, F., Jamil, R., & Muktar, S. N. (2004). Level Of Awareness Of UTM Staff On Occupational Safety And Health At The Work Place. Johor: Department of Human Resources, University of Technology Malaysia.
Ismail, F., Harun, H., Ismail, R., & Majid, M. Z. A. (2010). A framework of safety culture for the Malaysian construction companies: A methodological development. Pertanika Journal of Social Science and Humanities, 18(1), 45-54.
Ismail, Z., Doostdar,S.,and Harun,Z. (2011). Factors influencing the implementation of safety management system for construction sites. Safety Science, 50, 418-423.
Iyer, K. C., and Jha,K.N. (2005). Factors affecting cost performance ; evidence from Indian construction projects. . International Journal of Project Management, 23, 283-295.
James, C. S., Don, S. Woodman. (1993). Leadership in Australia and Its Organizational Outcomes. Leadership & Organization Development Journal, 14(4), 3-9.
Johnson, R. A., and Wichern,D.W. (2002). Applied multivariate statistical analysis. (5th. ed.) New Jersey: Prentice-Hall International Inc.
Kamarudin, N., and Roslan, M.A. (1990). Kaedah Penyelidikan : Panduan mudah kerja luar. Petaling Jaya: Fajar Bakti.
Katram, N. A., Flood, I., & Koushki, P. (2000). Construction safety in Kuwait: issues, procedures, problems and recommendations. Safety Science, 36, 163-184.
Kilman, R. (1985). Managing your organization’s culture. In Report, N. t. W. (Ed.), (Vol. 3, pp. 12-15).
Kuenzi, M., and Schminke,M (2009). Assembling fragments into a lens: a review, critique, and proposed research agenda for the organisational work climate literature. Journal of Management, 35, 634-717.
Lardner, R. (Ed.). (2003). PRISM: Safety Culture Application Guide. Edinburgh. Lawler, E. E., Mohrman, S. A., & Ledford, G. (1995). Creating high performance organizations.
San Francisco: Jossey-Bass. Lawshe, C. H. (1975). A Quantitative Approach To Content Validity. Personnel Psychology,
28(4), 563–575. Liaw, S. H., and Goh,K.L. . (2002). Statistik Asas : Konsep dan Amalan. Kuala Lumpur: McGraw-
Hill (Malaysia) Sdn.Bhd. Likert, R. (1932). A Technique for measurement of Attitudes. Archives of Psychology, 140, 5-55.

229
Lillie-Blanton, M., Maleque, S., & Guest, W. M. (2008). Beyond Coverage: Building Capacity To Promote And Protect The Public`s Health: Reducing Racial, Ethnic, and Socioeconomic Disparities in Health Care: Opportunities in National Health Reform. JL Med. & Ethics, 36, 693-860.
Lingard, H., and Wakefield,R. (2011). The development and testing of a hierarchical measure of project OHS performance. Engeneering Construction Architect Management, 18(1), 30-49.
Lira, M. E., Ripoll, P. P. M. J., & González, P. (2006). The roles of group potency and information and communication technologies in the relationship between task conflict and team effectiveness”. A longitudinal study Computers in Human Behavior, 23(6), 2888-2903.
Lu, C.-S., and Tsai, C.-L. . (2007). The effects of safety climate on vessel accidents in the contaiber shipping context. Accident Analysis & Prevention, 40, 594-601.
Lubega, H. A., Kiggundu, B. M., & Tindiwensi, D. (2000). An Investigation into the causees of Accidents in the Construction Industry in Uganda. Paper presented at the 2nd International Conference On Construction In Developing Countries: Challenges Facing The Construction Industry In Developing Countries., Botswana.
Malaysia. (2007a). Malaysia Economy Report 2007/2008.: Ministry of Finance. Maltz, E. (2000). Is all communication created equal?: An investigation into the effect of
communication mode on perceived information quality. Journal of Product Innovation Management 17(2), 110-127.
MAMPU. (1987). A Guide to research methodology. Kuala Lumpur. Marcoulides, G., and Heck, R.H. . (1993). Organizational Culture and Performance:Proposing
and Testing a Model. Organizational Science, 4(2), 209-223. Mayo, E., and Thompson,K. (2003). The Human Problems of an Industrial Civilization.
Cambridge. Milczarek, M., and Najmiec, A. (2004). The relationship between workers' safety culture and
accidents, near accidents and health problem. International Journal Occupational Safety and Ergonomic, 10(1), 25-33.
Miller, K., & Monge,P.R. (1986). Participation,satisfaction, and Productivity: A Meta-analytic review. Academy of Management Journal 29, 727-753.
Misnan, M. S., & Mohammed, A. H (2007). Development of safety culture in the construction industry: A conceptual framework. In: Boyd, D (Ed) Procs. . Paper presented at the 23rd Annual ARCOM Conference, Belfast, UK.
Mohamed, S. (2002). Safety climate in construction site environments. Journal of Construction Engineering and Management, 128(5), 375-384.
Mohammad, S. E.-M., Bashar, M. A.-S., Khalied, H. H., & Shaher, M. R. (2010). Safety Management in the Jordian Construction Industry. Jordan Journal of Civil Engineering, 4(1), 47-54.
Mohr, J. J., and R.S.,Sohi. (1995). Communication Flows in Distribution and Satisfaction. Journal of Retailing 71(4), 393-416.
Mohr, J. J., Fisher, R. J., & Nevin, J. R. (1996). Collaborative Communication in Inter firm Relationships: Moderating Effects of integration and Control. Journal of Marketing, 60(3), 103-115.
Mohsen, T., and Reg, Dennick. (2011). Making sense of Cronbach’s alpha. International Journal of Medical Education, 2, 53-55.
Montgomery, D. C., Runger, G. C., & Hubele, N. F. (2001). Engineering Statistics: John Wiley & Sons, Inc.
Mowday, R. T., and Porter, L.W. (1979). The Measurement of Organizational Commitment. Journal of Vocational Behavior, 14, 87-98.
Nahrgang, J. D., Morgeson, F. P., & Hofmann, D. A. (2006, May 5-7). Predicting safety performance: a meta-analysis of safety and organizational constructs. Paper presented at the 21st Annual SIOP Conference, Dallas,Texas.

230
Naoum, S. (2003). An Overview into the Concept of Partnering. International Journal of Project Management, 21(1), 71-76.
Naoum, S. G. (1998). Dissertation Research and Writing for Construction Students.: A Butterworth-Heinemann.
Nguyen, L. D., Ogunluna, S. O., & Lan, D. T. X. (2004). A study on project success factor in large construction projects in Vietnam. Engineering, Construction and Architectural Management 11(6), 404-413.
Nordên-Hágg, A., Bryan S.J., Kalvemark-Sporroy, S., Lena Ring, & Kettis-Lindblad, A. (2010). Assessing Safety Culture in Pharmacies: The psychometric validation of the Safety Attitudes Questionnaire(SAQ) in a national sample of community pharmacology in Sweden. BMC Clinical Pharmacology 10(8).
Norland-Tilburg, E. V. (1990). Controlling error in evaluation instruments. Journal of Extension, 28(2), 170-183.
Norusis, M. J. (1999a). SPSS regression model 10.: Prentice Hall. Norusis, M. J. (1999b). SPSS regression model 10.0. Prentice Hall. Norusis, M. J. (2007). Guide to Data Analysis.: Prentice Hall. Nunnaly, J. (1978). Psychometric Theory. New York.: McGraw-Hill. O'Reilly, C. A. I., Williams, K. Y., & Barsade, S. (1998). Demography and group performance:
Does diversity help? In M. A. Neale, E. A.Mannix, & D. Gruenfeld (Eds.) Research on managing groups and teams Greenwich.
Ogbonna, E., & Wilkinson, B. (1990). Corporate strategy and corporate culture: The view from the checkout. Personnel Review, 19(4), 9-15.
Ogbonna, E., and Wilkinson, B. . (1996). Inter-organizational power relations in the UK grocery industry: contradictions and developments. International Review of Retail, Distribution and Consumer Research, 6(4), 395-414.
Osterman, P. (1995). Skill, Training, and Work Organization in American Establishments. Industrial Relations, 34(2), 125-146.
Pascale, R., T. (1984). Perspectives on Strategy: The Real Story Behind Honda's Success. California Management Review 26, 47-72.
Peterson, R. A. (2000). Conctructive effective questionnaires.: Sage Publications Inc.. Piccolo, R. F., Greenbaum, R. L., Den Hartog, D., & Folger, R. (2010). The relationship between
ethical leadership and core job characteristics. Journal of Organizational Behavior, 31, 259-278.
Pidgeon, N. F. (1991). Safety culture and risk management in organizations. Journal of Cross-Cultural Psychology, 22, 129-141.
Pierce, J. L. (1995). Gender trials: Emotional lives in contemporary law firms. Berkeley: University of California Press.
Pipitsupaphol, T., and Watanabe, T. (2000). Identification of Root Causes of Labor Accidents in the Thai Construction Industry. Paper presented at the 4th Asia Pacific Structural Engineering and Construction Conference (APSEC 2000), Kuala Lumpur.
Radhakrishna, R. B. (2007). Tips for Developing and Testing Questionnaire/ Instruments. Journal of Extension, 45(1), online.
Rampal, K. G., Mohd Nizam, J., Zulfa Azlin, Z., & Noor Hassim, I. (2004). Awareness of Occupational Safety And Health Act-Ten Years After Enactment. Jurnal Kesihatan Masyarakat, 3-7.
Ranson, S., Hinings, B., & Greenwod, R. (1980). The structuring of organizational structures. Administrative Science Quarterly, 25(1), 1-17.
Reason, J. (1997). Managing the Risks of Organizational Accidents (Aldershot: Ashgate). Reason, J. (1998). Acheiving a safe culture: theory and practice. Manchester,UK: University of
Manchester. Redinger, C. F., Levine, S. P., Blotzer, M. J., and Majewski, M. P. (2002). Evaluation of an
occupational health and safety management system performance measurement tool.

231
III: Measurement of initiation elements. American Industrial Hygiene Association Journal 63, 41-46.
Reicher, A. E., and Schneider,B. (1990). Organizationa climate and culture. (1st ed.) San Francisco: Jossey-Bass: Jossey-Bass.
Rodeghier, M. (1996). Surveys with confidence: a practical guide to survey research using SPSS. Chicago: SPSS Inc.
Roughton, J. E., and Mercurio,J.J. (2002). Developing an Effective Safety Culture:A Leadership Approach.: Butterworth-Heinemann.
Rousseau, D. M. (1990). Assessing organizational culture: The case for multiple methods. In B. Schneider (Ed.), Organizational climate and culture. . San Francisco, CA Jossey-Bass.
Salkind, N. J. (Ed.). (2000). Exploring research. (Fourth ed ed.). New Jersey: Prentice Hall. Schein, E. (1992). Organisational Culture and Leadership. (2nd. ed.). San Francisco,CA: Jossey-
Bass. Schein, E. (2010). Organisational Culture and Leadership. (4 ed. Vol. 4th): John Wiley and Sons. Sekaran, U. (2000). Research methods for business. A skill-building approach. . New York: John
Wiley and Sons Seo, D. C. (2005). An explicate model of unsafe work behavior. Safety Science, 43, 187-211. Shenhar, A. J., Tishler, A., Dvir, D., Lipovetsky, S., , & Lechler, T. (2002). Refining the search for
project success factors: a multivariate, typological approach. R&D Management 32(2), 111-126.
Simard, M., and Marchand, A. (1994). Tile behavior of first-line supervisors in accident prevention and effectiveness in occupational safety. Safety Science, 17, 169-185.
Sisson, K., and K.F., Sisson. (1997). New forms of work organisation - can Europe realise its innovative potential? Results of a survey of direct employee participation in Europe. Luxembourg: European Foundation, Office for the Official Publications of the European Communities.
Siu, O., Philips D.R., & Leung, T. (2004). Safety climate and safety performance among construction workers in Hong kong: the role of psychological strains as mediators. Accident Analysis Prevention 36(3), 359-366.
Smith, A., and Wadsworth,E. (2009). Safety culture,advice and performance. Cardiff: IOSH Research Committee,Cardiff University.
SOCSO. (2005). Annual Report 2005.: Social Secirity Organisation. SOCSO. (2009). Annual Report 2009.: Social Security Organisation. SOCSO. (2010). Annual Report 2010.: Social Security Organisation. Sweet, S. A. (1999). Data Analysisi with SPSS. New York: Allyn & Bacon. Takao, Y., Aochi, S., and Suzuki, T. . (2007). A study on repeatability and reproducibility for
qualitative data (in Japanese). Proc. The 37th JSQC Annual Congress, 149-152. Tam, C. M., Zeng, S. X., & Z.M., D. (2004). Identifying Elements of Poor Construction Safety
Management in China. . Safety Science 1, 569-586. Thomas, J. G. (2002). Employee Participation in Decision Making in Extension: A Ladder of
Participation to Reduce Cynicism. Journal of Extension, 40(5). Thomas, R., and Dunkerley, D. (1999). Careering downwards? Middle managers’ expectations
in the downsized organization. British Journal of Management, 10(2), 95–184. Ticker, M. (2001). Exploring alternative research designs.: Aston University. Toole, T. M. (2002). Construction Site Safety Roles. Journal of Construction Engineering and
Management, 128(3), 203-210. von Thaden, T. L., Gibbons,A.M. (2008). The Safety Culture Indicator Scale Measurement
System(SCISMS),Technical Report HFD-08-03/FAA-08-02. . Savoy,IL: University of Illinios,Human Factors Division.
Wadsworth, E. J. K., and Smith, A. P. (2009). Safety culture, advice and performance. Policy and Practice in Health and Safety 2, 7(1).
Wagner, J. A. (1994). Participation`s effects on performance and satisfaction: A reconsideration of the research evidence. Academy of Management Review, 19, 302-330.

232
Wales, W. C. N. S. (2001). Safety meter positive performance measurement tool. Sydney: WorkCover NSW.
Wang, X., and Huang, J. (2005). The relationship between key stakeholders` project performance and project success: Perceptions of Chinese construction supervising engineers. . International Journal of Project Management 15(5), 273-281.
Wiegmann, D. A., Zhang, H., & von Thaden, T. L. (2001). Defining and assessing safety culture in high reliability systems: An annotated bibliography. Savoy,IL: University of Illinios Institute of Aviaton Technical Report.Savoy,IL: Aviation Res.Lab.
Williams, F., and Monge,P. (2001). Reasoning with statistics: How to read quantitative research.: Harcourt college publishers.
Wreathall, J. (1995). Organizational culture, behavior norms, and safety. . Paper presented at the International Topical Meeting on Safety Culture in Nuclear Installations, Vienna,Austria.
Yasin, A. (2008). A survey on worker’s perception towards workplace safety culture and the influence on safety performance among workers in the Kuantan Municipal Council. MSc Thesis., University Utara Malaysia.
Yule, S., Flin, R., & Murdy, A. (2007). The role of management and safety climate in preventing risk-taking at work. International Journal of Risk Assessment and Management, 7(2), 137-151.
Yusuf Latief, Akhmal Suraji, Yulianto S.Nugroho, & Arifudin, R. (2011). The Nature of Fall Accidents in Construction Projects: A Case of Indonesia. International Journal of Civil & Environmental Engineering., 11(5), 92-99.
Zhang, H., Wiegmann, D. A., & von Thaden, T. L. (2002). Safety culture: A concept in chaos? Paper presented at the Annual Meeting of the Human Factors and Ergonomics Society, Santa Monica, CA, Santa Monica, CA.
Zigmund, W. G. (2000). Business research methods. Ohio: South Western. Zohar, D. (1980). Safety Climate in Industrial Organizations. . Journal of Applied Psychology,
65(1), 96-102. Zohar, D. (2000). A Group-level Model of Safety Climate: Testing the Effect of Group Climate on
Micro-accidents in Manufacturing Jobs. Journal of Applied Psychology, 85, 587-596. Zohar, D., and Erev, I. (2007). On the difficulty of promoting workers' safety behaviour:
overcoming the underweighting of routine risks. International Journal of Risk Assessment and Management, 7(2), 122-135.
Zulkarnain, Z., and Hishamuddin, M.S. (2001). Analisis Data Menggunakan SPSS Windows. Johor: Universiti Teknologi Malaysia.

233
APPENDIX A
PART IV
GENERAL DUTIES OF EMPLOYEES AND SELF-
EMPLOYEED PERSONS
General duties of employers and self-employed persons
to their employees
15. (1) It shall be the duty of every employer and every self-employed person to ensure , so far as is practicable , the safety , health and welfare at work of all his employees.
(2) Without prejudice to the generality of subsection (1), the matters to which the duty extends include in particular-
the provision and maintenance of plant and systems of work that are , so far as is practicable , safe and without risks to health; the making of arrangements for ensuring , so far as is practicable , safety and absence of risks to health in connection with the use or operation , handling , storage and transport of plant and substances; the provision of such information , instruction , training and supervision as is necessary to ensure , so far as is practicable , the safety and health at work of his employees; so far as is practicable , as regards any place of work under the control of the employer of self-employed person , the maintenance of it in a condition that is safe and without risks to health and the provision and maintenance of the means of access to and egress from it that are safe and without such risks; the provisions and maintenance of a working environment for his employees that is , so far as is practicable , safe , without risks to health , and adequate as regards facilities for their welfare at work. (3) For the purposes of subsections (1) and (2) – (a) “employee” includes an independent contractor engaged by an employer or a self- employed person and any employee of the independent contractor; and (b) the duties of an employer or a self-employed person under subsection (1) and (2) extend to such an independent contractor and the independent contractors employees in relation to matters over which the employer or self-employed person- has control; or would have had control but for any agreement between the employer or self-employed person and the independent contractor to the contrary.

234
APPENDIX B
DEPARTMENT OF IRRIGATION AND DRAINAGE
MALAYSIA
(DIVISION AND FUNCTION)
Flood Management Division
Functions
To manage planning and design for flood mitigation development through structural
method
To manage and coordinate flood management program through non-structural method
To manage flood mitigation budget
River
Functions
Provide expertise services in river management in an integrated manner including
policy making and legislation and to ensure river basin managed perfectly for the
conservation of water resources quantity and quality ( Clean, Living & Vibrant River)
Coastal
Functions
To execute coastal erosions plan for the protection of all coastal areas in the critical
erosion category.
To execute improvement works on river estuaries categorised under critical conditions
to facilitate navigation .
To provide technical services towards the implementation of the coastal zone
management.

235
Water Resources Management and Hydrology Division
Functions
To collect and process hydrological data for the development and management of water
resources for now and future.
To asses hydrological data for water resources to make sure that the information given
is enough to implement the plans for development and management.
To provide hydrological services (floods and droughts) at major river basin in Malaysia
Stormwater Management
Functions
To provide expertise in storm water management through preventive measures for the
efficient and effective operation for flood using Storm Water Management Manual (Manual
Drainage, Environmental) – MSMA
Building and Infrastructure Division
Functions
To implement and coordinate building planning works including appointment of
consultants, designing and preparation of tender documents by consultants.
To focus on construction projects and renovations of buildings for agencies within the
Ministry of Natural Resources and Environment (NRE).
To provide support services for planning and design works, preparation of architectural
building plans, mechanical and engineering works as well as support services to other
Divisions of the Department.
To carry out detailed planning for all maintenance services within a building including
the implementation

236
Design and Dam Division
Functions
To provide expert advice on the structural design, geotechnical, hydraulic and materials
technology.
To provide specific design or repair/ rehabilitation of problematic structures.
To resolve problems of structures not functioning as per designed, collapsed structures
or structures in critical condition.
To coordinate safety surveillance of major DID structures
To provide infrastructure design for various departments/ agencies under the Ministry of
Natural Resources and Enviroment (NRE) and the Ministry of Agriculture and Agro-
Based Industry (MOA).
To assist in ensuring the safety of dams owned by DID and other relevant agencies.
Quantity Surveying and Contract Administration
Functions
To Implement Technical Auditing On Documents In Relation To Procurement
Management & Contract Administration For Works, Supplies & Services.
To prepare Tender Evaluation & Letter of Acceptance For Tenders Closed in JPS
Headquarters.
To Prepare Guidelines , Director General's Directive Letters, JPS Circulars As To
Enhance The Quality Of Procurement Management And Contract Administration.
To Compile And Publish Cost Informations For The Department.
To Co-ordinate The Appointment Of Consultants For The Department's.
To Identify Contractors' Claims Submitted To JPS Is 'Prima Facie'.

237
Special Project Division
Function
To ensure cost, time, quality targets and customer satisfaction of major projects are
archieved.
To carry technical auditing on Project Quality Assurance, Environmental
Management and Occupational Safety & Health of
Workers during implementation phase.
To promote best practices in Project Management
To formulate and disseminate effective procedures, processes, guidelines, standars,
templates and tools in relation to project
management.
To ensure mechanical and electrical services meet the high standards of quality
To administer contracts efficiently and effectively.
Corporate Division
Functions
Provide in planning service and department and government implementation of policies,
monitoring development programme performance, coordinate the information relating
service work, coordinate customers complaint and increase image of the department and
quality enhancement and audit performance supply ensure services JPS fulfils need and
contentment customer.
Mechanical & Electrical Division
Functions
Procurement of appropriate machineries and mechanical equipments, which are required
by the Department from time to time.
Enhancement and repair of mechanical equipments as well machineries of the
Department in particular tractors, vehicles and pumps (inclusive of fixed and mobile
pumps).
Invention and / or collection, commissioning, testing and repair of all Watergates and
the components thereof under the scheme of the Department of Irrigation and Drainage.
The design, commissioning, testing and repair of all pump and pump components
within the scheme of the Department of Irrigation and Drainage.
The design, commissioning, testing and thereafter the care for all mechanical device
utilized by the Department
Managed all selected mechanical and public engineering item.
Trained and skill build-up programs of the Department’s staffs in managing and
maintaining the Department’s mechanical items.

238
Undertake the research and development with the view to enhance and modernize the
mechanical engineering inputs of the Department to maintain the effectiveness in
meeting the Department ’s requirements.
Human Capital Development Division
Functions
Assist individuals in developing their competencies through training programmes
supported by world class infrastructure and facilities.
Provide exposure to the latest technologies and best practises to assist in competency
development.
Integrate career development programme to assist in competency development.
Conduct Assessment of competencies to facilitate the process for confirmation,
promotion and rewards.
Provide training programs to developing countrie
Management Services Division
Functions
Human Resources Management Section
Prepare and ensure all the personnel information of Management and Professional
Group and Support Group relevant,integrated and realibility. The related matters:
Intake, Placement, Promotions, Acting/Specially For Holder (KUP)
Appointment confirmation, Service Confirmation, Trial Period Extension, Pensionable
Status Conferral, Disposal/Resignation, Update and Recorded Service Books, Bearing
work, Leave Application, Pension and Application to Foreign
Manage matters Declaration Of Property, Security Filter, Examination Result(PTK),
Award, Discipline, Human Resource Management Panel, JKP and LNPT
Apply Information System in Human Resource Management

239
Financial Management Section
Prepare, manage and ensure the following based on rules treasury:
Manage Bill Payment/Emolument/Allowance/Personal Advance Clain, Imprest Retail
Money, Travel Warrant, Loan Transaction(Computer,Vehicle, Housing), Book
Management Vote Trust Account, Deposit Revenue Account/ABT dan e-SPKB
Provide Budget Runs act as Secretariat JPKA, Monthly Report Provision Finance
Manage Goods Turnover, Service and Work, e-Perolehan, Local Order, Purchasing,
Registration,Maintanance, Asset Disposal, Store Management and act as Secretariat
JKP
Secretarial And Administration
Manage and ensure:
Customer Service Management
Correspondence Management Department
File Management,Punch Card
Official Function Business
Building Maintenance/Electrical System, Telephone and Fax, Parking, Pest Control,
Canteen Service, Water Supply Cleaning and Handling Of Systems, Air
Conditioner,Development, Office Security Managemnt, Building, Tender
Provision/Contract/Quatation
Training/Course
Humid Tropics Centre Division
Functions
To standardize project’s implementation and cooperation especially in the hydrological
and water resources study
To establish a powerful networking between all the agencies in the National IHP and its
continent and worldwide center in the exchange of scientific and technical information.
To conduct and conduct appropriate courses, trainings, seminars, workshops and
meetings to generate technology ideas.
To publish and distribute hydrological and water resources-related articles

240
Smart Control Centre
Function - to alleviate flooding problem caused by the overflow of flood waters of the Sungai
Klang in Kuala Lumpur to divert flood waters at the confluence of Sungai Klang / Ampang
River into the 9.7km tunnel.
Performance Audit
Function
To perform performance and technical auditing on physical developments program to
ensure economic, efficient and effective implementation, and to produce balance and
unbias report for the top management.
To perform outcome and impact analysis on development programs and projects with
the cooperation of the Divisions and States.
To plan, implement and monitor all aspects of creative and innovative work culture
through the implementation of Innovation Action Plan.
To coordinate and monitor the progress and achievements of the Annual Business Plan.
To coordinate and monitor the progress and achievements of Key Performance
Indicators related to NRE Minister and Secretary General and also the Director General
To implement and analyze the Value Audit Scorecard of the department.
To coordinate the periodic updating of the Department’s Works Manual
To coordinate and monitor the implementation of ISO9000, EMS 14000 and OHSAS
18000 initiatives.
Information Management Division
Functions
1. ICT planning in JPS and management of ICT Division
Development of Divisional and ICT Strategic Plan
Secretariat for various ICT steering committees
Procurement management of hardware, software and ICT services
Enculturation of ICT in JPS through training, quality programs etc.
Compliance to ICT procedures and circulars.
Management of divisional administration and finance / expenditure.

241
2. Management of ICT operations and technical support
Data Centre and server management
System and Database administration
Management of e-mail system
Network management
ICT security management
Technical support and helpdesk
Hardware and software inventory management
3. Development and maintainance of application systems
Development and maintainance of application systems (inhouse and outsource)
Application Systems roll out to states/ divisions offices
Development and maintenance of JPS Website and Intranet
Development of presentation software and Multimedia.
Support the implementation of Electronic Government Systems.

242
APPENDIX C Safety Culture and Safety Climate Research 1980-2010
No. Author/s Industry
&
Sample
Data collection
& Type of
research
Factors Outcome
measures and
analysis
1. Zohar 1980)
Israel/ 20 factories(chemi cal metal, food, textile)
Data collection: Questionnaire developed for the study (40 items) Research design: Cross- sectional research.
8-Factors- Perceived important of safety training programs, Perceived management attitudes to safety; Perceived effects of safe conduct on promotion; Perceived level of risk in the workplace; Perceived effects of required workplace on safety; Perceived status of safety officer; Perceived effects of safe conduct on social status; Perceived status of safety Committee
Outcome measures: No useable safety outcome data Analysis: Exploratory factor analysis, multiple range test, expert ranking, stepwise discriminant analysis
2. Brown & Holmes (1986)
US/ Production workers in 10 manufacturing companies (n- = 425, of those 200 suffered an accident in the past year and 225 had not)
Data collection: Zohar’s (1980) questionnaire. Research design: Cross- sectional research
8-Factors- Perceived important of safety training programs, Perceived management attitudes to safety; Perceived effects of safe conduct on promotion; Perceived level of risk in the workplace; Perceived effects of required workplace on safety; Perceived status of safety officer; Perceived effects of safe conduct on social status; Perceived status of safety Committee
Outcome measure: Accident vs non-accident groups Analysis: CFA using LISREL to test Zohar’s 91980) 8-factor structure, EFA to refine solution

243
No. Author/s Industry
&
Sample
Data collection
& Type of
research
Factors Outcome
measures and
analysis
3. Dedobeleer & Beland (1991)
US/ 9 Construction companies (n=384, 71%)
Data collection: Questionnaire designed specifically for the study. Items reflected Brown & Holmes (1986) 3 factor model but the same measure were not used. Research design: Cross- sectional Research
Model 1: Management concerns, management safety activities, employee risk perception. Model 2: Management commitment, worker involvement
Outcome measure: No outcome measure Analysis: Maximum Likelihood and Weight Least Squares using LISREL
4. Cox and Cox (1991)
Europe: UK, France, Germany, The Netherlands and Belgium/ Data collection: Questionnaire developed for the study (18 items) 5-Factors -Personal skepticism Individual responsibility Safeness of the work environment Effectiveness of arrangements Outcome measure: No outcome measure
- 238 - Industrial gases company (n=630) -
Data collection: Questionnaire developed for the study (18 items) Research design: Cross- sectional research
5-Factors -Personal skepticism Individual responsibility Safeness of the work Environment. Effectiveness of arrangementsfor safety Personal immunity
Outcome measure: No outcome Measure. Analysis: Exploratory factor analysis, test-retest paradigm used to check reliability of questionnaire.
5. Ostrom, Wilhemsen & Kaplan (1993)
Ostrom, Wilhemsen & Kaplan (1993) US/ Nuclear energy laboratory (n=4000 administered across 5 departments)
Data collection: Questionnaire developed for the study (84 items) based on interviews, analysis of manager’s safety statements and literature review. Research design: Cross- sectional research
13-Factors- Safety Awareness, Teamwork, Pride and Commitment, Excellence, Honesty Communications, Leadership and Supervision, Innovation Training, Customer Relations, Procedure Compliance, Safety Effectiveness, Facilities
Outcome measure: Accident statistics by department (OSHA recordable injuries in 1991). Analysis: Descriptive statistics for individual items, not factors (do not conduct EFA to identify factors,

244
6. Donald & Canter (1994)
UK/ 10 chemical processing plants (n=701, mean response rate= 53.8%)
Data collection: 167 item questionnaire developed for the study and mapping sentences used for question templates Research design: Cross- sectional research
Data collection: 167 item questionnaire developed for the study and mapping sentences used for question templates Research design: Cross- sectional research People (Self, workmates, supervisors, managers, safety representatives) Attitude behaviour (satisfaction, Knowledge, Action, Passive safety behaviour, Active safety behaviour
Outcome measure: Self-reported accidents Analysis: Pearson correlations
7. Niskanen, (1994)
Finland/road maintenance, construction and repair. Workers n=1890 and supervisors n=562
Data collection: Questionnaire developed for the study (25 itemsworkers; 18 items – supervisors) Research design: Cross- sectional research
4-Factors (workers): Attitudes towards safety in organization, Changes in work demands, Appreciation of the work, Safety as part of productive work 5-Factors (supervisors): Changes in job demands, attitudes towards safety in the organization, value of the work, safety as part of productive work
Outcome measure: High-accident rate vs low accident rate. Analysis: Descriptive analyses, ttests, exploratory actor analysis
8. Rundmo (1994)
Norway 8 offshore oil platforms from 5 oil companies (n=915)
Data collection: Questionnaire, Developed from literature search/ sources of risks from accidents statistics Research design: Cross-sectional research
4-Factors -Safety and contingency factors, commitment and involvement in safety work, social support, attitudes to accident prevention
Outcome measure: No additional outcome measures Analysis: Exploratory Factor Analysis, SEM using LISREL
9. Coyle, Sleeman & Adams (1995)
Australia/Cleri cal and service (total n=880), Organisation 1: (n=340, 56%), Organisation 2: (n=540, 63%)
Data collection: 30-32 questionnaire developed for the study (26 items constant between organisation) developed by interviews and group work. Research design: Cross- sectional research
7-Factors- Maintenance and management issues, Company policy, Accountability, Training and management attitudes, Work environment, Policy/procedures, Personal Authority
Outcome measure: No outcome measure Analysis: Exploratory Factor Analysis, checks for concurrent validity
10. Hoffmann & Stetzer (1996)
US Chemical processing (n= 204 for analysis)
Data collection: Questionnaire comprising published scales and scales developed specifically for the
4 -Factors- Role overload, perceptions of work group processes, approach intentions, unsafe behaviours
Outcome measures: OSHA recordable accidents for previous 2 years, self reported

245
study. 9 items were based on Zohar’s (1980) safety climate scale Research design: Cross-sectional research
unsafe behaviours, Analysis: Regression (ordinary least squares), correlations
11. Williamson, Feyer, Cairns & Biancotti (1997)
Australia/Heav y and light manufacturing; outdoor workers (n=660, 42%)
Data collection: Questionnaire developed from literature and previous themes (62 items – reduced to 32 items) Research design: Cross- sectional
research
8-Factors- Safety awareness, safety responsibility, safety priority, management safety commitment, safety control, safety motivation, safety activity, safety evaluation
Outcome measures: self reported accident involvement, perceptions of workplace dangers. Analysis: Exploratory factor analysis, one-way ANOVA.
12. Diaz & Cabrera (1997)
Spain./Aviatio n (ground handling, fuel company and airport authority), n=166)
Data collection: Questionnaire developed for the study (45 items). Research design: Cross- sectional research
6-Factors- company policies towards safety, Emphasis on productivity vs safety, Group attitudes towards safety, Specific strategies for prevention, Safety level perceived in the airport, Safety level perceived on the job
Outcome measures: Self reported safety level (including previous/ probability of future incidents. Analysis: Inter-company differences using ANOVA, correlations, regression
13. Lee (1998) UK/ Nuclear Power Plant
(n=5296)
Data collection: Questionnaire developed for the study (172 items). Research design: Cross- sectional research
38 -factors (reduced to 15 through domain analysis)- Confidence in safety procedures, Personal caution over risks, Perceived level of risk at work, Trust in workforce, Personal interest in job, Contentment with job, Satisfaction with work relationships, Satisfaction with rewards for good work, Personal understanding of safety rules, Satisfaction with training, Satisfaction with staff suitability, Perceived source of safety suggestions, Perceived source of safety actions, Perceived personal control over safety, Satisfaction with design of plant
Outcome measures: 3- day loss-time accidents. Analysis: Exploratory factor analysts, t-tests, discriminant function analysis. (explain each factor interpretation

246
14. Mearns, Flin, Gordon & Fleming (1998)
UK/ 10 Offshore oil and gas production (n=722, 33%)
Data collection: Questionnaire developed for this study - Offshore Safety Questionnaire (OSQ - 52 items) Data collection: Cross- sectional
research
Work environment (2 scale from Moos & Insel, 1974), job communication, safety behaviour, risk perception, safety attitudes, accident history.
Outcome measures: Selfreported accidents (in previous 2 years on site) Analysis: Descriptive analysis by factor (i.e., % agree/disagree) , Exploratory factor analysis, t-tests,
ANOVA.
15. Cheyne, Cox, Oliver & Tomas (1998)
UK and France/ Multinational manufacturing (n=915)
Data collection: Questionnaire based on Cox & Cox (1991) and Tomas Oliver (1995) (30 items). Data collection: Cross- sectional
research
5-Factors-Safety management, Communication, Individual responsibility, Safety standards and goals, Personal
involvement
Outcome measures: Employees’ self-reported safety activities. Analysis: Structural Equation Modelling (SEM), MANOVA, ANOVA
16. Caroll (1998)
US/ Nuclear power plant
Data collection: 45 item questionnaire developed for the study plus two open ended question, Group interview based on the results of the questionnaire Data collection: Cross- sectional
research.
5 -Factors-Management support, Openness, Knowledge, Work practices, Attitudes.
Outcome measures: No outcome measures. Analysis : Questionnaire data were analyzed in descriptive manner (i.e. % agree/disagree) , interview data were thematically grouped.
17. Cox, Tomas, Cheyne & Oliver (1998)
UK/ 13 manufacturing companies
(n=3329, 73%)
Data collection: 19 item questionnaire developed for use in manufacturing and piloted using discussion groups with safety professionals and employees. Research design: Cross- sectional research
3-Factors-Management actions for safety, Quality of safety training, Personal actions for safety
Outcome measures: Employee appraisals of organizational commitment to safety. Analysis: ANOVA, multiple linear regression, structural equation modelling (SEM).
18. Cheyne, Tomas, Cox & Oliver (1999)
UK/Manufact uring, Dairy & Transport workforce (n=2429, 67%)
Data collection: Cox et al 1998 questionnaire with minor contextual alterations.
4 -Factors –Management actions and responsibility for safety, Personal actions and responsibility for safety, Quality of safety training, employee
Outcome measures: employee appraisals of organizational commitment to safety.

247
appraisals of organisational commitment to safe
Analysis: ANOVA, Structural Equation Modelling (SEM) using EQS.
19. Clarke (1999)
UK Train operating companies, workforce (train drivers, n=186), supervisors (n=55), senior managers (n=71) Total response
rate= 22%
75 item Questionnaire, developed on the basis of accident reports and discussions with managers. (25 unique items completed 3 times: from personal viewpoint then from view of worker/ supervisor/
manager as
5-Factors-Unsafe conditions, managerial decisions, working conditions, local management, line functions
Outcome measures: No outcome measures Analysis: Exploratory factor Analysis, one-way MANOVA
20. Collinson (1999)
UK/ Oil and gas
Data collection: Interview Research design:
Qualitative
Qualitative data. Outcome measures: No outcome measures. Analysis: qualitative
21. Griffin & Neal (2000)
Australia/ Manufacturing & Mining (n=1403 workforce members, 1264 used in analysis, response rate not available as data were obtained from archival records)
Data collection: Questionnaire developed for the study. Research design: Cross- sectional
research
6-Factors-Manager Values, Safety Inspection, Personnel Training, Safety Communication, safety knowledge, safety compliance, safety participation
Outcome measures: Self reported safety compliance and safety participation. Analysis: Confirmatory Factor Analysis (CFA), Structural Equation Modelling (SEM).
22. Neal, Griffin & Hart (2000
Australia/ Healthcare (n=525 workforce,
56%).
Data collection: 59-item questionnaire comprising scales that are published (eg. Organizational climate, Hart et.al., 1996), and those that were developed specifically. Research design Cross- sectional Research
Organisational climate, safety climate, determinants of safety performance (knowledge, motivation), components of safety performance (compliance participation)
Outcome measures: Self-reported safety compliance and safety participation. Analysis: Structural Equation Modeling (SEM)

248
23 Glendon & Litherland (2001)
Road Construction (Australia)
Data collection: Safety Climate Questionnaire (SCQ) developed by Glendon et al (1994) with some modification. Research design:
6-Factors: Communication and support Adequacy of procedures Work pressure Personal Protective Equipment Relationships Safety Rules
Outcome measure: Unsafe behaviour Analysis: EFA, MANOVA, Multiple regression
24 O’Toole (2002)
US/Mining & construction (n=1414, 45.3%)
Data collection: Questionnaire based on Bailey & Peterson Research design: Cross- sectional research
7-Factors - Management’s Commitment to Safety Education and Knowledge Safety Supervisory Process Employee Involvement and Commitment Drugs and Alcohol Emergency Response Off-the Job Safety
Outcome measure: Injury rate (however it is not possible to infer with statistical due to nonexperimental design) Analysis: Factor analysis
25 Zohar & Luria (2003)
Israel/Manufac turing (Company A, n=121 line workers, n=13 shop floor supervisor; Company B, n=248 line workers, n=23 shop floor supervisor, Company C,
Data collection: Group Safety Climate 10 items questionnaire with 2 sub-scales: Supervisory Action and Expectation (Zohar, 2000) Research design: Longitudinal
Group Safety Climate 10 items questionnaire with 2 sub-scales: Supervisory Action Expectation (Zohar, 2000)
Outcome measure: Safety behaviour Analysis: Correlation analysis, ttest, percentage
26. Seo, Torabi, Blair & Ellis (2004)
US/Grain industry (n=722 , 98%)
Data collection: Questionnaire developed for this study. Type of research: Cross-sectional research.
5-Factors- Management commitment , Supervisor support, Co-worker support, Employee participation, Competence level
Outcome measure: No outcome measure Analysis: Descriptive statistics, EFA, CFA
27 Seo (2005) US/ 722 workers throughout the nation who worked for grain elevator facilities.
Data collection: Questionnaire based on Seo et al., (2004 Type of research: Cross-sectional research.
5-Factors- Management commitment , Supervisor support, Co-worker support, Employee participation, Competence level
Outcome measure: unsafe behaviours Analysis: SEM (using Lisrel)
28 Neal & Griffin (2006)
Australia/700 staffs in an Australian hospital. Year 1 – n= 430 (61%) Year 2 – n=490 (52%) Year 4 – n=301 (46%)
Data collection: Questionnaire based on Neal et al. (2000) Type of research: Longitudinal research.
1-Factor - consists of 3 items: Management places a strong emphasis on workplace health and safety Safety is given a high priority by management. Management considers safety to be important. (Based on Neal et al. 2000)
Outcome measure: Safety behaviour Analysis: EFA, Pearson correlations, ANOVA,
29 Findley, Smith, Gorski & O’neil
US/ Nuclear (n= 1587 workers, 48.1%)
Data collection: Health and Safety Climate Survey Tool (CST)
11-Factors: Organisational commitment and communication Line management
Outcome measure No outcome measure

249
(2007) published by the Health and Safety Executive (1997), the UK’s government agency counterpart of the US Department of labour’s OSHA. Type of research: Cross-sectional
commitment Supervisor’s role Personal role Co-worker’s influence Competence Risk taking behaviour Obstacles to safe behaviour Permit-to-work Reporting of accidents and near misses Job satisfaction
Analysis: PCA, mean score
30 Kao, Lai, Chuang & Lee (2008
Taiwan/petroc hemical plants (n=533) Data Collection: Adapted from Safety culture developed
Data Collection: Adapted from Safety culture developed by International Atomic Energy Authority he
8-Factors: Safety commitment and support, Safety attitude and behaviour, Safety communication and involvement, Safety training and competence, Safety supervision and audit, Safety management system and organisation, Accident investigation and emergency planning, Reward and punishment and benefit
Outcome measure: Analysis: EFA,ANOVA. Correlation analysis, multiple stepwise regression analysis
31 Ma & Yuan (2009)
China/1060 employees from 144 enterprise; (75.1% response rate)
Data collection: Using safety climate scale of Lin et al., (2008) a questionnaire with 21 items was designed for all of the industrial sectors in Fujian province in Southeastern China But using 6factor instead of 7 factor (Lin et al. 2008)
Employees safety commitment, Management support, Risk judgement, Safety communication, Employees safety competency, Safety training
Outcome measure: No outcome measure Analysis: CFA, one way ANOVA
32 Abdullah, Spickett, Rumchev, & Dhaliwal, . (2009)
Malaysia/Healt hcare (n=418, 43.15% response rate)
Data Collection: Adapted from Flin, Mearns & Burn (2004) Safety Climate Assessment Tool. Type of research: Cross-sectional
10-Factors: Safety communication, Safety involvement, Training & competence, safety reporting, Work pressure, Management safety commitment, Safety objectives, Role of supervisor in safety and health, Leadership style
Outcome measure: Safety satisfaction and feedback Analysis: Descriptive statistics EFA, ANOVA, ttest
33 Luria & Yagil (2010)
90 employees in 11 manufacturing organisation. Metal & aviation industries (5) Food industries (4) Chemical industry (1) Plastic industry
Data collection: Semi-structured interview and survey. Type of research: Cross-sectional
19 themes based on content analysis: Relationship between employees Transactional leadership People-oriented leadership Task-oriented safety leadership Overall leadership evaluation Safety training Rewards and sanctions for Safety,safety resources
Outcome measure: No outcome measure Analysis: Content analysis, ANOVA

250
APPENDIX D

251
Dear Respondent,
The research is conducted for the purpose of completing my PhD at the University of Malaya.
I am studying the occupational safety and health ( OSH ) management practices on Department
of Irrigation and Drainage Malaysia. The title of this research is `Relationships between Safety
Climate Factors and Occupational Safety and Health (OSH) Level of Awareness in
Malaysian Government Agencies’.
I would greatly appreciate your participation in this project, by completing the attached
questionnaire and allow follow-up interview to explore issues in more depth. All Information
obtained from this questionnaire will be treated confidential and participant`s identity will
remain anonymous. The results will be used for academia proposes only, and might be included
in an academia publication.
This questionnaire seeks information about the degree of implementation of OSH practices in
your office. You will ask to consider how these various elements are managed in your
organization. In answering each question, please be objective as possible remembering /that
biases sometimes ` cloud` the real answer. Your responses should reflect the situation in your
section/ organization. The validity of this research largely depends on the accuracy of your
answer.
Thank you in advance for your participation in the completion of this questionnaire.
ABU HANIPAH BIN RAMLI
FACULTY OF ENGINEERING,
UNIVERSITY OF MALAYA,
Kuala Lumpur.
E-mail: [email protected]
HP: 013-3574909
APPENDIX E

252
SURVEY QUESTIONNAIRE
Section 1: Respondent personel profile
Please circle the answer that is relevant to you.
Designation
[a.] Manager ( J54-above )
[b.] Engineer ( J41-J52 )
[c. ] Assistant Engineer ( J29-J38)
[d.] Technician ( J17-J26 )
Education Level
[a.] SPM-below…
[b.] Technical Certificate
[c.] Diploma
[d.] Degree
[e.] Master and above…
3. Age _____________ years old.
4. Working Experience _____________ years.
Note :
OSH = Occupational Safety and Health
PPE = Personel Protective Equipment

253
Section 2: We would like to know how much you agree or disagree with each of the following
statements related to your organization. Responses are indicated by a single digit on the severity of
agreement/disagreement scale illustrated below :
MANAGEMENT COMMITMENT
Please tick the appropriate box to indicate your level of agreement
Strongly Disagree
( 1 )
Disagree
( 2 )
Moderate
( 3 )
Agree
( 4 )
Strongly Agree
( 5 )
1. The organization puts sufficient resources into OSH.
2. Senior managers take OSH issues into account when making decisions.
3. Management readily acts upon OSH suggestions from staff.
4. I get good response from my manager when I raise a OSH issue with him.
5. I am provided with suitable and sufficient PPE for my job.
6. Management places a low priority on Health and Safety Training.
7. Managements only looks at OSH after there has been an accident.
8. There is a reward and recognition program for innovation in OSH.
9. Management’s promotion of a work culture is supportive of OSH .

254
EMPLOYEES PARTICIPATION
Please tick the appropriate box to indicate your level of agreement
Strongly Disagree
( 1 )
Disagree
( 2 )
Moderate
( 3 )
Agree
( 4 )
Strongly Agree
( 5 )
10. I have responsibilities for the OSH of myself and my colleagues.
11. I am aware of the safety system of the work before I start a job.
12. Discussions on OSH at meetings(team and safety related meeting) are frank and open.
13. I have opportunity to discuss the day –to-day job plan with my manager or immediate superior.
14. Management and the workforce work together as a team to tackle OSH and other work related problems.
15. Everybody understand their OSH responsibility and acts accordingly.
16. When I see a potential OSH hazard, I am willing to correct it myself if possible.
17. My workmates would react strongly against a person who breaks safety and health procedures /rules.
18. People here always work safely even when they are not being supervised
19. I am willing to warn my co-employees about working unsafely.
20. I sometimes take shortcuts in performing my job when sensible to do so.

255
TRAINING AND EDUCATION(safety prevention/control system)
Please tick the appropriate box to indicate your level of agreement
Strongly Disagree
( 1 )
Disagree
( 2 )
Moderate
( 3 )
Agree
( 4 )
Strongly Agree
( 5 )
21. The training I had attended covered all Safety and Health risks associated with the work for which I am responsible.
22. I have received training in the emergency procedures and arrangements for my workplace.
23. Accident investigations are mainly used to identify OSH hazards in the workplace.
24. I have been briefed to identify OSH hazards in the workplace.
25. Organization’s senior leaders received specific OSH education.
26. Employees have been given specific OSH education.
27. OSH component is included in all new employee orientation programs.
28. All staff, employees and managers receive specific training in procedures to identify and report OSH concerns, adverse events, near misses and errors.

256
COMMUNICATION
Please tick the appropriate box to indicate your level of agreement
Strongly Disagree
( 1 )
Disagree
( 2 )
Moderate
( 3 )
Agree
( 4 )
Strongly Agree
( 5 )
29. There are good communications here about Safety and Health issues.
30. I received useful and accurate OSH information.
31. The company encourages suggestions on how to improves safety and health conditions.
32. There is good feedback from management on reported OSH issues.
33. I can report an accident or near-miss without fear of blame of retribution.
34. Accident which happen here are always reported.
35. Information on current OSH performance is easily available.
36. I am given sufficient information on management’s decisions regarding matters of OSH.
37. I believe that management have communicated a clear vision of OSH to them.
38. Some safety and health procedures/rules are not really practical.
39. The company has a good system for identifying and dealing with OSH problems.

257
LEVEL OF AWARENESS( LoA) OF OCCUPATIONAL SAFETY AND HEALTH
OSH Orientation
Please tick the appropriate box to indicate your level of agreement
Strongly disagree
Disagree Moderate Agree Strongly Agree
40. I feel safe at my workplace.
41. My organization takes all OSH measure to ensure employees safety.
42. My organization has Occupational Safety and Health policy.
Policy
Please tick the appropriate box to indicate your level of agreement
Strongly disagree
Disagree Moderate Agree Strongly Agree
43. The policy meets the legal requirements and best practices of occupational safety and health.
44. The policy is up to date.
45. The policy is being implemented effectively.
Monitoring
Please tick the appropriate box to indicate your level of agreement
Strongly disagree
Disagree Moderate Agree Strongly Agree
46. My organization provides safety and health information to employees.
47. My organization has a safety and health committee.
48. My organization sets safety and health objectives on an organization level.
49. My organization sets safety and health objectives on an individual level.

258
Risk Assessment
Please tick the appropriate box to indicate your level of agreement
Strongly disagree
Disagree Moderate Agree Strongly Agree
50. The workplace risk assessment are being carried out.
51. The systems are in placed to ensure risk assessment are reviewed when appropriate.
52. OSH inspection are being carried out.
53. My organization has a system for reporting accidents.
54. My organization has an audit system in place.
Review
Please tick the appropriate box to indicate your level of agreement
Strongly disagree
Disagree Moderate Agree Strongly Agree
55. My organization has procedures for safety and health .
56. My organization reviews safety and health implementation.
Thank you for your cooperation
ABU HANIPAH BIN RAMLI
FACULTY OF ENGINEERING
UNIVERSITI OF MALAYA.
Kuala Lumpur.
E-MAIL: [email protected]
HP: 013-3574909

259
Kepada Responden,
Kajian ini dijalankan dengan tujuan bagi melengkapkan pengajian saya di peringkat PhD di
Universiti Malaya. Saya mempelajari mengenai Pengurusan Keselamatan dan Kesihatan
Pekerjaan yang dipraktikkan di Jabatan Pengairan dan Saliran, Malaysia. Tajuk Kajian saya
ialah ‘Hubungan Antara Faktor-faktor Iklim Keselamatan terhadap Tahap Kesedaran
Keselamatan dan Kesihatan Pekerjaan Di Dalam Agensi-Agensi Kerajaan di Malaysia.’
Saya sangat menghargai penyertaan anda di dalam kajian ini, dengan melengkapkan borang
soal-selidik yang disertakan dan membenarkan temu bual susulan bagi mengkaji isu ini dengan
lebih mendalam. Segala maklumat yang diperolehi dari soal-selidik ini adalah sulit dan identiti
responden tidak dikenali. Hasil kajian akan digunakan bagi tujuan akademik dan mungkin akan
diterbitkan dalam penerbitan akademik.
Soal selidik ini mengenal pasti maklumat mengenai tahap implementasi Keselamatan dan
Kesihatan Pekerjaan di pejabat anda. Maklumat yang anda berikan boleh mempengaruhi situasi
di dalam organisasi anda. Kesahan kajian ini sangat bergantung pada ketepatan jawapan yang
anda berikan.
Terima kasih diucapkan di atas penyertaan anda dalam kajian ini.
ABU HANIPAH BIN RAMLI
FAKULTI KEJURUTERAAN
UNIVERSITI MALAYA.
Kuala Lumpur.
E-MAIL: [email protected]
HP: 013-3574909
APPENDIX F

260
SOALAN SOALSELIDIK
Seksyen 1: Maklumat Peribadi Responden
Sila jawab soalan berikut mengenai diri anda.
Jawatan
[a.] Pengurusan ( J54-ke atas )
[b.] Jurutera ( J41-J52 )
[c. ] Penolong Jurutera ( J28-J38)
[d.] Juruteknik ( J17-J26 )
Taraf Pendidikan
[a.] SPM-ke bawah
[b.] Sijil Teknikal
[c.] Diploma
[d.] Sarjana Muda
[e.] Sarjana- ke atas
3. Umur _____________ tahun.
4. Pengalaman _____________ tahun.
Bekerja
Nota :
K&K = Keselamatan Dan Kesihatan

261
Seksyen 2: Anda diperlukan menyatakan sejauh mana anda bersetuju atau tidak bersetuju dengan
setiap pernyataan mengenai organisasi anda merujuk kepada skala berikut:
SOKONGAN PENGURUSAN.
Sila tanda petak yang sesuai untuk menunjukkan tahap persetujuan anda
Sangat Tidak Setuju
( 1 )
Tidak setuju
( 2 )
Sederhana
( 3 )
Setuju
( 4 )
Sangat Setuju
( 5 )
1. Organisasi menyediakan sumber mencukupi terhadap K&K
2. Pengurusan Kanan mengambil kira isu K&K apabila membuat keputusan.
3. Pengurusan bersedia mengambil tindakan terhadap cadangan mengenai K&K daripada pekerja.
4. Saya diberi perhatian oleh Pengurus apabila mengemukakan isu K&K kepada beliau.
5. Saya dibekalkan dengan Peralatan Keselamatan yang lengkap untuk menjalankan kerja.
6. Pengurusan tidak mengutamakan Program Latihan K&K.
7. Pengurusan hanya mengambil tindakan selepas berlaku kemalangan.
8. Pengurusan menyediakan anugerah dan pengiktirafan terhadap program Inovasi dalam K&K.
9. Pengurusan sangat menyokong program membudayakan K&K di tempat kerja.
Nota:
K&K = Keselamatan Dan Kesihatan

262
PENGLIBATAN PEKERJA
Sila tanda petak yang sesuai untuk menunjukkan tahap persetujuan anda
Sangat Tidak Setuju
( 1 )
Tidak setuju
( 2 )
Sederhana
( 3 )
Setuju
( 4 )
Sangat Setuju
( 5 )
10. Saya mempunyai tanggungjawab terhadap K&K diri sendiri dan rakan sekerja.
11. Saya sedar akan ‘Sistem Kerja Selamat’ sebelum memulakan kerja.
12. Dalam mesyuarat, perbincangan mengenai K&K adalah terbuka dan bebas.
13. Saya berpeluang berbincang mengenai ‘pelan kerja harian’ bersama Pengurus/ Pegawai Kanan.
14. Pengurusan dan keseluruhan kakitangan akan bekerjasama bagi mengendali masalah K&K dan masalah lain.
15. Semua orang memahami tanggungjawab masing-masing terhadap K&K dan bertindak sewajarnya.
16. Apabila saya nampak akan potensi masalah K&K, saya akan menyelesaikan bersendiri an sekadar mampu.
17. Rakan sekerja saya akan bertindak sewajarnya terhadap sesiapa yang melanggar peraturan /prosedur K&K.
18. Pekerja di sini sentiasa bekerja secara selamat walaupun mereka tidak diawasi.
19. Saya akan memberi amaran kepada rakan sekerja yang tidak mementingkan K&K.
20. Saya kadang-kadang mengambil jalan mudah dalam menjalankan kerja, jika berpeluang melakukannya.
Nota:
K&K = Keselamatan Dan Kesihatan

263
PENDIDIKAN DAN LATIHAN( pencegahan keselamatan/sistem kawalan)
Sila tanda petak yang sesuai untuk menunjukkan tahap persetujuan anda
Sangat Tidak Setuju
( 1 )
Tidak setuju
( 2 )
Sederhana
( 3 )
Setuju
( 4 )
Sangat Setuju
( 5 )
21. Program Latihan yang telah saya hadiri merangkumi kesemua risiko yang berkaitan dengan K&K dalam kerja yang saya lakukan
22. Saya menerima latihan berkenaan Prosedur dan Aturan Kecemasan bagi tempat kerja saya.
23. Penyiasatan kemalangan sangat digunakan dalam mengenal pasti bahaya K&K di tempat kerja.
24. Saya telah diajar untuk mengenal pasti bahaya K&K di tempat kerja.
25. Pengurusan Kanan Organisasi telah menerima latihan K&K yang khusus.
26. Semua pekerja telah diberi pendidikan K&K secara khusus.
27. Semua aspek K&K termasuk di dalam Program Orientasi Pekerja Baru.
28. Semua kakitangan, pekerja dan Pengurusan menerima latihan khusus dalam prosedur untuk mengenal pasti dan melaporkan urusan K&K, pelanggaran peraturan, kemalangan nyaris dan kesilapan.
Nota:
K&K = Keselamatan Dan Kesihatan

264
KOMUNIKASI ( PERHUBUNGAN )
Sila tanda petak yang sesuai untuk menunjukkan tahap persetujuan anda
Sangat Tidak Setuju
( 1 )
Tidak setuju
( 2 )
Sederhana
( 3 )
Setuju
( 4 )
Sangat Setuju
( 5 )
29. Komunikasi berkaitan isu-isu K&K sangat baik di tempat kerja saya
30. Saya menerima maklumat K&K yang berguna dan tepat
31. Organisasi menggalakkan cadangan bagaimana untuk memperbaiki keadaan K&K.
32. Pengurusan memberikan tindakan susulan yang baik terhadap Laporan isu-isu K&K.
33. Saya boleh melaporkan tentang kemalangan tanpa rasa takut.
34. Setiap kemalangan yang berlaku di tempat kerja dilaporkan
35. Maklumat mengenai prestasi semasa K&K mudah diperolehi
36. Saya diberi maklumat yang mencukupi mengenai keputusan Pengurusan terhadap perkara-perkara berkaitan K&K.
37. Saya percaya bahawa Pengurusan telah memahami `hala tuju` yang jelas mengenai K&K.
38. Sebahagian Prosedur/Peraturan K&K tidak praktikal untuk dilaksanakan.
39. Organisasi mempunyai sistem yang baik dalam mengenal pasti dan berhadapan dengan masalah K&K.
Nota:
K&K = Keselamatan Dan Kesihatan

265
TAHAP KESELAMATAN DAN KESIHATAN PEKERJAAN ( K&K).
Orientasi K&K
Sila tanda petak yang sesuai untuk menunjukkan tahap persetujuan anda
Sangat Tidak Setuju
( 1 )
Tidak setuju
( 2 )
Sederhana
( 3 )
Setuju
( 4 )
Sangat Setuju
( 5 )
40. Saya rasa selamat di tempat kerja .
41. Organisasi saya mengambil kira kesemua aspek K&K bagi memastikan para pekerja selamat.
42. Organisasi saya mempunyai Polisi K&K.
Polisi
Sila tanda petak yang sesuai untuk menunjukkan tahap persetujuan anda
Sangat Tidak Setuju
( 1 )
Tidak setuju
( 2 )
Sederhana
( 3 )
Setuju
( 4 )
Sangat Setuju
( 5 )
43. Polisi tersebut mencapai keperluan dan amalan-amalan baik Perundangan K&K .
44. Polisi tersebut dikemas kini .
45. Polisi tersebut dilaksanakan secara berkesan .
Pengawasan
Sila tanda petak yang sesuai untuk menunjukkan tahap persetujuan anda
Sangat Tidak Setuju
( 1 )
Tidak setuju
( 2 )
Sederhana
( 3 )
Setuju
( 4 )
Sangat Setuju
( 5 )
46. Organisasi saya menyalurkan maklumat mengenai K&K kepada para pekerja .
47. Organisasi saya mempunyai Jawatankuasa Keselamatan dan Kesihatan Pekerjaan(K&K).
48. Organisasi saya menetapkan objektif K&K di peringkat Organisasi
49. Organisasi saya menetapkan objektif K&K di peringkat Individu .

266
Penilaian Risiko
Sila tanda petak yang sesuai untuk menunjukkan tahap persetujuan anda
Sangat Tidak Setuju
( 1 )
Tidak setuju
( 2 )
Sederhana
( 3 )
Setuju
( 4 )
Sangat Setuju
( 5 )
50. Penilaian Risiko di tempat kerja dilakukan
51. Organisasi sentiasa bersedia bagi memastikan Penilaian Risiko dijalankan apabila perlu .
52. Pemeriksaan Keselamatan dan Kesihatan ( K&K) dijalankan.
53. Organisasi saya mempunyai Sistem Pelaporan Kemalangan .
54. Organisasi saya mempunyai Sistem Audit .
Kajian Semula
Sila tanda petak yang sesuai untuk menunjukkan tahap persetujuan anda
Sangat Tidak Setuju
( 1 )
Tidak setuju
( 2 )
Sederhana
( 3 )
Setuju
( 4 )
Sangat Setuju
( 5 )
55. Organisasi saya mempunyai Prosedur K&K .
56. Organisasi saya mengkaji semula Pelaksanaan K&K .
Terima Kasih di atas Kerjasama Anda.
ABU HANIPAH BIN RAMLI
FAKULTI KEJURUTERAAN
UNIVERSITI MALAYA.
Kuala Lumpur.
E-MAIL: [email protected]
HP: 013-3574909

267
APPENDIX G

268
APPENDIX H

269
APPENDIX I

270
APPENDIX J

271
APPENDIX K
TEST OF NORMALITY
Tests of Normality
Kolmogorov-Smirnova Shapiro-Wilk
Statistic df Sig. (p) Statistic df Sig.
DEP1 .150 83 .096 .927 83 .124
a. Lilliefors Significance Correction
Tests of Normality
Kolmogorov-Smirnova Shapiro-Wilk
Statistic df Sig. (p) Statistic df Sig.
DEP2 .098 81 .053 .978 81 .169
a. Lilliefors Significance Correction
Tests of Normality
Kolmogorov-Smirnova Shapiro-Wilk
Statistic df Sig. (p) Statistic df Sig.
DEP3 .114 104 .152 .972 104 .084
a. Lilliefors Significance Correction
Tests of Normality
Kolmogorov-Smirnova Shapiro-Wilk
Statistic df Sig. (p) Statistic df Sig.
DEP4 .162 106 .246 .949 106 .136
a. Lilliefors Significance Correction
*According to Kolmogorov-Smirnov test, if the sig (p)≥ 0:05, the data are normally distributed
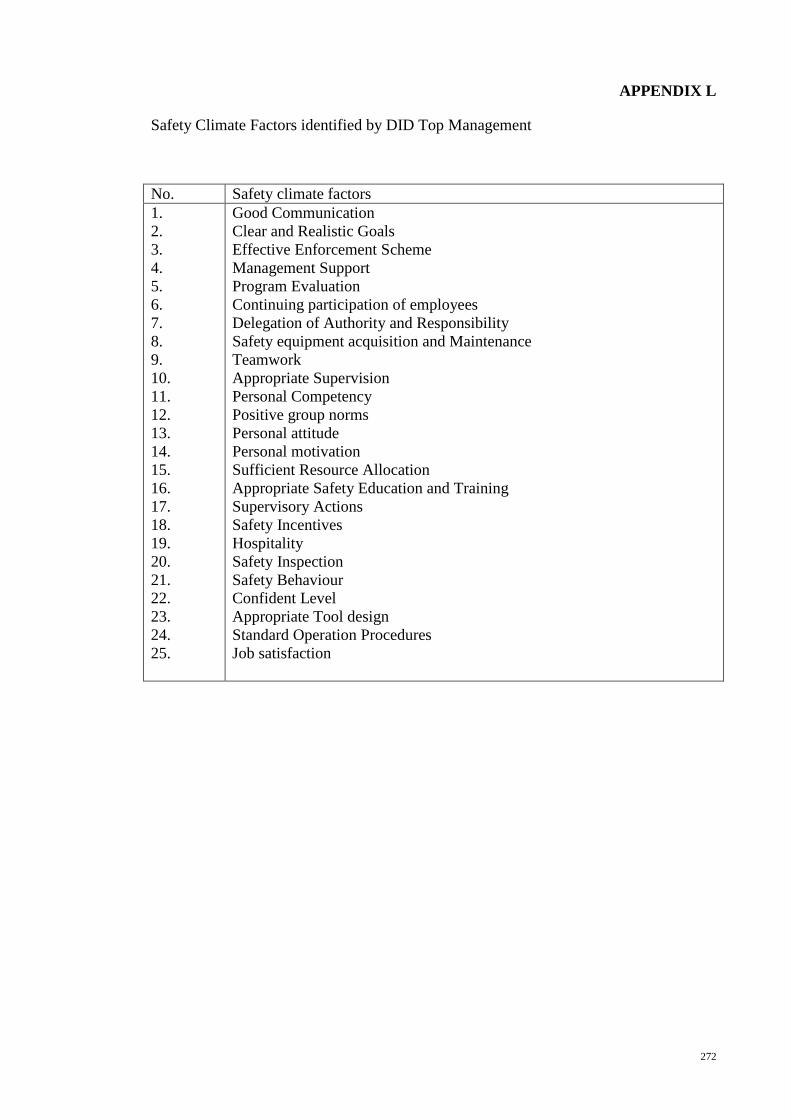
272
APPENDIX L
Safety Climate Factors identified by DID Top Management
No. Safety climate factors
1.
2.
3.
4.
5.
6.
7.
8.
9.
10.
11.
12.
13.
14.
15.
16.
17.
18.
19.
20.
21.
22.
23.
24.
25.
Good Communication
Clear and Realistic Goals
Effective Enforcement Scheme
Management Support
Program Evaluation
Continuing participation of employees
Delegation of Authority and Responsibility
Safety equipment acquisition and Maintenance
Teamwork
Appropriate Supervision
Personal Competency
Positive group norms
Personal attitude
Personal motivation
Sufficient Resource Allocation
Appropriate Safety Education and Training
Supervisory Actions
Safety Incentives
Hospitality
Safety Inspection
Safety Behaviour
Confident Level
Appropriate Tool design
Standard Operation Procedures
Job satisfaction

273
APPENDIX M

274

275
APPENDIX N
MINIMUM VALUES OF CVR
One Tailed Test, p=0.05
No. Of Panelists
Min Value
5
0.99
6
0.99
7
0.99
8
0.75
9
0.78
10
0.62
11
0.59
12
0.56
13
0.54
14
0.51
15
0.49
20
0.42
25
0.37
30
0.33
35
0.31
40
0.29
Source: Lawshe, 1975

276
APPENDIX O
Please rank the statement, as what you think it should be......
1= Essential 2= Useful but not essential 3= Not necessary
No. Variables 1 2 3 4 5 6 7 8 9 10 11 12 13 14 15 16 17 18 19 20 21 22 23 24 25 26 27 28 29 30 CVR
1 Good
Communication 1 2 1 1 1 2 1 1 1 1 1 1 2 1 3 1 2 1 1 1 1 3 1 1 1 2 1 1 1 1 0.53
2 Hospitality
1 1 1 2 1 1 2 1 1 1 3 1 1 1 1 3 3 1 2 1 2 1 2 1 2 1 3 1 2 2 0.20
3 Clear and
Realistic Goals 1 1 1 2 1 1 1 1 2 1 1 1 1 2 1 1 1 2 1 1 2 1 3 1 1 3 1 1 1 2 0.46
4 Effective
Enforcement
Scheme
1 2 1 1 1 3 1 1 3 1 1 2 1 1 2 1 1 2 1 1 1 2 1 1 3 1 1 1 3 3 0.33
5 Safety
Incentives 2 1 1 1 2 1 1 1 1 2 1 1 1 1 1 1 2 2 1 1 1 2 1 2 1 1 2 2 2 2 0.26
6 Management
Support 3 1 1 1 1 1 3 1 1 1 1 3 1 1 1 1 2 1 1 1 1 1 2 1 1 1 1 1 1 1 0.66
7 Safety
Inspection 2 2 1 1 1 1 1 1 1 1 1 3 1 1 3 3 1 1 1 2 1 2 1 1 2 1 2 3 3 1 0.26
8 Program
Evaluation 2 1 1 1 2 1 1 1 2 1 1 1 1 3 1 1 1 1 3 1 1 1 1 1 1 2 1 1 1 1 0.60
9 Confident Level
1 2 1 1 1 2 1 2 1 2 1 2 1 1 1 3 1 3 1 3 1 3 1 3 1 2 1 2 1 1 0.20
10 Continuing
participation of
employees
1 1 1 1 1 1 1 1 1 1 3 1 1 1 1 1 1 1 1 3 1 1 1 1 1 3 3 1 1 2 0.66
11 Delegation of
Authority and
Responsibility
2 1 1 1 1 1 1 2 1 1 1 1 3 1 1 1 1 1 3 1 1 1 1 1 2 1 2 2 1 1 0.53

277
12 Standard
Operation
Procedures
1 2 2 1 1 1 2 1 1 3 1 3 1 1 1 1 1 1 1 1 2 2 1 2 2 1 1 2 1 2 0.26
13 Safety
equipment
acquisition and
Maintenance
1 1 1 2 2 1 1 1 1 1 2 1 1 1 1 1 1 1 1 1 1 1 1 1 1 2 2 2 2 2 0.46
14 Teamwork
1 1 1 1 1 1 1 1 2 2 2 1 1 1 1 1 1 1 1 1 1 1 1 1 1 1 1 1 1 2 0.73
15 Job Satisfaction
1 3 1 3 1 1 3 1 1 1 2 1 1 2 1 2 1 1 1 1 3 3 1 1 3 1 1 1 3 3 0.26
16 Appropriate
Supervision 2 1 1 1 1 1 2 1 1 1 1 1 1 2 1 1 1 1 1 1 1 1 2 1 1 1 2 1 1 1 0.66
17 Personal
Competency 1 1 1 1 1 1 1 1 1 1 2 2 1 1 1 1 1 1 1 1 1 1 2 1 1 1 2 1 1 2 0.66
18 Positive group
norms 1 1 1 1 2 1 2 1 1 1 1 1 3 2 1 1 3 1 1 1 1 1 2 1 1 1 2 1 2 2 0.40
19 Personal attitude
2 1 1 1 3 1 1 1 3 3 1 1 2 1 1 2 1 1 1 2 1 1 1 2 1 1 2 1 3 1 0.33
20 Safety Behavior
1 1 2 1 1 2 1 1 3 1 1 3 1 1 1 3 3 3 1 1 1 1 3 3 1 1 1 3 2 3 0.20
21 Personal
motivation 1 2 1 1 2 1 1 2 1 1 1 3 1 1 1 1 1 2 1 1 1 1 2 1 1 2 1 1 1 1 0.53
22 Sufficient
Resource
Allocation
1 2 1 1 1 1 1 1 2 1 1 1 1 1 1 1 2 1 1 1 1 1 1 1 1 1 1 2 2 2 0.60
23 Supervisory
Actions 3 3 3 2 1 1 1 2 2 1 1 1 2 1 3 1 1 1 3 1 1 2 1 1 1 1 1 2 1 2 0.20
24 Appropriate
Safety
Education and
Training
1 1 1 1 1 2 2 1 1 1 1 1 1 1 2 1 1 1 1 1 1 1 1 2 1 1 1 1 1 1 0.73
25 AppropriateTool
Design 1 1 3 1 3 1 1 1 2 1 1 2 1 2 1 1 3 1 1 1 2 1 2 2 1 2 1 1 2 1 0.26
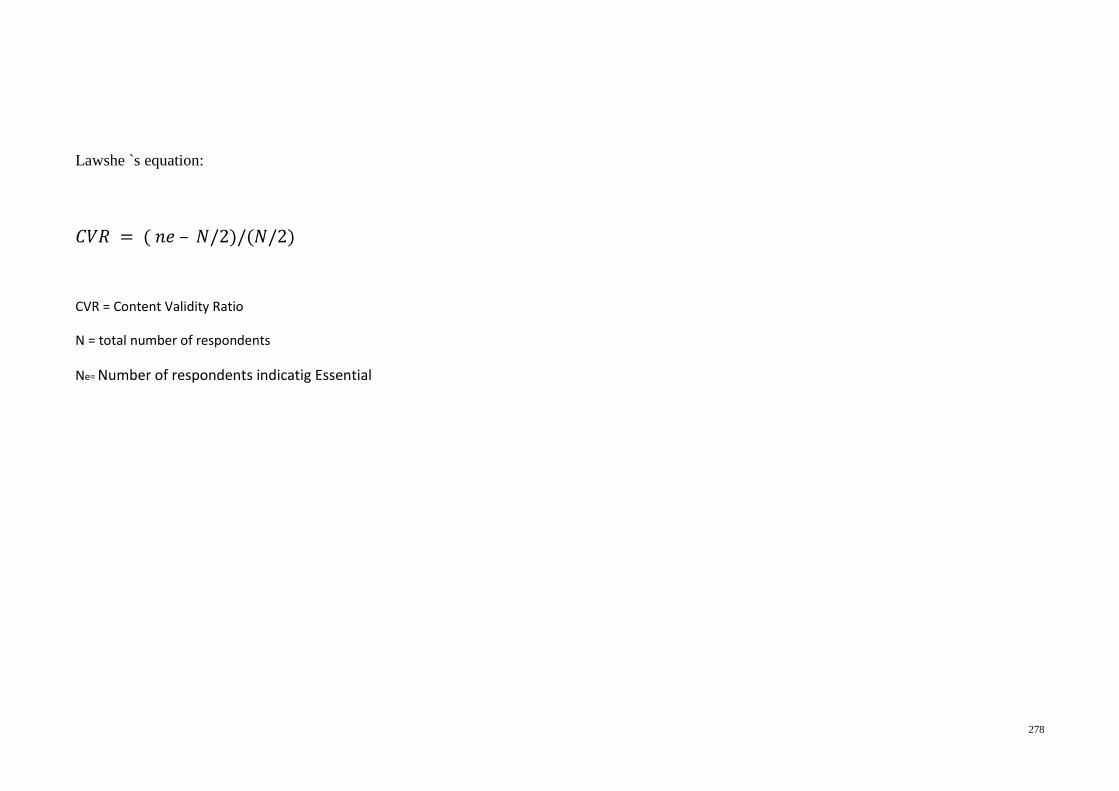
278
Lawshe `s equation:
CVR = Content Validity Ratio
N = total number of respondents
Ne= Number of respondents indicatig Essential

279
APPENDIX P
Prediction values on occupational safety Awareness for minimum (2) Likert scale:
DEP1 : The assumed value of 2 for occupational safety awareness and significant
factors in the model gives a total value of 1.672, thus a 0.328 deviation from the
assumption.
DEP2 : The assumed value of 2 for occupational safety awareness and significant
factors in the model gives a total value of 1.540, thus a 0.46 deviation from assumption.
Prediction values on occupational safety awareness for minimum (3) Likert scale:
DEP1 : The assumed value of 3 for occupational safety awareness and significant
factors in the model gives a total value of 2.508, thus a 0.492 deviation from the
assumption.
DEP2 : The assumed value of 3 for occupational safety awareness and significant
factors in the model gives a total value of 2.310, thus a 0.690 deviation from
assumption.
Prediction values on occupational safety awareness for minimum (4) Likert scale:
DEP1 : The assumed value of 4 for occupational safety awareness and significant
factors in the model gives a total value of 3.344, thus a 0.656 deviation from the
assumption.
DEP2 : The assumed value of 4 for occupational safety awareness and significant
factors in the model gives a total value of 3.080, thus a 0.920 deviation from
assumption.

280
APPENDIX Q

281
APPENDIX R

282
APPENDIX S
Prediction values on occupational safety awareness for minimum (1) Likert scale:
DEP3 : The assumed value of 1 for occupational safety awareness and significant
factors in the model gives a total value of 1.02, thus a 0.02 deviation from the
assumption.
DEP4 : The assumed value of 1 for occupational safety awareness and significant
factors in the model gives a total value of 0.924, thus a 0.076 deviation from
assumption.
Prediction values on occupational safety awareness for minimum (2) Likert scale:
DEP3 : The assumed value of 2 for occupational safety awareness and significant
factors in the model gives a total value of 2.04, thus a 0.04 deviation from the
assumption.
DEP4 : The assumed value of 2 for occupational safety awareness and significant
factors in the model gives a total value of 1.848, thus a 0.152 deviation from
assumption.
Prediction values on occupational safety awareness for minimum (3) Likert scale:
DEP3 : The assumed value of 3 for occupational safety awareness and significant
factors in the model gives a total value of 3.06, thus a 0.06 deviation from the
assumption.
DEP4 : The assumed value of 3 for occupational safety awareness and significant
factors in the model gives a total value of 2.772, thus a 0.228 deviation from
assumption.

283
Prediction values on occupational safety awareness for minimum (4) Likert scale:
DEP3 : The assumed value of 4 for occupational safety awareness and significant
factors in the model gives a total value of 4.08, thus a 0.08 deviation from the
assumption.
DEP4 : The assumed value of 4 for occupational safety awareness and significant
factors in the model gives a total value of 3.696, thus a 0.304 deviation from
assumption.
Prediction values on occupational safety awareness for minimum (5) Likert scale:
DEP3 : The assumed value of 5 for occupational safety awareness and significant
factors in the model gives a total value of 5.10, thus a 0.100 deviation from the
assumption.
DEP4 : The assumed value of 5 for occupational safety awareness and significant
factors in the model gives a total value of 4.62, thus a 0.380 deviation from assumption.

284
APPENDIX T
Calculations for Model DEP2:
OSH LoA = 0.770 COMM + 1.016
The mean score for Communications for DEP2 = 3:70 ( taken from appendix I)
Replace the mean score values COMM into the equation:
To obtain the percentages:
OSH LoA = 3.865/5 * 100
= 77%
Calculations for Model DEP3:
The mean score for Communications for DEP3 = 3:56 ( taken from appendix I)
The mean score for Training and Education = 3.44 ( taken from appendix I)
The mean score for Employee Participation = 3.71 ( taken from appendix I)
Replace the mean score values COMM, TE and EP into the equation:
= 3.54
To obtain the percentages:
OSH LoA = 3.54/5 * 100
= 70%

285
Calculations for Model DEP4:
The mean score for Communications for DEP4 = 3:76 ( taken from appendix I)
The mean score for Employee Participation = 3.72 ( taken from appendix I)
Replace the mean score values COMM and EP into the equation:
OSH LoA = 0.597 (3.76) + 0.327 (3.72) + 0.373
= 3.83
To obtain the percentages:
OSH LoA = 3.83/5 * 100
= 76%

286
APPENDIX U
Meanscores for Safety Climate Factors.
FACTORS
DEP1 DEP2 DEP3 DEP4
MANAGEMENT
COMMITMENT
3.31 3.42 3.49 3.60
EMPLOYEE
PARTICIPATION
3.57 3.61 3.71 3.72
TRAINING AND
EDUCATION
3.18 3.60 3.44 3.87
COMMUNICATION
3.41 3.70 3.56 3.76