Embed Size (px)
Citation preview

University of Kentucky University of Kentucky
UKnowledge UKnowledge
Theses and Dissertations--Educational Leadership Studies Educational Leadership Studies
2014
RELATIONSHIP BETWEEN THE EMOTIONAL INTELLIGENCE OF RELATIONSHIP BETWEEN THE EMOTIONAL INTELLIGENCE OF
TEACHERS AND STUDENT ACADEMIC ACHIEVEMENT TEACHERS AND STUDENT ACADEMIC ACHIEVEMENT
David Allen Rust University of Kentucky, [email protected]
Right click to open a feedback form in a new tab to let us know how this document benefits you. Right click to open a feedback form in a new tab to let us know how this document benefits you.
Recommended Citation Recommended Citation Rust, David Allen, "RELATIONSHIP BETWEEN THE EMOTIONAL INTELLIGENCE OF TEACHERS AND STUDENT ACADEMIC ACHIEVEMENT" (2014). Theses and Dissertations--Educational Leadership Studies. 8. https://uknowledge.uky.edu/edl_etds/8
This Doctoral Dissertation is brought to you for free and open access by the Educational Leadership Studies at UKnowledge. It has been accepted for inclusion in Theses and Dissertations--Educational Leadership Studies by an authorized administrator of UKnowledge. For more information, please contact [email protected].

STUDENT AGREEMENT: STUDENT AGREEMENT:
I represent that my thesis or dissertation and abstract are my original work. Proper attribution
has been given to all outside sources. I understand that I am solely responsible for obtaining
any needed copyright permissions. I have obtained needed written permission statement(s)
from the owner(s) of each third-party copyrighted matter to be included in my work, allowing
electronic distribution (if such use is not permitted by the fair use doctrine) which will be
submitted to UKnowledge as Additional File.
I hereby grant to The University of Kentucky and its agents the irrevocable, non-exclusive, and
royalty-free license to archive and make accessible my work in whole or in part in all forms of
media, now or hereafter known. I agree that the document mentioned above may be made
available immediately for worldwide access unless an embargo applies.
I retain all other ownership rights to the copyright of my work. I also retain the right to use in
future works (such as articles or books) all or part of my work. I understand that I am free to
register the copyright to my work.
REVIEW, APPROVAL AND ACCEPTANCE REVIEW, APPROVAL AND ACCEPTANCE
The document mentioned above has been reviewed and accepted by the student’s advisor, on
behalf of the advisory committee, and by the Director of Graduate Studies (DGS), on behalf of
the program; we verify that this is the final, approved version of the student’s thesis including all
changes required by the advisory committee. The undersigned agree to abide by the statements
above.
David Allen Rust, Student
Dr. Lars Björk, Major Professor
Dr. John Nash, Director of Graduate Studies

RELATIONSHIP BETWEEN THE EMOTIONAL INTELLIGENCE OF TEACHERS AND STUDENT ACADEMIC ACHIEVEMENT
_______________________________
DISSERTATION _______________________________
A dissertation submitted in partial fulfillment of the
requirements for the degree of Doctor of Education in the College of Education
at the University of Kentucky
By
DAVID ALLEN RUST
Independence, Kentucky
Co-Director: Dr. Lars Björk, Professor of Educational Leadership Co-Director: Dr. Beth Rous, Professor of Educational Leadership
Lexington, Kentucky
2014
Copyright David Allen Rust 2014

ABSTRACT OF DISSERTATION
RELATIONSHIP BETWEEN THE EMOTIONAL INTELLIGENCE OF TEACHERS AND STUDENT ACADEMIC ACHIEVEMENT
Linda Darling-Hammond (1997) states that the classroom teacher is the most influential variable influencing student achievement outside of the child’s home environment. Many studies have attempted to identify the specific attributes of teachers who are more effective than others. During the last decade, research has shown that teachers who work to develop relationships, while delivering relevant and rigorous instruction, demonstrate greater student achievement. Additional studies from the world of business tell us that those individuals with increased levels of emotional intelligence are better leaders, managers and salespersons, and are more frequently hired into those positions by large corporations. They are more likely to get along with peers, be promoted and demonstrate success when working with others. A similar relationship may exist in the field of education between teachers who exhibit increased levels of emotional intelligence and their students’ academic achievement. This pilot study investigated possible relationships between the academic performance of sixth grade math students and the emotional intelligence of their corresponding teachers through the use of descriptive statistics. Although no significant findings were established, the data provide a useful starting point for future queries into this construct.

KEYWORDS: Social-Emotional Intelligence, Teacher Training, Teacher-Student
Relationships, Teacher Dispositions, Student Achievement
David Allen Rust Student’s Signature
April 17, 2014 Date

RELATIONSHIP BETWEEN THE EMOTIONAL INTELLIGENCE OF TEACHERS AND STUDENT ACADEMIC ACHIEVEMENT
By
David Allen Rust Dr. Lars Björk
Co-Director of Dissertation
Dr. Beth Rous Co-Director of Dissertation
Dr. John Nash Director of Graduate Studies
April 17, 2014

For Those Driven to Learn and Affect Change

iii
Acknowledgements
I dedicate this dissertation, with love, to my wife Stacy and my four
beautiful children, Kyler, Ashlyn, Danton, and Garrett, who endured as I labored
through the program and this culminating piece of work. Their patience,
encouragement and support will always provide me with the strength and
courage to achieve more. I hope my work through this process will serve as a
model, demonstrating resilience, determination and a strong work ethic so; they
too, can consider and pursue their future goals.
I would also like to thank my parents, Al and Anita, who instilled in me,
from a very early age, an unquenchable thirst for knowledge and the trust to be
who I wanted to be, even as I still search for who and what that may eventually
be. They allowed me to make my mistakes and learn from them. They demanded
and showed me how to be ethical, respectful and trustworthy.
A very special thank you must go to my late grandfather, Frank Pohlman,
who taught me the detail orientation to see the “nuts and bolts.” He reminded me
that practice and patience worked hand in hand and were necessary to complete
the puzzle. He taught me to ask the hard questions and never settle for a
mediocre result.
I would like to thank the academic communities within which I have
worked while pursuing this doctoral degree, particularly the hard-working
teachers and administrative teams of the Boone County and Ludlow Independent
School Districts. I am blessed to have been mentored and challenged by many
knowledgeable, progressive and change-driven individuals. My desire to learn
iv
and lead would never have evolved without their influence and the opportunity to
serve as principal for Ludlow Middle School and Rector A. Jones Middle School
during the past ten years. Specifically, I would like to thank Regina Brownfield,
Melissa Lameier, and Jenny Cox, for they, as my friends, peers and confidants,
struggled through this journey with me, providing much needed support and
encouragement when it was needed most.
Finally to Doctors Björk, Hausman, Knoeppel, Rinehart, Rous and Scollay:
without your courses, guidance and suggestions, this dissertation would have
never come to fruition. I want you to know that your effort has transformed the
way I think and helped me develop a “critical lens” through which to view the
world. For this, I will be forever in your debt.

v
Table of Contents
Acknowledgements .............................................................................................. iii
List of Tables ...................................................................................................... viii
Chapter One - Introduction ................................................................................... 1
Statement of the Problem .......................................................................... 4
Purpose of the Study ................................................................................. 5
Significance of the Study ........................................................................... 5
Chapter Two - Literature Review .......................................................................... 7
History of Emotional Intelligence ................................................................ 8
Emotional Intelligence in the Business Sector ......................................... 12
Emotional Intelligence and Emotional Labor ............................................ 16
Importance of Teacher Quality and Building Student Relationships ........ 17
Emotional Intelligence and Student Achievement .................................... 20
Measuring Emotional Intelligence ............................................................ 26
Chapter Three - Research Methods ................................................................... 32
Introduction .............................................................................................. 32
Research Design ..................................................................................... 32
Research Setting and Context ................................................................. 33
Research Sample .................................................................................... 34
Instruments and Procedures .................................................................... 37
Reliability and Validity of the EQ-i ............................................................ 40
Data Collection ........................................................................................ 42
Data Analysis ........................................................................................... 44
Role of the Researcher ............................................................................ 45

vi
Limitations ................................................................................................ 45
Summary ................................................................................................. 48
Chapter Four – Results ...................................................................................... 49
Measuring Student Math Achievement .................................................... 49
Measuring Teacher Emotional Intelligence .............................................. 55
EQ Composite Scale Relationship to Student Achievement .................... 59
Exploring EQ Subscales .......................................................................... 61
Summary ................................................................................................. 69
Chapter Five – Discussion .................................................................................. 72
Introduction .............................................................................................. 72
Summary of the Study ............................................................................. 73
Discussion ............................................................................................... 73
Study Question.............................................................................. 75
Self-Actualization .......................................................................... 77
Stress Tolerance ........................................................................... 78
Recommendations ................................................................................... 80
Conclusion ............................................................................................... 81
Appendix A ......................................................................................................... 83
Appendix B ......................................................................................................... 84
Appendix C ......................................................................................................... 85
Appendix D ......................................................................................................... 89
Appendix E ......................................................................................................... 90
Appendix F ......................................................................................................... 91

vii
Appendix G ......................................................................................................... 98
References ....................................................................................................... 103
Vita ................................................................................................................... 112

viii
List of Tables
Table 3.1 Teacher Demographics .................................................................... 36
Table 3.2 Student Demographics ..................................................................... 37
Table 4.1 Pre-Test Scale Score Central Tendencies – Student Scores by
Teacher .................................................................................................. 51
Table 4.2 Post -Test Scale Score Central Tendencies – Student Scores by
Teacher .................................................................................................. 53
Table 4.3 Student Achievement Mean Scale Score Gains Per Teacher ........... 55
Table 4.4 Total EQ and Composite Scale Descriptives ..................................... 57
Table 4.5 Teachers’ Total EQ and Composite Scale Scores ............................ 59
Table 4.6 Teacher EQ Composite Scale Scores and Student Achievement ..... 61
Table 4.7 EQ Intrapersonal Subscales and Student Achievement .................... 63
Table 4.8 EQ Interpersonal Subscales and Student Achievement .................... 65
Table 4.9 EQ Stress Management Subscales and Student Achievement .......... 66
Table 4.10 EQ Adaptability Subscales and Student Achievement..................... 68
Table 4.11 EQ General Mood Subscales and Student Achievement. ................ 69

1
Chapter One - Introduction
The Kentucky Educational Reform Act (KERA) of 1990 initiated sweeping
instructional mandates for change ranging from state and school district
management to the most basic level of teacher and student performance in the
classroom. KERA promoted, and in most instances, mandated the creation of
school based decision-making councils for the purpose of monitoring and
implementing initiatives designed to promote student achievement. High stakes
accountability placed massive responsibility on the shoulders of principals and
classroom teachers to demonstrate academic results.
During the past 20 years, schools and school districts have worked to
change the culture and management of their educational institutions based on
the collective professional wisdom and newly generated research-based tools
from within the Commonwealth and across the country. From district to district,
student performance has generally increased during this period. Student
achievement in math and reading at the secondary level however, continues to
lag significantly behind elementary improvement (Education Trust, 2005).
Many schools, particularly those enrolling populations of students in lower
socio-economic communities, struggle to make the same kind of instructional
gains as those schools in more affluent neighborhoods. “The National
Assessment of Educational Progress consistently reports that the average eighth
grade minority student performs at about the level of the average fourth-grade
white student” (National Center for Education Statistics, 2003). “Minority students
are found all up and down the achievement scale, of course, but too many

2
remain lower down” (Barton, 2004, p.8). Educational researchers continue to look
for ways to improve student achievement.
Linda Darling-Hammond (1997) states that the classroom teacher is the
most influential variable influencing student achievement outside of the child’s
home environment. She also claims that “teacher expertise-what teachers know
and can do-affects all the core tasks of teaching… their skill in assessing their
students’ progress also depends on how deeply they understand learning, and
how well they can interpret students’ discussions and written work” (p.16).
McNulty and Quaglia (2007), in their work with the International Center for
Leadership in Education, has examined some of the most successful high
schools in the country- schools that have the challenges of poverty, mobility and
diversity but still have high rates of student success. They note that, “in addition
to the achievement gap, there is a participation gap, which is characterized by
students who feel unwelcome, disconnected and lost in our schools” (McNulty &
Quaglia, p.4). The relationship between student and teacher may be the answer
to bridging these gaps.
Today, researchers hunt for the magic bullet that enables teachers to
assess student needs and make relevant connections in order to better motivate
and instruct students within their classrooms. However, the teacher effectiveness
literature tends to focus narrowly on cognitive outcomes, with insufficient
attention placed upon broader domains associated with student morale and
social well-being, and the establishment of positive relationships with colleagues
and parents (Campbell, Kyriakides, Muijs, & Robinson, et al., 2003). The

3
overreliance on nationally norm referenced testing of student cognitive/academic
ability and the antiquated stand and deliver teaching methods have failed to meet
the needs of most students. The recognition and management of emotional
intelligence (EI) by classroom teachers may be the edge necessary to make
effective and relevant connections with students of varying backgrounds and
educational expectations. Salovey, Brackett and Mayer (2007) state that
“emotional intelligence (EI) refers to the processes involved in the recognition,
use, understanding and management of one’s own and other emotional states to
solve emotion-laden problems and to regulate behavior” (p. i). Bar-On, Maree,
and Elias (2007) summarize what they call emotional-social intelligence as the
following competencies:
The ability to recognize and understand emotions and to express feelings
nondestructively; the ability to understand how others deal and relate with
them cooperatively; the ability to manage and control emotions effectively;
the ability to manage change and the emotions generated by change, and
to adapt and solve problems of a personal and interpersonal nature; and
the ability to generate positive affect and be self-motivated (p. xiv).
Research into understanding the parameters and mastery of teacher
emotional intelligence may lead to important findings about how emotional
intelligence may be used by teachers to connect with and motivate students on a
daily basis, potentially increasing student academic achievement. The definition
of emotional intelligence capacities documented by Bar-On, Maree, and Elias
and Bar-On’s related EQ-i assessment was utilized for this study.

4
Statement of the Problem
School district personnel and building principals work feverishly to find,
retain and professionally develop teachers who achieve results to meet the
demands of high stakes accountability. McNulty and Quaglia (2007) note that
relationships between teachers and students matter, particularly in those schools
serving high risk populations.
Many studies over the past 20 years, particularly in business settings,
indicate that emotional intelligence can help to identify employers and employees
with affective skills capable of relating with and motivating others (Othman,
Abdullah, & Ahmad, 2008; Rozell, Pettijohn, & Parker, 2006). Butler and
Chinowsky (2006) claim that within construction organizations, emotional
intelligence traits are just as important as previously used cognitive intelligence
measures and experience to find and grow the capacity of future leaders.
These findings raise questions as to whether or not the emotional
intelligence construct can transfer to the educational environment and help
explain which teachers or prospective teacher candidates might be the most
successful impacting student outcomes and help them target growth areas. The
emotional intelligence of teachers may influence their effectiveness. If an
emotional intelligence assessment can help identify which employees maintain
affective skills capable of relating and motivating others in the business world
then the possibility exists that emotional intelligence may help educational
leaders develop teachers to excel in relating with students and motivating them
to perform in schools. The problem is that no studies have been done to identify

5
whether or not differences in the emotional intelligence of teachers result in an
enhanced ability to generate meaningful relationships with students resulting in
increased academic benefits.
Purpose of the Study
The purpose of this study was to investigate the relationship between the
emotional intelligence of teachers and the achievement of the sixth grade math
students in their classrooms. Specifically, the study focused on the following
question:
What relationships exist between the measured emotional intelligence of
sixth grade math teachers and the achievement of their students?
Significance of the Study
As an exploratory investigation, this question is important to study
because it attempts to shed light on whether or not students of teachers with
varying degrees of emotional intelligence demonstrate measurable differences in
achievement scores. The current body of research does not provide any similar
or replicable studies relating to this question. An answer to this question provides
additional detail to the literature regarding teacher quality and effects and may
inform future studies.
This question also helps to identify which, if any, of the specific composite
scales or sub-domains of teacher emotional intelligence may associate to student
achievement. It is, therefore, important to identify specific components of
emotional intelligence and the individual relationships each may have with
student achievement.

6
As noted previously, education professionals continue to seek answers
clarifying the effects and measures of quality teachers. If a teacher’s emotional
intelligence can be related to student academic gains, professional growth and
instructional practices may be modified and enhance teacher efficacy. Colleges
and universities could modify teacher preparation courses to include emotional
intelligence and its subdomains as part of the knowledge and skill base for new
teachers. School districts could consider utilizing emotional intelligence
assessments to inform professional development needs of pre-service teachers
and teacher interns once hired into the field.
For more experienced teachers currently practicing in the field, a
successfully articulated and measured relationship between teacher emotional
intelligence and student achievement could lead to the use of emotional
intelligence instruments to inform professional growth by identifying areas of
strength or weakness for development to improve the quality of teacher social
interactions. Hence, the goal of this study is to serve as a pilot to inform future
investigations into this possible construct.
Copyright David Allen Rust 2014

7
Chapter Two – Literature Review
A substantial body of research indicates that student achievement is
affected by meaningful and purposeful relationships between teachers and
students (Brophy & Good, 1974; Coleman, et. al., 1966; Klem & Connell, 2004;
McNulty & Quaglia, 2007), while inappropriate or negative relationships can
hinder student performance and a feeling of worth in the classroom (Brophy &
Good, 1974). The emotional intelligence research conducted over the past 20
years makes arguments for the use of emotional intelligence assessments to
identify, hire, grow and promote employees within corporate America (Carmeli &
Josman, 2006; Dearborn, 2002; Dulewicz & Higgs, 2003; Goleman, Boyatzis, &
McKee, 2001). Additional research has investigated the similar concept of
emotional labor and the employee division of labor and expectation that exists for
those individuals who interact with the public (or clients) and those who only
interact with others within the organization itself (Meier, Mastracci, & Wilson,
2006; Othman et al., 2008). However, research into the relationship between
teacher emotional intelligence and student achievement is nonexistent.
Researchers have conducted only a few relevant investigations on
emotional intelligence in the field of education during the past ten years. The
most recent and relevant studies focus on either the emotional intelligence of
students and its resulting potential relationship with achievement (Downey,
Mountstephen, Lloyd, Hansen, & Stough, 2008; Stottlemyer, 2002) or the
emotional intelligence of teachers and pre-service teachers as workers or
potential workers (Drew, 2006). There has not been, however, a single report of

8
teacher emotional intelligence and any direct connection or relationship with
student achievement.
This study addresses a potentially meaningful gap in education research
when one considers the available evidence on the significance of student and
teacher relationships, the research establishing positive effects of emotional
intelligence in the corporate sector, and the scarcity of research into the
relationship between teacher emotional intelligence and student outcomes,.
This review of the literature begins with a discussion of the history of the
construct of emotional intelligence followed by an examination of emotional
intelligence as it has been utilized by corporate America. Secondly, this review
reports on the research relating teacher relationships to student success in the
classroom. Finally, it concludes by discussing the potential role of the emotional
intelligence of teachers for promoting student achievement in our schools.
History of Emotional Intelligence
Several contemporary theorists have generated models to investigate and
describe an individual’s emotional intelligence. The definition of emotional
intelligence has evolved over the course of the past 20 years due to intensive
research and reporting. The most widely known researchers, Peter Salovey of
Yale University, John D. Mayer of the University of New Hampshire, Daniel
Goleman of Harvard and Reuven Bar-On of the University of Texas, have
provided several different definitions and models of emotional intelligence, and all
trace their roots from the works of Edward Thorndike and Howard Gardner.

9
Edward Thorndike, the psychologist who articulated and publicly defended
the intelligence quotient (I.Q.) in the 1920s and 1930s, “proposed that other types
of abilities existed and needed to be differentiated from general intelligence.
Thorndike’s main focus was to suggest that the understanding and perception of
one’s personal feelings, as well as those of others, was a type of intelligence
distinguishable from one’s general intelligence” (Rozell, Pettijohn, & Parker,
2006, p. 115). Thorndike proposed that social intelligence was itself an aspect of
a person’s IQ (Goleman, 1995, p. 42). However, the idea of social intelligence, its
definition, and thorough investigations were neglected for many decades.
Howard Gardner, in his 1983 book, Frames of Mind, expanded the
concept of IQ to include what he calls the Multiple Intelligences Theory. Gardner
proposes that the brain acquires knowledge and skill in different ways, through
different modes, which vary from individual to individual. His theory of multiple
intelligence includes seven domains: linguistic, musical, spatial, logical-
mathematical, bodily-kinesthetic, inter and intra personal. He states that inter and
intra personal relationships form the basis for the construct of emotional
intelligence (Gardner, 1998). In 1983, Gardner opened the floodgate for the
consideration that the mind, and humans in general, learn and interact in a
multitude of ways. Like Gardner, other researchers began considering how
humans learn and demonstrate knowledge and skills. Emotional intelligence
evolved as a construct and serious investigation into its usefulness intensified
during the 1990s. This link is even more important as Gardner’s ideas relating to

10
multiple intelligences continue to filter into mainstream educational thought and
classroom lesson implementation.
Emotional intelligence as a definition and construct continues to develop.
Generally, “Theorists are interested in identifying the mental processes which
involve emotional information, including appraising, expressing and regulating
emotions in self and others, and using the emotions in adaptive ways” (Finegan,
1998, p. 9). Salovey and Mayer’s original definition of “Emotional intelligence (EI)
refers to the processes involved in the recognition, use, understanding and
management of one’s own and other emotional states to solve emotion-laden
problems and to regulate behavior” (Salovey, Brackett, & Mayer, 2007, p. i).
They have since revised their own definition, stating, “Emotional
intelligence involves, [1] the ability to perceive accurately, appraise, and express
emotion; [2] the ability to access and/or generate feelings when they facilitate
thought; [3] the ability to understand emotion and emotional knowledge; and [4]
the ability to regulate emotion to promote emotional and intellectual growth”
(Salovey & Mayer, 2007, p. 35). This expanded definition from Salovey and
Mayer stretched across a void to connect the idea of intelligence with the
recognition that emotion and its regulation affects a person’s growth and
interactions with other individuals.
The first of these four dimensions is the ability to perceive, appraise and
express emotion as measured by a respondent's attention to a variety of non-
verbal cues such as tone of voice, posture, and facial expressions in oneself and
others. The second dimension is the ability to use emotions to facilitate thinking

11
and behavior, focusing on how emotions influence our cognitive system. This
dimension involves using intuition or “gut-feelings” to help make decisions and be
creative. The third dimension is the ability to understand and use emotional
knowledge (Mayer, Salovey, and Caruso, 2002) through an understanding of
what has led to the experience of an emotion and is an essential component of
emotional intelligence. One needs to know how emotions change and combine
over time to effectively use this emotional knowledge. The fourth dimension is the
ability to manage and regulate emotions. Individuals who are high in this
dimension are usually very calm, not impulsive, and work well under pressure.
They can typically respond to stressful situations without emotional outbursts
(Bar-On & Parker, 2000).
Bar-On, Maree, and Elias (2007) add a separate layer of understanding
and summarize what they call emotional-social intelligence as the following
competencies:
• “The ability to recognize and understand emotions and to express feelings
nondestructively.
• The ability to understand how others deal and relate with them
cooperatively.
• The ability to manage and control emotions effectively.
• The ability to manage change and the emotions generated by change,
and to adapt and solve problems of a personal and interpersonal nature.
• The ability to generate positive affect and be self-motivated” (p. xiv).

12
Reuven Bar-On claims that “people who are emotionally and socially intelligent
are able to understand and express themselves, to understand and relate well to
others, and to successfully cope with the demands of daily life” (Bar-On, 2007, p.
2). Bar-On’s model, although very similar in definition to others, seems to make
the distinction from a personal understanding and regulation to that of
implementation for management of inter and intrapersonal relationships. Bar-On
exemplifies this by adding that those scoring high in emotional intelligence are
better equipped to effectively manage change by flexibly coping with situations of
an interpersonal nature (Bar-On, 2007).
Bar-On (2007) promotes the study of social and emotional intelligence
through an educational application. He is credited with creating one of the most
commonly used instruments for measuring emotional intelligence, the EQ-i
(Brown, Bryant, & Reilly, 2006). Many studies have utilized the EQ-i to assess a
person’s intrapersonal and interpersonal competencies, stress management,
adaptability, and general mood. For the purposes of this study, the researcher
utilizes Bar-On's construct of emotional intelligence as assessed via the EQ-i.
Emotional Intelligence in the Business Sector
In 1990, Daniel Goleman (1995), the Harvard trained psychologist serving
as a science reporter for the New York Times, reported on a journal article
written by Peter Salovey and John Mayer with the coined phrase of emotional
intelligence. Goleman was so intrigued by the concept that he brought it to the
world’s attention through his own book and New York Times bestseller,
Emotional Intelligence. Within his book, Goleman (1995) “suggests that

13
emotional intelligence, the skills that help people harmonize, should become
increasingly valued as a workplace asset in the years to come“ (p. 160).
Since that time, many studies have come to the forefront supporting the
application of emotional intelligence in business settings. In fact, Goleman’s
research “at nearly 200 large, global companies revealed that emotional
intelligence-especially at the highest levels of the company-is the sine qua non
for leadership. Without it, a person can have first-class training, an incisive mind,
and an endless supply of good ideas, but he still won’t make a great leader”
(Goleman, 1998, p. 2). Jack Welch, former CEO of General Electric, stated:
Finally, a misstep we've both taken is hiring a candidate who's smart and
capable but just too lacking in emotional intelligence... occasionally you
bump into a talented and competent candidate, as we did not long ago,
who's so lacking in the EQ components of humility and realness that you
can't take a chance. (Welch & Welch, 1998, p. 1)
Additional research provides support for Goleman’s claim that emotional
intelligence relates to success in business. Carmeli and Josman, in a 2006 study,
examined the relationship between emotional intelligence and two aspects of
work outcomes, task performance and two forms of organizational citizenship
behaviors, altruism and compliance. Their study, unlike many others, avoided
self-report scores by utilizing evaluator ratings of performance. They found
evidence for specific links between employee emotional intelligence and work
outcomes (Carmeli & Josman, 2006, p. 414). Specifically, the study found that
the regulation of emotions in the work place was significantly and positively

14
related to the outcomes of task performance, altruism, and compliance (Carmeli
& Josman, 2006).
Businesses currently recognize the importance of emotional intelligence
competencies as they exist and are utilized on a daily basis. “Key contributors
not only possess information and ideas, but more importantly, they have the
ability to effectively utilize social networks within the organization. People want to
discuss, learn, and collaborate with them because of their ability to build on,
develop others, self-manage, listen, share information, and understand”
(Dearborn, 2002, p. 524). Giles, (as quoted in Carmeli & Josman, 2006) “found
evidence for a positive correlation between subordinates’ commitment to the
organization and their supervisors’ emotional intelligence” (p. 407).
Dulewicz and Higgs of the Henley Management College conducted a
thorough investigation into the emotional intelligence of business leaders and
board members in the United Kingdom. Dulewicz and Higgs (2003) utilized a job
competencies survey measuring both emotional intelligence (EI or EQ) and IQ
through 40 different competencies. In addition to the questionnaire, the
participants provided information about their job level, responsibilities, the
number of levels between them and their CEO, and the number of staff for whom
they were responsible. Ratings of their job performance were also included.
Multiple regressions were conducted on each of the competencies to determine
which were the most important in determining organizational advancement. The
researchers found that IQ plus EI (EQ) results in success. “It was found that the
IQ competencies accounted for 27%, quite close to Goleman’s own estimate.

15
EQ accounted for over one third of the variance, 36%... of advancement”
(Dulewicz & Higgs, 2003, p. 196).
In 1996, the Rohm and Haas Company embarked on an endeavor to
create a coaching program utilizing the practice of emotional intelligence to
groom promising employees for the top 30 to 40 leadership roles in the
company. “Rohm and Haas senior executives have come to value the role of
psychology-and specifically, the role of emotions in the behavior of successful
leaders” (Wasylyshyn, Gronsky, & Haas, 2006, p. 66). The authors conducted a
survey to determine the effectiveness of the company's emotional development
program. The results indicated sustained learning and behavior change among
program participants over an extended period (Wasylyshyn et al., 2006). Daniel
Goleman (1995) sums up the emotional intelligence and business connection
with a quote from his book, Emotional Intelligence, “as Shoshona Zuboff, a
psychologist at Harvard Business School, pointed out to me, corporations have
gone through a radical revolution within this century, and with it has come a
corresponding transformation of the emotional landscape” (p. 149).
Some research indicates that identifying leadership should not be the only
use for emotional intelligence in business settings. Researchers Rozelle,
Pettijohn, and Parker (2006) investigated the impact of the emotional
intelligence of salespeople on sales performance. One hypothesis states “The
highest levels of performance will be achieved by salespeople who have [EI]
combination scores placing them in the group with the highest positive affect
and lowest negative affect group” (p. 115). The researchers argue that a

16
salesperson must be able to separate himself or herself from negative results
through the self-control and self-awareness of feeling, particularly when faced
with rudeness or rejection on the job (Rozell et. al., 2006). The researchers
specifically found:
When the overall emotional intelligence scale was used as the
independent variable, it was found that those salespeople in the highest
performance category had mean emotional intelligence scores that were
significantly greater than the scores of those occupying the lowest
performance group (F = 3.62, p < 0.05). Significant results were also
found when the individual emotional intelligence factors were used as the
independent variables. (p. 116)
Emotional Intelligence and Emotional Labor
Several researchers have connected emotional intelligence to a
discussion of emotional labor and their relationships to workplace effectiveness.
Othman, Abdullah, and Ahmad (2008) discuss the fact that certain jobs in the
workplace require the display of a specific emotion to be successful and that
workers should be specifically hired and placed in positions to demonstrate this
emotional labor. “Emotional labor is the projection of feelings and emotions
needed to gain the cooperation of clients or coworkers, the ability to see
another’s side of the issue and integrate that perspective into what the
organization does” (Meier, Mastracci, & Wilson, 2006, p. 899). Othman, et. al.
(2008) contend that employees who can perceive, understand, and regulate

17
emotion in self and others would be able to achieve higher performance in their
job.
Effectively, these researchers claim that jobs can be divided among those
requiring high, medium, and low emotional labor and that most professional jobs
requiring personal interaction, teamwork or public-relations necessitate high
emotional labor. Othman, el.al. (2008) argue that professional service providers
deal with specific, customized needs of clients and require the deliberate use of
EI abilities to better serve customers and achieve high career roles. For the
purpose of this study, one could argue that teachers participate in a profession
that requires high emotional labor. Acquiring and dispensing appropriate EI skills
may allow teachers to better serve students, parents and the community, who
could ultimately be portrayed as their clients.
Meier, Mastracci and Wilson (2006) examined the connection between
emotional intelligence and emotional labor through studies in the private and
public service industries. They hypothesize that employers, with greater
emotional labor expectations of their employees, will have more effective
interactions with clients, better internal relationships, and superior program
performance and add that “emotional intelligence, in Goleman’s view, is the
management of emotional labor so that it benefits the organization” (p. 899).
Importance of Teacher Quality and Building Student Relationships
From the writing of A Nation at Risk (1983) to the passage of No Child Left
Behind and the publishing of Breaking Ranks II (2004), the community,
legislators, and school administrators have come to realize the keen importance

18
of having highly trained and effective teachers in every child’s classroom. In
addition, we now recognize that the importance of relationship building between
students and teachers as a variable that cannot be overlooked any longer.
McNulty and Quaglia (2007) claim that “schools across the country are
realizing that rigor and relevance develop most naturally when they are cultivated
on firm grounding in relationships …if there is not a high level of positive
relationships, students will not respond to higher expectations” (p. 3). Helm
(2007) adds that teachers with the right dispositions can be the keys to reach
students from at-risk and under-privileged environments. She further quotes a
study by Harme and Pianta which “found that students with significant behavior
problems in their early years are less likely to have problems later in school if
their teachers are sensitive to their needs and provide frequent, consistent, and
positive feedback” (p. 109). Whitfield and Klug (2004) promote the idea of
teachers as healers in the classroom and note that schools must hire and grow
teachers who can promote success for all students, including those who struggle
in traditional school settings. These statements emphasize the need for teachers
and administrators to recognize that teacher quality and effectiveness does not
lie entirely in core subject training and years of experience but also in the
application of the affective domain to reach the emotional dispositions of children
to better connect and motivate their achievement.
Andy Hargreaves (2000) claims that educators must look seriously at
students’ emotions, conditions and expectations, and learn to ‘read’ students
over time. This reading of students may help to inform teachers' decisions with

19
instruction, classroom management and assessment. Those teachers who are
better able to understand their own and students’ needs may be better suited to
initiate those actions, which promote student success.
Ang (2005) conducted a study to validate the teacher-student relationship
inventory (TSRI) which she developed. While approaching her study, Ang noted
that a student's academic and behavioral adjustment may be positively
influenced by a satisfactory teacher-student relationship. Her goal was to create
a short 14-question survey administered to teachers for identifying the quality of
teacher-student relationships. She found, after conducting a multiple regression
analysis with her three TSRI factors (satisfaction, instrumental help, and conflict)
that instrumental help and conflict could predict students’ academic achievement
scores.
Findings from the present study provide additional support that positive
teacher-student relationships continue to be influential in predicting older
elementary and middle school students’ behavioral and academic
outcomes. Having a positive and satisfactory relationship with one’s
teacher and a relationship that is free from conflict and negative
exchanges is associated with lower levels of [student] anger and
aggression. Furthermore, willingness to approach the teacher for help and
to view the teacher as a resource person is predictive of academic
achievement. Absence of conflict and negative interaction within the
teacher-student relationship is also predictive of academic success (Ang,
2005, p. 70).

20
These studies demonstrate that effective teacher-student relationships
promote academic performance within the classroom yet they still fail to identify
the specific competencies teachers utilize to build relationships and motivate
students. Worley, et al. (2007), provides some insight through a discussion of
teacher communication and classroom effects. Their goals were to “describe how
award-winning teachers (a) understand the ebb and flow of the classroom, (b)
use a wide repertoire of communication skills, (c) create relationships with
students, and (d) effectively manage their classroom climates” (p. 207). The
researchers found that teachers participating in their study regularly allow
spontaneity to drive instruction and that learning is at its best when students have
an opportunity to take ownership and apply the content to their own experience.
Building relationships with students remains a core principle.
“Virtually all of the teachers in this study engage students in rapport-talk,
a term coined by Deborah Tannen (1994) to describe communication of shared
experiences in order to establish interpersonal rapport” (Worley, et al., 2007, p.
220). The researchers added, “these excellent teachers were interpersonally
aware and responsive, thereby encouraging open, warm, and communicatively
confirming climates that willingly invited students’ comments, questions and
responses” (p. 220).
Emotional Intelligence and Student Achievement
Emotional intelligence, as a model for influencing student achievement, is
a construct that has not been adequately studied to date. One study investigates
the emotional intelligence of pre-service teachers and their success in student

21
teaching (Drew, 2006) while an Italian study (Fabio & Palazzeschi, 2008)
considers the self-efficacy of teachers and their resulting emotional intelligence.
The goal of this review and ultimately the related pilot study is to better
understand and explore the possibility that teachers, who maintain high levels of
emotional intelligence, are better able to motivate student achievement in the
classroom. The rationale for how teacher emotional intelligence and the
corresponding subdomains may influence teacher effectiveness is described
below and summarized in Appendix B.
The following argument frames the connection between this literature
review and justification for the related study. Studies indicate that students
perform better in classrooms instructed by teachers who make relational
connections with them. Achievement increases when students know that
teachers care and demonstrate interest (McNulty & Quaglia, 2007). Studies into
emotional intelligence in the workforce indicate that employees with higher levels
of emotional intelligence and emotion regulation relate better with their peers
(Goleman, 1995), report lower levels of stress, interact better with their clients
and community (Meier, et.al., 2006), and have a higher rates of task
performance, compliance, and altruism (Carmeli & Josman, 2006). Therefore,
this study explores the possible relationship between the emotional intelligence
of a teacher, as a worker, and their students’ outcomes, such as achievement on
criterion-referenced or norm-referenced tests.
Reuvan Bar-On has not formally studied nor published reports describing
the relationships between the emotional intelligence of teachers, teacher

22
characteristics or relational outcomes. However, a question can be raised about
the possible alignment of Bar-On’s emotional intelligence composite scale
subdomains and teacher characteristics. Each of the five Bar-On composite
scales may define specific teacher emotional attributes conducive to student
learning.
Composite scale one- intrapersonal relationships: a teacher who
maintains a strong intrapersonal dimension may better understand his or her own
emotional needs and triggers. Understanding this may enable the teacher to
modify appropriately his or her own emotions to address situational needs. For
example, this teacher may be less emotionally charged by student misbehavior
occurring in the classroom. The teacher may be less likely to react to a student
attempting to “push buttons” in an effort to escalate an emotional situation. Dr.
Clyde Winters (2009) quoted Dr. Robert Brooks (1996) stating:
Brooks has made it clear that a teacher’s empathy and emotional
intelligence can help that teacher work more effectively with angry and
resistant students. Understanding what a student is going through helps a
teacher to recognize the burdens many students experience at home and
at school that lead to misbehavior, and the ability to create strategies that
can make these students less angry and resistant (pg. 2).
The emotionally intelligent teacher may better identify the antagonizing
factors of a situation, be less likely to “take the bait” and capable of de-escalating
or deflecting a situation by controlling or managing emotions.

23
Composite scale two of Bar-On’s emotional intelligence construct is
interpersonal relationships. This scale may define a teacher maintaining strong
interpersonal relationships who identifies the personal and group needs of
students. For example, if the teacher is aware of others’ feelings he may better
relate with students as a result. High interpersonal relationships may allow
teachers to work with parents, administrators and other teachers to grow
professionally. Student achievement may increase as a result of teachers
working collaboratively.
Composite scale three of Bar-On’s emotional intelligence construct is
stress management. As an example, teachers demonstrating high stress
management capacities may be better able to deal with the never ending
responsibilities of their role, the reactionary tendency of dealing with student
misbehavior, the weight of high stakes accountability, and parent complaints.
Successful teachers, scoring high in this category, may be less likely to react
angrily or shut down from the stress of the classroom. Teachers demonstrating
greater stress management skills may be more approachable for students and
more reflective on their work, both leading to higher student achievement.
Composite scale four of Bar-On’s emotional intelligence construct is
adaptability. Teachers performing well within the adaptability dimension may
respond better to individual student needs and learning styles. These teachers
may be better differentiators of instruction, better problem solvers and more likely
to take risks for student benefit. These teachers might cope readily with the
changing nature of schools and schedules. The students in these classrooms will

24
benefit from instruction specifically related to the environment, the complex
curriculum and individual emotional needs.
Composite scale five of Bar-On’s emotional intelligence construct is
general mood. Teachers demonstrating a greater general mood may be more
optimistic and happier than their peers. Students instructed by these teachers
may be more confident and likely to take chances. These students may
demonstrate greater academic performance due to increased teacher support
and the reinforced confidence in student ability.
Researchers of emotional intelligence have begun to recognize the
potential for their studies and the connection with student achievement, although
little empirical research exists to this end.
“Few would disagree that the purpose of schools is to promote academic
skills and knowledge and to take students from one level to the next.
However, that is difficult to accomplish if the student is absent; if the
student is suspended or expelled; if the student is dropping out of school:
if the student is dealing with a death; if the student believes that life is
something that happens to him and he has no control over it…To get
these students to their next academic levels, we must meet them where
they are and give them the skills and resources to cope with stressors so
that they will then be better able to attend to academics. Without these
social/emotional skills, the stressors take over and prevent our students
from living up to their academic potential” (Salovey & Mayer, 2007, pp. 57-
58).

25
Several studies consider emotional intelligence and its potential
connection in the classroom. For example, one study investigated the
relationship between student emotional intelligence and student achievement.
Australian researchers “examined the relationship between emotional intelligence
and scholastic achievement in Australian adolescents… and found academic
success to be satiated with higher levels of total EI, via assessment of the EI of
different academic levels [of students]” (Downey et al., 2008, p. 10). A
dissertation documented the relationship between emotional intelligence of pre-
service student teachers and their success in student teaching. Drew (2006), in
his study, found some evidence indicating that emotional intelligence may
eventually be a useful conceptual tool to predict student teacher performance
informing the future selection of educators.
An Italian study considered the emotional intelligence of teachers and the
relationship with self-efficacy. The researchers utilized the Bar-On EQ-i and the
Ohio State Teacher Efficacy Scale. The study did not consider student
achievement but did report on teacher efficacy and emotional intelligence. Fabio
and Palazzeschi (2008) found that “Higher emotional intelligence was linked to
higher teacher self-efficacy in the capacity to manage the classroom, motivate
and involve students, and use appropriate teaching strategies” (p. 322). This
study is important because it demonstrates that teacher effects and emotional
intelligence may have a key connection to student outcomes.

26
Measuring Emotional Intelligence
One limitation of early literature on emotional intelligence is that the
definitions of the concept are vague. Emotional intelligence has been viewed as
a multi-dimensional construct, however, it is unclear which dimensions should be
included and which dimensions predict success, whether in personal
relationships, business, education, etc. Further, there is a lack of reliable and
valid measurement for the models proposed for emotional intelligence (Zeidner,
Matthews, & Roberts, 2001).
The Encyclopedia of Applied Psychology (Spielberger, 2004) suggests
there are three major conceptual models of emotional intelligence. The first is the
Salovey-Mayer model (Mayer & Salovey, 1997). This model defines the construct
as the ability to perceive, understand, manage and use emotions to facilitate
thinking, measured by an ability-based measure (Mayer & Salovey, 1997). The
second is the Goleman model (1998), which views this construct as various
competencies and skills that drive managerial performance and are measured by
multi-rater assessments (Boyatzis et al., 2001). The third conceptual model of
emotional intelligence is the Bar-On model (Bar-On 1997, 2000). This model
describes a cross-section of interrelated emotional and social competencies,
skills and facilitators that affect intelligent behavior. It is measured by self-report
within a potentially expandable multi-modal approach including interview and
multi-rater assessment (Bar-On & Handley, 2003).
Reuven Bar-On began the development of the EQ-i in 1983 by examining
various factors of effective emotional and social functioning. These factors, or

27
components, were ultimately intended to contribute to an individual’s
psychological well-being. This lengthy process became known as a multi-factorial
approach and analysis. It led to the development of a very complex construct
through a multi-step process. It involved identifying several key factors related to
effective emotional and social functioning, providing operational definitions for
these factors, and constructing a psychometric instrument (inventory) and
norming and validating the instrument across cultures (Bar-On, 2004).
Several researchers have focused on developing psychometrically sound
measures to assess these relevant abilities. Mayer and colleagues (2002)
developed a performance-based measure where respondents solve emotion-
related problems. This measure, known as the Mayer-Salovey-Caruso Emotional
Intelligence Test (MSCEIT) produces a separate score for each of the four
dimensions and gives a total emotional intelligence score. The MSCEIT
instrument is deployed primarily as emotional intelligence ability measure (Day &
Carroll, 2007).
Bar-On uses a self-reported measure; the most frequently used and
readily available measure of emotional intelligence (Day & Carroll, 2007). Using
125 items, the instrument includes five scales: intrapersonal (including subscales
like recognizing and understanding one’s feelings, interpersonal (including
subscales such as empathy), adaptability (including subscales of being able to
adjust one’s emotions and behaviors to changing situations and conditions),
stress management (including subscales like resisting or delaying an impulse),
and general mood (measuring optimism and happiness) (Bar-On, 2007).

28
A study leading to the use of the EQ-i investigated the emotional
intelligence of 349 pre-service teachers, examining their anger expression
through the use of the Permanent Anger Expression Style Scale and correlating
the results of the teachers' performance on the Bar-On's EQ-i (Sahin-Baltaci &
Demir, 2012). Sahin-Baltaci and Demir (2012) found that pre-service teachers
demonstrating emotional intelligence skills were better able to control their anger
in a situation rather than suppressing or reflecting it. This outcome and the use of
the EQ-i with pre-service teachers promoted its use in this exploration.
To best understand the Bar-On model of Emotional Social Intelligence,
one must understand the Emotional Quotient Inventory (the EQ-i). This has
played an important role in developing the Bar-On model. The Bar-On model is
operationalized by the EQ-i. The EQ-i is a self-report measure of emotionally and
socially intelligent behavior, which provides an estimate of emotional-social
intelligence. This measure was the first of its kind to be published by a
psychological test publisher and was also the first to be peer-reviewed in the
Buros Mental Measurement Yearbook (Plake & Impara, 1999). It is one of the
most widely used measure of emotional-social intelligence to date (Bar-On, 2004;
Perez, Petrides & Furnham, 2005) and "covers the sampling domain of trait EI
better than many other inventories" (Perez, et.al., p. 129). As a result of these
factors, it is the instrument used to assess emotional intelligence in this study.
Bar-On (2004) presents his concept of emotional and social intelligence as
a “multifactorial array of interrelated emotional, personal, and social abilities
influencing our overall ability to actively and effectively cope with daily demands

29
and pressures” (p. 385). He asserts emotionally intelligent people are able to
recognize their emotions and act on them appropriately. They have a positive
self-regard, understand the way others feel, and are capable of establishing and
maintaining mutually satisfying interpersonal relationships (Bar-On, 2004).
Currently, Bar-On’s emotional intelligence model is considered one of “the
clearest and the most comprehensive to date” (McCallum & Piper, 2000, p. 125).
The Bar-On EQ-i has been translated into over twenty languages, with a
collection of normative data in more than fifteen countries and a multitude of
reliability and validity studies (Bar-On & Parker, 2000). The overall average
internal consistency coefficient (Cronbach’s alpha) is .76 across seven countries
examined at one time, which is considered high reliability (Bar-On, 2002). Testing
results also indicate the instrument is valid.
The EQ-i has been administered with various measures of cognitive
intelligence in an effort to examine the construct validity of the Bar-On model.
These cognitive measures include the Wechsler Adult Intelligence Scale, the
Progressive Raven Matrix, and the General Adult Mental Ability Scale. These
were administered to a total of 4,218 individuals in six studies (Bar-On, 2004).
The results found only minimal overlap between the EQ-i and tests of cognitive
intelligence, which was expected, given the Bar-On instrument was not designed
nor intended to assess cognitive intelligence. David Van Rooy and colleagues
also confirmed this finding and suggest that no more than 4% of the variance of
the EQ-i can be explained by cognitive intelligence (Van Rooy & Viswesvaran,
2004). These findings indicate emotional-social intelligence and cognitive

30
intelligence are not strongly related and are most likely separate constructs (Bar-
On, 2004; Van Rooy & Viswesvaran, 2004). A comprehensive description of the
psychometric properties of the instrument and how it was developed can be
found in the Bar-On Emotional Quotient Inventory- Technical Manual and in
Glenn Geher’s book, Measuring Emotional Intelligence: Common Ground and
Controversy (2004).
Contradictory evaluations of the EQ-i do exist. One study warns against
participants possibly "faking" answers to receive elevated scores on the EQ-i. A
study conducted by Day and Carroll (2008) indicate that college-age, student
participants were able to significantly increase their scores on the EQ-i when
motivated to do so. They further added that the study did "not answer the
question of whether faking decreases the predictive validity of the EQ-i."
An additional study, comparing the use of the MSCEIT and EQ-i to predict
the emotional intelligence of prospective accountants in the corporate hiring
process concluded that neither instrument was clearly better than the other and
that both required revisions to be used for this purpose. Nicholls, Wegener, Bay
and Cook (2012) claim that potential job candidates were able to purposely alter
their scores to fit a job description and make their application appear stronger.
This review takes into account the important part played by emotional
intelligence in America’s workforce and potential for consideration in America’s
schools. Corporate executives now realize how important it is for their employees
and managers to recognize, control and manipulate emotional inputs and
outputs, especially when dealing externally with clients. Hargreves (2000), Helm

31
(2007) and McNulty and Quaglia (2007) suggest that the relationships between
students and teachers matter and will likely lead to higher student achievement,
particularly for those students from at-risk backgrounds. To add to the current
literature researchers must discover whether or not a teacher’s emotional
intelligence or specific subdomain therein, can help indicate success in
motivating students to achieve at high levels. The following chapter will present
methodology, results and a discussion of possible relationships.
Copyright David Allen Rust 2014

32
Chapter Three- Research Methods
Introduction
The purpose of this study was exploratory in nature, to investigate the
relationships between the emotional intelligence composite scales and sub-
domain scores of teachers and the achievement of their sixth grade math
students.
This chapter provides an overview of the research methods undertaken for
this study. This includes a discussion of the design, followed by the setting and
context of the study. Information will be provided on the population sample and
sources for the data and will conclude by discussing the instruments, procedures
and data acquisition methods necessary to conduct the study.
Research Design Exploring the question of this pilot study required the use of descriptive
statistics, particularly through the calculation and interpretation of means, ranges
and standard deviations, across individuals and groups of teachers and students.
According to Morgan, Reichert, & Harrison (2002), the most basic information,
reported as measures of central tendency, is often the most useful. This study
investigated differences in emotional intelligence of teachers and relationships
that might exist with math gain scores of their students. Students were not
randomly selected nor were different controlled, experimental treatments applied.
To consider relationships between the math achievement of students and
their teachers' measured emotional intelligence, the researcher focused on sixth

33
grade, middle school, math teachers and their corresponding students in one
Midwestern school district to frame the study and report outcomes.
Research Setting and Context
This study was conducted during the 2008-2009 school year within a large
suburban, Midwestern, public school district serving residents near a major
metropolitan city. This large suburban school district will be referred to as
Cherokee County Schools for purposes of this study. According to the 2006
United States Census, the county was home to 110,000 residents, 94% of whom
were white and 3% of whom were African American. The median income of
households within the county was $56,477. The median age was 33 years old
and in 2006, 90% of people 25 years and over had at least graduated from high
school while 25% had a bachelor’s degree or higher.
Specifically, the study included teachers and students from four of the
district’s middle schools. The district serviced 18,225 students with 3,200 school
employees during the 2008-2009 school year. The district was one of the largest
school district in the state. The district maintained five middle schools with
enrollments ranging from 650 to 992 students, all with grades spanning six
through eight. According to the October 2008 district attendance data, the five
middle schools enrolled 4,036 students with 28.4% eligible for free and reduced
lunch. Within the five middle schools, 90% of students were designated as white,
and not of Hispanic descent. Ten percent of the remaining student demographic
were designated with minority status including all ethnic and racial statuses other
than that of white and non-Hispanic descent. One middle school, with an

34
enrollment of 642 students and a free-reduced lunch percentage of 67% was
omitted from the study for having a significantly higher percentage of free and
reduced lunch students in addition to being the researcher’s home school.
According to the 2008-2009 district report card, available through the state
department of education, the district spent $7,568 per student and maintained a
student-teacher ratio of 17:1. The report card indicated that the district
maintained an average of 3.5 students per each of the internet-connected
computers. Classroom teachers in the district averaged 11.6 years of experience.
Twenty-two percent of teachers held Bachelor’s degrees, while 59.4% held
Master’s degrees, and 18.6% earned Rank I (30 hours past Master’s) or Doctoral
degrees.
Research Sample
Data were collected from participating sixth grade math teachers and
matched with existing student data, which were provided by the school district.
The target population of teachers included 15 sixth grade math teachers. The
study was limited to these teachers in an attempt to isolate similar data. All
middle schools in Cherokee County utilize the same Ed Performance
assessment for progress monitoring. This test was not utilized in any of the
surrounding school districts for inclusion of their math teachers. In addition, all
middle school math teachers in Cherokee County followed similar curriculum and
targeted learning outcomes. Sixth grade math teachers were specifically chosen
for several reasons. Six grade math was a departmentalized subject in Cherokee
County, meaning that students received only math instruction from their

35
corresponding teacher, contrary to some elementary (grades kindergarten - fifth)
where students may receive multiple subject instruction from individual teachers.
In addition, sixth grade math, in contrast to succeeding secondary math courses
in grades seven through twelve, were more likely to heterogeneously grouped
and not leveled nor ability grouped. Finally, math as a course subject was
selected because there was less instructional influence of other teachers into the
yearly gain score earned by students. This is in contrast to student reading
achievement which could be heavily influenced by other teachers who
incorporate outside text or reading into their instruction. This would be likely in a
social studies or science classroom.
To be eligible for selection, teachers taught normally-scheduled and
departmentalized sixth grade math classes, or mainstreamed special education
math classes, which could contain students served by special education. The
classes, however, could not be scheduled as resource-only special education
classes. Of that population, eight teachers agreed to participate in the study,
seven female and one male teacher, ranging in age from 26 to 61 years old.
Table 3.1 presents teacher demographic data.

36
Table 3.1
Teacher Demographics
Teachers Gender Age Education Rank Certification Years of
Experience
Teacher A Female 42 2 1-8 20 +
Teacher B Female 29 2 5-9 Math 5-10
Teacher C Female 61 2 1-8 & Reading 20 +
Teacher D Female 46 1 1-8 20 +
Teacher E Female 53 2 1-8 20 +
Teacher F Male 44 1 K-4, 5-8 Math 20 +
Teacher G Female 26 3 5-9 Math/Science 0-5
Teacher H Female 51 2 K-4, 5-8 Math 10-20
Two teachers in this study maintained rank one status. Teachers earn
rank one status upon completing 30 or more hours of approved college credit
hours above a master’s degree. Five teachers held rank two status which is
awarded to teachers with a master’s degree. One teacher, the least experienced,
maintained rank three status, indicating a lack of a master’s degree.
The student population from which the study sample was drawn included
1,470 sixth grade students in the Cherokee County School District. Criteria for
inclusion in this study sample were students taught (1) by participating teachers,
and (2) in departmentalized, regular education settings. This resulted in a sample
of 717 students, 355 (49.5%) of which were male and 362 (50.5%) female. Of the

37
717 students, 8.5% (n = 61) were served by Individualized Education Plans
(IEPs), indicating they qualified for special education. Twenty-five (0.3%) of the
special education students were female and 36 (0.5%) were male. Additional
demographic information on students was not released or available for analysis
from the school district. Table 3.2 depicts the student sample for the study as
disaggregated by teacher.
Table 3.2
Student Demographics
Teachers # Students Male Female Special Education
Teacher A 122 63 59 18
Teacher B 82 46 36 13
Teacher C 98 50 48 1
Teacher D 77 38 39 6
Teacher E 96 42 54 5
Teacher F 94 48 46 13
Teacher G 73 33 40 3
Teacher H 75 35 40 2
Total 717 355 362 61
Instruments and Procedures
Fifteen sixth grade math teachers were eligible and recruited to participate
in the study. More teachers were not eligible to participate due to the limits of the
math assessment utilized and specific curriculum targeted for the study. The
researcher provided teachers with an informed consent letter notifying them of
the purpose of the study and providing an active opt in (See Appendix E). The

38
letter indicated any potential risks and reinforced the confidentiality of their
participation and survey results as required by the Institutional Review Board
(IRB). As noted by McMillan and Schumacher (2006), researchers should be as
open and honest with the subjects as possible. They continue by stating that,
“Informed consent is achieved by providing subjects with an explanation of the
research, an opportunity to terminate their participation, at any time with no
penalty, and full disclosure of any risks associated with the study” (p. 143).
Teachers were asked to return correspondence, including the informed
consent, if they were willing to participate. Eight teachers (53%) agreed to
participate in the study and completed the Bar-On E.Q-i emotional intelligence
assessment via an online survey called the EQ-i 125. The EQ-i 125 served as
the instrument chosen to measure the teachers' emotional intelligence.
The researcher selected the 125-item survey, located in Appendix F, in
part, as it could be completed in a timeframe consistent with a typical teacher’s
planning period and it provided a thorough evaluation of a teacher's emotional
intelligence. This research into the EQ-i 125 produced easily understood
descriptions of emotional intelligence while maintaining strong and well-vetted
validity and reliability scores along with thorough factor analyses. Mae Hapal, a
researcher in the psychology department at the Polytechnic University of the
Philippines, added, "The emotional quotient Inventory (EQ-i) is the first
scientifically validated and most widely used emotional intelligence assessment
in the world. Based on more than 20 years of research worldwide, the EQ-i
examines an individual’s social and emotional strengths and weaknesses" (n.d.,

39
p. 6). The evolution of the EQ-i reaches back to 1983 and has involved multiple
iterations, based on further studies repeated internationally, involving over 4000
participants (Bar-On, 2004). Bar-On (2004) claims that the EQ-i was scientifically
developed over a 17-year period to provide objective, cross-cultural information
about a person.
The primary investigator acquired the EQ-i 125, from Multi-Health
Systems, a publisher located in North Tonawanda, New York for approximately
$26.00 per assessment, in addition to the online scoring service and the
technical manual to assist with data interpretation. Teachers received a
password and given one week to complete the survey. They were additionally
informed they would receive results from the survey, which would be kept
confidential.
The 125 survey items of the EQ-i were administered "in the form of short
sentences using a 5-point Likert scale with a textual response format ranging
from 'very seldom or not true of me' to 'very often true of me or true of me" (Bar-
On, 1997, p. 3). All questions address Bar-On’s construct consisting of 15
subscales grouped in five composite scales. The five composite scales of Bar-
On’s construct are intrapersonal relationships, interpersonal relationships, stress
management, adaptability, and general mood. The five dimensions or composite
scales are comprised of fifteen subscales (Bar-On, 2004). Appendix A presents
the subscales under each dimension and the characteristics assessed.
This study also required a reporting of student math achievement against
which to measure the teachers' emotional intelligence. In Cherokee County,

40
elementary and middle school students complete an assessment (i.e. Ed
Performance test) in the fall and spring of each school year to identify
achievement gains in mathematics and reading. During the 2008-2009 school
year, gains were determined and assigned to students via the change in scale
scores achieved from one testing period to another. Students who did not
complete the assessment in either the fall or the spring were removed from the
study since no gain score could be reported.
The Scantron Corporation published the Ed Performance test as a
computer adaptive diagnostic in which students complete a mathematics and
reading assessment to measure gains over time. Teachers and school
administrators utilized the Ed Performance test to help identify students with skill
or knowledge deficits and to measure improvement in achievement after the
application of intervention or deficit reduction activities. The web-based
assessments required approximately one hour of class time for completion. Math
units or skills assessed included number and operations, algebra, measurement;
geometry, data analysis and probability, problem solving and computation skills.
Students between the grades of two and nine complete the Ed Performance
assessment two or three times per year.
Reliability and Validity of the EQ-i
Reliability and validity of the EQ-i have been established during the past
20 years of development and testing (Bar-On, 2004). The instrument’s technical
manual indicates nine types of validity studies were conducted. "They include:
content, face, factor, construct, convergent, divergent, criterion-group,

41
discriminant and predictive validity....each scale and sub-scale was tested across
all of these dimensions, reinforcing the instrument’s strength" (Bar-On, 2004, 89).
The EQ-I technical manual indicates both basic types of reliability studies,
internal consistency and retest reliability, were carried out on the EQ-i. Bar-On
(2004) reports, “By examining the results of the internal consistency and retest
reliability studies, it can be concluded that the EQ-I has demonstrated more than
adequate reliability” (p. 88). Bar-On (2004) goes further, stating that those who
administer this inventory can, with confidence, rely on the accuracy of the results
received. Dawda and Hart (2000) support this assertion after conducting an
independent assessment of the EQ-i, stating that their results indicated that the
EQ-i domain and component scales had good item homogeneity and internal
consistency and that scores were not unduly affected by response styles or
biases.
The EQ-i maintained an internal consistency index and a reported
indicator of validity for each subject who completed the instrument. For all eight
teachers participating, the EQ-I reported their validity indicators were all within
the acceptable range suggesting valid responses and results that were not
unduly influenced by response style.
The EQ-i individual summary reported an inconsistency index for each
participant. According to the technical manual response inconsistency identifies
respondents who contradict their answers or respond randomly (Bar-On, 2004).
The inconsistency indicators reported for all subjects fell within the “OK” category
indicating that answers are consistent. These indicators were important as they

42
helped to validate the usefulness of data presented and the reliability of the
instrument for use to measure the emotional intelligence of the teachers who
participated in this study.
Data Collection
To acquire emotional intelligence scores, the researcher contacted eligible
sixth grade math teachers in the spring of 2009, via a hard copy letter (located in
Appendix E), requesting their participation in the study. Email requests, including
the same letter were distributed on two additional occasions to secure
participation. Within a two-week period from the end of May, 2009 through the
beginning of June 2009, teachers confirmed their willingness to participate in the
study and completed the online EQ-i assessment.
Scores on the EQ-i 125 were computer-generated, and raw scores
tabulated and converted into standard scores based on a mean of 100 with a
standard deviation of 15 scale score points. Average to above average EQ
scores on the EQ-i suggests that the respondent is effective in emotional and
social functioning and the higher the score, the more positive the prediction for
effective functioning (Bar-On, 2005). Low EQ scores suggest an inability to be
effective and the possibility of existing emotional, social and/or behavioral
problems (Bar-On, 2005). Bar-On (2004) recommends the invalidation of any
score achieved on the EQ-i that is greater than two standard deviations above
the instrument mean. This equates to a scale score of 130 or greater.
A correction factor was built into the instrument to automatically adjust the
scale scores based on scores obtained from two of the instrument’s validity

43
indices. These indices are Positive Impression and Negative Impression. This
important feature of the EQ-i reduces the potentially distorting effects of response
bias and therefore increases the accuracy of the results for self-reported
measures (Bar-On, 2005).
A web-accessible, five-page individual summary report was generated for
each respondent. This report provided demographic information, results including
the Total EQ, composite scales, content subscales, validity indicators, positive
impression scores, an inconsistency index and individual item responses. Each
participating teacher received a separate electronic summary report. An
anonymous copy of the summary report is located in Appendix G.
To acquire student math performance scores the researcher requested
and received Ed Performance math scores for the students taught by the
teachers participating in the study. Students completed a computerized
assessment in the fall of 2008. The Ed Performance assessment assigned scale
scores, measuring their performance. Students completed a similar assessment
in the spring of 2009 and were assigned scale scores. In addition, each student
was assigned a gain score demonstrating the level of improvement over the
course of the year by subtracting the fall scale score from the spring scale score.
During the spring and early summer of 2009, once students had
completed their post- Ed Performance assessments, the researcher contacted
principals in schools with participating teachers to request the outcomes of
students assigned to those teachers. An excel spreadsheet was requested,
omitting student names but including information about the teacher to whom they

44
were assigned for sixth grade math, the student’s gender, whether or not they
received special education services and their Fall and Spring Scantron math
scale scores. The researcher redacted the scores and corresponding data of
students who failed to complete either the Fall or Spring assessment.
Data Analysis
To explore possible relationships which may exist between the emotional
intelligence of teachers and achievement of sixth grade math students, the
researcher used measures of central tendency to evaluate the five emotional
intelligence composite scales and 15 subscales as related to their students' math
achievement. Specifically, means and standard deviations were reported on the
five composite scales of emotional intelligence. The composite scales are:
intrapersonal, interpersonal, stress management, adaptability, and general mood.
The means and standard deviations were also reported for the 15
emotional intelligence subscales. The 15 subscale were self-regard, emotional
self-awareness, assertiveness, independence, self-actualization, empathy, social
responsibility, interpersonal relationship, stress tolerance, impulse control, reality
testing, flexibility, problem solving, optimism and happiness. Descriptive statistics
were utilized to disaggregate teacher scores. These and the composite scale
scores were also evaluated against teacher demographics to better understand
how different teachers rated across the emotional intelligence outcomes.
The researcher measured student math achievement utilizing the Ed
Performance assessment scores. Scores were reported as pre-test scores, post-
test scores and gain scores, indicating the difference between the two. Outcomes

45
were reported, per teacher, for comparison. Descriptive statistics were calculated
and considered, based on teacher demographic data and emotional intelligence
outcomes.
Role of the Researcher
The researcher performed this study as the primary and only investigator,
producing all necessary documentation, recruiting and confirming participants
and evaluating all collected data. The researcher conferred with doctoral
committee members and, on at least four occasions, with statistics advisors from
two different, local universities.
Because the primary researcher serves as a middle school principal within
the targeted school district, it was important to maintain some separation from
the teacher participants by not electing to conduct the study with his home
school. Teacher participants and students involved were in no way influenced or
evaluated by the researcher.
Limitations
As an exploratory investigation with limited resources, several limitations
to this study surfaced quickly. The limitations included its small sample size of
eight teachers. Having fewer participants within a sample typically leads to a lack
of variance. This few participants violated the assumptions for conducting
parametric investigations and interpreting or generalizing any findings. Lacking
variance and can greatly hinder the ability to find significant differences or
relationships among data reported.

46
The self-reporting nature of the survey instrument may have acted as a
limiting factor as well. However, the EQ-i utilizes an inconsistency index, positive
and negative impression score, and correction scale to enhance validity. The
instrument provides these measures to help the researcher determine whether or
not the results are a realistic and accurate self-appraisal that is not overly
negative or positive. Day and Carroll (2012) refute this claim stating that
participants are able to "fake it" or significantly increase their scores on the EQ-i
when motivated to do so. In their study, students were motivated by the use of
fifty dollars to produce higher EQ scores. Then students were asked to take the
assessment again, the second time without any money to motivate their
responses. Significant score differences were achieved. The positive impression
index did not adequately identify the elevated scores.
The study could, therefore, be improved if a multi-rater scale had also
been utilized and compared with the self-reported scale results. An investigator
could accomplish this by either soliciting the survey opinions of supervisors, co-
workers, or students with whom the teachers work on a regular basis. Several
other published instruments, including the EQ 360 and the EQ interview, may be
utilized for this purpose.
Another potential limitation is the possibility of many other factors
influencing student achievement gains. Classroom differences, lighting, class
length, period of the day, and after-school tutoring involving different teachers
could all be potential variables not controlled for in this study.

47
A limitation exists within the sample of teachers as well. There are so
many variables that influence good teaching. It is difficult to isolate all but one.
There could potentially be one or several unseen possibilities which lead to
student achievement. One example could be the math text or program, which
was not controlled for in this study.
Finally, the Ed Performance assessments, used to measure student gains,
were administered over two days, once in the fall and again in the spring. They
may not be aligned with the teacher’s taught curriculum and like every test,
scores may be influenced by individual student motivation and personal or
environmental distractions.
This study of teacher emotional intelligence and its relationship to student
performance is a unique one. The goal of this study was to shed some light on a
potential teaching variable or variables, which principals may rely on to hire
effective teachers, to lead or interact with those teachers and to affect teacher
professional development. This exploratory study just begins to provide useful
information and data which could lead to future studies.
This study was negatively affected from the beginning by a low number of
participants. The targeted group of teachers was only 15 due to organizational
and management issues. The teacher population should have been at least two
to three times this number. With only eight teachers agreeing to participate,
accumulating generalizable results was very difficult and hence, inferential
statistics were not utilized. The cost of the EQ-i instrument, however, was a
mitigation factor which also limited the size of the targeted study population.

48
The study was additionally limited by the need to maintain student
assessment to measure student achievement that would be universal across
teachers and administered in a like manner and in like testing environments.
This was not controlled for. Another potential limitation was the administration of
the study by a known and sitting principal. Due to this fact, it is likely that several
of the teachers declined to participate due to a perceived lack of confidentiality or
concern that outcomes may influence performance ratings at their own school.
Summary
This chapter provided the framework for the methods undertaken in this
investigation. The question selected indicated the researcher’s belief there may
be a connection between the emotional intelligence of sixth grade math teachers
and their students’ academic performance. This study examined potential links
through the participation of eight middle school teachers and 717 of their
students as measured by the Ed Performance assessment of math gains and the
EQ-I to measure emotional intelligence.
The next chapter will present the data accumulated and discuss possible
associations or relationships across teachers and students. The final chapter will
offer conclusions based on the data outcomes and some discussion of next steps
for future investigations.
Copyright David Allen Rust 2014

49
Chapter Four - Results
This chapter reports accumulated data and is organized to provide initial
findings based on the question of the study. In addition, data are included to
provide insight, which may later lead to additional commentary and further
considerations. Due to a lack of participating teachers (N=8) in this study, the
parametric assumptions for utilizing inferential statistical instruments was not
met. This chapter will focus on reporting the descriptive statistics.
The purpose of this study was to investigate the potential relationship
between the emotional intelligence of teachers and the achievement of the sixth
grade math students in their classrooms. Specifically, the study focused on the
following question:
What relationships exist between the measured emotional intelligence of
sixth grade math teachers and the achievement of their students?
This chapter is organized to provide the student math achievement data
and teacher emotional intelligence outcomes. These outcomes will be discussed
as an aggregate group and then disaggregated by teacher. Student math
outcomes will be discussed first and then referenced in discussion of the different
emotional intelligence measures, total EQ, composite scales and subscales. The
researcher will use descriptive statistics to inform discussion.
Measuring Student Math Achievement
To discuss the research question, the gain scores achieved by students
for each teacher participating in the study were calculated and matched with the
corresponding teacher’s emotional quotient score. Given the need for matched
pre- and post-scores to calculate overall gain scores, 47 of students who did not

50
meet this criteria were omitted from the study. Table 4.1 depicts the pre-test
scale score ranges of students.
The Ed Performance fall assessment was completed by students between
August 15th and September 30th, 2008. Of the 717 students, scale scores ranged
from 1,971 to 3,137, with a group mean of 2,623.35 (SD = 160.18). According to
the national norming documentation provided for this assessment, students
scoring between 2,429 and 2,676 at the beginning of the school year fell in the
interquartile range. Students scoring 2,839 or above were considered advanced
and preformed within the top quartile of students nationally. Those performing
below 2,428 were considered at risk and in the bottom quartile nationally.
Twenty-five students of the 717 (3%) fell in the at-risk range. Forty-eight students
(6%) performed in the advanced range. The mean of this sample scored at the
high end of the nationally normed inter-quartile range.
Table 4.1 additionally depicts the central tendencies of the student pre-test
scores by teacher and summarizes totals. The table provides the number of
students taught by each teacher in addition to the minimum and maximum scores
achieved by individual students within the corresponding teachers’ classes. In
addition, the range of student scores, mean and standard deviations are noted.
Students instructed by teacher A showed the greatest range of pre-test
scores with outcomes as low as 1,971 and scores as high as 3,021, a range of
1,050 points (SD = 194.5). The average range for the group was 791.75. In
contrast, the range of student scores for teacher H was a pre-test score of 2,312

51
and a high score of 2,972, for a range of 660 points. Most teachers fell within the
700 to 880 point range with standard deviations in the 140 range.
As previously noted, students who scored in the range from 2,429 and
2,676 at the beginning of the school year ranked in the inter-quartile range, which
was consistent with the study sample. The total mean scale score of 2,623.35
ranked at the upper end of the inter-quartile range.
Table 4.1
Pre-Test Scale Score Central Tendencies- Student Scores by Teacher
Teachers No. of Students
Minimum Score
Maximum Score
Range Mean Std. Deviation
Teacher A 122 1971 3021 1050 2608.48 194.5
Teacher B 82 2029 2903 874 2525.41 162.8
Teacher H 98 2314 3111 797 2668.84 139.1
Teacher D 77 2330 3137 807 2677.45 146.8
Teacher E 96 2157 2861 704 2594.65 141.2
Teacher F 94 2123 2883 760 2612.27 148.3
Teacher G 73 2302 2984 682 2668.23 127.7
Teacher H 75 2312 2972 660 2646.55 141.7
Total 717 1971 3137 1166 2623.35 160.1
The middle schools in Cherokee County conducted the Ed Performance
post-test between April 1st and May 15th. Of 717 students, the lowest performer
achieved a scale score of 2,181 while the highest performer achieved a score of
3267 for a range of 1086 points. The mean score for the group was 2,770.07 (SD
= 155.90).

52
For the spring data points, students scoring between 2,528 and 2,798
were considered to be within the inter-quartile range. Students performing below
2,527 were considered at risk and students performing above 2,973 were
considered to be advanced, based on their nationally normed data (Scantron
Performance Series Technical Report, 2009). Similar to the pre-test data, the
group mean of 2,770.07 fell within the inter-quartile range but at the upper end.
Table 4.2 depicts the central tendencies and totals of the student post-test
scores by teacher. This includes the number of students taught by teachers in
addition to the minimum and maximum scores achieved by individual students
within their corresponding teachers’ classes. In addition, the range of student
scores, means and standard deviations are noted.
Similar to the pre-test, students instructed by teacher A showed the
greatest range of post-test scores from 2,181 to 3,127 for a range of 946,
compared to pre-test range of 1,050 scale score points (SD = 194.5 pre-test and
183.87 post-test). In contrast, students from teacher E posted a minimum post-
test score of 2,429 and a high score of 3,034, with a range of 605 points. For
reference, the range for the group was 1,086 with an average range of 750.75,
both of which were smaller than the pre-test.
In terms of variance, teachers A (SD = 183.87) and B (SD = 184.37)
posted the highest standard deviations of the group. Teacher H’s students
posted the highest mean scores (2838.41) and the smallest standard deviation
(113.34). Teacher E, whose students did not score quite as high (M = 2759.49)
maintained a small standard deviation (118.16) as well. This demonstrates that

53
teacher E’s and teacher H’s student gain scores were much more homogeneous
while teachers A and B scores demonstrated more variance and more
heterogeneity across their students’ performance.
Table 4.2 Post-Test Scale Score Central Tendencies- Student Scores by Teacher
Teachers N Minimum Maximum Range Mean Std.
Deviation
Teacher A 122 2181 3127 946 2748.07 183.87
Teacher B 82 2191 3076 885 2723.79 184.37
Teacher C 98 2459 3071 612 2784.18 149.28
Teacher D 77 2447 3267 820 2830.68 148.88
Teacher E 96 2429 3034 605 2759.99 118.16
Teacher F 94 2311 3024 713 2745.49 140.01
Teacher G 73 2184 2988 804 2750.63 150.45
Teacher H 75 2422 3043 621 2838.41 113.34
Total 717 2181 3267 1086 2770.07 155.90
Table 4.3 depicts the mean beginning and ending scale scores by teacher.
Overall, students earned a mean scale score gain of 146.72 points, calculated
from the difference between the mean post-test score of 2770.07 and the mean
pre-test score of 2623.35. Among the 717 students, the individual gains ranged
from 720 points of gain to a student who posted a -282 point loss from pre-test to
post-test, for a total range of 1002 points.
Of the eight who participated in the study, students taught by teachers D,
E, and H achieved the highest mean gain scores of 153.23, 165.34 and 191.86,

54
respectively. Students in the classes of teachers G, C, F and B achieved the
lowest aggregate mean scale score gains of 82.4, 115.34, 133.22 and 134
respectively. Interestingly, teacher C’s mean student post-test scale score
(2784.18) ranked at the upper end of the interquartile range and her students'
pre-test mean scale score (2668.84) was one of the highest as well but only
managed to achieve 115.34 points of mean gain, well below the 146 point mean
for all students. Likewise, teacher G, the most inexperienced of the group with
less than five years of teaching experience, inherited the second highest
achieving group of students at the beginning of the year (M=2668.84). Her
students made only 82.4 points of gain, finishing the year with a mean post-test
score of 2750.63, twenty points below the mean post-test score. The table shows
the numbers of students taught by teachers.

55
Table 4.3
Student Achievement Mean Scale Score Gains Per Teacher
Teachers # Students Pre-Test
Mean Scale Score
Post-Test Mean Scale
Score
Mean Scale Score Gain
Teacher A 122 2608.48 2748.07 139.59
Teacher B 82 2525.41 2659.41 134.00
Teacher C 98 2668.84 2784.18 115.34
Teacher D 77 2677.45 2830.68 153.23
Teacher E 96 2594.65 2759.99 165.34
Teacher F 94 2612.27 2745.49 133.22
Teacher G 73 2668.23 2750.63 82.40
Teacher H 75 2646.55 2838.41 191.86
Total 717 2623.35 2770.07 146.72
Measuring Teacher Emotional Intelligence
Bar-On (2004) reported that one third of all individuals taking the EQ-i will
achieve total EQ scores between 85 and 115. The EQ-i technical report indicated
the instrument was scaled to a mean of 100 with a standard deviation of 15
points. Bar-On (2004) indicated that individuals achieving total EQ scores above
100 were considered emotionally intelligent, while those whose scores fell below
90 may need to improve emotional skills in specific areas.
Table 4.4 reports the minimum and maximum composite scale scores,
mean scores, ranges and standard deviations in addition to the same measures
for the total EQ of the eight teachers participating in the study. This table

56
indicates that teachers’ total EQs ranged from 90 to 116, a range of 26 points.
The teachers (N=8) achieved a mean EQ score of 103.88 (SD = 10.68). The total
EQ provides the researcher with a starting, but broad measure of a person's
emotional intelligence (Bar-On, 2004).
The mean scores for the EQ composite scales fell within a small range of
5.12 points. This range (100.13 - 105.25) brackets the total EQ (M = 103.88) for
the group. The teachers achieved the highest scores for Intrapersonal
relationships (M = 105.25, SD = 8.00) with adaptability (M = 100.13, SD = 8.63)
being scored the lowest. Ironically, these two composite scales demonstrated the
least amount of variance, with the smallest standard deviations and the smallest
ranges of scores for this group of teachers. The range of scores for intra-
personal relationship was only 22 points and 23 points for adaptability.
Conversely, the greatest ranges and variance of scores were recorded for
interpersonal relationships (M = 104.13, SD = 15.92) with a range of 44 scale
score points and general mood (M = 105.13, SD = 15.32) with a range of 42
points.
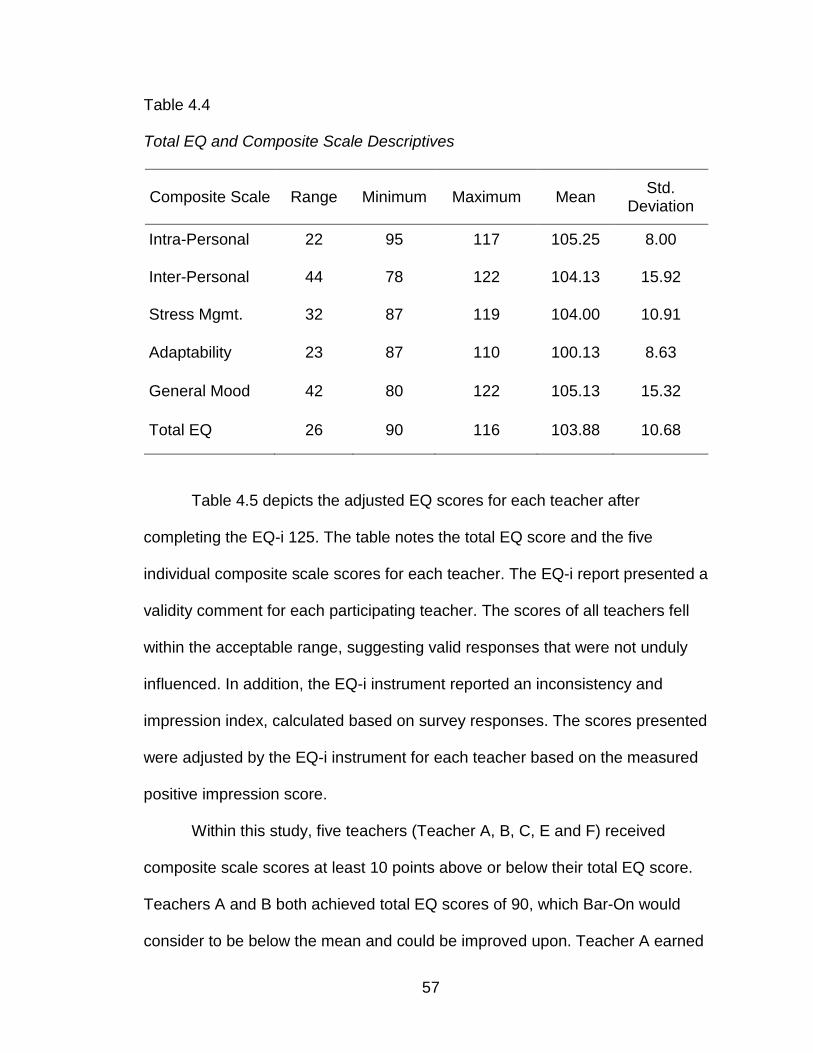
57
Table 4.4
Total EQ and Composite Scale Descriptives
Composite Scale Range Minimum Maximum Mean Std. Deviation
Intra-Personal 22 95 117 105.25 8.00
Inter-Personal 44 78 122 104.13 15.92
Stress Mgmt. 32 87 119 104.00 10.91
Adaptability 23 87 110 100.13 8.63
General Mood 42 80 122 105.13 15.32
Total EQ 26 90 116 103.88 10.68
Table 4.5 depicts the adjusted EQ scores for each teacher after
completing the EQ-i 125. The table notes the total EQ score and the five
individual composite scale scores for each teacher. The EQ-i report presented a
validity comment for each participating teacher. The scores of all teachers fell
within the acceptable range, suggesting valid responses that were not unduly
influenced. In addition, the EQ-i instrument reported an inconsistency and
impression index, calculated based on survey responses. The scores presented
were adjusted by the EQ-i instrument for each teacher based on the measured
positive impression score.
Within this study, five teachers (Teacher A, B, C, E and F) received
composite scale scores at least 10 points above or below their total EQ score.
Teachers A and B both achieved total EQ scores of 90, which Bar-On would
consider to be below the mean and could be improved upon. Teacher A earned

58
very consistent composite scale scores of either 94 or 95, with the exception of
inter-personal relationship (78) which was markedly lower. Teacher B's
composite scale scores ranged from 80 to 104, with three scores in the 80s
(stress management, adaptability and general mood). These teachers
demonstrate Bar-On's concern about considering only the total EQ to describe an
individual's emotional intelligence. Although they both maintain total EQ scores of
90, their composite scales draw a much different picture. Three of teacher B's
composite scale scores are more than one standard deviation from the mean
while that is only true for one of teacher A's composite scales.
Teachers G and H achieved the highest overall total EQ scores of 115 and
116, respectively. Their composite scales were very high with a distribution from
108 to 119, both extremes in the range being achieved by teacher G. Teachers E
and F both achieved high scores in general mood (122) while teacher E also
earned a 122 composite scale score in interpersonal relationships as well.
In terms of composite scale ranges, teacher H, who earned the highest
total EQ score, also had the smallest range of composite scale scores, with all
scores falling within eight points (110 - 118) of each other. Interestingly, Teacher
H's students also achieved the greatest math gains (M=191.86) as an aggregate
group. Teacher F maintained the largest range (93 -122) of composite scale
scores, measuring 29 points of difference. Teacher F's students as a group only
achieved 133.22 points of mean gain on their math assessments from fall to
spring.

59
Table 4.5
Teachers’ Total EQ and Composite Scale Scores
E.Q. Composite Scale Relationship to Student Achievement
The following table introduces the overall mean scale score gains for the
math students, disaggregated by teacher, to provide perspective against the
individual teacher composite scale scores and the total emotional intelligence
scores of each teacher. Table 4.6 also reports the corresponding composite
scales and means for all outcomes. Note that the student math gains reported for
the entire group (M = 146.72) is the mean gain for all students (N=717) rather
than the mean calculated from the mean gains as reported by teacher. This is
necessary due to the differences in the number of students served by each
teacher.
Teacher Total EQ
Intra-personal
Inter-personal
Stress Manage Adapt General
Mood
Teacher A 90 95 78 94 94 95
Teacher B 90 96 104 87 87 80
Teacher C 107 102 117 101 105 110
Teacher D 95 103 89 97 95 90
Teacher E 110 106 122 112 94 122
Teacher F 108 108 93 111 107 122
Teacher G 115 115 112 119 109 108
Teacher H 116 117 118 111 110 114
Mean 103.88 105.25 104.13 104 100.13 105.13

60
When evaluating these data, it was noticeable that teachers E and H, in
addition to having several of the highest composite scale scores, also taught
groups of students achieving the two greatest mean math scale scores. In
addition, one quickly sees that teacher D, whose students earned a better than
average scale score gain (M = 153.23), seemed to have lower composite scale
scores, ranging from 89 -103. Teacher C, to the contrary, with a much lower
student mean gain score of 115.34, achieved EQ composite scale scores ranging
from 101 to 117 points.
Teacher G stands out of the group. Although having one of the highest
overall EQ scores (115) and exceeding the mean by a standard deviation or
better on all but one of the composite scales (general mood), this teacher's
students achieved the least in terms of math achievement (M = 82.40). When
referring back to the teacher demographic data reported in table 3.1, one notices
that this teacher was the least experienced of the group. Teacher G taught for
the fewest number of years and achieved the least in terms of college credentials
and teacher rank. This, rather than emotional intelligence, may have exerted a
greater influence in student achievement.

61
Table 4.6
Teacher EQ Composite Scale Scores and Student Achievement
Teacher Math Gains
Total EQ
Intra-Person
Inter-Person
Stress Mgmt.
Adapt-ability
Gen. Mood
Teacher A 139.59 90 95 78 94 94 95
Teacher B 134.00 90 96 104 87 87 80
Teacher C 115.34 107 102 117 101 105 110
Teacher D 153.23 95 103 89 97 95 90
Teacher E 165.34 110 106 122 112 94 122
Teacher F 133.22 108 108 93 111 107 122
Teacher G 82.40 115 115 112 119 109 108
Teacher H 191.86 116 117 118 111 110 114
Mean 146.72 103.88 105.25 104.13 104 100.13 105.13
Exploring EQ Sub-Scales
The researcher conducted an additional investigation, looking for
relationships between student math gains and the emotional intelligence
subscales of their corresponding teachers. This is the level of greater specificity
below the EQ composite scales. Each composite scale was divided into
subscales that are more specific descriptors of emotional intelligence. According
to Bar-On (2004), "...it is important to examine more closely the EQ composite
scales and, particularly, the EQ subscales. A high total EQ score can hide a low
score on one or more of the underlying subscales and vice versa” (p. 43). It
seemed reasonable, therefore, for this pilot study to venture into a review of the
subscales to see if any additional relationships could be recognized to inform
future researchers and investigations.

62
Each of the five composite scales are divided into two to five subscales.
These are the most specific of Bar-On’s measures through the EQ-i and each
teacher had subscale scores assigned to them through the course of the online
questionnaire. The 15 subscales and their assignment to corresponding
composite scales, with brief definitions, are listed in Appendix A. In the following
tables, each of the composite scales, with their complement of subscales are
reported for teachers, along with their assigned students' math gain scores.
Table 4.7 introduces the intrapersonal subscale scores per teacher with
the corresponding teachers' student math gains. Means and standard deviations
are presented for each of the subscale scores across the group. The five
intrapersonal subscales are (1) self-regard, (2) emotional self-awareness, (3)
assertiveness, (4) independence and (5) self-actualization. Bar-On (2004)
describes a person with strong intrapersonal scores as a person who is in touch
with their feelings, feels good about themselves, who is positive in what they are
doing and is strong and confident in conveying their ideas and beliefs.
Teachers' scored varied across these subdomains. Teachers scored the
highest in self-actualization (M = 111, SD = 9.55) with the least amount of
variance among the group. In contrast, teachers scored the lowest in
independence (M = 95, SD = 14.98) with the greatest amount of variance with
scores ranging from 65 to 112 points.
The three teachers (H, E, & D) who scored the highest in self-actualization
also taught students who posted the three highest mean math gains across all
groups. Teacher H and teacher E, whose students achieved the two greatest

63
mean gains of 191.86 and 165.34, respectively, also attained the highest scores
in self-actualization at 122 and 119, and were the only two teachers near or
above a standard deviation (9.55) from the mean of 111 points. Teacher D,
additionally achieved a high score of 117 in the self-actualization subscale.
Teacher D's students posted the third highest mean math gain of 153.23 points.
Interestingly, teacher G, whose students achieved the least amount of
math gain, was the only teacher in the group to earn an assertiveness score
(120) which exceeded one standard deviation (10.77) above the mean (105).
This elevated score may inform future investigations into the assertiveness
subdomain of teachers and possible relationship to student achievement.
Table 4.7
EQ Intrapersonal Subscales and Student Achievement
Math Gains SR ES AS IN SA
Teacher A 139.59 99 91 84 105 102
Teacher B 134.00 80 102 113 102 93
Teacher C 115.34 95 122 101 82 111
Teacher D 153.23 89 107 110 95 117
Teacher E 165.34 110 123 101 65 119
Teacher F 133.22 119 90 104 102 114
Teacher G 82.40 111 118 120 99 113
Teacher H 191.86 113 110 110 112 122
Mean 146.72 102 108 105 95 111
SD 101.96 13.45 12.96 10.77 14.98 9.55 Note. SR = self-regard; ES = emotional self-awareness; AS = assertiveness; IN = independence; SA = self-actualization

64
Table 4.8 introduces the interpersonal subscale scores of teachers and
their students' math performance. The interpersonal composite scale is
composed of the empathy, social responsibility and interpersonal relationship
subscales. The means for all three subscales were very close with similar
variance as measured by standard deviations.
Teachers demonstrated the largest range of scores in interpersonal
relationships (M = 104), extending 55 points from 72-127. This was supported by
the largest variance (SD = 17.24) of scores. Empathy (M = 102, SD = 14.46) had
a range from 77 to 116 points. The range for social responsibility (M = 104, SD =
114.24) extended from 85 to 116 points. In exploration of this composite scale, it
was difficult to identify any potential or informative trends. Teachers H and E,
whose students achieved the highest math gains, once again posted two of the
three highest scores (118 & 115) in the social responsibility subscale. Teacher G,
who achieved a social responsibility score of 116 but whose students made the
least amount of gain (M = 82.40), contradicted this outcome.

65
Table 4.8
EQ Interpersonal Subscales and Student Achievement
Math Gains Empathy Social
Responsibility Interpersonal Relationship
Teacher A 139.59 87 89 72
Teacher B 134.00 109 110 100
Teacher C 115.34 116 113 117
Teacher D 153.23 91 88 90
Teacher E 165.34 109 115 127
Teacher F 133.22 77 85 105
Teacher G 82.40 112 116 109
Teacher H 191.86 112 118 115
Mean 146.72 102 104 104
SD 101.96 14.46 14.24 17.24
Table 4.9 depicts the stress management subscales scores for teacher
and their corresponding student math achievement scores. The stress
management composite is composed of the stress tolerance and impulse control
subscales. As a group, the mean scores were similar for both, with stress
tolerance (M = 104, SD 14.93) having almost twice as much variance. Impulse
control (M = 103, SD = 8.64) had a smaller range and greater homogeneity of
scores, all falling between 94 and 105, with the exception of teacher G, who, at a
score of 123, was a significant outlier, more than two standard deviations above
the mean.
Some interesting numbers were exposed when exploring the stress
tolerance subscale. Teachers H and E, whose students achieved the highest

66
math gains, also earned the highest scores in the subscale. Their scores of 118
and 120, respectively, were the only two to fall at or above one standard
deviation from the mean (M = 104, SD = 14.93). Teacher D's outcomes,
however, contradicted this statement with the third highest student achievement
scores (M = 153.23) but the next to lowest stress tolerance score (90) of the
group, nearly a full standard deviation from the group mean.
Table 4.9
EQ Stress Management Subscales and Student Achievement
Math Gains
Stress Tolerance
Impulse Control
Teacher A 139.59 95 94
Teacher B 134.00 79 99
Teacher C 115.34 103 99
Teacher D 153.23 90 105
Teacher E 165.34 120 101
Teacher F 133.22 117 102
Teacher G 82.40 110 123
Teacher H 191.86 118 102
Mean 146.72 104 103
SD 101.96 14.93 8.64
Table 4.10 introduces the adaptability composite scale and the teacher
scores for its subscales of reality testing, flexibility and problem solving, along
with the students' corresponding math gains. Problem solving (M = 99) and
reality testing (M = 99) had very similar variance and homogeneity of scores with
standard deviations of 7.54 and 7.78, respectively. Teachers achieved a smaller

67
mean score in flexibility (M = 94, SD = 13.03) with almost double the variance
across scores.
When exploring the subscale outcomes against student math gains per
teacher, it was difficult to identify and trends. Teacher H (111) whose students
were the highest math performers (M = 191.86) and teacher C (109), whose
students performed near the bottom (M = 115.4), earned the highest scores
achieved by teachers in problem solving, effectively contradicting each other.
Teacher E, whose students achieved the second highest math gains, scored a
91 on this subscale, which was more than one standard deviation below the
mean, additionally confusing the outcomes.
Teachers H and E, with their students' high math performance, achieved
two of the three highest score in reality testing, at 113 and 112, respectively.
Teacher G, contradicted this potential with the highest reality testing score of
113, more than one standard deviation from the mean (106) but with the lowest
overall student math gains (M = 82.40).
The teachers' performance scores on the flexibility subscale did not
provide any immediately useful insight against math performance with a range of
32 points (79-111), seemingly scattered indiscriminately across all student
achievement scores. However, it is interesting to note that the teacher mean
score for flexibility (94) was the lowest for all of the 15 subscales with
independence (95) being a close second.

68
Table 4.10
EQ Adaptability Subscales and Student Achievement
Math Gains
Reality Testing Flexibility Problem
Solving
Teacher A 139.59 98 87 100
Teacher B 134.00 93 83 90
Teacher C 115.34 101 102 109
Teacher D 153.23 107 80 99
Teacher E 165.34 112 79 91
Teacher F 133.22 110 111 96
Teacher G 82.40 114 108 99
Teacher H 191.86 113 101 111
Mean 146.72 106 94 99
SD 101.96 7.78 13.03 7.54
Table 4.11 depicts the general mood composite scale and teacher
performance on its two subscales of optimism (M = 107, SD = 11.22) and
happiness (M = 104, SD = 16.98). As a group, teachers achieved nearly the
same mean scores across these subscales. Teacher scores in happiness are
spread across a larger range (74 - 120) than in optimism (92 - 122), reinforcing
its larger standard deviation.
The teacher scores for happiness did not appear to coincide in any
manner with their corresponding student achievement scores.
Teacher scores for optimism showed more promise. Teacher H and E,
whose students maintained the highest mean math gains of 191.86 and 165.34,
respectively, also posted two (118 & 117) of the three highest scores in optimism.

69
Teacher F achieved a score of 122 on the optimism subscale but taught students
who failed to meet or exceed the math achievement mean score. All three of their
optimism scores approached or exceeded one standard deviation above the
mean for the group. Teacher C, whose students achieved the next to lowest
math gains, eared an optimism score of 109, which was two points above the
mean for the group and a happiness score of 112 which was eight points above
the group mean. This teacher's performance across the general mood subscales,
tended to contradict other scores and violated potential relationships.
Table 4.11
EQ General Mood Subscales and Student Achievement
Math Gains Optimism Happiness
Teacher A 139.59 96 97
Teacher B 134.00 92 74
Teacher C 115.34 109 112
Teacher D 153.23 98 85
Teacher E 165.34 117 122
Teacher F 133.22 122 120
Teacher G 82.40 105 111
Teacher H 191.86 118 108
Mean 146.72 107 104
SD 101.96 11.22 16.98
Summary
This exploratory investigation attempted to uncover some data useful for
initiating other studies into the possible relationships that may exist between the

70
emotional intelligence of teacher and their students' corresponding achievement.
This chapter disaggregated the emotional intelligence scores of eight
participating teachers, down to the 15 individual EQ subscales. Although no
inferential statistics were utilized for this study, due to the limited number of
participants, some interesting data were produced which may further inform
future researchers interested in the pursuit of similar or related studies.
This study identified a few areas of interest based on teacher emotional
intelligence measures and the math performance of their students. When
exploring the total EQ, teachers H and E achieved two of the three highest
scores and the greatest math achievement gains. Teacher G, however had the
second highest total EQ and the lowest student achievement scores, which
seemed to defeat a possible relationship.
When exploring the EQ composite scales, either teachers E and H, whose
students made the greatest gains, posted the highest scores across all the
composite scales, except stress management. Contrary to this information was
teacher G, who earned the second highest composite scale scores in three areas
and the highest in stress management, even though her students were the
lowest performers.
An exploration of the 15 EQ subscales provided some insight. Teachers H
and E scored the highest on the stress tolerance subscale while teaching the two
groups of students who made the greatest gains. Teachers H, E and D
additionally posted the highest subscale scores in self-actualization which related
to the fact that their students achieved the three highest gains in math. Although

71
these numbers are not statistically significant due to a lack of sample size and
incorporation of parametric measures, they may promote additional work into a
larger study incorporating more teachers to measure the size and strength of
possible relationships, effects, significance and generalizability.
Chapter five will summarize the research and findings of this pilot study. It
will discuss the limits of these data and make recommendations for future
research. Chapter five will also attempt to generalize the findings back into the
research and provide additional thoughts about the study of the emotional
intelligence of teacher and the possible uses in the field of education.
Copyright David Allen Rust 2014

72
Chapter Five- Discussion
Introduction
Chapter five contains four important sections. The first section
summarizes the study to provide an overview of the problem, the purpose, the
research question along with a summary of findings. The discussion section
provides literature framing the study, a narrative regarding the findings and a
synthesis of the results and recommendations for future research or examination.
The final section will conclude the chapter and provide additional thoughts.
Linda Darling-Hammond (1997) states that the classroom teacher is the
most influential variable promoting student achievement outside of the child’s
home environment. Several questions remain. What do successful teachers do
that influence and promote student achievement? What variable or variables
“make” a good teacher? Do relationships and emotional understanding really
make a difference? Can these differences be quantified or measured? Can the
successful variables be grown through professional development or mentoring?
The question driving this study is; do relationships exist between a
teacher’s emotional intelligence and the academic achievement of his or her
students? Surmising, based on previous research, that students best perform
when they have an established relationship with, or trust in a teacher, it was
hypothesized that increased student performance may relate to teachers
maintaining higher levels of emotional intelligence. Teachers with higher
emotional intelligence would, therefore, be better suited to interact with students
and peers leading to greater achievement. This, in turn, would better inform

73
hiring officials and principals, and influence professional development as a
means to increase student achievement via the enhancement of a teacher's
emotional intelligence.
Summary of the Study
The purpose of this study was exploratory in nature, to investigate the
relationship between the emotional intelligence composite scales and sub-
domain scores of teachers and the achievement of their sixth grade math
students.
Although only an exploratory investigation into the potential connection
between a teacher’s emotional intelligence and the possible association with
student outcomes, clarity is elusive. Part of this results from the lack of teacher
participants (N=8) and the many possible, unmeasured or isolated variables,
which may be at play within or across classrooms and schools. This is always an
issue and consideration when conducting research in the social sciences.
Some interesting data did emerge, particularly in the composite scale of inter-
personal relationships and the subscales of stress tolerance and self-
actualization. These data were slightly skewed by some contradictory findings
but could still help to inform future investigations.
Discussion
This study into the emotional intelligence of teachers and its relationship to
student achievement is a new one, unique within the literature. No previously
published studies have attempted to understand this concept. The hypothesis
and proposed framework, connecting teacher emotional intelligence to student
74
achievement (Appendix B), is based on former studies, primarily in the business
sector and teacher-student relationship/ motivation domains.
School district personnel and building principals work tirelessly to find,
retain and professionally develop teachers who achieve results to meet the
demands of high stakes accountability. Othman, et. al. (2008) contend that
“employees with the abilities to perceive, understand, and regulate emotion in
self and others and the ability to use emotion to facilitate thought and actions
would be able to achieve high performance in their job” (p. 34). Of importance to
education is the understanding of the teacher as a worker, one hopefully capable
of high performance as measured by the achievement of his or her students.
Challenging classrooms, particularly ones with students of low socio-
economic or minority backgrounds, present additional instructional concerns,
requiring teachers to utilize a specific skillset to motivate and manage learners.
McNulty and Quaglia (2007) note that relationships between teachers and
students matter, particularly in those schools servicing high risk populations.
Helm (2007) mentions a study by Harme and Pianta who found that students with
significant behavior problems are less likely to have problems if their teachers
are sensitive to their needs and provide frequent, consistent, and positive
feedback. Ang (2005) supports this, adding that positive teacher-student
relationships that are free of conflict will be predictive of student achievement.
These researchers make a general case that relationships and a teacher's affect
can influence the performance of students within their classrooms.

75
In an effort to link relationships and student achievement to emotional
intelligence, one must understand the EI construct. Bar-On (2007) states that
emotionally intelligent people are better able to manage personal, social and
environmental change by coping with the immediate situation and solving
problems of an interpersonal nature. This is supported by a teacher self-efficacy
study by Fabio and Palazzeschi (2008) who found that a link existed between
teachers with higher emotional intelligence and teacher self-efficacy in the ability
to manage their classroom, and motivate students.
Study Question. The goal of this pilot study was to explore the following
question: What relationship exists between the measured emotional intelligence
of sixth grade math teachers and the achievement of their students? The focus
was to explore emotional intelligence through the five composite scales and 15
subscales demonstrated by individual sixth grade math teachers and identify
relationships or associations between their EQ and their students’ achievement.
The mean scale score gains for each teachers’ students were used to
measure student performance. Likewise, the web-based results of the Bar-On
Emotional Quotient Inventory provided the emotional intelligence scale scores.
The total EQ, five composite scale scores and 15 subdomain scores were
measured for each teacher. This study utilized all eight participating teachers’
scores for comparison and the math gain scores of their corresponding students.
The exploration into possible relationships yielded only a few meager
considerations worthy of mention. When exploring the total EQ, teachers H and E
achieved two of the three highest score and the greatest math achievement

76
gains. These two teachers were both veteran female teachers, near or exceeding
twenty years of experience. Bar-On states that emotional intelligence continues
to increase well into an individual's forth decade of life. Both of these teachers
had achieved a master's degree, were certified for both elementary and middle
school math and were over 50 years of age. Any of these other factors may play
as large a part or more in their students' high math achievement.
Teacher G, however, achieved the second highest total EQ and the lowest
student achievement scores. On its face, this seems confusing. Upon further
exploration, teacher G was the least experienced of the eight, with less than four
years of teaching under her belt. She had not yet earned her master's degree
and rank two status. Additionally, she did only acquired middle school (5-9) math
certification, unlike teachers E and H who also maintained and extra elementary
certification. How that matters is undetermined by this pilot study. Nevertheless,
there are definitely other variables interacting with these data.
A further exploration into the 15 EQ subscales provided additional
information worth pursuing. Teachers H, E and D achieved the highest subscale
scores in self-actualization. This is important to note as their students, likewise,
achieved the three highest mean gains in math. Teachers H and E scored the
highest on the stress tolerance subscale while teaching the two groups of
students who made the highest gains. This review will continue with a discussion
of the possible relationship connections between teaching and the self-
actualization and stress tolerance subdomains for consideration by researchers
for future investigations.

77
Self-actualization. Intrapersonal relationship is a composite scale, which
also contains the self-actualization subscale. Bar-On (2004) describes a person
with a strong intrapersonal score as a person who is in touch with their feelings,
feels good about themselves, who is positive in what they are doing and is strong
and confident in conveying their ideas and beliefs. Like in business, particularly in
sales and marketing, self-confidence and a positive affect may promote success
in classrooms. How many students have languished in a negative, boring
classroom or been instructed by teachers who lacked the emotion or passion to
engage student in healthy conversation or investigation of course content?
Andrew Martin of the University of Western Sydney, Australia, conducted
a study in which he utilized his Student Motivation and Engagement Scale to
measure 10 facets of motivation and engagement amongst a sample of 1019
teachers. Martin (2006) hypothesized confident teachers are more likely to
engage in pedagogy that is positive, proactive and solution-focused. He found
that a strong correlation existed between the adaptive behavioral dimension of
student planning and teachers’ confidence in teaching (p.73). Martin (2006) also
found an additional correlation between student mastery orientation and
teachers’ enjoyment of teaching.
How many students have deviated from the instruction or classroom
management of a substitute or novice teacher due to a lack of confidence or self-
recognition of goal and process? Self-actualization, which falls within this
composite scale, is described by Bar-On (2004) as a subscale whose high
scores are obtained by individuals who are able to realize their potential and who

78
become involved in pursuits that lead to meaningful, rich, and full lives. These
people have a good idea of where they are going and why (p.45).
Stress tolerance. Bar-On (2004) describes people scoring high in stress
management as those who are able to withstand stress without falling apart or
losing control. They are generally calm, rarely impulsive and work well under
pressure. He says they can often handle tasks that are stressful or anxiety
provoking.
One only needs to Google the term "stressful occupation" or spend ten
minutes in school's teacher's lounge or at a teacher team meeting to recognize
the fact that teaching is difficult and emotionally draining. Principals and parents
want teachers who are able to handle the constant day-to-day pressures of their
responsibilities while maintaining a positive affect and purposefully addressing
student needs to promote achievement. Carmeli and Josman (2006) found that
the regulation of emotions in the workplace was significantly and positively
related to the outcomes of task performance, altruism, and compliance. This
reinforces that teachers demonstrating elevated EQ subscale scores in stress
management may be the best suited to manage the rigors of today's classrooms
and exhibit elevated task performance.
Teachers must frequently deal with stressors related to student
misbehavior, parent attacks and pressure from supervisors to increase student
performance. Salovey and Mayer (2007) claim, "To get these students to their
next academic levels, we must meet them where they are....[and] without these

79
social/emotional skills, the stressors will take over and prevent our students from
living up to their academic potential" (pp. 57-58).
A study conducted by Rozelle, Pettijohn and Parker (2006) found that
salespersons in the highest performance group maintain significantly higher
emotional intelligence scores than those in the lowest performance group (p.
116). Othman, et.al., (2008), contend that "employees with the abilities to
perceive, understand and regulate emotion in self and others and the ability to
use emotion to facilitate thought and action would be able to achieve high
performance in their job" (p. 34). These statements strongly support the
possibility of association between teaching outcomes and the need to manage
stress tolerance, as possible measured by the EQ-i or another emotional
intelligence instrument.
Upon further analysis of the results, two conclusions could be interpreted.
One may consider this an adequate exploratory investigation, finding small
incidents of data that may lead to further investigations of potential relationships
existing between the emotional intelligence of teachers and student achievement.
However, one may alternatively consider that the small population of teachers
participating and often contradictory information difficult to inform any future
directions for study. Due to the lack of statistical significance from this study,
generalization to the scientific field and a further discussion of relevant literature
is unnecessary.

80
Recommendations
This pilot study does provide some worthwhile data, worthy of further
investigation. These data, through the measure of central tendency, indicate that
there is a possibility of relationship between teacher emotional intelligence
scores and student achievement, at least in terms of self-actualization and stress
management. If, in fact, these measures of the emotional intelligence of teachers
could be later correlated with student achievement and can be generalized to
larger populations of teachers and students, across other grades and curricular
disciplines, teacher growth and instructional practices would likely be influenced.
Regardless of a teacher's emotional intelligence subscales scores, Goleman
(1995) contends that emotional intelligence can be learned and improved upon.
His contention therefore implies that teachers, regardless of their level of
emotional intelligence, can learn to be more emotionally intelligent which may,
upon further study, provide insight into student learning.
More study is certainly needed to determine whether or not the emotional
intelligence of teachers correlates to student achievement and is worthy of
generalization. More research is recommended to ascertain how the emotional
intelligence subscales would compare across teachers of differing levels of
experience, personal demographics and training. Future researchers should
recruit a larger sample of participants. A larger sample should generate enough
variance and statistical power to increase the likelihood of producing data
capable of statistical significance. Eight participants from an initial pool of 15 is
not large enough to achieve this goal.

81
In addition to a quantitative research design, a future investigator may
consider a mixed method approach or qualitative approach to better understand
and describe a teacher's emotional intelligence, as defined in the literature, and
apply those understandings to measured student outcomes. An additional
instrument such as the EQ-360 or EQ Interview could provide a researcher with
emotional intelligence information beyond a self-rater format. A qualitative
component may assist in data analysis, helping to provide a descriptive narrative
to the scores produced by the EQ-i or similar instrument.
Conclusion
The study of teacher emotional intelligence is very new and this study
exploring its relationship to student achievement has no predecessor. New
performance criteria in schools currently hold teachers to higher standards than
ever before. Many states, in competition for federal Race to the Top funding
dollars, are building school accountability models incorporating student
achievement/ growth and are tied back to an individual teacher. Teacher
evaluation processes are changing nationwide. Educators have come to a place
in time when research must answer questions about the specific attributes of
successful teachers and how those attributes correlate with student outcomes.
The question posed through this study facilitated an inquiry into emotional
intelligence as a possible indicator, which may be later leveraged by schools and
school districts to affect student achievement.
Additional study is recommended. Emotional intelligence, as a construct,
has the promise to provide meaningful answers about the successful working

82
relationships between teachers and students in a classroom. Interpersonal
relationship management, self-actualization and stress management capacities
may someday prove to be significant measures and indicators of teacher
potential, as could many others. However, additional research is required and
recommended.
Copyright David Allen Rust 2014

Appendix A
Bar-On's Emotional Intelligence Scales and Subscales
E.Q. Scales and Subscales Characteristic Intrapersonal Self-awareness and self-expression:
Self-Regard To accurately perceive, understand and accept oneself. Emotional Self-Awareness To be aware of and understand one’s emotions. Assertiveness To effectively and constructively express one’s feelings Independence To be self-reliant and free of emotional dependency on others. Self-Actualization To strive to achieve personal goals and actualize one’s potential.
Interpersonal Social awareness and interpersonal relationship: Empathy To be aware of and understand how others feel. Social Responsibility To identify with one’s social group and cooperate with others. Interpersonal Relationship To establish mutually satisfying relationships and relate well with others.
Stress Management Emotional management and regulation: Stress Tolerance To effectively and constructively manage emotions. Impulse Control To effectively and constructively control emotions.
Adaptability Change management: Reality-Testing To objectively validate one’s feelings and thinking with external reality. Flexibility To adapt and adjust one’s feelings and thinking to new situations. Problem-Solving To effectively solve problems of a personal and interpersonal nature.
General Mood Self-motivation: Optimism To be positive and look at the brighter side of life. Happiness To feel content with oneself, others and life in general.
83

84
Appendix B
Hypothesized Teacher EI and Student Achievement Logic Chart
E.I. Domains Potential Teacher Effects Potential Student Outcomes
Intrapersonal Relationships
Teachers can better recognize and regulate their own emotional responses.
This teacher will be less likely to personalize the student baggage or misbehavior occurring in the classroom. The confident teacher may be more independent and self-motivated to work in student best interests.
Interpersonal Relationships
Teachers can better relate with parents, colleagues and students to meet student needs.
The teacher is aware of others’ feelings and can better motivate student as a result. Student achievement will increase because of teachers working effective and collaboratively.
Stress Management
Teachers exhibiting low stress can better deal with reform initiatives, high stakes accountability and student misbehavior.
Teachers demonstrating greater stress management skills may be more approachable for students and more reflective of their work, both leading to achievement.
Adaptability
Teachers can modify instruction to better deal with students who have different learning needs. Teachers are more likely to thrive in the complex classroom environment.
The students in these classrooms will benefit from instruction specifically related to the environment, the complex curriculum and individual emotional needs.
General Mood Teachers are generally happier and better able to recognize the importance of their jobs and impact on students. Teachers are more optimistic about student capacity for learning and success.
Students of these teachers may be more confident and likely to take chances. These students may be more motivated and expect to perform better due to increased teacher support and confidence in student ability.

85
Appendix C
IRB documents supporting investigation.

86

87

88

89
Appendix D
School district letter permitting study to be conducted.

90
Appendix E
Letter to sixth grade math teacher requesting their participation in the study.
January 25, 2009
Dear Teacher,
As a sixth grade mathematics teacher in the Cherokee County School District, your assistance is requested for the completion of a survey to measure your emotional intelligence for use in a research project I am conducting for my doctoral dissertation. The purpose of this study is to compare the student achievement results of students instructed by teachers with high Emotional Intelligence to the student achievement results of students instructed by teachers with low Emotional Intelligence. By doing this study, we hope to learn if there is a significant impact on student achievement results in classrooms by teachers with high or low emotional intelligence.
The online survey, called the EQ-i will take approximately 30 minutes to complete 125 items. Both the school district and your principal have approved your participation in this study. The results of your survey will remain confidential. They will not be shared with the school district nor your supervisor and/or principal. Results of your online survey will, however, be made available to you personally upon completion. As with any credible educational research, you have the right to refuse participation in this research.
Please respond to David Rust by phone or by email if you are willing to participate.
Sincerely,

91
Appendix F
EQ-I 125 – Emotional intelligence instrument

92

93

94

95

96

97

98
Appendix G
EQ-I Individual Summary Report for Teachers

99

100

101
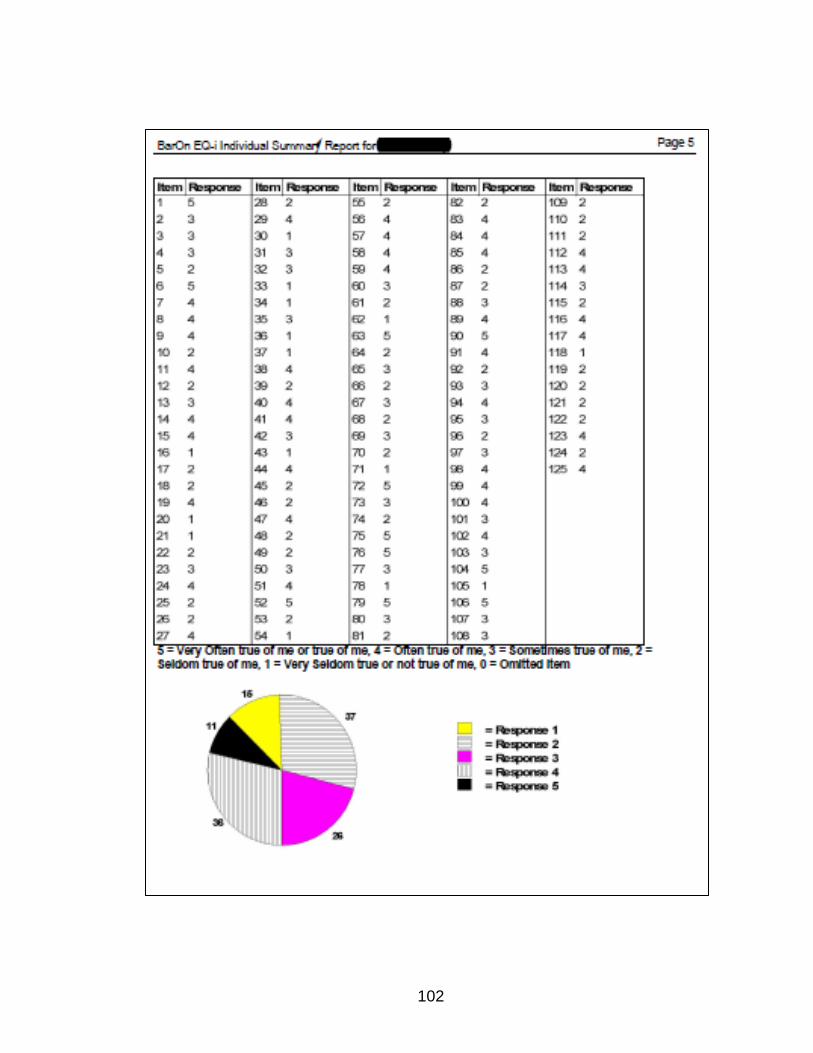
102

103
References
Ang, R. P. (2005). Development and validation of the teacher-student
relationship inventory using exploratory and confirmatory factor analysis.
Journal of Experimental Education, 74(1), 55-73.
Bar-On, R. (1997a). The Emotional quotient inventory (EQ-i): A test of emotional
Intelligence. Toronto, Canada Multi-Health Systems, Inc.
Bar-On, R. (1997b). The Emotional quotient inventory (EQ- i): Technical manual.
Toronto, Canada: Multi-Health Systems, Inc.
Bar-On, R. (Ed.). (2004). The Bar-On emotional quotient inventory (EQ-i):
Rationale, description, and summary of psychometric properties.
Hauppauge, NY: Nova Science Publishers.
Bar-On, R. (2005). Emotional intelligence and subjective wellbeing. Unpublished
manuscript.
Bar-On, R., & Handley, R. (2003). The Bar-On EQ-360. Toronto, Canada: Multi-
Health Systems.
Bar-On, R., Maree, J. G., & Elias, M. J. (Eds.). (2007). Educating people to be
emotionally intelligent. Westport Connecticut: Praeger.
Bar-On, R., & Parker, J. D. A. (Eds.). (2000). Emotional and social intelligence:
Insights from the emotional quotient inventory (EQ-i). San Franscisco:
Jossey-Bass.
Barton, P. E. (2004). Widens the gap persists. Educational leadership, 62(3), 8-
13.

104
Bechara, A., & Bar-On, R. (In Press). The neurological substrates of emotional
and Social intelligence: Evidence from patients with focal brain lesions. In
J. T. Cacioppo & G. G. Bernston (Eds.), Essays in social neuroscience.
Cambridge, MA: MIT Press.
Boyatzis, R. E., Goleman, D., & Group, H. M. (1999). Emotional Competence
Inventory 2.0 Self-Version; Emotional Competence Inventory 2.0 360
Version; Emotional Competence Inventory 2.0 Scoring Instructions (pp.
Downloaded by special permission from
Sala/BOSTON/US/HAYGROUP@HAYGROUP for the purpose of
research).
Brooks, R. (1996). Creating a positive school climate: Strategies for fostering
self-esteem, motivation, and resilience. In J. Cohen (Ed.), Educating
minds and hearts: Social emotional learning and the passage into
adolescence (pp.61-73). New York, NY: Columbia Teachers College
Press.
Brophy, J. E., & Good, T. L. (1974). Teacher-Student Relationships: Causes and
Consequences. New York: Holt, Rinehart and Winston.
Brown, F.W., Bryant, S.E., Reilly, M.D., (2006). Does emotional intelligence – as
measured by the EQI – influence transformational leadership and/or
desirable outcomes? Leadership & Organization Development Journal,
27(5), 330 - 351.

105
Campbell, R. J., Kyriakides, L., Muijs, R. D., & Robinson, W. (2003). Differential
teacher effectiveness: towards a model for research and teacher
appraisal. Oxford Review of Education, 29(3), 362.
Carmeli, A., & Josman, Z. E. (2006). The relationship among emotional
intelligence, task performance, and organizational citizenship behaviors.
Human Performance, 19(4), 403-419.
Coleman, J. S. (1966). Equality of Educational Opportunity. Washington, DC:
United States Department of Education.
Darling-Hammond, L. (1997). Doing What Matters Most: Investing in Quality
Teaching. New York: National Commission on Teaching & America's
Future.
Dawda, D., & Hart, S.D. (2000). Assessing emotional intelligence: Reliability and
validity of the Bar-On Emotional Quotient Inventory (EQ-i) in university
students. Personality and Individual Differences, 28(4), 797-812.
Day, A.L., & Carroll, S.A. (2008). Faking emotional intelligence (EI):Comparing
response distortion on ability and trait-based EI measures. Journal of
Organizational Behavior, 29(6), 761-784.
Dearborn, K. (2002). Studies in emotional intelligence redefine our approach to
leadership development. Public Personnel Management, 31(4), 523-526.
Drew, T. L. (2006). A relationship with emotional intelligence and student teacher
performance. Unpublished Dissertation, University of Nebraska, Lincoln.

106
Dulewicz, V., & Higgs, M. (2003). Leadership at the top: the need for emotional
intelligence in organizations. International Journal of Organizational
Analysis, 11(3), 193-210.
Education Trust. (2005). Stalled in secondary: a look at student achievement
since the no Child left behind act (Publication). Retrieved July 20, 2008,
from Education Trust: http://www2.edtrust.org/NR/rdonlyres/77670E50-
188F-4AA8-8729-555115389E18/0/StalledInSecondary.pdf
Fabio, A. D., & Palazzeschi, L. (2008). Emotional intelligence and self-efficacy in
a sample of Italian high school teachers. School Behavior and Personality,
36(3), 315-326.
Finegan, J. E. (1998). Measuring emotional intelligence: where we are today.
Paper presented at the Annual meeting of the Mid-south educational
research Association.
Gardner, H. (1983). Frames of mind: the theory of multiple intelligences. New
York: Basic Books.
Gardner, H. (1998). A Multiplicity of Intelligences. Scientific American Presents,
18-23.
Geher, G. (Ed.). (2004). Measuring emotional intelligence: common ground and
controversy. Hauppage, New York: Nova Science Publishers.
Goleman, D. (1995). Emotional Intelligence: Why it can matter more than IQ.
New York: Bantam.
Goleman, D. (1998). What makes a leader? Harvard Business Review, 76(6), 93-
102.
107
Grubb III, W. L., McDaniel, M. (2007). The fakability of Bar-On's emotional
quotient short form: Catch me if you can. Human Performance. 20(1), 43-
59.
Hapal, M. (n.d.). Bar-On emotional intelligence-inventory: short (test evaluation).
Retrieved March 29. 2014, from Academia.edu:
https://www.academia.edu/5514911/Bar-On_Emotional_Intelligence-
Inventory_Short_Test_Evaluation
Hargreaves, A. (2000). Mixed emotions: Teachers perceptions of their
interactions with students. Teaching and Teacher Education, 16(8), 811–
826.
Helm, C. (2007). Teacher dispositions affecting self-esteem and student
performance. Clearing House: A Journal of Educational Strategies, Issues
and Ideas, 80(3), 109-110.
Klem, A. M., & Connell. (2004). Relationships matter: Linking teacher support to
student engagement and achievement. Journal of School Health, 74(7),
262-275.
Martin, A. (2006). The relationship between teachers’ perceptions of student
motivation and engagement and teachers’ enjoyment of and confidence in
teaching. Asia-Pacific Journal of Teacher Education, 34(1), 73–93.
Marzano, R. (2007). The art and science of teaching. Alexandria, Va: ASCD.
Matthews, G., Roberts, R. D., & Zeidner, M. (2003). Development of emotional
intelligence: a skeptical-but not dismissive-perspectives. Human
Development, 46, 109-114.

108
Mayer, J., & Salovey, P. (1993). Intelligence of emotional intelligence.
Intelligence, 17, 433-442.
Mayer, J., & Salovey, P. (1995). Emotional intelligence in the construction and
regulation of feelings. Applied and Preventive Psychology, 4, 197-208.
Mayer, J., & Salovey, P. (1997). What is emotional intelligence? In P. Salovey &
D. Sluyter (Eds.), Emotional development and emotional intelligence:
implications for education. New York: Jossey-Bass.
Mayer, J., Salovey, P., & Caruso, D. (1999). MSCEIT item booklet (research
version 1.1). Toronto: MHS publishers.
McMillan, J. H., & Schumacher, S. (2006). Research in education. Evidence-
based inquiry (6th ed.). Boston, Ma: Allyn and Bacon.
McNulty, R. J., & Quaglia, R. J. (2007). Rigor, relevance, and relationships.
School Administrator, 64(8), 6.
Meier, K. J., Mastracci, S. H., & Wilson, K. (2006). Gender and emotional labor in
public organizations: an empirical examination of the link to performance.
Public administration review, 66(6), 899-909.
National Association of Secondary School Principals. (2004). Breaking ranks ii:
Strategies for leading high school reform. Reston, Va.
National Commission on Excellence in Education. (1983). A nation at risk - The
imperative for educational reform. Washington, DC: Government Printing
Office.

109
Nicholls, S., Wegener, M., Bay, D., & Cook, G.L. (2012) Emotional intelligence
tests: Potential impacts on the hiring process for accounting students.
Accounting Education, 21(1), 75-95.
Othman, A. K., Abdullah, H. S., & Ahmad, J. (2008). Emotional intelligence,
emotional labor and work effectiveness in service organizations: a
proposed model. Vision-the Journal of business perspective, 12(1), 31-42.
Perez, J.C., Petrides, K.V., & Furnham, A. (2005). Measuring trait emotional
intelligence. In R. Schulze & R.D. Roberts (Eds.) International handbook
of emotional intelligence. Cambridge, MA: Hogrefe & Huber.
Plake, B., & Impara, J. (Eds.). (1999). Supplement to the 13th mental
measurement yearbook. Lincoln, Nebraska: Buros Institute for mental
measurement.
Morgan, S.E., Reichert, T., & Harrison, T.R. (2002). From numbers to words:
Reporting statistical results for the social sciences. Boston, MA: Allyn &
Bacon.
Rozell, E. J., Pettijohn, C. E., & Parker, R. S. (2006). Emotional intelligence and
dispositional activity as predictors of performance in salespeople. Journal
of Marketing Theory and Practice, 14(2), 113-124.
Sahin-Baltaci, H.,& Demir, Kamile. (2012). Pre-service classroom teachers'
emotional intelligence and anger expression styles. Education Sciences:
Theory and Practice, 12(4), 2422-2428.
Salovey, P., Brackett, M., & Mayer, J. (Eds.). (2007). Emotional intelligence: Key
readings on the mayer and salovey model. New York: Dude.

110
Salovey, P., & Mayer, J. (1990). Emotional intelligence. Imagination, Cognition,
and Personality, 9, 185-211.
Spielberger, C. (Ed.). (2004). Encyclopedia of applied psychology: Academic
press.
Stottlemyer, B. G. (2002). An examination of emotional intelligence: its
relationship to academic achievement and the implications for education.
Texas A&M, Corpus Christi.
Van Rooy, D., & Viswesvaran, C. (2004). Emotional intelligence: a meta-analytic
investigation of predictive validity and nomological net. Journal of
Vocational Behavior, 65, 71-95.
Wasylyshyn, K. M., Gronsky, B., & Haas, J. W. (2006). Tigers, stripes, and
behavior change: survey results of a commissioned coaching program.
Consulting Psychology Journal: Practice and Research, 58(2), 65-81.
Welch, J., & Welch, S. (1998). Hiring is Hard Work: The lessons we (re)learned
recently from two job applicants we almost employed. (July 7, 2008).
Retrieved from
http://www.businessweek.com/magazine/content/08_27/b4091080522869.
htm?chan=magazine+channel_opinion
Whitfield, P. T., & Klug, B. J. (2004). Teachers as Healers: 21st-Century
Possibility? Or Necessity. Multicultural Perspectives, 6(1), 43-50.
Winters, C, (2009). Emotional intelligence and teaching. In J. Helfer (Ed.),
Proceedings of the 2004-2005 Midwest Philosophy of Education Society.
Bloomington, IN: Authorhouse.

111
Worley, D., Titsworth, S., Worley, D. W., & Cornett-DeVito, M. (2007).
Instructional communication confidence: lessons learned from award-
winning teachers. Communication studies, 58(2), 207-222.
Zeidner, M., Matthews, G., & Roberts, R. (2001). Slow down, you move too fast:
Emotional intelligence remains in "elusive" intelligence. Emotion, 1(3),
265-275.
Zeidner, M., Matthews, G., Roberts, R. (2004). Emotional intelligence in the
workplace: A critical review. Applied Psychology: An International Review,
53(3), 371-99.

112
April 17, 2014
Vita
David A. Rust
R. A. Jones Middle School Boone County Schools Florence, KY 41042 Office Phone: 859-282-4610 Office Email: [email protected]
Professional Experience
Principal, Rector A. Jones Middle School, Florence, KY. 2007 – present Principal, Ludlow Middle School, Ludlow, KY. 2003-2007 Assistant Principal, Robert Scott High School, Taylor Mill, KY. 2001-2003 High School Teacher, Robert Scott High School, Taylor Mill, KY. 1995-2001
Education B.A., Secondary Social Studies Education, 1995, Northern Kentucky University,
Highland Heights, KY M.A., Instructional Leadership, 2001, Northern Kentucky University, Highland
Heights, KY Ed.D., Educational Leadership, Expected 2014, University of Kentucky,
Lexington, KY
Honors and Awards Outstanding Administrator of the Year, Kentucky Music Educators Association,
March 2014.
Association Memberships • Association for Supervision and Curriculum Development • National Association of Secondary School Principals • Kentucky Association of School Administrators • Northern Kentucky Association of Secondary School Principals

113
Professional Experience
Northern Kentucky University, Teacher Education Committee, Member, 2008-present.
Northern Kentucky University, Special Education Advisory Committee, Member, 2013-present.
Professional Presentations
Invited Presentation: M.S. - H.S. - College Collaboration to Promote ILP, EPAS and College Readiness. American College Test (ACT), College and Career Readiness Workshop, Louisville, KY, November 17, 2010.
Publications and Papers
Rust, D.A., (2006). How can school leaders affect increased student achievement through the evaluation of teachers? Paper presented at the 2nd International Symposium on Education Reform, University of Jyväskylä, Finland, June 15, 2006.
References
Dr. Lars Björk, Professor, Department of Educational Leadership Studies, University of Kentucky, Lexington, KY, 40506. Tel: 859-257-2450. Email: [email protected]
Ms. Regina Brownfield, Assistant Principal, R.A. Jones Middle School,
Florence, KY, 41042. Tel: 859-282-4610. Email: [email protected]
Ms. Karen Cheser, Chief Academic Officer, Boone County Schools, Florence,
KY 41042. Tel: 859-282-3196. Email: [email protected] Dr. Randy Poe, Superintendent of Schools, Boone County Schools, Florence,
KY, 41042. Tel: 859-282-2375. Email: [email protected]