Embed Size (px)
Citation preview
International Journal of Advanced Research in ISSN: 2278-6236
Management and Social Sciences Impact Factor: 7.065
Vol. 8 | No. 6 | June 2019 www.garph.co.uk IJARMSS | 627
EMOTIONAL INTELLIGENCE AND ITS RELATIONSHIP TO ACADEMIC
PERFORMANCE OF FEMALE STUDENT- LEADERS OF ACCREDITED PRIVATE
HIGHER EDUCATION INSTITUTIONS IN REGION II
ROSEMARIEDEL CASIBANG-CATLI, Ph.D Faculty Member College of Teacher Education
Cagayan State University Andrews Campus, Tuguegarao City, Cagayan, Philippines 3500
ABSTRACT: This descriptive- correlational study determined the emotional intelligence and
academic performance of the women population of student-leaders in ten accredited private
higher education institutions in Region II. Correlational analysis on the student’s emotional
intelligence and academic performance were further explored. Student’s emotional
intelligence was assessed through the Bar-On Emotional Quotient Inventory (EQ-I: S), while
their academic performance was obtained through a documentary analysis of their grades in
all subjects enrolled. Profile data were treated using the simple frequency and percentage,
emotional intelligence scores and academic performance were obtained using the mean.
Emotional intelligence scores were further analyzed to obtain the corresponding composite
scale. Inferences were tested using the T-test for independent samples, Analysis of Variance
(ANOVA) and Chi-square Tests. Findings revealed that majority of the student leaders were
rated highest on “interpersonal” scale. On the other hand, majority of them likewise have
“satisfactory” academic performance. Inferential test revealed that no significant difference
exists on the emotional intelligence of the female students across provinces. Chi-square tests
revealed that academic performance and emotional intelligence are not significantly
correlated. Moreover, female student’s age, year level, birth order, religion, socio-economic
status and ethnic affiliation do not significantly relate with their emotional intelligence.
KEYWORDS: emotional intelligence, academic performance, female, intrapersonal,
interpersonal, stress management, adaptability and general mood.
INTRODUCTION
Emotional intelligence “refers to the ability to identify and manage one’s own emotions, as
well as the emotions of others. It is the capacity to be aware of, control and express one’s
emotions, and to handle interpersonal relationships judiciously and empathetically.
“Emotional Intelligence require that we learn to acknowledge and value feelings in ourselves
and others. It motivates us to pursue unique potential and purpose, and activates our
International Journal of Advanced Research in ISSN: 2278-6236
Management and Social Sciences Impact Factor: 7.065
Vol. 8 | No. 6 | June 2019 www.garph.co.uk IJARMSS | 628
innermost values and aspirations. EI is a construct that involves an individual’s ability to
monitor their own and other’s emotions, to distinguish between the positive and negative
effects of emotions and to use emotional information to regulate thinking and actions
(Jordan & Troth, 2002).
The youth of today are “promising” future leaders, thus school administrators have a great
share in developing the emotional intelligence of the young generation for EI is the key to
personal, social, mental, moral and even leadership and professional success. For leaders to
be able to perform their leadership roles and excel in their academic responsibilities,
emotional intelligence is highly required. Emotional intelligence is claimed to be the sine
qua non of leadership. Women or the female group nowadays play an ever increasing and
influential leadership roles in all endeavors thus it is highly encouraged that female student
leaders in all schools in the region, may it be private or even government institutions, should
be well guided by its principles, vision, mission and Decalogue of objectives to hone the
leadership potentials and intelligences particularly emotional intelligence of the students in
order for them to become emotionally managed, nurturing and responsible citizens who will
be future assets of the society. Research confirms the female students advantage in social
skills accords with another commonly accepted proposition that females are more sensitive
to the emotions of others (Hall & Mast, 2008) and have better recall of emotionally-laden
information regarding others (Bloise and Johnson, 2007).
Academic excellence is fundamental to every student more so among student leaders
because they hold positions in different organizations and portray essential roles in planning
and decision making. Leaders who are better able to regulate their emotions will find it
easier to develop a competency such as Initiative or Achievement drive. Ultimately, it is
these social and emotional competencies that could lead to effective leadership and
academic performance.
Jaeger (2007) in his analysis of the effects of emotional intelligence training on academic
performance, determined that the group receiving emotional intelligence curriculum and
exposure to EI trainings and workshops significantly increased their EI quotient scores and
performed better academically than the four groups of students who did not receive such
International Journal of Advanced Research in ISSN: 2278-6236
Management and Social Sciences Impact Factor: 7.065
Vol. 8 | No. 6 | June 2019 www.garph.co.uk IJARMSS | 629
training. As such Jaeger (2007) concluded that higher levels of emotional intelligence could
be correlated with improved academic performance.
If the emotional intelligence and academic performance of female student leaders are
properly honed and developed, this would unfold the talents, potentials, capacities and
intelligences of youth leaders to become well adjusted, well-rounded and empowered
women who will be very smart, caring, emotionally stable and dedicated leaders willing to
give their best service for other’s welfare, hence this study.
STATEMENT OF THE PROBLEM
The study sought to determine the relationship between the emotional intelligence and
mean academic performance of female student-leaders of private higher education
institutions in Region II.
Specifically, it was geared towards realizing the following:
1. Describe the personal profile of the female student leaders as a whole in terms of age,
course, year-level, birth order, socio-economic status, religion and ethnic affiliation.
2. Determine the emotional intelligence of female student leaders as a whole relative to
the following composite scales: intrapersonal, interpersonal, stress management,
adaptability and general mood.
3. Find out the significant difference in the emotional intelligence of female student
leaders as a whole relative to: intrapersonal, interpersonal, stress management,
adaptability and general mood.
4. Determine the mean academic performance of female student leaders.
5. Find out the significant relationship between the emotional intelligence of female
student leaders and their mean academic performance.
6. Find out the significant relationship in the emotional intelligence of the female student
leaders when grouped according to profile variables.
International Journal of Advanced Research in ISSN: 2278-6236
Management and Social Sciences Impact Factor: 7.065
Vol. 8 | No. 6 | June 2019 www.garph.co.uk IJARMSS | 630
METHODOLOGY
RESEARCH DESIGN
The Descriptive Correlational Method was utilized in this study to describe an existing
relationship between variables and the degree to which two or more qualitative variables
are related by the use of a correlation coefficient.
Furthermore, the descriptive correlational design was used to find out the direction and
extent of relationship between the emotional intelligence and the mean academic of the
female student- leaders under study.
PARTICIPANTS
The respondents of the study were female student-leaders of selected private higher
education institutions in Region 02. Since there were only ten (10) private higher education
institutions involved in the study, the total enumeration technique was used to represent
the total population. A total of 105 samples was used as respondents of the study.
To gather data for the profile variables, the female student leaders answered the Personal
Data Sheet. The questionnaire was attached as part of the main questionnaire distributed by
the researcher to the respondents.
The Bar-On Emotional Quotient Inventory (EQ-I: S) a standardized test by Reuven Bar-On
was used in the study to assess the key aspects of intelligence of student-leaders.
Furthermore, it was designed to measure relatively independent emotional variables such
as intrapersonal, interpersonal, stress management, adaptability and general mood.
DATA GATHERING PROCEDURE
1. List of female student leaders of private higher education institutions in Region II
from the office of the Commission on Higher Education Institutions (to identify the
total number of participants in the study – letter of request to the Regional Director)
2. Endorsement letter from CHED to formally conduct the study in the 10 accredited
private higher education institutions in the region.
3. Letter of permission from the Directors/Coordinators of Student Affairs in the 10
private schools.
International Journal of Advanced Research in ISSN: 2278-6236
Management and Social Sciences Impact Factor: 7.065
Vol. 8 | No. 6 | June 2019 www.garph.co.uk IJARMSS | 631
4. Administration of the Bar-On EQ-I: S or the Bar-On Emotional Quotient Inventory:
Short Version to assess the emotional intelligence of the student leaders.
5. Scoring, profiling, data analysis and interpretation of the data and results through
the help and assistance of a psychometrician.
6. General Weighted Average of the female student-leaders for the Second Semester of
School Year which were secured from the office of the Registrar.
7. Personal and brief interviews with the participants of the study as to how they
emotionally manage the execution of their duties as female student-leaders while
balancing it with their academic performance in school.
DATA ANALYSIS
In as much as the study was concerned with the emotional intelligence of the female
student-leaders, the following statistical treatments were used to analyze the data
gathered.
On the profile of the respondents as to profile variables, the simple frequency and
percentage distribution was used.
To test the difference on the emotional intelligence of female student leaders by province
and as a whole, the F-test was used.
The Chi-square was utilized to determine whether there was a significant relationship
between emotional intelligence and academic performance of the female student leader-
respondents when grouped according to profile variables.
RESULTS AND DISCUSSIONS
Table 1.1
Frequency and Percentage Distribution of the Female Student-Leaders Relative to Age
Age Range Frequency Percentage
16-17 13 12.38
18-20 47 44.76
21-23 32 30.48
24-26 9 8.57
27-29 4 3.81
Total 105 100.00
Mean Age = 20.48
International Journal of Advanced Research in ISSN: 2278-6236
Management and Social Sciences Impact Factor: 7.065
Vol. 8 | No. 6 | June 2019 www.garph.co.uk IJARMSS | 632
Table 1 shows the frequency and percentage distribution of respondents as to age as a
whole in Region II. Of the 105 respondents, the highest frequency of 47 or 44.76 percent
belongs to 18-20 age bracket, followed by 32 or 30.48 percent, belonging to the 21-23 age
bracket, 13 or 16-17 age bracket, 9 or 8.57 percent are in the age range of 24-26 and the
lowest frequency of 4 or 3.81 percent are in the age range of 27-29. The findings imply that
majority of the respondents in Region II are in the age bracket of 18-20 and 21-23
respectively, this is supported with a mean age of 20.48. This further implies that the
respondents are in the legal age thus they are socially and mentally responsible to perform
their leadership roles and duties.
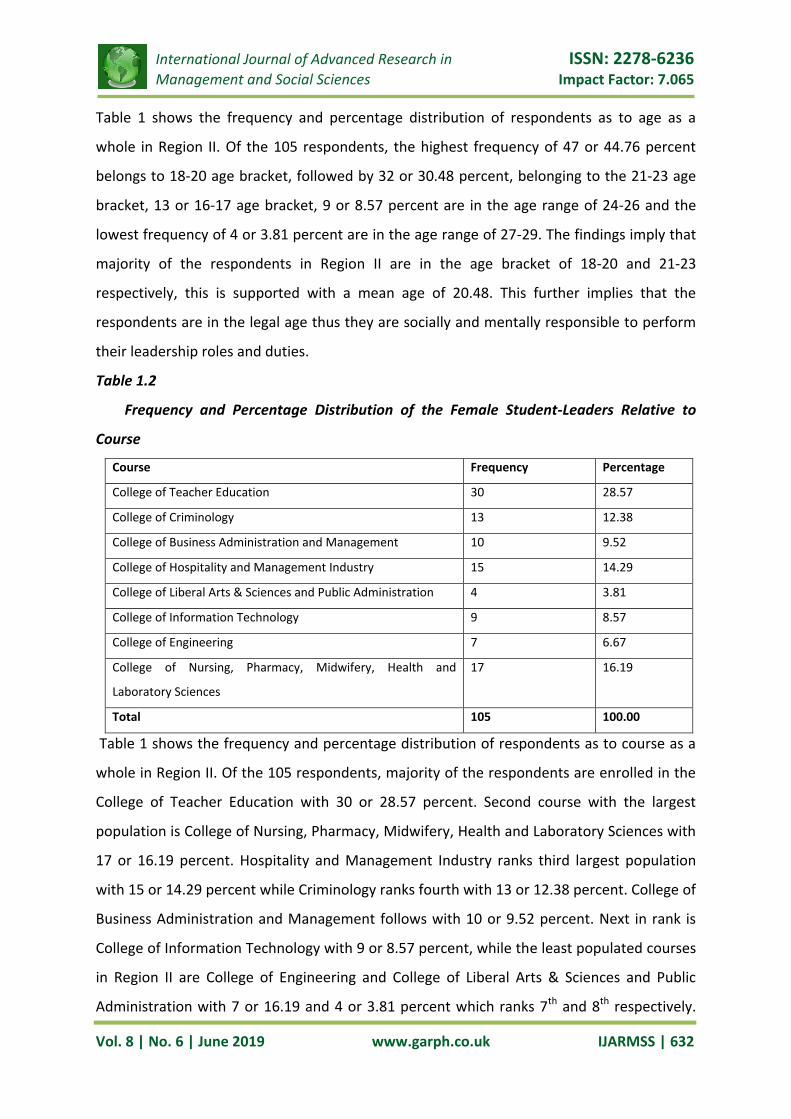
Table 1.2
Frequency and Percentage Distribution of the Female Student-Leaders Relative to
Course
Course Frequency Percentage
College of Teacher Education 30 28.57
College of Criminology 13 12.38
College of Business Administration and Management 10 9.52
College of Hospitality and Management Industry 15 14.29
College of Liberal Arts & Sciences and Public Administration 4 3.81
College of Information Technology 9 8.57
College of Engineering 7 6.67
College of Nursing, Pharmacy, Midwifery, Health and
Laboratory Sciences
17 16.19
Total 105 100.00
Table 1 shows the frequency and percentage distribution of respondents as to course as a
whole in Region II. Of the 105 respondents, majority of the respondents are enrolled in the
College of Teacher Education with 30 or 28.57 percent. Second course with the largest
population is College of Nursing, Pharmacy, Midwifery, Health and Laboratory Sciences with
17 or 16.19 percent. Hospitality and Management Industry ranks third largest population
with 15 or 14.29 percent while Criminology ranks fourth with 13 or 12.38 percent. College of
Business Administration and Management follows with 10 or 9.52 percent. Next in rank is
College of Information Technology with 9 or 8.57 percent, while the least populated courses
in Region II are College of Engineering and College of Liberal Arts & Sciences and Public
Administration with 7 or 16.19 and 4 or 3.81 percent which ranks 7th and 8th respectively.
International Journal of Advanced Research in ISSN: 2278-6236
Management and Social Sciences Impact Factor: 7.065
Vol. 8 | No. 6 | June 2019 www.garph.co.uk IJARMSS | 633
The College of Teacher Education dominated the population of the respondents which
implies that teachers or teachers-to-be are known to be compassionate and emotionally
attached to their students thus fellow students tend to associate leadership of soon-to-be
teachers to be compassionate and emotionally attached leaders, thus Teacher Education
students are more preferred by their fellow students to lead them.
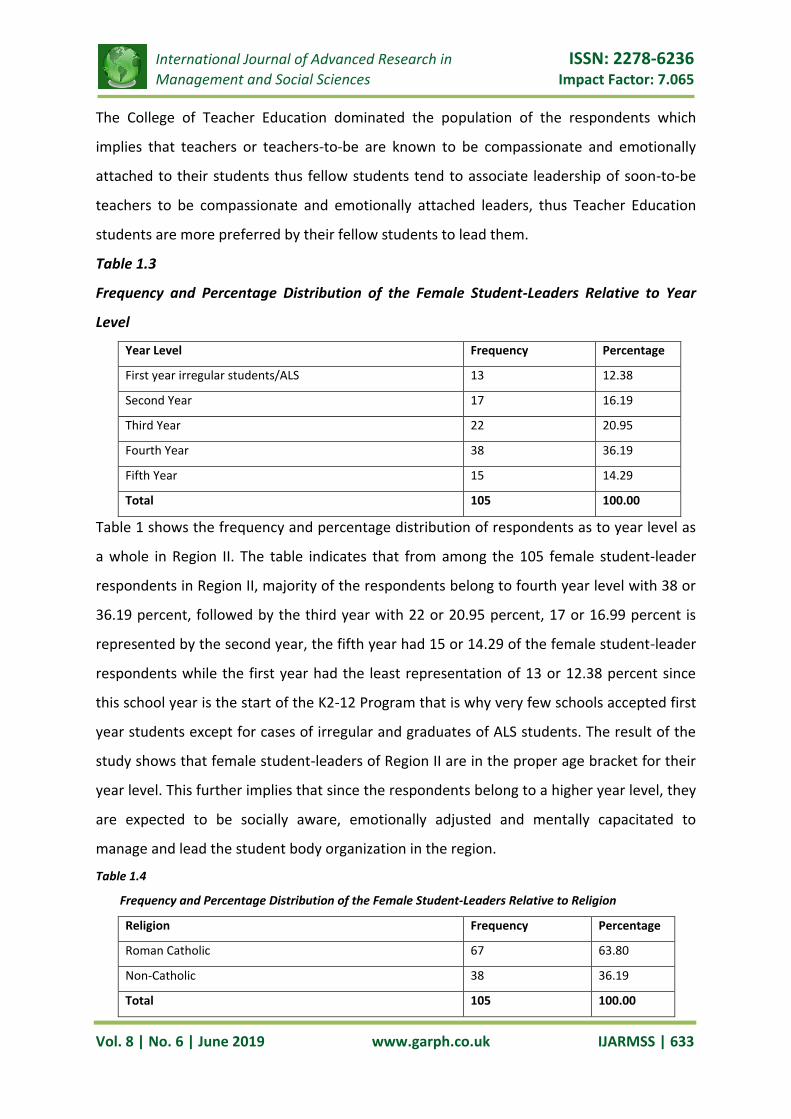
Table 1.3
Frequency and Percentage Distribution of the Female Student-Leaders Relative to Year
Level
Year Level Frequency Percentage
First year irregular students/ALS 13 12.38
Second Year 17 16.19
Third Year 22 20.95
Fourth Year 38 36.19
Fifth Year 15 14.29
Total 105 100.00
Table 1 shows the frequency and percentage distribution of respondents as to year level as
a whole in Region II. The table indicates that from among the 105 female student-leader
respondents in Region II, majority of the respondents belong to fourth year level with 38 or
36.19 percent, followed by the third year with 22 or 20.95 percent, 17 or 16.99 percent is
represented by the second year, the fifth year had 15 or 14.29 of the female student-leader
respondents while the first year had the least representation of 13 or 12.38 percent since
this school year is the start of the K2-12 Program that is why very few schools accepted first
year students except for cases of irregular and graduates of ALS students. The result of the
study shows that female student-leaders of Region II are in the proper age bracket for their
year level. This further implies that since the respondents belong to a higher year level, they
are expected to be socially aware, emotionally adjusted and mentally capacitated to
manage and lead the student body organization in the region.
Table 1.4
Frequency and Percentage Distribution of the Female Student-Leaders Relative to Religion
Religion Frequency Percentage
Roman Catholic 67 63.80
Non-Catholic 38 36.19
Total 105 100.00
International Journal of Advanced Research in ISSN: 2278-6236
Management and Social Sciences Impact Factor: 7.065
Vol. 8 | No. 6 | June 2019 www.garph.co.uk IJARMSS | 634
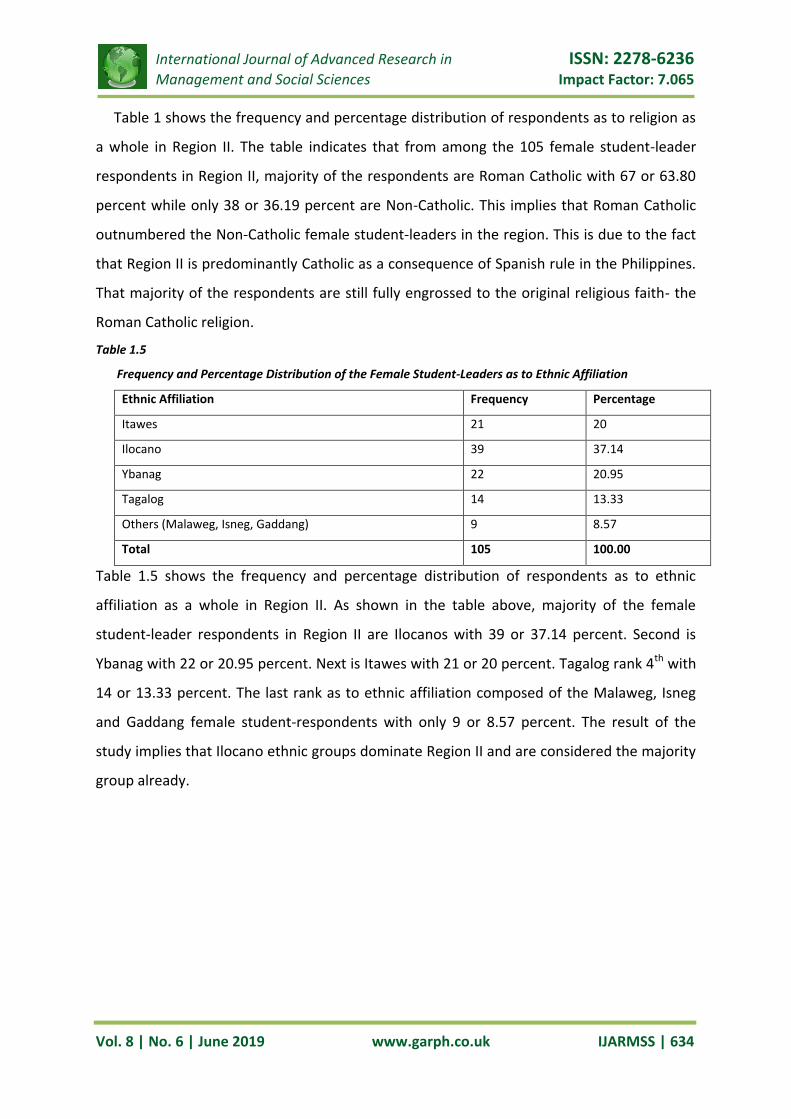
Table 1 shows the frequency and percentage distribution of respondents as to religion as
a whole in Region II. The table indicates that from among the 105 female student-leader
respondents in Region II, majority of the respondents are Roman Catholic with 67 or 63.80
percent while only 38 or 36.19 percent are Non-Catholic. This implies that Roman Catholic
outnumbered the Non-Catholic female student-leaders in the region. This is due to the fact
that Region II is predominantly Catholic as a consequence of Spanish rule in the Philippines.
That majority of the respondents are still fully engrossed to the original religious faith- the
Roman Catholic religion.
Table 1.5
Frequency and Percentage Distribution of the Female Student-Leaders as to Ethnic Affiliation
Ethnic Affiliation Frequency Percentage
Itawes 21 20
Ilocano 39 37.14
Ybanag 22 20.95
Tagalog 14 13.33
Others (Malaweg, Isneg, Gaddang) 9 8.57
Total 105 100.00
Table 1.5 shows the frequency and percentage distribution of respondents as to ethnic
affiliation as a whole in Region II. As shown in the table above, majority of the female
student-leader respondents in Region II are Ilocanos with 39 or 37.14 percent. Second is
Ybanag with 22 or 20.95 percent. Next is Itawes with 21 or 20 percent. Tagalog rank 4th with
14 or 13.33 percent. The last rank as to ethnic affiliation composed of the Malaweg, Isneg
and Gaddang female student-respondents with only 9 or 8.57 percent. The result of the
study implies that Ilocano ethnic groups dominate Region II and are considered the majority
group already.
International Journal of Advanced Research in ISSN: 2278-6236
Management and Social Sciences Impact Factor: 7.065
Vol. 8 | No. 6 | June 2019 www.garph.co.uk IJARMSS | 635
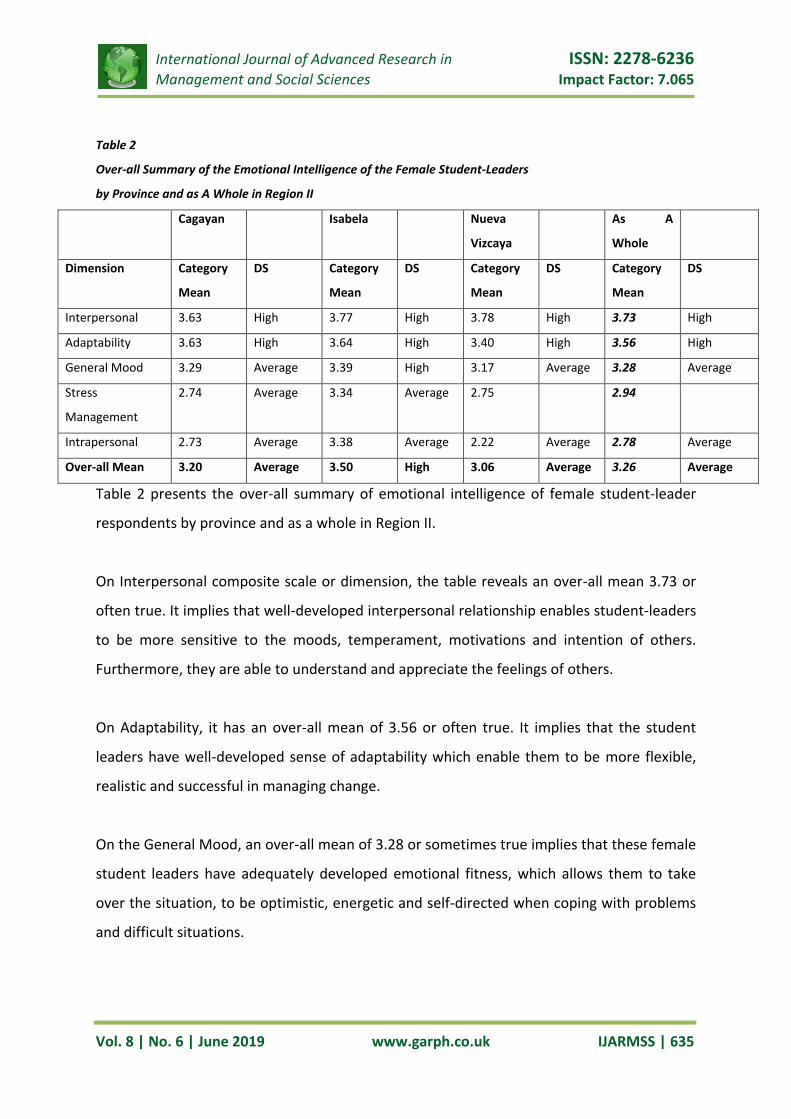
Table 2
Over-all Summary of the Emotional Intelligence of the Female Student-Leaders
by Province and as A Whole in Region II
Cagayan Isabela Nueva
Vizcaya
As A
Whole
Dimension Category
Mean
DS Category
Mean
DS Category
Mean
DS Category
Mean
DS
Interpersonal 3.63 High 3.77 High 3.78 High 3.73 High
Adaptability 3.63 High 3.64 High 3.40 High 3.56 High
General Mood 3.29 Average 3.39 High 3.17 Average 3.28 Average
Stress
Management
2.74 Average 3.34 Average 2.75 2.94
Intrapersonal 2.73 Average 3.38 Average 2.22 Average 2.78 Average
Over-all Mean 3.20 Average 3.50 High 3.06 Average 3.26 Average
Table 2 presents the over-all summary of emotional intelligence of female student-leader
respondents by province and as a whole in Region II.
On Interpersonal composite scale or dimension, the table reveals an over-all mean 3.73 or
often true. It implies that well-developed interpersonal relationship enables student-leaders
to be more sensitive to the moods, temperament, motivations and intention of others.
Furthermore, they are able to understand and appreciate the feelings of others.
On Adaptability, it has an over-all mean of 3.56 or often true. It implies that the student
leaders have well-developed sense of adaptability which enable them to be more flexible,
realistic and successful in managing change.
On the General Mood, an over-all mean of 3.28 or sometimes true implies that these female
student leaders have adequately developed emotional fitness, which allows them to take
over the situation, to be optimistic, energetic and self-directed when coping with problems
and difficult situations.
International Journal of Advanced Research in ISSN: 2278-6236
Management and Social Sciences Impact Factor: 7.065
Vol. 8 | No. 6 | June 2019 www.garph.co.uk IJARMSS | 636
On Stress Management, the female student leaders have an over-all mean of 2.94 or
sometimes true. This implies that they have adequately developed way of managing
stresses thus helping them to be calm and work well under pressure and are rarely
impulsive or lose control.
Finally, on Intrapersonal composite scale or dimension, the table reveals an over-all mean of
2.78 or sometimes true. This implies that these female student leaders have adequately
developed intrapersonal relationship, which enables them to assess more of their own
feelings and emotions and knew so well their wants, desires and even their idiosyncrasies
thus can effectively manage their plans and decisions.
The table reveals and Over-all mean of 3.26 or sometimes true. This implies that a well-
developed emotional and social skill greatly influence student leader’s ability to succeed in
life and directly influence their over-all well-being. These female student-leaders of Region II
have sufficient drive to pursue their goals and actualize their potentials and relate well with
others and are able to efficiently cope with stress.
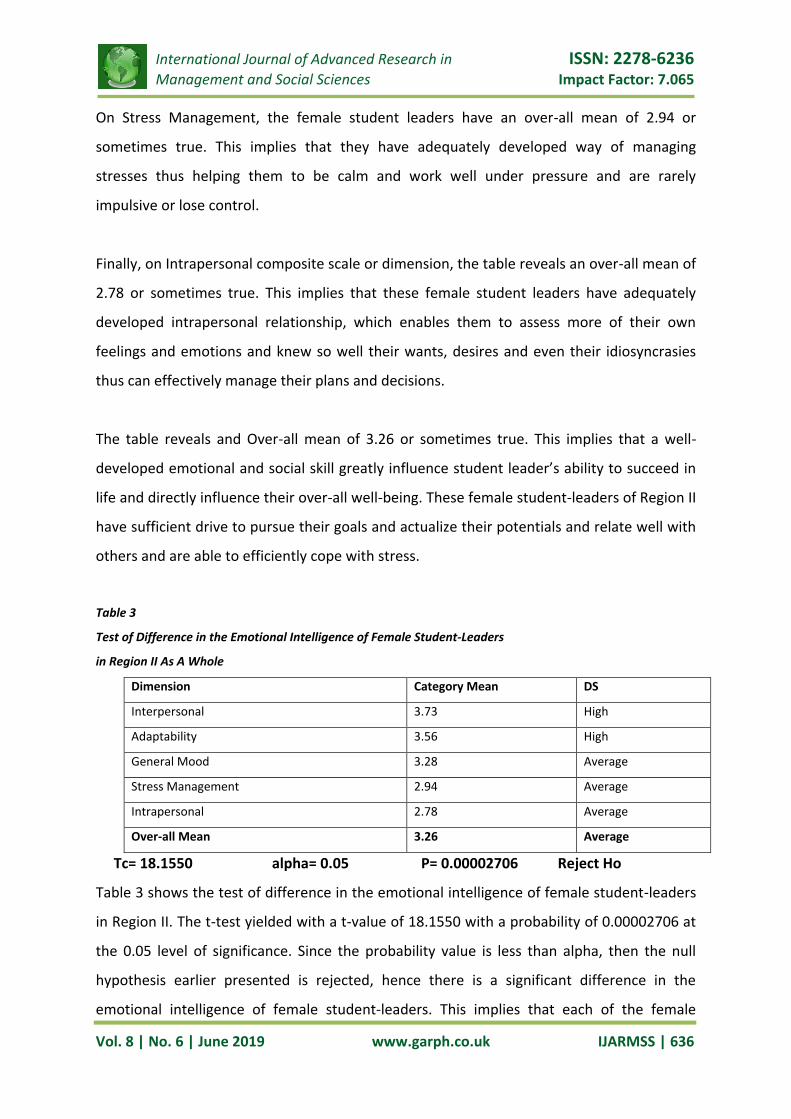
Table 3
Test of Difference in the Emotional Intelligence of Female Student-Leaders
in Region II As A Whole
Dimension Category Mean DS
Interpersonal 3.73 High
Adaptability 3.56 High
General Mood 3.28 Average
Stress Management 2.94 Average
Intrapersonal 2.78 Average
Over-all Mean 3.26 Average
Tc= 18.1550 alpha= 0.05 P= 0.00002706 Reject Ho
Table 3 shows the test of difference in the emotional intelligence of female student-leaders
in Region II. The t-test yielded with a t-value of 18.1550 with a probability of 0.00002706 at
the 0.05 level of significance. Since the probability value is less than alpha, then the null
hypothesis earlier presented is rejected, hence there is a significant difference in the
emotional intelligence of female student-leaders. This implies that each of the female
International Journal of Advanced Research in ISSN: 2278-6236
Management and Social Sciences Impact Factor: 7.065
Vol. 8 | No. 6 | June 2019 www.garph.co.uk IJARMSS | 637
student-leaders in Region II had unique emotional and social capacity. Thus there is no
means of comparing one from the other.
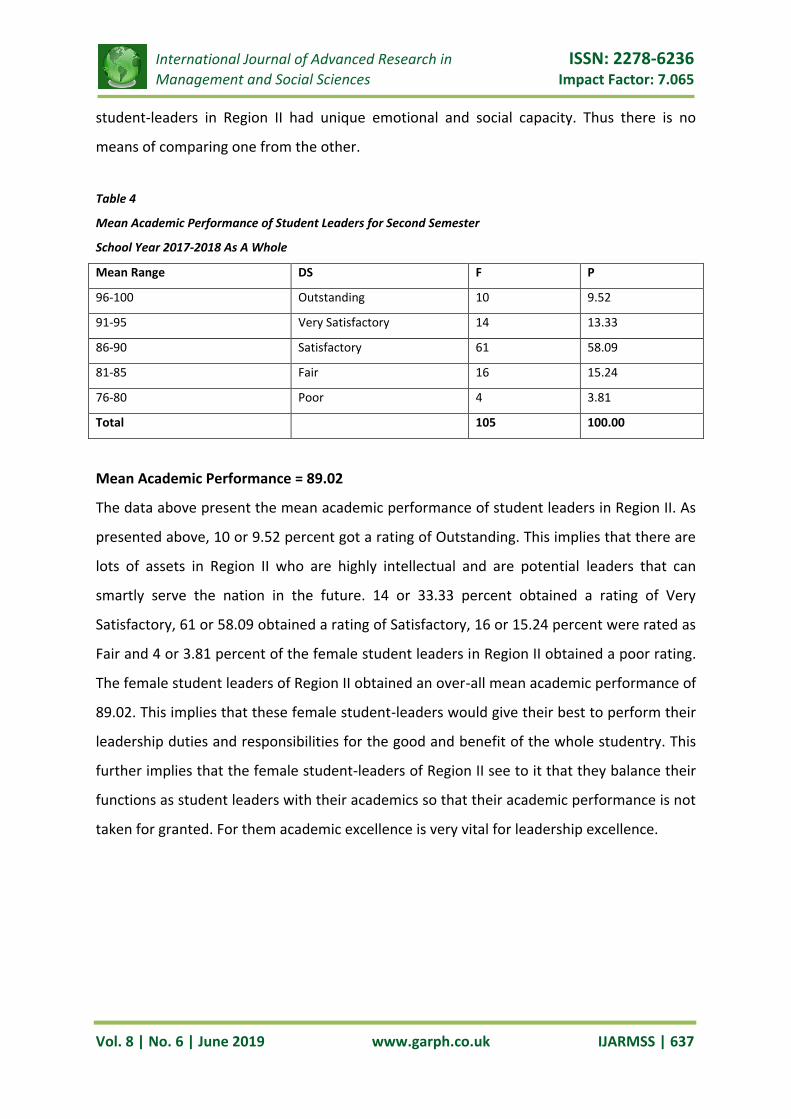
Table 4
Mean Academic Performance of Student Leaders for Second Semester
School Year 2017-2018 As A Whole
Mean Range DS F P
96-100 Outstanding 10 9.52
91-95 Very Satisfactory 14 13.33
86-90 Satisfactory 61 58.09
81-85 Fair 16 15.24
76-80 Poor 4 3.81
Total 105 100.00
Mean Academic Performance = 89.02
The data above present the mean academic performance of student leaders in Region II. As
presented above, 10 or 9.52 percent got a rating of Outstanding. This implies that there are
lots of assets in Region II who are highly intellectual and are potential leaders that can
smartly serve the nation in the future. 14 or 33.33 percent obtained a rating of Very
Satisfactory, 61 or 58.09 obtained a rating of Satisfactory, 16 or 15.24 percent were rated as
Fair and 4 or 3.81 percent of the female student leaders in Region II obtained a poor rating.
The female student leaders of Region II obtained an over-all mean academic performance of
89.02. This implies that these female student-leaders would give their best to perform their
leadership duties and responsibilities for the good and benefit of the whole studentry. This
further implies that the female student-leaders of Region II see to it that they balance their
functions as student leaders with their academics so that their academic performance is not
taken for granted. For them academic excellence is very vital for leadership excellence.
International Journal of Advanced Research in ISSN: 2278-6236
Management and Social Sciences Impact Factor: 7.065
Vol. 8 | No. 6 | June 2019 www.garph.co.uk IJARMSS | 638
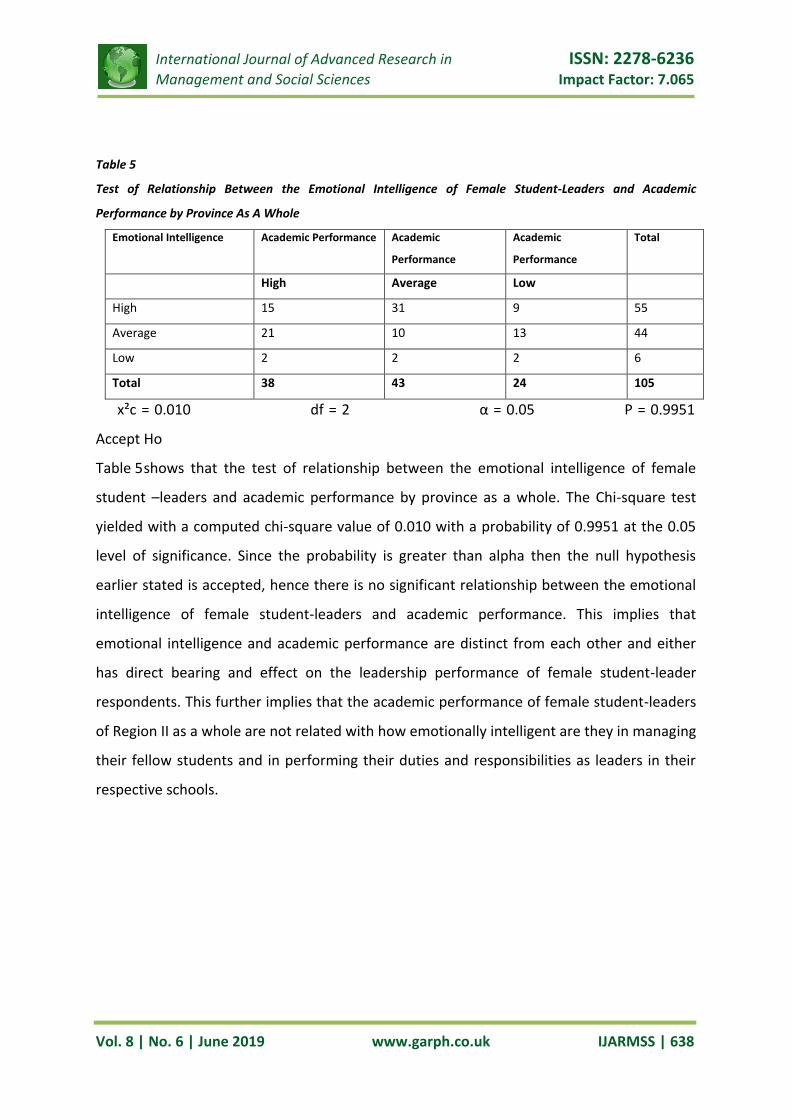
Table 5
Test of Relationship Between the Emotional Intelligence of Female Student-Leaders and Academic
Performance by Province As A Whole
Emotional Intelligence Academic Performance Academic
Performance
Academic
Performance
Total
High Average Low
High 15 31 9 55
Average 21 10 13 44
Low 2 2 2 6
Total 38 43 24 105
x²c = 0.010 df = 2 α = 0.05 P = 0.9951
Accept Ho
Table 5 shows that the test of relationship between the emotional intelligence of female
student –leaders and academic performance by province as a whole. The Chi-square test
yielded with a computed chi-square value of 0.010 with a probability of 0.9951 at the 0.05
level of significance. Since the probability is greater than alpha then the null hypothesis
earlier stated is accepted, hence there is no significant relationship between the emotional
intelligence of female student-leaders and academic performance. This implies that
emotional intelligence and academic performance are distinct from each other and either
has direct bearing and effect on the leadership performance of female student-leader
respondents. This further implies that the academic performance of female student-leaders
of Region II as a whole are not related with how emotionally intelligent are they in managing
their fellow students and in performing their duties and responsibilities as leaders in their
respective schools.
International Journal of Advanced Research in ISSN: 2278-6236
Management and Social Sciences Impact Factor: 7.065
Vol. 8 | No. 6 | June 2019 www.garph.co.uk IJARMSS | 639
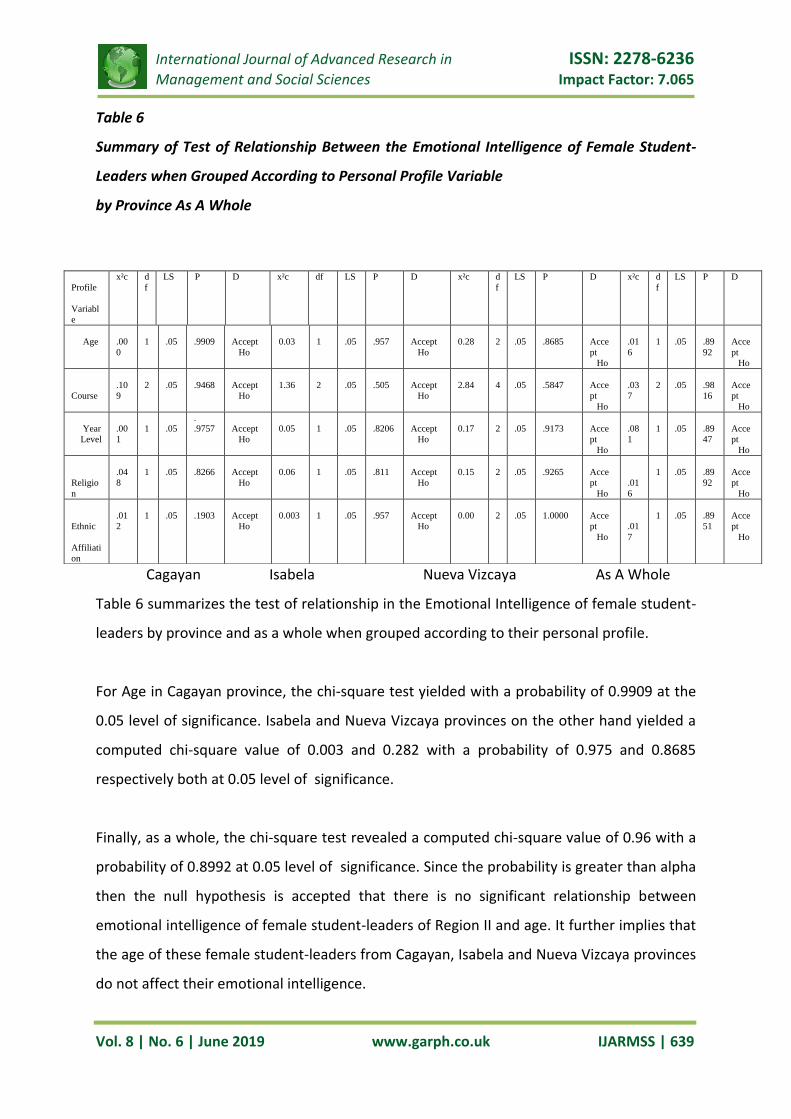
Table 6
Summary of Test of Relationship Between the Emotional Intelligence of Female Student-
Leaders when Grouped According to Personal Profile Variable
by Province As A Whole
Cagayan Isabela Nueva Vizcaya As A Whole
Table 6 summarizes the test of relationship in the Emotional Intelligence of female student-
leaders by province and as a whole when grouped according to their personal profile.
For Age in Cagayan province, the chi-square test yielded with a probability of 0.9909 at the
0.05 level of significance. Isabela and Nueva Vizcaya provinces on the other hand yielded a
computed chi-square value of 0.003 and 0.282 with a probability of 0.975 and 0.8685
respectively both at 0.05 level of significance.
Finally, as a whole, the chi-square test revealed a computed chi-square value of 0.96 with a
probability of 0.8992 at 0.05 level of significance. Since the probability is greater than alpha
then the null hypothesis is accepted that there is no significant relationship between
emotional intelligence of female student-leaders of Region II and age. It further implies that
the age of these female student-leaders from Cagayan, Isabela and Nueva Vizcaya provinces
do not affect their emotional intelligence.
Profile
Variabl
e
x²c d
f
LS P D x²c df LS P D x²c d
f
LS P D x²c d
f
LS P D
Age
.00
0
1
.05
.9909
Accept
Ho
0.03
1
.05
.957
Accept
Ho
0.28
2
.05
.8685
Acce
pt
Ho
.01
6
1
.05
.89
92
Acce
pt
Ho
Course
.10
9
2
.05
.9468
Accept
Ho
1.36
2
.05
.505
Accept
Ho
2.84
4
.05
.5847
Acce
pt
Ho
.03
7
2
.05
.98
16
Acce
pt
Ho
Year
Level
.00
1
1
.05
.
.9757
Accept
Ho
0.05
1
.05
.8206
Accept
Ho
0.17
2
.05
.9173
Acce
pt
Ho
.08
1
1
.05
.89
47
Acce
pt
Ho
Religio
n
.04
8
1
.05
.8266
Accept
Ho
0.06
1
.05
.811
Accept
Ho
0.15
2
.05
.9265
Acce
pt
Ho
.01
6
1
.05
.89
92
Acce
pt
Ho
Ethnic
Affiliati
on
.01
2
1
.05
.1903
Accept
Ho
0.003
1
.05
.957
Accept
Ho
0.00
2
.05
1.0000
Acce
pt
Ho
.01
7
1
.05
.89
51
Acce
pt
Ho
International Journal of Advanced Research in ISSN: 2278-6236
Management and Social Sciences Impact Factor: 7.065
Vol. 8 | No. 6 | June 2019 www.garph.co.uk IJARMSS | 640
For Course in Cagayan province, the chi-square test yielded with a computed chi-square
value of 0.109 with a probability of 0.9468 at the 0.05 level of significance. Isabela and
Nueva Vizcaya provinces on the other hand yielded a computed chi-square value of 1.366
and 2.842 with a probability of 0.5052 and 0.5857 respectively both at 0.05 level of
significance.
Finally, as a whole, the chi-square test revealed a computed chi-square value of 0.037 with a
probability of 0.9816 at 0.05 level of significance. Since the probability is greater than alpha
then the null hypothesis is accepted that there is no significant relationship between
emotional intelligence of female student-leaders of Region II and course. It further implies
that the emotional intelligence of these female student-leaders from Cagayan, Isabela and
Nueva Vizcaya provinces is not affected with whatever course they took up in their
respective schools.
For Year Level in Cagayan province, the chi-square test yielded with a computed chi-square
value of 0.001 with a probability of 0.9757 at the 0.05 level of significance. Isabela and
Nueva Vizcaya provinces on the other hand yielded a computed chi-square value of 0.051
and 0.173 with a probability of 0.8206 and 0.9173 respectively both at 0.05 level of
significance.
Finally, as a whole, the chi-square test revealed a computed chi-square value of 0.96 with a
probability of 0.8947 at 0.05 level of significance. Since the probability is greater than alpha
then the null hypothesis is accepted that there is no significant relationship between
emotional intelligence of female student-leaders of Region II and year level. It further
implies that the year level of these female student-leaders from Cagayan, Isabela and Nueva
Vizcaya provinces as a whole do not have impact or influence on their emotional
intelligence.
For Religion in Cagayan province, the chi-square test yielded with a computed chi-square
value of 0.048 with a probability of 0.8266 at the 0.05 level of significance. Isabela and
International Journal of Advanced Research in ISSN: 2278-6236
Management and Social Sciences Impact Factor: 7.065
Vol. 8 | No. 6 | June 2019 www.garph.co.uk IJARMSS | 641
Nueva Vizcaya provinces on the other hand yielded a computed chi-square value of 0.057
and 0.153 with a probability of 0.8114 and 0.9265 respectively both at 0.05 level of
significance.
Finally, as a whole, the chi-square test revealed a computed chi-square value of 0.016 with a
probability of 0.8992 at 0.05 level of significance. Since the probability is greater than alpha
then the null hypothesis is accepted that there is no significant relationship between
emotional intelligence of female student-leaders of Region II and religion. It further implies
that the whether these female student-leaders from Cagayan, Isabela and Nueva Vizcaya
provinces as a whole are Roman Catholic or Non-Roman Catholic, it has nothing to do with
their emotional intelligence. This further means that whatever religion they embrace, they
perform equally well in emotional and social skill and also in performing their roles as
leaders.
For Ethnic Affiliation in Cagayan province, the chi-square test yielded with a computed chi-
square value of 0.012 with a probability of 0.9130 at the 0.05 level of significance. Isabela
and Nueva Vizcaya provinces on the other hand yielded a computed chi-square value of
0.003 and 0.000 with a probability of 0.9575 and 1.000 respectively both at 0.05 level of
significance.
Finally, as a whole, the chi-square test revealed a computed chi-square value of 0.017 with a
probability of 0.8951 at 0.05 level of significance. Since the probability is greater than alpha
then the null hypothesis is accepted that there is no significant relationship between
emotional intelligence of female student-leaders of Region II and their ethnic affiliation. It
further implies that as to ethnic affiliation, the emotional of the Ybanag female student-
leaders from Cagayan, Isabela and Nueva Vizcaya provinces as a whole do not vary with the
Ilocanos, Itawes, Malaweg, Gaddang, Isneg and Tagalog female student-leaders of Region II
respectively.
Generally, the result implies that the profile variables of the respondents namely age,
course, year level, religion and ethnic affiliation were found to no interaction with
International Journal of Advanced Research in ISSN: 2278-6236
Management and Social Sciences Impact Factor: 7.065
Vol. 8 | No. 6 | June 2019 www.garph.co.uk IJARMSS | 642
emotional intelligence of respondents. This further implies that the female student-leaders
of Region II were found to be similar in social and emotional skills in intrapersonal,
interpersonal, adaptability, stress management and general mood composite scales or
dimensions.
SUMMARY OF FINDINGS
1. Profile of Respondents
i. Majority of the female respondents in Region II are in the age bracket of 18-20 and
21-23 respectively, this is supported with a mean age of 20.48 years.
ii. Majority of the female student leaders in Region 02 are enrolled in the College of
Teacher Education.
iii. Most of the female student leaders in Region II belong to the fourth year level.
iv. Majority of the female student leaders in the region are first-born.
v. The result of the study reveals that majority of the female student leaders in Region
II are above average in terms of socio-economic status.
vi. Majority of the female student leaders in Region II are Roman Catholic.
vii. The female student leaders in the region are dominated by Ilocanos.
2. In Region II, Interpersonal was ranked first by the female student leaders followed by
Adaptability dimension. Third in rank is the general mood. Next is stress management
and last in rank is the intrapersonal dimension.
3. The test of difference in the emotional intelligence of female student leaders across
provinces show that there is no significant difference, between the emotional
intelligence of female student leaders of Cagayan, Isabela, Nueva Vizcaya and Cagayan
Valley Region as a whole relative to the interpersonal, intrapersonal, stress
management, adaptability and general mood composite scales.
4. As a whole, majority of the female student leaders of Region II have “satisfactory”
academic performance as reflected in their over-all mean of 89.02.
International Journal of Advanced Research in ISSN: 2278-6236
Management and Social Sciences Impact Factor: 7.065
Vol. 8 | No. 6 | June 2019 www.garph.co.uk IJARMSS | 643
5. The test of relationship between the emotional intelligence of female student leaders
and academic performance as a whole reveal that there is no significant relationship
between the emotional intelligence of student leaders and academic performance which
implies that emotional intelligence is independent of academic performance.
Generally, the result of the study implies that the profile variables of the respondents as a
whole namely, age, course, year-level, birth order, socio-economic status, religion and
ethnic affiliation were found to no interaction or no significant relationship with emotional
intelligence of the female student-leader respondents
CONCLUSIONS
Based on the findings, the following conclusions are drawn:
1. The female student leaders of the ten (10) accredited private higher education
institutions of Region II are composed of students who are emotionally adjusted,
productive, committed and competent in the performance of their assigned tasks and
duties thus are considered responsible leaders.
2. It can be concluded therefore that there is no significant relationship between emotional
intelligence and academic performance of female student-leaders of Region II. Perhaps, it
can be attributed to the fact that all the female student-leader respondents have similar
rating in their academic performance, which is satisfactory. It can further be concluded
that emotional intelligence of the female student-leaders does not vary with their
academic performance.
3. Furthermore, it can be concluded that when grouped as a whole, there is no significant
difference on the emotional intelligence of Cagayan, Isabela and Nueva Vizcaya female
student leaders.
4. Finally, it can also be concluded that the personal profile of the female student-leaders
does not have direct bearing and effect on their emotional intelligence, that the student
leaders of Region II display the same emotional and social skills regardless of age, course,
year level, birth order, socio-economic status, religion and ethnic affiliation.
International Journal of Advanced Research in ISSN: 2278-6236
Management and Social Sciences Impact Factor: 7.065
Vol. 8 | No. 6 | June 2019 www.garph.co.uk IJARMSS | 644
RECOMMENDATIONS
1. Curriculum makers should conduct an intensive review to incorporate emotional
intelligence awareness into academic programs to help students obtain higher academic
success and potentially lead to their retention and successful completion of their degree
programs.
2. There should be a complete emotional intelligence inventories of the students properly
kept in the guidance office. The guidance program should also periodically conduct
emotional intelligence trainings, seminars and workshops to significantly enhance the
academic performance and contribute to the holistic development not only of their
student-leaders but the whole student population.
3. The female student-leaders of Region II strongly desire to be emotionally intelligent and
to lead effectively. Along these aspirations, in order to materialize such goals, the school
should design Student’s Development Programs to be spearheaded by the Office of
Student Welfare and Development should include in their plan of activities the conduct of
leadership trainings and conferences along emotional intelligence particularly on stress
management, general mood and intrapersonal aspects of the human person. The OSSW
program should also include activities not only those manifested in academic excellence
but also enhance the leadership and emotional capabilities of their student leaders for
their wholesome development.
4. Further study is recommended on the variables or factors, which affect the emotional
intelligence of the female student-leaders of Region II.
5. Teachers should employ varied and innovative teaching styles to empower women by
helping female student leaders discover and tap their intelligences particularly their
emotional intelligence and always play the role not only as an adviser, second parent in
school but as a change agent in the lives of their students.
6. The family play a significant role in their children’s wholesome development. The school
should work in close partnership with the parents in the academic achievement and
International Journal of Advanced Research in ISSN: 2278-6236
Management and Social Sciences Impact Factor: 7.065
Vol. 8 | No. 6 | June 2019 www.garph.co.uk IJARMSS | 645
especially in enhancing the leadership potentials and emotional intelligence of their
children.
7. A study should be conducted on the emotional intelligence and job performance of the
Administration, Heads, Faculty Members and Personnel Staff of the different accredited
private higher education institutions as well as government institutions.
8. A follow-up study shall be conducted in the succeeding years on the emotional
intelligence and academic performance of student leaders not only of the accredited
private higher education institutions in Region II but likewise of the different
Government Colleges and State Universities in Region II for a meaningful comparison of
the emotional intelligence and academic performance of the female student leaders
between private and government institutions in Region II.
REFERENCES
[1]. Bar-On, R.A. (2000). The Bar-On Emotional Quotient Inventory: A Test of Emotional
Intelligence, Multi-health Systems, Inc. Toronto, Canada
[2]. Bar-On, R.A. (2000). The Bar-On Emotional Quotient Inventory: User’s Manual, Toronto:
Multi-health Systems, Inc. Toronto, Canada
[3]. Bloise., S. M. and Johnson, M.K (2007). Memory for emotional and Neutral Information:
Gender and Individual Differences in emotional sensitivity: Memory, 15(2), 192-204.
[4]. Commission on Higher Education Memorandum Order (CMO) No. 9 Series of 2013 also
known as the Revised Manual for Student Services Program.
[5]. Jaeger, A. J., and Eagan, M. K (2007). Exploring the value of emotional intelligence: A
means to improve academic performance. NASPA Journal, 44(3).
International Journal of Advanced Research in ISSN: 2278-6236
Management and Social Sciences Impact Factor: 7.065
Vol. 8 | No. 6 | June 2019 www.garph.co.uk IJARMSS | 646
[6]. Jordan, Peter Jeffrey & Troth Ashlea (2002). Emotional Intelligence at Work: Ethics and
Conflict Resolution: Implications for Human Resource Development. Advances in Developing
Human Resources, 4(1), 62-79.
[7]. Mast, M.S., Hall, J.A., (2008). Are Women Always More Interpersonally Sensitive Than
Men? Impact of. Goals and Content Domain. Personality and Social Psychology Bulletin, 34,
144-145. Goals and Content Domain
[8]. Mayer, J.D. & Salovey, P. (2000). What is Emotional Intelligence? P. Salovey and Sluyter
Edition, Basic Books, New York, U.S.A.
[9]. Miranda, Gregorio S. and Miranda, C. (2002). Management Principles and Practices,
updated Edition, L. and G. Business House.
[10]. Scott, G. (2002). Emotional Intelligence and Academic Success: Examining the
transition from High School to University.
[11]. Singh. D. 2002. Emotional Intelligence at Work: A Professional Guide. New Delhi: Sage
Publications
[12]. Weschler, D. (2004). Non-Intellective Factors in General Intelligence: Emotional
Intelligence, What It is and Why It Matters, C. Cherniss, Inc.
[13]. www.eiconsortium.org(retrieved March 7, 2014)
[14]. www.leadershipcriteria.com