Embed Size (px)
Citation preview
The relationship of emotional intelligence and transformational leadership behavior in Texas AgriLife Extension Service mid‐managers
by
Angela Bohannon Burkham, M.S.
Dissertation In
AGRICULTURAL EDUCATION
Submitted to the Graduate Faculty of Texas Tech University in
Partial Fulfillment of the Requirements for
the Degree of
Doctorate of Education
Approved
David Doerfert, Ph.D, Committee Co‐Chair
Christopher T. Boleman, Ph.D, Committee Co‐Chair
Steven Fraze, Ph.D, Committee Member
Barry Boyd, Ph.D, Committee Member
Fred Hartmeister
Dean of the Graduate School
August 2010

Copyright 2010, Angela Bohannon Burkham
Texas Tech University, Angela Bohannon Burkham, August 2010
ii
Acknowledgements
I would have never been able to complete such a monumental task as a dissertation without the guidance of my committee members, help from friends and support from my family, husband and children.
I would like to express my deepest gratitude to my advisor, Dr. David Doerfert, for his guidance, caring attitude and patience with me throughout the process. He contributed so many hours beyond the work week, at night and on holidays to my research to ensure it was at the level it needed to be. I would also like to thank Dr. Chris Boleman, Dr. Steve Fraze, and Dr. Barry Boyd for serving on my committee and assisting me with the research and writing process. Special thanks to Dr. Matt Baker for guiding me up to the point of oral and written defense.
I would also like to express appreciation to my co‐workers and Doc@Distance Co‐Hort 3 members for your encouragement and motivation. For you being such a supportive role in balancing work, school and family.
I am most grateful for my family and friends. Many of you helped support my most immediate family with “Mom” being a full time student and worker. Thanks to my parents for always believing and supporting me in whatever I wanted to do. Finally, I would like to thank my husband, Bob and children Clay and Abby for always encouraging me through the good and bad times!
Texas Tech University, Angela Bohannon Burkham, August 2010
iii
Table of Contents
Acknowledgements ..............................................................................................................ii
Abstract ................................................................................................................................ v
List of Tables ....................................................................................................................... vi
CHAPTER I ........................................................................................................................... 1
INTRODUCTION ............................................................................................................... 1
Background and Setting ............................................................................................... 1
Statement of the Problem ........................................................................................... 3
Objectives of the Study/Hypotheses ........................................................................... 6
Definition of Terms ...................................................................................................... 7
Limitations of Study ..................................................................................................... 8
Basic Assumptions ....................................................................................................... 9
Significance of the Problem ......................................................................................... 9
CHAPTER II ........................................................................................................................ 11
REVIEW OF LITERATURE ................................................................................................ 11
The Cooperative Extension System ........................................................................... 11
Texas AgriLife Extension Service ................................................................................ 12
Leadership ................................................................................................................. 14
Leadership and Organizational Culture ..................................................................... 17
Emotional Intelligence ............................................................................................... 18
Emotional Intelligence and Leadership ..................................................................... 28
Measuring Emotional Intelligence and Leadership ................................................... 29
Summary .................................................................................................................... 31
CHAPTER III ....................................................................................................................... 32
PROCEDURES ................................................................................................................. 32
Research Design ......................................................................................................... 32
Subject Selection ....................................................................................................... 32
Outcome Measures ................................................................................................... 33
Texas Tech University, Angela Bohannon Burkham, August 2010
iv
Conditions of Testing ................................................................................................. 36
Treatment .................................................................................................................. 37
Data Analysis .............................................................................................................. 39
CHAPTER IV ....................................................................................................................... 42
RESULTS ......................................................................................................................... 42
Descriptive Statistics .................................................................................................. 43
Hypothesis One. ......................................................................................................... 50
Hypothesis Two. ........................................................................................................ 69
CHAPTER V ........................................................................................................................ 72
DISCUSSION ................................................................................................................... 72
Summary of Respondent Demographics ...................................................................... 72
EI Profile ........................................................................................................................ 73
Implications ............................................................................................................... 73
Study Limitations ....................................................................................................... 77
Recommendations for Future Study ......................................................................... 78
Bibliography................................................................................................................... 81
Appendix A: IRB Approval ............................................................................................ 98
Appendix B: General Questionnaire ............................................................................. 99
Appendix C: Promotion Email for Research ................................................................ 101
Appendix D: Invitation Email for Research ................................................................. 102
Appendix E: Most Important Leadership Traits .......................................................... 103
Appendix F: Greatest leadership challenge facing Extension? ................................. 105
Texas Tech University, Angela Bohannon Burkham, August 2010
v
Abstract
The purpose of the study was to examine the relationship between emotional
intelligence and leadership styles among Texas AgriLife Extension Service mid‐managers.
A web based three part instrument was administered to participants. A general
questionnaire about demographics, work history and views of leadership was part one.
The Multifactor Leadership Questionnaire (MLQ form 5x) developed by Avolio and Bass
examined the leader’s self reported leadership style. The MLQ identifies scores for
transformational, transactional and laissez‐faire leadership styles and those were
compared with scores on the BarOn Emotional Quotient Inventory Test (EQ‐i).
An independent samples t test was performed to assess whether the mean EI
subscales scores for the high transformational leadership group differed significantly
from the low transformational leadership group. Six EI constructs were statistically
significant in relation to transformational leadership behavior. The six were: optimism,
happiness, empathy, interpersonal relationships, self‐regard, and stress tolerance. An
independent samples t test was performed to assess whether the mean EI subscales
scores for the high transactional leadership group differed significantly from the low
transactional leadership group. Social responsibility was the one EI construct that was
statistically significant in relation to transactional leadership behavior.
The findings from this study indicate the leaders can develop and strengthen
emotional intelligence and in doing so can more likely exhibit the use of
transformational leadership behaviors. Further study would be needed to demonstrate
the extent of possible application, but it is commendable that if leaders are trained in EI
and those skills are fostered, they will be more likely to utilize transformational
leadership further resulting in organizational effectiveness and follower satisfaction.
Texas Tech University, Angela Bohannon Burkham, August 2010
vi
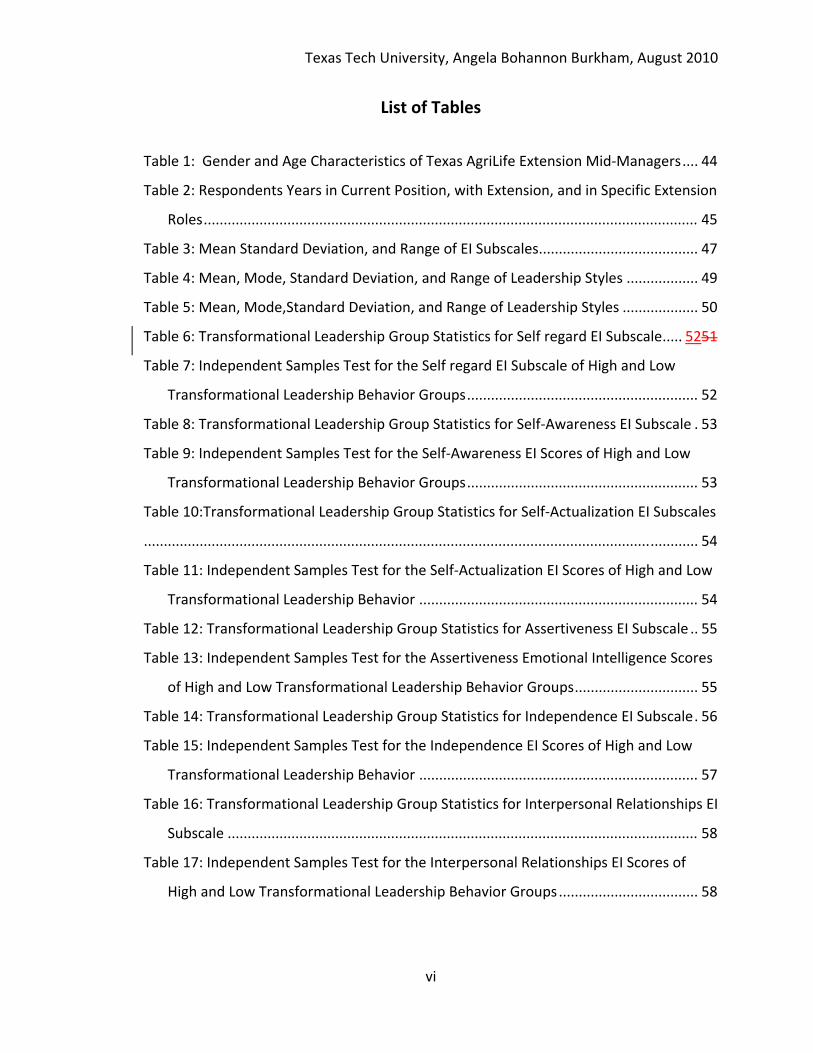
List of Tables
Table 1: Gender and Age Characteristics of Texas AgriLife Extension Mid‐Managers .... 44
Table 2: Respondents Years in Current Position, with Extension, and in Specific Extension
Roles ............................................................................................................................ 45
Table 3: Mean Standard Deviation, and Range of EI Subscales ........................................ 47
Table 4: Mean, Mode, Standard Deviation, and Range of Leadership Styles .................. 49
Table 5: Mean, Mode,Standard Deviation, and Range of Leadership Styles ................... 50
Table 6: Transformational Leadership Group Statistics for Self regard EI Subscale ..... 5251
Table 7: Independent Samples Test for the Self regard EI Subscale of High and Low
Transformational Leadership Behavior Groups .......................................................... 52
Table 8: Transformational Leadership Group Statistics for Self‐Awareness EI Subscale . 53
Table 9: Independent Samples Test for the Self‐Awareness EI Scores of High and Low
Transformational Leadership Behavior Groups .......................................................... 53
Table 10:Transformational Leadership Group Statistics for Self‐Actualization EI Subscales
........................................................................................................................................... 54
Table 11: Independent Samples Test for the Self‐Actualization EI Scores of High and Low
Transformational Leadership Behavior ...................................................................... 54
Table 12: Transformational Leadership Group Statistics for Assertiveness EI Subscale .. 55
Table 13: Independent Samples Test for the Assertiveness Emotional Intelligence Scores
of High and Low Transformational Leadership Behavior Groups ............................... 55
Table 14: Transformational Leadership Group Statistics for Independence EI Subscale . 56
Table 15: Independent Samples Test for the Independence EI Scores of High and Low
Transformational Leadership Behavior ...................................................................... 57
Table 16: Transformational Leadership Group Statistics for Interpersonal Relationships EI
Subscale ...................................................................................................................... 58
Table 17: Independent Samples Test for the Interpersonal Relationships EI Scores of
High and Low Transformational Leadership Behavior Groups ................................... 58
Texas Tech University, Angela Bohannon Burkham, August 2010
vii
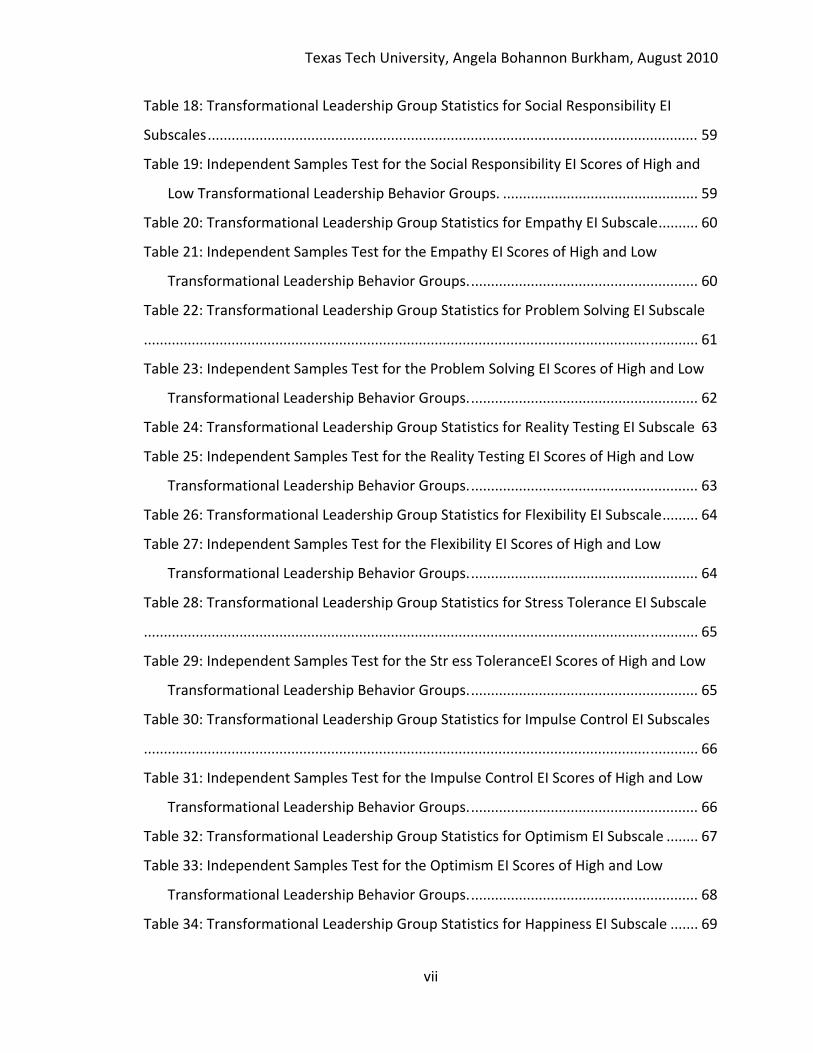
Table 18: Transformational Leadership Group Statistics for Social Responsibility EI
Subscales ........................................................................................................................... 59
Table 19: Independent Samples Test for the Social Responsibility EI Scores of High and
Low Transformational Leadership Behavior Groups. ................................................. 59
Table 20: Transformational Leadership Group Statistics for Empathy EI Subscale .......... 60
Table 21: Independent Samples Test for the Empathy EI Scores of High and Low
Transformational Leadership Behavior Groups. ......................................................... 60
Table 22: Transformational Leadership Group Statistics for Problem Solving EI Subscale
........................................................................................................................................... 61
Table 23: Independent Samples Test for the Problem Solving EI Scores of High and Low
Transformational Leadership Behavior Groups. ......................................................... 62
Table 24: Transformational Leadership Group Statistics for Reality Testing EI Subscale 63
Table 25: Independent Samples Test for the Reality Testing EI Scores of High and Low
Transformational Leadership Behavior Groups. ......................................................... 63
Table 26: Transformational Leadership Group Statistics for Flexibility EI Subscale ......... 64
Table 27: Independent Samples Test for the Flexibility EI Scores of High and Low
Transformational Leadership Behavior Groups. ......................................................... 64
Table 28: Transformational Leadership Group Statistics for Stress Tolerance EI Subscale
........................................................................................................................................... 65
Table 29: Independent Samples Test for the Str ess ToleranceEI Scores of High and Low
Transformational Leadership Behavior Groups. ......................................................... 65
Table 30: Transformational Leadership Group Statistics for Impulse Control EI Subscales
........................................................................................................................................... 66
Table 31: Independent Samples Test for the Impulse Control EI Scores of High and Low
Transformational Leadership Behavior Groups. ......................................................... 66
Table 32: Transformational Leadership Group Statistics for Optimism EI Subscale ........ 67
Table 33: Independent Samples Test for the Optimism EI Scores of High and Low
Transformational Leadership Behavior Groups. ......................................................... 68
Table 34: Transformational Leadership Group Statistics for Happiness EI Subscale ....... 69
Texas Tech University, Angela Bohannon Burkham, August 2010
viii
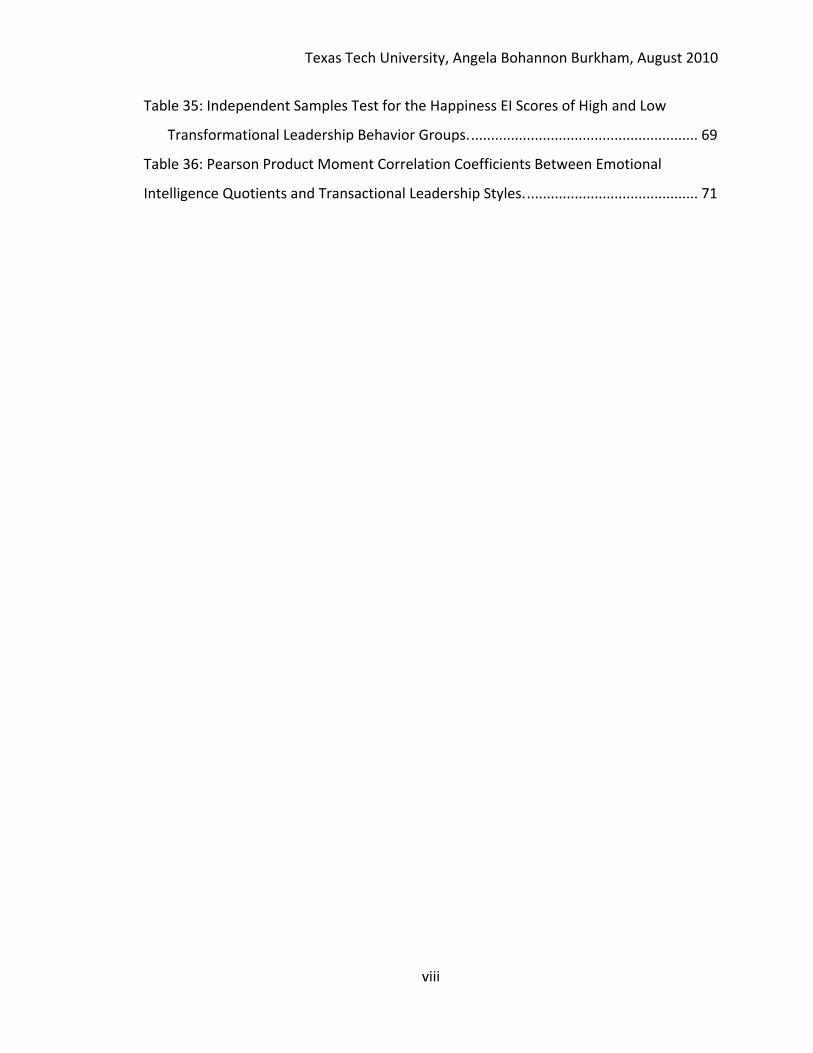
Table 35: Independent Samples Test for the Happiness EI Scores of High and Low
Transformational Leadership Behavior Groups. ......................................................... 69
Table 36: Pearson Product Moment Correlation Coefficients Between Emotional
Intelligence Quotients and Transactional Leadership Styles. ........................................... 71
Texas Tech University, Angela Bohannon Burkham, August 2010
1
Chapter I
Introduction
Background and Setting
Leadership has been a focus of research both in the public and private sector for
many years and is defined by people many different ways. Meyers’ (1978) definition of
leadership is “...the performance of specifically defined leadership behaviors designed
to influence group behavior and task organization” (p. 38). Owen (1987) gives the most
succinct definition of leadership which “is in the relationship between leaders and
followers” (p.67).
Whether the leadership interest focuses on what makes one a great leader or
how a leader interacts with their followers, the dynamics of leadership is of great
interest. Early research in leadership did not always connect the roles of the leader and
the follower (Goleman, 1995). The knowledge base of transactional and
transformational leadership looks at the exchange between the follower and the leader
and then beyond that exchange respectively.
Downton (1973) first distinguished the difference between transformational
leadership and that of transactional leadership. His work was further defined through
the efforts of Burns (1978) and his work with political leaders. This pioneer work began
to connect the work of the leader and the follower that had not been evident in prior
research. Zaleznik (1977) expanded the transformational leadership theory as he
connected the future goals based on the associate or followers needs. The Full Range
Texas Tech University, Angela Bohannon Burkham, August 2010
2
Model of Leadership (Avolio & Bass, 2004) broadened the scope of what was typically
studied. It was identified as “full range” to expand the leadership field paradigm of
leadership styles. Avolio (1999), Bass (1998), and Burns and Avolio (1994) challenged
the leadership field with their new paradigm of transformational and transactional
leadership.
Emotional intelligence (EI) also caught the attention and interest of many over
the last few decades. Emotional intelligence can be the core to life success. It fosters
how one looks at their life, work and the world around them. It is a crucial concept to
understand, it’s difficult to capture on paper and harder than IQ to identify. It is a
powerful concept! If people can understand their emotions and those emotions of
others; they can fundamentally influence lives every day (BarOn, 2006; Goleman, 1998).
Emotional intelligence is a popular term and trend within corporate America and
the educational world. EI “is a type of social intelligence that involves the ability to
monitor one’s own and other’s emotions to discriminate among them and to use the
information to guide one’s own thinking and action” (Mayer & Salovey, 1993, p. 422).
Emotional intelligence is learned. According to Stein and Book (2001), an
individual’s emotional intelligence measure continues to rise with age. The process of
development is over time with understanding and thoughtful effort. With improved
personal performance comes ultimately success in many aspects of life (Lajoie, 2002).
Research also suggests that people with high levels of emotional intelligence
“experience more career success, build stronger personal relationships, lead more
Texas Tech University, Angela Bohannon Burkham, August 2010
3
effectively, and enjoy better health than those with low [emotional intelligence] EQ”
(Cooper, 1997, p.32). In their study on including emotional intelligence in agricultural
education curriculum, Martinez, Beesley, Doerfert, and Akers (2003) recommended
research be conducted on the relationship between leadership and emotional
intelligence.
Statement of the Problem
There are many studies focusing on emotional intelligence and leadership
respectively. The research is undeniable that transformational leadership increases
organizational effectiveness (BarOn, 2006). There is also evidence that emotional
intelligence can be developed and measured and is an important skill both in personal
and professional lives (Goleman, 1998).
Texas AgriLife Extension Service conducted an agency structure reorganization in
2003 which included mid‐management positions. In that restructuring, some
administrative positions where made into program director positions. These new
positions had no or little administrative duties related to hiring and firing of employees
and were more directed towards subject matter expertise and programming. In this
new structure, mid‐management positions related to organizational excellence have an
equal need for individuals possessing emotional intelligence and exhibiting a high level
of transformational leadership ability.
Leaders with higher emotional intelligence are more functional in managing their
moods and emotions. Such leaders are better able to “repair negative moods” which
Texas Tech University, Angela Bohannon Burkham, August 2010
4
may limit flexibility and creativity (Mayer et al, 1991). When a leader expresses
confidence in their following they will be more likely to exhibit positive emotions and be
an ally to the goals and objectives of the leader (Gardner & Avolio, 1998).
Emotional intelligence abilities that are utilized may assist individuals in
employing effective leadership skills, and others have found a significant predictive
relationship between transformational leadership and emotional intelligence (Goleman,
1998; Leban & Zulauf, 2004; Mandell & Pherwani, 2003; Barling et al, 2000; Gardner &
Stough, 2002). Additionally these researchers found that EI and effective leadership are
closely tied (Higgs & Aitken, 2003; Sosik & Megerian, 1999). In all the cases there is a
stronger correlation between emotional intelligence and transformational leadership in
self‐reports versus rater reports.
When leaders possess strong interpersonal skills there is a greater likelihood of
exhibiting transformational behavior. Bass (1990a) established that there is a positive
correlation between leadership and self‐confidence, conviction, self control, ability to
handle conflict, and tolerance for stress. Goleman (1995) identified motivation as a
characteristic possessed by all effective leaders. Bass (1990) confirmed this as a
characteristic defining transformational leadership. In addition others confirmed
empathy, self awareness and self confidence as transformational leadership traits (Bass,
1985; Burns, 1978; Ross & Offerman, 1997). Many have reported that self awareness
leads to greater leader performance (Atwater & Yammarino, 1992; Barling et al 2000;
Texas Tech University, Angela Bohannon Burkham, August 2010
5
Church, 1997; Shipper & Dillard, 1994; Sosik & Megerain, 1999). Goleman says these
qualities are sub components of emotional intelligence.
Emotional intelligence cannot be seen solely as the understanding of feelings,
but must be examined from a functional perspective as in the exhibition of leadership
skills and behaviors. If there is a relationship between emotional intelligence and
transformational leadership, leaders can be assisted in their emotional intelligence
competencies thus expanding their behavior and improving their leadership ability.
Identifying areas of low emotional intelligence competence can result improved training
and support of employees.
Questions continue to be raised when a gap is seen in the stated values of an
organization and the actions of employees, particularly administrators’ behavior.
Cherniss (2000) stated that ninety percent of the optimal competencies for leadership
roles are born of a social or emotional trait. “Two‐thirds of companies linked superior
performance to emotional or social qualities such as self‐confidence, flexibility,
persistence, empathy, and the ability to get along with others” (Cherniss, 2000, p.449).
The majority of characteristics of transformational leadership and emotional intelligence
are consistent with the values of Texas AgriLife Extension Service. If there is a
relationship between the two, there is likelihood to align those qualities with the
organizational values.
This study explored the potential relationship between EI and the leadership
style used by Texas AgriLife Extension Service mid‐managers. If there is a specific
Texas Tech University, Angela Bohannon Burkham, August 2010
6
relationship of EI and transformational leadership qualities, the literature suggests that
mid‐managers could develop the skill to be better leaders and employees.
Objectives of the Study/Hypotheses
The purpose of the study was to examine the potential relationship between EI
and the leadership styles used by Texas AgriLife Extension Service mid‐managers. The
following objectives guided the study:
1. Describe Texas AgriLife Extension Service mid‐managers in terms of their
gender, age, current title, years in current position, total years of
employment in Extension, as an agent, total years of employment as a
specialist and total years of employment as an educator.
2. Describe Texas AgriLife Extension Service mid‐managers in terms of their
emotional intelligence as measured by the BarOn EQ‐i instrument.
3. Describe Texas AgriLife Extension Service mid‐managers in terms of their
leadership styles as measured by the Multifactor Leadership Questionnaire.
4. Describe the statistical relationship between Texas AgriLife Extension mid‐
managers leadership styles and their emotional intelligence scores.
The following research hypothesis generated from the literature review was tested.
H₀ 1. There is no statistically significant difference in EI scores between
AgriLife Extension mid‐managers with high Transformational
Leadership behaviors with those having low Transformational
Leadership behaviors.
Texas Tech University, Angela Bohannon Burkham, August 2010
7
H₀ 2. There is no statistically significant difference in EI scores between
AgriLife Extension mid‐managers with high Transactional Leadership
behaviors with those having low Transactional Leadership behaviors.
Definition of Terms
Emotional Intelligence
Emotional intelligence is an “array of non‐cognitive capabilities, competencies
and skills that influence one’s ability to succeed in coping with environmental demands
and pressures (Bar‐On, 2002, p.2).” The BarOn Emotional Quotient Inventory Test (EQ‐i)
relates to the potential rather than performance in the area of emotional intelligence.
Leadership behaviors
There are many facets to the study of leadership, but one of the most studied
and valued is transformational leadership. The full range model was developed to
broaden the range of leadership styles investigated. The MLQ 5x was developed by
Avolio and Bass (2004) and is an easy to understand model. The model consists of nine
subscales which broadens the continuum of leadership behaviors versus other models.
Transformational leadership is not simply an exchange relationship between the
leader and the follower; it is the motivation of the learner to achieve self‐actualized
higher goals (Burns, 1978). The five factors of transformational leadership include:
idealized influence, attributed, idealized influence behavior, inspirational motivation,
intellectual stimulation, and individualized consideration (Avolio & Bass, 2004).
Texas Tech University, Angela Bohannon Burkham, August 2010
8
Bass (1990a) described this leadership style as outward behaviors exhibited to
others. This form of leadership style may be seen as a contingent reward and or
management by exception being either active or passive in nature (Avolio & Bass, 2004).
Limitations of Study
One of the limitations to this study is the sample used in this study. The mid‐
managers involved in this study were district Extension directors, county Extension
directors, program directors and associate department heads. These individuals were
identified from the directory listed on the Texas AgriLife Extension Service web site that
was deemed to be a reliable data source. As with all published directories, there is a
potential for error from data entry or lack of recent updating of the directory. In
addition, the size of the sample was small which impacted statistical power and the
potential use of other inferential data analysis methods or modeling with this data.
A second limitation of the study was with the data collection processes. The
respondents contribute their data through a self‐ rated instrument versus a subordinate
rated instrument or utilize an assessment center or outside source. Further, the study
utilized an EI mixed‐method model and did not assess the real or perceived leadership
effectiveness of the participants. In addition there is a potential for common method
bias with administering the EI and MLQ instruments simultaneously.
Time was also considered as a limitation in the study. The sample population has
extensive work responsibilities and may have had limited time to respond. The
researcher determined the time to complete the instrument to be 30 to 45 minutes and
Texas Tech University, Angela Bohannon Burkham, August 2010
9
use the Internet to collect data to provide potential participants with a time saving
means to respond that also allow for greater flexibility and convenience. While this may
have limited the time burden on the respondents, it would not have eliminated the
problem.
Basic Assumptions
The researcher based validity and reliability determinations of the instruments
implemented on reports provided by the individual instrument provider. The researcher
has assumed that these validity and reliability values will stand true for this
administration of the instruments.
Emotional intelligence as measured by the BarOn Emotional Quotient Inventory
Test (EQ‐i) is data that is of an ordinal scale in that a higher number represent a higher
level of intelligence. However, the intervals between the numbers on this scale are not
necessarily equal. The individual ordinal statements are then added together to create
the unique EI constructs. In the creation of these constructs, the summated score is
deemed to be interval in nature. In the statistical analysis of this study, EI scores are
considered to be interval in nature, representing an order and equal number of unit.
The last assumption made by the researcher is that all respondents answered
the questions openly and honestly. The basis of the research instrument being a self‐
rater is that they did respond honestly.
Significance of the Problem
Texas Tech University, Angela Bohannon Burkham, August 2010
10
To the researcher’s knowledge, there are currently less than ten studies focusing
on the relationship between EI and transformational leadership while assessing it with
BarOn’s EQ‐i and the MLQ 5x instruments. This study will further research in this area
and contribute to the knowledge base. This study is also of interest regarding the
identification and development of leaders within the researcher’s agency and field. This
research may provide additional dialog and development for future leaders within
Extension.
Texas Tech University, Angela Bohannon Burkham, August 2010
11
Chapter II
Review of Literature
Researchers and scientists have been challenged for many years to define
intelligence. It “is one of the most discussed topics in both scientific and popular
literature” (Averill, 2004, 228). Bar On states, “emotional intelligence addresses the
emotional, personal, social and survival dimensions of intelligence, which are often
more important for daily functioning than the more cognitive aspects of intelligence”
(Bar On, 2002). An overview of this theory is outlined in this chapter. A second track of
research and related literature that was reviewed is leadership. More specifically
transformational, transactional, and laissez‐faire leadership styles will be the major
components discussed. This chapter begins with providing the reader with an
understanding of the context of this study: the Texas AgriLife Extension Service.
The Cooperative Extension System
The Smith‐Lever Act established the Extension Service that completed the triad
of the land‐grant system consisting of the university, experiment station and outreach
arm known as the Cooperative Extension System (Vines & Anderson, 1976). Today the
National Institute of Food and Agriculture is an agency within the U.S Department of
Agriculture. Over the last century, the Cooperative Extension System has adapted to
changing times and continues to address a wide range of issues both in rural and urban
areas (Vines & Anderson).
Texas Tech University, Angela Bohannon Burkham, August 2010
12
Texas AgriLife Extension Service
As part of USDA’s Cooperative Extension Service, the Texas AgriLIfe Extension
Service has a mission to improve the lives of Texans with quality, relevant outreach and
continuing education programs and services. It is a state and federal supported agency
of the Texas A&M University System. Texas AgriLife Extension Service mission is to
serve Texans through community‐based education. This is achieved through
programming in 4‐H and youth development, agriculture and natural resources,
community economic development and family and consumer sciences through the goals
of (Texas AgriLife Extension Service Strategic Plan):
Ensure a sustainable, profitable, and competitive food and fiber systems in Texas
Enhance natural resource conservation and management
Build local capacity for economic development in Texas communities
Improve the health, nutrition, safety and economic security of Texas families
Prepare Texas youth to be productive, positive and equipped with life skills for
the future
Expand access to Extension education and knowledge resources.
Studies targeting Extension leadership have been conducted within different
respondent groups (Cobb, 1989; Holder, 1990; Lowery, 1996; Moore & Jones, 2001;
Sykes, 1995; Moore & Rudd, 2006). The majority of these studies have focused on
county‐based faculty. Therefore questions remain as to the preferred leadership styles
of Extension administrators.
Texas Tech University, Angela Bohannon Burkham, August 2010
13
Moore and Rudd (2006) found that senior administrative leaders were
somewhat similar in terms of their self‐identified leadership style. These leaders were
described as being engaged in transactional leadership style behaviors “once in a while”
to “sometimes” and engaged in transformational leadership styles “fairly often” to
“frequently if not always.” These leaders used transformational more often than
transactional which only augments the effects of transactional behaviors.
Woodrum and Safrit (2003) utilizing the MLQ questionnaire with West Virginia
University Extension Agents working 4‐H and Youth Development programs found that
four out of the five transformational leadership constructs were identified to being used
more often. Those constructs include: Idealized Influence – Attributed, Idealized
Influence – Behavior, Inspirational Motivation, and Intellectual Stimulation. The highest
transactional construct was Individual Consideration.
Sinasky and Bruce (2006) investigated leadership styles through a self‐rated
instrument and a supervisor rated instrument. Utilizing the transformational leadership
constructs educators ranked themselves highest in individual consideration and
supervisors ranked them highest in Idealized influence‐attributed. Both educators and
supervisors rated contingent reward as the most used skill in the transactional
leadership construct.
To date leadership studies have been primarily focused on county‐based
Extension faculty with a limited number on Extension administration. Methods have
Texas Tech University, Angela Bohannon Burkham, August 2010
14
included self‐rating and supervisor rated instrumentation. There has been limited
understanding from research on Texas Extension administration leadership.
Leadership
When examining the literature beyond the context of the Extension leadership,
you will find that leadership is one of the most researched and debated areas in
organization research and sciences. Sometimes this area is more of a creation in the
minds of followers than the attributes of the person in the leadership role (Meindle,
1990). Building good relationships with followers and a lack of trust may be seen
through leaders who experience anger frequently (Jones & George, 1998).
Correspondingly a leader who experiences a lot of positive moods may not take notice
of performance shortfalls. A diversity of feelings influences the effectiveness of leaders,
both through emotions and moods (George, 1995; George & Bettenhausen, 1990).
Leaders who exhibit greater empathy show greater degrees of intellectual
stimulation and individual consideration (Barbuto & Burbach, 2006). Further expanding
on those attributes leaders with intellectual stimulation, individual consideration,
inspirational motivation and idealized influence will experience greater employee
performance, effort, satisfaction and organizational effectiveness (Lowe, Kroeck, &
Sivasubramaniam, 1996).
The transformational and transactional leadership models were first introduced
by Burns in 1978. This groundbreaking work initiated extensive research supporting the
distinction between, expressions of leadership, and the impact of the field (Bass, 1999).
Texas Tech University, Angela Bohannon Burkham, August 2010
15
Transformational leadership has been described as being among one of the most
researched leadership theories over the past 20 years (Barbuto & Burbach, 2006).
Despite this popularity, researchers know less about its antecedents and much more
about its outcomes.
Transformational leadership is rooted in Confucian and Socratic philosophy
focusing on virtue and moral character (Bass, 1999). Transformational leadership is not
simply an exchange relationship between the leader and the follower; it is the
motivation of the learner to achieve self‐actualized higher goals (Burns, 1978). Burns
also classified transformational as a higher order of needs and being more closely
associated with the moral fiber of a person. Two decades later researchers have found
that other aspects besides internal motivation relate more so to transformational
leadership unlike what past studies have suggested (Barling et al, 2000; Gibbons, 1986;
Howell & Avolio, 1993; Sosik & Megerian, 1999). “Transformational leadership occurs
when leaders broaden and elevate the interests of employees, while generating
awareness and acceptance of the purposes and mission of the group, they stir their
employees to look beyond their own self‐interest for the good of the group” (Bass,
1990b, p.20)
Transformational leaders have been identified to possess “strong forces of
leadership” (Avolio & Bass, 1988; Conger & Kamungo, 1988). Strong forces are defined
as the ability to motivate others to perform, the leader’s vision enables a shift in outlook
and perspective and often this force is apparent in times of crisis and despair.
Texas Tech University, Angela Bohannon Burkham, August 2010
16
Transformational leadership does not replace transactional leadership it “augments” it
in succeeding the goals of those involved (Waldman & Bars, 1986; Howell & Avolio,
1993; Waldman, Bass, & Yammarino, 1990).
Transactional leadership exhibits a mutual dependency with both being
recognized and rewarded through their contribution. Bass (1990) described this
leadership style as outward behaviors exhibited to others. Transactional leadership
concentrates more on lower order needs such as food, shelter, safety and need for
affiliation. Transactional leadership results in lower levels of performance or non‐
significant change in several large‐scale surveys (Bass & Avolio, 1993a; Avolio & Bass,
1988; Hoover, 1987; Love et al, 1996; Murray, 1988; Onnen, 1987). If a leader relies on
passive management intervening only when tasks or standards are not met, they prove
to be ineffective (Bass, 1985). Equally ineffective are discipline threats attempting to
bring a group up to standard and are often counterproductive in the end.
When transformational leadership is greater than transactional qualities one can
predict higher employee ratings of satisfaction and effectiveness (Hatter & Bass, 1988).
An additional finding from the same researchers was the top performing manager’s
exhibit more transformational leadership styles than “ordinary” managers. In group
settings, certain aspects of transformational leadership can predict higher group
performance (Keller, 1995). It has also been discovered that visioning, communicating
and enacting the vision through subordinates is the result of change implemented by
transformational leadership (Hemphey, 2002). On the flip side when levels of
Texas Tech University, Angela Bohannon Burkham, August 2010
17
transformational leadership are lower there is a greater level of frustration among
employees and lower performance (McCall‐Kennedy & Anderson, 2002)
Reviewing past research on the differences of leadership styles between men
and women, the results are inclusive. One study did find that women are consistently
evaluated in a negative manner in comparison to men when they utilize an autocratic
leadership style (Eagly, Makhiijani, & Klonsky, 1992). Evaluation through the MLQ
instrument has found that age is unrelated to the female leaders rank. In addition they
found that female leaders rank higher in transformational leadership than transactional
leadership than their male counterparts (Eagly, Johannesen‐Schmidt, & Van Engen,
2003; Bass, Avolio, & Atwater, 1996).
Leadership and Organizational Culture
An organizations culture is highly influenced by the leadership of all its workers.
High quality interpersonal relationships are the goal of most organizations. Leaders can
create a positive environment through enthusiasm, excitement and optimism along with
an atmosphere of trust. Organizational leadership positions often deal with a fast past,
hectic work schedule, ever‐changing environments and stress (Kanter, 1983; Minteberg,
1973). It is very important that leaders meet these demands as they deal with conflict
and promote cooperation and trust. Constructive thinking as Estein (1990) refers to it is
essential to solving problems with the least amount of stress.
In creating an organizational vision one must execute creativity, thinking, and
flexibility. A positive mood facilitates this process to a higher level. Some research has
Texas Tech University, Angela Bohannon Burkham, August 2010
18
linked positive moods to creativity (Isen et al, 1987). Furthermore people in positive
moods have been identified as flexible, more integrative, utilizing broader categories
and approaching problems (Isen & Buron, 1991; Isen & Daubman, 1984; Isen et al, 1985;
Murray, 1988).
Cherniss (2000) stated that ninety percent of the optimal competencies for
leadership roles are born of a social or emotional trait. “Two‐thirds of companies linked
superior performance to emotional or social qualities such as self‐confidence, flexibility,
persistence, empathy, and the ability to get along with others” (Cherniss, 2000, p.449).
Up to eighty percent of companies acknowledge using training funds to promote
emotional intelligence. The most essential educational objectives include “greater
emotional self awareness, self management, and empathy as well as building social
skills” (Cherniss, 2000, p. 449).
Emotional Intelligence
What is emotional intelligence? Daniel Goleman defines it as:
… a different way of being smart. It includes knowing what your feelings are and using your feelings to make good decisions in life. It’s being able to manage distressing moods well and control impulses. It’s being motivated and remaining hopeful and optimistic when you have setbacks in working toward goals. It’s empathy, knowing what the people around you are feeling. And it’s social skill – getting along well with other people, managing emotions in relationships, being able to persuade or lead others (Goleman, 1998, p. 10).
Emotional intelligence brings the two worlds of intellect and emotions together.
The popularity of emotional intelligence has increased greatly in recent years and with
that has come debate (Matthews, Zeidner, & Roberts, 2004). Through much of history
Texas Tech University, Angela Bohannon Burkham, August 2010
19
the Western culture has “viewed reason and intellect as opposing forces to supposedly
non‐rational phenomena like passion, intuition, feeling and emotions” (Matthews,
Zeidner, & Roberts, 2004, p. 81).
Feelings are seen as something that inhibits effective decision‐making and
rationality (Albrow, 1992). In reality feelings are a ”central role” in the leadership
process, not an additional factor to consider (Fineman, 1993; Forgas, 1995). In addition
feelings are necessary for making good decisions in neurological studies (Damasio, 1994;
Goleman, 1995).
Moods are “generalized feeling states” that are not tied to circumstances or
events, which might cause a mood (Morris, 1989). In general a low intensity mood will
not interrupt ongoing activities. Positive moods may have an advantageous result such
as more favorable perceptions and evaluations, more likely to remember positive
information, more self assured, tendency to take credit for success and avoid blame,
more helpful to others and increase inductive reasoning (Bower, 1981; Cunningham et
al, 1980; Forgus et al, 1984, 1990; George, 1991; Isen et al, 1976, 1978; Rosenhahl, et al,
1981). Negative moods may foster deductive reasoning, and more critical and
comprehensive evaluation (Salovey et al, 1993; Sinclair & Mark, 1992). George (1995)
found in workgroups if people experience positive moods, there is a positive pro‐social
behavior performed by group members. He also found when negative moods were
experienced there was a direct connection to higher group turnover rates. Complex
Texas Tech University, Angela Bohannon Burkham, August 2010
20
problems call for careful processing and systematic judgment. Sinclair (1988) and
Sinclair and Mark (1992) found that negative moods foster such behavior.
The term “emotional” in emotional intelligence refers to both moods and
emotions. Emotions actually sometimes feed into moods. Emotions are “high intensity
feelings” triggered a specific stimulus, evoke attention and interrupt cognitive
processing or behaviors (Forgas, 1992; Morris, 1989; Simon, 1982). Damasio (1994)
found that intense emotional reaction could interfere with effective decision making
stating that a “reduction in emotion may constitute an equally important source of
irrational behavior” (p. 53).
Ambivalence in emotional expression can deter an individual from developing
positive interpersonal relations. Ambivalence can be expressed by people who want to
express their emotions, agonize over it, and then fail to act (Emmons & Colby, 1995).
Others may express ambivalence by showing their emotion but then regret doing it
(King & Emmons, 1991). Both examples are linked to anxiety, depression, psychiatric
disorders, less social support and lower well‐being (Emmons & Colby, 1995; Kate &
Campbell, 1994; King & Emmons, 1990, 1991).
Intelligence Quotient (IQ) is the most recognized and used predictor of a
person’s success, current research has shown that Emotional Intelligence (EI) is a better
presage to “success” than traditional methods of cognitive intelligence (EQ University,
2004). Emotional intelligence is teachable as proven in research (Goleman, 1998). Pool
(1997) discovered IQ predicts only 20 percent of career success and he inferred that
Texas Tech University, Angela Bohannon Burkham, August 2010
21
while emotional intelligence predicts about 80 percent of a person’s success in life.
Although Goleman (1998) states one cannot make that comparison.
Cognitive ability and use of that ability is not always the predictor of success in
life. Many intelligent (cognitively) people struggle and sometimes fail at life. On the
contrary some less cognitively intelligent people flourish and succeed. Robert Thorndike
(1920) was the first to distinguish among more than one form of intelligence. He
outlined the three areas of intelligence to be abstract, social and mechanical. Social
intelligence was related to interpersonal relationships and one’s ability to understand
and to manage others. Thorndike spent more than twenty years trying to define and
measure this area of intelligence. He personally doubted in the end that a means for
measuring social intelligence was to be found (Zirkel, 2000). David Wechsler focused on
general intelligence which did include a “non‐intellective aspect” (Wechler, 1940). His
work was based on Edgar Doll’s theory to assess social competence through the
Vineland Social Maturity Scale (Doll, 1935). Wechler later wrote (1958) the he was
“convinced that intelligence is most usefully interpreted as an aspect of the total
personality” (p. vii).
Constructivism is a “broad conceptual framework in philosophy and science
based on the study of cognition.” (Bruner, 1960, p. 63). Bruner’s main principles include
readiness focusing on the “experiences and contexts that make the student willing and
able to learn.” The spiral organization targets an instruction approach that “can be
Texas Tech University, Angela Bohannon Burkham, August 2010
22
easily grasped by the student.” The last principle goes beyond the information given for
instruction to “facilitate extrapolation and or fill in the gaps.” (Bruner, 1960, p. 65).
Constructivism is a broad group of theories that offers insight to how people
learn. This concept is based upon learning from previous experiences and knowledge.
The constructivist helps to facilitate learning rather than simply acquiring information
(Carlisle & Jordan, 2005).
Implications of Constructivism for Practice (Carlile et al., 2004, p. 17).
approach material from the learner’s perspective and values;
acknowledge and accommodate student diversity (ability, age, gender,
culture, nationality);
encourage reflection through the use of learning journals etc;
present an overview of the topic including purpose and objectives;
explain the relevance of the topic;
build on what it is already known;
encourage active and discovery and independent learning;
give timely feedback on performance; and
constructively align objectives, strategies and assessment.
Constructivism is interested in the whole mind as a part of the affective domain.
Special emphasis has been given to volition and emotion in learning. In learning volition
is more important than intellect (Barnett, 2004). More emphasis should be put towards
Texas Tech University, Angela Bohannon Burkham, August 2010
23
improving volition and motivation by learners with paying special attention to the value
set forth by the individual.
Gardner (1999a) who speaks from a Constructivist perspective places the
greatest value on a diversity of intelligence versus a single intelligence. His Multiple
Intelligence (MI) theory possesses a number of intelligence rather than one overarching
intelligence approach. According to Gardner, individuals develop a profile from their
potential, experience, practice and motivation. The MI Theory, like learning styles
incorporates a range of teaching strategies and assessment strategies, enabling the
learner to identify and build on their strength.
Goleman (1995) had a great interest in brain and behavior research. He set the
pace for EI in the early nineties with his book Emotional Intelligence. Goleman trained
at Harvard with David McClelland among others. It was McClelland’s early work (1973)
that pinpointed what little traditional cognitive intelligence tests tell what it takes to be
successful in life. Goleman first recognized Salovey and Mayers (1993) five broad
categories. He has since paired it down to four competences: (a) Self‐awareness, (b)
Social awareness, (c) Recognition, and (d) Regulation.
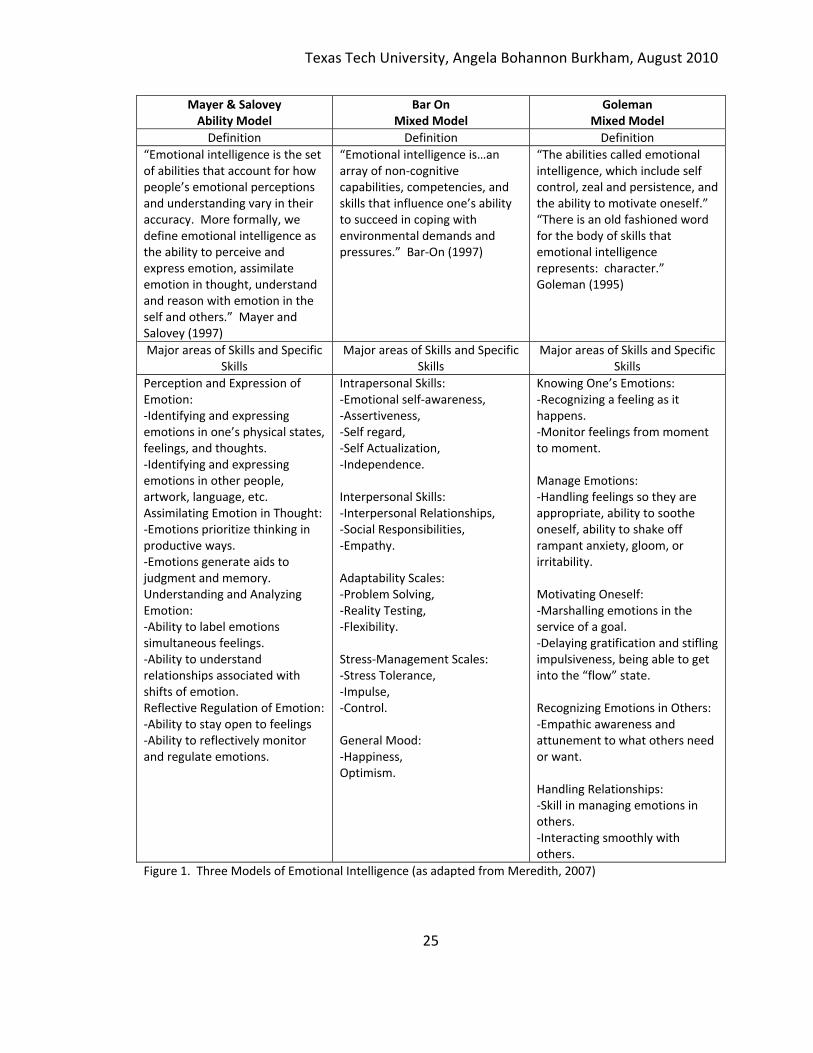
The mixed model theories are an evolution authored first by Daniel Goleman
(1995) and followed by Reuben Bar‐On (1997). Their models differed but “included
elements ranging from motivation, cognition, neurobiology, personality, social
operation, character and disposition” (Meredith, 2007). The mixed model theories
focus on feelings, moods, self‐awareness, character and overall social skills. It is a mix of
Texas Tech University, Angela Bohannon Burkham, August 2010
24
skills and traits (Bar‐On, 1997; Goleman, 1995; Petrides, 2004; Schutte et al, 1998).
According to Mandell and Pherwani (2003), it’s an “ability with social behaviors, traits,
and competencies” (p. 389).
In contrast, the EI ability model targets emotionally connected processes,
beyond personality and looks at how it affects behavior (Salovey, Brackett, & Mayer,
2004). It is more aptitude focused (Mayer & Salovey, 1997). Mandell and Pherwani
(2003) identify it as a “set of abilities that involves perceiving and reasoning abstractly
with information that emerges from feelings” (page 389). These concepts are further
defined in Figure 1.
Texas Tech University, Angela Bohannon Burkham, August 2010
25
Mayer & Salovey Ability Model
Bar OnMixed Model
Goleman Mixed Model
Definition Definition Definition
“Emotional intelligence is the set of abilities that account for how people’s emotional perceptions and understanding vary in their accuracy. More formally, we define emotional intelligence as the ability to perceive and express emotion, assimilate emotion in thought, understand and reason with emotion in the self and others.” Mayer and Salovey (1997)
“Emotional intelligence is…an array of non‐cognitive capabilities, competencies, and skills that influence one’s ability to succeed in coping with environmental demands and pressures.” Bar‐On (1997)
“The abilities called emotional intelligence, which include self control, zeal and persistence, and the ability to motivate oneself.” “There is an old fashioned word for the body of skills that emotional intelligence represents: character.” Goleman (1995)
Major areas of Skills and Specific Skills
Major areas of Skills and Specific Skills
Major areas of Skills and Specific Skills
Perception and Expression of Emotion: ‐Identifying and expressing emotions in one’s physical states, feelings, and thoughts. ‐Identifying and expressing emotions in other people, artwork, language, etc. Assimilating Emotion in Thought: ‐Emotions prioritize thinking in productive ways. ‐Emotions generate aids to judgment and memory. Understanding and Analyzing Emotion: ‐Ability to label emotions simultaneous feelings. ‐Ability to understand relationships associated with shifts of emotion. Reflective Regulation of Emotion: ‐Ability to stay open to feelings ‐Ability to reflectively monitor and regulate emotions.
Intrapersonal Skills:‐Emotional self‐awareness, ‐Assertiveness, ‐Self regard, ‐Self Actualization, ‐Independence. Interpersonal Skills: ‐Interpersonal Relationships, ‐Social Responsibilities, ‐Empathy. Adaptability Scales: ‐Problem Solving, ‐Reality Testing, ‐Flexibility. Stress‐Management Scales: ‐Stress Tolerance, ‐Impulse, ‐Control. General Mood: ‐Happiness, Optimism.
Knowing One’s Emotions:‐Recognizing a feeling as it happens. ‐Monitor feelings from moment to moment. Manage Emotions: ‐Handling feelings so they are appropriate, ability to soothe oneself, ability to shake off rampant anxiety, gloom, or irritability. Motivating Oneself: ‐Marshalling emotions in the service of a goal. ‐Delaying gratification and stifling impulsiveness, being able to get into the “flow” state. Recognizing Emotions in Others: ‐Empathic awareness and attunement to what others need or want. Handling Relationships: ‐Skill in managing emotions in others. ‐Interacting smoothly with others.
Figure 1. Three Models of Emotional Intelligence (as adapted from Meredith, 2007)
Texas Tech University, Angela Bohannon Burkham, August 2010
26
Bar‐On’s model has five categories that are subdivided further. Intrapersonal
skills are broken into self regard, emotional self awareness, assertiveness,
independence, and self‐actualization. Interpersonal skills encompass empathy, social
responsibility, and interpersonal relationship. Adaptability focuses on reality testing,
flexibility, and problem solving. Stress management includes stress tolerance, and
impulse control. Lastly, general mood covers optimism and happiness.
The BarOn EQ‐I Technical Manual (Bar‐On, 2002, p. 15‐18) describes each of the
factorial components as follows:
Intrapersonal Skills Subscales:
Self regard (SR): Self regard is the ability to respect and accept oneself as
basically good.
Emotional Self‐Awareness (ES): Emotional self‐awareness is the ability to
recognize one’s feelings.
Assertiveness (AS): Assertiveness is the ability to express feelings, beliefs, and
thoughts and to defend one’s right in a nondestructive manner.
Independence (IN): Independence is the ability to be self‐directed and self
controlled in one’s thinking and actions and to be free of emotional dependency.
Self‐Actualization (SA): Self‐actualization pertains to the ability to realize one’s
potential capabilities.
Interpersonal Skills Subscales:
Texas Tech University, Angela Bohannon Burkham, August 2010
27
Empathy (EM): Empathy is the ability to be aware of, to understand, and to
appreciate the feelings of others.
Social Responsibility (RE): Social responsibility is the ability to demonstrate
oneself as a cooperative, contributing and constructive member of one’s social group.
Interpersonal Relations (IR): Interpersonal relations skill involves the ability to
establish and maintain mutually satisfying relationships that are characterized by
intimacy and by giving and receiving affection.
Adaptability Subscale:
Reality Testing (RT): Reality testing is the ability to assess the correspondence
between what is experienced and what objectively exists.
Flexibility (FL): Flexibility is the ability to adjust one’s emotions, thoughts and
behavior to changing situations and conditions.
Problem Solving (PS): Problem‐solving aptitude is the ability to identify and
define problems as well as to generate and implement potentially effective solutions.
Stress Management Subscale:
Stress Tolerance (ST): Stress tolerance is the ability to withstand adverse events
and stress situations without ‘falling apart’ by actively and positively coping with stress.
Impulse Control (IC): Impulse control is the ability to resist or delay an impulse,
drive or temptation to act.
General Mood Subscale:
Texas Tech University, Angela Bohannon Burkham, August 2010
28
Optimism (OP): Optimism is the ability to look at the brighter side of life and to
maintain a positive attitude even in the face of adversity.
Happiness (HA): Happiness is the ability to feel satisfied with one’s life, to enjoy
oneself and others, and to have fun.
Emotional Intelligence and Leadership
Leaders with higher emotional intelligence are more functional in managing their
moods and emotions. Such leaders are better able to “repair negative moods” which
may limit flexibility and creativity (Mayer et al, 1991). When a leader expresses
confidence in their following they will be more likely to exhibit positive emotions and be
an ally to the goals and objectives of the leader (Gardner & Avolio, 1998).
Emotional intelligence abilities that are utilized may assist individuals in
employing effective leadership skills, and others have found a significant predictive
relationship between transformational leadership and emotional intelligence (Goleman,
1998; Leban & Zulauf, 2004; Mandell & Pherwani, 2003; Barling et al, 2000; Gardner &
Stough, 2002). Additionally researchers have found that EI and effective leadership are
closely tied (Higgs & Aitken, 2003; Sosik & Megerian, 1999). In all the cases there is a
stronger correlation between emotional intelligence and transformational leadership in
self reports versus rater reports.
When leaders possess strong interpersonal skills there is a greater likelihood of
exhibiting transformational behavior. Bass (1990a) established that there is a positive
correlation between leadership and self‐confidence, conviction, self control, ability to
Texas Tech University, Angela Bohannon Burkham, August 2010
29
handle conflict, and tolerance for stress. Goleman (1995) identified motivation as a
characteristic possessed by all effective leaders. Bass (1990) confirmed this as a
characteristic defining transformational leadership. In addition others confirmed
empathy, self‐awareness and self confidence as transformational leadership traits (Bass,
1985; Burns, 1978; Ross & Offerman, 1997). Many have reported that self‐awareness
leads to greater leader performance (Atwater & Yammarino, 1992; Barling et al, 2000;
Church, 1997; Shipper & Dillard, 1994; Sosik & Megerain, 1999). Goleman says these
qualities are sub components of emotional intelligence.
There is not a significant relationship between gender and emotional intelligence
as a predictor of transformational leadership (Mandell & Pherwani, 2003). Mandell and
Pherwani also found there is no difference in the relationship of emotional intelligence
and transformational leadership styles of males and females. However, they did find a
significant difference in emotional intelligence scores of female versus male managers.
But there was not a significant relationship that was a prediction of transformational
leadership.
Measuring Emotional Intelligence and Leadership
The two primary assessment instruments identified by the researcher are the
BarOn Emotional Quotient Inventory (BarOn EQ‐l) and the Multifactor Leadership
Questionnaire (MLQ). Both instruments are widely used, scientific and reliable (BarOn,
1997; Bass & Avolio, 2004).
Texas Tech University, Angela Bohannon Burkham, August 2010
30
The BarOn EQ‐I, provides a total emotional quotient (EQ) score and five EQ
composite scale scores comprising 15 subscale scores (Bar‐On, 2000). This instrument
was developed by clinical psychologist Reuven Bar On and was the first empirically
constructed test of emotional intelligence (Bar On, 2002). The five scales are
intrapersonal EQ, interpersonal EQ, stress management EQ, adaptability EQ, and general
mood EQ — each with its own set of subscales (Bar‐On, 2000). The instrument is
comprised of 133 items and employs a five‐point response set, ranging from “not true of
me” to “true of me.” Approximately 30 to 40 minutes are needed to complete the
instrument; however, there are no imposed time limits. The assessment renders four
validity scale scores, a total emotional quotient (EQ) score, five composite scale scores,
and 15 EQ subscale scores. The scoring structure to this instrument is very similar to
that of the intelligence quotient assessment (Bar‐On, 2002). Since the development of
the instruments, it has been translated into 22 languages and normative data has been
collected in more than 15 countries. The EQ‐I has previously been shown to
demonstrate sufficient test‐retest reliability (.85 after one month and .75 after four
months; Bar‐On, 1997).
The MLQ (5X Short) is a 45‐question instrument used in field and laboratory
research studies of transformational, transactional and passive/avoidant leadership
styles. It has been used extensively in research and commercial environments. It is a
strong predictor of leadership performance throughout many organizations, levels and
Texas Tech University, Angela Bohannon Burkham, August 2010
31
cultures. Bass and Avolio (2000) have used 14 samples to validate the MLQ with
Cronbach’s alphas ranging from .91 to .94.
The original MLQ model was created to assess transactional and
transformational leadership attributes (Bass, 1985). The original model was a seven‐
factor scale encompassing charisma, inspirational, intellectual stimulation,
individualized consideration, contingent reward, management by exception, and laissez‐
faire. Bycio, Hackett, and Allen (1995) revised the model further by combining charisma
and inspiration for a six‐factor model. Bass and Avolio (1993b, 1994) subsequent
research revised the concept to include a nine or “full range” model. Six parameters
used previously with three being newly created. These adaptations have not negated
the theoretical significance of the original six‐factor model (Avolio & Bass, 2004).
Summary
IQ and technical skills are baseline needs for executive. Without emotional
intelligence well‐trained managers won’t be great leaders (Goleman, 1998). Goleman
goes on to report EI is increasingly more important in the highest levels of an agency
versus the technical skill levels. Even with all of this data there are still some
unanswered questions regarding the potential relationship between emotional
intelligence and the use of transformational leadership. With limited studies being
conducted with Extension faculty and even fewer with mid managers as the target
audience, there are still some remaining questions regarding what kind of leaders are in
these positions.
Texas Tech University, Angela Bohannon Burkham, August 2010
32
Chapter III
Procedures
The study considered the relationship between emotional intelligence and
transformational leadership of mid‐managers of Texas AgriLife Extension Service. This
population experiences a busy daily schedule with extensive responsibilities and travel
requirements. They are an influential group within their own agency and with
collaborative partners. A greater understanding of their skill set related to emotional
intelligence and leadership can have an overall positive impact on the workforce.
Research Design
The design for the study was correlational with the goal of identifying any
relationships between emotional intelligence and transformational leadership
behaviors. The independent variable is the emotional intelligence factors. The
dependent variables are the nine factors of the full range leadership model. Both
variables are assessed with a self‐rating instrument.
Subject Selection
The population for this study was mid‐managers of Texas AgriLife Extension
Service as listed in the state Extension directory on January 15, 2010. Mid‐managers are
defined as individuals who supervise and guide county Extension agents, other county
based personnel and Extension specialist on Extension programs in the areas of 4‐H and
youth development, agriculture and natural resources, community resource and
economic development, and family and consumers sciences.
Texas Tech University, Angela Bohannon Burkham, August 2010
33
Mid‐managers involved in this study include district Extension administrators,
county Extension directors, program directors and associate department heads.
Positions within the mid‐manager ranks are administratively and programmatically
focused. These individuals are located off and on the main site for Texas AgriLife
Extension Service that is headquartered at Texas A&M University in College Station,
Texas. There were 48 individuals identified from the database as being the population
for the study.
Participation in the study was voluntary. Participants who withdrew from the
study had the right to not let any information obtained about them be used. One
respondent emailed and said they declined to participate in the study. No information
had been secured from that individual. The omission rate for this study was six percent.
There were six of the 42 responses that fell into this category.
Outcome Measures
This research project was a correlational survey design. Data was collected
regarding emotional intelligence and preferred leadership style using two commercially
available instruments.
The BarOn EQ‐I’s is a unique instrument as it “combines an eclectic assortment
of existing observations, theories, methodological strategies, research findings, and a
comprehensive, multifactorial nature” (BarOn, 2004, p. 7). A statistical procedure called
item analysis has been used which is based on the opinions of experienced practitioners
Texas Tech University, Angela Bohannon Burkham, August 2010
34
and human resource professionals. Lastly, it is the first commercially available
empirically constructed test of EI.
Some of the advantages of using the BarOn instrument are its supported by 17
years of research, based on a large North American sample of over 4,000 people,
versatile in its implementation, adjusted positive and negative responses based on the
correction factors and has excellent statistical reliability and validity. The assessment
renders four validity scale scores, a total emotional quotient (EQ) score, five composite
scale scores, and 15 EQ subscale scores.
Since the development of the exam, the instrument has been translated into 22
languages and normative data has been collected in more than 15 countries. The EQ‐I
has previously been shown to demonstrate sufficient test‐retest reliability (.85 after one
month and .75 after four months; Bar‐On, 1997). Additional details regarding validity
and reliability are available in the BarOn Emotional Quotient Inventory User’s Manual
(BarOn, 2002). Permission to use the EQ‐I instrument was secured by the researcher on
November 25, 2009 and expires in one year.
Bar‐On’s model has five composites that serve as the dependent variables.
Intrapersonal skills are broken into self regard, emotional self‐awareness, assertiveness,
independence, and self‐actualization. Interpersonal skills encompass empathy, social
responsibility, and interpersonal relationship. Adaptability focuses on reality testing,
flexibility, and problem solving. Stress management includes stress tolerance, and
impulse control. Lastly, general mood covers optimism and happiness.
Texas Tech University, Angela Bohannon Burkham, August 2010
35
The scoring structure to this test is very similar to that of the intelligence
quotient assessment (Bar‐On, 2002). The assessment renders four validity scale scores,
a total emotional quotient (EQ) score, five composite scale scores, and 15 EQ subscale
scores.
The MLQ (5X Short) is a 45‐question instrument used in field and laboratory
research studies of transformational, transactional and passive/avoidant leadership
styles. The instrument is comprised of eleven subsets and the 45 questions use a Likert‐
type scale ranging from “0” (not at all) to “4” (Frequently, if not always).
The three leadership behaviors have been divided into a series of sub‐factors.
The transformational factors include: (a) idealized influence attributed, (b) idealized
influence behavior, (c) inspirational motivation, (d) intellectual stimulation, (e) individual
consideration. Transactional factors include: (a) contingent reward, (b) management by
exception (active), (c) management by exception (passive). The Laissez‐Faire sole factor
is laissez‐faire leadership (Bass, 1988, 1997; Bass & Avolio, 1990). These nine factors
comprise the full‐range leadership model.
A cross‐validation examination of the MLQ 5x survey was conducted. Validity
was improved by the addition of a fifth transformational scale that captured non‐
behavioral and/or impact items (Avolio & Bass, 2004). It has been used extensively in
research and commercial environments. The last 20 years has provided the best
validation evidence for the MLQ and now the 5x. It is a strong predictor of leadership
performance throughout many organizations, levels and cultures. Bass and Avolio
Texas Tech University, Angela Bohannon Burkham, August 2010
36
(2000) discussed the reliability of the instrument and used 14 samples to validate the
MLQ with Cronbach’s alphas ranging from .91 to .94. Permission to use the Multifactor
Leadership Questionnaire was obtained by the researcher through Mind Garden, Inc. on
November 17, 2009.
Conditions of Testing
A web‐based data collection process was chosen for this study for several
reasons. All potential respondents are provided through their position with Extension
the hardware and software that would be necessary to complete a web‐based
instrument. In addition, each potential respondent has Internet access within his or her
offices and while traveling for business. It is also very unlikely that data collection would
be impacted based on the respondent’s inability to operate the computer or canvas the
web. In addition, the cost to implement the study will be less via web versus a mixed‐
mode approach using face‐to‐face or hard copy instruments.
All email addresses and personal information was kept confidential. The study
used Instant Survey at the web‐based data collection system. The items of the two
instruments as well as the additional data collection items were entered into the system
by the researcher. The license for the software is through Texas AgriLife Extension
Service. This system has a global data infrastructure for enhanced security. Instant
Survey is a member of the Council of American Survey Research Organizations and
adheres to CASRO Code of Standards and Ethics for Survey Research for data and
personal information, collection, storage and dissemination.
Texas Tech University, Angela Bohannon Burkham, August 2010
37
The researcher used two initial recruitment approaches. First, the
administration of Texas AgriLife Extension sent an electronic letter promoting and
encouraging mid‐managers to be a part of the research study. Five days later, the
researcher sent an invitation with a web link to the survey asking for participation in the
study. The web link remained active for three weeks. The targeted population was sent
a reminder after the 14th day, and a final reminder after the 21st day. Each supervisor of
the various subsets of the population sent the final reminder. This email reminded the
population that their responses were optional and would be held confidential and
encouraged each of them to participate in the final phase of the research study.
Treatment
Prior to beginning the study a field test was completed to ensure the website
and test functioned effectively. Field test members’ included a university professor,
communication specialist, and an administrative assistant. Upon completion of the
online field test, each participant was interviewed to determine if the various pieces of
the website functioned correctly. Adaptations to the instrument included adding a
progress bar, correcting typographical errors, grammatical errors, and reformatting the
EI and MLQ questions to include only fifteen questions per page.
Three instruments were used to collect research data. Initially participants
received instructions on how to proceed through the web based instrument. A general
questionnaire about demographics and work history was the first section of the
instrument to complete. This instrument was based on the instrument used by
Texas Tech University, Angela Bohannon Burkham, August 2010
38
Meredith (2007). The BarOn EQ‐i questionnaire and Bass’s MLQ 5X leadership
questionnaire were accessed using a website designed specifically for this study.
Participants were directed to the website through an instructional email. They began
with demographic data and answered a series of questions related to their current title,
and work history and experiences. They then completed the MLQ Form 5X indicating
their leadership style data and then the BarOn EQ‐I assessment.
The demographic component of the assessment focused on years experience in
the workforce, years experience in the position, years experience in Extension, years
experience as an agent, specialist, administrator or other Extension positions, and age.
Additionally two open‐ended questions regarding the leadership challenges faced by the
agency were included.
The second phase of the instrument was the MLQ 5x that provides a 360‐degree
measurement of leadership styles related to transformational leadership, transactional
leadership, non‐transactional leadership styles, and outcomes of leadership. The
revised MLQ 5x has strong validity and reliability and has been used extensively in
research and commercial applications. It has proven to be a strong predictor of leader
performance across a broad range of organizations.
The BarOn EQ‐I, provides a total emotional quotient (EQ) score and five EQ
composite scale scores comprising 15 subscale scores (Bar‐On, 2000). This test was
developed by clinical psychologist Reuven Bar On and was the first empirically
constructed test of emotional intelligence (Bar On, 2002). The five scales are
Texas Tech University, Angela Bohannon Burkham, August 2010
39
intrapersonal EQ, interpersonal EQ, stress management EQ, adaptability EQ, and general
mood EQ — each with its own set of subscales (Bar‐On, 2000). The test is comprised of
133 items and employs a five‐point response set, ranging from “not true of me” to “true
of me.” Approximately 30 to 40 minutes are needed to complete the exam; however,
there are no imposed time limits. The assessment renders four validity scale scores, a
total emotional quotient (EQ) score, five composite scale scores, and 15 EQ subscale
scores.
The MLQ (5X Short) is a 45‐question instrument used in field and laboratory
research studies of transformational, transactional and passive/avoidant leadership
styles. The three leadership behaviors have been divided into a series of sub‐factors.
The transformational factors include: (a) idealized influence attributed, (b) idealized
influence behavior, (c) inspirational motivation, (d) intellectual stimulation, (e) individual
consideration. Transactional factors include: (a) contingent reward, (b) management by
exception (active), (c) management by exception (passive). The Laissez‐Faire sole factor
is laissez‐faire leadership (Bass, 1988, 1997; Bass & Avolio, 1990).
Data Analysis
The data analysis of the study will include a variety of statistical processes. Data
were analyzed using the SPSS statistical software created for Windows. The general
questionnaire, EQ‐I survey and MLQ questionnaire all provided a foundation for
descriptive statistics. Descriptive statistics was conducted for the demographic
information related to current title, tenure in various positions, years in workforce, age
Texas Tech University, Angela Bohannon Burkham, August 2010
40
and gender. Descriptive data was also yielded from the open‐ended questions related
to the most important leadership traits needed and the biggest leadership challenges
facing Texas AgriLife Extension. The statements were segmented and coded first by
rank order and then grouped by common theme identified through the literature
review.
The EQ‐I questions which totaled 133 required 64 of them to be reverse coded.
Questions are worded in a survey that a high score reflects the highest value of the
theoretical construct. Other questions are worded that a low score reflects the high
values of the construct.
A compute process was employed to determine individual scores for
transformation, transactional and laissez‐faire leadership styles. The transformation
leadership score variable represented the average of the following subsets: (a) idealized
influence attributed, (b) idealized influence behavior, (c) inspirational motivation, (d)
intellectual stimulation, (e) individual consideration. The transactional leadership score
variable represented the average of the following subsets: (a) contingent reward, (b)
management by exception (active), (c) management by exception (passive). The laissez‐
faire score was a compute of the laissez‐faire subset.
An independent t‐test was calculated comparing the mean score of
transformational leadership score, transactional leadership score and laissez‐faire
leadership score with the seventeen subscales of the EQ‐I assessment. The mean
difference between pairs of scores was divided by the standard error of those
Texas Tech University, Angela Bohannon Burkham, August 2010
41
differences. A Levene’s test was conducted to ensure the variances within the variables
are equal.
Non‐response error can be a threat to external validity when the response rate is
less than 100% (Lindner, Murphy, & Briers, 2000). To address non‐response error in this
project, early and late respondents were compared for statistical differences (Ary,
Jacobs, & Razaveih, 1996; Linder et al; Miller & Smith, 1983). Late responders were
defined as the later 50% of the respondents (Linder, et al). There was no statistically
significant difference between early and late responders.
Texas Tech University, Angela Bohannon Burkham, August 2010
42
Chapter IV
Results
This purpose of the study was to examine the potential relationship between
emotional intelligence and the leadership styles used Texas AgriLife Extension Service
mid‐managers? The following objectives guided the study:
1. Describe Texas AgriLife Extension Service mid‐managers in terms of their
gender, age, current title, years in current position, total years of
employment in Extension, as an agent, total years of employment as a
specialist and total years of employment as an educator.
2. Describe Texas AgriLife Extension Service mid‐managers in terms of their
emotional intelligence as measured by the BarOn EQ‐i instrument.
3. Describe Texas AgriLife Extension Service mid‐managers in terms of their
leadership styles as measured by the Multifactor Leadership Questionnaire.
4. Describe the statistical relationship between Texas AgriLife Extension mid‐
managers leadership styles and their emotional intelligence scores.
The following research hypothesis generated from the literature review was tested.
H₀ 1. There is no statistically significant difference in EI scores between
AgriLife Extension mid‐managers with high Transformational
Leadership behaviors with those having low Transformational
Leadership behaviors.
Texas Tech University, Angela Bohannon Burkham, August 2010
43
H₀ 2. There is no statistically significant difference in EI scores between
AgriLife Extension mid‐managers with high Transactional Leadership
behaviors with those having low Transactional Leadership behaviors.
The survey included general demographic information, the BarOn EQ‐i and the
Multi‐Leadership Questionnaire (MLQ) via an instant survey created by the researcher.
A total of 48 mid‐managers were the population for this study. Of these, 42 responded
to the demographic section with 36 also completing the MLQ and EQ‐i sections. What
follows are the results organized by the objectives of this study.
Descriptive Statistics
Objective 1
The majority of the respondents were female with 28 completing the
assessment. The age of participants was varied with the majority of participants being
in the 41‐60 year old range (n = 37). Table 1 shows the respondents breakdown by
gender and age.
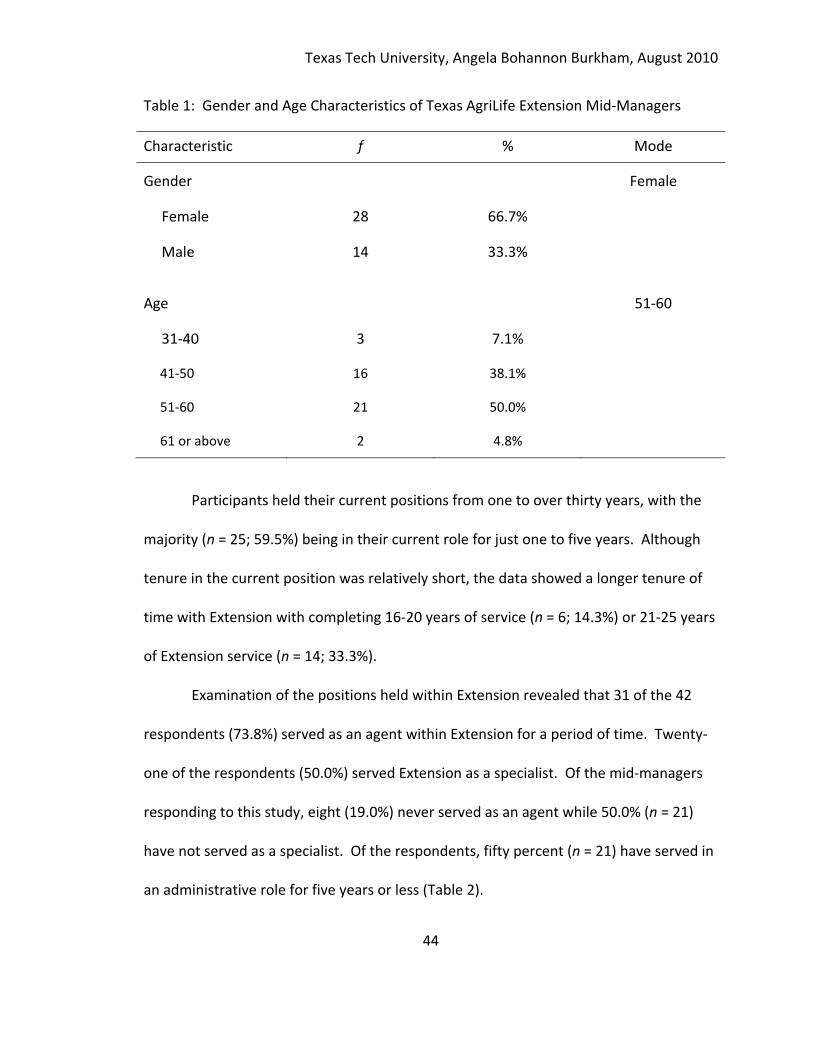
Texas Tech University, Angela Bohannon Burkham, August 2010
44
Table 1: Gender and Age Characteristics of Texas AgriLife Extension Mid‐Managers
Characteristic f % Mode
Gender Female
Female 28 66.7%
Male 14 33.3%
Age 51‐60
31‐40 3 7.1%
41‐50 16 38.1%
51‐60 21 50.0%
61 or above 2 4.8%
Participants held their current positions from one to over thirty years, with the
majority (n = 25; 59.5%) being in their current role for just one to five years. Although
tenure in the current position was relatively short, the data showed a longer tenure of
time with Extension with completing 16‐20 years of service (n = 6; 14.3%) or 21‐25 years
of Extension service (n = 14; 33.3%).
Examination of the positions held within Extension revealed that 31 of the 42
respondents (73.8%) served as an agent within Extension for a period of time. Twenty‐
one of the respondents (50.0%) served Extension as a specialist. Of the mid‐managers
responding to this study, eight (19.0%) never served as an agent while 50.0% (n = 21)
have not served as a specialist. Of the respondents, fifty percent (n = 21) have served in
an administrative role for five years or less (Table 2).
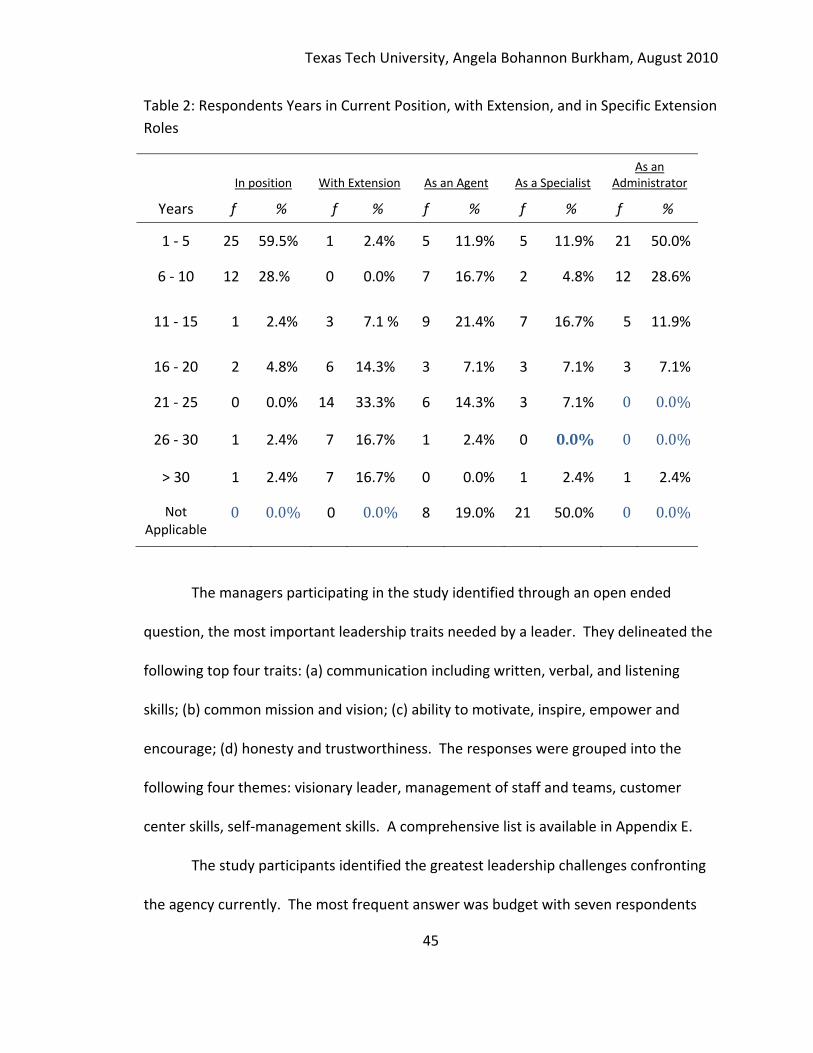
Texas Tech University, Angela Bohannon Burkham, August 2010
45
Table 2: Respondents Years in Current Position, with Extension, and in Specific Extension
Roles
Years
In position With Extension As an Agent As a Specialist As an
Administrator
f % f % f % f % f %
1 ‐ 5 25 59.5% 1 2.4% 5 11.9% 5 11.9% 21 50.0%
6 ‐ 10 12 28.% 0 0.0% 7 16.7% 2 4.8% 12 28.6%
11 ‐ 15 1 2.4% 3 7.1 % 9 21.4% 7 16.7% 5 11.9%
16 ‐ 20 2 4.8% 6 14.3% 3 7.1% 3 7.1% 3 7.1%
21 ‐ 25 0 0.0% 14 33.3% 6 14.3% 3 7.1% 0 0.0%
26 ‐ 30 1 2.4% 7 16.7% 1 2.4% 0 0.0% 0 0.0%
> 30 1 2.4% 7 16.7% 0 0.0% 1 2.4% 1 2.4%
Not Applicable
0 0.0% 0 0.0% 8 19.0% 21 50.0% 0 0.0%
The managers participating in the study identified through an open ended
question, the most important leadership traits needed by a leader. They delineated the
following top four traits: (a) communication including written, verbal, and listening
skills; (b) common mission and vision; (c) ability to motivate, inspire, empower and
encourage; (d) honesty and trustworthiness. The responses were grouped into the
following four themes: visionary leader, management of staff and teams, customer
center skills, self‐management skills. A comprehensive list is available in Appendix E.
The study participants identified the greatest leadership challenges confronting
the agency currently. The most frequent answer was budget with seven respondents
Texas Tech University, Angela Bohannon Burkham, August 2010
46
identifying it as the primary challenge. The range of issues regarding budget included
lack of funding, economic security, maintaining and increasing funding, and transitioning
to state supported from state funded. The need for individuals to be trained as leaders
was the next common response with four. Specifically, individuals trained and ready to
assume leadership roles. The third greatest was moral with four responses. This issue
was most closely related to low salaries, decreasing budgets and uncertain economic
times. The economic times and the decreasing state and federal budgets are obvious
factors in the results of these questions. Other challenges were mentioned at a
minimum, but the ones above represent the most frequent leadership challenges
identified by participants. Appendix F provides additional data in addition to specific
management level comments.
Objective 2.
Descriptive statistics were determined for each of the emotional intelligence
components. The top five components as identified through a mean score were
interpersonal relationship (37.78), social responsibility (35.92), empathy (31.08),
optimism (31.64) and self regard (29.97) (Table 3). The weakest mean scores were
identified in independence (13.31), impulse tolerance (17.14), assertiveness (19.06),
flexibility (20.11), and self‐actualization (25.14).
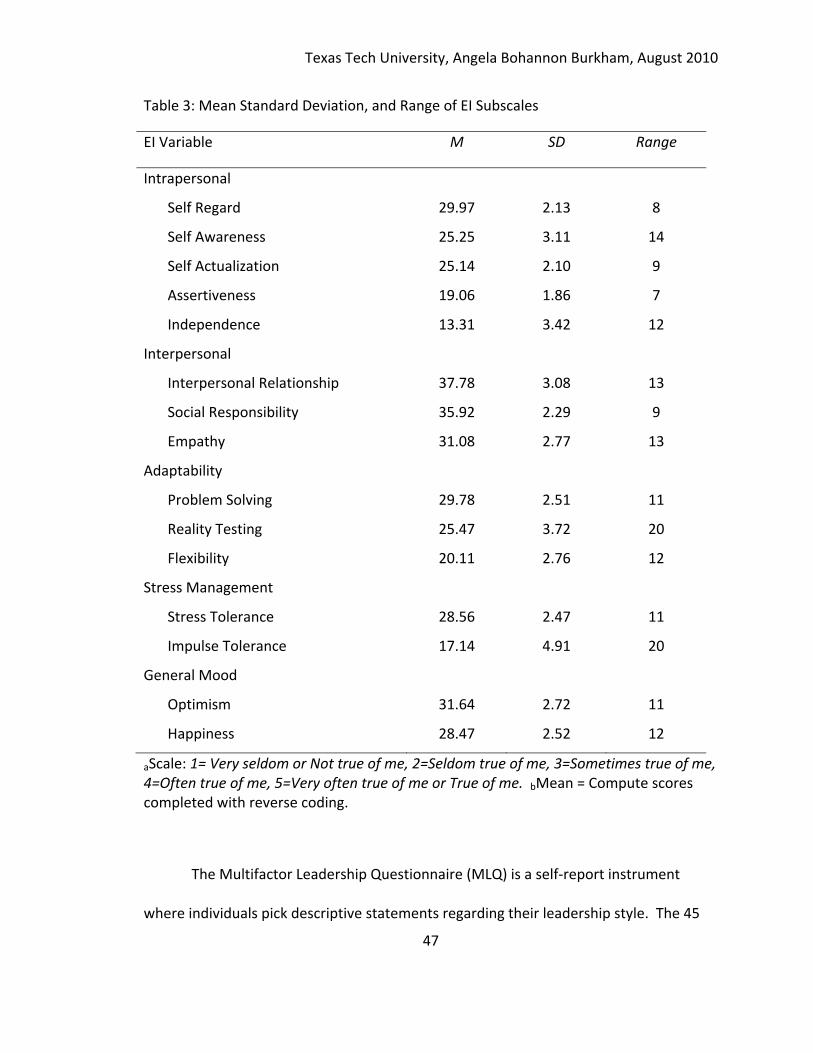
Texas Tech University, Angela Bohannon Burkham, August 2010
47
Table 3: Mean Standard Deviation, and Range of EI Subscales
EI Variable M SD Range
Intrapersonal
Self Regard 29.97 2.13 8
Self Awareness 25.25 3.11 14
Self Actualization 25.14 2.10 9
Assertiveness 19.06 1.86 7
Independence 13.31 3.42 12
Interpersonal
Interpersonal Relationship 37.78 3.08 13
Social Responsibility 35.92 2.29 9
Empathy 31.08 2.77 13
Adaptability
Problem Solving 29.78 2.51 11
Reality Testing 25.47 3.72 20
Flexibility 20.11 2.76 12
Stress Management
Stress Tolerance 28.56 2.47 11
Impulse Tolerance 17.14 4.91 20
General Mood
Optimism 31.64 2.72 11
Happiness 28.47 2.52 12
aScale: 1= Very seldom or Not true of me, 2=Seldom true of me, 3=Sometimes true of me, 4=Often true of me, 5=Very often true of me or True of me. bMean = Compute scores completed with reverse coding.
The Multifactor Leadership Questionnaire (MLQ) is a self‐report instrument
where individuals pick descriptive statements regarding their leadership style. The 45
Texas Tech University, Angela Bohannon Burkham, August 2010
48
questions “identify and measure key leadership and effectiveness behaviors shown in
prior research to be strongly linked with both individual and organizational success”
(Avolio & Bass, 2004, p. 12). Descriptive statistics were determined for the Multifactor
Leadership Questionnaire and its components. The results are outlined in table 4 with
the mean, mode and standard deviation detailed for each of the three leadership styles,
transformational, transactional and laissez‐faire.
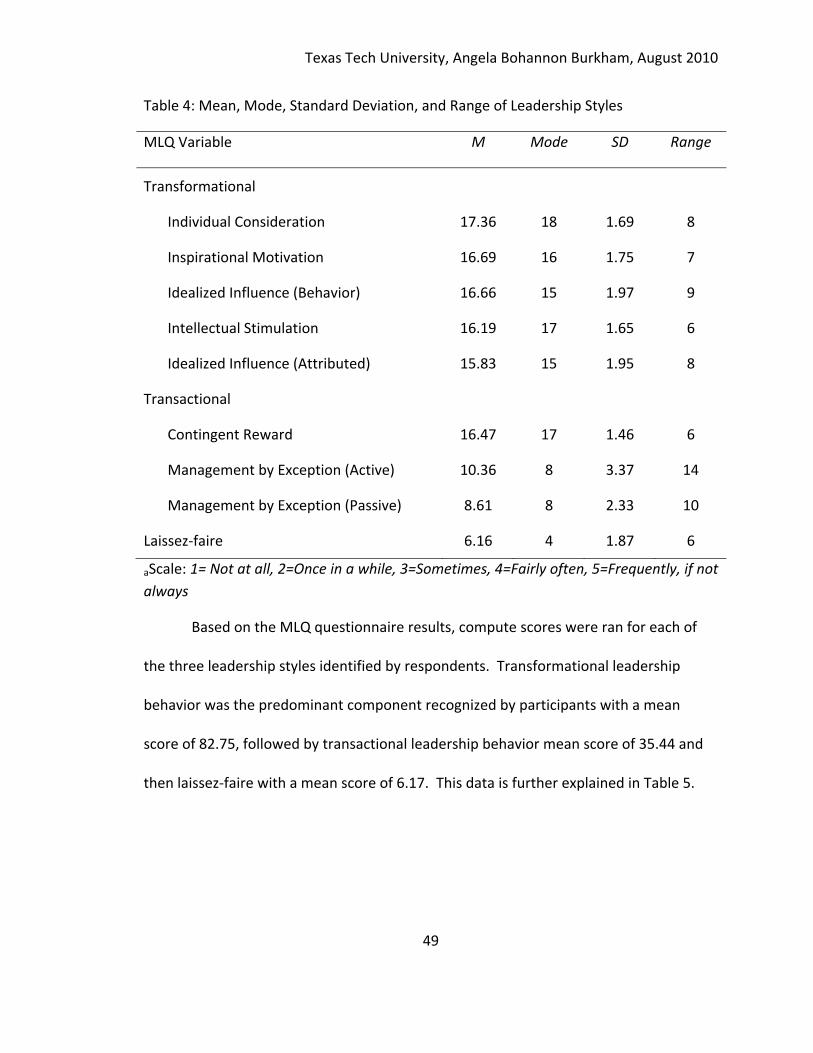
Texas Tech University, Angela Bohannon Burkham, August 2010
49
Table 4: Mean, Mode, Standard Deviation, and Range of Leadership Styles
MLQ Variable M Mode SD Range
Transformational
Individual Consideration 17.36 18 1.69 8
Inspirational Motivation 16.69 16 1.75 7
Idealized Influence (Behavior) 16.66 15 1.97 9
Intellectual Stimulation 16.19 17 1.65 6
Idealized Influence (Attributed) 15.83 15 1.95 8
Transactional
Contingent Reward 16.47 17 1.46 6
Management by Exception (Active) 10.36 8 3.37 14
Management by Exception (Passive) 8.61 8 2.33 10
Laissez‐faire 6.16 4 1.87 6
aScale: 1= Not at all, 2=Once in a while, 3=Sometimes, 4=Fairly often, 5=Frequently, if not
always
Based on the MLQ questionnaire results, compute scores were ran for each of
the three leadership styles identified by respondents. Transformational leadership
behavior was the predominant component recognized by participants with a mean
score of 82.75, followed by transactional leadership behavior mean score of 35.44 and
then laissez‐faire with a mean score of 6.17. This data is further explained in Table 5.
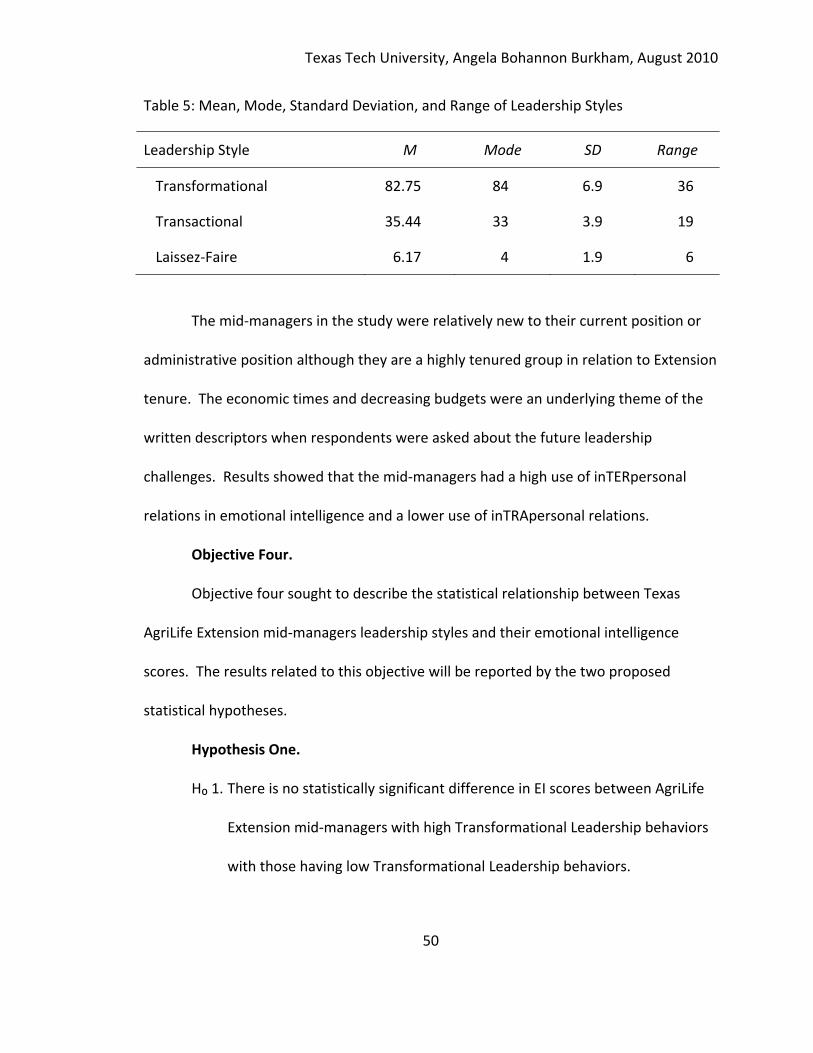
Texas Tech University, Angela Bohannon Burkham, August 2010
50
Table 5: Mean, Mode, Standard Deviation, and Range of Leadership Styles
Leadership Style M Mode SD Range
Transformational 82.75 84 6.9 36
Transactional 35.44 33 3.9 19
Laissez‐Faire 6.17 4 1.9 6
The mid‐managers in the study were relatively new to their current position or
administrative position although they are a highly tenured group in relation to Extension
tenure. The economic times and decreasing budgets were an underlying theme of the
written descriptors when respondents were asked about the future leadership
challenges. Results showed that the mid‐managers had a high use of inTERpersonal
relations in emotional intelligence and a lower use of inTRApersonal relations.
Objective Four.
Objective four sought to describe the statistical relationship between Texas
AgriLife Extension mid‐managers leadership styles and their emotional intelligence
scores. The results related to this objective will be reported by the two proposed
statistical hypotheses.
Hypothesis One.
H₀ 1. There is no statistically significant difference in EI scores between AgriLife
Extension mid‐managers with high Transformational Leadership behaviors
with those having low Transformational Leadership behaviors.
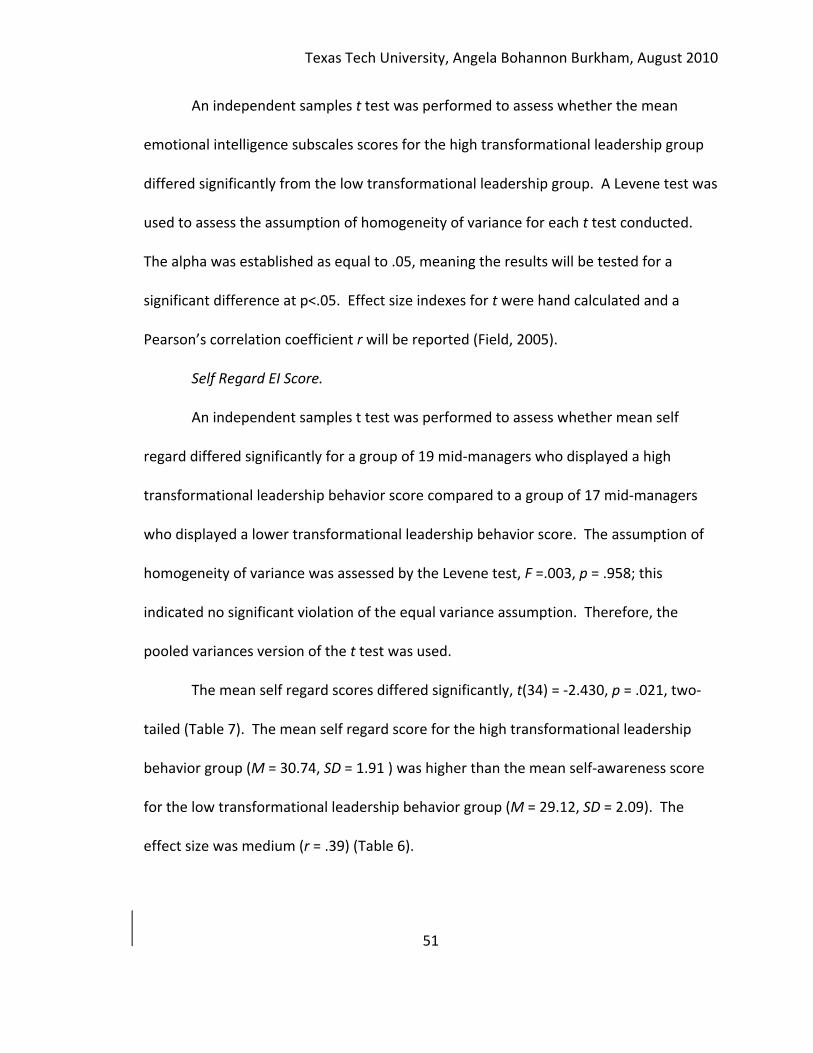
Texas Tech University, Angela Bohannon Burkham, August 2010
51
An independent samples t test was performed to assess whether the mean
emotional intelligence subscales scores for the high transformational leadership group
differed significantly from the low transformational leadership group. A Levene test was
used to assess the assumption of homogeneity of variance for each t test conducted.
The alpha was established as equal to .05, meaning the results will be tested for a
significant difference at p<.05. Effect size indexes for t were hand calculated and a
Pearson’s correlation coefficient r will be reported (Field, 2005).
Self Regard EI Score.
An independent samples t test was performed to assess whether mean self
regard differed significantly for a group of 19 mid‐managers who displayed a high
transformational leadership behavior score compared to a group of 17 mid‐managers
who displayed a lower transformational leadership behavior score. The assumption of
homogeneity of variance was assessed by the Levene test, F =.003, p = .958; this
indicated no significant violation of the equal variance assumption. Therefore, the
pooled variances version of the t test was used.
The mean self regard scores differed significantly, t(34) = ‐2.430, p = .021, two‐
tailed (Table 7). The mean self regard score for the high transformational leadership
behavior group (M = 30.74, SD = 1.91 ) was higher than the mean self‐awareness score
for the low transformational leadership behavior group (M = 29.12, SD = 2.09). The
effect size was medium (r = .39) (Table 6).
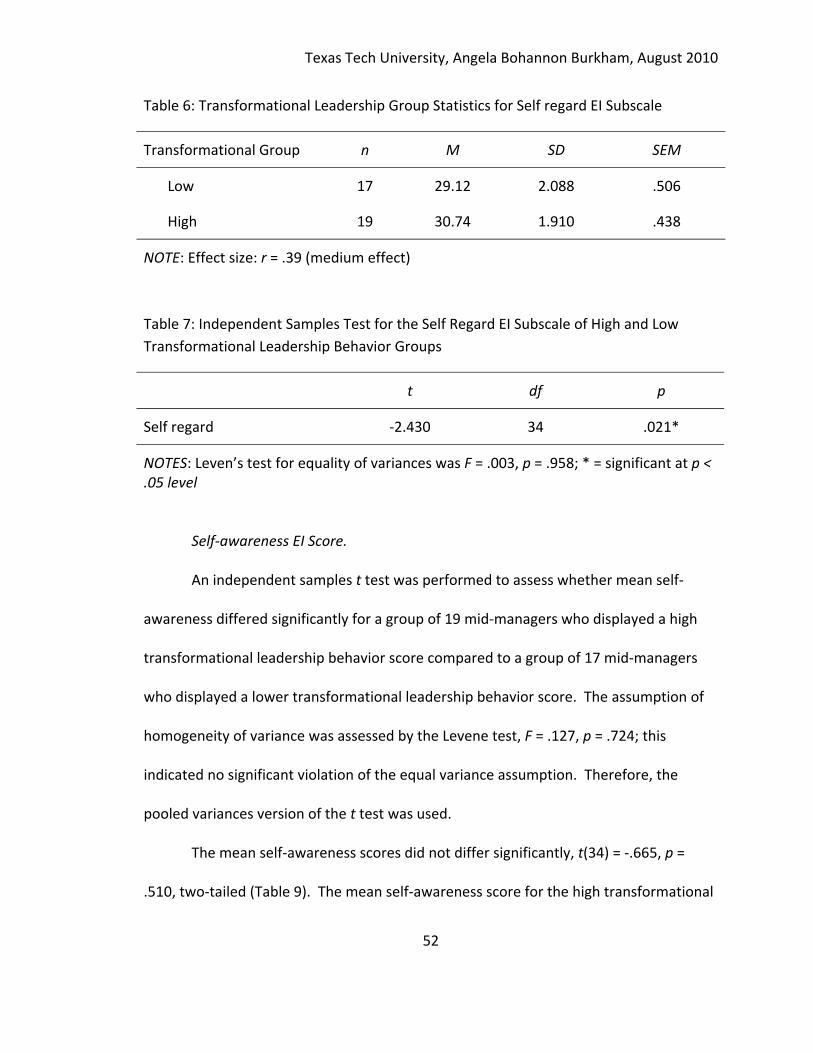
Texas Tech University, Angela Bohannon Burkham, August 2010
52
Table 6: Transformational Leadership Group Statistics for Self regard EI Subscale
Transformational Group n M SD SEM
Low 17 29.12 2.088 .506
High 19 30.74 1.910 .438
NOTE: Effect size: r = .39 (medium effect)
Table 7: Independent Samples Test for the Self Regard EI Subscale of High and Low
Transformational Leadership Behavior Groups
t df p
Self regard ‐2.430 34 .021*
NOTES: Leven’s test for equality of variances was F = .003, p = .958; * = significant at p < .05 level
Self‐awareness EI Score.
An independent samples t test was performed to assess whether mean self‐
awareness differed significantly for a group of 19 mid‐managers who displayed a high
transformational leadership behavior score compared to a group of 17 mid‐managers
who displayed a lower transformational leadership behavior score. The assumption of
homogeneity of variance was assessed by the Levene test, F = .127, p = .724; this
indicated no significant violation of the equal variance assumption. Therefore, the
pooled variances version of the t test was used.
The mean self‐awareness scores did not differ significantly, t(34) = ‐.665, p =
.510, two‐tailed (Table 9). The mean self‐awareness score for the high transformational
Texas Tech University, Angela Bohannon Burkham, August 2010
53
leadership behavior group (M = 25.58, SD = 3.01) was higher than the mean self‐
awareness score for the low transformational leadership behavior group (M = 24.88, SD
= 3.28) though this difference was not statistically significant, the effect size was small (r
= .11) (Table 8).
Table 8: Transformational Leadership Group Statistics for Self‐Awareness EI Subscale
Transformational Group n M SD SEM
Low 17 24.88 3.276 .795
High 19 25.58 3.006 .690
NOTE: Effect size: r = .11 (small effect)
Table 9: Independent Samples Test for the Self‐Awareness EI Scores of High and Low
Transformational Leadership Behavior Groups
t df p
Self‐awareness ‐.665 34 .510
NOTE: Leven’s test for equality of variances was F = .127, p = .724.
Self‐actualization EI Score.
An independent samples t test was performed to assess whether mean self‐
actualization differed significantly for a group of 19 mid‐managers who displayed a high
transformational leadership behavior score compared to a group of 17 mid‐managers
who displayed a lower transformational leadership behavior score. The assumption of
homogeneity of variance was assessed by the Levene test, F = .466, p = .500; this
indicated no significant violation of the equal variance assumption. Therefore, the
pooled variances version of the t test was used.
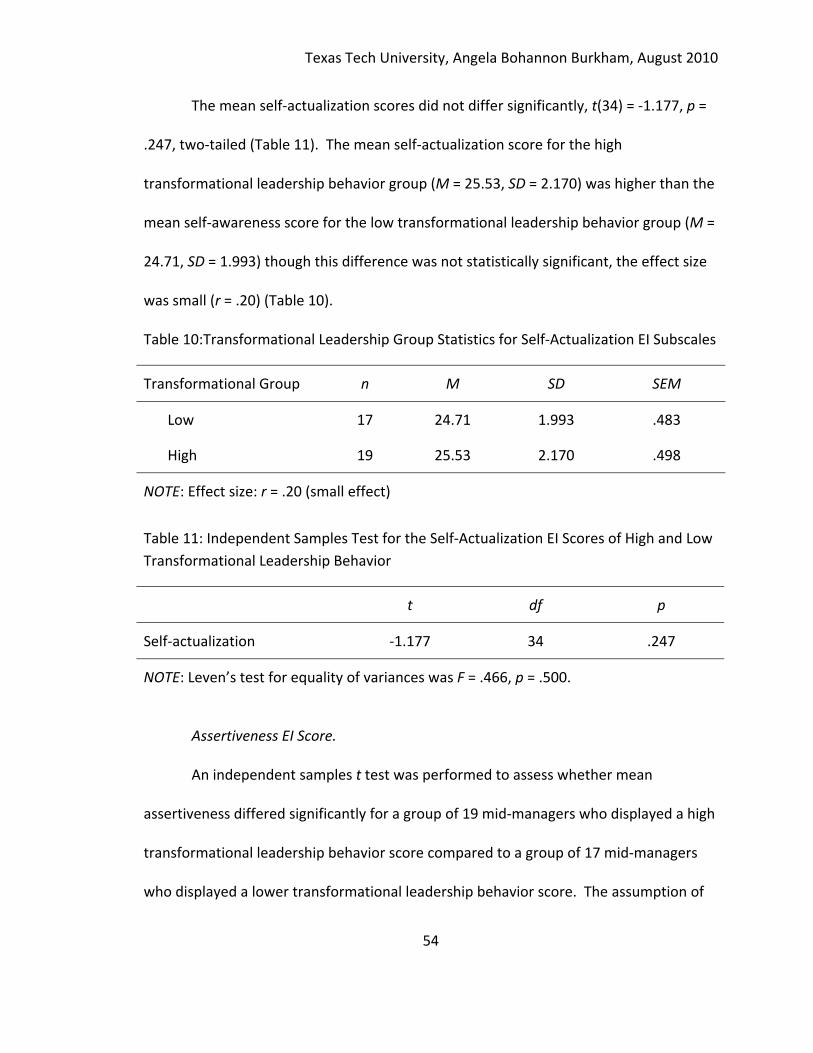
Texas Tech University, Angela Bohannon Burkham, August 2010
54
The mean self‐actualization scores did not differ significantly, t(34) = ‐1.177, p =
.247, two‐tailed (Table 11). The mean self‐actualization score for the high
transformational leadership behavior group (M = 25.53, SD = 2.170) was higher than the
mean self‐awareness score for the low transformational leadership behavior group (M =
24.71, SD = 1.993) though this difference was not statistically significant, the effect size
was small (r = .20) (Table 10).
Table 10:Transformational Leadership Group Statistics for Self‐Actualization EI Subscales
Transformational Group n M SD SEM
Low 17 24.71 1.993 .483
High 19 25.53 2.170 .498
NOTE: Effect size: r = .20 (small effect)
Table 11: Independent Samples Test for the Self‐Actualization EI Scores of High and Low
Transformational Leadership Behavior
t df p
Self‐actualization ‐1.177 34 .247
NOTE: Leven’s test for equality of variances was F = .466, p = .500.
Assertiveness EI Score.
An independent samples t test was performed to assess whether mean
assertiveness differed significantly for a group of 19 mid‐managers who displayed a high
transformational leadership behavior score compared to a group of 17 mid‐managers
who displayed a lower transformational leadership behavior score. The assumption of
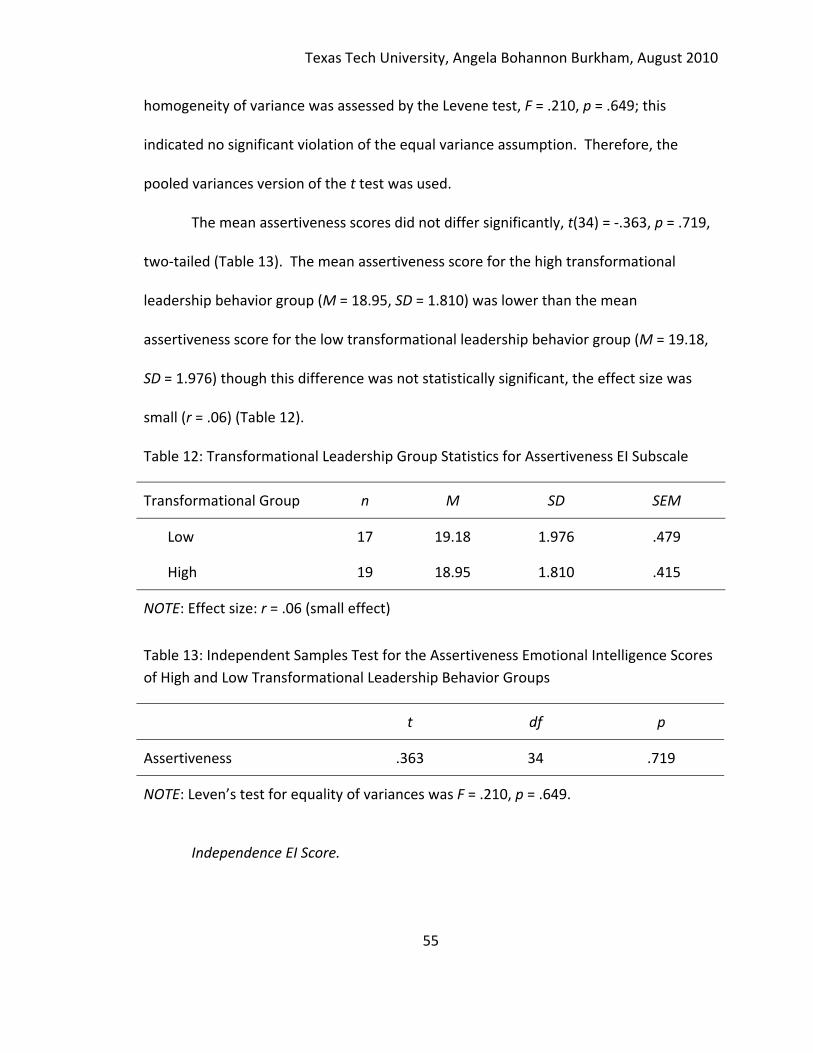
Texas Tech University, Angela Bohannon Burkham, August 2010
55
homogeneity of variance was assessed by the Levene test, F = .210, p = .649; this
indicated no significant violation of the equal variance assumption. Therefore, the
pooled variances version of the t test was used.
The mean assertiveness scores did not differ significantly, t(34) = ‐.363, p = .719,
two‐tailed (Table 13). The mean assertiveness score for the high transformational
leadership behavior group (M = 18.95, SD = 1.810) was lower than the mean
assertiveness score for the low transformational leadership behavior group (M = 19.18,
SD = 1.976) though this difference was not statistically significant, the effect size was
small (r = .06) (Table 12).
Table 12: Transformational Leadership Group Statistics for Assertiveness EI Subscale
Transformational Group n M SD SEM
Low 17 19.18 1.976 .479
High 19 18.95 1.810 .415
NOTE: Effect size: r = .06 (small effect)
Table 13: Independent Samples Test for the Assertiveness Emotional Intelligence Scores
of High and Low Transformational Leadership Behavior Groups
t df p
Assertiveness .363 34 .719
NOTE: Leven’s test for equality of variances was F = .210, p = .649.
Independence EI Score.
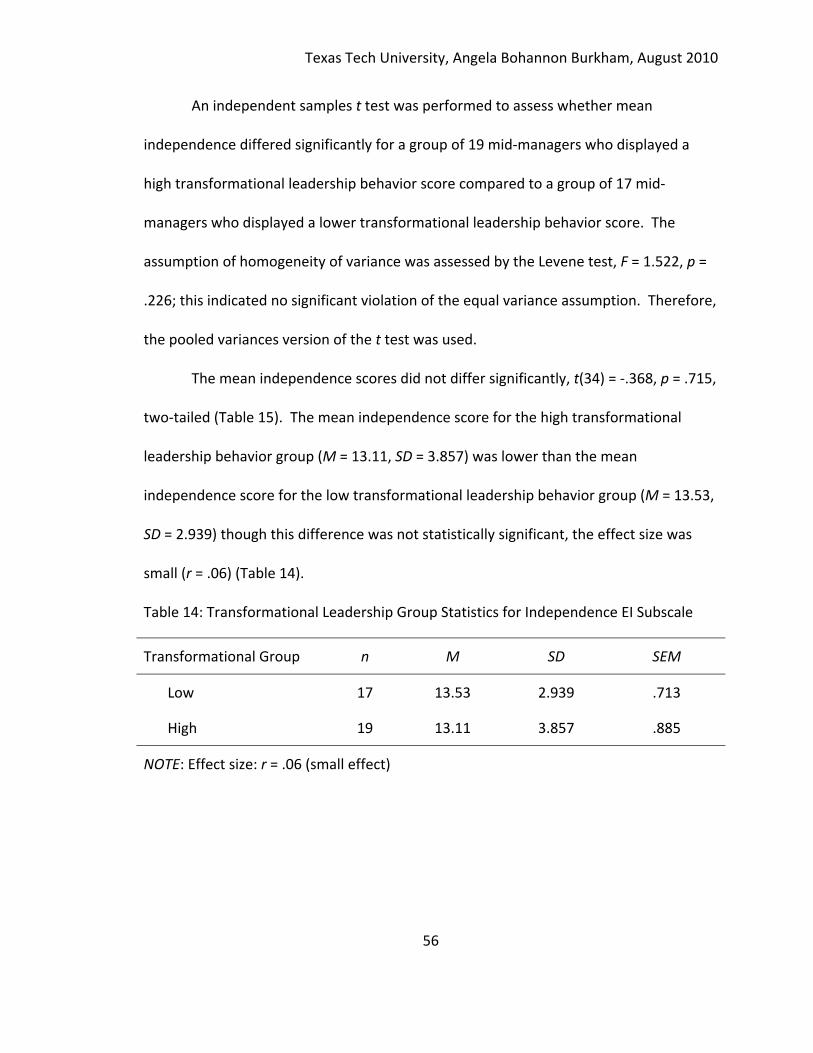
Texas Tech University, Angela Bohannon Burkham, August 2010
56
An independent samples t test was performed to assess whether mean
independence differed significantly for a group of 19 mid‐managers who displayed a
high transformational leadership behavior score compared to a group of 17 mid‐
managers who displayed a lower transformational leadership behavior score. The
assumption of homogeneity of variance was assessed by the Levene test, F = 1.522, p =
.226; this indicated no significant violation of the equal variance assumption. Therefore,
the pooled variances version of the t test was used.
The mean independence scores did not differ significantly, t(34) = ‐.368, p = .715,
two‐tailed (Table 15). The mean independence score for the high transformational
leadership behavior group (M = 13.11, SD = 3.857) was lower than the mean
independence score for the low transformational leadership behavior group (M = 13.53,
SD = 2.939) though this difference was not statistically significant, the effect size was
small (r = .06) (Table 14).
Table 14: Transformational Leadership Group Statistics for Independence EI Subscale
Transformational Group n M SD SEM
Low 17 13.53 2.939 .713
High 19 13.11 3.857 .885
NOTE: Effect size: r = .06 (small effect)
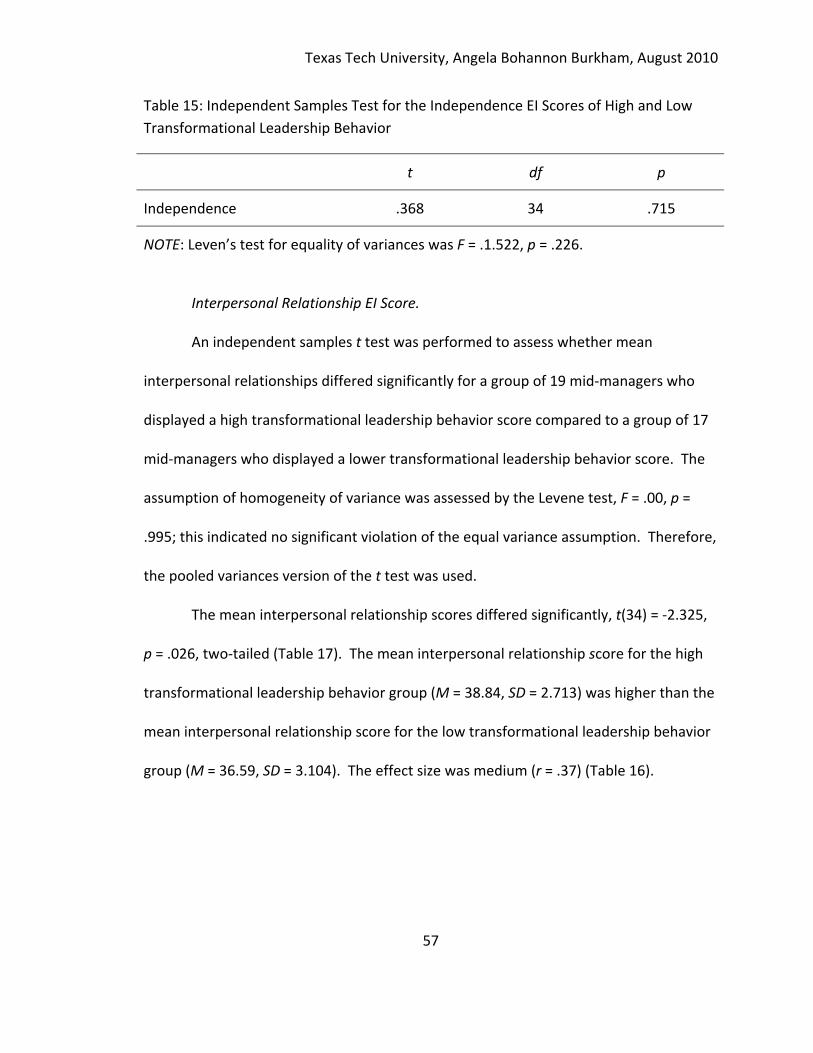
Texas Tech University, Angela Bohannon Burkham, August 2010
57
Table 15: Independent Samples Test for the Independence EI Scores of High and Low
Transformational Leadership Behavior
t df p
Independence .368 34 .715
NOTE: Leven’s test for equality of variances was F = .1.522, p = .226.
Interpersonal Relationship EI Score.
An independent samples t test was performed to assess whether mean
interpersonal relationships differed significantly for a group of 19 mid‐managers who
displayed a high transformational leadership behavior score compared to a group of 17
mid‐managers who displayed a lower transformational leadership behavior score. The
assumption of homogeneity of variance was assessed by the Levene test, F = .00, p =
.995; this indicated no significant violation of the equal variance assumption. Therefore,
the pooled variances version of the t test was used.
The mean interpersonal relationship scores differed significantly, t(34) = ‐2.325,
p = .026, two‐tailed (Table 17). The mean interpersonal relationship score for the high
transformational leadership behavior group (M = 38.84, SD = 2.713) was higher than the
mean interpersonal relationship score for the low transformational leadership behavior
group (M = 36.59, SD = 3.104). The effect size was medium (r = .37) (Table 16).
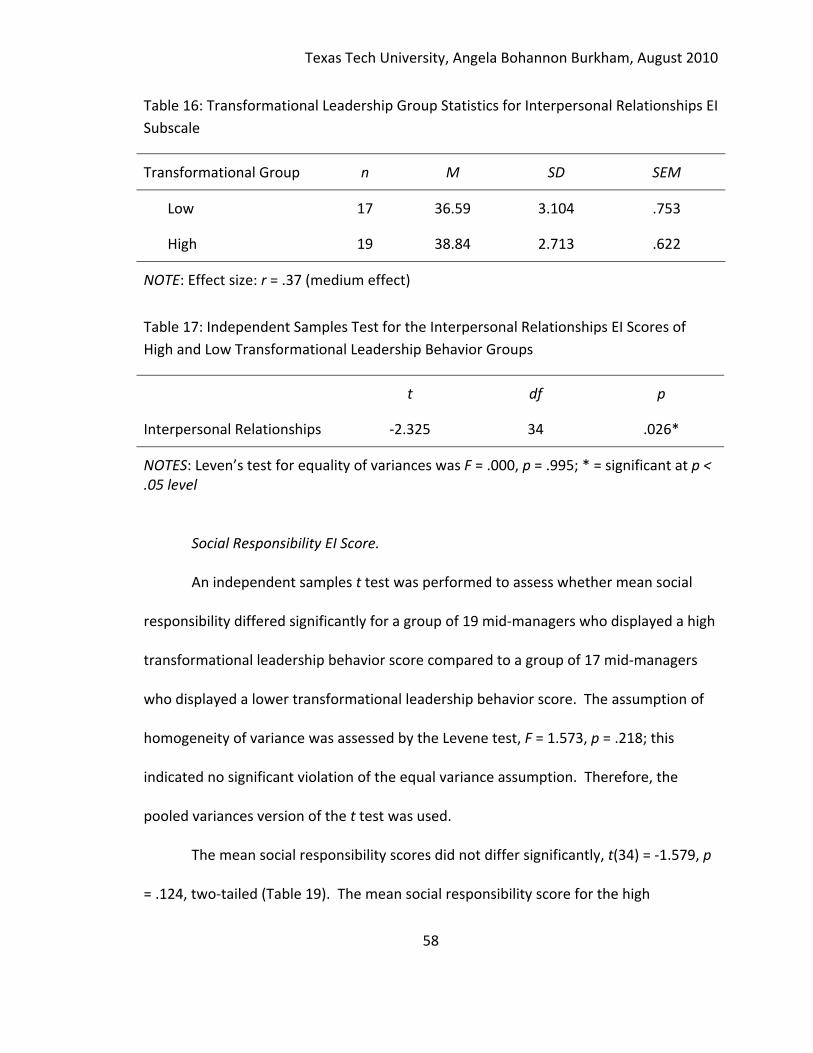
Texas Tech University, Angela Bohannon Burkham, August 2010
58
Table 16: Transformational Leadership Group Statistics for Interpersonal Relationships EI
Subscale
Transformational Group n M SD SEM
Low 17 36.59 3.104 .753
High 19 38.84 2.713 .622
NOTE: Effect size: r = .37 (medium effect)
Table 17: Independent Samples Test for the Interpersonal Relationships EI Scores of
High and Low Transformational Leadership Behavior Groups
t df p
Interpersonal Relationships ‐2.325 34 .026*
NOTES: Leven’s test for equality of variances was F = .000, p = .995; * = significant at p < .05 level
Social Responsibility EI Score.
An independent samples t test was performed to assess whether mean social
responsibility differed significantly for a group of 19 mid‐managers who displayed a high
transformational leadership behavior score compared to a group of 17 mid‐managers
who displayed a lower transformational leadership behavior score. The assumption of
homogeneity of variance was assessed by the Levene test, F = 1.573, p = .218; this
indicated no significant violation of the equal variance assumption. Therefore, the
pooled variances version of the t test was used.
The mean social responsibility scores did not differ significantly, t(34) = ‐1.579, p
= .124, two‐tailed (Table 19). The mean social responsibility score for the high
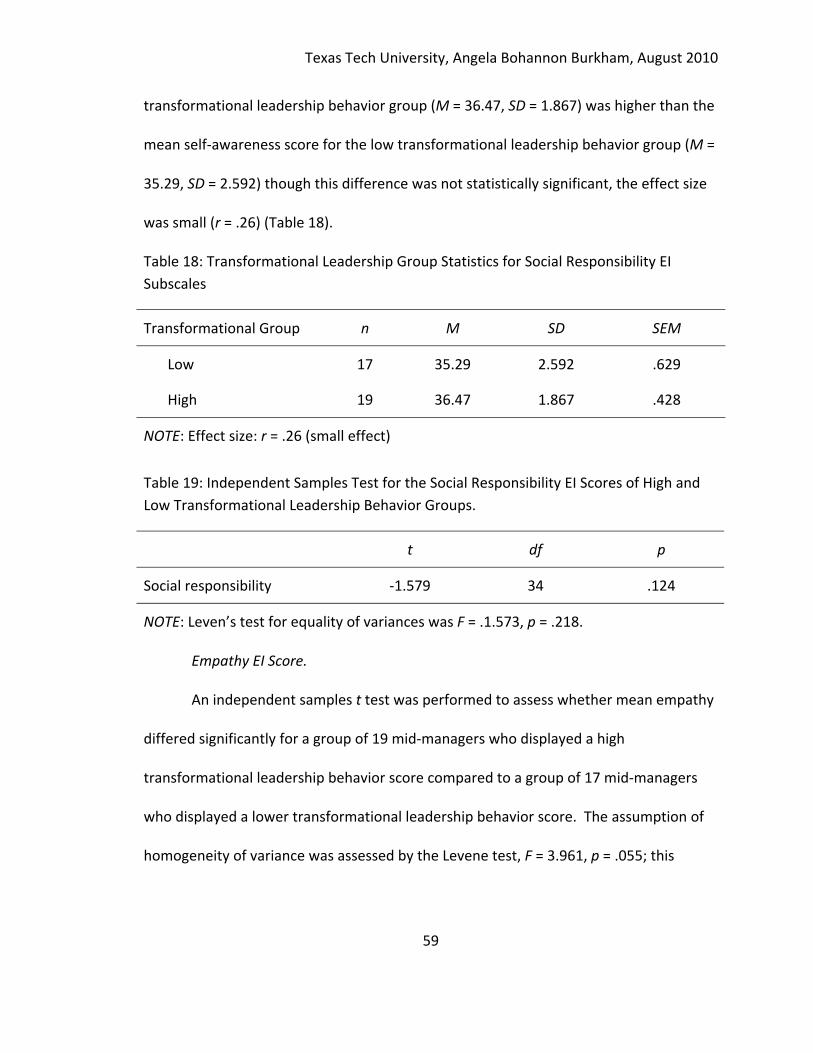
Texas Tech University, Angela Bohannon Burkham, August 2010
59
transformational leadership behavior group (M = 36.47, SD = 1.867) was higher than the
mean self‐awareness score for the low transformational leadership behavior group (M =
35.29, SD = 2.592) though this difference was not statistically significant, the effect size
was small (r = .26) (Table 18).
Table 18: Transformational Leadership Group Statistics for Social Responsibility EI
Subscales
Transformational Group n M SD SEM
Low 17 35.29 2.592 .629
High 19 36.47 1.867 .428
NOTE: Effect size: r = .26 (small effect)
Table 19: Independent Samples Test for the Social Responsibility EI Scores of High and
Low Transformational Leadership Behavior Groups.
t df p
Social responsibility ‐1.579 34 .124
NOTE: Leven’s test for equality of variances was F = .1.573, p = .218.
Empathy EI Score.
An independent samples t test was performed to assess whether mean empathy
differed significantly for a group of 19 mid‐managers who displayed a high
transformational leadership behavior score compared to a group of 17 mid‐managers
who displayed a lower transformational leadership behavior score. The assumption of
homogeneity of variance was assessed by the Levene test, F = 3.961, p = .055; this
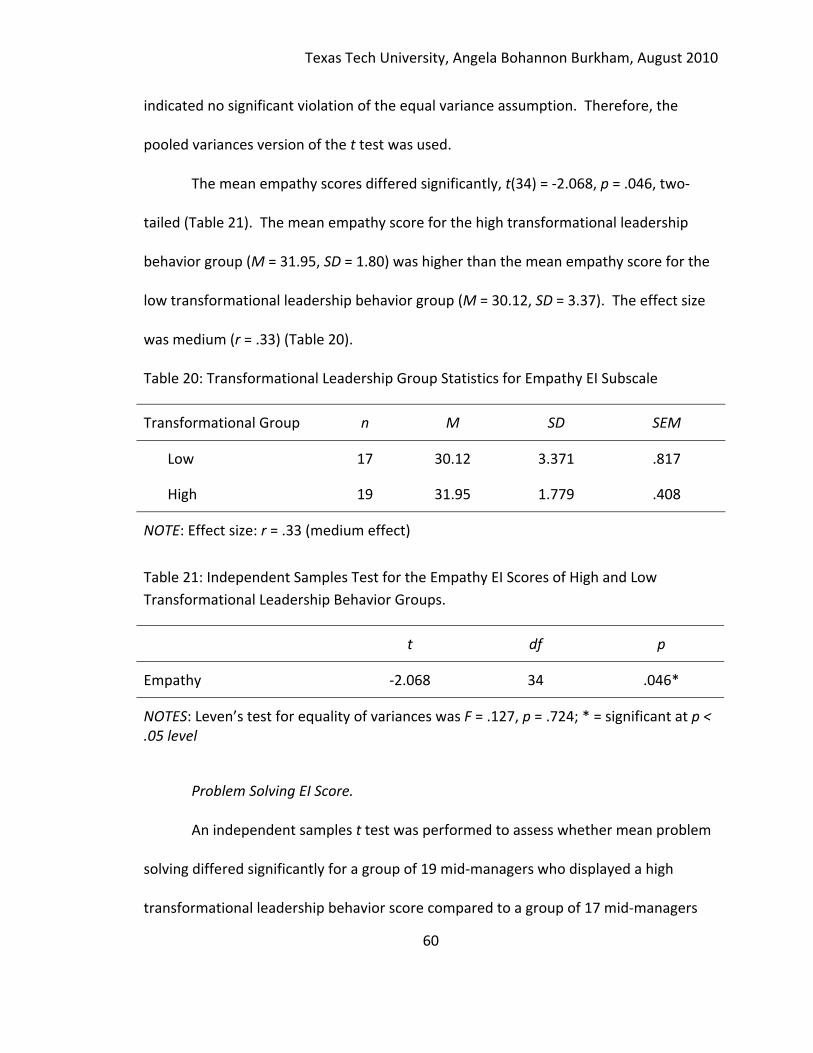
Texas Tech University, Angela Bohannon Burkham, August 2010
60
indicated no significant violation of the equal variance assumption. Therefore, the
pooled variances version of the t test was used.
The mean empathy scores differed significantly, t(34) = ‐2.068, p = .046, two‐
tailed (Table 21). The mean empathy score for the high transformational leadership
behavior group (M = 31.95, SD = 1.80) was higher than the mean empathy score for the
low transformational leadership behavior group (M = 30.12, SD = 3.37). The effect size
was medium (r = .33) (Table 20).
Table 20: Transformational Leadership Group Statistics for Empathy EI Subscale
Transformational Group n M SD SEM
Low 17 30.12 3.371 .817
High 19 31.95 1.779 .408
NOTE: Effect size: r = .33 (medium effect)
Table 21: Independent Samples Test for the Empathy EI Scores of High and Low
Transformational Leadership Behavior Groups.
t df p
Empathy ‐2.068 34 .046*
NOTES: Leven’s test for equality of variances was F = .127, p = .724; * = significant at p < .05 level
Problem Solving EI Score.
An independent samples t test was performed to assess whether mean problem
solving differed significantly for a group of 19 mid‐managers who displayed a high
transformational leadership behavior score compared to a group of 17 mid‐managers
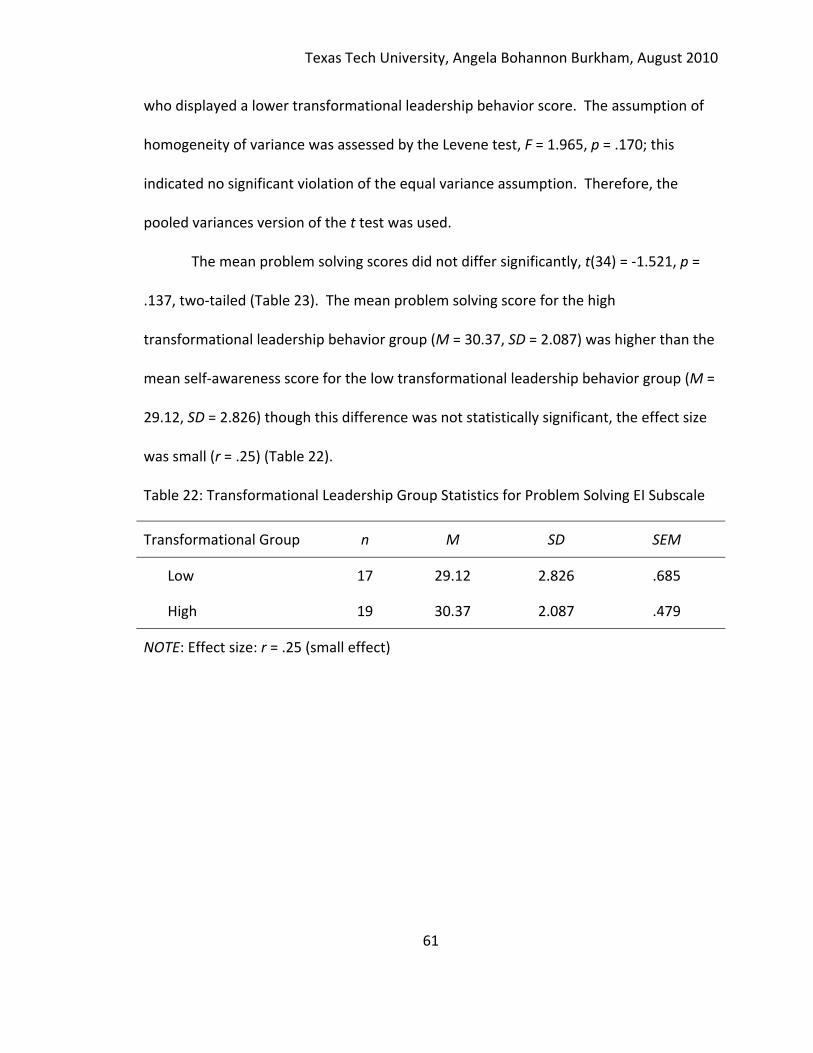
Texas Tech University, Angela Bohannon Burkham, August 2010
61
who displayed a lower transformational leadership behavior score. The assumption of
homogeneity of variance was assessed by the Levene test, F = 1.965, p = .170; this
indicated no significant violation of the equal variance assumption. Therefore, the
pooled variances version of the t test was used.
The mean problem solving scores did not differ significantly, t(34) = ‐1.521, p =
.137, two‐tailed (Table 23). The mean problem solving score for the high
transformational leadership behavior group (M = 30.37, SD = 2.087) was higher than the
mean self‐awareness score for the low transformational leadership behavior group (M =
29.12, SD = 2.826) though this difference was not statistically significant, the effect size
was small (r = .25) (Table 22).
Table 22: Transformational Leadership Group Statistics for Problem Solving EI Subscale
Transformational Group n M SD SEM
Low 17 29.12 2.826 .685
High 19 30.37 2.087 .479
NOTE: Effect size: r = .25 (small effect)
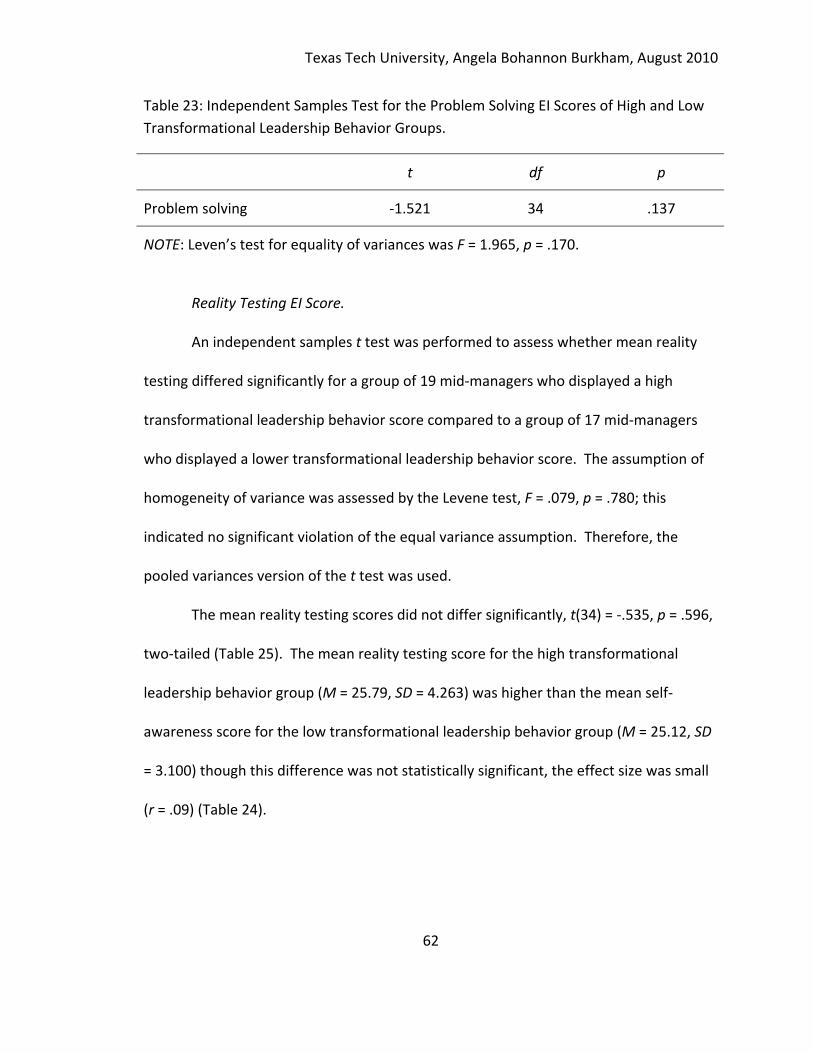
Texas Tech University, Angela Bohannon Burkham, August 2010
62
Table 23: Independent Samples Test for the Problem Solving EI Scores of High and Low
Transformational Leadership Behavior Groups.
t df p
Problem solving ‐1.521 34 .137
NOTE: Leven’s test for equality of variances was F = 1.965, p = .170.
Reality Testing EI Score.
An independent samples t test was performed to assess whether mean reality
testing differed significantly for a group of 19 mid‐managers who displayed a high
transformational leadership behavior score compared to a group of 17 mid‐managers
who displayed a lower transformational leadership behavior score. The assumption of
homogeneity of variance was assessed by the Levene test, F = .079, p = .780; this
indicated no significant violation of the equal variance assumption. Therefore, the
pooled variances version of the t test was used.
The mean reality testing scores did not differ significantly, t(34) = ‐.535, p = .596,
two‐tailed (Table 25). The mean reality testing score for the high transformational
leadership behavior group (M = 25.79, SD = 4.263) was higher than the mean self‐
awareness score for the low transformational leadership behavior group (M = 25.12, SD
= 3.100) though this difference was not statistically significant, the effect size was small
(r = .09) (Table 24).
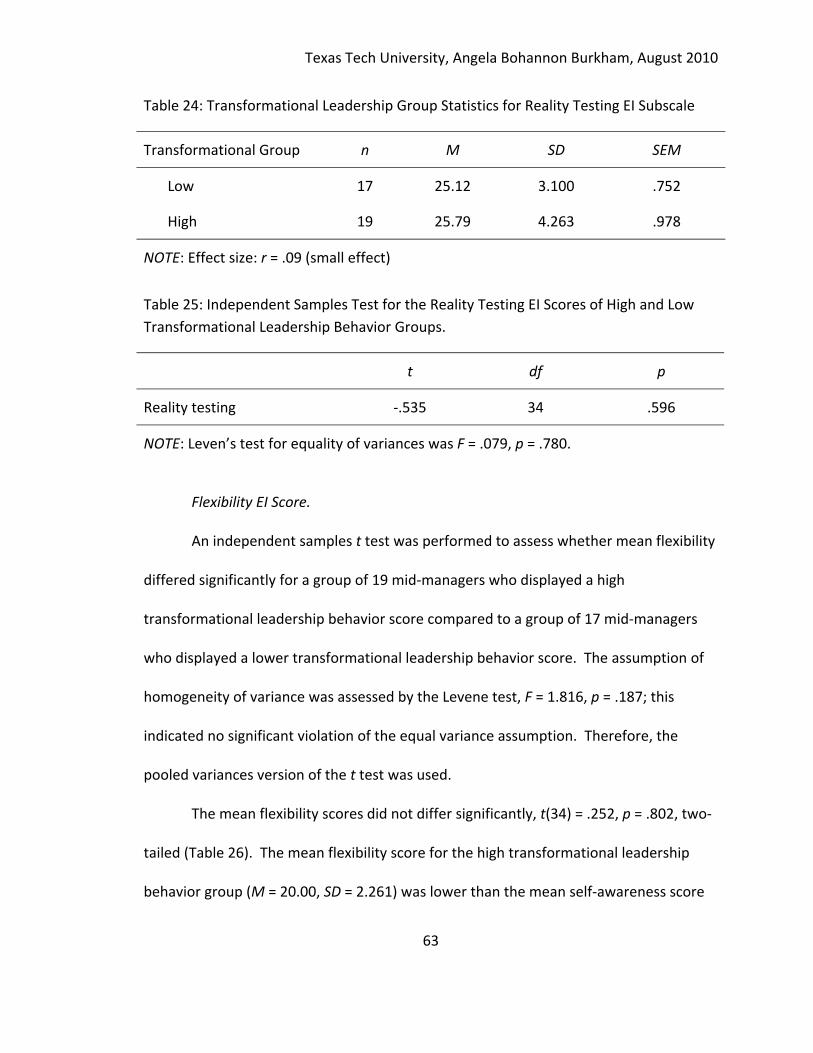
Texas Tech University, Angela Bohannon Burkham, August 2010
63
Table 24: Transformational Leadership Group Statistics for Reality Testing EI Subscale
Transformational Group n M SD SEM
Low 17 25.12 3.100 .752
High 19 25.79 4.263 .978
NOTE: Effect size: r = .09 (small effect)
Table 25: Independent Samples Test for the Reality Testing EI Scores of High and Low
Transformational Leadership Behavior Groups.
t df p
Reality testing ‐.535 34 .596
NOTE: Leven’s test for equality of variances was F = .079, p = .780.
Flexibility EI Score.
An independent samples t test was performed to assess whether mean flexibility
differed significantly for a group of 19 mid‐managers who displayed a high
transformational leadership behavior score compared to a group of 17 mid‐managers
who displayed a lower transformational leadership behavior score. The assumption of
homogeneity of variance was assessed by the Levene test, F = 1.816, p = .187; this
indicated no significant violation of the equal variance assumption. Therefore, the
pooled variances version of the t test was used.
The mean flexibility scores did not differ significantly, t(34) = .252, p = .802, two‐
tailed (Table 26). The mean flexibility score for the high transformational leadership
behavior group (M = 20.00, SD = 2.261) was lower than the mean self‐awareness score
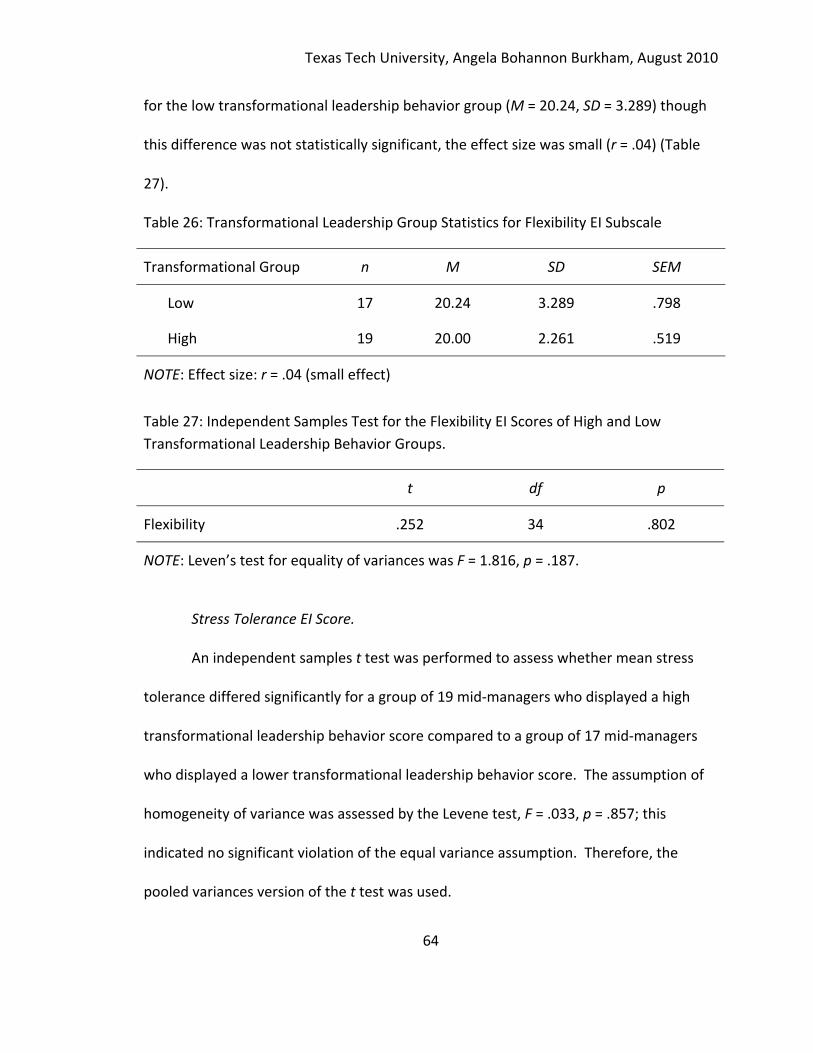
Texas Tech University, Angela Bohannon Burkham, August 2010
64
for the low transformational leadership behavior group (M = 20.24, SD = 3.289) though
this difference was not statistically significant, the effect size was small (r = .04) (Table
27).
Table 26: Transformational Leadership Group Statistics for Flexibility EI Subscale
Transformational Group n M SD SEM
Low 17 20.24 3.289 .798
High 19 20.00 2.261 .519
NOTE: Effect size: r = .04 (small effect)
Table 27: Independent Samples Test for the Flexibility EI Scores of High and Low
Transformational Leadership Behavior Groups.
t df p
Flexibility .252 34 .802
NOTE: Leven’s test for equality of variances was F = 1.816, p = .187.
Stress Tolerance EI Score.
An independent samples t test was performed to assess whether mean stress
tolerance differed significantly for a group of 19 mid‐managers who displayed a high
transformational leadership behavior score compared to a group of 17 mid‐managers
who displayed a lower transformational leadership behavior score. The assumption of
homogeneity of variance was assessed by the Levene test, F = .033, p = .857; this
indicated no significant violation of the equal variance assumption. Therefore, the
pooled variances version of the t test was used.
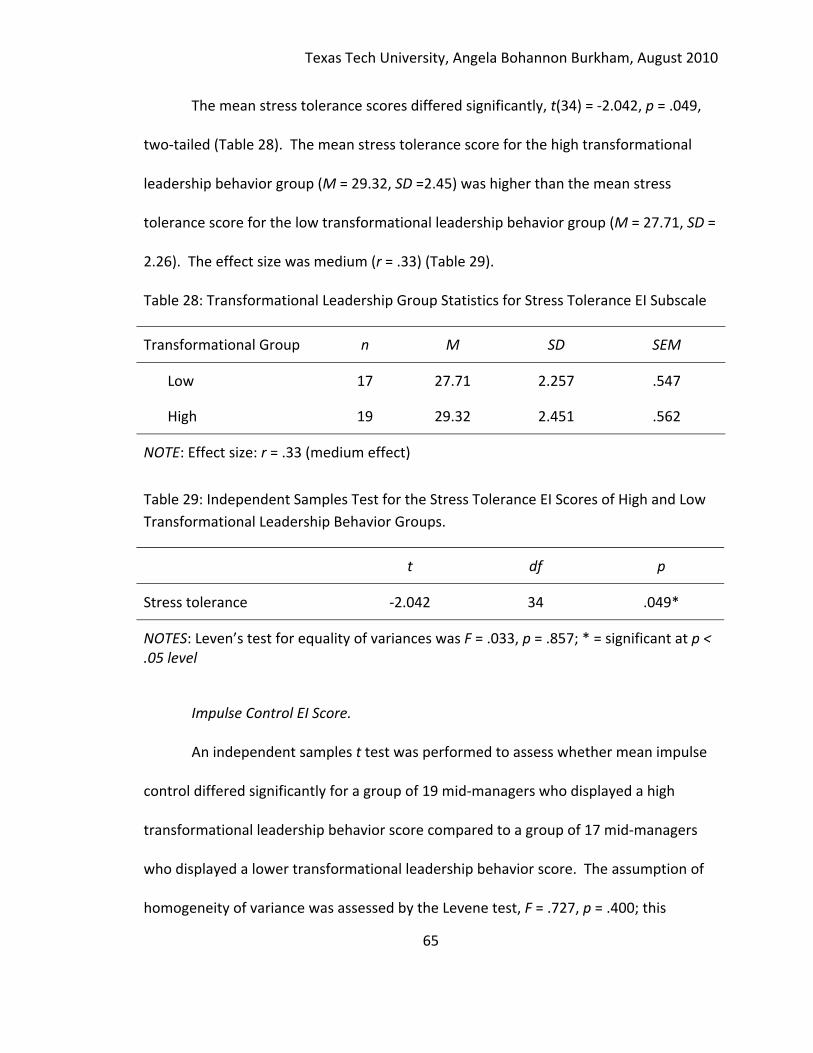
Texas Tech University, Angela Bohannon Burkham, August 2010
65
The mean stress tolerance scores differed significantly, t(34) = ‐2.042, p = .049,
two‐tailed (Table 28). The mean stress tolerance score for the high transformational
leadership behavior group (M = 29.32, SD =2.45) was higher than the mean stress
tolerance score for the low transformational leadership behavior group (M = 27.71, SD =
2.26). The effect size was medium (r = .33) (Table 29).
Table 28: Transformational Leadership Group Statistics for Stress Tolerance EI Subscale
Transformational Group n M SD SEM
Low 17 27.71 2.257 .547
High 19 29.32 2.451 .562
NOTE: Effect size: r = .33 (medium effect)
Table 29: Independent Samples Test for the Stress Tolerance EI Scores of High and Low
Transformational Leadership Behavior Groups.
t df p
Stress tolerance ‐2.042 34 .049*
NOTES: Leven’s test for equality of variances was F = .033, p = .857; * = significant at p < .05 level
Impulse Control EI Score.
An independent samples t test was performed to assess whether mean impulse
control differed significantly for a group of 19 mid‐managers who displayed a high
transformational leadership behavior score compared to a group of 17 mid‐managers
who displayed a lower transformational leadership behavior score. The assumption of
homogeneity of variance was assessed by the Levene test, F = .727, p = .400; this
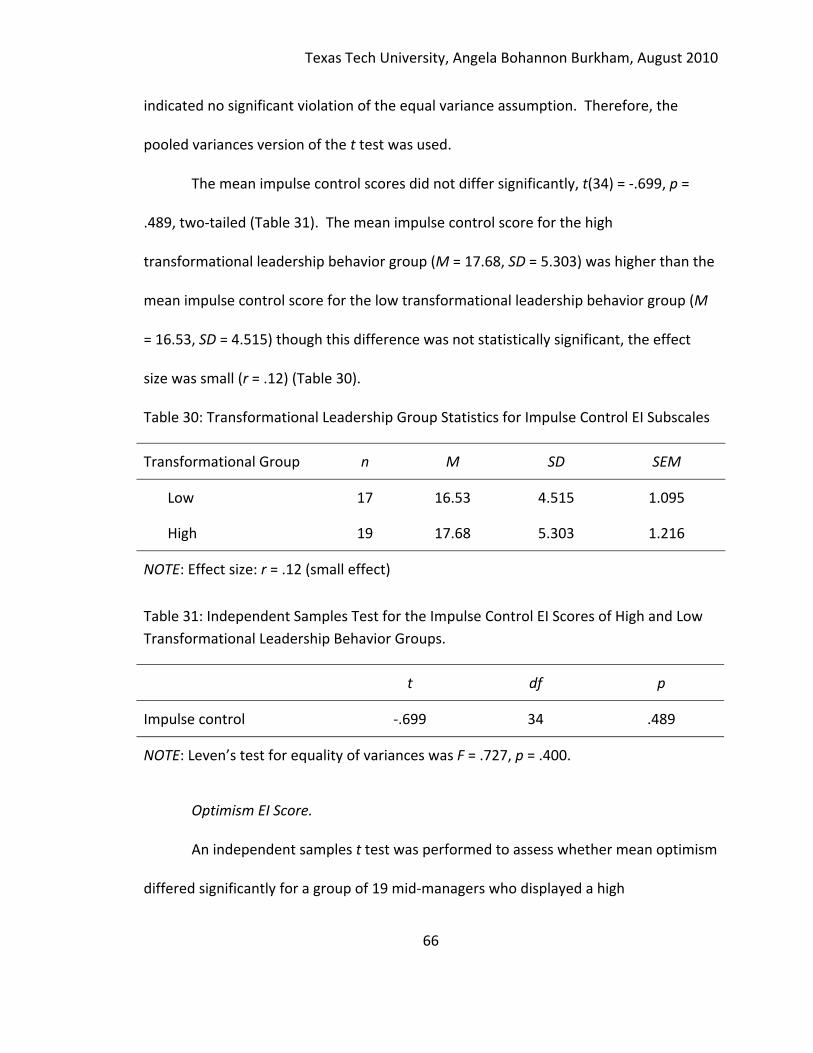
Texas Tech University, Angela Bohannon Burkham, August 2010
66
indicated no significant violation of the equal variance assumption. Therefore, the
pooled variances version of the t test was used.
The mean impulse control scores did not differ significantly, t(34) = ‐.699, p =
.489, two‐tailed (Table 31). The mean impulse control score for the high
transformational leadership behavior group (M = 17.68, SD = 5.303) was higher than the
mean impulse control score for the low transformational leadership behavior group (M
= 16.53, SD = 4.515) though this difference was not statistically significant, the effect
size was small (r = .12) (Table 30).
Table 30: Transformational Leadership Group Statistics for Impulse Control EI Subscales
Transformational Group n M SD SEM
Low 17 16.53 4.515 1.095
High 19 17.68 5.303 1.216
NOTE: Effect size: r = .12 (small effect)
Table 31: Independent Samples Test for the Impulse Control EI Scores of High and Low
Transformational Leadership Behavior Groups.
t df p
Impulse control ‐.699 34 .489
NOTE: Leven’s test for equality of variances was F = .727, p = .400.
Optimism EI Score.
An independent samples t test was performed to assess whether mean optimism
differed significantly for a group of 19 mid‐managers who displayed a high
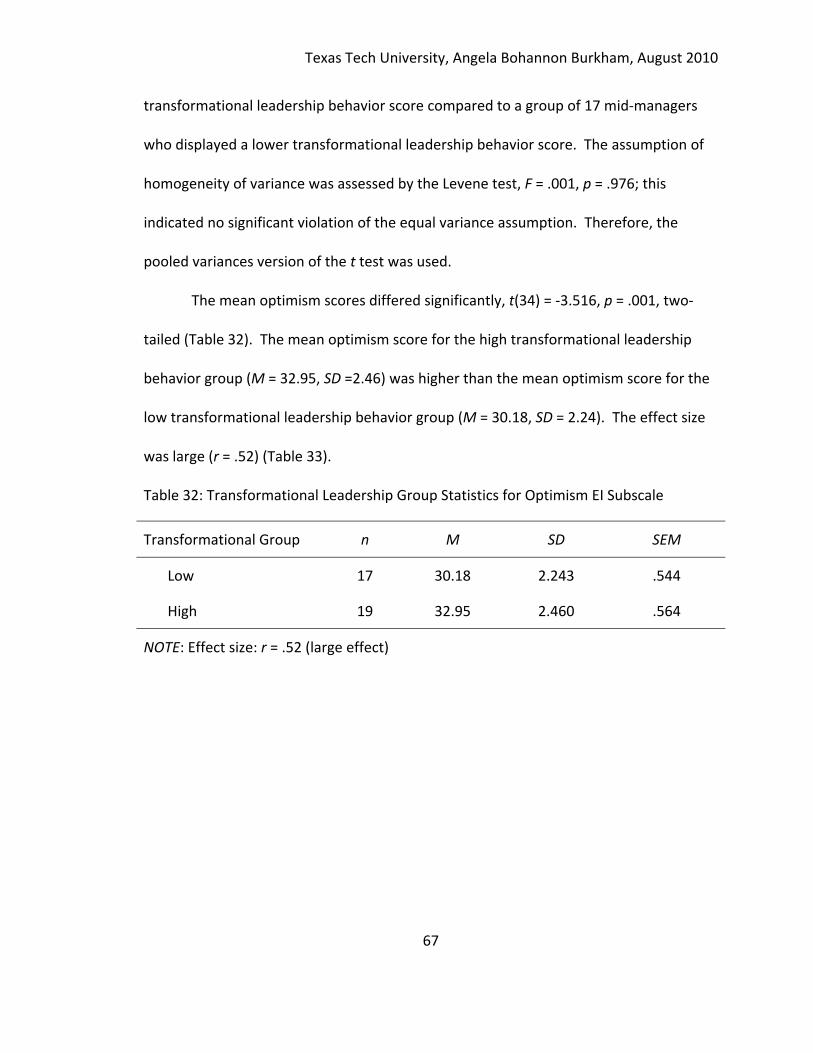
Texas Tech University, Angela Bohannon Burkham, August 2010
67
transformational leadership behavior score compared to a group of 17 mid‐managers
who displayed a lower transformational leadership behavior score. The assumption of
homogeneity of variance was assessed by the Levene test, F = .001, p = .976; this
indicated no significant violation of the equal variance assumption. Therefore, the
pooled variances version of the t test was used.
The mean optimism scores differed significantly, t(34) = ‐3.516, p = .001, two‐
tailed (Table 32). The mean optimism score for the high transformational leadership
behavior group (M = 32.95, SD =2.46) was higher than the mean optimism score for the
low transformational leadership behavior group (M = 30.18, SD = 2.24). The effect size
was large (r = .52) (Table 33).
Table 32: Transformational Leadership Group Statistics for Optimism EI Subscale
Transformational Group n M SD SEM
Low 17 30.18 2.243 .544
High 19 32.95 2.460 .564
NOTE: Effect size: r = .52 (large effect)
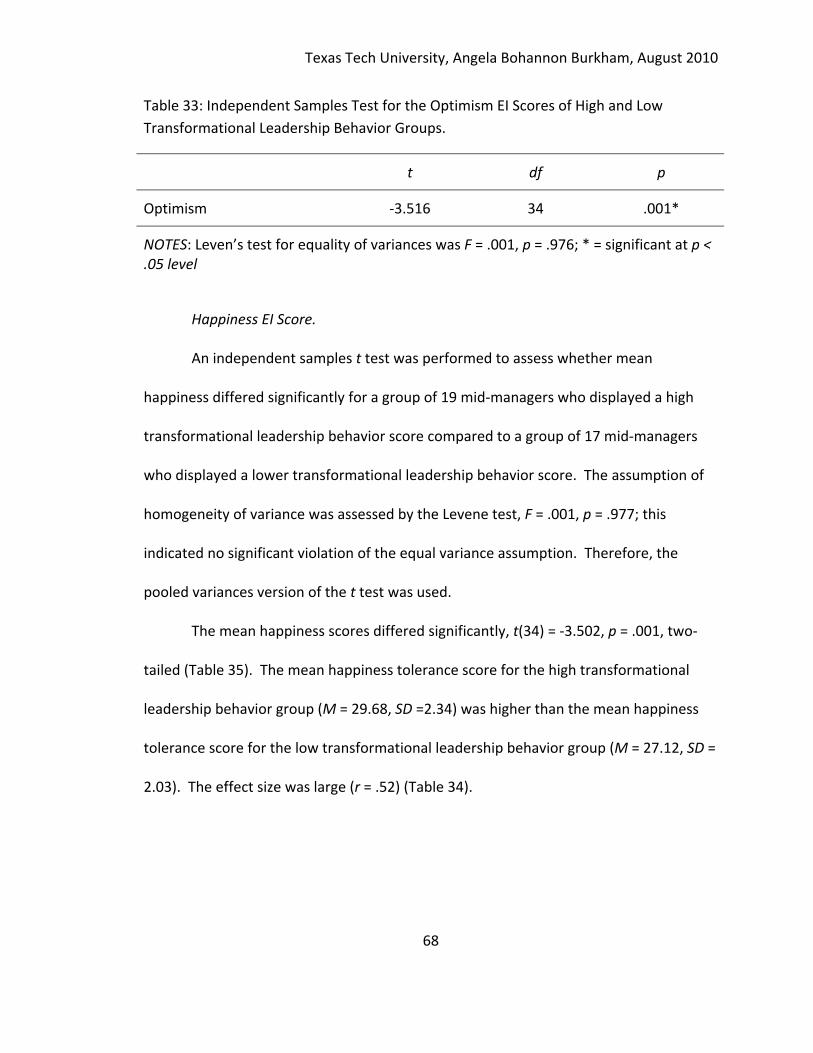
Texas Tech University, Angela Bohannon Burkham, August 2010
68
Table 33: Independent Samples Test for the Optimism EI Scores of High and Low
Transformational Leadership Behavior Groups.
t df p
Optimism ‐3.516 34 .001*
NOTES: Leven’s test for equality of variances was F = .001, p = .976; * = significant at p < .05 level
Happiness EI Score.
An independent samples t test was performed to assess whether mean
happiness differed significantly for a group of 19 mid‐managers who displayed a high
transformational leadership behavior score compared to a group of 17 mid‐managers
who displayed a lower transformational leadership behavior score. The assumption of
homogeneity of variance was assessed by the Levene test, F = .001, p = .977; this
indicated no significant violation of the equal variance assumption. Therefore, the
pooled variances version of the t test was used.
The mean happiness scores differed significantly, t(34) = ‐3.502, p = .001, two‐
tailed (Table 35). The mean happiness tolerance score for the high transformational
leadership behavior group (M = 29.68, SD =2.34) was higher than the mean happiness
tolerance score for the low transformational leadership behavior group (M = 27.12, SD =
2.03). The effect size was large (r = .52) (Table 34).
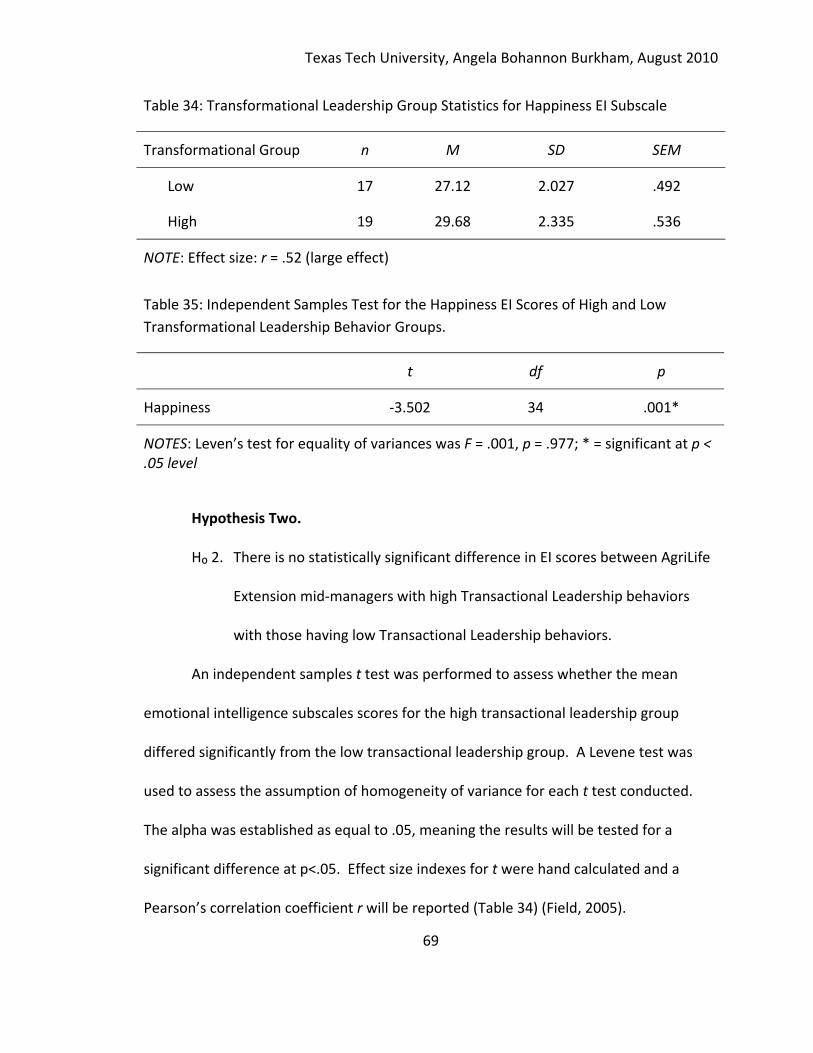
Texas Tech University, Angela Bohannon Burkham, August 2010
69
Table 34: Transformational Leadership Group Statistics for Happiness EI Subscale
Transformational Group n M SD SEM
Low 17 27.12 2.027 .492
High 19 29.68 2.335 .536
NOTE: Effect size: r = .52 (large effect)
Table 35: Independent Samples Test for the Happiness EI Scores of High and Low
Transformational Leadership Behavior Groups.
t df p
Happiness ‐3.502 34 .001*
NOTES: Leven’s test for equality of variances was F = .001, p = .977; * = significant at p < .05 level
Hypothesis Two.
H₀ 2. There is no statistically significant difference in EI scores between AgriLife
Extension mid‐managers with high Transactional Leadership behaviors
with those having low Transactional Leadership behaviors.
An independent samples t test was performed to assess whether the mean
emotional intelligence subscales scores for the high transactional leadership group
differed significantly from the low transactional leadership group. A Levene test was
used to assess the assumption of homogeneity of variance for each t test conducted.
The alpha was established as equal to .05, meaning the results will be tested for a
significant difference at p<.05. Effect size indexes for t were hand calculated and a
Pearson’s correlation coefficient r will be reported (Table 34) (Field, 2005).
Texas Tech University, Angela Bohannon Burkham, August 2010
70
Low positive relationships are noted for all of the Emotional Quotient categories
compared to transactional leadership styles of Texas AgriLife Extension mid‐managers.
However, social responsibility revealed a statistically significant (p<.05), moderate,
positive relationship and empathy was not statistically significant (p<.05) but showed a
moderate positive relationship. Therefore these data do support rejecting the null
hypothesis that states, there is no statistically significant difference in EI scores between
AgriLife Extension mid‐managers with high Transactional Leadership behaviors with
those having low Transactional Leadership behaviors.
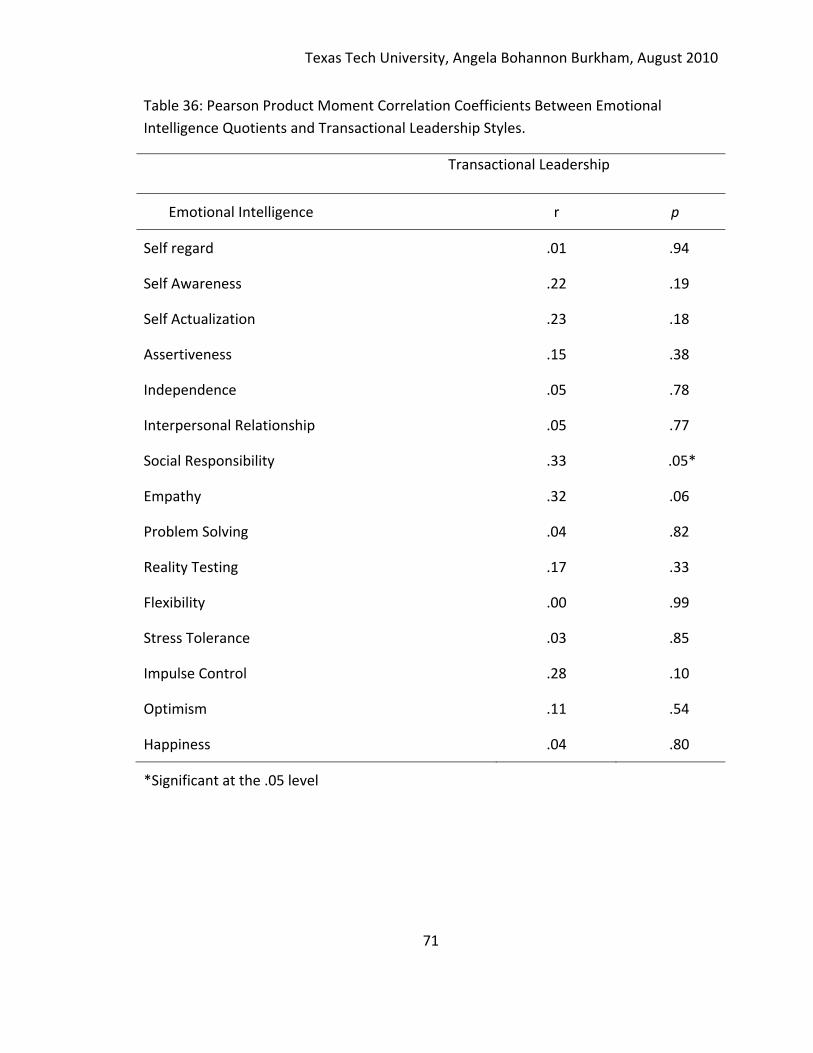
Texas Tech University, Angela Bohannon Burkham, August 2010
71
Table 36: Pearson Product Moment Correlation Coefficients Between Emotional
Intelligence Quotients and Transactional Leadership Styles.
Transactional Leadership
Emotional Intelligence r p
Self regard .01 .94
Self Awareness .22 .19
Self Actualization .23 .18
Assertiveness .15 .38
Independence .05 .78
Interpersonal Relationship .05 .77
Social Responsibility .33 .05*
Empathy .32 .06
Problem Solving .04 .82
Reality Testing .17 .33
Flexibility .00 .99
Stress Tolerance .03 .85
Impulse Control .28 .10
Optimism .11 .54
Happiness .04 .80
*Significant at the .05 level
Texas Tech University, Angela Bohannon Burkham, August 2010
72
Chapter V
Discussion
This chapter is intended to summarize the study with discussion regarding
through the dialogue of conclusions, limitations and recommendations for future
studies. Recommendations will be summarized for research focusing on the
relationship of emotional intelligence and transformational leadership styles. This study
has found some relationship among transformational and transactional leadership and
certain emotional intelligence constructs. The findings from this study utilizing the
BarOn EQ‐I and Bass’ MLQ indicate a prosperous area for further research.
Summary of Respondent Demographics
The respondents were represented by a majority of female mid‐managers (n =
28, 67%) with the mode for age being 51‐60 years of age (n = 21, 50%) followed closely
by 41‐50 year olds (n = 16, 38%). Participants held their current positions from one to
over thirty years, with the majority (n = 25; 60%) being in their current role for just one
to five years. Although tenure in the current position was relatively short, the data
showed a longer tenure of time with Extension with completing 16‐20 years of service (n
= 6; 14%) or 21‐25 years of Extension service (n = 14; 33%).
Mid‐managers were asked two open ended questions one related to leadership
traits needed by a leader and the other was based on the challenges they identified
Texas Tech University, Angela Bohannon Burkham, August 2010
73
facing Texas AgriLife Extension. The leadership traits coded and grouped by theme with
the results encompassing visionary leadership, management of staff and teams,
customer‐center skills, and self‐management skills. The biggest leadership challenge
identified was economic security related to shrinking state and federal budgets and lack
of funding.
EI Profile
Descriptive data outlined the mean score in EI for the mid‐managers. These
particular mid‐managers had strengthens in the areas of interpersonal with mean scores
including interpersonal relations (37.78), social responsibility (35.92), and empathy
(31.08), and stress tolerance (28.56). Their intrapersonal strength was in the area of self
regard (29.97). Lastly, in the general mood component they scored highest in the area
of optimism (31.64) and happiness (31.64).
Implications
In this study, an increased level of emotional intelligence is linked to the higher
use of transformational leadership behaviors in AgriLife Extension mid‐managers. The
findings from this study indicate that leaders can develop and strengthen emotional
intelligence and in doing so, can more likely exhibit the use of transformational
leadership behaviors. As a result, if leaders are trained in EI and those skills are
fostered, they will be more likely to utilize transformational leadership, further resulting
in organizational effectiveness and follower satisfaction.
Texas Tech University, Angela Bohannon Burkham, August 2010
74
A review of the BarOn EQ‐I definitions of traits will help outline the mid‐
managers profile and strengths. The EQ‐I handbook details the seven crucial
characteristics to a mid‐manager’s profile in the following way:
General Mood EQ
Optimism suggests individuals who are able to look at the brighter side of life and
maintain a positive attitude, even in the face of adversity. Optimistic people approach
life with hope and keep their expectations balanced for the future. This trait also plays
an important role in self actualization, problem solving, and stress tolerance (BarOn,
2006).
Happiness is shown by individuals who are able to feel satisfied with their lives,
genuinely enjoy the company of others, and have the ability to derive pleasure from life.
These individuals often feel at ease both at leisure and work and are able to “let their
hair down.” Happiness is a by‐product of one’s “overall degree of emotional intelligence
and emotional functioning” (BarOn, 2006).
Interpersonal EQ
Empathy is exhibited by people who are aware of and can appreciate the feelings
of others. Typically they can “emotionally read” other people. They are the type of
people that care about others and exhibit interest and concern for others. Members of
this group have an understanding of others, show consideration and give proper regard
to others (BarOn, 2006).
Texas Tech University, Angela Bohannon Burkham, August 2010
75
Interpersonal relationships are held by people able to establish and maintain
mutually satisfying relationships generally obtain high scores on this subscale. These
individuals show a desire to foster intimacy and give and receive affection. The strength
with this trait is effective communication and to positively exchange feelings, ideas and
information (BarOn, 2006).
Intrapersonal EQ
Self regard respondents have good feelings about themselves and tend to accept
and respect others. They have a good sense of who they are and a positive sense of self
identity (BarOn, 2006).
Stress Management EQ
Stress tolerance is shown by individuals who are able to withstand adverse
events and stress situations, without “falling apart.” Typically they are able to withstand
difficult situations without being overwhelmed. A higher level of stress tolerance
creates a lower level of anxiety in these individuals.
The findings of the study found a relationship with statistical significance among
those who scored high on the transformational leadership score and the above six EI
components. These self‐identified emotional intelligence quotients were found to
positively influence mid‐manager’s self‐identified transformational leadership styles.
The null hypothesis that there is no statistically significant difference in EI scores
between AgriLife Extension mid‐managers with high Transformational Leadership
behaviors with those having low Transformational Leadership behaviors was rejected.
Texas Tech University, Angela Bohannon Burkham, August 2010
76
The findings of the study revealed a relationship with statistical significance
among those who scored high on the transactional leadership score and the EI
component of social responsibility. This self‐identified emotional intelligence quotient
was found to positively influence the mid‐manager’s self‐identified transactional
leadership styles.
Social responsibility identifies people who are cooperative, contributing and
constructive members of their social groups. These individuals have a “social
consciousness” and concern for others. Socially responsible people typically have
positive feelings towards a social group and can identify with that group.
The null hypothesis that there is no statistically significant difference in EI scores
between AgriLife Extension mid‐managers with high Transactional Leadership behaviors
with those having low Transactional Leadership behaviors is rejected.
The results of this study support the findings of other researchers in the field of
emotional intelligence and transformational leadership behaviors. Cherniss (2000)
found a relationship between empathy and interpersonal relationships. This study as
did Bass (1990) found a direct relationship between self regard and stress tolerance
abilities and exhibiting positive leadership traits. Barbuto and Burbach (2006) found a
positive statistical relationship in empathetic response with each of the subscales of
transformational leadership. These findings are consistent with past studies that show a
positive significant relationship between transformational leadership and emotional
intelligence (Barling et al, 2000; Gardner & Stough, 2002; Barbuto & Burbach, 2006).
Texas Tech University, Angela Bohannon Burkham, August 2010
77
The study found that more emotional intelligence quotients were related to
transformational leadership styles than transactional leadership styles as self‐
determined by the participants. Participants reported engaging in both transactional
and transformational leadership styles. Transformational leadership literature says that
it is expected that individuals would engage in both. Participants in this study used
transformational leadership more often which augments the effects of transactional
leadership, a major premise to transformational leadership.
Study Limitations
The study has a few limitations that should be clearly stated. Some of the
limitations may be addressed in future studies with the adaption of the research design.
The limitation outlined will be in the area of the sample and response rate. This is in
addition to the limitations already detailed in Chapter 1.
In relation to the sample of the study, the researcher cannot assume that the 36
complete respondents were representative of the population. There is also not an
assumption for those who didn’t respond to the research study. Another limitation falls
in the self‐selection of those mid‐managers that participated in the study.
Recommendations for Practice
Respondents of the study showed higher scores in two subscales of
interpersonal relationships including empathy and interpersonal relationships. A strong
ability in interpersonal skills is needed for individuals in management and leadership
roles. The second strongest emotional quotient was in the general mood scale.

Texas Tech University, Angela Bohannon Burkham, August 2010
78
Respondents identified a stronger ability in optimism and happiness. These qualities are
instrumental in interacting with others and assist the person in creating an uplifting and
positive atmosphere in the workplace. This study did not find significant ability
identified in the adaptability scale. This was not identified as a future training need as
the respondents possessed an average potential ability in this scale and type of mid‐
management position held by respondents does not lend itself to the need for a high
level of adaptability. People typically achieving a higher level of adaptability are
engaged in research and development and technical support areas.
The most immediate implication of these results would be to implement training
of current mid‐managers in the areas of interpersonal, intrapersonal and general mood.
These three scales relate most closely to the job descriptions for a Texas AgriLife
Extension Service mid‐manager. A number of organizations seek to improve
performance often focusing on weaknesses. Gallup (2010) says organizations should
focus on employee strengths and develop those attributes. Research indicates that
people who are not operating from their strengths dread going to work, have more
negative interactions with co‐workers, achieve less on a daily basis and have fewer
creative and positive moments.
Recommendations for Future Study
The research topic of emotional intelligence and transformational leadership
affords itself many potential areas of study. Replicating the study with Extension is a
simple first step to testing and validating the current findings. Additional factors to
Texas Tech University, Angela Bohannon Burkham, August 2010
79
consider in subsequent research that could provide greater understanding would
include the user rater feedback or observation used in conjunction with the self rated,
an organizational assessment method, and the testing of training and its relationship to
job and life satisfaction. The MLQ also offers a colleague assessment instrument that
could be completed by four to six co‐workers. Additionally, an ability‐based test could
be used to further assess the EI quotients.
In regards to the broader leadership knowledge base, the study could be
replicated with other populations. Replication may prove more valuable and could
facilitate generalizing the findings to a broader group. More studies of EI and leadership
with multiple sources of data would further strengthen and confirm any relationships.
There may also be value in expanding future investigations to include other variables
such as cultural background, leadership coursework and training completed, and the
type of work setting.
Summary
This study has demonstrated a relationship between emotional intelligence and
transformational leadership. Leaders with higher emotional intelligence are more likely
to exhibit transformational leadership behaviors. Those with lower EI scores are less
likely to exhibit transformational traits but more likely to exhibit transactional
leadership behaviors. In this study six emotional intelligence quotients were found to
be significantly relational to transformational leadership behavior. Those included self
regard, interpersonal relationships, empathy, stress tolerance, optimism and happiness.
Texas Tech University, Angela Bohannon Burkham, August 2010
80
The findings from this study indicate that leaders can develop and strengthen
emotional intelligence and in doing so can more likely exhibit the use of
transformational leadership behaviors. As a result if leaders are trained in EI and those
skills are fostered, they will be more likely to utilize transformational leadership further
resulting in organizational effectiveness and follower satisfaction. The relationship of EI
and transformational leadership has been shown, but what remains is how to foster and
train for this skill development and witness the application of such knowledge.
Texas Tech University, Angela Bohannon Burkham, August 2010
81
Bibliography
Albrow, M. (1992). Sine ira et studio – or do organizations have feelings? Organization
Studies, 13, 313‐329.
Ary, D., Jacobs, L. C. & Razavieh, A. (1996). Introduction to research in education (5th
ed.). Fort Worth, TX: Harcourt Brace College Publishers.
Atwater, L. E. & Yammarino, F .J. (1993). Personal attributes as predictors of superiors’
and subordinates’ perceptions of military leadership. Human Relations, 46, 645‐
658.
Averill, J. R. (2004). A tale of two sharks: Emotional intelligence and emotional creativity
compared. Psychological Inquiry, 15(3), 228‐233.
Avolio, B. J. (1999). Full leadership development: Building the vital forces in
organizations. Thousand Oaks, CA: Sage.
Avolio, B. J. & Bass, B. M. (1988). Transformational leadership, charisma and beyond. In
J.F. Hunt, B. R. Baloga, H. P. Dachler, & C. Schriesheim (Eds.), Emerging
leadership vistas (pp. 29‐50). Elmsford, NY: Pergamon Press.
Avolio, B. J. & Bass, B. M (2004). Multifactor leadership questionnaire manual and
sampler set. Mind Garden, Inc., www.mindgarden.com.
Texas Tech University, Angela Bohannon Burkham, August 2010
82
Barbuto, J. E. & Burbach, M. E. (2006). The emotional intelligence of transformational
leaders: A field study of elected officials. The Journal of Social Psychology,
146(1), 51‐64.
Barling, J., Slater, F. & Kelloway, E. K . (2000). Transformational leadership and
emotional intelligence: An exploratory study. Leadership & Organization
Development Journal, 21(3), 157‐161.
Barnett, R. (2004). Willing to learn in higher education. AISHE Inaugural Conference,
Dublin, Ireland.
Bar‐On, R. (2002). Bar‐On Emotional Quotient Inventory: Technical manual. Toronto, ON:
Multi‐Health Systems Inc.
Bar‐On, R. (1997, August). Development of the Bar‐On EQ‐i: A measurement of
emotional and social intelligence. Paper presented at the 105th annual
convention of the American Psychological Association, Chicago, IL.
Bar‐On, R. (2000). Emotional and social intelligence: Insights from the Emotional
Quotient Inventory. In R. Bar‐On & J. D. A. Parker (Eds.), The Handbook of
Emotional Intelligence (pp. 363‐388). San Francisco: Jossey‐Bass.
Bass, B. M. (1985). Leadership and performance beyond expectations. New York: Free
Press.
Texas Tech University, Angela Bohannon Burkham, August 2010
83
Bass, B. M. (1988). Evolving perspectives on charismatic leadership. In J. A. Conger & R.
N. Kanungo (Eds.), Charismatic leadership: The elusive factor in organizational
effectiveness (pp. 40‐77). San Francisco: Jossey‐Bass.
Bass, B. M. (1990a). Bass & Stogdill’s Handbook of Leadership: Theory, Research &
Managerial Applications (3rd Ed.). New York: Free Press.
Bass, B.M. (1990b). From transactional to transformational leadership: Learning to share
the vision. Organizational Dynamics, 18, 19‐31.
Bass, B. M. (1998b). The ethics of transformational leadership. In J. B. Ciulla (Eds.),
Ethics, the heart of leadership. Westport, CT: Praeger.
Bass, B. M. (1999). Two decades of research and development in transformational
leadership. European Journal of Work and Organizational Psychology, 8(1), 9‐32.
Bass, B. M. & Avolio, B. J. (1990). Developing transformational leadership: 1992 and
beyond. Journal of European Industrial Training, 14, 21‐27.
Bass, B. M. & Avolio, B. J. (1993a). Transformational leadership: A response to critiques.
In M. M. Chemers & R. Ayman (Eds.), Leadership theory and research:
Perspectives and directions (pp. 49‐80). New York: Academic Press.
Bass, B. M. & Avolio, B. J. (1993b). Transformational leadership and organizational
culture. Public Administration Quarterly, 17, 112‐122.
Texas Tech University, Angela Bohannon Burkham, August 2010
84
Bass, B. M. & Avolio, B. J. (1994). Improving organizational effectiveness through
transformational leadership. Newbury Park, CA: Sage Publications.
Bass, B. M. & Avolio, B. J. (1996). The transformational and transactional leadership of
men and women. Applied Psychology: An International Review, 45, 5‐34.
Bass, B. M. & Avolio, B. J. (2000). Technical reports, leader form, rater form, and scoring
key for the MLQ Form 5x‐short. Binghamton, NY: Center for Leadership Studies,
Binghamton University.
Bass, B. M., Avolio, B. J. & Atwater, L. (1996). The transformational and transactional
leadership of men and women. Applied Psychology: An International Review,
45, 5‐34.
Bower, G. H. (1981). Mood and memory. American Psychologist, 36, 129‐148.
Bruner, J. (1960). The process of education. Cambridge: MA: Harvard University Press.
Burns, J. M. (1978). Leadership. New York: Harper and Row.
Bycio, P., Hackett, R. D. & Allen, J. S. (1995). Further assessments of Bass’
conceptualization of transactional and transformational leadership. Journal of
Applied Psychology, 80, 468‐478.
Carlisle, O. & Jordan, A. (2004). It works in practice but will it work in theory? The
theoretical underpinnings of pedagogy. AISHE Inaugural Conference, Dublin.
Texas Tech University, Angela Bohannon Burkham, August 2010
85
Cherniss, C. (2000, April). Emotional intelligence: What it is and why it matters. Annual
Meeting of the Society for Industrial and Organizational Psychology. New
Orleans, LA.
Church, A. H. (1997). Managerial self‐awareness in high‐performing individuals in
organizations. Journal of Applied Psychology, 82, 281‐292.
Cobb, D. W. (1989). Leadership effectiveness of county extension directors: A
comparison of perceptions between county extension agents and county
extension directors within the North Carolina agricultural extension service.
Unpublished doctoral dissertation, North Carolina State University, Raleigh.
Conger, J. A. & Kanungo, R. N. (1987). Toward a behavioral theory of charismatic
leadership in organizational settings. Academy of Management Review, 12, 637‐
47.
Conger, J. A. & Kanungo, R. N. (1998). Charismatic leadership in organizations.
Thousand Oaks, CA: Sage.
Cooper, R. (1997). Applying emotional intelligence in the workplace: Part 2 of a 2‐part
article. Training and Development, 51(12), 31‐38.
Cooper, R.K., & Sawaf, A. (1997). Executive EQ: Emotional intelligence in leadership and
organizations. New York: Berkeley.
Texas Tech University, Angela Bohannon Burkham, August 2010
86
Cunningham, M. R., Steinberg, J. & Grev, R. (1980). Wanting to and having to help:
Separate motivations for positive mood and guilt‐induced helping. Journal of
Personality and Social Psychology, 38, 181‐192.
Damasio, A. R. (1994). Descartes’ error. New York: G.P. Putnam’s Sons.
Doll, E. A. (1935). A genetic scale of social maturity. American Journal of
Orthopsychiatry, 5, 180‐188.
Downton, J. V. (1973). Rebel leadership: commitment and charisma in the revolutionary
process. New York: Free Press.
Eagly, A. H., Johannesen‐Schmidt, M. C. & Van Engen, M. L. (2003). Transformational,
transactional and laissez‐faire leadership styles: A meta‐analysis comparing men
and women. Psychological Bulletin, 129, 569‐591.
Eagly, A. H., Makhiijani, M.G. & Klonsky, B.G. (1992). Gender and the evaluation of
leaders: A meta‐analysis. Psychological Bulletin, 111, 3‐22.
Emmons, R. A & Colby, P. M. (1995). Emotional conflict and well‐being: Relation to
perceived availability, daily utilization and observer reports of social support.
Journal of Personality and Social Psychology, 68, 947‐959.
Epstein, S. (1990). Cognitive‐experiential self theory. In L. Pervin (Eds). Handbook of
personality theory and research. New York: Guilford Press.
Field, A. (2005). Discovering statistics using spss. London: Sage.
Texas Tech University, Angela Bohannon Burkham, August 2010
87
Fineman, S. (1993). Emotion in organizations. London: Sage.
Forgas, J. P. (1992). Affect in social judgments and decision: A multi‐process model. In
M. Zanna (Eds). Advances in experimental and social psychology, 25. San Diego,
CA: Academic Press.
Forgas, J. P. (1995). Mood and judgment: The affect infusion model. Psychological
Bulletin, 117, 39‐66.
Forgas, J. P., Bower, G. H. & Krantz, S. E. (1984). The influence of mood on perceptions
of social interactions. Journal of Experimental Social Psychology, 20, 497‐513.
Forgas, J. P., Bower, G. H. & Mohan, S. J. (1990). Praise or blame? Affective influences
on attributions for achievement. Journal of Personality and Social Psychology,
59, 809‐819.
Gardner, H. (1999a). Intelligence Reframed for the 21st Century. New York: Basic Books.
Gardner, H. (1999b). Are there additional intelligences? The case for naturalist, spiritual,
and existential intelligences. In J. Kane (Eds.), Education, information, and
transformation (pp, 111‐131). Upper Saddle River, NJ: Prentice Hall.
Gardner, W. L. & Avolio, B. J. (1998). The charismatic relationship: A dramaturgical
perspective. Academy of Management Review, 23, 32‐58.

Texas Tech University, Angela Bohannon Burkham, August 2010
88
Gardner, L., & Stough, C. (2002). Examining the relationship between leadership and
emotional intelligence in senior level managers. Leadership & Organization
Development Journal, 23, 68‐78.
George, J. M. (1991). State or trait: Effects of positive mood on pro‐social behaviors at
work. Journal of Applied Psychology, 76, 299‐307.
George, J. M. (1995). Leader’s positive mood and group performance: The case of
customer service. Journal of Applied Social Psychology, 25, 778‐794.
George, J. M. & Bettenhausen, K. (1990). Understanding pro‐social behavior, sales
performance and turnover: A group level analysis in a service context. Journal
of Applied Psychology, 75, 698‐709.
Gibbons, T.C. (1986). Revisiting: The question of born vs. made: Toward a theory of
development of transformational leaders. Doctoral dissertation, Fielding
Institute, Santa Barbara, CA.
Goleman, D. (1998). Working with emotional intelligence. London: Bloomsbury.
Goleman, D. (1995). Emotional Intelligence. New York: Bantam.
Hater, J.J., & Bass, B.M. (1988). Superior’s evaluations and subordinates’ perceptions of
transformational and transactional leadership. Journal of Applied Psychology,
73(4), 695‐702.
Texas Tech University, Angela Bohannon Burkham, August 2010
89
Higgs, M. & Aitken, P. (2003). An exploration of the relationship between emotional
intelligence and leadership potential. Journal of Managerial Psychology, 18, 814‐
823.
Holder, S. L. (1990). Leadership style and leadership behavior preferences of
cooperative extension faculty. Unpublished doctoral dissertation, New Mexico
State University, Las Cruces.
Hoover, N. R. (1987). Transformational and transactional leadership: A test of the model.
Unpublished doctoral dissertation. University of Louisville, KY.
Howell, J. M. & Avolio, B. J. (1993). Transformational leadership, transactional
leadership, locus of control, and support for innovation: Key predictors of
consolidated business‐unit performance. Journal of Applied Psychology, 78, 891‐
902.
Hyland, A. (2000). Multiple intelligences: Curriculum assessment project. Cork: UCC. Final
Report.
Isen, A. M & Baron, R. A. (1991). Positive affect as a factor in organizational behavior. In
B. M. Staw and L. L. Cummings (Eds), Research in organizational behavior (p. 1‐
54), Greenwich, CT: JAI press.
Isan, A. M. & Daubman, K. A. (1984). The influence of affect on categorization. Journal
of Personality and Social Psychology, 47, 1206‐1217.
Texas Tech University, Angela Bohannon Burkham, August 2010
90
Isen, A. M., Clark, M & Schwartz, M. F. (1976). Duration of the effect of good mood on
helping: ‘Footprints on the sands of time.’ Journal of Personality and Social
Psychology, 34, 385‐393.
Isen, A. M, Johnson, M. S., Mertz, E. & Robinson, G. F. (1985). The influence of positive
effect on the unusualness of word associations. Journal of Personality and Social
Psychology, 48, 1413‐1426.
Jones, G. R. & George, J. M. (1998). The experience and evolution of trust: Implications
for cooperation and teamwork. Academy of Management Review, 23, 531‐546.
Kanter, R. M. (1983). The change masters. New York: Simon and Schuster.
Katz, I. M & Campbell, J. D. (1994). Ambivalence over emotional expression and well
being: Nomothetic and idiographic tests of the stress‐buffering hypothesis.
Journal of Personality and Social Psychology, 67, 513‐524.
King, L. A. & Emmons, R. A. (1990). Conflict over emotion expression: Psychological
and physical correlates. Journal of Personality and Social Psychology, 58, 864‐
877.
King, L. A. & Emmons, R. A. (1991). Psychological, physical, and interpersonal correlates
of emotional expressiveness, conflict and control. European Journal of
Personality, 5 131‐150.
Texas Tech University, Angela Bohannon Burkham, August 2010
91
Keller, R. T. (1995). Transformational leaders make a difference. Journal of Research &
Technology Management, 38, 41‐44.
Lajoie, D. (2002, Autumn). The emotional intelligence explosion. Moving Business
Forward. Retrieved from http://www.guelphchamber.com.
Leban, W. & Zulauf, C. (2004). Linking Emotional Intelligence Abilities and
Transformational Leadership Styles. The Leadership & Organization Development
Journal, 25(7), 554‐564.
Linder, J. R., Murphy, T. H. & Briers, G. E. (2001). Handling non response in social
science research. Journal of Agricultural Education, 42(4), 43‐53.
Lowe, K. B., Kroek, G. & Sivasubramaniam, N. (1996). Effectiveness correlates of
transformational and transactional leadership: A meta‐analytic review.
Leadership Quarterly, 1, 385‐426.
Lowery, C. M (1996). Leadership behaviors and job performance of county extension
directors in the North Carolina cooperative extension service. Unpublished
doctoral dissertation, North Carolina State University, Raleigh.
Mandell,B. & Pherwani, S. (2003). Relationship between emotional leadership style: A
gender comparison. Journal of Business and Psychology, 17, 387‐404.
Martinez, B., Beesley, A., Doerfert, D. L. & Akers, C. L. (2004). The need for the inclusion
of emotional intelligence in the agricultural education curriculum: literature
Texas Tech University, Angela Bohannon Burkham, August 2010
92
review. Research Proceedings of the 31st National Agricultural Education
Research Conference, St. Louis, MO.
Matthews, G., Emo, A. K., Roberts, R. D., & Zeidner, M. (2006). What is this thing called
emotional intelligence. In K. R. Murphy (Eds.), A critique of emotional
intelligence: What are the problems and how can they be fixed? (pp. 3‐36).
Mahwah, NJ: Lawrence Erlbaum.
Mayer J.D. & Salovey, P. (1993). The intelligence of emotional intelligence. Intelligence,
17, 422‐442.
Mayer, J. D. & Salovey, P. (1997). What is emotional intelligence?: In P. Salovey & D.
Sluyter (Eds.), Emotional development and emotional intelligence: Educational
implications (pp. 3‐31). New York: Basic Books.
Mayer, J.D., Salovey, P., Gomberg‐Kaufman, S. & Blainey, K. (1991). A broader
conception of mood experience. Journal of Personality and Social Psychology,
60, 100‐111.
McCall‐Kennedy, J. R. & Anderson, R. D. (2002). Impact of Leadership Style and
Emotions on Subordinate Performance. The Leadership Quarterly, 13(5), 545‐
559.
McClelland, D. C. (1973). Testing for competence rather than intelligence. American
Psychologist, 28(1), 1‐14.
Texas Tech University, Angela Bohannon Burkham, August 2010
93
Meindl, J. R. (1990). On leadership: An alternative to the conventional wisdom. In B.M.
Staw and L.L. Cummings (Eds.). Research in Organizational Behavior (p.159‐203).
Greenwich, CT: JAI Press.
Meredith, C. L. (2007). The relationship of emotional intelligence and transformational
leadership behavior in non‐profit executive leaders. Unpublished doctoral
dissertation, Capella University Minnesota.
Mintzberg, H. (1973). The nature of managerial work. New York: Harper & Row.
Moore, M. & Jones, J. (2001). Cracking the concrete ceiling: Inquiry into the aspirations,
values, motives, and actions of African American female 1890 cooperative
extension administrators. Journal of Extension, 39(6), Retrieved January 29,
2010 from http://www.joe.org/joe/2001december/rb1.html.
Moore, L. L. & Rudd, R. D. (2006). Leadership styles of current extension leaders.
Journal of Agricultural Education, 47(1).
Morris, W. N. (1989). The frame of mind. New York: Springer‐Verlag.
Murray, F. (1988). A study of transformational leadership and organizational
effectiveness in selected small college settings. Doctoral dissertation. Kent State
University, Kent. OH.
Texas Tech University, Angela Bohannon Burkham, August 2010
94
Owen, M. K. (1987). The relationship of clergy and leadership characteristics to growing
or declining churches. Doctoral dissertation. University of Louisville, Louisville,
KY.
Petrides, K. V. (2004). Estimates of emotional and psychometric intelligence: Evidence
for gender‐based stereotypes. The Journal of Social Psychology, 144, 149‐163.
Pool, C.R. (1997, May). Up with emotional health. Educational Leadership, 54, 12‐14.
Rosenhahn, D. L., Salovey, P. & Hargis, K. (1981). The joys of helping: Focus of attention
mediates the impact of positive effect on altruism. Journal of Personality and
Social Psychology, 40, 899‐905.
Ross, S. M. & Offerman, L. R. (1997). Transformational leaders: Measurement of
personality attributes and work group performance. Unpublished manuscript.
Salovey, P., Brackett, M. & Mayer, J.D. (2004). Emotional intelligence: Key readings on
the Mayer and Salovey model. Port Chester, New York: Basic Books.
Salovey, P., Hsee, C. K. & Mayer, J. D. (1993). Emotional intelligence and the self
regulation of affect. In D. M. Wegner and J.W. Pennebaker (Eds.) Handbook of
mental control (p.258‐277). Englewood Cliffs, NJ: Prentice Hall.
Salovey, P. & Mayer, J.D. (1993). The intelligence of emotional intelligence. Intelligence,
17, 422‐433.
Texas Tech University, Angela Bohannon Burkham, August 2010
95
Schutte, N. S., Malouf, J. M., Hall, L. E., Haggarty, D. J., Cooper, J. T. & Golden, C. J.,
(1998). Development and validation of a measure of emotional intelligence.
Personality & Individual Differences, 25(2), 167‐177.
Shipper, F. & Dillard, J. E. (1994, August). Comparing the managerial skills of early
derailers vs. fast trackers, late derailers vs. long‐term fast trackers, and mid‐
career derailers vs. “recoverers.” Paper presented at the meeting of the Academy
of Management, Dallas, TX.
Simon, H. A. (1982). Comments. In M. S. Clark and S. T. Fiske (Eds). Affect and
cognition (p.333‐342). Hillsdale, NJ: Erlbaum.
Sinasky, M. E. & Bruce, J. A. (2006). Supervisors’ and 4‐H and youth development
educators’ perceptions of the leadership practices employed by educators.
Journal of Extension, 44(3), Retrieved January 15, 2010 from
http://www.joe.org/joe/2006June/rb1.html.
Sinclair, R. C. (1988). Mood, categorization breadth, and performance appraisal:
The effects of order of information acquisition and affective state on halo,
accuracy, information retrieval, and evaluations. Organizational behavior and
human decision processes, 42, 22‐46
Sinclair R.C. & Mark, M. M. (1992). The influence of mood stat on judgment and action:
Effects on persuasion, categorization, social justice, person perceptions and
Texas Tech University, Angela Bohannon Burkham, August 2010
96
judgmental accuracy. In L. L. Martin and A Tesser (Eds). The construction of
social judgments.
Sosik, J. J. & Megerian, L. E. (1999). Understanding leader emotional intelligence and
performance: The role of self‐other agreement on transformational leadership
perceptions. Group and Organization Management, 24, 367‐90.
Stein, S. J., & Book, H.E. (2001). The EQ edge. Toronto, Canada: Stoddart Publishing Co.
Limited.
Texas AgriLife Extension Service Strategic Plan. (2009) College Station, Texas.
Retrieved on December 31, 2009
http://agrilifeextension.tamu.edu/about/strategyimpact/strategicplan/index.
Thorndike, E. L. (1920). Intelligence and its uses. Harpers Magazine, 140, 227‐235.
Vines, C. A. & Anderson, M.A. (1976). Heritage horizons: Extension commitment to the
people. Journal of Extension, 2(1), 34‐40.
Waldman, D. A., Bass, B. M. & Yammarino, F. J. (1990). Adding to contingent‐reward
behavior: The augmenting effect of charismatic leadership. Group and
Organizational Studies, 15, 381‐394.
Waldman, D. A. & Bass, B. M. (1986). Adding to leader and follower transactions: The
augmenting effect of transformational leadership (Working Paper No. 86‐109).
Binghamton State University of New York, School of Management.
Texas Tech University, Angela Bohannon Burkham, August 2010
97
Wechsler, D. (1940). The Measurement and appraisal of adult intelligence. Baltimore,
MD: Williams & Wilkins Company.
Wechsler, D. (1958). The measurement and appraisal of adult intelligence. (4th ed.).
Baltimore, MD: The Williams and Wilkins Company.
Woodrum,W. & Safrit, R. D. (2003). Leadership practices of west Virginia university
extension agents working with the 4‐H youth development program. Journal of
Extension, 41(3). Retrieved January 2, 2010 from
http://www.joe.org/joe/2003June/rb1.html.
Zaleznik, A. (1977). Managers and leaders: Are they different? Harvard Business Review,
54, 67‐78.
Zirkel, S. (2000). Social intelligence, the development and maintenance of purposive
behavior. In R. Bar‐On & J. Parker (Eds.), The Handbook of emotional
intelligence, theory, development, assessment and application at home, school
and in the workplace (pp. 3‐27). San Francisco: Jossey‐Bass.
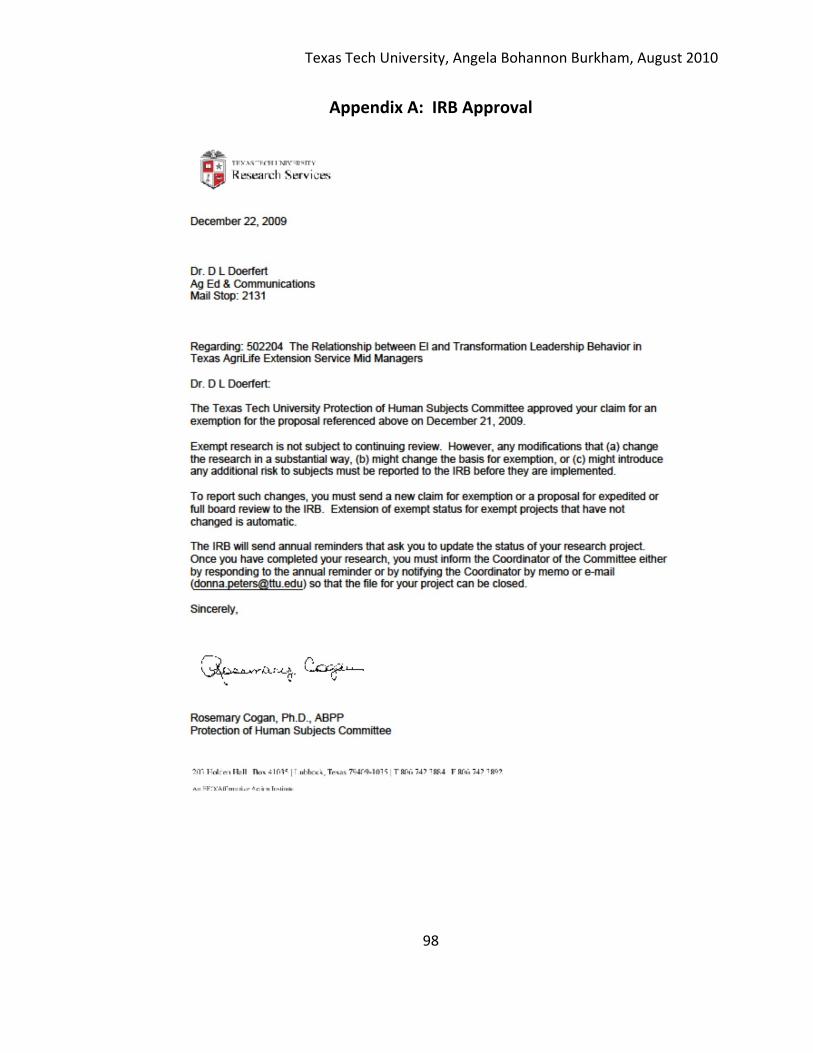
Texas Tech University, Angela Bohannon Burkham, August 2010
98
Appendix A: IRB Approval
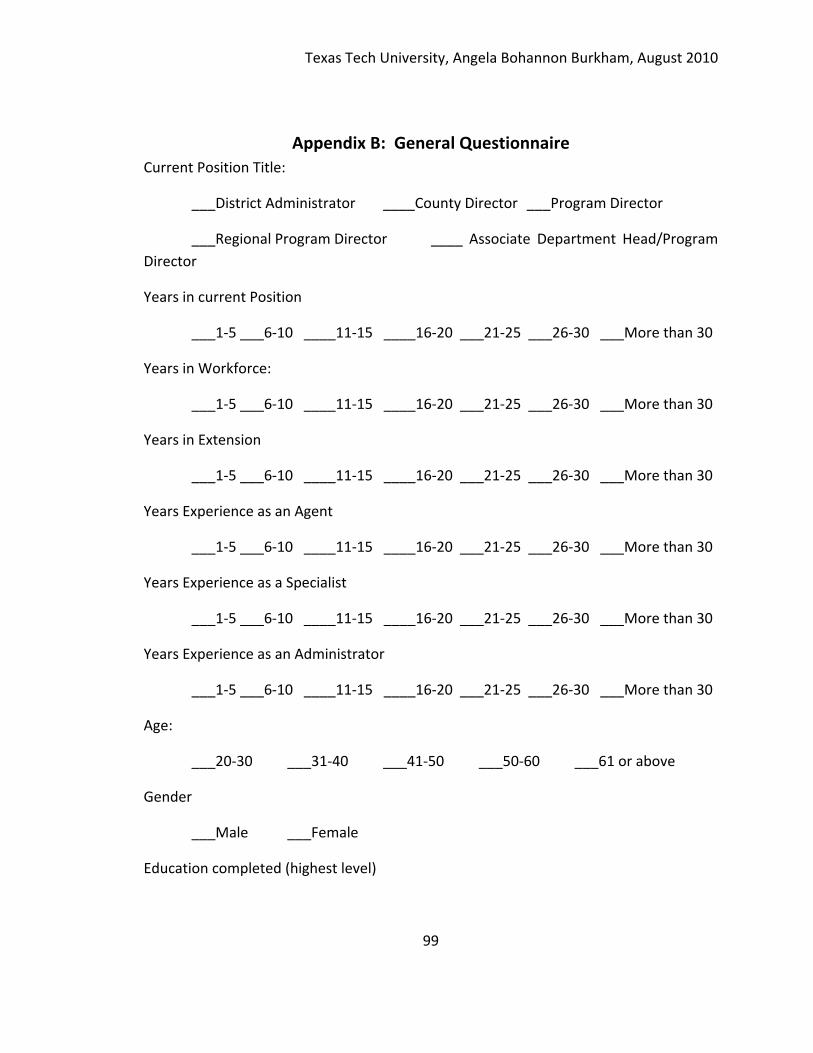
Texas Tech University, Angela Bohannon Burkham, August 2010
99
Appendix B: General Questionnaire
Current Position Title:
___District Administrator ____County Director ___Program Director
___Regional Program Director ____ Associate Department Head/Program
Director
Years in current Position
___1‐5 ___6‐10 ____11‐15 ____16‐20 ___21‐25 ___26‐30 ___More than 30
Years in Workforce:
___1‐5 ___6‐10 ____11‐15 ____16‐20 ___21‐25 ___26‐30 ___More than 30
Years in Extension
___1‐5 ___6‐10 ____11‐15 ____16‐20 ___21‐25 ___26‐30 ___More than 30
Years Experience as an Agent
___1‐5 ___6‐10 ____11‐15 ____16‐20 ___21‐25 ___26‐30 ___More than 30
Years Experience as a Specialist
___1‐5 ___6‐10 ____11‐15 ____16‐20 ___21‐25 ___26‐30 ___More than 30
Years Experience as an Administrator
___1‐5 ___6‐10 ____11‐15 ____16‐20 ___21‐25 ___26‐30 ___More than 30
Age:
___20‐30 ___31‐40 ___41‐50 ___50‐60 ___61 or above
Gender
___Male ___Female
Education completed (highest level)
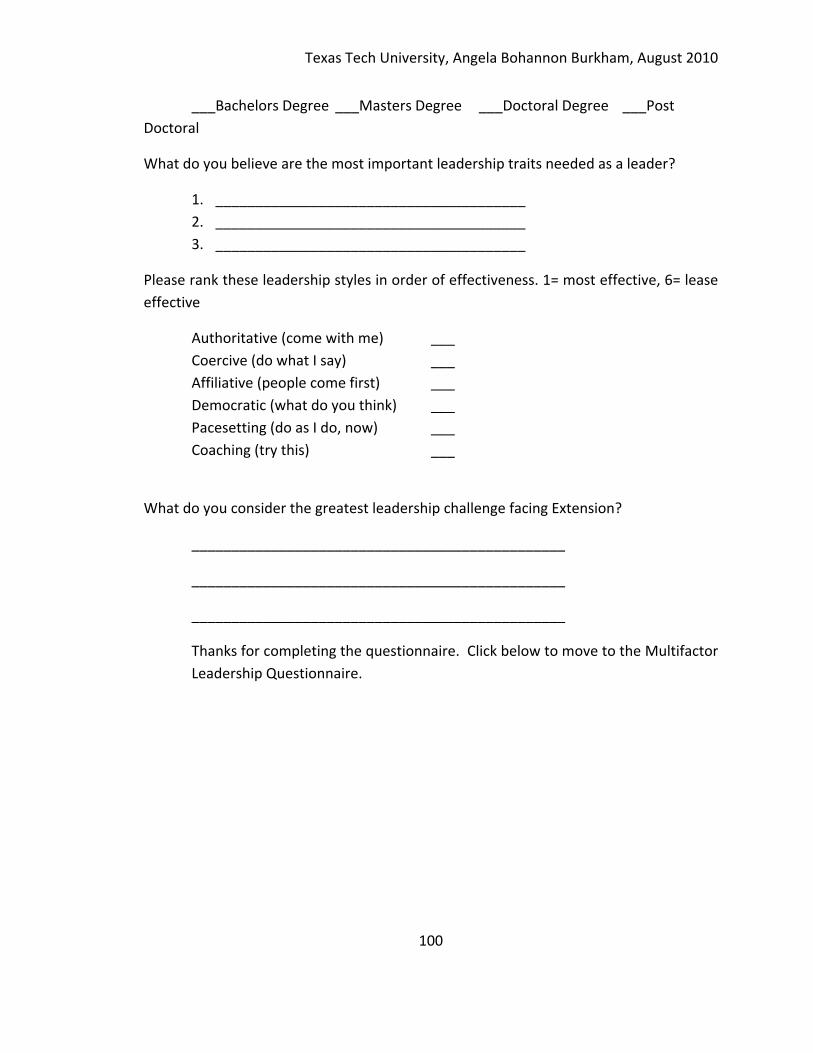
Texas Tech University, Angela Bohannon Burkham, August 2010
100
___Bachelors Degree ___Masters Degree ___Doctoral Degree ___Post
Doctoral
What do you believe are the most important leadership traits needed as a leader?
1. _______________________________________
2. _______________________________________
3. _______________________________________
Please rank these leadership styles in order of effectiveness. 1= most effective, 6= lease
effective
Authoritative (come with me) ___
Coercive (do what I say) ___
Affiliative (people come first) ___
Democratic (what do you think) ___
Pacesetting (do as I do, now) ___
Coaching (try this) ___
What do you consider the greatest leadership challenge facing Extension?
_______________________________________________
_______________________________________________
_______________________________________________
Thanks for completing the questionnaire. Click below to move to the Multifactor
Leadership Questionnaire.
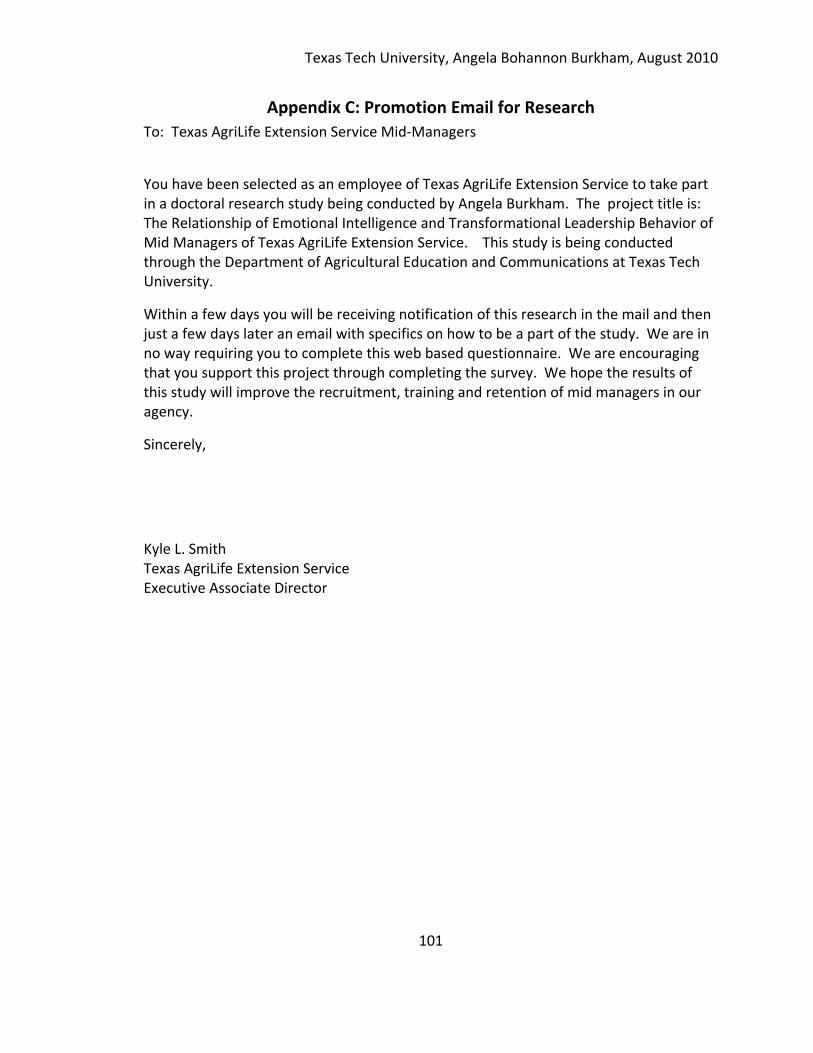
Texas Tech University, Angela Bohannon Burkham, August 2010
101
Appendix C: Promotion Email for Research
To: Texas AgriLife Extension Service Mid‐Managers
You have been selected as an employee of Texas AgriLife Extension Service to take part in a doctoral research study being conducted by Angela Burkham. The project title is: The Relationship of Emotional Intelligence and Transformational Leadership Behavior of Mid Managers of Texas AgriLife Extension Service. This study is being conducted through the Department of Agricultural Education and Communications at Texas Tech University.
Within a few days you will be receiving notification of this research in the mail and then just a few days later an email with specifics on how to be a part of the study. We are in no way requiring you to complete this web based questionnaire. We are encouraging that you support this project through completing the survey. We hope the results of this study will improve the recruitment, training and retention of mid managers in our agency.
Sincerely,
Kyle L. Smith Texas AgriLife Extension Service Executive Associate Director
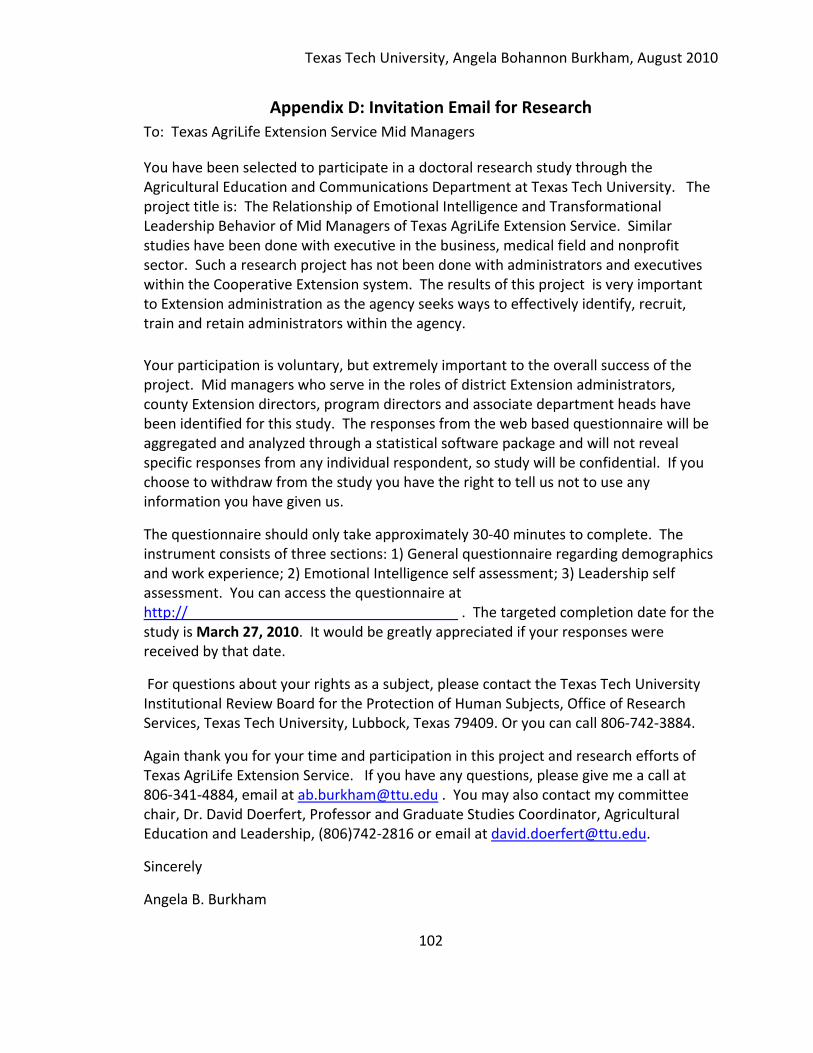
Texas Tech University, Angela Bohannon Burkham, August 2010
102
Appendix D: Invitation Email for Research
To: Texas AgriLife Extension Service Mid Managers
You have been selected to participate in a doctoral research study through the Agricultural Education and Communications Department at Texas Tech University. The project title is: The Relationship of Emotional Intelligence and Transformational Leadership Behavior of Mid Managers of Texas AgriLife Extension Service. Similar studies have been done with executive in the business, medical field and nonprofit sector. Such a research project has not been done with administrators and executives within the Cooperative Extension system. The results of this project is very important to Extension administration as the agency seeks ways to effectively identify, recruit, train and retain administrators within the agency.
Your participation is voluntary, but extremely important to the overall success of the project. Mid managers who serve in the roles of district Extension administrators, county Extension directors, program directors and associate department heads have been identified for this study. The responses from the web based questionnaire will be aggregated and analyzed through a statistical software package and will not reveal specific responses from any individual respondent, so study will be confidential. If you choose to withdraw from the study you have the right to tell us not to use any information you have given us.
The questionnaire should only take approximately 30‐40 minutes to complete. The instrument consists of three sections: 1) General questionnaire regarding demographics and work experience; 2) Emotional Intelligence self assessment; 3) Leadership self assessment. You can access the questionnaire at http://__________________________________ . The targeted completion date for the study is March 27, 2010. It would be greatly appreciated if your responses were received by that date.
For questions about your rights as a subject, please contact the Texas Tech University Institutional Review Board for the Protection of Human Subjects, Office of Research Services, Texas Tech University, Lubbock, Texas 79409. Or you can call 806‐742‐3884.
Again thank you for your time and participation in this project and research efforts of Texas AgriLife Extension Service. If you have any questions, please give me a call at 806‐341‐4884, email at [email protected] . You may also contact my committee chair, Dr. David Doerfert, Professor and Graduate Studies Coordinator, Agricultural Education and Leadership, (806)742‐2816 or email at [email protected].
Sincerely
Angela B. Burkham
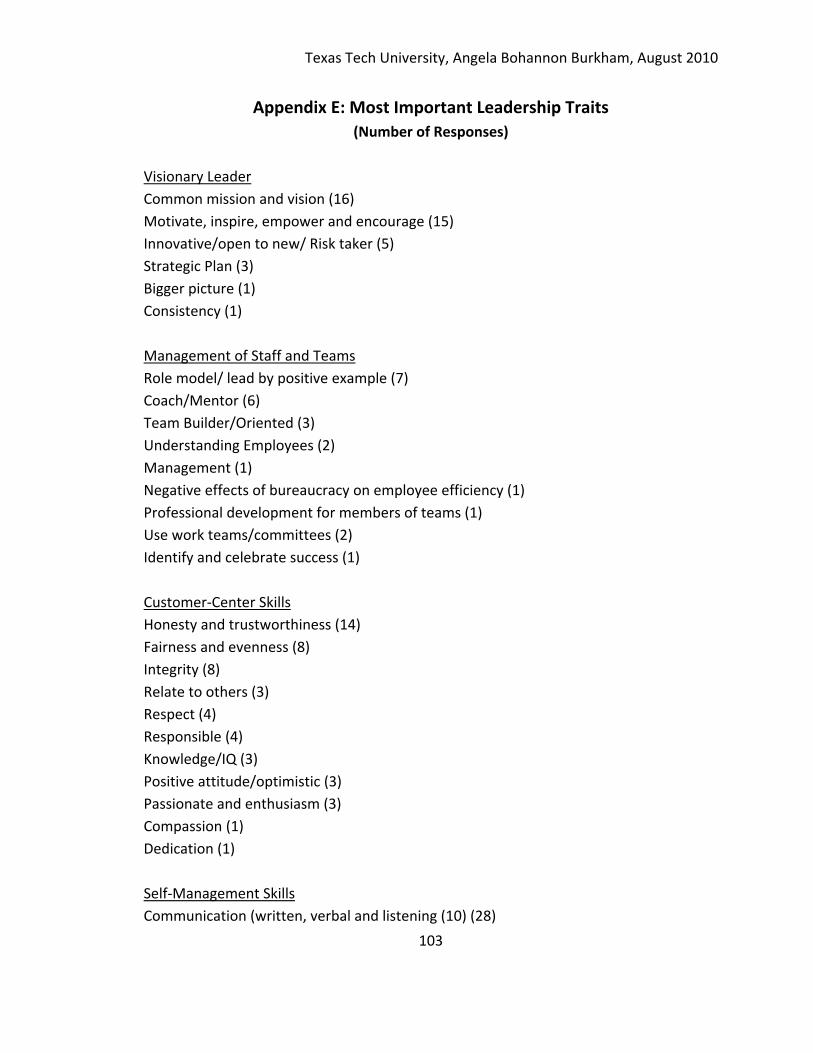
Texas Tech University, Angela Bohannon Burkham, August 2010
103
Appendix E: Most Important Leadership Traits
(Number of Responses)
Visionary Leader
Common mission and vision (16)
Motivate, inspire, empower and encourage (15)
Innovative/open to new/ Risk taker (5)
Strategic Plan (3)
Bigger picture (1)
Consistency (1)
Management of Staff and Teams
Role model/ lead by positive example (7)
Coach/Mentor (6)
Team Builder/Oriented (3)
Understanding Employees (2)
Management (1)
Negative effects of bureaucracy on employee efficiency (1)
Professional development for members of teams (1)
Use work teams/committees (2)
Identify and celebrate success (1)
Customer‐Center Skills
Honesty and trustworthiness (14)
Fairness and evenness (8)
Integrity (8)
Relate to others (3)
Respect (4)
Responsible (4)
Knowledge/IQ (3)
Positive attitude/optimistic (3)
Passionate and enthusiasm (3)
Compassion (1)
Dedication (1)
Self‐Management Skills
Communication (written, verbal and listening (10) (28)
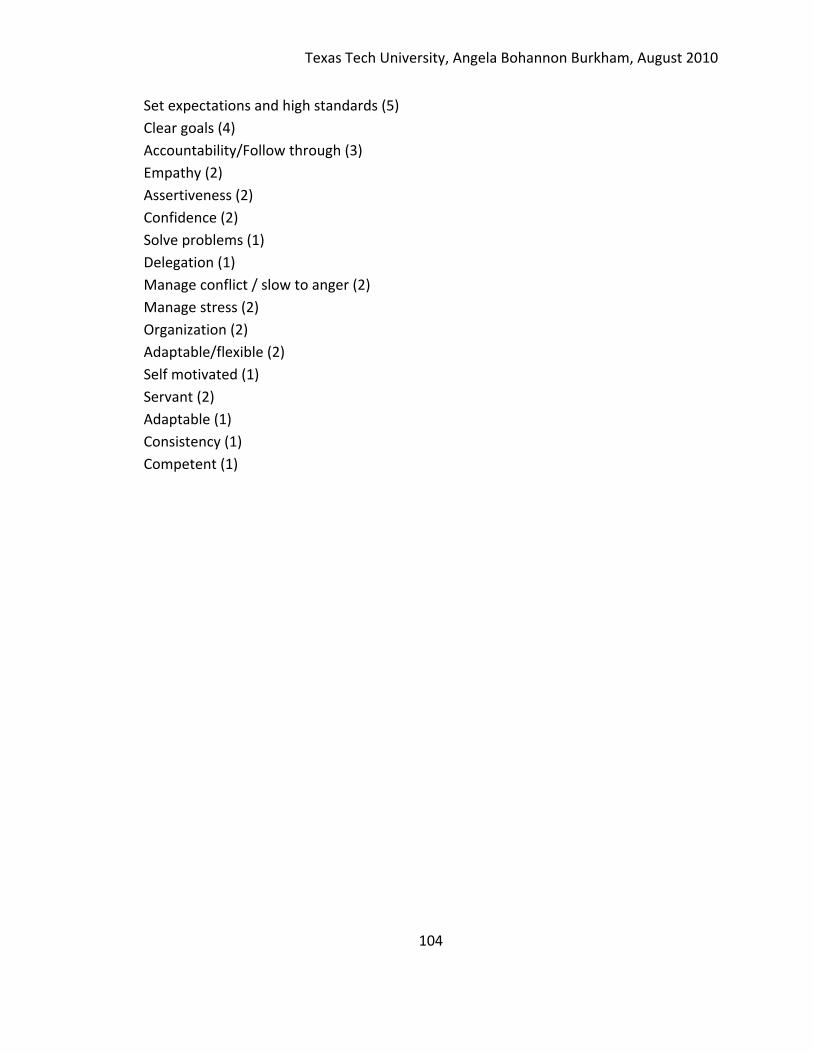
Texas Tech University, Angela Bohannon Burkham, August 2010
104
Set expectations and high standards (5)
Clear goals (4)
Accountability/Follow through (3)
Empathy (2)
Assertiveness (2)
Confidence (2)
Solve problems (1)
Delegation (1)
Manage conflict / slow to anger (2)
Manage stress (2)
Organization (2)
Adaptable/flexible (2)
Self motivated (1)
Servant (2)
Adaptable (1)
Consistency (1)
Competent (1)
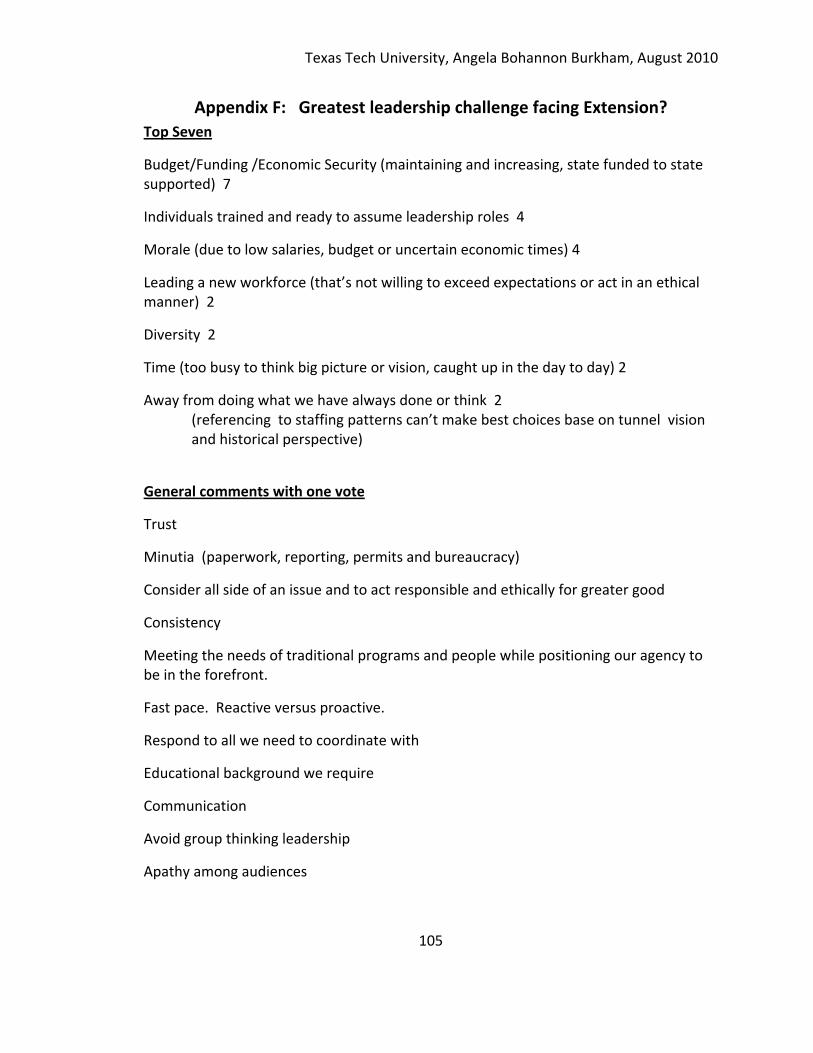
Texas Tech University, Angela Bohannon Burkham, August 2010
105
Appendix F: Greatest leadership challenge facing Extension?
Top Seven
Budget/Funding /Economic Security (maintaining and increasing, state funded to state supported) 7
Individuals trained and ready to assume leadership roles 4
Morale (due to low salaries, budget or uncertain economic times) 4
Leading a new workforce (that’s not willing to exceed expectations or act in an ethical manner) 2
Diversity 2
Time (too busy to think big picture or vision, caught up in the day to day) 2
Away from doing what we have always done or think 2 (referencing to staffing patterns can’t make best choices base on tunnel vision and historical perspective)
General comments with one vote
Trust
Minutia (paperwork, reporting, permits and bureaucracy)
Consider all side of an issue and to act responsible and ethically for greater good
Consistency
Meeting the needs of traditional programs and people while positioning our agency to be in the forefront.
Fast pace. Reactive versus proactive.
Respond to all we need to coordinate with
Educational background we require
Communication
Avoid group thinking leadership
Apathy among audiences
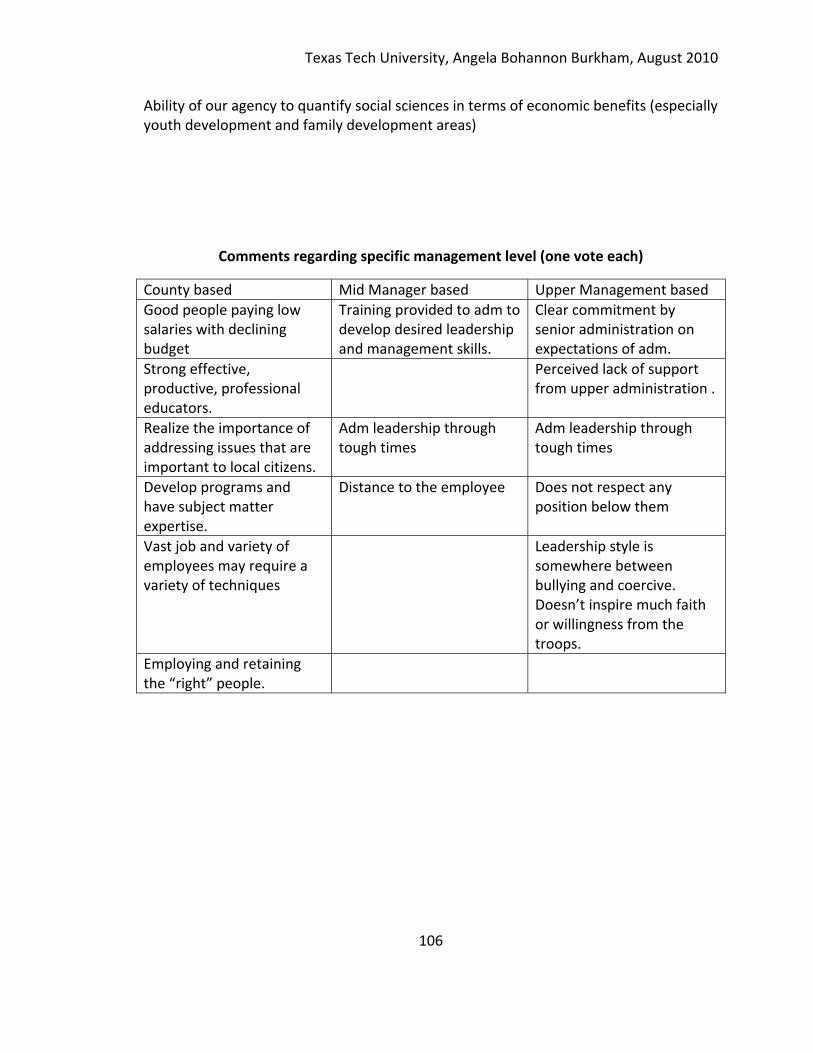
Texas Tech University, Angela Bohannon Burkham, August 2010
106
Ability of our agency to quantify social sciences in terms of economic benefits (especially youth development and family development areas)
Comments regarding specific management level (one vote each)
County based Mid Manager based Upper Management based
Good people paying low salaries with declining budget
Training provided to adm to develop desired leadership and management skills.
Clear commitment by senior administration on expectations of adm.
Strong effective, productive, professional educators.
Perceived lack of support from upper administration .
Realize the importance of addressing issues that are important to local citizens.
Adm leadership through tough times
Adm leadership through tough times
Develop programs and have subject matter expertise.
Distance to the employee Does not respect any position below them
Vast job and variety of employees may require a variety of techniques
Leadership style is somewhere between bullying and coercive. Doesn’t inspire much faith or willingness from the troops.
Employing and retaining the “right” people.