Embed Size (px)
Citation preview
Journal of Personality and Social Psychology1980, Vol. 39, No. 6, 1238-1244
Relation Between Loneliness and Depression:A Structural Equation Analysis
David G. WeeksWashington University School of Medicine
John L. Michela and Letitia Anne PeplauUniversity of California, Los Angeles
Martin E. BraggUniversity of Illinois, Champaign-Urbana
Research on loneliness has been hampered by its strong association with depres-sion. The two states frequently co-occur, and measures of the two states aresubstantially correlated. Inability to manipulate experimentally loneliness ordepression makes it difficult to untangle the causal influence of one on the other.The combination of longitudinal design and structural equation methodology isproposed as a solution to this general problem. Measures of loneliness and de-pression were administered to undergraduates at two points 5 weeks apart. Datafrom 333 subjects were correlated and analyzed under a succession of structuralequation models. Results indicated that loneliness and depression were corre-lated but clearly different constructs; neither was a direct cause of the other,though both probably share some common origins; both were highly stable overthe 5-week period.
Correlation between variables that purportto measure distinct constructs is a commonoccurrence in personality research and all ofpsychology. Such correlation must in generalbe considered part and parcel of the phe-nomena under consideration, rather than aby-product of some defect in design or instru-mentation. The constructs that populate agiven domain often overlap (leading to corre-lated measures of these constructs) due to thevariety of causal relations among them.
Loneliness is an important area for re-search that has been seriously hindered bysuch problems. Although loneliness is a com-
This research was supported in part by U.S. Pub-lic Health Service Grant DA01070, P. M. Bentler,principal investigator, and by National Institute ofMental Health Grant MH24819, E. J. Anthony andJ. Worland, principal investigators.
The authors wish to thank Dan Russell for hisassistance.
Requests for reprints should be sent to David G.Weeks, Child Development Research Center, Wash-ington University School of Medicine, 369 NorthTaylor, St. Louis, Missouri 63108.
mon and distressing problem for many Ameri-cans, relatively little empirical research onloneliness has been conducted (Peplau &Perlman, 1979; Weiss, 1973). A barrier toresearch has been the problem of distinguish-ing loneliness from depression. There is em-pirical evidence that loneliness and depres-sion often co-occur. Correlations betweenmeasures of these two constructs range from.4 to .6 (Russell, Peplau, & Cutrona, 1980;Russell, Peplau, & Ferguson, 1978) in collegesamples. In fact, the study of loneliness hasoften been subsumed under the more estab-lished field of research on depression. Yettheorists (Leiderman, 1969; Ortega, 1969;Peplau & Perlman, 1979; Weiss, 1973) arguethat there are important distinctions betweenloneliness and depression. For example, ac-cording to Weiss (1973), "In loneliness thereis a drive to rid oneself of one's distress byintegrating a new relationship; in depressionthere is instead a surrender to it" (p. IS) . Ifresearch on loneliness is to develop in its ownright, it will be necessary to go beyond the-
Copyright 1980 by the American Psychological Association, Inc. 0022-3514/80/3906-1238$00.75
1238
LONELINESS AND DEPRESSION 1239
orizing to demonstrate.empirically that lone-liness and depression are distinct.
Distinguishing loneliness and depressionrequires a demonstration that the two con-structs are measurably different. If this firstrequirement can be met, it is then possible tobegin to specify the causal relations betweenloneliness and depression. At least threecausal relationships seem plausible. First,prolonged loneliness may be a common causeof depression. Second, depression may causepeople to reduce their social activities andbecome lonely. Finally, other factors such asthe breakup of a close relationship may simul-taneously produce both loneliness and de-pression.
Identification of the causal relations be-tween loneliness and depression is complicatedby the fact that neither variable is readilysubject to experimental manipulation. Thus,attempts to analyze the causal links betweenloneliness and depression must be based oncorrelational data. Although it is true thatcorrelation does not imply causation, it is alsotrue that causation does imply correlation.Use of a longitudinal design is particularlydesirable in the present context. One advan-tage is that the temporal direction of allcausal links is given, that is, from earlier tolater in time. However, the identification ofcausal paths and the determination of theirmagnitude remains to be determined. Currentstructural equation methodology (cf. Joreskog& Sorbom, 1977; Weeks, 1980) provides ameans of testing causal hypotheses on non-experimental data. (Structural equations aredescribed in more detail below.) A secondadvantage of a longitudinal design is theopportunity to assess the stability of loneli-ness and depression. Both loneliness anddepression occur as transient mood states,but it is the more stable form of each condi-tion, enduring over some time, that is usuallyconsidered a psychological problem. Assessingthe stability of these experiences is also im-portant because it is unlikely that a particu-larly unstable state can be identified as acause of anything.
MethodSubjects
Subjects were introductory psychology students atthe University of California, Los Angeles (UCLA),who received course credit for attending two testingsessions. All subjects were new students, attendingUCLA for their first quarter. Of an initial group of354 who attended a first testing session, 333 re-turned to participate in a second testing session andcomprised the sample for this research.
Procedure
Measures were administered to groups of 10-32students. There were two measurement periods,during the 2nd and 7th weeks of the fall quarter,1977. Each testing session lasted about 45 minutes.At each session, students completed the 20-itemUCLA Loneliness Scale (ULS; Russell et al., 1978),the 20-item Beck Depression Inventory (BDI; Beck,1967), the Profile of Mood States (POMS; McNair,Lorr, & Droppleman, 1971), and several other paper-and-pencil instruments not considered in the presentarticle. (More details of data collection are givenin Bragg, 1979.) To illustrate the ULS, two of theitems were "I have nobody to talk to" and "I feelleft out;" each item was followed by a 4-point scaleindicating how frequently the respondent feels thisway. Each of the BDI items required a forcedchoice among four or five alternate statements, forexample, "(a) I don't get any more tired thanusual, (b) I get tired more easily than usual, (c) Iget tired from doing anything, (d) I get too tiredto do anything." The POMS Depression subscaleconsists of 15 mood adjectives (e.g., sad, gloomy) forwhich responses were given on a 5-point scale toindicate the degree to which these feelings wereexperienced during the past week. All three scalesare highly reliable (ULS .96, BDI .86, and POMS.95).
For the present analyses several variables werecreated from each scale. Four measures of loneli-ness were formed as sums of five items each on theULS. Three measures of depression were used: theDepression subscale score on the POMS, and twosums of 10 items each on the BDI. Scores on the 14variables (7 at each session) were correlated, andthese correlations were used as input for subsequentanalyses.
Structural Equations
A structural equation model is a set of equationsthat embodies the causal assumptions about a givenset of data. A given set of causal assumptions im-plies a specific set of equations. The numerical solu-tion to these equations provides estimates of themagnitudes of the various causal linkages by opti-mizing the goodness of fit of the model to the data.That is, a given causal model implies (or predicts)
TIME 2
WEEKS, MICHELA, PEPLAU, AND BRAGG
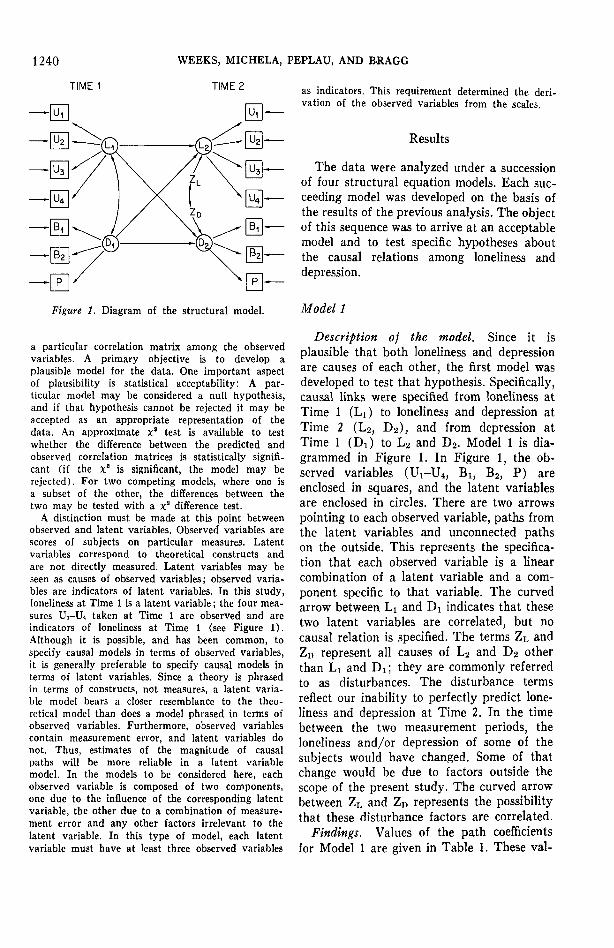
Figure 1. Diagram of the structural model.
a particular correlation matrix among the observedvariables. A primary objective is to develop aplausible model for the data. One important aspectof plausibility is statistical acceptability: A par-ticular model may be considered a null hypothesis,and if that hypothesis cannot be rejected it may beaccepted as an appropriate representation of thedata. An approximate xa test is available to testwhether the difference between the predicted andobserved correlation matrices is statistically signifi-cant (if the x" is significant, the model may berejected). For two competing models, where one isa subset of the other, the differences between thetwo may be tested with a xa difference test.
A distinction must be made at this point betweenobserved and latent variables. Observed variables arescores of subjects on particular measures. Latentvariables correspond to theoretical constructs andare not directly measured. Latent variables may beseen as causes of observed variables; observed varia-bles are indicators of latent variables. In this study,loneliness at Time 1 is a latent variable; the four mea-sures Ui-Ui taken at Time 1 are observed and areindicators of loneliness at Time 1 (see Figure 1).Although it is possible, and has been common, tospecify causal models in terms of observed variables,it is generally preferable to specify causal models interms of latent variables. Since a theory is phrasedin terms of constructs, not measures, a latent varia-ble model bears a closer resemblance to the theo-retical model than does a model phrased in terms ofobserved variables. Furthermore, observed variablescontain measurement error, and latent variables donot. Thus, estimates of the magnitude of causalpaths will be more reliable in a latent variablemodel. In the models to be considered here, eachobserved variable is composed of two components,one due to the influence of the corresponding latentvariable, the other due to a combination of measure-ment error and any other factors irrelevant to thelatent variable. In this type of model, each latentvariable must have at least three observed variables
as indicators. This requirement determined the deri-vation of the observed variables from the scales.
Results
The data were analyzed under a successionof four structural equation models. Each suc-ceeding model was developed on the basis ofthe results of the previous analysis. The objectof this sequence was to arrive at an acceptablemodel and to test specific hypotheses aboutthe causal relations among loneliness anddepression.
Model 1
Description of the model. Since it isplausible that both loneliness and depressionare causes of each other, the first model wasdeveloped to test that hypothesis. Specifically,causal links were specified from loneliness atTime 1 (Li) to loneliness and depression atTime 2 (L2, D2), and from depression atTime 1 (Di) to L2 and D2. Model 1 is dia-grammed in Figure 1. In Figure 1, the ob-served variables (Ui-U4, B1( B2, P) areenclosed in squares, and the latent variablesare enclosed in circles. There are two arrowspointing to each observed variable, paths fromthe latent variables and unconnected pathson the outside. This represents the specifica-tion that each observed variable is a linearcombination of a latent variable and a com-ponent specific to that variable. The curvedarrow between LI and D! indicates that thesetwo latent variables are correlated, but nocausal relation is specified. The terms ZL andZD represent all causes of L2 and D2 otherthan LI and Di; they are commonly referredto as disturbances. The disturbance termsreflect our inability to perfectly predict lone-liness and depression at Time 2. In the timebetween the two measurement periods, theloneliness and/or depression of some of thesubjects would have changed. Some of thatchange would be due to factors outside thescope of the present study. The curved arrowbetween Zr/ and ZD represents the possibilitythat these disturbance factors are correlated.
Findings. Values of the path coefficientsfor Model 1 are given in Table 1. These val-
LONELINESS AND DEPRESSION 1241
ues may be interpreted as standardized re-gression coefficients. It can be seen that thetwo same-factor paths (Li-L2, Di-D2) arelarge, and the two cross-factor paths (Li-Da,Di-L2) are small. An approximate statisticaltest is available for the hypothesis that aparticular parameter (in this case, a path co-efficient) is zero. The parameter estimatedivided by its standard error gives the criticalratio (CR), which is distributed approxi-mately as z, so a CR greater than ±1.96 sug-gests a significant path. The CRs for each ofthe path coefficients are also given in Table 1.The CR tests demonstrate that the two cross-factor paths are nonsignificant, whereas thetwo same-factor paths are significant. Theoverall fit of the model to the data is indi-cated by the x2 test, X
2(64) = 129.1587, p <.00005. Since this x2 is statistically signifi-cant, Model 1 must be rejected on a purelystatistical criterion. But since this x2 test isparticularly restrictive, other measures of thequality of fit are often used. For example,the ratio of x2 to dj is approximately 2:1,which suggests that Model 1 accounts for thedata reasonably well.
Model 2
Model 2 was developed from Model 1 byeliminating the two cross-factor paths. Valuesof the path coefficients, critical ratios, andoverall x2 are given in Table 1. The values ofthe same-factor paths are close to their valuesin Model 1, and their CRs are again high.The x2 is still statistically significant (p <.0005), indicating that Model 2 can also berejected. Model 2 provides a more exact testof the hypothesis that neither loneliness nordepression is the cause of the other. Model 2is a subset of Model 1: They are identicalexcept for two additional restrictions in Model2 (that the paths Li-D2 and Di-L2 are zero).The difference in x2 values for Models 1 and2 is itself a x2, with degrees of freedom equalto the differences in degrees of freedom forthe model. This x2 w&s nonsignificant, x 2 (2)= 1.3951, p > .40. Specifically, the hypothe-sis that the cross-factor paths are zero cannotbe rejected.
Table 1Path Coefficients, Critical Ratios (CR), andX2 for the Three Models
Path
L,-L,
Li-Da'D,-L,
L,-L2D,-D,
Dt-D2
»X2(64) = 129.1587
bX2(66) = 130,5538«X2(54) = 64.5265,
Coefficient
Model 1".744.749
-.076.046
Model 2b
.782.688
Model 3°.784.687
, p < .00005., p < .0005.p = .1546.
CR
11.0679.645
-1.106.755
15.64112.764
16.10412.827
Model 3
Model 3 was generated by allowing 12 cor-relations between specific components (thecomponents of measurement error and otherfactors irrelevant to the latent variables).Such correlations usually have no substantiveinterpretation and are used to compensate forthe fact that the specification of the model isrestrictive and that the x2 test is sensitive todepartures from multivariate normality.When these correlations are allowed, the dataare represented more accurately by the modelwhile the conceptually meaningful links areleft intact. The path coefficients, CRs, and x2
for Model 3 are presented in Table 1. Thevalues of the path coefficients are nearlyidentical to those in Model 2, which is furtherindication that the added correlations do notaffect the substantive interpretation of themodel. The x2 is nonsignificant by conven-tional standards (p — .1546), indicating thatModel 3 cannot be rejected; that is, it is astatistically acceptable model. Furthermore,a x2 difference test between Models 2 and 3shows that the 12 added correlations make asignificant contribution, x2(12) = 66.0723, p< .001. It should be stressed that Models 2and 3 are substantively equivalent. Model 3is statistically acceptable, but Model 2 is

1242 WEEKS, MICHELA, PEPLAU, AND BRAGG
cleaner, containing no irrelevant parameters.There may be differences in opinion overwhich of the two models is best, but thetheoretical implications are the same in eithercase.
The correlations between latent variableswithin each time period were substantial (.701for Li-Dj and .613 for L2-D2), but withcorrelations in this range, loneliness and de-pression must be considered separate and dis-tinct factors. The correlation between thedisturbance terms ZL and ZD was .522. Sincethe disturbance terms represent all factorsaffecting loneliness and depression at Time 2exclusive of the Time 1 factors, the magnitudeof this correlation suggests that some of theseintervening factors influence both lonelinessand depression.
Model 4
That the correlation between loneliness anddepression is much lower than unity may notbe sufficiently convincing evidence to supportthe claim that these two latent variables are,in fact, distinct factors. The hypothesis thatthe seven observed variables at each timewere all measures of a single factor was testedformally with a fourth structural equationmodel. The details of Model 4 were the sameas for Model 3 except that loneliness anddepression were combined in a single factorat each time period. This model, representingthe one-factor hypothesis, could be clearlyrejected, X
2(57) = 592.4845, p < .00005.Model 4 is the equivalent of Model 3 underthe restriction that the correlations betweenloneliness and depression are equal to unity,so the x2 difference test is appropriate. Resultsof this test, x2(3) = 527.9580, p < .0005,again indicated that the data are best de-scribed by two underlying factors.
Discussion
Our first objective in this study was todetermine whether or not loneliness and de-pression could be empirically distinguished.Had our measures of loneliness and depres-sion in fact measured a single latent variable,the correlation between loneliness and depres-sion would have approached unity. This was
hardly the case: The highest correlation,which was in the first time period, was only.701. Although this may appear large, it isimportant to realize that this correlation isnot biased downward by measurement error.It is a correlation between latent variables,and latent variables are free of measurementerror. It should also be noted that over halfof the variance in loneliness was not accountedfor by depression, and vice versa. Also, hadthere been but one latent variable, the x2
difference between Models 3 and 4 would havebeen nonsignificant, or at least not nearly somassive.
The second objective was to determine thecausal relations between loneliness and de-pression. Results from Models 1 and 2 clearlyindicated that no cross-factor paths werepresent. Loneliness did not cause depression,nor did depression cause loneliness. The ab-sence of cross-factor paths also served tounderscore the distinctiveness of lonelinessand depression. If two latent variables arereally equivalent, the same-factor paths canbe replaced by the cross-factor paths, but ourresults ruled out this possibility. It may bethat such causal relations exist but that thelag time for the effect is longer than 5 weeks.There may also be a causal link betweenloneliness and depression of a more transientnature. For example, feeling lonely one daymay increase feelings of depression for thatday but have no influence on depression theday after. These types of causal relationcould not be tested in the present design.
The relatively large magnitude of the same-factor paths is evidence that both lonelinessand depression were stable over time. It wascritical for the purpose of this study that themeasures we selected tap relatively stablepsychological states rather than transientmoods. If, for example, loneliness had provedunstable, the absence of a path from depres-sion to loneliness would have been much lessconvincing evidence for the hypothesis thatdepression does not cause loneliness. In thatcase it could be argued that depression atTime 1 may have caused loneliness the nextday, but that the distribution of loneliness inthe sample had changed widely during the5-week interval between testing. Thus, the
LONELINESS AND DEPRESSION 1243
observed stability of loneliness and depressionstrengthens the claim that neither was acause of the other.
A further point should be noted about thedepression construct. It is virtually certainthat we did not tap severe depression to anygreat extent, since we sampled from a non-psychiatric population. Our results mightincidentally relate to loneliness and clinicaldepression. However, our findings are mostpertinent to questions about how the socialpsychological construct of loneliness (Peplau& Perlman, 1979) is distinguished from adepressed mood state.
The analyses also provided informationabout unidentified determinants of lonelinessand depression. The correlation between lone-liness and depression at both measurementperiods indicates an appreciable overlap be-tween the two constructs. Although these cor-relations were not high enough to suggest oneconstruct instead of two, they were not nearlylow enough to suggest that loneliness and de-pression are independent of one another. Sinceloneliness and depression are correlated, andsince neither was the cause of the other, themost likely hypothesis is that loneliness anddepression shared some common causes. Thishypothesis is supported in particular by thecorrelation between the disturbance terms(.522) in Model 3. Recall that the distur-bances represent all causes of loneliness anddepression at Time 2 that could not be speci-fied in the model. Since the disturbance termswere correlated, some of these unspecifiedcauses were the same for both loneliness anddepression. For example, suppose that amountof social contact is a component of ZL andthat the salience of personal problems is acomponent of ZD. Then some stressful lifeevent could affect both of these factors, whichwould in turn affect both loneliness and de-pression. Since the disturbances are by defini-tion not identifiable in terms of the variables,for the present study it is impossible to domore than speculate on the common origin ofloneliness and depression. Identification ofthese common origins would certainly be ofimportance, although it would be a difficultand time-consuming endeavor.
The primary goal of this study has been
to acquire specific information about the rela-tionship between loneliness and depression.Analyses of longitudinal data under four rela-tively simple structural equation models haveprovided several particularly significant find-ings: Loneliness and depression were distinct,though correlated; neither was the cause ofthe other; both were stable over time; andthey apparently shared some common causalorigins.
A secondary but more general aim of thisstudy was to demonstrate the use of structuralequation models for the analysis of nonexperi-mental data. A pervasive problem in psycho-logical research, which was encountered inthis study of loneliness and depression, con-cerns the inability or undesirability of usingexperimental manipulations to determine thecausal relations among certain psychologicalvariables. Our approach to this problem hasits origins primarily in sociology and econo-metrics (cf . Bielby & Hauser, 1977; Joreskog& Sorbom, 1977; Wheaton, Muthen, Alwin,& Summers, 1977), in which naturalisticassessment is often necessary. This studymeasured persons' states of loneliness anddepression on two occasions in a longitudinaldesign, and then structural equation methodswere applied to the intercorrelations of themeasures.
Future application of the method couldwell involve many of the issues of currentinterest in personality and social psychology.One example is the controversy over causal-ity between attitudes and behaviors, whichmay most reasonably be studied by natural-istic assessment (cf. Kahle & Berman, 1979).Interrelations among cognitive and affectivestates, and the effect of these states on be-havior, also may profitably be addressed bystructural equation methods. We view as anideal the prospect of basic theoretical ques-tions being studied by a combination ofcarefully controlled experiments and natural-istic assessment analyzed in part by structuralequation methods.
References
Beck, A. Depression: Clinical, experimental, andtheoretical aspects. Philadelphia: University otPennsylvania Press, 1967.

1244 WEEKS, MICHELA, PEPLAU, AND BRAGG
Bielby, W. T., & Hauser, R. M. Structural equationmodels. Annual Review of Sociology, 1977, 3, 137-161.
Bragg, M. E. A comparative study of loneliness anddepression (Doctoral dissertation, University ofCalifornia, Los Angeles, 1979.) Dissertation Ab-stracts International, 1979, 39, 6109-B. (UniversityMicrofilms No. 7913710)
Joreskog, K. G., & Sb'rbom, D. Statistical modelsand methods for analysis of longitudinal data. InD. J. Aigner & A. S. Goldberger (Eds.), Latentvariables in socioeconomic models. Amsterdam:North-Holland, 1977.
Kahle, L. R., & Berman, J. J. Attitudes cause be-haviors: A cross-lagged panel analysis. Journal ojPersonality and Social Psychology, 1979, 37, 315-321.
Leiderman, P. Loneliness: A psychodynamic in-terpretation. In E. Shneidman & M. Ortega (Eds.),Aspects of depression. Boston: Little, Brown, 1969.
McNair, D., Lorr, M., & Droppleman, L. The profileof mood states. San Diego, Calif.: Educationaland Industrial Testing Service, 1971.
Ortega, M. Depression, loneliness, and unhappiness.
In E. Shneidman & M. Ortega (Eds.), Aspectsof depression. Boston: Little, Brown, 1969.
Peplau, L. A., & Perlman, D. Blueprint for a socialpsychological theory of loneliness. In M. Cook &G. Wilson (Eds.), Love and attraction. Oxford,England: Pergamon Press, 1979.
Russell, D., Peplau, L. A., & Cutrona, C. E. Therevised UCLA Loneliness Scale: Concurrent anddiscriminant validity evidence. Journal of Per-sonality and Social Psychology, 1980, 39, 472-480.
Russell, D., Peplau, L. A., & Ferguson, M. L.Developing a measure of loneliness. Journal ofPersonality Assessment, 1978, 42, 290-294.
Weeks, D. G. A second-order longitudinal model ofability structure. Multivariate Behavioral Research,1980, IS, 3S3-36S.
Weiss, R. Loneliness: The experience of emotionaland social isolation. Cambridge, Mass.: MIT Press,1973.
Wheaton, B., Muthen, B., Alwin, D. F., & Summers,G. F. Assessing reliability and stability in panelmodels. In D. R. Heise (Ed.), Sociologicalmethodology. San Francisco: Jossey-Bass, 1977.
Received February 4, 1980 •