Embed Size (px)
Citation preview
Reintegrating Land and Livestock Agroecological Solutions to
Beef System Challenges
Marcia DeLonge
October 2017
NATIONAL HEADQUARTERS Two Brattle Square Cambridge, MA 02138-3780 t 617.547.5552 f 617.864.9405
WASHINGTON, DC, OFFICE 1825 K St. NW, Ste. 800 Washington, DC 20006-1232 t 202.223.6133 f 202.223.6162
WEST COAST OFFICE 500 12th St., Suite 340 Oakland, CA 94607-4087 t 510.843.1872 f 510.451.3785
MIDWEST OFFICE One N. LaSalle St., Ste. 1904 Chicago, IL 60602-4064 t 312.578.1750 f 312.578.1751
© 2017 Union of Concerned Scientists
All Rights Reserved
Marcia DeLonge is a Senior Scientist in the UCS Food and
Environment Program.
The Union of Concerned Scientists puts rigorous, independent
science to work to solve our planet’s most pressing problems.
Joining with people across the country, we combine technical
analysis and effective advocacy to create innovative, practical
solutions for a healthy, safe, and sustainable future.
More information about UCS and the Food and Environment
Program is available on the UCS website:
www.ucsusa.org/food_and_agriculture.
This report is available online (in PDF format) at
www.ucsusa.org/landandlivestock.
ACKNOWLEDGMENTS
This report was made possible through the support of the
TomKat Foundation, the Grantham Foundation for the
Protection of the Environment, and UCS members.
The analysis was completed with the assistance of
Rebecca Wasserman-Olin and George Boody, MS (Land
Stewardship Project), and Alexandra Parisien (graduate
student, University of Virginia; Stanback Intern, Duke
University). For their thoughtful reviews, the author would like
to thank Jonathan Gelbard, PhD (Conservation Value
Solutions); Peter Byck, filmmaker & Professor of Practice
(Arizona State University); Kari Hamerschlag, Deputy
Director, Food and Technology Program (Friends of the Earth);
and an anonymous external reviewer. At UCS, the author
especially thanks Kranti Mulik, Karen Perry Stillerman, Sarah
Reinhardt, Mike Lavender, Andrea Basche, Sharon Smith,
Doug Boucher, and Rachel Cleetus.
Organizational affiliations are listed for identification
purposes only. The opinions expressed herein do not
necessarily reflect those of the organizations that funded the
work or the individuals who reviewed it. The Union of
Concerned Scientists bears sole responsibility for the report’s
contents.
Reintegrating Land and Livestock | 1
[ANALYSIS]
Overview
Current eating habits and farming practices are depleting
natural resources, polluting air and water, and contributing to
climate change. Beef, which in the United States is produced
mostly in industrialized systems, creates outsized
consequences—in part from intensive monocropping of animal
feed and massive cattle-feeding operations. Many experts have
recommended producing and eating less beef to deliver health
and environmental benefits. However, farmers can contribute to
the reduction of beef’s environmental impact by adopting best
practices and diversifying farms: varying the crops they plant,
and integrating livestock. This report evaluates those practices,
which could maintain or improve farmers’ profits while
reducing their fertilizer and fuel use and cutting water
pollution. The report also contains policy recommendations for
the US Department of Agriculture and Congress.
Introduction
Beef production systems have been linked to a range of
problems, including degradation of croplands and grasslands,
air and water pollution, and climate change. Because of these
and other issues, there has been a growing consensus among
many scientists and health experts that reducing beef
production and consumption can deliver both environmental
and health benefits (Boxes 1 and 2; Figure 1). An additional or
alternative solution calls for farmers and ranchers to engage in
improved land and animal management. For the many US
farmers connected to industrial beef systems primarily through
feed-crop production, options to contribute to improved
systems may include adopting more ecological cropping
practices and reintegrating livestock into operations. In this
report, we explore how introducing ecological cropping and
grazing practices into areas now dominated by monoculture
croplands could improve outcomes for farmers and the
environment.
Overall, our analysis suggests that farmers could
profitably transition land that is part of intensive monocropping
systems to more diversified crop and livestock systems. Such a
switch would offer beef raised within alternative systems that
can generate environmental and economic benefits. However,
mitigating challenges associated with various beef production
systems will require the creation of circumstances and policies
that consider multiple factors and encourage more regenerative,
economically viable practices for farmers.
CONVENTIONAL BEEF PRODUCTION SYSTEMS
Understanding some key features of conventional beef
production systems is a prerequisite for understanding
opportunities and trade-offs among alternatives. The cattle life
cycle involves different phases, but this study focuses on the
finishing phase in the United States (Table A1). Grain,
particularly corn, represents a large portion of feed in this
phase, as it helps cattle reach market weight faster than grass
and is relatively cheap (Siegel et al. 2016).1 Moreover, a
majority of the US beef market (97 percent; Cheung et al.
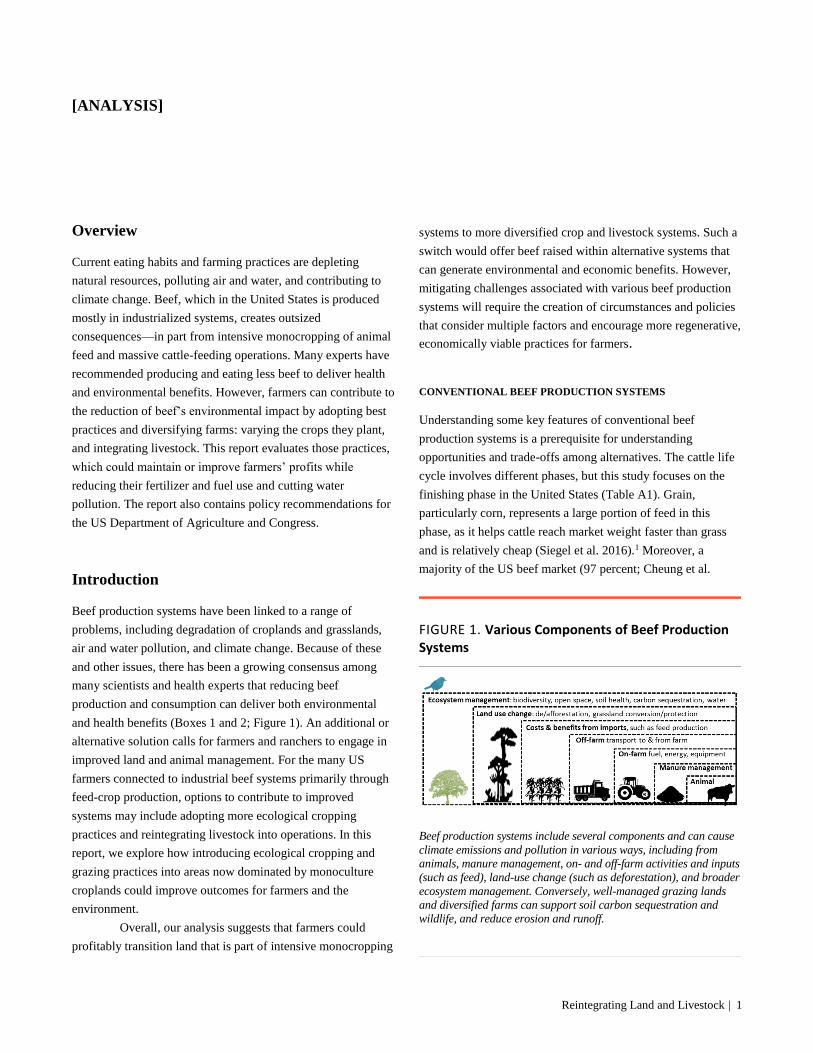
FIGURE 1. Various Components of Beef Production Systems
Beef production systems include several components and can cause
climate emissions and pollution in various ways, including from
animals, manure management, on- and off-farm activities and inputs
(such as feed), land-use change (such as deforestation), and broader
ecosystem management. Conversely, well-managed grazing lands
and diversified farms can support soil carbon sequestration and
wildlife, and reduce erosion and runoff.
2 | UNION OF CONCERNED SCIENTISTS
2017) uses grain finishing, which typically takes five to
10 months and represents much of total weight gain.2 As a
result, 9 to 20 percent of US corn production is consumed by
beef cattle.3 Substantial quantities of corn also go to other
livestock (especially poultry and hogs, as well as dairy cows),
but the portion consumed by beef cattle is of interest,
considering that it is relatively large and that, as ruminants,4
they do not require grain.
The consumption of large amounts of corn by
livestock, including beef cattle, is intertwined with several
agricultural trends that have raised concerns, including the
separation of crop and animal systems (Gliessman 2014),5 loss
of diversity on farms (Dimitri, Effland, and Conklin 2005), rise
in corn acreage (Nickerson et al. 2011), and transition of areas
of the Corn Belt and Great Plains from grasslands to croplands
(Wimberly et al. 2017; Lark, Salmon, and Gibbs 2015; Wright
and Wimberly 2013). These changes, which have been domin-
ated by a trend toward low-diversity corn cropping (planted as
a monoculture or in biologically simple rotations), have occur-
red even as total US cropland area has declined (Nickerson et
al. 2011). While these land-use changes result from multiple
drivers—most notably demand for corn ethanol—the demand
for animal feed stands out (von Reusner 2017).
Another important feature of the finishing phase of
beef production is that it often occurs in concentrated animal
feeding operations (CAFOs).6 A majority (more than 95
percent) of CAFOs are relatively small (with fewer than 1,000
cattle) and produce only 10 to 20 percent of feedlot cattle. The
largest CAFOs, however (holding more than 32,000 cattle),
produce about 40 percent of feedlot cattle.7 These large
facilities tend to concentrate environmental problems—such as
air, water, and soil contamination—and often disproportionally
affect impoverished communities and communities of color
(Harun and Ogneva-Himmelberger 2013; Lenhardt and
Ogneva-Himmelberger 2013).8
Despite the problems linked to grain-based CAFOs,
some scientists have calculated that these CAFOs produce beef
with fewer climate-disrupting emissions than grass-based
alternatives (Capper 2012). This result is based on analyses
showing that grain feeding leads to lower daily digestive
methane emissions, faster finishing times, and smaller farmland
requirements. Critiques of these analyses note that they have
commonly ignored soil carbon dynamics and the diversity of
grass-finishing systems (Rowntree et al. 2016; Teague et al.
2016; Wang et al. 2015), and that they have not fully
considered other critical variables such as water pollution,
biodiversity, and social factors (Janzen 2011). Clearly, this
complexity shows that addressing the challenges of beef
production systems must involve balanced consideration of the
potential trade-offs of alternative systems, including the impact
on the climate and farmers.
IMPROVING BEEF PRODUCTION SYSTEMS WITH
REGENERATIVE AGRICULTURE
Research has identified several practices that farmers can adopt
to improve aspects of beef production systems, including
management of crop- and grazing lands, animals, and
diversified agroecosystems. In particular, researchers have
proposed reintegrating animals into regions dominated by
biologically simple farms to address challenges (Liebman and
Schulte 2015; Hellwinckel and Phillips 2012; Janzen 2011).
Integrated systems can involve practices such as including
forages in crop rotations, grazing crop residues or cover crops,
planting crops that can be either harvested or grazed, or simply
having crop fields and livestock operations more closely
situated to foster exchange of fertilizer and feed (Sulc and
Franzluebbers 2014). Potential effects of improving and
integrating grazing and cropping systems include:
• Protection and expansion of beneficial grasslands.
Well-managed grasslands deliver numerous ecosystem
services—reducing runoff, erosion, and risk of drought
and flood—while supporting wildlife habitat, recreation,
biodiversity, and livelihoods (Peters et al. 2016; Briske et
al. 2015; Yahdjian, Sala, and Havstad 2015; Werling et al.
2014; Sayre et al. 2013; Franzluebbers et al. 2012; Thorn-
ton et al. 2009). Adopting an adaptive approach to optim-
izing stocking rates and patterns (timing, intensity, and
duration of grazing and rest periods) can restore degraded
grassland soils, build soil health, and improve sustain-
ability (Teague et al. 2016; Franzluebbers et al. 2012). For
these reasons, farming practices that prevent conversion of
critical grasslands to croplands should be prioritized
(Wimberly et al. 2017). Furthermore, restoring grass in
areas dominated by croplands could be beneficial in many
cases, especially in regions less suited for crops (such as
areas where there is limited water; Allen et al. 2005).
• Sequestration of soil carbon. Recent studies indicate the
importance of not only reducing climate-disrupting
emissions, but also removing carbon from the atmosphere,
in part through soil sequestration (Paustian et al. 2016).
Soil carbon sequestration rates vary, depending on many
factors, such as region, climate, and the rate and duration
of sequestration (Paustian et al. 2016; West and Six 2007).
Reintegrating Land and Livestock | 3
However, there is evidence that soil carbon can be en-
hanced in several ways. For example, one study estimated
that widespread conversion of US cropland to pasture
could sequester carbon at 0.61 t CO2e/ac/y for a total of
about 10 Tg CO2e/y,9 enough to reduce US agricultural
production emissions by 36 percent (Hellwinckel and
Phillips 2012).10 Comparable rates have been observed
from integrating crop and livestock systems (4.45 t CO2e/
ac/y; Franzluebbers 2007), increasing or decreasing
grazing intensity (~0.5 t CO2e/ac/y; McSherry and Ritchie
2013; Conant, Paustian, and Elliott 2001), adopting
conservation practices (~0.2 t CO2e/ac/y in response to
cover crops, crop rotations, conservation tillage; Poeplau
and Don 2015; Powlson et al. 2014), and using
agroforestry (18 to 338 t CO2e/ac/y in trees and soils;
Albrecht and Kandji 2003).11 In some cases, soil carbon
sequestration in crop and graz-ing systems could mitigate
other emissions from livestock production (Rowntree et al.
2016; Teague et al. 2016). Despite the potential, soil
carbon is typically excluded from life cycle assessments
and similar analyses due to uncertainties (de Vries, van
Middelaar, and de Boer 2015).
• Reduction of reliance on inputs. Diverse agroecosystems
with healthy soils can provide additional benefits to
farmers and the environment by reducing the need for
costly and energy-intensive inputs. For example, practices
such as improved grazing management, cover cropping,
and legume-based rotations can reduce requirements for
synthetic nitrogen addition and, in some cases, reduce soil
N2O emissions (Davis et al. 2012; Wolf et al. 2010;
Tonitto, David, and Drinkwater 2006). In addition, having
crops and animals co-located can improve the efficient
disposal and use of manure (potentially further reducing
synthetic fertilizer needs and transportation costs;
Franzluebbers et al. 2014; Sulc and Tracy 2007; Peterson
and Gerrish 1995). Also beneficial, crop diversity, which
can be facilitated by integrated systems, can break pest
cycles and lower the prevalence of pests that cause disease
in plants and animals, thereby reducing the need for
pesticides (Karp et al. 2015; Keesing and Ostfeld 2015;
Gliessman 2014). Finally, animal health problems and
therefore the need for therapeutic antibiotic use are
reduced in well-managed grazing-based systems, with
benefits for both animal and human health (Mathews and
Johnson 2013).
• Reduction of water footprints. Water footprints can be
very high in beef management systems (Box 1), but best
management practices can reduce them (to around 1.6 to
3.3 gallons/ounce;12 Mekonnen and Hoekstra 2012; Allen
et al. 2005). Water footprints include three types of water:
blue (surface and groundwater), green (rainwater), and
gray (an indicator of water pollution). Demands on water
resources (blue and green water) can be reduced by
growing and breeding crops (including animal feeds) that
require less water and improve soil health, which in turn
can reduce risks of drought and floods (DeLonge and
Basche n.d.; Basche and DeLonge n.d., 2017; Janzen
2011; Hudson 1994). Water pollution can also be reduced
through ecologically based practices. For example,
strategic incorporation of perennials on farms (Helmers et
al. 2012) and reduced reliance on chemical inputs (Hunt,
Hill, and Liebman 2017; Seitzinger and Phillips 2017) can
reduce nutrient and chemical runoff from farms.
• Mitigation of animal emissions. Emissions from both
enteric fermentation and manure depend on the variety and
maturity of feeds, and can be reduced by factors such as
improved diets, genetics, grazing management, and herd
health (Hristov et al. 2013).13 Diet is the primary
determinant of animal emissions. Grass finishing leads to
higher methane emissions and less weight gain per day,
thereby requiring more time; in other words, grain has a
higher “feed efficiency” (Capper 2012). However,
emerging research suggests that higher-quality pasture can
reduce these differences (Chiavegato et al. 2015;
Chadwick et al. 2011) and that soil carbon in well-
managed grasslands can mitigate some of these emissions
(Teague et al. 2016; Wang et al. 2015). In integrated
systems, improvements in both grass and grain diet
components could reduce net emissions.
While there are several ways for farmers to improve
aspects of beef production systems, trade-offs—including those
related to productivity, climate, and land use—must be closely
evaluated. Furthermore, a key constraint for farm-based
solutions is that they must be practical and profitable for
farmers. Therefore, developing options for farmers must
involve a joint evaluation of the economic and environmental
opportunities and trade-offs. In the following section, we
investigate how reintegrating cattle and ecological practices
into landscapes currently dominated by intensive corn and soy
acres could affect farmers and the environment.

4 | UNION OF CONCERNED SCIENTISTS
BOX 1.
Why Focus on Beef?
There Is a Lot of Room for Improvement
Beef production systems in the United States are intertwined
with an industrial-scale farming system that brings challenging
consequences and significant room for improvement
(Springmann et al. 2016; Porter, Mitchell, and Moore 2015;
Veenstra and Burras 2015; Ripple et al. 2014; Greger and
Koneswaran 2010; Montgomery 2007). Outlined here are some
of the most significant environmental concerns (see Box 2 for
concerns linked to consumption):
• Water depletion and pollution: Animal products can have
large water footprints that contribute to drought risk, pollute
surface and groundwater, create dead zones, damage
fisheries, and deplete water reservoirs (Basche and Edelson
2017; Sobota et al. 2015; Barton and Clark 2014). In US
industrial systems, beef’s footprint has been estimated to be
on average 29 gal/oz,14 depending on cattle diet and
management (Mekonnen and Hoekstra 2012). This value is
partly attributable to corn feed; corn receives more
irrigation water than any other crop (17.9 million acre-feet
per year) and 87 percent of irrigated corn is grown in areas
with high or extremely high water stress (Barton and Clark
2014; NASS 2014).15 Grazing systems can have even
higher water footprints when green water (rainwater) is
included, because more feed is needed per animal due to
lower feed efficiency and longer finishing times. However,
such systems can conserve and boost water resources (e.g.,
blue and green water use; Mekonnen and Hoekstra 2012),
especially when best management practices are used to
improve soil water properties (e.g., water holding capacity
and infiltration rates; DeLonge and Basche n.d.; Basche and
DeLonge n.d., 2017; Basche 2017).
• Climate-disrupting emissions: Beef cattle have a large
climate footprint, including emissions from digestion
(enteric fermentation), manure management, and soils (from
fertilizers and manure deposited by cattle).16 In the United
States, beef cattle have been estimated to contribute about 2
to 3 percent of total emissions (Gurian-Sherman 2011),
which is high, considering that the agriculture sector
contributes 7.9 percent of emissions (EPA 2017).17 Studies
in various systems have reported that the climate footprint
of one pound of beef is around 0.03 to 0.07 t CO2e (de
Vries, van Middelaar, and de Boer 2015).ii Grain-based
systems have been found to have 4 to 48 percent (average
28 percent) lower footprints than grass-based systems, due
largely to higher enteric fermentation and longer finishing
times in the latter. However, such comparisons have
typically excluded soil carbon dynamics and are sensitive to
several management factors (de Vries, van Middelaar, and
de Boer 2015).18
• Soil health: Agriculture often leads to erosion19 and soil
carbon losses, creating climate-disrupting emissions while
reducing soil health and farm resilience (Sanderman, Hengl,
and Fiske 2017; Amundson et al. 2015). Losses associated
with beef production can result from practices such as
conversion of grasslands to croplands (typically 0.7 to more
than 3 t CO2e/ac/y; Paustian et al. 2016) and poor grazing-
land management (including overgrazing, up to 2.2 t
CO2e/ac/y; McSherry and Ritchie 2013). While there are no
estimates of soil carbon losses due specifically to beef
production, significant acreage could be affected. For
example, 21 to 46 million acres of US corn were likely used
for beef cattle in 2016.20 Also, there are about 777 million
acres of US grazing land (Nickerson et al. 2011), and
previous studies have estimated that more than 100 million
are poorly managed or degraded.21 Finally, recent
conversion of grasslands to croplands may be associated
with losses of soil carbon (6 million acres or more; Gage,
Olimb, and Nelson 2016; Lark, Salmon, and Gibbs 2015).22
• Overuse of antibiotics: Antibiotics are administered to
livestock to treat and prevent illness or to promote growth.
Seventy percent of antibiotics sold in the United States and
that are considered important for humans are used for
livestock and poultry production—though many of the
animals are not sick—and this use can lead to antibiotic
resistance in humans (Stashwick et al. 2016). While
therapeutic uses of antibiotics are critical to treat sick
animals, nontherapeutic uses are common and problematic.
The estimated annual health care cost for antibiotic-resistant
infections totals around $20 billion (CDC 2013), and
despite recent Food and Drug Administration guidance
directing producers to avoid antibiotic use for growth
promotion, overuse has not substantially improved
(Stashwick et al. 2016).23 Conventional beef production
systems rely on nontherapeutic use of antibiotics typically
to maximize growth and prevent the contraction and spread
of illness in concentrated facilities (Mathews and Johnson
2013; Gustafson and Bowen 1997).

Reintegrating Land and Livestock | 5
Analysis: Assessing the Benefits of Integrating
Grass, Grazing, and Agroecology into
Cropping Systems
To explore the effects of transitioning conventional farming
practices to integrated, conservation-based alternatives, we
developed and analyzed several scenarios for economic and
environmental modeling (Figure 2). We based our analysis on a
simple, farmer-tested economic tool, which we expanded to
consider environmental and policy implications. The economic
tool was designed for farmers to evaluate financial returns from
different cropping systems, including options for integrating
continuous living cover and grazing (Land Stewardship Project
Cropping Systems Calculator [CSC]; Wasserman-Olin 2016).24
The CSC model does not predict specific income, but rather a
range of returns. Originally optimized for a 10-county region in
Minnesota’s Chippewa River Watershed, the model is most
applicable to neighboring regions in the US Corn Belt.
However, we designed our scenarios to be relevant to areas in
the Great Plains and eastern United States that have sufficient
access to water to be used for commodity crops. Critically, this
analysis does not directly pertain to the more arid western
grasslands, where grazing is already in place and many grass-
lands remain but are degraded (Box 1). For those areas, regen-
erative grassland management practices are the highest priority.
In our analysis, we modeled various cases of crop-
based farms transitioning fully or partially to grasses, grazing,
and complex crop rotations (Figure 2). For all scenarios, the
integration of grazing in farms was modeled as a custom
grazing operation during the finishing phase of cattle produc-
tion. In addition, the “improved” grazing option we used from
the CSC was “managed intensive,” which is characterized by
higher forage productivity, as opposed to both “continuous”
and standard “rotational” grazing (Teague and Barnes 2017).
The model scenarios included:
• Full transition of conventional crops to grass (Scenario
1). To explore the potential effect of a significant
management change, we considered the case of 100
percent conversion of a corn-soy system to perennial
pasture with either continuous (Scenario 1a) or improved
(Scenario 1b) grazing.
• Partial transition of conventional crops to grass
(Scenario 2). To evaluate a more moderate shift in prac-
tices, we considered the effect of partial conversion (33
percent) of a corn-soy system to perennial pasture with
improved grazing. In Scenario 2a, we assumed that the rest
of the farm (67 percent) remained in the corn-soy rotation.
In Scenarios 2b and 2c, these corn-soy acres were convert-
ed to a four-crop rotation (corn-soy-oats/alfalfa-alfalfa)
where alfalfa was either grazed (Scenario 2b) or harvested
(Scenario 2c). In addition, to test the sensitivity of our
results to yields and prices, we made simple modifications
to Scenario 2c. We first considered the case where yields
of corn and soy increased in the four-crop rotation due to
boosted soil health.25 We then also considered the addi-
tional circumstance of increased prices of corn and soy.26
• Partial transition of diversified crops to grass (Scenario
3). To assess the impact of adding grasses and grazing to a
farm already using conservation practices, we considered
the effects of converting 33 percent of land in a four-crop
rotation (corn-soy-oats/alfalfa-alfalfa) to perennial pasture
with improved grazing.
In addition to using the CSC to explore on-farm
economic outcomes of these conversion scenarios, we
estimated the value of select environmental outcomes,
including climate and water variables. For climate emissions,
we considered potential soil carbon gains as well as prevented
FIGURE 2. Original and Alternative Model Scenarios
In Scenarios 1 and 2, the original system is a conventional corn-soy
rotation with no animals on-farm. In Scenario 3, the original system
is a four-crop rotation with oats and alfalfa, and no animals on-
farm. All alternative scenarios include at least a partial conversion
to pasture with continuous (Scenario 1a) or intensively managed (all
others) grazing. Cattle are not drawn to scale but illustrate whether
animals supported by the model farm production are located off-field
(feedlot) or on-field (grazing). Also, all scenarios that include an
assumption of reduced feed efficiency relative to the Scenario 1 case
are represented with one fewer animal, as an indicator of potentially
reduced productivity.
6 | UNION OF CONCERNED SCIENTISTS
emissions from reduced synthetic fertilizer and fuel use, but not
changes to cattle emissions from manure or enteric
fermentation (Table A2). We did not include changes to cattle
emissions because the model was not capable of estimating
altered total cattle numbers at a larger scale due to changes in
supply and demand. However, the shift in proportion of animal
feeds represented in the scenarios are likely to be linked with
changing animal performance, productivity, and related
changes to emissions and land requirements (de Vries, van
Middelaar, and de Boer 2015). We therefore conducted some
simple calculations to explore the number of cattle likely
supported by each land base, using common assumptions
regarding feed efficiencies, and we discuss the potential
implications (Box 3).
For calculations involving climate emissions, we
approximated the public value associated with net changes to
greenhouse gas emissions using published estimates for the
social costs of carbon and nitrous oxide ($41/t CO2 and
$14,860/t N2O in 2015 dollars; IWGSCGG 2016a, b27). For the
purposes of this analysis, we used these values to approximate
the value of reduced climate emissions from the farm scale,
assuming that cattle numbers and emissions overall stayed the
same or decreased (Box 3). We also estimated payments for
which farmers may be eligible through US Department of
Agriculture (USDA) conservation programs, to get a sense for
the existing public incentives that farmers could benefit from
for adopting such practices and to compare these amounts to
the estimated public value of farm-based benefits (soil carbon,
reduced synthetic fertilizer and fuel). While conservation
payments are highly uncertain, we assumed $18/ac for land
converted to perennial pasture and $15/ac for adopting
complex, “resource conserving” crop rotations.28 Finally, we
also estimated the impact of our scenarios on farm-level water
footprints (green and gray water;29 Table A2; Mekonnen and
Hoekstra 2012).
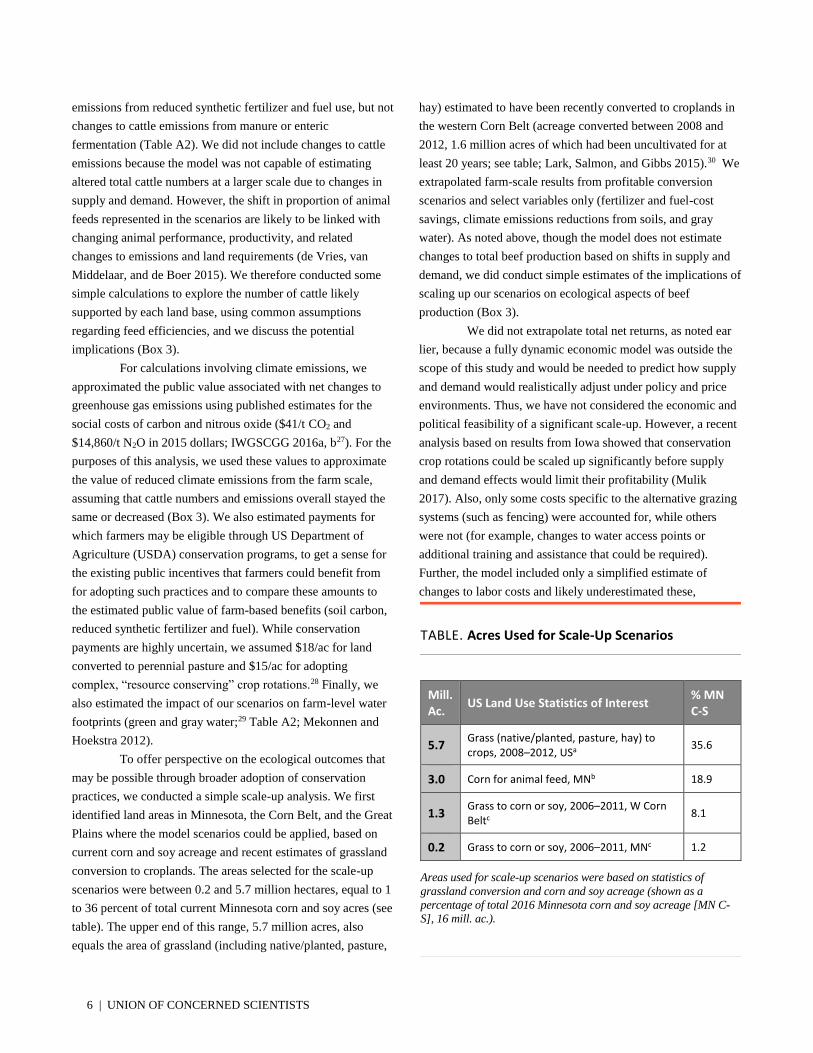
To offer perspective on the ecological outcomes that
may be possible through broader adoption of conservation
practices, we conducted a simple scale-up analysis. We first
identified land areas in Minnesota, the Corn Belt, and the Great
Plains where the model scenarios could be applied, based on
current corn and soy acreage and recent estimates of grassland
conversion to croplands. The areas selected for the scale-up
scenarios were between 0.2 and 5.7 million hectares, equal to 1
to 36 percent of total current Minnesota corn and soy acres (see
table). The upper end of this range, 5.7 million acres, also
equals the area of grassland (including native/planted, pasture,
hay) estimated to have been recently converted to croplands in
the western Corn Belt (acreage converted between 2008 and
2012, 1.6 million acres of which had been uncultivated for at
least 20 years; see table; Lark, Salmon, and Gibbs 2015).30 We
extrapolated farm-scale results from profitable conversion
scenarios and select variables only (fertilizer and fuel-cost
savings, climate emissions reductions from soils, and gray
water). As noted above, though the model does not estimate
changes to total beef production based on shifts in supply and
demand, we did conduct simple estimates of the implications of
scaling up our scenarios on ecological aspects of beef
production (Box 3).
We did not extrapolate total net returns, as noted ear
lier, because a fully dynamic economic model was outside the
scope of this study and would be needed to predict how supply
and demand would realistically adjust under policy and price
environments. Thus, we have not considered the economic and
political feasibility of a significant scale-up. However, a recent
analysis based on results from Iowa showed that conservation
crop rotations could be scaled up significantly before supply
and demand effects would limit their profitability (Mulik
2017). Also, only some costs specific to the alternative grazing
systems (such as fencing) were accounted for, while others
were not (for example, changes to water access points or
additional training and assistance that could be required).
Further, the model included only a simplified estimate of
changes to labor costs and likely underestimated these,
TABLE. Acres Used for Scale-Up Scenarios
Mill. Ac.
US Land Use Statistics of Interest % MN C-S
5.7 Grass (native/planted, pasture, hay) to crops, 2008–2012, USa
35.6
3.0 Corn for animal feed, MNb 18.9
1.3 Grass to corn or soy, 2006–2011, W Corn Beltc
8.1
0.2 Grass to corn or soy, 2006–2011, MNc 1.2
Areas used for scale-up scenarios were based on statistics of
grassland conversion and corn and soy acreage (shown as a
percentage of total 2016 Minnesota corn and soy acreage [MN C-
S], 16 mill. ac.).
Reintegrating Land and Livestock | 7
particularly during the early stages of transition. However, we
have likely also underestimated the value of improved
synergies that would be facilitated by more integrated
systems—such as reduced costs of transportation, fertilizer, or
feed—because of proximity or economic efficiencies.31
RESULTS: POTENTIAL FOR PROFITS AND
ENVIRONMENTAL VALUE
Despite trends toward increasingly separated animal and crop
production due to economies of scale and cheap feed crops, our
model shows scenarios where it is viable for farmers with
cropping systems to integrate grass and grazing into their
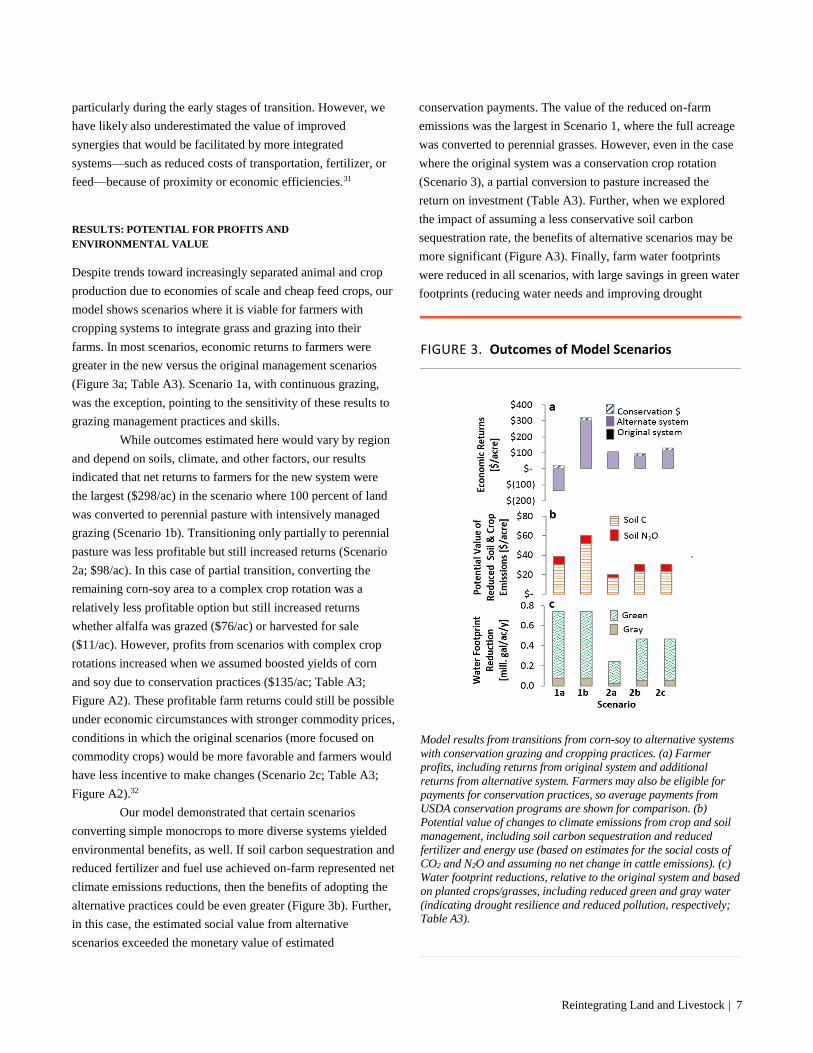
farms. In most scenarios, economic returns to farmers were
greater in the new versus the original management scenarios
(Figure 3a; Table A3). Scenario 1a, with continuous grazing,
was the exception, pointing to the sensitivity of these results to
grazing management practices and skills.
While outcomes estimated here would vary by region
and depend on soils, climate, and other factors, our results
indicated that net returns to farmers for the new system were
the largest ($298/ac) in the scenario where 100 percent of land
was converted to perennial pasture with intensively managed
grazing (Scenario 1b). Transitioning only partially to perennial
pasture was less profitable but still increased returns (Scenario
2a; $98/ac). In this case of partial transition, converting the
remaining corn-soy area to a complex crop rotation was a
relatively less profitable option but still increased returns
whether alfalfa was grazed ($76/ac) or harvested for sale
($11/ac). However, profits from scenarios with complex crop
rotations increased when we assumed boosted yields of corn
and soy due to conservation practices ($135/ac; Table A3;
Figure A2). These profitable farm returns could still be possible
under economic circumstances with stronger commodity prices,
conditions in which the original scenarios (more focused on
commodity crops) would be more favorable and farmers would
have less incentive to make changes (Scenario 2c; Table A3;
Figure A2).32
Our model demonstrated that certain scenarios
converting simple monocrops to more diverse systems yielded
environmental benefits, as well. If soil carbon sequestration and
reduced fertilizer and fuel use achieved on-farm represented net
climate emissions reductions, then the benefits of adopting the
alternative practices could be even greater (Figure 3b). Further,
in this case, the estimated social value from alternative
scenarios exceeded the monetary value of estimated
conservation payments. The value of the reduced on-farm
emissions was the largest in Scenario 1, where the full acreage
was converted to perennial grasses. However, even in the case
where the original system was a conservation crop rotation
(Scenario 3), a partial conversion to pasture increased the
return on investment (Table A3). Further, when we explored
the impact of assuming a less conservative soil carbon
sequestration rate, the benefits of alternative scenarios may be
more significant (Figure A3). Finally, farm water footprints
were reduced in all scenarios, with large savings in green water
footprints (reducing water needs and improving drought
FIGURE 3. Outcomes of Model Scenarios
.
Model results from transitions from corn-soy to alternative systems
with conservation grazing and cropping practices. (a) Farmer
profits, including returns from original system and additional
returns from alternative system. Farmers may also be eligible for
payments for conservation practices, so average payments from
USDA conservation programs are shown for comparison. (b)
Potential value of changes to climate emissions from crop and soil
management, including soil carbon sequestration and reduced
fertilizer and energy use (based on estimates for the social costs of
CO2 and N2O and assuming no net change in cattle emissions). (c)
Water footprint reductions, relative to the original system and based
on planted crops/grasses, including reduced green and gray water
(indicating drought resilience and reduced pollution, respectively;
Table A3).
8 | UNION OF CONCERNED SCIENTISTS
resilience) and additional savings in gray water (indicating
reduced water pollution; Figure 3c).
Based on our model results, if a farmer converted
one-third of a 1,000-acre conventional corn-soy farm to a well-
managed, grass-based grazing system (Scenario 2a),33 each
year they could potentially save $28,000 in fertilizer costs and
$1,500 in fuel costs; reduce climate emissions from fertilizer,
fuel, and soils by more than 400 t CO2e;34 reduce the farm
water footprint by 280 million gallons;35 and generate $98,000
in profit. Other conversion scenarios—such as transitioning
additional corn-soy acreage to grasslands (Scenario 1),
adopting complex crop rotations (Scenarios 2b and 2c), or
otherwise improving aspects of the cropping systems—could
add to these farm-scale economic and environmental benefits
(for a discussion of impact on productivity and cattle
emissions, see Box 3).
Finally, if more farmers adopted these ecological
practices, more benefits could be accrued. While we did not
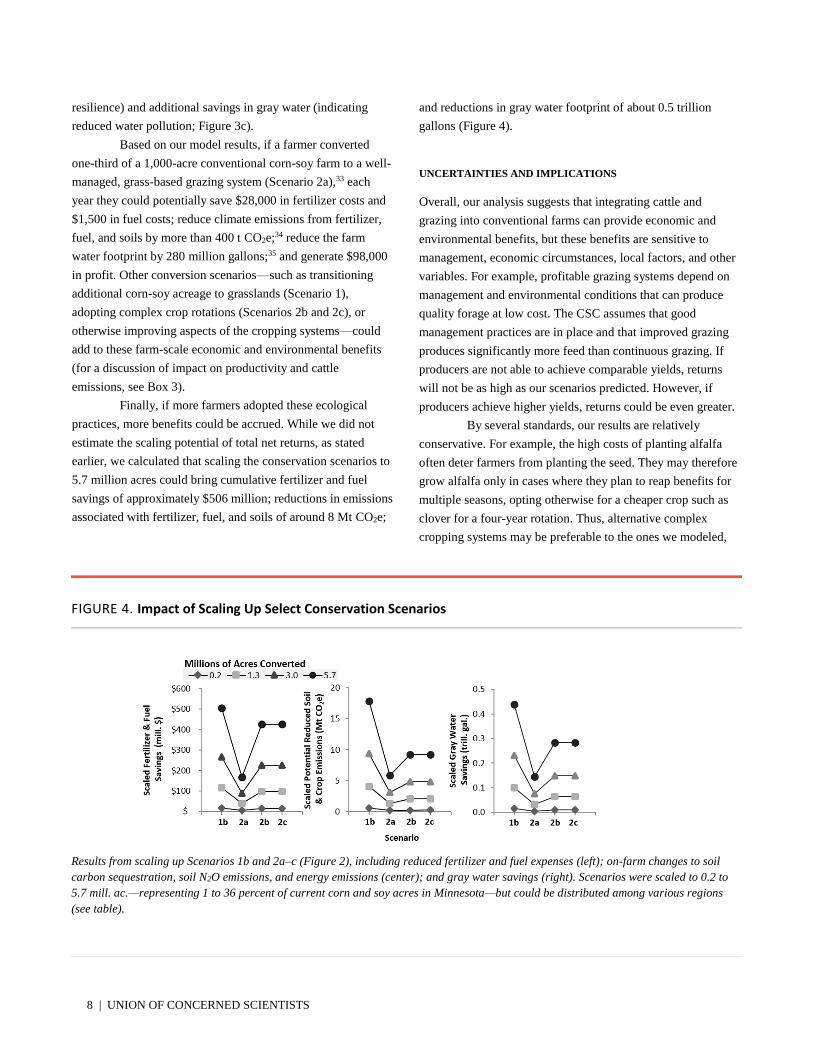
estimate the scaling potential of total net returns, as stated
earlier, we calculated that scaling the conservation scenarios to
5.7 million acres could bring cumulative fertilizer and fuel
savings of approximately $506 million; reductions in emissions
associated with fertilizer, fuel, and soils of around 8 Mt CO2e;
and reductions in gray water footprint of about 0.5 trillion
gallons (Figure 4).
UNCERTAINTIES AND IMPLICATIONS
Overall, our analysis suggests that integrating cattle and
grazing into conventional farms can provide economic and
environmental benefits, but these benefits are sensitive to
management, economic circumstances, local factors, and other
variables. For example, profitable grazing systems depend on
management and environmental conditions that can produce
quality forage at low cost. The CSC assumes that good
management practices are in place and that improved grazing
produces significantly more feed than continuous grazing. If
producers are not able to achieve comparable yields, returns
will not be as high as our scenarios predicted. However, if
producers achieve higher yields, returns could be even greater.
By several standards, our results are relatively
conservative. For example, the high costs of planting alfalfa
often deter farmers from planting the seed. They may therefore
grow alfalfa only in cases where they plan to reap benefits for
multiple seasons, opting otherwise for a cheaper crop such as
clover for a four-year rotation. Thus, alternative complex
cropping systems may be preferable to the ones we modeled,
FIGURE 4. Impact of Scaling Up Select Conservation Scenarios
Results from scaling up Scenarios 1b and 2a–c (Figure 2), including reduced fertilizer and fuel expenses (left); on-farm changes to soil
carbon sequestration, soil N2O emissions, and energy emissions (center); and gray water savings (right). Scenarios were scaled to 0.2 to
5.7 mill. ac.—representing 1 to 36 percent of current corn and soy acres in Minnesota—but could be distributed among various regions
(see table).

Reintegrating Land and Livestock | 9
but such systems require additional research to be optimized for
different regions. Additionally, our analysis generally does not
capture the “economies of scope” of diverse farms—such as
reduced feed costs, pesticide costs, and manure-based fertilizer
availability—possible under best management practices
(Gameiro, Rocco, and Caixeta Filho 2016).
Current knowledge gaps about the environmental
benefits of alternative practices created some uncertainties in
our analysis. For example, the potential carbon sink resulting
from different practices remains an area of active research
(Paustian et al. 2016; Teague et al. 2016; West and Six 2007),
but it is known to vary considerably, depending on factors such
as climate, region, soil type, land-use history, and grazing
management. We assumed relatively conservative sequestration
rates, but in cases where higher rates are attainable, benefits
could be greater, and vice versa (Figure A3). In contrast,
conventional monocrop systems often experience soil carbon
losses through erosion (4.7 t soil/ac, about 58 percent of which
is carbon; NRCS 2015), a factor for which we did not account.
Another area of active research is the magnitude of N2O
emissions from fertilizer application. We used the same
emissions factor to estimate N losses from both the corn-soy
and alternative systems. Thus, we may have underestimated
potential savings from the ecological practices (Shcherbak,
Millar, and Robertson 2014). Likewise, water footprints for
different crops are sensitive to local landscapes, soils, climates,
and practices. Since we based our model on average published
values for water footprints, it is likely that farmers who are
applying the best management practices could further improve
water savings. Lastly, uncertainties surround other variables,
such as enteric fermentation and manure emissions, that we
were not able to include our model (described earlier).
Additional research could be targeted toward improving
understanding of these variables and identifying best
management practices for alternative production systems.
Extrapolating our model results to explore the impact
of scaling up scenarios also included numerous uncertainties, as
wider adoption rates of such practices could affect total cattle
inventories and therefore influence livestock-sector emissions,
particularly those related to enteric fermentation and manure
management. Our ecologically based scenarios were still
productive and even more profitable for farmers, but
implementing such systems may require more land and emit
more total climate emissions if beef production rates were to
remain constant. Therefore, maintaining or decreasing climate
emissions overall while transitioning to such systems would
require reduced beef production and/or optimized integrated
systems with substantial soil carbon sequestration (Box 3).
Finally, our analysis focused on a limited set of
cropping system scenarios, and additional research is needed to
evaluate the likely profitability and benefits of other integrated
and diverse systems. To date, only a handful of studies on
integrated crop-livestock systems have been conducted, but
several have found that integrating grazing animals into
cropping systems can be profitable due to a variety of factors
such as lower fertilizer and irrigation needs and improved
waste management (Poffenbarger et al. 2017; Gameiro, Rocco,
and Caixeta Filho 2016; Hilimire 2011).36
Conclusions and Recommendations
Beef production systems, including intensive monocropping of
animal feed, have been linked to significant environmental and
human health challenges, and Congress and the USDA can
mitigate these challenges through policy changes. We propose
that shifting farming practices and reducing conventional beef
production together can benefit farmers while potentially
reducing climate-disrupting emissions; increasing resilience to
droughts and floods; reducing water pollution; and restoring
diversity of native plants, fish, and wildlife. Our analysis shows
that farms including cattle can contribute to this broader push
through ecological, integrated crop-livestock production
systems that are expanded alongside reduced conventional beef
production. However, to achieve desirable and balanced
outcomes, integrated systems must be optimized through
strategic diversification of systems from local to regional
levels, and by incorporating crop rotations, cover crops, and
more techniques. Such a transformation could benefit farmers
and the public, and we propose several policy recommen-
dations that can help to support farmers and researchers in
building better beef production systems and that can facilitate a
food system that relies on less total beef.
• Bolster programs to encourage farming practices that
boost soil health. The Natural Resources Conservation
Service (NRCS) offers programs and financial incentives
to support farmers’ adoption of practices that conserve
resources, build farm resiliency, and sequester soil carbon.
These practices include conversion to perennial pasture,
grassland conservation, improved grazing management,
complex crop rotations, cover cropping, improved manure
management, conservation tillage, and agroforestry.
10 | UNION OF CONCERNED SCIENTISTS
Congress and the USDA should protect and enhance
NRCS programs to incentivize a transformation that could
benefit farmers and taxpayers:
- The Conservation Stewardship Program (CSP) offers
financial and technical assistance to farmers to
promote conservation and improvement of soil, water,
and air. Payments for regenerative and climate-
friendly practices—including integration of animals
into well-managed diversified farms—should be
increased. Also, managed grazing systems (such as
management-intensive rotational grazing or adaptive
multi-paddock grazing) should be added as a practice
qualifying for a supplemental payment within CSP.
- The Conservation Reserve Program (CRP) offers an
important avenue to protect land and deliver numer-
ous services (Johnson et al. 2016). However, contracts
limit the availability of land for agricultural use and
last just 10 to 15 years, and benefits can be lost when
contracts end (Hellerstein 2017; Morefield et al. 2016;
Vandever and Allen 2015). The CRP could be
improved by expanding CRP Grasslands, a program
that allows grazing on protected acres, and by
offering additional technical assistance to help
producers implement sustainable grazing manage-
ment plans.
- The Environmental Quality Incentives Program
(EQIP) provides financial and technical assistance to
producers and landowners to plan and install
structural, vegetative, and land management practices.
The program could promote adoption of regenerative
agricultural practices by shifting more resources to
farms that implement diverse crop and livestock
farming systems and moving resources away from
CAFO expansion. Such a shift could be facilitated by
emphasizing grazing management for pasture quality
within EQIP funding for prescribed grazing, and by
reimbursing land management practices at 75 percent
while reimbursing infrastructure at a maximum of 50
percent. In addition, the Conservation Innovation
Grants within the EQIP program should be increased,
and new funds should prioritize innovations related to
cropping and grazing in diverse, integrated systems.
• Improve education, technical assistance, and regula-
tions to support farmers and ranchers in adopting
BOX 2.
What about Health? Less Beef Is Better, and
Source Matters
Today, the US Dietary Guidelines for Americans recommends
that Americans consume 26 oz.-equivalents per week (3.7 oz-eq/
day) of meat, poultry, and eggs,37 and most Americans are close
to meeting these recommended amounts—or they exceed them.38
Based on data about current diets and decades of scientific liter-
ature, the 2015 Dietary Guidelines Advisory Committee (DGAC)
recently recommended that Americans shift to diets lower in red
and processed meat and higher in fruits and vegetables.39 This
recommendation was based largely on scientific evidence that
such dietary patterns can reduce health risks, particularly for
cardiovascular disease but also for obesity, type 2 diabetes, and
some types of cancer (DGAC 2015). The committee made
science-based recommendations that the Dietary Guidelines con-
sider sustainability and noted that beef was the food with the
greatest environmental impact. However, this recommendation
was not integrated into the final US Dietary Guidelines. Never-
theless, recommendations from the expert advisory committee
suggest that eating less beef can contribute to positive health for
many Americans, while also delivering environmental benefits.40
But what about “better” beef? Studies have shown that grass-
finished cattle may have improved fatty acid composition and
antioxidant content (Daley et al. 2010). Similarly, other research
has indicated that organic meat, which could be produced with
organic grass or grains, may reduce risks of cardiovascular
disease (Srednicka-Tober et al. 2016). Such research
demonstrates that meat produced in alternative systems may
offer greater nutritional benefits than conventional beef.
However, as described in this report, research has found that
many alternative beef production systems produce less beef per
acre and more emissions per pound of beef, posing potential
challenges and trade-offs (Box 3). Therefore, consumers seeking
“better” beef may want to purchase products from farms using
the best management practices and to eat less beef if they aim to
reduce the carbon or land footprints of their diets. Currently,
such beef can be hard to find and more expensive (Cheung et al.
2017), a condition that is unlikely to change if the USDA or
other stakeholders do not take measures to increase marketing
and education.
Reintegrating Land and Livestock | 11
innovative practices. Despite the economic and
environmental viability of improved, integrated cropping
and grazing systems, scaling these up will require much
stronger support for farmers who must overcome barriers
(DeLonge and Basche 2017). For example, additional
technical service providers will be needed to assist farmers
seeking to begin or improve grazing practices. Congress
should direct the NRCS to significantly expand its pool of
technical service providers in the field of mixed crop-
livestock and adaptive management systems so that farm-
ers can get the support they need. Ensuring greater access
to the nation’s broader network of grazing system manage-
ment trainers would be a great step forward. On public
lands utilized for grazing, Congress should direct the
Bureau of Land Management to review federal regulations
regarding grazing programs to ensure that they reflect the
latest science on sustainability (with respect to soil carbon,
water, and climate emissions) and that producers can
implement the most ecologically sound practices.
• Revamp crop insurance to remove obstacles that
hamper farmers’ ability to reduce risks. Current farm
policy overwhelmingly incentivizes large-scale, monocrop
grain systems and presents obstacles for farmers interested
in alternatives (Wright 2015). Congress and the USDA
should shift the federal crop insurance program toward
incentivizing more regenerative practices and away from
disproportionately incentivizing industrial animal and
monocrop production systems.
- The Federal Crop Insurance Corporation is the
USDA’s largest farmer safety net, providing
producers with insurance policies that protect them
against losses to their yields and revenue. However,
the program does not consider the role of soils and
discourages resilient farming strategies, such as cover
cropping (Woodard and Verteramo-Chiu 2017;
Ristino and Steier 2016). We recommended that
future policies include soil data in insurance
formulations and develop risk management programs
specific to sustainable products.
- The Whole-Farm Revenue Protection Pilot Program
(WFRP), established in the 2014 farm bill, is a new
type of crop insurance designed for diverse farms that
are growing a range of commodities, including farms
selling to local or regional markets and producing
specialty, value-added crop and animal products. As
the program is relatively new, the current priority is to
increase awareness and educational and staff training
materials in support of WFRP.
• Increase public investment in agroecological research.
Currently, a lack of public research funding for
agroecology is slowing the adoption and continued
improvement of regenerative farming practices (Miles,
DeLonge, and Carlisle 2017; DeLonge, Miles, and Carlisle
2016). Congress and the USDA should increase funding
for key research programs and prioritize projects
investigating more regenerative and integrated cropping
and grazing systems, including adaptive grazing
management and diverse feed production systems. Key
programs include the Agriculture and Food Research
Initiative (the USDA’s largest competitive grants
program), the Sustainable Agriculture Research and
Education program (the only funding program dedicated to
sustainable farming practices), and the Organic Agricul-
ture Research and Extension Initiative (a critical program
supporting agroecological research for organic farming).
Also, because long-term research is particularly needed for
these areas of study, programs such as those affiliated with
the USDA’s Long-Term Agroecosystem Research
Network should be directed to support more research into
regenerative integrated cropping and grazing systems.
• Improve and develop programs that help regenerative
producers thrive. Small and midsize farming systems
transitioning to regenerative practices are often more
disadvantaged than conventional systems, but Congress
and the USDA could create a more level playing field by
adjusting policies to:
- Allow producers who receive relevant certifications
(such as third-party organic, grass-fed and humane
certifications) to opt out of the beef check-off pro-
gram so that they can use their resources to promote
products that the check-off program does not
market.41
- Improve and develop aggregation programs, such as
the Local Food Promotion and Value-Added Producer
Grant programs, to make small and mid-scale
improved beef production more viable.
- Support programs and strategies that develop or use
certifications, labeling, or consumer education to help
distinguish beef produced in more regenerative
systems. Such programs should verify not only what
the cattle consume, but also that they were raised on
credible, well-managed ranches and farms.
12 | UNION OF CONCERNED SCIENTISTS
- Increase the accessibility and affordability of beef
from improved systems. Currently, beef products
from specialized systems typically cost 25 to 40
percent more than conventionally produced meat
(Cheung et al. 2017). Thus, the latter is the only
economically viable option for many people.
• Begin to transform existing policies and regulations
that disproportionately incentivize industrial-scale
production of feed crops in monoculture and cattle in
CAFOs. The USDA could take several steps to reduce the
negative impact of large-scale monocultures and CAFOs,
such as reducing nontherapeutic uses of antibiotics and
pushing back against consolidation. However, these
changes must be paired with strengthened conservation
compliance on grasslands and rangelands to avoid any
shifts that unintentionally further degrade those systems.
• Align the US Dietary Guidelines for Americans with
science-based Dietary Guidelines Advisory Committee
recommendations to encourage a shift toward more
nutrient-dense protein sources and more rigorous
sustainability standards. The current Dietary Guidelines
recommend that the general population shift dietary
patterns to include a greater variety of nutrient-dense
protein options—including seafood, legumes, and lean and
low-sodium meats—and that teen boys and adult men
reduce overall intake of protein foods such as meat,
poultry, and eggs. The guidelines should be strengthened
to match those of the 2015 Dietary Guidelines Advisory
Committee (DGAC 2015), which more broadly
recommended shifting to diets lower in red and processed
meat and higher in fruits and vegetables, based in part on
their finding that these products (and especially beef) had
the greatest environmental impact. The guidelines should
also recognize the different nutritional profiles and
environmental effects between and among protein sources,
including differences between grass- and grain-based
meat. Due to the human, animal, and environmental health
benefits associated with well-managed beef systems that
do not rely heavily on antibiotics, growth hormones,
chemical fertilizers, and pesticides, products from these
systems should be prioritized over those sourced from
highly concentrated, feedlot systems associated with
environmental degradation and growing antibiotic
resistance.
BOX 3.
Balancing Trade-Offs by Producing Less and Better Beef
In the alternative systems considered in this analysis, we
estimated higher profits for farmers and more environmental
benefits on a per area basis. However, we also estimated lower
beef production per acre, based on our model assumptions.
Under these circumstances, farms were more ecologically and
economically sustainable, but less beef production was supported
per acre. This outcome could put the overall benefits of
alternative systems at risk if demand were to remain constant.
For example, while there are cases where using more land could
be beneficial (for example, if that land is protecting or improving
grasslands), doing so could also be detrimental (e.g., diverse
grasslands could be converted to nondiverse croplands, or
diverse forests to poorly managed grasslands). Furthermore,
since incorporating more grass into cattle diets would increase
animal emissions, use of the currently available alternatives to
maintain a constant level of production would contribute
additional emissions.
For these reasons, optimal outcomes may result from pairing
best land management practices with policies that simultaneous-
ly reduce overall conventional beef consumption. With this idea
in mind, we explored how much US beef consumption may need
to decline to keep land use constant and to secure reduced net
climate emissions in some of our scenarios.42 Our calculations
indicated that the required decrease in beef production as a result
of scaling scenarios to 5.7 mill. ac. might amount to 347 to 924
mill. lbs. per year. This reduction, when spread across the US
population, would equate to a reduction of just a fraction of one
serving of beef per week (0.3 to 0.9 oz/wk less beef; Figure
A4),43 a relatively small amount that could potentially contribute
to improved diets for many Americans (Box 2).
An important thing to consider is that the productivity of any
agroecosystem could be increased or reduced in response to
management and environmental factors, and that yields and total
production are likely to change over both spatial and temporal
scales. Furthermore, additional products and services (tangible
and intangible) are delivered by such systems but not captured in
this analysis. Therefore, our results offer just a snapshot of the
potential outcomes of adopting alternative practices.
Ultimately, healthier soils are expected to support more
resilient and productive farms. Thus, a key first step to improve
sustainability is to implement and develop practices that build
soil health. Additional policies and programs should then be put
into place to prevent the expansion of any systems that are not
ecologically sustainable.
Reintegrating Land and Livestock | 13
[ENDNOTES]
1 Cheap prices are driven by factors such as high yields,
government incentives, and economies of scale. 2 Finishing time depends on factors such as entry weight and
diet (Table A1). 3 In 2016, 86.7 million acres of corn (138 million metric tons
[Mt]) were harvested in the United States (NASS 2017). Of
all corn, 35.8 percent went to feed (ERS 2017). Beef cattle
consumed 24.7 percent of feed (poultry and hogs consumed
33.1 percent and 30.5 percent, respectively; the remainder
went to dairy and other livestock) (ERS 2017). While these
proportions were calculated using additional feeds (sorghum,
barley, oats, wheat), corn represents a majority (more than 90
percent). Thus, if 24.7 percent of corn for feed went to beef
cattle, this represents 8.8 percent of all corn. Alternatively,
one could assume that all 17 million steers (or all 31 million
cattle) slaughtered were finished on a ration with 1,037
kilograms of corn (Lupo et al. 2013), which would indicate
that 17 to 32 Mt of corn (or 13 to 23 percent of corn) were
used for cattle finishing in 2016. These estimates are in the
range of previously reported estimates in various years: 10
percent (Barton and Clark 2014), 15 percent (Williams 2016),
and 20 percent (Gurian-Sherman 2011). In addition, about 35
percent of all corn goes to ethanol and by-products, including
distillers grains, which are also oftentimes used to feed cattle
(Barton and Clark 2014). 4 Ruminants (such as cattle, sheep, and goats) have stomachs
that can digest some foods, such as grasses, that nonruminants
(such as poultry and hogs) cannot. 5 Farmers in sixteenth-century Europe discovered that growing
livestock and crops together could boost yields, prompting an
agricultural revolution, but integration declined after World
War II, due to new machinery designed to operate in uniform
systems and the use of chemical pesticides and fertilizers
(Gliessman 2014). In 2014, 48 states grew grain, but only four
integrated livestock into at least 4 percent of operations
(Figure A1). 6 For definition and details on CAFOs see EPA (2012). 7 The remaining 20 to 30 percent of production occurs in
CAFOs with between 1,000 and 32,000 cattle. 8 Harun and Ogneva-Himmelberger (2013) investigated
chicken, hog, and cattle CAFOs and only found significant
environmental justice issues with respect to minority
populations for chicken CAFOs. Cattle farms had
significantly higher white populations near CAFOs as
compared to other areas, but also had a higher percentage of
white population below the poverty line.
9 CO2e is CO2 equivalents, the unit for Global Warming
Potential (GWP). GWPs quantify gases’ ability to trap heat in
the atmosphere (GWPs of CO2, CH4, and N2O are 1, 25, and
298 CO2e, respectively, 100-year time horizon; IPCC 2014) 10 The study considered only sequestration in rain-fed grazing
land east of the 100th parallel, where there is greater certainty.
The researchers assumed nearly 25 mill. ac. of cropland could
be converted. 11 Agroforestry with livestock is called silvopasture and can
create wildlife habitat, shade, and shelter; improve water
cycling; and provide windbreaks, riparian buffers, and lumber
(Schoeneberger et al. 2012). 12 Assuming consumption rates of 12.11 oz/person (Bentley
2017), the average daily water footprint associated with beef
would be 2.8 to 5.7 gal/person. By comparison, a 10-minute
shower consumes about 25 to 50 gal., and household water
use of a US family of four is estimated to be 400 gal/day
(EPAWS 2008). 13 For example, manure emissions can be lowered by adding
tannins in pasture (Chadwick et al. 2011). 14 At this rate (including blue, green, and gray water) and
assuming consumption rates of 12.11 oz/person (Bentley
2017), the average daily footprint associated with beef is ~50
gal/person. Note that the global average water footprint for
beef is higher, at 115 gal/oz (Mekonnen and Hoekstra 2012). 15 The Great Plains region produces 25 percent of US corn and
relies on the High Plains aquifer (including the Ogallala) for
irrigated water (Barton and Clark 2014). 16 Emissions from enteric fermentation and manure depend on
feed variety and maturity, and other management factors
(Gerber, Henderson, and Makkar 2013; Hristov et al. 2013).
Soil N2O may be higher for heavily fertilized crops
(Shcherbak, Millar, and Robertson 2014) or in areas with
more runoff (e.g., the Corn Belt; Turner et al. 2015). 17 US agriculture emissions include enteric fermentation,
manure management, rice cultivation, soil management, and
burning. Beef emissions include enteric fermentation, manure
emissions, and soil N2O loss from corn and pasture, but
exclude other feeds and soil carbon. Globally, livestock
(mostly beef and dairy cattle) are estimated to contribute 8 to
18 percent of total emissions (Herrero et al. 2015; Gerber,
Henderson, and Makkar 2013). 18 Assuming 0.03 t CO2e/lb beef and 12.11 oz. beef
/person/week (Bentley 2017), this is 4.72 t CO2e/y for a
family of four, slightly less than annual emissions from a
passenger vehicle (EPA n.d.).
14 | UNION OF CONCERNED SCIENTISTS
19 Sheet and rill erosion on nonfederal rural lands in 2012 was
2.99±0.05 t soil/ac/y in cultivated US croplands and
0.69±0.03 t soil/ac/y in US pasture; wind erosion was
2.20±0.06 t soil/ac/y and 0.18±0.03 t soil/ac/y on cultivated
croplands and pasture, respectively (NRCS 2015). 20 Based on finding that 9 to 20 percent of corn goes to beef
cattle and 94 mill. ac. of corn were planted in 2016. 21 Not all grazing land is used for beef production. However,
most acres designated as pasture or range west of the
Mississippi (~300 mill. ac.) are devoted to beef cattle (Conner
et al. 2001). The percent of land degraded by beef cattle
grazing is unknown, but Schuman, Janzen, and Herrick
(2002) estimated 297 mill. ac. of US grasslands were poorly
managed, and Herrick et al. (2010) found that 21 percent of
western US rangelands were at least moderately degraded.
Follett, Kimble, and Lal (2001) estimated even more
degradation, concluding that only 60 percent of western US
rangeland was in good condition for forage production.
Assuming 300 mill. ac. are used for beef cattle and 21 percent
are degraded, 63 mill. ac. could benefit from improved
management. 22 US soil carbon losses related to beef could be ~152 Mt
CO2e/y (by comparison, US Agricultural Soil Management
emissions were 318.4 Mt CO2e in 2014). This assumes 63
mill. ac. of grazing land are degraded by beef cattle; 21 mill.
ac. of corn are used to feed beef cattle (5.7 mill. of which
were recently converted from grasslands); and that carbon
losses are 2.2, 1.5, and 0.3 t CO2e/ac/y for grazing lands,
recently converted croplands, and long-term cultivated
croplands, respectively. 23 Food and Drug Administration guidance can be found at
https://ahdc.vet.cornell.edu/programs/NYSCHAP/nysvfrp/vfd.
cfm#antimicrobials. 24 The model was originally designed for farmers participating
in the Chippewa 10% Project. For details, see Wasserman-
Olin 2016. Unless stated otherwise, we used default values.
The model does not include supply and demand factors. The
CSC includes options for year-round or custom grazing and
offers various grazing operations (cow/calf, stocker, feeder-
to-finish) and management styles (continuous, rotational [6
days/paddock], managed intensive [1 d/paddock], mob [0.5
d/paddock]). The model accounts for grazing differences by
assuming different productivity levels (e.g., 5.6 and 1.35 t dry
matter/ac for managed intensive versus continuous grazing,
respectively). The CRC is also based on the Grass-Fed Beef
Decision Calculator (WCWI n.d.) 25 Yields were changed based on a study in Iowa that found that
a four-crop rotation with corn and soy led to higher yields by
5 percent and 27 percent, respectively, compared with a
simple corn-soy rotation (Davis et al. 2012). Fertilizer, fuel,
and other chemical inputs were assumed to be decreased in
these systems, according to data from the same experiment
(Table A2). These cost savings were not accounted for in the
economic calculations, so calculated profits may be
conservative. 26 It is often more profitable to plant corn-soy versus complex
rotations when commodity prices are high. 27 These values are only an approximation for the broader social
costs of net global increases to total atmospheric greenhouse
gas concentrations (Metcalf and Stock 2017). They are only
used here as a rough indicator of the possible benefits of our
modeled scenarios, assuming that the scenarios represent a net
reduction in climate emissions. 28 Although the amount farmers can earn from conservation
programs ranges widely, the average payment from the
Natural Resources Conservation Service’s (NRCS) Conser-
vation Stewardship Program is $18/ac for farms that adopt
several practices; an additional $15/ac is available for imple-
menting a resource-conserving crop rotation (NRCS n.d.). 29 We assumed rain-fed (not irrigated) systems and therefore did
not investigate blue water footprints. 30 For perspective, the entire state of Minnesota is about 51 mill.
ac. 31 Diversification in farms can reduce transaction costs for
obtaining resources and managing wastes, improving
economic viability. This is referred to as “economy of scope”
(Gameiro, Rocco, and Caixeta Filho 2016). 32 Supply and demand factors were not considered for this
analysis, so these results reflect only a simple scenario of
increased prices and farm-scale cropping system conversions. 33 Including profits from grazing based on a custom grazing
operation with intensively managed grazing during the
finishing phase, as simulated with the CSC. Farm-level
calculations are separate from the larger-scale estimates for
total possible beef production, which are based only on feed
production and not directly tied to the farm production
system. This simplification is due to the complexities of beef
systems and because much of beef production happens off-
farm in the original scenario. On-farm CSC calculations offer
insight into beef production through grazing systems, but not
into overall beef production. 34 A passenger vehicle emits 4.73 t CO2e/y (EPA n.d.), so this
equates to removing 85 cars from the road. 35 An Olympic-sized pool holds 660,430 gal., so these savings
are equivalent to 424 swimming pools. 36 For example, transitioning a cotton monoculture to a cotton-
forage-livestock system increased profits from $77/ac to
$147/ac, and winter grazing of a cover crop in a cotton-peanut
rotation increased revenue by $126/ac (Franzluebbers 2007;
Allen et al. 2005). 37 Based on a 2,000-calorie-level Healthy US-Style Eating
Pattern. 38 Teen boys and adult men exceed recommended intakes.
Average consumption per person of meat, poultry, fish, and
shellfish is 5.74 oz-eq/d; beef is 1.73 oz-eq/d (12.11 oz-
eq/wk; Bentley 2017).
Reintegrating Land and Livestock | 15
39 Beef, pork, lamb, veal, goat, and nonbird game are considered
red meat. 40 Consumers seeking meat-based protein alternatives for
environmental reasons should be aware that many of today’s
other animal products also rely heavily on industrial cropping
systems and contribute to similar environmental problems
(von Reusner 2017) but at much smaller amounts per serving
(Eshel et al. 2014; Hedenus, Wirsenius, and Johansson 2014).
Further, equity issues regarding health and safety in
concentrated feedlots and meat-processing facilities exist
across meat categories (Gunderson 2012). Animal welfare
issues are also present across animal agricultural systems
(Robbins et al. 2016; Grandin 2014). 41 Mandatory check-off programs tax producers of specific
commodities and use those funds for research, development,
and promotion that do not benefit all producers equally. 42 We assumed that a reduction in production of high-efficiency
feeds on the farm would be associated with a reduction in
cattle production. We assumed crop yields as described in the
scenarios and standard moisture levels. We estimated
potential beef production with available feeds using efficiency
rates of 7.8 kg. beef per kg. dry matter for common feeds
(corn, oats, and soy) and 27 kg. beef per kg. dry matter for
forage feeds (grass and alfalfa) (Wilkinson 2011; because
these ratios assumed bone-in carcass fresh weight, we
calculated boneless edible meat as 70 percent of the beef
totals; Nijdam, Rood, and Westhoek 2012). We did not
consider how the proportions of feeds in our scenarios
affected feed ration composition, as our goal was to obtain
only a basic sense of the degree to which a switch to farming
more forages on a farm producing animal feed could affect
production. 43 A serving is 3 oz. (USDA 2012). This reduction is a fraction
of current consumption (12.11 oz/wk).

16 | UNION OF CONCERNED SCIENTISTS
[REFERENCES]
Albrecht, A., and S.T. Kandji. 2003. Carbon sequestration in
tropical agroforestry systems. Agriculture, Ecosystems and
Environment 99:15–27. doi:10.1016/S0167-8809(03)00138-5.
Allen, V.G., C.P. Brown, R. Kellison, E. Segarra, T. Wheeler,
P.A. Dotray, J.C. Conkwright, C.J. Green, and V. Acosta-
Martinez. 2005. Integrating cotton and beef production to
reduce water withdrawal from the Ogallala Aquifer in the
Southern High Plains. Agronomy Journal 97(2):556–567.
Amundson, R., A.A. Berhe, J.W. Hopmans, C. Olson, A.E.
Sztein, and D.L. Sparks. 2015. Soil and human security in the
21st century. Science, May 8, 348.
doi:10.1126/science. 1261071.
Barton, B., and S.E. Clark. 2014. Water & climate risks facing
US corn production: How companies & investors can cultivate
sustainability. Boston, MA: Ceres.
Basche, A.D. 2017. Turning soils into sponges: How farmers
can fight floods and droughts. Cambridge, MA: Union of
Concerned Scientists.
Basche, A.D., and M. DeLonge. No date. How do conservation
and ecological practices impact infiltration rates? A meta-
analysis. Global Change Biology. Under review.
Basche, A.D., and M. DeLonge. 2017. The impact of
continuous living cover on soil hydrologic properties: A meta-
analysis. Soil Science Society of America Journal.
doi:10.2136/ sssaj2017.03.0077
Basche, A.D., and O.F. Edelson. 2017. Improving water
resilience with more perennially based agriculture.
Agroecology and Sustainable Food Systems 41:799–824.
doi:10.1080/21683565.2017.1330795.
Bentley, J. 2017. U.S. trends in food availability and a dietary
assessment of loss-adjusted food availability, 1970–2014. EIB-
166. Washington, DC: US Department of Agriculture.
Briske, D.D., L.A. Joyce, H.W. Polley, J.R. Brown, K. Wolter,
J.A. Morgan, B.A. McCarl, and D.W. Bailey. 2015. Climate-
change adaptation on rangelands: Linking regional exposure
with diverse adaptive capacity. Frontiers in Ecology and the
Environment 13:249–256. doi:10.1890/140266.
Capper, J.L. 2012. Is the grass always greener? Comparing the
environmental impact of conventional, natural and grass-fed
beef production systems. Animals 2:127–143.
doi:10.3390/ ani2020127.
Centers for Disease Control and Prevention (CDC). 2013.
Antibiotic resistance threats in the United States, 2013.
Atlanta, GA.
Chadwick, D., S. Sommer, R. Thorman, D. Fangueiro, L.
Cardenas, B. Amon, and T. Misselbrook. 2011. Manure
management: Implications for greenhouse gas emissions.
Animal Feed Science and Technology 166–167:514–531.
doi:10.1016/j.anifeedsci.2011.04.036.
Chambers, A., R. Lal, K. Paustian. 2016. Soil carbon
sequestration potential of US croplands and grasslands:
Implementing the 4 per Thousand Initiative. Journal of Soil
and Water Conservation 71:68A–74A.
doi:10.2489/ jswc.71.3.68A.
Cheung, R., P. McMahon, E. Norell, R. Kissel, and D. Benz.
2017. Back to grass: The market potential for US grassfed beef.
New York: SLM Partners.
Chiavegato, M.B., J.E. Rowntree, D. Carmichael, and W.J.
Powers. 2015. Enteric methane from lactating beef cows
managed with high- and low-input grazing systems. Journal of
Animal Science 93:1365–1375.
Conant, R.T., K. Paustian, and E.T. Elliott. 2001. Grassland
management and conversion into grassland: Effects on soil
carbon. Ecological Applications 11(2):343–355.
Reintegrating Land and Livestock | 17
Conner R., A. Seidl, L. VanTassell, and N. Wilkins. 2001.
United States grasslands and related resources: An economic
and biological trends assessment. Centennial, CO: National
Cattlemen’s Beef Association; Arlington, VA: Nature
Conservancy; Memphis, TN: Ducks Unlimited. Online at
https://nri.tamu.edu/media/1101/us_grasslands.pdf, accessed
July 2017.
Daley, C.A., A. Abbott, P.S. Doyle, G.A. Nader, and S. Larson.
(2010). A review of fatty acid profiles and antioxidant content
in grass-fed and grain-fed beef. Nutrition Journal 9(10).
doi.org/10.1186/1475-2891-9-10.
Davis, A.S., J.D. Hill, C.A. Chase, A.M. Johanns, and M.
Liebman. 2012. Increasing cropping system diversity balances
productivity, profitability and environmental health. PloS ONE
7:e47149. doi:10.1371/journal.pone.0047149.
DeLonge, M., and A. Basche, A.D. No date. Managing grazing
lands to improve soils and promote climate change adaptation
and mitigation: a global synthesis. Renewable Agriculture and
Food Systems. In Press.
DeLonge, M., and A. Basche. 2017. Leveraging agroecology
for solutions in food, energy, and water. Elementa: Science of
the Anthropocene 5:6. doi:http://doi.org/10.1525/elementa.211.
DeLonge, M.S., A. Miles, and L. Carlisle. 2016. Investing in
the transition to sustainable agriculture. Environmental Science
and Policy 55:266–273. doi:10.1016/j.envsci.2015.09.013.
de Vries, M., C.E. van Middelaar, and I.J.M. de Boer. 2015.
Comparing environmental impacts of beef production systems:
A review of life cycle assessments. Livestock Science 178:279–
288. doi:10.1016/j.livsci.2015.06.020.
Dietary Guidelines Advisory Committee (DGAC). 2015.
Scientific report of the 2015 Dietary Guidelines Advisory
Committee: Advisory report to the secretary of Health and
Human Services and the secretary of agriculture. Washington,
DC: US Department of Health and Human Services.
Dimitri, C., A. Effland, and N. Conklin. 2005. The 20th century
transformation of U.S. agriculture and farm policy. Vol. 3.
Washington, DC: US Department of Agriculture. Online at
http://ageconsearch.umn.edu/bitstream/59390/2/eib3.pdf,
accessed July 2017.
Economic Research Services (ERS). 2017. Feed grains
database. Washington, DC: US Department of Agriculture.
Online at https://www.ers.usda.gov/data-products/feed-grains-
database/, accessed July 2017.
Environmental Protection Agency (EPA). 2017. Chaper 5:
Agriculture. In Inventory of U.S. Greenhouse Gas Emissions
and Sinks: 1990-2015. EPA 430-P-17-001. Washington, DC.
Online at https://www.epa.gov/ghgemissions/inventory-us-
greenhouse-gas-emissions-and-sinks-1990-2015, accessed
September 2017.
Environmental Protection Agency (EPA). 2012. Chapter 2:
AFOs and CAFOs. In NPDES permit writers' manual for
concentrate. EPA 833-F-12-001. Washington, DC. Online at
https://www.epa.gov/npdes/npdes-permit-writers-manual-
concentrated-animal-feeding-operations, accessed July 2017.
Environmental Protection Agency (EPA). No date. Greenhouse
gases equivalencies calculator - Calculations and references.
Online at www.epa.gov/energy/greenhouse-gases-equivalencies-
calculator-calculations-and-references, accessed February 2017.
Environmental Protection Agency WaterSense (EPAWS).
2008. Indoor water use in the United States. EPA-832-F-06-
004. Washington, DC.
Eshel, G., A. Shepon, T. Makov, and R. Milo. 2014. Land,
irrigation water, greenhouse gas, and reactive nitrogen burdens
of meat, eggs, and dairy production in the United States.
Proceedings of the National Academy of Sciences 111:11996–
12001. doi:10.1073/pnas.1402183111.
Follett, R.F., J.M. Kimble, and R. Lal. (Eds.) 2001. The poten-
tial of U.S. grazing lands to sequester carbon and mitigate the
greenhouse effect. Boca Raton, FL: Lewis Publishers.
Franzluebbers, A.J. 2007. Integrated crop-livestock systems in
the southeastern USA. Agronomy Journal 99(2):361–372.
Franzluebbers, A.J., G. Lemaire, P.C. de Faccio Carvalho,
R.M. Sulc, and B. Dedieu. 2014. Toward agricultural
sustainability through integrated crop-livestock systems:
Environmental outcomes. Agriculture, Ecosystems &
Environment 190:1–3. doi:10.1016/j.agee.2014.04.028.
Franzluebbers, A.J., L.K. Paine, J.R. Winsten, M. Krome, M.A.
Sanderson, K. Ogles, and D. Thompson. 2012. Well-managed
grazing systems: A forgotten hero of conservation. Journal of
Soil and Water Conservation 67(4):100A–104A.
doi:10.2489/ jswc.67.4.100A.
Gage, A.M., S.K. Olimb, and J. Nelson. 2016. Plowprint:
Tracking cumulative cropland expansion to target grassland
conservation. Great Plains Research 26(2):107–116.
Gameiro, A.H., C.D. Rocco, and J.V. Caixeta Filho. 2016.
Linear programming in the economic estimate of livestock-crop
integration: Application to a Brazilian dairy farm. Revista
18 | UNION OF CONCERNED SCIENTISTS
Brasileira de Zootecnia 45:181–189.
doi:10.1590/S1806-92902016000400006.
Gerber, P.J., B. Henderson, and H.P.S. Makkar. (Ed.) 2013.
Mitigation of greenhouse gas emissions in livestock
production: A review of technical options for non-CO2
emissions. Rome, Italy: Food and Agriculture Organization of
the United Nations.
Gliessman S.R. 2014. Agroecology: The ecology of food
systems, third edition. Boca Raton, FL: CRC Press.
Grandin, T. 2014. Animal welfare and society concerns finding
the missing link. Meat Science 98:461–469.
doi:10.1016/j.meatsci.2014.05.011.
Greger, M., and G. Koneswaran. 2010. The public health
impacts of concentrated animal feeding operations on local
communities. Family and Community Health 33:11–20.
Gunderson, R. 2012. Meat and inequality: Environmental
health consequences of livestock agribusiness. Environmental
Justice 5:54–58. doi:10.1089/env.2011.0010.
Gurian-Sherman, D. 2011. Raising the steaks: Global warming
and pasture-raised beef production in the United States.
Cambridge, MA: Union of Concerned Scientists.
Gustafson, R.H., and R.E. Bowen. 1997. Antibiotic use in
animal agriculture. Journal of Applied Microbiology
83(5):531–541.
Harun, S.M.R., and Y. Ogneva-Himmelberger. 2013.
Distribution of industrial farms in the United States and
socioeconomic, health, and environmental characteristics of
counties. Geography Journal 2013:1–12.
doi:10.1155/ 2013/385893.
Hedenus, F., S. Wirsenius, and D.J.A. Johansson. 2014. The
importance of reduced meat and dairy consumption for meeting
stringent climate change targets. Climatic Change 124:79–91.
doi:10.1007/s10584-014-1104-5.
Hellerstein, D.M. 2017. The US Conservation Reserve
Program: The evolution of an enrollment mechanism. Land Use
Policy 63:601–610. doi:10.1016/j.landusepol.2015.07.017.
Hellwinckel, C., and J.G. Phillips. 2012. Land use carbon
impli-cations of a reduction in ethanol production and an
increase in well-managed pastures. Carbon Management 3:27–38.
doi:10.4155/cmt.11.79.
Helmers, M.J., X. Zhou, H. Asbjornsen, R. Kolka, M.D.
Tomer, and R.M. Cruse. 2012. Sediment removal by prairie
filter strips in row-cropped ephemeral watersheds. Journal of
Environment Quality 41:1531. doi:10.2134/jeq2011.0473.
Herrero, M., S. Wirsenius, B. Henderson, C. Rigolot, P.
Thornton, P. Havlík, I. de Boer, and P.J. Gerber. 2015.
Livestock and the environment: What have we learned in the
past decade? Annual Review of Environment and Resources
40:177–202. doi:10.1146/annurev-environ-031113-093503.
Herrick, J.E., V.C. Lessard, K.E. Spaeth, P.L. Shaver, R.S.
Dayton, D.A. Pyke, L. Jolley, and J.J. Goebel. 2010. National
ecosystem assessments supported by scientific and local
knowledge. Frontiers in Ecology and the Environment 8:403–
408. doi:10.1890/100017.
Hilimire, K. 2011. Integrated crop/livestock agriculture in the
United States: A review. Journal of Sustainable Agriculture
35:376–393. doi:10.1080/10440046.2011.562042.
Hristov, A.N., J. Oh, J.L. Firkins, J. Dijkstra, E. Kebreab, G.
Waghorn, H.P.S. Makkar, A.T. Adesogan, W. Yang, C. Lee,
P.J. Gerber, B. Henderson, and J.M. Tricarico. 2013. Special
topics—Mitigation of methane and nitrous oxide emissions
from animal operations: I. A review of enteric methane miti-
gation options. Journal of Animal Science 91(11):5045–5069.
Hudson, B.D. 1994. Soil organic matter and available water
capacity. Journal of Soil and Water Conservation 49(2):189–194.
Hunt, N.D., J.D. Hill, and M. Liebman. 2017. Reducing
freshwater toxicity while maintaining weed control, profits, and
productivity: Effects of increased crop rotation diversity and
reduced herbicide usage. Environmental Science & Technology
51:1707–1717. doi:10.1021/acs.est.6b04086.
Interagency Working Group on Social Cost of Greenhouse
Gases (IWGSCGG). 2016a. Technical update of the social cost
of carbon for regulatory impact analysis — Under Executive
Order 12866. Washington, DC: US Office of Management and
Budget. Online at https://19january2017snapshot.epa.gov/
sites/production/files/2016-12/documents/sc_CO2_tsd_
august_2016.pdf, accessed September 2017.
Interagency Working Group on Social Cost of Greenhouse
Gases (IWGSCGG). 2016b. Addendum to technical support
document on social cost of carbon for regulatory impact analy-
sis under Executive Order 12866: Application of the method-
ology to estimate the social cost of methane and the social cost
of nitrous oxide. Washington, DC: US Office of Management
and Budget. Online at https://obamawhitehouse.archives.gov/
sites/default/files/omb/inforeg/august_2016_sc_ch4_sc_n2o_ad
dendum_final_8_26_16.pdf, accessed September 2017.
Reintegrating Land and Livestock | 19
Intergovernmental Panel on Climate Change (IPCC). 2014.
Climate change 2014: Mitigation of climate change: Working
group III contribution to the fifth assessment report of the
intergovernmental panel on climate change, edited by O.
Edenhofer, R. Pichs-Madruga, Y. Sokona, E. Farahani, S.
Kadner, K. Seyboth, A. Adler, I. Baum, S. Brunner, P.
Eickemeier, B. Kriemann, J. Savolainen, S. Schlömer, C. von
Stechow, T. Zwickel, and J.C. Minx. New York: Cambridge
University Press.
Janzen, H.H. 2011. What place for livestock on a re-greening
earth? Animal Feed Science and Technology 166–167:783–796.
Johnson, K.A., B.J. Dalzell, M. Donahue, J. Gourevitch, D.L.
Johnson, G.S. Karlovits, B. Keeler, and J.T. Smith. 2016.
Conservation Reserve Program (CRP) lands provide ecosystem
service benefits that exceed land rental payment costs.
Ecosystem Services 18:175–185. doi:10.1016/j.ecoser.
2016.03.004.
Karp, D.S., S. Gennet, C. Kilonzo, M. Partyka, N. Chaumont,
E.R. Atwill, and C. Kremen. 2015. Co-managing fresh produce
for nature conservation and food safety. Proceedings of the
National Academy of Sciences 112:11126–11131.
doi:10.1073/pnas.1508435112.
Keesing, F., and R.S. Ostfeld. 2015. Is biodiversity good for
your health? Science, July 17, 235–236.
doi:10.1126/science.aab3689.
Lark, T.J., J.M. Salmon, and H.K. Gibbs. 2015. Cropland
expansion outpaces agricultural and biofuel policies in the
United States. Environmental Research Letters 10:44003.
doi:10.1088/1748-9326/10/4/044003.
Lenhardt, J., and Y. Ogneva-Himmelberger. 2013. Environ-
mental injustice in the spatial distribution of concentrated
animal feeding operations in Ohio. Environmental Justice
6:133–139. doi:10.1089/env.2013.0023.
Liebman, M., and L.A. Schulte. 2015. Enhancing
agroecosystem performance and resilience through increased
diversification of landscapes and cropping systems. Elementa:
Science of the Anthropocene 3:41. doi:10.12952/journal.
elementa.000041.
Lupo, C.D., D.E. Clay, J.L. Benning, and J.J. Stone. 2013.
Life-cycle assessment of the beef cattle production system for
the northern Great Plains, USA. Journal of Environment
Quality 42:1386. doi:10.2134/jeq2013.03.0101.
Mathews Jr., K.H., and R.J. Johnson. 2013. Alternative beef
production systems: Issues and implications. LDPM-218-01.
Washington, DC: US Department of Agriculture.
McSherry, M.E., and M.E. Ritchie. 2013. Effects of grazing on
grassland soil carbon: A global review. Global Change Biology
19:1347–1357.
Mekonnen, M.M., and A.Y. Hoekstra. 2012. A global
assessment of the water footprint of farm animal products.
Ecosystems 15:401–415. doi:10.1007/s10021-011-9517-8.
Mekonnen, M.M., and A.Y. Hoekstra. 2011. The green, blue
and grey water footprint of crops and derived crop products.
Hydrology and Earth System Sciences 15:1577–1600.
doi:10.5194/hess-15-1577-2011.
Metcalf, G.E., and J.H. Stock. 2017. Integrated assessment
models and the social cost of carbon: A review and assessment
of US experience. Review of Environmental Economics and
Policy 11(1):80–99.
Miles, A., M.S. DeLonge, and L. Carlisle. 2017. Triggering a
positive research and policy feedback cycle to support a
transition to agroecology and sustainable food systems.
Agroecology and Sustainable Food Systems 41:855–879.
doi:10.1080/21683565.2017.1331179.
Montgomery, D.R. 2007. Soil erosion and agricultural
sustainability. Proceedings of the National Academy of
Sciences 104(33):13268–13272. doi:10.1073/pnas.0611508104.
Morefield, P.E., S.D. LeDuc, C.M. Clark, and R. Iovanna.
2016. Grasslands, wetlands, and agriculture: The fate of land
expiring from the Conservation Reserve Program in the
midwestern United States. Environmental Research Letters
11:094005. doi:10.1088/1748-9326/11/9/094005.
Mulik, K. 2017. Rotating crops, turning profits. Cambridge,
MA: Union of Concerned Scientists.
National Agricultural Statistics Service (NASS). 2017. Agricul-
tural statistics 2016. Washington, DC: US Department of
Agriculture. Online at https://www.nass.usda.gov/Publications/
Ag_Statistics/index.php, accessed September 2017.
National Agricultural Statistics Service (NASS). 2014. 2012
census of agriculture: Farm and ranch irrigation survey. Vol.
3 (2013). Special Studies Part 1 AC-12-SS-1. Washington, DC:
US Department of Agriculture.
Natural Resources Conservation Service (NRCS). 2015. Sum-
mary report: 2012 national resources inventory. Washington,
DC: US Department of Agriculture; and Ames, IA: Center for
Survey Statistics and Methodology, Iowa State University.
Online at https://www.nrcs.usda.gov/wps/portal/nrcs/main/
national/technical/nra/nri/, accessed September 2017.
20 | UNION OF CONCERNED SCIENTISTS
Natural Resources Conservation Service (NRCS). No date.
Conservation Stewardship Program. Washington, DC: US
Department of Agriculture. Online at www.nrcs.usda.gov/wps/
portal/nrcs/main/national/programs/financial/csp/, accessed
July 2017.
Nickerson, C., R. Ebel, A. Borchers, and F. Carriazo. 2011.
Major uses of land in the United States, 2007. Washington,
DC: US Department of Agriculture.
Nijdam, D., T. Rood, and H. Westhoek. 2012. The price of
protein: Review of land use and carbon footprints from life
cycle assessments of animal food products and their substitutes.
Food Policy 37:760–770. doi:10.1016/j.foodpol.2012.08.002.
Paustian, K., J. Lehmann, S. Ogle, D. Reay, G.P. Robertson,
and P. Smith. 2016. Climate-smart soils. Nature, April 7, 49–
57. doi:10.1038/nature17174.
Peters, C.J., J. Picardy, A.F. Darrouzet-Nardi, J.L. Wilkins,
T.S. Griffin, and G.W. Fick. 2016. Carrying capacity of U.S.
agricultural land: Ten diet scenarios. Elementa: Science of the
Anthropocene 4:116. doi:10.12952/journal.elementa.000116.
Peterson, P.R., and J.R. Gerrish. 1995. Grazing management
affects manure distribution by beef cattle. Berea, KY:
American Forage & Grassland Council, 170–174.
Poeplau, C., and A. Don. 2015. Carbon sequestration in
agricultural soils via cultivation of cover crops—A meta-
analysis. Agriculture, Ecosystems & Environment 200:33–41.
Poffenbarger, H., G. Artz, G. Dahlke, W. Edwards, M. Hanna,
J. Russell, H. Sellers, and M. Liebman. 2017. An economic
analysis of integrated crop-livestock systems in Iowa, U.S.A.
Agricultural Systems 157:51–69. doi:10.1016/j.agsy. 2017.07.001.
Porter, P.A., R.B. Mitchell, and K.J. Moore. 2015. Reducing
hypoxia in the Gulf of Mexico: Reimagining a more resilient
agricultural landscape in the Mississippi River watershed.
Journal of Soil and Water Conservation 70(3):63A–65A.
doi:10.2489/jswc.70.3.63A.
Powlson, D.S., C.M. Stirling, M.L. Jat, B.G. Gerard, C.A.
Palm, P.A. Sanchez, and K.G. Cassman. 2014. Limited
potential of no-till agriculture for climate change mitigation.
Nature Climate Change 4:678–683. doi:10.1038/nclimate2292.
Ripple, W.J., P. Smith, H. Haberl, S.A. Montzka, C. McAlpine,
and D.H. Boucher. 2014. Ruminants, climate change and
climate policy. Nature Climate Change 4(1):2–5.
Ristino, L.A., and G. Steier. 2016. Losing ground: A clarion
call for farm bill reform to ensure a food secure future.
Columbia Journal of Environmental Law 42(1). Online at
https://ssrn.com/abstract=2887584, accessed July 2017.
Robbins, J.A., M.A.G. von Keyserlingk, D. Fraser, and D.M.
Weary. 2016. Invited review: Farm size and animal welfare.
Journal of Animal Science 94:5439–5455.
Rowntree, J.E., R. Ryals, M. DeLonge, W.R. Teague, M.
Chiavegato, P. Byck, T. Wang, and S. Xu. 2016. Potential
mitigation of Midwest grass-finished beef production emissions
with soil carbon sequestration in the United States of America.
Future of Food: Journal on Food, Agriculture and Society
4:31–38.
Sanderman, J., T. Hengl, and G.J. Fiske. 2017. Soil carbon debt
of 12,000 years of human land use. Proceedings of the National
Academy of Sciences. Online at www.pnas.org/content/early/
2017/08/15/1706103114.full, accessed July 2017.
Sayre, N.F., R.R. McAllister, B.T. Bestelmeyer, M. Moritz, and
M.D. Turner. 2013. Earth stewardship of rangelands: Coping
with ecological, economic, and political marginality. Frontiers
in Ecology and the Environment 11:348–354.
doi:10.1890/ 120333.
Schoeneberger, M., G. Bentrup, H. de Gooijer, R. Soolanaya-
kanahally, T. Sauer, J. Brandle, X. Zhou, and D. Current. 2012.
Branching out: Agroforestry as a climate change mitigation and
adaptation tool for agriculture. Journal of Soil and Water
Conservation 67:128A–136A. doi:10.2489/jswc.67.5.128A.
Schuman, G.E., H.H. Janzen, and J.E. Herrick. 2002. Soil
carbon dynamics and potential carbon sequestration by
rangelands. Environmental Pollution 116(3):391–396.
Seitzinger, S.P., and L. Phillips. 2017. Nitrogen stewardship in
the Anthropocene. Science, July 28, 350–351.
Shcherbak, I., N. Millar, and G.P. Robertson. 2014. Global
meta-analysis of the nonlinear response of soil nitrous oxide
(N2O) emissions to fertilizer nitrogen. Proceedings of the
National Academy of Sciences of the United States of America
111:9199–9204.
Siegel, K.R., K. McKeever Bullard, G. Imperatore, H.S. Kahn,
A.D. Stein, M.K. Ali, and K.M. Narayan. 2016. Association of
higher consumption of foods derived from subsidized com-
modities with adverse cardiometabolic risk among US adults.
JAMA Internal Medicine 176:1124.
doi:10.1001/jamainternmed.2016.2410.
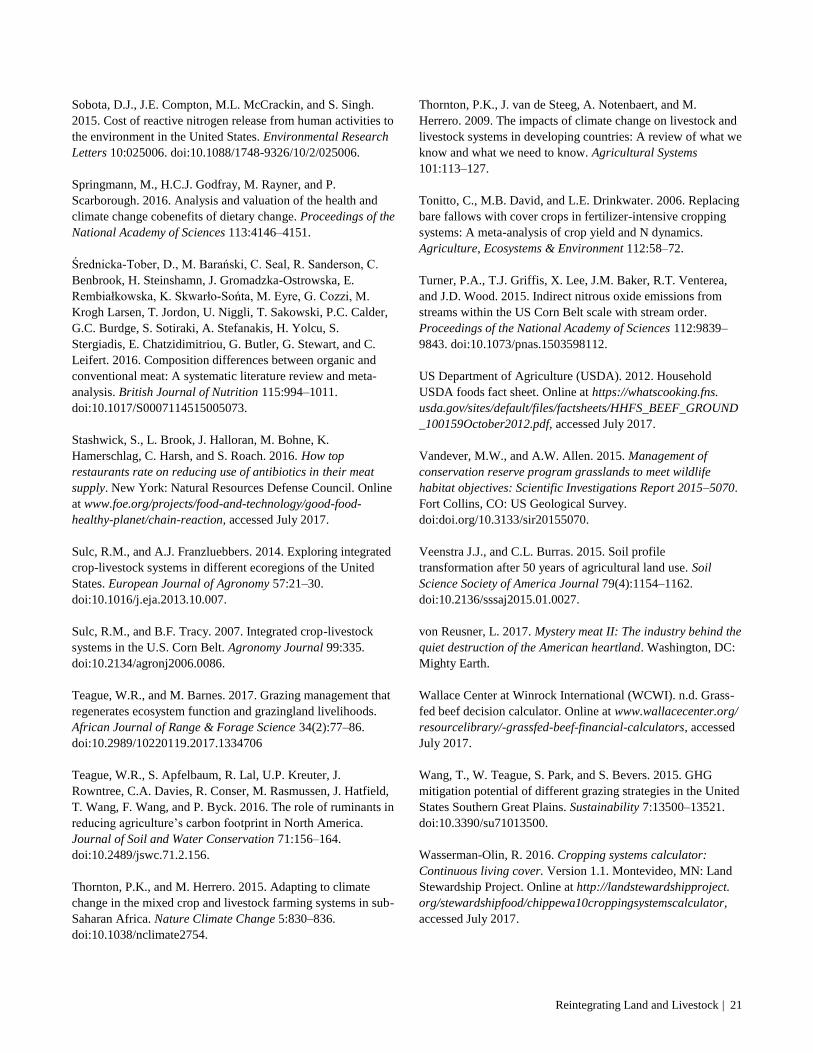
Reintegrating Land and Livestock | 21
Sobota, D.J., J.E. Compton, M.L. McCrackin, and S. Singh.
2015. Cost of reactive nitrogen release from human activities to
the environment in the United States. Environmental Research
Letters 10:025006. doi:10.1088/1748-9326/10/2/025006.
Springmann, M., H.C.J. Godfray, M. Rayner, and P.
Scarborough. 2016. Analysis and valuation of the health and
climate change cobenefits of dietary change. Proceedings of the
National Academy of Sciences 113:4146–4151.
Średnicka-Tober, D., M. Barański, C. Seal, R. Sanderson, C.
Benbrook, H. Steinshamn, J. Gromadzka-Ostrowska, E.
Rembiałkowska, K. Skwarło-Sońta, M. Eyre, G. Cozzi, M.
Krogh Larsen, T. Jordon, U. Niggli, T. Sakowski, P.C. Calder,
G.C. Burdge, S. Sotiraki, A. Stefanakis, H. Yolcu, S.
Stergiadis, E. Chatzidimitriou, G. Butler, G. Stewart, and C.
Leifert. 2016. Composition differences between organic and
conventional meat: A systematic literature review and meta-
analysis. British Journal of Nutrition 115:994–1011.
doi:10.1017/S0007114515005073.
Stashwick, S., L. Brook, J. Halloran, M. Bohne, K.
Hamerschlag, C. Harsh, and S. Roach. 2016. How top
restaurants rate on reducing use of antibiotics in their meat
supply. New York: Natural Resources Defense Council. Online
at www.foe.org/projects/food-and-technology/good-food-
healthy-planet/chain-reaction, accessed July 2017.
Sulc, R.M., and A.J. Franzluebbers. 2014. Exploring integrated
crop-livestock systems in different ecoregions of the United
States. European Journal of Agronomy 57:21–30.
doi:10.1016/j.eja.2013.10.007.
Sulc, R.M., and B.F. Tracy. 2007. Integrated crop-livestock
systems in the U.S. Corn Belt. Agronomy Journal 99:335.
doi:10.2134/agronj2006.0086.
Teague, W.R., and M. Barnes. 2017. Grazing management that
regenerates ecosystem function and grazingland livelihoods.
African Journal of Range & Forage Science 34(2):77–86.
doi:10.2989/10220119.2017.1334706
Teague, W.R., S. Apfelbaum, R. Lal, U.P. Kreuter, J.
Rowntree, C.A. Davies, R. Conser, M. Rasmussen, J. Hatfield,
T. Wang, F. Wang, and P. Byck. 2016. The role of ruminants in
reducing agriculture’s carbon footprint in North America.
Journal of Soil and Water Conservation 71:156–164.
doi:10.2489/jswc.71.2.156.
Thornton, P.K., and M. Herrero. 2015. Adapting to climate
change in the mixed crop and livestock farming systems in sub-
Saharan Africa. Nature Climate Change 5:830–836.
doi:10.1038/nclimate2754.
Thornton, P.K., J. van de Steeg, A. Notenbaert, and M.
Herrero. 2009. The impacts of climate change on livestock and
livestock systems in developing countries: A review of what we
know and what we need to know. Agricultural Systems
101:113–127.
Tonitto, C., M.B. David, and L.E. Drinkwater. 2006. Replacing
bare fallows with cover crops in fertilizer-intensive cropping
systems: A meta-analysis of crop yield and N dynamics.
Agriculture, Ecosystems & Environment 112:58–72.
Turner, P.A., T.J. Griffis, X. Lee, J.M. Baker, R.T. Venterea,
and J.D. Wood. 2015. Indirect nitrous oxide emissions from
streams within the US Corn Belt scale with stream order.
Proceedings of the National Academy of Sciences 112:9839–
9843. doi:10.1073/pnas.1503598112.
US Department of Agriculture (USDA). 2012. Household
USDA foods fact sheet. Online at https://whatscooking.fns.
usda.gov/sites/default/files/factsheets/HHFS_BEEF_GROUND
_100159October2012.pdf, accessed July 2017.
Vandever, M.W., and A.W. Allen. 2015. Management of
conservation reserve program grasslands to meet wildlife
habitat objectives: Scientific Investigations Report 2015–5070.
Fort Collins, CO: US Geological Survey.
doi:doi.org/10.3133/sir20155070.
Veenstra J.J., and C.L. Burras. 2015. Soil profile
transformation after 50 years of agricultural land use. Soil
Science Society of America Journal 79(4):1154–1162.
doi:10.2136/sssaj2015.01.0027.
von Reusner, L. 2017. Mystery meat II: The industry behind the
quiet destruction of the American heartland. Washington, DC:
Mighty Earth.
Wallace Center at Winrock International (WCWI). n.d. Grass-
fed beef decision calculator. Online at www.wallacecenter.org/
resourcelibrary/-grassfed-beef-financial-calculators, accessed
July 2017.
Wang, T., W. Teague, S. Park, and S. Bevers. 2015. GHG
mitigation potential of different grazing strategies in the United
States Southern Great Plains. Sustainability 7:13500–13521.
doi:10.3390/su71013500.
Wasserman-Olin, R. 2016. Cropping systems calculator:
Continuous living cover. Version 1.1. Montevideo, MN: Land
Stewardship Project. Online at http://landstewardshipproject.
org/stewardshipfood/chippewa10croppingsystemscalculator,
accessed July 2017.
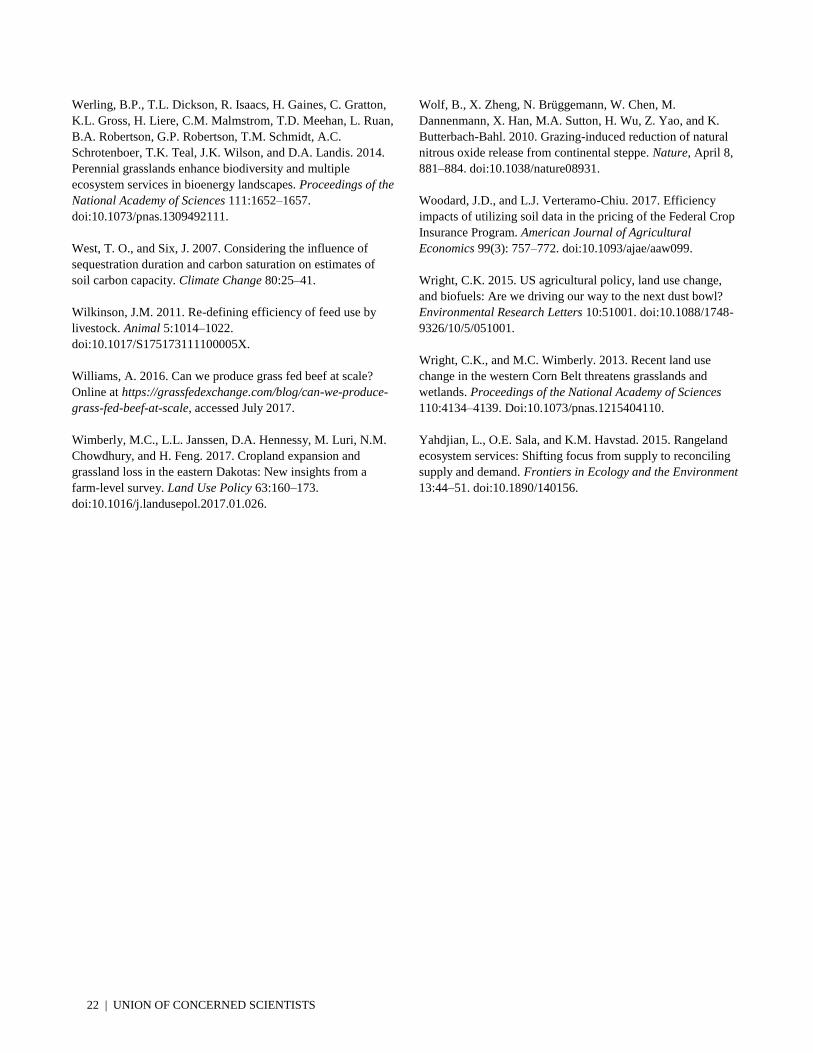
22 | UNION OF CONCERNED SCIENTISTS
Werling, B.P., T.L. Dickson, R. Isaacs, H. Gaines, C. Gratton,
K.L. Gross, H. Liere, C.M. Malmstrom, T.D. Meehan, L. Ruan,
B.A. Robertson, G.P. Robertson, T.M. Schmidt, A.C.
Schrotenboer, T.K. Teal, J.K. Wilson, and D.A. Landis. 2014.
Perennial grasslands enhance biodiversity and multiple
ecosystem services in bioenergy landscapes. Proceedings of the
National Academy of Sciences 111:1652–1657.
doi:10.1073/pnas.1309492111.
West, T. O., and Six, J. 2007. Considering the influence of
sequestration duration and carbon saturation on estimates of
soil carbon capacity. Climate Change 80:25–41.
Wilkinson, J.M. 2011. Re-defining efficiency of feed use by
livestock. Animal 5:1014–1022.
doi:10.1017/S175173111100005X.
Williams, A. 2016. Can we produce grass fed beef at scale?
Online at https://grassfedexchange.com/blog/can-we-produce-
grass-fed-beef-at-scale, accessed July 2017.
Wimberly, M.C., L.L. Janssen, D.A. Hennessy, M. Luri, N.M.
Chowdhury, and H. Feng. 2017. Cropland expansion and
grassland loss in the eastern Dakotas: New insights from a
farm-level survey. Land Use Policy 63:160–173.
doi:10.1016/j.landusepol.2017.01.026.
Wolf, B., X. Zheng, N. Brüggemann, W. Chen, M.
Dannenmann, X. Han, M.A. Sutton, H. Wu, Z. Yao, and K.
Butterbach-Bahl. 2010. Grazing-induced reduction of natural
nitrous oxide release from continental steppe. Nature, April 8,
881–884. doi:10.1038/nature08931.
Woodard, J.D., and L.J. Verteramo-Chiu. 2017. Efficiency
impacts of utilizing soil data in the pricing of the Federal Crop
Insurance Program. American Journal of Agricultural
Economics 99(3): 757–772. doi:10.1093/ajae/aaw099.
Wright, C.K. 2015. US agricultural policy, land use change,
and biofuels: Are we driving our way to the next dust bowl?
Environmental Research Letters 10:51001. doi:10.1088/1748-
9326/10/5/051001.
Wright, C.K., and M.C. Wimberly. 2013. Recent land use
change in the western Corn Belt threatens grasslands and
wetlands. Proceedings of the National Academy of Sciences
110:4134–4139. Doi:10.1073/pnas.1215404110.
Yahdjian, L., O.E. Sala, and K.M. Havstad. 2015. Rangeland
ecosystem services: Shifting focus from supply to reconciling
supply and demand. Frontiers in Ecology and the Environment
13:44–51. doi:10.1890/140156.
Reintegrating Land and Livestock | 23
[APPENDIX]
TABLE A1. Cattle Life Phases
Phase
Duration,
End Weighta,b
Feed Details
Cow-Calf 180–240 d, 400–700 lbs.
Grazed forage Mothers stay on-farm for next breeding cycle, bringing additional costs. Most operations are small (average cowherd of 40 head). While the majority (91%) of operations maintains <100 cows, these represent only 49% of the beef cow inventory.c
Backgrounding/ Stocking
120–200 d, 800 lbs.
Stocking: grazed forage. Backgrounding: cheap feeds.
Phase can be co-located with cow-calf, but most farmers manage only one. Backgrounding diets often include ~40% grain, 60% forage (including corn, alfalfa hay, wheat, barley, oats, distillers grains).d
Feedlot Finishing 120–240 d, 1,350 lbs.
Large proportions of grain and protein concentrates (up to 70–90%).
Usually occurs in feedlots (confined animal feeding operations [CAFOs]). While the majority (>95%) are small (<1,000 head), these operations produce only 10–20% of feedlot cattle, whereas the largest (>32,000 head; <5% of feedlots) produce about 40%.
Grass Finishing 180–480 d,e,f
1,150 lbs. Grazed forage. High-quality forage can reduce duration and animal emissions.e,f
Grass-finished system representing less than 3% of the US beef market.
Beef from Dairy
18% of US beef are from the dairy industry (6% from old dairy cows; 14% from fed, mostly male dairy calves).h The footprints of these animals are different, as they are products of distinct systems.
Beef production systems tend to be more complex than other animal operations, and cattle are managed differently as they move through
phases. Phase durations and end weights depend on various factors, such as entry weights and diets.
Notes: In the Upper Midwest, about 50 percent of production involves sending calves directly to feedlots for longer finishing periods (303 days, 10 months), whereas the other 50 percent entails 300 d on pasture followed by 150 d (5 mos.) in feedlots (Pelletier, Pirog, and Rasmussen 2010). Finishing can be shorter in some environments (e.g., California; Stackhouse-Lawson et al. 2012; 121–212 d). While rates of weight gain are 5–7 lbs. dry matter/lb on grain-based feeds, they are lower on forage (usually 7–25 lbs. dry matter/lb, depending on forage quality; Coffey 2011).
DATA SOURCES: (A) CHEUNG ET AL. 2017; (B) LUPO ET AL. 2013; (C) ERS 2016; (D) LARDY 2013; (E) CAPPER 2012; (F) PELLETIER, PIROG, AND RASMUSSEN 2010; (G) MATHEWS AND JOHNSON 2013; (H) LOWE AND GEREFFI 2009.
24 | UNION OF CONCERNED SCIENTISTS
TABLE A2. Values of Key Variables Used to Calculate Effects of Scenarios Including Corn-Soy Rotations and Four-Crop Rotations
Category Value(s)
Soil Carbon Fluxes Low Carbon Case High Carbon Case
Cropland to Pasture a,b 0.20 t C/ac/y 0.40 t C/ac/y
Managed Grazing (vs. Continuous) a,b 0.14 t C/ac/y 0.40 t C/ac/y
Complex Crop Rotation (Four-Crop Rotation) b,c 0.06 t C/ac/y 0.20 t C/ac/y
Soil Nitrogen Fluxes Value
N2O-N Lost After Application d,1 1.0%
Input Use Fertilizer use Energy Use
Corn in Corn-Soy Rotation 143 lbs/ac/y e,2 5.83 BTU/ac/y h,5
Corn in Four-Crop Rotation 0 f,g,3 2.63 BTU/ac/y h,5
Other Crops Var.f,g,4 Var. h,4
Water Footprint Gray Water Green Water
Corn i,6 187 m3/ton 1,082 m3/ton
Soy i,6 33 m3/ton 2,079 m3/ton
Oats i,7 128 m3/ton 1,479 m3/ton
Alfalfa/Grass i,8 20 m3/ton 207 m3/ton
Notes: 1. Recent studies suggest this may be too low in heavily fertilized corn-soy and too high for more sustainable systems (Turner et al. 2015; Shcherbak, Millar, and Robertson 2014). 2. Minnesota state average. 3. Based on use of a legume as fourth crop and corn as first. 4. Based on corn rates and scaled to other crops using Cropping Systems Calculator costs (Wasserman-Olin 2016). 5. Energy units converted to CO2 using diesel fuel emissions factor (161.30 lbs. CO2/mill BTU; EIA 2016). 6. Rain-fed (Table 8 in Mekonnen and Hoekstra 2011); 10 percent lower for 4-CR. 7. Table 3 in Mekonnen and Hoekstra 2011. 8. Table 2 in Mekonnen and Hoekstra 2011 (fodder crops).
DATA SOURCES: (A) CONANT, PAUSTIAN, AND ELLIOTT 2001; (B) CHAMBERS, LAL, AND PAUSTIAN 2016; (C) MCDANIEL, TIEMANN, AND GRANDY 2014; (D) BOUWMAN, BOUMANS, AND BATJES 2002; (E) NASS 2014; (F) CLARK 2007; (G) DAVIS ET AL. 2012; (H) JOHANNS, CHASE, AND LIEBMAN 2012; (I) MEKONNEN AND HOEKSTRA 2011.
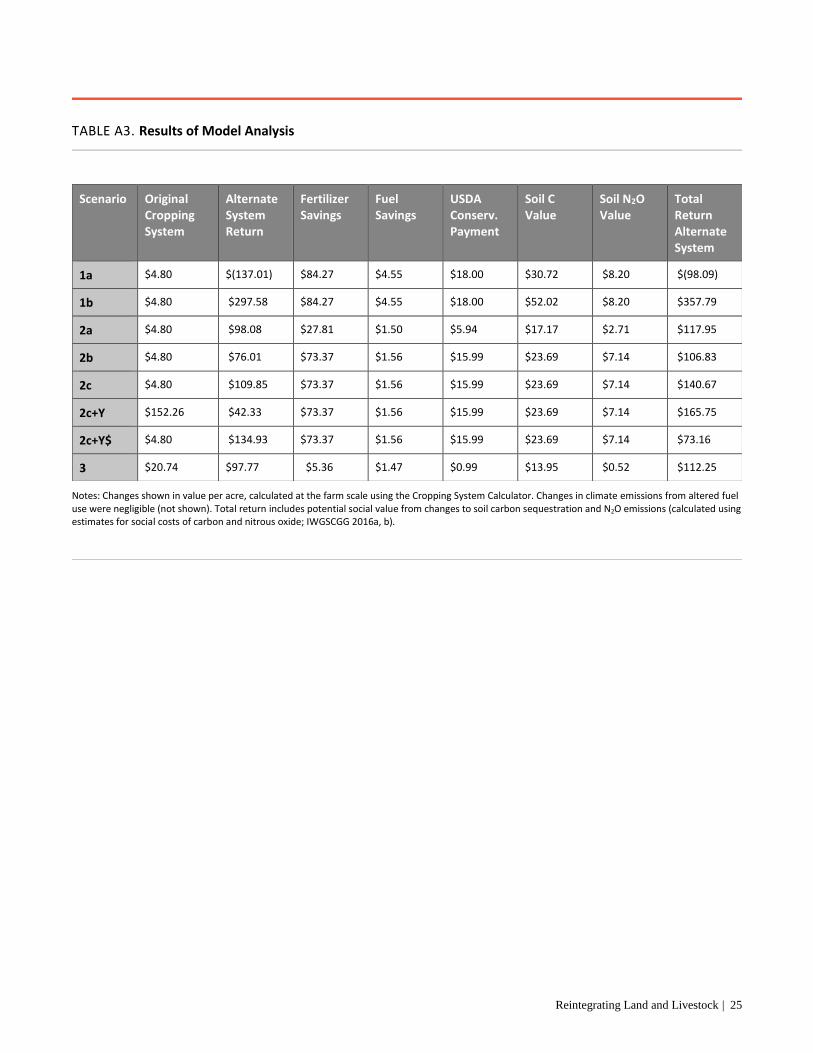
Reintegrating Land and Livestock | 25
TABLE A3. Results of Model Analysis
Scenario Original Cropping System
Alternate System Return
Fertilizer Savings
Fuel Savings
USDA Conserv. Payment
Soil C Value
Soil N2O Value
Total Return Alternate System
1a $4.80 $(137.01) $84.27 $4.55 $18.00 $30.72 $8.20 $(98.09)
1b $4.80 $297.58 $84.27 $4.55 $18.00 $52.02 $8.20 $357.79
2a $4.80 $98.08 $27.81 $1.50 $5.94 $17.17 $2.71 $117.95
2b $4.80 $76.01 $73.37 $1.56 $15.99 $23.69 $7.14 $106.83
2c $4.80 $109.85 $73.37 $1.56 $15.99 $23.69 $7.14 $140.67
2c+Y $152.26 $42.33 $73.37 $1.56 $15.99 $23.69 $7.14 $165.75
2c+Y$ $4.80 $134.93 $73.37 $1.56 $15.99 $23.69 $7.14 $73.16
3 $20.74 $97.77 $5.36 $1.47 $0.99 $13.95 $0.52 $112.25
Notes: Changes shown in value per acre, calculated at the farm scale using the Cropping System Calculator. Changes in climate emissions from altered fuel use were negligible (not shown). Total return includes potential social value from changes to soil carbon sequestration and N2O emissions (calculated using estimates for social costs of carbon and nitrous oxide; IWGSCGG 2016a, b).
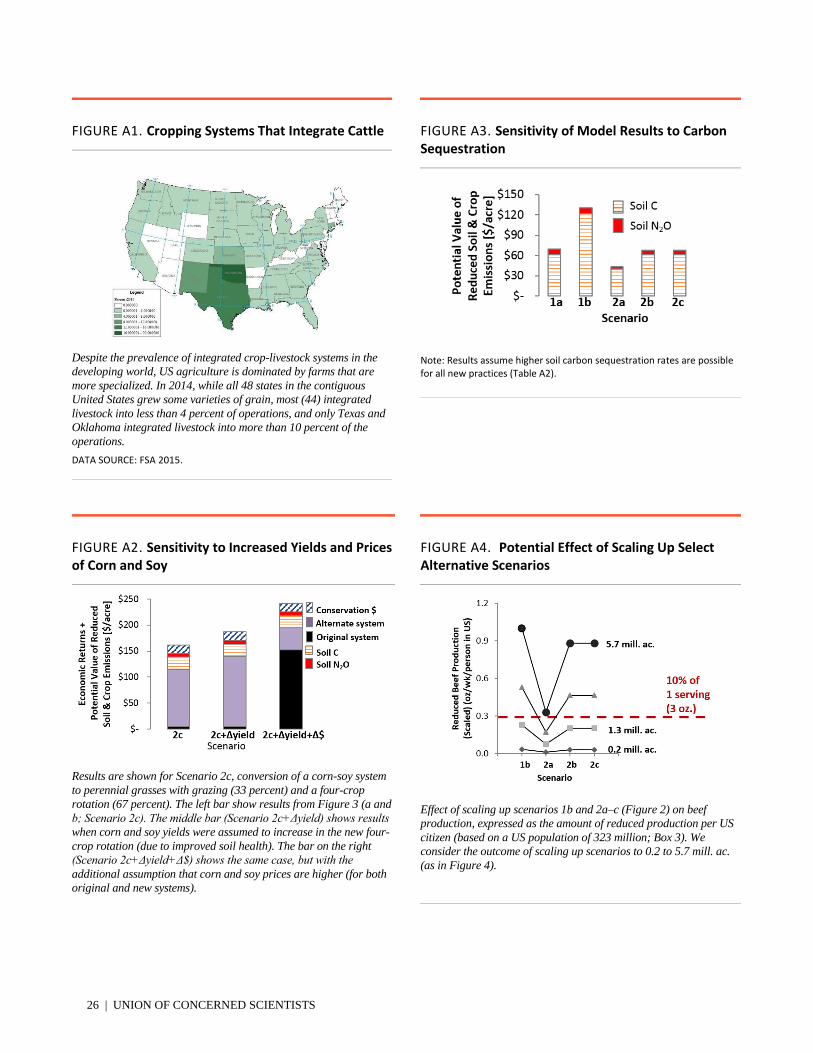
26 | UNION OF CONCERNED SCIENTISTS
FIGURE A1. Cropping Systems That Integrate Cattle
Despite the prevalence of integrated crop-livestock systems in the
developing world, US agriculture is dominated by farms that are
more specialized. In 2014, while all 48 states in the contiguous
United States grew some varieties of grain, most (44) integrated
livestock into less than 4 percent of operations, and only Texas and
Oklahoma integrated livestock into more than 10 percent of the
operations.
DATA SOURCE: FSA 2015.
FIGURE A2. Sensitivity to Increased Yields and Prices of Corn and Soy
Results are shown for Scenario 2c, conversion of a corn-soy system
to perennial grasses with grazing (33 percent) and a four-crop
rotation (67 percent). The left bar show results from Figure 3 (a and
b; Scenario 2c). The middle bar (Scenario 2c+Δyield) shows results
when corn and soy yields were assumed to increase in the new four-
crop rotation (due to improved soil health). The bar on the right
(Scenario 2c+Δyield+Δ$) shows the same case, but with the
additional assumption that corn and soy prices are higher (for both
original and new systems).
FIGURE A4. Potential Effect of Scaling Up Select Alternative Scenarios
Effect of scaling up scenarios 1b and 2a–c (Figure 2) on beef
production, expressed as the amount of reduced production per US
citizen (based on a US population of 323 million; Box 3). We
consider the outcome of scaling up scenarios to 0.2 to 5.7 mill. ac.
(as in Figure 4).
FIGURE A3. Sensitivity of Model Results to Carbon Sequestration
Note: Results assume higher soil carbon sequestration rates are possible for all new practices (Table A2).
Reintegrating Land and Livestock | 27
[APPENDIX REFERENCES]
Bouwman, A.F., L.J.M. Boumans, and N.H. Batjes. 2002.
Emissions of N2O and NO from fertilized fields: Summary of
available measurement data. Global Biogeochemical Cycles
16:6-1–6-13. doi:10.1029/2001GB001811.
Capper, J.L. 2012. Is the grass always greener? Comparing the
environmental impact of conventional, natural and grass-fed
beef production systems. Animals 2:127–143.
doi:10.3390/ani2020127.
Chambers, A., R. Lal, K. Paustian. 2016. Soil carbon
sequestration potential of US croplands and grasslands:
Implementing the 4 per Thousand Initiative. Journal of Soil
and Water Conservation 71:68A–74A. doi:10.2489/
jswc.71.3.68A.
Cheung, R., P. McMahon, E. Norell, R. Kissel, and D. Benz.
2017. Back to grass: The market potential for US grassfed beef.
New York: SLM Partners.
Clark, A. (Ed.) 2007. Managing cover crops profitably, third
edition. Washington, DC: U.S. Department of Agriculture.
Coffey, C. 2011. The efficiency of beef production. Ardmore,
OK: Noble Research Institute. Online at www.noble.org/ag/
pasture/efficiency-beef/, accessed July 2017.
Conant, R.T., K. Paustian, and E.T. Elliott. 2001. Grassland
management and conversion into grassland: Effects on soil
carbon. Ecological Applications 11(2):343–355.
Davis, A.S., J.D. Hill, C.A. Chase, A.M. Johanns, and M.
Liebman. 2012. Increasing cropping system diversity balances
productivity, profitability and environmental health. PloS ONE
7:e47149. doi:10.1371/journal.pone.0047149.
Economic Research Service (ERS). 2016. Cattle and beef:
Background. Online at www.ers.usda.gov/topics/animal-
products/cattle-beef/background.aspx, accessed July 2017.
Energy Information Administration (EIA). 2016. Carbon
dioxide emissions coefficients. Online at www.eia.gov/
environment/emissions/co2_vol_mass.cfm accessed July 2017.
Farm Service Agency (FSA). 2015. Crop acreage data. Online
at www.fsa.usda.gov/news-room/efoia/electronic-reading-
room/frequently-requested-information/crop-acreage-
data/index, accessed July 2017.
Johanns, A.M., C. Chase, and M. Liebman. 2012. Energy and
economic returns by crop rotation. Ag Decision Maker,
September, File A1-90. Online at www.extension.iastate.edu/
agdm/crops/html/a1-90.html, accessed July 2017.
Lardy, G. 2013. Systems for backgrounding beef cattle.
AS1151 (Revised). Fargo: North Dakota State University
Extension Service.
Lowe, M., and G. Gereffi. 2009. A value chain analysis of the
U.S. beef and dairy industries. Durham, NC: Duke University
Center on Globalization, Governance and Competitiveness.
Lupo, C.D., D.E. Clay, J.L. Benning, and J.J. Stone. 2013.
Life-cycle assessment of the beef cattle production system for
the northern Great Plains, USA. Journal of Environment
Quality 42:1386. doi:10.2134/jeq2013.03.0101.
Mathews Jr., K.H., and R.J. Johnson. 2013. Alternative beef
production systems: Issues and implications. LDPM-218-01.
Washington, DC: U.S. Department of Agriculture.
McDaniel, M.D., L.K. Tiemann, and A.S. Grandy. 2014. Does
agricultural crop diversity enhance soil microbial biomass and
organic matter dynamics? A meta-analysis. Ecological
Applications 24:560–570.
Mekonnen, M.M., and A.Y. Hoekstra. 2011. The green, blue
and grey water footprint of crops and derived crop products.
Hydrology and Earth System Sciences 15:1577–1600.
doi:10.5194/hess-15-1577-2011.
National Agricultural Statistics Service (NASS). 2014.
Agricultural chemical use program: 2014 corn and potatoes.
Online at www.nass.usda.gov/Surveys/Guide_to_NASS
_Surveys/ Chemical_Use/, accessed July 2017.
Pelletier, N., R. Pirog, and R. Rasmussen. 2010. Comparative
life cycle environmental impacts of three beef production
strategies in the Upper Midwestern United States. Agricultural
Systems 103:380–389. doi:10.1016/j.agsy.2010.03.009.
28 | UNION OF CONCERNED SCIENTISTS
Shcherbak, I., N. Millar, and G.P. Robertson. 2014. Global
meta-analysis of the nonlinear response of soil nitrous oxide
(N2O) emissions to fertilizer nitrogen. Proceedings of the
National Academy of Sciences of the United States of America
111:9199–9204.
Stackhouse-Lawson, K.R., C.A. Rotz, J.W. Oltjen, and F.M.
Mitloehner. 2012. Carbon footprint and ammonia emissions of
California beef production systems. Journal of Animal Science
90:4641–4655. doi:10.2527/jas.2011-4653.
Turner, P.A., T.J. Griffis, X. Lee, J.M. Baker, R.T. Venterea,
and J.D. Wood. 2015. Indirect nitrous oxide emissions from
streams within the US Corn Belt scale with stream order.
Proceedings of the National Academy of Sciences 112:9839–
9843. doi:10.1073/pnas.1503598112.
Wasserman-Olin, R. 2016. Cropping systems calculator:
Continuous living cover. Version 1.1. Montevideo, MN: Land
Stewardship Project. Online at http://landstewardshipproject.
org/stewardshipfood/chippewa10croppingsystemscalculator,
accessed July 2017.