Embed Size (px)
Citation preview
Rehabiliation of Road Pavements to Enhanced the
Durability using High Strength Concrete (H.S.C)
Syed Omer Hussain Tanveer, Amer Salam, Sohail Shafiuddin Ahmed,
Mirza Salman Baig Khaja, Mohammad Naveed Jameel ISL Engineering college
Under the Guidance of
Mr. Dr. Ahmed Hussain Assistant Professor in Civil Engineering dept.
ISL Engineering College, Hyderabad, India -500005
Abstract:- The vast amount of civil infrastructure in India includes an extensive stretch of road networks. From an economic point of
view it is more cost effective to maintain the already existing pavements rather than building new ones.
Rapid civilization leads to construction of thousands of buildings in urban areas. Now days, multi-storied R.C. framed structures are
common in urban regions in the cities like Hyderabad, Bangalore, New Delhi, Chennai, Maharashtra, Pune etc.
Due to thickly populated urban regions the buildings are extending vertically or going high or becoming more slender. Decades are
evident that traffic volume in urban regions is high when compared to semi urban or rural regions.
A large proportion of the traffic delays on these road networks are caused by road closures and closures of individual lanes for pavement
maintenance purposes. The application of early strength concrete in pavement maintenance measures will lead to a substantial
reduction in the user costs involved with the road closures caused by such maintenance. These costs involve both the actual costs of the
delays in terms of time and fuel consumption, but also, more importantly, the social and economic costs associated with the safety
hazards resulting from these closures.
This research is aimed at selecting two four-hour mix designs out of a total of five mix designs selected in a report made by Construction
Technology Laboratories Inc. (CTL), based on concrete compressive strength and freezing-thawing durability. The targeted concrete
strength aimed at is a minimum of 14 MPa at four hours.
CHAPTER 1 – INTRODUCTION
General Overview
All civil infrastructures have a definite life span. In other words, all structures are designed to fail at some point, and this includes
the vast network of road pavements in India. Approximately 2% of lands in India are paved this consists of flexible, rigid and
composite pavements. In order to ensure that pavements achieve the purpose for which they were designed they ought to be
maintained regularly and at very little cost to the road user.
Road maintenance and rehabilitation form the largest percentage of this figure. It is therefore necessary to curtail the high cost of
maintenance to road users by developing measures to decrease traffic delays during maintenance and rehabilitation.
There is a wide perception that concrete pavements "cost too much," "take too long," or "are too difficult to repair." However, to
the contrary, although the initial cost of concrete may be higher than for asphalt pavement, however concrete costs less during the
pavement's life cycle. Roads can be opened faster than ever and can be repaired easily with the proper equipment, materials,
processes and or procedures. Also concrete pavement restoration can return a pavement to a near-new condition at a lesser cost
to the road user if measurers to decrease delay time are put in place.
Background Information
Deteriorating asphalt and concrete pavement infrastructure worldwide demands innovative and economical rehabilitation
solutions. When desired, a properly designed and constructed bonded overlay can add considerable life to an existing pavement,
by taking advantage of the remaining structural capacity of the original pavement. For patchwork and total rehabilitation, two
types of thin concrete pavement overlays rely on a bond between the overlay and the existing pavement for performance. Concrete
overlays bonded to existing concrete pavements are called Bonded Concrete Overlays (BCO). Concrete overlays bonded to
existing asphalt pavements are called Ultra-thin White-topping (UTW). Research has shown that concrete overlays over asphalt
often bond to the asphalt, and that some reduction of concrete flexural stresses may be expected from this effect. These overlays
have been used to address rutting of asphalt pavements.
International Journal of Engineering Research & Technology (IJERT)
ISSN: 2278-0181http://www.ijert.org
IJERTV9IS060309(This work is licensed under a Creative Commons Attribution 4.0 International License.)
Published by :
www.ijert.org
Vol. 9 Issue 06, June-2020
469
Bond strength and resistance to cracking are important for overlay performance. In many cases these overlays are constructed on
heavily traveled pavements, making early opening to traffic important. Therefore, early strength development without
compromising durability is necessary. Satisfactory performance will only occur if the overlay is of sufficient thickness and is well
bonded to the original pavement. The design assumption is that if the overlay bonds perfectly with the original pavement, it
produces a monolithic structure. Without bond, there is very little structural benefit from an overlay, and the overlay may break
apart rapidly under heavy traffic.
The use of concrete overlays for pavement and bridge deck maintenance and rehabilitation has been in existence for several
decades, both un-bonded and bonded overlays have been used in rehabilitation and maintenance of deteriorating road pavements.
For both BCO and UTW overlays, characteristics of the overlay concrete have important implications for early age behavior and
long-term performance.
High Performance Concrete (HPC)
High performance concrete is defined as “concrete made with appropriate materials combined according to a selected mix design
and properly mixed, transported, placed, consolidated, and cured so that the resulting concrete will give excellent performance in
the structure in which it will be exposed, and with the loads to which it will be subjected for its design life”[Forster et al. 1994].
The design of high performance concrete mixes started in the 1980’s in the private sector to protect parking structures and
reinforced concrete high-rise buildings from chlorides, sulfates, alkali-silica reactivity and to curtail concrete shrinkage and creep.
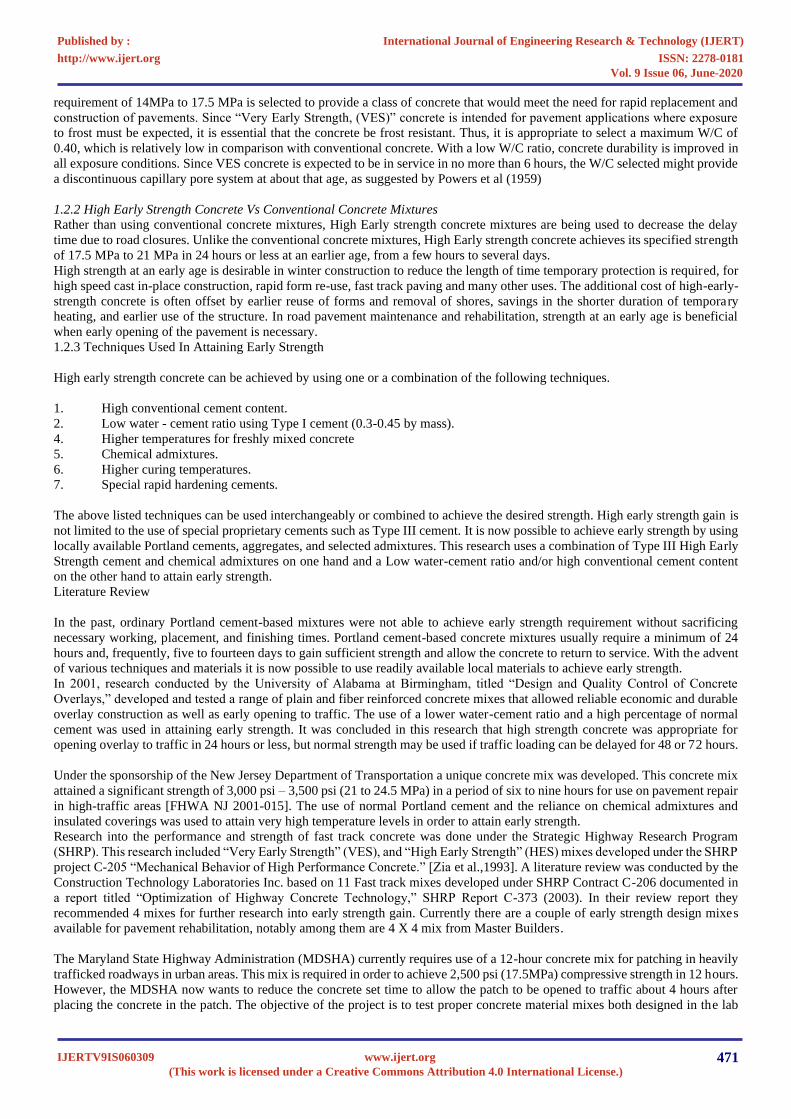
HPC for pavements originated in the Strategic Highway Research Program under contract C205 where the mechanical properties
of HPC were described and studied under actual use conditions. SHRP developed a definition of HPC (Table 1.1) and funding for
limited field trials, which were to be followed by a substantial implementation period.
Table 1.1: Definition of HPC according to SHRP C-205
Performance goals for HPC pavements included an increase in pavement system service life, a decrease in construction time
(including fast-track concrete paving techniques), longer life cycles such as a 30 - 50-year life, and lower maintenance costs.
1.2.1 Early Strength / Fast Track Concrete mixes
Early strength concrete mixes are concrete mixes that, through the use of high-early-strength cement or admixtures, are capable
of attaining specified strengths at an earlier age than normal concrete. This property is very useful in road pavement maintenance
and rehabilitation by reducing delay costs to the road user.
Concrete or composite pavement repair is prime for maintaining existing roads. Before the advent of early strength concrete, there
was no comparism of the costs of flexible pavements to rigid pavements in both initial and operating costs. This was because the
initial material costs of rigid pavements and the cost of delays due to the longer closing time during maintenance and rehabilitation
were far more than when asphalt was used. Since its inception, a lot of research and development has been done on early strength
concrete. Early Strength can be broken down into two categories, Very Early Strength (VES) and High Early Strength (HES)
concrete
High early strength concrete is specified to have minimum compressive strength of 14 MPa but for a longer duration of 12 hours.
In the context of our research, however, the word “Early” is considered to be relative; the concrete mixes to be researched will be
termed “Early strength,” without taking into consideration the time and place of strength gain.
These criteria were adopted after considering several factors pertinent to the construction and design of highway pavements and
structures. The use of a time constraint of 4 to 6 hours for “Very Early Strength, (VES)” concrete is intended for projects with
very tight construction schedules involving full-depth pavement replacements in urban or heavily traveled areas. The strength
Category of HPC
Minimum Maximum Minimum Frost
Compressive Strength Water/cement Ratio Durability Factor
Very early strength (VES)
Option A 14 MPa
0.4 80%
(With Type III Cement) in 6 hours
Option B 17.5 MPa
0.29 80%
(With PBC-XT Cement) in 4 hours
High early strength (HES) 35 MPa
0.35 80%
(With Type III Cement) in 24 hours
Very high strength 70 MPa
0.35 80%
(With Type I Cement) in 28 hours
International Journal of Engineering Research & Technology (IJERT)
ISSN: 2278-0181http://www.ijert.org
IJERTV9IS060309(This work is licensed under a Creative Commons Attribution 4.0 International License.)
Published by :
www.ijert.org
Vol. 9 Issue 06, June-2020
470
requirement of 14MPa to 17.5 MPa is selected to provide a class of concrete that would meet the need for rapid replacement and
construction of pavements. Since “Very Early Strength, (VES)” concrete is intended for pavement applications where exposure
to frost must be expected, it is essential that the concrete be frost resistant. Thus, it is appropriate to select a maximum W/C of
0.40, which is relatively low in comparison with conventional concrete. With a low W/C ratio, concrete durability is improved in
all exposure conditions. Since VES concrete is expected to be in service in no more than 6 hours, the W/C selected might provide
a discontinuous capillary pore system at about that age, as suggested by Powers et al (1959)
1.2.2 High Early Strength Concrete Vs Conventional Concrete Mixtures
Rather than using conventional concrete mixtures, High Early strength concrete mixtures are being used to decrease the delay
time due to road closures. Unlike the conventional concrete mixtures, High Early strength concrete achieves its specified strength
of 17.5 MPa to 21 MPa in 24 hours or less at an earlier age, from a few hours to several days.
High strength at an early age is desirable in winter construction to reduce the length of time temporary protection is required, for
high speed cast in-place construction, rapid form re-use, fast track paving and many other uses. The additional cost of high-early-
strength concrete is often offset by earlier reuse of forms and removal of shores, savings in the shorter duration of temporary
heating, and earlier use of the structure. In road pavement maintenance and rehabilitation, strength at an early age is beneficial
when early opening of the pavement is necessary.
1.2.3 Techniques Used In Attaining Early Strength
High early strength concrete can be achieved by using one or a combination of the following techniques.
1. High conventional cement content.
2. Low water - cement ratio using Type I cement (0.3-0.45 by mass).
4. Higher temperatures for freshly mixed concrete
5. Chemical admixtures.
6. Higher curing temperatures.
7. Special rapid hardening cements.
The above listed techniques can be used interchangeably or combined to achieve the desired strength. High early strength gain is
not limited to the use of special proprietary cements such as Type III cement. It is now possible to achieve early strength by using
locally available Portland cements, aggregates, and selected admixtures. This research uses a combination of Type III High Early
Strength cement and chemical admixtures on one hand and a Low water-cement ratio and/or high conventional cement content
on the other hand to attain early strength.
Literature Review
In the past, ordinary Portland cement-based mixtures were not able to achieve early strength requirement without sacrificing
necessary working, placement, and finishing times. Portland cement-based concrete mixtures usually require a minimum of 24
hours and, frequently, five to fourteen days to gain sufficient strength and allow the concrete to return to service. With the advent
of various techniques and materials it is now possible to use readily available local materials to achieve early strength.
In 2001, research conducted by the University of Alabama at Birmingham, titled “Design and Quality Control of Concrete
Overlays,” developed and tested a range of plain and fiber reinforced concrete mixes that allowed reliable economic and durable
overlay construction as well as early opening to traffic. The use of a lower water-cement ratio and a high percentage of normal
cement was used in attaining early strength. It was concluded in this research that high strength concrete was appropriate for
opening overlay to traffic in 24 hours or less, but normal strength may be used if traffic loading can be delayed for 48 or 72 hours.
Under the sponsorship of the New Jersey Department of Transportation a unique concrete mix was developed. This concrete mix
attained a significant strength of 3,000 psi – 3,500 psi (21 to 24.5 MPa) in a period of six to nine hours for use on pavement repair
in high-traffic areas [FHWA NJ 2001-015]. The use of normal Portland cement and the reliance on chemical admixtures and
insulated coverings was used to attain very high temperature levels in order to attain early strength.
Research into the performance and strength of fast track concrete was done under the Strategic Highway Research Program
(SHRP). This research included “Very Early Strength” (VES), and “High Early Strength” (HES) mixes developed under the SHRP
project C-205 “Mechanical Behavior of High Performance Concrete.” [Zia et al.,1993]. A literature review was conducted by the
Construction Technology Laboratories Inc. based on 11 Fast track mixes developed under SHRP Contract C-206 documented in
a report titled “Optimization of Highway Concrete Technology,” SHRP Report C-373 (2003). In their review report they
recommended 4 mixes for further research into early strength gain. Currently there are a couple of early strength design mixes
available for pavement rehabilitation, notably among them are 4 X 4 mix from Master Builders.
The Maryland State Highway Administration (MDSHA) currently requires use of a 12-hour concrete mix for patching in heavily
trafficked roadways in urban areas. This mix is required in order to achieve 2,500 psi (17.5MPa) compressive strength in 12 hours.
However, the MDSHA now wants to reduce the concrete set time to allow the patch to be opened to traffic about 4 hours after
placing the concrete in the patch. The objective of the project is to test proper concrete material mixes both designed in the lab
International Journal of Engineering Research & Technology (IJERT)
ISSN: 2278-0181http://www.ijert.org
IJERTV9IS060309(This work is licensed under a Creative Commons Attribution 4.0 International License.)
Published by :
www.ijert.org
Vol. 9 Issue 06, June-2020
471
and in the field, for composite pavements that will allow the repaired sections to be opened to traffic after four hours of concrete
placement in the patch. A shorter patch repair time would minimize the disruption caused to traffic and ultimately provide longer
lasting composite pavements. The report by the Construction Technology Laboratories (CTL) was submitted to the Maryland
State Highway Administration in April 2003. Based on this report, a proposal was to be made to the Maryland State Highway
Administration to test the four concrete mix designs selected in the report made by CTL.
From an earlier literature review study of eleven mixes, eight mixes were considered suitable for further study, two used at a
Georgia site and six used at a Ohio site. Based on the performances of these mixes during the initial trials and, considering
modifications for local materials, the VES mix, the GADOT mix in Georgia, and the VES mix and the ODOT mix in Ohio were
selected as the four trial mixes to be evaluated further as part of a laboratory study. Also included as one of the trial mix designs,
was a 12- hour concrete mix design currently used in Maryland for fast- track paving, and designated as the control Mix.
1.5.0 Research Objective
The objective of this research is to select two (2) concrete mixes out of the five selected that will yield a compressive strength of
at least 14MPa after four hours of casting. The selected specimen should be able to withstand at least 300 cycles of freezing and
thawing. The 2 selected mixes shall have passed both criteria. Based on the findings and recommendations of this report, another
phase of this project is to be started to investigate the characteristics of the recommended mixes to field conditions. This will
comprise the second phase of this project.
CHAPTER 2 – CONCRETE AND ITS CONSTITUENTS
2. Introduction
Concrete is a construction material; it has been used for a variety of structures such as highways, bridges, buildings, dams, and
tunnels over the years. Its widespread use compared to other options like steel and timber is due to its versatility, durability and
economy.
The external appearance of concrete looks very simple, but it has a very complex internal structure. It is basically a simple
homogeneous mixture of two components, aggregates (gravel or crushed stone) and paste (cement, water and entrapped or
purposely entrained air). Cement paste normally constitutes about 25%-40% and aggregates 60%-75% of the total volume of
concrete. When the paste is mixed with the aggregates, the chemical reaction of the constituents of the paste binds the aggregates
into a rocklike mass as it hardens. This mass is referred to as concrete.
The quality of concrete greatly depends upon the quality of the paste and the quality of hardened concrete is determined by the
amount of water used in relation to the amount of cement. Thus, the less water used, the better the quality of concrete, so far as it
can be consolidated properly. Although smaller amounts of water result in stiffer mixes, these mixes are more economical and
can still be used with efficient vibration during placing.
The physical and chemical properties of concrete, however, can be altered by the addition of admixtures in order to attain desirable
mixes for specific purposes.
2.1.0 Basic Components of Concrete
Concrete is made up of various components, primarily; concrete is made up of paste, coarse aggregates and admixtures. The basic
components of concrete are the following;
2.1.1Portland cement
Portland cement is the most common type of cement in general use around the world as a basic ingredient of concrete, mortar,
stucco, and non-specialty grout. It was developed from other types of hydraulic lime in England in the early 19th century by
Joseph Aspdin, and usually originates from limestone. It is a fine powder, produced by heating limestone and clay minerals in a
kiln to form clinker, grinding the clinker, and adding 2 to 3 percent of gypsum. Several types of Portland cement are available.
The most common, called ordinary Portland cement (OPC), is grey, but white Portland cement is also available. Its name is
derived from its similarity to Portland stone which was quarried on the Isle of Portland in Dorset, England. It was named by
Joseph Aspdin who obtained a patent for it in 1824. However, his son William Aspdin is regarded as the inventor of "modern"
Portland cement due to his developments in the 1840s
2.1.2 Types of Portland cement
Type I
Type I is a general purpose Portland cement suitable for all uses where the special properties of other types are not required. It is
used where cement or concrete is not subject to specific exposures, such as sulfate attack from soil or water, or to an objectionable
temperature rise due to heat generated by hydration. Its uses include pavements and sidewalks, reinforced concrete buildings,
bridges, railway structures, tanks, reservoirs, culverts, sewers, water pipes and masonry units.
International Journal of Engineering Research & Technology (IJERT)
ISSN: 2278-0181http://www.ijert.org
IJERTV9IS060309(This work is licensed under a Creative Commons Attribution 4.0 International License.)
Published by :
www.ijert.org
Vol. 9 Issue 06, June-2020
472
Type II Portland cement is used where precaution against moderate sulfate attack is important, as in drainage structures where
sulfate concentrations in groundwater are higher than normal but not unusually severe. Type II cement will usually generate less
heat at a slower rate than Type I. With this moderate heat of hydration, Type II cement can be used in structures of considerable
mass, such as large piers, heavy abutments, and heavy retaining walls. Its use will reduce temperature rise --
especially important
when the concrete is laid in warm weather.
Type III
Type III is a high-early
strength Portland cement that provides high strengths at an early period, usually a week or less. It is used
when forms are to be removed as soon as possible, or when the structure must be put into service quickly. In cold weather, its use
permits a reduction in the controlled curing period. Although richer mixtures of Type I cement can be used to gain high early
strength, Type III may provide it more satisfactorily and more economically.
2.2.0 Aggregates
Aggregates play a major role in the properties of concrete, using the right kind of aggregate greatly influence concrete’s freshly
mixed and hardened properties, mixture proportions, and economy.
Aggregates can be distinguished into two distinct types based on their particle sizes. Fine aggregate consists of natural sand or
crushed stone with most particles smaller than 1/5 inch (5mm). Coarse aggregates consist of one or a combination of gravels and
crushed aggregate with particles predominantly larger than 1/5 inch (5mm) and generally between 3/8 and 1-1/2 inches (9.5 and
37.5mm). Natural aggregates are obtained by either dredging or digging from a pit, river, lake or sea-bed. Crushed aggregates are
produced by the crushing of quarry rock, boulders, cobbles, or large size gravels.
Aggregates must be set to some standards in order to be most useful in engineering structures. They must be clean, hard, strong,
durable particles free of absorbed chemicals, coating of clay and other fine materials in amounts that could affect hydration
and
the bond of the cement paste. Aggregates with low resistance to weathering should be avoided in concrete mixes.
2.3.0
Aggregate Characteristics
Aggregate Grades and Grading Limits
The particle size and distribution of an aggregate is termed grading. It is determine by a sieve analysis in accordance to IS-2386-
2. The seven standard IS-2386-2 sieves for fine aggregates have openings ranging from 150µm to 3/8in (9.5mm). There are
thirteen standard sieves for coarse aggregates that range from 0.046 inches to 4 inches (101.6mm). Grading and grading limits are
usually expressed as percentages of materials passing through each sieve.
It is important to specify grading limits and maximum aggregate size because it affects the relative aggregate proportions as
well
as cement and water requirements, workability, pump-ability, economy, porosity, shrinkage and durability of concrete. It is thus
important to acquire aggregates comprised of a collection of sizes so as to reduce the total volume of voids between aggregates
during mixing.
Shape and Texture
The shape of aggregates influences the properties of concrete mixes. Angular, elongated particles and rough-textured aggregate
produce more workable concrete than smooth, rounded, compact aggregates. Flat and elongated particles should be avoided or at
least limited to 15% by weight of the total aggregate.
Strength and Shrinkage
An aggregate’s tensile strength ranges from 0.21MPa to 16.1MPa and its compressive strength from 70MPa to 280 MPa. This is
important in high strength concrete.
Aggregates with high absorption properties may have high shrinkage on drying. Other characteristics include unit weight and
voids, specific gravity, absorption, surface moisture, strength and shrinkage.
Handling and Storage of Aggregates
To minimize segregation, degradation and contamination by deleterious substances, aggregates should be handled and stored in
an appropriate fashion by stockpiling them in thin layers of uniform thickness. The most appropriate and economical method of
stockpiling is the truck dump method; however, when aggregates are not delivered by truck, an acceptable and less expensive way
is to form the stockpile in layers using a clamshell bucket.
Washed aggregates should be stockpiled in sufficient time so that they can drain to have uniform moisture content before use.
2.4.0 Admixture
Admixtures are additives other than water, aggregates, hydraulic cement, and fibers that are added to the concrete batch
immediately before or during mixing to improve specific characteristics of the concrete. There are two types of admixtures,
chemical and mineral admixtures. These when properly used, offer certain beneficial effects to concrete, including improved
quality of concrete during the stages of mixing, transporting, placing and curing in adverse weather, reduction in the cost of
concrete construction, avoidance of certain emergencies during concrete mix operations, and achievement of certain properties.
International Journal of Engineering Research & Technology (IJERT)
ISSN: 2278-0181http://www.ijert.org
IJERTV9IS060309(This work is licensed under a Creative Commons Attribution 4.0 International License.)
Published by :
www.ijert.org
Vol. 9 Issue 06, June-2020
Type II
473
A survey by the National Ready Mix Concrete Association reported that 39% of all ready-mixed concrete producers use fly ash,
and at least 70% of produced concrete contains a water-reducer admixture. The chemical composition of admixtures vary and,
since many perform more than one function, it is necessary that all admixtures to be used in any concrete mix should meet
specifications and tests should be made to evaluate the effect of the admixtures on the properties of the concrete mix.
The beneficial effects admixtures have on concrete are due to the following properties they possess;
• Water Reduction in the Mix
• Increase in Concrete Strength
• Corrosion Protection
• Strength Enhancement
• Set Retardation
• Crack Control (shrinkage reduction)
• Flow ability
• Finish Enhancement
2.4.1 Mineral Admixtures
Mineral admixtures are usually added to concrete in large amounts to enhance its workability; improve its resistance to thermal
cracking, alkali-aggregate expansion and sulfate attack; reduce permeability; increase strength; and enable a reduction in the
cement content, thus improving the concrete mix properties.
Mineral admixtures affect the nature of the hardened concrete through hydraulic or pozzolanic activity. Pozzolans are cementitious
materials and include natural pozzolans (such as the volcanic ash used in Roman concrete), fly ash and silica fume.
Fly Ash
Fly ashes are finely divided residues resulting from combustion of ground or powdered coal. They are generally finer than cement
and consist mainly of glassy-spherical particles as well as residues of hematite and magnetite, char, and some crystalline phases
formed during cooling.
Fly ash improves the workability in concrete, reduces segregation, bleeding, heat evolution and permeability, inhibits alkali-
aggregate reaction, and enhances sulfate resistance. Because Portland cement concrete pavement is largely dependent on high
volumes of cement, the use of fly ash as an admixture is important where economy is important factor.
Granulated Blast Furnace Slag
Intergrading the granulated slag with Portland cement clinker makes Portland blast furnace slag cement. Its use as a mineral
admixture did not start until the late 1970s. Ground granulated blast-furnace slag is the granular material formed when molten
iron blast furnace slag is rapidly chilled by immersion in water.
2.4.2 Chemical Admixtures
Chemical admixtures are added to concrete to modify its properties. They ensure the quality of concrete during
mixing/transporting/placing/curing. They are added mainly for the entrainment of air, reduction of water or cement content,
plasticization of fresh concrete mixtures, or control of setting time. They are added in smaller amounts as compared to mineral
admixtures. They fall into the following categories: Air entrains, Water reducers, Set retarders, Set accelerators, and
Superplasticizers.
Water Reducers
Water-reducing admixtures are groups of products that are added to concrete to achieve certain workability (slump) at a lower
w/c than that of control concrete. In other words they are used to reduce the quantity of mixing water required to produce concrete
of a certain slump, to reduce water-cement ratio, or to increase slump. Water-reducing admixtures are used to improve the quality
of concrete and to obtain specified strength at lower cement content. They also improve the properties of concrete containing
marginal- or low-quality aggregates and they help in placing concrete under difficult conditions. When these are used, the water
content in concrete is reduced by approximately 5% - 30% depending on whether the reducer is high range or not. Despite
reduction in water content, water reducers can cause significant increases in drying shrinkage.
The basic role of water reducers is to deflocculated the cement particles bounded together and release the water tied up in these
units, producing more fluid paste at lower water contents. Its effectiveness in concrete is a function of its chemical composition,
concrete temperature, cement composition and fineness.
Water reducers have been used primarily in bridge decks, low-slump concrete overlays, and patching concrete.
Specialty Admixture
International Journal of Engineering Research & Technology (IJERT)
ISSN: 2278-0181http://www.ijert.org
IJERTV9IS060309(This work is licensed under a Creative Commons Attribution 4.0 International License.)
Published by :
www.ijert.org
Vol. 9 Issue 06, June-2020
474
These include corrosion inhibitors, shrinkage control, alkali-silica reactivity inhibitors, and coloring. They can be used with
Portland cement, or blended cement either individually or in combinations.
2.5.0 Water for Mixing Concrete
All natural and processed water that is drinkable and has no pronounced taste or odor can be used as mixing water for making
concrete if as it has no chemicals that will react with the concrete constituents to change its required properties or standards. An
example of this is the use of saline water, which can cause dampness of the concrete, efflorescence (white deposits of precipitated
salts on the surface of the concrete), increased risk of corrosion (rust) damage to embedded reinforcement, and damage to paint
systems. It is therefore advisable not to use such water for durable concrete work, and its use is generally avoided. However, some
water, which may not be suitable for drinking, may still be safe for mixing concrete.
Pipe borne drinking water supplies are generally safe for making concrete; however, if in doubt of the quality of water being used,
a simple test to verify its usability is to simply make two sets of cubes or cylinders of the same mix, one with the doubtful water,
and the other set with distilled water, purified water, tap water, or other drinkable water of good quality. By using the second mix
as reference, if the suspected water produces concrete of twenty eight (28)-day compressive strengths for at least 90% of the
strength of the reference set, then it can be considered suitable for mixing concrete. If however it falls below this percentage, its
use will depend on how far below it falls, and the standards and use for which the concrete is to be used, IS:456 2000
IS:456 2000 specifies limits of chemicals allowed in mixing water for concrete and provides a useful guide as to allowances that
have worked in practice.
It is acknowledged that the quality of the constituents of a concrete mix plays an important role in the quality of the concrete;
however, the best materials will fail if incorporated into a concrete mixture in an improper manner or if the concrete is
subsequently incorrectly mixed or transported. It is therefore important to ensure that the batching process and sequence during
loading of the concrete mixer is as important as the quality of materials that make up the concrete mix.
2.6.0 Properties of Concrete
The desired properties required in any concrete mix are the following;
Workability
This is the ease at which concrete is placed, consolidated and finished. Concrete mixes should be workable but not segregated or
bleeding excessively. Entrained air improves workability and reduces the chances of segregation.
Proper consolidation of concrete makes the use of stiffer mixes possible. Stiffer mixes tend to be more economical and are
achieved by reducing the water to cement ratio or using larger proportions of coarse aggregates and a smaller proportion of fine
aggregates, resulting in improved quality and economy.
Permeability and Water-tightness
Permeability is the ability of concrete to resist water penetration or other substances. Pavements as well as other structures
depending on their use require very little or no penetration of water. Water-tightness is the ability of the concrete to retain water
without visible leakage; this property is desirable in water retaining or confined structures.
Permeability and water tightness is a function of the permeability of the paste and aggregates, the gradation of the aggregates and
the relative proportion of paste to aggregate. These are related to water-cement ratio and the degree of cement hydration or length
of moist curing.
Strength
This is defined as the maximum resistance of a concrete specimen to axial loading. The most common measure of concrete
strength is the compressive strength. It is primarily a physical property, which is used in design calculations of structural members.
General use concrete has a compressive strength of 21.0MPa – 35.0 MPa at an age of twenty-eight (28) days whilst high strength
concrete has a compressive strength of at least 42.0 MPa.
In pavement design, the flexural strength of concrete is used; the compressive strength can be used, however, as an index of
flexural strength, once the empirical relationship between them has been established.
The flexural strength is approximated as 7.5 to 10 times the square root of the compressive strength whilst the tensile strength is
approximated as 5 to 7.5 times the square root of the compressive strength. The major factors, which determine the strength of a
mix, are: The free water-cement ratio, the coarse aggregate type (Harder coarse aggregates result in stronger concrete.), and the
cement properties.
Wear resistance
Pavements are subjected to abrasion; thus, in this type of application concrete must have a high abrasion resistance. Abrasion
resistance is closely related to the compressive strength of the concrete.
International Journal of Engineering Research & Technology (IJERT)
ISSN: 2278-0181http://www.ijert.org
IJERTV9IS060309(This work is licensed under a Creative Commons Attribution 4.0 International License.)
Published by :
www.ijert.org
Vol. 9 Issue 06, June-2020
475
3.0.0
Introduction
The previous two chapters gave a brief overview of past research, into concrete as a construction material, and the essence of
early strength concrete in pavement maintenance and rehabilitation. This chapter details the procedures, materials used and
specifications adopted in the preparation of the concrete specimens. The various test methods and test procedures are also detailed
and explained.
To attain early strength, the mix designs adopted from the IS-10262(2009) report by the Construction Technology Laboratory
(CTL) made use of the following techniques:
ƒ
Use of Type III High Early Strength cement.
ƒ
Low water -
cement ratio (0.3-0.45 by mass) using Type I cement.
ƒ
Use of chemical admixtures to enhance workability and durability.
The water to cement ratios varied from 0.3 to 0.45 depending on the specimen in
Question. The use of normal Portland cement (Type I), and High Early Strength Portland cement (Type III) was employed with
various dosages of different kinds of admixtures depending on the concrete quality and specifications required in an attempt to
attain the specified strength and durability requirements. The coarse aggregate-fine aggregate, and the cement-fine aggregate ratio
were also varied in each mix.
3.2.0
Materials
Material Preparations
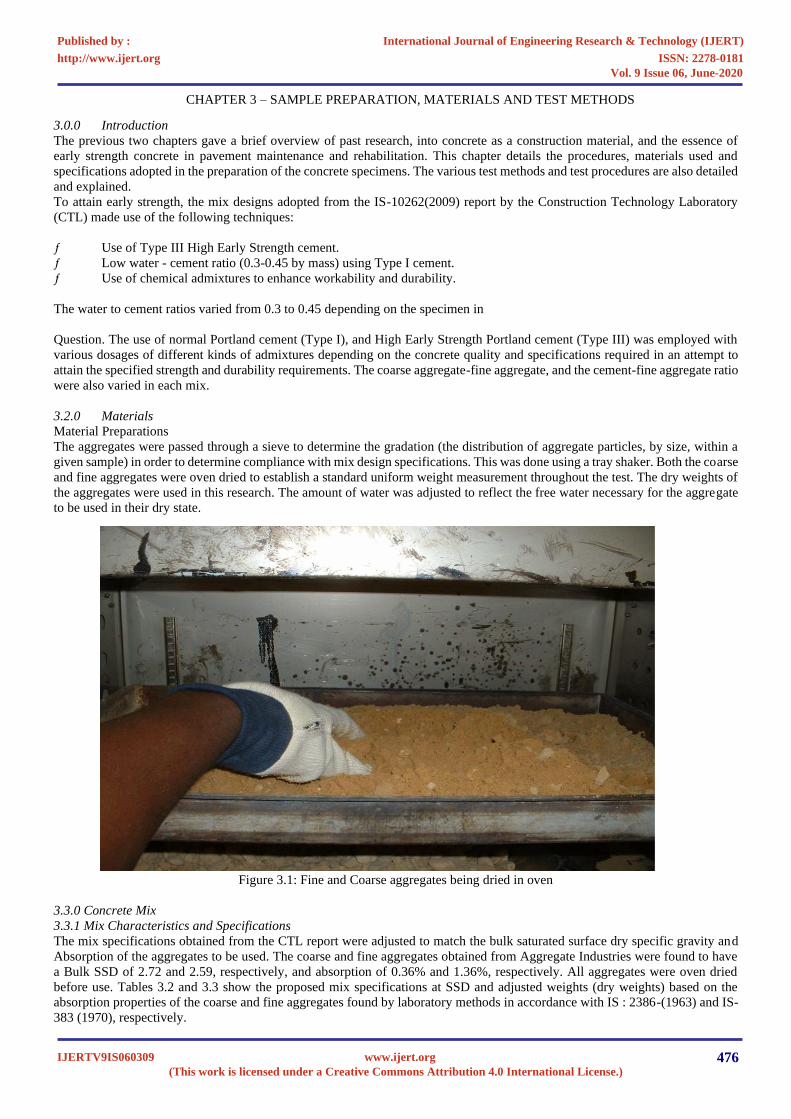
The aggregates were passed through a sieve to determine the gradation (the distribution of aggregate particles, by size, within a
given sample) in order to determine compliance with mix design specifications. This was done using a tray shaker. Both the coarse
and fine aggregates were oven dried to establish a standard uniform weight measurement throughout the test. The dry weights of
the aggregates were used in this research. The amount of water was adjusted to reflect the free water necessary for the aggregate
to be used in their dry state.
Figure 3.1: Fine and Coarse aggregates being dried in oven
3.3.0 Concrete Mix
3.3.1 Mix Characteristics and Specifications
The mix specifications obtained from the CTL report were adjusted to match the bulk saturated surface dry specific gravity and
Absorption of the aggregates to be used. The coarse and fine aggregates obtained from Aggregate Industries were found to have
a Bulk SSD of 2.72 and 2.59, respectively, and absorption of 0.36% and 1.36%, respectively. All aggregates were oven dried
before
use. Tables 3.2 and 3.3 show the proposed mix specifications at SSD and adjusted weights (dry weights) based on the
absorption properties of the coarse and fine aggregates found by laboratory methods in accordance with IS : 2386-(1963) and IS-
383 (1970), respectively.
International Journal of Engineering Research & Technology (IJERT)
ISSN: 2278-0181http://www.ijert.org
IJERTV9IS060309(This work is licensed under a Creative Commons Attribution 4.0 International License.)
Published by :
www.ijert.org
Vol. 9 Issue 06, June-2020
CHAPTER 3 – SAMPLE PREPARATION, MATERIALS AND TEST METHODS
476
3.3.2 Actual mix specifications (Dry weights):
To ensure that the mix proportions were exact according to specifications for laboratory testing, the dry weights of the aggregates
were calculated and the water-cement ratio adjusted. The mix design obtained from the report by CTL was based on the saturated
surface dry density (SSD) of the aggregates. Because aggregates vary in SSD,the absorption of the aggregates used in this research
was calculated in accordance to IS : 2386-(1963) and IS-383 (1970) for coarse and fine aggregates respectively.
To find the SSD and absorption of the aggregates, the aggregates were oven dried to a condition where there was no change in
mass. The dry weights of the aggregates were measured and recorded. The aggregates were then immersed in water to a state
where they were fully saturated.
The weights of the fully saturated aggregates were measuredand the absorption computed as follows;
Weight at SSD = X g
Absorption (ABS) = Y%
Dry Weight =? g
Water at SSD =? g
Dry Weight + Water at SSD = weight at SSD
ABS + Dry weight = weight at SSD
((100%+Y %) /100) of dry weight= X g
Dry Weight = X g / ((100+Y)/100)
Weight of water = Weight at SSD – Dry weight.
Knowing the quantity of water that the aggregate will absorb when fully saturated, the dry weights of the aggregate was computed
as shown above and the amount of absorbed water at SSD was added to the amount of free water to get the total weight of water
required for the mix. Allowance was also allowed for the use of Polarset since each liter of Polarset added to a concrete mix will
contribute 0.78 kg of water to that mix.
Table 3.3 shows the actual mix specifications for all 5 mixes.
MIX DESIGN Materials Dry Weight (Cubic yard basis)
MIX 1 2 3 4 CONTROL
Cement Type III I III I I
Cement, 394.6 341.1 415.37 415.37 362.8
Coarse Aggregate, 782.96 782.96 509.83 1590 801.04
Fine Aggregate, 371.3 205.9 552.4 503.48 539.32
Water, 73.59 72.54 186.88 290.8 264.5
W/C Ratio 0.45 0.44 0.51 0.37 0.34
Table 3.3: Actual mix specifications
3.4.0 Compressive Strength Test
This phase consists of applying a compressive axial load to a molded cylinder until failure occurs in accordance with IS:456-2000
The material for each mix design was batched based on the actual mix specifications in Table 3.3 above. The concrete was mixed
and cured in accordance with IS:456-2000, “Standard Practice for Making and Curing Test Specimens in the Laboratory,” making
sure the inner surface of the mixer was wetted to compensate for the loss of free water due to absorption by the surface of the
mixer.
The concrete components were mixed in an electrically driven mixer. A shovel was used to scoop the mixed concrete into a large
wheelbarrow and a "slump test" was used to test the water content of the concrete. The cone was 1’-0” high, with a top opening
of 4” diameter and a bottom opening of 8” diameter. The mixed concrete was placed into the cone through the top, a bar was used
to compact the concrete, and remove air voids, within the cone. The cone was then lifted clear. By laying a bar on top of the cone,
it was possible to measure how far the concrete "slumped." 6”x12” cylindrical plastic molds were filled and compacted using an
International Journal of Engineering Research & Technology (IJERT)
ISSN: 2278-0181http://www.ijert.org
IJERTV9IS060309(This work is licensed under a Creative Commons Attribution 4.0 International License.)
Published by :
www.ijert.org
Vol. 9 Issue 06, June-2020
477
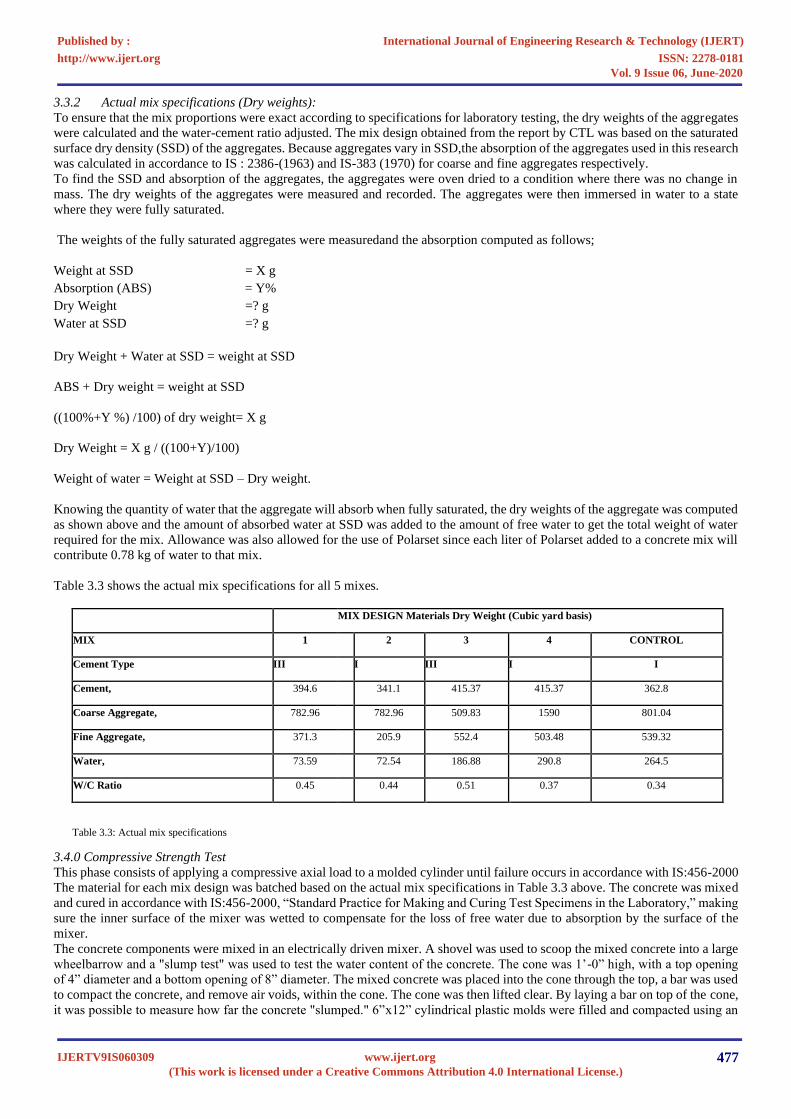
external table vibrator to remove air voids. A total of 60 cylindrical specimens were cast, four (4) for each of the 3-test conditions
(4 hours, 24 hours, and 7 days) for a total of 5 different mixes. The 20 specimens were then de-molded, weighed and tested after
4 hours to obtain the compressive strength. The same procedure was repeated after 24 hours and seven (7) days to obtain the
compressive strength after that period of placing. The seven (7) day-old specimen was placed in a curing tank after twenty –four
(24) hrs.
Fig.3.2: Cast cylindrical specimen
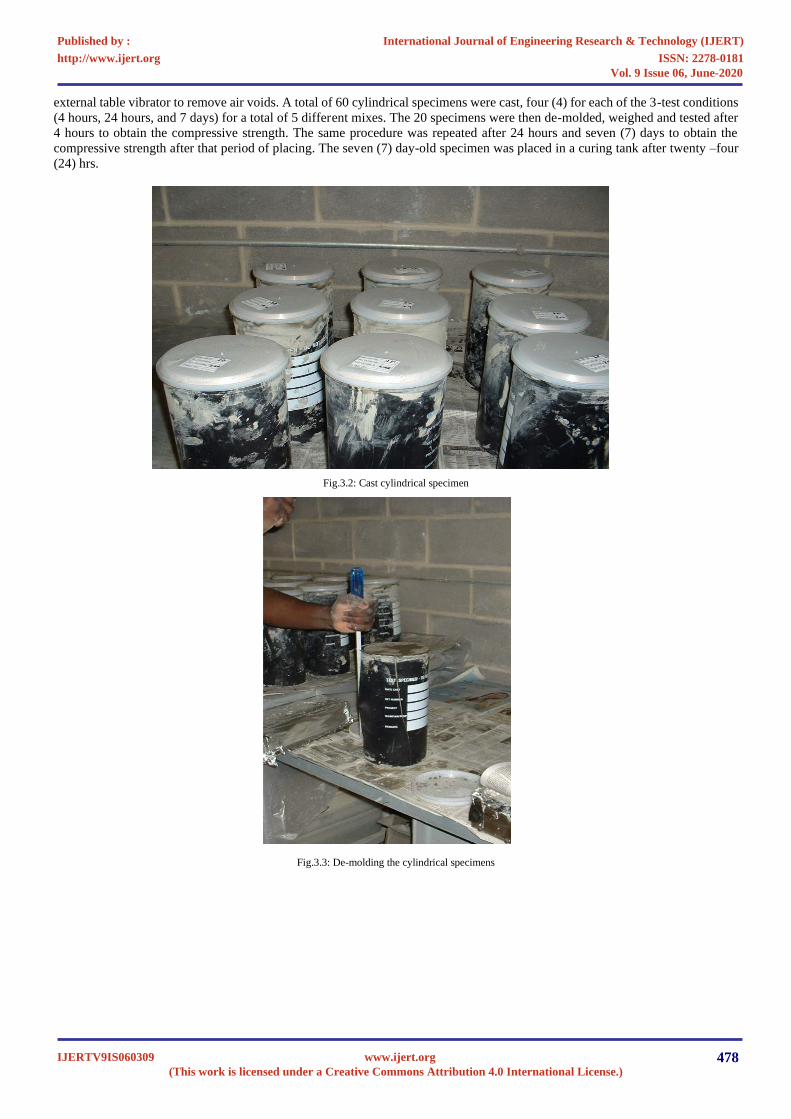
Fig.3.3: De-molding the cylindrical specimens
International Journal of Engineering Research & Technology (IJERT)
ISSN: 2278-0181http://www.ijert.org
IJERTV9IS060309(This work is licensed under a Creative Commons Attribution 4.0 International License.)
Published by :
www.ijert.org
Vol. 9 Issue 06, June-2020
478
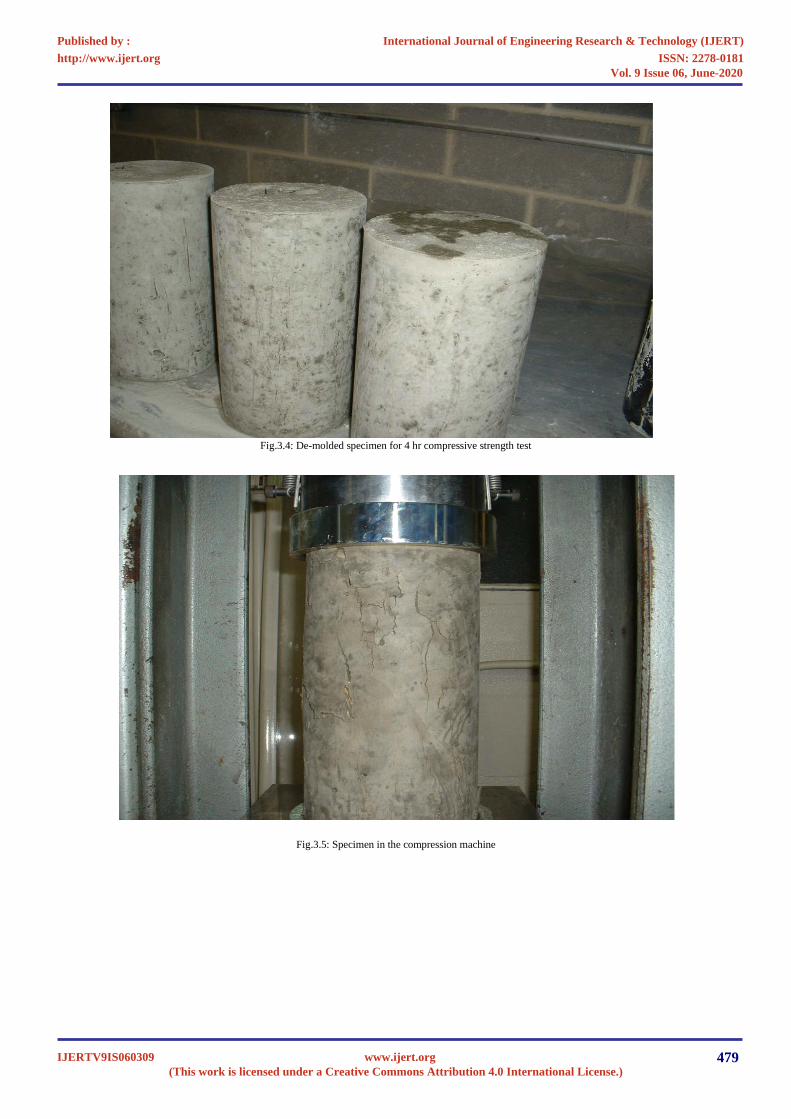
Fig.3.4: De-molded specimen for 4 hr compressive strength test
Fig.3.5: Specimen in the compression machine
International Journal of Engineering Research & Technology (IJERT)
ISSN: 2278-0181http://www.ijert.org
IJERTV9IS060309(This work is licensed under a Creative Commons Attribution 4.0 International License.)
Published by :
www.ijert.org
Vol. 9 Issue 06, June-2020
479
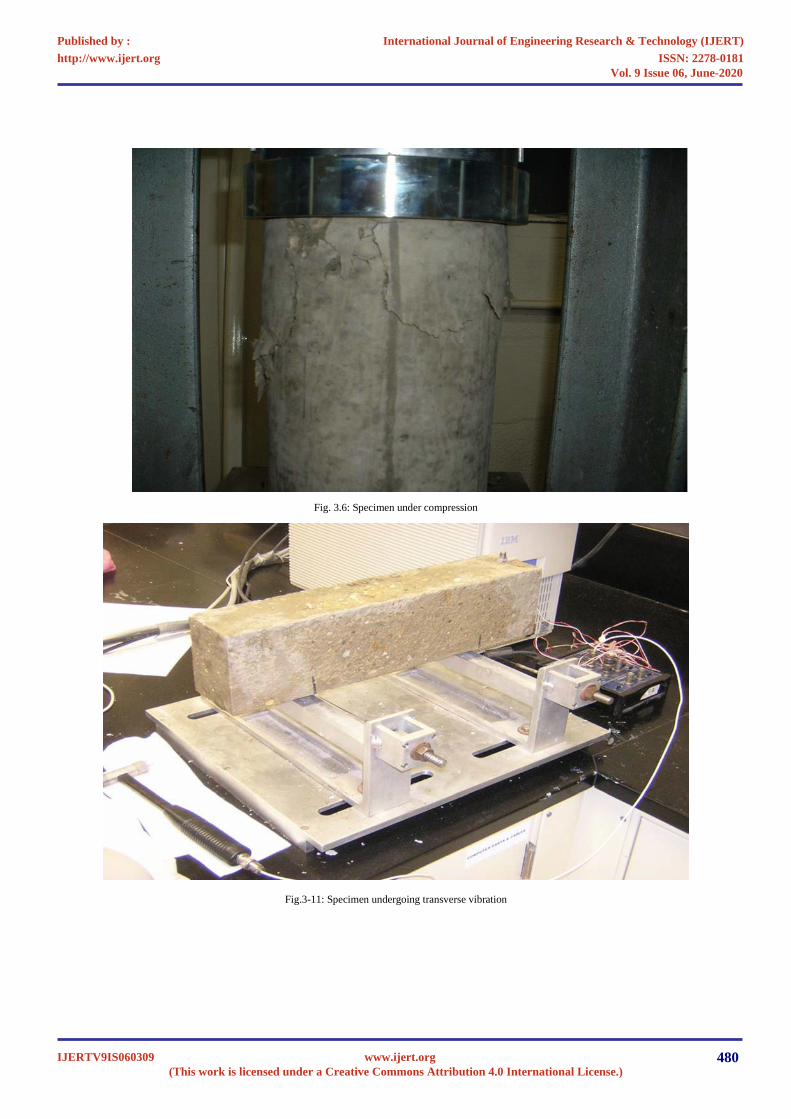
Fig. 3.6: Specimen under compression
Fig.3-11: Specimen undergoing transverse vibration
International Journal of Engineering Research & Technology (IJERT)
ISSN: 2278-0181http://www.ijert.org
IJERTV9IS060309(This work is licensed under a Creative Commons Attribution 4.0 International License.)
Published by :
www.ijert.org
Vol. 9 Issue 06, June-2020
480
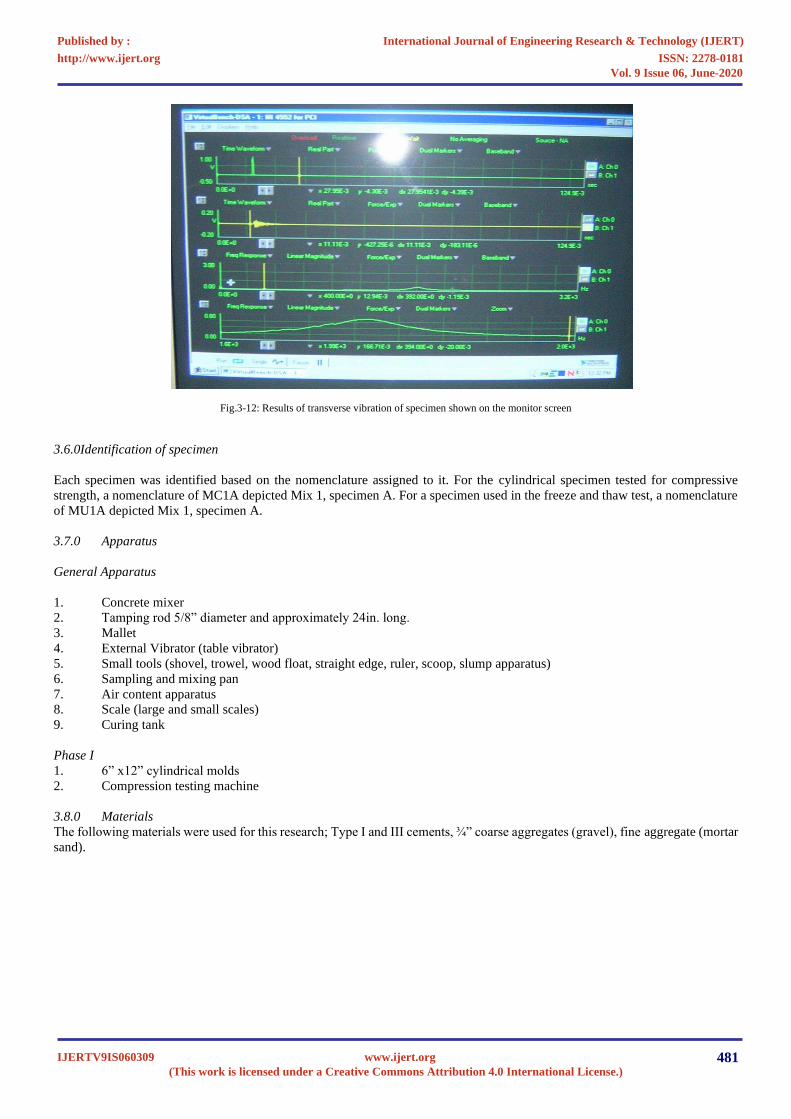
Fig.3-12: Results of transverse vibration of specimen shown on the monitor screen
3.6.0Identification of specimen
Each specimen was identified based on the nomenclature assigned to it. For the cylindrical specimen tested for compressive
strength, a nomenclature of MC1A depicted Mix 1, specimen A. For a specimen used in the freeze and thaw test, a nomenclature
of MU1A depicted Mix 1, specimen A.
3.7.0 Apparatus
General Apparatus
1. Concrete mixer
2. Tamping rod 5/8” diameter and approximately 24in. long.
3. Mallet
4. External Vibrator (table vibrator)
5. Small tools (shovel, trowel, wood float, straight edge, ruler, scoop, slump apparatus)
6. Sampling and mixing pan
7. Air content apparatus
8. Scale (large and small scales)
9. Curing tank
Phase I
1. 6” x12” cylindrical molds
2. Compression testing machine
3.8.0 Materials
The following materials were used for this research; Type I and III cements, ¾” coarse aggregates (gravel), fine aggregate (mortar
sand).
International Journal of Engineering Research & Technology (IJERT)
ISSN: 2278-0181http://www.ijert.org
IJERTV9IS060309(This work is licensed under a Creative Commons Attribution 4.0 International License.)
Published by :
www.ijert.org
Vol. 9 Issue 06, June-2020
481
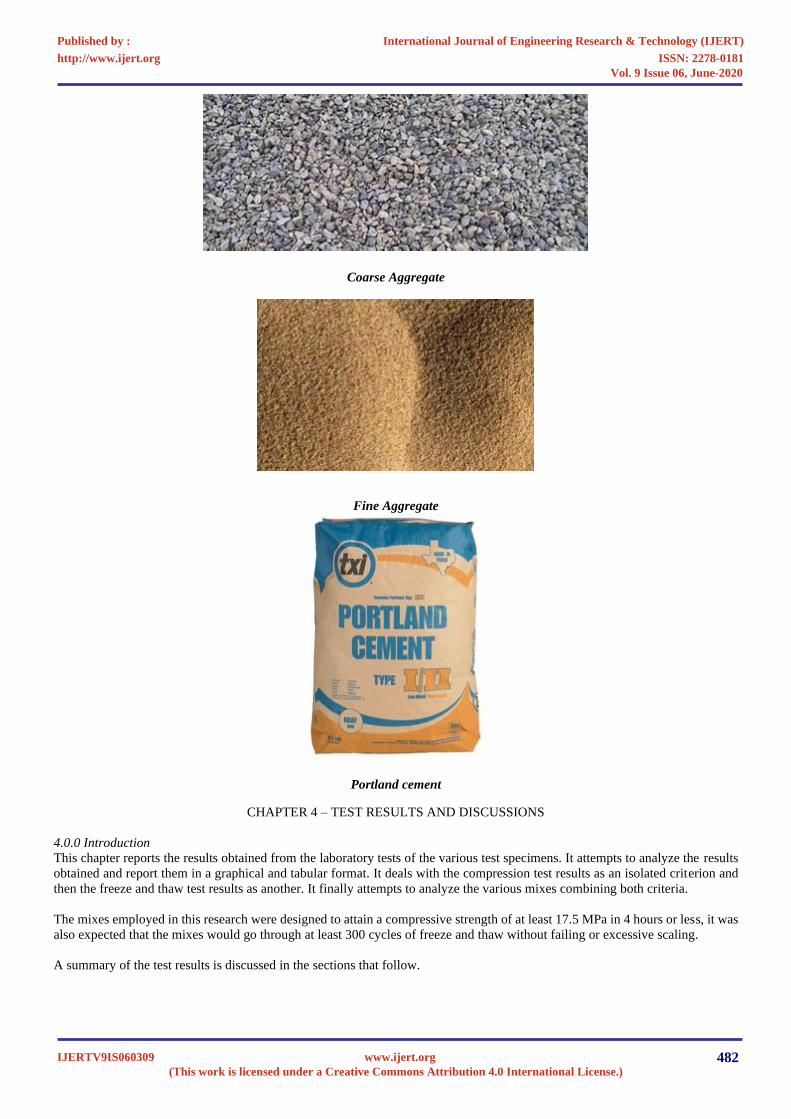
Coarse Aggregate
Fine Aggregate
Portland cement
CHAPTER 4 – TEST RESULTS AND DISCUSSIONS
4.0.0 Introduction
This chapter reports the results obtained from the laboratory tests of the various test specimens. It attempts to analyze the results
obtained and report them in a graphical and tabular format. It deals with the compression test results as an isolated criterion and
then the freeze and thaw test results as another. It finally attempts to analyze the various mixes combining both criteria.
The mixes employed in this research were designed to attain a compressive strength of at least 17.5 MPa in 4 hours or less, it was
also expected that the mixes would go through at least 300 cycles of freeze and thaw without failing or excessive scaling.
A summary of the test results is discussed in the sections that follow.
International Journal of Engineering Research & Technology (IJERT)
ISSN: 2278-0181http://www.ijert.org
IJERTV9IS060309(This work is licensed under a Creative Commons Attribution 4.0 International License.)
Published by :
www.ijert.org
Vol. 9 Issue 06, June-2020
482
4.1.0 Properties of the concrete mixes.
The property of a concrete mix depicts its strength, durability and performance under loading. Properties affecting concrete
characteristics measured in this research include the following;
• Air content
• Consistency
When in its fresh state, concrete should be plastic or semi-fluid and generally capable of being molded by hand. This does not
include a very wet concrete which can be cast in a mold, but which is not pliable and capable of being molded or shaped like a
lump of modeling clay nor a dry mix, which crumbles when molded into a slump cone.
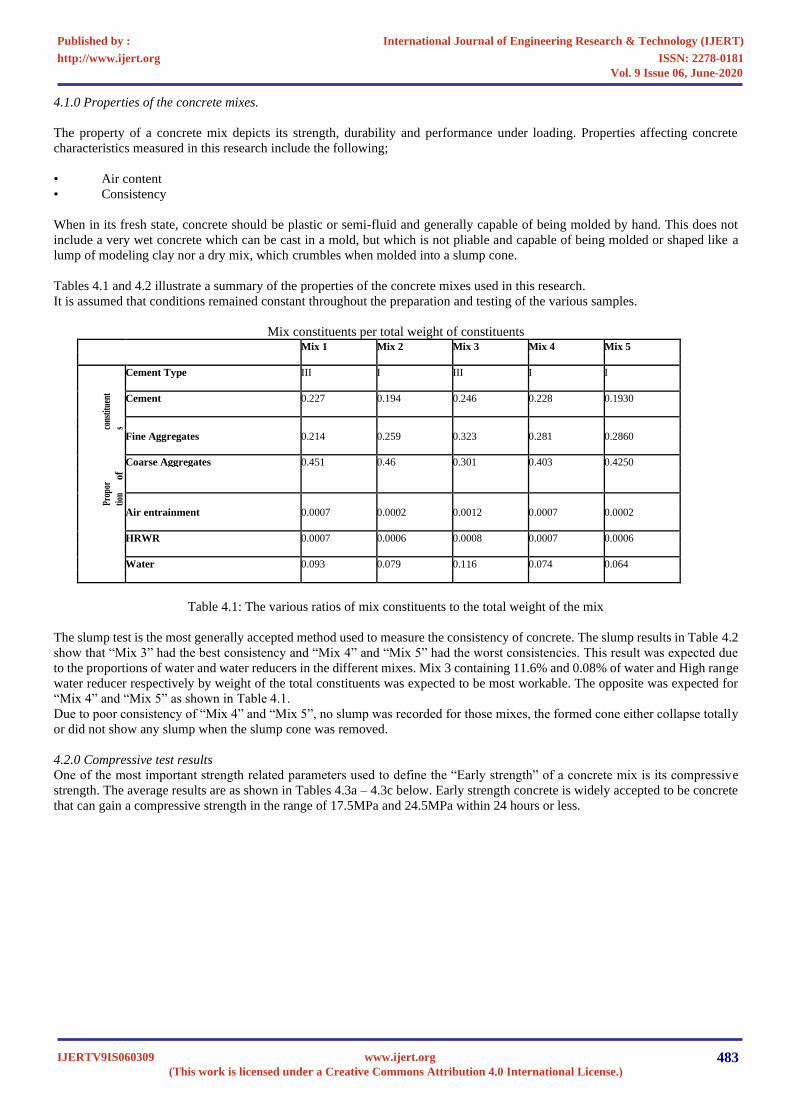
Tables 4.1 and 4.2 illustrate a summary of the properties of the concrete mixes used in this research.
It is assumed that conditions remained constant throughout the preparation and testing of the various samples.
Mix constituents per total weight of constituents Mix 1 Mix 2 Mix 3 Mix 4 Mix 5
Cement Type III I III I I
cons
titue
nt
s
Cement 0.227 0.194 0.246 0.228 0.1930
Fine Aggregates 0.214 0.259 0.323 0.281 0.2860
of
Coarse Aggregates 0.451 0.46 0.301 0.403 0.4250
Pro
por
tion
Air entrainment 0.0007 0.0002 0.0012 0.0007 0.0002
HRWR 0.0007 0.0006 0.0008 0.0007 0.0006
Water 0.093 0.079 0.116 0.074 0.064
Table 4.1: The various ratios of mix constituents to the total weight of the mix
The slump test is the most generally accepted method used to measure the consistency of concrete. The slump results in Table 4.2
show that “Mix 3” had the best consistency and “Mix 4” and “Mix 5” had the worst consistencies. This result was expected due
to the proportions of water and water reducers in the different mixes. Mix 3 containing 11.6% and 0.08% of water and High range
water reducer respectively by weight of the total constituents was expected to be most workable. The opposite was expected for
“Mix 4” and “Mix 5” as shown in Table 4.1.
Due to poor consistency of “Mix 4” and “Mix 5”, no slump was recorded for those mixes, the formed cone either collapse totally
or did not show any slump when the slump cone was removed.
4.2.0 Compressive test results
One of the most important strength related parameters used to define the “Early strength” of a concrete mix is its compressive
strength. The average results are as shown in Tables 4.3a – 4.3c below. Early strength concrete is widely accepted to be concrete
that can gain a compressive strength in the range of 17.5MPa and 24.5MPa within 24 hours or less.
International Journal of Engineering Research & Technology (IJERT)
ISSN: 2278-0181http://www.ijert.org
IJERTV9IS060309(This work is licensed under a Creative Commons Attribution 4.0 International License.)
Published by :
www.ijert.org
Vol. 9 Issue 06, June-2020
483
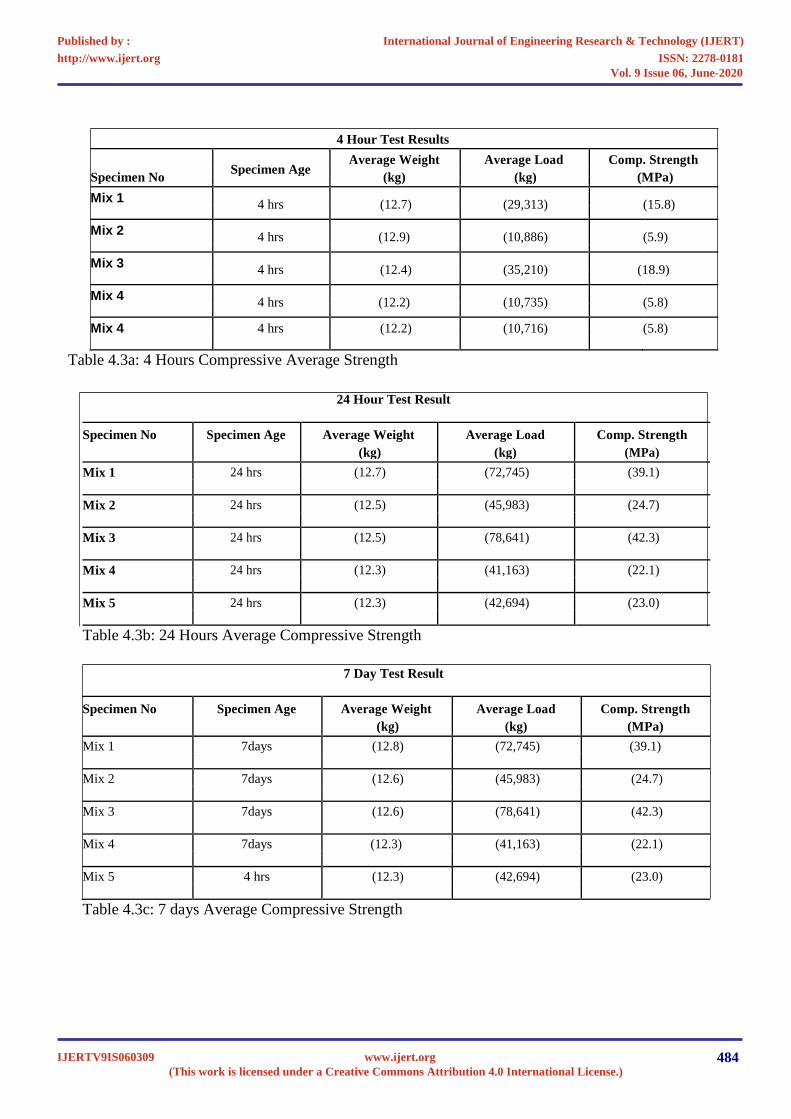
4 Hour Test Results
Specimen NoSpecimen Age
Average Weight Average Load Comp. Strength
(kg) (kg) (MPa)
Mix 14 hrs (12.7) (29,313) (15.8)
Mix 24 hrs (12.9) (10,886) (5.9)
Mix 34 hrs (12.4) (35,210) (18.9)
Mix 44 hrs (12.2) (10,735) (5.8)
Mix 4 4 hrs (12.2) (10,716) (5.8)
Table 4.3a: 4 Hours Compressive Average Strength
24 Hour Test Result
Specimen No Specimen Age Average Weight Average Load Comp. Strength
(kg) (kg) (MPa)
Mix 1 24 hrs (12.7) (72,745) (39.1)
Mix 2 24 hrs (12.5) (45,983) (24.7)
Mix 3 24 hrs (12.5) (78,641) (42.3)
Mix 4 24 hrs (12.3) (41,163) (22.1)
Mix 5 24 hrs (12.3) (42,694) (23.0)
Table 4.3b: 24 Hours Average Compressive Strength
7 Day Test Result
Specimen No Specimen Age Average Weight Average Load Comp. Strength
(kg) (kg) (MPa)
Mix 1 7days (12.8) (72,745) (39.1)
Mix 2 7days (12.6) (45,983) (24.7)
Mix 3 7days (12.6) (78,641) (42.3)
Mix 4 7days (12.3) (41,163) (22.1)
Mix 5 4 hrs (12.3) (42,694) (23.0)
Table 4.3c: 7 days Average Compressive Strength
International Journal of Engineering Research & Technology (IJERT)
ISSN: 2278-0181http://www.ijert.org
IJERTV9IS060309(This work is licensed under a Creative Commons Attribution 4.0 International License.)
Published by :
www.ijert.org
Vol. 9 Issue 06, June-2020
484
Compressive Strength versus Concrete Age
7000
6000
Str
en
gth
/Ps
i
5000y = 899.41Ln(x) + 1344.7
R2 = 0.9157
4000
Co
mp
ressiv
e
3000
2000
1000
0
0 20 40 60 80 100 120 140 160 180
Concrete Age/Hours
Mix 1 Log. (Mix 1)
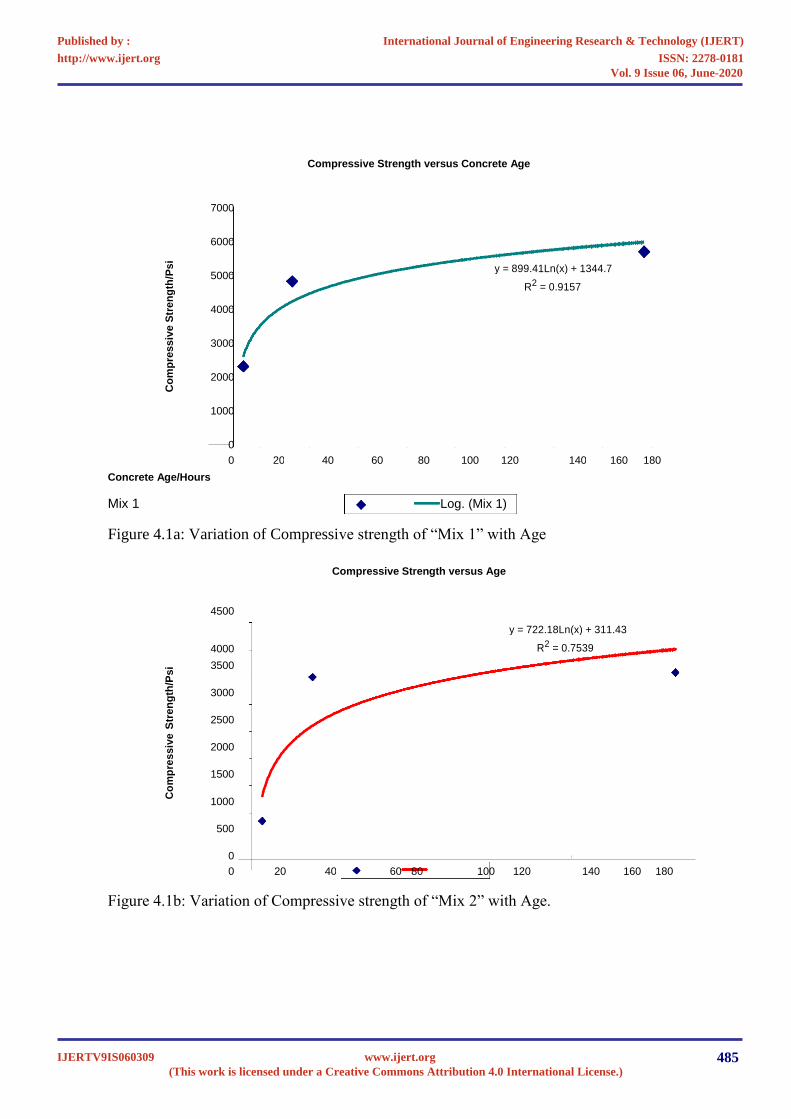
Figure 4.1a: Variation of Compressive strength of “Mix 1” with Age
Compressive Strength versus Age
4500
4000
y = 722.18Ln(x) + 311.43
R2 = 0.7539
Str
en
gth
/Psi 3500
3000
2500
Co
mp
res
siv
e
2000
1500
1000
500
0
0 20 40 60 80 100 120 140 160 180
Figure 4.1b: Variation of Compressive strength of “Mix 2” with Age.
International Journal of Engineering Research & Technology (IJERT)
ISSN: 2278-0181http://www.ijert.org
IJERTV9IS060309(This work is licensed under a Creative Commons Attribution 4.0 International License.)
Published by :
www.ijert.org
Vol. 9 Issue 06, June-2020
485
Compressive Strength versus Age
7000
6000
Str
en
gth
/Ps
i
5000
y = 901.56Ln(x) + 1700.5
R2
= 0.9605
4000
Co
mp
ressiv
e
3000
2000
1000
0
0
20
40
60
80
100
120
140
160
180
Age/Hrs
Mix 3
Log. (Mix 3)
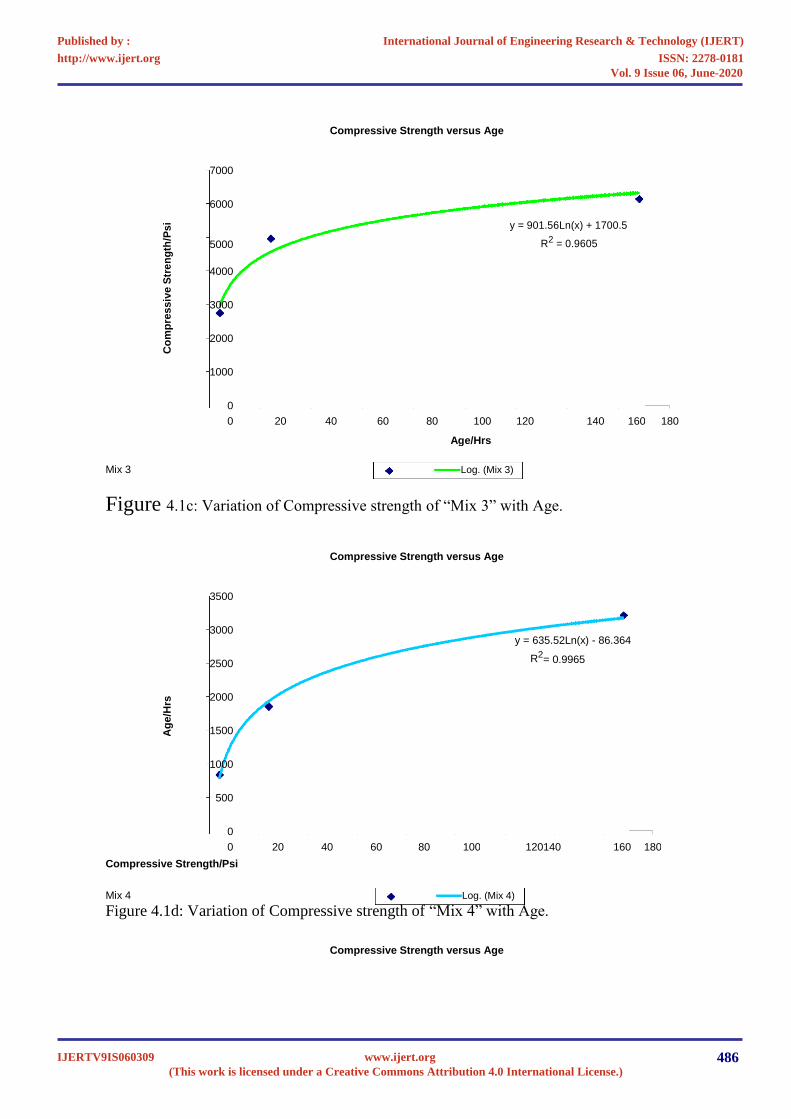
Figure 4.1c: Variation of Compressive strength of “Mix 3” with Age.
Compressive Strength versus Age
3500
3000
y = 635.52Ln(x) -
86.364
2500
R2
= 0.9965
Ag
e/H
rs
2000
1500
1000
500
0
0
20
40
60
80
100
120
140
160
180
Compressive Strength/Psi
Mix 4
Log. (Mix 4)
Figure 4.1d: Variation of Compressive strength of
“Mix 4” with Age.
Compressive Strength versus Age
International Journal of Engineering Research & Technology (IJERT)
ISSN: 2278-0181http://www.ijert.org
IJERTV9IS060309(This work is licensed under a Creative Commons Attribution 4.0 International License.)
Published by :
www.ijert.org
Vol. 9 Issue 06, June-2020
486
3500
3000
Str
en
gth
/Psi y = 668.41Ln(x) - 145.93
2500 R2 = 0.9948
2000
Co
mp
res
siv
e
1500
1000
500
0
0 20 40 60 80 100 120 140 160 180
Age/Hrs
Mix 5 Log. (Mix 5)
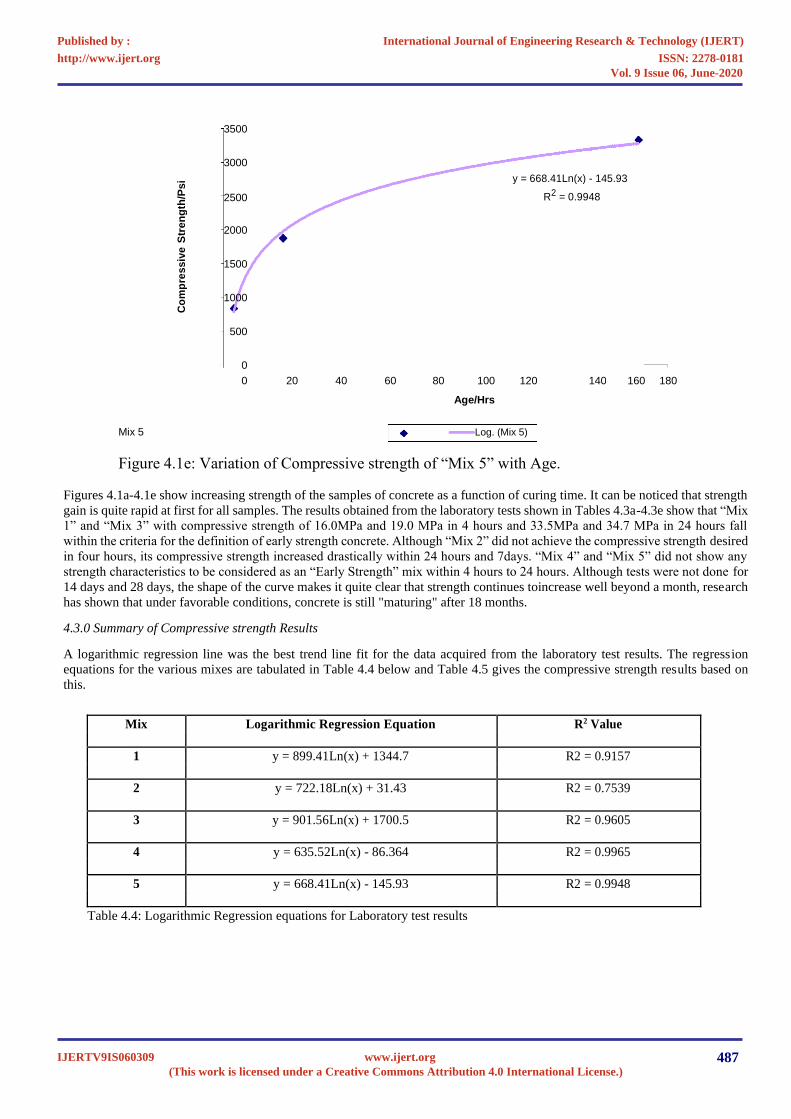
Figure 4.1e: Variation of Compressive strength of “Mix 5” with Age.
Figures 4.1a-4.1e show increasing strength of the samples of concrete as a function of curing time. It can be noticed that strength
gain is quite rapid at first for all samples. The results obtained from the laboratory tests shown in Tables 4.3a-4.3e show that “Mix
1” and “Mix 3” with compressive strength of 16.0MPa and 19.0 MPa in 4 hours and 33.5MPa and 34.7 MPa in 24 hours fall
within the criteria for the definition of early strength concrete. Although “Mix 2” did not achieve the compressive strength desired
in four hours, its compressive strength increased drastically within 24 hours and 7days. “Mix 4” and “Mix 5” did not show any
strength characteristics to be considered as an “Early Strength” mix within 4 hours to 24 hours. Although tests were not done for
14 days and 28 days, the shape of the curve makes it quite clear that strength continues toincrease well beyond a month, research
has shown that under favorable conditions, concrete is still "maturing" after 18 months.
4.3.0 Summary of Compressive strength Results
A logarithmic regression line was the best trend line fit for the data acquired from the laboratory test results. The regression
equations for the various mixes are tabulated in Table 4.4 below and Table 4.5 gives the compressive strength results based on
this.
Mix Logarithmic Regression Equation R2 Value
1 y = 899.41Ln(x) + 1344.7 R2 = 0.9157
2 y = 722.18Ln(x) + 31.43 R2 = 0.7539
3 y = 901.56Ln(x) + 1700.5 R2 = 0.9605
4 y = 635.52Ln(x) - 86.364 R2 = 0.9965
5 y = 668.41Ln(x) - 145.93 R2 = 0.9948
Table 4.4: Logarithmic Regression equations for Laboratory test results
International Journal of Engineering Research & Technology (IJERT)
ISSN: 2278-0181http://www.ijert.org
IJERTV9IS060309(This work is licensed under a Creative Commons Attribution 4.0 International License.)
Published by :
www.ijert.org
Vol. 9 Issue 06, June-2020
487
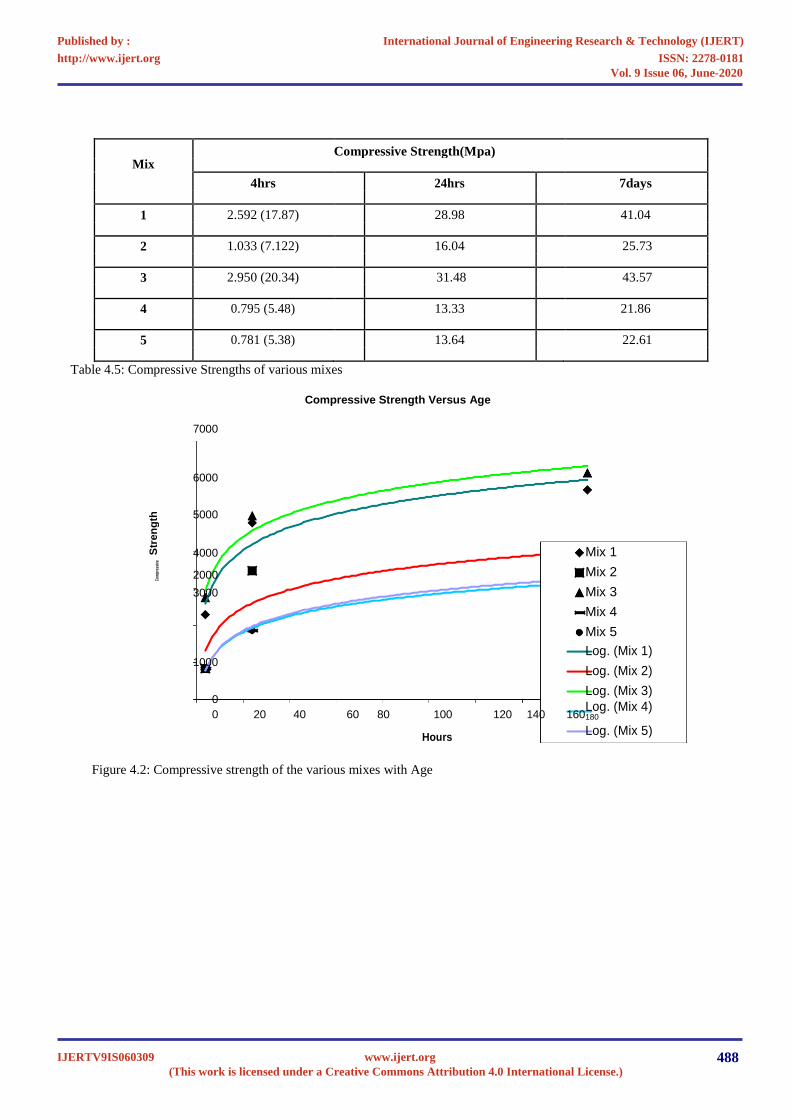
MixCompressive Strength(Mpa)
4hrs 24hrs 7days
1 2.592 (17.87) 28.98 41.04
2 1.033 (7.122) 16.04 25.73
3 2.950 (20.34) 31.48 43.57
4 0.795 (5.48) 13.33 21.86
5 0.781 (5.38) 13.64 22.61
Table 4.5: Compressive Strengths of various mixes
Compressive Strength Versus Age
7000
6000
Str
en
gth 5000
4000 Mix 1
Com
pres
sive
2000 Mix 2
3000 Mix 3
Mix 4
Mix 5
1000Log. (Mix 1)
Log. (Mix 2)
0Log. (Mix 3)
Log. (Mix 4)0 20 40 60 80 100 120 140 160180
HoursLog. (Mix 5)
Figure 4.2: Compressive strength of the various mixes with Age
International Journal of Engineering Research & Technology (IJERT)
ISSN: 2278-0181http://www.ijert.org
IJERTV9IS060309(This work is licensed under a Creative Commons Attribution 4.0 International License.)
Published by :
www.ijert.org
Vol. 9 Issue 06, June-2020
488
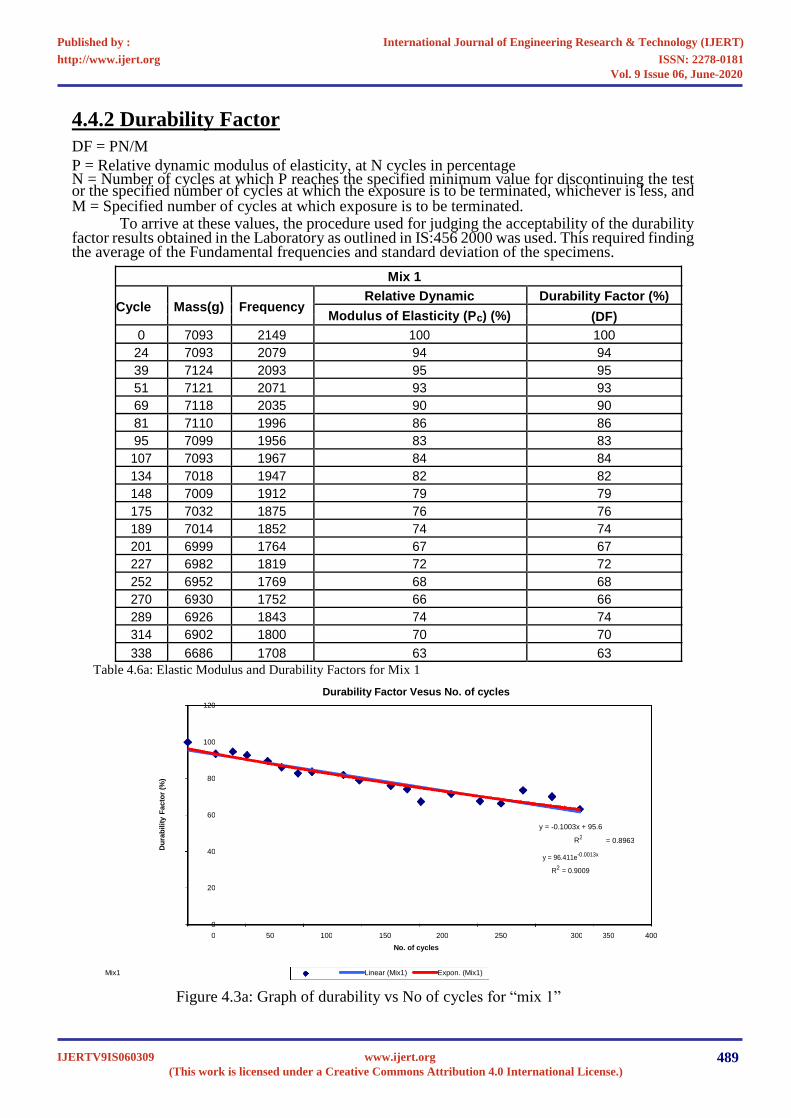
4.4.2 Durability Factor
DF = PN/M
P = Relative dynamic modulus of elasticity, at N cycles in percentageN = Number of cycles at which P reaches the specified minimum value for discontinuing the test or the specified number of cycles at which the exposure is to be terminated, whichever is less, andM = Specified number of cycles at which exposure is to be terminated.
To arrive at these values, the procedure used for judging the acceptability of the durability factor results obtained in the Laboratory as outlined in IS:456 2000 was used. This required finding the average of the Fundamental frequencies and standard deviation of the specimens.
Mix 1
Cycle Mass(g) FrequencyRelative Dynamic Durability Factor (%)
Modulus of Elasticity (Pc) (%) (DF)
0 7093 2149 100 100
24 7093 2079 94 94
39 7124 2093 95 95
51 7121 2071 93 93
69 7118 2035 90 90
81 7110 1996 86 86
95 7099 1956 83 83
107 7093 1967 84 84
134 7018 1947 82 82
148 7009 1912 79 79
175 7032 1875 76 76
189 7014 1852 74 74
201 6999 1764 67 67
227 6982 1819 72 72
252 6952 1769 68 68
270 6930 1752 66 66
289 6926 1843 74 74
314 6902 1800 70 70
338 6686 1708 63 63
Table 4.6a: Elastic Modulus and Durability Factors for Mix 1
Durability Factor Vesus No. of cycles120
100
Fa
cto
r (%
) 80
60
Du
rab
ilit
y
y = -0.1003x + 95.6
R2= 0.8963
40y = 96.411e-0.0013x
R2 = 0.9009
20
0
0 50 100 150 200 250 300 350 400
No. of cycles
Mix1 Linear (Mix1) Expon. (Mix1)
Figure 4.3a: Graph of durability vs No of cycles for “mix 1”
International Journal of Engineering Research & Technology (IJERT)
ISSN: 2278-0181http://www.ijert.org
IJERTV9IS060309(This work is licensed under a Creative Commons Attribution 4.0 International License.)
Published by :
www.ijert.org
Vol. 9 Issue 06, June-2020
489
Mix 2
Cycle
Mass
Frequency
Relative Dynamic
Durability Factor (%)
(g)
Modulus of Elasticity (Pc) (%)
(DF)
0
7254
2118
100
100
24
7254
2075
96
96
39
7247
2073
96
96
51
7242
2071
96
96
69
7226
2074
96
96
81
7211
2073
96
96
95
7182
2063
95
95
107
7194
2076
96
96
134
7179
2068
95
95
148
7166
2069
95
95
175
7150
2071
96
96
189
7139
2061
95
95
201
7126
2071
96
96
227
7126
2071
96
96
252
7110
2073
96
96
270
7095
2057
94
94
289
7087
2060
95
95
314
7089
2068
95
95
338
7075
2061
95
95
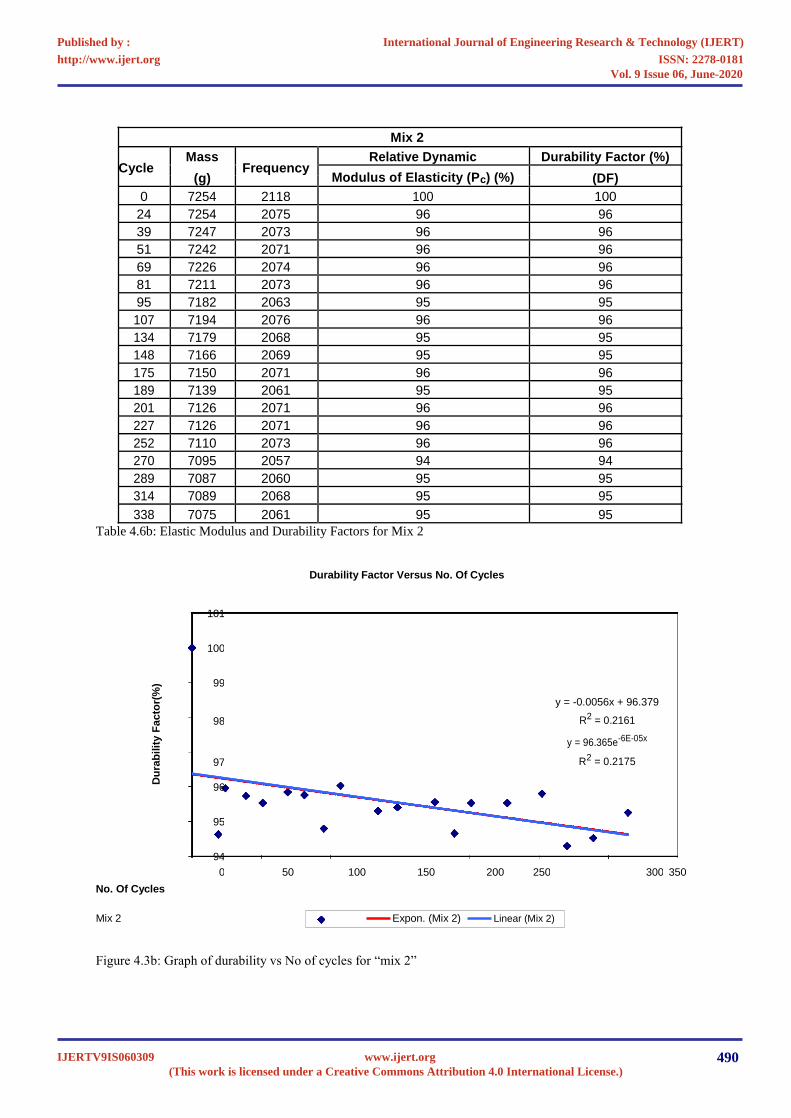
Table 4.6b: Elastic Modulus and Durability Factors for Mix 2
Durability Factor Versus No. Of Cycles
101
100
Fa
cto
r(%
)
99
y = -0.0056x + 96.379
98
R2
= 0.2161
Du
rab
ilit
y 97
y = 96.365e-6E-05x
R2
= 0.2175
96
95
94
0
50
100
150
200
250
300
350
No. Of Cycles
Mix 2
Expon. (Mix 2)
Linear (Mix 2)
Figure 4.3b: Graph of durability vs No of cycles for “mix 2”
International Journal of Engineering Research & Technology (IJERT)
ISSN: 2278-0181http://www.ijert.org
IJERTV9IS060309(This work is licensed under a Creative Commons Attribution 4.0 International License.)
Published by :
www.ijert.org
Vol. 9 Issue 06, June-2020
490
Mix 3
Cycle
Mass
Frequency
Relative Dynamic
Durability Factor (%)
(g)
Modulus of Elasticity (Pc) (%)
(DF)
0
6916
2011
100
100
24
6904
1989
98
98
39
6899
1985
97
97
51
6893
1967
96
96
69
6888
1955
95
95
81
6877
1939
93
93
95
6869
1921
91
91
107
6865
1916
91
91
134
6848
1873
87
87
148
6838
1836
83
83
175
6814
1829
83
83
189
6805
1788
79
79
201
6805
1788
79
79
227
6798
1733
74
74
252
6763
1633
66
66
270
6739
1593
63
63
289
6758
1628
66
66
314
6743
1596
63
63
338
6725
1515
57
57
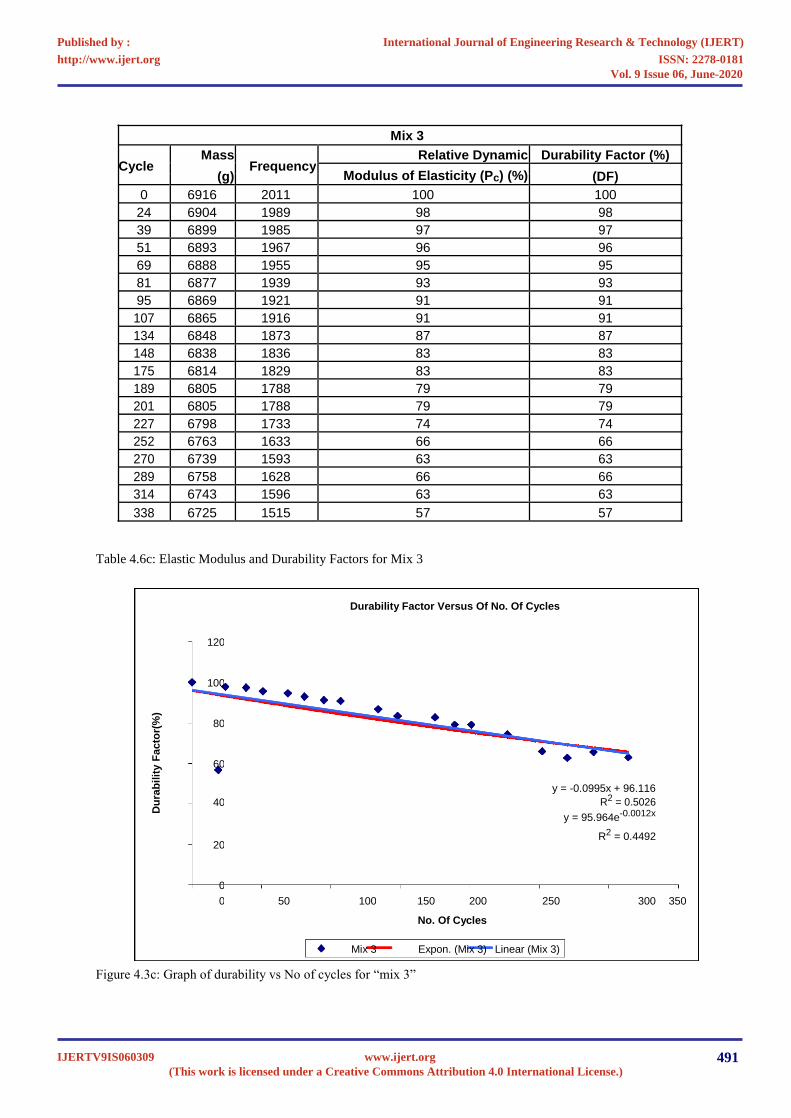
Table 4.6c: Elastic Modulus and Durability Factors for Mix 3
Durability Factor Versus Of No. Of Cycles
120
100
Fa
cto
r(%
)
80
60
Du
rab
ilit
y
y = -0.0995x + 96.116
40
R2
= 0.5026
y = 95.964e-0.0012x
20
R2
= 0.4492
0
0
50
100
150
200
250
300
350
No. Of Cycles
Mix 3
Expon. (Mix 3)
Linear (Mix 3)
Figure 4.3c: Graph of durability vs No of cycles for “mix 3”
International Journal of Engineering Research & Technology (IJERT)
ISSN: 2278-0181http://www.ijert.org
IJERTV9IS060309(This work is licensed under a Creative Commons Attribution 4.0 International License.)
Published by :
www.ijert.org
Vol. 9 Issue 06, June-2020
491
Mix 4
Cycle
Mass
Frequency
Relative Dynamic
Durability Factor (%)
(g)
Modulus of Elasticity (Pc) (%)
(DF)
0
7384
2196
100
100
24
7377
2165
97
97
39
7374
2170
98
98
51
7371
2164
97
97
69
7371
2157
97
97
81
7368
2153
96
96
95
7367
2152
96
96
107
7368
2161
97
97
134
7373
2146
95
95
148
7371
2146
96
96
175
7391
2157
96
96
189
7388
2136
95
95
201
7390
2141
95
95
227
7392
2152
96
96
252
7387
2155
96
96
270
7329
2055
88
88
289
7419
2175
98
98
314
7419
2173
98
98
338
7415
2164
97
97
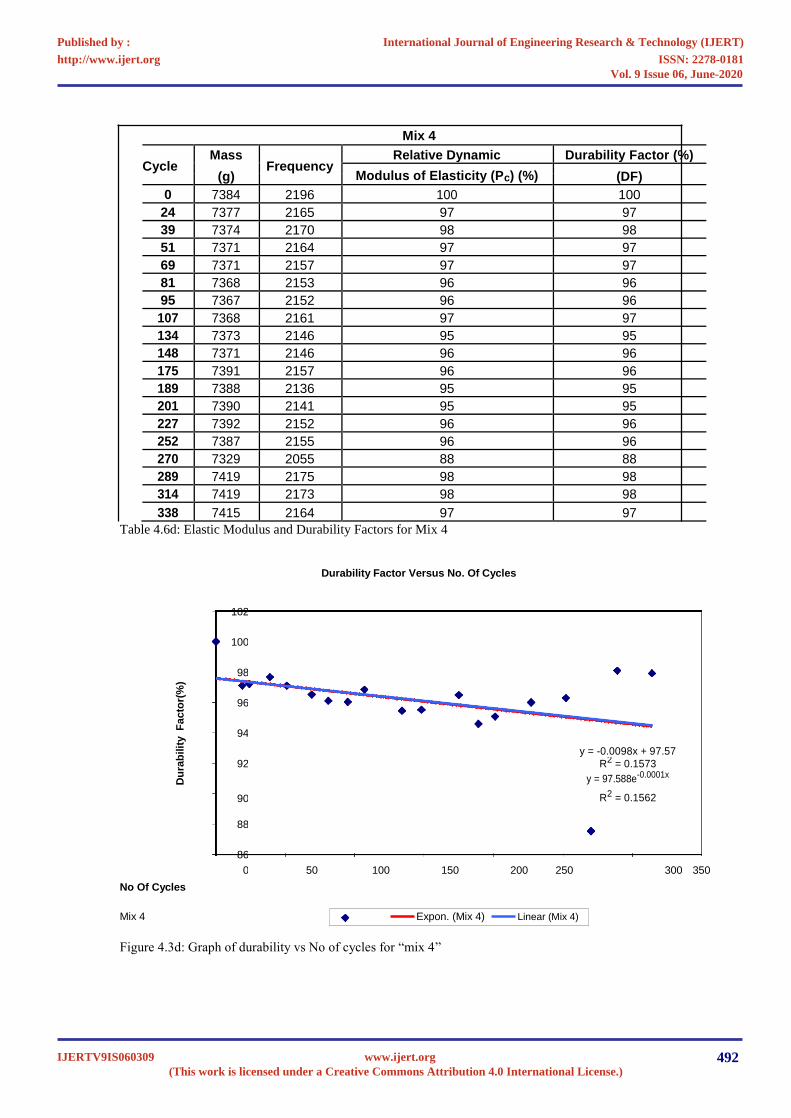
Table 4.6d: Elastic Modulus and Durability Factors for Mix 4
Durability Factor Versus No. Of Cycles
102
100
Fa
cto
r(%
)
98
96
94
Du
rab
ilit
y
92
y = -0.0098x + 97.57
R2
= 0.1573
y = 97.588e-0.0001x
90
R2
= 0.1562
88
86
0
50
100
150
200
250
300
350
No Of Cycles
Mix 4
Expon. (Mix 4)
Linear (Mix 4)
Figure 4.3d: Graph of durability vs No of cycles for “mix 4”
International Journal of Engineering Research & Technology (IJERT)
ISSN: 2278-0181http://www.ijert.org
IJERTV9IS060309(This work is licensed under a Creative Commons Attribution 4.0 International License.)
Published by :
www.ijert.org
Vol. 9 Issue 06, June-2020
492
For simplicity, it was decided to use the linear regression equation in predicting the durability
factor at the 300th
cycle because both trends were almost identical. Notably from Table 4.8,
none of the mixes fell below 60% durability factor. However, the 3 mixes with Type I cement
and lowest water-cement ratio
fared better in this durability test.
In a research by Powers et al. he concluded that entrained air voids act as empty chambers in
the paste for the freezing and migrating water to enter, thus relieving the pressures described
above and preventing damage to the concrete. Upon thawing, most of the water returns to the
capillaries due to capillary action and pressure from air compressed in the bubbles.
The three mixes that fared best among the lot were mixes that may have likely more air
pockets in them due to inadequate consolidation during placing.
CHAPTER 5-CONCLUSIONS, OBSERVATIONS AND
RECOMMENDATIONS
5.0.0
Conclusions and Observations
The primary conclusion expected from this research was to determine if all the mixes
researched into, fell into the category of High Performance concrete and thus was either Very
early strength (VES), High early strength (HES) or not an Early strength mix. It was finally
expected to recommend which two mixes based on the strength and durability requirements of
High Performance concrete were the best.
Based on the results of this investigation, the following conclusions can be drawn;
5.1.0Strength Criterion: Compressive strength
1
High Performance concrete can be produced with a variety of mix options including
the
use of;
(a)
Type III Portland cement and
(b) Type I or Type III Portland cement with a low water-cement ratios by using superplasticizers
to achieve moderate to high consistencies.
2
Although the water-cement ratio plays an important role in attaining early strength, for
concrete to be poured and consolidated, it has to workable. The consistency of an early strength
mix should not be compromised in an attempt to acquire its strength. It was concluded in this
research that “mix 4” and “mix 5” attained low early strengths due to inadequate consolidation.
International Journal of Engineering Research & Technology (IJERT)
ISSN: 2278-0181http://www.ijert.org
IJERTV9IS060309(This work is licensed under a Creative Commons Attribution 4.0 International License.)
Published by :
www.ijert.org
Vol. 9 Issue 06, June-2020
493
3
In order to make use of a lower water to cement ratio in acquiring early strength, the right
dosage of superplasticizers must be used. A slump of at least 2” must be obtained in order to attain
good consolidation in
a laboratory setting.
4
The two mixes with type III Portland cement “mix 1” and “mix 3” fell in the Very early
Strength (VES) category of High Performance concrete, attaining the required strengths of a
minimum of 14-17.5 MPa within four (4) hours. “Mix 2”,
“mix 4” and “mix 5” can be considered
as High early strength concrete (HES) accordingly, attaining a strength of approximately 2,000 psi
(14.0 MPa) within twenty-four (24) hours as shown in Table 4.3.
5
“Mix 1” and “mix 3” which utilizes Type III early strength Portland cement achieved
the best results for the strength criterion.
5.2.0
Durability Criterion: Freeze and thaw resistance
From earlier research discussed in the literature review of this paper, it was established that;
•
Dry concrete is unaffected by repeated freeze and thaw.
•
The development of pore structure inside cement paste is fundamental to freeze–
thaw resistance of concrete.
•
Capillary porosity of a concrete cement paste becomes a factor in concrete’s resistance to
freeze and thaw at water-cement ratios above 0.36. At water cement ratios below this value, the
only porosity in the paste is the gel porosity, which is very minute and has no effect on frost action.
International Journal of Engineering Research & Technology (IJERT)
ISSN: 2278-0181http://www.ijert.org
IJERTV9IS060309(This work is licensed under a Creative Commons Attribution 4.0 International License.)
Published by :
www.ijert.org
Vol. 9 Issue 06, June-2020
494
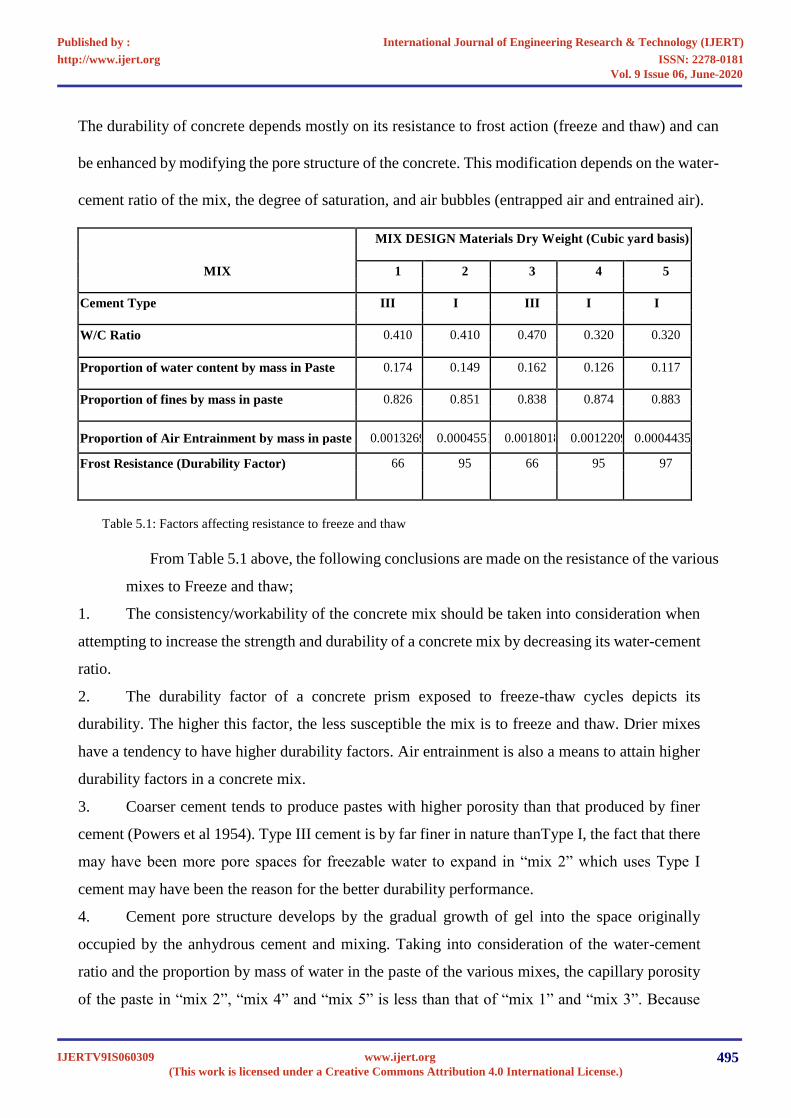
The durability of concrete depends mostly on its resistance to frost action
(freeze and thaw) and can
be enhanced by modifying the pore structure of the concrete. This modification depends on the water-
cement ratio of the mix, the degree of saturation, and air bubbles (entrapped air and entrained air).
MIX DESIGN Materials Dry Weight (Cubic yard basis)
MIX
1
2
3
4
5
Cement Type
III
I
III
I
I
W/C Ratio
0.410
0.410
0.470
0.320
0.320
Proportion of water content by mass in Paste
0.174
0.149
0.162
0.126
0.117
Proportion of fines by mass in paste
0.826
0.851
0.838
0.874
0.883
Proportion of Air Entrainment by mass in paste
0.0013269
0.0004551
0.0018018
0.0012209
0.00044356
Frost Resistance (Durability Factor)
66
95
66
95
97
Table 5.1: Factors affecting resistance to freeze and thaw
From Table 5.1 above, the following conclusions are made on the resistance of the various
mixes to Freeze and thaw;
1.
The consistency/workability of the concrete mix should be taken into consideration when
attempting to increase the strength
and durability of a concrete mix by decreasing its water-cement
ratio.
2.
The durability factor of a concrete prism exposed to freeze-thaw cycles depicts its
durability. The higher this factor, the less susceptible the mix is to freeze and thaw. Drier mixes
have a tendency to have higher durability factors. Air entrainment is also a means to attain higher
durability factors in a concrete mix.
3.
Coarser cement tends to produce pastes with higher porosity than that produced by finer
cement (Powers et al 1954). Type III cement is by far finer in nature thanType I, the fact that there
may have been more pore spaces for freezable water to expand in “mix 2” which uses Type I
cement may have been the reason for the better durability performance.
4.
Cement pore structure develops by the gradual growth of gel into the space originally
occupied by the anhydrous cement and mixing. Taking into consideration of the water-cement
ratio and the proportion by mass of water in the paste of the various mixes, the capillary porosity
of
the paste in “mix 2”, “mix 4” and “mix 5” is less than that of “mix 1” and “mix 3”. Because
International Journal of Engineering Research & Technology (IJERT)
ISSN: 2278-0181http://www.ijert.org
IJERTV9IS060309(This work is licensed under a Creative Commons Attribution 4.0 International License.)
Published by :
www.ijert.org
Vol. 9 Issue 06, June-2020
495
there is less freezable water in the drier mixes (“mix 2”, “mix 4” and “mix 5”), there is little or no
impact of the hydraulic pressures during freezing on the internal structure of the paste hence the
better results obtained for durability.
5.
The ratio by mass of air entrainment in the various mixes may have aided their resistance
to frost action, but its effect on “mix 4” and “mix 5” was negligible since there was virtually no
expandable freezable water to fill the air voids.
6.
All the mixes had samples going through all 300 cycles of freeze and thaw, “Mix 4” and
“mix 5” were more durable in this respect (resistance to freeze and thaw). They did not show any
signs of deterioration after the freeze and thaw cycle had ended. The other three mixes showed
some signs of scaling and some of the samples failed. Some of the failures were considered,
however, as abnormalities in the mixing procedures.
Because of the variability of water-cement ratio and superplasticizers used, no conclusion could
be made as to the optimal dosage of admixtures.
7.
Adjustment of the factors that enhance either the strength or durability of the various mixes
could be done for “mix 1”, “mix 2” and “mix 3” because there is room for water content adjustment
to resist freeze and thaw as well as to increase strength. Since “mix 4” and “mix 5” make use of
low water-cement ratio to achieve early strength, adjusting the water content will increase the
strength a little but may compromise with its durability.
International Journal of Engineering Research & Technology (IJERT)
ISSN: 2278-0181http://www.ijert.org
IJERTV9IS060309(This work is licensed under a Creative Commons Attribution 4.0 International License.)
Published by :
www.ijert.org
Vol. 9 Issue 06, June-2020
496
5.3.0
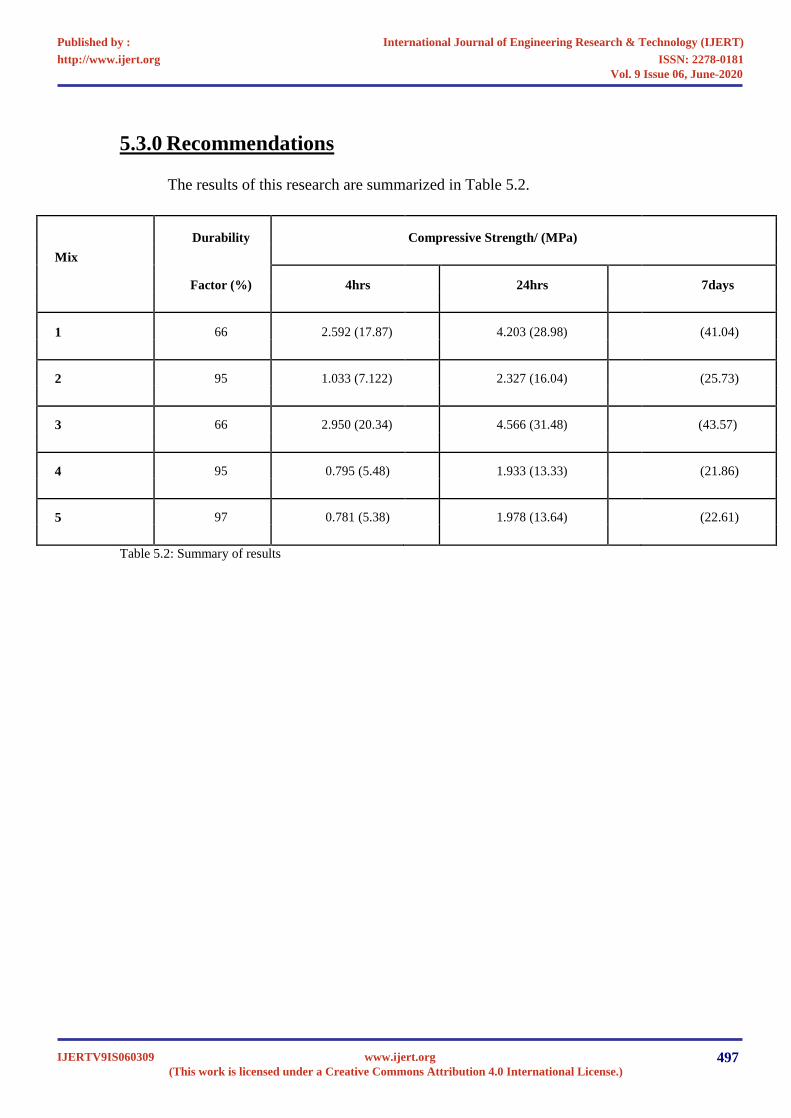
Recommendations
The results of this research are summarized in Table 5.2.
Mix
Durability
Compressive Strength/ (MPa)
Factor (%)
4hrs
24hrs
7days
1
66
2.592 (17.87)
4.203 (28.98)
(41.04)
2
95
1.033 (7.122)
2.327 (16.04)
(25.73)
3
66
2.950 (20.34)
4.566 (31.48)
(43.57)
4
95
0.795 (5.48)
1.933 (13.33)
(21.86)
5
97
0.781 (5.38)
1.978 (13.64)
(22.61)
Table 5.2: Summary of results
International Journal of Engineering Research & Technology (IJERT)
ISSN: 2278-0181http://www.ijert.org
IJERTV9IS060309(This work is licensed under a Creative Commons Attribution 4.0 International License.)
Published by :
www.ijert.org
Vol. 9 Issue 06, June-2020
497
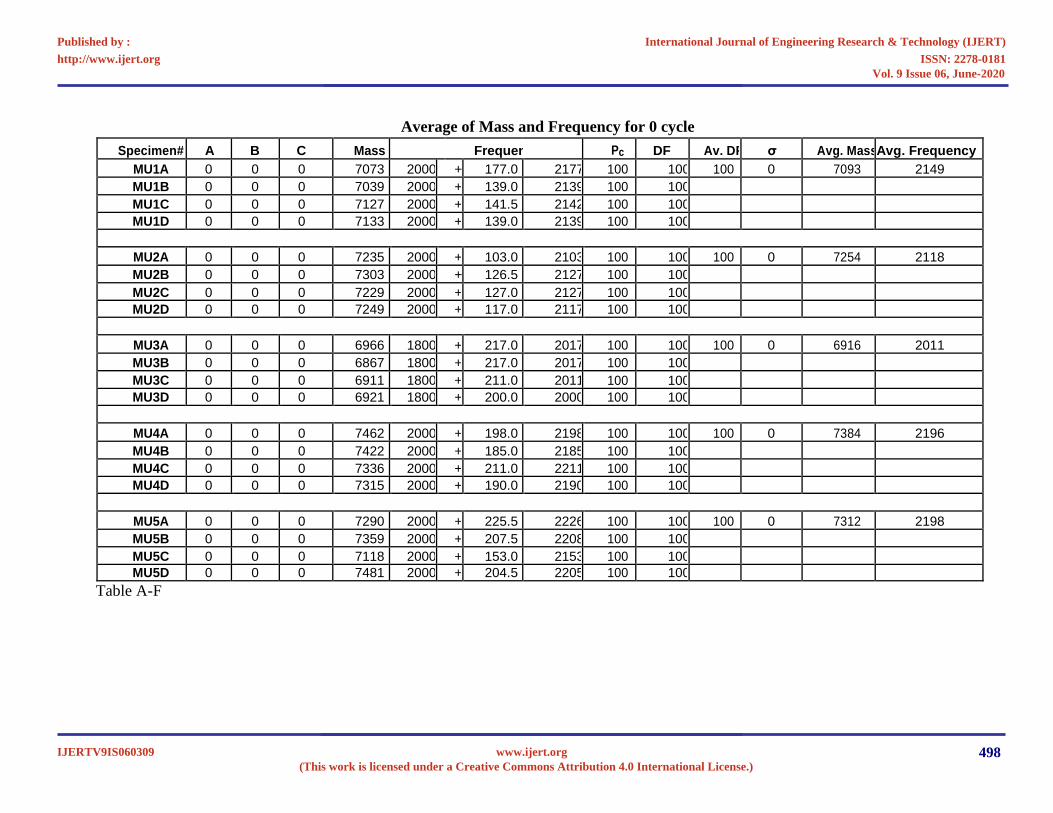
Average of Mass and Frequency for 0 cycle
Specimen#
A
B
C
Mass
Frequency
Pc
DF
Av. DF
σ
Avg. Mass
Avg. Frequency
MU1A
0
0
0
7073
2000
+
177.0
2177
100
100
100
0
7093
2149
MU1B
0
0
0
7039
2000
+
139.0
2139
100
100
MU1C
0
0
0
7127
2000
+
141.5
2142
100
100
MU1D
0
0
0
7133
2000
+
139.0
2139
100
100
MU2A
0
0
0
7235
2000
+
103.0
2103
100
100
100
0
7254
2118
MU2B
0
0
0
7303
2000
+
126.5
2127
100
100
MU2C
0
0
0
7229
2000
+
127.0
2127
100
100
MU2D
0
0
0
7249
2000
+
117.0
2117
100
100
MU3A
0
0
0
6966
1800
+
217.0
2017
100
100
100
0
6916
2011
MU3B
0
0
0
6867
1800
+
217.0
2017
100
100
MU3C
0
0
0
6911
1800
+
211.0
2011
100
100
MU3D
0
0
0
6921
1800
+
200.0
2000
100
100
MU4A
0
0
0
7462
2000
+
198.0
2198
100
100
100
0
7384
2196
MU4B
0
0
0
7422
2000
+
185.0
2185
100
100
MU4C
0
0
0
7336
2000
+
211.0
2211
100
100
MU4D
0
0
0
7315
2000
+
190.0
2190
100
100
MU5A
0
0
0
7290
2000
+
225.5
2226
100
100
100
0
7312
2198
MU5B
0
0
0
7359
2000
+
207.5
2208
100
100
MU5C
0
0
0
7118
2000
+
153.0
2153
100
100
MU5D
0
0
0
7481
2000
+
204.5
2205
100
100
Table A-F
International Journal of Engineering Research & Technology (IJERT)
ISSN: 2278-0181http://www.ijert.org
IJERTV9IS060309(This work is licensed under a Creative Commons Attribution 4.0 International License.)
Published by :
www.ijert.org
Vol. 9 Issue 06, June-2020
498
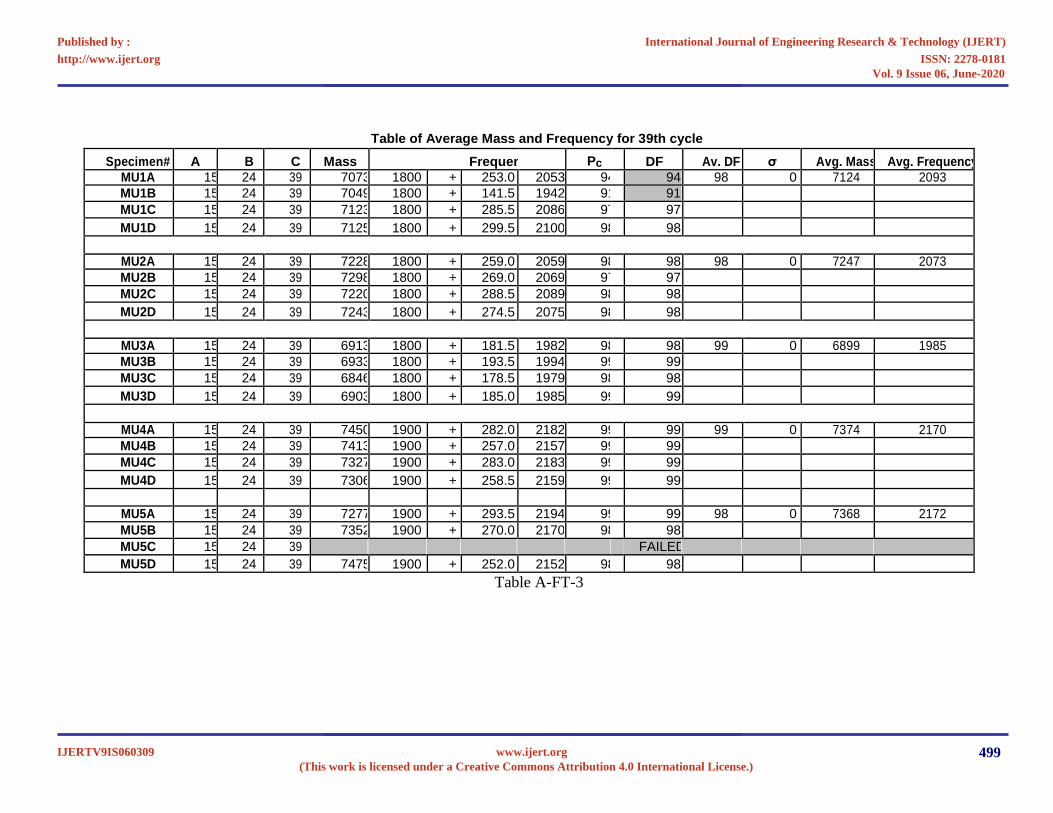
Table of Average Mass and Frequency for 39th cycle
Specimen#
A
B
C
Mass
Frequency
Pc
DF
Av. DF
σ
Avg. Mass
Avg. Frequency
MU1A
15
24
39
7073
1800
+
253.0
2053
94
94
98
0
7124
2093
MU1B
15
24
39
7049
1800
+
141.5
1942
91
91
MU1C
15
24
39
7123
1800
+
285.5
2086
97
97
MU1D
15
24
39
7125
1800
+
299.5
2100
98
98
MU2A
15
24
39
7228
1800
+
259.0
2059
98
98
98
0
7247
2073
MU2B
15
24
39
7298
1800
+
269.0
2069
97
97
MU2C
15
24
39
7220
1800
+
288.5
2089
98
98
MU2D
15
24
39
7243
1800
+
274.5
2075
98
98
MU3A
15
24
39
6913
1800
+
181.5
1982
98
98
99
0
6899
1985
MU3B
15
24
39
6933
1800
+
193.5
1994
99
99
MU3C
15
24
39
6846
1800
+
178.5
1979
98
98
MU3D
15
24
39
6903
1800
+
185.0
1985
99
99
MU4A
15
24
39
7450
1900
+
282.0
2182
99
99
99
0
7374
2170
MU4B
15
24
39
7413
1900
+
257.0
2157
99
99
MU4C
15
24
39
7327
1900
+
283.0
2183
99
99
MU4D
15
24
39
7306
1900
+
258.5
2159
99
99
MU5A
15
24
39
7277
1900
+
293.5
2194
99
99
98
0
7368
2172
MU5B
15
24
39
7352
1900
+
270.0
2170
98
98
MU5C
15
24
39
FAILED
MU5D
15
24
39
7475
1900
+
252.0
2152
98
98
Table A-FT-3
International Journal of Engineering Research & Technology (IJERT)
ISSN: 2278-0181http://www.ijert.org
IJERTV9IS060309(This work is licensed under a Creative Commons Attribution 4.0 International License.)
Published by :
www.ijert.org
Vol. 9 Issue 06, June-2020
499
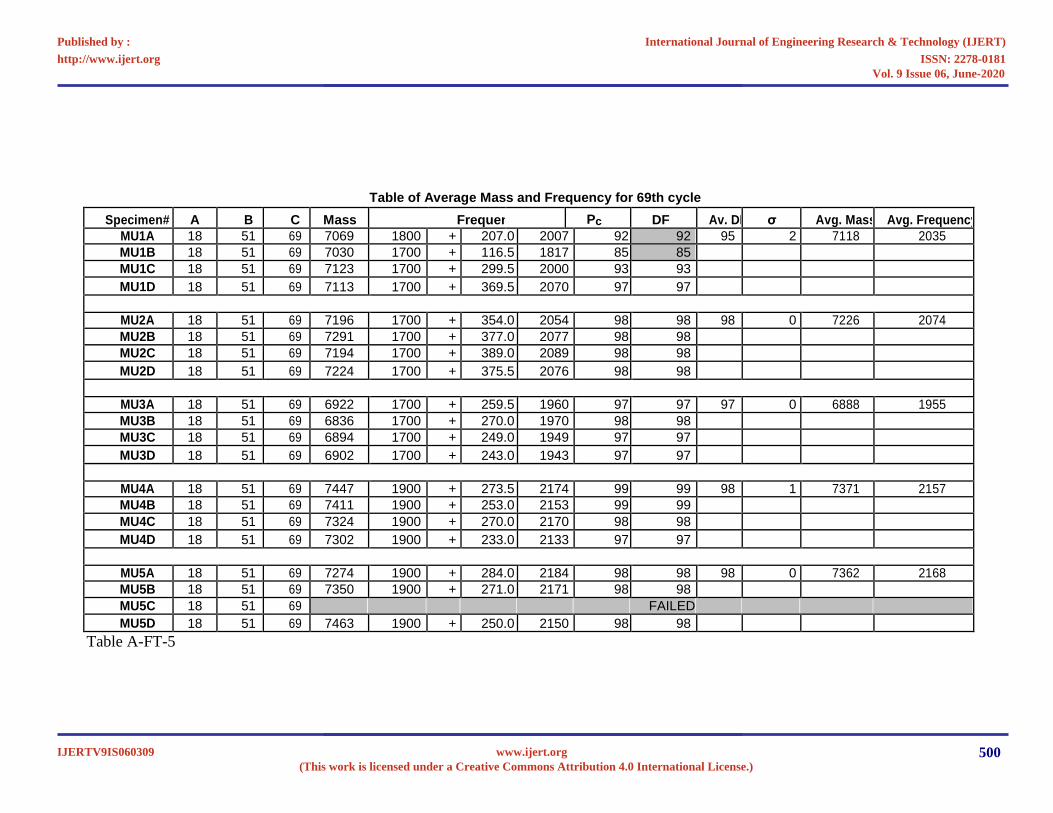
Table of Average Mass and Frequency for 69th cycle
Specimen# A B C Mass Frequency Pc DF Av. DF σ Avg. Mass Avg. Frequency
MU1A 18 51 69 7069 1800 + 207.0 2007 92 92 95 2 7118 2035
MU1B 18 51 69 7030 1700 + 116.5 1817 85 85
MU1C 18 51 69 7123 1700 + 299.5 2000 93 93
MU1D 18 51 69 7113 1700 + 369.5 2070 97 97
MU2A 18 51 69 7196 1700 + 354.0 2054 98 98 98 0 7226 2074
MU2B 18 51 69 7291 1700 + 377.0 2077 98 98
MU2C 18 51 69 7194 1700 + 389.0 2089 98 98
MU2D 18 51 69 7224 1700 + 375.5 2076 98 98
MU3A 18 51 69 6922 1700 + 259.5 1960 97 97 97 0 6888 1955
MU3B 18 51 69 6836 1700 + 270.0 1970 98 98
MU3C 18 51 69 6894 1700 + 249.0 1949 97 97
MU3D 18 51 69 6902 1700 + 243.0 1943 97 97
MU4A 18 51 69 7447 1900 + 273.5 2174 99 99 98 1 7371 2157
MU4B 18 51 69 7411 1900 + 253.0 2153 99 99
MU4C 18 51 69 7324 1900 + 270.0 2170 98 98
MU4D 18 51 69 7302 1900 + 233.0 2133 97 97
MU5A 18 51 69 7274 1900 + 284.0 2184 98 98 98 0 7362 2168
MU5B 18 51 69 7350 1900 + 271.0 2171 98 98
MU5C 18 51 69 FAILED
MU5D 18 51 69 7463 1900 + 250.0 2150 98 98
Table A-FT-5
International Journal of Engineering Research & Technology (IJERT)
ISSN: 2278-0181http://www.ijert.org
IJERTV9IS060309(This work is licensed under a Creative Commons Attribution 4.0 International License.)
Published by :
www.ijert.org
Vol. 9 Issue 06, June-2020
500
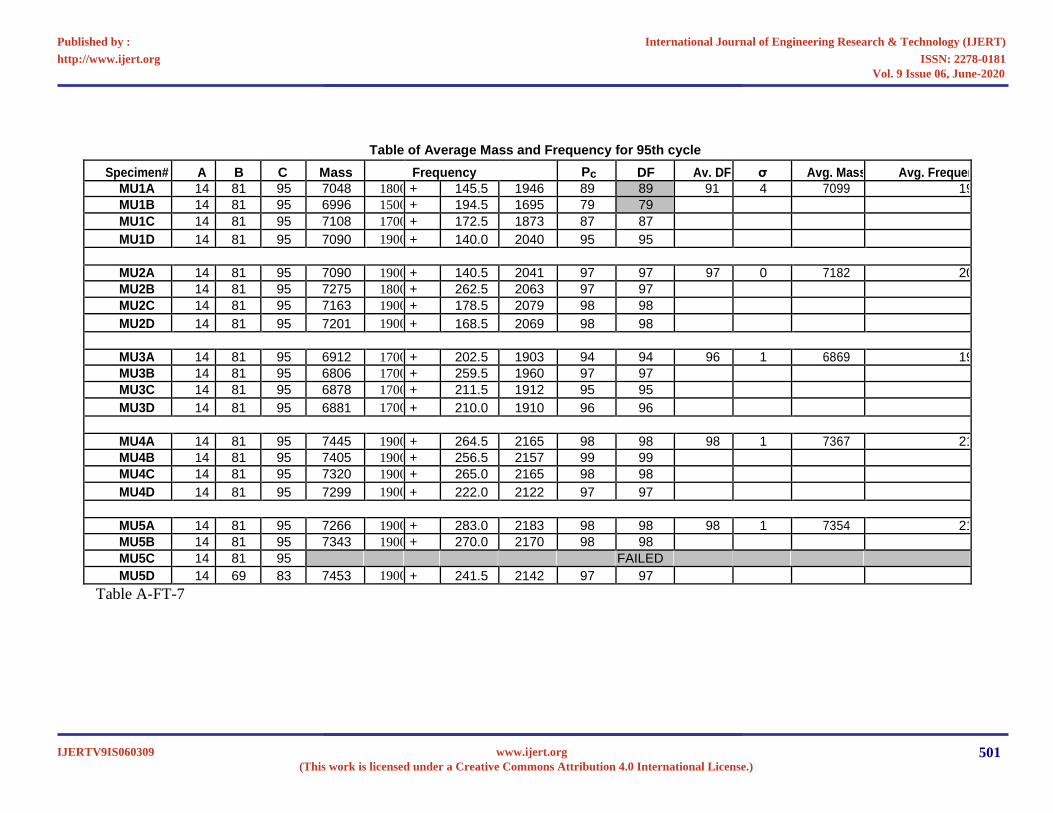
Table of Average Mass and Frequency for 95th cycle
Specimen# A B C Mass Frequency Pc DF Av. DF σ Avg. Mass Avg. Frequency
MU1A 14 81 95 7048 1800 + 145.5 1946 89 89 91 4 7099 1956
MU1B 14 81 95 6996 1500 + 194.5 1695 79 79
MU1C 14 81 95 7108 1700 + 172.5 1873 87 87
MU1D 14 81 95 7090 1900 + 140.0 2040 95 95
MU2A 14 81 95 7090 1900 + 140.5 2041 97 97 97 0 7182 2063
MU2B 14 81 95 7275 1800 + 262.5 2063 97 97
MU2C 14 81 95 7163 1900 + 178.5 2079 98 98
MU2D 14 81 95 7201 1900 + 168.5 2069 98 98
MU3A 14 81 95 6912 1700 + 202.5 1903 94 94 96 1 6869 1921
MU3B 14 81 95 6806 1700 + 259.5 1960 97 97
MU3C 14 81 95 6878 1700 + 211.5 1912 95 95
MU3D 14 81 95 6881 1700 + 210.0 1910 96 96
MU4A 14 81 95 7445 1900 + 264.5 2165 98 98 98 1 7367 2152
MU4B 14 81 95 7405 1900 + 256.5 2157 99 99
MU4C 14 81 95 7320 1900 + 265.0 2165 98 98
MU4D 14 81 95 7299 1900 + 222.0 2122 97 97
MU5A 14 81 95 7266 1900 + 283.0 2183 98 98 98 1 7354 2165
MU5B 14 81 95 7343 1900 + 270.0 2170 98 98
MU5C 14 81 95 FAILED
MU5D 14 69 83 7453 1900 + 241.5 2142 97 97
Table A-FT-7
International Journal of Engineering Research & Technology (IJERT)
ISSN: 2278-0181http://www.ijert.org
IJERTV9IS060309(This work is licensed under a Creative Commons Attribution 4.0 International License.)
Published by :
www.ijert.org
Vol. 9 Issue 06, June-2020
501
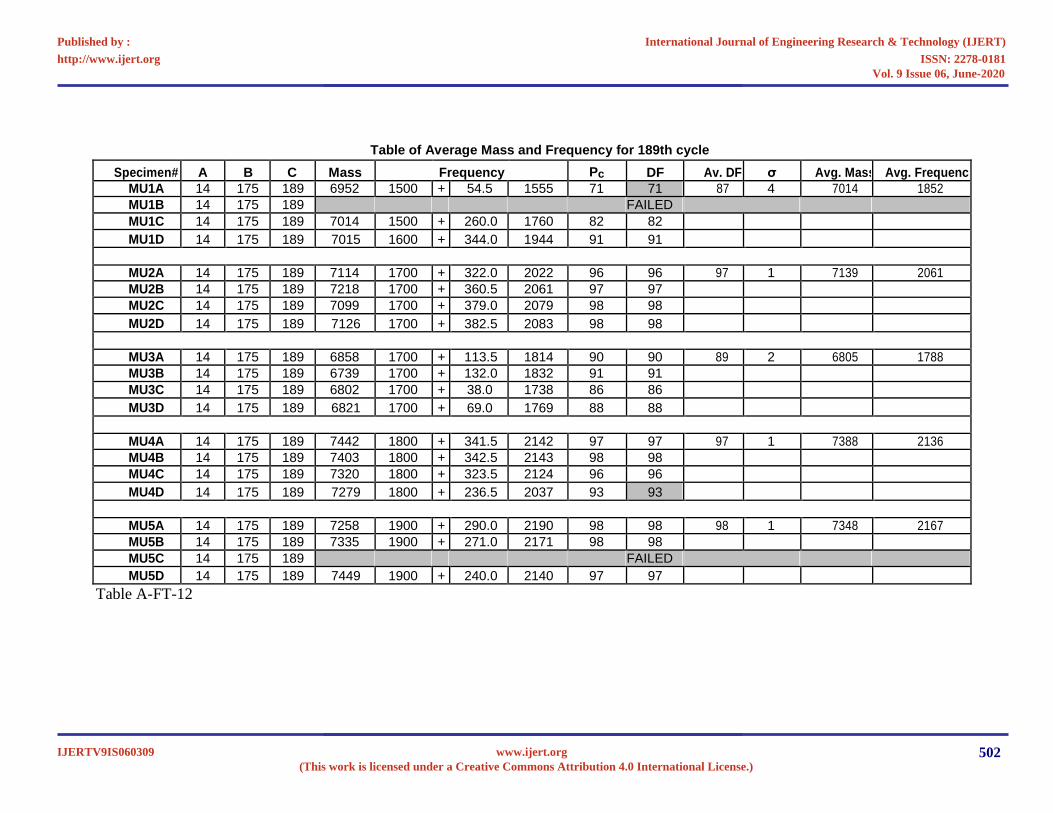
Table of Average Mass and Frequency for 189th cycle
Specimen# A B C Mass Frequency Pc DF Av. DF σ Avg. Mass Avg. Frequency
MU1A 14 175 189 6952 1500 + 54.5 1555 71 71 87 4 7014 1852
MU1B 14 175 189 FAILED
MU1C 14 175 189 7014 1500 + 260.0 1760 82 82
MU1D 14 175 189 7015 1600 + 344.0 1944 91 91
MU2A 14 175 189 7114 1700 + 322.0 2022 96 96 97 1 7139 2061
MU2B 14 175 189 7218 1700 + 360.5 2061 97 97
MU2C 14 175 189 7099 1700 + 379.0 2079 98 98
MU2D 14 175 189 7126 1700 + 382.5 2083 98 98
MU3A 14 175 189 6858 1700 + 113.5 1814 90 90 89 2 6805 1788
MU3B 14 175 189 6739 1700 + 132.0 1832 91 91
MU3C 14 175 189 6802 1700 + 38.0 1738 86 86
MU3D 14 175 189 6821 1700 + 69.0 1769 88 88
MU4A 14 175 189 7442 1800 + 341.5 2142 97 97 97 1 7388 2136
MU4B 14 175 189 7403 1800 + 342.5 2143 98 98
MU4C 14 175 189 7320 1800 + 323.5 2124 96 96
MU4D 14 175 189 7279 1800 + 236.5 2037 93 93
MU5A 14 175 189 7258 1900 + 290.0 2190 98 98 98 1 7348 2167
MU5B 14 175 189 7335 1900 + 271.0 2171 98 98
MU5C 14 175 189 FAILED
MU5D 14 175 189 7449 1900 + 240.0 2140 97 97
Table A-FT-12
International Journal of Engineering Research & Technology (IJERT)
ISSN: 2278-0181http://www.ijert.org
IJERTV9IS060309(This work is licensed under a Creative Commons Attribution 4.0 International License.)
Published by :
www.ijert.org
Vol. 9 Issue 06, June-2020
502
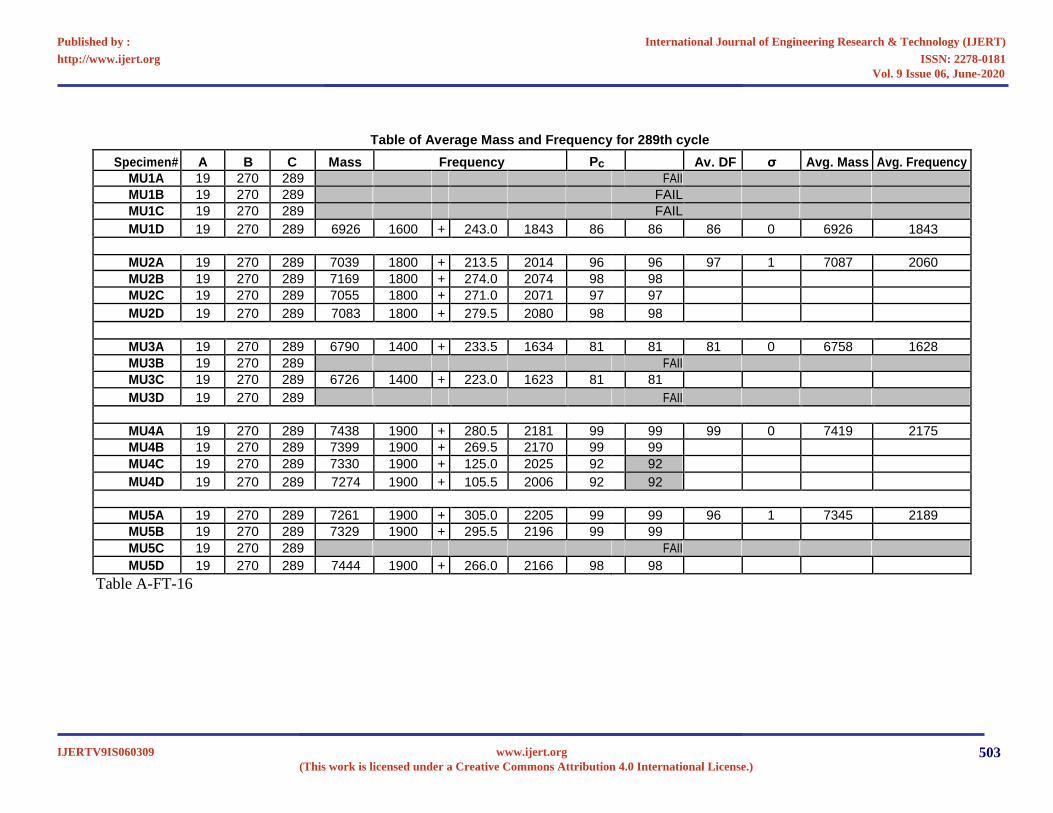
Table of Average Mass and Frequency for 289th cycle
Specimen#
A
B
C
Mass
Frequency
Pc
DF
Av. DF
σ
Avg. Mass
Avg. Frequency
MU1A
19
270
289
FAILED
MU1B
19
270
289
FAILED
MU1C
19
270
289
FAILED
MU1D
19
270
289
6926
1600
+
243.0
1843
86
86
86
0
6926
1843
MU2A
19
270
289
7039
1800
+
213.5
2014
96
96
97
1
7087
2060
MU2B
19
270
289
7169
1800
+
274.0
2074
98
98
MU2C
19
270
289
7055
1800
+
271.0
2071
97
97
MU2D
19
270
289
7083
1800
+
279.5
2080
98
98
MU3A
19
270
289
6790
1400
+
233.5
1634
81
81
81
0
6758
1628
MU3B
19
270
289
FAILED
MU3C
19
270
289
6726
1400
+
223.0
1623
81
81
MU3D
19
270
289
FAILED
MU4A
19
270
289
7438
1900
+
280.5
2181
99
99
99
0
7419
2175
MU4B
19
270
289
7399
1900
+
269.5
2170
99
99
MU4C
19
270
289
7330
1900
+
125.0
2025
92
92
MU4D
19
270
289
7274
1900
+
105.5
2006
92
92
MU5A
19
270
289
7261
1900
+
305.0
2205
99
99
96
1
7345
2189
MU5B
19
270
289
7329
1900
+
295.5
2196
99
99
MU5C
19
270
289
FAILED
MU5D
19
270
289
7444
1900
+
266.0
2166
98
98
Table A-FT-16
International Journal of Engineering Research & Technology (IJERT)
ISSN: 2278-0181http://www.ijert.org
IJERTV9IS060309(This work is licensed under a Creative Commons Attribution 4.0 International License.)
Published by :
www.ijert.org
Vol. 9 Issue 06, June-2020
503
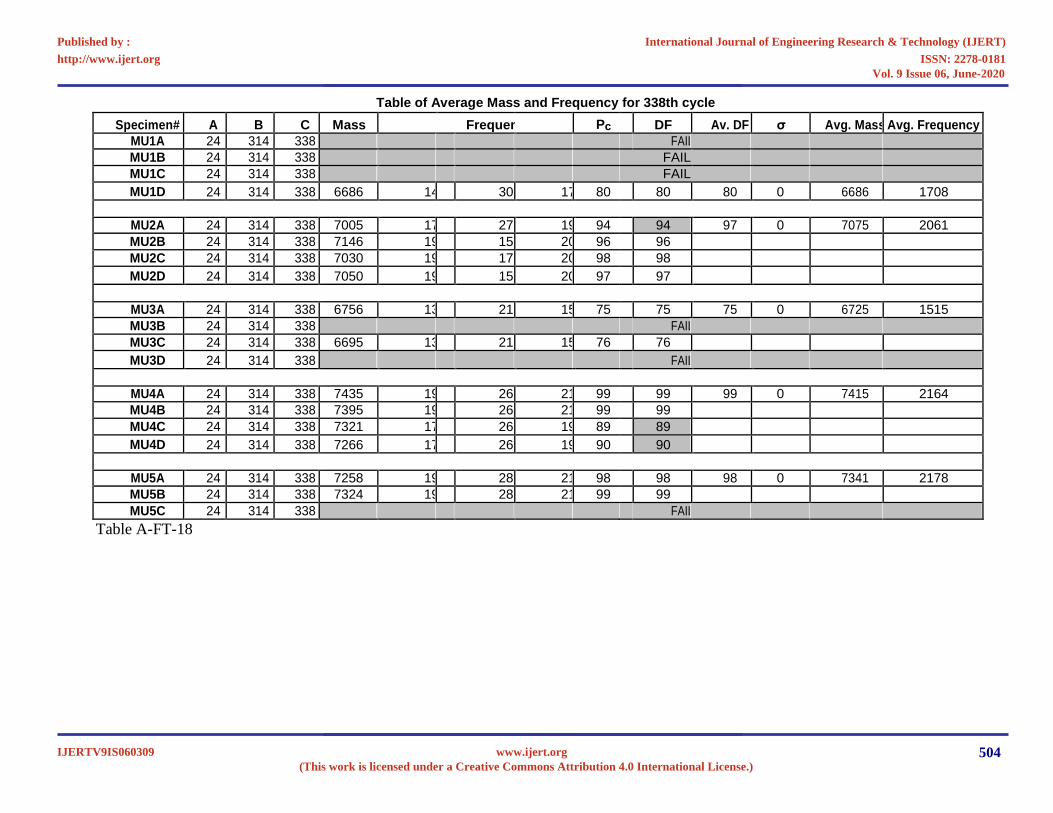
Table of Average Mass and Frequency for 338th cycle
Specimen# A B C Mass Frequency Pc DF Av. DF σ Avg. Mass Avg. Frequency
MU1A 24 314 338 FAILED
MU1B 24 314 338 FAILED
MU1C 24 314 338 FAILED
MU1D 24 314 338 6686 1400 + 307.5 1708 80 80 80 0 6686 1708
MU2A 24 314 338 7005 1700 + 277.5 1978 94 94 97 0 7075 2061
MU2B 24 314 338 7146 1900 + 150.5 2051 96 96
MU2C 24 314 338 7030 1900 + 174.0 2074 98 98
MU2D 24 314 338 7050 1900 + 157.5 2058 97 97
MU3A 24 314 338 6756 1300 + 210.0 1510 75 75 75 0 6725 1515
MU3B 24 314 338 FAILED
MU3C 24 314 338 6695 1300 + 219.0 1519 76 76
MU3D 24 314 338 FAILED
MU4A 24 314 338 7435 1900 + 265.5 2166 99 99 99 0 7415 2164
MU4B 24 314 338 7395 1900 + 262.5 2163 99 99
MU4C 24 314 338 7321 1700 + 266.5 1967 89 89
MU4D 24 314 338 7266 1700 + 266.0 1966 90 90
MU5A 24 314 338 7258 1900 + 287.5 2188 98 98 98 0 7341 2178
MU5B 24 314 338 7324 1900 + 287.0 2187 99 99
MU5C 24 314 338 FAILED
Table A-FT-18
International Journal of Engineering Research & Technology (IJERT)
ISSN: 2278-0181http://www.ijert.org
IJERTV9IS060309(This work is licensed under a Creative Commons Attribution 4.0 International License.)
Published by :
www.ijert.org
Vol. 9 Issue 06, June-2020
504
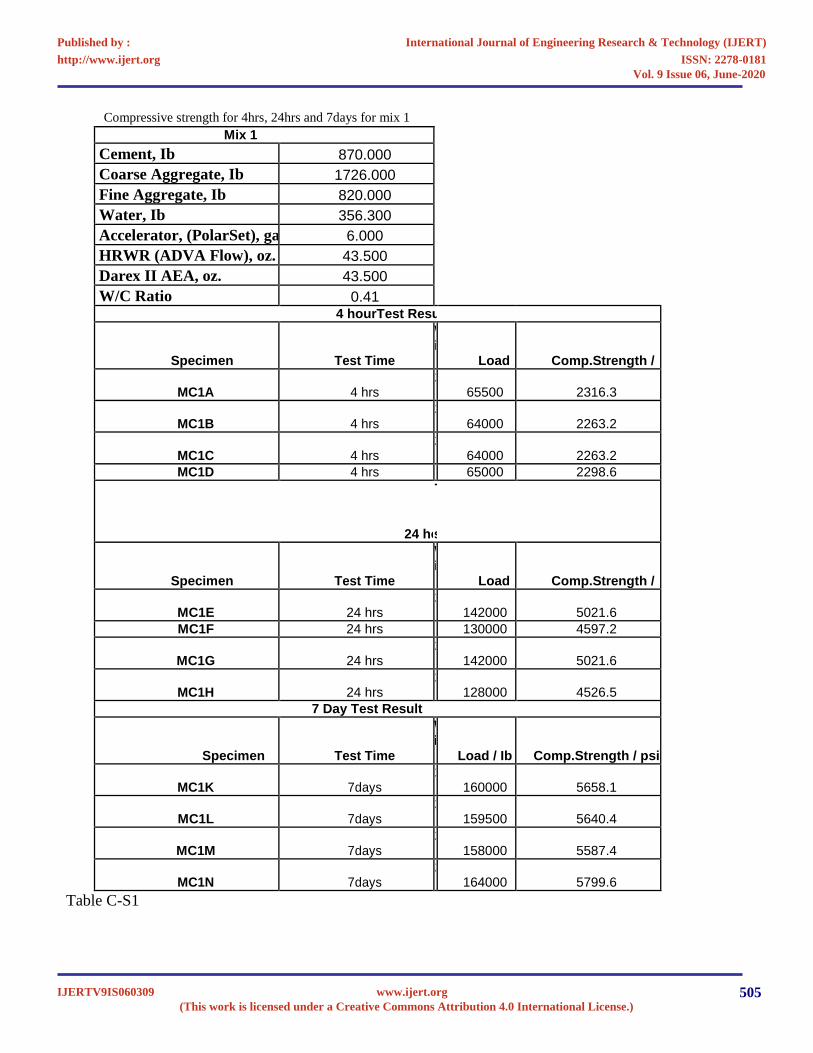
Compressive strength for 4hrs, 24hrs and 7days for mix 1
Mix 1
Cement, Ib
870.000
Coarse Aggregate, Ib
1726.000
Fine Aggregate, Ib
820.000
Water, Ib
356.300
Accelerator, (PolarSet), gal.
6.000
HRWR (ADVA Flow), oz.
43.500
Darex II AEA, oz.
43.500
W/C Ratio
0.41
4 hourTest Results
Specimen
Test Time
Weigh
t
Load / Ib
Comp.Strength / psi
MC1A
4 hrs
28.3
65500
2316.3
MC1B
4 hrs
28.3
64000
2263.2
MC1C
4 hrs
28.1
64000
2263.2
MC1D
4 hrs
28
65000
2298.6
24 hour
Test
Result
Specimen
Test Time
Weigh
t
Load / Ib
Comp.Strength / psi
MC1E
24 hrs
28.2
142000
5021.6
MC1F
24 hrs
28
130000
4597.2
MC1G
24 hrs
28.1
142000
5021.6
MC1H
24 hrs
28.2
128000
4526.5
7 Day Test Result
Specimen
Test Time
Weigh
t
Load / Ib
Comp.Strength / psi
MC1K
7days
28.4
160000
5658.1
MC1L
7days
28.4
159500
5640.4
MC1M
7days
28.1
158000
5587.4
MC1N
7days
28.2
164000
5799.6
Table C-S1
International Journal of Engineering Research & Technology (IJERT)
ISSN: 2278-0181http://www.ijert.org
IJERTV9IS060309(This work is licensed under a Creative Commons Attribution 4.0 International License.)
Published by :
www.ijert.org
Vol. 9 Issue 06, June-2020
505
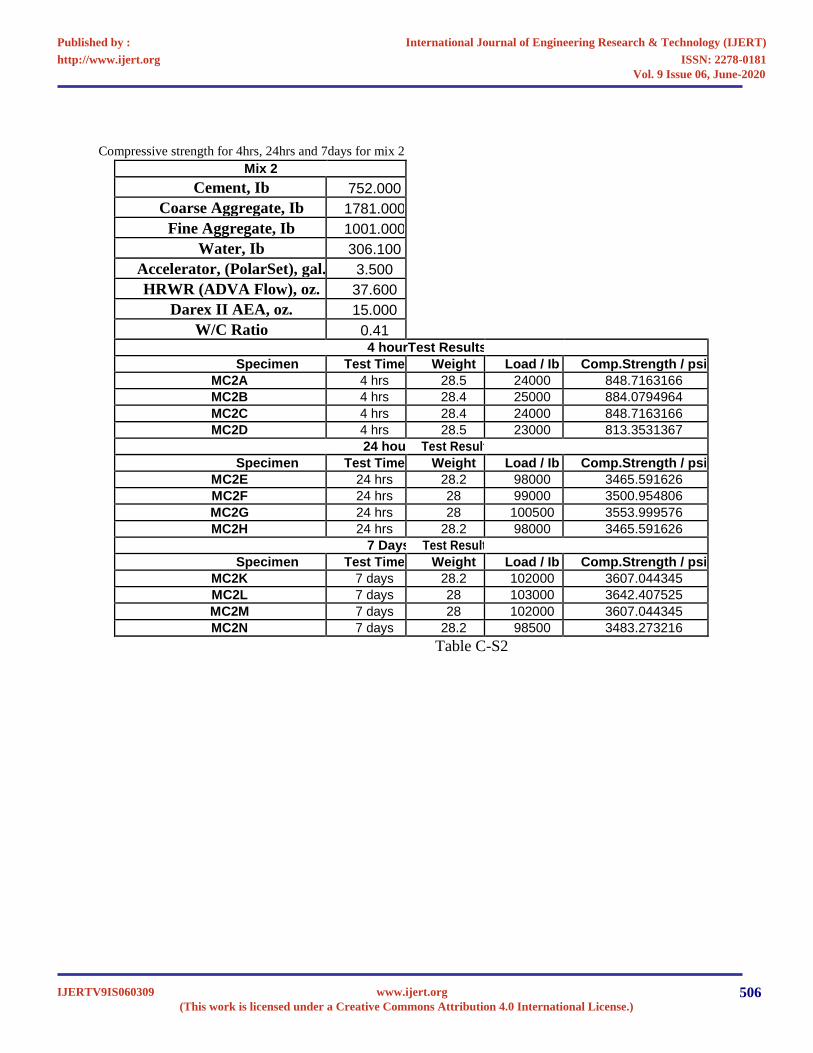
Compressive strength for 4hrs, 24hrs and 7days for mix 2 Mix 2
Cement, Ib 752.000
Coarse Aggregate, Ib 1781.000
Fine Aggregate, Ib 1001.000
Water, Ib 306.100
Accelerator, (PolarSet), gal. 3.500
HRWR (ADVA Flow), oz. 37.600
Darex II AEA, oz. 15.000
W/C Ratio 0.41 4 hourTest Results
Specimen Test Time Weight Load / Ib Comp.Strength / psi
MC2A 4 hrs 28.5 24000 848.7163166
MC2B 4 hrs 28.4 25000 884.0794964
MC2C 4 hrs 28.4 24000 848.7163166
MC2D 4 hrs 28.5 23000 813.3531367
24 hour Test Result
Specimen Test Time Weight Load / Ib Comp.Strength / psi
MC2E 24 hrs 28.2 98000 3465.591626
MC2F 24 hrs 28 99000 3500.954806
MC2G 24 hrs 28 100500 3553.999576
MC2H 24 hrs 28.2 98000 3465.591626
7 Days Test Result
Specimen Test Time Weight Load / Ib Comp.Strength / psi
MC2K 7 days 28.2 102000 3607.044345
MC2L 7 days 28 103000 3642.407525
MC2M 7 days 28 102000 3607.044345
MC2N 7 days 28.2 98500 3483.273216
Table C-S2
International Journal of Engineering Research & Technology (IJERT)
ISSN: 2278-0181http://www.ijert.org
IJERTV9IS060309(This work is licensed under a Creative Commons Attribution 4.0 International License.)
Published by :
www.ijert.org
Vol. 9 Issue 06, June-2020
506
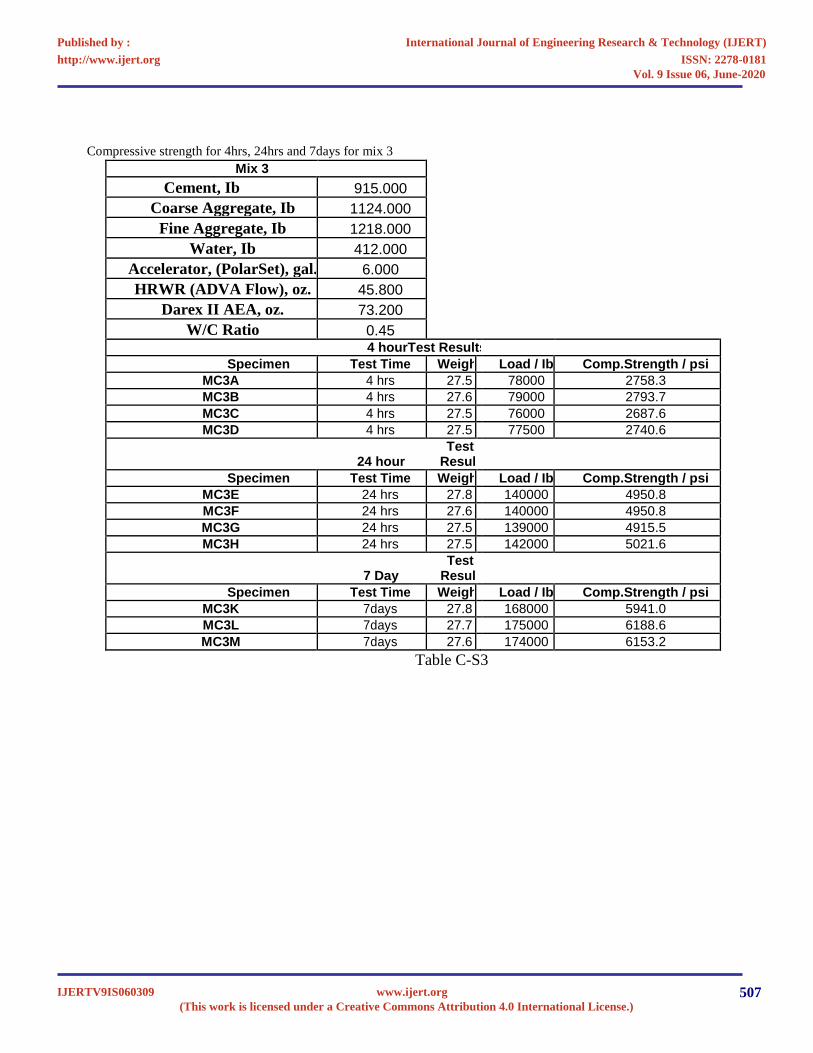
Compressive strength for 4hrs, 24hrs and 7days for mix 3 Mix 3
Cement, Ib 915.000
Coarse Aggregate, Ib 1124.000
Fine Aggregate, Ib 1218.000
Water, Ib 412.000
Accelerator, (PolarSet), gal. 6.000
HRWR (ADVA Flow), oz. 45.800
Darex II AEA, oz. 73.200
W/C Ratio 0.45 4 hourTest Results
Specimen Test Time Weight Load / Ib Comp.Strength / psi
MC3A 4 hrs 27.5 78000 2758.3
MC3B 4 hrs 27.6 79000 2793.7
MC3C 4 hrs 27.5 76000 2687.6
MC3D 4 hrs 27.5 77500 2740.6
24 hour Test
Result
Specimen Test Time Weight Load / Ib Comp.Strength / psi
MC3E 24 hrs 27.8 140000 4950.8
MC3F 24 hrs 27.6 140000 4950.8
MC3G 24 hrs 27.5 139000 4915.5
MC3H 24 hrs 27.5 142000 5021.6
7 Day Test
Result
Specimen Test Time Weight Load / Ib Comp.Strength / psi
MC3K 7days 27.8 168000 5941.0
MC3L 7days 27.7 175000 6188.6
MC3M 7days 27.6 174000 6153.2
Table C-S3
International Journal of Engineering Research & Technology (IJERT)
ISSN: 2278-0181http://www.ijert.org
IJERTV9IS060309(This work is licensed under a Creative Commons Attribution 4.0 International License.)
Published by :
www.ijert.org
Vol. 9 Issue 06, June-2020
507
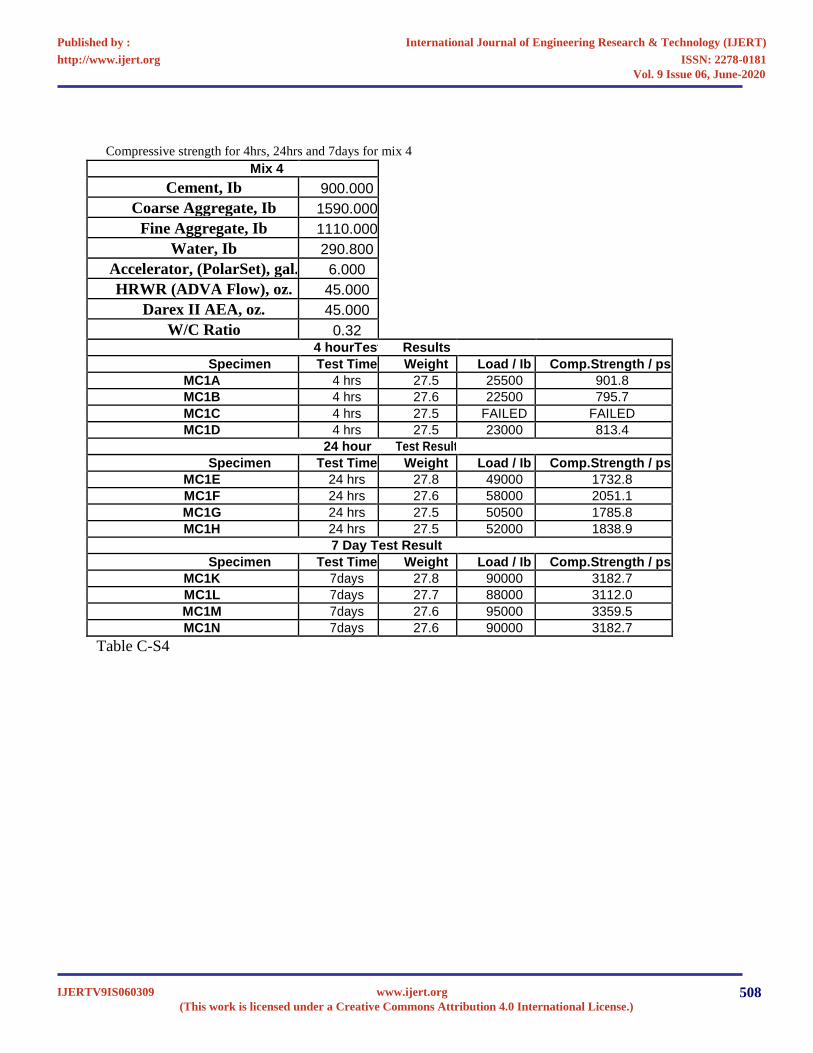
Compressive strength for 4hrs, 24hrs and 7days for mix 4 Mix 4
Cement, Ib 900.000
Coarse Aggregate, Ib 1590.000
Fine Aggregate, Ib 1110.000
Water, Ib 290.800
Accelerator, (PolarSet), gal. 6.000
HRWR (ADVA Flow), oz. 45.000
Darex II AEA, oz. 45.000
W/C Ratio 0.32 4 hourTest Results
Specimen Test Time Weight Load / Ib Comp.Strength / psi
MC1A 4 hrs 27.5 25500 901.8
MC1B 4 hrs 27.6 22500 795.7
MC1C 4 hrs 27.5 FAILED FAILED
MC1D 4 hrs 27.5 23000 813.4
24 hour Test Result
Specimen Test Time Weight Load / Ib Comp.Strength / psi
MC1E 24 hrs 27.8 49000 1732.8
MC1F 24 hrs 27.6 58000 2051.1
MC1G 24 hrs 27.5 50500 1785.8
MC1H 24 hrs 27.5 52000 1838.9
7 Day Test Result
Specimen Test Time Weight Load / Ib Comp.Strength / psi
MC1K 7days 27.8 90000 3182.7
MC1L 7days 27.7 88000 3112.0
MC1M 7days 27.6 95000 3359.5
MC1N 7days 27.6 90000 3182.7
Table C-S4
International Journal of Engineering Research & Technology (IJERT)
ISSN: 2278-0181http://www.ijert.org
IJERTV9IS060309(This work is licensed under a Creative Commons Attribution 4.0 International License.)
Published by :
www.ijert.org
Vol. 9 Issue 06, June-2020
508
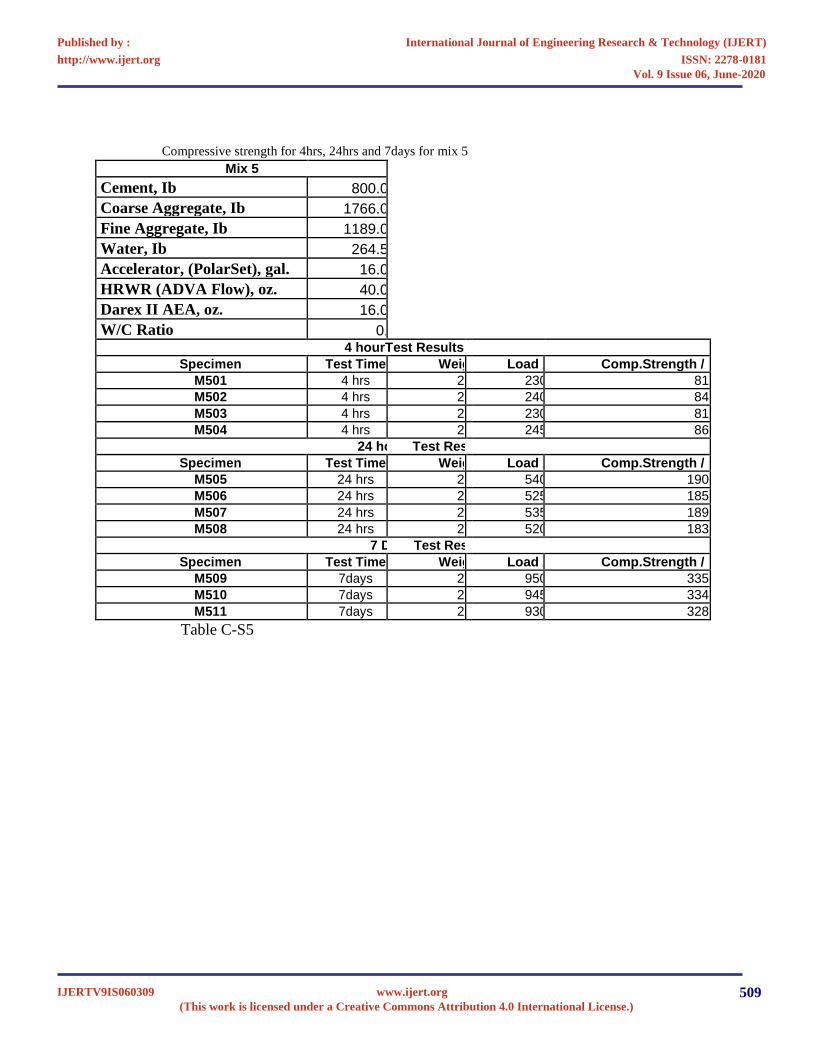
Compressive strength for 4hrs, 24hrs and 7days for mix 5 Mix 5
Cement, Ib 800.000
Coarse Aggregate, Ib 1766.000
Fine Aggregate, Ib 1189.000
Water, Ib 264.500
Accelerator, (PolarSet), gal. 16.000
HRWR (ADVA Flow), oz. 40.000
Darex II AEA, oz. 16.000
W/C Ratio 0.33 4 hourTest Results
Specimen Test Time Weight Load / Ib Comp.Strength / psi
M501 4 hrs 27.5 23000 813.4
M502 4 hrs 27.6 24000 848.7
M503 4 hrs 27.5 23000 813.4
M504 4 hrs 27.5 24500 866.4
24 hour Test Result
Specimen Test Time Weight Load / Ib Comp.Strength / psi
M505 24 hrs 27.8 54000 1909.6
M506 24 hrs 27.6 52500 1856.6
M507 24 hrs 27.5 53500 1891.9
M508 24 hrs 27.5 52000 1838.9
7 Day Test Result
Specimen Test Time Weight Load / Ib Comp.Strength / psi
M509 7days 27.8 95000 3359.5
M510 7days 27.7 94500 3341.8
M511 7days 27.6 93000 3288.8
Table C-S5
International Journal of Engineering Research & Technology (IJERT)
ISSN: 2278-0181http://www.ijert.org
IJERTV9IS060309(This work is licensed under a Creative Commons Attribution 4.0 International License.)
Published by :
www.ijert.org
Vol. 9 Issue 06, June-2020
509
REFERENCES
[1] BTS/USDOT, Pocket guide to transportation, 2003, Bureau of Transportation Statistics, U.S. Department of Transportation, Washington, DC, 2003
[2] 1999 costs/68 urban areas; TRB SR 260.
[3] Kutz, S., Balaguru, P., Consolasio, G., Maher, A., Fast Track Concrete For Construction Repair, FHWA NJ 2001-015, NJDOT/FHWA, March 1997.
[4] S. W. Forster. High-Performance Concrete — Stretching the Paradigm,1994.
[5] Powers, T. C., The Air Requirements of Frost-Resistant Concrete, Research Department Bulletin RX033, Portland cement Association, 1949.[6] Powers, T. C., Basic Considerations Pertaining to Freezing and Thawing Tests, Research Department Bulletin RX058, Portland, 1955.
[7] Korhonen, C., Effect of High Doses of Chemical Admixtures on the Freeze–Thaw Durability of Portland cement Concrete, [ERDC/CRREL
TR-02-5], 2002.
[8] Concrete International, Oct, Vol. 16, No. 10, pp. 33-34
[9] C. H. Goodspeed, S. Vanikar, and R. A. Cook. 1996. [10] High-Performance Concrete Defined for Highway Structures. Concrete International, Feb, Vol. 18, No. 2, pp. 62-67.
International Journal of Engineering Research & Technology (IJERT)
ISSN: 2278-0181http://www.ijert.org
IJERTV9IS060309(This work is licensed under a Creative Commons Attribution 4.0 International License.)
Published by :
www.ijert.org
Vol. 9 Issue 06, June-2020
510