Embed Size (px)
Citation preview
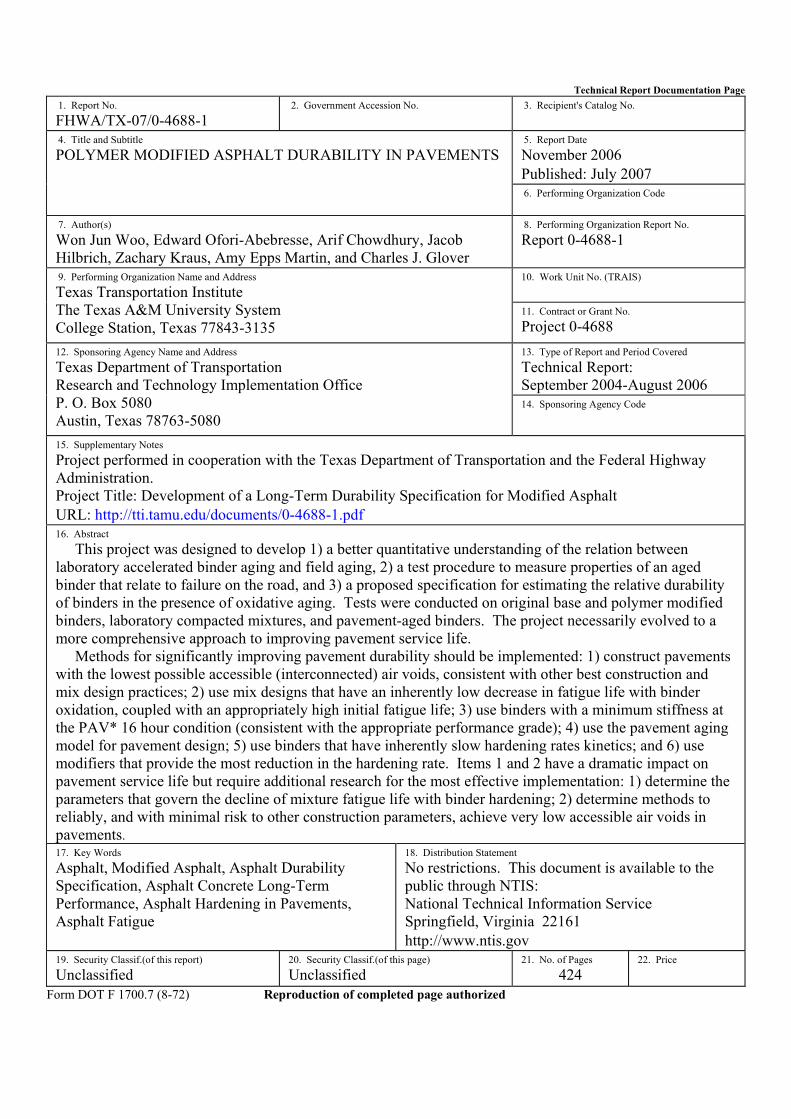
Technical Report Documentation Page 1. Report No. FHWA/TX-07/0-4688-1
2. Government Accession No.
3. Recipient's Catalog No. 5. Report Date November 2006 Published: July 2007
4. Title and Subtitle POLYMER MODIFIED ASPHALT DURABILITY IN PAVEMENTS
6. Performing Organization Code
7. Author(s) Won Jun Woo, Edward Ofori-Abebresse, Arif Chowdhury, Jacob Hilbrich, Zachary Kraus, Amy Epps Martin, and Charles J. Glover
8. Performing Organization Report No. Report 0-4688-1
10. Work Unit No. (TRAIS)
9. Performing Organization Name and Address Texas Transportation Institute The Texas A&M University System College Station, Texas 77843-3135
11. Contract or Grant No. Project 0-4688 13. Type of Report and Period Covered Technical Report: September 2004-August 2006
12. Sponsoring Agency Name and Address Texas Department of Transportation Research and Technology Implementation Office P. O. Box 5080 Austin, Texas 78763-5080
14. Sponsoring Agency Code
15. Supplementary Notes Project performed in cooperation with the Texas Department of Transportation and the Federal Highway Administration. Project Title: Development of a Long-Term Durability Specification for Modified Asphalt URL: http://tti.tamu.edu/documents/0-4688-1.pdf 16. Abstract This project was designed to develop 1) a better quantitative understanding of the relation between laboratory accelerated binder aging and field aging, 2) a test procedure to measure properties of an aged binder that relate to failure on the road, and 3) a proposed specification for estimating the relative durability of binders in the presence of oxidative aging. Tests were conducted on original base and polymer modified binders, laboratory compacted mixtures, and pavement-aged binders. The project necessarily evolved to a more comprehensive approach to improving pavement service life. Methods for significantly improving pavement durability should be implemented: 1) construct pavements with the lowest possible accessible (interconnected) air voids, consistent with other best construction and mix design practices; 2) use mix designs that have an inherently low decrease in fatigue life with binder oxidation, coupled with an appropriately high initial fatigue life; 3) use binders with a minimum stiffness at the PAV* 16 hour condition (consistent with the appropriate performance grade); 4) use the pavement aging model for pavement design; 5) use binders that have inherently slow hardening rates kinetics; and 6) use modifiers that provide the most reduction in the hardening rate. Items 1 and 2 have a dramatic impact on pavement service life but require additional research for the most effective implementation: 1) determine the parameters that govern the decline of mixture fatigue life with binder hardening; 2) determine methods to reliably, and with minimal risk to other construction parameters, achieve very low accessible air voids in pavements. 17. Key Words Asphalt, Modified Asphalt, Asphalt Durability Specification, Asphalt Concrete Long-Term Performance, Asphalt Hardening in Pavements, Asphalt Fatigue
18. Distribution Statement No restrictions. This document is available to the public through NTIS: National Technical Information Service Springfield, Virginia 22161 http://www.ntis.gov
19. Security Classif.(of this report) Unclassified
20. Security Classif.(of this page) Unclassified
21. No. of Pages
424
22. Price
Form DOT F 1700.7 (8-72) Reproduction of completed page authorized

POLYMER MODIFIED ASPHALT DURABILITY IN PAVEMENTS
by
Won Jun Woo Graduate Research Assistant
Artie McFerrin Department of Chemical Engineering/Texas Transportation Institute
Edward Ofori-Abebresse Graduate Research Assistant, Texas Transportation Institute
Arif Chowdhury
Research Engineer, Texas Transportation Institute
Jacob Hilbrich Undergraduate Research Assistant, Artie McFerrin Department of Chemical Engineering
Zachary Kraus
Graduate Research Assistant Artie McFerrin Department of Chemical Engineering/Texas Transportation Institute
Amy Epps Martin
Associate Research Engineer, Texas Transportation Institute
and
Charles J. Glover Professor/Research Engineer
Artie McFerrin Department of Chemical Engineering/Texas Transportation Institute
Report 0-4688-1 Project 0-4688
Project Title: Development of a Long-Term Durability Specification for Modified Asphalt
Performed in cooperation with the Texas Department of Transportation
and the Federal Highway Administration
November 2006
Published: July 2007
TEXAS TRANSPORTATION INSTITUTE The Texas A&M University System College Station, Texas 77843-3135

v
DISCLAIMER
The contents of this report reflect the views of the authors, who are responsible for the facts and the accuracy of the data presented herein. The contents do not necessarily reflect the official view or policies of the Federal Highway Administration (FHWA) and the Texas Department of Transportation (TxDOT). This report does not constitute a standard, specification, or regulation, nor is it intended for construction, bidding, or permit purposes. The Unites States Government and the State of Texas do not endorse products or manufacturers. Trade or manufacturers’ names appear herein solely because they are considered essential to the object of this report. The engineers in charge were Charles J. Glover, P.E. (Texas No. 48732) and Amy Epps Martin, P.E. (Texas No. 91053).
vi
ACKNOWLEDGMENTS
This project was conducted for TxDOT, and the authors thank TxDOT and FHWA for their support in funding this research project. In particular, the guidance and technical assistance provided by the project director (PD) Darren Hazlett of TxDOT, the project coordinator (PC) German Claros of the Research and Technology Implementation (RTI) office, and the project monitoring committee (PMC). Special thanks also go to Lee Gustavus and Rick Canatella of the Texas Transportation Institute (TTI) for their help in specimen and sample preparation. The various TxDOT district offices that provided assistance in material and pavement core procurement are also thanked. Finally, we thank Ben Worrel of the MnRoad Test Site for providing the MnRoad pavement cores, binder, and hot mix materials, as well as MnRoad data.
vii
TABLE OF CONTENTS
Page
LIST OF FIGURES ..................................................................................................................... xiv
LIST OF TABLES....................................................................................................................... xxi
LIST OF ABBREVIATIONS AND SYMBOLS ...................................................................... xxiii
CHAPTER 1. INTRODUCTION AND BACKGROUND ......................................................... 1-1
PROBLEM STATEMENT.................................................................................................... 1-1
BACKGROUND AND SIGNIFICANCE OF WORK.......................................................... 1-1
A Brief Review of Binder Oxidation and Hardening Kinetics ........................................ 1-2
Binder Oxidation and Embrittlement – Conventional Binders........................................ 1-4
Binder Oxidation and Embrittlement – Polymer-Modified Binders................................ 1-6
TxDOT Project 0-4468 – Fatigue Resistance of Rut-Resistant Mixtures...................... 1-13
SUMMARY OF DURABILITY ISSUES........................................................................... 1-14
OUTLINE OF THE REPORT............................................................................................. 1-15
CHAPTER 2. DURABILITY EFFECTIVENESS OF SELECTED POLYMER-ASPHALT
SYSTEMS.................................................................................................................................... 2-1
INTRODUCTION ................................................................................................................. 2-1
RESEARCH OBJECTIVES .................................................................................................. 2-1
METHODOLOGY ................................................................................................................ 2-2
Materials .......................................................................................................................... 2-2
Aging Methods................................................................................................................. 2-3
Analytical Measurements................................................................................................. 2-3
RESULTS AND DISCUSSION............................................................................................ 2-4
Asphalt Composition and Changes in Composition with Oxidative Aging .................... 2-4
Effect of Aging on Ductility and Rheological Properties................................................ 2-7
Oxidative Hardening Rates ............................................................................................ 2-17
GPC Spectra................................................................................................................... 2-22
Effect of Polymer Modifier on Elongational Properties ................................................ 2-26
Some Important Binder Measures Related to Durability............................................... 2-32
viii
TABLE OF CONTENTS (CONT.)
Page SUMMARY......................................................................................................................... 2-36
CHAPTER 3. EFFECTIVENESS OF POLYMER MODIFIER AFTER AGING ..................... 3-1
INTRODUCTION ................................................................................................................. 3-1
RESEARCH OBJECTIVES .................................................................................................. 3-2
METHODOLOGY ................................................................................................................ 3-2
Material Preparation......................................................................................................... 3-2
Test Methods.................................................................................................................... 3-3
RESULTS AND DISCUSSION............................................................................................ 3-3
Effect of Aging on Ductility and Rheological Properties................................................ 3-3
Effect of Polymer Modifier on Elongational Properties .................................................. 3-5
Rheological and Elongational Properties of Rejuvenated Heavily Aged PMA .............. 3-8
CONCLUSION.................................................................................................................... 3-12
CHAPTER 4. A PRELIMINARY INVESTIGATION OF POLYMER MODIFIED AND
UNMODIFIED ASPHALT USING IMAGING ......................................................................... 4-1
INTRODUCTION ................................................................................................................. 4-1
RESEARCH OBJECTIVES .................................................................................................. 4-2
METHODOLOGY ................................................................................................................ 4-2
Material Preparation......................................................................................................... 4-2
Test Methods.................................................................................................................... 4-2
RESULTS AND DISCUSSION............................................................................................ 4-3
SUMMARY........................................................................................................................... 4-9
CHAPTER 5. TOWARDS AN OXYGEN AND THERMAL TRANSPORT MODEL OF
BINDER OXIDATION IN PAVEMENTS................................................................................. 5-1
INTRODUCTION ................................................................................................................. 5-1
RESEARCH OBJECTIVES .................................................................................................. 5-3
ix
TABLE OF CONTENTS (CONT.)
Page METHODOLOGY ................................................................................................................ 5-3
Materials .......................................................................................................................... 5-4
Pavement Core Properties................................................................................................ 5-7
Binder Extraction and Recovery...................................................................................... 5-8
Binder Content ................................................................................................................. 5-8
Binder Analytical Measurements..................................................................................... 5-8
Aging Methods................................................................................................................. 5-9
RESULTS AND DISCUSSION.......................................................................................... 5-10
Texas and Minnesota Aging Rates ................................................................................ 5-10
Model Development of Binder Aging in Pavements..................................................... 5-21
MnRoad Pavements ....................................................................................................... 5-28
Summary of the Pavement Aging Model....................................................................... 5-36
Oxidative Aging in Texas Pavements............................................................................ 5-37
Summary of Binder Aging in Texas Pavements............................................................ 5-46
CHAPTER 6. ESTIMATION OF POLYMER MODIFIED MIXTURE FATIGUE LIFE
BASED ON THE EFFECTS OF AGING ................................................................................... 6-1
INTRODUCTION ................................................................................................................. 6-1
Problem Statement ........................................................................................................... 6-1
Chapter Objectives........................................................................................................... 6-2
Scope of the Chapter........................................................................................................ 6-2
Chapter Organization ....................................................................................................... 6-3
RESEARCH METHODOLOGY........................................................................................... 6-3
Introduction...................................................................................................................... 6-3
Experimental Design........................................................................................................ 6-3
HMAC Specimen Fabrication.......................................................................................... 6-7
Hypothetical Pavement Structure and Traffic Parameters............................................. 6-10
Analytical Measurements............................................................................................... 6-11
x
TABLE OF CONTENTS (CONT.)
Page Analysis Procedure ........................................................................................................ 6-15
LABORATORY TEST RESULTS AND ANALYSIS....................................................... 6-17
Surface Energy Test Results .......................................................................................... 6-17
CMSE Test Results ........................................................................................................ 6-20
Load Cycles to Crack Initiation (Ni).............................................................................. 6-29
Load Cycles to Crack Propagation Np ........................................................................... 6-31
Statistical Analysis of Lab Nf Results............................................................................ 6-31
Discussion of Nf Results ................................................................................................ 6-33
SUMMARY......................................................................................................................... 6-34
CHAPTER 7. THE IMPACT OF MIXTURE VERSUS NEAT-FILM BINDER AGING
ON MIXTURE FATIGUE .......................................................................................................... 7-1
INTRODUCTION ................................................................................................................. 7-1
RESEARCH OBJECTIVES .................................................................................................. 7-2
METHODOLOGY ................................................................................................................ 7-2
Materials .......................................................................................................................... 7-2
Aging Processes ............................................................................................................... 7-3
Test Methods.................................................................................................................... 7-4
RESULTS AND DISCUSSION............................................................................................ 7-5
Mixture versus Neat-Film Binder Oxidation and Hardening .......................................... 7-5
Mixture Oxidative Aging and Fatigue Resistance ......................................................... 7-13
The Impact of Binder Aging on Mixture Fatigue Life .................................................. 7-16
SUMMARY AND CONCLUSIONS .................................................................................. 7-21
CHAPTER 8. A PROTOCOL FOR ASSESSING POLYMER MODIFIED ASPHALT
DURABILITY IN PAVEMENT ................................................................................................. 8-1
BACKGROUND ................................................................................................................... 8-1
DETERMINE MEASURES OF MODIFIED BINDER PERFORMANCE......................... 8-2
xi
TABLE OF CONTENTS (CONT.)
Page Age Both the Base and Modified Binders ....................................................................... 8-2
Measure Aged Binder Properties ..................................................................................... 8-3
Calculate Screening Measures of Binder Performance ................................................... 8-3
ESTIMATE PAVEMENT LIFE............................................................................................ 8-6
Method 1: Estimate Pavement Fatigue Life without Mixture Properties ........................ 8-6
Method 2: Estimate Pavement Life Including Mixture Properties .................................. 8-8
CHAPTER 9. POLYMER MODIFIED ASPHALT DURABILITY IN PAVEMENTS:
SUMMARY OF THE PROJECT PROBLEM, ACTIVITIES, FINDINGS, AND
RECOMMENDATIONS............................................................................................................. 9-1
METHODOLOGY ................................................................................................................ 9-1
RESULTS .............................................................................................................................. 9-2
Changes to Binder Properties with Polymer Modification and Oxidative Aging ........... 9-2
Mechanisms of PMA Loss of Ductility with Binder Oxidation ...................................... 9-3
Asphalt and Modified Asphalt Fluorescence Microscopy Imaging ................................ 9-3
A Model for Binder Oxidation Rates in Pavements ........................................................ 9-3
Mixture Fatigue Life Decline with Oxidative Aging....................................................... 9-4
A Protocol for Assessing PMA Durability in Pavements................................................ 9-4
RECOMMENDATIONS....................................................................................................... 9-5
Implement Methods for Maximizing Pavement Durability............................................. 9-5
Further Research and Development................................................................................. 9-6
CHAPTER 10. REFERENCES ................................................................................................. 10-1
xii
TABLE OF CONTENTS (CONT.)
Page APPENDICES FOR CHAPTER 2
APPENDIX 2-A: TABLES OF CORBETT ANALYSIS DATA .....................................2-A-1
APPENDIX 2-B: TABLES OF RHEOLOGICAL PROPERTIES, DUCTILITY, AND
CARBONYL AREA DATA.............................................................................................. 2-B-1
APPENDIX 2-C: FIGURES OF DUCTILITY DATA ..................................................... 2-C-1
APPENDIX 2-D: FIGURES OF HARDENING RATE AND RATIO DATA ................2-D-1
APPENDIX 2-E: FIGURES OF MASTER CURVE DATA ............................................ 2-E-1
APPENDIX 2-F: FIGURES OF GPC DATA ....................................................................2-F-1
APPENDIX 2-G: FIGURES OF FORCE DUCTILITY DATA .......................................2-G-1
APPENDIX 2-H: FIGURES OF FT-IR DATA.................................................................2-H-1
APPENDICES FOR CHAPTER 3
APPENDIX 3-A: TABLES OF RHEOLOGICAL PROPERTIES, DUCTILITY, AND
CARBONYL AREA DATA..............................................................................................3-A-1
APPENDIX 3-B: FIGURES OF GPC DATA................................................................... 3-B-1
APPENDICES FOR CHAPTER 5
APPENDIX 5-A: TABLES OF RHEOLOGICAL PROPERTIES, CARBONYL
AREA, AND DSR FUNCTION HARDENING WITH PAVEMENT SERVICE
TIME DATA......................................................................................................................5-A-1
APPENDIX 5-B: TABLES OF BULK S.G., AIR VOID, AND
BINDER CONTENT DATA............................................................................................. 5-B-1
APPENDIX 5-C: FIGURES OF BULK S.G., AIR VOID, BINDER CONTENT,
AND DSR FUNCTION VERSUS AAV DATA............................................................... 5-C-1
APPENDIX 5-D: FIGURES OF AGING PATH DATA ..................................................5-D-1
APPENDIX 5-E: FIGURES OF HARDENING RATE DATA........................................ 5-E-1
APPENDIX 5-F: FIGURES OF MASTER CURVE DATA..............................................5-F-1
APPENDIX 5-G: FIGURES OF GPC DATA...................................................................5-G-1
xiii
TABLE OF CONTENTS (CONT.)
Page APPENDIX 5-H: FIGURES OF OXYGEN TRANSPORT DATA .................................5-H-1
APPENDIX FOR CHAPTER 6
APPENDIX 6-A: TABLES OF BINDER SURFACE ENERGY AND HMAC MIXTURE
PROPERTY DATA...........................................................................................................6-A-1
APPENDICES FOR CHAPTER 7
APPENDIX 7-A: TABLES OF RHEOLOGICAL PROPERTIES AND
CARBONYL AREA DATA..............................................................................................7-A-1
APPENDIX 7-B: FIGURES OF BINDER CONTENT AND MASTER
CURVE DATA.................................................................................................................. 7-B-1
APPENDIX 7-C: FIGURES OF GPC DATA................................................................... 7-C-1
APPENDICES FOR CHAPTER 8
APPENDIX 8-A: TABLE AND FIGURES OF PROTOCOL CRITERIA DATA...........8-A-1
APPENDIX 8-B: TABLE OF DSR FUNCTION AND FATIGUE LIFE DATA ............ 8-B-1
xiv
LIST OF FIGURES
Figure Page 1-1 Typical Hardening Response of an Unmodified Asphalt Binder to Oxidation................ 1-3
1-2 Correlation of Aged-Binder Ductility with the DSR Function G′/(η′/G′)
for Unmodified Binders. .................................................................................................. 1-5
1-3 Binder Aging Path on a G′ versus η′/G′ Map (Pavement-aged Binders)......................... 1-6
1-4 The Effect of Modifiers on Binder Hardening Rates ....................................................... 1-7
1-5 The Effect of Modifiers on Binder Oxidation Rates ........................................................ 1-8
1-6 The Effect of Modifiers on Binder ................................................................................... 1-8
1-7 Stress versus Elongation, 4 °C: Unaged ........................................................................... 1-9
1-8 The Effect of Modifiers on Binder ................................................................................. 1-10
1-9 Ductility versus G′/(η′/G′) for Modified Asphalt Groupings......................................... 1-11
1-10 Effect of Modifiers on Ductility ..................................................................................... 1-11
1-11 Ductility-Direct Tension Comparison at -12 °C............................................................. 1-12
1-12 Ductility-Direct Tension Comparison at -18 °C............................................................. 1-13
2-1 Corbett Analysis for Unaged and PAV* Aged PMAs and Base Binders
(Wright through MnRoad) ............................................................................................... 2-5
2-2 Corbett Analysis for Unaged and PAV* Aged PMAs and Base Binders
(Lion through Valero). ..................................................................................................... 2-5
2-3 Ductility versus DSR Function [G′/(η′/G′)] for Unaged and PAV* Aged PMAs
and Base Binders (Wright through MnRoad) .................................................................. 2-7
2-4 Ductility versus DSR Function [G′/(η′/G′)] for Unaged and PAV* Aged PMAs
and Base Binders (Lion through Valero) ......................................................................... 2-8
2-5 G′ versus η′/G′ for Unaged and PAV* Aged PMAs and Base Binders
(Wright through MnRoad) ............................................................................................. 2-10
2-6 Part A: G′ versus η′/G′ for Unaged and PAV* Aged PMAs and Base Binders
(Wright through MnRoad) ............................................................................................. 2-10
2-7 G′ versus η′/G′ for Unaged and PAV* Aged PMAs and Base Binders
(Lion through Valero) .................................................................................................... 2-11
xv
LIST OF FIGURES (CONT.)
Page 2-8 Part A: G′ versus η′/G for Unaged and PAV* Aged PMAs and Base Binders
(Lion through Valero) .................................................................................................... 2-11
2-9 Ductility versus DSR Function [G′/(η′/G′)] for PAV* and ER Aged PMAs
and Base Binders (Wright through MnRoad). ............................................................... 2-13
2-10 Ductility versus DSR Function [G′/(η′/G′)] for PAV* and ER Aged PMAs
and Base Binders (Lion through Valero) ....................................................................... 2-13
2-11 Ductility versus DSR Function [G′/(η′/G′)] for PAV* and ER Aged PMAs
and Base Binders............................................................................................................ 2-15
2-12 Ductility versus DSR Function [G′/(η′/G′)] for PAV* and ER Aged PMAs
and Base Binders (Ductility from 3 to 10 cm)............................................................... 2-15
2-13 G′ versus η′/G′ for Unaged and ER Aged PMAs and Base Binders
(Wright through MnRoad) ............................................................................................. 2-16
2-14 G′ versus η′/G′ for Unaged and ER Aged PMAs and Base Binders
(Lion through Valero) .................................................................................................... 2-17
2-15 DSR Function [G′/(η′/G′)] Hardening Rate for ER Aged Binders
(Wright through MnRoad). ............................................................................................ 2-19
2-16 DSR Function [G′/(η′/G′)] Hardening Rate for ER Aged Binders
(Lion through Valero) .................................................................................................... 2-19
2-17 η* Hardening Rate for ER Aged Binders (Wright through MnRoad) ........................... 2-21
2-18 η* Hardening Rate for ER Aged Binders (Lion through Valero) .................................. 2-21
2-19 GPC Chromatograms for Koch PG 64-22...................................................................... 2-23
2-20 GPC Chromatograms for Koch PG 70-22...................................................................... 2-23
2-21 GPC Chromatograms for Koch PG 76-22...................................................................... 2-24
2-22 GPC Chromatograms for MnRoad PG 58-28................................................................. 2-25
2-23 GPC Chromatograms for MnRoad PG 58-34................................................................. 2-25
2-24 GPC Chromatograms for MnRoad PG 58-40................................................................. 2-26
2-25 Force Ductility at 4 oC for SAFT Aged Wright Asphalts............................................... 2-27
2-26 Force Ductility at 4 oC for PAV* 16 hr Aged Wright Asphalts ..................................... 2-28
xvi
LIST OF FIGURES (CONT.)
Page 2-27 Force Ductility at 4 oC for PAV* 32 hr Aged Wright Asphalts ..................................... 2-28
2-28 Force Ductility at 4 oC for SAFT Aged Alon Asphalts.................................................. 2-29
2-29 Force Ductility at 4 oC for PAV* 16 hr Aged Alon Asphalts ........................................ 2-30
2-30 Force Ductility at 4 oC for PAV* 32 hr Aged Alon Asphalts ........................................ 2-30
2-31 Force Ductility at 4 oC for ER 9 Month Aged Alon Asphalts........................................ 2-31
2-32 Force Ductility at 4 oC for SAFT Aged Valero-Oklahoma Asphalts ............................. 2-32
2-33 Ratio of Actual Ductility to Calculated Ductility (PAV* 16 hr).................................... 2-33
2-34 Ratio of the Modified Asphalt to Base Binder DSR Function (PAV* 16 hr) ................ 2-34
2-35 Ratio of the Modified Asphalt to Base Binder DSR Function Hardening Rate
(PAV* 16 hr to PAV* 32 hr) ......................................................................................... 2-35
2-36 Ratio of the DSR Function after PAV* 16 hr Aging to 10-4 MPa/s ............................... 2-36
3-1 Ductility versus DSR Function [G′/(η′/G′)] for PMAs and Base Binder......................... 3-4
3-2 G′ versus η′/G′ for PMAs and Base Binder..................................................................... 3-4
3-3 Stress versus Elongation at 4 oC for PMAs and Base Binder .......................................... 3-6
3-4 Force Ductility Measurements at 4 oC versus 10 oC for PMAs and Base Binder ........... 3-7
3-5 Force Ductility Measurements at 4 oC versus 10 oC, PG 70-22 PMA............................. 3-8
3-6 DSR Map for Blending Aged PG 70-22 with Murphy Oil.............................................. 3-9
3-7 Master Curves for Blending Aged PG 70-22 with Murphy Oil....................................... 3-9
3-8 Stress versus Elongation for Blending Aged PG 70-22 with Murphy Oil..................... 3-10
3-9 DSR Map for Blending Modified with Unmodified Binders ........................................ 3-11
3-10 Stress versus Elongation for Blending Modified with Unmodified Binders.................. 3-12
4-1 Brightness Comparison of Unaged Binders Taken at 50x Magnification with a
Constant Exposure Time .................................................................................................. 4-4
4-2 An Examination of Tire Rubber Fluorescence................................................................. 4-5
4-3 Brightness Comparison of Aged Binders Taken at 100x Magnification with a
Constant Exposure Time .................................................................................................. 4-6
xvii
LIST OF FIGURES (CONT.)
Page 4-4 The Brightness of the Alon Images in Figure 4-3 Changing with Aging ........................ 4-7
4-5 The Brightness of the Alon Images in Figure 4-3 Changing with Carbonyl Area........... 4-7
4-6 Size and Shape of Alon PG 76-22 (TRS) with Aging at 50x Magnification ................... 4-8
5-1 Selected TxDOT Districts for Collecting Cores .............................................................. 5-6
5-2 Pavement Layer Details for the MnRoad Cores............................................................... 5-6
5-3 Movement of Binder across the DSR Map, Station 1277, SH 21.................................. 5-11
5-4 MnRoad Binder Content ................................................................................................ 5-12
5-5 MnRoad Total Air Void ................................................................................................. 5-13
5-6 MnRoad Accessible Air Void ........................................................................................ 5-14
5-7 MnRoad Aging Comparison of the Surface to the Middle Layers ................................ 5-15
5-8 MnRoad Aging Comparison of the Middle to Bottom Layers....................................... 5-16
5-9 MnRoad Aging Comparison of the Surface to Bottom Layers...................................... 5-16
5-10 MnRoad Aging Path from 1st Core to 2nd Core, Plus
Recovered Binder Thin Film Aging............................................................................... 5-18
5-11 MnRoad DSR Function Hardening Rate for Unmodified Binders ................................ 5-18
5-12 MnRoad (PMA and Base Binders) Aging Comparison of the
Surface to Bottom Layers............................................................................................... 5-19
5-13 Calculated Temperature versus Time and Depth ........................................................... 5-22
5-14 Refugio, TX, Measured Temperature with Depth in Summer 1994.............................. 5-23
5-15 Refugio, TX, Temperature Amplitude versus Depth below Surface ............................. 5-23
5-16 Refugio, TX, Phase Shift versus Depth below Surface.................................................. 5-24
5-17 Refugio, TX, Calculated Summer Months Temperature History over 50 Days ............ 5-25
5-18 Refugio, TX, Calculated Temperature History over 360 Days...................................... 5-25
5-19 Refugio, TX, Calculated Carbonyl Area Growth........................................................... 5-26
5-20 Refugio, TX, Calculated DSR Function Growth ........................................................... 5-27
5-21 Depth versus DSR Function at Different Aging Times ................................................. 5-28
5-22 MnRoad Cell 3 Measured Temperature with Depth, 2005 ............................................ 5-29
xviii
LIST OF FIGURES (CONT.)
Page 5-23 MnRoad Calculated Summer Months Temperature over 50 Days ................................ 5-29
5-24 MnRoad Calculated Temperature over 360 Days .......................................................... 5-30
5-25 Effect of Temperature on MnRoad AC 120-150 Hardening Rate ................................. 5-31
5-26 Estimation of MnRoad DSR Function Hardening Kinetic Parameters at 1 atm Air...... 5-31
5-27 Calculated Estimate of Pavement Carbonyl Area Growth at 1 atm Air (SH 21 Binder,
MnRoad Temperatures).................................................................................................. 5-32
5-28 MnRoad Calculated Pavement DSR Function Growth.................................................. 5-33
5-29 Calculated and Measured Pavement DSR Function Growth ......................................... 5-33
5-30 DSR Function Hardening with Pavement Service Time in Texas and
MnRoad Pavements, Unmodified and Modified Binders .............................................. 5-38
5-31 TxDOT (Polymer Modified Asphalt) Accessible Air Voids ......................................... 5-41
5-32 TxDOT (Unmodified Asphalt) Accessible (Interconnected) Air Voids ........................ 5-41
5-33 TxDOT (Polymer Modified Asphalt) Aging Comparison of
the Surface to Bottom Layers......................................................................................... 5-43
5-34 Binder Hardening Related to Local Pavement Accessible Air Voids............................ 5-44
6-1 Aggregate Gradation Curve.............................................................................................. 6-7
6-2 Superpave Gyratory Compactor ....................................................................................... 6-8
6-3 HMAC Specimen Storage .............................................................................................. 6-10
6-4 HMAC ER Aging ........................................................................................................... 6-10
6-5 Hypothetical Pavement Structure ................................................................................... 6-11
6-6 Wilhelmy Plate Test Setup ............................................................................................. 6-12
6-7 Micro Calorimeter Test Setup ........................................................................................ 6-13
6-8 CMSE Mixture Test Protocols ....................................................................................... 6-14
6-9 ΔGf with Aging.............................................................................................................. 6-18
6-10 ΔGhLW with Aging .......................................................................................................... 6-19
6-11 ΔGhAB with Aging........................................................................................................... 6-19
6-12 MnRoad 01 RM Results at 20 ºC ................................................................................... 6-22
xix
LIST OF FIGURES (CONT.)
Page 6-13 MnRoad 02 RM Results at 20 ºC .................................................................................. 6-22
6-14 Waco RM Results at 20 ºC. ............................................................................................ 6-23
6-15 Odessa RM Results at 20 ºC .......................................................................................... 6-24
6-16 Atlanta Sandstone RM Results at 20 ºC. ........................................................................ 6-25
6-17 Atlanta Quartzite RM Results at 20 ºC .......................................................................... 6-25
6-18 MnRoad 01 and 02 DPSE versus Log N at 20 ºC .......................................................... 6-26
6-19 Waco DPSE versus Log N at 20 ºC................................................................................ 6-27
6-20 Odessa DPSE versus Log N at 20 ºC ............................................................................. 6-27
6-21 Atlanta Sandstone DPSE versus Log N at 20 ºC............................................................ 6-28
6-22 Atlanta Quartzite DPSE versus Log N at 20 ºC ............................................................. 6-29
6-23 Lab Nf versus Aging Time.............................................................................................. 6-33
7-1 DSR Function Hardening Rate for MnRoad PG 58-34.................................................... 7-6
7-2 DSR Function Hardening Rate for MnRoad PG 58-40.................................................... 7-7
7-3 DSR Function Hardening Rate for Waco......................................................................... 7-7
7-4 DSR Function Hardening Rate for Odessa....................................................................... 7-8
7-5 DSR Function Hardening Rate for Atlanta Sandstone ..................................................... 7-9
7-6 DSR Function Hardening Rate for Atlanta Quartzite....................................................... 7-9
7-7 G′ versus η′/G′ for MnRoad PG 58-34.......................................................................... 7-10
7-8 G′ versus η′/G′ for MnRoad PG 58-40.......................................................................... 7-11
7-9 G′ versus η′/G′ for Waco ............................................................................................... 7-11
7-10 G′ versus η′/G′ for Odessa ............................................................................................ 7-12
7-11 G′ versus η′/G′ for Atlanta Sandstone ........................................................................... 7-12
7-12 G′ versus η′/G′ for Atlanta Quartzite............................................................................. 7-13
7-13 Field Nf versus Aging Time........................................................................................... 7-15
7-14 Field Nf versus DSR Function ....................................................................................... 7-16
7-15 The Effect of Oxidative Aging on Estimated Pavement Service Life ........................... 7-20
xx
LIST OF FIGURES (CONT.)
Page 8-1 The Four Screening Measures for Seven PG 70-22 SBS Modified Binders (Data from
Figures 2-33 through 2-36) .............................................................................................. 8-5
8-2 The Four Screening Measures for Seven PG 76-22 SBS Modified Binders (Data from
Figures 2-33 through 2-36) .............................................................................................. 8-6
8-3 Approximate Pavement Hardening Paths, Starting at Two Initial DSR Function
Values and for Several Possible Hardening Rates (Values of K2)................................... 8-8
8-4 Example Fatigue Life Decline Due to Binder Stiffening for a Specific Mixture and
Pavement Structure ........................................................................................................ 8-10
xxi
LIST OF TABLES
Table Page 2-1 Collected PMAs and Base Materials from Suppliers....................................................... 2-2
3-1 Representative Viscosities of Each Material.................................................................... 3-2
4-1 Electron Donor and Electron Acceptor Groups ............................................................... 4-1
4-2 List of Used Materials ...................................................................................................... 4-2
5-1 Collected Cores from TxDOT and MnRoad District ....................................................... 5-5
5-2 Comparison of Measured and Calculated Pavement Hardening Rates.......................... 5-35
5-3 Calculated Binder Pavement Hardening Rates for Refugio Temperatures.................... 5-45
5-4 Comparison of Calculated Binder Pavement Hardening Rates:
Refugio, TX, versus MnRoad ........................................................................................ 5-45
5-5 Comparison of 60 °C Hardening Rates to Estimated Pavement Rates Using Refugio
Temperatures.................................................................................................................. 5-46
6-1 HMAC Mixture Matrix .................................................................................................... 6-4
6-2 Aggregate Mix Design ..................................................................................................... 6-6
6-3 HMAC Fabrication Process Temperatures ...................................................................... 6-9
6-4 Aging of HMAC Specimens ............................................................................................ 6-9
6-5 Traffic Loading Parameters and Critical Design Strains ............................................... 6-10
6-6 MnRoad 01 and 02 TS Results....................................................................................... 6-20
6-7 Waco and Odessa TS Results......................................................................................... 6-20
6-8 Atlanta Sandstone and Quartzite TS Results.................................................................. 6-21
6-9 Typical Ni Values for the HMAC Mixtures ................................................................... 6-29
6-10 Paris’ Law Fracture Coefficient (A) for HMAC Mixtures ............................................ 6-30
6-11 Paris’ Law Fracture Coefficient (n) for HMAC Mixtures ............................................. 6-30
6-12 Typical Np Values for HMAC Mixtures with Aging ..................................................... 6-31
6-13 HMAC Mixture Property Combinations for Statistical Analysis .................................. 6-32

xxii
LIST OF TABLES (CONT.)
Page http://i242.photobucket.com/albums/ff246/carolinariches/Forumheadercopy.jpg
xxiii
LIST OF ABBREVIATIONS AND SYMBOLS
ω Angular Frequency
η′ (ω) Dynamic Shear Viscosity
G′ (ω) Elastic (storage) Dynamic Shear Modulus
G"(ω) Viscous (loss) Dynamic Shear Modulus
G*(ω) Complex Dynamic Shear Modulus
G′/(η′/G′) DSR Function
rη Binder Hardening Rate
rCA Binder Oxidation Rate (Rate of Carbonyl Area Formation)
Ni Number of Load Cycles to Crack Initiation
Nf Fatigue Life or Number of Load Cycles to Fatigue Failure
Np Number of Load Cycles to Crack Propagation
RL Pavement Loading Rate
SFa Shift Factor due to Anisotropy
SFh Shift Factor due to Healing Effects
CMSE Calibrated Mechanistic with Surface Energy Measurements
TS Tensile Strength Test
RM Relaxation Modulus Test
RDT Uniaxial Repeated-Direct Tension Test
σt Tensile Strength of HMAC Mixture (psi)
εf Failure Tensile Strain at Break under Tensile Loading (in/in)
E1 HMAC Elastic Relaxation Modulus at 1 s Reduced Loading Time (psi)
m Stress Relaxation Rate of the HMAC Mixture
b Rate of Fracture Damage Accumulation under Repeated Direct-Tension Test

1-1
CHAPTER 1
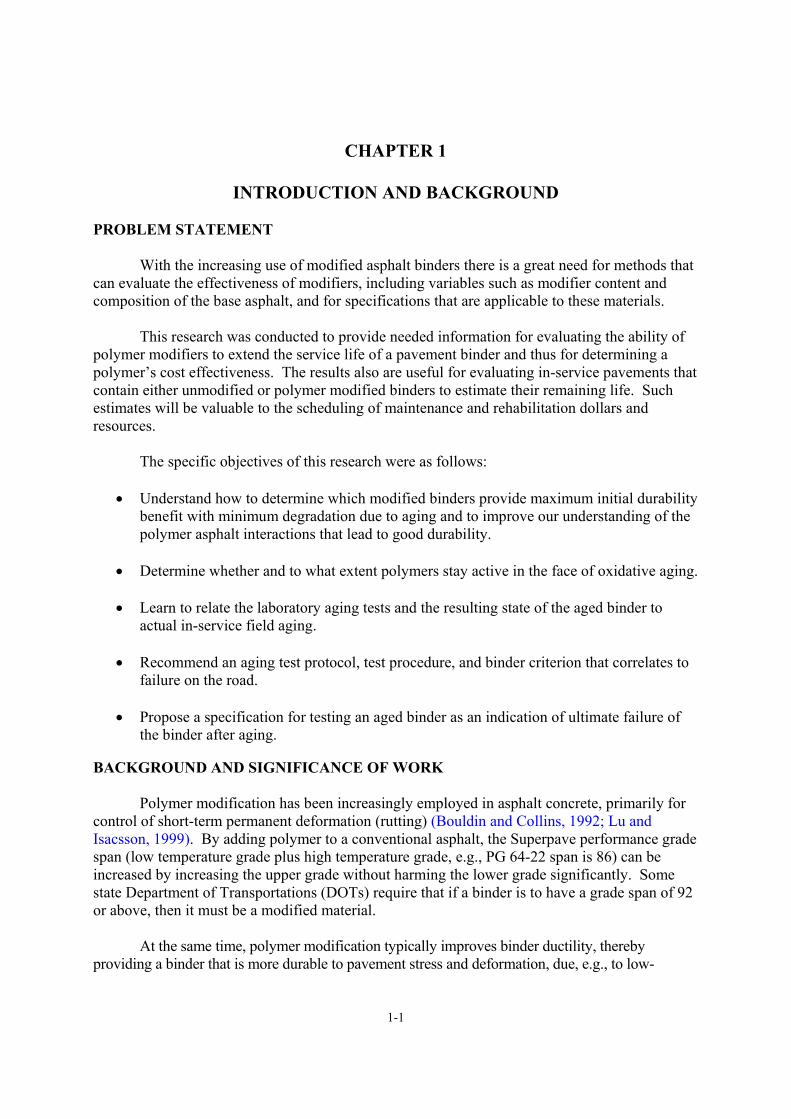
INTRODUCTION AND BACKGROUND PROBLEM STATEMENT
With the increasing use of modified asphalt binders there is a great need for methods that can evaluate the effectiveness of modifiers, including variables such as modifier content and composition of the base asphalt, and for specifications that are applicable to these materials.
This research was conducted to provide needed information for evaluating the ability of
polymer modifiers to extend the service life of a pavement binder and thus for determining a polymer’s cost effectiveness. The results also are useful for evaluating in-service pavements that contain either unmodified or polymer modified binders to estimate their remaining life. Such estimates will be valuable to the scheduling of maintenance and rehabilitation dollars and resources.
The specific objectives of this research were as follows:
• Understand how to determine which modified binders provide maximum initial durability
benefit with minimum degradation due to aging and to improve our understanding of the polymer asphalt interactions that lead to good durability.
• Determine whether and to what extent polymers stay active in the face of oxidative aging.
• Learn to relate the laboratory aging tests and the resulting state of the aged binder to
actual in-service field aging.
• Recommend an aging test protocol, test procedure, and binder criterion that correlates to failure on the road.
• Propose a specification for testing an aged binder as an indication of ultimate failure of
the binder after aging. BACKGROUND AND SIGNIFICANCE OF WORK Polymer modification has been increasingly employed in asphalt concrete, primarily for control of short-term permanent deformation (rutting) (Bouldin and Collins, 1992; Lu and Isacsson, 1999). By adding polymer to a conventional asphalt, the Superpave performance grade span (low temperature grade plus high temperature grade, e.g., PG 64-22 span is 86) can be increased by increasing the upper grade without harming the lower grade significantly. Some state Department of Transportations (DOTs) require that if a binder is to have a grade span of 92 or above, then it must be a modified material. At the same time, polymer modification typically improves binder ductility, thereby providing a binder that is more durable to pavement stress and deformation, due, e.g., to low-
1-2
temperature thermal contraction or traffic loads, including the effects of fatigue (Glover et al., 2005). Finally, there is evidence that polymer modifiers may improve the aging characteristics of a binder so that the deleterious impact of oxidative aging is delayed, leading to a more durable pavement (Glover et al., 2005). While all of these effects positively impact the durability of polymer-modified pavements, there is a need to quantify these improvements and their duration in the presence of oxidative aging. Such an improved understanding will lead to better modified binder selection and to a better cost-benefit analysis, thereby leading to more efficient use of Texas highway construction dollars. This project was designed to develop a better quantitative understanding of the relation between laboratory accelerated binder aging and field aging, a test procedure to measure a property of an aged binder that correlates to failure on the road, and a proposed specification for estimating the relative durability of binders in the presence of oxidative aging. The discussion that follows presents more details concerning fundamentals of binder oxidation and its impact on binder properties, conventional and modified asphalt binder durability, project 0-4468 on fatigue of rut-resistant mixtures, and a summary of durability issues addressed by this project. A Brief Review of Binder Oxidation and Hardening Kinetics
The issue of developing an accelerated binder aging test that ranks asphalts the same as pavement aging is challenging at best and fundamentally impossible at worst because of the different effects of time, temperature, and pressure on different materials. Equation 1-1 shows the mechanisms by which hardening occurs in the absence of diffusion resistance:
lnηt = lnηo + ∆(lnηot ) + ∆(lnη j ) + rη (time) (1-1)
where ηo is the original viscosity, ηt is the viscosity at any time, ∆(ln ηot) is the hardening in the hot-mix plant simulated by an oven test, ∆(ln ηj) is the hardening that occurs in an early rapid “initial jump” stage, and r η is the subsequent constant rate of hardening.
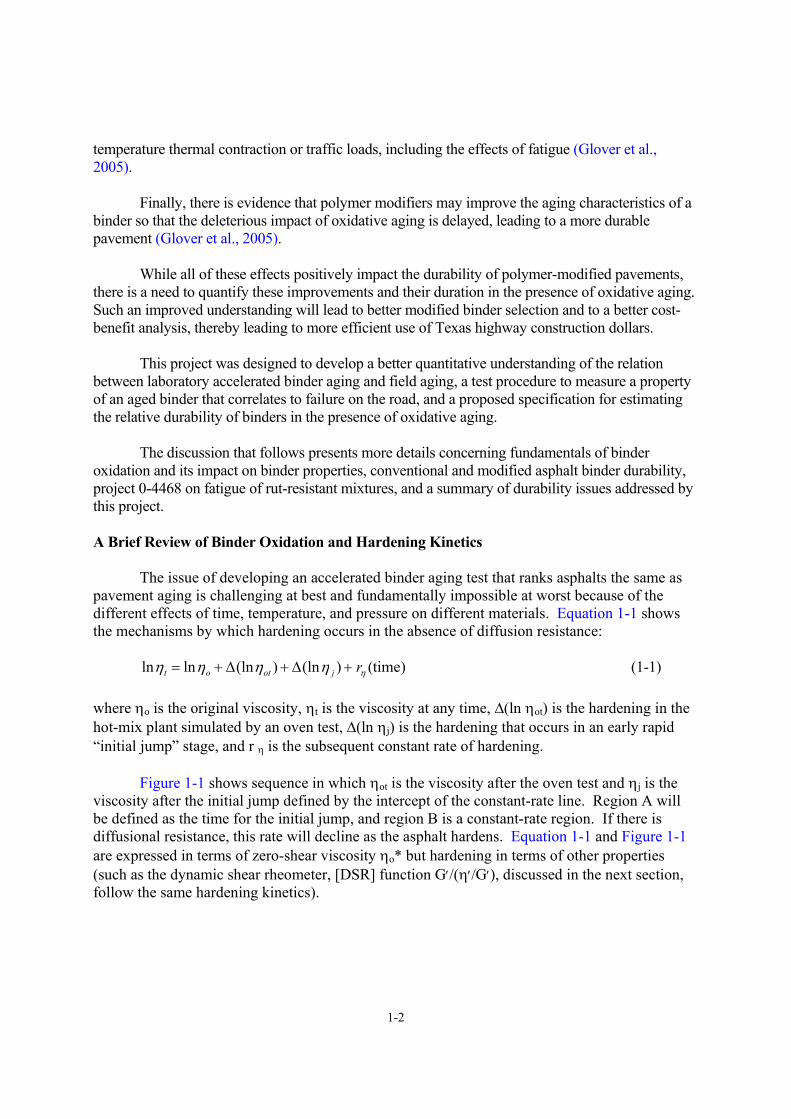
Figure 1-1 shows sequence in which ηot is the viscosity after the oven test and ηj is the viscosity after the initial jump defined by the intercept of the constant-rate line. Region A will be defined as the time for the initial jump, and region B is a constant-rate region. If there is diffusional resistance, this rate will decline as the asphalt hardens. Equation 1-1 and Figure 1-1 are expressed in terms of zero-shear viscosity ηo* but hardening in terms of other properties (such as the dynamic shear rheometer, [DSR] function G′/(η′/G′), discussed in the next section, follow the same hardening kinetics).
1-3
Figure 1-1. Typical Hardening Response of an Unmodified Asphalt Binder to Oxidation.
Asphalt oxidative hardening is almost entirely caused by asphaltene formation (Lin et al.,
1995, 1996, and 1998), and the rate can be expressed as follows:
ttr
∂∂
∂∂
∂∂
=∂
∂=
CACAAS
ASlnln
••ηη
η (1-2)
where ∂ ln η/∂AS is the impact of asphaltene (AS) increase on increasing viscosity and is affected by asphaltene size, which in turn is affected by maltene solvent power. ∂AS/∂CA is the extent to which increases in carbonyl area (CA) produce asphaltenes, and ∂CA/∂t is the rate of CA formation. The increase of CA correlates linearly with oxidation (Liu et al., 1998a).
Equation 1-2 can be simplified as:
rη = HS • rCA (1-3)
where HS is the combination of the first two terms in Equation 1-2. This combination is remarkably constant as oxidation proceeds and is independent of oxidation temperature below about 100 to 110 °C. It has a characteristic value for each asphalt except that it is pressure dependent. This term is called the hardening susceptibility (Lau et al., 1992; Domke et al., 1999).
The rate of carbonyl formation is (Lin et al., 1996; Lin et al., 1998; Liu et al., 1997):
1-4
RTEeAPt
r /CA
CA −=∂
∂= α (1-4)
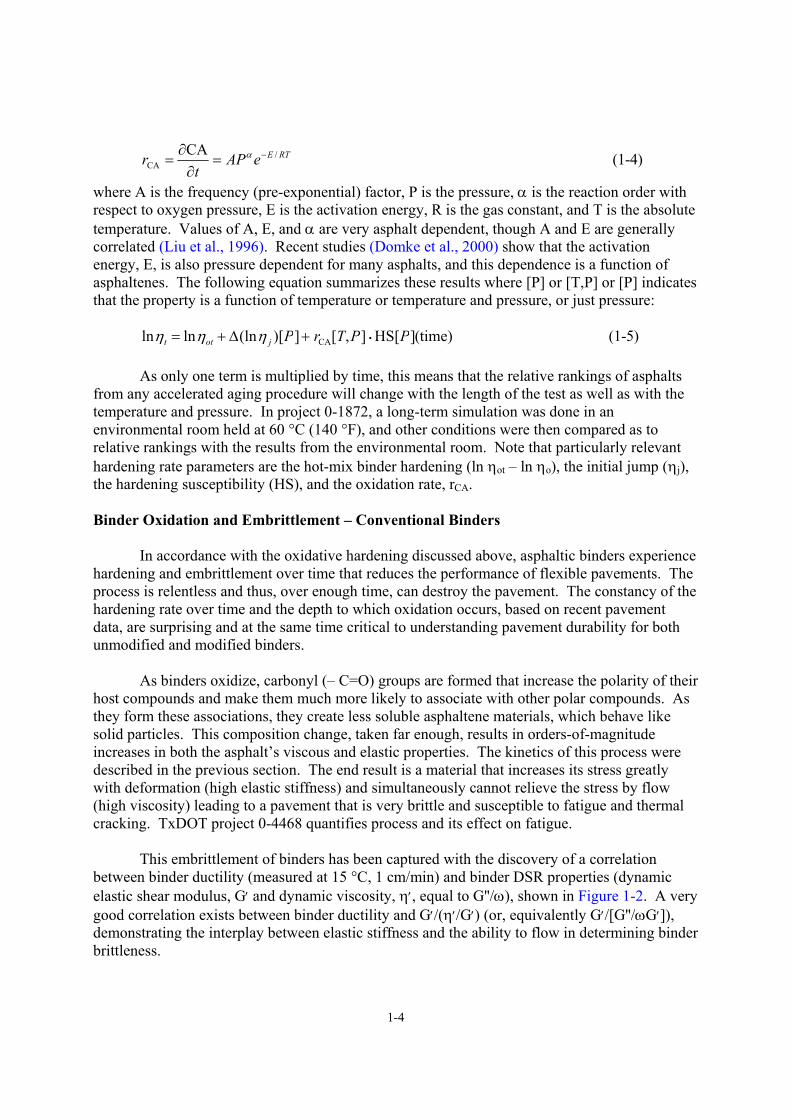
where A is the frequency (pre-exponential) factor, P is the pressure, α is the reaction order with respect to oxygen pressure, E is the activation energy, R is the gas constant, and T is the absolute temperature. Values of A, E, and α are very asphalt dependent, though A and E are generally correlated (Liu et al., 1996). Recent studies (Domke et al., 2000) show that the activation energy, E, is also pressure dependent for many asphalts, and this dependence is a function of asphaltenes. The following equation summarizes these results where [P] or [T,P] or [P] indicates that the property is a function of temperature or temperature and pressure, or just pressure:
lnηt = lnηot + ∆(lnη j )[P]+ rCA[T,P] • HS[P](time) (1-5)
As only one term is multiplied by time, this means that the relative rankings of asphalts from any accelerated aging procedure will change with the length of the test as well as with the temperature and pressure. In project 0-1872, a long-term simulation was done in an environmental room held at 60 °C (140 °F), and other conditions were then compared as to relative rankings with the results from the environmental room. Note that particularly relevant hardening rate parameters are the hot-mix binder hardening (ln ηot – ln ηo), the initial jump (ηj), the hardening susceptibility (HS), and the oxidation rate, rCA. Binder Oxidation and Embrittlement – Conventional Binders
In accordance with the oxidative hardening discussed above, asphaltic binders experience hardening and embrittlement over time that reduces the performance of flexible pavements. The process is relentless and thus, over enough time, can destroy the pavement. The constancy of the hardening rate over time and the depth to which oxidation occurs, based on recent pavement data, are surprising and at the same time critical to understanding pavement durability for both unmodified and modified binders.
As binders oxidize, carbonyl (– C=O) groups are formed that increase the polarity of their
host compounds and make them much more likely to associate with other polar compounds. As they form these associations, they create less soluble asphaltene materials, which behave like solid particles. This composition change, taken far enough, results in orders-of-magnitude increases in both the asphalt’s viscous and elastic properties. The kinetics of this process were described in the previous section. The end result is a material that increases its stress greatly with deformation (high elastic stiffness) and simultaneously cannot relieve the stress by flow (high viscosity) leading to a pavement that is very brittle and susceptible to fatigue and thermal cracking. TxDOT project 0-4468 quantifies process and its effect on fatigue.
This embrittlement of binders has been captured with the discovery of a correlation between binder ductility (measured at 15 °C, 1 cm/min) and binder DSR properties (dynamic elastic shear modulus, G′ and dynamic viscosity, η′, equal to G''/ω), shown in Figure 1-2. A very good correlation exists between binder ductility and G′/(η′/G′) (or, equivalently G′/[G''/ωG′]), demonstrating the interplay between elastic stiffness and the ability to flow in determining binder brittleness.
1-5
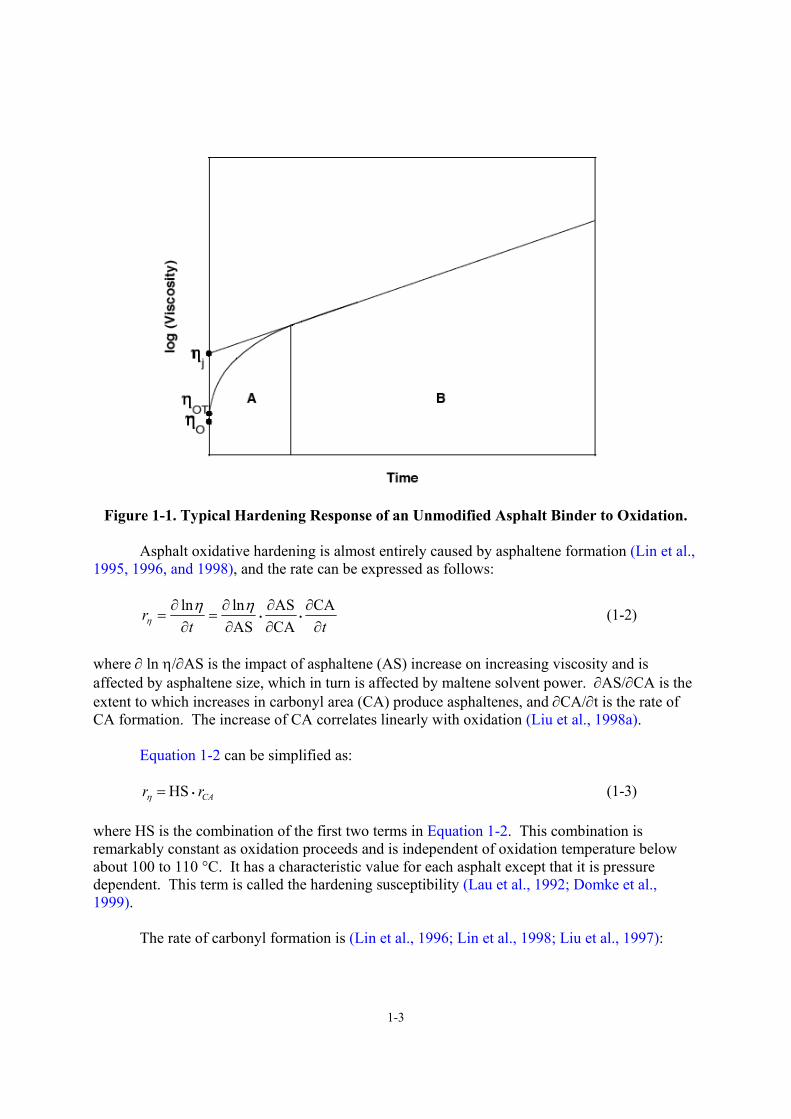
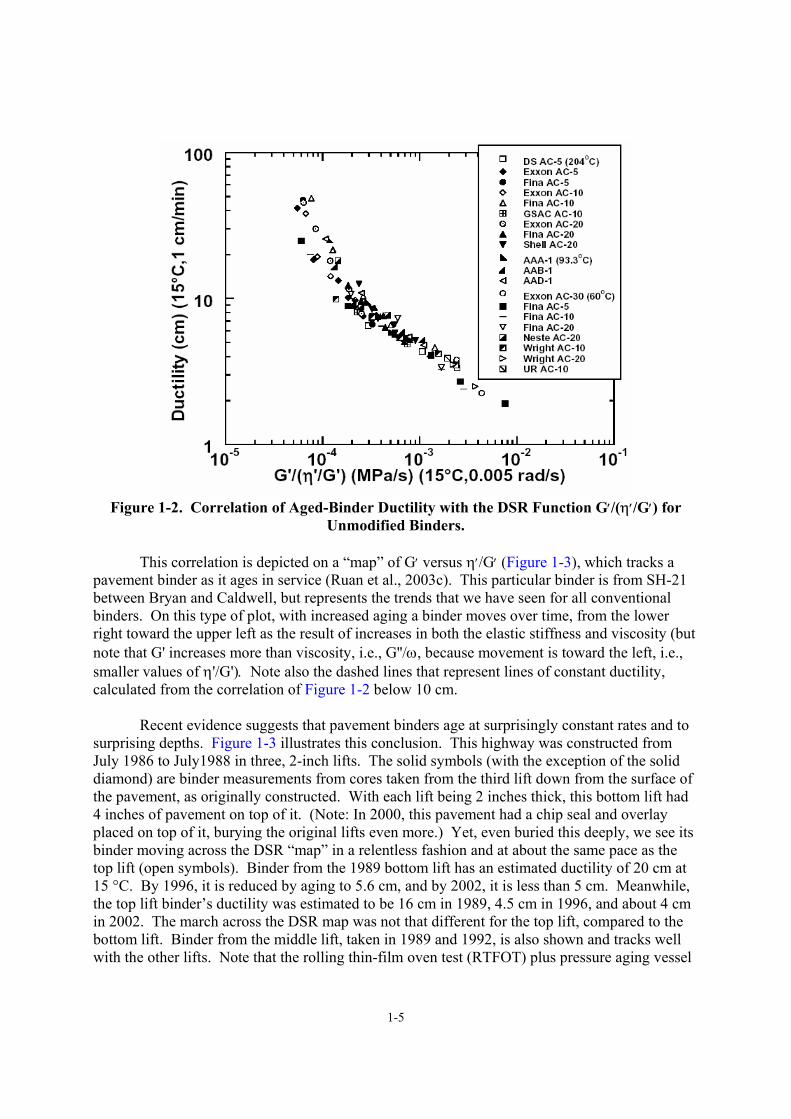
Figure 1-2. Correlation of Aged-Binder Ductility with the DSR Function G′/(η′/G′) for
Unmodified Binders.
This correlation is depicted on a “map” of G′ versus η′/G′ (Figure 1-3), which tracks a pavement binder as it ages in service (Ruan et al., 2003c). This particular binder is from SH-21 between Bryan and Caldwell, but represents the trends that we have seen for all conventional binders. On this type of plot, with increased aging a binder moves over time, from the lower right toward the upper left as the result of increases in both the elastic stiffness and viscosity (but note that G' increases more than viscosity, i.e., G''/ω, because movement is toward the left, i.e., smaller values of η'/G'). Note also the dashed lines that represent lines of constant ductility, calculated from the correlation of Figure 1-2 below 10 cm.
Recent evidence suggests that pavement binders age at surprisingly constant rates and to
surprising depths. Figure 1-3 illustrates this conclusion. This highway was constructed from July 1986 to July1988 in three, 2-inch lifts. The solid symbols (with the exception of the solid diamond) are binder measurements from cores taken from the third lift down from the surface of the pavement, as originally constructed. With each lift being 2 inches thick, this bottom lift had 4 inches of pavement on top of it. (Note: In 2000, this pavement had a chip seal and overlay placed on top of it, burying the original lifts even more.) Yet, even buried this deeply, we see its binder moving across the DSR “map” in a relentless fashion and at about the same pace as the top lift (open symbols). Binder from the 1989 bottom lift has an estimated ductility of 20 cm at 15 °C. By 1996, it is reduced by aging to 5.6 cm, and by 2002, it is less than 5 cm. Meanwhile, the top lift binder’s ductility was estimated to be 16 cm in 1989, 4.5 cm in 1996, and about 4 cm in 2002. The march across the DSR map was not that different for the top lift, compared to the bottom lift. Binder from the middle lift, taken in 1989 and 1992, is also shown and tracks well with the other lifts. Note that the rolling thin-film oven test (RTFOT) plus pressure aging vessel
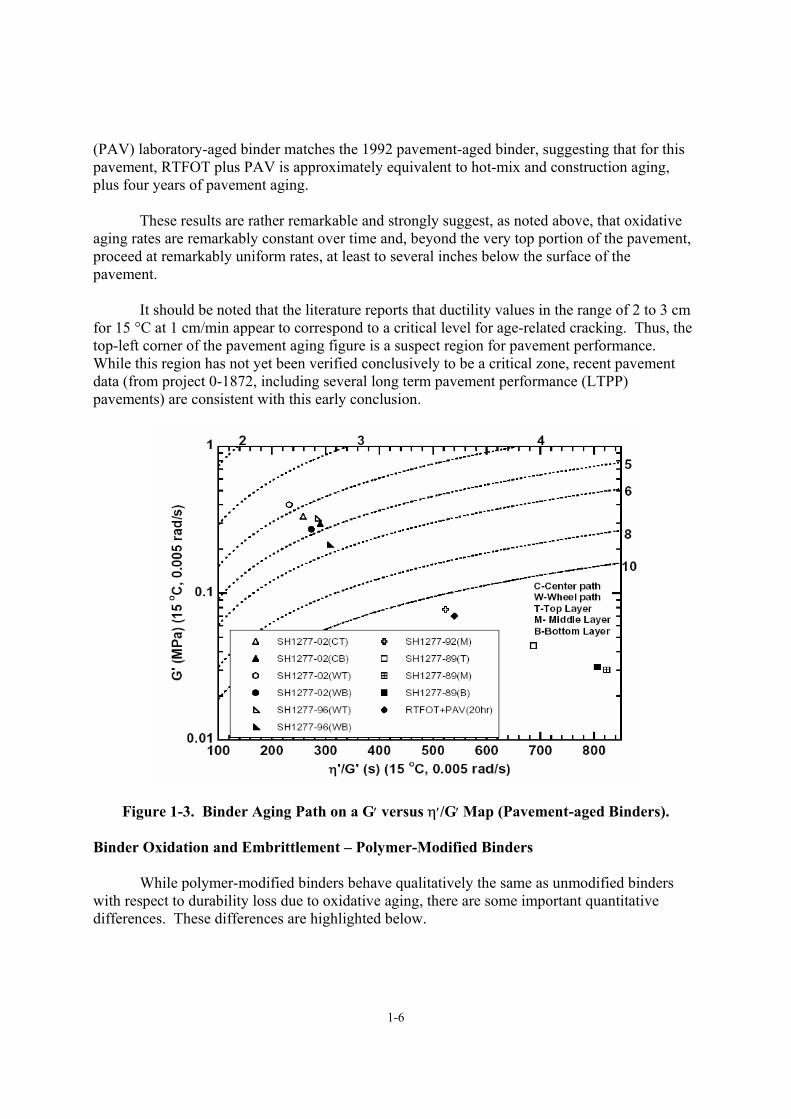
1-6
(PAV) laboratory-aged binder matches the 1992 pavement-aged binder, suggesting that for this pavement, RTFOT plus PAV is approximately equivalent to hot-mix and construction aging, plus four years of pavement aging.
These results are rather remarkable and strongly suggest, as noted above, that oxidative
aging rates are remarkably constant over time and, beyond the very top portion of the pavement, proceed at remarkably uniform rates, at least to several inches below the surface of the pavement.
It should be noted that the literature reports that ductility values in the range of 2 to 3 cm
for 15 °C at 1 cm/min appear to correspond to a critical level for age-related cracking. Thus, the top-left corner of the pavement aging figure is a suspect region for pavement performance. While this region has not yet been verified conclusively to be a critical zone, recent pavement data (from project 0-1872, including several long term pavement performance (LTPP) pavements) are consistent with this early conclusion.
Figure 1-3. Binder Aging Path on a G′ versus η′/G′ Map (Pavement-aged Binders). Binder Oxidation and Embrittlement – Polymer-Modified Binders
While polymer-modified binders behave qualitatively the same as unmodified binders with respect to durability loss due to oxidative aging, there are some important quantitative differences. These differences are highlighted below.
1-7
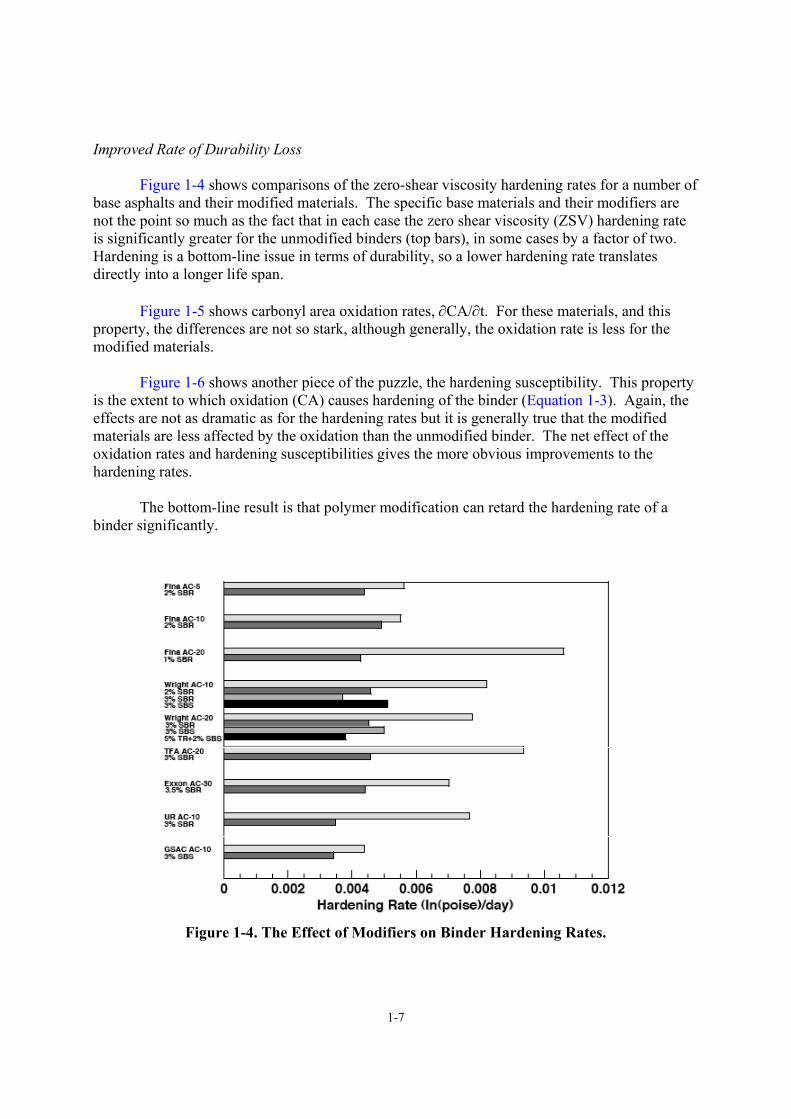
Improved Rate of Durability Loss
Figure 1-4 shows comparisons of the zero-shear viscosity hardening rates for a number of base asphalts and their modified materials. The specific base materials and their modifiers are not the point so much as the fact that in each case the zero shear viscosity (ZSV) hardening rate is significantly greater for the unmodified binders (top bars), in some cases by a factor of two. Hardening is a bottom-line issue in terms of durability, so a lower hardening rate translates directly into a longer life span.
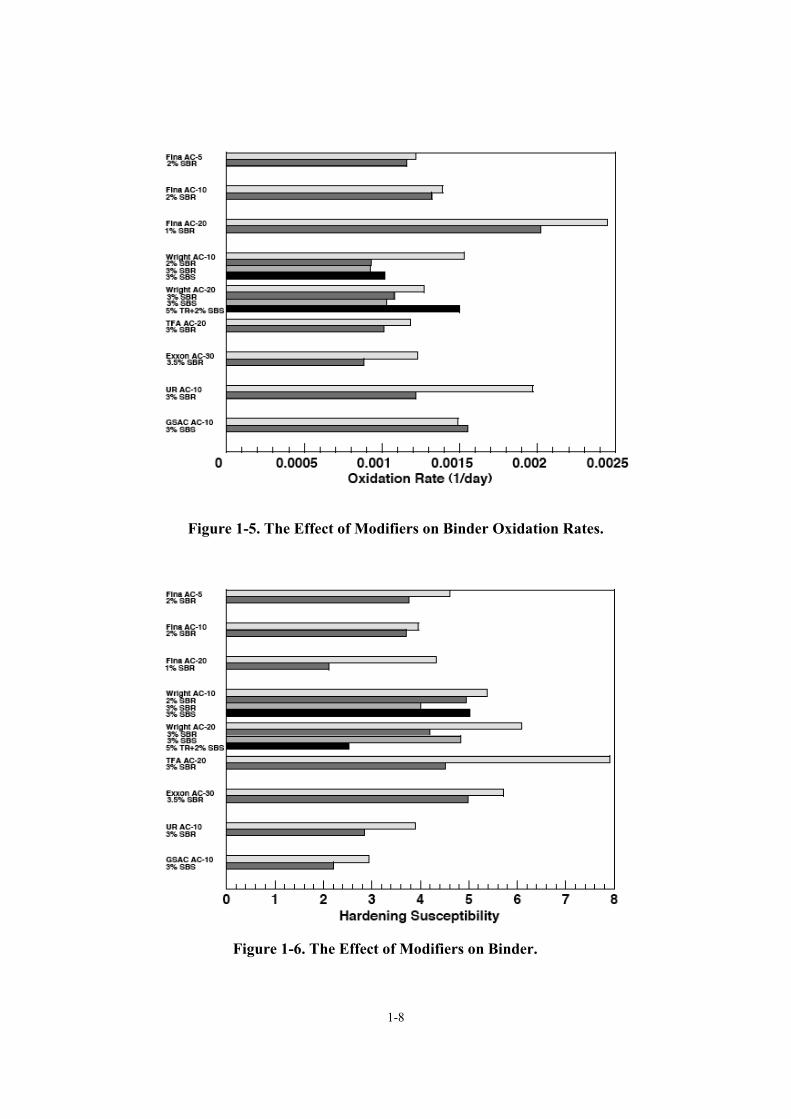
Figure 1-5 shows carbonyl area oxidation rates, ∂CA/∂t. For these materials, and this
property, the differences are not so stark, although generally, the oxidation rate is less for the modified materials.
Figure 1-6 shows another piece of the puzzle, the hardening susceptibility. This property
is the extent to which oxidation (CA) causes hardening of the binder (Equation 1-3). Again, the effects are not as dramatic as for the hardening rates but it is generally true that the modified materials are less affected by the oxidation than the unmodified binder. The net effect of the oxidation rates and hardening susceptibilities gives the more obvious improvements to the hardening rates.
The bottom-line result is that polymer modification can retard the hardening rate of a
binder significantly.
Figure 1-4. The Effect of Modifiers on Binder Hardening Rates.
1-8
Figure 1-5. The Effect of Modifiers on Binder Oxidation Rates.
Figure 1-6. The Effect of Modifiers on Binder.
1-9
Improved Durability
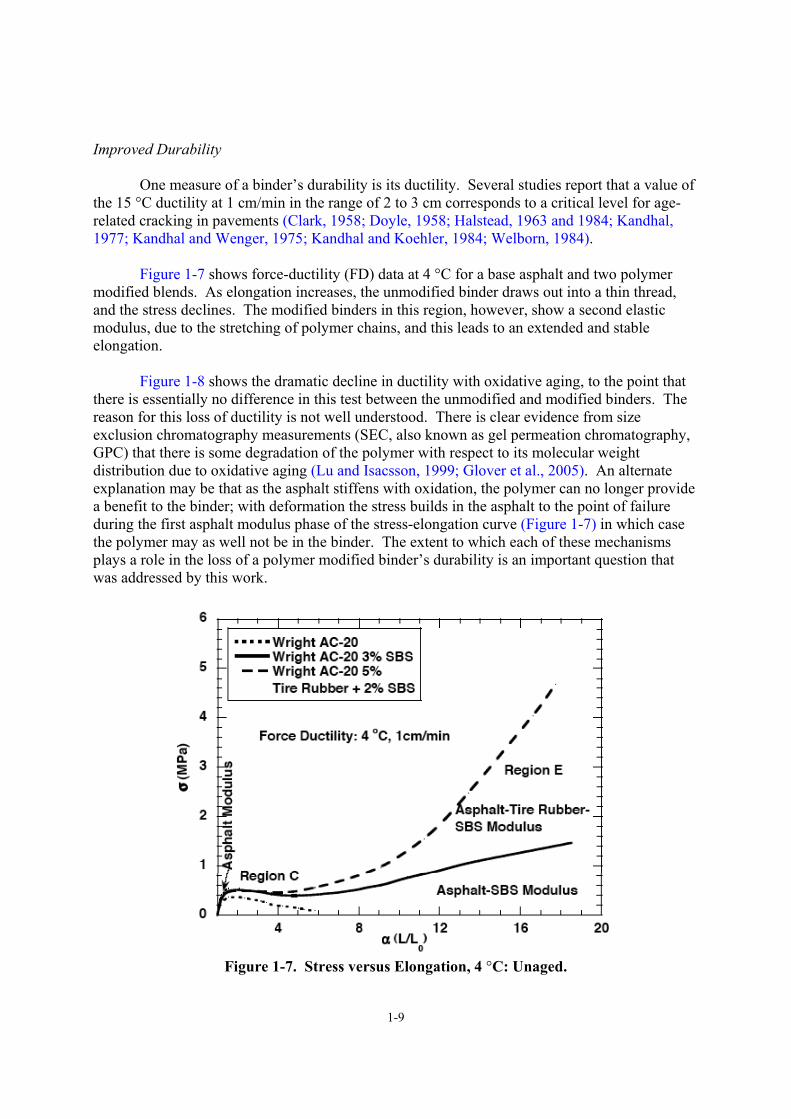
One measure of a binder’s durability is its ductility. Several studies report that a value of the 15 °C ductility at 1 cm/min in the range of 2 to 3 cm corresponds to a critical level for age-related cracking in pavements (Clark, 1958; Doyle, 1958; Halstead, 1963 and 1984; Kandhal, 1977; Kandhal and Wenger, 1975; Kandhal and Koehler, 1984; Welborn, 1984).
Figure 1-7 shows force-ductility (FD) data at 4 °C for a base asphalt and two polymer
modified blends. As elongation increases, the unmodified binder draws out into a thin thread, and the stress declines. The modified binders in this region, however, show a second elastic modulus, due to the stretching of polymer chains, and this leads to an extended and stable elongation.
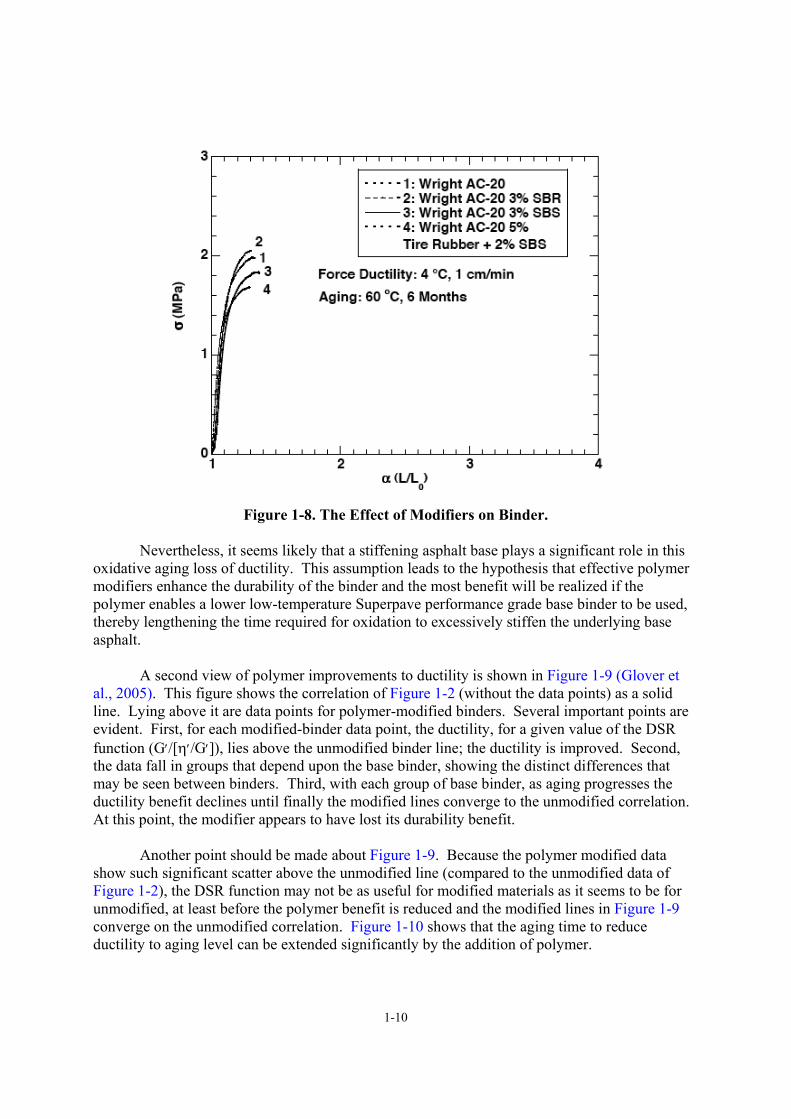
Figure 1-8 shows the dramatic decline in ductility with oxidative aging, to the point that
there is essentially no difference in this test between the unmodified and modified binders. The reason for this loss of ductility is not well understood. There is clear evidence from size exclusion chromatography measurements (SEC, also known as gel permeation chromatography, GPC) that there is some degradation of the polymer with respect to its molecular weight distribution due to oxidative aging (Lu and Isacsson, 1999; Glover et al., 2005). An alternate explanation may be that as the asphalt stiffens with oxidation, the polymer can no longer provide a benefit to the binder; with deformation the stress builds in the asphalt to the point of failure during the first asphalt modulus phase of the stress-elongation curve (Figure 1-7) in which case the polymer may as well not be in the binder. The extent to which each of these mechanisms plays a role in the loss of a polymer modified binder’s durability is an important question that was addressed by this work.
Figure 1-7. Stress versus Elongation, 4 °C: Unaged.
1-10
Figure 1-8. The Effect of Modifiers on Binder.
Nevertheless, it seems likely that a stiffening asphalt base plays a significant role in this oxidative aging loss of ductility. This assumption leads to the hypothesis that effective polymer modifiers enhance the durability of the binder and the most benefit will be realized if the polymer enables a lower low-temperature Superpave performance grade base binder to be used, thereby lengthening the time required for oxidation to excessively stiffen the underlying base asphalt.
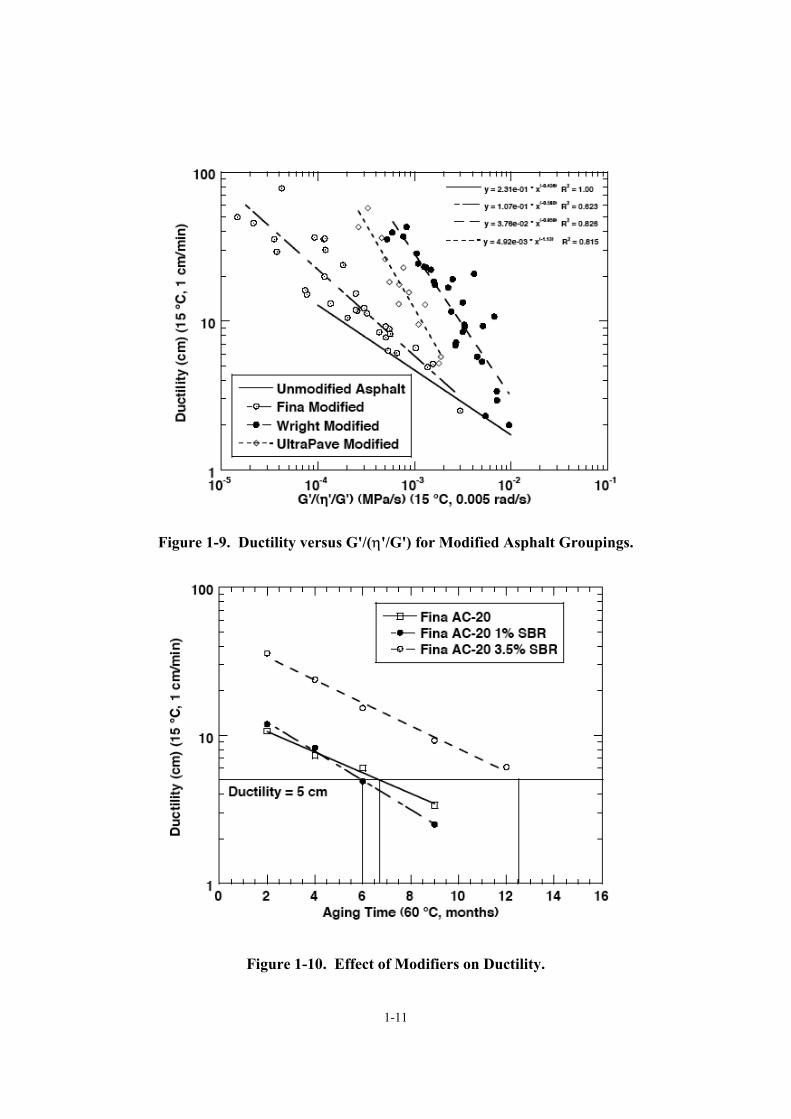
A second view of polymer improvements to ductility is shown in Figure 1-9 (Glover et al., 2005). This figure shows the correlation of Figure 1-2 (without the data points) as a solid line. Lying above it are data points for polymer-modified binders. Several important points are evident. First, for each modified-binder data point, the ductility, for a given value of the DSR function (G′/[η′/G′]), lies above the unmodified binder line; the ductility is improved. Second, the data fall in groups that depend upon the base binder, showing the distinct differences that may be seen between binders. Third, with each group of base binder, as aging progresses the ductility benefit declines until finally the modified lines converge to the unmodified correlation. At this point, the modifier appears to have lost its durability benefit.
Another point should be made about Figure 1-9. Because the polymer modified data
show such significant scatter above the unmodified line (compared to the unmodified data of Figure 1-2), the DSR function may not be as useful for modified materials as it seems to be for unmodified, at least before the polymer benefit is reduced and the modified lines in Figure 1-9 converge on the unmodified correlation. Figure 1-10 shows that the aging time to reduce ductility to aging level can be extended significantly by the addition of polymer.
1-11
Figure 1-9. Ductility versus G'/(η'/G') for Modified Asphalt Groupings.
Figure 1-10. Effect of Modifiers on Ductility.
1-12
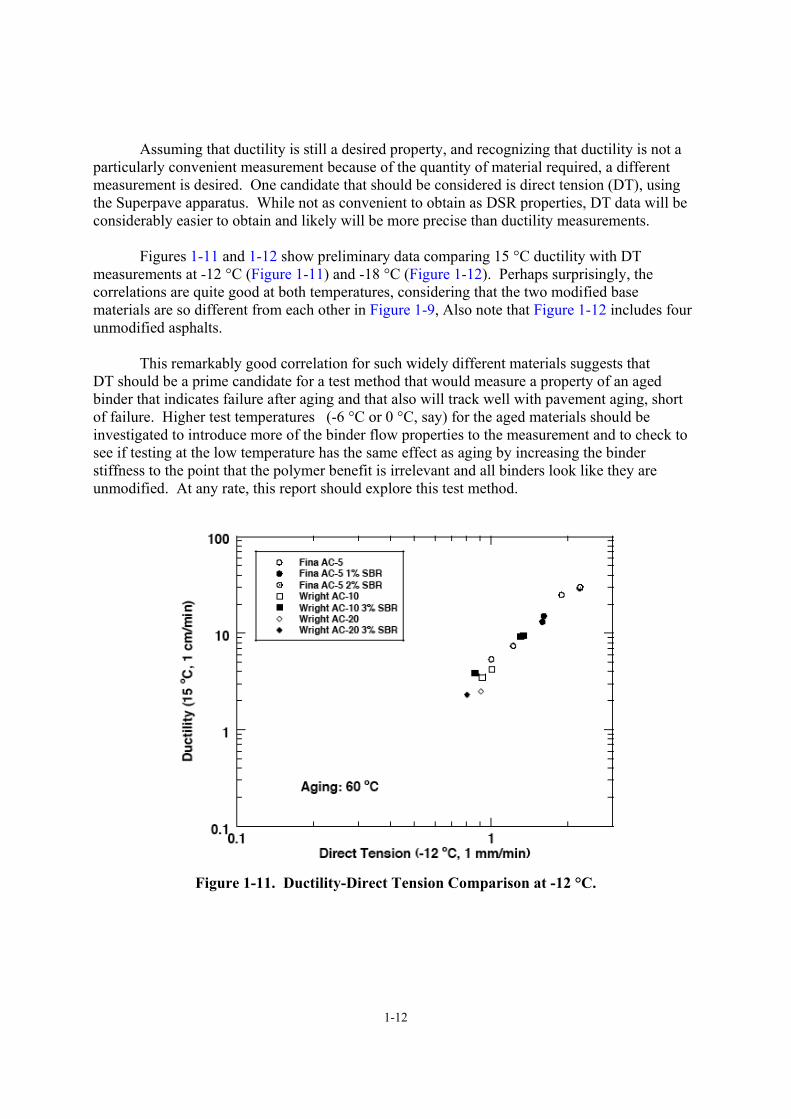
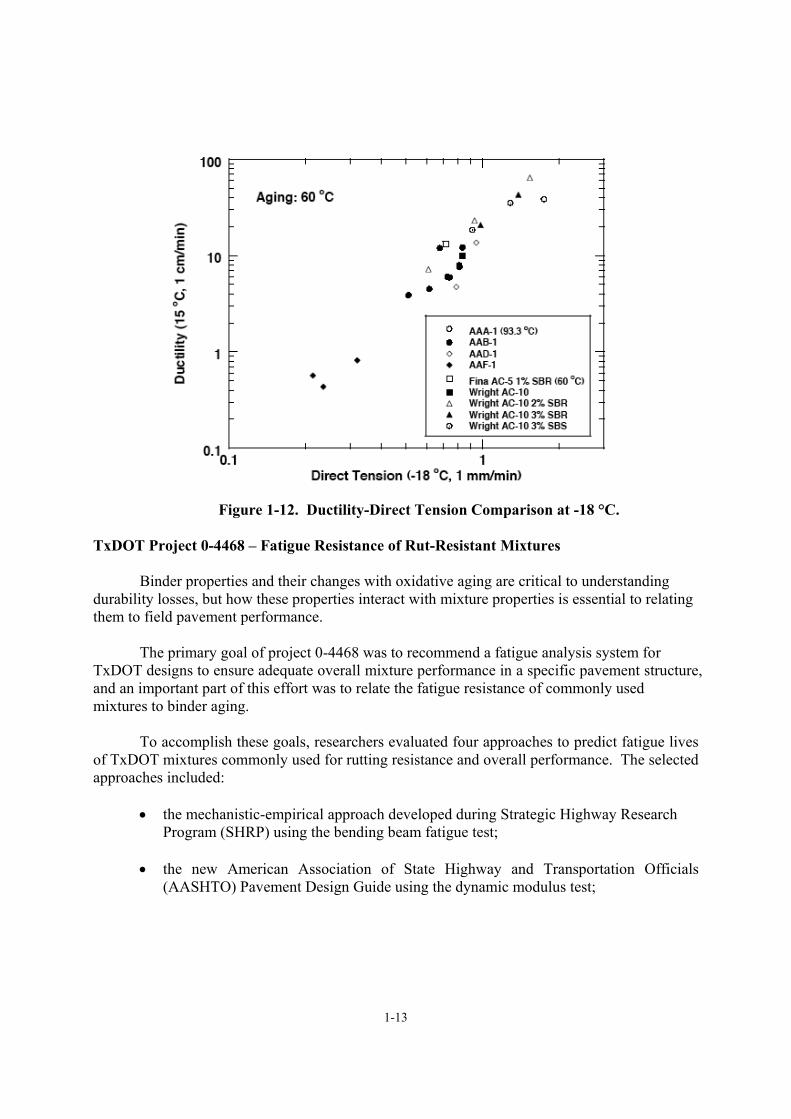
Assuming that ductility is still a desired property, and recognizing that ductility is not a particularly convenient measurement because of the quantity of material required, a different measurement is desired. One candidate that should be considered is direct tension (DT), using the Superpave apparatus. While not as convenient to obtain as DSR properties, DT data will be considerably easier to obtain and likely will be more precise than ductility measurements. Figures 1-11 and 1-12 show preliminary data comparing 15 °C ductility with DT measurements at -12 °C (Figure 1-11) and -18 °C (Figure 1-12). Perhaps surprisingly, the correlations are quite good at both temperatures, considering that the two modified base materials are so different from each other in Figure 1-9, Also note that Figure 1-12 includes four unmodified asphalts. This remarkably good correlation for such widely different materials suggests that DT should be a prime candidate for a test method that would measure a property of an aged binder that indicates failure after aging and that also will track well with pavement aging, short of failure. Higher test temperatures (-6 °C or 0 °C, say) for the aged materials should be investigated to introduce more of the binder flow properties to the measurement and to check to see if testing at the low temperature has the same effect as aging by increasing the binder stiffness to the point that the polymer benefit is irrelevant and all binders look like they are unmodified. At any rate, this report should explore this test method.
Figure 1-11. Ductility-Direct Tension Comparison at -12 °C.
1-13
Figure 1-12. Ductility-Direct Tension Comparison at -18 °C.
TxDOT Project 0-4468 – Fatigue Resistance of Rut-Resistant Mixtures
Binder properties and their changes with oxidative aging are critical to understanding durability losses, but how these properties interact with mixture properties is essential to relating them to field pavement performance.
The primary goal of project 0-4468 was to recommend a fatigue analysis system for
TxDOT designs to ensure adequate overall mixture performance in a specific pavement structure, and an important part of this effort was to relate the fatigue resistance of commonly used mixtures to binder aging.
To accomplish these goals, researchers evaluated four approaches to predict fatigue lives
of TxDOT mixtures commonly used for rutting resistance and overall performance. The selected approaches included:
• the mechanistic-empirical approach developed during Strategic Highway Research
Program (SHRP) using the bending beam fatigue test; • the new American Association of State Highway and Transportation Officials
(AASHTO) Pavement Design Guide using the dynamic modulus test;
1-14
• a calibrated mechanistic approach developed at Texas A&M that requires creep,
strength, and repeated tests in uniaxial tension and creep tests in uniaxial compression for material characterization and monitoring dissipated pseudo strain energy; and
• an updated calibrated mechanistic approach developed at Texas A&M that also
requires measuring surface energies of component materials in addition to the material characterization tests from the original calibrated mechanistic approach.
The CMSE approach (or the simpler CM approach) for fatigue analysis was
recommended by TxDOT report 0-4688-3 (Walubita et al., 2006b).
Laboratory data from project 0-4468 verified that there is a dramatic decrease in fatigue life that results from binder aging for both unmodified and modified binders. Calibrated mechanistic mixture data showed up to an order of magnitude decrease in laboratory fatigue life caused by six months compacted mixture aging at 60 °C. A decrease by a factor of four was observed for the modified binder mix design that was studied. Furthermore, a cumulative damage calculation, assuming controlled-strain loading of the pavement, showed a very dramatic decrease in pavement life caused by binder hardening due to oxidation.
In summary, the work of project 0-4468 provides an important basis for relating binder
aging to pavement fatigue and durability. SUMMARY OF DURABILITY ISSUES From the above discussions the following polymer-modified binder durability issues have been identified:
• hardening improvement by modifiers, including hardening rate (both zero shear viscosity [ZSV] and DSR function);
• the benefits of using a lower low-temperature performance grade asphalt;
• the ability of a modifier to improve the binder failure stress (higher failure stress means a
higher failure strain);
• the role of the base binder composition in achieving improved durability;
• the extent to which durability loss with oxidative aging is due to polymer degradation versus base binder stiffening;
• the life extension of a binder provided by the polymer durability enhancement;
• relation between laboratory and field aging rates; and
• the impact of binder aging on mixture and pavement durability.
1-15
OUTLINE OF THE REPORT
Chapter 2 presents measurements of characteristics of polymer-modified asphalts (PMA) that are believed to impact binder durability, including the initial characteristics of binders, and how oxidative aging impacts binder characteristics. This chapter is an essential element to developing a durability test and specification. Actual commercial modified products and their base asphalts were studied.
Chapter 3 presents studies of the specific issue of the extent to which polymer
effectiveness is lost due to binder oxidation and whether this loss is due to base binder stiffening or polymer degradation.
Chapter 4 presents a brief study of polymer phase behavior in the polymer modified
asphalt. Chapter 5 is an extensive study of modified and unmodified binder oxidation and
hardening in pavements. Included are measurements of binder hardening over time, and at various pavement depths, as a function of accessible (or interconnected) air voids. From the data, a pavement aging model is proposed that includes daily and annual temperature variations. Data from 16 Texas pavements in 11 districts, plus the MnRoad test site in Minnesota are included.
Chapters 6 and 7 present studies of laboratory compacted mixture versus neat-film binder
aging, and of the effect of binder aging on mixture fatigue. Chapter 6 presents the mixture and fatigue life measurements and calculations, while Chapter 7 addresses the binder hardening issues and the impact of binder hardening on fatigue life.
Chapter 8 presents the proposed polymer modified binder durability aging protocol,
binder test and comparison procedures, and durability specification. Finally, Chapter 9 provides an executive summary of the report.

2-1
CHAPTER 2
DURABILITY EFFECTIVENESS OF SELECTED POLYMER-ASPHALT SYSTEMS
INTRODUCTION
The key to understanding the durability of PMA in pavements is to understand their fundamental properties and the changes that occur to these properties due to oxidative aging in service. In particular, the physical properties of the binder (i.e., its rheological stiffness), the role of the polymer in establishing these properties, and the manner and rate at which these properties change due to oxidation all are critically important. Furthermore, these properties are specific to each polymer-modified system and thus vary according to the base binder, the modifier, and the relative amounts of the two.
Thus the role of this chapter is to study the rheological properties and aging
characteristics of a number of polymer-modified asphalt systems used in Texas. As such, this project includes determining the characteristics of the base binders in these systems together with a number of modified systems created from these base binders. The base binders are primarily PG 64-22 asphalts, but also include one PG 58-28. The modified binders include materials up to a PG 76-22 and incorporate styrene-butadiene styrene (SBS), styrene-butadiene rubber (SBR), and tire rubber as modifiers.
These properties lay the foundation for understanding the oxidative aging and
performance of PMA in pavements in Texas that is documented in Chapter 5, the impact of oxidative aging on laboratory compacted mixtures (Chapters 6 and 7), and finally the PMA assessment procedure that is proposed in Chapter 8.
RESEARCH OBJECTIVES
The objectives of the work presented in this chapter were to determine the principal characteristics of polymer-modified asphalts and their base asphalts that are typically used in Texas. The characteristics evaluated in this project include binder DSR properties (master curves and the DSR function as it is defined below), infrared measurements to determine carbonyl area (which indicates binder oxidation), size exclusion chromatography to assess the level and nature of the polymer modification, and the residual presence of solvent from the extraction and recovery of binders from aggregate. Changes to all of these properties that result from oxidation (carried out by a number of means including 60 °C environmental room aging, high pressure and temperature accelerated aging, the standard PAV aging method, and a surrogate for RTFOT aging, the SAFT method) were investigated. Other rheological data included the measurement of binder ductility and force ductility values. Compositional measurements included the Corbett analysis of saturates, naphthene aromatics, polar aromatics, and asphaltenes at different levels of aging.
Chapters 3 and 4 address additional issues related to the properties of polymer-modified asphalts. Chapter 3 addresses the effectiveness of a polymer modifier after aging, and Chapter 4 addresses an investigation of polymer modified and unmodified asphalt using imaging.
2-2
METHODOLOGY Materials
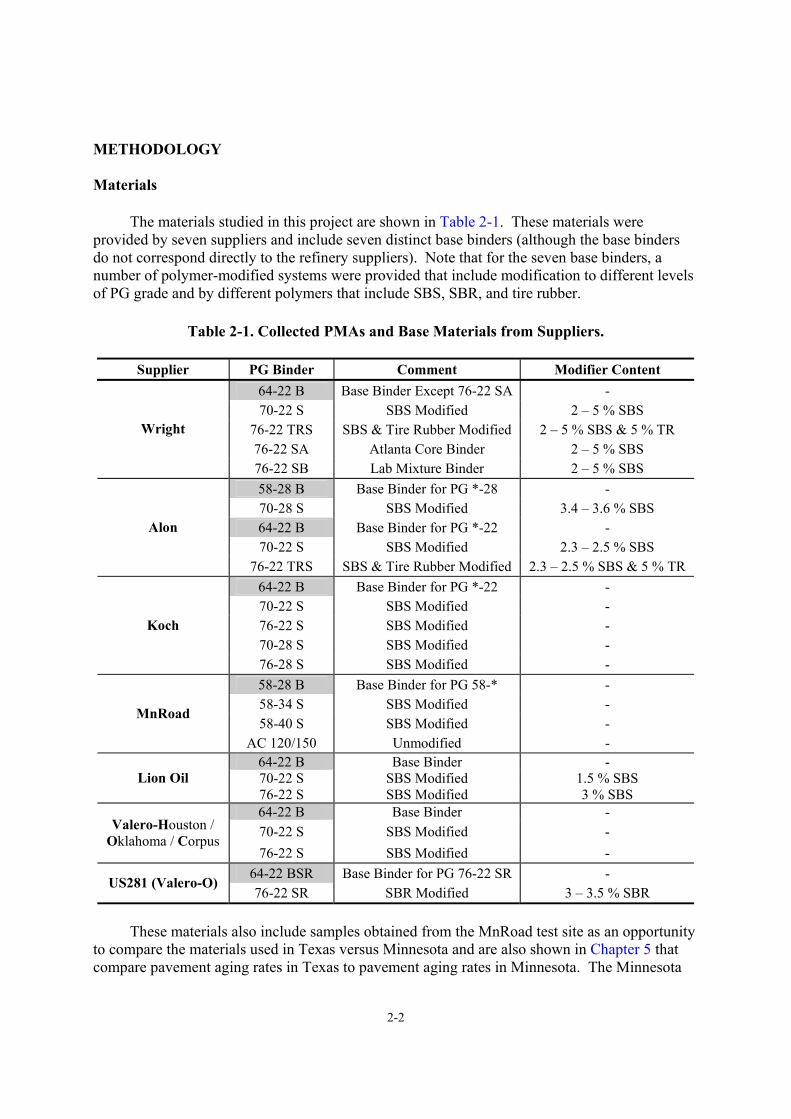
The materials studied in this project are shown in Table 2-1. These materials were
provided by seven suppliers and include seven distinct base binders (although the base binders do not correspond directly to the refinery suppliers). Note that for the seven base binders, a number of polymer-modified systems were provided that include modification to different levels of PG grade and by different polymers that include SBS, SBR, and tire rubber.
Table 2-1. Collected PMAs and Base Materials from Suppliers.
Supplier PG Binder Comment Modifier Content
64-22 B Base Binder Except 76-22 SA - 70-22 S SBS Modified 2 – 5 % SBS
76-22 TRS SBS & Tire Rubber Modified 2 – 5 % SBS & 5 % TR 76-22 SA Atlanta Core Binder 2 – 5 % SBS
Wright
76-22 SB Lab Mixture Binder 2 – 5 % SBS 58-28 B Base Binder for PG *-28 - 70-28 S SBS Modified 3.4 – 3.6 % SBS 64-22 B Base Binder for PG *-22 - 70-22 S SBS Modified 2.3 – 2.5 % SBS
Alon
76-22 TRS SBS & Tire Rubber Modified 2.3 – 2.5 % SBS & 5 % TR 64-22 B Base Binder for PG *-22 - 70-22 S SBS Modified - 76-22 S SBS Modified - 70-28 S SBS Modified -
Koch
76-28 S SBS Modified - 58-28 B Base Binder for PG 58-* - 58-34 S SBS Modified - 58-40 S SBS Modified -
MnRoad
AC 120/150 Unmodified - 64-22 B Base Binder - 70-22 S SBS Modified 1.5 % SBS Lion Oil 76-22 S SBS Modified 3 % SBS 64-22 B Base Binder - 70-22 S SBS Modified - Valero-Houston /
Oklahoma / Corpus 76-22 S SBS Modified -
64-22 BSR Base Binder for PG 76-22 SR - US281 (Valero-O)
76-22 SR SBR Modified 3 – 3.5 % SBR
These materials also include samples obtained from the MnRoad test site as an opportunity to compare the materials used in Texas versus Minnesota and are also shown in Chapter 5 that compare pavement aging rates in Texas to pavement aging rates in Minnesota. The Minnesota
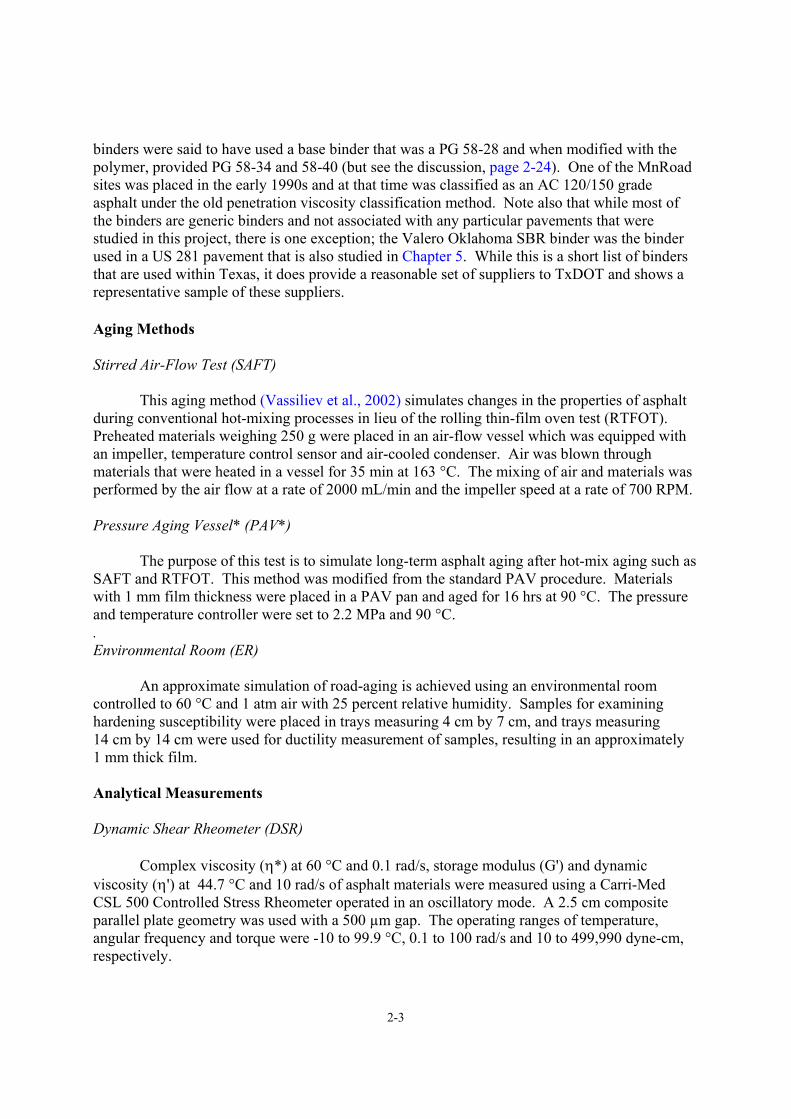
2-3
binders were said to have used a base binder that was a PG 58-28 and when modified with the polymer, provided PG 58-34 and 58-40 (but see the discussion, page 2-24). One of the MnRoad sites was placed in the early 1990s and at that time was classified as an AC 120/150 grade asphalt under the old penetration viscosity classification method. Note also that while most of the binders are generic binders and not associated with any particular pavements that were studied in this project, there is one exception; the Valero Oklahoma SBR binder was the binder used in a US 281 pavement that is also studied in Chapter 5. While this is a short list of binders that are used within Texas, it does provide a reasonable set of suppliers to TxDOT and shows a representative sample of these suppliers. Aging Methods Stirred Air-Flow Test (SAFT)
This aging method (Vassiliev et al., 2002) simulates changes in the properties of asphalt during conventional hot-mixing processes in lieu of the rolling thin-film oven test (RTFOT). Preheated materials weighing 250 g were placed in an air-flow vessel which was equipped with an impeller, temperature control sensor and air-cooled condenser. Air was blown through materials that were heated in a vessel for 35 min at 163 °C. The mixing of air and materials was performed by the air flow at a rate of 2000 mL/min and the impeller speed at a rate of 700 RPM. Pressure Aging Vessel* (PAV*)
The purpose of this test is to simulate long-term asphalt aging after hot-mix aging such as SAFT and RTFOT. This method was modified from the standard PAV procedure. Materials with 1 mm film thickness were placed in a PAV pan and aged for 16 hrs at 90 °C. The pressure and temperature controller were set to 2.2 MPa and 90 °C. . Environmental Room (ER)
An approximate simulation of road-aging is achieved using an environmental room controlled to 60 °C and 1 atm air with 25 percent relative humidity. Samples for examining hardening susceptibility were placed in trays measuring 4 cm by 7 cm, and trays measuring 14 cm by 14 cm were used for ductility measurement of samples, resulting in an approximately 1 mm thick film. Analytical Measurements Dynamic Shear Rheometer (DSR)
Complex viscosity (η*) at 60 °C and 0.1 rad/s, storage modulus (G') and dynamic viscosity (η') at 44.7 °C and 10 rad/s of asphalt materials were measured using a Carri-Med CSL 500 Controlled Stress Rheometer operated in an oscillatory mode. A 2.5 cm composite parallel plate geometry was used with a 500 µm gap. The operating ranges of temperature, angular frequency and torque were -10 to 99.9 °C, 0.1 to 100 rad/s and 10 to 499,990 dyne-cm, respectively.
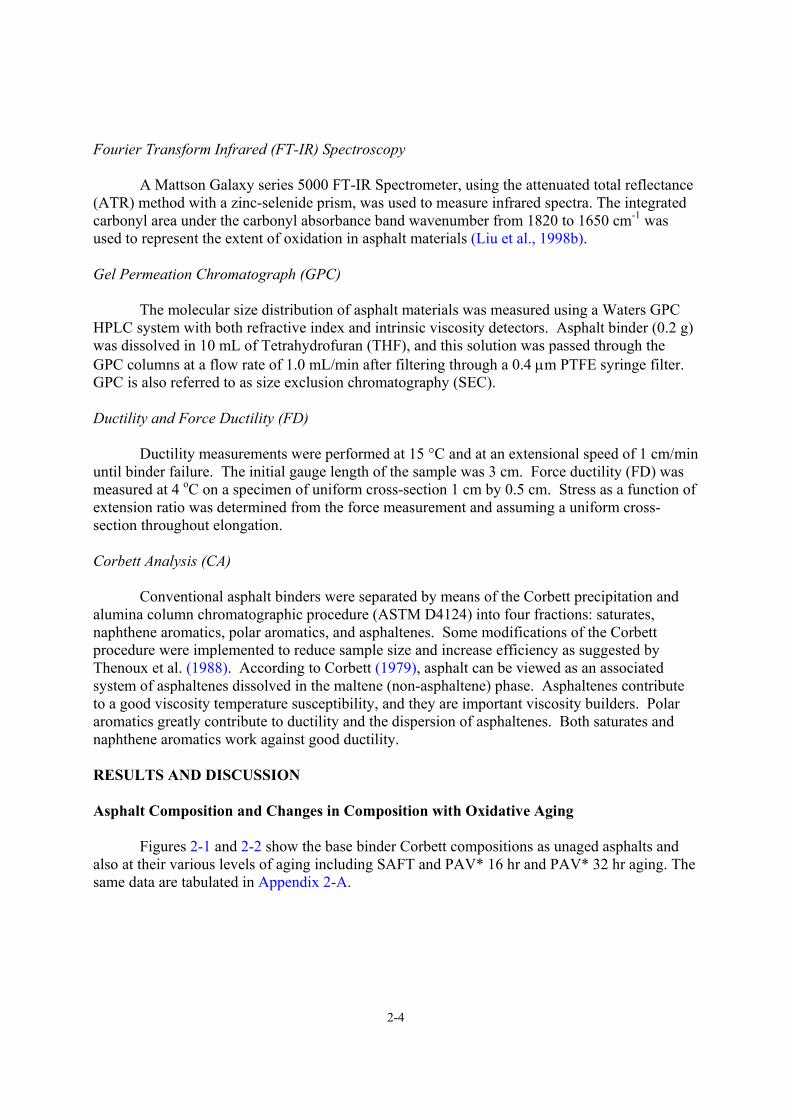
2-4
Fourier Transform Infrared (FT-IR) Spectroscopy
A Mattson Galaxy series 5000 FT-IR Spectrometer, using the attenuated total reflectance (ATR) method with a zinc-selenide prism, was used to measure infrared spectra. The integrated carbonyl area under the carbonyl absorbance band wavenumber from 1820 to 1650 cm-1 was used to represent the extent of oxidation in asphalt materials (Liu et al., 1998b). Gel Permeation Chromatograph (GPC)
The molecular size distribution of asphalt materials was measured using a Waters GPC HPLC system with both refractive index and intrinsic viscosity detectors. Asphalt binder (0.2 g) was dissolved in 10 mL of Tetrahydrofuran (THF), and this solution was passed through the GPC columns at a flow rate of 1.0 mL/min after filtering through a 0.4 µm PTFE syringe filter. GPC is also referred to as size exclusion chromatography (SEC). Ductility and Force Ductility (FD)
Ductility measurements were performed at 15 °C and at an extensional speed of 1 cm/min until binder failure. The initial gauge length of the sample was 3 cm. Force ductility (FD) was measured at 4 oC on a specimen of uniform cross-section 1 cm by 0.5 cm. Stress as a function of extension ratio was determined from the force measurement and assuming a uniform cross-section throughout elongation. Corbett Analysis (CA)
Conventional asphalt binders were separated by means of the Corbett precipitation and alumina column chromatographic procedure (ASTM D4124) into four fractions: saturates, naphthene aromatics, polar aromatics, and asphaltenes. Some modifications of the Corbett procedure were implemented to reduce sample size and increase efficiency as suggested by Thenoux et al. (1988). According to Corbett (1979), asphalt can be viewed as an associated system of asphaltenes dissolved in the maltene (non-asphaltene) phase. Asphaltenes contribute to a good viscosity temperature susceptibility, and they are important viscosity builders. Polar aromatics greatly contribute to ductility and the dispersion of asphaltenes. Both saturates and naphthene aromatics work against good ductility. RESULTS AND DISCUSSION Asphalt Composition and Changes in Composition with Oxidative Aging
Figures 2-1 and 2-2 show the base binder Corbett compositions as unaged asphalts and also at their various levels of aging including SAFT and PAV* 16 hr and PAV* 32 hr aging. The same data are tabulated in Appendix 2-A.
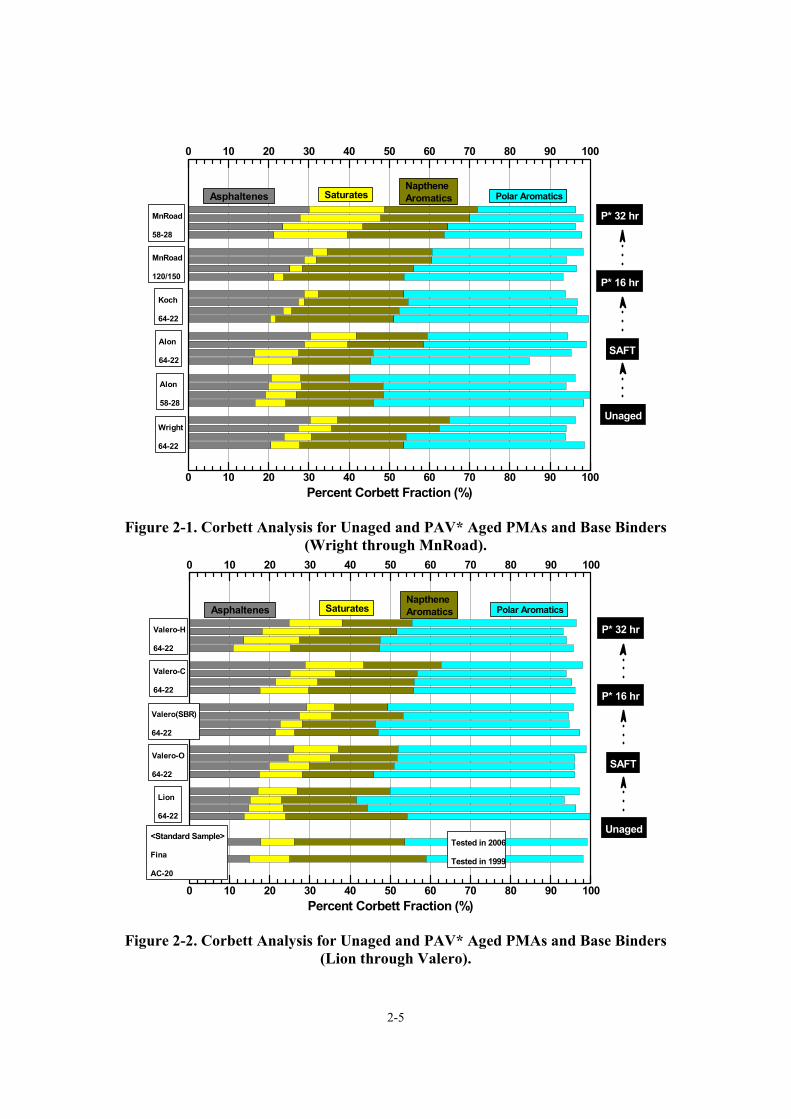
2-5
0 10 20 30 40 50 60 70 80 90 100
0 10 20 30 40 50 60 70 80 90 100
Alon
64-22
Wright
64-22
Alon
58-28
Koch
64-22
MnRoad
120/150
Polar AromaticsNapthene AromaticsSaturatesAsphaltenes
MnRoad
58-28
Percent Corbett Fraction (%)
P* 32 hr
P* 16 hr
SAFT
Unaged
Figure 2-1. Corbett Analysis for Unaged and PAV* Aged PMAs and Base Binders (Wright through MnRoad).
0 10 20 30 40 50 60 70 80 90 100
0 10 20 30 40 50 60 70 80 90 100
<Standard Sample>
Fina
AC-20
Valero(SBR)
64-22
Tested in 2006
Tested in 1999
Valero-O
64-22
Lion
64-22
Valero-C
64-22
Polar AromaticsNapthene AromaticsSaturatesAsphaltenes
Valero-H
64-22
Percent Corbett Fraction (%)
P* 32 hr
P* 16 hr
SAFT
Unaged
Figure 2-2. Corbett Analysis for Unaged and PAV* Aged PMAs and Base Binders (Lion through Valero).
2-6
From these graphs, we see distinct differences between some of the base binders. For example, the Koch PG 64-22 binder is very low in saturates and correspondingly high in polar aromatics. The MnRoad AC 120/150 binder is also very low in saturates and the Valero Oklahoma PG 64-22 base binder that was blended with SBR is low also although not to the same extreme as the Koch and MnRoad; the Valero binder has saturates in the range of 5-7 percent, whereas, the other two are less than 3 percent. These low saturates are notable because previous work has shown that in order for binders to have a good temperature susceptibility as unmodified binders, the saturates and asphaltenes tend to be in rough balance in the range of 15-20 or even 25 percent. The Wright asphalt base binder also has saturates under 10 percent, and the Valero Oklahoma and Lion are about 10 percent. The unaged asphaltenes level of these binders typically is 15-20 percent. Although the Valero-Houston and the Lion binders have asphaltenes below that level, it should be noted that the asphaltenes composition increases with aging, as has been extensively reported, and at the expense primarily of polar aromatics. With progressively more oxidation, the level of asphaltenes increases, and the increase comes at the expense of polar aromatics. As the heaviest, or near-asphaltene, polar aromatics are oxidized, they convert to asphaltenes. In a similar fashion, the heaviest naphthene aromatics that are near-polar aromatics may be converted to polar aromatics upon oxidation. Saturates, however, maintain a stable composition.
Concerning the asphaltene’s composition, we note that for most of the binders, there is a
regular progressive increase in asphaltenes for each level of oxidation. Two exceptions are the Alon and the Lion materials. For the Alon, there is relatively little increase in asphaltenes due to SAFT oxidation but significantly more due to the PAV* 16 hr oxidation. Then the PAV* 32 hr oxidation provides relatively little additional asphaltenes. Whether this is a true representation of the actual change in composition or whether it is an experimental anomaly for this particular experiment is not known. There is no reason to believe the data are in error. The Lion base asphalt, on the other hand, has a relatively low increase in asphaltenes with each additional step of aging, although, the increase occurs evenly at each level. Ultimately, the objective of these data would be to correlate the asphalt polymer compatibility to Corbett composition. If achieved, this would be a very simple way to characterize compatibility. However, because the composition is only crudely measured by the Corbett fractions (each fraction from one asphalt to the next can be widely different due to its sub-composition), the ability to make a compatibility assessment based on only Corbett composition is probably unlikely.
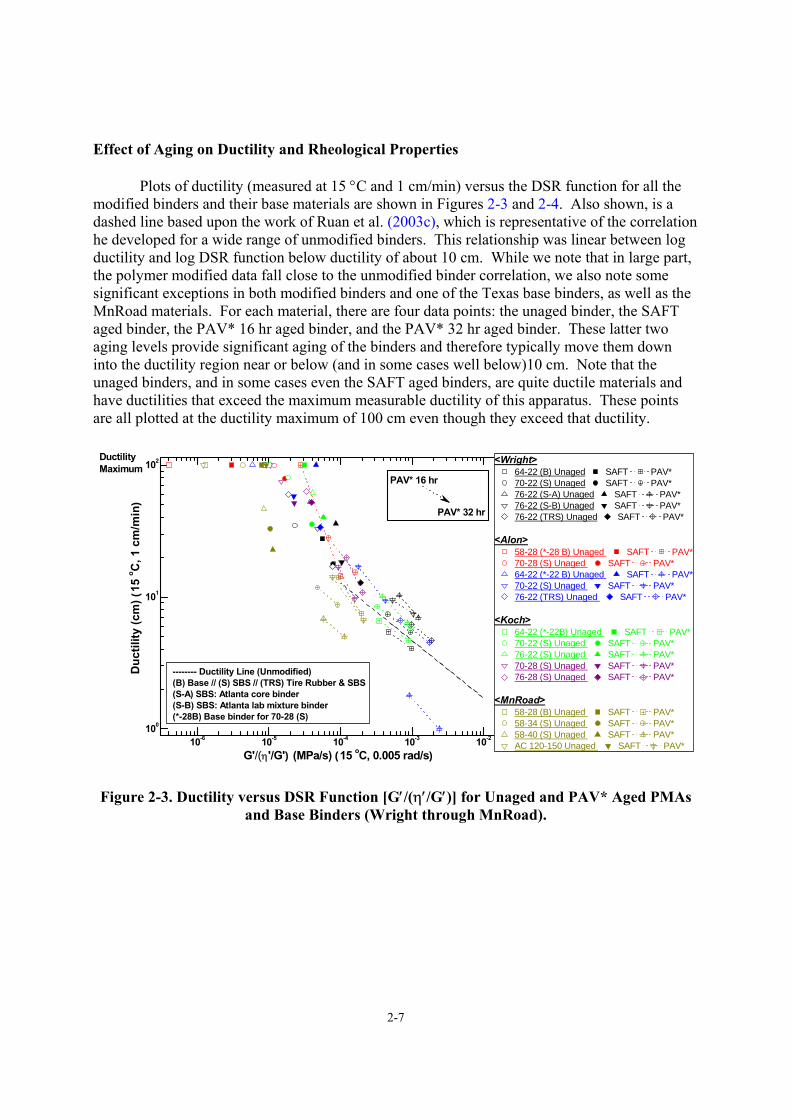
2-7
Effect of Aging on Ductility and Rheological Properties
Plots of ductility (measured at 15 °C and 1 cm/min) versus the DSR function for all the modified binders and their base materials are shown in Figures 2-3 and 2-4. Also shown, is a dashed line based upon the work of Ruan et al. (2003c), which is representative of the correlation he developed for a wide range of unmodified binders. This relationship was linear between log ductility and log DSR function below ductility of about 10 cm. While we note that in large part, the polymer modified data fall close to the unmodified binder correlation, we also note some significant exceptions in both modified binders and one of the Texas base binders, as well as the MnRoad materials. For each material, there are four data points: the unaged binder, the SAFT aged binder, the PAV* 16 hr aged binder, and the PAV* 32 hr aged binder. These latter two aging levels provide significant aging of the binders and therefore typically move them down into the ductility region near or below (and in some cases well below)10 cm. Note that the unaged binders, and in some cases even the SAFT aged binders, are quite ductile materials and have ductilities that exceed the maximum measurable ductility of this apparatus. These points are all plotted at the ductility maximum of 100 cm even though they exceed that ductility.
10-6 10-5 10-4 10-3 10-2100
101
102
-------- Ductility Line (Unmodified)(B) Base // (S) SBS // (TRS) Tire Rubber & SBS(S-A) SBS: Atlanta core binder(S-B) SBS: Atlanta lab mixture binder(*-28B) Base binder for 70-28 (S)
Ductility Maximum
<Wright>64-22 (B) Unaged SAFT PAV*70-22 (S) Unaged SAFT PAV*76-22 (S-A) Unaged SAFT PAV* 76-22 (S-B) Unaged SAFT PAV*76-22 (TRS) Unaged SAFT PAV*
<Alon>58-28 (*-28 B) Unaged SAFT PAV*70-28 (S) Unaged SAFT PAV*64-22 (*-22 B) Unaged SAFT PAV*70-22 (S) Unaged SAFT PAV*76-22 (TRS) Unaged SAFT PAV*
<Koch>64-22 (*-22B) Unaged SAFT PAV*70-22 (S) Unaged SAFT PAV*76-22 (S) Unaged SAFT PAV*70-28 (S) Unaged SAFT PAV*76-28 (S) Unaged SAFT PAV*
<MnRoad>58-28 (B) Unaged SAFT PAV*58-34 (S) Unaged SAFT PAV*58-40 (S) Unaged SAFT PAV*AC 120-150 Unaged SAFT PAV*
Duc
tility
(cm
) (15
o C, 1
cm
/min
)
G'/(η'/G') (MPa/s) (15 oC, 0.005 rad/s)
PAV* 32 hr
PAV* 16 hr
Figure 2-3. Ductility versus DSR Function [G′/(η′/G′)] for Unaged and PAV* Aged PMAs
and Base Binders (Wright through MnRoad).
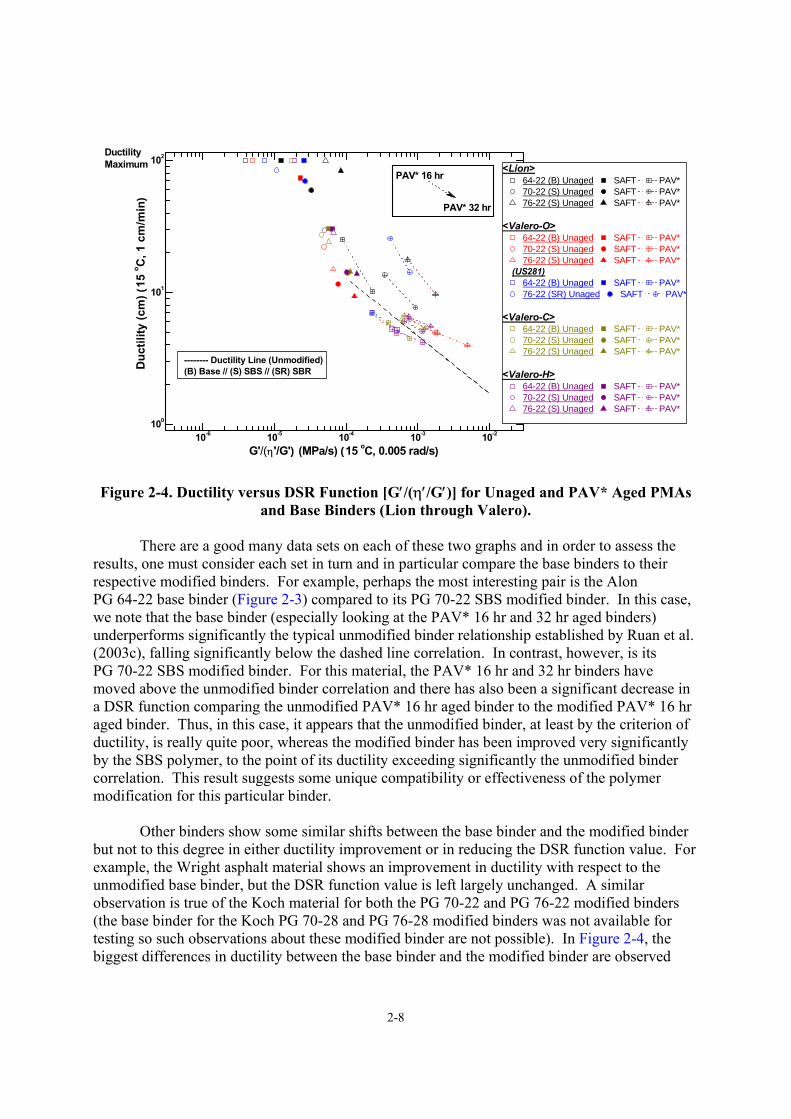
2-8
10-6 10-5 10-4 10-3 10-2100
101
102Ductility Maximum
-------- Ductility Line (Unmodified)(B) Base // (S) SBS // (SR) SBR
<Lion>64-22 (B) Unaged SAFT PAV* 70-22 (S) Unaged SAFT PAV*76-22 (S) Unaged SAFT PAV*
<Valero-O>64-22 (B) Unaged SAFT PAV* 70-22 (S) Unaged SAFT PAV*76-22 (S) Unaged SAFT PAV*
(US281)64-22 (B) Unaged SAFT PAV* 76-22 (SR) Unaged SAFT PAV*
<Valero-C>64-22 (B) Unaged SAFT PAV* 70-22 (S) Unaged SAFT PAV*76-22 (S) Unaged SAFT PAV*
<Valero-H>64-22 (B) Unaged SAFT PAV* 70-22 (S) Unaged SAFT PAV*76-22 (S) Unaged SAFT PAV*
Duc
tility
(cm
) (15
o C, 1
cm
/min
)
G'/(η'/G') (MPa/s) (15 oC, 0.005 rad/s)
PAV* 32 hr
PAV* 16 hr
Figure 2-4. Ductility versus DSR Function [G′/(η′/G′)] for Unaged and PAV* Aged PMAs and Base Binders (Lion through Valero).
There are a good many data sets on each of these two graphs and in order to assess the
results, one must consider each set in turn and in particular compare the base binders to their respective modified binders. For example, perhaps the most interesting pair is the Alon PG 64-22 base binder (Figure 2-3) compared to its PG 70-22 SBS modified binder. In this case, we note that the base binder (especially looking at the PAV* 16 hr and 32 hr aged binders) underperforms significantly the typical unmodified binder relationship established by Ruan et al. (2003c), falling significantly below the dashed line correlation. In contrast, however, is its PG 70-22 SBS modified binder. For this material, the PAV* 16 hr and 32 hr binders have moved above the unmodified binder correlation and there has also been a significant decrease in a DSR function comparing the unmodified PAV* 16 hr aged binder to the modified PAV* 16 hr aged binder. Thus, in this case, it appears that the unmodified binder, at least by the criterion of ductility, is really quite poor, whereas the modified binder has been improved very significantly by the SBS polymer, to the point of its ductility exceeding significantly the unmodified binder correlation. This result suggests some unique compatibility or effectiveness of the polymer modification for this particular binder.
Other binders show some similar shifts between the base binder and the modified binder
but not to this degree in either ductility improvement or in reducing the DSR function value. For example, the Wright asphalt material shows an improvement in ductility with respect to the unmodified base binder, but the DSR function value is left largely unchanged. A similar observation is true of the Koch material for both the PG 70-22 and PG 76-22 modified binders (the base binder for the Koch PG 70-28 and PG 76-28 modified binders was not available for testing so such observations about these modified binder are not possible). In Figure 2-4, the biggest differences in ductility between the base binder and the modified binder are observed
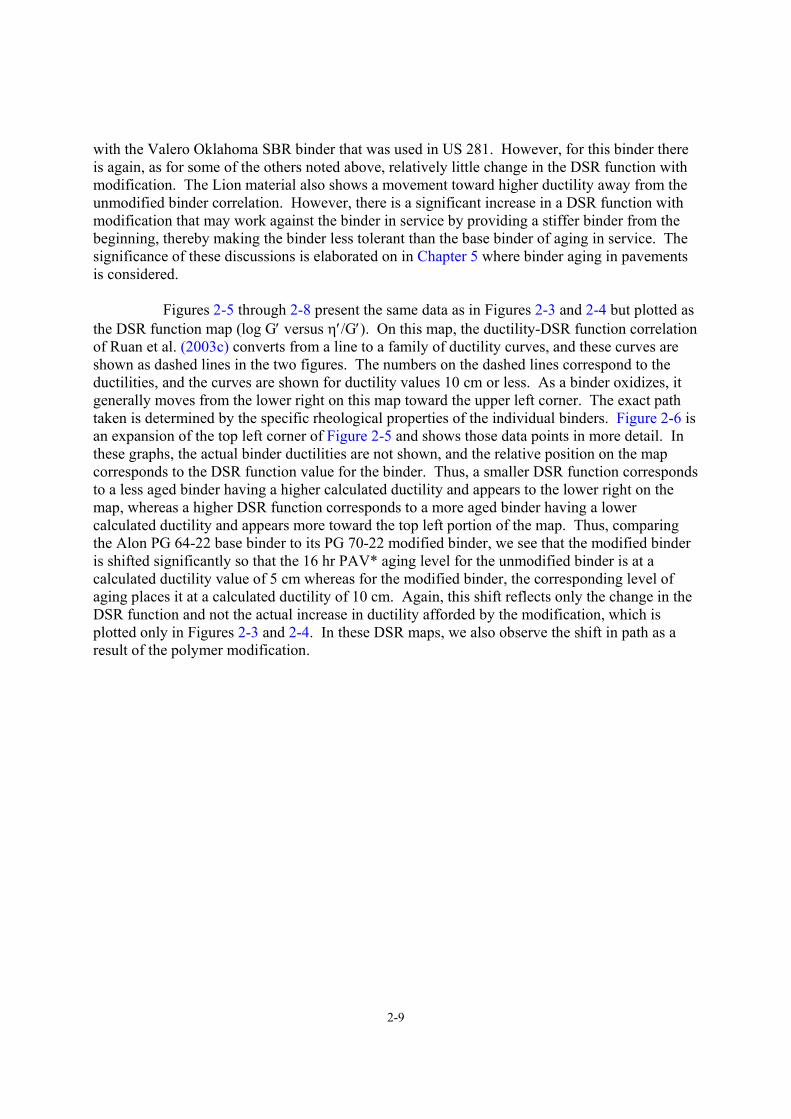
2-9
with the Valero Oklahoma SBR binder that was used in US 281. However, for this binder there is again, as for some of the others noted above, relatively little change in the DSR function with modification. The Lion material also shows a movement toward higher ductility away from the unmodified binder correlation. However, there is a significant increase in a DSR function with modification that may work against the binder in service by providing a stiffer binder from the beginning, thereby making the binder less tolerant than the base binder of aging in service. The significance of these discussions is elaborated on in Chapter 5 where binder aging in pavements is considered. Figures 2-5 through 2-8 present the same data as in Figures 2-3 and 2-4 but plotted as the DSR function map (log G′ versus η′/G′). On this map, the ductility-DSR function correlation of Ruan et al. (2003c) converts from a line to a family of ductility curves, and these curves are shown as dashed lines in the two figures. The numbers on the dashed lines correspond to the ductilities, and the curves are shown for ductility values 10 cm or less. As a binder oxidizes, it generally moves from the lower right on this map toward the upper left corner. The exact path taken is determined by the specific rheological properties of the individual binders. Figure 2-6 is an expansion of the top left corner of Figure 2-5 and shows those data points in more detail. In these graphs, the actual binder ductilities are not shown, and the relative position on the map corresponds to the DSR function value for the binder. Thus, a smaller DSR function corresponds to a less aged binder having a higher calculated ductility and appears to the lower right on the map, whereas a higher DSR function corresponds to a more aged binder having a lower calculated ductility and appears more toward the top left portion of the map. Thus, comparing the Alon PG 64-22 base binder to its PG 70-22 modified binder, we see that the modified binder is shifted significantly so that the 16 hr PAV* aging level for the unmodified binder is at a calculated ductility value of 5 cm whereas for the modified binder, the corresponding level of aging places it at a calculated ductility of 10 cm. Again, this shift reflects only the change in the DSR function and not the actual increase in ductility afforded by the modification, which is plotted only in Figures 2-3 and 2-4. In these DSR maps, we also observe the shift in path as a result of the polymer modification.
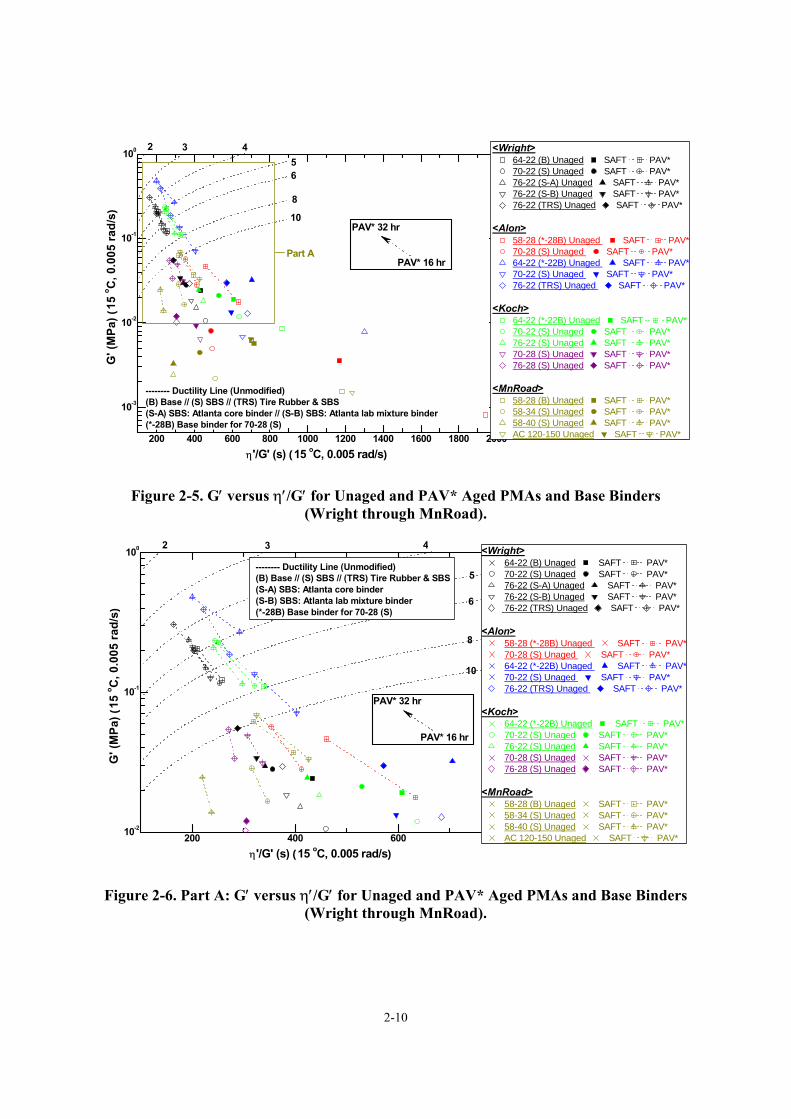
2-10
200 400 600 800 1000 1200 1400 1600 1800 2000
10-3
10-2
10-1
100 <Wright>64-22 (B) Unaged SAFT PAV*70-22 (S) Unaged SAFT PAV*76-22 (S-A) Unaged SAFT PAV*76-22 (S-B) Unaged SAFT PAV* 76-22 (TRS) Unaged SAFT PAV*
<Alon>58-28 (*-28B) Unaged SAFT PAV*70-28 (S) Unaged SAFT PAV*64-22 (*-22B) Unaged SAFT PAV*70-22 (S) Unaged SAFT PAV* 76-22 (TRS) Unaged SAFT PAV*
<Koch>64-22 (*-22B) Unaged SAFT PAV*70-22 (S) Unaged SAFT PAV* 76-22 (S) Unaged SAFT PAV*70-28 (S) Unaged SAFT PAV*76-28 (S) Unaged SAFT PAV*
<MnRoad>58-28 (B) Unaged SAFT PAV* 58-34 (S) Unaged SAFT PAV*58-40 (S) Unaged SAFT PAV*AC 120-150 Unaged SAFT PAV*
-------- Ductility Line (Unmodified)(B) Base // (S) SBS // (TRS) Tire Rubber & SBS(S-A) SBS: Atlanta core binder // (S-B) SBS: Atlanta lab mixture binder(*-28B) Base binder for 70-28 (S)
G' (
MPa
) (15
o C, 0
.005
rad/
s)
η'/G' (s) (15 oC, 0.005 rad/s)
8
10
56
3 42
Part A
PAV* 32 hr
PAV* 16 hr
Figure 2-5. G′ versus η′/G′ for Unaged and PAV* Aged PMAs and Base Binders (Wright through MnRoad).
200 400 600 80010-2
10-1
100
-------- Ductility Line (Unmodified)(B) Base // (S) SBS // (TRS) Tire Rubber & SBS(S-A) SBS: Atlanta core binder(S-B) SBS: Atlanta lab mixture binder(*-28B) Base binder for 70-28 (S)
<Wright> 64-22 (B) Unaged SAFT PAV* 70-22 (S) Unaged SAFT PAV* 76-22 (S-A) Unaged SAFT PAV* 76-22 (S-B) Unaged SAFT PAV* 76-22 (TRS) Unaged SAFT PAV*
<Alon> 58-28 (*-28B) Unaged SAFT PAV* 70-28 (S) Unaged SAFT PAV* 64-22 (*-22B) Unaged SAFT PAV* 70-22 (S) Unaged SAFT PAV* 76-22 (TRS) Unaged SAFT PAV*
<Koch> 64-22 (*-22B) Unaged SAFT PAV* 70-22 (S) Unaged SAFT PAV* 76-22 (S) Unaged SAFT PAV* 70-28 (S) Unaged SAFT PAV* 76-28 (S) Unaged SAFT PAV*
<MnRoad> 58-28 (B) Unaged SAFT PAV* 58-34 (S) Unaged SAFT PAV* 58-40 (S) Unaged SAFT PAV* AC 120-150 Unaged SAFT PAV*
G' (
MPa
) (15
o C, 0
.005
rad/
s)
η'/G' (s) (15 oC, 0.005 rad/s)
8
10
5
6
3 42
PAV* 32 hr
PAV* 16 hr
Figure 2-6. Part A: G′ versus η′/G′ for Unaged and PAV* Aged PMAs and Base Binders (Wright through MnRoad).
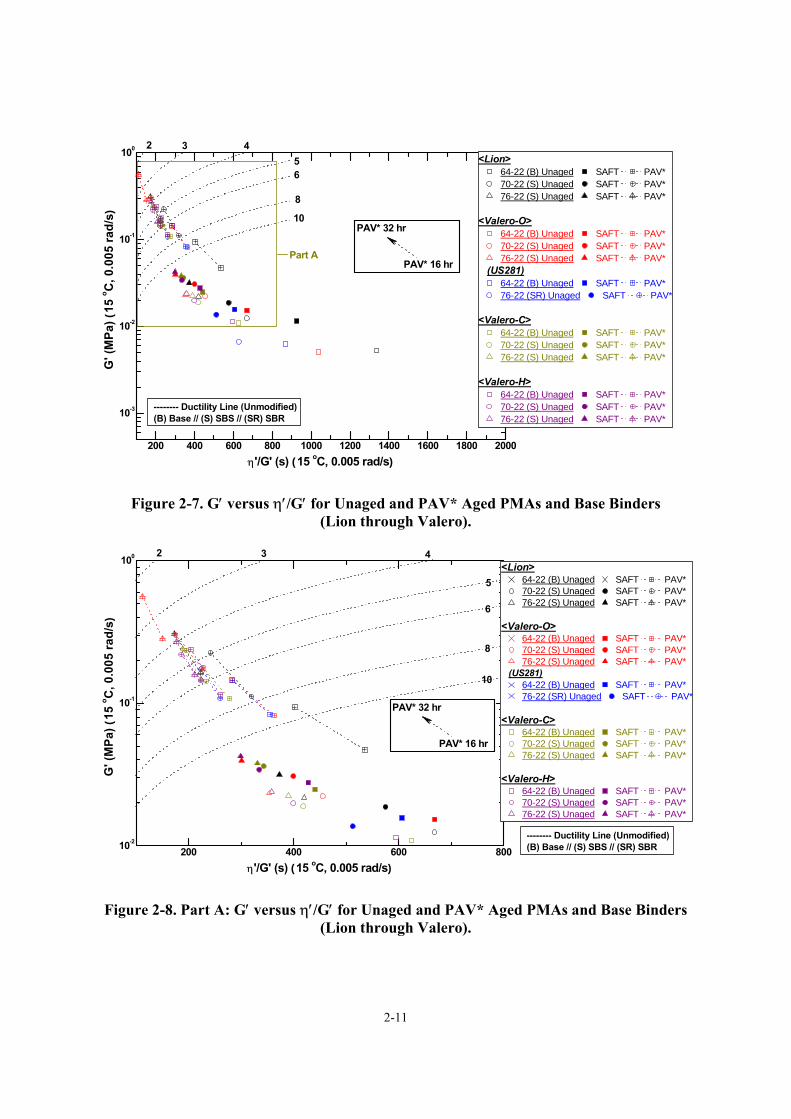
2-11
200 400 600 800 1000 1200 1400 1600 1800 2000
10-3
10-2
10-1
100
-------- Ductility Line (Unmodified)(B) Base // (S) SBS // (SR) SBR
<Lion>64-22 (B) Unaged SAFT PAV* 70-22 (S) Unaged SAFT PAV* 76-22 (S) Unaged SAFT PAV*
<Valero-O>64-22 (B) Unaged SAFT PAV* 70-22 (S) Unaged SAFT PAV* 76-22 (S) Unaged SAFT PAV*
(US281)64-22 (B) Unaged SAFT PAV* 76-22 (SR) Unaged SAFT PAV*
<Valero-C>64-22 (B) Unaged SAFT PAV* 70-22 (S) Unaged SAFT PAV*76-22 (S) Unaged SAFT PAV*
<Valero-H>64-22 (B) Unaged SAFT PAV* 70-22 (S) Unaged SAFT PAV*76-22 (S) Unaged SAFT PAV*
G' (
MPa
) (15
o C, 0
.005
rad/
s)
η'/G' (s) (15 oC, 0.005 rad/s)
8
10
56
3 42
Part A
PAV* 32 hr
PAV* 16 hr
Figure 2-7. G′ versus η′/G′ for Unaged and PAV* Aged PMAs and Base Binders (Lion through Valero).
200 400 600 80010-2
10-1
100
-------- Ductility Line (Unmodified)(B) Base // (S) SBS // (SR) SBR
<Lion>64-22 (B) Unaged SAFT PAV* 70-22 (S) Unaged SAFT PAV* 76-22 (S) Unaged SAFT PAV*
<Valero-O>64-22 (B) Unaged SAFT PAV* 70-22 (S) Unaged SAFT PAV* 76-22 (S) Unaged SAFT PAV*
(US281)64-22 (B) Unaged SAFT PAV* 76-22 (SR) Unaged SAFT PAV*
<Valero-C>64-22 (B) Unaged SAFT PAV* 70-22 (S) Unaged SAFT PAV*76-22 (S) Unaged SAFT PAV*
<Valero-H>64-22 (B) Unaged SAFT PAV* 70-22 (S) Unaged SAFT PAV*76-22 (S) Unaged SAFT PAV*
G' (
MPa
) (15
o C, 0
.005
rad/
s)
η'/G' (s) (15 oC, 0.005 rad/s)
8
10
5
6
3 42
PAV* 32 hr
PAV* 16 hr
Figure 2-8. Part A: G′ versus η′/G′ for Unaged and PAV* Aged PMAs and Base Binders (Lion through Valero).
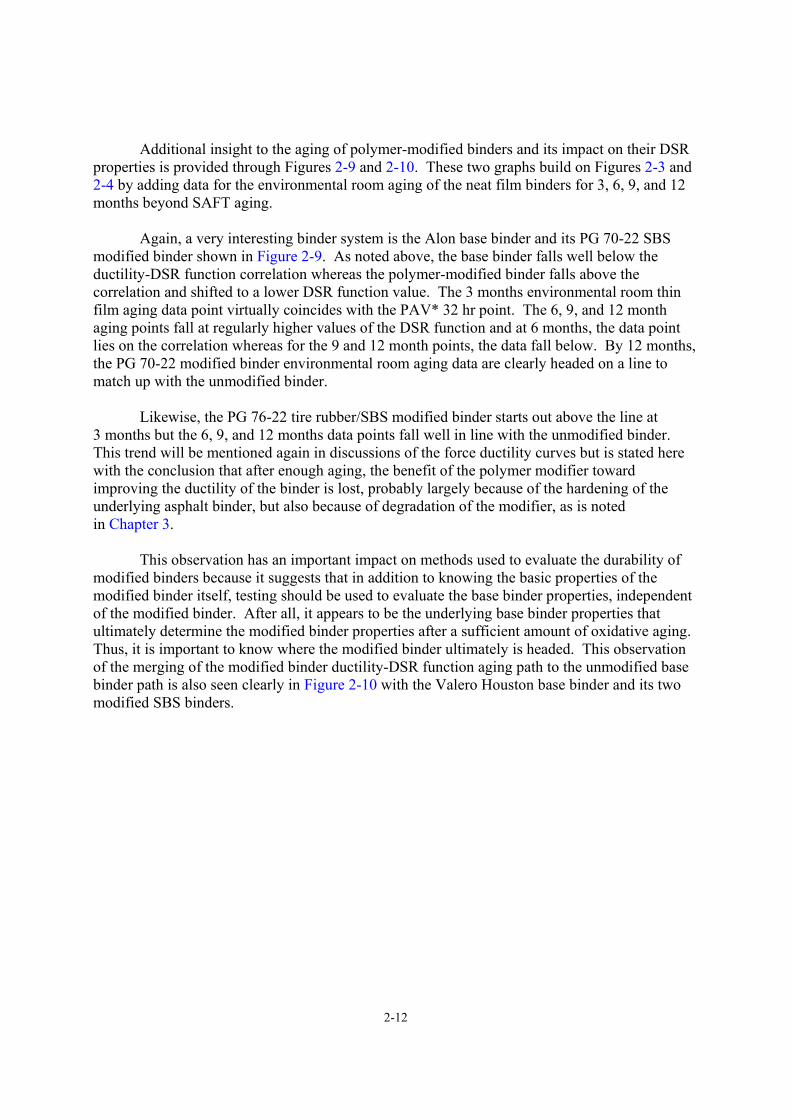
2-12
Additional insight to the aging of polymer-modified binders and its impact on their DSR properties is provided through Figures 2-9 and 2-10. These two graphs build on Figures 2-3 and 2-4 by adding data for the environmental room aging of the neat film binders for 3, 6, 9, and 12 months beyond SAFT aging.
Again, a very interesting binder system is the Alon base binder and its PG 70-22 SBS
modified binder shown in Figure 2-9. As noted above, the base binder falls well below the ductility-DSR function correlation whereas the polymer-modified binder falls above the correlation and shifted to a lower DSR function value. The 3 months environmental room thin film aging data point virtually coincides with the PAV* 32 hr point. The 6, 9, and 12 month aging points fall at regularly higher values of the DSR function and at 6 months, the data point lies on the correlation whereas for the 9 and 12 month points, the data fall below. By 12 months, the PG 70-22 modified binder environmental room aging data are clearly headed on a line to match up with the unmodified binder.
Likewise, the PG 76-22 tire rubber/SBS modified binder starts out above the line at
3 months but the 6, 9, and 12 months data points fall well in line with the unmodified binder. This trend will be mentioned again in discussions of the force ductility curves but is stated here with the conclusion that after enough aging, the benefit of the polymer modifier toward improving the ductility of the binder is lost, probably largely because of the hardening of the underlying asphalt binder, but also because of degradation of the modifier, as is noted in Chapter 3.
This observation has an important impact on methods used to evaluate the durability of
modified binders because it suggests that in addition to knowing the basic properties of the modified binder itself, testing should be used to evaluate the base binder properties, independent of the modified binder. After all, it appears to be the underlying base binder properties that ultimately determine the modified binder properties after a sufficient amount of oxidative aging. Thus, it is important to know where the modified binder ultimately is headed. This observation of the merging of the modified binder ductility-DSR function aging path to the unmodified base binder path is also seen clearly in Figure 2-10 with the Valero Houston base binder and its two modified SBS binders.
2-13
10-4 10-3 10-210-1
100
101
102
-------- Ductility Line (Unmodified)(B) Base // (S) SBS // (TRS) Tire Rubber & SBS(S-A) SBS: Atlanta core binder(S-B) SBS: Atlanta lab mixture binder(*-28B) Base binder for 70-28 (S)
<Wright>64-22 (B) ER PAV* 70-22 (S) ER PAV* 76-22 (S-A) ER PAV* 76-22 (S-B) ER PAV* 76-22 (TRS) ER PAV*
<Alon>58-28 (*-28 B) ER PAV*70-28 (S) ER PAV*64-22 (*-22 B) ER PAV*70-22 (S) ER PAV*76-22 (TRS) ER PAV*
<Koch>64-22 (*-22 B) ER PAV*70-22 (S) ER PAV*76-22 (S) ER PAV*70-28 (S) ER PAV*76-28 (S) ER PAV*
<MnRoad>58-28 (B) ER PAV*58-34 (S) ER PAV* 58-40 (S) ER PAV* AC 120-150 ER PAV*
Duc
tility
(cm
) (15
o C, 1
cm
/min
)
G'/(η'/G') (MPa/s) (15 oC, 0.005 rad/s)
ER 12 months or PAV* 32
ER 3 months or PAV* 16
Figure 2-9. Ductility versus DSR Function [G′/(η′/G′)] for PAV* and ER Aged PMAs and Base Binders (Wright through MnRoad).
10-4 10-3 10-210-1
100
101
102
-------- Ductility Line (Unmodified)(B) Base // (S) SBS // (SR) SBR
<Lion>64-22 (B) ER PAV* 70-22 (S) ER PAV* 76-22 (S) ER PAV*
<Valero-O>64-22 (B) ER PAV* 70-22 (S) ER PAV* 76-22 (S) ER PAV (US281)64-22 (B) ER PAV* 76-22 (SR) ER PAV*
<Valero-C>64-22 (B) ER PAV* 70-22 (S) ER PAV* 76-22 (S) ER PAV*
<Valero-H>64-22 (B) ER PAV* 70-22 (S) ER PAV* 76-22 (S) ER PAV*
Duc
tility
(cm
) (15
o C, 1
cm
/min
)
G'/(η'/G') (MPa/s) (15 oC, 0.005 rad/s)
ER 12 months or PAV* 32
ER 3 months or PAV* 16
Figure 2-10. Ductility versus DSR Function [G′/(η′/G′)] for PAV* and ER Aged PMAs and Base Binders (Lion through Valero).
2-14
Another interesting comparison is seen in Figures 2-11 and 2-12. In these graphs, the data for all the base and modified binders are shown but not identified with respect to the binder suppliers. Instead, they are identified simply as to performance grade so that both PG 58-28 base binders are shown with the same symbol, all the PG 64-22 are shown with another symbol, all the PG 70-22 as another symbol, and so on.
In Figure 2-11, all of the data are shown for both environmental room thin film binder
aging out to 12 months and for the PAV* 16 and 32 hr PAV apparatus aging conditions. Generally, it is observed that with a performance grade shift to higher temperatures, there is a shift of the data from below the ductility-DSR function correlation to above the correlation. This point is made more clearly in Figure 2-12 where only the data points for which ductility values between 3 and 10 cm are shown. Additionally, there are correlating lines shown for each of the performance grades. Clearly, the PG 58-40 performance grade lies well below the correlation of Ruan et al. (2003c), followed by the PG 58-34 and then the two base binders, PG 64-22 and PG 58-28, all of which lie below the correlation but with the base binders closer than the modified binders. Lying above the correlation are the PG 70-22 and the PG 76-22 modified binders, and with each PG shift, there is an approximate corresponding shift of the line toward or away from the Ruan et al. (2003c) correlation.
This result suggests that in general, polymer modification shifts the base binder
performance in the direction of increased ductility. Note that the Alon base binder does not appear in Figure 2-12 because the PAV* 16 and 32 hr condition binders fall below a ductility of 3 cm.
Another conclusion that might be proposed based upon Figure 2-12 is that suppliers in
the course of the developing modified binder systems have gravitated to using base binders that fall below the average of most base binders (at least compared to those reported by Ruan et al., 2003c) as well as the ones measured in this project that fall below his correlation. Now this may not be a generalizable observation because of the small number of binders studied. However, it is something that might be considered in future studies when evaluating the optimization of polymer-modified binder systems and whether this might in fact be something that manufacturers have learned to do as a good practice.
It should be noted also that typically polymer modification more likely raises the high
temperature end (changes 64 to 70 or 76) rather than change the low temperature end. Thus, the modified binders made from the PG 64-22 binders become PG 70-22 or PG 76-22. We note that the MnRoad binders appear to be anomalous in that the PG 58-28 binder is modified by the addition of polymer, and in this case the high temperature grade is maintained at 58 while the low temperature number is decreased from -28 to -34 to -40. This fact is likely the reason for the shift of the lines of those binders away from the ductility correlation to the direction of lower ductility for a given DSR function (or smaller DSR function for a given ductility). This observation is mentioned again in the discussion of the GPC chromatograms of these materials. As a preview to that discussion and recognizing that the -34 and -40 binders have also employed, according to the manufacture, sulfur cross linking during the hot-mix process, it is hypothesized that apart from polymer modification, there has been some additional modification of the base binder perhaps with a lighter asphaltic material that serves to reduce the low temperature grade.
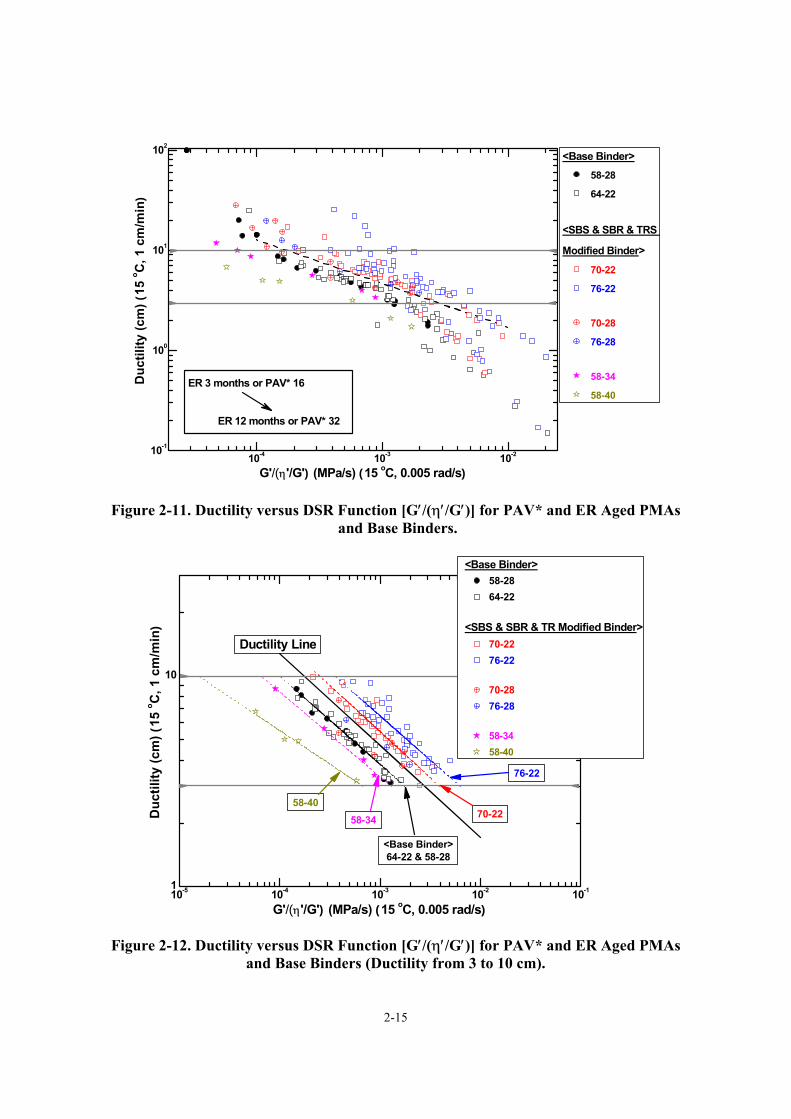
2-15
10-4 10-3 10-210-1
100
101
102
<Base Binder>58-28
64-22
<SBS & SBR & TRS
Modified Binder>
70-22
76-22
70-28
76-28
58-34
58-40
Duc
tility
(cm
) (15
o C, 1
cm
/min
)
G'/(η'/G') (MPa/s) (15 oC, 0.005 rad/s)
ER 12 months or PAV* 32
ER 3 months or PAV* 16
Figure 2-11. Ductility versus DSR Function [G′/(η′/G′)] for PAV* and ER Aged PMAs and Base Binders.
10-5 10-4 10-3 10-2 10-11
10
Ductility Line
76-22
70-22
<Base Binder>64-22 & 58-28
58-34
<Base Binder>58-2864-22
<SBS & SBR & TR Modified Binder>70-2276-22
70-28 76-28
58-34 58-40
Duc
tility
(cm
) (15
o C, 1
cm
/min
)
G'/(η'/G') (MPa/s) (15 oC, 0.005 rad/s)
58-40
Figure 2-12. Ductility versus DSR Function [G′/(η′/G′)] for PAV* and ER Aged PMAs and Base Binders (Ductility from 3 to 10 cm).
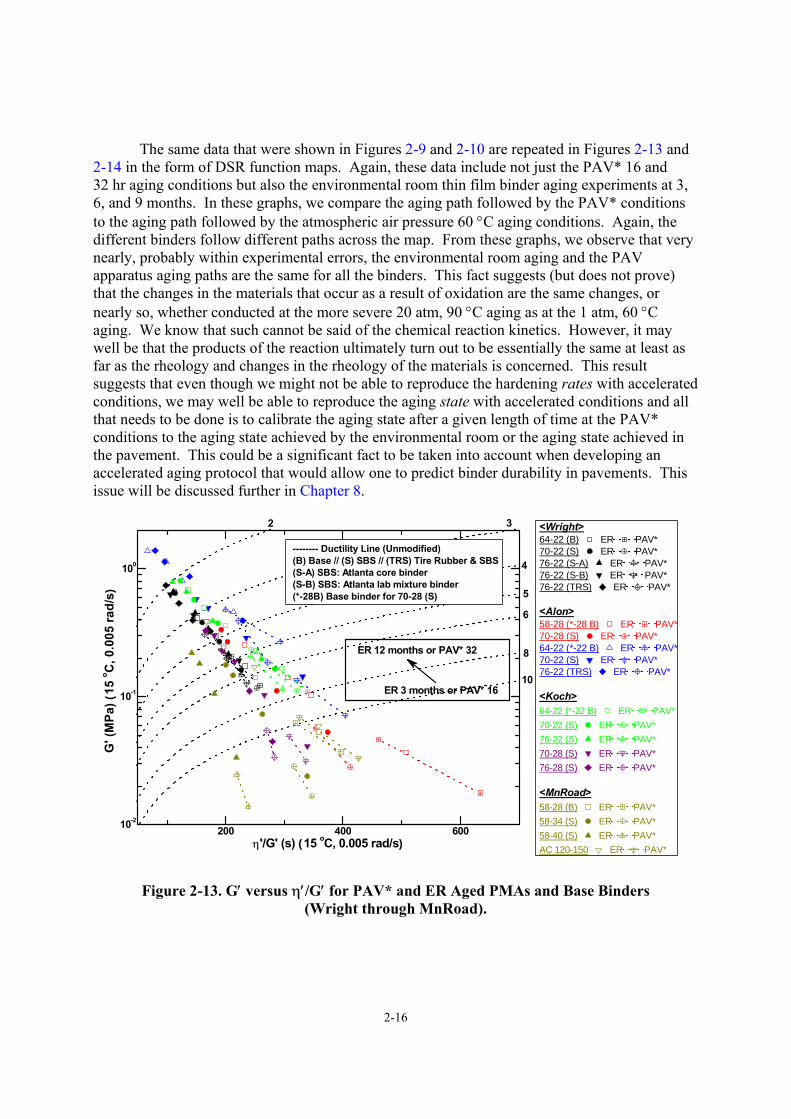
2-16
The same data that were shown in Figures 2-9 and 2-10 are repeated in Figures 2-13 and 2-14 in the form of DSR function maps. Again, these data include not just the PAV* 16 and 32 hr aging conditions but also the environmental room thin film binder aging experiments at 3, 6, and 9 months. In these graphs, we compare the aging path followed by the PAV* conditions to the aging path followed by the atmospheric air pressure 60 °C aging conditions. Again, the different binders follow different paths across the map. From these graphs, we observe that very nearly, probably within experimental errors, the environmental room aging and the PAV apparatus aging paths are the same for all the binders. This fact suggests (but does not prove) that the changes in the materials that occur as a result of oxidation are the same changes, or nearly so, whether conducted at the more severe 20 atm, 90 °C aging as at the 1 atm, 60 °C aging. We know that such cannot be said of the chemical reaction kinetics. However, it may well be that the products of the reaction ultimately turn out to be essentially the same at least as far as the rheology and changes in the rheology of the materials is concerned. This result suggests that even though we might not be able to reproduce the hardening rates with accelerated conditions, we may well be able to reproduce the aging state with accelerated conditions and all that needs to be done is to calibrate the aging state after a given length of time at the PAV* conditions to the aging state achieved by the environmental room or the aging state achieved in the pavement. This could be a significant fact to be taken into account when developing an accelerated aging protocol that would allow one to predict binder durability in pavements. This issue will be discussed further in Chapter 8.
200 400 60010-2
10-1
100
-------- Ductility Line (Unmodified)(B) Base // (S) SBS // (TRS) Tire Rubber & SBS(S-A) SBS: Atlanta core binder(S-B) SBS: Atlanta lab mixture binder(*-28B) Base binder for 70-28 (S)
<Wright>64-22 (B) ER PAV* 70-22 (S) ER PAV* 76-22 (S-A) ER PAV* 76-22 (S-B) ER PAV* 76-22 (TRS) ER PAV*
<Alon>58-28 (*-28 B) ER PAV*70-28 (S) ER PAV*64-22 (*-22 B) ER PAV*70-22 (S) ER PAV*76-22 (TRS) ER PAV*
<Koch>64-22 (*-22 B) ER PAV*70-22 (S) ER PAV*76-22 (S) ER PAV*70-28 (S) ER PAV*76-28 (S) ER PAV*
<MnRoad>58-28 (B) ER PAV*58-34 (S) ER PAV* 58-40 (S) ER PAV* AC 120-150 ER PAV*
G' (
MPa
) (15
o C, 0
.005
rad/
s)
η'/G' (s) (15 oC, 0.005 rad/s)
8
10
5
6
3
4
2
ER 12 months or PAV* 32
ER 3 months or PAV* 16
Figure 2-13. G′ versus η′/G′ for PAV* and ER Aged PMAs and Base Binders (Wright through MnRoad).
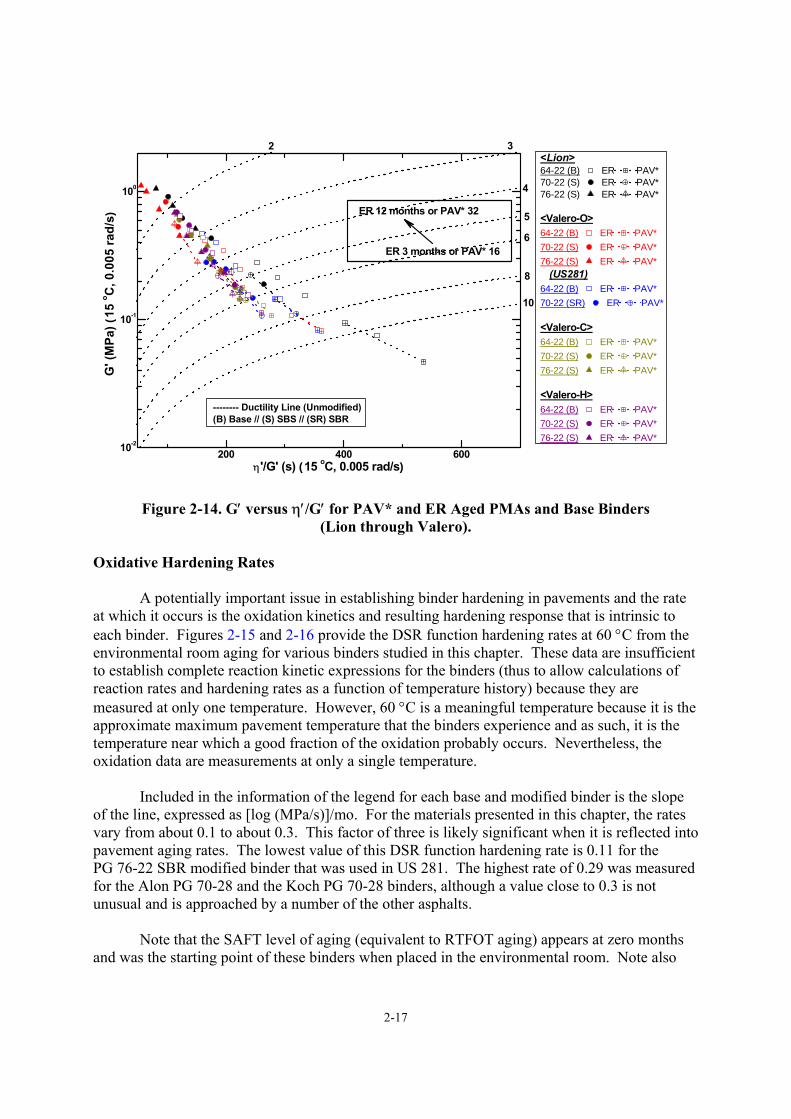
2-17
200 400 60010-2
10-1
100
-------- Ductility Line (Unmodified)(B) Base // (S) SBS // (SR) SBR
<Lion>64-22 (B) ER PAV* 70-22 (S) ER PAV* 76-22 (S) ER PAV*
<Valero-O>64-22 (B) ER PAV* 70-22 (S) ER PAV* 76-22 (S) ER PAV* (US281)64-22 (B) ER PAV* 70-22 (SR) ER PAV*
<Valero-C>64-22 (B) ER PAV* 70-22 (S) ER PAV* 76-22 (S) ER PAV*
<Valero-H>64-22 (B) ER PAV* 70-22 (S) ER PAV* 76-22 (S) ER PAV*
G' (
MPa
) (15
o C, 0
.005
rad/
s)
η'/G' (s) (15 oC, 0.005 rad/s)
8
10
5
6
3
4
2
ER 12 months or PAV* 32
ER 3 months or PAV* 16
Figure 2-14. G′ versus η′/G′ for PAV* and ER Aged PMAs and Base Binders (Lion through Valero).
Oxidative Hardening Rates
A potentially important issue in establishing binder hardening in pavements and the rate at which it occurs is the oxidation kinetics and resulting hardening response that is intrinsic to each binder. Figures 2-15 and 2-16 provide the DSR function hardening rates at 60 °C from the environmental room aging for various binders studied in this chapter. These data are insufficient to establish complete reaction kinetic expressions for the binders (thus to allow calculations of reaction rates and hardening rates as a function of temperature history) because they are measured at only one temperature. However, 60 °C is a meaningful temperature because it is the approximate maximum pavement temperature that the binders experience and as such, it is the temperature near which a good fraction of the oxidation probably occurs. Nevertheless, the oxidation data are measurements at only a single temperature.
Included in the information of the legend for each base and modified binder is the slope
of the line, expressed as [log (MPa/s)]/mo. For the materials presented in this chapter, the rates vary from about 0.1 to about 0.3. This factor of three is likely significant when it is reflected into pavement aging rates. The lowest value of this DSR function hardening rate is 0.11 for the PG 76-22 SBR modified binder that was used in US 281. The highest rate of 0.29 was measured for the Alon PG 70-28 and the Koch PG 70-28 binders, although a value close to 0.3 is not unusual and is approached by a number of the other asphalts.
Note that the SAFT level of aging (equivalent to RTFOT aging) appears at zero months
and was the starting point of these binders when placed in the environmental room. Note also
2-18
that the aging at 3, 6, 9, and 12 months form essentially a straight line that intercepts zero months well above the SAFT level of aging as has been documented in the literature (Lau et al., 1992; Liu et al., 1996). This offset is typical of binder oxidation and hardening kinetics and complicates assessing binder aging in pavements. The intercept of the long-term hardening rates compared to the SAFT values has been called an initial jump and represents the fact that between 0 and 3 months (at 60 °C), there is a higher aging rate period that eventually declines and transitions into a steady rate after a period of time. The reaction chemistry responsible for this early high rate is not well understood, but very likely is a result of free radicals that exist in the binder and that are ready to oxidize as soon as they come in contact with oxygen. Once these are depleted, the oxidation proceeds at a slower but steady rate.
Also, it has been noted previously that the hardening of a binder is a process that involves two separate phenomena. On one hand, the oxidation reaction kinetics is a function of temperature and oxygen pressure in the binder. The reaction kinetics for a large number of binders has been well documented in the literature (Lau et al., 1992; Liu et al., 1996; Glover et al., 2005). The second issue is the result of structuring in the binder that leads to physical changes. The oxidation of the binder forms carbonyl compounds, and these carbonyl compounds result in the formation of more polar materials that associate and behave like asphaltenes. These asphaltenes in turn act like solid particles in the binder, which serve to structure the material significantly and thereby result in a large amount of stiffening of the binders (Lin et al., 1996; Liu et al., 1998a and 1998b). This two-step process, oxidation followed by molecular associations that result in binder stiffening, is reflected in Figures 2-15 and 2-16 as a single process.
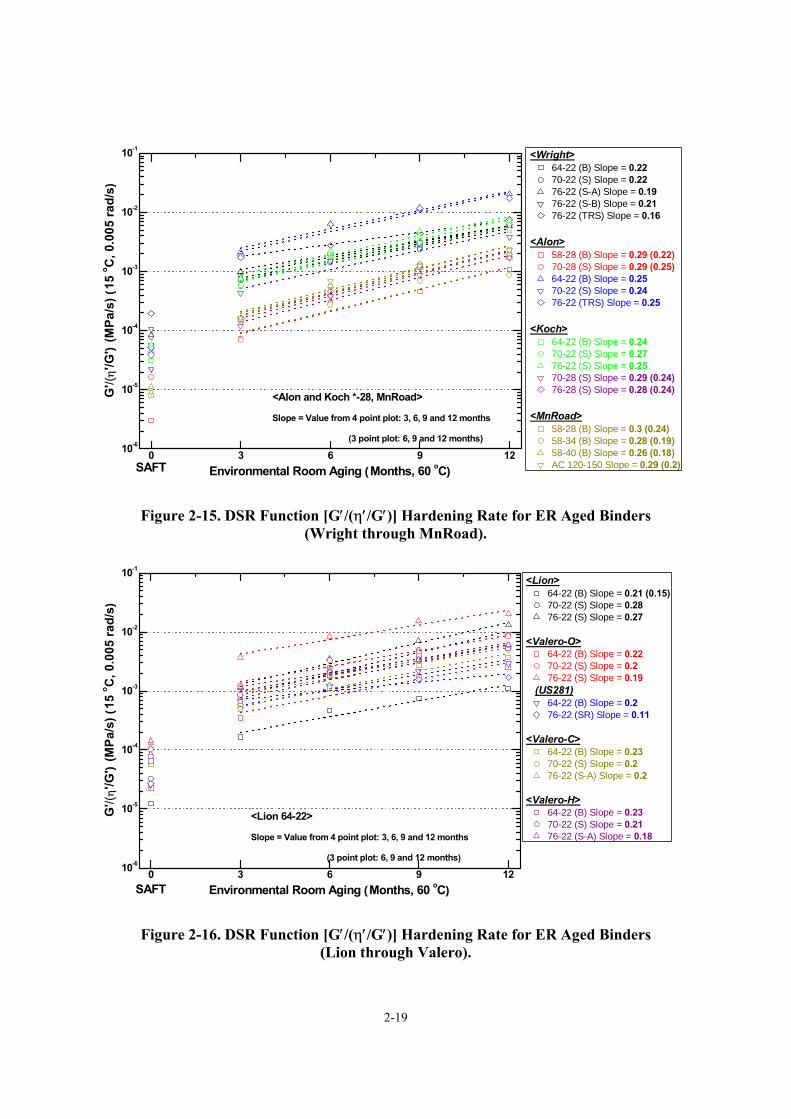
2-19
0 3 6 9 1210-6
10-5
10-4
10-3
10-2
10-1
SAFT
Environmental Room Aging (Months, 60 oC)
<Wright>64-22 (B) Slope = 0.2270-22 (S) Slope = 0.2276-22 (S-A) Slope = 0.1976-22 (S-B) Slope = 0.2176-22 (TRS) Slope = 0.16
<Alon>58-28 (B) Slope = 0.29 (0.22)70-28 (S) Slope = 0.29 (0.25)64-22 (B) Slope = 0.2570-22 (S) Slope = 0.2476-22 (TRS) Slope = 0.25
<Koch>64-22 (B) Slope = 0.2470-22 (S) Slope = 0.2776-22 (S) Slope = 0.2570-28 (S) Slope = 0.29 (0.24)76-28 (S) Slope = 0.28 (0.24)
<MnRoad>58-28 (B) Slope = 0.3 (0.24)58-34 (B) Slope = 0.28 (0.19)58-40 (B) Slope = 0.26 (0.18)AC 120-150 Slope = 0.29 (0.2)
G'/(
η'/G
') (M
Pa/s
) (15
o C, 0
.005
rad/
s)
<Alon and Koch *-28, MnRoad> Slope = Value from 4 point plot: 3, 6, 9 and 12 months
(3 point plot: 6, 9 and 12 months)
Figure 2-15. DSR Function [G′/(η′/G′)] Hardening Rate for ER Aged Binders
(Wright through MnRoad).
0 3 6 9 1210-6
10-5
10-4
10-3
10-2
10-1
<Lion 64-22> Slope = Value from 4 point plot: 3, 6, 9 and 12 months
(3 point plot: 6, 9 and 12 months)
SAFT
Environmental Room Aging (Months, 60 oC)
<Lion>64-22 (B) Slope = 0.21 (0.15)70-22 (S) Slope = 0.2876-22 (S) Slope = 0.27
<Valero-O>64-22 (B) Slope = 0.2270-22 (S) Slope = 0.276-22 (S) Slope = 0.19
(US281)64-22 (B) Slope = 0.276-22 (SR) Slope = 0.11
<Valero-C>64-22 (B) Slope = 0.2370-22 (S) Slope = 0.276-22 (S-A) Slope = 0.2
<Valero-H>64-22 (B) Slope = 0.2370-22 (S) Slope = 0.2176-22 (S-A) Slope = 0.18
G'/(
η'/G
') (M
Pa/s
) (15
o C, 0
.005
rad/
s)
Figure 2-16. DSR Function [G′/(η′/G′)] Hardening Rate for ER Aged Binders
(Lion through Valero).
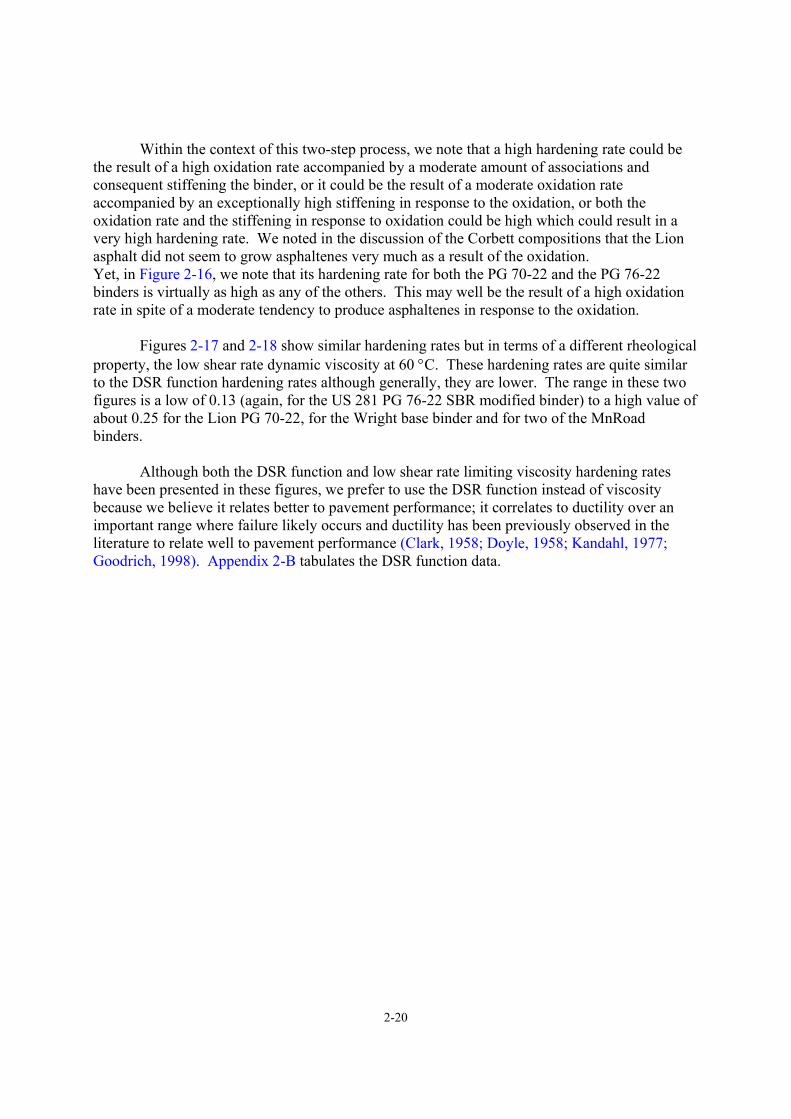
2-20
Within the context of this two-step process, we note that a high hardening rate could be the result of a high oxidation rate accompanied by a moderate amount of associations and consequent stiffening the binder, or it could be the result of a moderate oxidation rate accompanied by an exceptionally high stiffening in response to the oxidation, or both the oxidation rate and the stiffening in response to oxidation could be high which could result in a very high hardening rate. We noted in the discussion of the Corbett compositions that the Lion asphalt did not seem to grow asphaltenes very much as a result of the oxidation. Yet, in Figure 2-16, we note that its hardening rate for both the PG 70-22 and the PG 76-22 binders is virtually as high as any of the others. This may well be the result of a high oxidation rate in spite of a moderate tendency to produce asphaltenes in response to the oxidation.
Figures 2-17 and 2-18 show similar hardening rates but in terms of a different rheological property, the low shear rate dynamic viscosity at 60 °C. These hardening rates are quite similar to the DSR function hardening rates although generally, they are lower. The range in these two figures is a low of 0.13 (again, for the US 281 PG 76-22 SBR modified binder) to a high value of about 0.25 for the Lion PG 70-22, for the Wright base binder and for two of the MnRoad binders.
Although both the DSR function and low shear rate limiting viscosity hardening rates have been presented in these figures, we prefer to use the DSR function instead of viscosity because we believe it relates better to pavement performance; it correlates to ductility over an important range where failure likely occurs and ductility has been previously observed in the literature to relate well to pavement performance (Clark, 1958; Doyle, 1958; Kandahl, 1977; Goodrich, 1998). Appendix 2-B tabulates the DSR function data.
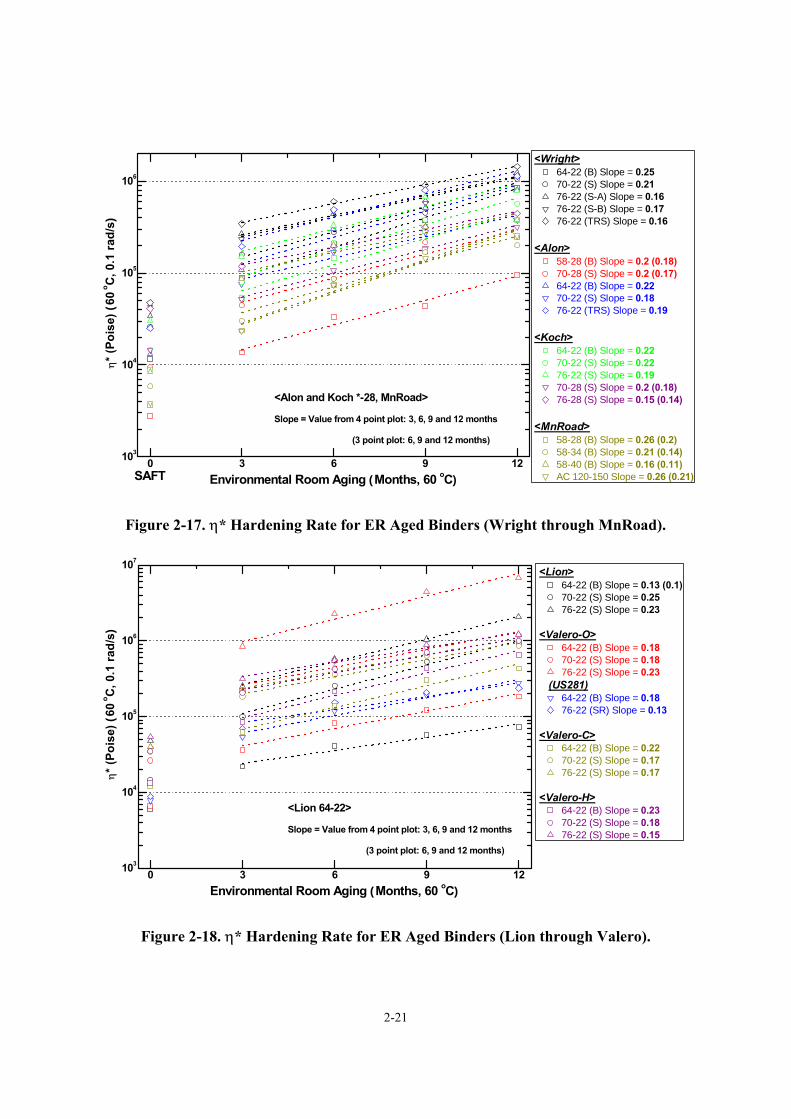
2-21
0 3 6 9 12103
104
105
106
<Alon and Koch *-28, MnRoad> Slope = Value from 4 point plot: 3, 6, 9 and 12 months
(3 point plot: 6, 9 and 12 months)
SAFT
<Wright>64-22 (B) Slope = 0.2570-22 (S) Slope = 0.2176-22 (S-A) Slope = 0.1676-22 (S-B) Slope = 0.1776-22 (TRS) Slope = 0.16
<Alon>58-28 (B) Slope = 0.2 (0.18)70-28 (S) Slope = 0.2 (0.17)64-22 (B) Slope = 0.2270-22 (S) Slope = 0.1876-22 (TRS) Slope = 0.19
<Koch>64-22 (B) Slope = 0.2270-22 (S) Slope = 0.2276-22 (S) Slope = 0.1970-28 (S) Slope = 0.2 (0.18)76-28 (S) Slope = 0.15 (0.14)
<MnRoad>58-28 (B) Slope = 0.26 (0.2)58-34 (B) Slope = 0.21 (0.14)58-40 (B) Slope = 0.16 (0.11)AC 120-150 Slope = 0.26 (0.21)
η* (
Pois
e) (
60 o C
, 0.1
rad/
s)
Environmental Room Aging (Months, 60 oC)
Figure 2-17. η* Hardening Rate for ER Aged Binders (Wright through MnRoad).
0 3 6 9 12103
104
105
106
107
<Lion 64-22> Slope = Value from 4 point plot: 3, 6, 9 and 12 months
(3 point plot: 6, 9 and 12 months)
<Lion>64-22 (B) Slope = 0.13 (0.1)70-22 (S) Slope = 0.2576-22 (S) Slope = 0.23
<Valero-O>64-22 (B) Slope = 0.1870-22 (S) Slope = 0.1876-22 (S) Slope = 0.23
(US281)64-22 (B) Slope = 0.1876-22 (SR) Slope = 0.13
<Valero-C>64-22 (B) Slope = 0.2270-22 (S) Slope = 0.1776-22 (S) Slope = 0.17
<Valero-H>64-22 (B) Slope = 0.2370-22 (S) Slope = 0.1876-22 (S) Slope = 0.15
η* (
Pois
e) (
60 o C
, 0.1
rad/
s)
Environmental Room Aging (Months, 60 oC)
Figure 2-18. η* Hardening Rate for ER Aged Binders (Lion through Valero).
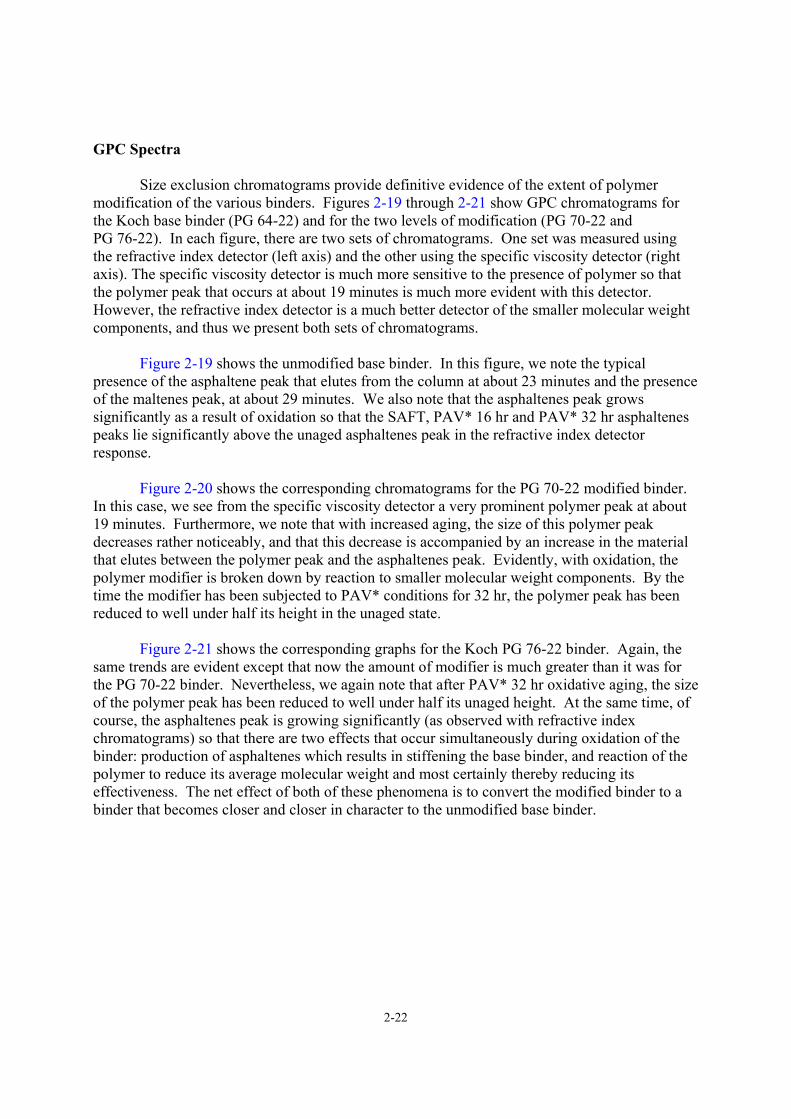
2-22
GPC Spectra
Size exclusion chromatograms provide definitive evidence of the extent of polymer modification of the various binders. Figures 2-19 through 2-21 show GPC chromatograms for the Koch base binder (PG 64-22) and for the two levels of modification (PG 70-22 and PG 76-22). In each figure, there are two sets of chromatograms. One set was measured using the refractive index detector (left axis) and the other using the specific viscosity detector (right axis). The specific viscosity detector is much more sensitive to the presence of polymer so that the polymer peak that occurs at about 19 minutes is much more evident with this detector. However, the refractive index detector is a much better detector of the smaller molecular weight components, and thus we present both sets of chromatograms.
Figure 2-19 shows the unmodified base binder. In this figure, we note the typical presence of the asphaltene peak that elutes from the column at about 23 minutes and the presence of the maltenes peak, at about 29 minutes. We also note that the asphaltenes peak grows significantly as a result of oxidation so that the SAFT, PAV* 16 hr and PAV* 32 hr asphaltenes peaks lie significantly above the unaged asphaltenes peak in the refractive index detector response.
Figure 2-20 shows the corresponding chromatograms for the PG 70-22 modified binder.
In this case, we see from the specific viscosity detector a very prominent polymer peak at about 19 minutes. Furthermore, we note that with increased aging, the size of this polymer peak decreases rather noticeably, and that this decrease is accompanied by an increase in the material that elutes between the polymer peak and the asphaltenes peak. Evidently, with oxidation, the polymer modifier is broken down by reaction to smaller molecular weight components. By the time the modifier has been subjected to PAV* conditions for 32 hr, the polymer peak has been reduced to well under half its height in the unaged state.
Figure 2-21 shows the corresponding graphs for the Koch PG 76-22 binder. Again, the
same trends are evident except that now the amount of modifier is much greater than it was for the PG 70-22 binder. Nevertheless, we again note that after PAV* 32 hr oxidative aging, the size of the polymer peak has been reduced to well under half its unaged height. At the same time, of course, the asphaltenes peak is growing significantly (as observed with refractive index chromatograms) so that there are two effects that occur simultaneously during oxidation of the binder: production of asphaltenes which results in stiffening the base binder, and reaction of the polymer to reduce its average molecular weight and most certainly thereby reducing its effectiveness. The net effect of both of these phenomena is to convert the modified binder to a binder that becomes closer and closer in character to the unmodified base binder.
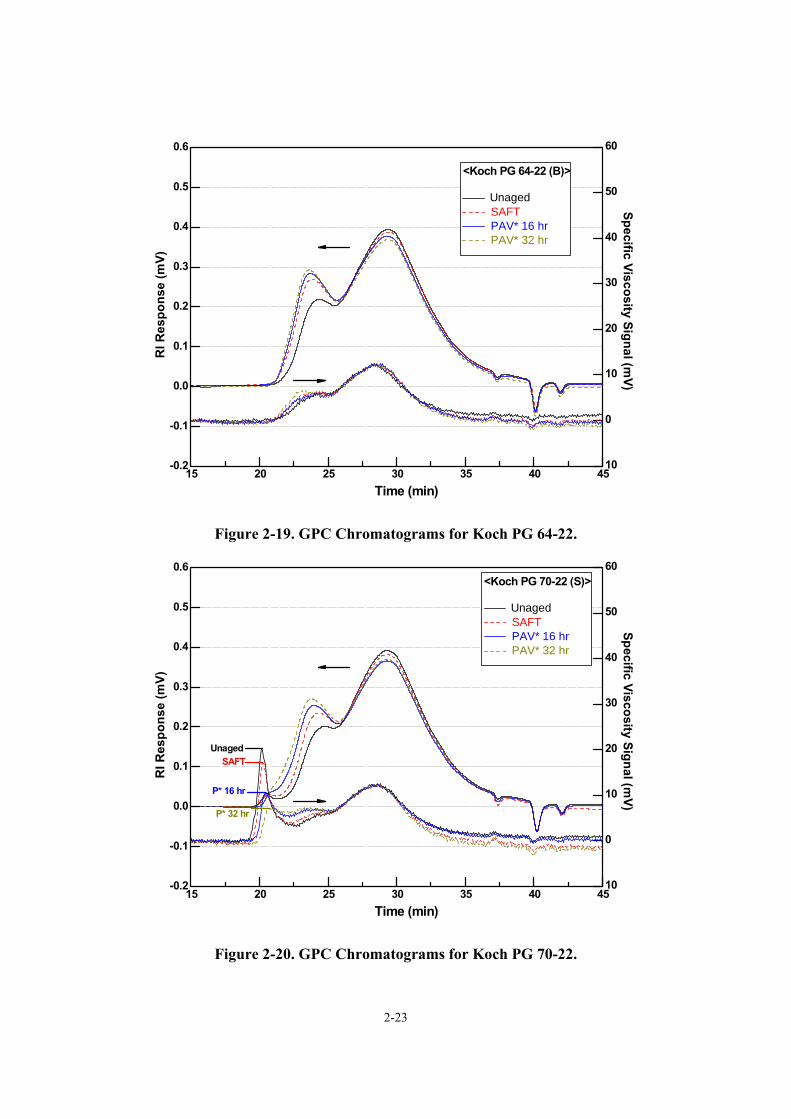
2-23
10
0
10
20
30
40
50
60
15 20 25 30 35 40 45-0.2
-0.1
0.0
0.1
0.2
0.3
0.4
0.5
0.6
<Koch PG 64-22 (B)>
Unaged SAFT PAV* 16 hr PAV* 32 hr
Specific Viscosity Signal (mV)
Time (min)
RI R
espo
nse
(mV)
Figure 2-19. GPC Chromatograms for Koch PG 64-22.
10
0
10
20
30
40
50
60
15 20 25 30 35 40 45-0.2
-0.1
0.0
0.1
0.2
0.3
0.4
0.5
0.6
P* 32 hr
P* 16 hr
SAFT
<Koch PG 70-22 (S)>
Unaged SAFT PAV* 16 hr PAV* 32 hr
Specific Viscosity Signal (mV)
Time (min)
RI R
espo
nse
(mV)
Unaged
Figure 2-20. GPC Chromatograms for Koch PG 70-22.
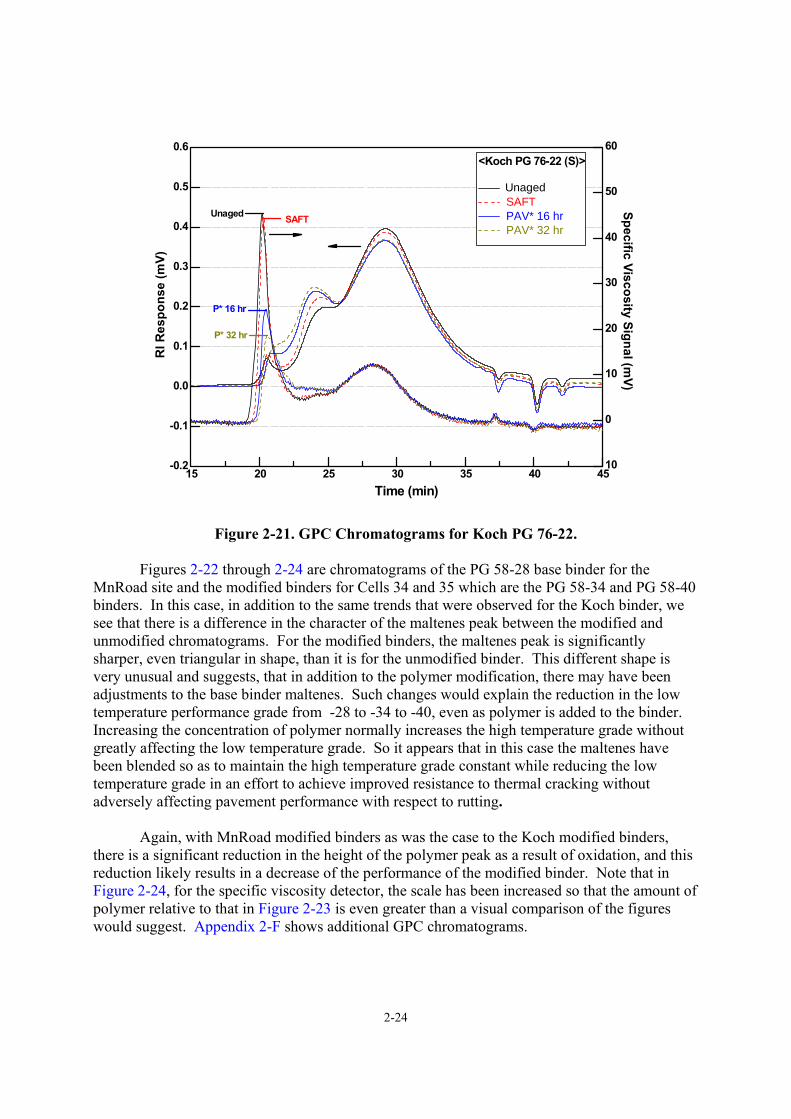
2-24
10
0
10
20
30
40
50
60
15 20 25 30 35 40 45-0.2
-0.1
0.0
0.1
0.2
0.3
0.4
0.5
0.6
P* 32 hr
P* 16 hr
SAFT
<Koch PG 76-22 (S)>
Unaged SAFT PAV* 16 hr PAV* 32 hr
Specific Viscosity Signal (mV)
Time (min)
RI R
espo
nse
(mV)
Unaged
Figure 2-21. GPC Chromatograms for Koch PG 76-22.
Figures 2-22 through 2-24 are chromatograms of the PG 58-28 base binder for the MnRoad site and the modified binders for Cells 34 and 35 which are the PG 58-34 and PG 58-40 binders. In this case, in addition to the same trends that were observed for the Koch binder, we see that there is a difference in the character of the maltenes peak between the modified and unmodified chromatograms. For the modified binders, the maltenes peak is significantly sharper, even triangular in shape, than it is for the unmodified binder. This different shape is very unusual and suggests, that in addition to the polymer modification, there may have been adjustments to the base binder maltenes. Such changes would explain the reduction in the low temperature performance grade from -28 to -34 to -40, even as polymer is added to the binder. Increasing the concentration of polymer normally increases the high temperature grade without greatly affecting the low temperature grade. So it appears that in this case the maltenes have been blended so as to maintain the high temperature grade constant while reducing the low temperature grade in an effort to achieve improved resistance to thermal cracking without adversely affecting pavement performance with respect to rutting.
Again, with MnRoad modified binders as was the case to the Koch modified binders,
there is a significant reduction in the height of the polymer peak as a result of oxidation, and this reduction likely results in a decrease of the performance of the modified binder. Note that in Figure 2-24, for the specific viscosity detector, the scale has been increased so that the amount of polymer relative to that in Figure 2-23 is even greater than a visual comparison of the figures would suggest. Appendix 2-F shows additional GPC chromatograms.
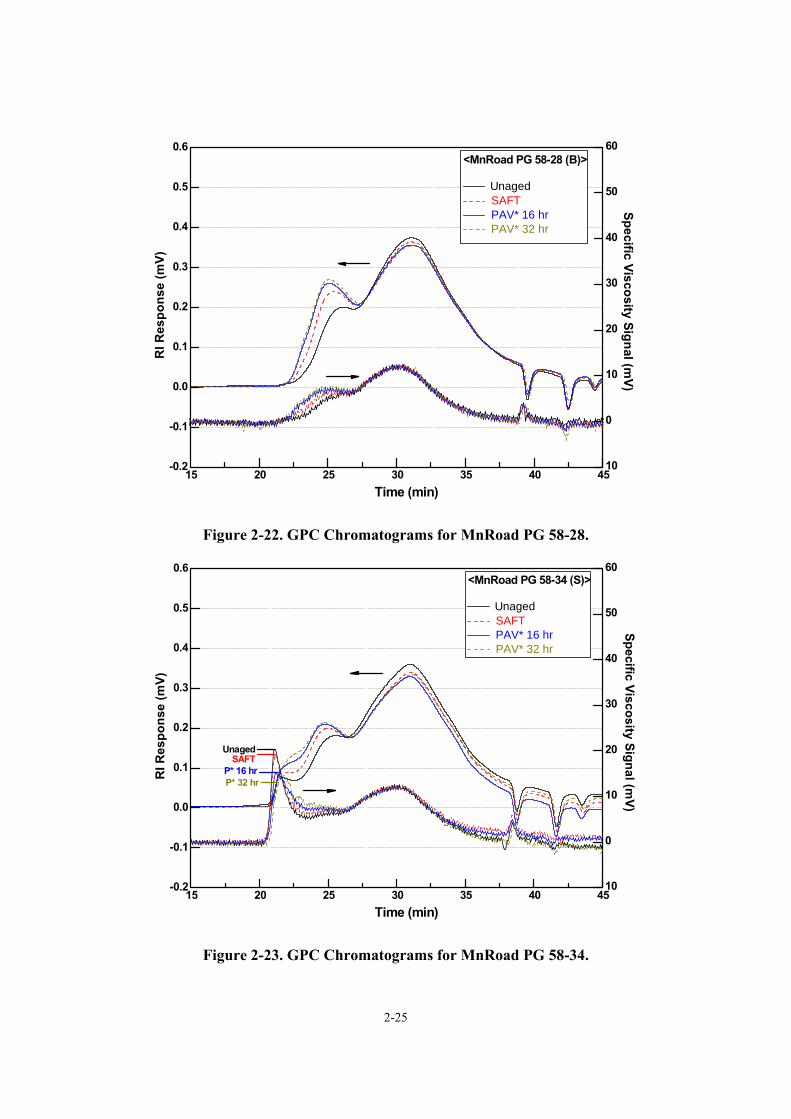
2-25
10
0
10
20
30
40
50
60
15 20 25 30 35 40 45-0.2
-0.1
0.0
0.1
0.2
0.3
0.4
0.5
0.6<MnRoad PG 58-28 (B)>
Unaged SAFT PAV* 16 hr PAV* 32 hr
Specific Viscosity Signal (mV)
Time (min)
RI R
espo
nse
(mV)
Figure 2-22. GPC Chromatograms for MnRoad PG 58-28.
10
0
10
20
30
40
50
60
15 20 25 30 35 40 45-0.2
-0.1
0.0
0.1
0.2
0.3
0.4
0.5
0.6
P* 32 hrP* 16 hr
SAFT
<MnRoad PG 58-34 (S)>
Unaged SAFT PAV* 16 hr PAV* 32 hr
Specific Viscosity Signal (mV)
Time (min)
RI R
espo
nse
(mV)
Unaged
Figure 2-23. GPC Chromatograms for MnRoad PG 58-34.
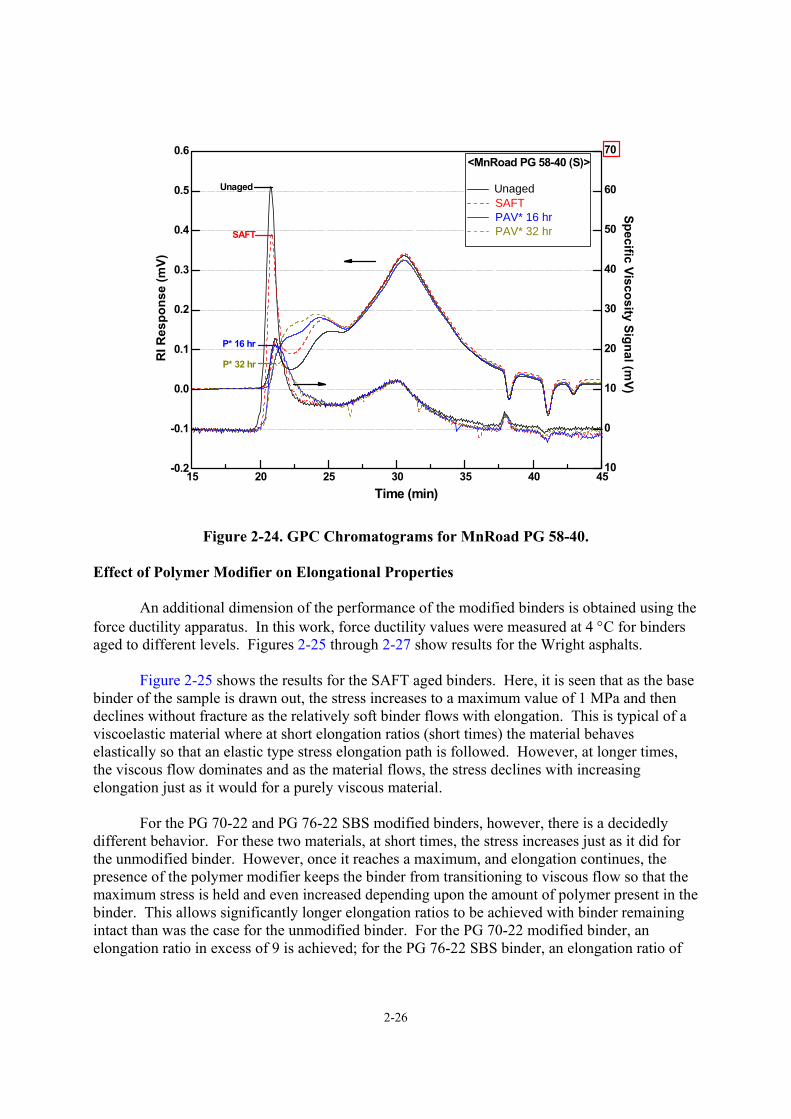
2-26
10
0
10
20
30
40
50
60
70
15 20 25 30 35 40 45-0.2
-0.1
0.0
0.1
0.2
0.3
0.4
0.5
0.6
P* 32 hr
P* 16 hr
SAFT
<MnRoad PG 58-40 (S)>
Unaged SAFT PAV* 16 hr PAV* 32 hr
Specific Viscosity Signal (mV)
Time (min)
RI R
espo
nse
(mV)
Unaged
Figure 2-24. GPC Chromatograms for MnRoad PG 58-40.
Effect of Polymer Modifier on Elongational Properties
An additional dimension of the performance of the modified binders is obtained using the force ductility apparatus. In this work, force ductility values were measured at 4 °C for binders aged to different levels. Figures 2-25 through 2-27 show results for the Wright asphalts.
Figure 2-25 shows the results for the SAFT aged binders. Here, it is seen that as the base
binder of the sample is drawn out, the stress increases to a maximum value of 1 MPa and then declines without fracture as the relatively soft binder flows with elongation. This is typical of a viscoelastic material where at short elongation ratios (short times) the material behaves elastically so that an elastic type stress elongation path is followed. However, at longer times, the viscous flow dominates and as the material flows, the stress declines with increasing elongation just as it would for a purely viscous material.
For the PG 70-22 and PG 76-22 SBS modified binders, however, there is a decidedly
different behavior. For these two materials, at short times, the stress increases just as it did for the unmodified binder. However, once it reaches a maximum, and elongation continues, the presence of the polymer modifier keeps the binder from transitioning to viscous flow so that the maximum stress is held and even increased depending upon the amount of polymer present in the binder. This allows significantly longer elongation ratios to be achieved with binder remaining intact than was the case for the unmodified binder. For the PG 70-22 modified binder, an elongation ratio in excess of 9 is achieved; for the PG 76-22 SBS binder, an elongation ratio of
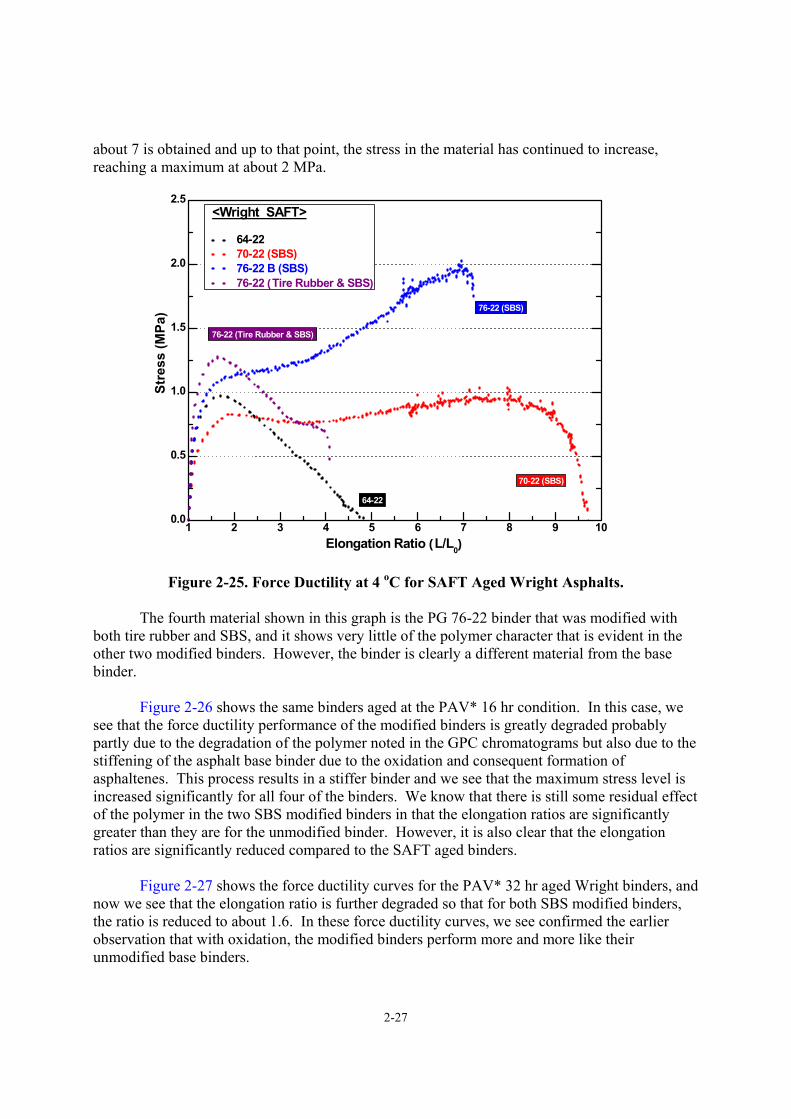
2-27
about 7 is obtained and up to that point, the stress in the material has continued to increase, reaching a maximum at about 2 MPa.
1 2 3 4 5 6 7 8 9 100.0
0.5
1.0
1.5
2.0
2.5
76-22 (Tire Rubber & SBS)
Stre
ss (M
Pa)
Elongation Ratio (L/L0)
64-22
70-22 (SBS)
76-22 (SBS)
<Wright SAFT>
64-22 70-22 (SBS) 76-22 B (SBS) 76-22 (Tire Rubber & SBS)
Figure 2-25. Force Ductility at 4 oC for SAFT Aged Wright Asphalts. The fourth material shown in this graph is the PG 76-22 binder that was modified with
both tire rubber and SBS, and it shows very little of the polymer character that is evident in the other two modified binders. However, the binder is clearly a different material from the base binder.
Figure 2-26 shows the same binders aged at the PAV* 16 hr condition. In this case, we see that the force ductility performance of the modified binders is greatly degraded probably partly due to the degradation of the polymer noted in the GPC chromatograms but also due to the stiffening of the asphalt base binder due to the oxidation and consequent formation of asphaltenes. This process results in a stiffer binder and we see that the maximum stress level is increased significantly for all four of the binders. We know that there is still some residual effect of the polymer in the two SBS modified binders in that the elongation ratios are significantly greater than they are for the unmodified binder. However, it is also clear that the elongation ratios are significantly reduced compared to the SAFT aged binders.
Figure 2-27 shows the force ductility curves for the PAV* 32 hr aged Wright binders, and
now we see that the elongation ratio is further degraded so that for both SBS modified binders, the ratio is reduced to about 1.6. In these force ductility curves, we see confirmed the earlier observation that with oxidation, the modified binders perform more and more like their unmodified base binders.
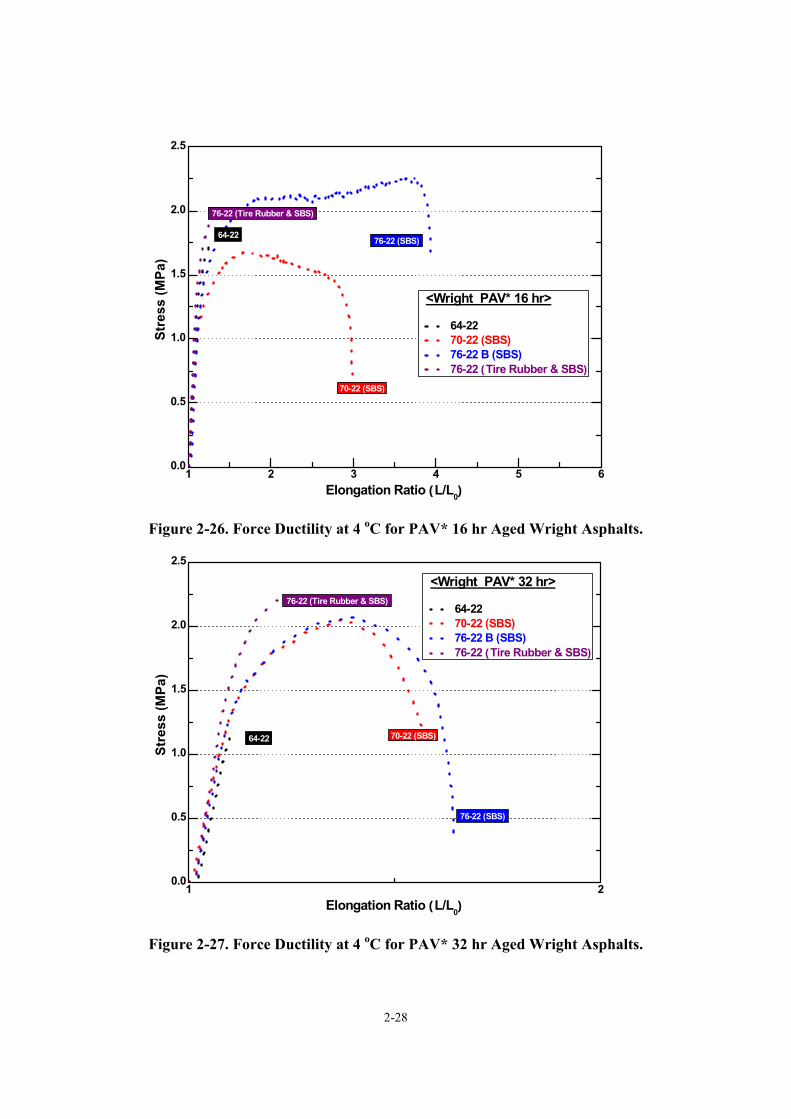
2-28
1 2 3 4 5 60.0
0.5
1.0
1.5
2.0
2.5
<Wright PAV* 16 hr>
64-22 70-22 (SBS) 76-22 B (SBS) 76-22 (Tire Rubber & SBS)
76-22 (Tire Rubber & SBS)
Stre
ss (M
Pa)
Elongation Ratio (L/L0)
64-22
70-22 (SBS)
76-22 (SBS)
Figure 2-26. Force Ductility at 4 oC for PAV* 16 hr Aged Wright Asphalts.
1 20.0
0.5
1.0
1.5
2.0
2.5
<Wright PAV* 32 hr>
64-22 70-22 (SBS) 76-22 B (SBS) 76-22 (Tire Rubber & SBS)
76-22 (Tire Rubber & SBS)
Stre
ss (M
Pa)
Elongation Ratio (L/L0)
64-22 70-22 (SBS)
76-22 (SBS)
Figure 2-27. Force Ductility at 4 oC for PAV* 32 hr Aged Wright Asphalts.
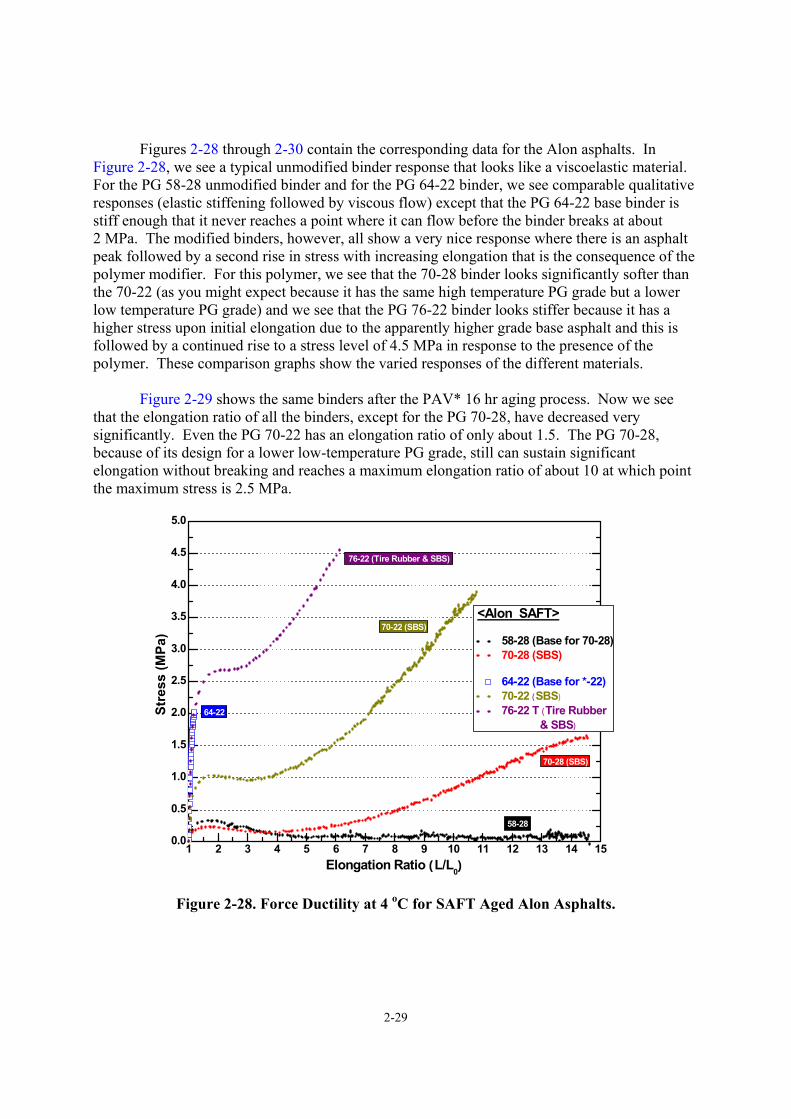
2-29
Figures 2-28 through 2-30 contain the corresponding data for the Alon asphalts. In Figure 2-28, we see a typical unmodified binder response that looks like a viscoelastic material. For the PG 58-28 unmodified binder and for the PG 64-22 binder, we see comparable qualitative responses (elastic stiffening followed by viscous flow) except that the PG 64-22 base binder is stiff enough that it never reaches a point where it can flow before the binder breaks at about 2 MPa. The modified binders, however, all show a very nice response where there is an asphalt peak followed by a second rise in stress with increasing elongation that is the consequence of the polymer modifier. For this polymer, we see that the 70-28 binder looks significantly softer than the 70-22 (as you might expect because it has the same high temperature PG grade but a lower low temperature PG grade) and we see that the PG 76-22 binder looks stiffer because it has a higher stress upon initial elongation due to the apparently higher grade base asphalt and this is followed by a continued rise to a stress level of 4.5 MPa in response to the presence of the polymer. These comparison graphs show the varied responses of the different materials.
Figure 2-29 shows the same binders after the PAV* 16 hr aging process. Now we see
that the elongation ratio of all the binders, except for the PG 70-28, have decreased very significantly. Even the PG 70-22 has an elongation ratio of only about 1.5. The PG 70-28, because of its design for a lower low-temperature PG grade, still can sustain significant elongation without breaking and reaches a maximum elongation ratio of about 10 at which point the maximum stress is 2.5 MPa.
1 2 3 4 5 6 7 8 9 10 11 12 13 14 150.0
0.5
1.0
1.5
2.0
2.5
3.0
3.5
4.0
4.5
5.0
70-22 (SBS)
76-22 (Tire Rubber & SBS)
Stre
ss (M
Pa)
Elongation Ratio (L/L0)
58-28
70-28 (SBS)
64-22
<Alon SAFT>
58-28 (Base for 70-28) 70-28 (SBS)
64-22 (Base for *-22) 70-22 (SBS)
76-22 T (Tire Rubber & SBS)
Figure 2-28. Force Ductility at 4 oC for SAFT Aged Alon Asphalts.
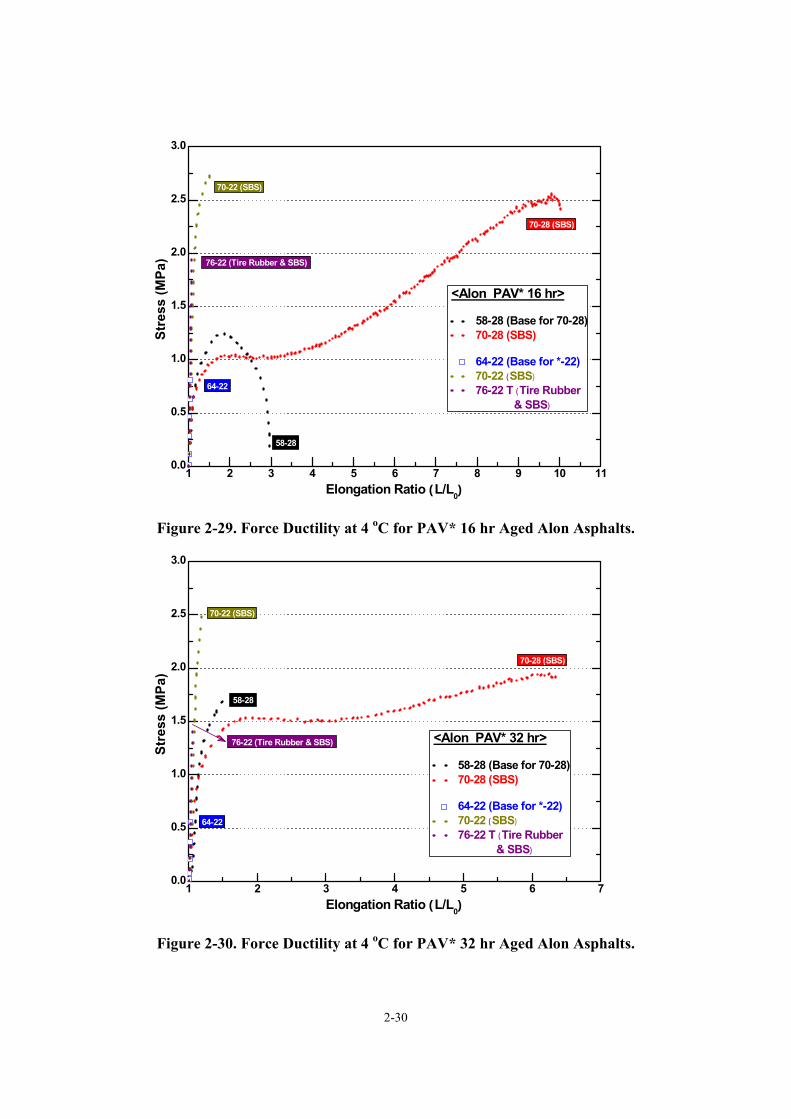
2-30
1 2 3 4 5 6 7 8 9 10 110.0
0.5
1.0
1.5
2.0
2.5
3.0
<Alon PAV* 16 hr>
58-28 (Base for 70-28) 70-28 (SBS)
64-22 (Base for *-22) 70-22 (SBS)
76-22 T (Tire Rubber & SBS)
70-22 (SBS)
76-22 (Tire Rubber & SBS)
Stre
ss (M
Pa)
Elongation Ratio (L/L0)
58-28
70-28 (SBS)
64-22
Figure 2-29. Force Ductility at 4 oC for PAV* 16 hr Aged Alon Asphalts.
1 2 3 4 5 6 70.0
0.5
1.0
1.5
2.0
2.5
3.0
<Alon PAV* 32 hr>
58-28 (Base for 70-28) 70-28 (SBS)
64-22 (Base for *-22) 70-22 (SBS)
76-22 T (Tire Rubber & SBS)
70-22 (SBS)
76-22 (Tire Rubber & SBS)
Stre
ss (M
Pa)
Elongation Ratio (L/L0)
58-28
70-28 (SBS)
64-22
Figure 2-30. Force Ductility at 4 oC for PAV* 32 hr Aged Alon Asphalts.
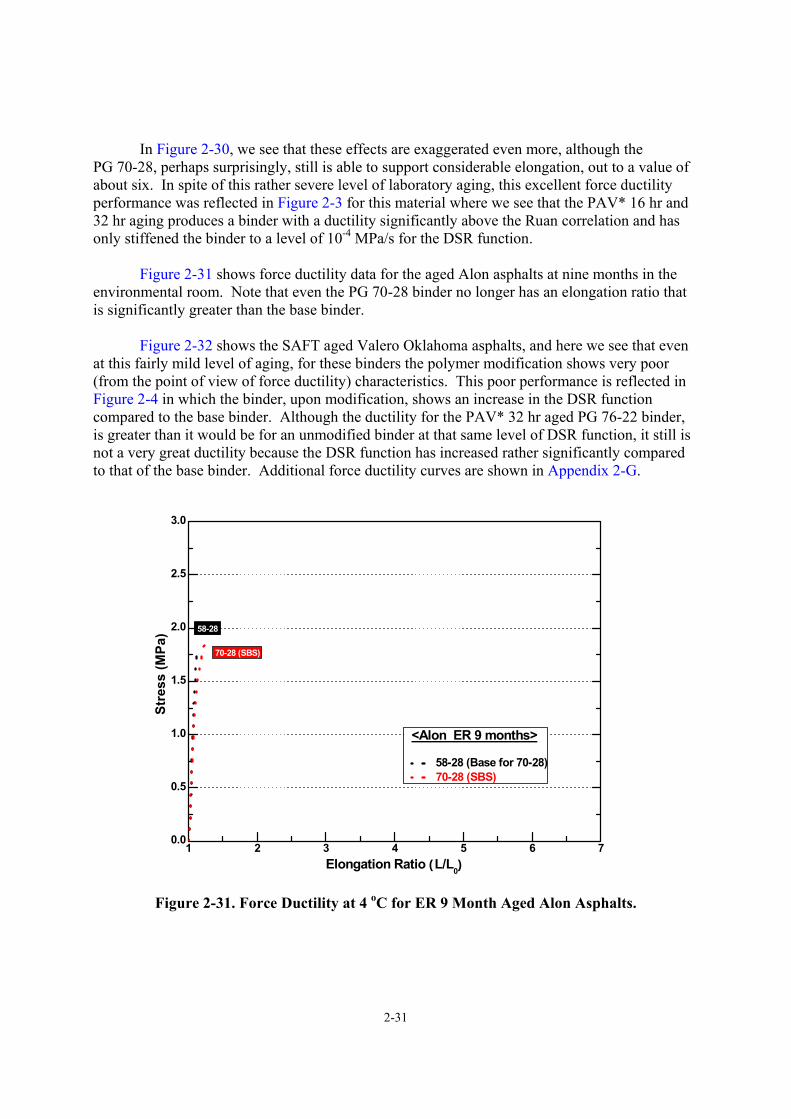
2-31
In Figure 2-30, we see that these effects are exaggerated even more, although the PG 70-28, perhaps surprisingly, still is able to support considerable elongation, out to a value of about six. In spite of this rather severe level of laboratory aging, this excellent force ductility performance was reflected in Figure 2-3 for this material where we see that the PAV* 16 hr and 32 hr aging produces a binder with a ductility significantly above the Ruan correlation and has only stiffened the binder to a level of 10-4 MPa/s for the DSR function.
Figure 2-31 shows force ductility data for the aged Alon asphalts at nine months in the environmental room. Note that even the PG 70-28 binder no longer has an elongation ratio that is significantly greater than the base binder.
Figure 2-32 shows the SAFT aged Valero Oklahoma asphalts, and here we see that even
at this fairly mild level of aging, for these binders the polymer modification shows very poor (from the point of view of force ductility) characteristics. This poor performance is reflected in Figure 2-4 in which the binder, upon modification, shows an increase in the DSR function compared to the base binder. Although the ductility for the PAV* 32 hr aged PG 76-22 binder, is greater than it would be for an unmodified binder at that same level of DSR function, it still is not a very great ductility because the DSR function has increased rather significantly compared to that of the base binder. Additional force ductility curves are shown in Appendix 2-G.
1 2 3 4 5 6 70.0
0.5
1.0
1.5
2.0
2.5
3.0
Stre
ss (M
Pa)
Elongation Ratio (L/L0)
58-28
70-28 (SBS)
<Alon ER 9 months>
58-28 (Base for 70-28) 70-28 (SBS)
Figure 2-31. Force Ductility at 4 oC for ER 9 Month Aged Alon Asphalts.
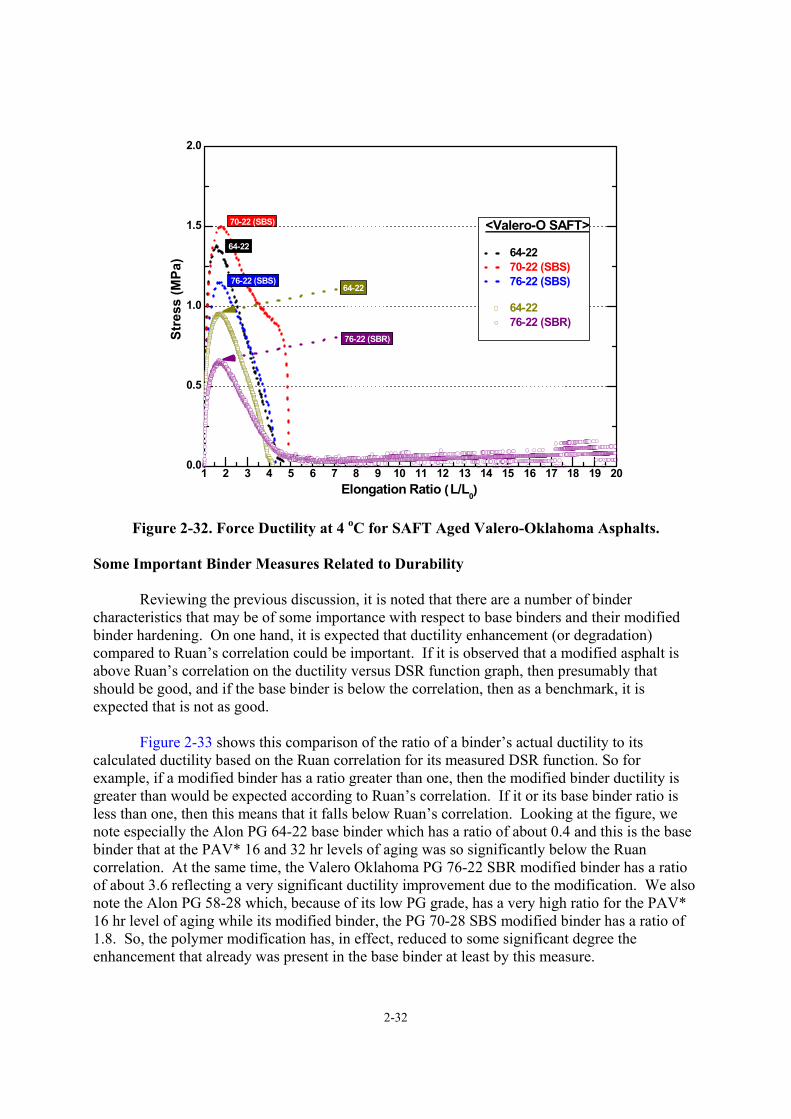
2-32
1 2 3 4 5 6 7 8 9 10 11 12 13 14 15 16 17 18 19 200.0
0.5
1.0
1.5
2.0
76-22 (SBR)
64-22
Stre
ss (M
Pa)
Elongation Ratio (L/L0)
64-22
70-22 (SBS)
76-22 (SBS) SAFT (163 oC, 35 min)
<Valero-O SAFT>
64-22 70-22 (SBS) 76-22 (SBS)
64-22 76-22 (SBR)
Figure 2-32. Force Ductility at 4 oC for SAFT Aged Valero-Oklahoma Asphalts. Some Important Binder Measures Related to Durability
Reviewing the previous discussion, it is noted that there are a number of binder
characteristics that may be of some importance with respect to base binders and their modified binder hardening. On one hand, it is expected that ductility enhancement (or degradation) compared to Ruan’s correlation could be important. If it is observed that a modified asphalt is above Ruan’s correlation on the ductility versus DSR function graph, then presumably that should be good, and if the base binder is below the correlation, then as a benchmark, it is expected that is not as good.
Figure 2-33 shows this comparison of the ratio of a binder’s actual ductility to its
calculated ductility based on the Ruan correlation for its measured DSR function. So for example, if a modified binder has a ratio greater than one, then the modified binder ductility is greater than would be expected according to Ruan’s correlation. If it or its base binder ratio is less than one, then this means that it falls below Ruan’s correlation. Looking at the figure, we note especially the Alon PG 64-22 base binder which has a ratio of about 0.4 and this is the base binder that at the PAV* 16 and 32 hr levels of aging was so significantly below the Ruan correlation. At the same time, the Valero Oklahoma PG 76-22 SBR modified binder has a ratio of about 3.6 reflecting a very significant ductility improvement due to the modification. We also note the Alon PG 58-28 which, because of its low PG grade, has a very high ratio for the PAV* 16 hr level of aging while its modified binder, the PG 70-28 SBS modified binder has a ratio of 1.8. So, the polymer modification has, in effect, reduced to some significant degree the enhancement that already was present in the base binder at least by this measure.
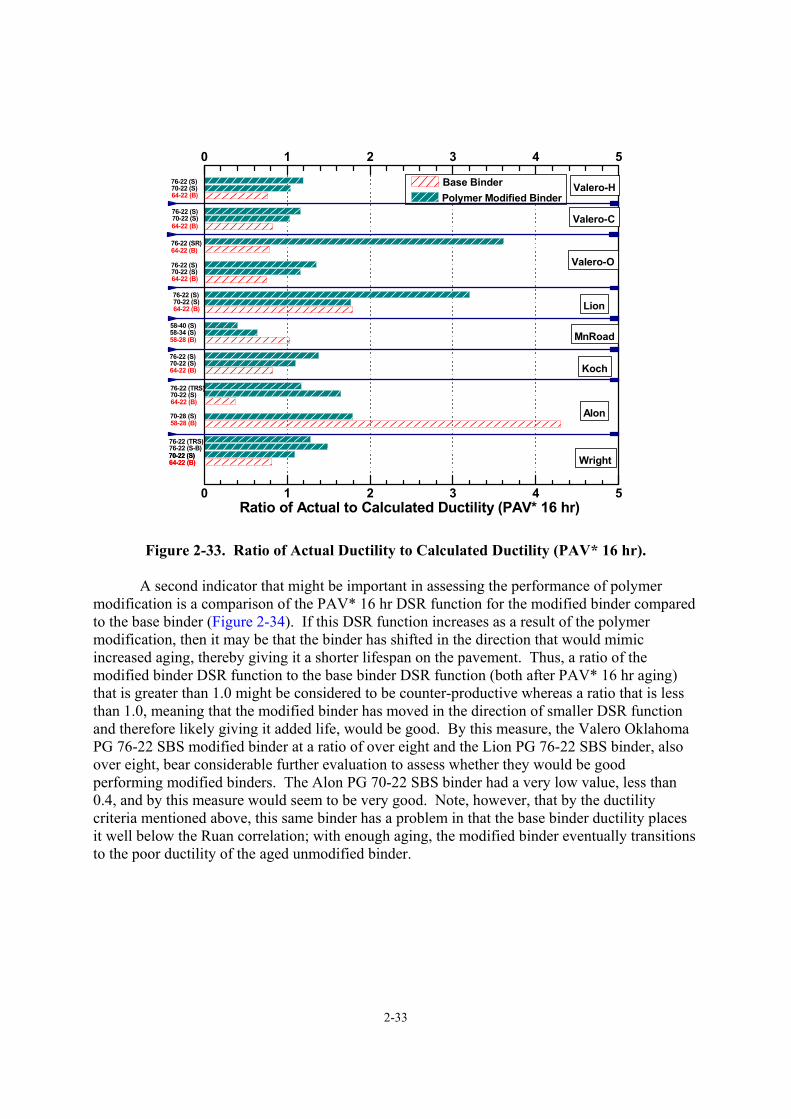
2-33
0 1 2 3 4 5
0 1 2 3 4 5
Base Binder Polymer Modified Binder
76-22 (TRS)76-22 (S-B)70-22 (S)
Valero-H
Valero-C
Valero-O
Lion
MnRoad
Koch
Alon
Wright
Ratio of Actual to Calculated Ductility (PAV* 16 hr)
64-22 (B)
76-22 (TRS)70-22 (S)64-22 (B)
70-28 (S)58-28 (B)
70-22 (S)64-22 (B)
76-22 (S)70-22 (S)64-22 (B)
58-40 (S)58-34 (S)58-28 (B)
76-22 (S)70-22 (S)64-22 (B)
76-22 (S)70-22 (S)64-22 (B)
76-22 (S)70-22 (S)64-22 (B)
76-22 (SR)64-22 (B)
76-22 (S)70-22 (S)64-22 (B)
Figure 2-33. Ratio of Actual Ductility to Calculated Ductility (PAV* 16 hr).
A second indicator that might be important in assessing the performance of polymer modification is a comparison of the PAV* 16 hr DSR function for the modified binder compared to the base binder (Figure 2-34). If this DSR function increases as a result of the polymer modification, then it may be that the binder has shifted in the direction that would mimic increased aging, thereby giving it a shorter lifespan on the pavement. Thus, a ratio of the modified binder DSR function to the base binder DSR function (both after PAV* 16 hr aging) that is greater than 1.0 might be considered to be counter-productive whereas a ratio that is less than 1.0, meaning that the modified binder has moved in the direction of smaller DSR function and therefore likely giving it added life, would be good. By this measure, the Valero Oklahoma PG 76-22 SBS modified binder at a ratio of over eight and the Lion PG 76-22 SBS binder, also over eight, bear considerable further evaluation to assess whether they would be good performing modified binders. The Alon PG 70-22 SBS binder had a very low value, less than 0.4, and by this measure would seem to be very good. Note, however, that by the ductility criteria mentioned above, this same binder has a problem in that the base binder ductility places it well below the Ruan correlation; with enough aging, the modified binder eventually transitions to the poor ductility of the aged unmodified binder.
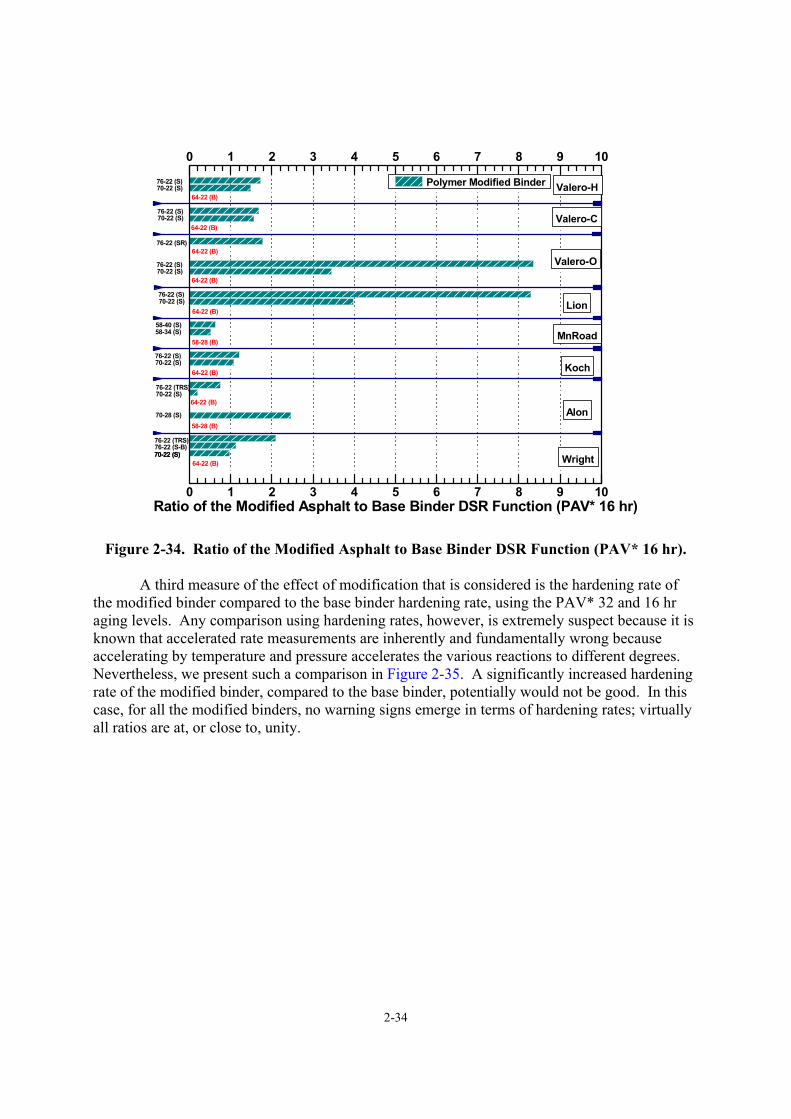
2-34
0 1 2 3 4 5 6 7 8 9 10
0 1 2 3 4 5 6 7 8 9 10
Polymer Modified Binder
76-22 (TRS)76-22 (S-B)70-22 (S)
Valero-H
Valero-C
Valero-O
Lion
MnRoad
Koch
Alon
Wright
Ratio of the Modified Asphalt to Base Binder DSR Function (PAV* 16 hr)
76-22 (TRS)70-22 (S)
64-22 (B)
70-28 (S)58-28 (B)
70-22 (S)64-22 (B)
76-22 (S)70-22 (S)
64-22 (B)
58-40 (S)58-34 (S)
58-28 (B)
76-22 (S)70-22 (S)
64-22 (B)
76-22 (S)70-22 (S)
64-22 (B)
76-22 (S)70-22 (S)
64-22 (B)
76-22 (SR)64-22 (B)
76-22 (S)70-22 (S)
64-22 (B)
Figure 2-34. Ratio of the Modified Asphalt to Base Binder DSR Function (PAV* 16 hr). A third measure of the effect of modification that is considered is the hardening rate of
the modified binder compared to the base binder hardening rate, using the PAV* 32 and 16 hr aging levels. Any comparison using hardening rates, however, is extremely suspect because it is known that accelerated rate measurements are inherently and fundamentally wrong because accelerating by temperature and pressure accelerates the various reactions to different degrees. Nevertheless, we present such a comparison in Figure 2-35. A significantly increased hardening rate of the modified binder, compared to the base binder, potentially would not be good. In this case, for all the modified binders, no warning signs emerge in terms of hardening rates; virtually all ratios are at, or close to, unity.
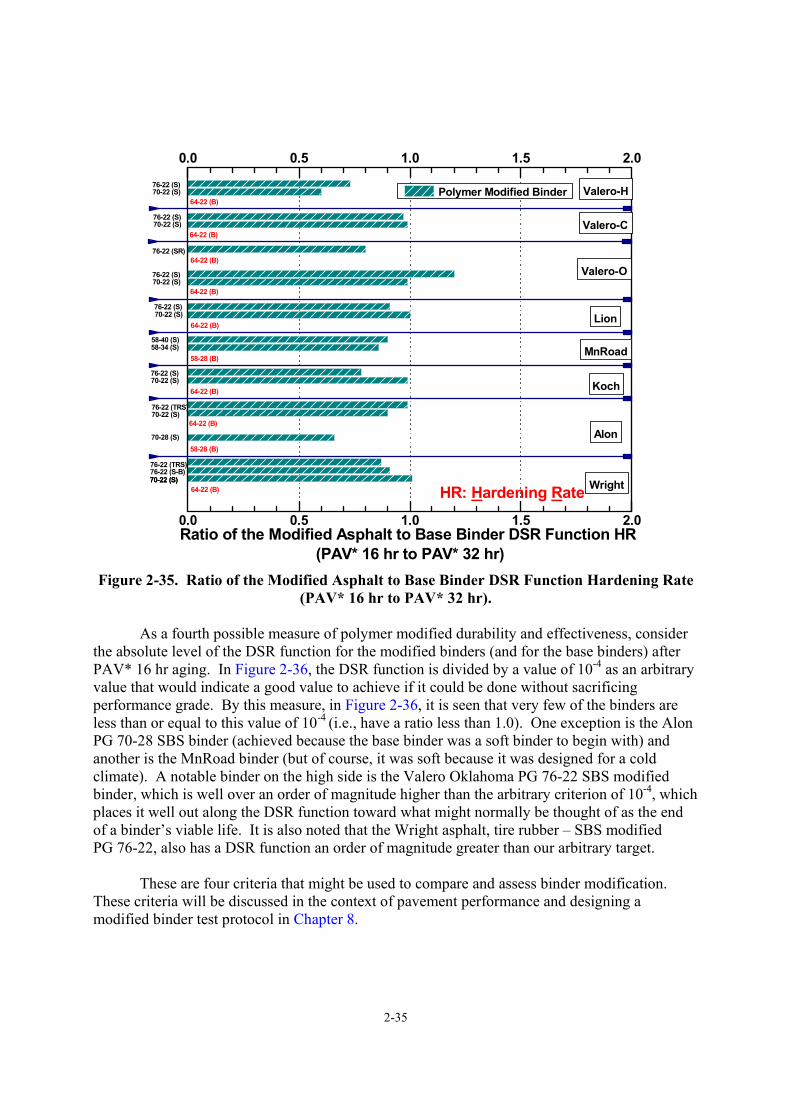
2-35
0.0 0.5 1.0 1.5 2.0
0.0 0.5 1.0 1.5 2.0
Polymer Modified Binder
76-22 (TRS)76-22 (S-B)70-22 (S)
Valero-H
Valero-C
Valero-O
Lion
MnRoad
Koch
Alon
Wright
Ratio of the Modified Asphalt to Base Binder DSR Function HR (PAV* 16 hr to PAV* 32 hr)
76-22 (TRS)70-22 (S)
64-22 (B)
70-28 (S)58-28 (B)
70-22 (S)64-22 (B)
76-22 (S)70-22 (S)
64-22 (B)
58-40 (S)58-34 (S)
58-28 (B)
76-22 (S)70-22 (S)
64-22 (B)
76-22 (S)70-22 (S)
64-22 (B)
76-22 (S)70-22 (S)
64-22 (B)
76-22 (SR)64-22 (B)
76-22 (S)70-22 (S)
64-22 (B)
HR: Hardening Rate
Figure 2-35. Ratio of the Modified Asphalt to Base Binder DSR Function Hardening Rate
(PAV* 16 hr to PAV* 32 hr).
As a fourth possible measure of polymer modified durability and effectiveness, consider the absolute level of the DSR function for the modified binders (and for the base binders) after PAV* 16 hr aging. In Figure 2-36, the DSR function is divided by a value of 10-4 as an arbitrary value that would indicate a good value to achieve if it could be done without sacrificing performance grade. By this measure, in Figure 2-36, it is seen that very few of the binders are less than or equal to this value of 10-4 (i.e., have a ratio less than 1.0). One exception is the Alon PG 70-28 SBS binder (achieved because the base binder was a soft binder to begin with) and another is the MnRoad binder (but of course, it was soft because it was designed for a cold climate). A notable binder on the high side is the Valero Oklahoma PG 76-22 SBS modified binder, which is well over an order of magnitude higher than the arbitrary criterion of 10-4, which places it well out along the DSR function toward what might normally be thought of as the end of a binder’s viable life. It is also noted that the Wright asphalt, tire rubber – SBS modified PG 76-22, also has a DSR function an order of magnitude greater than our arbitrary target.
These are four criteria that might be used to compare and assess binder modification. These criteria will be discussed in the context of pavement performance and designing a modified binder test protocol in Chapter 8.
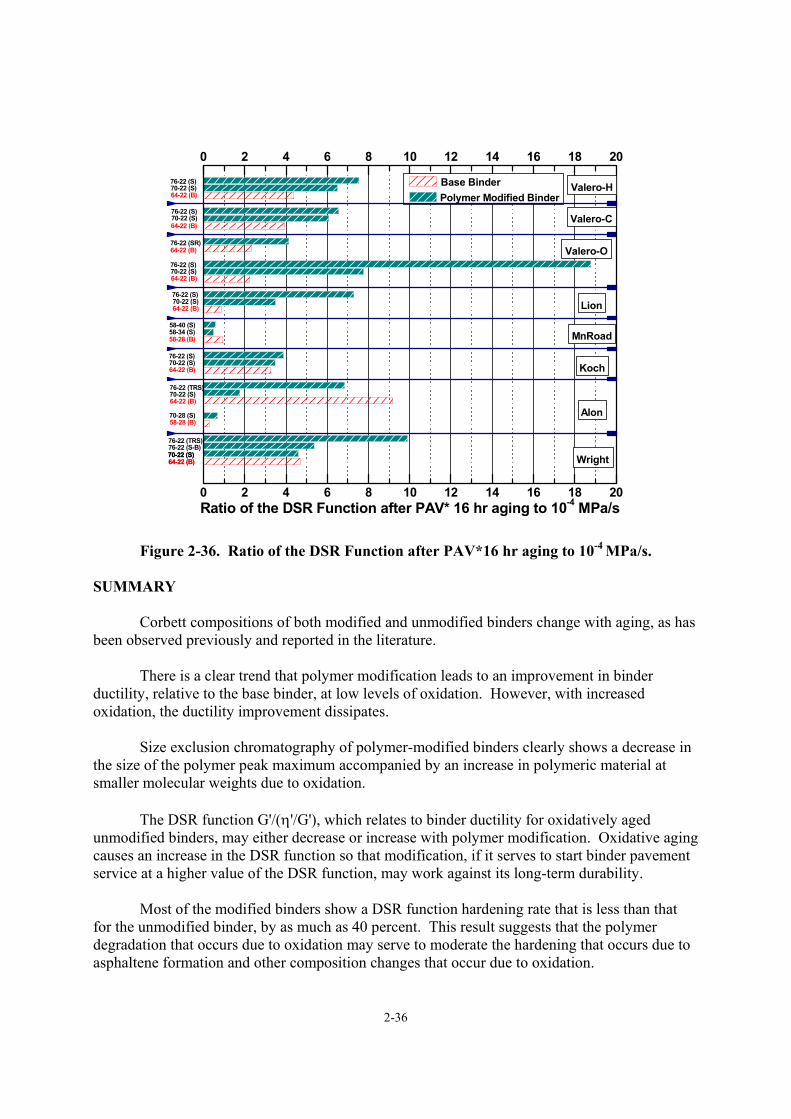
2-36
0 2 4 6 8 10 12 14 16 18 20
0 2 4 6 8 10 12 14 16 18 20
Base Binder Polymer Modified Binder
76-22 (TRS)76-22 (S-B)70-22 (S)
Valero-H
Valero-C
Valero-O
Lion
MnRoad
Koch
Alon
Wright
Ratio of the DSR Function after PAV* 16 hr aging to 10-4 MPa/s
64-22 (B)
76-22 (TRS)70-22 (S)64-22 (B)
70-28 (S)58-28 (B)
70-22 (S)64-22 (B)
76-22 (S)70-22 (S)64-22 (B)
58-40 (S)58-34 (S)58-28 (B)
76-22 (S)70-22 (S)64-22 (B)
76-22 (S)70-22 (S)64-22 (B)
76-22 (S)70-22 (S)64-22 (B)
76-22 (SR)64-22 (B)
76-22 (S)70-22 (S)64-22 (B)
Figure 2-36. Ratio of the DSR Function after PAV*16 hr aging to 10-4 MPa/s. SUMMARY Corbett compositions of both modified and unmodified binders change with aging, as has been observed previously and reported in the literature. There is a clear trend that polymer modification leads to an improvement in binder ductility, relative to the base binder, at low levels of oxidation. However, with increased oxidation, the ductility improvement dissipates. Size exclusion chromatography of polymer-modified binders clearly shows a decrease in the size of the polymer peak maximum accompanied by an increase in polymeric material at smaller molecular weights due to oxidation. The DSR function G'/(η'/G'), which relates to binder ductility for oxidatively aged unmodified binders, may either decrease or increase with polymer modification. Oxidative aging causes an increase in the DSR function so that modification, if it serves to start binder pavement service at a higher value of the DSR function, may work against its long-term durability. Most of the modified binders show a DSR function hardening rate that is less than that for the unmodified binder, by as much as 40 percent. This result suggests that the polymer degradation that occurs due to oxidation may serve to moderate the hardening that occurs due to asphaltene formation and other composition changes that occur due to oxidation.
3-1
CHAPTER 3
EFFECTIVENESS OF POLYMER MODIFIER AFTER AGING
INTRODUCTION
It is well known that early failure of asphalt pavement, such as rutting (permanent deformation) usually results from inadequate initial mixture properties, while later-term failure can be the result of significant changes to the pavement due to fatigue and oxidative aging of the asphalt binder. In order to reduce the deterioration and cracking of pavements that result in huge maintenance expenditures, efforts have been made to improve the properties of asphalt binders with regard to increased resistance to high-temperature rutting, fatigue, and low-temperature thermal cracking.
Polymer modified asphalt (PMA), which is the blending and interaction of polymers in a base asphalt binder, has been used with increasing frequency for the construction of pavements, primarily due to its ability to stiffen the binder at high temperature but without stiffening it at low temperatures, resulting in reduced permanent deformation without harming thermal cracking. In addition, it was found that polymer modifiers in some cases were able to decrease the deleterious impact of binder oxidative aging and thereby result in more durable pavements (Ruan et al., 2003a, 2003b; Leicht et al., 2001; Lu and Isacsson, 1997a, 2000, and 2001).
The properties of PMA depend upon the characteristics and content of the polymer, the
nature of the base asphalt binder, and the preparation process. For the modification of asphalt binder, two kinds of polymeric additives, elastomers and plastomers, typically are used. The styrenic block copolymer, which is termed thermoplastic rubber or elastomer, has proved to have the greatest potential when blended with asphalt binder. Therefore, the modification of asphalt binder using styrene-butadiene-styrene (SBS) has been widely studied (Lu and Isacsson, 1997b).
Several reported studies indicated that oxidation of SBS modified asphalt resulted in an
increase of asphaltenes in base binders, and SEC chromatography indicated that polymer modifiers degraded to a lower molecular size (Ruan et al., 2003a; Lu and Isacsson, 1997a). In addition, researchers found that oxidative aging could either increase or decrease the temperature susceptibility of SBS modified asphalt due to competing effects. Increased asphaltenes decrease temperature susceptibility while degradation of the polymer modifier increases temperature susceptibility (Lu and Isacsson, 1997a, 2000, and 2001). The net change in temperature susceptibility depends upon which effect is greater.
While SBS modified asphalt may positively improve the durability of pavements, there is a need to quantify the effectiveness of polymer modification and its interaction with the base binder as oxidative aging progresses, in light of the accompanying base binder stiffening and polymer degradation (Ruan et al., 2003a and 2003b; Lu and Isacsson, 2001). Such detailed data and understanding will lead to better PMA preparation and to better durability and life-cycle cost.
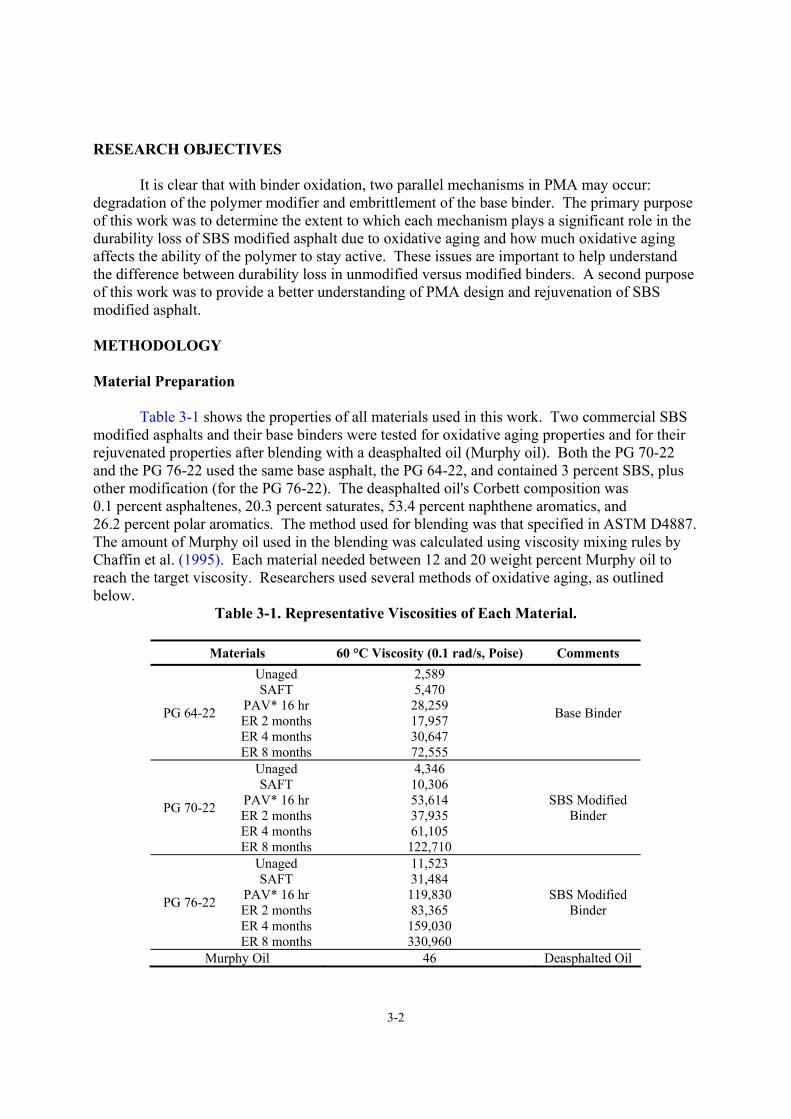
3-2
RESEARCH OBJECTIVES
It is clear that with binder oxidation, two parallel mechanisms in PMA may occur: degradation of the polymer modifier and embrittlement of the base binder. The primary purpose of this work was to determine the extent to which each mechanism plays a significant role in the durability loss of SBS modified asphalt due to oxidative aging and how much oxidative aging affects the ability of the polymer to stay active. These issues are important to help understand the difference between durability loss in unmodified versus modified binders. A second purpose of this work was to provide a better understanding of PMA design and rejuvenation of SBS modified asphalt. METHODOLOGY Material Preparation
Table 3-1 shows the properties of all materials used in this work. Two commercial SBS modified asphalts and their base binders were tested for oxidative aging properties and for their rejuvenated properties after blending with a deasphalted oil (Murphy oil). Both the PG 70-22 and the PG 76-22 used the same base asphalt, the PG 64-22, and contained 3 percent SBS, plus other modification (for the PG 76-22). The deasphalted oil's Corbett composition was 0.1 percent asphaltenes, 20.3 percent saturates, 53.4 percent naphthene aromatics, and 26.2 percent polar aromatics. The method used for blending was that specified in ASTM D4887. The amount of Murphy oil used in the blending was calculated using viscosity mixing rules by Chaffin et al. (1995). Each material needed between 12 and 20 weight percent Murphy oil to reach the target viscosity. Researchers used several methods of oxidative aging, as outlined below.
Table 3-1. Representative Viscosities of Each Material.
Materials 60 °C Viscosity (0.1 rad/s, Poise) Comments
PG 64-22
Unaged SAFT
PAV* 16 hr ER 2 months ER 4 months ER 8 months
2,589 5,470
28,259 17,957 30,647 72,555
Base Binder
PG 70-22
Unaged SAFT
PAV* 16 hr ER 2 months ER 4 months ER 8 months
4,346 10,306 53,614 37,935 61,105 122,710
SBS Modified Binder
PG 76-22
Unaged SAFT
PAV* 16 hr ER 2 months ER 4 months ER 8 months
11,523 31,484 119,830 83,365 159,030 330,960
SBS Modified Binder
Murphy Oil 46 Deasphalted Oil
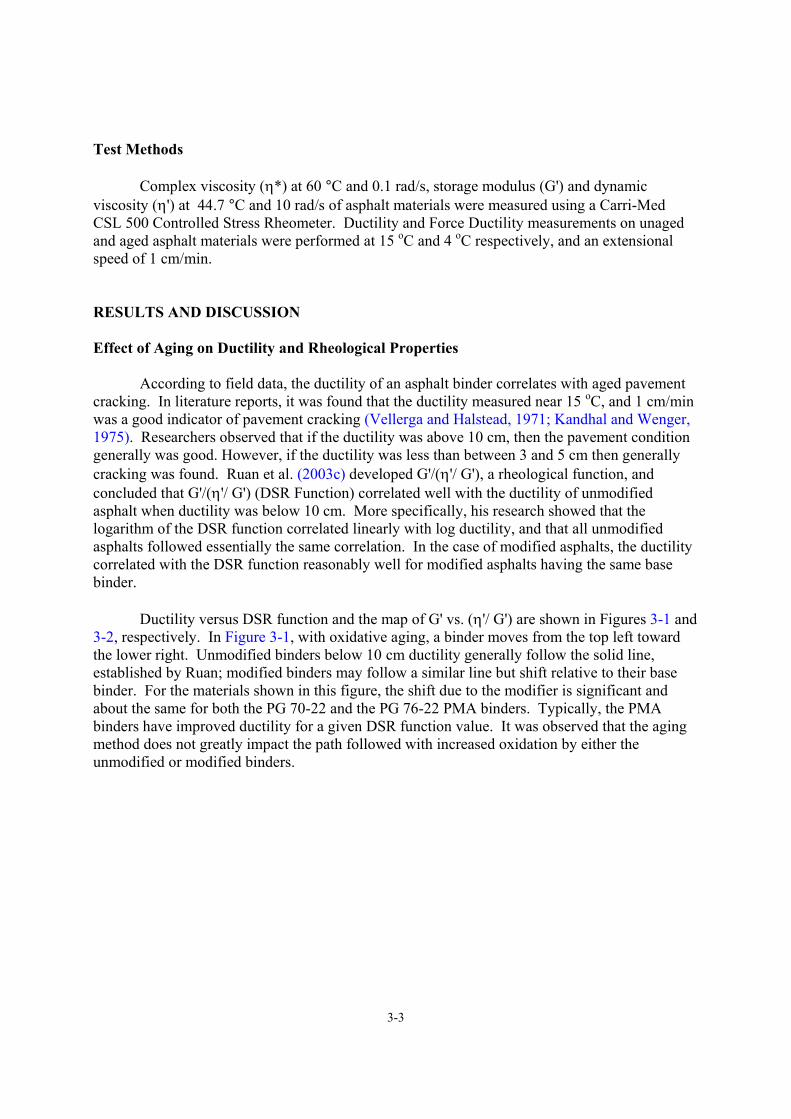
3-3
Test Methods
Complex viscosity (η*) at 60 °C and 0.1 rad/s, storage modulus (G') and dynamic viscosity (η') at 44.7 °C and 10 rad/s of asphalt materials were measured using a Carri-Med CSL 500 Controlled Stress Rheometer. Ductility and Force Ductility measurements on unaged and aged asphalt materials were performed at 15 oC and 4 oC respectively, and an extensional speed of 1 cm/min. RESULTS AND DISCUSSION Effect of Aging on Ductility and Rheological Properties
According to field data, the ductility of an asphalt binder correlates with aged pavement cracking. In literature reports, it was found that the ductility measured near 15 oC, and 1 cm/min was a good indicator of pavement cracking (Vellerga and Halstead, 1971; Kandhal and Wenger, 1975). Researchers observed that if the ductility was above 10 cm, then the pavement condition generally was good. However, if the ductility was less than between 3 and 5 cm then generally cracking was found. Ruan et al. (2003c) developed G'/(η'/ G'), a rheological function, and concluded that G'/(η'/ G') (DSR Function) correlated well with the ductility of unmodified asphalt when ductility was below 10 cm. More specifically, his research showed that the logarithm of the DSR function correlated linearly with log ductility, and that all unmodified asphalts followed essentially the same correlation. In the case of modified asphalts, the ductility correlated with the DSR function reasonably well for modified asphalts having the same base binder. Ductility versus DSR function and the map of G' vs. (η'/ G') are shown in Figures 3-1 and 3-2, respectively. In Figure 3-1, with oxidative aging, a binder moves from the top left toward the lower right. Unmodified binders below 10 cm ductility generally follow the solid line, established by Ruan; modified binders may follow a similar line but shift relative to their base binder. For the materials shown in this figure, the shift due to the modifier is significant and about the same for both the PG 70-22 and the PG 76-22 PMA binders. Typically, the PMA binders have improved ductility for a given DSR function value. It was observed that the aging method does not greatly impact the path followed with increased oxidation by either the unmodified or modified binders.
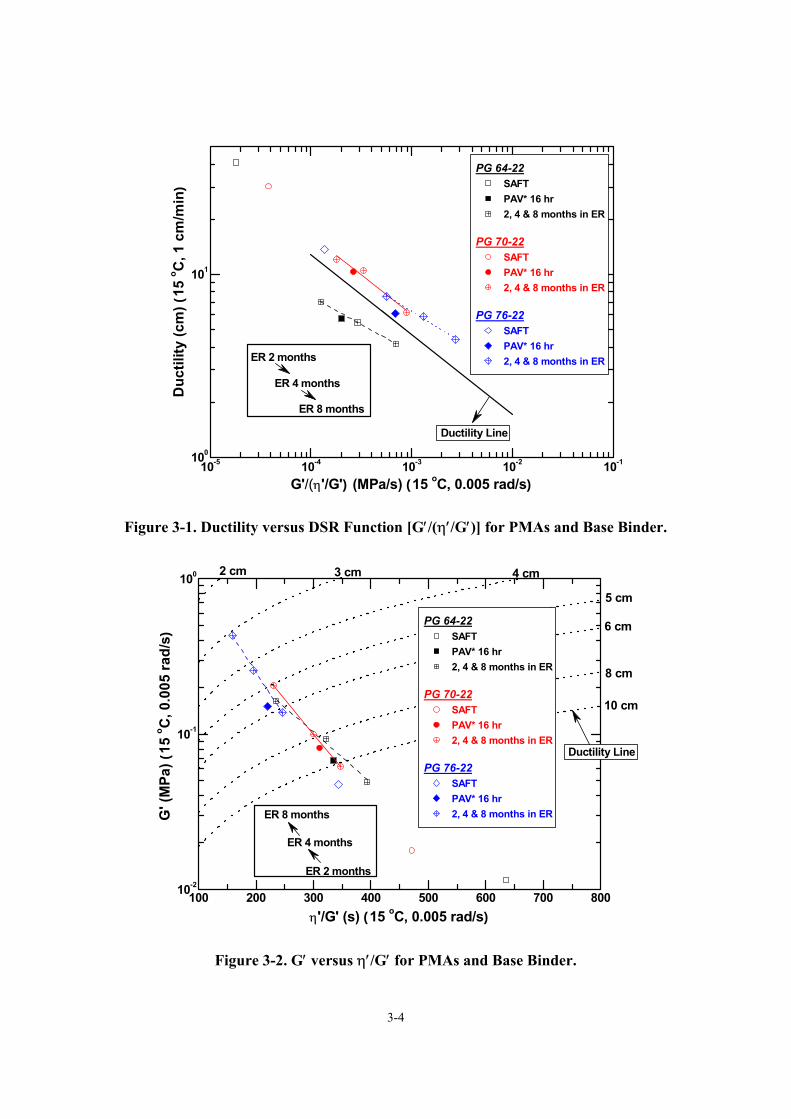
3-4
10-5 10-4 10-3 10-2 10-1100
101
ER 8 months
ER 4 months
PG 64-22 SAFT PAV* 16 hr 2, 4 & 8 months in ER
PG 70-22 SAFT PAV* 16 hr 2, 4 & 8 months in ER
PG 76-22 SAFT PAV* 16 hr 2, 4 & 8 months in ER
Ductility Line
Duc
tility
(cm
) (15
o C, 1
cm
/min
)
G'/(η'/G') (MPa/s) (15 oC, 0.005 rad/s)
ER 2 months
Figure 3-1. Ductility versus DSR Function [G′/(η′/G′)] for PMAs and Base Binder.
100 200 300 400 500 600 700 80010-2
10-1
100
Ductility Line
PG 64-22 SAFT PAV* 16 hr 2, 4 & 8 months in ER
PG 70-22 SAFT PAV* 16 hr 2, 4 & 8 months in ER
PG 76-22 SAFT PAV* 16 hr 2, 4 & 8 months in ER
G' (
MPa
) (15
o C, 0
.005
rad/
s)
η'/G' (s) (15 oC, 0.005 rad/s)
8 cm
10 cm
5 cm
6 cm
3 cm 4 cm2 cm
ER 8 months
ER 4 months
ER 2 months
Figure 3-2. G′ versus η′/G′ for PMAs and Base Binder.
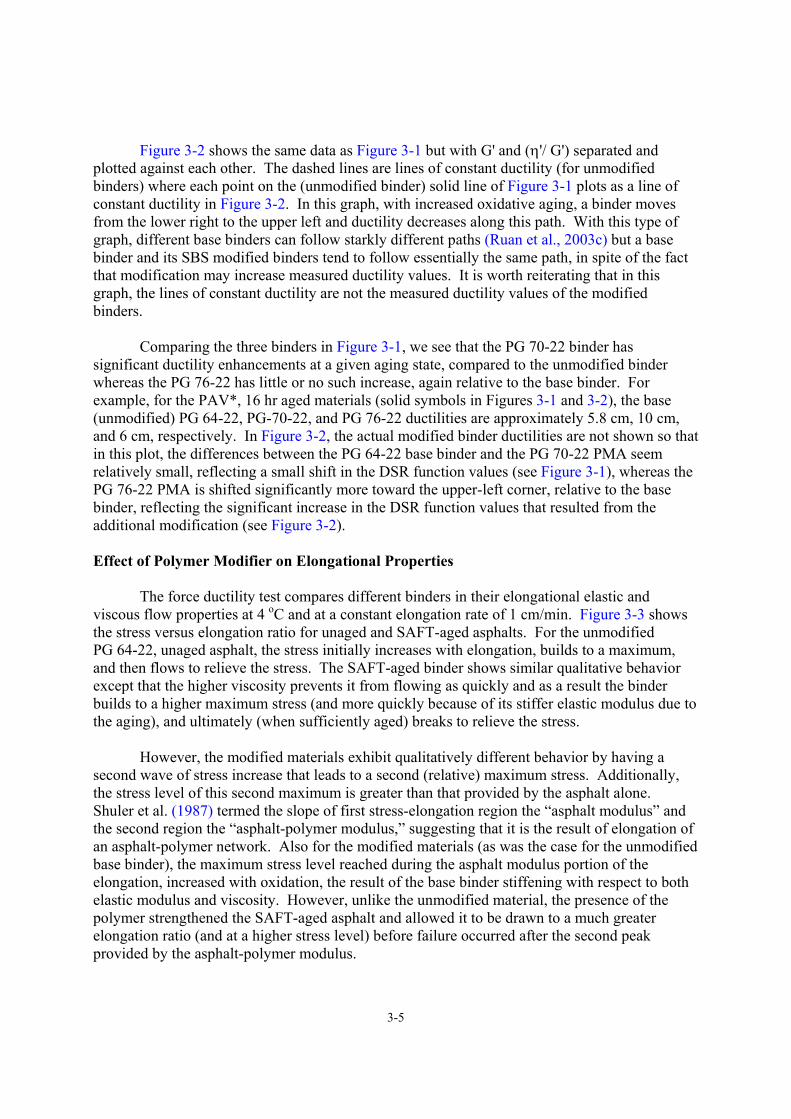
3-5
Figure 3-2 shows the same data as Figure 3-1 but with G' and (η'/ G') separated and plotted against each other. The dashed lines are lines of constant ductility (for unmodified binders) where each point on the (unmodified binder) solid line of Figure 3-1 plots as a line of constant ductility in Figure 3-2. In this graph, with increased oxidative aging, a binder moves from the lower right to the upper left and ductility decreases along this path. With this type of graph, different base binders can follow starkly different paths (Ruan et al., 2003c) but a base binder and its SBS modified binders tend to follow essentially the same path, in spite of the fact that modification may increase measured ductility values. It is worth reiterating that in this graph, the lines of constant ductility are not the measured ductility values of the modified binders.
Comparing the three binders in Figure 3-1, we see that the PG 70-22 binder has
significant ductility enhancements at a given aging state, compared to the unmodified binder whereas the PG 76-22 has little or no such increase, again relative to the base binder. For example, for the PAV*, 16 hr aged materials (solid symbols in Figures 3-1 and 3-2), the base (unmodified) PG 64-22, PG-70-22, and PG 76-22 ductilities are approximately 5.8 cm, 10 cm, and 6 cm, respectively. In Figure 3-2, the actual modified binder ductilities are not shown so that in this plot, the differences between the PG 64-22 base binder and the PG 70-22 PMA seem relatively small, reflecting a small shift in the DSR function values (see Figure 3-1), whereas the PG 76-22 PMA is shifted significantly more toward the upper-left corner, relative to the base binder, reflecting the significant increase in the DSR function values that resulted from the additional modification (see Figure 3-2). Effect of Polymer Modifier on Elongational Properties
The force ductility test compares different binders in their elongational elastic and viscous flow properties at 4 oC and at a constant elongation rate of 1 cm/min. Figure 3-3 shows the stress versus elongation ratio for unaged and SAFT-aged asphalts. For the unmodified PG 64-22, unaged asphalt, the stress initially increases with elongation, builds to a maximum, and then flows to relieve the stress. The SAFT-aged binder shows similar qualitative behavior except that the higher viscosity prevents it from flowing as quickly and as a result the binder builds to a higher maximum stress (and more quickly because of its stiffer elastic modulus due to the aging), and ultimately (when sufficiently aged) breaks to relieve the stress.
However, the modified materials exhibit qualitatively different behavior by having a
second wave of stress increase that leads to a second (relative) maximum stress. Additionally, the stress level of this second maximum is greater than that provided by the asphalt alone. Shuler et al. (1987) termed the slope of first stress-elongation region the “asphalt modulus” and the second region the “asphalt-polymer modulus,” suggesting that it is the result of elongation of an asphalt-polymer network. Also for the modified materials (as was the case for the unmodified base binder), the maximum stress level reached during the asphalt modulus portion of the elongation, increased with oxidation, the result of the base binder stiffening with respect to both elastic modulus and viscosity. However, unlike the unmodified material, the presence of the polymer strengthened the SAFT-aged asphalt and allowed it to be drawn to a much greater elongation ratio (and at a higher stress level) before failure occurred after the second peak provided by the asphalt-polymer modulus.
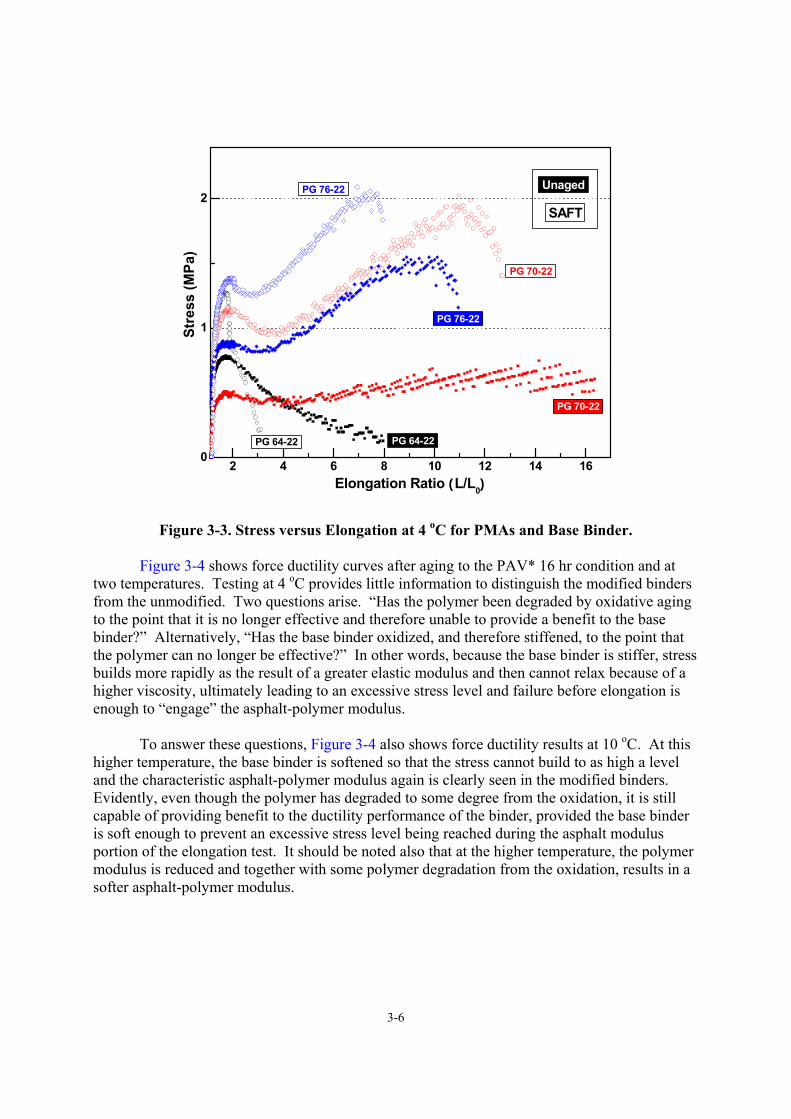
3-6
2 4 6 8 10 12 14 160
1
2Unaged
SAFT
PG 70-22
PG 76-22
PG 64-22
PG 70-22
PG 76-22
Stre
ss (M
Pa)
Elongation Ratio (L/L0)
PG 64-22
Figure 3-3. Stress versus Elongation at 4 oC for PMAs and Base Binder.
Figure 3-4 shows force ductility curves after aging to the PAV* 16 hr condition and at two temperatures. Testing at 4 oC provides little information to distinguish the modified binders from the unmodified. Two questions arise. “Has the polymer been degraded by oxidative aging to the point that it is no longer effective and therefore unable to provide a benefit to the base binder?” Alternatively, “Has the base binder oxidized, and therefore stiffened, to the point that the polymer can no longer be effective?” In other words, because the base binder is stiffer, stress builds more rapidly as the result of a greater elastic modulus and then cannot relax because of a higher viscosity, ultimately leading to an excessive stress level and failure before elongation is enough to “engage” the asphalt-polymer modulus.
To answer these questions, Figure 3-4 also shows force ductility results at 10 oC. At this
higher temperature, the base binder is softened so that the stress cannot build to as high a level and the characteristic asphalt-polymer modulus again is clearly seen in the modified binders. Evidently, even though the polymer has degraded to some degree from the oxidation, it is still capable of providing benefit to the ductility performance of the binder, provided the base binder is soft enough to prevent an excessive stress level being reached during the asphalt modulus portion of the elongation test. It should be noted also that at the higher temperature, the polymer modulus is reduced and together with some polymer degradation from the oxidation, results in a softer asphalt-polymer modulus.
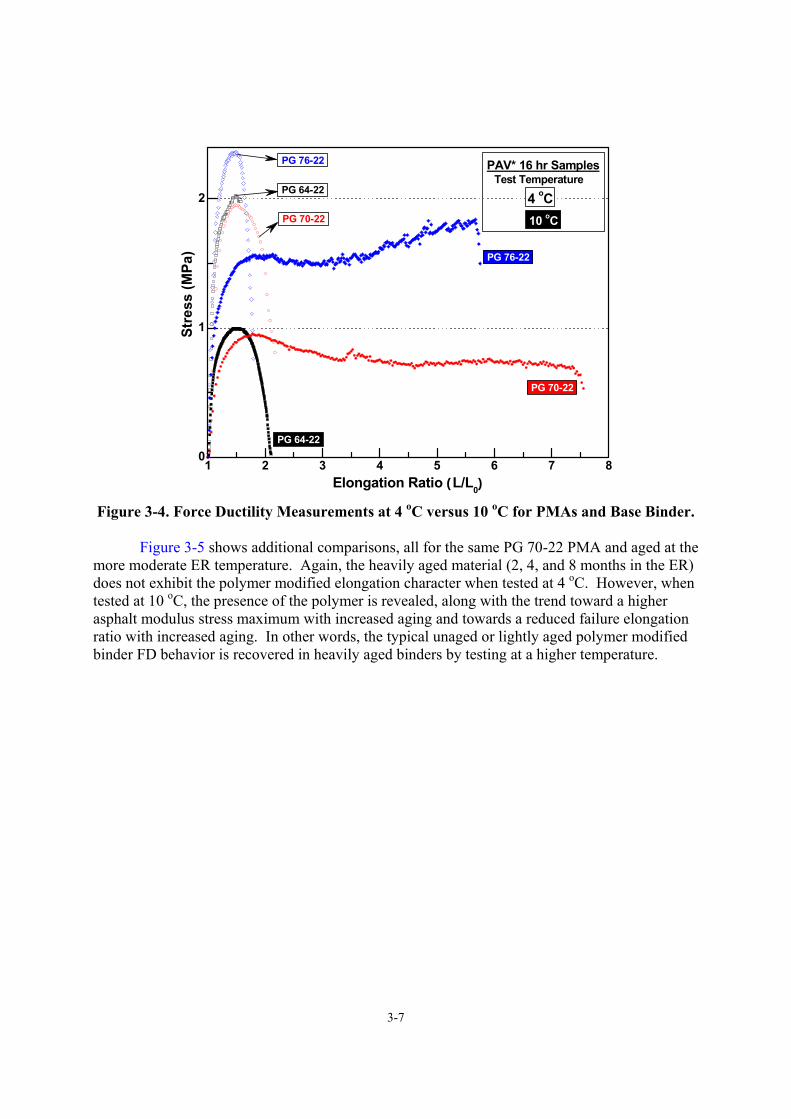
3-7
1 2 3 4 5 6 7 80
1
2PG 64-22
PG 76-22
PG 70-22
Stre
ss (M
Pa)
Elongation Ratio (L/L0)
PG 70-22
PG 76-22
PG 64-22
10 oC
4 oC
PAV* 16 hr SamplesTest Temperature
Figure 3-4. Force Ductility Measurements at 4 oC versus 10 oC for PMAs and Base Binder.
Figure 3-5 shows additional comparisons, all for the same PG 70-22 PMA and aged at the
more moderate ER temperature. Again, the heavily aged material (2, 4, and 8 months in the ER) does not exhibit the polymer modified elongation character when tested at 4 oC. However, when tested at 10 oC, the presence of the polymer is revealed, along with the trend toward a higher asphalt modulus stress maximum with increased aging and towards a reduced failure elongation ratio with increased aging. In other words, the typical unaged or lightly aged polymer modified binder FD behavior is recovered in heavily aged binders by testing at a higher temperature.
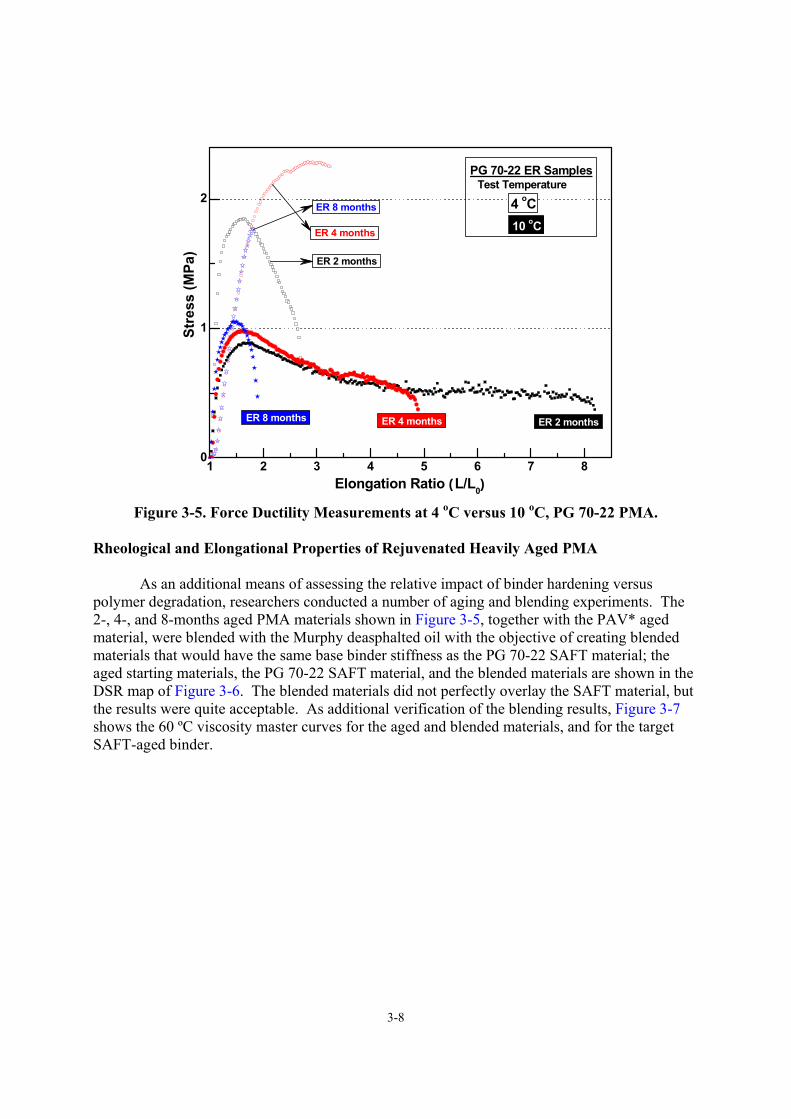
3-8
1 2 3 4 5 6 7 80
1
2
ER 4 months
ER 8 months
ER 2 months
Stre
ss (M
Pa)
Elongation Ratio (L/L0)
ER 2 monthsER 4 monthsER 8 months
10 oC
4 oC
PG 70-22 ER SamplesTest Temperature
Figure 3-5. Force Ductility Measurements at 4 oC versus 10 oC, PG 70-22 PMA.
Rheological and Elongational Properties of Rejuvenated Heavily Aged PMA
As an additional means of assessing the relative impact of binder hardening versus polymer degradation, researchers conducted a number of aging and blending experiments. The 2-, 4-, and 8-months aged PMA materials shown in Figure 3-5, together with the PAV* aged material, were blended with the Murphy deasphalted oil with the objective of creating blended materials that would have the same base binder stiffness as the PG 70-22 SAFT material; the aged starting materials, the PG 70-22 SAFT material, and the blended materials are shown in the DSR map of Figure 3-6. The blended materials did not perfectly overlay the SAFT material, but the results were quite acceptable. As additional verification of the blending results, Figure 3-7 shows the 60 ºC viscosity master curves for the aged and blended materials, and for the target SAFT-aged binder.
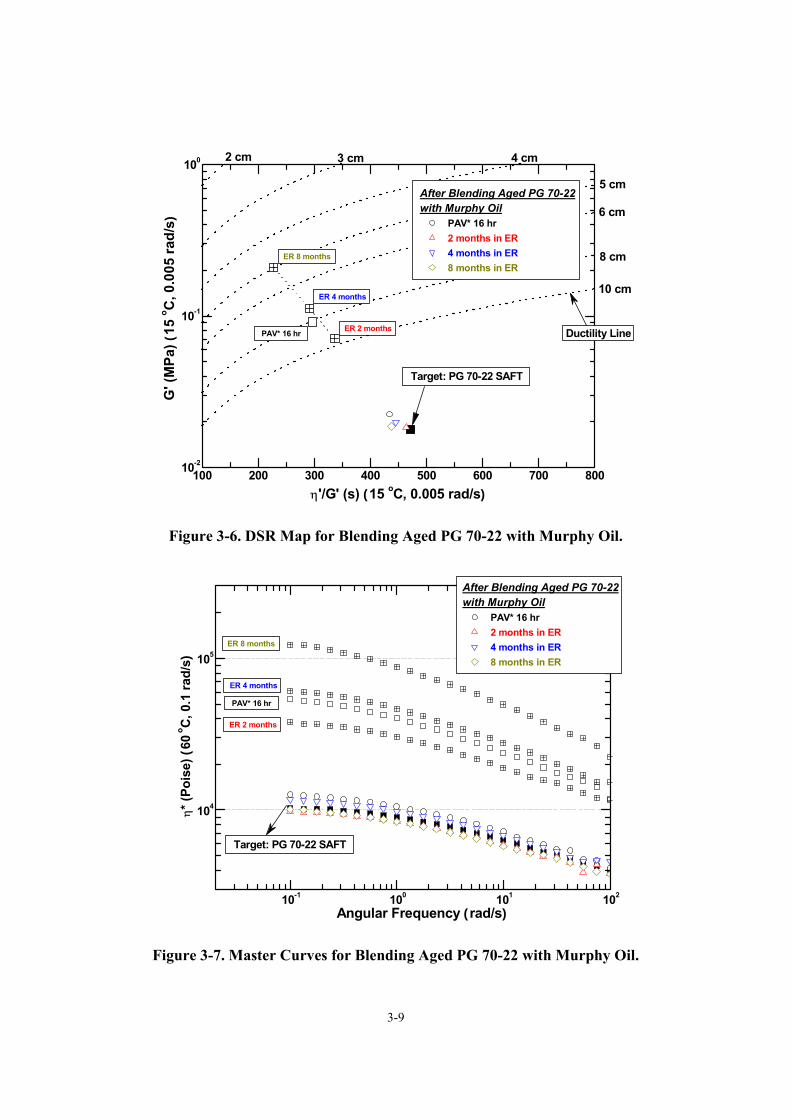
3-9
100 200 300 400 500 600 700 80010-2
10-1
100
PAV* 16 hr
ER 8 months
ER 4 months
ER 2 months
After Blending Aged PG 70-22with Murphy Oil
PAV* 16 hr 2 months in ER 4 months in ER 8 months in ER
G' (
MPa
) (15
o C, 0
.005
rad/
s)
η'/G' (s) (15 oC, 0.005 rad/s)
Target: PG 70-22 SAFT
Ductility Line
8 cm
10 cm
5 cm
6 cm
3 cm 4 cm2 cm
Figure 3-6. DSR Map for Blending Aged PG 70-22 with Murphy Oil.
10-1 100 101 102
104
105
ER 2 months
PAV* 16 hr
ER 4 months
ER 8 months
Target: PG 70-22 SAFT
Angular Frequency (rad/s)
η* (
Pois
e) (
60 o C
, 0.1
rad/
s)
After Blending Aged PG 70-22with Murphy Oil
PAV* 16 hr 2 months in ER 4 months in ER 8 months in ER
Figure 3-7. Master Curves for Blending Aged PG 70-22 with Murphy Oil.
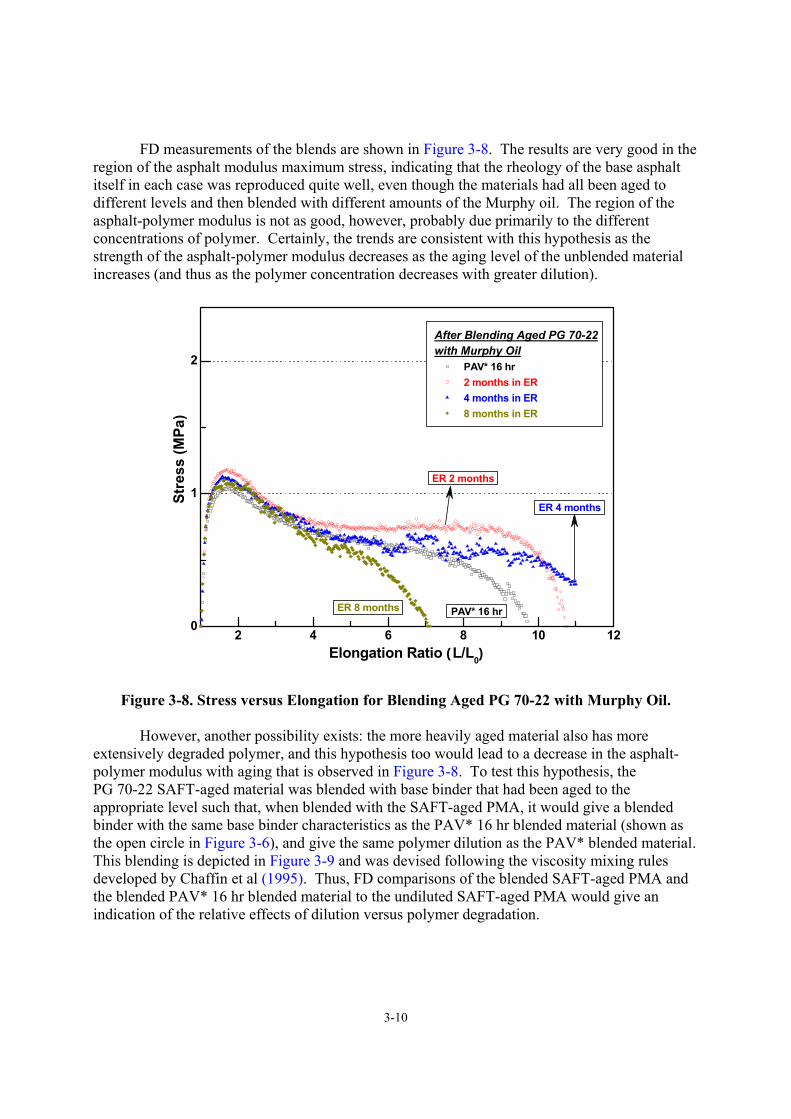
3-10
FD measurements of the blends are shown in Figure 3-8. The results are very good in the region of the asphalt modulus maximum stress, indicating that the rheology of the base asphalt itself in each case was reproduced quite well, even though the materials had all been aged to different levels and then blended with different amounts of the Murphy oil. The region of the asphalt-polymer modulus is not as good, however, probably due primarily to the different concentrations of polymer. Certainly, the trends are consistent with this hypothesis as the strength of the asphalt-polymer modulus decreases as the aging level of the unblended material increases (and thus as the polymer concentration decreases with greater dilution).
2 4 6 8 10 120
1
2
After Blending Aged PG 70-22with Murphy Oil
PAV* 16 hr 2 months in ER 4 months in ER 8 months in ER
ER 4 months
ER 8 months PAV* 16 hr
ER 2 months
Stre
ss (M
Pa)
Elongation Ratio (L/L0)
Figure 3-8. Stress versus Elongation for Blending Aged PG 70-22 with Murphy Oil.
However, another possibility exists: the more heavily aged material also has more extensively degraded polymer, and this hypothesis too would lead to a decrease in the asphalt-polymer modulus with aging that is observed in Figure 3-8. To test this hypothesis, the PG 70-22 SAFT-aged material was blended with base binder that had been aged to the appropriate level such that, when blended with the SAFT-aged PMA, it would give a blended binder with the same base binder characteristics as the PAV* 16 hr blended material (shown as the open circle in Figure 3-6), and give the same polymer dilution as the PAV* blended material. This blending is depicted in Figure 3-9 and was devised following the viscosity mixing rules developed by Chaffin et al (1995). Thus, FD comparisons of the blended SAFT-aged PMA and the blended PAV* 16 hr blended material to the undiluted SAFT-aged PMA would give an indication of the relative effects of dilution versus polymer degradation.
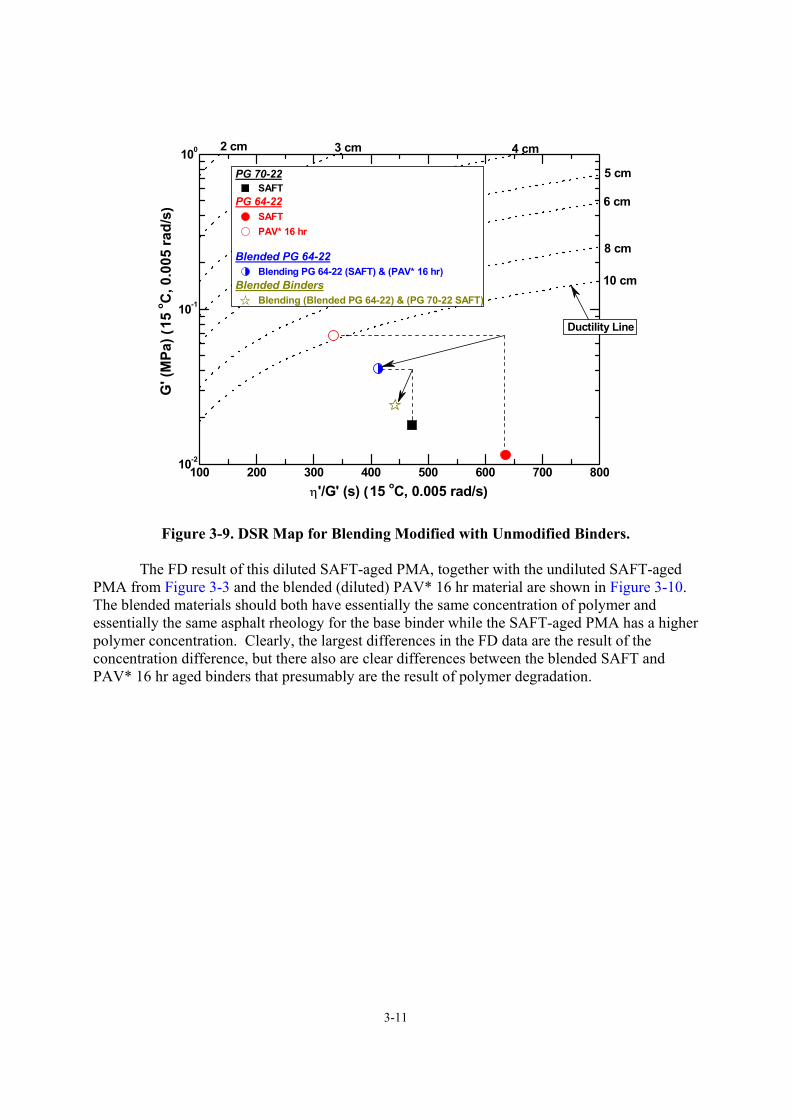
3-11
100 200 300 400 500 600 700 80010-2
10-1
100
PG 70-22 SAFT
PG 64-22 SAFT PAV* 16 hr
Blended PG 64-22 Blending PG 64-22 (SAFT) & (PAV* 16 hr)
Blended Binders Blending (Blended PG 64-22) & (PG 70-22 SAFT)
G' (
MPa
) (15
o C, 0
.005
rad/
s)
η'/G' (s) (15 oC, 0.005 rad/s)
Ductility Line
8 cm
10 cm
5 cm
6 cm
3 cm 4 cm2 cm
Figure 3-9. DSR Map for Blending Modified with Unmodified Binders.
The FD result of this diluted SAFT-aged PMA, together with the undiluted SAFT-aged PMA from Figure 3-3 and the blended (diluted) PAV* 16 hr material are shown in Figure 3-10. The blended materials should both have essentially the same concentration of polymer and essentially the same asphalt rheology for the base binder while the SAFT-aged PMA has a higher polymer concentration. Clearly, the largest differences in the FD data are the result of the concentration difference, but there also are clear differences between the blended SAFT and PAV* 16 hr aged binders that presumably are the result of polymer degradation.
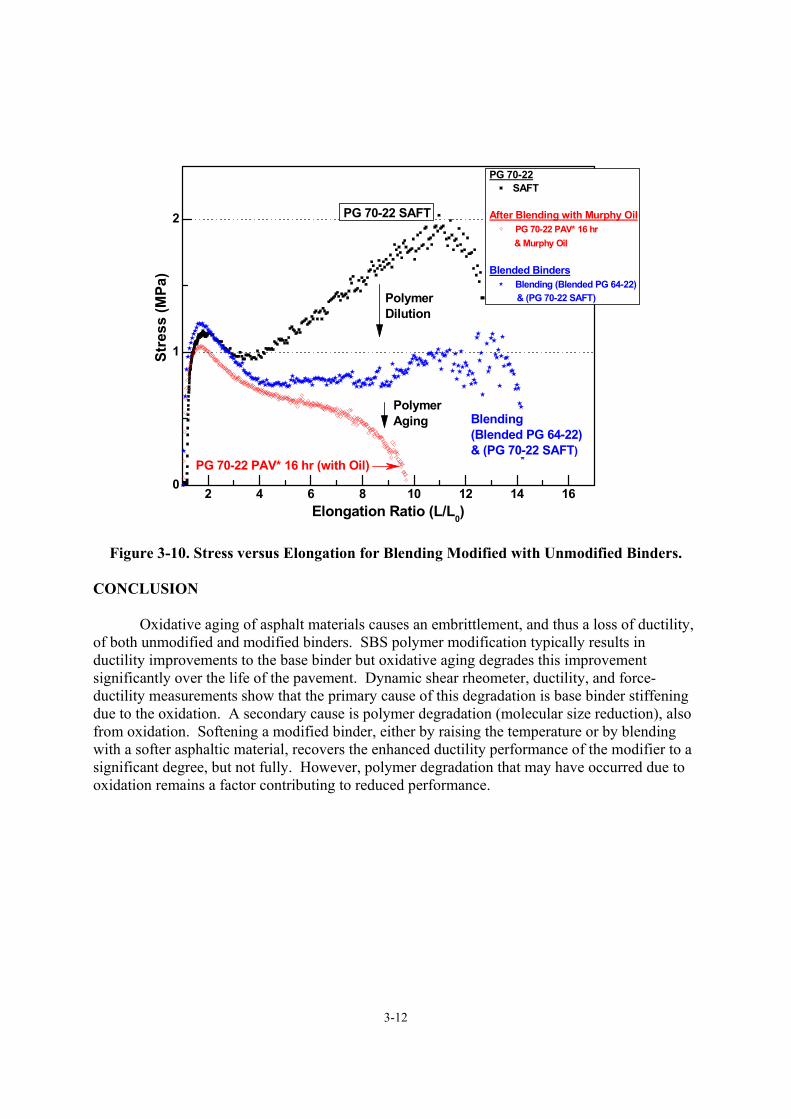
3-12
2 4 6 8 10 12 14 160
1
2
PolymerAging
PolymerDilution
Blending (Blended PG 64-22) & (PG 70-22 SAFT)
PG 70-22 SAFT
PG 70-22 PAV* 16 hr (with Oil)
PG 70-22SAFT
After Blending with Murphy Oil PG 70-22 PAV* 16 hr
& Murphy Oil
Blended Binders Blending (Blended PG 64-22)
& (PG 70-22 SAFT)
Stre
ss (M
Pa)
Elongation Ratio (L/L0)
Figure 3-10. Stress versus Elongation for Blending Modified with Unmodified Binders. CONCLUSION
Oxidative aging of asphalt materials causes an embrittlement, and thus a loss of ductility, of both unmodified and modified binders. SBS polymer modification typically results in ductility improvements to the base binder but oxidative aging degrades this improvement significantly over the life of the pavement. Dynamic shear rheometer, ductility, and force-ductility measurements show that the primary cause of this degradation is base binder stiffening due to the oxidation. A secondary cause is polymer degradation (molecular size reduction), also from oxidation. Softening a modified binder, either by raising the temperature or by blending with a softer asphaltic material, recovers the enhanced ductility performance of the modifier to a significant degree, but not fully. However, polymer degradation that may have occurred due to oxidation remains a factor contributing to reduced performance.
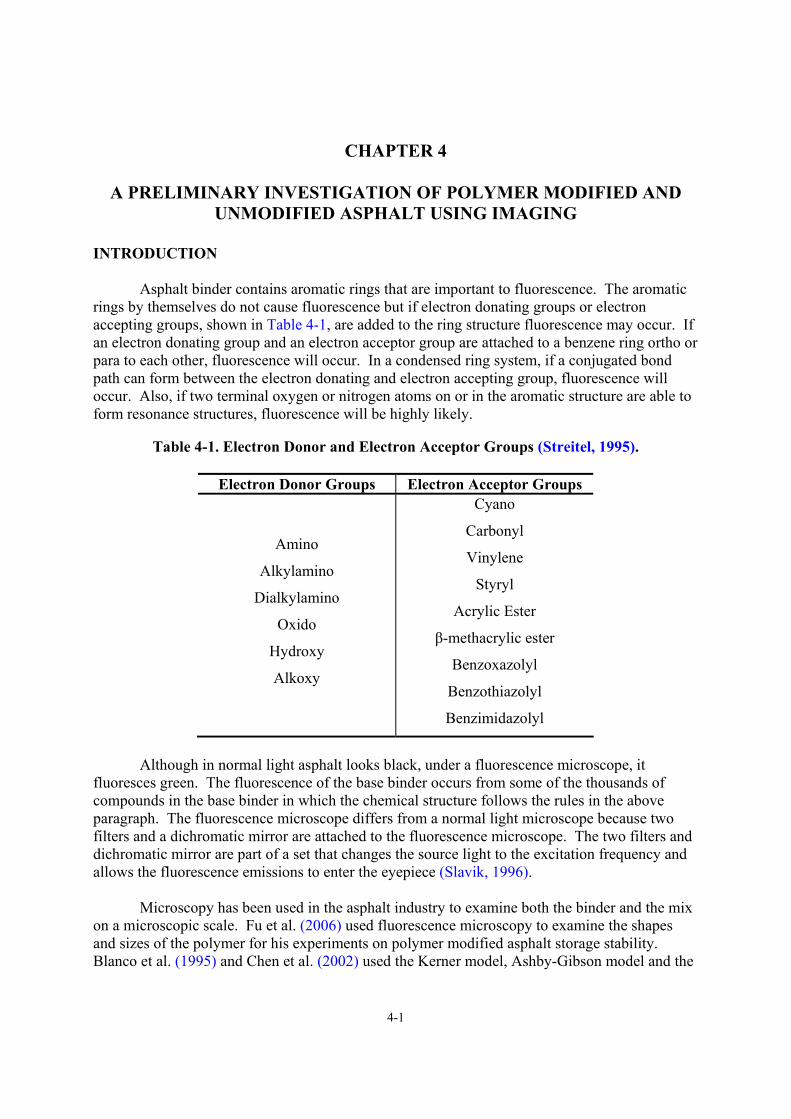
4-1
CHAPTER 4
A PRELIMINARY INVESTIGATION OF POLYMER MODIFIED AND UNMODIFIED ASPHALT USING IMAGING
INTRODUCTION Asphalt binder contains aromatic rings that are important to fluorescence. The aromatic rings by themselves do not cause fluorescence but if electron donating groups or electron accepting groups, shown in Table 4-1, are added to the ring structure fluorescence may occur. If an electron donating group and an electron acceptor group are attached to a benzene ring ortho or para to each other, fluorescence will occur. In a condensed ring system, if a conjugated bond path can form between the electron donating and electron accepting group, fluorescence will occur. Also, if two terminal oxygen or nitrogen atoms on or in the aromatic structure are able to form resonance structures, fluorescence will be highly likely.
Table 4-1. Electron Donor and Electron Acceptor Groups (Streitel, 1995).
Electron Donor Groups Electron Acceptor Groups
Amino
Alkylamino
Dialkylamino
Oxido
Hydroxy
Alkoxy
Cyano
Carbonyl
Vinylene
Styryl
Acrylic Ester
β-methacrylic ester
Benzoxazolyl
Benzothiazolyl
Benzimidazolyl
Although in normal light asphalt looks black, under a fluorescence microscope, it fluoresces green. The fluorescence of the base binder occurs from some of the thousands of compounds in the base binder in which the chemical structure follows the rules in the above paragraph. The fluorescence microscope differs from a normal light microscope because two filters and a dichromatic mirror are attached to the fluorescence microscope. The two filters and dichromatic mirror are part of a set that changes the source light to the excitation frequency and allows the fluorescence emissions to enter the eyepiece (Slavik, 1996). Microscopy has been used in the asphalt industry to examine both the binder and the mix on a microscopic scale. Fu et al. (2006) used fluorescence microscopy to examine the shapes and sizes of the polymer for his experiments on polymer modified asphalt storage stability. Blanco et al. (1995) and Chen et al. (2002) used the Kerner model, Ashby-Gibson model and the
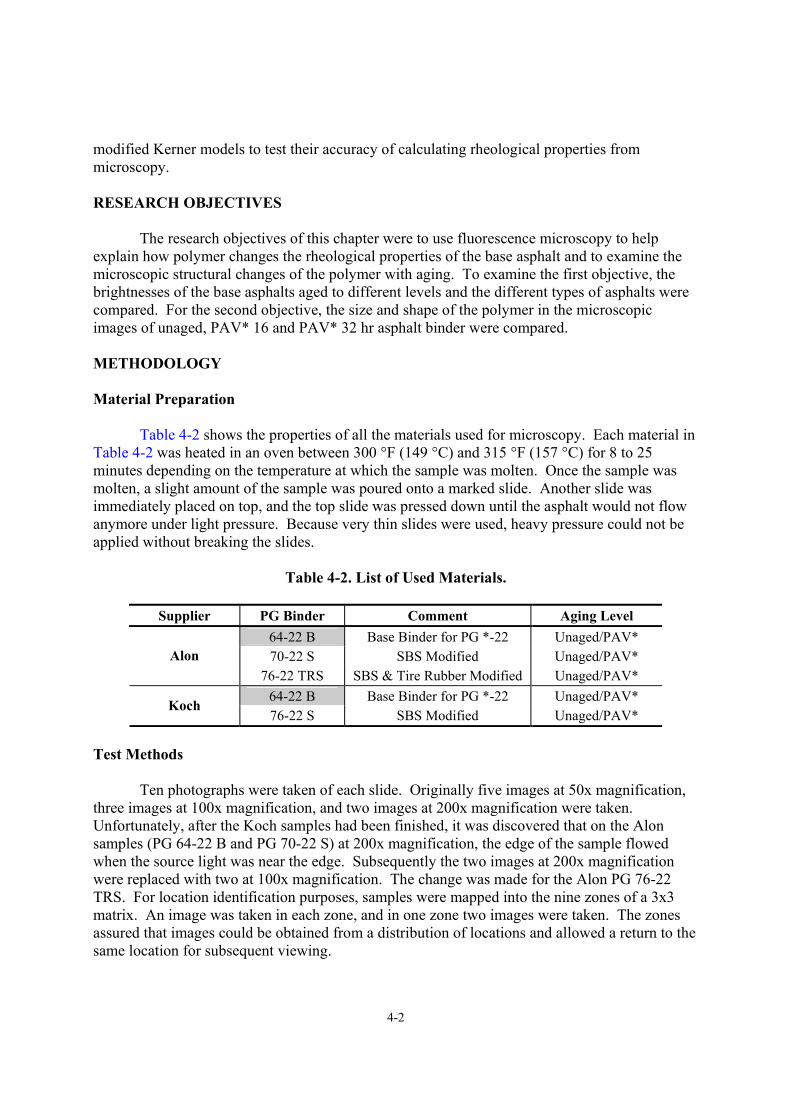
4-2
modified Kerner models to test their accuracy of calculating rheological properties from microscopy. RESEARCH OBJECTIVES
The research objectives of this chapter were to use fluorescence microscopy to help explain how polymer changes the rheological properties of the base asphalt and to examine the microscopic structural changes of the polymer with aging. To examine the first objective, the brightnesses of the base asphalts aged to different levels and the different types of asphalts were compared. For the second objective, the size and shape of the polymer in the microscopic images of unaged, PAV* 16 and PAV* 32 hr asphalt binder were compared. METHODOLOGY Material Preparation Table 4-2 shows the properties of all the materials used for microscopy. Each material in Table 4-2 was heated in an oven between 300 °F (149 °C) and 315 °F (157 °C) for 8 to 25 minutes depending on the temperature at which the sample was molten. Once the sample was molten, a slight amount of the sample was poured onto a marked slide. Another slide was immediately placed on top, and the top slide was pressed down until the asphalt would not flow anymore under light pressure. Because very thin slides were used, heavy pressure could not be applied without breaking the slides.
Table 4-2. List of Used Materials.
Supplier PG Binder Comment Aging Level
64-22 B Base Binder for PG *-22 Unaged/PAV* 70-22 S SBS Modified Unaged/PAV* Alon
76-22 TRS SBS & Tire Rubber Modified Unaged/PAV* 64-22 B Base Binder for PG *-22 Unaged/PAV*
Koch 76-22 S SBS Modified Unaged/PAV*
Test Methods Ten photographs were taken of each slide. Originally five images at 50x magnification, three images at 100x magnification, and two images at 200x magnification were taken. Unfortunately, after the Koch samples had been finished, it was discovered that on the Alon samples (PG 64-22 B and PG 70-22 S) at 200x magnification, the edge of the sample flowed when the source light was near the edge. Subsequently the two images at 200x magnification were replaced with two at 100x magnification. The change was made for the Alon PG 76-22 TRS. For location identification purposes, samples were mapped into the nine zones of a 3x3 matrix. An image was taken in each zone, and in one zone two images were taken. The zones assured that images could be obtained from a distribution of locations and allowed a return to the same location for subsequent viewing.
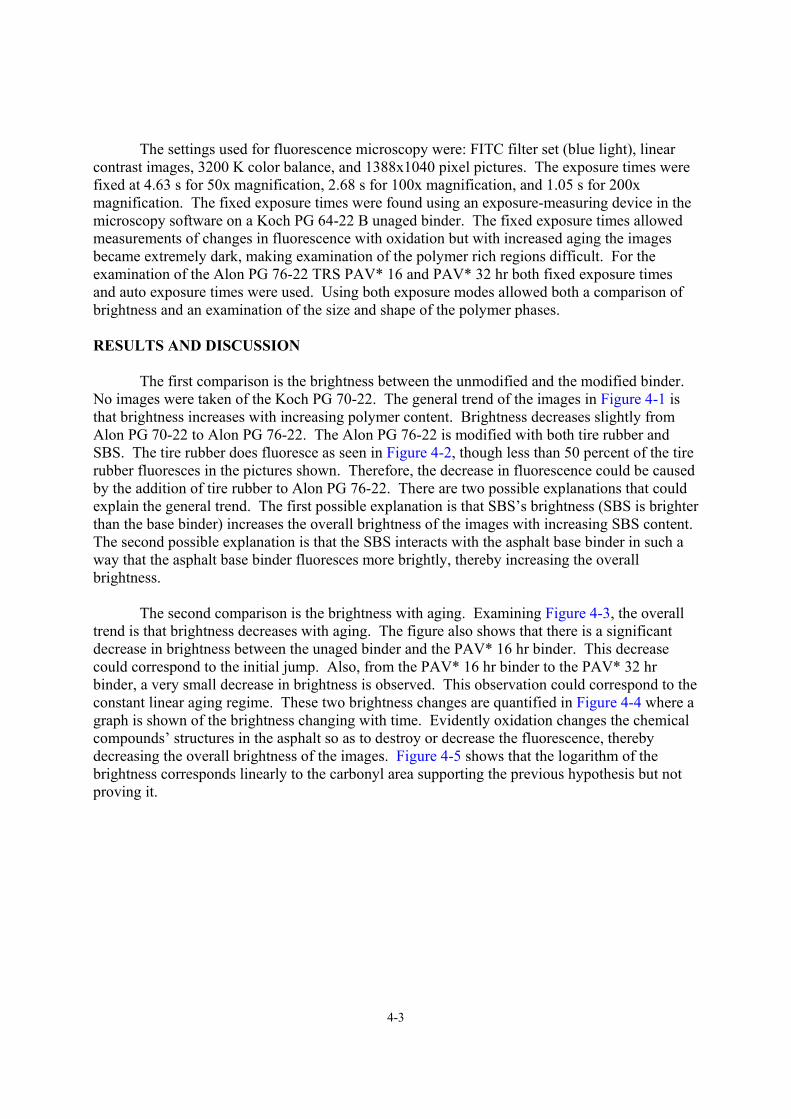
4-3
The settings used for fluorescence microscopy were: FITC filter set (blue light), linear contrast images, 3200 K color balance, and 1388x1040 pixel pictures. The exposure times were fixed at 4.63 s for 50x magnification, 2.68 s for 100x magnification, and 1.05 s for 200x magnification. The fixed exposure times were found using an exposure-measuring device in the microscopy software on a Koch PG 64-22 B unaged binder. The fixed exposure times allowed measurements of changes in fluorescence with oxidation but with increased aging the images became extremely dark, making examination of the polymer rich regions difficult. For the examination of the Alon PG 76-22 TRS PAV* 16 and PAV* 32 hr both fixed exposure times and auto exposure times were used. Using both exposure modes allowed both a comparison of brightness and an examination of the size and shape of the polymer phases. RESULTS AND DISCUSSION The first comparison is the brightness between the unmodified and the modified binder. No images were taken of the Koch PG 70-22. The general trend of the images in Figure 4-1 is that brightness increases with increasing polymer content. Brightness decreases slightly from Alon PG 70-22 to Alon PG 76-22. The Alon PG 76-22 is modified with both tire rubber and SBS. The tire rubber does fluoresce as seen in Figure 4-2, though less than 50 percent of the tire rubber fluoresces in the pictures shown. Therefore, the decrease in fluorescence could be caused by the addition of tire rubber to Alon PG 76-22. There are two possible explanations that could explain the general trend. The first possible explanation is that SBS’s brightness (SBS is brighter than the base binder) increases the overall brightness of the images with increasing SBS content. The second possible explanation is that the SBS interacts with the asphalt base binder in such a way that the asphalt base binder fluoresces more brightly, thereby increasing the overall brightness. The second comparison is the brightness with aging. Examining Figure 4-3, the overall trend is that brightness decreases with aging. The figure also shows that there is a significant decrease in brightness between the unaged binder and the PAV* 16 hr binder. This decrease could correspond to the initial jump. Also, from the PAV* 16 hr binder to the PAV* 32 hr binder, a very small decrease in brightness is observed. This observation could correspond to the constant linear aging regime. These two brightness changes are quantified in Figure 4-4 where a graph is shown of the brightness changing with time. Evidently oxidation changes the chemical compounds’ structures in the asphalt so as to destroy or decrease the fluorescence, thereby decreasing the overall brightness of the images. Figure 4-5 shows that the logarithm of the brightness corresponds linearly to the carbonyl area supporting the previous hypothesis but not proving it.
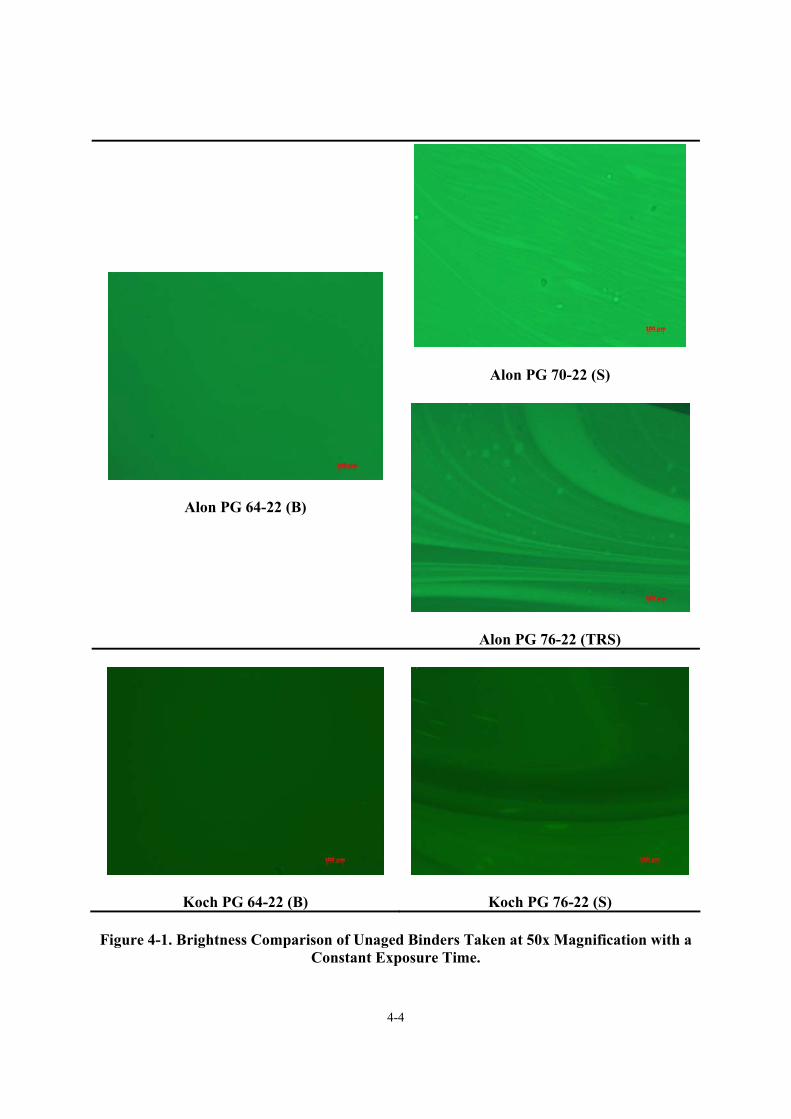
4-4
Alon PG 70-22 (S)
Alon PG 64-22 (B)
Alon PG 76-22 (TRS)
Koch PG 64-22 (B)
Koch PG 76-22 (S)
Figure 4-1. Brightness Comparison of Unaged Binders Taken at 50x Magnification with a Constant Exposure Time.
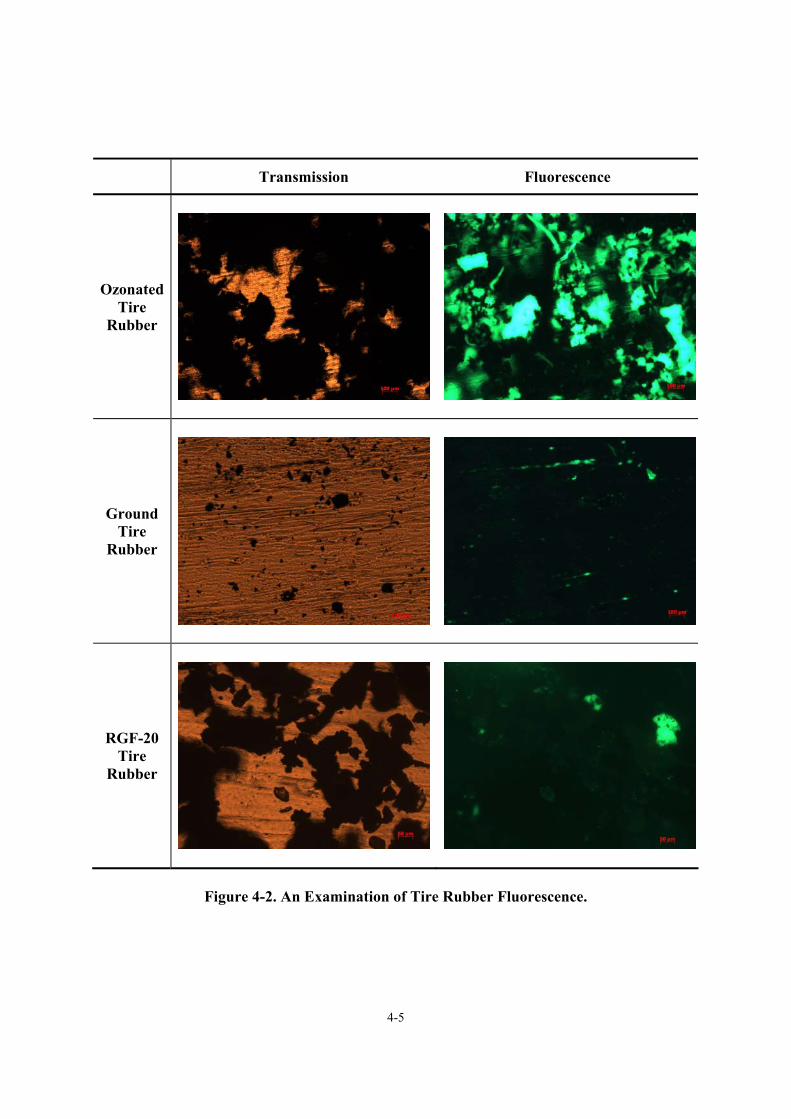
4-5
Transmission Fluorescence
Ozonated Tire
Rubber
Ground Tire
Rubber
RGF-20 Tire
Rubber
Figure 4-2. An Examination of Tire Rubber Fluorescence.
4-6
Alon Unaged PAV* 16 hr PAV* 32 hr
PG 64-22
(B)
PG 70-22
(S)
PG 76-22 (TRS)
Koch Unaged PAV* 16 hr PAV* 32 hr
PG 64-22
(B)
PG 76-22
(S)
Figure 4-3. Brightness Comparison of Aged Binders Taken at 100x Magnification with a
Constant Exposure Time.
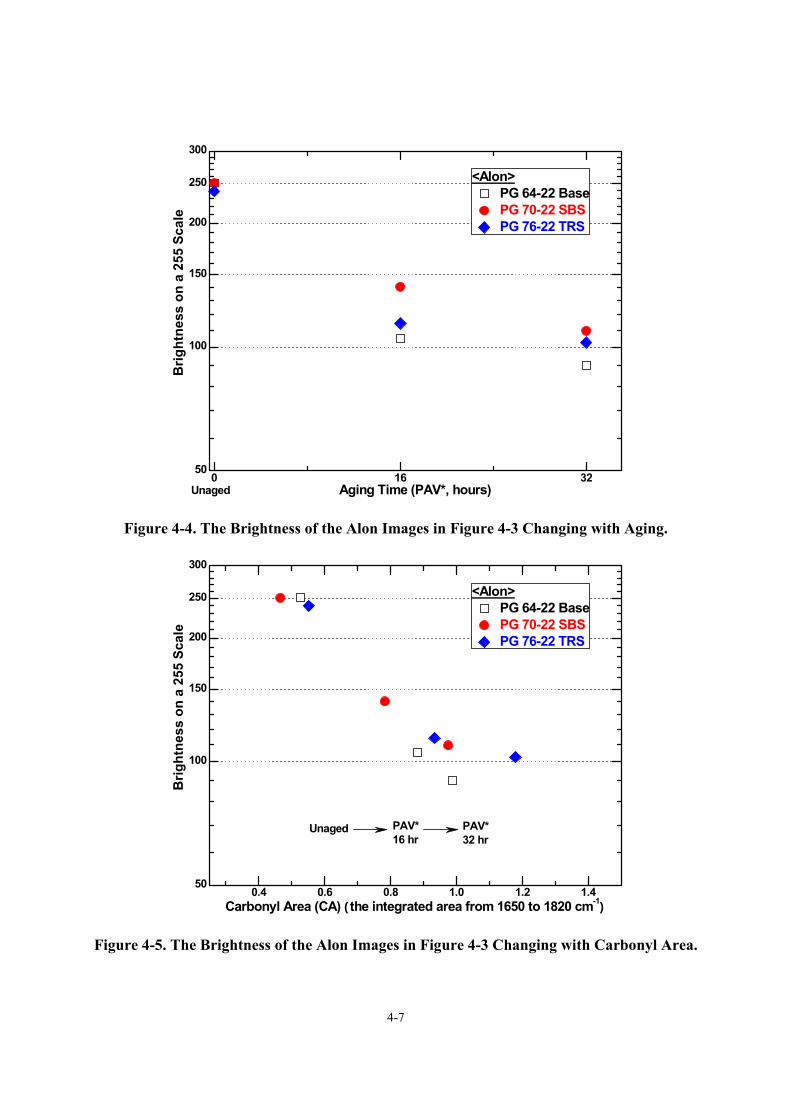
4-7
0 16 3250
100
150
200
250
300
Unaged
<Alon> PG 64-22 Base PG 70-22 SBS PG 76-22 TRS
Brig
htne
ss o
n a
255
Scal
e
Aging Time (PAV*, hours)
Figure 4-4. The Brightness of the Alon Images in Figure 4-3 Changing with Aging.
0.4 0.6 0.8 1.0 1.2 1.450
100
150
200
250
300
PAV* 32 hr
Unaged
<Alon> PG 64-22 Base PG 70-22 SBS PG 76-22 TRS
Brig
htne
ss o
n a
255
Scal
e
Carbonyl Area (CA) (the integrated area from 1650 to 1820 cm-1)
PAV* 16 hr
Figure 4-5. The Brightness of the Alon Images in Figure 4-3 Changing with Carbonyl Area.
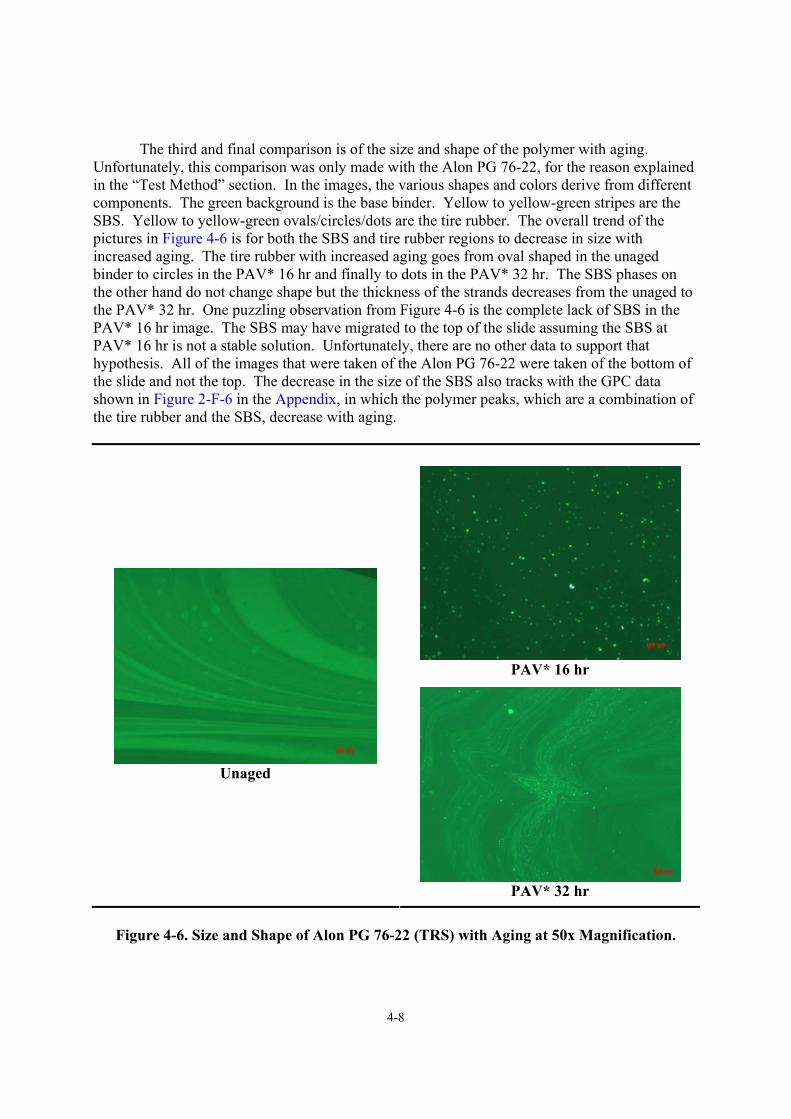
4-8
The third and final comparison is of the size and shape of the polymer with aging. Unfortunately, this comparison was only made with the Alon PG 76-22, for the reason explained in the “Test Method” section. In the images, the various shapes and colors derive from different components. The green background is the base binder. Yellow to yellow-green stripes are the SBS. Yellow to yellow-green ovals/circles/dots are the tire rubber. The overall trend of the pictures in Figure 4-6 is for both the SBS and tire rubber regions to decrease in size with increased aging. The tire rubber with increased aging goes from oval shaped in the unaged binder to circles in the PAV* 16 hr and finally to dots in the PAV* 32 hr. The SBS phases on the other hand do not change shape but the thickness of the strands decreases from the unaged to the PAV* 32 hr. One puzzling observation from Figure 4-6 is the complete lack of SBS in the PAV* 16 hr image. The SBS may have migrated to the top of the slide assuming the SBS at PAV* 16 hr is not a stable solution. Unfortunately, there are no other data to support that hypothesis. All of the images that were taken of the Alon PG 76-22 were taken of the bottom of the slide and not the top. The decrease in the size of the SBS also tracks with the GPC data shown in Figure 2-F-6 in the Appendix, in which the polymer peaks, which are a combination of the tire rubber and the SBS, decrease with aging.
PAV* 16 hr
Unaged
PAV* 32 hr
Figure 4-6. Size and Shape of Alon PG 76-22 (TRS) with Aging at 50x Magnification.

4-9
SUMMARY Currently we note four preliminary observations, based on these limited fluorescence microscopy data:
• image brightness increases with the increase in SBS, • image brightness decreases with aging,
• the size but not the shape of the SBS rich phases change with aging,
• the size and shape of the tire rubber changes with aging.
• the SBS phase in the PAV* 16 hr aged material may be difficult to observe.
In summary, additional fluorescence microscopy imaging is needed to further understand
asphalt-polymer phase behavior and its changes with oxidation and the impact of oxidation on polymer modification of asphalts.

5-1
CHAPTER 5
TOWARDS AN OXYGEN AND THERMAL TRANSPORT MODEL OF BINDER OXIDATION IN PAVEMENTS
INTRODUCTION The oxidation of binders in asphalt pavements has been a subject of interest for a significant number of years, even decades. This ongoing effort has several important facets that are separate, but related. Perhaps the most fundamental issue is the basic oxidation chemistry. This issue has been explored rather extensively in reports by Petersen et al (1993). Significant reports are by Lee and Huang (1973), Lau et al. (1992), Petersen et al. (1993). A general observation of these reports is that carbonyl compounds form as a result of oxidation and that, while the exact nature of the carbonyl compounds and the formation rates may vary from asphalt to asphalt, the common factor is that for each asphalt the carbonyl content can be used as a surrogate for total oxidative changes; qualitatively the carbonyl growth varies linearly with total oxygen increase, even though the quantitative dependence varies from asphalt to asphalt (Liu et al., 1998b). A second aspect of binder oxidation is the oxidation kinetics of an asphalt, studied and reported by Petersen et al. (1993), Liu et al. (1996), and others. The basic carbonyl reaction rate can generally be described using an Arrhenius expression for temperature variation and pressure dependence:
RTEeAPrdt
d /CA
CA −== α (5-1)
Lau et al. (1992) reported results for 10 asphalts in which they determined values for the
activation energy E, the oxygen pressure reaction order α and the constant A. It was also noted that in general, the reaction rates of asphalt binders undergo an initial rapid rate period that declines over time until a constant rate period is reached and the reaction rate given in the equation above describes this constant rate period. The early time faster rate period has been variously described as the “initial jump” (Lau et al., 1992) or the “initial spurt” by Petersen (1993). The point is that while the parameters of the oxidation rates vary from one asphalt to another, the basic form of the reaction rates are essentially the same. Kinetic parameters have been determined for a number of different asphalts including the SHRP core asphalts and others. Many of these results are reported by Glover et al. (2005). A third facet of binder oxidation is the impact that the oxidation has on the binder’s physical properties. Fundamentally, the oxidation of the binder creates carbonyl compounds, primarily by oxidizing aromatic compounds in the naphthene aromatic, polar aromatic, and asphaltene fractions. These more polar carbonyl groups result in stronger associations between asphalt components, which increase the asphaltene fraction, and in turn lead to a stiffening of the binder in both its elastic modulus and its viscosity. Results have been reported in terms of the
5-2
low shear rate limiting viscosity, and it has been observed that this viscosity increases in direct proportion to the carbonyl band infrared carbonyl growth (Martin et al., 1990). The proportionality factor has been termed the hardening susceptibility (Lau et al., 1992; Domke et al., 1999). More recently, a DSR function has been defined that includes both elastic and viscous properties and at more mid-range test conditions (frequency and/or temperature) than are represented by the low shear rate limiting viscosity which, by definition, is at very low frequency or equivalently at high temperatures. This DSR function also increases linearly with carbonyl content, and the slope of this relationship is termed the DSR function hardening susceptibility. This parameter, also measured for a number of asphalts, has been reported as well (Glover et al. 2005). For either of these hardening functions, one can develop kinetic equations, just as can be done for carbonyl formation kinetics, in that the hardening rate can be expressed in an Arrhenius rate form, thereby bypassing explicit representation of the carbonyl reaction kinetics. Equivalently, the hardening susceptibility can be multiplied by the oxidation reaction rate to obtain the hardening rate, again, after the initial jump period has been passed, with the reaction rate constant at a fixed temperature. A fourth issue regarding binder oxidation is “So what?” Assuming binders oxidize in pavements, what is the importance of this oxidation to pavement performance? For example, to what extent is the fatigue life of a pavement impacted by binder oxidation? This is a question that has recently been addressed by Walubita et al. (2005, 2006a and 2006b). Recent literature reports also address this issue (Walubita et al., 2006c). These results indicate that binder oxidation in pavements can have a very significant negative impact on pavement fatigue life. While the mechanism of this fatigue life decline with oxidation is not yet well understood, it is believed to be a very important phenomenon, and early data indicate that there may be significant differences between different mixture designs. Understanding these differences is an important area for future research and is addressed in this report in Chapter 7. The final issue of binder oxidation in pavements is the question of whether, in fact, binders oxidize in pavements at all, in the face of presumed reduced temperatures and restricted oxygen transport to the binder below the surface. The work discussed above showed that binders harden as a result of oxidation, that the kinetics of oxidation and the hardening that results from oxidation are quite well known (or can be measured) and can be described quantitatively in terms of oxidation temperature and pressure. The work discussed above also indicates that if binders oxidize in pavements, the impact on pavement fatigue performance can be profound. All of these factors, however, will be moot points if binder oxidization doesn’t occur in pavements, and the question of whether this oxidation occurs has no clear answer in the literature. In fact, a very well cited and accepted literature report concludes that binder oxidation occurs only in the top 1.5 inch of the pavement and that below the top inch, the binder is left virtually unaffected by years of use and years of environmental exposure (Coons and Wright, 1968). And their conclusion is formalized in a recently developed mechanistic empirical pavement design guide (MEPDG, AASHTO (2002)) that assumes in its calculation that binders oxidize only in the top inch. Parenthetically, calculations performed using the MEPDG under project 0-4468 suggest that binder oxidation and the consequent increase in pavement stiffness (and the presumed decrease in deformation under load as a result of this stiffness) actually have a positive impact on pavement fatigue life. Contradicting the work of Coons and Wright and the
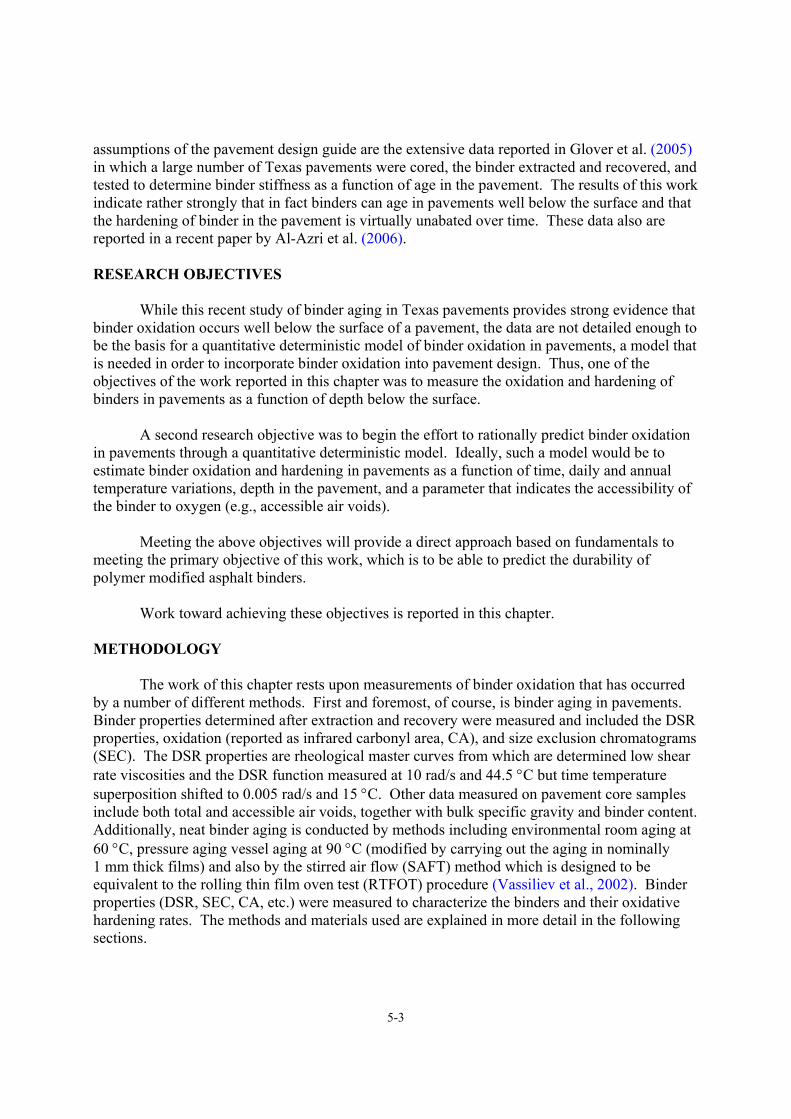
5-3
assumptions of the pavement design guide are the extensive data reported in Glover et al. (2005) in which a large number of Texas pavements were cored, the binder extracted and recovered, and tested to determine binder stiffness as a function of age in the pavement. The results of this work indicate rather strongly that in fact binders can age in pavements well below the surface and that the hardening of binder in the pavement is virtually unabated over time. These data also are reported in a recent paper by Al-Azri et al. (2006). RESEARCH OBJECTIVES While this recent study of binder aging in Texas pavements provides strong evidence that binder oxidation occurs well below the surface of a pavement, the data are not detailed enough to be the basis for a quantitative deterministic model of binder oxidation in pavements, a model that is needed in order to incorporate binder oxidation into pavement design. Thus, one of the objectives of the work reported in this chapter was to measure the oxidation and hardening of binders in pavements as a function of depth below the surface. A second research objective was to begin the effort to rationally predict binder oxidation in pavements through a quantitative deterministic model. Ideally, such a model would be to estimate binder oxidation and hardening in pavements as a function of time, daily and annual temperature variations, depth in the pavement, and a parameter that indicates the accessibility of the binder to oxygen (e.g., accessible air voids). Meeting the above objectives will provide a direct approach based on fundamentals to meeting the primary objective of this work, which is to be able to predict the durability of polymer modified asphalt binders. Work toward achieving these objectives is reported in this chapter. METHODOLOGY The work of this chapter rests upon measurements of binder oxidation that has occurred by a number of different methods. First and foremost, of course, is binder aging in pavements. Binder properties determined after extraction and recovery were measured and included the DSR properties, oxidation (reported as infrared carbonyl area, CA), and size exclusion chromatograms (SEC). The DSR properties are rheological master curves from which are determined low shear rate viscosities and the DSR function measured at 10 rad/s and 44.5 °C but time temperature superposition shifted to 0.005 rad/s and 15 °C. Other data measured on pavement core samples include both total and accessible air voids, together with bulk specific gravity and binder content. Additionally, neat binder aging is conducted by methods including environmental room aging at 60 °C, pressure aging vessel aging at 90 °C (modified by carrying out the aging in nominally 1 mm thick films) and also by the stirred air flow (SAFT) method which is designed to be equivalent to the rolling thin film oven test (RTFOT) procedure (Vassiliev et al., 2002). Binder properties (DSR, SEC, CA, etc.) were measured to characterize the binders and their oxidative hardening rates. The methods and materials used are explained in more detail in the following sections.
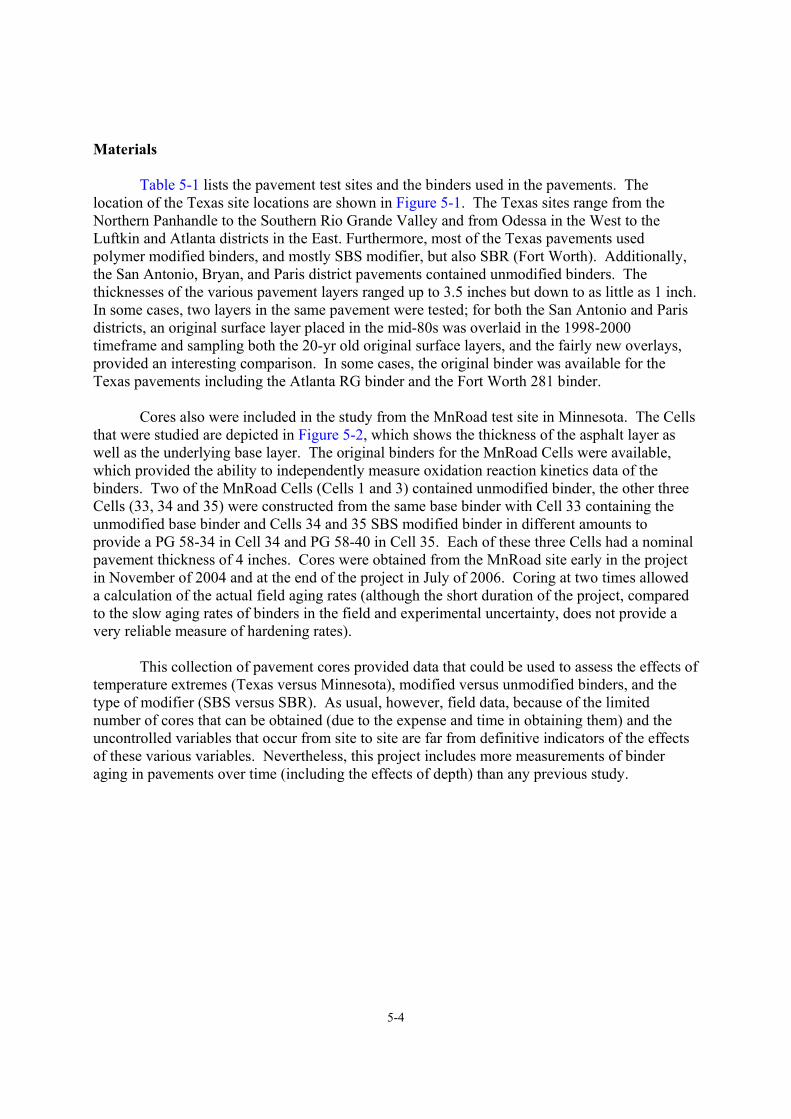
5-4
Materials Table 5-1 lists the pavement test sites and the binders used in the pavements. The location of the Texas site locations are shown in Figure 5-1. The Texas sites range from the Northern Panhandle to the Southern Rio Grande Valley and from Odessa in the West to the Luftkin and Atlanta districts in the East. Furthermore, most of the Texas pavements used polymer modified binders, and mostly SBS modifier, but also SBR (Fort Worth). Additionally, the San Antonio, Bryan, and Paris district pavements contained unmodified binders. The thicknesses of the various pavement layers ranged up to 3.5 inches but down to as little as 1 inch. In some cases, two layers in the same pavement were tested; for both the San Antonio and Paris districts, an original surface layer placed in the mid-80s was overlaid in the 1998-2000 timeframe and sampling both the 20-yr old original surface layers, and the fairly new overlays, provided an interesting comparison. In some cases, the original binder was available for the Texas pavements including the Atlanta RG binder and the Fort Worth 281 binder. Cores also were included in the study from the MnRoad test site in Minnesota. The Cells that were studied are depicted in Figure 5-2, which shows the thickness of the asphalt layer as well as the underlying base layer. The original binders for the MnRoad Cells were available, which provided the ability to independently measure oxidation reaction kinetics data of the binders. Two of the MnRoad Cells (Cells 1 and 3) contained unmodified binder, the other three Cells (33, 34 and 35) were constructed from the same base binder with Cell 33 containing the unmodified base binder and Cells 34 and 35 SBS modified binder in different amounts to provide a PG 58-34 in Cell 34 and PG 58-40 in Cell 35. Each of these three Cells had a nominal pavement thickness of 4 inches. Cores were obtained from the MnRoad site early in the project in November of 2004 and at the end of the project in July of 2006. Coring at two times allowed a calculation of the actual field aging rates (although the short duration of the project, compared to the slow aging rates of binders in the field and experimental uncertainty, does not provide a very reliable measure of hardening rates). This collection of pavement cores provided data that could be used to assess the effects of temperature extremes (Texas versus Minnesota), modified versus unmodified binders, and the type of modifier (SBS versus SBR). As usual, however, field data, because of the limited number of cores that can be obtained (due to the expense and time in obtaining them) and the uncontrolled variables that occur from site to site are far from definitive indicators of the effects of these various variables. Nevertheless, this project includes more measurements of binder aging in pavements over time (including the effects of depth) than any previous study.
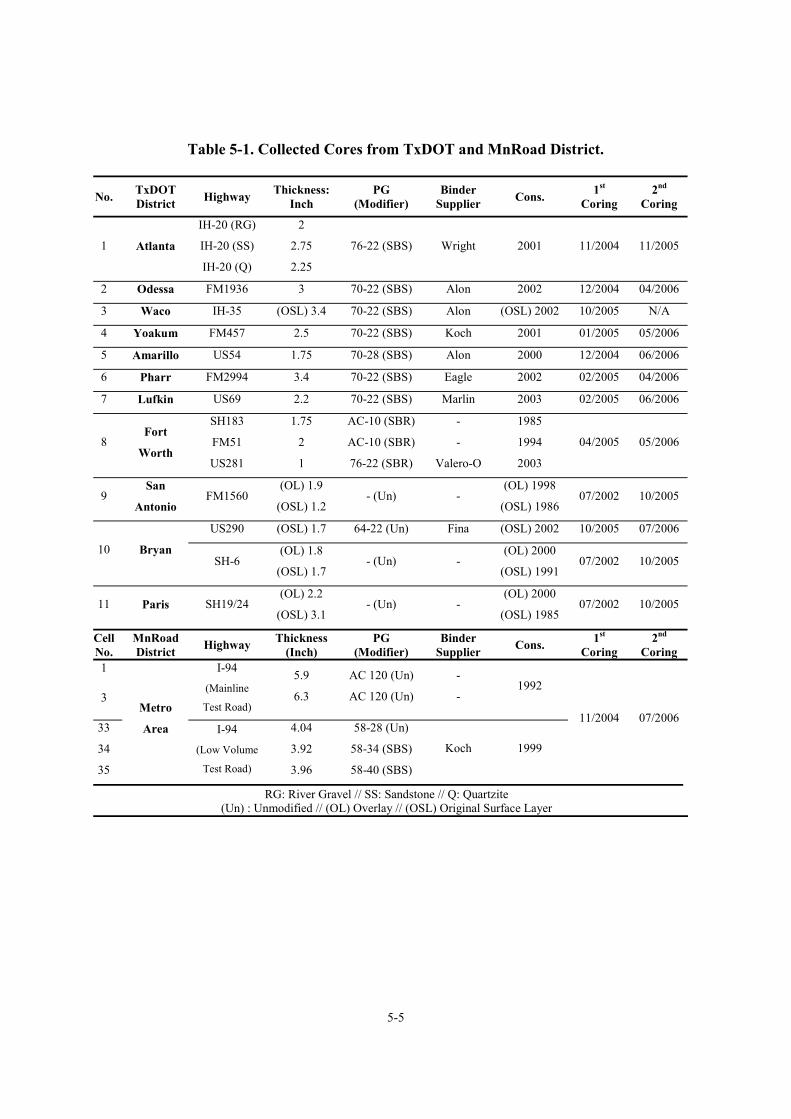
5-5
Table 5-1. Collected Cores from TxDOT and MnRoad District.
No. TxDOT District Highway Thickness:
Inch PG
(Modifier) Binder
Supplier Cons. 1st Coring
2nd Coring
1 Atlanta
IH-20 (RG)
IH-20 (SS)
IH-20 (Q)
2
2.75
2.25
76-22 (SBS)
Wright
2001
11/2004 11/2005
2 Odessa FM1936 3 70-22 (SBS) Alon 2002 12/2004 04/2006
3 Waco IH-35 (OSL) 3.4 70-22 (SBS) Alon (OSL) 2002 10/2005 N/A
4 Yoakum FM457 2.5 70-22 (SBS) Koch 2001 01/2005 05/2006
5 Amarillo US54 1.75 70-28 (SBS) Alon 2000 12/2004 06/2006
6 Pharr FM2994 3.4 70-22 (SBS) Eagle 2002 02/2005 04/2006
7 Lufkin US69 2.2 70-22 (SBS) Marlin 2003 02/2005 06/2006
8 Fort
Worth
SH183
FM51
US281
1.75
2
1
AC-10 (SBR)
AC-10 (SBR)
76-22 (SBR)
-
-
Valero-O
1985
1994
2003
04/2005 05/2006
9 San
Antonio FM1560
(OL) 1.9
(OSL) 1.2 - (Un) -
(OL) 1998
(OSL) 1986 07/2002 10/2005
US290 (OSL) 1.7 64-22 (Un) Fina (OSL) 2002 10/2005 07/2006
10 Bryan SH-6
(OL) 1.8
(OSL) 1.7 - (Un) -
(OL) 2000
(OSL) 1991 07/2002 10/2005
11 Paris SH19/24 (OL) 2.2
(OSL) 3.1 - (Un) -
(OL) 2000
(OSL) 1985 07/2002 10/2005
Cell No.
MnRoad District Highway Thickness
(Inch) PG
(Modifier) Binder
Supplier Cons. 1st Coring
2nd Coring
1
3
I-94
(Mainline
Test Road)
5.9
6.3
AC 120 (Un)
AC 120 (Un)
-
- 1992
33 4.04 58-28 (Un)
34 3.92 58-34 (SBS)
35
Metro
Area I-94
(Low Volume
Test Road) 3.96 58-40 (SBS)
Koch 1999
11/2004 07/2006
RG: River Gravel // SS: Sandstone // Q: Quartzite (Un) : Unmodified // (OL) Overlay // (OSL) Original Surface Layer
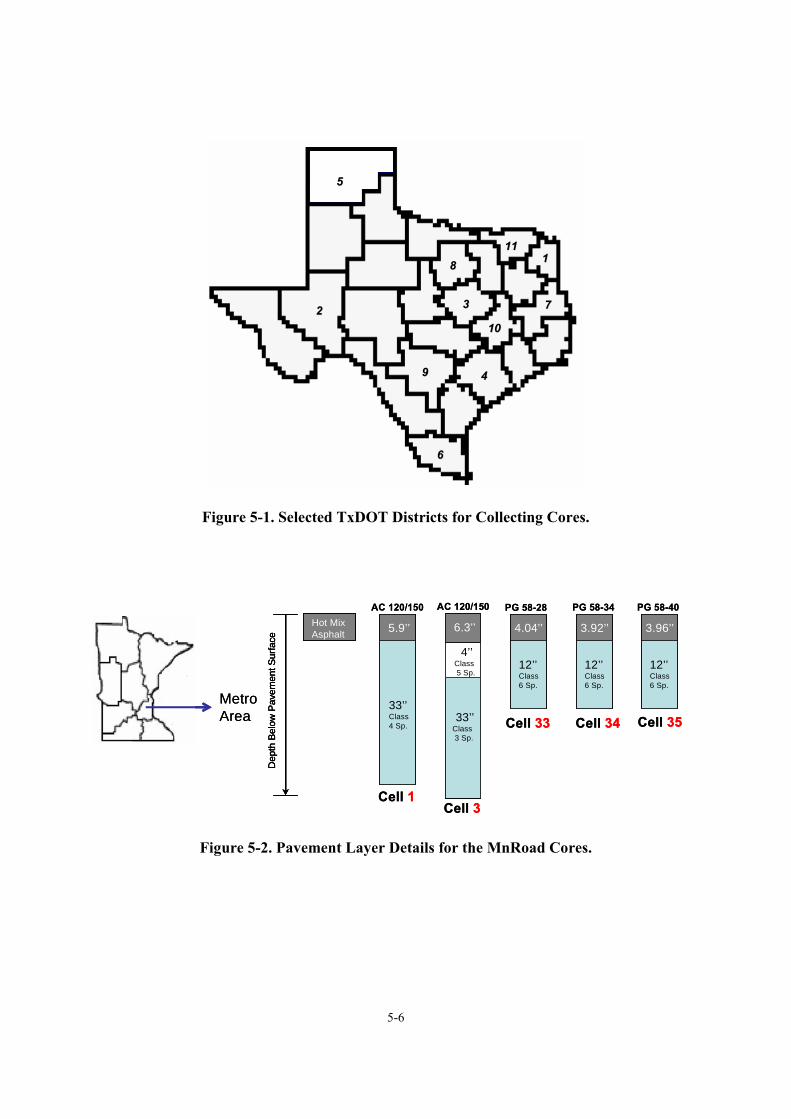
5-6
11
22 33
44
55
66
77
1010
88
99
111111
22 33
44
55
66
77
1010
88
99
1111
Figure 5-1. Selected TxDOT Districts for Collecting Cores.
Cell 3
5.9’’
33’’Class 4 Sp.
6.3’’
33’’Class 3 Sp.
4’’Class 5 Sp.
4.04’’
12’’Class 6 Sp.
3.92’’
12’’Class 6 Sp.
3.96’’
12’’Class 6 Sp.
Dep
th B
elow
Pav
emen
t Sur
face
Hot MixAsphalt
Cell 1
Cell 33 Cell 34 Cell 35
AC 120/150 AC 120/150 PG 58-28 PG 58-34 PG 58-40
MetroArea
Cell 3
5.9’’
33’’Class 4 Sp.
5.9’’
33’’Class 4 Sp.
6.3’’
33’’Class 3 Sp.
4’’Class 5 Sp.
6.3’’
33’’Class 3 Sp.
4’’Class 5 Sp.
4.04’’
12’’Class 6 Sp.
4.04’’
12’’Class 6 Sp.
3.92’’
12’’Class 6 Sp.
3.92’’
12’’Class 6 Sp.
3.96’’
12’’Class 6 Sp.
3.96’’
12’’Class 6 Sp.
Dep
th B
elow
Pav
emen
t Sur
face
Dep
th B
elow
Pav
emen
t Sur
face
Hot MixAsphaltHot MixAsphalt
Cell 1
Cell 33 Cell 34 Cell 35
AC 120/150 AC 120/150 PG 58-28 PG 58-34 PG 58-40
MetroArea
Figure 5-2. Pavement Layer Details for the MnRoad Cores.
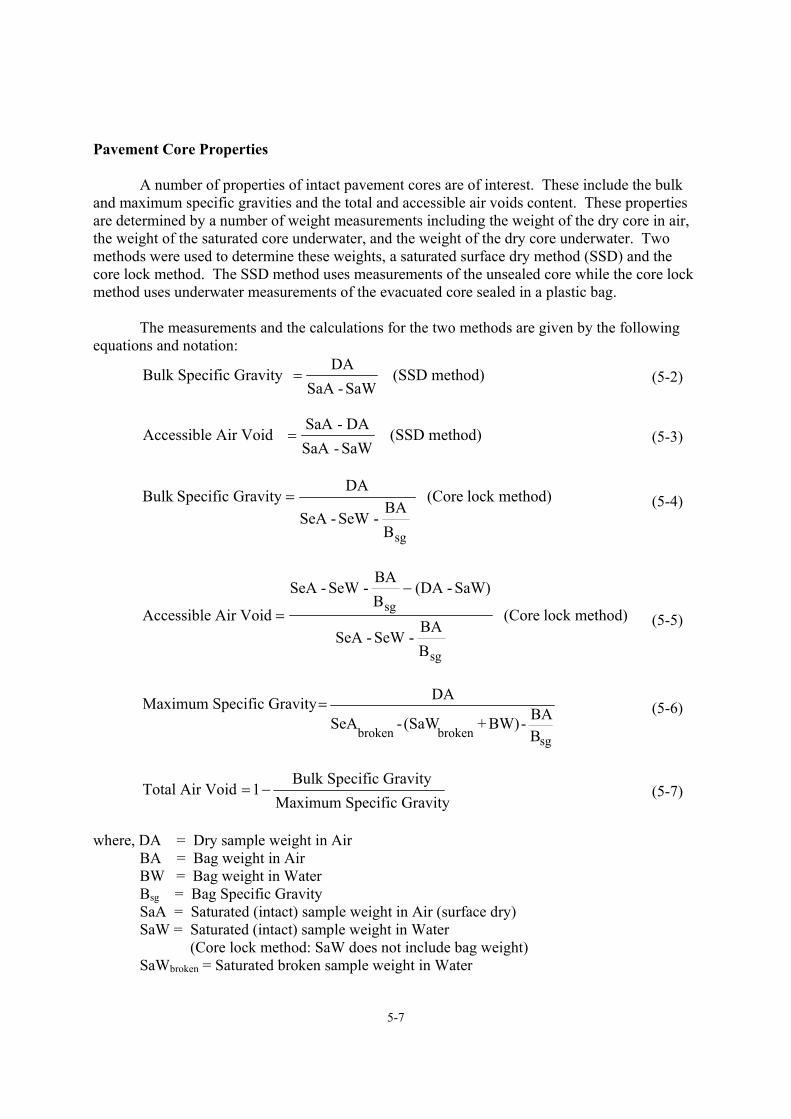
5-7
Pavement Core Properties A number of properties of intact pavement cores are of interest. These include the bulk and maximum specific gravities and the total and accessible air voids content. These properties are determined by a number of weight measurements including the weight of the dry core in air, the weight of the saturated core underwater, and the weight of the dry core underwater. Two methods were used to determine these weights, a saturated surface dry method (SSD) and the core lock method. The SSD method uses measurements of the unsealed core while the core lock method uses underwater measurements of the evacuated core sealed in a plastic bag. The measurements and the calculations for the two methods are given by the following equations and notation:
Bulk Specific Gravity =DA
SaA - SaW (SSD method) (5-2)
Accessible Air Void =SaA - DASaA - SaW
(SSD method) (5-3)
method)lock (Core
BBA
-SeW -SeA
DAGravity SpecificBulk
sg
= (5-4)
method)lock (Core
BBA
-SeW-SeA
SaW)-(DABBA
-SeW-SeA
VoidAir Accessible
sg
sg−
= (5-5)
Maximum Specific Gravity = DA
SeAbroken - (SaWbroken + BW)- BABsg
(5-6)
Total Air Void =1−Bulk Specific Gravity
Maximum Specific Gravity (5-7)
where, DA = Dry sample weight in Air BA = Bag weight in Air BW = Bag weight in Water Bsg = Bag Specific Gravity SaA = Saturated (intact) sample weight in Air (surface dry) SaW = Saturated (intact) sample weight in Water (Core lock method: SaW does not include bag weight) SaWbroken = Saturated broken sample weight in Water
5-8
SeA = Sealed (intact) sample weight in Air SeAbroken = Sealed broken sample weight in Air SeW = Sealed (intact) sample weight in Water In method ASTM D 6857-03 the mixture is well broken so that trapped air pockets are opened. Then this broken mixture is vacuum sealed in a bag to determine SeAbroken, Then the bag and sample are immersed in water, the bag opened, and the saturated sample and bag weighed together underwater to obtain (SaWbroken+BW) as a single measurement.
Each of these methods of determining air voids has inherent measurement errors, and taken together, the two provide a useful check on the one hand, and their comparisons provide an indication of the types of errors, on the other. For example, the SSD method is subject to greater error for more open, porous mixtures. This is because the SSD method relies on being able to obtain a weight of the saturated core that still contains all of the water inside the pores of the core. However, if the mixture is open enough, the water will tend to drain out, giving a lower saturated weight and also, higher air voids. On the other hand, the core lock method will give higher air voids if the surface of the core has a lot of texture to it because the bag cannot collapse around this texture completely and therefore, this texture appears as air voids in the pavement.
These methods are based on the standard methods for determining bulk specific gravity
of compacted specimens, ASTM D 6752-03 (Vacuum Sealing Method) and AASHTO T166-00 (SSD), and on ASTM D 6857-03 for determining maximum specific gravity. Further detailed explanation of the method equations and measurements are given in Appendix 5-B. Binder Extraction and Recovery Extraction and recovery of the binder in the cores is conducted based on the procedures outlined by Burr et al. (1993). These procedures provide for a thorough wash and therefore extraction of the binder from the aggregate but with minimal hardening or softening of the binder in the solvent and with care taken to assure complete solvent removal during the recovery process (Burr et al., 1990, 1993). The extraction process uses washes in toluene followed by a 15 percent ethanol in toluene solvent mixture and size exclusion chromatography to assure removal of the solvent from the recovered binder. It should be noted that the more aged binder requires a more extended recovery time in order to remove the solvent from the stiffer, more heavily aged binder. Binder Content
The binder from the extraction recovery process is quantitatively recovered and weighed and provides a determination of binder content as a percent of the initial core weight. Binder Analytical Measurements The recovered binder was analyzed for a number of properties and also aged to determine binder hardening rates at 60 °C. Additionally, original binders where available were also characterized by these methods. FTIR samples were analyzed using a Mattson Galaxy 5000
5-9
FTIR and the attenuated total reflectance method described by Jemison et al. (1992). The carbonyl area was determined by finding the area under the absorbance peaks from 1650 to 1820 cm-1. The CA was used to monitor the progress of the asphalt oxidation. Size Exclusion Chromatography After the binder was extracted and recovered, the SEC analysis assessed complete solvent removal using previously reported methodology (Burr et al., 1993). Tests samples were prepared by dissolving 0.2 plus or minus 0.005 g of binder in 10 mL of carrier. The sample of interest was then sonicated to ensure complete dissolution. The sonicated sample was then filtered through a 0.45 µm PTFE syringe filter. Samples of 100 µL were injected into 1000, 500, and 50 Å columns in series with tetrahydrofuran carrier solvent flowing at 1.0 mL per minute. The chromatograms of binder obtained from replicate extractions should overlay each other. Incomplete solvent removal results in a peak located at 38 minutes on the chromatogram. Dynamic Shear Rheometer The rheological properties of the binder were determined using a Carimed CSL 500 controlled-stress rheometer. The rheological properties of interest were the complex viscosity ηo* measured at 60 °C and 0.1 rad/s (approximately equal to the low shear rate limiting viscosity) and the storage modulus (G΄) and the dynamic viscosity (η΄), both at 44.7 °C and 10 rad/s, in the time-sweep mode. A 2.5 cm composite parallel plate geometry was used with a 500 µm gap between the plates. DSR measurement was also important for deciding whether the binder was changed in some way by the extraction and recovery process (Burr et al., 1990, 1991, 1994; Cipione et al., 1991). If two extraction and recovery replicates yielded binders with matching SEC chromatograms but significantly different complex viscosities, then at least one of the binders was suspected of having undergone solvent hardening or softening. Aging Methods In this study, binders were aged by a variety of methods including aging in service in the pavement, an uncontrolled process which occurred over a wide range of temperatures and subject to variabilities in other perimeters such as accessibility to oxygen and binder film thicknesses. In addition, a number of controlled laboratory aging methods were used on both recovered binders that had been previously aged in pavement and original binders obtained for a small number of the pavement sites, including MnRoad. These methods include environmental room aging at 60 °C, SAFT aging (approximately equivalent to RTFOT aging), and PAV aging. A stirred air flow test which simulates the hot mix process was used for short-term aging (Vassiliev et al., 2002). The standard pressure aging vessel procedure, was modified and is referred to as the PAV* procedure. This PAV* method was conducted at 90 °C and in 1 mm thick films (one third the thickness of the standard PAV test) and conducted for two test periods: 16 hr and 32 hr of aging, both at 20 atmospheres of air (the standard PAV pressure). The thin
5-10
film provides increased access of the binder to oxygen and thus enhancement to the binder aging rate, even at 20 atmospheres air pressure. RESULTS AND DISCUSSION Texas and Minnesota Aging Rates In a previous project, results were obtained from Texas Highway 21 between Bryan and Caldwell (Glover et al., 2005). These results provided an early, albeit very approximate, indication of binder aging in Texas pavements and suggested strongly that binders age even inches down into the pavement. These results were used to obtain a quantitative estimate of binder aging rates and, using these data, a value of 0.028 ∆(ln MPa/s) per month (or equivalently 0.028/month) was reported in Table 9-8 of that report. It was noted, however, that this rate may have been a bit high because it included cores from 1989, only two years after the pavement was placed. These cores likely were not yet out of the initial jump reaction kinetics period, and therefore were probably aging at a higher rate than the longer term post initial jump aging rate. Nevertheless, it gave an approximate value for an aging rate for this binder in this pavement in this part of Texas. Data were also shown of binder properties at different pavement depths in the same pavement over an extended period of time. Figure 9-14 of that report is repeated here in Figure 5-3. Note that binder properties were measured in the top 2 inches of the pavement (designated by T, top), and in the next 2 inches (designated by M, middle) and the next 2 inches below that (designated by B, bottom). Thus, the B layer had four inches of pavement on top of it and had an average depth of 5 inches below the surface. Figure 5-3 shows that all of these pavement layers aged at close to the same rate although it does seem clear that the top layer ages somewhat faster than the middle or bottom layers, as in each case the binder from the top layer is more aged than that from the bottom or middle layer. Nevertheless, the striking feature of these data is that all of those binder samples progressed across this DSR function map from the bottom right corner toward the top left corner with oxidation over the years, and the progression across this map was far greater than any differences in aging between the various layers. From these results, the tentative conclusion was that environmental conditions in the pavement, temperature and oxygen availability, controlled the binder aging rate and that these conditions don’t change as much with depth as conventional wisdom assumes. Another way of stating this is that even though one might expect that inches into the pavement both temperature and oxygen availability would be reduced enough that binder oxidation would be significantly lower than at the surface, these assumptions do not seem to be supported by the experimental evidence.
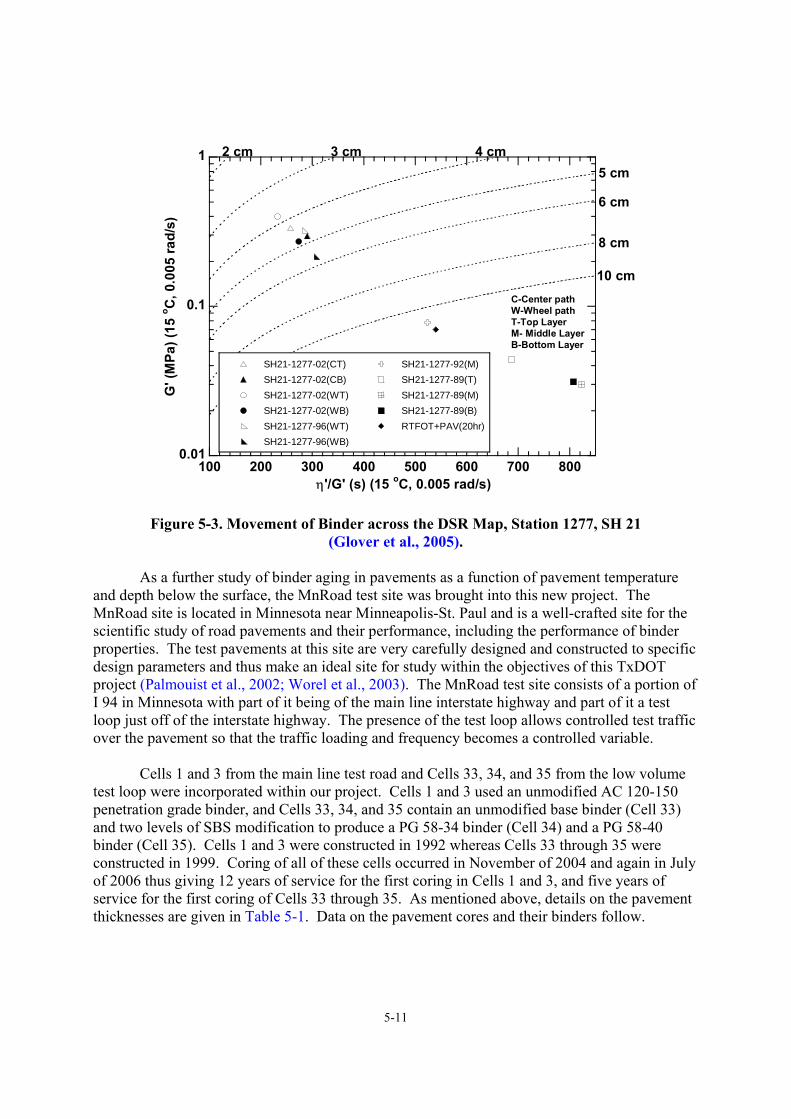
5-11
0.01
0.1
1
100 200 300 400 500 600 700 800
SH21-1277-02(CT)SH21-1277-02(CB)SH21-1277-02(WT)SH21-1277-02(WB)SH21-1277-96(WT)SH21-1277-96(WB)
SH21-1277-92(M)SH21-1277-89(T)SH21-1277-89(M)SH21-1277-89(B)RTFOT+PAV(20hr)
G' (
MPa
) (15
o C, 0
.005
rad/
s)
η'/G' (s) (15 oC, 0.005 rad/s)
2 cm 3 cm 4 cm5 cm
6 cm
8 cm
10 cmC-Center pathW-Wheel pathT-Top LayerM- Middle LayerB-Bottom Layer
Figure 5-3. Movement of Binder across the DSR Map, Station 1277, SH 21 (Glover et al., 2005).
As a further study of binder aging in pavements as a function of pavement temperature and depth below the surface, the MnRoad test site was brought into this new project. The MnRoad site is located in Minnesota near Minneapolis-St. Paul and is a well-crafted site for the scientific study of road pavements and their performance, including the performance of binder properties. The test pavements at this site are very carefully designed and constructed to specific design parameters and thus make an ideal site for study within the objectives of this TxDOT project (Palmouist et al., 2002; Worel et al., 2003). The MnRoad test site consists of a portion of I 94 in Minnesota with part of it being of the main line interstate highway and part of it a test loop just off of the interstate highway. The presence of the test loop allows controlled test traffic over the pavement so that the traffic loading and frequency becomes a controlled variable. Cells 1 and 3 from the main line test road and Cells 33, 34, and 35 from the low volume test loop were incorporated within our project. Cells 1 and 3 used an unmodified AC 120-150 penetration grade binder, and Cells 33, 34, and 35 contain an unmodified base binder (Cell 33) and two levels of SBS modification to produce a PG 58-34 binder (Cell 34) and a PG 58-40 binder (Cell 35). Cells 1 and 3 were constructed in 1992 whereas Cells 33 through 35 were constructed in 1999. Coring of all of these cells occurred in November of 2004 and again in July of 2006 thus giving 12 years of service for the first coring in Cells 1 and 3, and five years of service for the first coring of Cells 33 through 35. As mentioned above, details on the pavement thicknesses are given in Table 5-1. Data on the pavement cores and their binders follow.
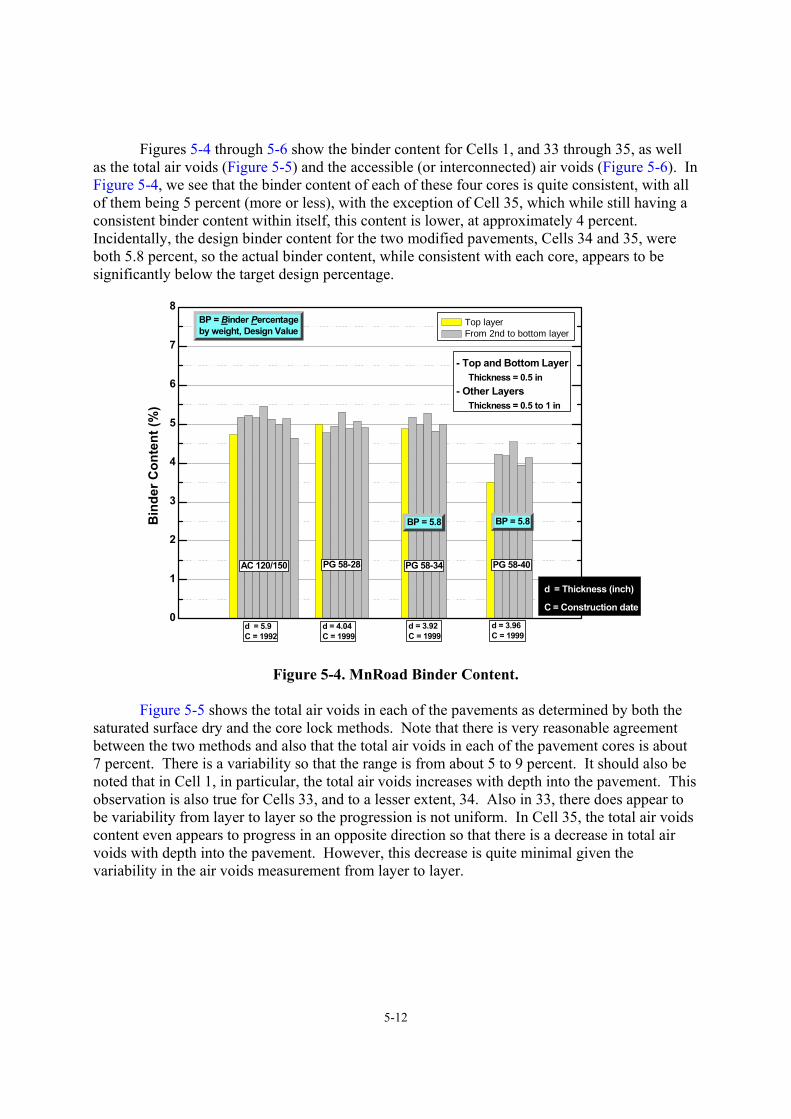
5-12
Figures 5-4 through 5-6 show the binder content for Cells 1, and 33 through 35, as well as the total air voids (Figure 5-5) and the accessible (or interconnected) air voids (Figure 5-6). In Figure 5-4, we see that the binder content of each of these four cores is quite consistent, with all of them being 5 percent (more or less), with the exception of Cell 35, which while still having a consistent binder content within itself, this content is lower, at approximately 4 percent. Incidentally, the design binder content for the two modified pavements, Cells 34 and 35, were both 5.8 percent, so the actual binder content, while consistent with each core, appears to be significantly below the target design percentage.
0
1
2
3
4
5
6
7
8BP = Binder Percentageby weight, Design Value
BP = 5.8BP = 5.8
Bin
der C
onte
nt (%
)
Top layer From 2nd to bottom layer
- Top and Bottom Layer Thickness = 0.5 in- Other Layers Thickness = 0.5 to 1 in
PG 58-40PG 58-28 PG 58-34AC 120/150
d = 3.96 C = 1999
d = 3.92 C = 1999
d = 4.04 C = 1999
d = 5.9 C = 1992
d = Thickness (inch)
C = Construction date
Figure 5-4. MnRoad Binder Content. Figure 5-5 shows the total air voids in each of the pavements as determined by both the saturated surface dry and the core lock methods. Note that there is very reasonable agreement between the two methods and also that the total air voids in each of the pavement cores is about 7 percent. There is a variability so that the range is from about 5 to 9 percent. It should also be noted that in Cell 1, in particular, the total air voids increases with depth into the pavement. This observation is also true for Cells 33, and to a lesser extent, 34. Also in 33, there does appear to be variability from layer to layer so the progression is not uniform. In Cell 35, the total air voids content even appears to progress in an opposite direction so that there is a decrease in total air voids with depth into the pavement. However, this decrease is quite minimal given the variability in the air voids measurement from layer to layer.
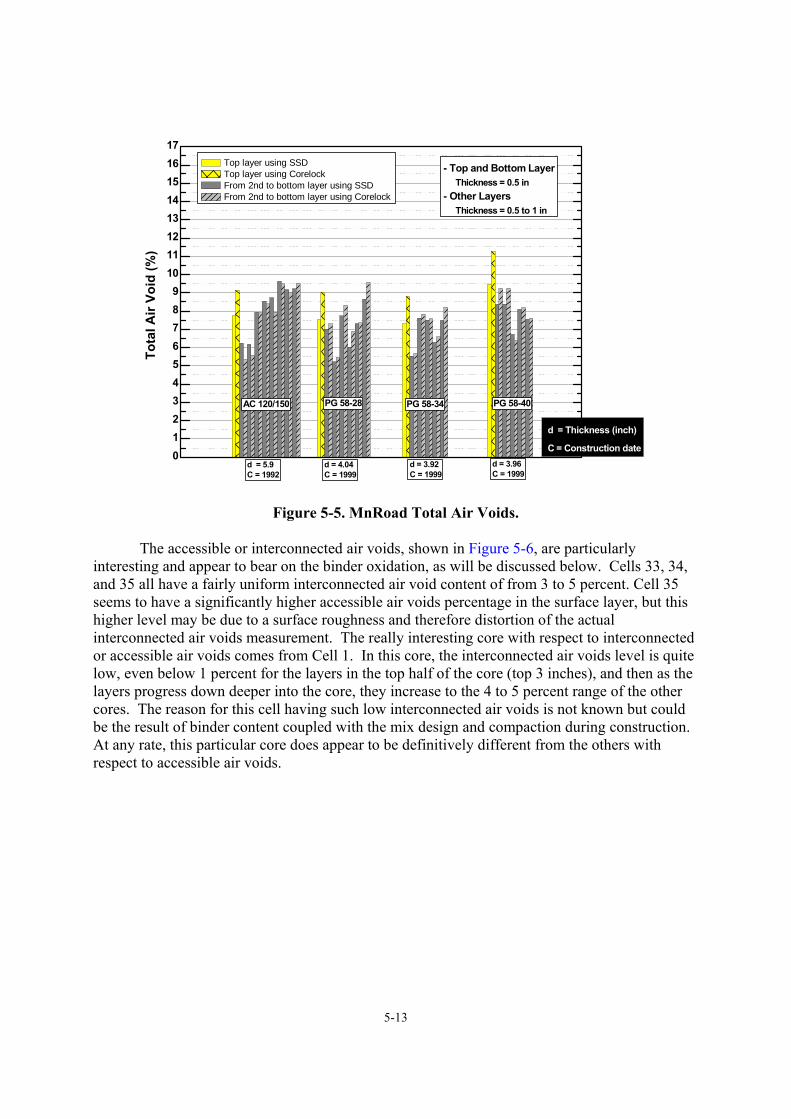
5-13
0123456789
1011121314151617
Tota
l Air
Void
(%)
PG 58-40PG 58-28 PG 58-34AC 120/150
d = 3.96 C = 1999
d = 3.92 C = 1999
d = 4.04 C = 1999
d = 5.9 C = 1992
- Top and Bottom Layer Thickness = 0.5 in- Other Layers Thickness = 0.5 to 1 in
Top layer using SSD Top layer using Corelock From 2nd to bottom layer using SSD From 2nd to bottom layer using Corelock
d = Thickness (inch)
C = Construction date
Figure 5-5. MnRoad Total Air Voids.
The accessible or interconnected air voids, shown in Figure 5-6, are particularly interesting and appear to bear on the binder oxidation, as will be discussed below. Cells 33, 34, and 35 all have a fairly uniform interconnected air void content of from 3 to 5 percent. Cell 35 seems to have a significantly higher accessible air voids percentage in the surface layer, but this higher level may be due to a surface roughness and therefore distortion of the actual interconnected air voids measurement. The really interesting core with respect to interconnected or accessible air voids comes from Cell 1. In this core, the interconnected air voids level is quite low, even below 1 percent for the layers in the top half of the core (top 3 inches), and then as the layers progress down deeper into the core, they increase to the 4 to 5 percent range of the other cores. The reason for this cell having such low interconnected air voids is not known but could be the result of binder content coupled with the mix design and compaction during construction. At any rate, this particular core does appear to be definitively different from the others with respect to accessible air voids.
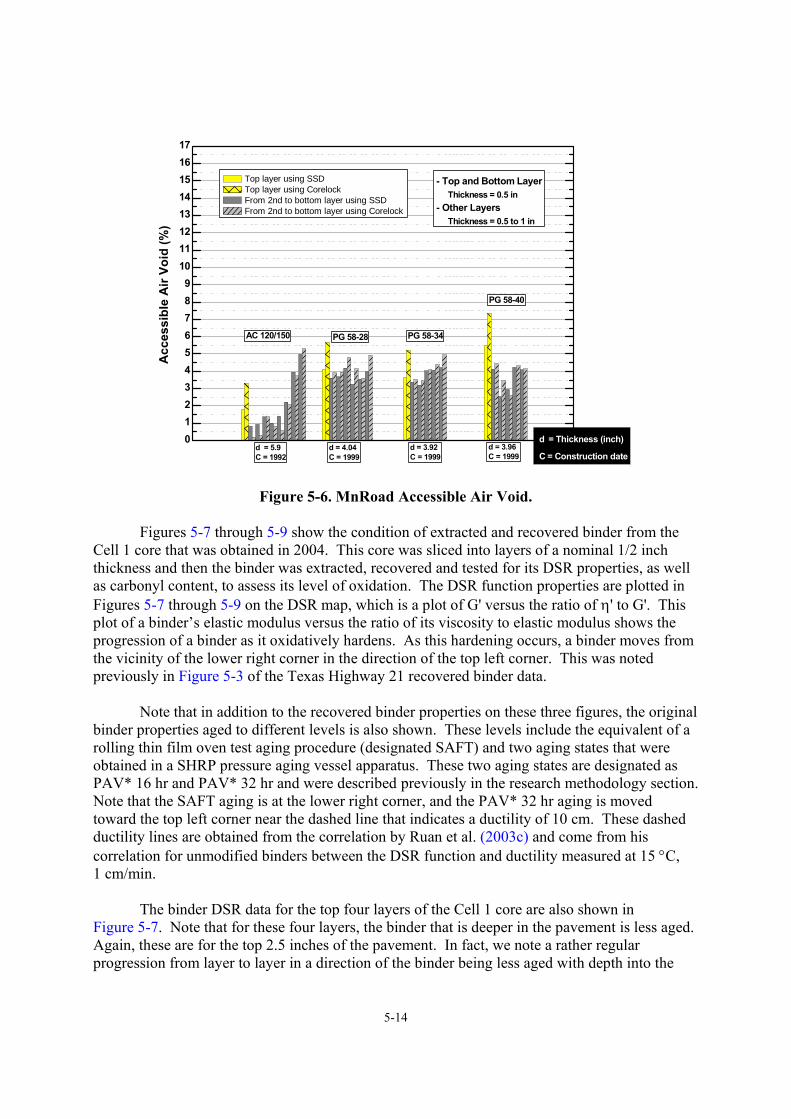
5-14
0123456789
1011121314151617
Top layer using SSD Top layer using Corelock From 2nd to bottom layer using SSD From 2nd to bottom layer using Corelock
- Top and Bottom Layer Thickness = 0.5 in- Other Layers Thickness = 0.5 to 1 in
Acc
essi
ble
Air
Void
(%)
PG 58-40
PG 58-28 PG 58-34AC 120/150
d = 3.96 C = 1999
d = 3.92 C = 1999
d = 4.04 C = 1999
d = 5.9 C = 1992
d = Thickness (inch)
C = Construction date
Figure 5-6. MnRoad Accessible Air Void.
Figures 5-7 through 5-9 show the condition of extracted and recovered binder from the Cell 1 core that was obtained in 2004. This core was sliced into layers of a nominal 1/2 inch thickness and then the binder was extracted, recovered and tested for its DSR properties, as well as carbonyl content, to assess its level of oxidation. The DSR function properties are plotted in Figures 5-7 through 5-9 on the DSR map, which is a plot of G' versus the ratio of η' to G'. This plot of a binder’s elastic modulus versus the ratio of its viscosity to elastic modulus shows the progression of a binder as it oxidatively hardens. As this hardening occurs, a binder moves from the vicinity of the lower right corner in the direction of the top left corner. This was noted previously in Figure 5-3 of the Texas Highway 21 recovered binder data.
Note that in addition to the recovered binder properties on these three figures, the original
binder properties aged to different levels is also shown. These levels include the equivalent of a rolling thin film oven test aging procedure (designated SAFT) and two aging states that were obtained in a SHRP pressure aging vessel apparatus. These two aging states are designated as PAV* 16 hr and PAV* 32 hr and were described previously in the research methodology section. Note that the SAFT aging is at the lower right corner, and the PAV* 32 hr aging is moved toward the top left corner near the dashed line that indicates a ductility of 10 cm. These dashed ductility lines are obtained from the correlation by Ruan et al. (2003c) and come from his correlation for unmodified binders between the DSR function and ductility measured at 15 °C, 1 cm/min.
The binder DSR data for the top four layers of the Cell 1 core are also shown in Figure 5-7. Note that for these four layers, the binder that is deeper in the pavement is less aged. Again, these are for the top 2.5 inches of the pavement. In fact, we note a rather regular progression from layer to layer in a direction of the binder being less aged with depth into the
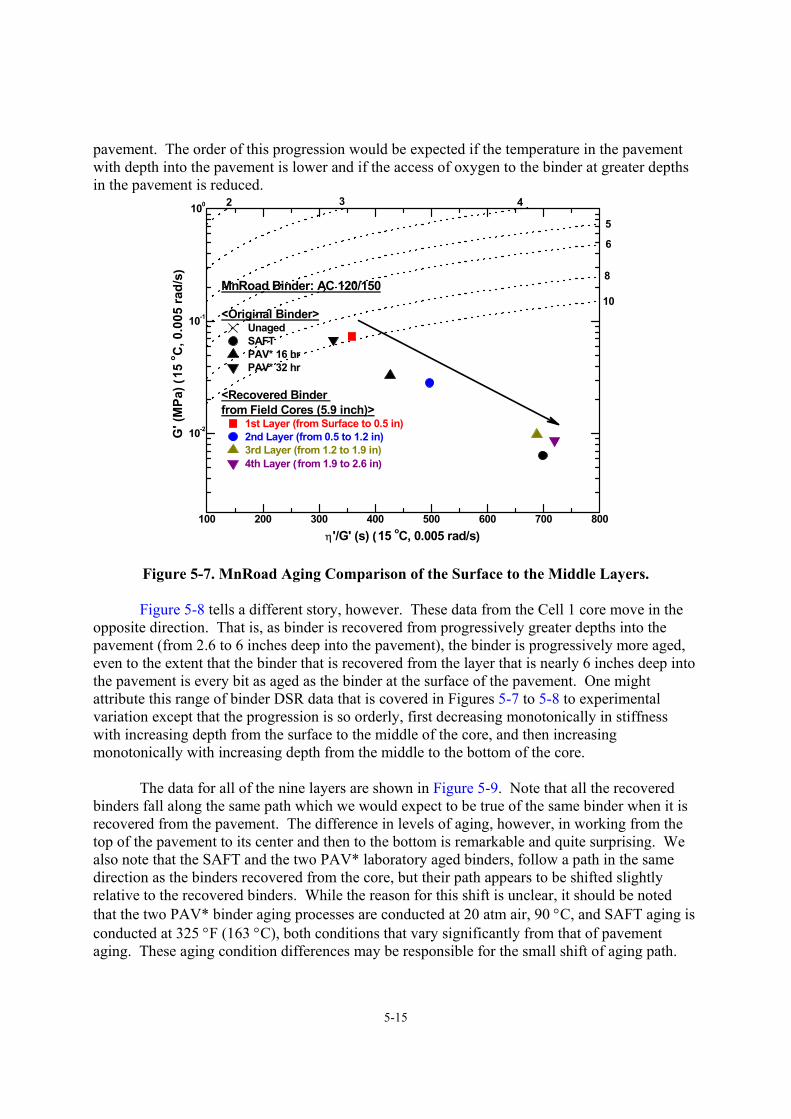
5-15
pavement. The order of this progression would be expected if the temperature in the pavement with depth into the pavement is lower and if the access of oxygen to the binder at greater depths in the pavement is reduced.
100 200 300 400 500 600 700 800
10-2
10-1
100
MnRoad Binder: AC 120/150
<Original Binder> Unaged SAFT PAV* 16 hr PAV* 32 hr
<Recovered Binder from Field Cores (5.9 inch)>
1st Layer (from Surface to 0.5 in)2nd Layer (from 0.5 to 1.2 in)3rd Layer (from 1.2 to 1.9 in)4th Layer (from 1.9 to 2.6 in)
G' (
MPa
) (15
o C, 0
.005
rad/
s)
η'/G' (s) (15 oC, 0.005 rad/s)
8
10
5
6
3 42
Figure 5-7. MnRoad Aging Comparison of the Surface to the Middle Layers.
Figure 5-8 tells a different story, however. These data from the Cell 1 core move in the opposite direction. That is, as binder is recovered from progressively greater depths into the pavement (from 2.6 to 6 inches deep into the pavement), the binder is progressively more aged, even to the extent that the binder that is recovered from the layer that is nearly 6 inches deep into the pavement is every bit as aged as the binder at the surface of the pavement. One might attribute this range of binder DSR data that is covered in Figures 5-7 to 5-8 to experimental variation except that the progression is so orderly, first decreasing monotonically in stiffness with increasing depth from the surface to the middle of the core, and then increasing monotonically with increasing depth from the middle to the bottom of the core.
The data for all of the nine layers are shown in Figure 5-9. Note that all the recovered
binders fall along the same path which we would expect to be true of the same binder when it is recovered from the pavement. The difference in levels of aging, however, in working from the top of the pavement to its center and then to the bottom is remarkable and quite surprising. We also note that the SAFT and the two PAV* laboratory aged binders, follow a path in the same direction as the binders recovered from the core, but their path appears to be shifted slightly relative to the recovered binders. While the reason for this shift is unclear, it should be noted that the two PAV* binder aging processes are conducted at 20 atm air, 90 °C, and SAFT aging is conducted at 325 °F (163 °C), both conditions that vary significantly from that of pavement aging. These aging condition differences may be responsible for the small shift of aging path.
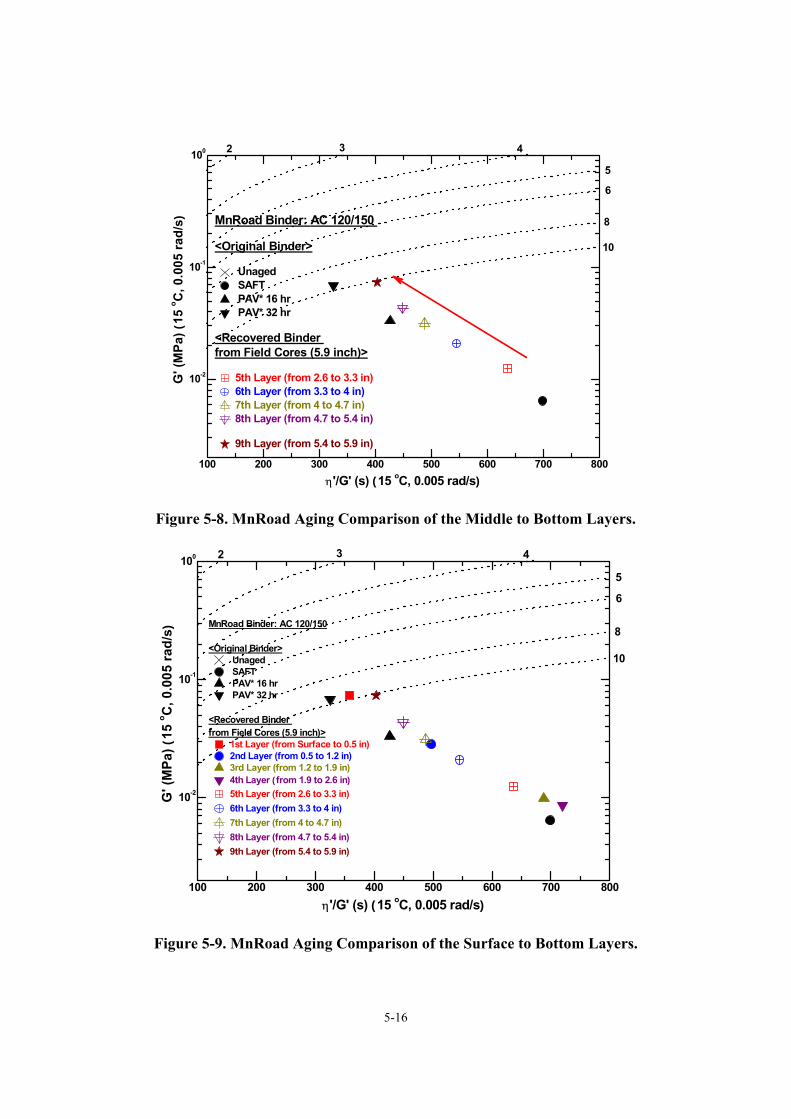
5-16
100 200 300 400 500 600 700 800
10-2
10-1
100
MnRoad Binder: AC 120/150
<Original Binder>
Unaged SAFT PAV* 16 hr PAV* 32 hr
<Recovered Binder from Field Cores (5.9 inch)>
5th Layer (from 2.6 to 3.3 in)6th Layer (from 3.3 to 4 in)7th Layer (from 4 to 4.7 in)8th Layer (from 4.7 to 5.4 in)
9th Layer (from 5.4 to 5.9 in)
G' (
MPa
) (15
o C, 0
.005
rad/
s)
η'/G' (s) (15 oC, 0.005 rad/s)
3 42
8
10
5
6
Figure 5-8. MnRoad Aging Comparison of the Middle to Bottom Layers.
100 200 300 400 500 600 700 800
10-2
10-1
100
MnRoad Binder: AC 120/150
<Original Binder> Unaged SAFT PAV* 16 hr PAV* 32 hr
<Recovered Binder from Field Cores (5.9 inch)>
1st Layer (from Surface to 0.5 in)2nd Layer (from 0.5 to 1.2 in)3rd Layer (from 1.2 to 1.9 in)4th Layer (from 1.9 to 2.6 in)5th Layer (from 2.6 to 3.3 in)6th Layer (from 3.3 to 4 in)7th Layer (from 4 to 4.7 in)8th Layer (from 4.7 to 5.4 in)9th Layer (from 5.4 to 5.9 in)
G' (
MPa
) (15
o C, 0
.005
rad/
s)
η'/G' (s) (15 oC, 0.005 rad/s)
8
10
5
6
3 42
Figure 5-9. MnRoad Aging Comparison of the Surface to Bottom Layers.
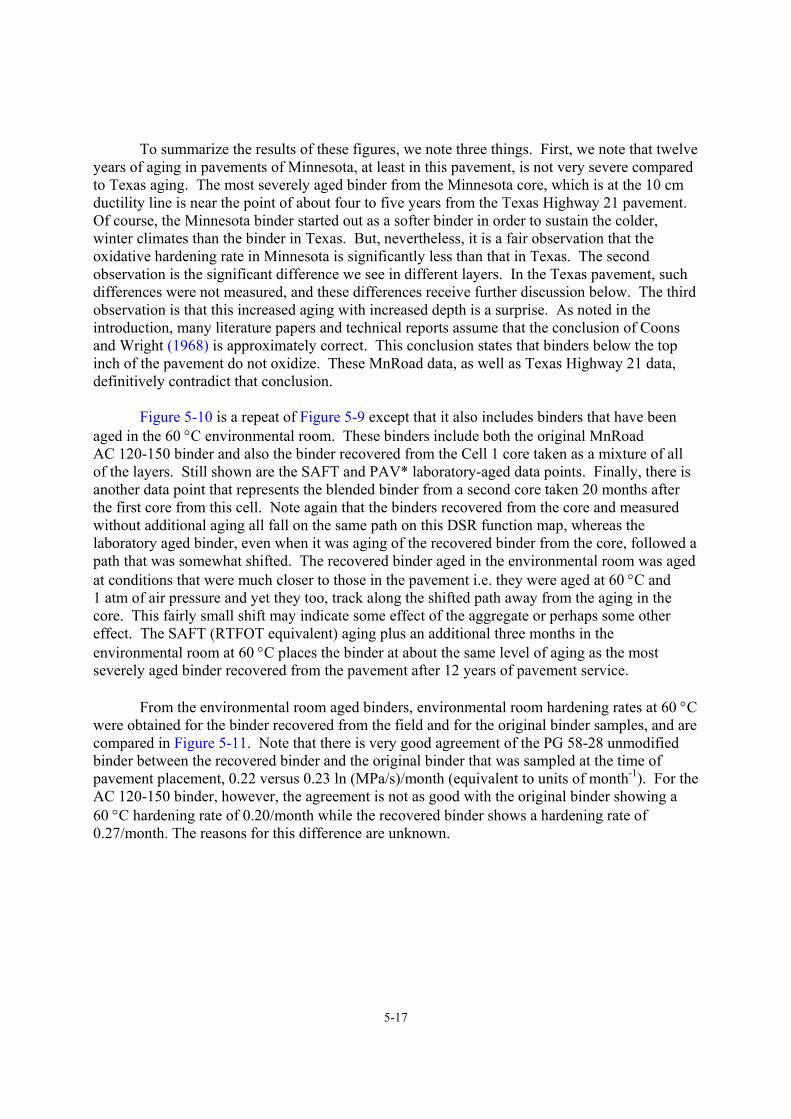
5-17
To summarize the results of these figures, we note three things. First, we note that twelve years of aging in pavements of Minnesota, at least in this pavement, is not very severe compared to Texas aging. The most severely aged binder from the Minnesota core, which is at the 10 cm ductility line is near the point of about four to five years from the Texas Highway 21 pavement. Of course, the Minnesota binder started out as a softer binder in order to sustain the colder, winter climates than the binder in Texas. But, nevertheless, it is a fair observation that the oxidative hardening rate in Minnesota is significantly less than that in Texas. The second observation is the significant difference we see in different layers. In the Texas pavement, such differences were not measured, and these differences receive further discussion below. The third observation is that this increased aging with increased depth is a surprise. As noted in the introduction, many literature papers and technical reports assume that the conclusion of Coons and Wright (1968) is approximately correct. This conclusion states that binders below the top inch of the pavement do not oxidize. These MnRoad data, as well as Texas Highway 21 data, definitively contradict that conclusion.
Figure 5-10 is a repeat of Figure 5-9 except that it also includes binders that have been aged in the 60 °C environmental room. These binders include both the original MnRoad AC 120-150 binder and also the binder recovered from the Cell 1 core taken as a mixture of all of the layers. Still shown are the SAFT and PAV* laboratory-aged data points. Finally, there is another data point that represents the blended binder from a second core taken 20 months after the first core from this cell. Note again that the binders recovered from the core and measured without additional aging all fall on the same path on this DSR function map, whereas the laboratory aged binder, even when it was aging of the recovered binder from the core, followed a path that was somewhat shifted. The recovered binder aged in the environmental room was aged at conditions that were much closer to those in the pavement i.e. they were aged at 60 °C and 1 atm of air pressure and yet they too, track along the shifted path away from the aging in the core. This fairly small shift may indicate some effect of the aggregate or perhaps some other effect. The SAFT (RTFOT equivalent) aging plus an additional three months in the environmental room at 60 °C places the binder at about the same level of aging as the most severely aged binder recovered from the pavement after 12 years of pavement service. From the environmental room aged binders, environmental room hardening rates at 60 °C were obtained for the binder recovered from the field and for the original binder samples, and are compared in Figure 5-11. Note that there is very good agreement of the PG 58-28 unmodified binder between the recovered binder and the original binder that was sampled at the time of pavement placement, 0.22 versus 0.23 ln (MPa/s)/month (equivalent to units of month-1). For the AC 120-150 binder, however, the agreement is not as good with the original binder showing a 60 °C hardening rate of 0.20/month while the recovered binder shows a hardening rate of 0.27/month. The reasons for this difference are unknown.
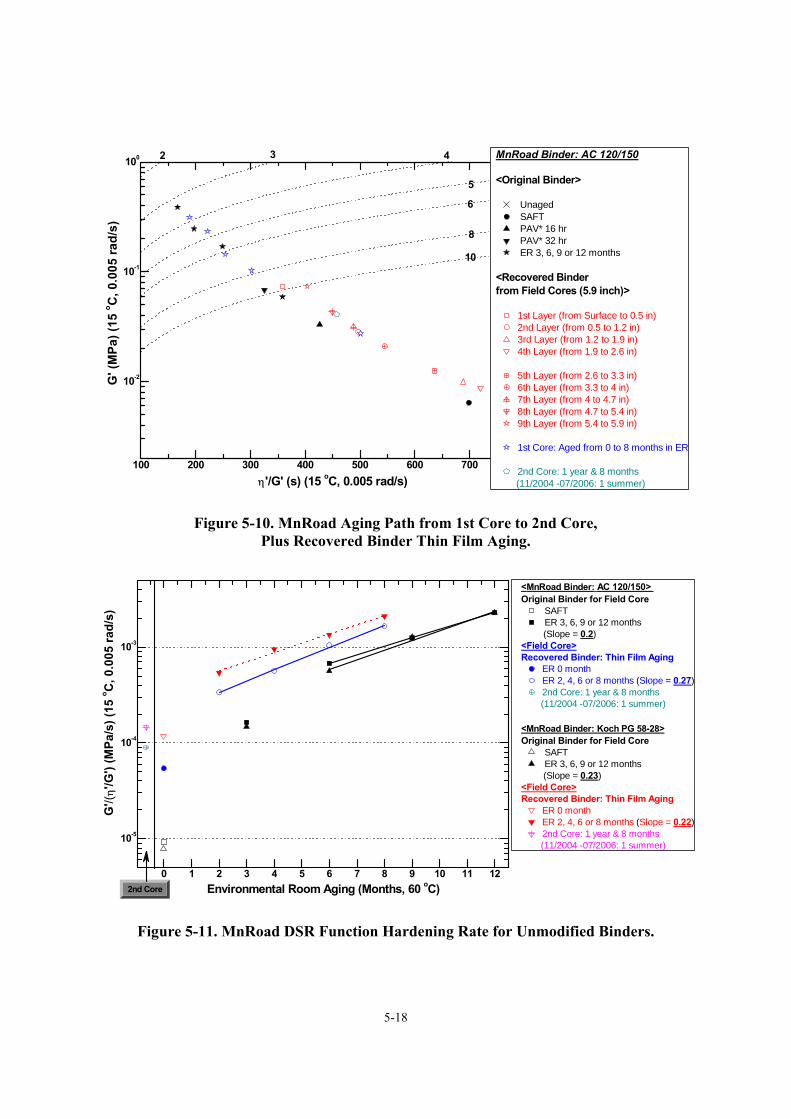
5-18
100 200 300 400 500 600 700 800
10-2
10-1
100 MnRoad Binder: AC 120/150
<Original Binder>
Unaged SAFT PAV* 16 hr PAV* 32 hr ER 3, 6, 9 or 12 months
<Recovered Binder from Field Cores (5.9 inch)>
1st Layer (from Surface to 0.5 in)2nd Layer (from 0.5 to 1.2 in)3rd Layer (from 1.2 to 1.9 in)4th Layer (from 1.9 to 2.6 in)
5th Layer (from 2.6 to 3.3 in)6th Layer (from 3.3 to 4 in)7th Layer (from 4 to 4.7 in)8th Layer (from 4.7 to 5.4 in)9th Layer (from 5.4 to 5.9 in)
1st Core: Aged from 0 to 8 months in ER
2nd Core: 1 year & 8 months (11/2004 -07/2006: 1 summer)
G' (
MPa
) (15
o C, 0
.005
rad/
s)
η'/G' (s) (15 oC, 0.005 rad/s)
8
10
5
6
3 42
Figure 5-10. MnRoad Aging Path from 1st Core to 2nd Core, Plus Recovered Binder Thin Film Aging.
0 1 2 3 4 5 6 7 8 9 10 11 12
10-5
10-4
10-3
Environmental Room Aging (Months, 60 oC)
<MnRoad Binder: AC 120/150> Original Binder for Field Core
SAFT ER 3, 6, 9 or 12 months
(Slope = 0.2)<Field Core>Recovered Binder: Thin Film Aging
ER 0 monthER 2, 4, 6 or 8 months (Slope = 0.27)2nd Core: 1 year & 8 months
(11/2004 -07/2006: 1 summer)
<MnRoad Binder: Koch PG 58-28>Original Binder for Field Core
SAFT ER 3, 6, 9 or 12 months
(Slope = 0.23)<Field Core>Recovered Binder: Thin Film Aging
ER 0 monthER 2, 4, 6 or 8 months (Slope = 0.22)2nd Core: 1 year & 8 months
(11/2004 -07/2006: 1 summer)
G'/(
η'/G
') (M
Pa/s
) (15
o C, 0
.005
rad/
s)
2nd Core
Figure 5-11. MnRoad DSR Function Hardening Rate for Unmodified Binders.
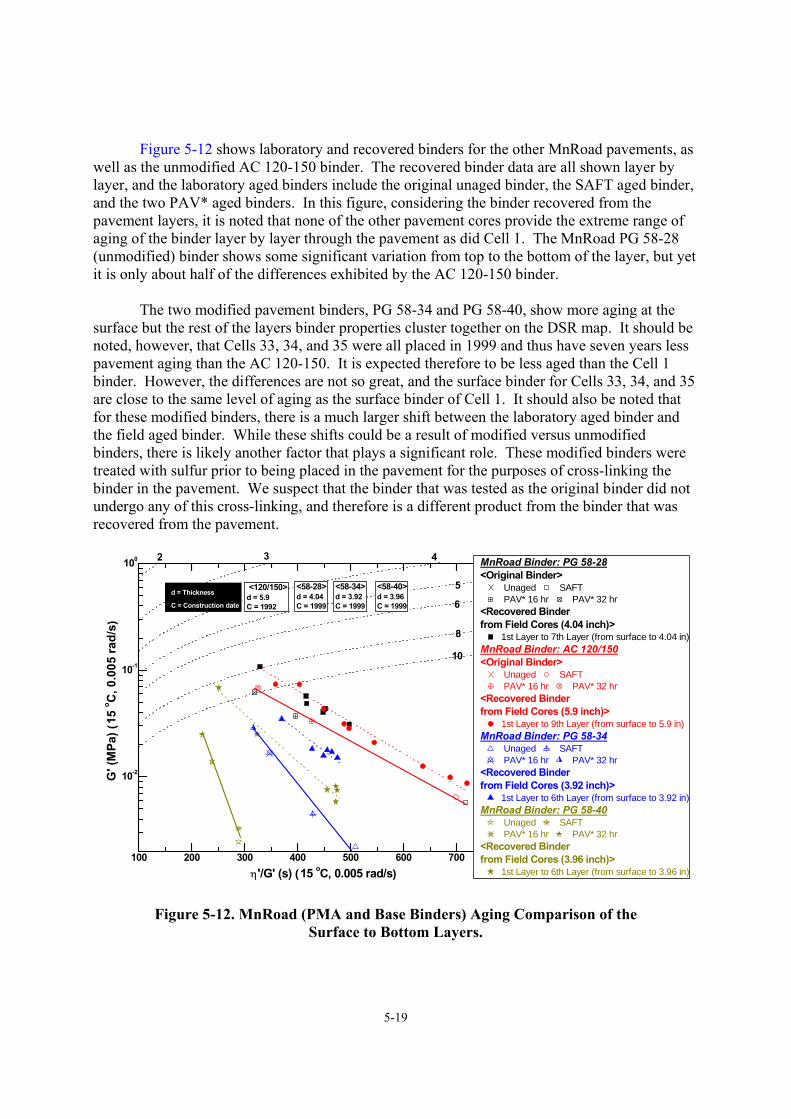
5-19
Figure 5-12 shows laboratory and recovered binders for the other MnRoad pavements, as well as the unmodified AC 120-150 binder. The recovered binder data are all shown layer by layer, and the laboratory aged binders include the original unaged binder, the SAFT aged binder, and the two PAV* aged binders. In this figure, considering the binder recovered from the pavement layers, it is noted that none of the other pavement cores provide the extreme range of aging of the binder layer by layer through the pavement as did Cell 1. The MnRoad PG 58-28 (unmodified) binder shows some significant variation from top to the bottom of the layer, but yet it is only about half of the differences exhibited by the AC 120-150 binder. The two modified pavement binders, PG 58-34 and PG 58-40, show more aging at the surface but the rest of the layers binder properties cluster together on the DSR map. It should be noted, however, that Cells 33, 34, and 35 were all placed in 1999 and thus have seven years less pavement aging than the AC 120-150. It is expected therefore to be less aged than the Cell 1 binder. However, the differences are not so great, and the surface binder for Cells 33, 34, and 35 are close to the same level of aging as the surface binder of Cell 1. It should also be noted that for these modified binders, there is a much larger shift between the laboratory aged binder and the field aged binder. While these shifts could be a result of modified versus unmodified binders, there is likely another factor that plays a significant role. These modified binders were treated with sulfur prior to being placed in the pavement for the purposes of cross-linking the binder in the pavement. We suspect that the binder that was tested as the original binder did not undergo any of this cross-linking, and therefore is a different product from the binder that was recovered from the pavement.
100 200 300 400 500 600 700 800
10-2
10-1
100
<58-40>d = 3.96 C = 1999
<58-34>d = 3.92 C = 1999
<58-28>d = 4.04 C = 1999
MnRoad Binder: PG 58-28<Original Binder>
Unaged SAFT PAV* 16 hr PAV* 32 hr
<Recovered Binder from Field Cores (4.04 inch)>
1st Layer to 7th Layer (from surface to 4.04 in)MnRoad Binder: AC 120/150<Original Binder>
Unaged SAFT PAV* 16 hr PAV* 32 hr
<Recovered Binder from Field Cores (5.9 inch)>
1st Layer to 9th Layer (from surface to 5.9 in)MnRoad Binder: PG 58-34
Unaged SAFT PAV* 16 hr PAV* 32 hr
<Recovered Binder from Field Cores (3.92 inch)>
1st Layer to 6th Layer (from surface to 3.92 in)MnRoad Binder: PG 58-40
Unaged SAFT PAV* 16 hr PAV* 32 hr
<Recovered Binder from Field Cores (3.96 inch)>
1st Layer to 6th Layer (from surface to 3.96 in)
G' (
MPa
) (15
o C, 0
.005
rad/
s)
η'/G' (s) (15 oC, 0.005 rad/s)
8
10
5
6
3 42
d = Thickness
C = Construction date
<120/150>d = 5.9C = 1992
Figure 5-12. MnRoad (PMA and Base Binders) Aging Comparison of the Surface to Bottom Layers.
5-20
Some final observations about these MnRoad pavements are appropriate. Previously, it was noted that the Cell 1 core had a significantly lower level of interconnected air voids than any of the others, and these lower levels were evident in the top layers of the pavement while the bottom layers were in the range of 2 to 5 percent interconnected air voids. A possible conclusion is that the variation in aging levels of that core with depth in the pavement is the result of these very low interconnected air voids. Looking at Figure 5-6, it can be seen that the air voids are less than 2 percent for the top five layers and then the sixth, seventh, eighth, and ninth layers increase progressively from 2 to 5 percent interconnected air voids. These data suggest that the progressively lower amount of aging deeper into the pavement could be due to this very low level of interconnected air voids and then that the increased aging towards the bottom of the pavement layer is a result of the increasing air voids with depth in that part of the pavement. It is also noted that the interconnected or accessible air voids in the other cells are all in the range of 3 to 5 percent and in fact, the data did not appear to show aging variations in those cores that might be attributed to differences in air voids. Thus, it is tentatively hypothesized that aging of the binder in a pavement is reduced by a deficiency of air if the accessible air voids are low enough, locally in the pavement, to affect binder oxidation. In other words, it is hypothesized that the oxidation of a binder in a pavement is affected by the air voids near that binder and not as much by the air voids some distance away from the binder. According to this hypothesis, oxygen generally is available to the binder in the pavement (to the extent that the pavement has accessible air voids) but only locally in a pavement if the air voids are sufficiently high; if the local air voids are low enough, then there can be a significantly reduced binder oxidation rate. This hypothesis is in progress and more data are required to establish its correctness. So, to summarize binder oxidation in these MnRoad cores, it is observed:
• Binder aging in Minnesota occurs at a generally lower rate than in Texas because of the lower temperatures.
• Aging rates may be different in different layers of the pavement, and it is hypothesized
that these differences are a result of the accessibility of oxygen to the binder locally.
• Generally, there is a shift between the aging path followed on the DSR map by binders aged in pavement versus binders aged in the laboratory in neat binder films. This shift occurs even in binders recovered from the pavement and subsequently aged in a laboratory in thin films.
• This shift between binders aged in cores and binders aged in the laboratory is very
significant for the two modified binders of the MnRoad cores, and this accentuated shift may be the result of cross-linking of the binder in the field as a result of added sulfur.
Additional data on the MnRoad binders are shown in the Appendix 5-G and include size
exclusion chromatograms of the modified and unmodified binders, layer by layer.
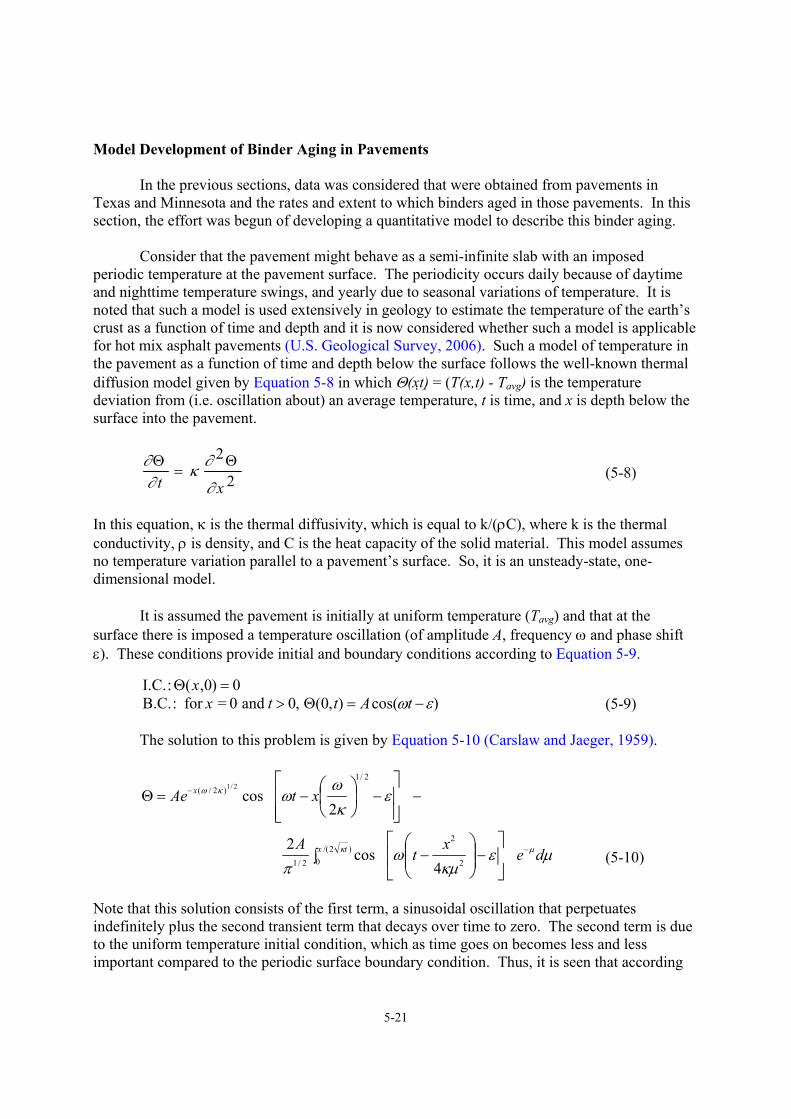
5-21
Model Development of Binder Aging in Pavements In the previous sections, data was considered that were obtained from pavements in
Texas and Minnesota and the rates and extent to which binders aged in those pavements. In this section, the effort was begun of developing a quantitative model to describe this binder aging. Consider that the pavement might behave as a semi-infinite slab with an imposed periodic temperature at the pavement surface. The periodicity occurs daily because of daytime and nighttime temperature swings, and yearly due to seasonal variations of temperature. It is noted that such a model is used extensively in geology to estimate the temperature of the earth’s crust as a function of time and depth and it is now considered whether such a model is applicable for hot mix asphalt pavements (U.S. Geological Survey, 2006). Such a model of temperature in the pavement as a function of time and depth below the surface follows the well-known thermal diffusion model given by Equation 5-8 in which Θ(xt) = (T(x,t) - Tavg) is the temperature deviation from (i.e. oscillation about) an average temperature, t is time, and x is depth below the surface into the pavement.
∂ Θ∂ t
= κ∂ 2 Θ
∂ x 2 (5-8)
In this equation, κ is the thermal diffusivity, which is equal to k/(ρC), where k is the thermal conductivity, ρ is density, and C is the heat capacity of the solid material. This model assumes no temperature variation parallel to a pavement’s surface. So, it is an unsteady-state, one-dimensional model. It is assumed the pavement is initially at uniform temperature (Tavg) and that at the surface there is imposed a temperature oscillation (of amplitude A, frequency ω and phase shift ε). These conditions provide initial and boundary conditions according to Equation 5-9. I.C.: Θ(x,0) = 0 B.C.: for x = 0 and t > 0, Θ(0,t) = Acos(ωt −ε) (5-9) The solution to this problem is given by Equation 5-10 (Carslaw and Jaeger, 1959).
−−−=Θ⎥⎥⎦
⎤
⎢⎢⎣
⎡⎟⎠⎞
⎜⎝⎛− ε
κω
ωκω2/1
)2/(
2cos
2/1
xtAe x
µεκµ
ωπ
µκ dex
tA tx −
∫ −− ⎥⎦
⎤⎢⎣
⎡⎟⎟⎠
⎞⎜⎜⎝
⎛)2/(0 2
2
2/1 4cos
2 (5-10)
Note that this solution consists of the first term, a sinusoidal oscillation that perpetuates indefinitely plus the second transient term that decays over time to zero. The second term is due to the uniform temperature initial condition, which as time goes on becomes less and less important compared to the periodic surface boundary condition. Thus, it is seen that according
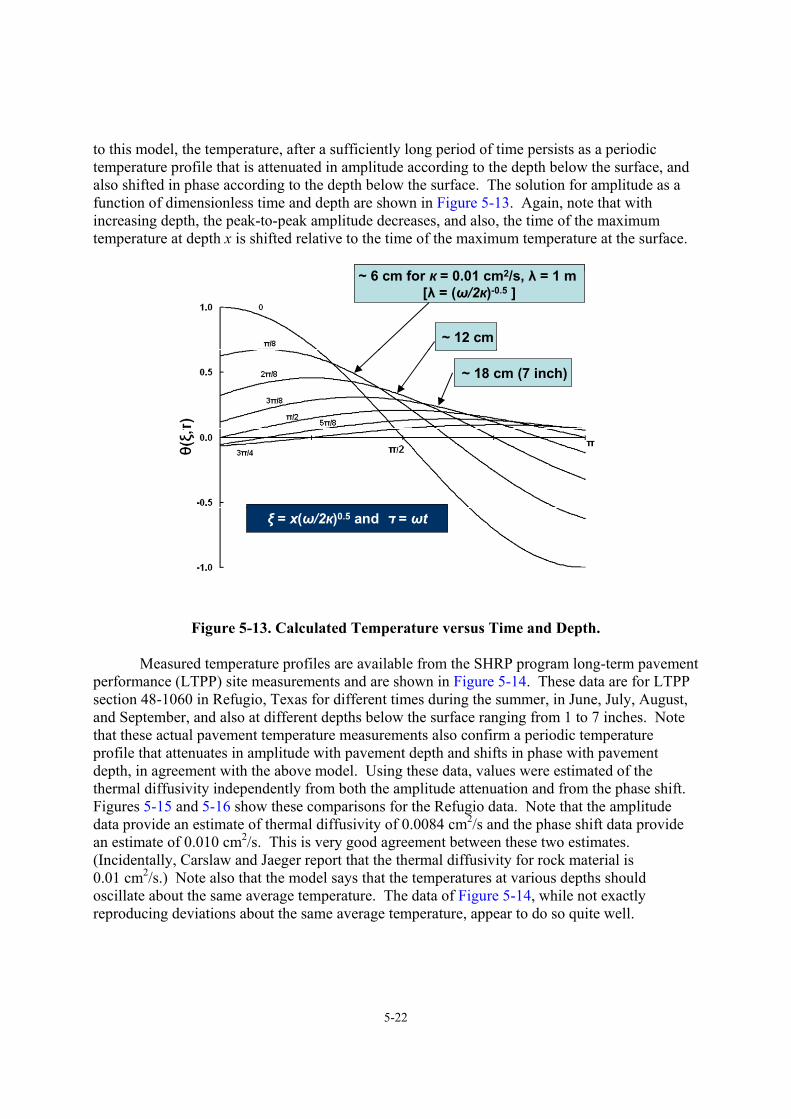
5-22
to this model, the temperature, after a sufficiently long period of time persists as a periodic temperature profile that is attenuated in amplitude according to the depth below the surface, and also shifted in phase according to the depth below the surface. The solution for amplitude as a function of dimensionless time and depth are shown in Figure 5-13. Again, note that with increasing depth, the peak-to-peak amplitude decreases, and also, the time of the maximum temperature at depth x is shifted relative to the time of the maximum temperature at the surface.
~ 6 cm for к = 0.01 cm2/s, λ = 1 m [λ = (ω/2к)-0.5 ]
~ 12 cm
~ 18 cm (7 inch)
ξ = x(ω/2к)0.5 and ד = ωt
~ 6 cm for к = 0.01 cm2/s, λ = 1 m [λ = (ω/2к)-0.5 ]
~ 12 cm
~ 18 cm (7 inch)
ξ = x(ω/2к)0.5 and ד = ωt
Figure 5-13. Calculated Temperature versus Time and Depth.
Measured temperature profiles are available from the SHRP program long-term pavement performance (LTPP) site measurements and are shown in Figure 5-14. These data are for LTPP section 48-1060 in Refugio, Texas for different times during the summer, in June, July, August, and September, and also at different depths below the surface ranging from 1 to 7 inches. Note that these actual pavement temperature measurements also confirm a periodic temperature profile that attenuates in amplitude with pavement depth and shifts in phase with pavement depth, in agreement with the above model. Using these data, values were estimated of the thermal diffusivity independently from both the amplitude attenuation and from the phase shift. Figures 5-15 and 5-16 show these comparisons for the Refugio data. Note that the amplitude data provide an estimate of thermal diffusivity of 0.0084 cm2/s and the phase shift data provide an estimate of 0.010 cm2/s. This is very good agreement between these two estimates. (Incidentally, Carslaw and Jaeger report that the thermal diffusivity for rock material is 0.01 cm2/s.) Note also that the model says that the temperatures at various depths should oscillate about the same average temperature. The data of Figure 5-14, while not exactly reproducing deviations about the same average temperature, appear to do so quite well.
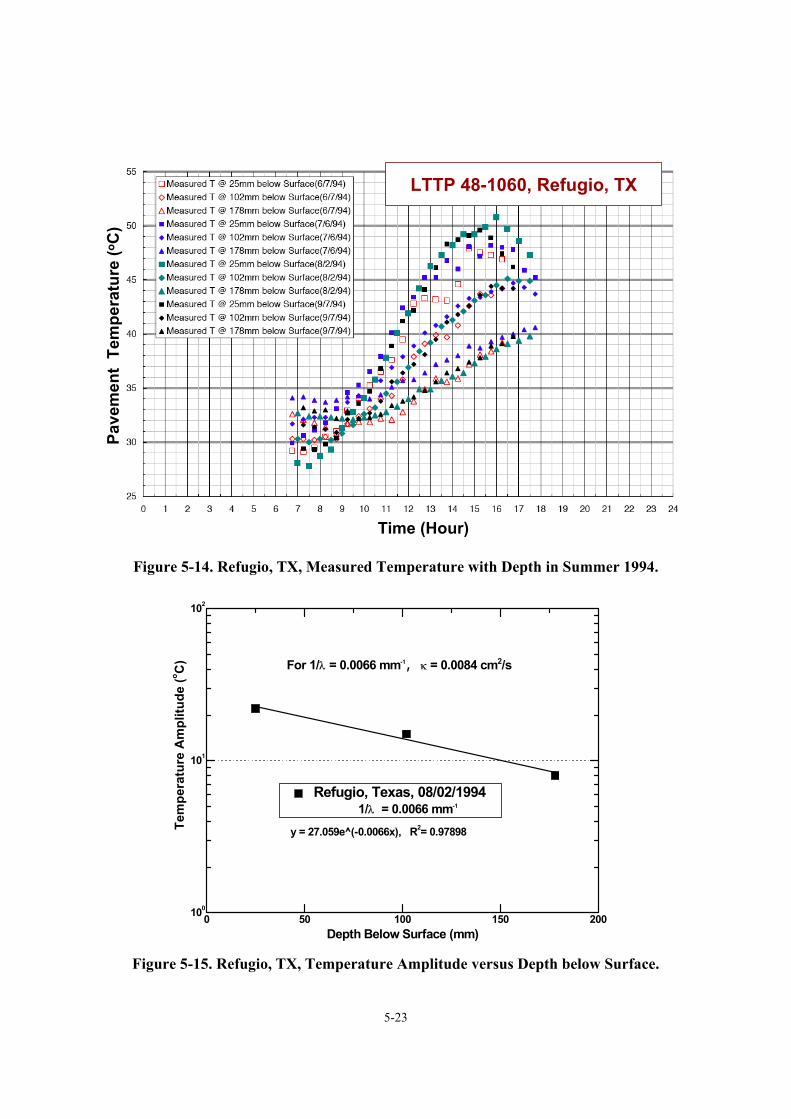
5-23
Time (Hour)
Pave
men
t Te
mpe
ratu
re (o
C)
LTTP 48-1060, Refugio, TX
Time (Hour)
Pave
men
t Te
mpe
ratu
re (o
C)
Time (Hour)
Pave
men
t Te
mpe
ratu
re (o
C)
LTTP 48-1060, Refugio, TX
Figure 5-14. Refugio, TX, Measured Temperature with Depth in Summer 1994.
0 50 100 150 200100
101
102
For 1/λ = 0.0066 mm-1, κ = 0.0084 cm2/s
y = 27.059e^(-0.0066x), R2= 0.97898
Depth Below Surface (mm)
Refugio, Texas, 08/02/1994 1/λ = 0.0066 mm-1
Tem
pera
ture
Am
plitu
de (o C
)
Figure 5-15. Refugio, TX, Temperature Amplitude versus Depth below Surface.
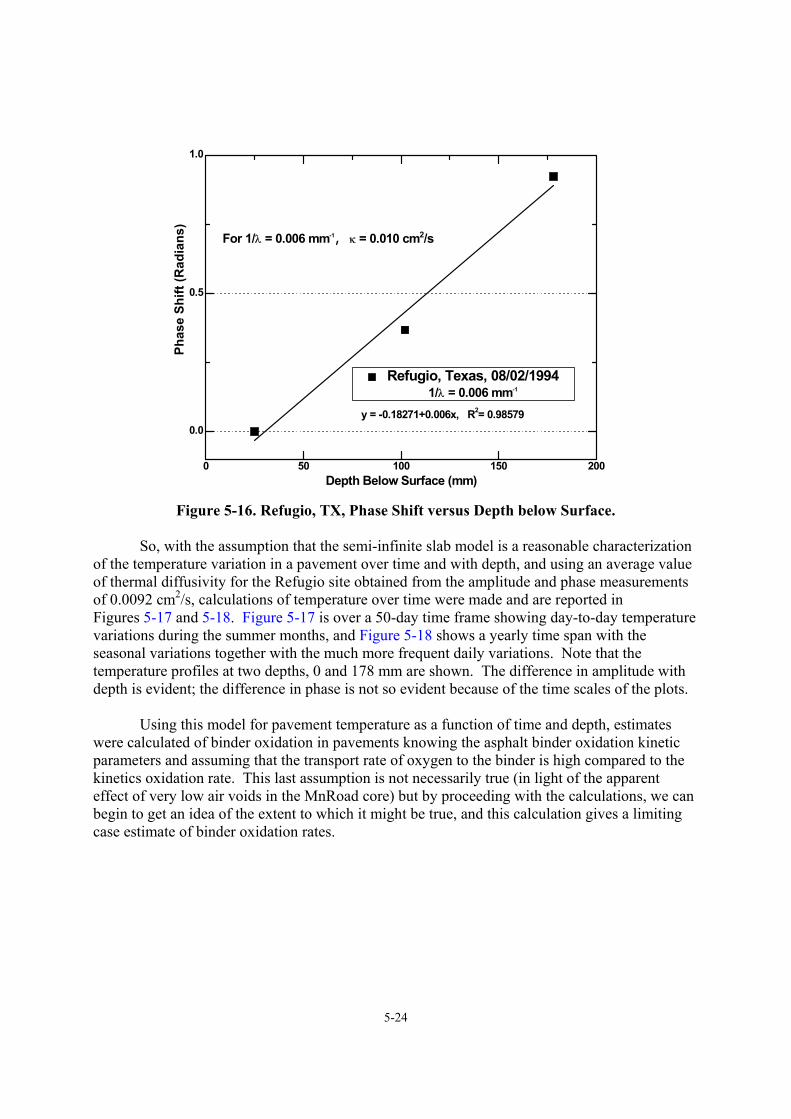
5-24
0 50 100 150 200
0.0
0.5
1.0
For 1/λ = 0.006 mm-1, κ = 0.010 cm2/s
y = -0.18271+0.006x, R2= 0.98579
Depth Below Surface (mm)
Refugio, Texas, 08/02/1994 1/λ = 0.006 mm-1
Phas
e Sh
ift (R
adia
ns)
Figure 5-16. Refugio, TX, Phase Shift versus Depth below Surface.
So, with the assumption that the semi-infinite slab model is a reasonable characterization
of the temperature variation in a pavement over time and with depth, and using an average value of thermal diffusivity for the Refugio site obtained from the amplitude and phase measurements of 0.0092 cm2/s, calculations of temperature over time were made and are reported in Figures 5-17 and 5-18. Figure 5-17 is over a 50-day time frame showing day-to-day temperature variations during the summer months, and Figure 5-18 shows a yearly time span with the seasonal variations together with the much more frequent daily variations. Note that the temperature profiles at two depths, 0 and 178 mm are shown. The difference in amplitude with depth is evident; the difference in phase is not so evident because of the time scales of the plots. Using this model for pavement temperature as a function of time and depth, estimates were calculated of binder oxidation in pavements knowing the asphalt binder oxidation kinetic parameters and assuming that the transport rate of oxygen to the binder is high compared to the kinetics oxidation rate. This last assumption is not necessarily true (in light of the apparent effect of very low air voids in the MnRoad core) but by proceeding with the calculations, we can begin to get an idea of the extent to which it might be true, and this calculation gives a limiting case estimate of binder oxidation rates.
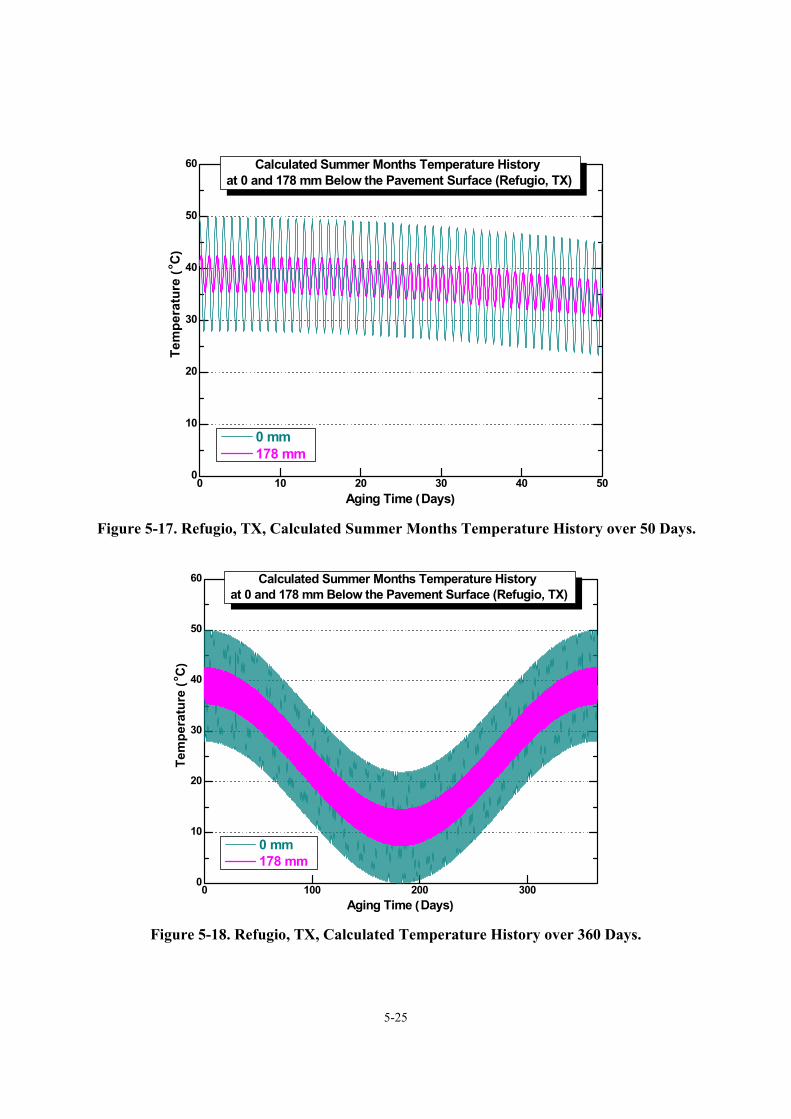
5-25
Figure 5-17. Refugio, TX, Calculated Summer Months Temperature History over 50 Days.
Figure 5-18. Refugio, TX, Calculated Temperature History over 360 Days.
0 100 200 3000
10
20
30
40
50
60
Aging Time (Days)
Calculated Summer Months Temperature History at 0 and 178 mm Below the Pavement Surface (Refugio, TX)
0 mm 178 mm
Tem
pera
ture
(o C
)
0 10 20 30 40 500
10
20
30
40
50
60
Aging Time (Days)
Calculated Summer Months Temperature History at 0 and 178 mm Below the Pavement Surface (Refugio, TX)
0 mm 178 mm
Tem
pera
ture
(o C
)
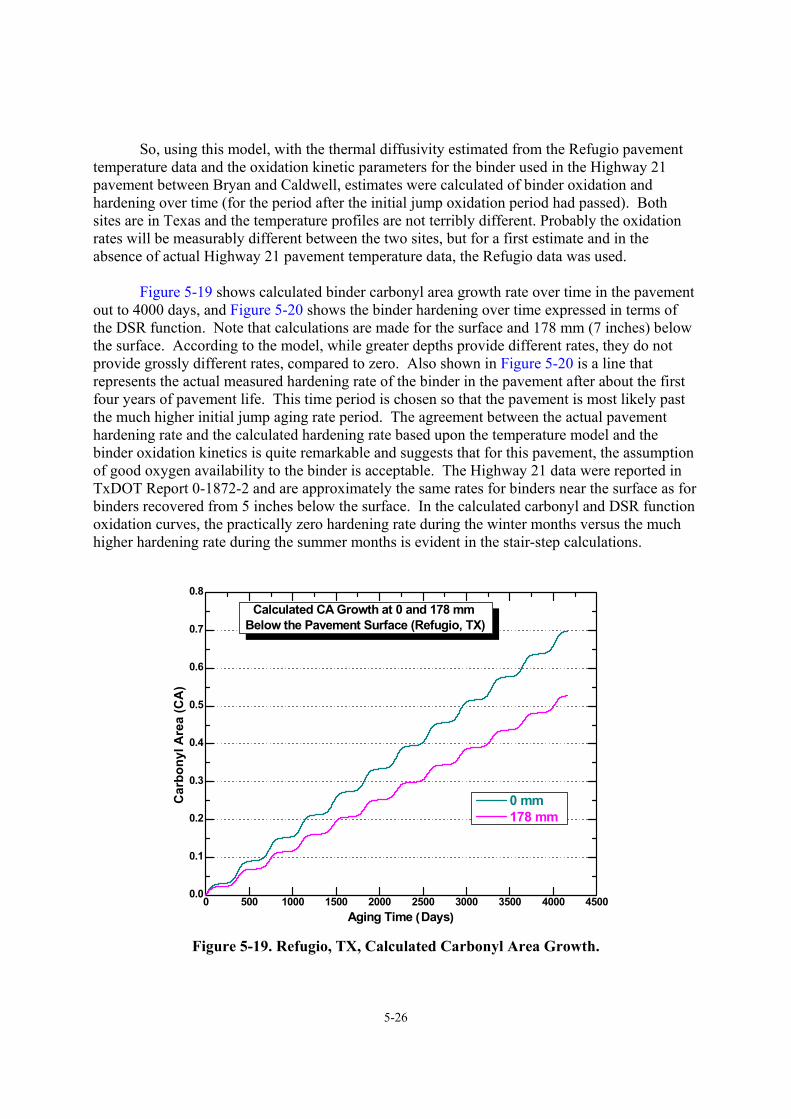
5-26
So, using this model, with the thermal diffusivity estimated from the Refugio pavement temperature data and the oxidation kinetic parameters for the binder used in the Highway 21 pavement between Bryan and Caldwell, estimates were calculated of binder oxidation and hardening over time (for the period after the initial jump oxidation period had passed). Both sites are in Texas and the temperature profiles are not terribly different. Probably the oxidation rates will be measurably different between the two sites, but for a first estimate and in the absence of actual Highway 21 pavement temperature data, the Refugio data was used. Figure 5-19 shows calculated binder carbonyl area growth rate over time in the pavement out to 4000 days, and Figure 5-20 shows the binder hardening over time expressed in terms of the DSR function. Note that calculations are made for the surface and 178 mm (7 inches) below the surface. According to the model, while greater depths provide different rates, they do not provide grossly different rates, compared to zero. Also shown in Figure 5-20 is a line that represents the actual measured hardening rate of the binder in the pavement after about the first four years of pavement life. This time period is chosen so that the pavement is most likely past the much higher initial jump aging rate period. The agreement between the actual pavement hardening rate and the calculated hardening rate based upon the temperature model and the binder oxidation kinetics is quite remarkable and suggests that for this pavement, the assumption of good oxygen availability to the binder is acceptable. The Highway 21 data were reported in TxDOT Report 0-1872-2 and are approximately the same rates for binders near the surface as for binders recovered from 5 inches below the surface. In the calculated carbonyl and DSR function oxidation curves, the practically zero hardening rate during the winter months versus the much higher hardening rate during the summer months is evident in the stair-step calculations.
Figure 5-19. Refugio, TX, Calculated Carbonyl Area Growth.
0 500 1000 1500 2000 2500 3000 3500 4000 45000.0
0.1
0.2
0.3
0.4
0.5
0.6
0.7
0.8
Car
bony
l Are
a (C
A)
0 mm 178 mm
Aging Time (Days)
Calculated CA Growth at 0 and 178 mm Below the Pavement Surface (Refugio, TX)
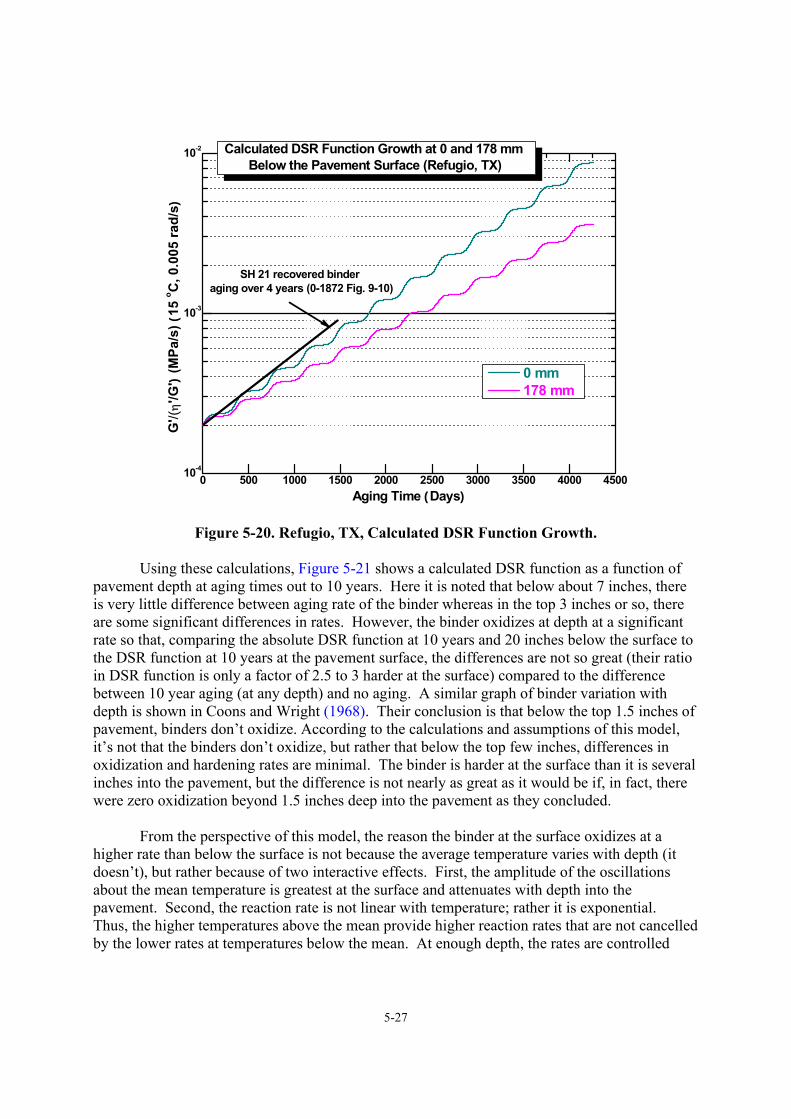
5-27
0 500 1000 1500 2000 2500 3000 3500 4000 450010-4
10-3
10-2
SH 21 recovered binder aging over 4 years (0-1872 Fig. 9-10)
G'/(
η'/G
') (M
Pa/s
) (15
o C, 0
.005
rad/
s)
0 mm 178 mm
Aging Time (Days)
Calculated DSR Function Growth at 0 and 178 mm Below the Pavement Surface (Refugio, TX)
Figure 5-20. Refugio, TX, Calculated DSR Function Growth.
Using these calculations, Figure 5-21 shows a calculated DSR function as a function of pavement depth at aging times out to 10 years. Here it is noted that below about 7 inches, there is very little difference between aging rate of the binder whereas in the top 3 inches or so, there are some significant differences in rates. However, the binder oxidizes at depth at a significant rate so that, comparing the absolute DSR function at 10 years and 20 inches below the surface to the DSR function at 10 years at the pavement surface, the differences are not so great (their ratio in DSR function is only a factor of 2.5 to 3 harder at the surface) compared to the difference between 10 year aging (at any depth) and no aging. A similar graph of binder variation with depth is shown in Coons and Wright (1968). Their conclusion is that below the top 1.5 inches of pavement, binders don’t oxidize. According to the calculations and assumptions of this model, it’s not that the binders don’t oxidize, but rather that below the top few inches, differences in oxidization and hardening rates are minimal. The binder is harder at the surface than it is several inches into the pavement, but the difference is not nearly as great as it would be if, in fact, there were zero oxidization beyond 1.5 inches deep into the pavement as they concluded. From the perspective of this model, the reason the binder at the surface oxidizes at a higher rate than below the surface is not because the average temperature varies with depth (it doesn’t), but rather because of two interactive effects. First, the amplitude of the oscillations about the mean temperature is greatest at the surface and attenuates with depth into the pavement. Second, the reaction rate is not linear with temperature; rather it is exponential. Thus, the higher temperatures above the mean provide higher reaction rates that are not cancelled by the lower rates at temperatures below the mean. At enough depth, the rates are controlled
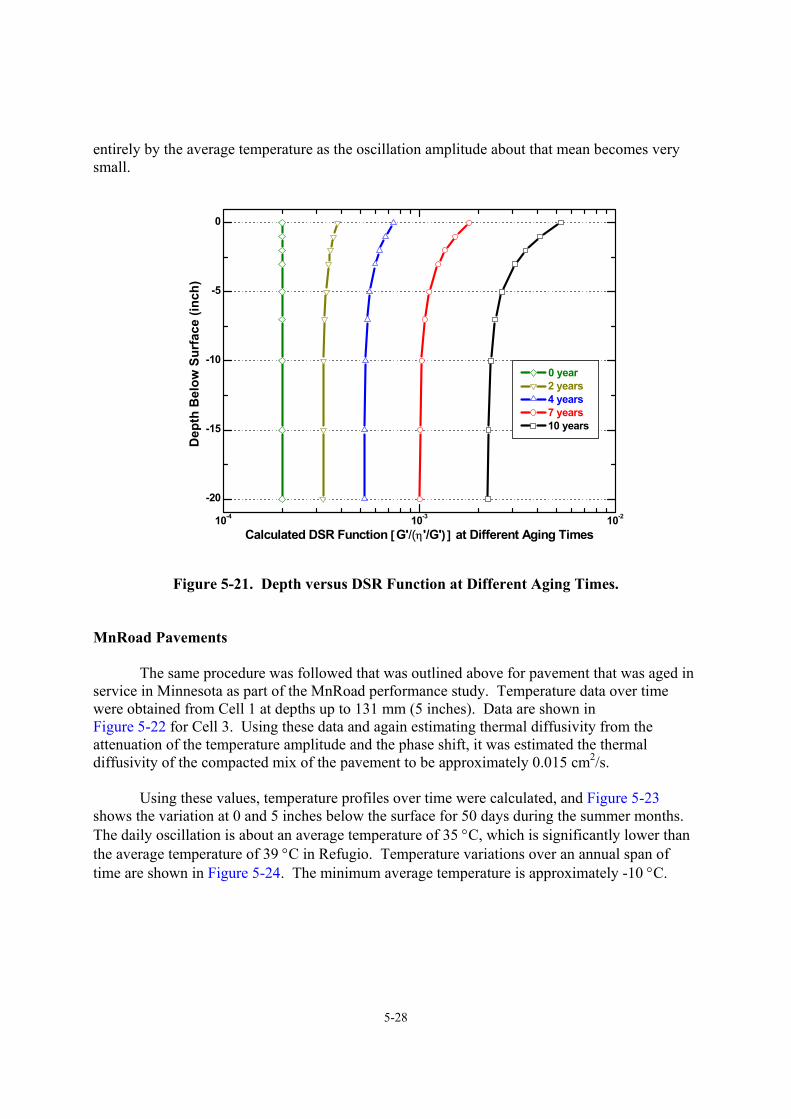
5-28
entirely by the average temperature as the oscillation amplitude about that mean becomes very small.
10-4 10-3 10-2
-20
-15
-10
-5
0
0 year 2 years 4 years 7 years 10 years
D
epth
Bel
ow S
urfa
ce (i
nch)
Calculated DSR Function [G'/(η'/G')] at Different Aging Times
Figure 5-21. Depth versus DSR Function at Different Aging Times.
MnRoad Pavements The same procedure was followed that was outlined above for pavement that was aged in service in Minnesota as part of the MnRoad performance study. Temperature data over time were obtained from Cell 1 at depths up to 131 mm (5 inches). Data are shown in Figure 5-22 for Cell 3. Using these data and again estimating thermal diffusivity from the attenuation of the temperature amplitude and the phase shift, it was estimated the thermal diffusivity of the compacted mix of the pavement to be approximately 0.015 cm2/s. Using these values, temperature profiles over time were calculated, and Figure 5-23 shows the variation at 0 and 5 inches below the surface for 50 days during the summer months. The daily oscillation is about an average temperature of 35 °C, which is significantly lower than the average temperature of 39 °C in Refugio. Temperature variations over an annual span of time are shown in Figure 5-24. The minimum average temperature is approximately -10 °C.
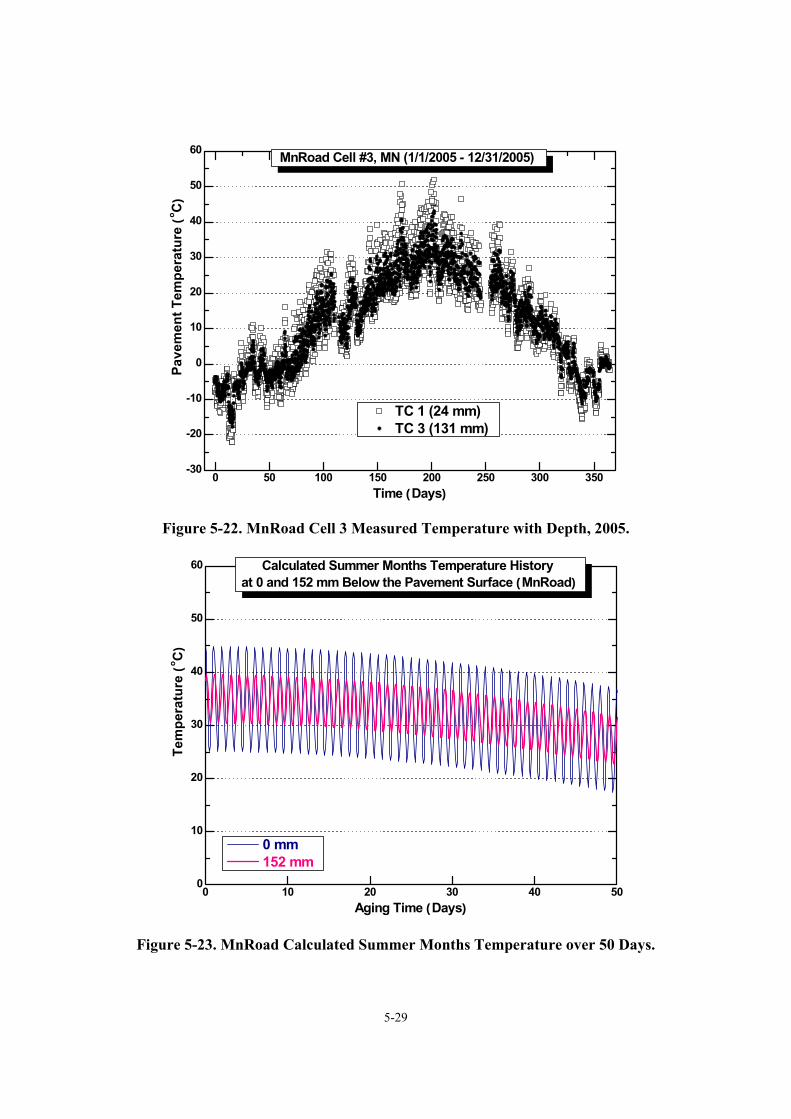
5-29
0 50 100 150 200 250 300 350-30
-20
-10
0
10
20
30
40
50
60
Pave
men
t Tem
pera
ture
(o C
)
Time (Days)
MnRoad Cell #3, MN (1/1/2005 - 12/31/2005)
TC 1 (24 mm)TC 3 (131 mm)
Figure 5-22. MnRoad Cell 3 Measured Temperature with Depth, 2005.
0 10 20 30 40 500
10
20
30
40
50
60 Calculated Summer Months Temperature History at 0 and 152 mm Below the Pavement Surface (MnRoad)
Tem
pera
ture
(o C
)
Aging Time (Days)
0 mm 152 mm
Figure 5-23. MnRoad Calculated Summer Months Temperature over 50 Days.
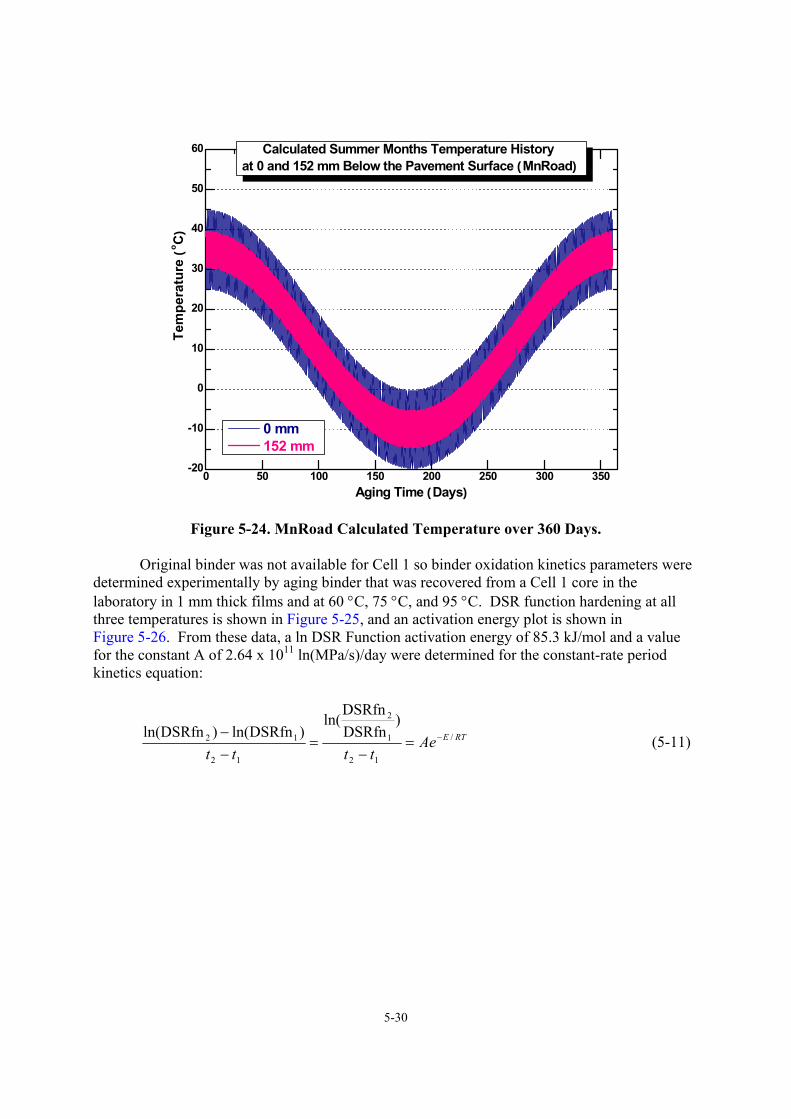
5-30
0 50 100 150 200 250 300 350-20
-10
0
10
20
30
40
50
60
Tem
pera
ture
(o C
)
Aging Time (Days)
Calculated Summer Months Temperature History at 0 and 152 mm Below the Pavement Surface (MnRoad)
0 mm 152 mm
Figure 5-24. MnRoad Calculated Temperature over 360 Days.
Original binder was not available for Cell 1 so binder oxidation kinetics parameters were determined experimentally by aging binder that was recovered from a Cell 1 core in the laboratory in 1 mm thick films and at 60 °C, 75 °C, and 95 °C. DSR function hardening at all three temperatures is shown in Figure 5-25, and an activation energy plot is shown in Figure 5-26. From these data, a ln DSR Function activation energy of 85.3 kJ/mol and a value for the constant A of 2.64 x 10¹¹ ln(MPa/s)/day were determined for the constant-rate period kinetics equation:
RTEAetttt
/
12
1
2
12
12
)DSRfnDSRfn
ln()DSRfnln()DSRfnln( −=
−=
−− (5-11)
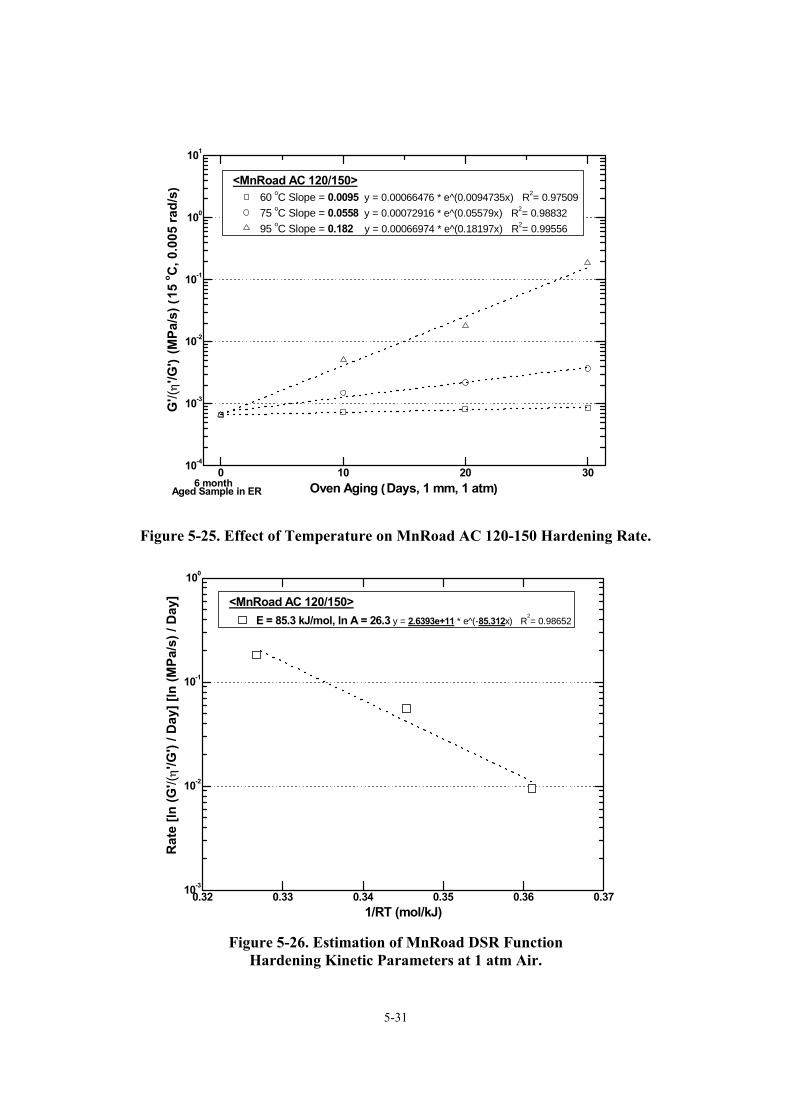
5-31
0 10 20 3010-4
10-3
10-2
10-1
100
101
6 month
Oven Aging (Days, 1 mm, 1 atm)
<MnRoad AC 120/150>60 oC Slope = 0.0095 y = 0.00066476 * e^(0.0094735x) R2= 0.97509 75 oC Slope = 0.0558 y = 0.00072916 * e^(0.05579x) R2= 0.98832 95 oC Slope = 0.182 y = 0.00066974 * e^(0.18197x) R2= 0.99556
G'/(
η'/G
') (M
Pa/s
) (15
o C, 0
.005
rad/
s)
Aged Sample in ER
Figure 5-25. Effect of Temperature on MnRoad AC 120-150 Hardening Rate.
0.32 0.33 0.34 0.35 0.36 0.3710-3
10-2
10-1
100
1/RT (mol/kJ)
<MnRoad AC 120/150>E = 85.3 kJ/mol, ln A = 26.3 y = 2.6393e+11 * e^(-85.312x) R
2= 0.98652
Rat
e [ln
(G'/(
η'/G
') / D
ay] [
ln (M
Pa/s
) / D
ay]
Figure 5-26. Estimation of MnRoad DSR Function
Hardening Kinetic Parameters at 1 atm Air.
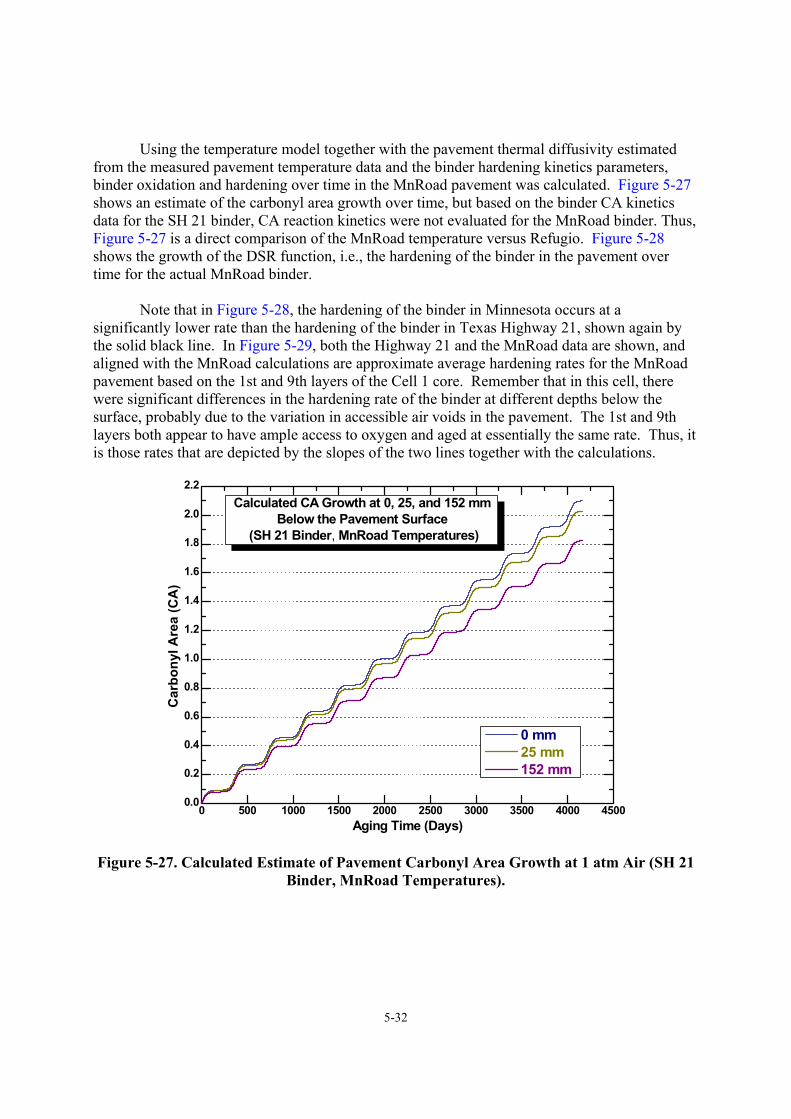
5-32
Using the temperature model together with the pavement thermal diffusivity estimated from the measured pavement temperature data and the binder hardening kinetics parameters, binder oxidation and hardening over time in the MnRoad pavement was calculated. Figure 5-27 shows an estimate of the carbonyl area growth over time, but based on the binder CA kinetics data for the SH 21 binder, CA reaction kinetics were not evaluated for the MnRoad binder. Thus, Figure 5-27 is a direct comparison of the MnRoad temperature versus Refugio. Figure 5-28 shows the growth of the DSR function, i.e., the hardening of the binder in the pavement over time for the actual MnRoad binder. Note that in Figure 5-28, the hardening of the binder in Minnesota occurs at a significantly lower rate than the hardening of the binder in Texas Highway 21, shown again by the solid black line. In Figure 5-29, both the Highway 21 and the MnRoad data are shown, and aligned with the MnRoad calculations are approximate average hardening rates for the MnRoad pavement based on the 1st and 9th layers of the Cell 1 core. Remember that in this cell, there were significant differences in the hardening rate of the binder at different depths below the surface, probably due to the variation in accessible air voids in the pavement. The 1st and 9th layers both appear to have ample access to oxygen and aged at essentially the same rate. Thus, it is those rates that are depicted by the slopes of the two lines together with the calculations.
0 500 1000 1500 2000 2500 3000 3500 4000 45000.0
0.2
0.4
0.6
0.8
1.0
1.2
1.4
1.6
1.8
2.0
2.2
Car
bony
l Are
a (C
A)
0 mm 25 mm 152 mm
Aging Time (Days)
Calculated CA Growth at 0, 25, and 152 mm Below the Pavement Surface
(SH 21 Binder, MnRoad Temperatures)
Figure 5-27. Calculated Estimate of Pavement Carbonyl Area Growth at 1 atm Air (SH 21
Binder, MnRoad Temperatures).
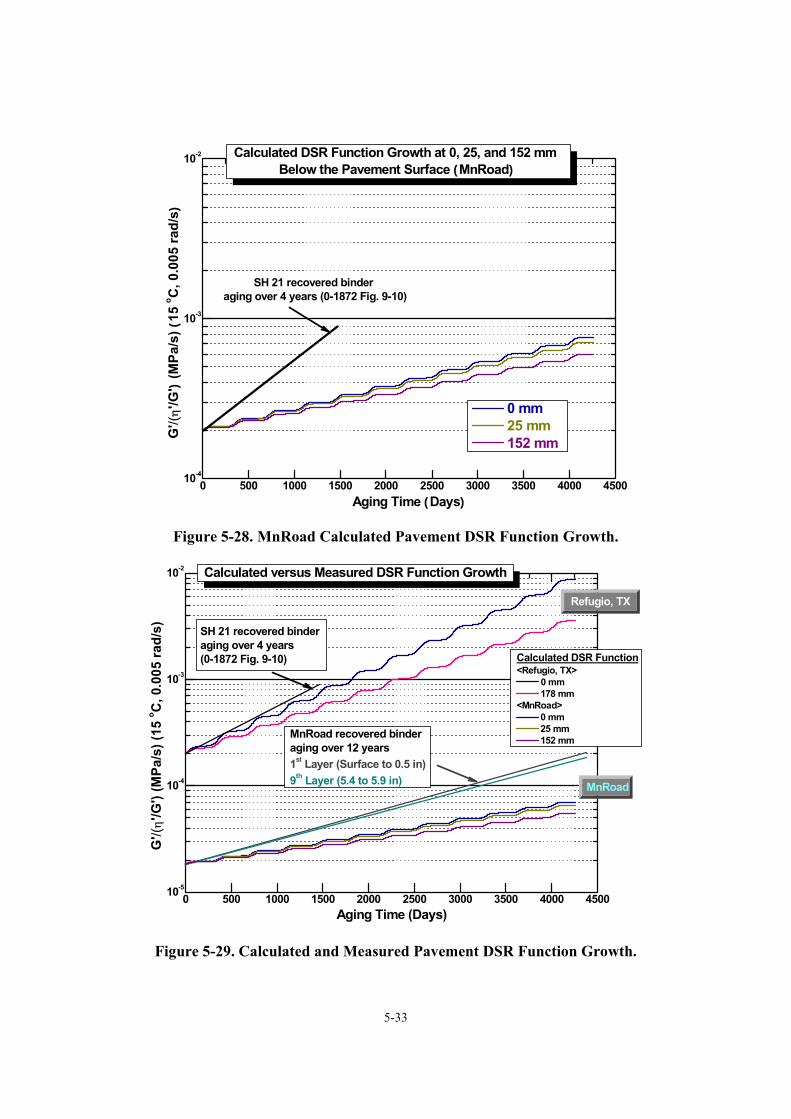
5-33
0 500 1000 1500 2000 2500 3000 3500 4000 450010-4
10-3
10-2
G'/(
η'/G
') (M
Pa/s
) (15
o C, 0
.005
rad/
s)
0 mm 25 mm 152 mm
Aging Time (Days)
Calculated DSR Function Growth at 0, 25, and 152 mm Below the Pavement Surface (MnRoad)
SH 21 recovered binder aging over 4 years (0-1872 Fig. 9-10)
Figure 5-28. MnRoad Calculated Pavement DSR Function Growth.
0 500 1000 1500 2000 2500 3000 3500 4000 450010-5
10-4
10-3
10-2
Calculated DSR Function<Refugio, TX>
0 mm 178 mm
<MnRoad> 0 mm 25 mm 152 mmMnRoad recovered binder
aging over 12 years1st Layer (Surface to 0.5 in)9th Layer (5.4 to 5.9 in) MnRoad
Refugio, TX
G'/(
η'/G
') (M
Pa/s
) (15
o C, 0
.005
rad/
s)
Aging Time (Days)
Calculated versus Measured DSR Function Growth
SH 21 recovered binder aging over 4 years (0-1872 Fig. 9-10)
Figure 5-29. Calculated and Measured Pavement DSR Function Growth.
5-34
Again, it is seen what is actually a good comparison between the actual binder aging rates and the calculated rates based upon measured temperatures in the pavement, measured binder reaction kinetic and hardening parameters, and based upon the semi-infinite slab temperature heat conduction model for temperature in the pavement as a function of time and position. For the MnRoad recovered binder hardening, an initial pavement value was not measured so an estimate had to be made. Furthermore, for the recovered binder, the aging over most of the service life of the pavement, based upon previous work with binder aging and MnRoad data in Figures 2-15 and 2-17, occurred during the initial jump portion of binder aging and therefore at a higher aging rate than would be described by the kinetic parameters, that were for aging after the initial jump period. The data in Figure 2-15, and especially in Figure 2-17 indicate rather clearly that SAFT plus 3 months ER aging leaves this MnRoad binder short of being aged past the initial jump rapid rate region. Thus the SAFT plus 3 months ER DSRfn value of 1.6 x 10⁻⁴ MPa/s (Table 5-A-17) is a value that is not yet out of the initial jump region and we estimate that a value of approximately 2 x 10⁻⁴ MPa/s is at the end of this aging period. Based on this estimate, we conclude that this MnRoad binder at the pavement surface only reached constant-rate period aging after 12 years! Taking these factors into consideration, it is not surprising that a higher aging rate is estimated for the recovered binder than is calculated based upon a temperature model and the binder oxidation and hardening kinetic parameters. The pavement binder is approximately 0.016 [ln (MPa/s)]/mo whereas the calculation at the surface gives a rate of 0.010 [ln (MPa/s)]/mo. For comparison, the data from Highway 21 for the recovered binder is 0.031 [ln (MPa/s)]/mo whereas for the calculation, the result is 0.028 [ln (MPa/s)]/mo at the surface of the pavement. The point is that the Highway 21 pavement aged in Texas occurred at a significantly higher rate than the binder in the pavement in Minnesota and the differences can be largely attributed to the lower temperatures in Minnesota and appear to follow quite well the very simple model of the heating of a semi-infinite slab with a periodic boundary condition. Again, the middle layers of the MnRoad pavement that have significantly lower accessible air voids appear to be notable deviations from the model. Further observations on the pavement hardening rates in both the Texas and Minnesota pavements are appropriate. The results for both pavements are summarized in Table 5-2 where data are shown for the approximate pavement aging rates that were calculated based upon recovered-binder DSR function values, and both the surface aging rate and the hardening rate 7 inches below the surface based upon the temperature model calculations and the pavement binder oxidation and hardening kinetic parameters.
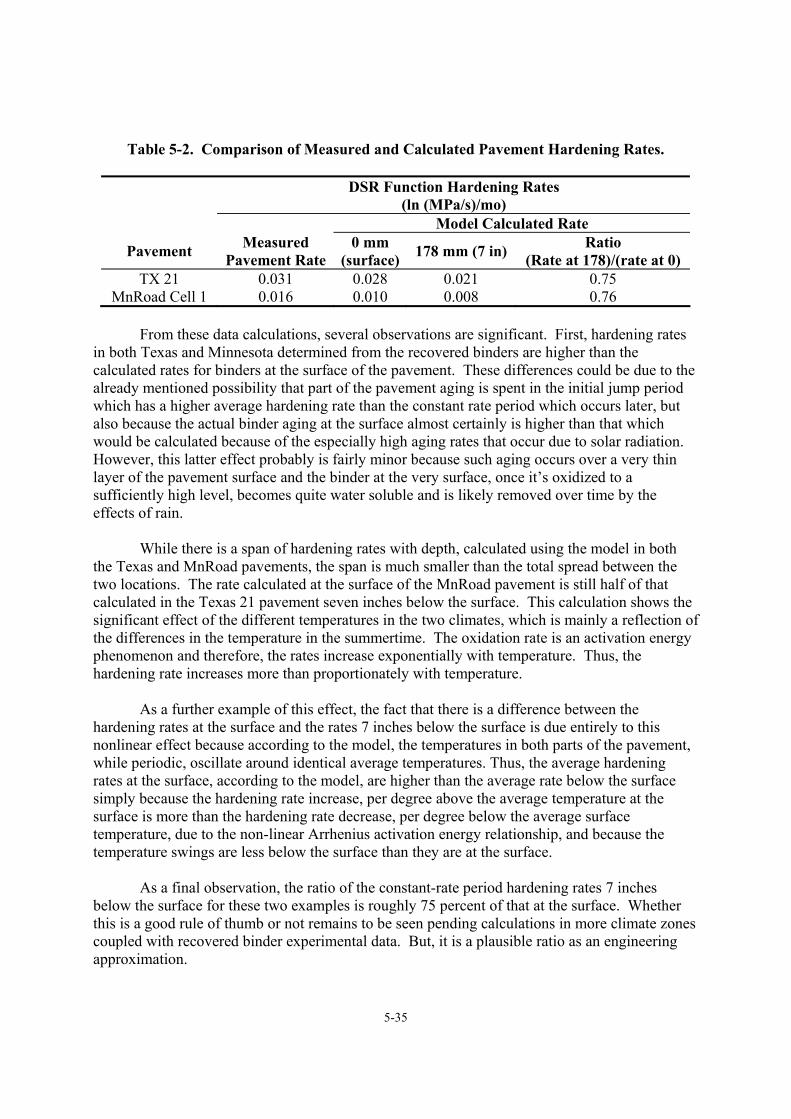
5-35
Table 5-2. Comparison of Measured and Calculated Pavement Hardening Rates.
DSR Function Hardening Rates (ln (MPa/s)/mo)
Model Calculated Rate
Pavement Measured Pavement Rate
0 mm (surface) 178 mm (7 in) Ratio
(Rate at 178)/(rate at 0) TX 21 0.031 0.028 0.021 0.75
MnRoad Cell 1 0.016 0.010 0.008 0.76
From these data calculations, several observations are significant. First, hardening rates in both Texas and Minnesota determined from the recovered binders are higher than the calculated rates for binders at the surface of the pavement. These differences could be due to the already mentioned possibility that part of the pavement aging is spent in the initial jump period which has a higher average hardening rate than the constant rate period which occurs later, but also because the actual binder aging at the surface almost certainly is higher than that which would be calculated because of the especially high aging rates that occur due to solar radiation. However, this latter effect probably is fairly minor because such aging occurs over a very thin layer of the pavement surface and the binder at the very surface, once it’s oxidized to a sufficiently high level, becomes quite water soluble and is likely removed over time by the effects of rain. While there is a span of hardening rates with depth, calculated using the model in both the Texas and MnRoad pavements, the span is much smaller than the total spread between the two locations. The rate calculated at the surface of the MnRoad pavement is still half of that calculated in the Texas 21 pavement seven inches below the surface. This calculation shows the significant effect of the different temperatures in the two climates, which is mainly a reflection of the differences in the temperature in the summertime. The oxidation rate is an activation energy phenomenon and therefore, the rates increase exponentially with temperature. Thus, the hardening rate increases more than proportionately with temperature. As a further example of this effect, the fact that there is a difference between the hardening rates at the surface and the rates 7 inches below the surface is due entirely to this nonlinear effect because according to the model, the temperatures in both parts of the pavement, while periodic, oscillate around identical average temperatures. Thus, the average hardening rates at the surface, according to the model, are higher than the average rate below the surface simply because the hardening rate increase, per degree above the average temperature at the surface is more than the hardening rate decrease, per degree below the average surface temperature, due to the non-linear Arrhenius activation energy relationship, and because the temperature swings are less below the surface than they are at the surface. As a final observation, the ratio of the constant-rate period hardening rates 7 inches below the surface for these two examples is roughly 75 percent of that at the surface. Whether this is a good rule of thumb or not remains to be seen pending calculations in more climate zones coupled with recovered binder experimental data. But, it is a plausible ratio as an engineering approximation.
5-36
Summary of the Pavement Aging Model To summarize the pavement aging model, the following observations are made. First, a model that assumes that oxygen is readily available to the binder in the pavement appears to give reasonable calculations of temperature over time that compare well to measured temperatures in pavements and also, that provide binder hardening rates that compare quite well to measured hardening rates in pavements in Texas and Minnesota. The agreement, of course, is not perfect, but considering that the diffusion of oxygen is ignored, it appears to be surprisingly good. One component of this aging model is that while there is a 25 percent drop in binder hardening rate from the surface to 7 inches below the surface, beyond that there is very little further decline in binder hardening rate at greater depths into the pavement. This conclusion obtained from the model refutes assumptions reported in the literature and embodied in the mechanistic empirical pavement design guide that binders oxidize in the top inch of a pavement, but beyond one inch they do not oxidize at all. The difference between these two conclusions on binder oxidation at depths into the pavement are profound and have significant impact on the considerations of binder performance in pavements and indeed of pavement performance itself in both fatigue and thermal cracking and therefore, on the long-term serviceability of highways. Further specific conclusions of the model and the data upon which it is based are discussed below.
• The temperature in the pavement varies periodically with daily temperature cycles and annually with seasonal temperature cycles.
• These temperature variations decrease in amplitude with increasing depth below the
surface of the pavement; however, the average temperature about which the variations occur is constant with pavement depth, again according to the heat conduction model, and is supported quite well by the data.
• Data obtained from pavements of temperature variations over time and with depth were
used to obtain values for the thermal diffusivity in the pavements in both Texas and Minnesota. These values of thermal diffusivity were quite close to the reported value of .01 cm2/s for geological materials in the earth’s crust. Therefore, if no other data were available, one could probably use a value of 0.01 cm2/s for the thermal diffusivity and obtain reasonable calculations for temperature profiles in pavements.
• To calculate binder hardening rates in pavements, the kinetic oxidation and/or hardening
values for the actual binder in question are required. While these values are tedious to measure, they do vary from material to material in both their initial jump and constant rate period hardening rate parameters and in their oxidation activation energies. These values need to be measured in order to have an accurate calculation of binder hardening rates in pavements.
• For pavements where the original binders are not available, and for which one would like
to calculate the pavement hardening rates over time, it is possible, in principal, to extract and recover the binder, age the binder at different temperatures over a period of months, and measure the hardening rate kinetic data and activation energies that are required.
5-37
These data would provide the constant rate period kinetic data but would not provide the initial jump data.
• The calculations applied to the Texas and MnRoad sites provide significantly different
hardening rates in the two pavements, and these different rates are quite consistent with the measured rates calculated from the recovered binders.
• Interestingly, at both sites, the model that assumes free oxygen access to the binder
performs quite well at reproducing the actual pavement hardening rates. This conclusion appears to be valid at least as long as the accessible air voids in the pavement local to the binder are of the order of several percent. When these air voids are below 2 percent, the hardening rates are significantly reduced.
• Based on these data, it is recommended that a complete revision of the binder oxidation
and hardening model in the mechanistic empirical pavement design guide (MEPDG) and elsewhere in design calculations be implemented.
Oxidative Aging in Texas Pavements
During the course of this project, 16 pavements in 11 TxDOT districts were evaluated. Most of these pavements used different binders that were both modified and unmodified. Furthermore for almost all of the pavements, cores were obtained twice during the project with 12-18 months between the two cores. For each pavement, the binders were extracted and recovered and measurements made on the recovered binders. These data included DSR rheological parameters, size-exclusion chromatograms, and infrared measurements of carbonyl area. In many cases, samples of the recovered binders were aged in a 60 °C environmental room to obtain DSR function hardening susceptibility characteristics of the binders and to obtain 60 °C hardening rate information at one atmosphere of air pressure. The detailed results are reported in the various appendices of this chapter with the DSR function values of the recovered binders and subsequently aged recovered binders reported in Appendix 5-A. The data are extensive and represent a tremendous amount of work, almost certainly the most work reported in a single document on binders recovered from aged pavements. These data, together with comparable data for the MnRoad pavements, provide a database of very interesting results. The age of the pavement cores ranges from two to over 20 years. Hardening of the various binders in the pavements in the form of the DSR function is summarized in Figure 5-30. This figure shows the DSR function values for the recovered binders for all of the cores that were studied in this project versus the corresponding service age for the cores. Both Texas pavements and the MnRoad pavements are summarized, and the Texas Highway 21 pavement between Bryan and Caldwell (studied and reported in TxDOT Report 0-1872-2) are included for reference. Both unmodified and modified binders appear in the data set and in the figure. The bulk of the binders reported are modified.
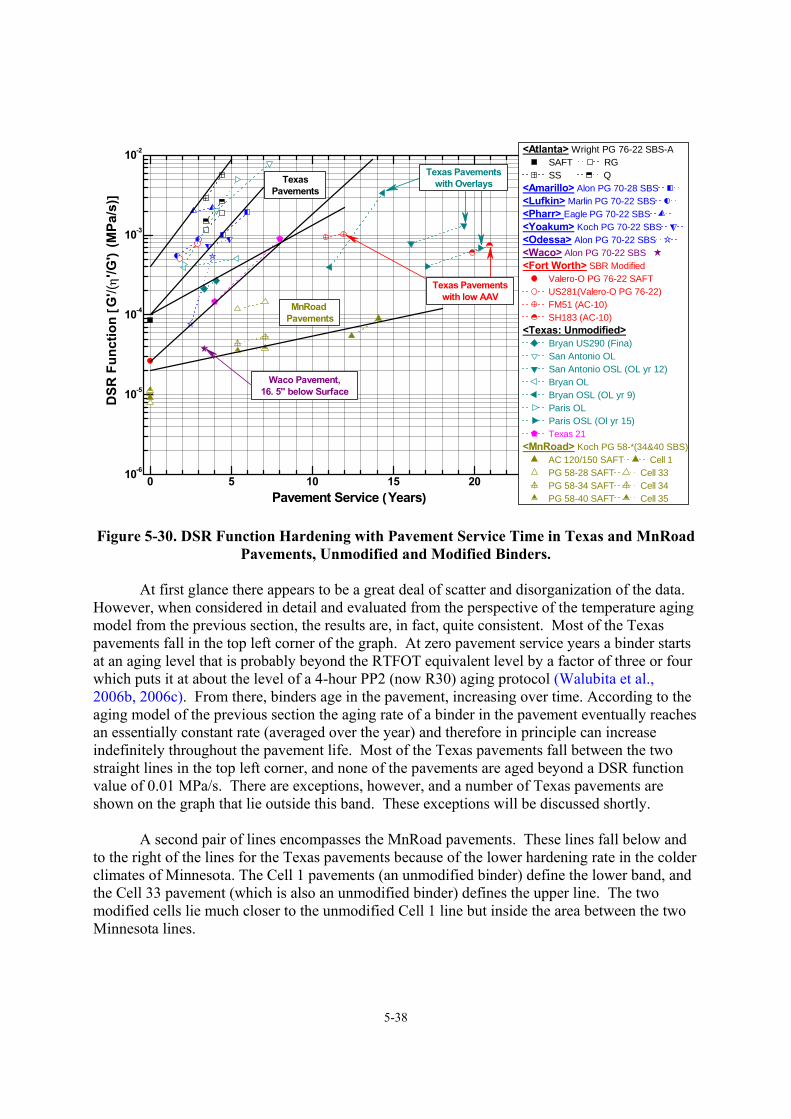
5-38
0 5 10 15 20 2510-6
10-5
10-4
10-3
10-2
DSR
Fun
ctio
n [G
'/(η
'/G')
(MPa
/s)]
Texas Pavementswith low AAV
Texas Pavementswith OverlaysTexas
Pavements
MnRoad Pavements
Pavement Service (Years)
<Atlanta> Wright PG 76-22 SBS-A SAFT RG SS Q
<Amarillo> Alon PG 70-28 SBS<Lufkin> Marlin PG 70-22 SBS <Pharr> Eagle PG 70-22 SBS<Yoakum> Koch PG 70-22 SBS <Odessa> Alon PG 70-22 SBS <Waco> Alon PG 70-22 SBS<Fort Worth> SBR Modified
Valero-O PG 76-22 SAFT US281(Valero-O PG 76-22) FM51 (AC-10) SH183 (AC-10)
<Texas: Unmodified> Bryan US290 (Fina) San Antonio OL San Antonio OSL (OL yr 12) Bryan OL Bryan OSL (OL yr 9) Paris OL Paris OSL (Ol yr 15) Texas 21
<MnRoad> Koch PG 58-*(34&40 SBS) AC 120/150 SAFT Cell 1 PG 58-28 SAFT Cell 33 PG 58-34 SAFT Cell 34 PG 58-40 SAFT Cell 35
Waco Pavement,16. 5'' below Surface
Figure 5-30. DSR Function Hardening with Pavement Service Time in Texas and MnRoad Pavements, Unmodified and Modified Binders.
At first glance there appears to be a great deal of scatter and disorganization of the data.
However, when considered in detail and evaluated from the perspective of the temperature aging model from the previous section, the results are, in fact, quite consistent. Most of the Texas pavements fall in the top left corner of the graph. At zero pavement service years a binder starts at an aging level that is probably beyond the RTFOT equivalent level by a factor of three or four which puts it at about the level of a 4-hour PP2 (now R30) aging protocol (Walubita et al., 2006b, 2006c). From there, binders age in the pavement, increasing over time. According to the aging model of the previous section the aging rate of a binder in the pavement eventually reaches an essentially constant rate (averaged over the year) and therefore in principle can increase indefinitely throughout the pavement life. Most of the Texas pavements fall between the two straight lines in the top left corner, and none of the pavements are aged beyond a DSR function value of 0.01 MPa/s. There are exceptions, however, and a number of Texas pavements are shown on the graph that lie outside this band. These exceptions will be discussed shortly. A second pair of lines encompasses the MnRoad pavements. These lines fall below and to the right of the lines for the Texas pavements because of the lower hardening rate in the colder climates of Minnesota. The Cell 1 pavements (an unmodified binder) define the lower band, and the Cell 33 pavement (which is also an unmodified binder) defines the upper line. The two modified cells lie much closer to the unmodified Cell 1 line but inside the area between the two Minnesota lines.
5-39
There are six Texas pavements that fall outside the boundary lines for the other Texas pavements. One of these outliers is the Waco pavement that falls inside the MnRoad pavement lines at about three years. This binder appears to fall outside the Texas band for two reasons. First; it is a modified binder that appears to have an exceptionally good interaction between the polymer and base asphalt, thereby producing a very low initial DSR function, for this binder at the beginning of the pavement service life. Secondly, this binder is in a 3 inch layer of an interstate highway that after placement was immediately covered by about 18 inches of additional pavement. Therefore, its aging rate, according to the temperature aging model of the previous section, is about 60-70 percent less than a comparable binder would be near the pavement surface. Keep in mind that the binder still ages at this depth (according to the model) but the rate is reduced below that of the surface. This reduced rate by itself is probably not enough to put the binder outside of the Texas boundaries. However, that reduced rate, coupled with the very low initial DSR function for this binder, probably is enough to move it to an outlier position. Of the other five Texas pavements with binders that are outliers, three of them had recent overlays from one to three years prior to the first coring. It may well be that this overlay, together with the seal coat that is typically placed between layers at the time of placement of an overlay, could have penetrated into the original layer thereby softening the binder (either in situ or at least once it is recovered and blended with the original binder). While definitive data have not yet been obtained to verify this hypothesis, it is true that the number of observations of pavements that appear to have been softened due to an overlay or a seal coat is great enough and the effect is consistent enough that the conclusion seems more and more likely to be correct. This phenomenon was reported first by Glover et al. (2005). The other two outlier binders, however, have no overlay or seal coat and yet have aged at significantly lower rates than the other Texas pavements. In these two pavements we believe that the lower average hardening rate is reduced by factors that are not observed in the other pavements. Both of these two pavements are AC10 binders modified with an SBR polymer and were placed in the Fort Worth district. Both pavements also have an exceptionally low accessible air voids in the range of 1 to 2 percent. Furthermore the pavement on SH 183 has been in service for 10 years and has a binder with an exceptionally low 60 °C hardening rate. Thus we believe that that binder is aging at an exceptionally low rate because of the combined effect of a low hardening rate binder coupled with a very low accessible air voids that hinders oxygen transport to the binder. Based on these data we anticipate that these pavement service lives will be much longer than the other pavements. And in fact the SH 183 service life at 20 years already significantly exceeds normal performance. One other observation is in order for all of these pavements. Except for the Waco Interstate 35 pavement, cores were obtained twice during the project period. In each case it was observed that the second coring of the pavement provides a binder that is noticeably more aged than does the first coring, even though the time between corings was relatively short from the perspective of binder hardening rates in pavements. Nevertheless in each case it was observed that the binder is continuing to harden in the pavement and at rates that are comparable to the rates that would be indicated by their position in the graph given that all of the binders start in the pavements somewhere between 2x10⁻⁵ and 2x10⁻⁴ MPa/s for the DSR function. This result
5-40
appears to confirm the aging model, which says that binders continue to oxidize virtually indefinitely, as far as the pavement lifetime is concerned. Stated differently these results appear to refute the assumptions of Coons and Wright (1968) and the assumptions of the MEPDG which are that after about 10 years of service, binder oxidation ceases. These data contradict that conclusion even for service lives between 15 and 20 years. Granted this is a fairly qualitative way of assessing these data, but given the errors that are inherent in measuring pavement properties and also the variabilities of climate and binder properties, the fact that these kinds of consistencies exist within both the Texas and MnRoad pavements and that the outliers can be explained rationally with the data is rather remarkable. Again the full details and numbers are reported in the appendix. For most of these Texas pavements the original binders were not available, and therefore it is really not known where these binders began at zero years of service. On the other hand, it is known from the data that the unmodified binders, as well as most of the modified binders, are in the neighborhood of 10-4 MPa/s for the DSR function and whether it is 2x10⁻⁴ or 3x10⁻⁴ or even something less such as 5x10⁻⁵ MPa/s, the exact value does not impact the above conclusions in a very significant way. Figures 5-31 and 5-32 show the layer-by-layer accessible air voids of the 16 Texas pavements sites that were studied. Figure 5-31 shows the accessible air voids for all the polymer modified asphalt sites, and Figure 5-32 shows the accessible air voids for the unmodified asphalt sites and for both cores that were obtained during the study. The latter figure thus also shows the reproducibility that it was seen from one year to the next with respect to accessible air voids measurements. In Figure 5-31, it is noted that the Amarillo, Atlanta, Fort Worth, US-281, Lufkin, Pharr, and Yoakum sites all had accessible air voids that were fairly high, that is 4 percent or greater, and actually the Waco site had accessible air voids nearly that high, between 3 and 4 percent. However, the Fort Worth FM 51 and SH 183 sites, plus the Odessa site, all had accessible air voids below the first layer of the pavement that were 2 percent or less. These were exceptionally low air voids. And the Odessa even showed less than 1 percent. Air voids this low are believed sufficient to significantly retard the oxidation rate of the binder. Figure 5-32 shows the accessible air voids for the unmodified sites, and in most cases they are 4 percent or greater, although at the Bryan LTPP site the original surface layer had the top surfaces quite low in air voids, 1 to 2 percent. Also the San Antonio original surface layer (OSL) that was cored in 2002 had one of the layers between 1 and 2 percent. So while most of these sites appear to have sufficient accessible air voids to allow unhindered oxidation of the binder, a couple of them may have somewhat retarded aging rates in some of the layers.
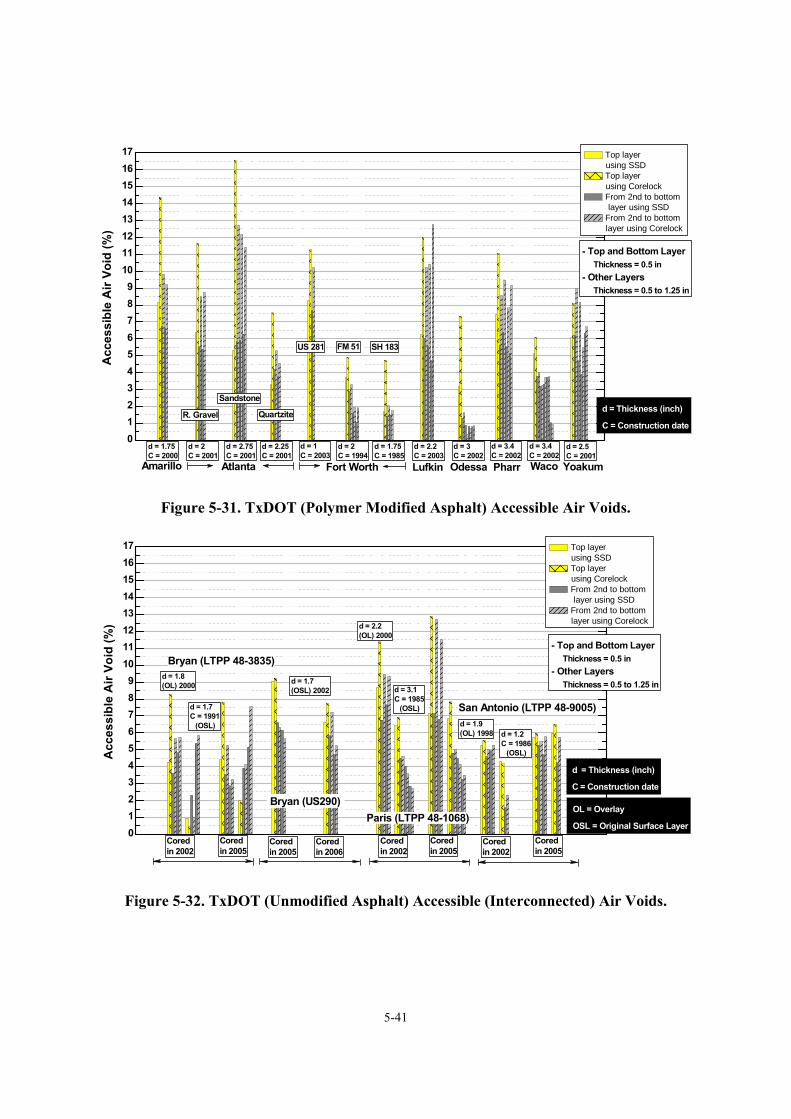
5-41
0123456789
1011121314151617
Waco
d = 3.4 C = 2002
Acc
essi
ble
Air
Void
(%)
Top layer using SSD
Top layer using Corelock
From 2nd to bottom layer using SSD
From 2nd to bottom layer using Corelock
- Top and Bottom Layer Thickness = 0.5 in- Other Layers Thickness = 0.5 to 1.25 in
FM 51
d = 1.75 C = 1985
d = 2 C = 1994
SH 183US 281
Atlanta
d = 1.75 C = 2000
d = 2.25 C = 2001
Quartzite
Sandstone
R. Gravel
d = 2.75C = 2001
d = Thickness (inch)
C = Construction date
d = 2 C = 2001
Amarillo
d = 3 C = 2002
d = 2.5 C = 2001
Odessa Yoakum
d = 2.2 C = 2003Lufkin
d = 3.4 C = 2002Pharr
d = 1C = 2003
Fort Worth
Figure 5-31. TxDOT (Polymer Modified Asphalt) Accessible Air Voids.
0123456789
1011121314151617
Bryan (US290)
d = 1.7 (OSL) 2002
San Antonio (LTPP 48-9005)
Paris (LTPP 48-1068)
d = 3.1C = 1985 (OSL)
d = 2.2 (OL) 2000
Acc
essi
ble
Air
Void
(%)
d = 1.2 C = 1986 (OSL)
d = 1.9 (OL) 1998
d = 1.7 C = 1991 (OSL)
d = 1.8 (OL) 2000
Bryan (LTPP 48-3835)
OL = Overlay
OSL = Original Surface Layer
d = Thickness (inch)
C = Construction date
Top layer using SSD
Top layer using Corelock
From 2nd to bottom layer using SSD
From 2nd to bottom layer using Corelock
- Top and Bottom Layer Thickness = 0.5 in- Other Layers Thickness = 0.5 to 1.25 in
Cored in 2005
Cored in 2002
Cored in 2005
Cored in 2002
Cored in 2005
Cored in 2002
Cored in 2006
Cored in 2005
Figure 5-32. TxDOT (Unmodified Asphalt) Accessible (Interconnected) Air Voids.
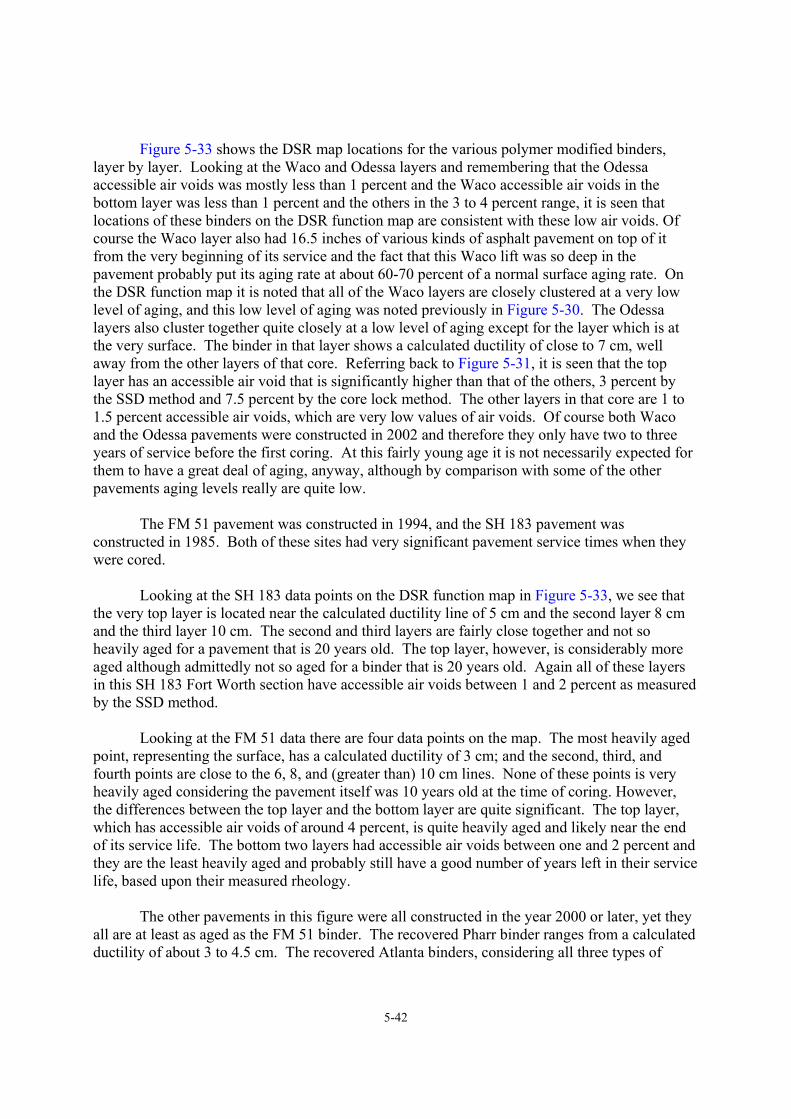
5-42
Figure 5-33 shows the DSR map locations for the various polymer modified binders, layer by layer. Looking at the Waco and Odessa layers and remembering that the Odessa accessible air voids was mostly less than 1 percent and the Waco accessible air voids in the bottom layer was less than 1 percent and the others in the 3 to 4 percent range, it is seen that locations of these binders on the DSR function map are consistent with these low air voids. Of course the Waco layer also had 16.5 inches of various kinds of asphalt pavement on top of it from the very beginning of its service and the fact that this Waco lift was so deep in the pavement probably put its aging rate at about 60-70 percent of a normal surface aging rate. On the DSR function map it is noted that all of the Waco layers are closely clustered at a very low level of aging, and this low level of aging was noted previously in Figure 5-30. The Odessa layers also cluster together quite closely at a low level of aging except for the layer which is at the very surface. The binder in that layer shows a calculated ductility of close to 7 cm, well away from the other layers of that core. Referring back to Figure 5-31, it is seen that the top layer has an accessible air void that is significantly higher than that of the others, 3 percent by the SSD method and 7.5 percent by the core lock method. The other layers in that core are 1 to 1.5 percent accessible air voids, which are very low values of air voids. Of course both Waco and the Odessa pavements were constructed in 2002 and therefore they only have two to three years of service before the first coring. At this fairly young age it is not necessarily expected for them to have a great deal of aging, anyway, although by comparison with some of the other pavements aging levels really are quite low.
The FM 51 pavement was constructed in 1994, and the SH 183 pavement was
constructed in 1985. Both of these sites had very significant pavement service times when they were cored. Looking at the SH 183 data points on the DSR function map in Figure 5-33, we see that the very top layer is located near the calculated ductility line of 5 cm and the second layer 8 cm and the third layer 10 cm. The second and third layers are fairly close together and not so heavily aged for a pavement that is 20 years old. The top layer, however, is considerably more aged although admittedly not so aged for a binder that is 20 years old. Again all of these layers in this SH 183 Fort Worth section have accessible air voids between 1 and 2 percent as measured by the SSD method. Looking at the FM 51 data there are four data points on the map. The most heavily aged point, representing the surface, has a calculated ductility of 3 cm; and the second, third, and fourth points are close to the 6, 8, and (greater than) 10 cm lines. None of these points is very heavily aged considering the pavement itself was 10 years old at the time of coring. However, the differences between the top layer and the bottom layer are quite significant. The top layer, which has accessible air voids of around 4 percent, is quite heavily aged and likely near the end of its service life. The bottom two layers had accessible air voids between one and 2 percent and they are the least heavily aged and probably still have a good number of years left in their service life, based upon their measured rheology. The other pavements in this figure were all constructed in the year 2000 or later, yet they all are at least as aged as the FM 51 binder. The recovered Pharr binder ranges from a calculated ductility of about 3 to 4.5 cm. The recovered Atlanta binders, considering all three types of
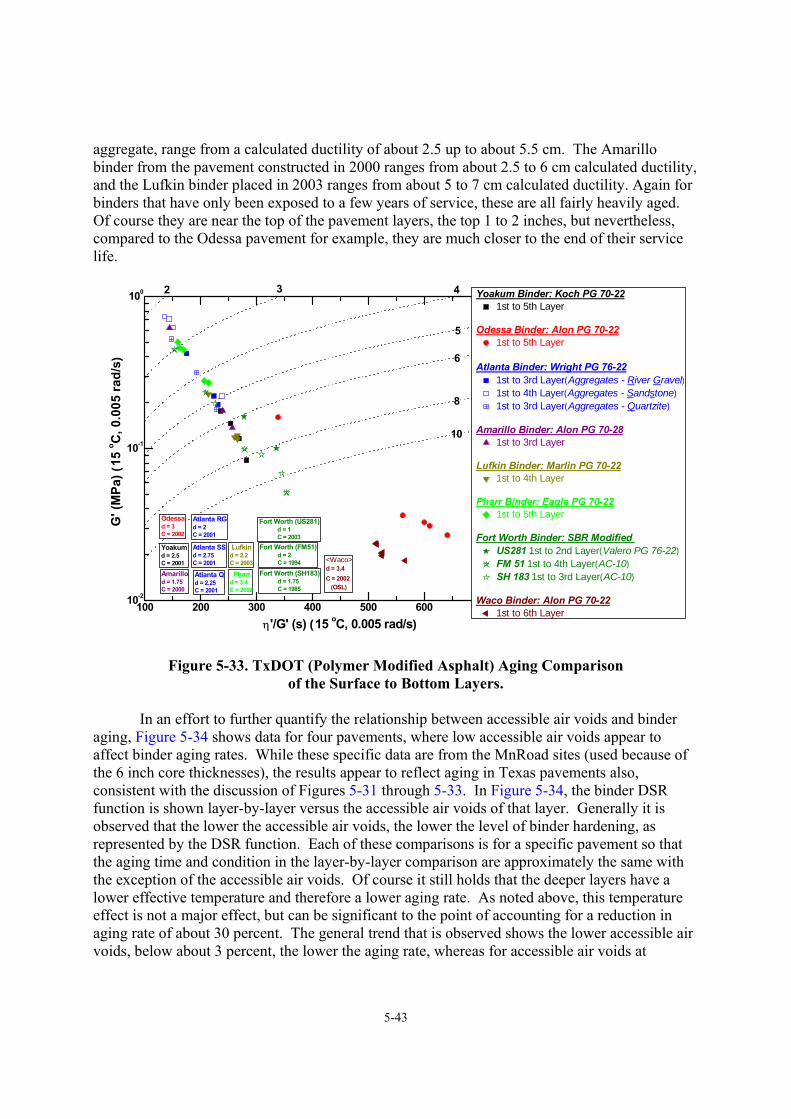
5-43
aggregate, range from a calculated ductility of about 2.5 up to about 5.5 cm. The Amarillo binder from the pavement constructed in 2000 ranges from about 2.5 to 6 cm calculated ductility, and the Lufkin binder placed in 2003 ranges from about 5 to 7 cm calculated ductility. Again for binders that have only been exposed to a few years of service, these are all fairly heavily aged. Of course they are near the top of the pavement layers, the top 1 to 2 inches, but nevertheless, compared to the Odessa pavement for example, they are much closer to the end of their service life.
100 200 300 400 500 600 700 80010-2
10-1
100
Fort Worth (SH183) d = 1.75 C = 1985
Fort Worth (FM51) d = 2 C = 1994
Fort Worth (US281) d = 1 C = 2003
Pharrd = 3.4 C = 2002
Lufkind = 2.2 C = 2003
Amarillod = 1.75 C = 2000
Atlanta Qd = 2.25 C = 2001
Atlanta SSd = 2.75 C = 2001
Yoakum Binder: Koch PG 70-221st to 5th Layer
Odessa Binder: Alon PG 70-221st to 5th Layer
Atlanta Binder: Wright PG 76-22
1st to 3rd Layer(Aggregates - River Gravel)1st to 4th Layer(Aggregates - Sandstone) 1st to 3rd Layer(Aggregates - Quartzite)
Amarillo Binder: Alon PG 70-281st to 3rd Layer
Lufkin Binder: Marlin PG 70-221st to 4th Layer
Pharr Binder: Eagle PG 70-221st to 5th Layer
Fort Worth Binder: SBR Modified US281 1st to 2nd Layer(Valero PG 76-22)FM 51 1st to 4th Layer(AC-10) SH 183 1st to 3rd Layer(AC-10)
Waco Binder: Alon PG 70-221st to 6th Layer
G' (
MPa
) (15
o C, 0
.005
rad/
s)
η'/G' (s) (15 oC, 0.005 rad/s)
8
10
5
6
3 42
Atlanta RGd = 2C = 2001
Odessad = 3 C = 2002
Yoakumd = 2.5 C = 2001 <Waco>
d = 3.4 C = 2002 (OSL)
Figure 5-33. TxDOT (Polymer Modified Asphalt) Aging Comparison of the Surface to Bottom Layers.
In an effort to further quantify the relationship between accessible air voids and binder
aging, Figure 5-34 shows data for four pavements, where low accessible air voids appear to affect binder aging rates. While these specific data are from the MnRoad sites (used because of the 6 inch core thicknesses), the results appear to reflect aging in Texas pavements also, consistent with the discussion of Figures 5-31 through 5-33. In Figure 5-34, the binder DSR function is shown layer-by-layer versus the accessible air voids of that layer. Generally it is observed that the lower the accessible air voids, the lower the level of binder hardening, as represented by the DSR function. Each of these comparisons is for a specific pavement so that the aging time and condition in the layer-by-layer comparison are approximately the same with the exception of the accessible air voids. Of course it still holds that the deeper layers have a lower effective temperature and therefore a lower aging rate. As noted above, this temperature effect is not a major effect, but can be significant to the point of accounting for a reduction in aging rate of about 30 percent. The general trend that is observed shows the lower accessible air voids, below about 3 percent, the lower the aging rate, whereas for accessible air voids at
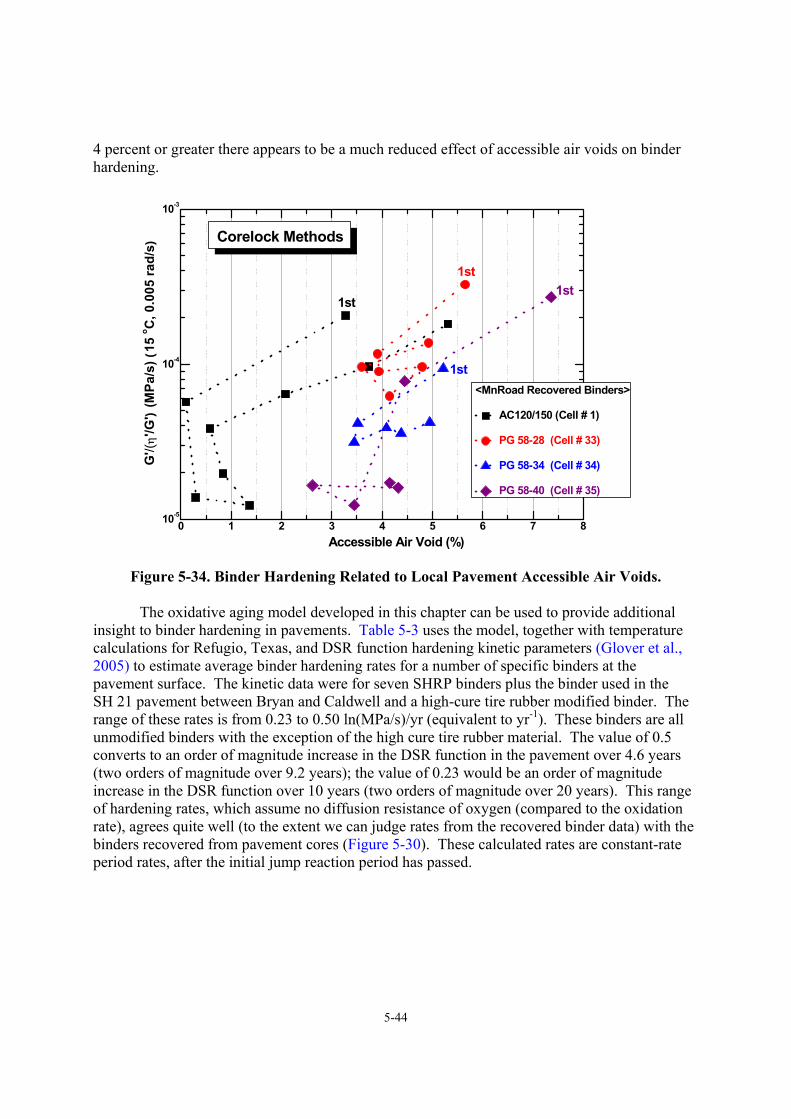
5-44
4 percent or greater there appears to be a much reduced effect of accessible air voids on binder hardening.
0 1 2 3 4 5 6 7 810-5
10-4
10-3
1st
1st
1st
Corelock Methods
<MnRoad Recovered Binders>
AC120/150 (Cell # 1)
PG 58-28 (Cell # 33)
PG 58-34 (Cell # 34)
PG 58-40 (Cell # 35)
G'/(
η'/G
') (M
Pa/s
) (15
o C, 0
.005
rad/
s)
Accessible Air Void (%)
1st
Figure 5-34. Binder Hardening Related to Local Pavement Accessible Air Voids. The oxidative aging model developed in this chapter can be used to provide additional insight to binder hardening in pavements. Table 5-3 uses the model, together with temperature calculations for Refugio, Texas, and DSR function hardening kinetic parameters (Glover et al., 2005) to estimate average binder hardening rates for a number of specific binders at the pavement surface. The kinetic data were for seven SHRP binders plus the binder used in the SH 21 pavement between Bryan and Caldwell and a high-cure tire rubber modified binder. The range of these rates is from 0.23 to 0.50 ln(MPa/s)/yr (equivalent to yr-1). These binders are all unmodified binders with the exception of the high cure tire rubber material. The value of 0.5 converts to an order of magnitude increase in the DSR function in the pavement over 4.6 years (two orders of magnitude over 9.2 years); the value of 0.23 would be an order of magnitude increase in the DSR function over 10 years (two orders of magnitude over 20 years). This range of hardening rates, which assume no diffusion resistance of oxygen (compared to the oxidation rate), agrees quite well (to the extent we can judge rates from the recovered binder data) with the binders recovered from pavement cores (Figure 5-30). These calculated rates are constant-rate period rates, after the initial jump reaction period has passed.
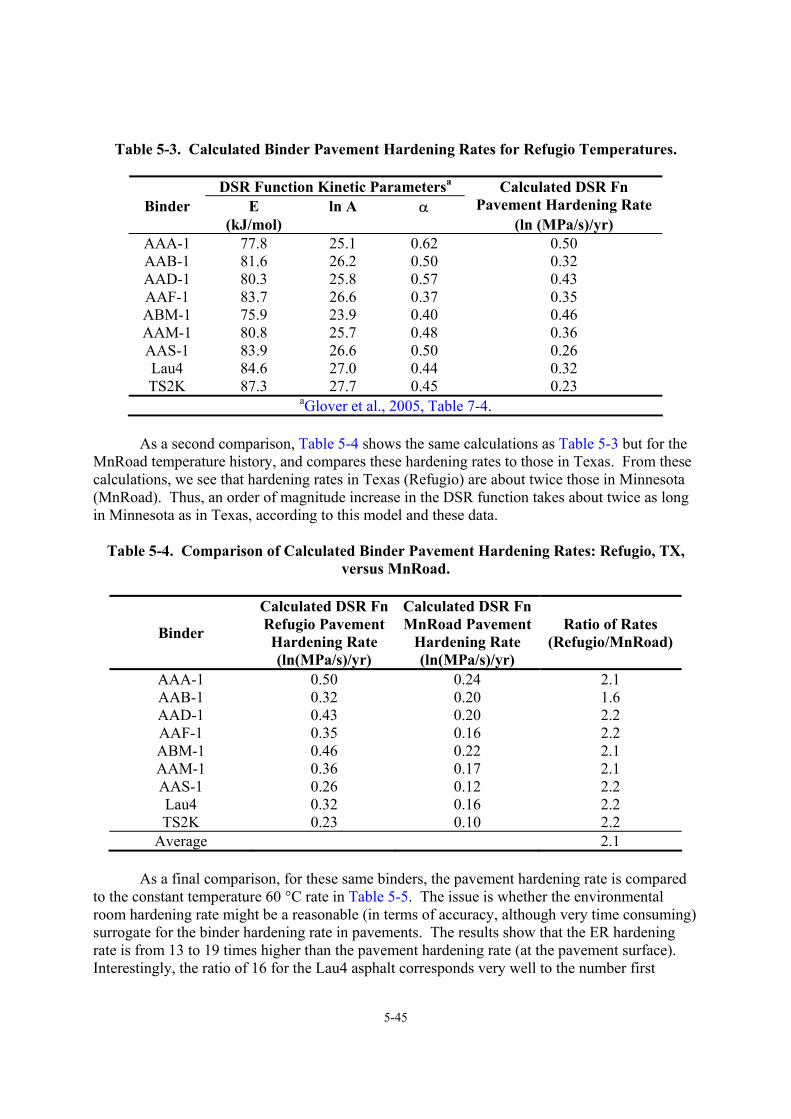
5-45
Table 5-3. Calculated Binder Pavement Hardening Rates for Refugio Temperatures.
DSR Function Kinetic Parametersa Binder E ln A α
Calculated DSR Fn Pavement Hardening Rate
(kJ/mol) (ln (MPa/s)/yr) AAA-1 77.8 25.1 0.62 0.50 AAB-1 81.6 26.2 0.50 0.32 AAD-1 80.3 25.8 0.57 0.43 AAF-1 83.7 26.6 0.37 0.35 ABM-1 75.9 23.9 0.40 0.46 AAM-1 80.8 25.7 0.48 0.36 AAS-1 83.9 26.6 0.50 0.26 Lau4 84.6 27.0 0.44 0.32 TS2K 87.3 27.7 0.45 0.23
aGlover et al., 2005, Table 7-4.
As a second comparison, Table 5-4 shows the same calculations as Table 5-3 but for the MnRoad temperature history, and compares these hardening rates to those in Texas. From these calculations, we see that hardening rates in Texas (Refugio) are about twice those in Minnesota (MnRoad). Thus, an order of magnitude increase in the DSR function takes about twice as long in Minnesota as in Texas, according to this model and these data.
Table 5-4. Comparison of Calculated Binder Pavement Hardening Rates: Refugio, TX, versus MnRoad.
Binder
Calculated DSR FnRefugio Pavement Hardening Rate (ln(MPa/s)/yr)
Calculated DSR FnMnRoad Pavement
Hardening Rate (ln(MPa/s)/yr)
Ratio of Rates (Refugio/MnRoad)
AAA-1 0.50 0.24 2.1 AAB-1 0.32 0.20 1.6 AAD-1 0.43 0.20 2.2 AAF-1 0.35 0.16 2.2 ABM-1 0.46 0.22 2.1 AAM-1 0.36 0.17 2.1 AAS-1 0.26 0.12 2.2 Lau4 0.32 0.16 2.2 TS2K 0.23 0.10 2.2
Average 2.1
As a final comparison, for these same binders, the pavement hardening rate is compared to the constant temperature 60 °C rate in Table 5-5. The issue is whether the environmental room hardening rate might be a reasonable (in terms of accuracy, although very time consuming) surrogate for the binder hardening rate in pavements. The results show that the ER hardening rate is from 13 to 19 times higher than the pavement hardening rate (at the pavement surface). Interestingly, the ratio of 16 for the Lau4 asphalt corresponds very well to the number first
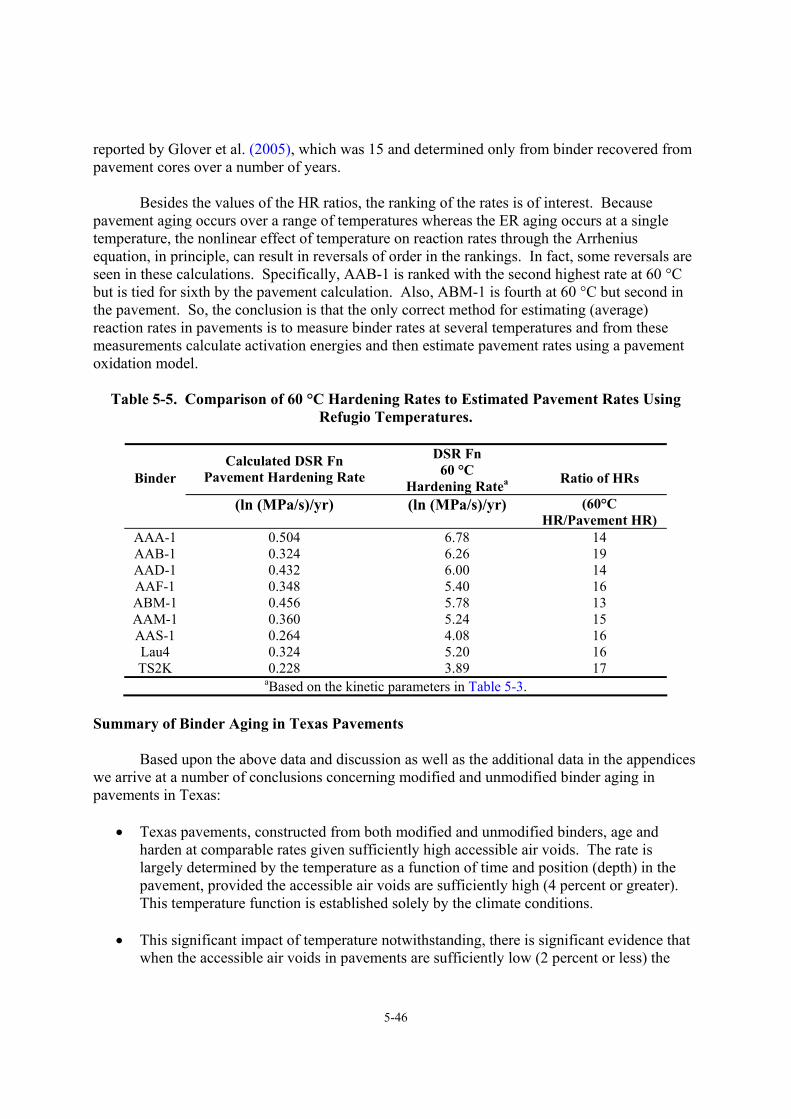
5-46
reported by Glover et al. (2005), which was 15 and determined only from binder recovered from pavement cores over a number of years. Besides the values of the HR ratios, the ranking of the rates is of interest. Because pavement aging occurs over a range of temperatures whereas the ER aging occurs at a single temperature, the nonlinear effect of temperature on reaction rates through the Arrhenius equation, in principle, can result in reversals of order in the rankings. In fact, some reversals are seen in these calculations. Specifically, AAB-1 is ranked with the second highest rate at 60 °C but is tied for sixth by the pavement calculation. Also, ABM-1 is fourth at 60 °C but second in the pavement. So, the conclusion is that the only correct method for estimating (average) reaction rates in pavements is to measure binder rates at several temperatures and from these measurements calculate activation energies and then estimate pavement rates using a pavement oxidation model.
Table 5-5. Comparison of 60 °C Hardening Rates to Estimated Pavement Rates Using Refugio Temperatures.
DSR Fn
Binder Calculated DSR Fn
Pavement Hardening Rate 60 °C Hardening Ratea Ratio of HRs
(ln (MPa/s)/yr) (ln (MPa/s)/yr) (60°C HR/Pavement HR)
AAA-1 0.504 6.78 14 AAB-1 0.324 6.26 19 AAD-1 0.432 6.00 14 AAF-1 0.348 5.40 16 ABM-1 0.456 5.78 13 AAM-1 0.360 5.24 15 AAS-1 0.264 4.08 16 Lau4 0.324 5.20 16 TS2K 0.228 3.89 17
aBased on the kinetic parameters in Table 5-3. Summary of Binder Aging in Texas Pavements Based upon the above data and discussion as well as the additional data in the appendices we arrive at a number of conclusions concerning modified and unmodified binder aging in pavements in Texas:
• Texas pavements, constructed from both modified and unmodified binders, age and harden at comparable rates given sufficiently high accessible air voids. The rate is largely determined by the temperature as a function of time and position (depth) in the pavement, provided the accessible air voids are sufficiently high (4 percent or greater). This temperature function is established solely by the climate conditions.
• This significant impact of temperature notwithstanding, there is significant evidence that
when the accessible air voids in pavements are sufficiently low (2 percent or less) the
5-47
hardening rate of binders in Texas pavements can be significantly reduced, thereby prolonging the service life of the pavements to 15 or 20 years or more.
• Some of the Texas pavements appear to be under aged relative to the other binders,
perhaps due to the application of a chip seal and/or overlay one to three years before coring the pavement. This phenomenon has been observed before, and these data may be an indication again that the right kind of treatment during a pavement’s service might well serve to soften the binder and rehabilitate it, thus providing an extended pavement life.
• The Texas pavements that were constructed from modified binders, for the most part
(with the exception of the SBR modifier) appear to begin their service as stiffer binders than their corresponding unmodified binder. This observation is almost certainly the result of a desire to provide, through polymer modification, binders that have a greater resistance to rutting at higher pavement temperatures. But a side effect seems to be that by starting as stiffer binders (i.e., at a higher level of the DSR function) the binders may be hardening sooner to a level that renders them unserviceable. Perhaps the objective with a polymer-modified binder is to achieve a binder that is softer initially (or at least as soft as the unmodified binders) in the context of the DSR function and still provides the desired rut resistance. If a binder can begin service at a lower stiffness, then it may reach failure later. An example of a modified binder that began service at a low stiffness level is the Alon PG 70-22 SBS modified binder that was used in the Waco pavement and also the Odessa pavement. Note that the Amarillo PG 70-28 appears to not have such an advantage.
• If a binder with an inherently low hardening rate (slow oxidation kinetics and minimal
physical response to the oxidation) is used in a pavement, and perhaps more practically, if a low enough level of accessible air voids can be achieved (in the range of two percent or less), then the pavement has a real chance of providing service over a very extended period of time.
• Binder DSR function hardening rates in Texas are about twice the rate for the
corresponding binder in Minnesota, and at comparable air void conditions.
• In order to estimate pavement binder hardening rates, values of the binder reaction kinetics parameters are required. Approximating the rate with measurements at 60 °C may give a rate from which a rough estimate can be calculated, but the nonlinear activation energy effect can cause significant error.
• Calculations from the pavement oxidation model and known binder reaction kinetics
parameters indicate that 60 °C hardening rates range from 13 to 19 times the calculated pavement binder aging rates at Refugio temperatures.

6-1
CHAPTER 6
ESTIMATION OF POLYMER MODIFIED MIXTURE FATIGUE LIFE BASED ON THE EFFECTS OF AGING
INTRODUCTION Problem Statement
As of 2001 in the United States, there were 2.5 million miles of flexible pavements (Huang, 2004). Several distresses hamper the performance of these pavements and result in premature failure. In flexible pavements, the primary forms of distress are fatigue cracking, rutting, and thermal cracking. These distresses manifest themselves most of the time due to construction material quality, poor maintenance, and improper design. A complete description of the distresses and failure mechanisms is described in the Highway Pavement Distress Identification Manual (Smith et al., 1979).
Rutting develops in the early life of a flexible pavement and is caused by a combination of consolidation and shear deformation in the pavement layers. At high temperatures, the hot mix asphalt concrete (HMAC) layer is less stiff and thus flows.
Upon the application of traffic loads, there is densification of the layer that leaves a depressed surface in the wheel paths as evidence of rutting. In other cases, inadequate compaction and stiffness of the supporting pavement layers causes consolidation of these layers which then leads to ultimate settling of the HMAC layer which also shows as depressed surfaces known as rutting.
At low temperatures, the stiffness of HMAC increases and cracks develop due to its brittle nature and the reduction in temperatures that leads to restrained shrinkage of the HMAC and induced thermal stresses. This form of distress is known as thermal cracking, and the distress manifests itself as regularly spaced transverse cracks.
Fatigue cracking is the third primary form of distress in flexible pavements. This type of distress occurs at intermediate temperatures under repetitive traffic loading. It occurs over the long term, but once it initiates it progresses rapidly and leads to a total structural collapse of the pavement. This distress is commonly referred to as alligator cracking because its pattern resembles the skin of an alligator.
To prevent the development of rutting, which develops in the early life of the pavement, researchers and pavement engineers have resorted to increasing the stiffness of the HMAC layer at high temperatures. It is assumed that once this is done, the HMAC will not flow and rut in the early life of the pavement. Some of the mechanisms that have been adapted to increase HMAC stiffness include polymer modification. This has worked well and drastically reduced the number of pavements that fail due to rutting. However, the high stiffness of the HMAC makes it brittle and therefore susceptible to cracking under repeated traffic loading. Therefore though rutting in the pavements is prevented, the problem of fatigue cracking remains.
6-2
Current research is focused on increasing the fatigue resistance of HMAC. Again, some of the methods suggested include polymer modification. Even though the stiffness of the HMAC is increased and therefore made brittle, other inherent properties in the polymer modified asphalts make the mixture resistant to fatigue cracking. The question remains as to what extent do the fatigue resistant properties in the polymer modified HMAC compensate for the brittleness created as a result of increased stiffness of the HMAC.
Several methods used in predicting the fatigue resistance of HMAC have been proposed
and used. These have been empirical and mechanistic in nature. The Asphalt Institute model and the Shell nomograph are among the early empirical models that have been used. Another common mechanistic-empirical approach which has been used extensively is the bending beam flexural fatigue test. Some mechanistic models incorporating the use of fracture mechanics, dissipated energy, and other concepts which have sought to predict fatigue resistance based on the fundamental behavior of crack initiation and propagation in the HMAC have also been proposed and used. The Calibrated Mechanistic with Surface Energy (CMSE) measurements is one of the mechanistic approaches in use today. This approach predicts fatigue resistance based on the material properties of the HMAC mixture and component materials. In a separate study comparing this approach with other fatigue prediction approaches, the CMSE produced fatigue lives with the lowest variability (Walubita, 2006a). Chapter Objectives
Based on the introduction, the following objectives are proposed for this research:
• Validate the CMSE approach as a reliable tool to measure the fatigue resistance of selected HMAC mixtures; and
• Evaluate and compare the fatigue resistance of selected HMAC mixtures that vary in
terms of mixture type, aggregate geometric properties, and binder type, including polymer-modified binders.
Scope of the Chapter
The scope of this research will be limited to the following:
• HMAC mixtures: two being studied in the Minnesota Department of Transportation (MnDOT) MnRoad Research study and four Texas Department of Transportation (TxDOT) mixtures used in the Atlanta, Odessa, and Waco Districts;
• Different aggregate types: gravel, igneous, rhyolite, quartzite, and sandstone used in the
six HMAC mixtures;
• Aggregate structures: Superpave 12.5 mm, Superpave 19 mm, and a Coarse Matrix High Binder type F (CHMB_F) used in Texas;
6-3
• Polymer-modified asphalts (PMA) utilizing SBS co-block polymer: PG 76-22, PG 70-22, PG 58-34, and PG 58-40,
• Mixture oxidative aging conditions that simulate Texas HMAC field aging: 0, 3, and
6 months aging in a 60 ºC environmental room,
• Fatigue analysis approach: the CMSE recommended in TxDOT project 0-4468. Chapter Organization
This chapter is organized in six sections. Section one is an introductory section outlining the problem statement and the objectives for the chapter.
The research methodology is the main theme in Section two. The experimental design for the HMAC is given with the material properties for the binders and aggregates. The methodology used in the HMAC mixture fabrication is outlined, and the analytical measurements used to characterize the mixtures in terms of fatigue resistance are also discussed. The analysis procedure employed in the CMSE is explained.
Section three describes the laboratory test results. In this section the surface energy tests of the asphalts and aggregates, as well as the results of the HMAC CMSE test results are provided.
The discussion of the results are presented in Section four. This section contains the discussion of the predicted fatigue resistance of the HMAC mixtures. A summary of the chapter is finally provided in the end. RESEARCH METHODOLOGY Introduction
In this research the CMSE approach for determination of fatigue resistance was used.
AIMS used by the International Center for Aggregate Research (ICAR) was also applied to measure the aggregate shape and texture characteristics of the aggregates used in the HMAC mixtures. This chapter looks extensively at the methodology adopted for the study. The experimental design for the HMAC mixtures, the HMAC specimen fabrication, the hypothetical pavement structure used for comparison together with the environmental conditions, the analytical measurements, the analysis procedure, and a summary of the chapter is provided. Experimental Design
In this project, six different HMAC mixtures were studied. These mixtures were those used in three Texas Department of Transportation districts: Atlanta, Waco, and Odessa and a test pavement section in Minnesota. These HMAC mixtures contained five different aggregate types: gravel, igneous, rhyolite, sandstone, and quartzite with five different gradations and four PMAs.
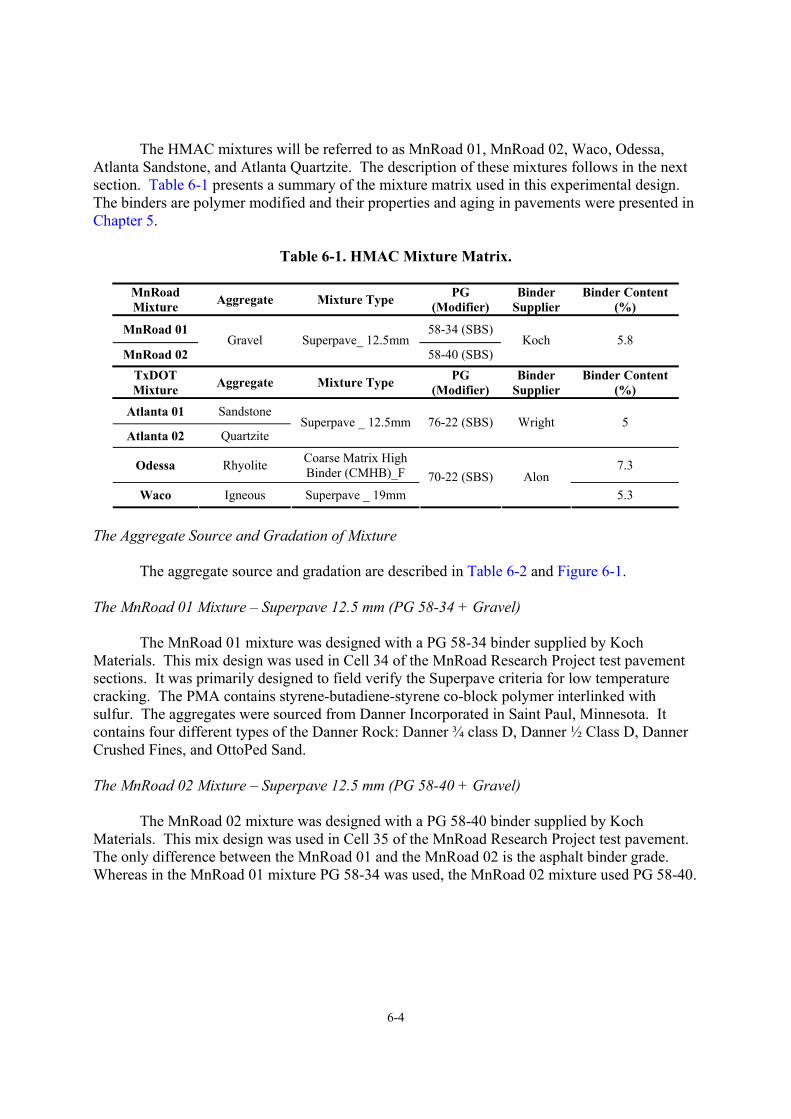
6-4
The HMAC mixtures will be referred to as MnRoad 01, MnRoad 02, Waco, Odessa, Atlanta Sandstone, and Atlanta Quartzite. The description of these mixtures follows in the next section. Table 6-1 presents a summary of the mixture matrix used in this experimental design. The binders are polymer modified and their properties and aging in pavements were presented in Chapter 5.
Table 6-1. HMAC Mixture Matrix.
MnRoad Mixture Aggregate Mixture Type PG
(Modifier) Binder
Supplier Binder Content
(%)
MnRoad 01 58-34 (SBS)
MnRoad 02 Gravel Superpave_ 12.5mm
58-40 (SBS) Koch 5.8
TxDOT Mixture Aggregate Mixture Type PG
(Modifier) Binder
Supplier Binder Content
(%)
Atlanta 01 Sandstone
Atlanta 02 Quartzite Superpave _ 12.5mm 76-22 (SBS) Wright 5
Odessa Rhyolite Coarse Matrix High Binder (CMHB)_F 7.3
Waco Igneous Superpave _ 19mm 70-22 (SBS) Alon
5.3
The Aggregate Source and Gradation of Mixture
The aggregate source and gradation are described in Table 6-2 and Figure 6-1. The MnRoad 01 Mixture – Superpave 12.5 mm (PG 58-34 + Gravel)
The MnRoad 01 mixture was designed with a PG 58-34 binder supplied by Koch Materials. This mix design was used in Cell 34 of the MnRoad Research Project test pavement sections. It was primarily designed to field verify the Superpave criteria for low temperature cracking. The PMA contains styrene-butadiene-styrene co-block polymer interlinked with sulfur. The aggregates were sourced from Danner Incorporated in Saint Paul, Minnesota. It contains four different types of the Danner Rock: Danner ¾ class D, Danner ½ Class D, Danner Crushed Fines, and OttoPed Sand. The MnRoad 02 Mixture – Superpave 12.5 mm (PG 58-40 + Gravel)
The MnRoad 02 mixture was designed with a PG 58-40 binder supplied by Koch Materials. This mix design was used in Cell 35 of the MnRoad Research Project test pavement. The only difference between the MnRoad 01 and the MnRoad 02 is the asphalt binder grade. Whereas in the MnRoad 01 mixture PG 58-34 was used, the MnRoad 02 mixture used PG 58-40.
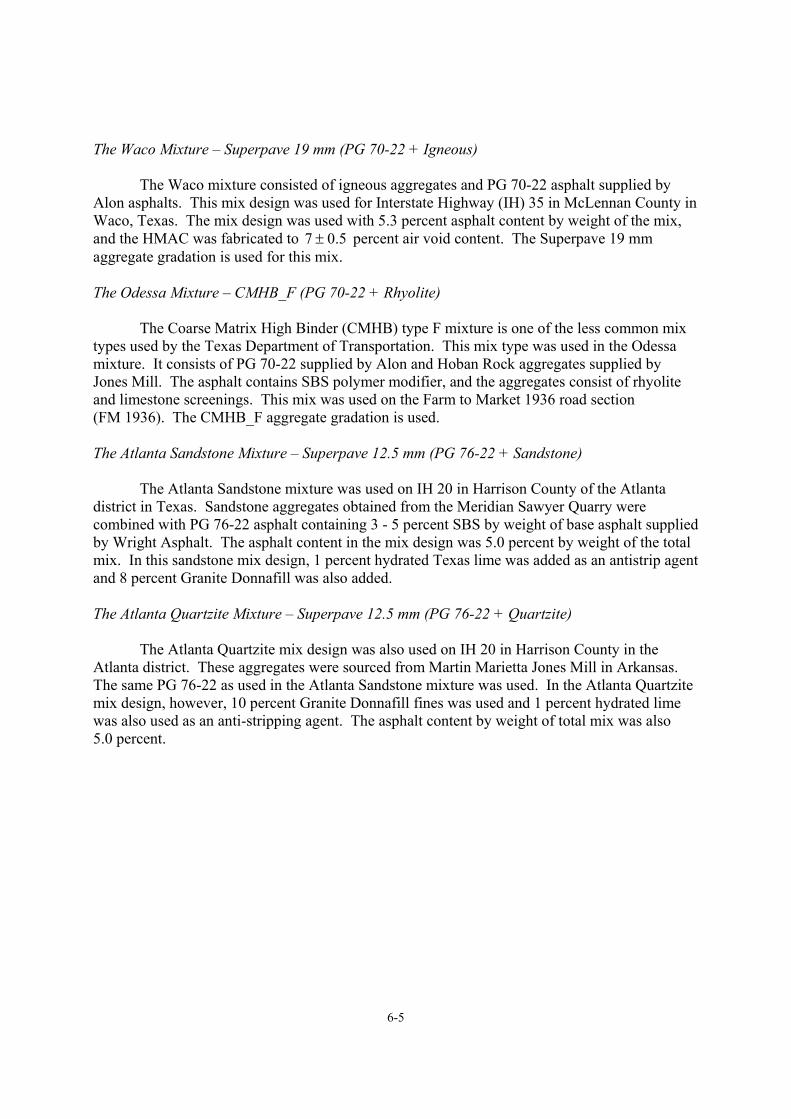
6-5
The Waco Mixture – Superpave 19 mm (PG 70-22 + Igneous)
The Waco mixture consisted of igneous aggregates and PG 70-22 asphalt supplied by Alon asphalts. This mix design was used for Interstate Highway (IH) 35 in McLennan County in Waco, Texas. The mix design was used with 5.3 percent asphalt content by weight of the mix, and the HMAC was fabricated to 5.07 ± percent air void content. The Superpave 19 mm aggregate gradation is used for this mix.
The Odessa Mixture – CMHB_F (PG 70-22 + Rhyolite)
The Coarse Matrix High Binder (CMHB) type F mixture is one of the less common mix types used by the Texas Department of Transportation. This mix type was used in the Odessa mixture. It consists of PG 70-22 supplied by Alon and Hoban Rock aggregates supplied by Jones Mill. The asphalt contains SBS polymer modifier, and the aggregates consist of rhyolite and limestone screenings. This mix was used on the Farm to Market 1936 road section (FM 1936). The CMHB_F aggregate gradation is used. The Atlanta Sandstone Mixture – Superpave 12.5 mm (PG 76-22 + Sandstone)
The Atlanta Sandstone mixture was used on IH 20 in Harrison County of the Atlanta district in Texas. Sandstone aggregates obtained from the Meridian Sawyer Quarry were combined with PG 76-22 asphalt containing 3 - 5 percent SBS by weight of base asphalt supplied by Wright Asphalt. The asphalt content in the mix design was 5.0 percent by weight of the total mix. In this sandstone mix design, 1 percent hydrated Texas lime was added as an antistrip agent and 8 percent Granite Donnafill was also added. The Atlanta Quartzite Mixture – Superpave 12.5 mm (PG 76-22 + Quartzite)
The Atlanta Quartzite mix design was also used on IH 20 in Harrison County in the Atlanta district. These aggregates were sourced from Martin Marietta Jones Mill in Arkansas. The same PG 76-22 as used in the Atlanta Sandstone mixture was used. In the Atlanta Quartzite mix design, however, 10 percent Granite Donnafill fines was used and 1 percent hydrated lime was also used as an anti-stripping agent. The asphalt content by weight of total mix was also 5.0 percent.
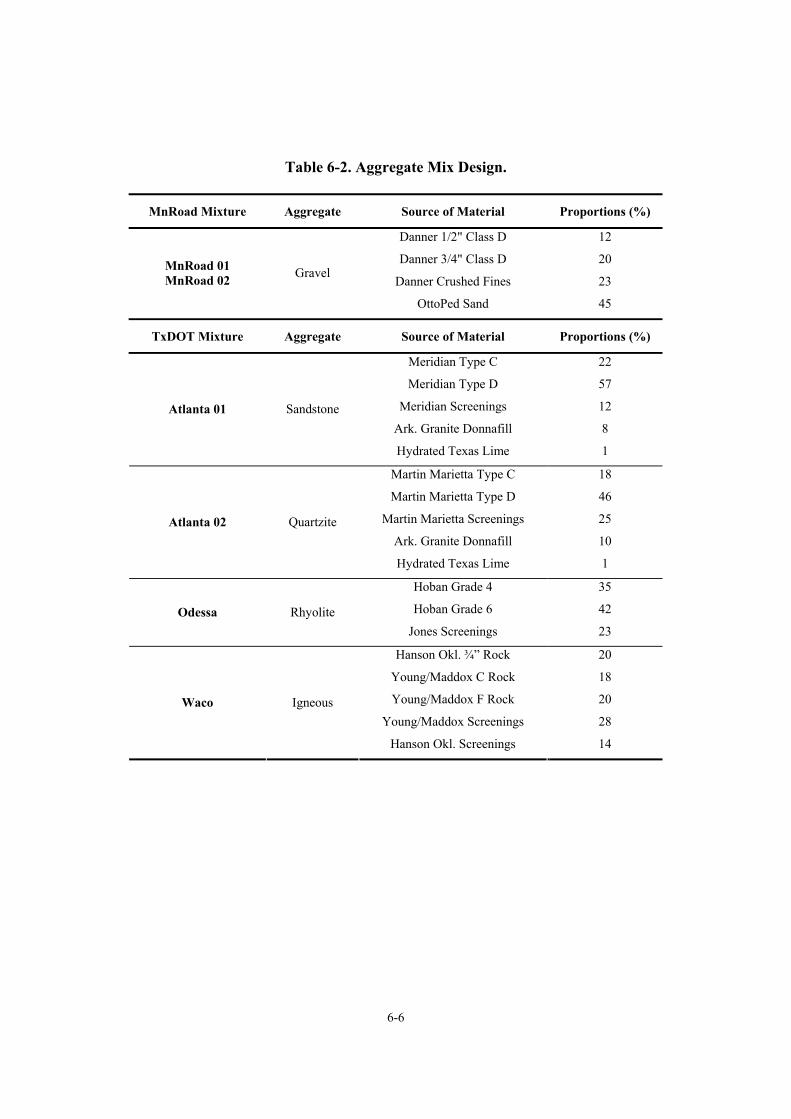
6-6
Table 6-2. Aggregate Mix Design.
MnRoad Mixture Aggregate Source of Material Proportions (%)
Danner 1/2" Class D 12
Danner 3/4" Class D 20
Danner Crushed Fines 23 MnRoad 01 MnRoad 02 Gravel
OttoPed Sand 45
TxDOT Mixture Aggregate Source of Material Proportions (%)
Meridian Type C 22
Meridian Type D 57
Meridian Screenings 12
Ark. Granite Donnafill 8 Atlanta 01 Sandstone
Hydrated Texas Lime 1
Martin Marietta Type C 18
Martin Marietta Type D 46
Martin Marietta Screenings 25
Ark. Granite Donnafill 10 Atlanta 02 Quartzite
Hydrated Texas Lime 1
Hoban Grade 4 35
Hoban Grade 6 42 Odessa Rhyolite Jones Screenings 23
Hanson Okl. ¾” Rock 20
Young/Maddox C Rock 18
Young/Maddox F Rock 20
Young/Maddox Screenings 28 Waco Igneous
Hanson Okl. Screenings 14
6-7
0 1 2 3 4 50
10
20
30
40
50
60
70
80
90
100
MnRoad 01 and 02 Waco Odessa Atlanta Sandstone Atlanta Quartzite
Perc
ent P
assi
ng (%
)
Sieve Size (k0.5)
Figure 6-1. Aggregate Gradation Curve. HMAC Specimen Fabrication
The various steps taken to complete the HMAC specimen fabrication are outlined below: Aggregate Sieving and Batching
The aggregates were supplied from stockpiles at the quarry. To separate individual sizes, they were sieved and then batched according to their gradations as shown in Figure 6-1. The MnRoad 01 and 02 mixtures were not a part of this process since they were supplied as loose HMAC. Aggregate-Asphalt Mixing and Short Term Oven Aging (STOA)
Batch sizes of aggregates were pre-heated at their respective mixing temperatures shown in Table 6-3 prior to mixing with asphalt. This preheating was done for 4 hr to remove all forms of moisture from the aggregates and to bring the aggregates to their mixing temperature. The respective asphalt binders were also liquefied for about 30 minutes at the mixing temperature. The aggregates and the asphalt were mixed in a rotating bucket until such a time that the asphalt had sufficiently coated the surface of the aggregates. The asphalt-aggregate mixture was then short term oven aged for 2 hr at 135 °C for the determination of the maximum specific gravity and 4 hr at the same temperature for compaction. The STOA was done according to the AASHTO PP2 protocol (AASHTO, 1994).
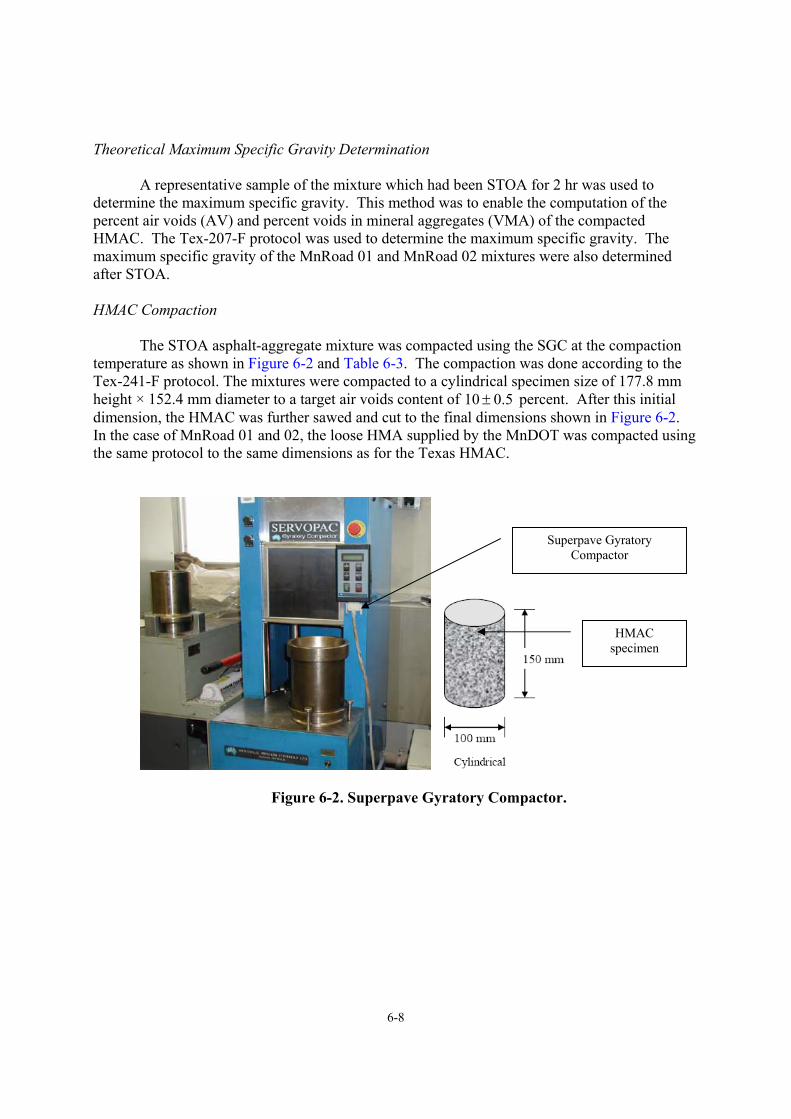
6-8
Theoretical Maximum Specific Gravity Determination
A representative sample of the mixture which had been STOA for 2 hr was used to determine the maximum specific gravity. This method was to enable the computation of the percent air voids (AV) and percent voids in mineral aggregates (VMA) of the compacted HMAC. The Tex-207-F protocol was used to determine the maximum specific gravity. The maximum specific gravity of the MnRoad 01 and MnRoad 02 mixtures were also determined after STOA. HMAC Compaction
The STOA asphalt-aggregate mixture was compacted using the SGC at the compaction temperature as shown in Figure 6-2 and Table 6-3. The compaction was done according to the Tex-241-F protocol. The mixtures were compacted to a cylindrical specimen size of 177.8 mm height × 152.4 mm diameter to a target air voids content of 5.010 ± percent. After this initial dimension, the HMAC was further sawed and cut to the final dimensions shown in Figure 6-2. In the case of MnRoad 01 and 02, the loose HMA supplied by the MnDOT was compacted using the same protocol to the same dimensions as for the Texas HMAC.
Figure 6-2. Superpave Gyratory Compactor.
Superpave Gyratory Compactor
HMAC specimen
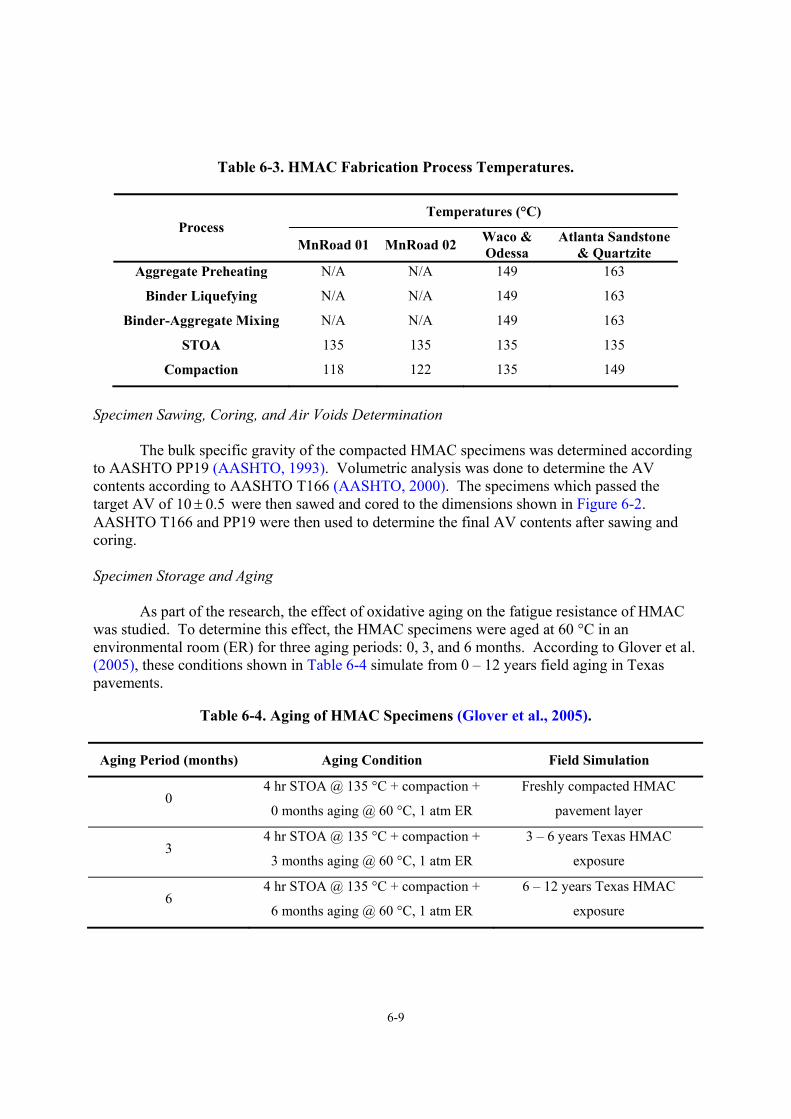
6-9
Table 6-3. HMAC Fabrication Process Temperatures.
Temperatures (°C) Process
MnRoad 01 MnRoad 02 Waco & Odessa
Atlanta Sandstone & Quartzite
Aggregate Preheating N/A N/A 149 163
Binder Liquefying N/A N/A 149 163
Binder-Aggregate Mixing N/A N/A 149 163
STOA 135 135 135 135
Compaction 118 122 135 149
Specimen Sawing, Coring, and Air Voids Determination
The bulk specific gravity of the compacted HMAC specimens was determined according to AASHTO PP19 (AASHTO, 1993). Volumetric analysis was done to determine the AV contents according to AASHTO T166 (AASHTO, 2000). The specimens which passed the target AV of 5.010 ± were then sawed and cored to the dimensions shown in Figure 6-2. AASHTO T166 and PP19 were then used to determine the final AV contents after sawing and coring.
Specimen Storage and Aging
As part of the research, the effect of oxidative aging on the fatigue resistance of HMAC was studied. To determine this effect, the HMAC specimens were aged at 60 °C in an environmental room (ER) for three aging periods: 0, 3, and 6 months. According to Glover et al. (2005), these conditions shown in Table 6-4 simulate from 0 – 12 years field aging in Texas pavements.
Table 6-4. Aging of HMAC Specimens (Glover et al., 2005).
Aging Period (months) Aging Condition Field Simulation
0 4 hr STOA @ 135 °C + compaction +
0 months aging @ 60 °C, 1 atm ER
Freshly compacted HMAC
pavement layer
3 4 hr STOA @ 135 °C + compaction +
3 months aging @ 60 °C, 1 atm ER
3 – 6 years Texas HMAC
exposure
6 4 hr STOA @ 135 °C + compaction +
6 months aging @ 60 °C, 1 atm ER
6 – 12 years Texas HMAC
exposure
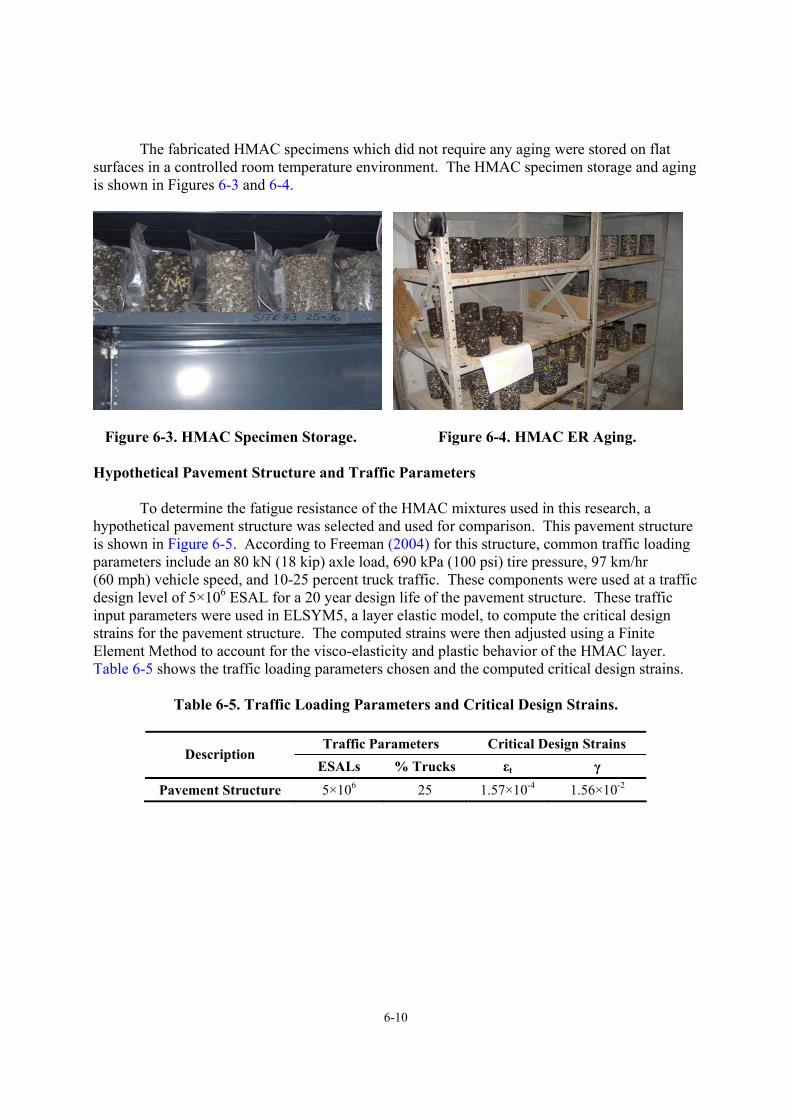
6-10
The fabricated HMAC specimens which did not require any aging were stored on flat surfaces in a controlled room temperature environment. The HMAC specimen storage and aging is shown in Figures 6-3 and 6-4.
Figure 6-3. HMAC Specimen Storage. Figure 6-4. HMAC ER Aging. Hypothetical Pavement Structure and Traffic Parameters
To determine the fatigue resistance of the HMAC mixtures used in this research, a hypothetical pavement structure was selected and used for comparison. This pavement structure is shown in Figure 6-5. According to Freeman (2004) for this structure, common traffic loading parameters include an 80 kN (18 kip) axle load, 690 kPa (100 psi) tire pressure, 97 km/hr (60 mph) vehicle speed, and 10-25 percent truck traffic. These components were used at a traffic design level of 5×10⁶ ESAL for a 20 year design life of the pavement structure. These traffic input parameters were used in ELSYM5, a layer elastic model, to compute the critical design strains for the pavement structure. The computed strains were then adjusted using a Finite Element Method to account for the visco-elasticity and plastic behavior of the HMAC layer. Table 6-5 shows the traffic loading parameters chosen and the computed critical design strains.
Table 6-5. Traffic Loading Parameters and Critical Design Strains.
Traffic Parameters Critical Design Strains Description
ESALs % Trucks εt γ
Pavement Structure 5×10⁶ 25 1.57×10⁻⁴ 1.56×10⁻²
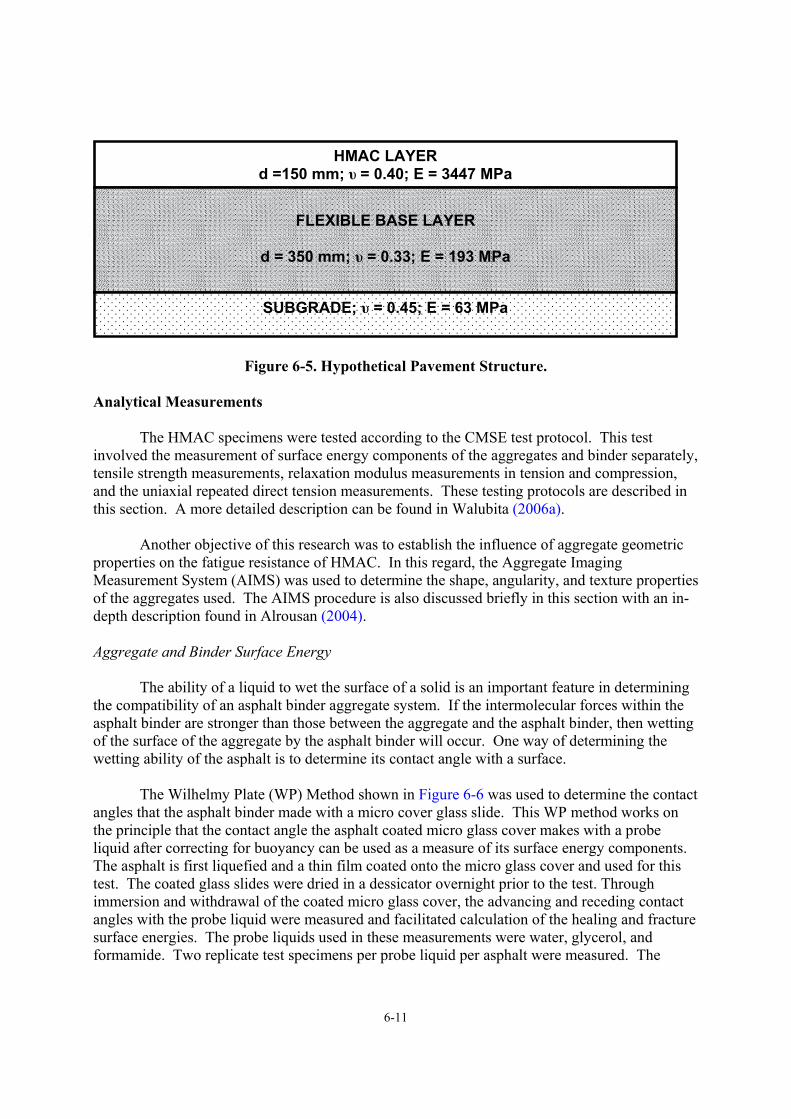
6-11
Figure 6-5. Hypothetical Pavement Structure. Analytical Measurements
The HMAC specimens were tested according to the CMSE test protocol. This test involved the measurement of surface energy components of the aggregates and binder separately, tensile strength measurements, relaxation modulus measurements in tension and compression, and the uniaxial repeated direct tension measurements. These testing protocols are described in this section. A more detailed description can be found in Walubita (2006a).
Another objective of this research was to establish the influence of aggregate geometric properties on the fatigue resistance of HMAC. In this regard, the Aggregate Imaging Measurement System (AIMS) was used to determine the shape, angularity, and texture properties of the aggregates used. The AIMS procedure is also discussed briefly in this section with an in-depth description found in Alrousan (2004). Aggregate and Binder Surface Energy
The ability of a liquid to wet the surface of a solid is an important feature in determining the compatibility of an asphalt binder aggregate system. If the intermolecular forces within the asphalt binder are stronger than those between the aggregate and the asphalt binder, then wetting of the surface of the aggregate by the asphalt binder will occur. One way of determining the wetting ability of the asphalt is to determine its contact angle with a surface.
The Wilhelmy Plate (WP) Method shown in Figure 6-6 was used to determine the contact
angles that the asphalt binder made with a micro cover glass slide. This WP method works on the principle that the contact angle the asphalt coated micro glass cover makes with a probe liquid after correcting for buoyancy can be used as a measure of its surface energy components. The asphalt is first liquefied and a thin film coated onto the micro glass cover and used for this test. The coated glass slides were dried in a dessicator overnight prior to the test. Through immersion and withdrawal of the coated micro glass cover, the advancing and receding contact angles with the probe liquid were measured and facilitated calculation of the healing and fracture surface energies. The probe liquids used in these measurements were water, glycerol, and formamide. Two replicate test specimens per probe liquid per asphalt were measured. The
HMAC LAYER d =150 mm; υ = 0.40; E = 3447 MPa
FLEXIBLE BASE LAYER
d = 350 mm; υ = 0.33; E = 193 MPa
SUBGRADE; υ = 0.45; E = 63 MPa
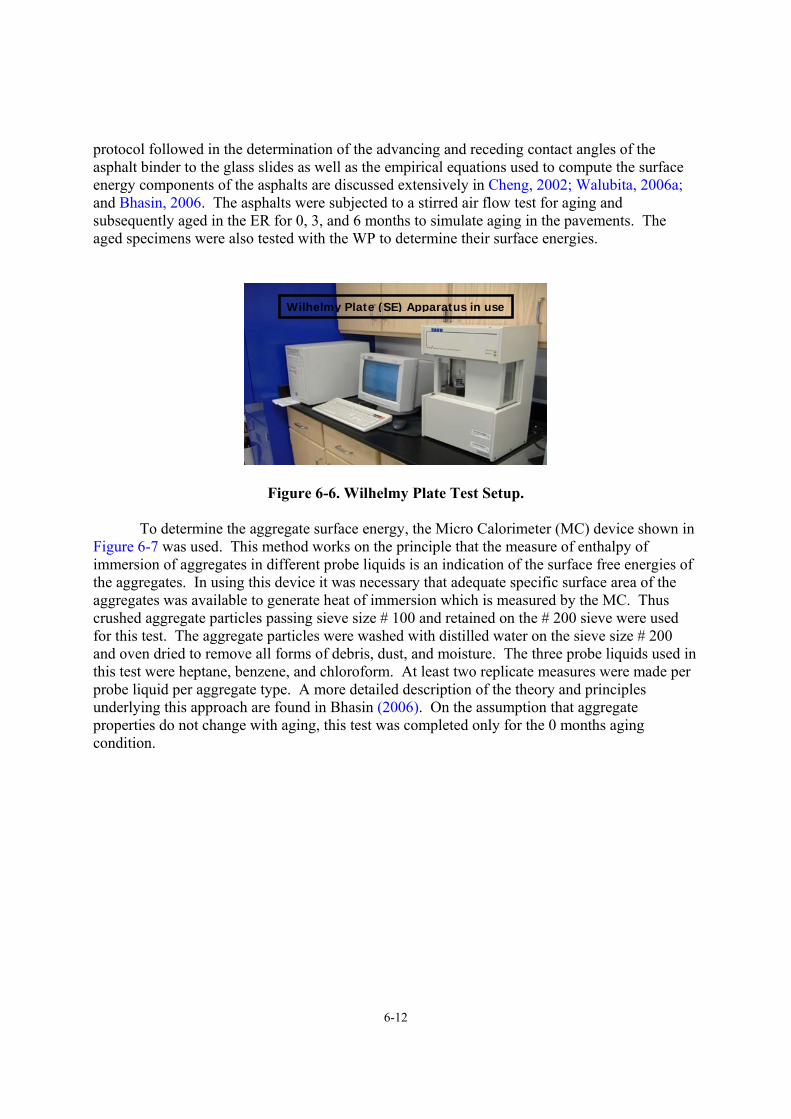
6-12
protocol followed in the determination of the advancing and receding contact angles of the asphalt binder to the glass slides as well as the empirical equations used to compute the surface energy components of the asphalts are discussed extensively in Cheng, 2002; Walubita, 2006a; and Bhasin, 2006. The asphalts were subjected to a stirred air flow test for aging and subsequently aged in the ER for 0, 3, and 6 months to simulate aging in the pavements. The aged specimens were also tested with the WP to determine their surface energies.
Figure 6-6. Wilhelmy Plate Test Setup.
To determine the aggregate surface energy, the Micro Calorimeter (MC) device shown in Figure 6-7 was used. This method works on the principle that the measure of enthalpy of immersion of aggregates in different probe liquids is an indication of the surface free energies of the aggregates. In using this device it was necessary that adequate specific surface area of the aggregates was available to generate heat of immersion which is measured by the MC. Thus crushed aggregate particles passing sieve size # 100 and retained on the # 200 sieve were used for this test. The aggregate particles were washed with distilled water on the sieve size # 200 and oven dried to remove all forms of debris, dust, and moisture. The three probe liquids used in this test were heptane, benzene, and chloroform. At least two replicate measures were made per probe liquid per aggregate type. A more detailed description of the theory and principles underlying this approach are found in Bhasin (2006). On the assumption that aggregate properties do not change with aging, this test was completed only for the 0 months aging condition.
Wilhelmy Plate (SE) Apparatus in use
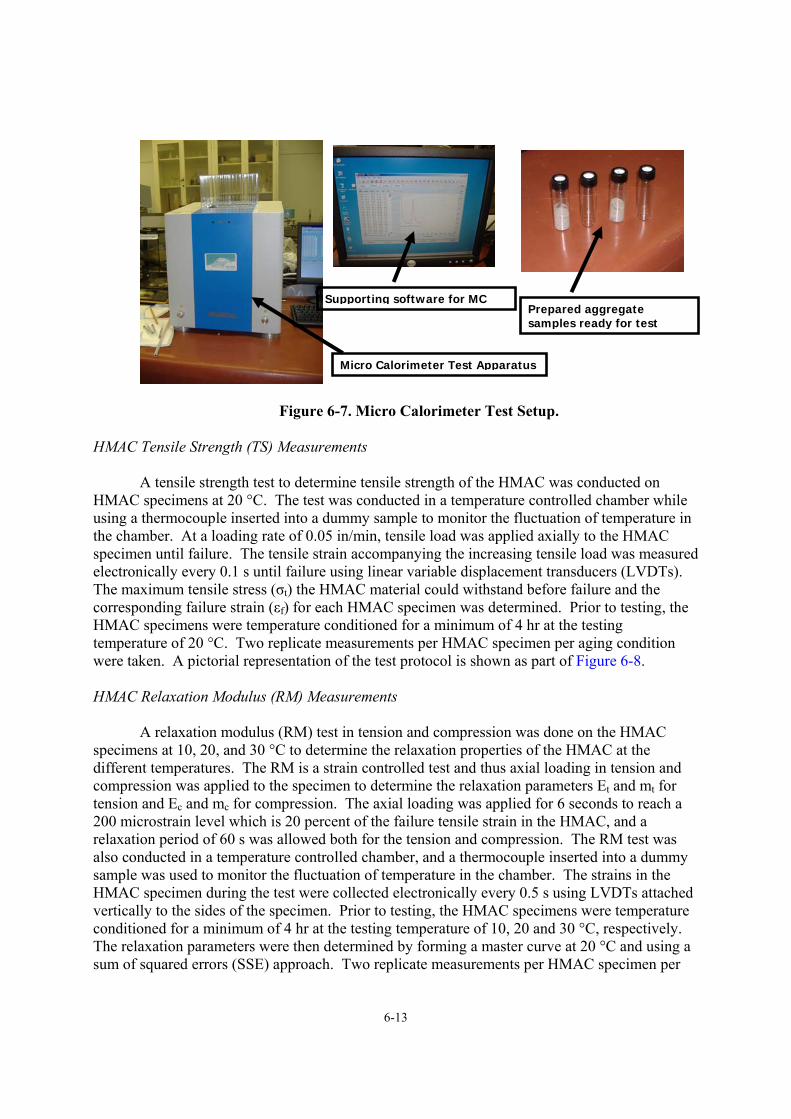
6-13
Figure 6-7. Micro Calorimeter Test Setup. HMAC Tensile Strength (TS) Measurements
A tensile strength test to determine tensile strength of the HMAC was conducted on
HMAC specimens at 20 °C. The test was conducted in a temperature controlled chamber while using a thermocouple inserted into a dummy sample to monitor the fluctuation of temperature in the chamber. At a loading rate of 0.05 in/min, tensile load was applied axially to the HMAC specimen until failure. The tensile strain accompanying the increasing tensile load was measured electronically every 0.1 s until failure using linear variable displacement transducers (LVDTs). The maximum tensile stress (σt) the HMAC material could withstand before failure and the corresponding failure strain (εf) for each HMAC specimen was determined. Prior to testing, the HMAC specimens were temperature conditioned for a minimum of 4 hr at the testing temperature of 20 °C. Two replicate measurements per HMAC specimen per aging condition were taken. A pictorial representation of the test protocol is shown as part of Figure 6-8. HMAC Relaxation Modulus (RM) Measurements
A relaxation modulus (RM) test in tension and compression was done on the HMAC specimens at 10, 20, and 30 °C to determine the relaxation properties of the HMAC at the different temperatures. The RM is a strain controlled test and thus axial loading in tension and compression was applied to the specimen to determine the relaxation parameters Et and mt for tension and Ec and mc for compression. The axial loading was applied for 6 seconds to reach a 200 microstrain level which is 20 percent of the failure tensile strain in the HMAC, and a relaxation period of 60 s was allowed both for the tension and compression. The RM test was also conducted in a temperature controlled chamber, and a thermocouple inserted into a dummy sample was used to monitor the fluctuation of temperature in the chamber. The strains in the HMAC specimen during the test were collected electronically every 0.5 s using LVDTs attached vertically to the sides of the specimen. Prior to testing, the HMAC specimens were temperature conditioned for a minimum of 4 hr at the testing temperature of 10, 20 and 30 °C, respectively. The relaxation parameters were then determined by forming a master curve at 20 °C and using a sum of squared errors (SSE) approach. Two replicate measurements per HMAC specimen per
Supporting software for MC
Micro Calorimeter Test Apparatus
Prepared aggregate samples ready for test
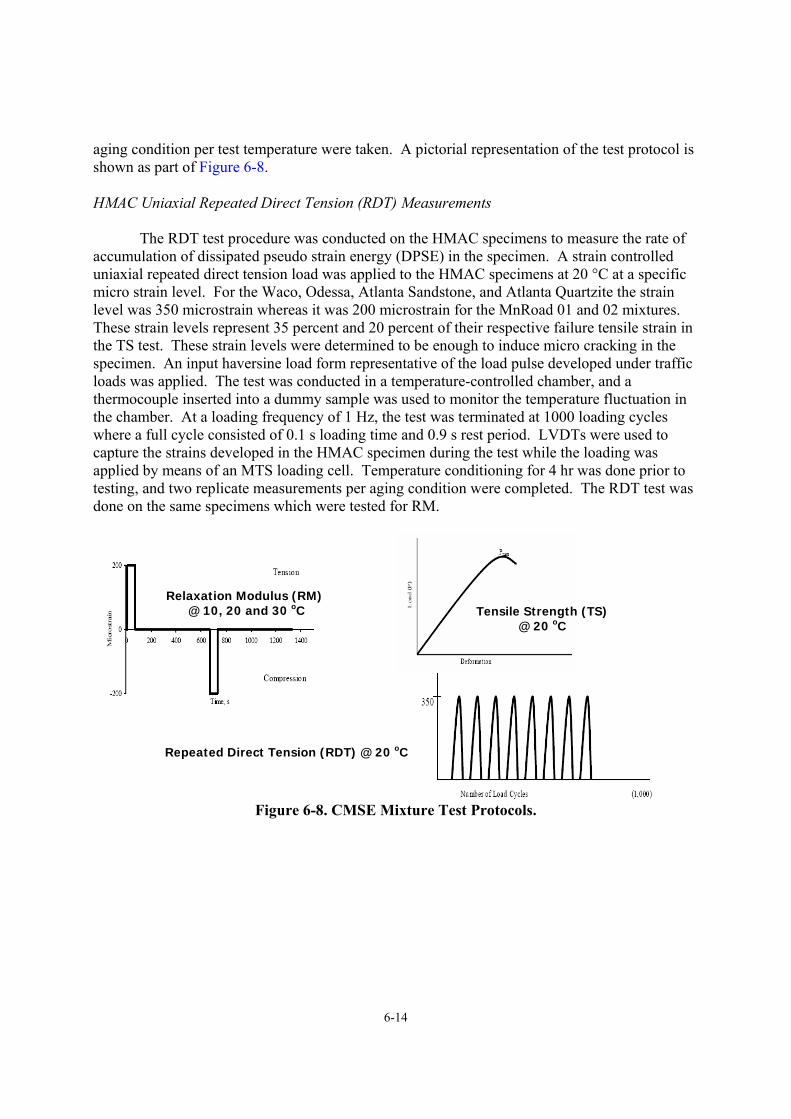
6-14
aging condition per test temperature were taken. A pictorial representation of the test protocol is shown as part of Figure 6-8.
HMAC Uniaxial Repeated Direct Tension (RDT) Measurements
The RDT test procedure was conducted on the HMAC specimens to measure the rate of
accumulation of dissipated pseudo strain energy (DPSE) in the specimen. A strain controlled uniaxial repeated direct tension load was applied to the HMAC specimens at 20 °C at a specific micro strain level. For the Waco, Odessa, Atlanta Sandstone, and Atlanta Quartzite the strain level was 350 microstrain whereas it was 200 microstrain for the MnRoad 01 and 02 mixtures. These strain levels represent 35 percent and 20 percent of their respective failure tensile strain in the TS test. These strain levels were determined to be enough to induce micro cracking in the specimen. An input haversine load form representative of the load pulse developed under traffic loads was applied. The test was conducted in a temperature-controlled chamber, and a thermocouple inserted into a dummy sample was used to monitor the temperature fluctuation in the chamber. At a loading frequency of 1 Hz, the test was terminated at 1000 loading cycles where a full cycle consisted of 0.1 s loading time and 0.9 s rest period. LVDTs were used to capture the strains developed in the HMAC specimen during the test while the loading was applied by means of an MTS loading cell. Temperature conditioning for 4 hr was done prior to testing, and two replicate measurements per aging condition were completed. The RDT test was done on the same specimens which were tested for RM.
Figure 6-8. CMSE Mixture Test Protocols.
Relaxation Modulus (RM) @ 10, 20 and 30 oC Tensile Strength (TS)
@ 20 oC
Repeated Direct Tension (RDT) @ 20 oC
6-15
Analysis Procedure Introduction
The CMSE approach of fatigue life determination relies on the principle that loading the
HMAC layer repeatedly induces micro crack initiation and then propagation through the HMAC layer. However, the bond strength of the asphalt aggregate matrix allows healing of the micro cracks as they are formed. It is fundamentally based on the Schapery modified Work Potential Theory and Paris’ Law of Fracture. This approach also accounts for the fact that HMAC is a heterogeneous material and as such exhibits anisotropy. As a result the fatigue life of HMAC according to this approach is a function of anisotropy, healing, number of load cycles to crack initiation, and number of load cycles to crack propagation through the HMAC layer. The CMSE uses fundamental material properties to determine the fatigue resistance of a mixture. The failure criterion in this approach is the growth and propagation of a 7.5 mm crack through the HMAC layer according to Lytton et al. (1993).
The CMSE approach is explained in detail by Walubita (2006a) but the primary equations used to determine fatigue life are described in this section. Material Property Outputs from Laboratory Tests
A summary of the material properties used in the CMSE approach and determined from the laboratory tests is as follows:
• Tensile Strength (TS) test o σt (Tensile Strength), εf (failure strain)
• Relaxation Modulus (RM) test o Et (Relaxation Modulus in Tension), mt (relaxation rate in tension), Ec (Relaxation
Modulus in compression), mc (relaxation rate in compression)
• Repeated Direct Tension (RDT) test o b-value (slope of the DPSE versus Log of load cycles plot)
• Surface Energy tests o ∆Gh (Bond Strength of the asphalt-aggregate due to healing), ∆Gf (Surface
Energy of the asphalt-aggregate mixture due to fracture) Determination of Fatigue Life Nf from Laboratory Test Outputs
Based on the outputs from the laboratory tests, the fatigue lives of the HMAC mixtures were determined using the following Equations 6-1 through 6-8:
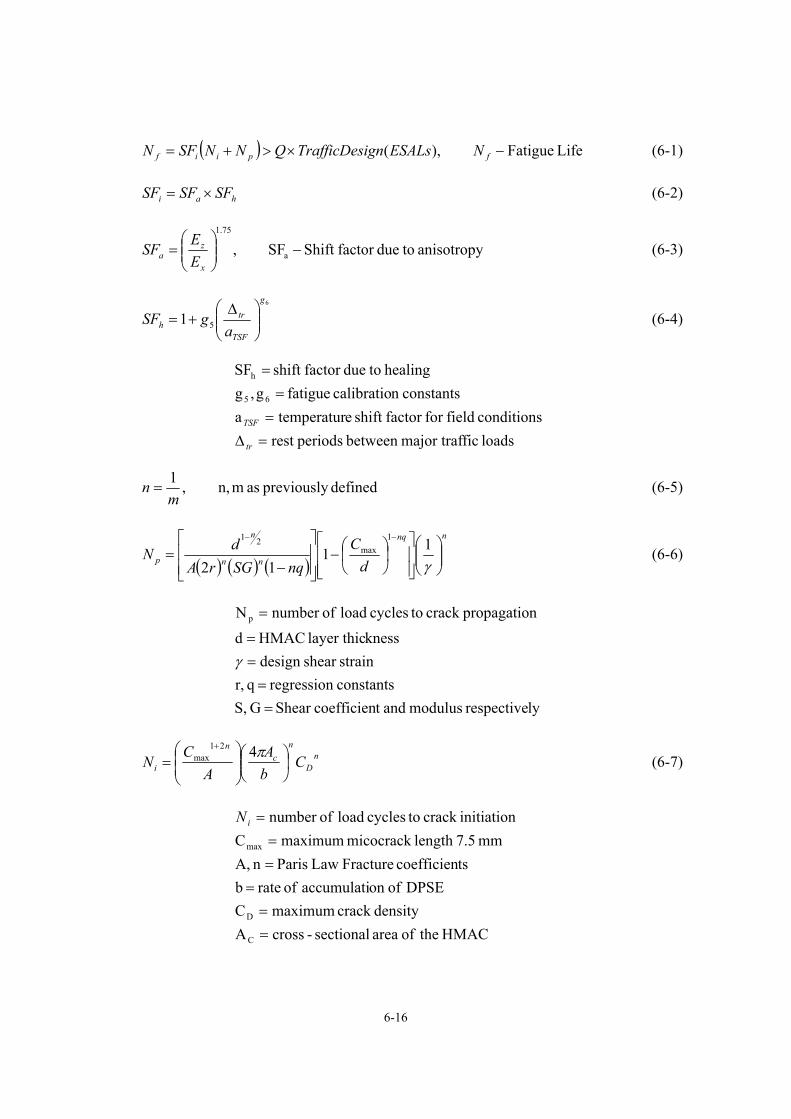
6-16
( ) Life Fatigue ),( −×>+= fpiif NESALsignTrafficDesQNNSFN (6-1)
hai SFSFSF ×= (6-2)
anisotropy toduefactor Shift SF, a
75.1
−⎟⎟⎠
⎞⎜⎜⎝
⎛=
x
za E
ESF (6-3)
6
51g
TSF
trh a
gSF ⎟⎟⎠
⎞⎜⎜⎝
⎛ ∆+= (6-4)
loads ficmajor trafbetween periodsrest conditions fieldfor factor shift etemperatura
constantsn calibratio fatigue g,ghealing toduefactor shift SF
65
h
=∆=
==
tr
TSF
defined previously as mn,,1m
n = (6-5)
( ) ( ) ( )
nnq
nn
n
p dC
nqSGrAdN ⎟⎟
⎠
⎞⎜⎜⎝
⎛
⎥⎥⎦
⎤
⎢⎢⎣
⎡⎟⎠⎞
⎜⎝⎛−
⎥⎥⎦
⎤
⎢⎢⎣
⎡
−=
−−
γ11
12
1max
21
(6-6)
lyrespective modulus andt coefficienShear G S,constants regression q r,strainshear design
knesslayer thic HMAC d
npropagatiocrack tocycles load ofnumber N p
==
==
=
γ
n
D
nc
n
i CbA
AC
N ⎟⎠⎞
⎜⎝⎛
⎟⎟⎠
⎞⎜⎜⎝
⎛=
+ π421max (6-7)
HMAC theof area sectional-crossAdensitycrack maximumC
DPSE ofon accumulati of rate btscoefficien Fracture Law Paris n A,
mm 7.5length micocrack maximumCinitiationcrack tocycles load ofnumber
C
D
max
==
===
=iN
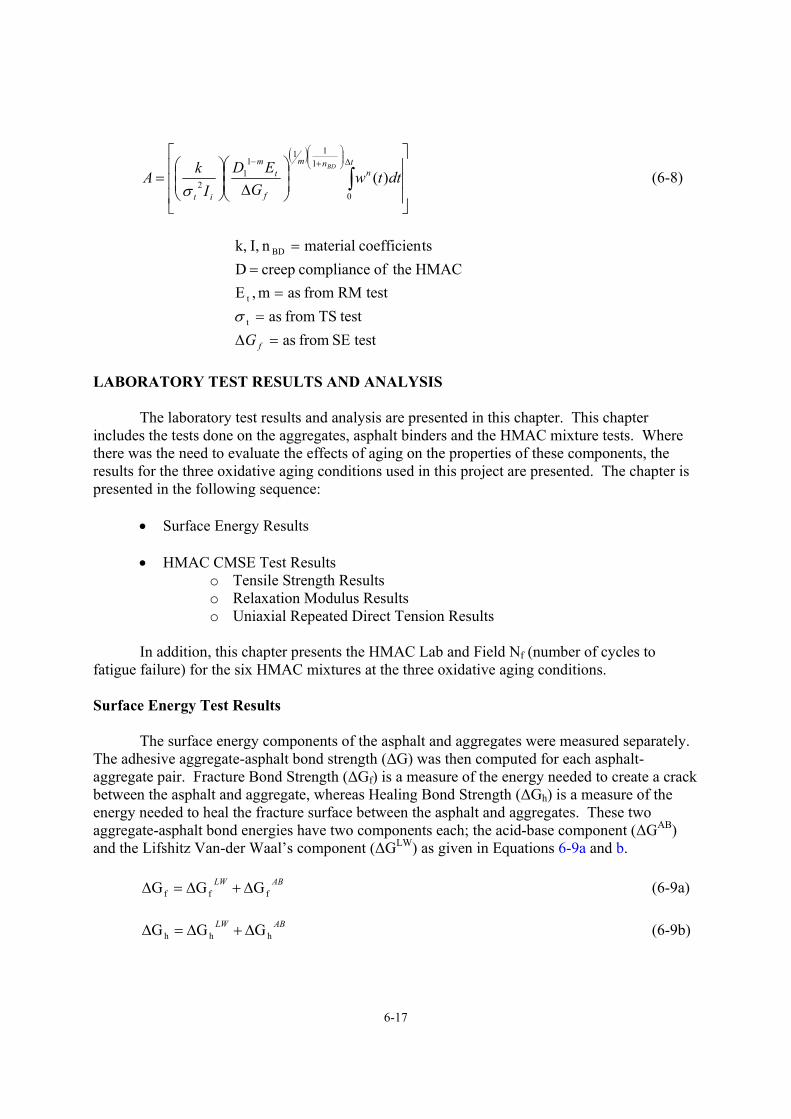
6-17
( )
⎥⎥⎥
⎦
⎤
⎢⎢⎢
⎣
⎡
⎟⎟⎠
⎞⎜⎜⎝
⎛
∆⎟⎟⎠
⎞⎜⎜⎝
⎛= ∫
∆⎟⎟⎠
⎞⎜⎜⎝
⎛+− t
nnm
f
tm
it
dttwG
EDI
kABD
0
111
11
2 )(σ
(6-8)
testSE from as testTS from as
testRM from asm,EHMAC theof compliance creep Dtscoefficien materialn I, k,
t
t
BD
=∆=
==
=
fGσ
LABORATORY TEST RESULTS AND ANALYSIS
The laboratory test results and analysis are presented in this chapter. This chapter
includes the tests done on the aggregates, asphalt binders and the HMAC mixture tests. Where there was the need to evaluate the effects of aging on the properties of these components, the results for the three oxidative aging conditions used in this project are presented. The chapter is presented in the following sequence:
• Surface Energy Results • HMAC CMSE Test Results
o Tensile Strength Results o Relaxation Modulus Results o Uniaxial Repeated Direct Tension Results
In addition, this chapter presents the HMAC Lab and Field Nf (number of cycles to
fatigue failure) for the six HMAC mixtures at the three oxidative aging conditions. Surface Energy Test Results
The surface energy components of the asphalt and aggregates were measured separately.
The adhesive aggregate-asphalt bond strength (∆G) was then computed for each asphalt-aggregate pair. Fracture Bond Strength (∆Gf) is a measure of the energy needed to create a crack between the asphalt and aggregate, whereas Healing Bond Strength (∆Gh) is a measure of the energy needed to heal the fracture surface between the asphalt and aggregates. These two aggregate-asphalt bond energies have two components each; the acid-base component (∆GAB) and the Lifshitz Van-der Waal’s component (∆GLW) as given in Equations 6-9a and b.
ABLWfff GGG ∆+∆=∆ (6-9a)
ABLW
hhh GGG ∆+∆=∆ (6-9b)
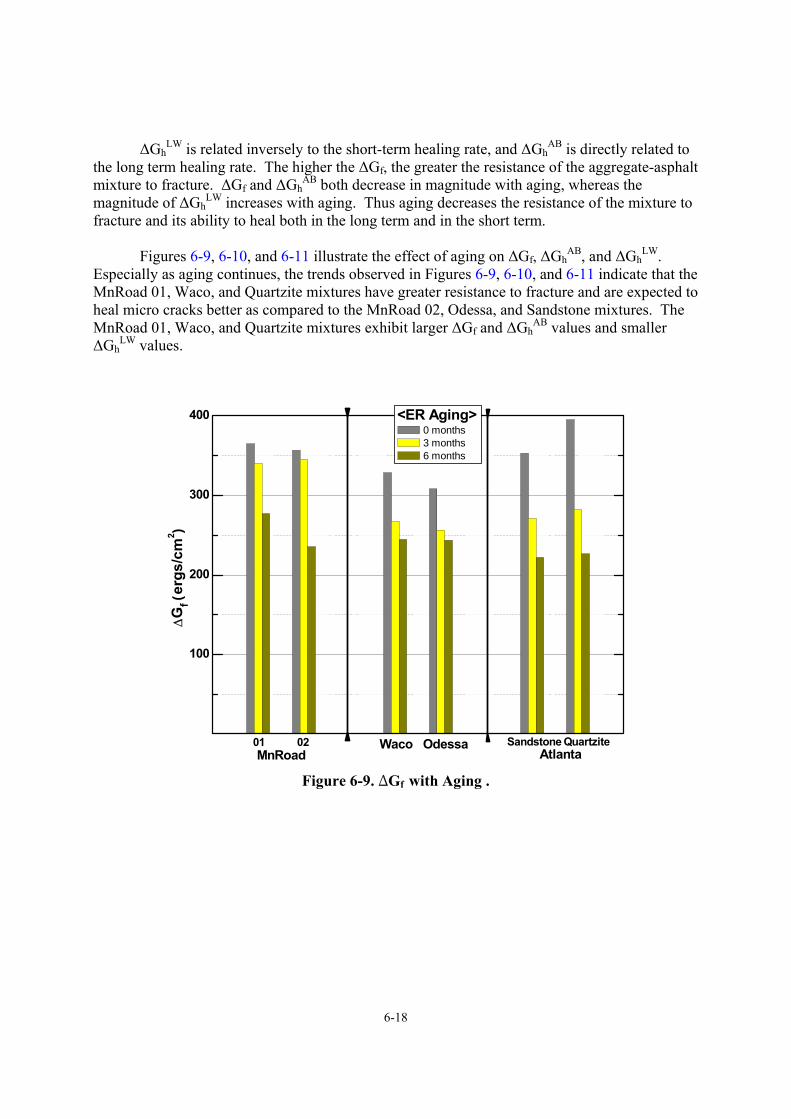
6-18
∆GhLW is related inversely to the short-term healing rate, and ∆Gh
AB is directly related to the long term healing rate. The higher the ∆Gf, the greater the resistance of the aggregate-asphalt mixture to fracture. ∆Gf and ∆Gh
AB both decrease in magnitude with aging, whereas the magnitude of ∆Gh
LW increases with aging. Thus aging decreases the resistance of the mixture to fracture and its ability to heal both in the long term and in the short term.
Figures 6-9, 6-10, and 6-11 illustrate the effect of aging on ∆Gf, ∆GhAB, and ∆Gh
LW. Especially as aging continues, the trends observed in Figures 6-9, 6-10, and 6-11 indicate that the MnRoad 01, Waco, and Quartzite mixtures have greater resistance to fracture and are expected to heal micro cracks better as compared to the MnRoad 02, Odessa, and Sandstone mixtures. The MnRoad 01, Waco, and Quartzite mixtures exhibit larger ∆Gf and ∆Gh
AB values and smaller ∆Gh
LW values.
100
200
300
400
QuartziteSandstone0201Atlanta
Odessa
∆G
f (er
gs/c
m2 )
<ER Aging> 0 months 3 months 6 months
MnRoadWaco
Figure 6-9. ΔGf with Aging .
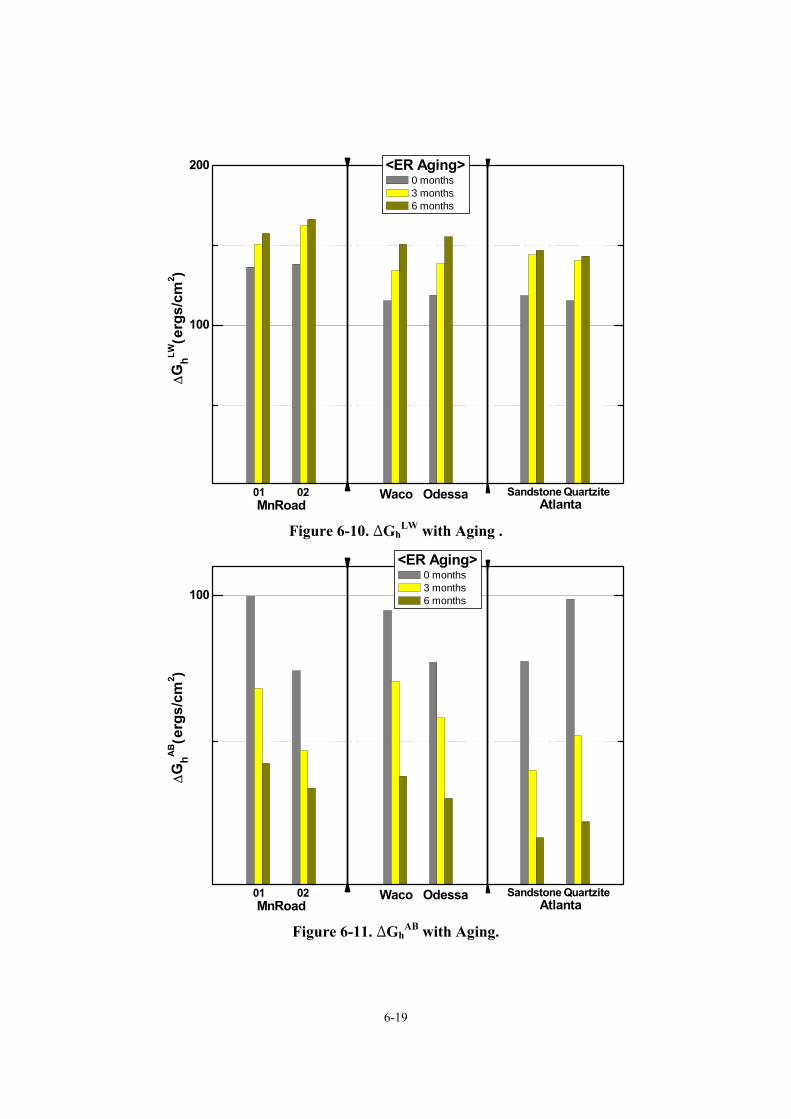
6-19
100
200
QuartziteSandstone0201Atlanta
Odessa
∆G
hLW(e
rgs/
cm2 )
<ER Aging> 0 months 3 months 6 months
MnRoadWaco
Figure 6-10. ΔGh
LW with Aging .
100
QuartziteSandstone0201Atlanta
Odessa
∆G
hAB(e
rgs/
cm2 )
<ER Aging> 0 months 3 months 6 months
MnRoadWaco
Figure 6-11. ΔGh
AB with Aging.
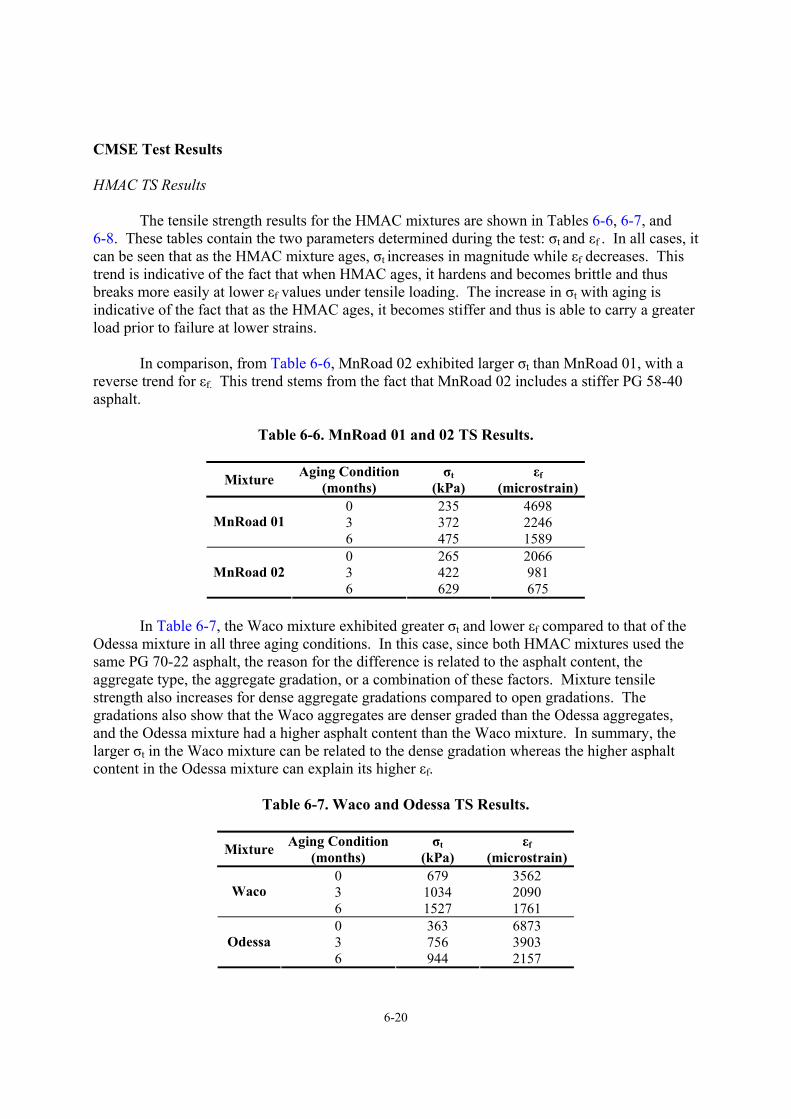
6-20
CMSE Test Results HMAC TS Results
The tensile strength results for the HMAC mixtures are shown in Tables 6-6, 6-7, and
6-8. These tables contain the two parameters determined during the test: σt and εf . In all cases, it can be seen that as the HMAC mixture ages, σt increases in magnitude while εf decreases. This trend is indicative of the fact that when HMAC ages, it hardens and becomes brittle and thus breaks more easily at lower εf values under tensile loading. The increase in σt with aging is indicative of the fact that as the HMAC ages, it becomes stiffer and thus is able to carry a greater load prior to failure at lower strains.
In comparison, from Table 6-6, MnRoad 02 exhibited larger σt than MnRoad 01, with a
reverse trend for εf. This trend stems from the fact that MnRoad 02 includes a stiffer PG 58-40 asphalt.
Table 6-6. MnRoad 01 and 02 TS Results.
Mixture Aging Condition(months)
σt (kPa)
εf (microstrain)
0 235 4698 3 372 2246 MnRoad 01 6 475 1589 0 265 2066 3 422 981 MnRoad 02 6 629 675
In Table 6-7, the Waco mixture exhibited greater σt and lower εf compared to that of the
Odessa mixture in all three aging conditions. In this case, since both HMAC mixtures used the same PG 70-22 asphalt, the reason for the difference is related to the asphalt content, the aggregate type, the aggregate gradation, or a combination of these factors. Mixture tensile strength also increases for dense aggregate gradations compared to open gradations. The gradations also show that the Waco aggregates are denser graded than the Odessa aggregates, and the Odessa mixture had a higher asphalt content than the Waco mixture. In summary, the larger σt in the Waco mixture can be related to the dense gradation whereas the higher asphalt content in the Odessa mixture can explain its higher εf.
Table 6-7. Waco and Odessa TS Results.
Mixture Aging Condition(months)
σt (kPa)
εf (microstrain)
0 679 3562 3 1034 2090 Waco 6 1527 1761 0 363 6873 3 756 3903 Odessa 6 944 2157
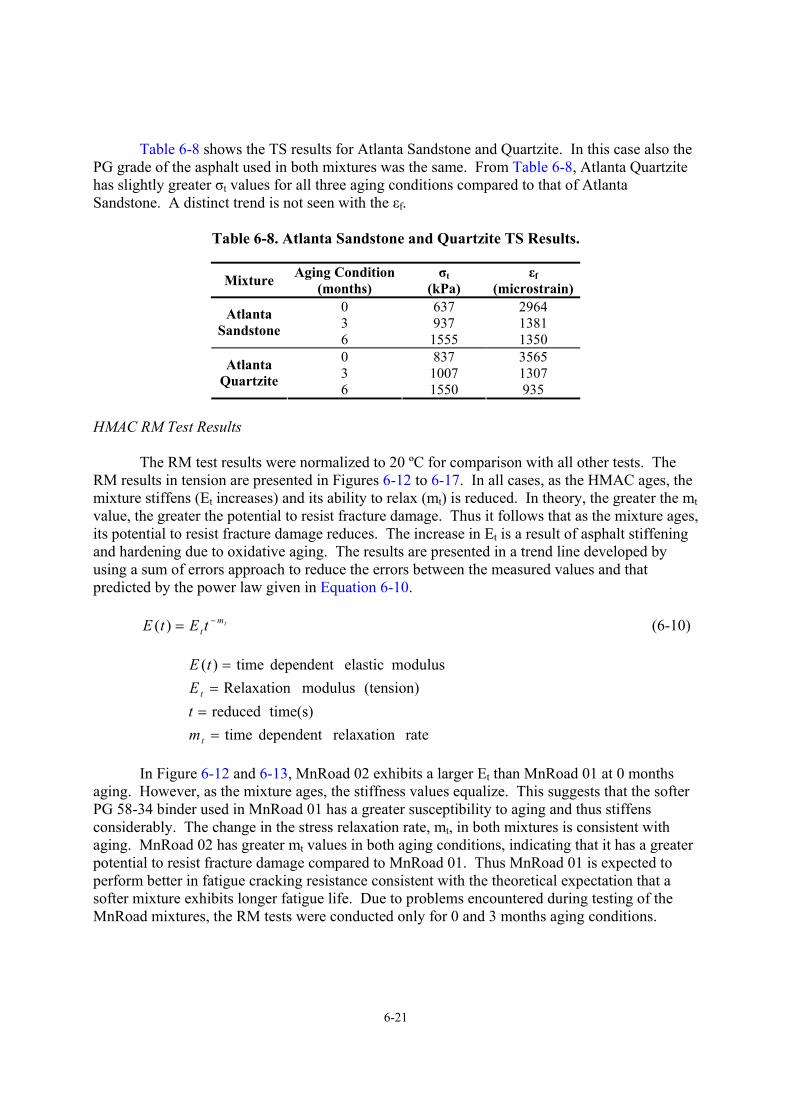
6-21
Table 6-8 shows the TS results for Atlanta Sandstone and Quartzite. In this case also the PG grade of the asphalt used in both mixtures was the same. From Table 6-8, Atlanta Quartzite has slightly greater σt values for all three aging conditions compared to that of Atlanta Sandstone. A distinct trend is not seen with the εf.
Table 6-8. Atlanta Sandstone and Quartzite TS Results.
Mixture Aging Condition(months)
σt (kPa)
εf (microstrain)
0 637 2964 3 937 1381 Atlanta
Sandstone 6 1555 1350 0 837 3565 3 1007 1307 Atlanta
Quartzite 6 1550 935 HMAC RM Test Results
The RM test results were normalized to 20 ºC for comparison with all other tests. The RM results in tension are presented in Figures 6-12 to 6-17. In all cases, as the HMAC ages, the mixture stiffens (Et increases) and its ability to relax (mt) is reduced. In theory, the greater the mt value, the greater the potential to resist fracture damage. Thus it follows that as the mixture ages, its potential to resist fracture damage reduces. The increase in Et is a result of asphalt stiffening and hardening due to oxidative aging. The results are presented in a trend line developed by using a sum of errors approach to reduce the errors between the measured values and that predicted by the power law given in Equation 6-10.
tm
t tEtE −=)( (6-10)
rate relaxationdependent time time(s)reduced
(tension) modulus Relaxationmoduluselasticdependent time)(
==
==
t
t
mtE
tE
In Figure 6-12 and 6-13, MnRoad 02 exhibits a larger Et than MnRoad 01 at 0 months
aging. However, as the mixture ages, the stiffness values equalize. This suggests that the softer PG 58-34 binder used in MnRoad 01 has a greater susceptibility to aging and thus stiffens considerably. The change in the stress relaxation rate, mt, in both mixtures is consistent with aging. MnRoad 02 has greater mt values in both aging conditions, indicating that it has a greater potential to resist fracture damage compared to MnRoad 01. Thus MnRoad 01 is expected to perform better in fatigue cracking resistance consistent with the theoretical expectation that a softer mixture exhibits longer fatigue life. Due to problems encountered during testing of the MnRoad mixtures, the RM tests were conducted only for 0 and 3 months aging conditions.
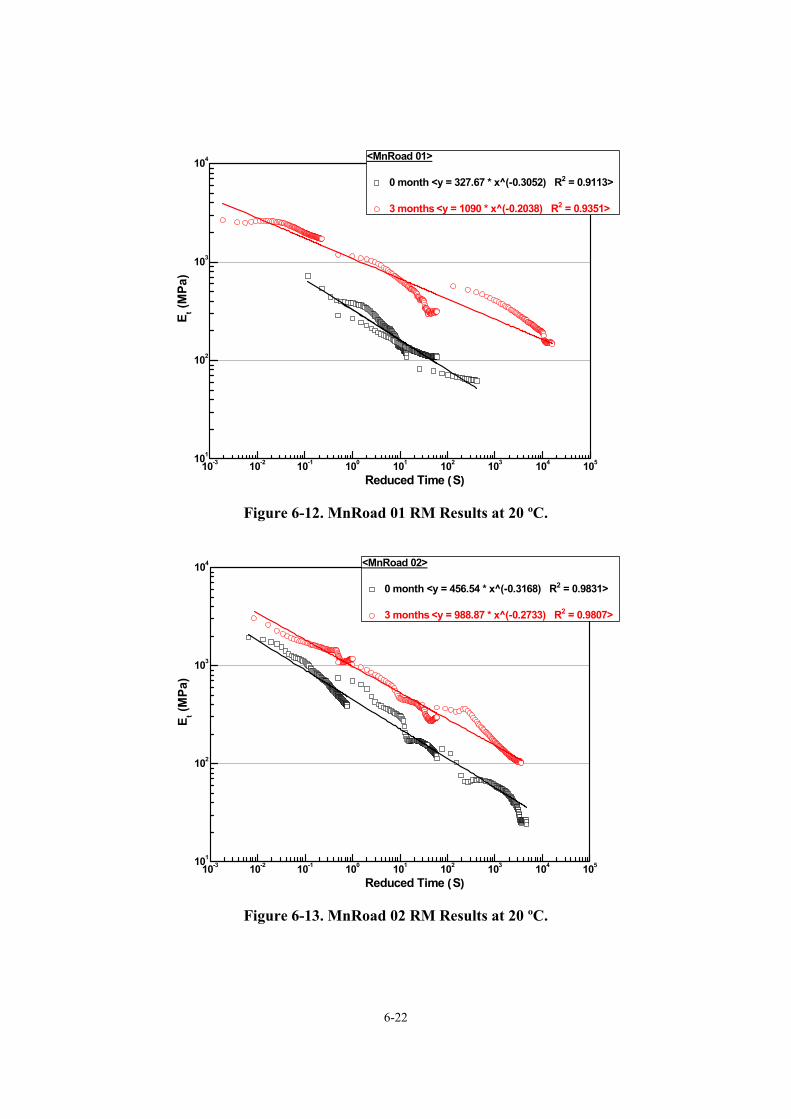
6-22
10-3 10-2 10-1 100 101 102 103 104 105101
102
103
104
<MnRoad 01>
0 month <y = 327.67 * x^(-0.3052) R2 = 0.9113>
3 months <y = 1090 * x^(-0.2038) R2 = 0.9351>
E t (MPa
)
Reduced Time (S)
Figure 6-12. MnRoad 01 RM Results at 20 ºC.
10-3 10-2 10-1 100 101 102 103 104 105101
102
103
104
<MnRoad 02>
0 month <y = 456.54 * x^(-0.3168) R2 = 0.9831>
3 months <y = 988.87 * x^(-0.2733) R2 = 0.9807>
E t (M
Pa)
Reduced Time (S)
Figure 6-13. MnRoad 02 RM Results at 20 ºC.
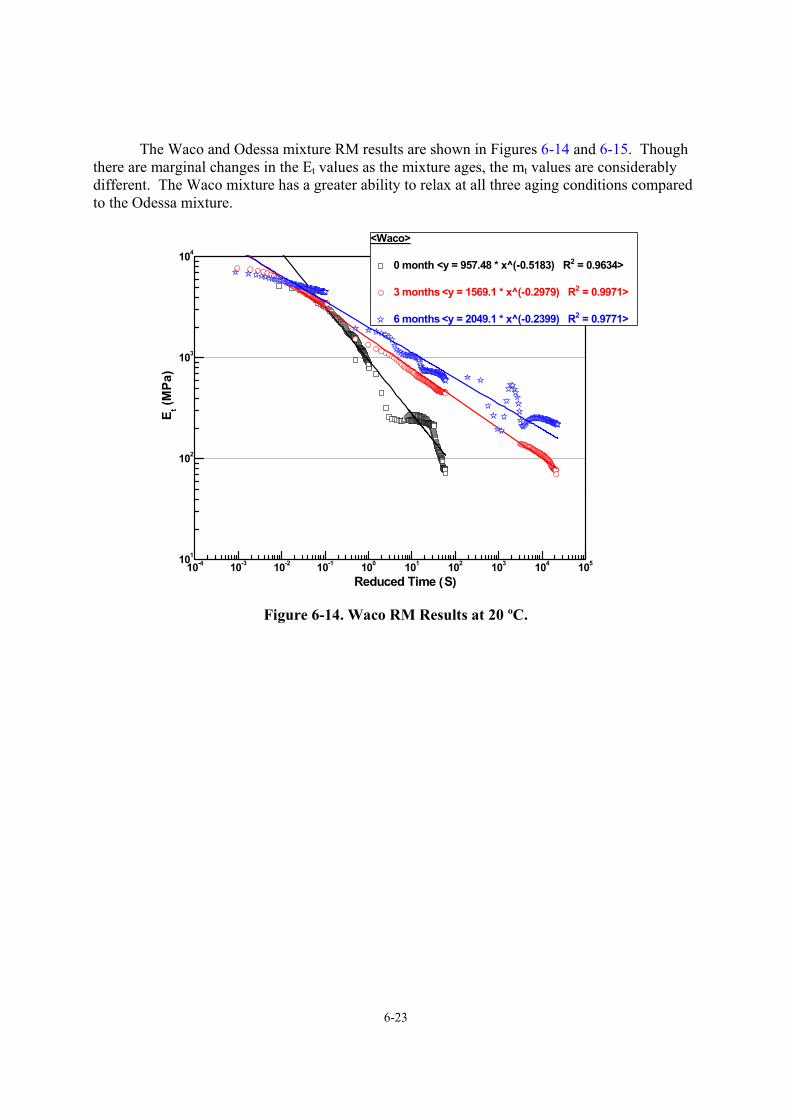
6-23
The Waco and Odessa mixture RM results are shown in Figures 6-14 and 6-15. Though there are marginal changes in the Et values as the mixture ages, the mt values are considerably different. The Waco mixture has a greater ability to relax at all three aging conditions compared to the Odessa mixture.
10-4 10-3 10-2 10-1 100 101 102 103 104 105101
102
103
104
<Waco>
0 month <y = 957.48 * x^(-0.5183) R2 = 0.9634>
3 months <y = 1569.1 * x^(-0.2979) R2 = 0.9971>
6 months <y = 2049.1 * x^(-0.2399) R2 = 0.9771>
E t (MPa
)
Reduced Time (S)
Figure 6-14. Waco RM Results at 20 ºC.
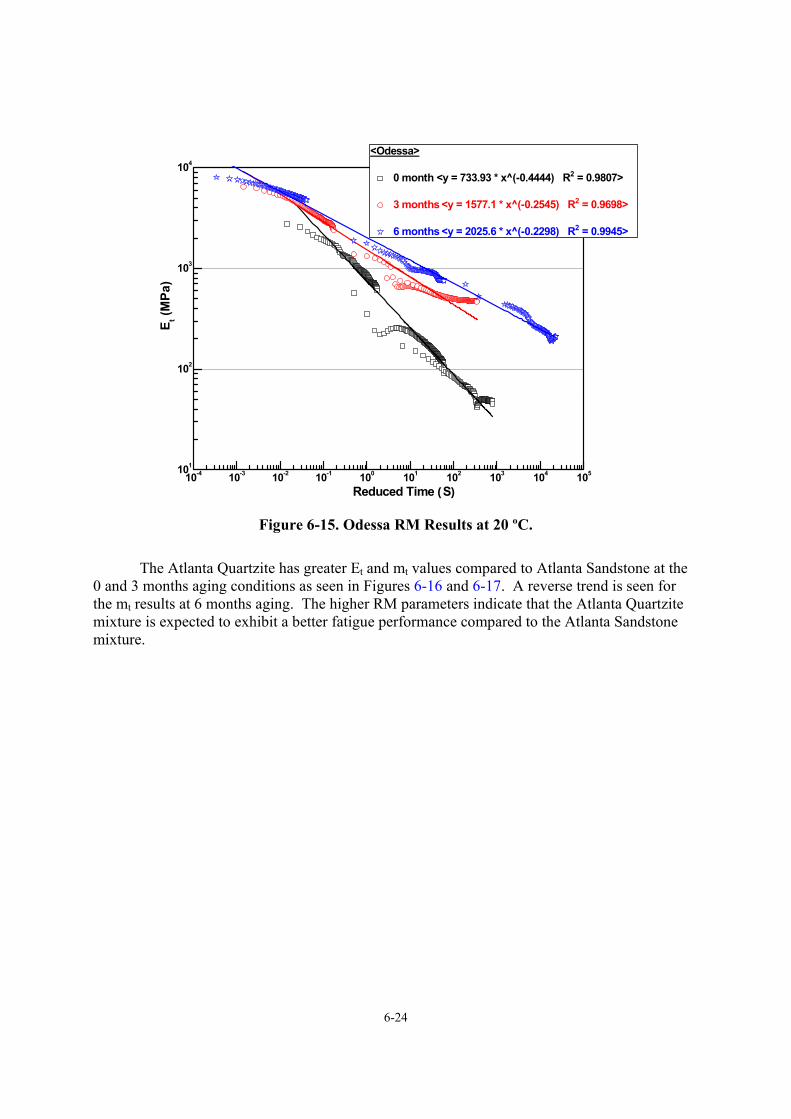
6-24
10-4 10-3 10-2 10-1 100 101 102 103 104 105101
102
103
104
<Odessa>
0 month <y = 733.93 * x^(-0.4444) R2 = 0.9807>
3 months <y = 1577.1 * x^(-0.2545) R2 = 0.9698>
6 months <y = 2025.6 * x^(-0.2298) R2 = 0.9945>
E t (MPa
)
Reduced Time (S)
Figure 6-15. Odessa RM Results at 20 ºC.
The Atlanta Quartzite has greater Et and mt values compared to Atlanta Sandstone at the
0 and 3 months aging conditions as seen in Figures 6-16 and 6-17. A reverse trend is seen for the mt results at 6 months aging. The higher RM parameters indicate that the Atlanta Quartzite mixture is expected to exhibit a better fatigue performance compared to the Atlanta Sandstone mixture.
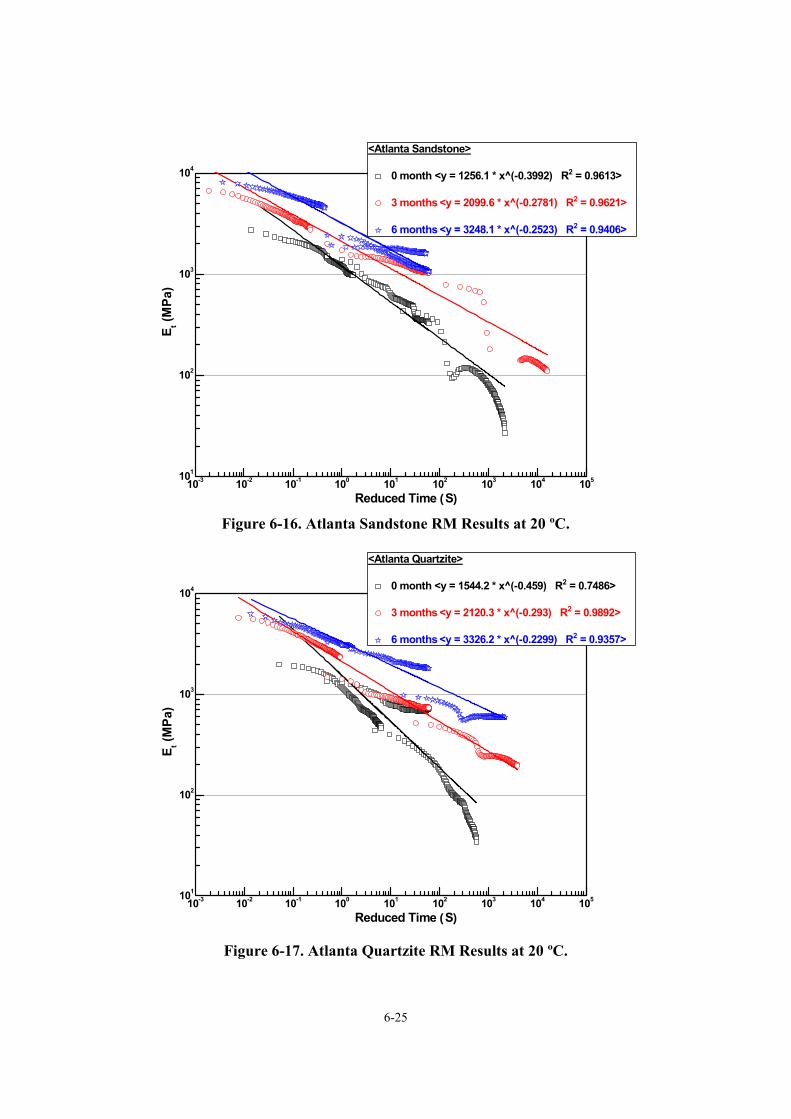
6-25
10-3 10-2 10-1 100 101 102 103 104 105101
102
103
104
<Atlanta Sandstone>
0 month <y = 1256.1 * x^(-0.3992) R2 = 0.9613>
3 months <y = 2099.6 * x^(-0.2781) R2 = 0.9621>
6 months <y = 3248.1 * x^(-0.2523) R2 = 0.9406>
E t (M
Pa)
Reduced Time (S)
Figure 6-16. Atlanta Sandstone RM Results at 20 ºC.
10-3 10-2 10-1 100 101 102 103 104 105101
102
103
104
<Atlanta Quartzite>
0 month <y = 1544.2 * x^(-0.459) R2 = 0.7486>
3 months <y = 2120.3 * x^(-0.293) R2 = 0.9892>
6 months <y = 3326.2 * x^(-0.2299) R2 = 0.9357>
E t (MPa
)
Reduced Time (S)
Figure 6-17. Atlanta Quartzite RM Results at 20 ºC.
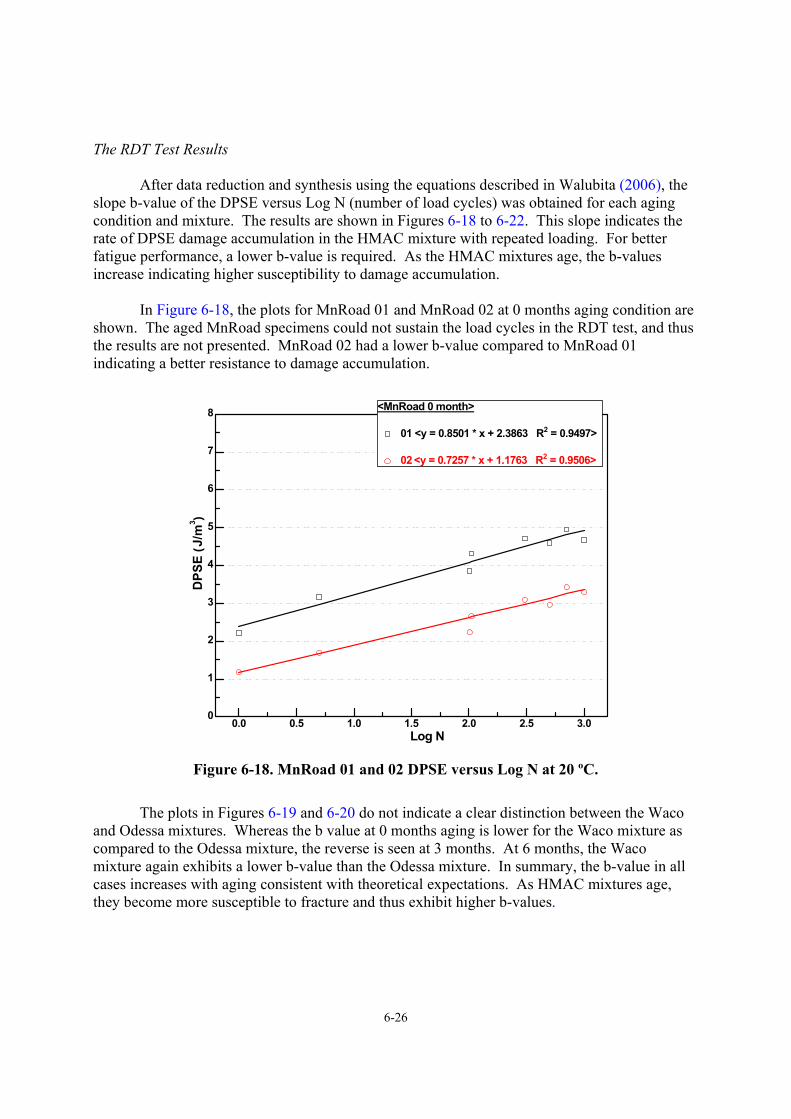
6-26
The RDT Test Results
After data reduction and synthesis using the equations described in Walubita (2006), the slope b-value of the DPSE versus Log N (number of load cycles) was obtained for each aging condition and mixture. The results are shown in Figures 6-18 to 6-22. This slope indicates the rate of DPSE damage accumulation in the HMAC mixture with repeated loading. For better fatigue performance, a lower b-value is required. As the HMAC mixtures age, the b-values increase indicating higher susceptibility to damage accumulation.
In Figure 6-18, the plots for MnRoad 01 and MnRoad 02 at 0 months aging condition are shown. The aged MnRoad specimens could not sustain the load cycles in the RDT test, and thus the results are not presented. MnRoad 02 had a lower b-value compared to MnRoad 01 indicating a better resistance to damage accumulation.
0.0 0.5 1.0 1.5 2.0 2.5 3.00
1
2
3
4
5
6
7
8 <MnRoad 0 month>
01 <y = 0.8501 * x + 2.3863 R2 = 0.9497>
02 <y = 0.7257 * x + 1.1763 R2 = 0.9506>
DPS
E (J
/m3 )
Log N
Figure 6-18. MnRoad 01 and 02 DPSE versus Log N at 20 ºC.
The plots in Figures 6-19 and 6-20 do not indicate a clear distinction between the Waco
and Odessa mixtures. Whereas the b value at 0 months aging is lower for the Waco mixture as compared to the Odessa mixture, the reverse is seen at 3 months. At 6 months, the Waco mixture again exhibits a lower b-value than the Odessa mixture. In summary, the b-value in all cases increases with aging consistent with theoretical expectations. As HMAC mixtures age, they become more susceptible to fracture and thus exhibit higher b-values.
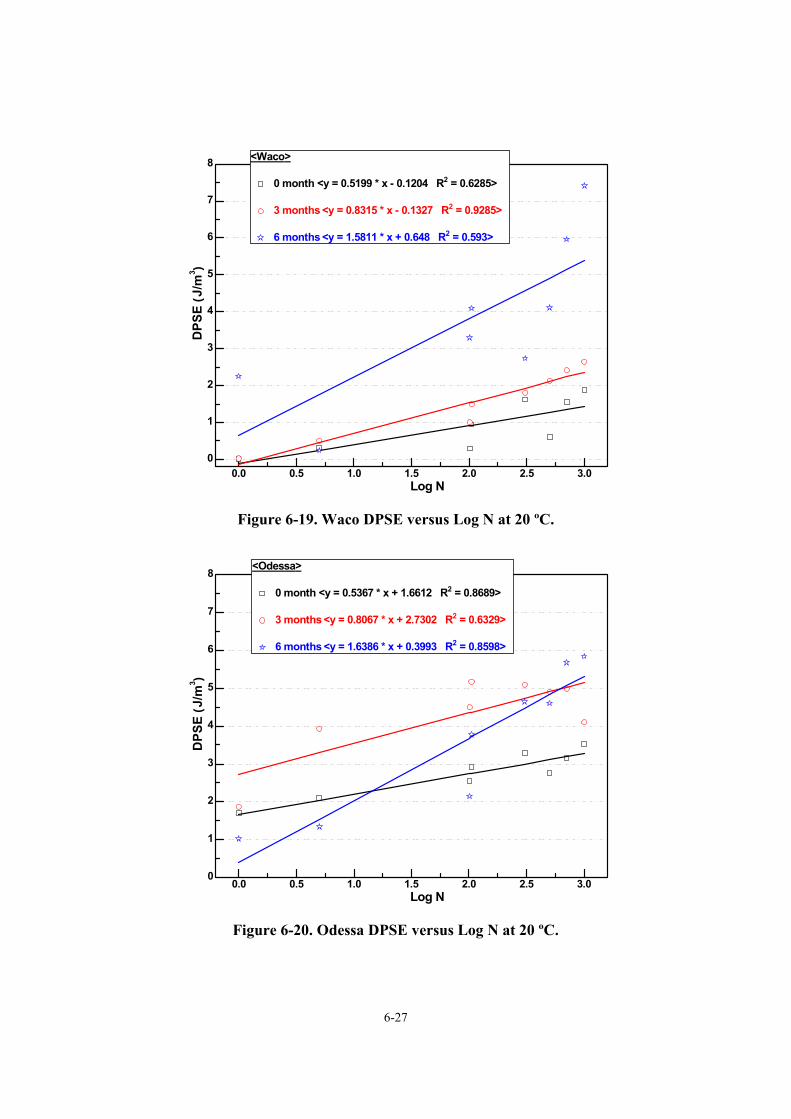
6-27
0.0 0.5 1.0 1.5 2.0 2.5 3.00
1
2
3
4
5
6
7
8 <Waco>
0 month <y = 0.5199 * x - 0.1204 R2 = 0.6285>
3 months <y = 0.8315 * x - 0.1327 R2 = 0.9285>
6 months <y = 1.5811 * x + 0.648 R2 = 0.593>
DPS
E (J
/m3 )
Log N
Figure 6-19. Waco DPSE versus Log N at 20 ºC.
0.0 0.5 1.0 1.5 2.0 2.5 3.00
1
2
3
4
5
6
7
8 <Odessa>
0 month <y = 0.5367 * x + 1.6612 R2 = 0.8689>
3 months <y = 0.8067 * x + 2.7302 R2 = 0.6329>
6 months <y = 1.6386 * x + 0.3993 R2 = 0.8598>
DPS
E (J
/m3 )
Log N
Figure 6-20. Odessa DPSE versus Log N at 20 ºC.
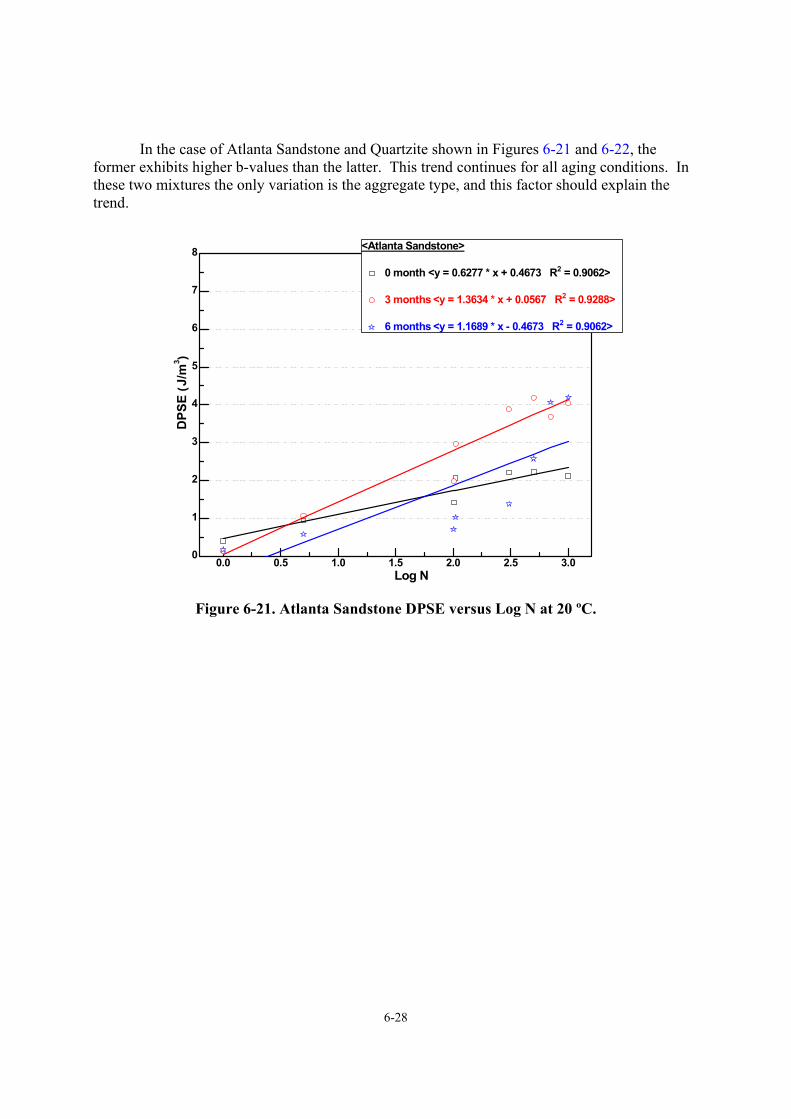
6-28
In the case of Atlanta Sandstone and Quartzite shown in Figures 6-21 and 6-22, the former exhibits higher b-values than the latter. This trend continues for all aging conditions. In these two mixtures the only variation is the aggregate type, and this factor should explain the trend.
0.0 0.5 1.0 1.5 2.0 2.5 3.00
1
2
3
4
5
6
7
8 <Atlanta Sandstone>
0 month <y = 0.6277 * x + 0.4673 R2 = 0.9062>
3 months <y = 1.3634 * x + 0.0567 R2 = 0.9288>
6 months <y = 1.1689 * x - 0.4673 R2 = 0.9062>
DPS
E (J
/m3 )
Log N
Figure 6-21. Atlanta Sandstone DPSE versus Log N at 20 ºC.
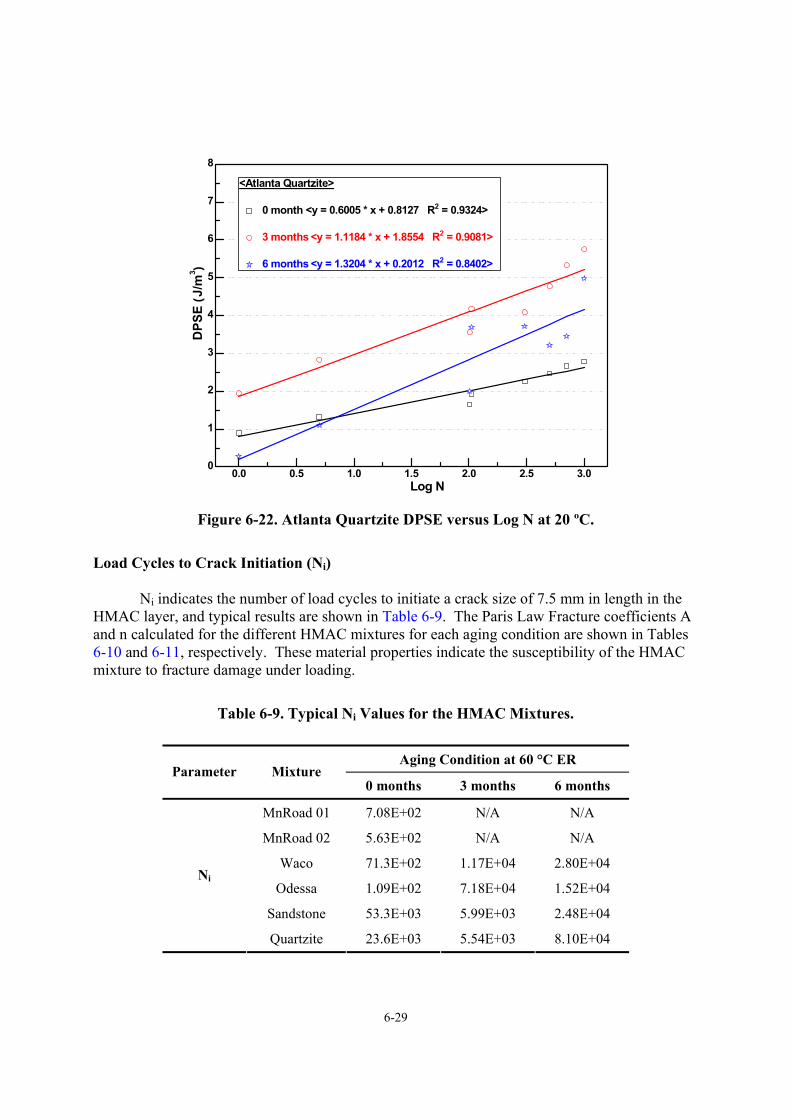
6-29
0.0 0.5 1.0 1.5 2.0 2.5 3.00
1
2
3
4
5
6
7
8
<Atlanta Quartzite>
0 month <y = 0.6005 * x + 0.8127 R2 = 0.9324>
3 months <y = 1.1184 * x + 1.8554 R2 = 0.9081>
6 months <y = 1.3204 * x + 0.2012 R2 = 0.8402>
DPS
E (J
/m3 )
Log N
Figure 6-22. Atlanta Quartzite DPSE versus Log N at 20 ºC.
Load Cycles to Crack Initiation (Ni)
Ni indicates the number of load cycles to initiate a crack size of 7.5 mm in length in the HMAC layer, and typical results are shown in Table 6-9. The Paris Law Fracture coefficients A and n calculated for the different HMAC mixtures for each aging condition are shown in Tables 6-10 and 6-11, respectively. These material properties indicate the susceptibility of the HMAC mixture to fracture damage under loading.
Table 6-9. Typical Ni Values for the HMAC Mixtures.
Aging Condition at 60 °C ER Parameter Mixture
0 months 3 months 6 months
MnRoad 01 7.08E+02 N/A N/A
MnRoad 02 5.63E+02 N/A N/A
Waco 71.3E+02 1.17E+04 2.80E+04
Odessa 1.09E+02 7.18E+04 1.52E+04
Sandstone 53.3E+03 5.99E+03 2.48E+04
Ni
Quartzite 23.6E+03 5.54E+03 8.10E+04
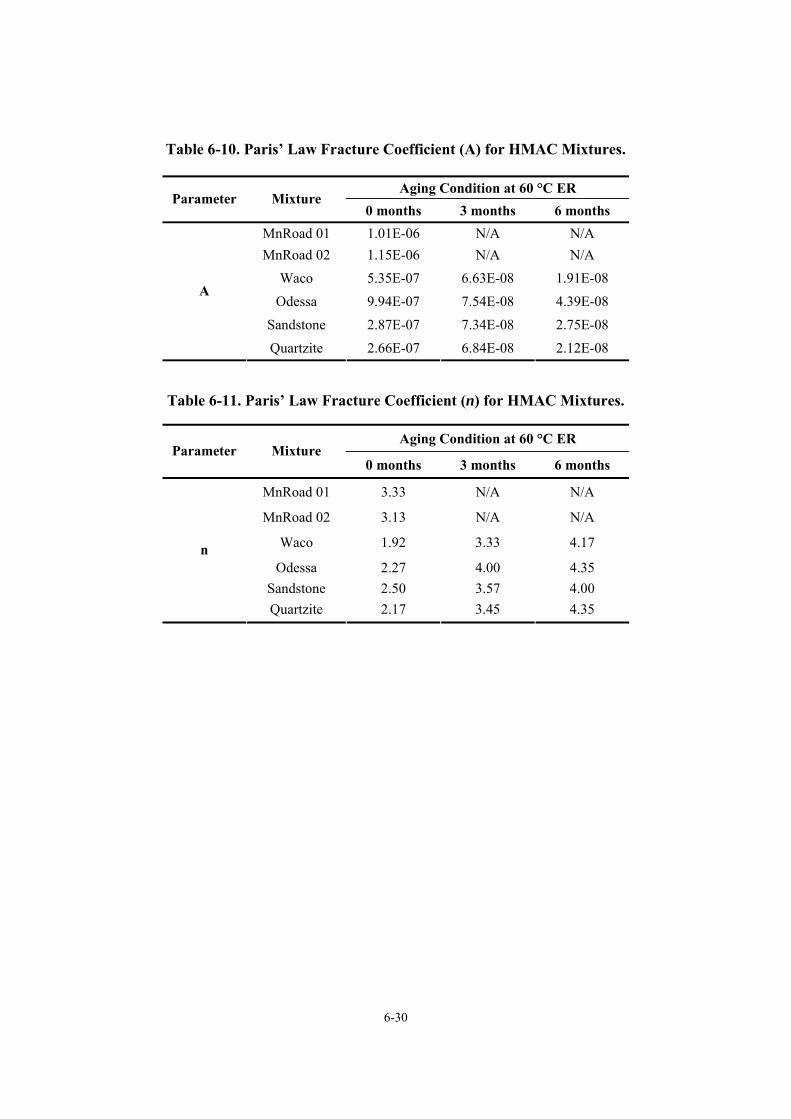
6-30
Table 6-10. Paris’ Law Fracture Coefficient (A) for HMAC Mixtures. Aging Condition at 60 °C ER
Parameter Mixture 0 months 3 months 6 months
MnRoad 01 1.01E-06 N/A N/A MnRoad 02 1.15E-06 N/A N/A
Waco 5.35E-07 6.63E-08 1.91E-08
Odessa 9.94E-07 7.54E-08 4.39E-08
Sandstone 2.87E-07 7.34E-08 2.75E-08
A
Quartzite 2.66E-07 6.84E-08 2.12E-08
Table 6-11. Paris’ Law Fracture Coefficient (n) for HMAC Mixtures.
Aging Condition at 60 °C ER Parameter Mixture
0 months 3 months 6 months
MnRoad 01 3.33 N/A N/A
MnRoad 02 3.13 N/A N/A
Waco 1.92 3.33 4.17
Odessa 2.27 4.00 4.35 Sandstone 2.50 3.57 4.00
n
Quartzite 2.17 3.45 4.35
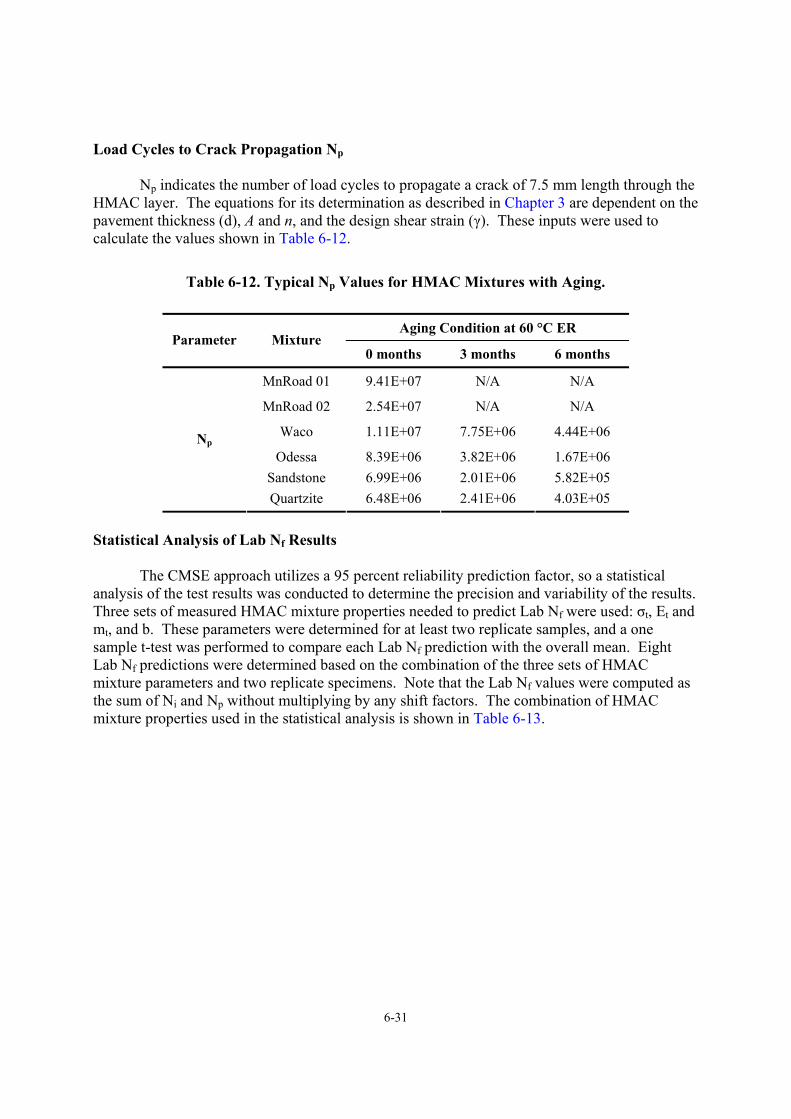
6-31
Load Cycles to Crack Propagation Np
Np indicates the number of load cycles to propagate a crack of 7.5 mm length through the HMAC layer. The equations for its determination as described in Chapter 3 are dependent on the pavement thickness (d), A and n, and the design shear strain (γ). These inputs were used to calculate the values shown in Table 6-12.
Table 6-12. Typical Np Values for HMAC Mixtures with Aging.
Aging Condition at 60 °C ER Parameter Mixture
0 months 3 months 6 months
MnRoad 01 9.41E+07 N/A N/A
MnRoad 02 2.54E+07 N/A N/A
Waco 1.11E+07 7.75E+06 4.44E+06
Odessa 8.39E+06 3.82E+06 1.67E+06 Sandstone 6.99E+06 2.01E+06 5.82E+05
Np
Quartzite 6.48E+06 2.41E+06 4.03E+05
Statistical Analysis of Lab Nf Results
The CMSE approach utilizes a 95 percent reliability prediction factor, so a statistical analysis of the test results was conducted to determine the precision and variability of the results. Three sets of measured HMAC mixture properties needed to predict Lab Nf were used: σt, Et and mt, and b. These parameters were determined for at least two replicate samples, and a one sample t-test was performed to compare each Lab Nf prediction with the overall mean. Eight Lab Nf predictions were determined based on the combination of the three sets of HMAC mixture parameters and two replicate specimens. Note that the Lab Nf values were computed as the sum of Ni and Np without multiplying by any shift factors. The combination of HMAC mixture properties used in the statistical analysis is shown in Table 6-13.
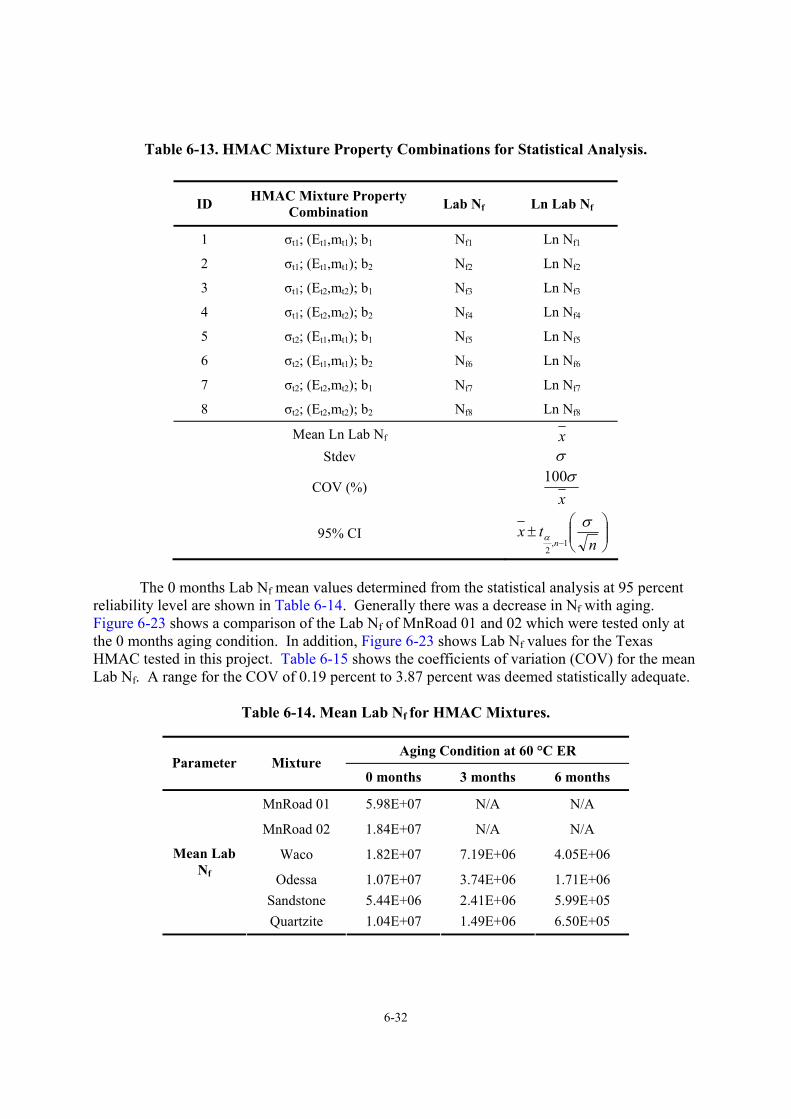
6-32
Table 6-13. HMAC Mixture Property Combinations for Statistical Analysis.
ID HMAC Mixture Property Combination Lab Nf Ln Lab Nf
1 σt1; (Et1,mt1); b1 Nf1 Ln Nf1
2 σt1; (Et1,mt1); b2 Nf2 Ln Nf2
3 σt1; (Et2,mt2); b1 Nf3 Ln Nf3
4 σt1; (Et2,mt2); b2 Nf4 Ln Nf4
5 σt2; (Et1,mt1); b1 Nf5 Ln Nf5
6 σt2; (Et1,mt1); b2 Nf6 Ln Nf6
7 σt2; (Et2,mt2); b1 Nf7 Ln Nf7
8 σt2; (Et2,mt2); b2 Nf8 Ln Nf8
Mean Ln Lab Nf x Stdev σ
COV (%) xσ100
95% CI ⎟⎟⎠
⎞⎜⎜⎝
⎛±
− ntx
n
σα 1,2
The 0 months Lab Nf mean values determined from the statistical analysis at 95 percent
reliability level are shown in Table 6-14. Generally there was a decrease in Nf with aging. Figure 6-23 shows a comparison of the Lab Nf of MnRoad 01 and 02 which were tested only at the 0 months aging condition. In addition, Figure 6-23 shows Lab Nf values for the Texas HMAC tested in this project. Table 6-15 shows the coefficients of variation (COV) for the mean Lab Nf. A range for the COV of 0.19 percent to 3.87 percent was deemed statistically adequate.
Table 6-14. Mean Lab Nf for HMAC Mixtures.
Aging Condition at 60 °C ER Parameter Mixture
0 months 3 months 6 months
MnRoad 01 5.98E+07 N/A N/A
MnRoad 02 1.84E+07 N/A N/A
Waco 1.82E+07 7.19E+06 4.05E+06
Odessa 1.07E+07 3.74E+06 1.71E+06 Sandstone 5.44E+06 2.41E+06 5.99E+05
Mean Lab Nf
Quartzite 1.04E+07 1.49E+06 6.50E+05
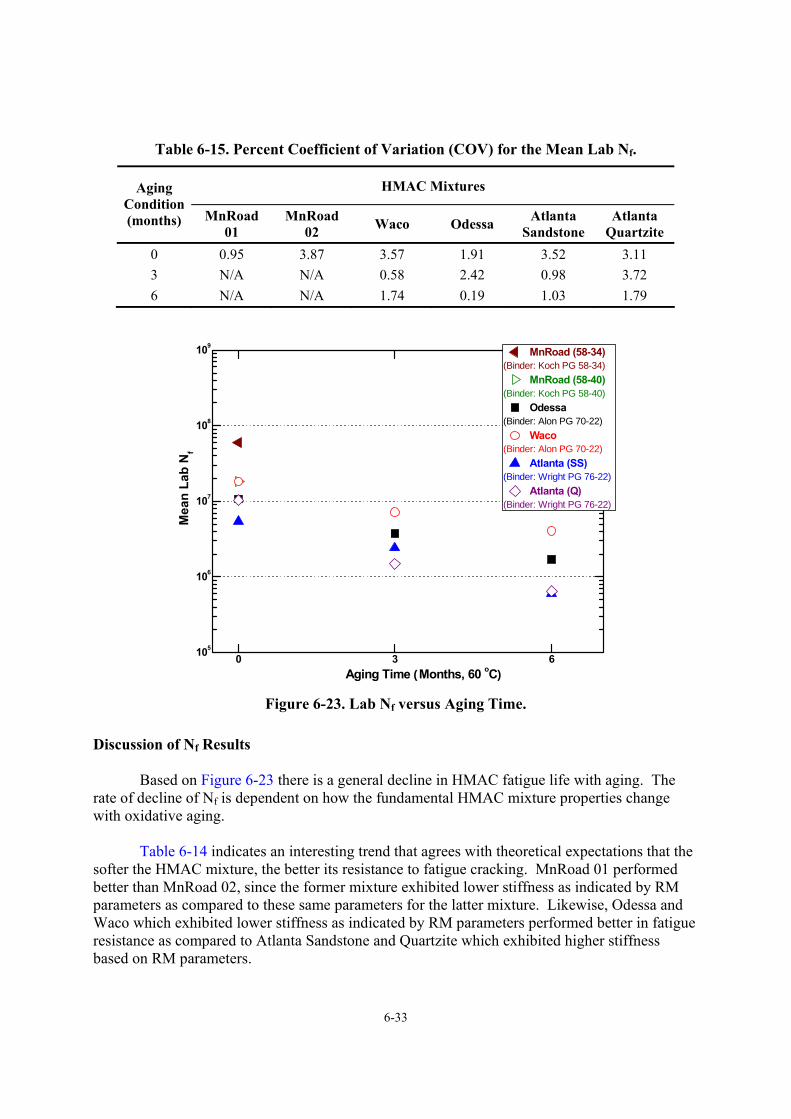
6-33
Table 6-15. Percent Coefficient of Variation (COV) for the Mean Lab Nf.
HMAC Mixtures Aging Condition (months) MnRoad
01 MnRoad
02 Waco Odessa Atlanta Sandstone
Atlanta Quartzite
0 0.95 3.87 3.57 1.91 3.52 3.11 3 N/A N/A 0.58 2.42 0.98 3.72 6 N/A N/A 1.74 0.19 1.03 1.79
0 3 6105
106
107
108
109 MnRoad (58-34)
(Binder: Koch PG 58-34) MnRoad (58-40)
(Binder: Koch PG 58-40) Odessa
(Binder: Alon PG 70-22) Waco
(Binder: Alon PG 70-22) Atlanta (SS)
(Binder: Wright PG 76-22) Atlanta (Q)
(Binder: Wright PG 76-22)
Mea
n La
b N
f
Aging Time (Months, 60 oC) Figure 6-23. Lab Nf versus Aging Time.
Discussion of Nf Results
Based on Figure 6-23 there is a general decline in HMAC fatigue life with aging. The rate of decline of Nf is dependent on how the fundamental HMAC mixture properties change with oxidative aging.
Table 6-14 indicates an interesting trend that agrees with theoretical expectations that the softer the HMAC mixture, the better its resistance to fatigue cracking. MnRoad 01 performed better than MnRoad 02, since the former mixture exhibited lower stiffness as indicated by RM parameters as compared to these same parameters for the latter mixture. Likewise, Odessa and Waco which exhibited lower stiffness as indicated by RM parameters performed better in fatigue resistance as compared to Atlanta Sandstone and Quartzite which exhibited higher stiffness based on RM parameters.
6-34
The Waco HMAC mixture performed better in fatigue resistance compared to the Odessa mixture. The reasons for this difference in performance can be attributed to many variables including asphalt binder content, asphalt film thickness, aggregate structure, stiffness indicated by RM parameters, and the accumulation of DPSE. Based on laboratory observation the Odessa HMAC mixture with a higher asphalt content contained thicker asphalt films, but theoretically higher asphalt contents should produce thicker asphalt films and consequently greater resistance to oxidative aging and susceptibility to cracking, assuming the surface area of the aggregates remains constant. In this case, this trend was not observed. A reasonable explanation for the greater resistance to fatigue cracking exhibited by the Waco HMAC mixture despite its lower asphalt content and relatively thin asphalt films, therefore, can be attributed to its higher adhesive bond energies compared to the Odessa HMAC mixture, implying that the aggregate had greater affinity and compatibility with the PG 70-22 binder. This may also have been the reason for the corresponding higher fundamental material properties of the Waco HMAC mixture compared to the Odessa HMAC mixture. The steeper decline of fatigue resistance of the Odessa HMAC mixture indicates a greater susceptibility to oxidative aging that leads to brittleness and eventual cracking.
A consistent trend was not observed between the results obtained from the Atlanta Sandstone and Quartzite mixtures. At 0 and 6 months aging conditions, the Atlanta Quartzite mixture exhibited a higher fatigue resistance compared to the Atlanta Sandstone mixture, and a reverse trend was observed at the 3 months aging condition. The rates of Nf decline were also not significantly different. Further discussion of the decline of fatigue life with aging and its impact on pavement durability is presented in Chapter 7.
SUMMARY
The following points summarize the major findings in this chapter:
• The statistical variability obtained in the determination of Lab Nf was deemed acceptable. The Atlanta Quartzite HMAC mixture exhibited the least COV (1.7 percent to 3.11 percent mixture), whereas the highest COV (1.03 percent to 3.52 percent) was seen in the Atlanta Sandstone HMAC mixture.
• A general exponential decline of Nf with aging was observed in the Texas mixtures. Waco was deemed to be the best HMAC since the Nf value after 20 years of aging exposure was still greater than the design 5 million ESALS.
The CMSE approach which utilizes fundamental material properties such as tensile strength σt, relaxation modulus E1, stress relaxation rate mt, the rate of DPSE damage accumulation as indicated by the b-value and the adhesive fracture and healing bond strengths of the asphalt-aggregate mixture ∆Gf, ∆Gh
LW, and ∆GhAB was found to be an effective approach to
determine fatigue resistance of HMAC. The results obtained in this project compared to those obtained in a previous study by Walubita (2006).
The CMSE approach utilizes test protocols, which represent actual field HMAC conditions including anisotropy, healing, crack initiation, crack propagation and the effects of

6-35
binder oxidative aging. The approach validated the theoretical concept of HMAC fatigue life decline with oxidative aging.
The CMSE approach was utilized to evaluate and compare the fatigue resistance of selected HMAC mixtures. The Waco mixture which used a Superpave_19mm aggregate structure with a PG 70-22 asphalt binder performed better in terms of fatigue resistance compared to the Odessa mixture which used a CMHB_F aggregate structure. The asphalt content of 7.3 percent in the Odessa mixture ensured thicker film thicknesses on the aggregates compared to the 5.3 percent asphalt content in the Waco mixture. This ensured that the Odessa mixture had higher failure strains in all aging conditions compared to the Waco mixture.
Based on the mixtures evaluated in this project the softer the HMAC mixture as indicated by RM parameters, the better the HMAC mixture performs in terms of fatigue resistance.

7-1
CHAPTER 7
THE IMPACT OF MIXTURE VERSUS NEAT-FILM BINDER AGING ON MIXTURE FATIGUE
INTRODUCTION
Asphalt binder oxidation is one of the major contributors to age-related pavement failure, including fatigue cracking. However, its impact has been underestimated or ignored in most hot mix asphalt concrete (HMAC) studies of fatigue failure in asphalt pavements.
An HMAC mixture is a heterogeneous complex composite material composed of air
voids, aggregates, and asphalt binder. The physico-chemical properties of binders are changed greatly by binder oxidation. A recent study showed that binder oxidation can significantly affect binder hardening and embrittlement at least 6 inches below the surface of asphalt pavements (Al-Azri et al., 2006). In fact, hardening rates over the 2 inch layer that was 4 inches below the surface were found to be surprisingly close to those measured over the top 2 inches of the sampled cores. The findings led to an important conclusion: the effects of binder oxidation are not limited to the asphalt pavement surface but penetrate the HMAC layer, making it stiffer and more brittle.
Previous studies (Clark, 1958; Doyle, 1958; Halstead, 1985; Kandhal, 1977; Kandhal and
Koehler, 1984) point out that pavement long term durability relates to asphalt binder ductility. Then Ruan et al. (2003c) found a good correlation between the DSR function G'/(η'/G') and ductility below ductilities of 10 cm. They found that binder long-term durability is not related to just a single rheological property, dynamic elastic shear modulus G', e.g., or the dynamic shear viscosity η', but rather to both of them in the form of G' and η'/G'. The DSR function quantifies binder durability changes due to binder oxidative hardening, and the DSR function map (G' versus η'/G') provides a convenient tool for tracking durability changes of binders in neat aged binders, HMAC mixtures, and pavements.
The detrimental impact of oxidation on binder durability almost certainly should be
included in asphalt pavement fatigue analysis, together with repeated traffic loading, but supporting data are non-existent. This chapter focuses on how binder oxidation affects binder properties in HMAC mixtures, and as a consequence how HMAC mixture fatigue life changes with oxidation.
While extensive studies of asphalt pavement fatigue performance have been conducted,
successful characterization of HMAC mixtures to ensure adequate fatigue performance is not well established, and fundamental fatigue predictive models still remain to be developed. The conventional way of measuring asphalt pavement fatigue life is testing laboratory HMAC mixtures and then applying a shift factor, which relates laboratory conditions to field conditions.
In this project, the calibrated mechanistic with surface energy fatigue approach was
utilized to measure laboratory HMAC fatigue life cycles under strain-controlled conditions and subsequently estimate field fatigue life. The CMSE fatigue analysis model uses fundamental
7-2
theories (the visco-elastic correspondence principle, Paris' Law fracture mechanics, Schapery’s work potential theory and energy concepts) to characterize HMAC mixture fatigue resistance (Kim et al., 1997a and 1997b; Schapery, 1984; Si, 2001). This approach was applied in this project and was used to estimate the impact of binder oxidation on the field fatigue performance because of its ability to measure fundamental material properties such as asphalt mixture tensile strength, stiffness, relaxation modulus in tension and compression, dissipated pseudo strain energy and surface energy for binder and aggregates to characterize HMAC mixture fatigue resistance (Lytton et al., 1993). RESEARCH OBJECTIVES
This research investigated the impact of binder oxidation on HMAC mixtures and their laboratory fatigue resistance measured under strain-controlled conditions. The objectives of the study were 1) to compare neat-film binder aging to laboratory compacted mixture binder aging, 2) to determine the effect of oxidative binder aging on controlled-strain HMAC mixture fatigue resistance, and 3) to investigate the effect of different binders and their contents in HMAC mixtures on their fatigue properties.
A further word about fatigue in pavements and the role of binder oxidation is appropriate.
It is commonly believed that stiffening the pavement by oxidation of the binder can increase pavement resistance to fatigue. The concept is that the stiffer pavement undergoes less deformation under a given load, and thus fatigue is reduced. This belief would seem to be predicated on mixture properties (specifically fatigue life) remaining unchanged by binder oxidation so that laboratory mixtures prepared by AASHTO PP2 aging procedures, for example, accurately reflect mixture fatigue behavior for the entire life of the pavement. In this context, TxDOT technical report 0-4468-3 provided an initial study of the impact of binder oxidation on mixture fatigue. The objective of this paper was to provide similar data on additional mixtures. This study used controlled-strain testing to both characterize mixtures non-destructively and to evaluate mixtures resistance to damage. That binders oxidize significantly in pavements, and to some depth below the immediate surface, has been demonstrated in the literature (Al-Azri et al., 2006) and this work addresses the question of how such aging impacts mixture fatigue in a way that is not currently included in pavement design. METHODOLOGY Materials
This section describes materials, aging processes, binder and mixture tests, and the CMSE fatigue approach. The materials were neat binders aged in thin films, binders recovered from aged HMAC mixtures, and seven different types of HMAC mixtures.
Binders
Four different binders were used in this project: styrene-butadiene-styrene polymer
modified binders such as PG 58-34, 58-40, 70-22, and 76-22. Aged neat binders as well as recovered binders from aged HMAC mixtures were used to compare neat binder aging with
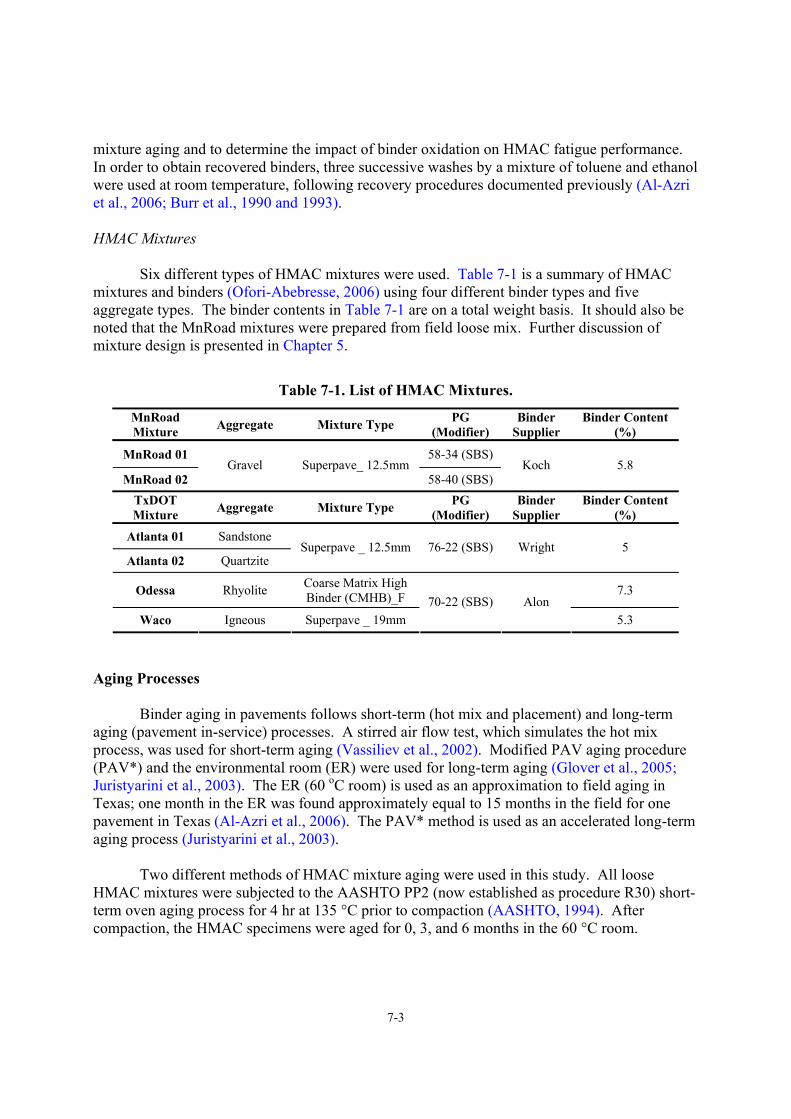
7-3
mixture aging and to determine the impact of binder oxidation on HMAC fatigue performance. In order to obtain recovered binders, three successive washes by a mixture of toluene and ethanol were used at room temperature, following recovery procedures documented previously (Al-Azri et al., 2006; Burr et al., 1990 and 1993). HMAC Mixtures
Six different types of HMAC mixtures were used. Table 7-1 is a summary of HMAC mixtures and binders (Ofori-Abebresse, 2006) using four different binder types and five aggregate types. The binder contents in Table 7-1 are on a total weight basis. It should also be noted that the MnRoad mixtures were prepared from field loose mix. Further discussion of mixture design is presented in Chapter 5.
Table 7-1. List of HMAC Mixtures.
MnRoad Mixture Aggregate Mixture Type PG
(Modifier) Binder
Supplier Binder Content
(%)
MnRoad 01 58-34 (SBS)
MnRoad 02 Gravel Superpave_ 12.5mm
58-40 (SBS) Koch 5.8
TxDOT Mixture Aggregate Mixture Type PG
(Modifier) Binder
Supplier Binder Content
(%)
Atlanta 01 Sandstone
Atlanta 02 Quartzite Superpave _ 12.5mm 76-22 (SBS) Wright 5
Odessa Rhyolite Coarse Matrix High Binder (CMHB)_F 7.3
Waco Igneous Superpave _ 19mm 70-22 (SBS) Alon
5.3
Aging Processes
Binder aging in pavements follows short-term (hot mix and placement) and long-term
aging (pavement in-service) processes. A stirred air flow test, which simulates the hot mix process, was used for short-term aging (Vassiliev et al., 2002). Modified PAV aging procedure (PAV*) and the environmental room (ER) were used for long-term aging (Glover et al., 2005; Juristyarini et al., 2003). The ER (60 oC room) is used as an approximation to field aging in Texas; one month in the ER was found approximately equal to 15 months in the field for one pavement in Texas (Al-Azri et al., 2006). The PAV* method is used as an accelerated long-term aging process (Juristyarini et al., 2003).
Two different methods of HMAC mixture aging were used in this study. All loose
HMAC mixtures were subjected to the AASHTO PP2 (now established as procedure R30) short-term oven aging process for 4 hr at 135 °C prior to compaction (AASHTO, 1994). After compaction, the HMAC specimens were aged for 0, 3, and 6 months in the 60 °C room.
7-4
Test Methods HMAC Mixture Tests
Mixture tests for the CMSE approach used the Whilhelmy plate (WP), the universal sorption device (USD), and other instruments to determine tensile strength (TS), uniaxial relaxation modulus (RM), and dissipated pseudo strain energy (DPSE). Details of the CMSE approach and associated laboratory tests are documented elsewhere (Lytton et al., 1993; Walubita, 2006b).
For each test type, at least two replicate HMAC specimens were tested per aging
condition per mixture type. For simplicity and because HMAC fatigue cracking is generally more prevalent at intermediate pavement service temperatures, most of the laboratory tests were conducted at 20 °C. Otherwise, the data were normalized to a reference temperature of 20 °C using a time temperature superposition shift during the analysis.
Output data from these laboratory tests served as input data for predicting the fatigue life
(Lytton et al., 1993; Si, 2001). Fatigue failure for the CMSE approach was defined as crack initiation and propagation through the HMAC layer thickness with a 7.5 mm microcrack length as the selected failure threshold value based on the work by Lytton et al. (1993). Field Condition
For hypothetical field conditions, a standard TxDOT pavement structure consisting of 150 mm HMAC (3,447 MPa, Poisson’s ratio (ν) = 0.33), 350 mm flex (granular) base (194 MPa, ν = 0.40), and a subgrade with an elastic modulus of 63 MPa (ν = 0.45) was utilized. Typical traffic conditions consisted of an 80 kN axle load, 690 kPa tire pressure, and 5 million equivalent single axle loads (ESALs) over a design life of 20 years and a 95 % reliability level in a Wet-Warm (WW) Texas environment considered critical to HMAC pavement fatigue performance (TxDOT, 2003; Huang, 1993). Shear strains (γ) which constitute the input failure load-response parameters for the CMSE fatigue analysis approach were computed using an elastic multi-layered ELSYM5 software (Walubita, 2006). Binder Tests
Binder tests included: gel permeation chromatography, also called size exclusion chromatography, using a refractive index (RI) detector to ensure complete solvent removal in the binder recovery process and dynamic shear rheometry to measure the rheological properties of the binder (Al-Azri et al., 2006).
Complex viscosity (η*) at 60 °C and 0.1 rad/s, storage modulus (G') and dynamic viscosity (η') at 44.7 °C and 10 rad/s of asphalt materials were measured using a Carri-Med CSL 500 Controlled Stress Rheometer.
7-5
RESULTS AND DISCUSSION
The main goal of this project was to investigate the impact of binder oxidation on HMAC mixture fatigue performance. Binder rheology was used to determine: 1) DSR function hardening rates and 2) DSR function map of G' versus η'/G'. Mixture measurements, at the same levels of oxidation, were obtained for CMSE estimates of fatigue for the different mixtures. Mixture versus Neat-Film Binder Oxidation and Hardening
As noted earlier, mixtures were prepared using the PP2 short-term aging protocol and then compacted to produce one aging level (PP2 + 0 month). Second and third levels were obtained by aging the compacted laboratory specimens in the ER for 3 and 6 months beyond PP2 conditioning (PP2 + 3 months and PP2 + 6 months). Here, the “0 month,” “3 months,” and “6 months” refer to environmental room aging beyond PP2 aging.
The binders were extracted and recovered from their laboratory prepared specimens at
several levels of aging and evaluated. SEC was used to check whether solvent residue existed in the binder. If solvent residue were present, it would significantly affect the rheological properties. After the recovered binders were tested, they were prepared in approximately 1 mm thick films for further aging, in the 60 °C environmental room. This aging of the recovered binder is critically important to obtaining binder aging and hardening characteristics of the pavement materials.
Neat binders were aged in a HMAC simulation, the stirred air-flow test to give one level
of aging (designated SAFT). Then these binders were further aged in the 60 °C ER in thin films (approximately 1 mm thick) for 3, 6, 9 and 12 months to obtain second, third, and fourth aging levels (SAFT + 3 months, SAFT + 6 months and SAFT + 9 months).
The aged binders were characterized by DSR. Oxidative aging increases the DSR
function (G'/(η'/G')) for both neat binders and mixture-aged binders. While there is a difference between neat binder and mixture aging rates due to diffusion resistance in the mixture, binder oxidation in the mixture still is significant and results in binder hardening and binder ductility decreases.
The following sections present the impact of binder oxidation on the neat binders and the
HMAC mixtures. DSR Function Hardening Comparison
The DSR function (G'/(η'/G')) has been found to be a binder hardening parameter that relates well to ductility (Al-Azri et al., 2006; Ruan et al., 2003c). The DSR function hardening rate kinetics parallel the oxidation rate kinetics, with each characterized by an early-time initial jump period that is rapid, but decelerating and followed by a slower constant-rate aging period (Juristyarini et al., 2003).
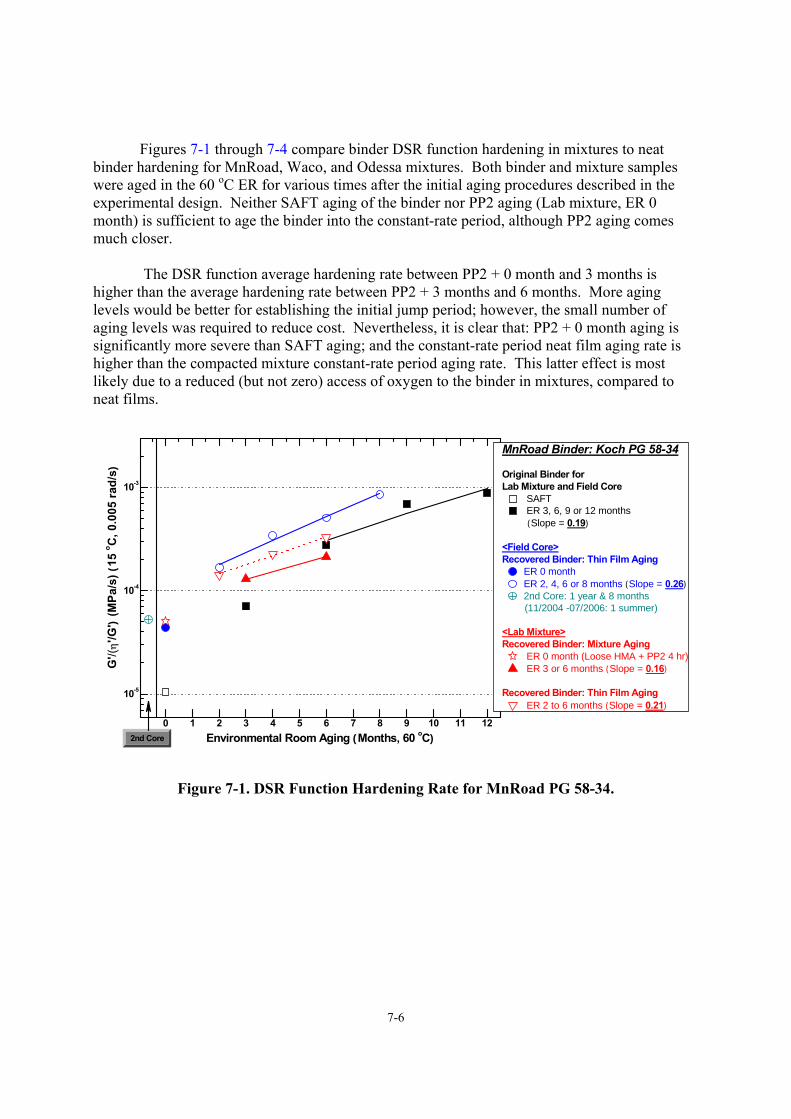
7-6
Figures 7-1 through 7-4 compare binder DSR function hardening in mixtures to neat binder hardening for MnRoad, Waco, and Odessa mixtures. Both binder and mixture samples were aged in the 60 oC ER for various times after the initial aging procedures described in the experimental design. Neither SAFT aging of the binder nor PP2 aging (Lab mixture, ER 0 month) is sufficient to age the binder into the constant-rate period, although PP2 aging comes much closer.
The DSR function average hardening rate between PP2 + 0 month and 3 months is
higher than the average hardening rate between PP2 + 3 months and 6 months. More aging levels would be better for establishing the initial jump period; however, the small number of aging levels was required to reduce cost. Nevertheless, it is clear that: PP2 + 0 month aging is significantly more severe than SAFT aging; and the constant-rate period neat film aging rate is higher than the compacted mixture constant-rate period aging rate. This latter effect is most likely due to a reduced (but not zero) access of oxygen to the binder in mixtures, compared to neat films.
0 1 2 3 4 5 6 7 8 9 10 11 12
10-5
10-4
10-3
Environmental Room Aging (Months, 60 oC)
MnRoad Binder: Koch PG 58-34
Original Binder for Lab Mixture and Field Core
SAFT ER 3, 6, 9 or 12 months
(Slope = 0.19)
<Field Core>Recovered Binder: Thin Film Aging
ER 0 monthER 2, 4, 6 or 8 months (Slope = 0.26)2nd Core: 1 year & 8 months
(11/2004 -07/2006: 1 summer)
<Lab Mixture>Recovered Binder: Mixture Aging
ER 0 month (Loose HMA + PP2 4 hr) ER 3 or 6 months (Slope = 0.16)
Recovered Binder: Thin Film Aging ER 2 to 6 months (Slope = 0.21)
G'/(
η'/G
') (M
Pa/s
) (15
o C, 0
.005
rad/
s)
2nd Core
Figure 7-1. DSR Function Hardening Rate for MnRoad PG 58-34.
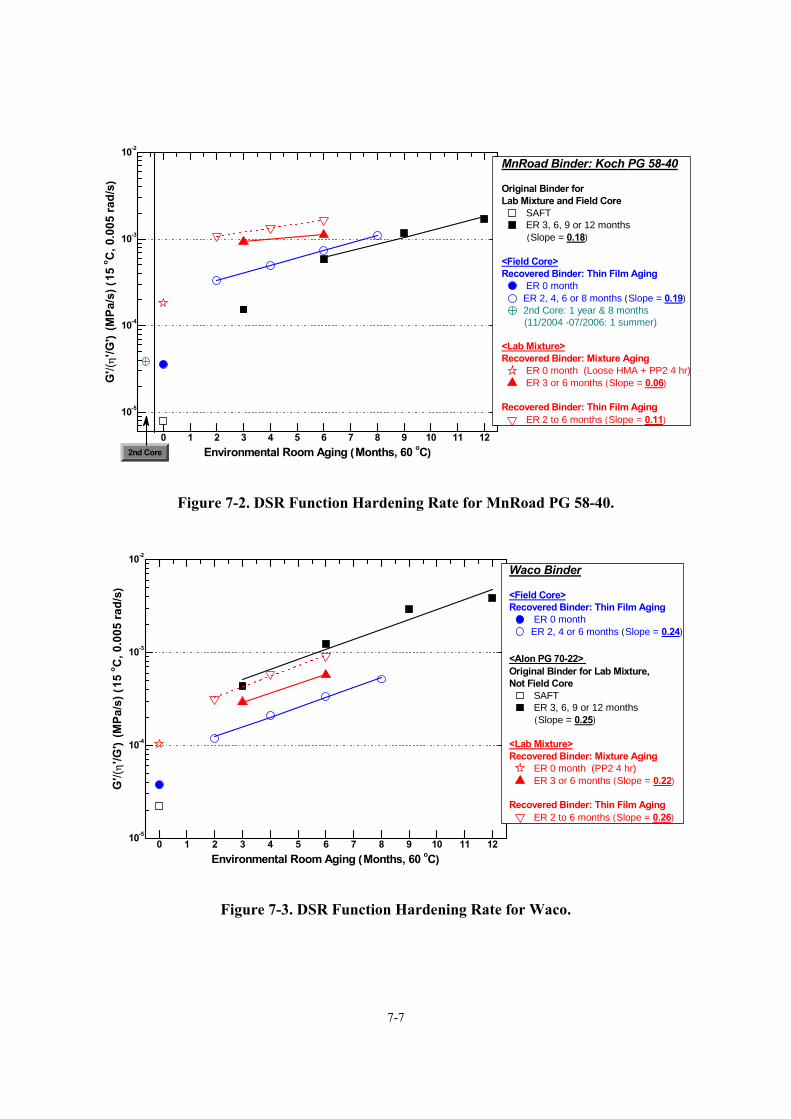
7-7
0 1 2 3 4 5 6 7 8 9 10 11 12
10-5
10-4
10-3
10-2
Environmental Room Aging (Months, 60 oC)
MnRoad Binder: Koch PG 58-40
Original Binder for Lab Mixture and Field Core
SAFT ER 3, 6, 9 or 12 months
(Slope = 0.18)
<Field Core>Recovered Binder: Thin Film Aging
ER 0 monthER 2, 4, 6 or 8 months (Slope = 0.19)2nd Core: 1 year & 8 months
(11/2004 -07/2006: 1 summer)
<Lab Mixture>Recovered Binder: Mixture Aging
ER 0 month (Loose HMA + PP2 4 hr) ER 3 or 6 months (Slope = 0.06)
Recovered Binder: Thin Film Aging ER 2 to 6 months (Slope = 0.11)
G'/(
η'/G
') (M
Pa/s
) (15
o C, 0
.005
rad/
s)
2nd Core
Figure 7-2. DSR Function Hardening Rate for MnRoad PG 58-40.
0 1 2 3 4 5 6 7 8 9 10 11 1210-5
10-4
10-3
10-2
Environmental Room Aging (Months, 60 oC)
Waco Binder
<Field Core>Recovered Binder: Thin Film Aging
ER 0 monthER 2, 4 or 6 months (Slope = 0.24)
<Alon PG 70-22> Original Binder for Lab Mixture, Not Field Core
SAFT ER 3, 6, 9 or 12 months
(Slope = 0.25)
<Lab Mixture>Recovered Binder: Mixture Aging
ER 0 month (PP2 4 hr) ER 3 or 6 months (Slope = 0.22)
Recovered Binder: Thin Film Aging ER 2 to 6 months (Slope = 0.26)
G'/(
η'/G
') (M
Pa/s
) (15
o C, 0
.005
rad/
s)
Figure 7-3. DSR Function Hardening Rate for Waco.
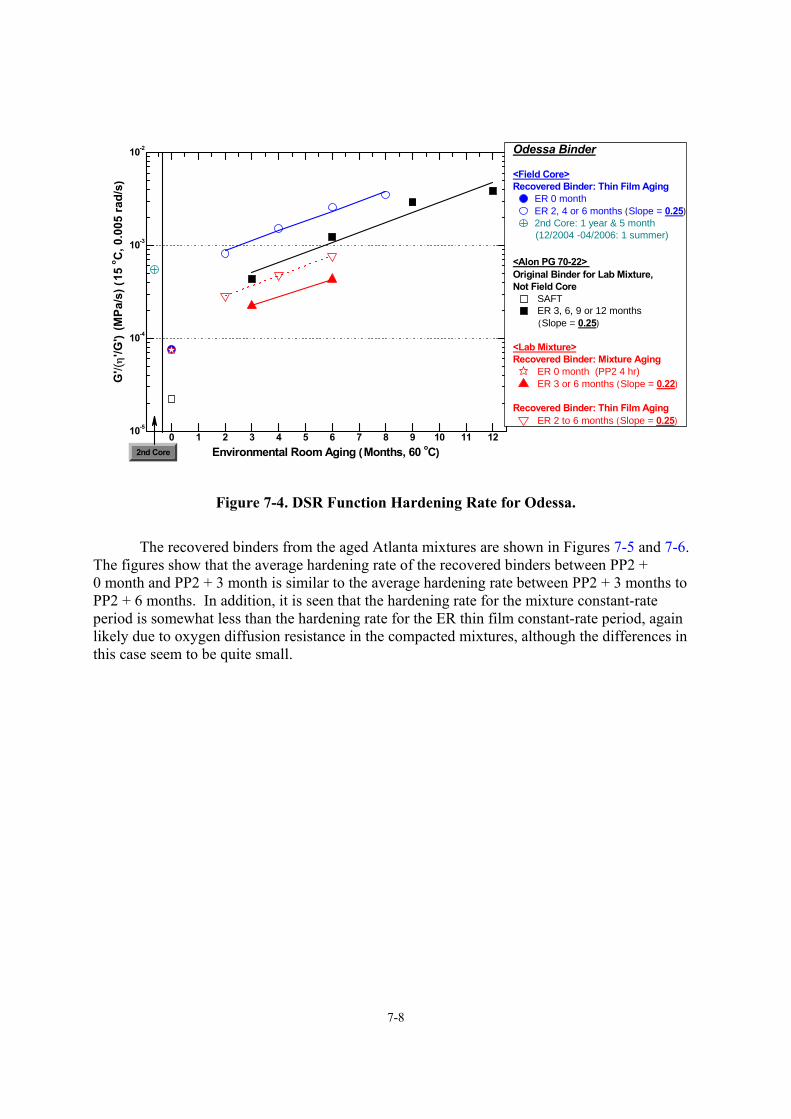
7-8
0 1 2 3 4 5 6 7 8 9 10 11 1210-5
10-4
10-3
10-2
Environmental Room Aging (Months, 60 oC)
Odessa Binder
<Field Core>Recovered Binder: Thin Film Aging
ER 0 monthER 2, 4 or 6 months (Slope = 0.25)2nd Core: 1 year & 5 month
(12/2004 -04/2006: 1 summer)
<Alon PG 70-22> Original Binder for Lab Mixture, Not Field Core
SAFT ER 3, 6, 9 or 12 months
(Slope = 0.25)
<Lab Mixture>Recovered Binder: Mixture Aging
ER 0 month (PP2 4 hr) ER 3 or 6 months (Slope = 0.22)
Recovered Binder: Thin Film Aging ER 2 to 6 months (Slope = 0.25)
G'/(
η'/G
') (M
Pa/s
) (15
o C, 0
.005
rad/
s)
2nd Core
Figure 7-4. DSR Function Hardening Rate for Odessa.
The recovered binders from the aged Atlanta mixtures are shown in Figures 7-5 and 7-6.
The figures show that the average hardening rate of the recovered binders between PP2 + 0 month and PP2 + 3 month is similar to the average hardening rate between PP2 + 3 months to PP2 + 6 months. In addition, it is seen that the hardening rate for the mixture constant-rate period is somewhat less than the hardening rate for the ER thin film constant-rate period, again likely due to oxygen diffusion resistance in the compacted mixtures, although the differences in this case seem to be quite small.
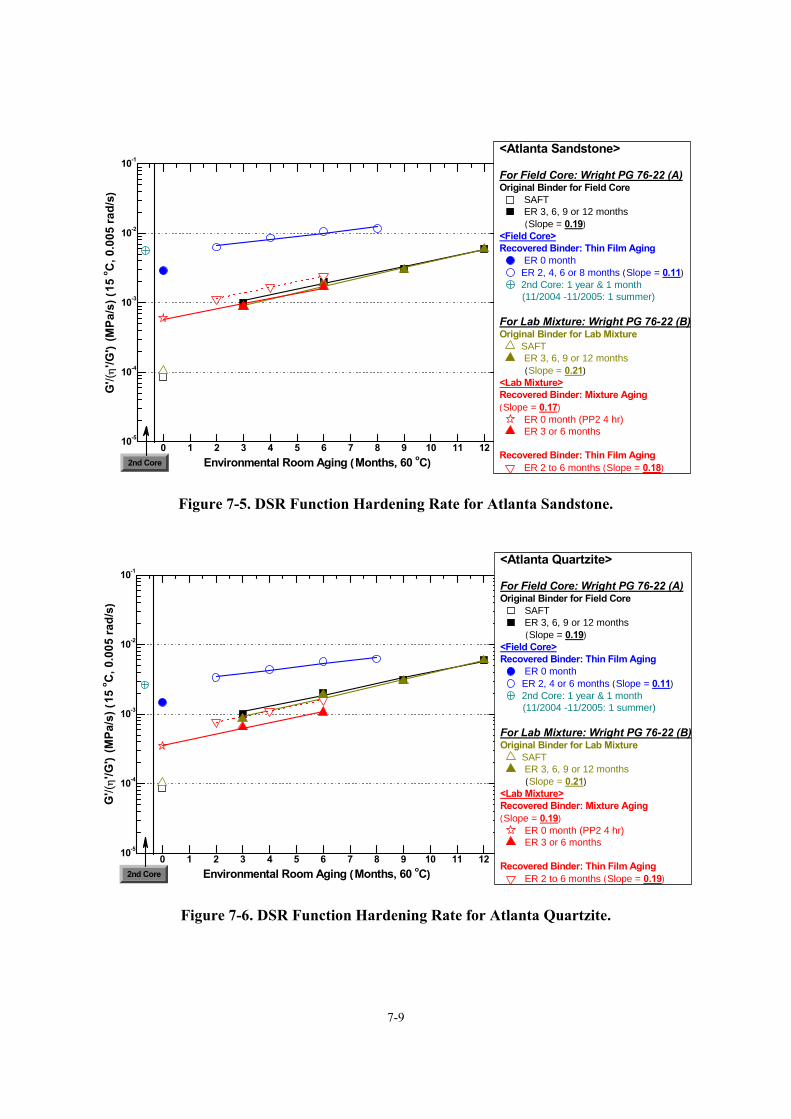
7-9
0 1 2 3 4 5 6 7 8 9 10 11 1210-5
10-4
10-3
10-2
10-1
Environmental Room Aging (Months, 60 oC)
<Atlanta Sandstone>
For Field Core: Wright PG 76-22 (A)Original Binder for Field Core
SAFT ER 3, 6, 9 or 12 months
(Slope = 0.19)<Field Core>Recovered Binder: Thin Film Aging
ER 0 monthER 2, 4, 6 or 8 months (Slope = 0.11)2nd Core: 1 year & 1 month
(11/2004 -11/2005: 1 summer)
For Lab Mixture: Wright PG 76-22 (B)Original Binder for Lab Mixture
SAFT ER 3, 6, 9 or 12 months
(Slope = 0.21)<Lab Mixture>Recovered Binder: Mixture Aging(Slope = 0.17)
ER 0 month (PP2 4 hr) ER 3 or 6 months
Recovered Binder: Thin Film Aging ER 2 to 6 months (Slope = 0.18)
G'/(
η'/G
') (M
Pa/s
) (15
o C, 0
.005
rad/
s)
2nd Core
Figure 7-5. DSR Function Hardening Rate for Atlanta Sandstone.
0 1 2 3 4 5 6 7 8 9 10 11 1210-5
10-4
10-3
10-2
10-1
Environmental Room Aging (Months, 60 oC)
<Atlanta Quartzite>
For Field Core: Wright PG 76-22 (A)Original Binder for Field Core
SAFT ER 3, 6, 9 or 12 months
(Slope = 0.19)<Field Core>Recovered Binder: Thin Film Aging
ER 0 monthER 2, 4 or 6 months (Slope = 0.11)2nd Core: 1 year & 1 month
(11/2004 -11/2005: 1 summer)
For Lab Mixture: Wright PG 76-22 (B)Original Binder for Lab Mixture
SAFT ER 3, 6, 9 or 12 months
(Slope = 0.21)<Lab Mixture>Recovered Binder: Mixture Aging(Slope = 0.19)
ER 0 month (PP2 4 hr) ER 3 or 6 months
Recovered Binder: Thin Film Aging ER 2 to 6 months (Slope = 0.19)
G'/(
η'/G
') (M
Pa/s
) (15
o C, 0
.005
rad/
s)
2nd Core
Figure 7-6. DSR Function Hardening Rate for Atlanta Quartzite.
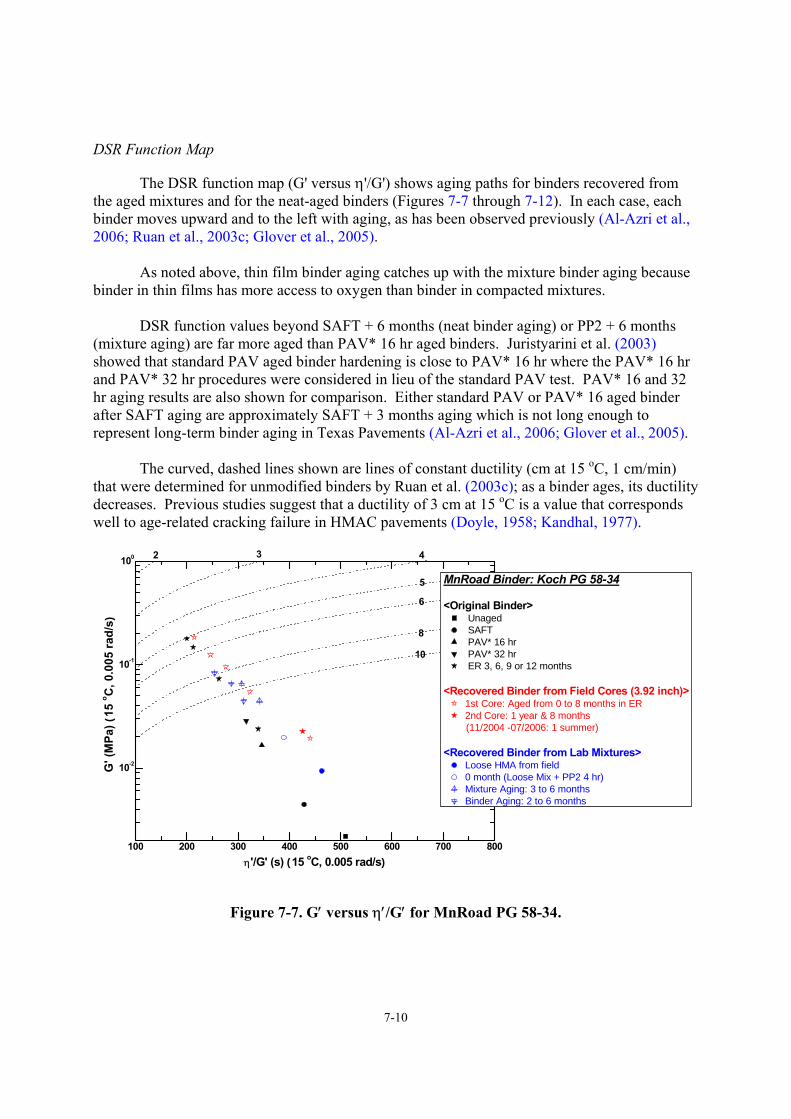
7-10
DSR Function Map
The DSR function map (G' versus η'/G') shows aging paths for binders recovered from the aged mixtures and for the neat-aged binders (Figures 7-7 through 7-12). In each case, each binder moves upward and to the left with aging, as has been observed previously (Al-Azri et al., 2006; Ruan et al., 2003c; Glover et al., 2005).
As noted above, thin film binder aging catches up with the mixture binder aging because
binder in thin films has more access to oxygen than binder in compacted mixtures. DSR function values beyond SAFT + 6 months (neat binder aging) or PP2 + 6 months
(mixture aging) are far more aged than PAV* 16 hr aged binders. Juristyarini et al. (2003) showed that standard PAV aged binder hardening is close to PAV* 16 hr where the PAV* 16 hr and PAV* 32 hr procedures were considered in lieu of the standard PAV test. PAV* 16 and 32 hr aging results are also shown for comparison. Either standard PAV or PAV* 16 aged binder after SAFT aging are approximately SAFT + 3 months aging which is not long enough to represent long-term binder aging in Texas Pavements (Al-Azri et al., 2006; Glover et al., 2005).
The curved, dashed lines shown are lines of constant ductility (cm at 15 oC, 1 cm/min)
that were determined for unmodified binders by Ruan et al. (2003c); as a binder ages, its ductility decreases. Previous studies suggest that a ductility of 3 cm at 15 oC is a value that corresponds well to age-related cracking failure in HMAC pavements (Doyle, 1958; Kandhal, 1977).
100 200 300 400 500 600 700 800
10-2
10-1
100
MnRoad Binder: Koch PG 58-34
<Original Binder> Unaged SAFT PAV* 16 hr PAV* 32 hr ER 3, 6, 9 or 12 months
<Recovered Binder from Field Cores (3.92 inch)>1st Core: Aged from 0 to 8 months in ER2nd Core: 1 year & 8 months
(11/2004 -07/2006: 1 summer)
<Recovered Binder from Lab Mixtures>Loose HMA from field 0 month (Loose Mix + PP2 4 hr)Mixture Aging: 3 to 6 monthsBinder Aging: 2 to 6 months
G' (
MPa
) (15
o C, 0
.005
rad/
s)
η'/G' (s) (15 oC, 0.005 rad/s)
8
10
5
6
3 42
Figure 7-7. G′ versus η′/G′ for MnRoad PG 58-34.
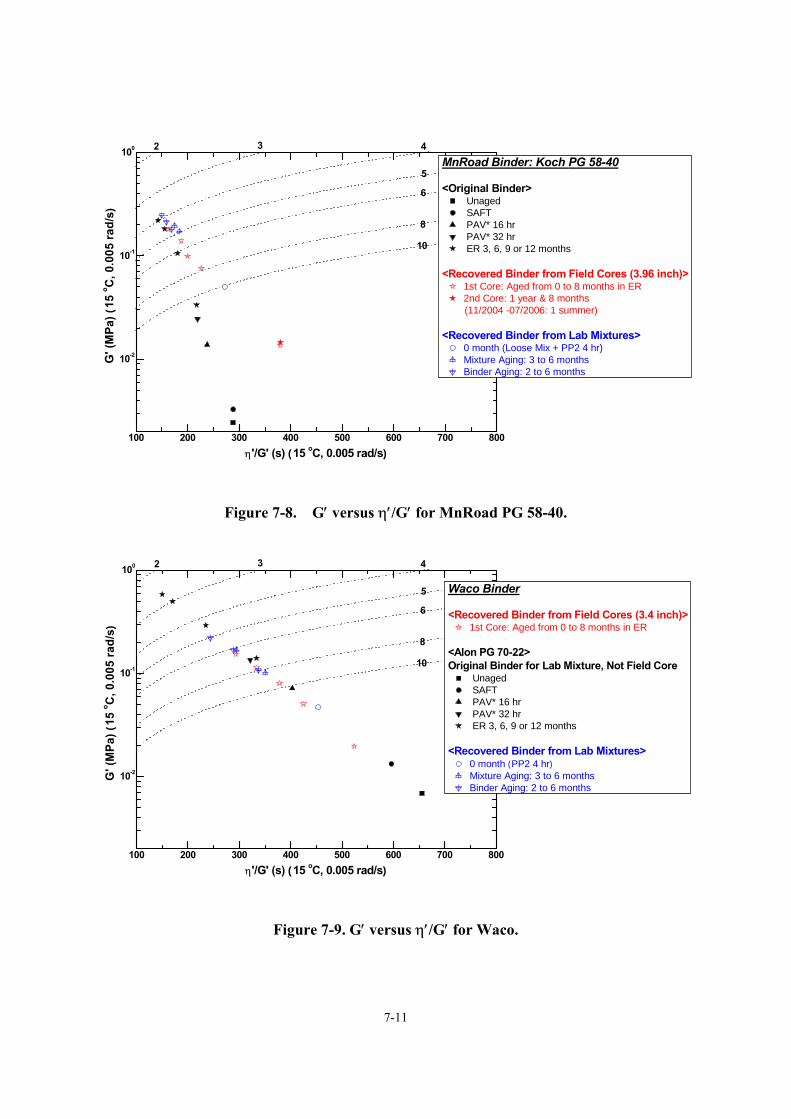
7-11
100 200 300 400 500 600 700 800
10-2
10-1
100
MnRoad Binder: Koch PG 58-40
<Original Binder> Unaged SAFT PAV* 16 hr PAV* 32 hr ER 3, 6, 9 or 12 months
<Recovered Binder from Field Cores (3.96 inch)>1st Core: Aged from 0 to 8 months in ER2nd Core: 1 year & 8 months
(11/2004 -07/2006: 1 summer)
<Recovered Binder from Lab Mixtures>0 month (Loose Mix + PP2 4 hr)Mixture Aging: 3 to 6 monthsBinder Aging: 2 to 6 months
G' (
MPa
) (15
o C, 0
.005
rad/
s)
η'/G' (s) (15 oC, 0.005 rad/s)
8
10
5
6
3 42
Figure 7-8. G′ versus η′/G′ for MnRoad PG 58-40.
100 200 300 400 500 600 700 800
10-2
10-1
100
Waco Binder
<Recovered Binder from Field Cores (3.4 inch)>1st Core: Aged from 0 to 8 months in ER
<Alon PG 70-22> Original Binder for Lab Mixture, Not Field Core
Unaged SAFT PAV* 16 hr PAV* 32 hr ER 3, 6, 9 or 12 months
<Recovered Binder from Lab Mixtures>0 month (PP2 4 hr)Mixture Aging: 3 to 6 monthsBinder Aging: 2 to 6 months
G' (
MPa
) (15
o C, 0
.005
rad/
s)
η'/G' (s) (15 oC, 0.005 rad/s)
8
10
5
6
3 42
Figure 7-9. G′ versus η′/G′ for Waco.
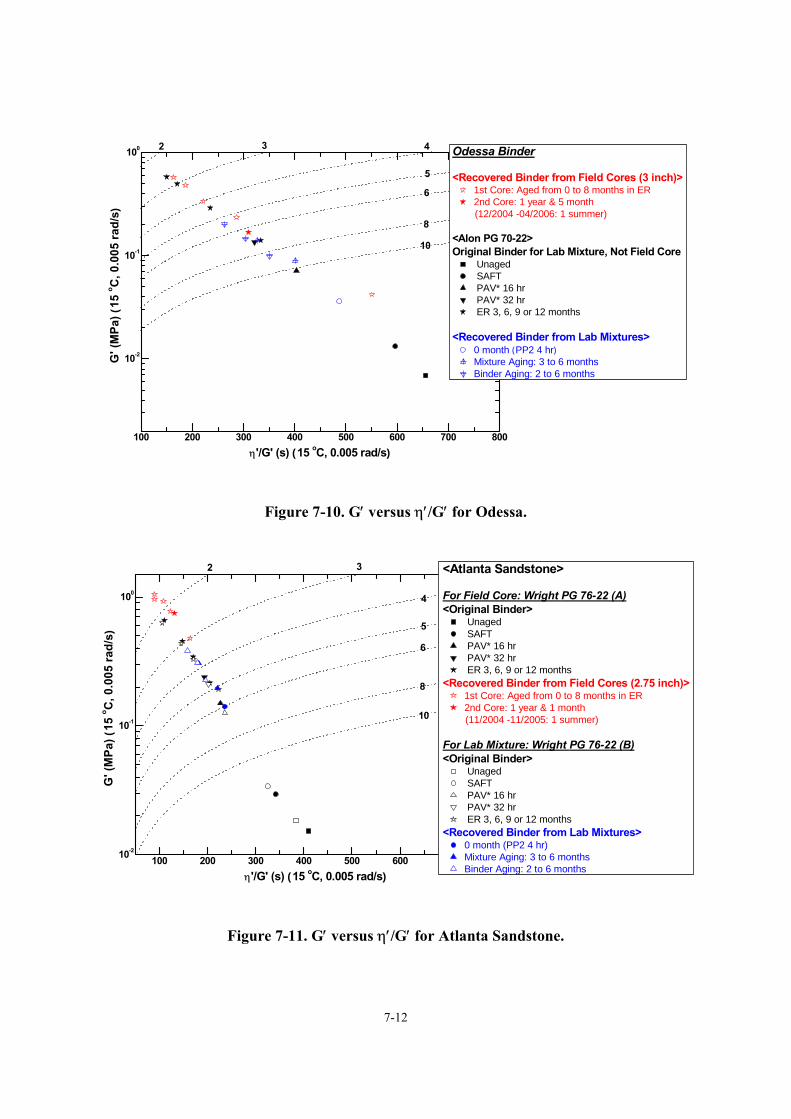
7-12
100 200 300 400 500 600 700 800
10-2
10-1
100 Odessa Binder
<Recovered Binder from Field Cores (3 inch)>1st Core: Aged from 0 to 8 months in ER2nd Core: 1 year & 5 month
(12/2004 -04/2006: 1 summer)
<Alon PG 70-22> Original Binder for Lab Mixture, Not Field Core
Unaged SAFT PAV* 16 hr PAV* 32 hr ER 3, 6, 9 or 12 months
<Recovered Binder from Lab Mixtures>0 month (PP2 4 hr)Mixture Aging: 3 to 6 monthsBinder Aging: 2 to 6 months
G' (
MPa
) (15
o C, 0
.005
rad/
s)
η'/G' (s) (15 oC, 0.005 rad/s)
8
10
5
6
3 42
Figure 7-10. G′ versus η′/G′ for Odessa.
100 200 300 400 500 600 700 80010-2
10-1
100
<Atlanta Sandstone>
For Field Core: Wright PG 76-22 (A)<Original Binder>
Unaged SAFT PAV* 16 hr PAV* 32 hr ER 3, 6, 9 or 12 months
<Recovered Binder from Field Cores (2.75 inch)>1st Core: Aged from 0 to 8 months in ER2nd Core: 1 year & 1 month
(11/2004 -11/2005: 1 summer)
For Lab Mixture: Wright PG 76-22 (B)<Original Binder>
Unaged SAFT PAV* 16 hr PAV* 32 hr ER 3, 6, 9 or 12 months
<Recovered Binder from Lab Mixtures>0 month (PP2 4 hr)Mixture Aging: 3 to 6 monthsBinder Aging: 2 to 6 months
G' (
MPa
) (15
o C, 0
.005
rad/
s)
η'/G' (s) (15 oC, 0.005 rad/s)
8
10
5
6
3
4
2
Figure 7-11. G′ versus η′/G′ for Atlanta Sandstone.
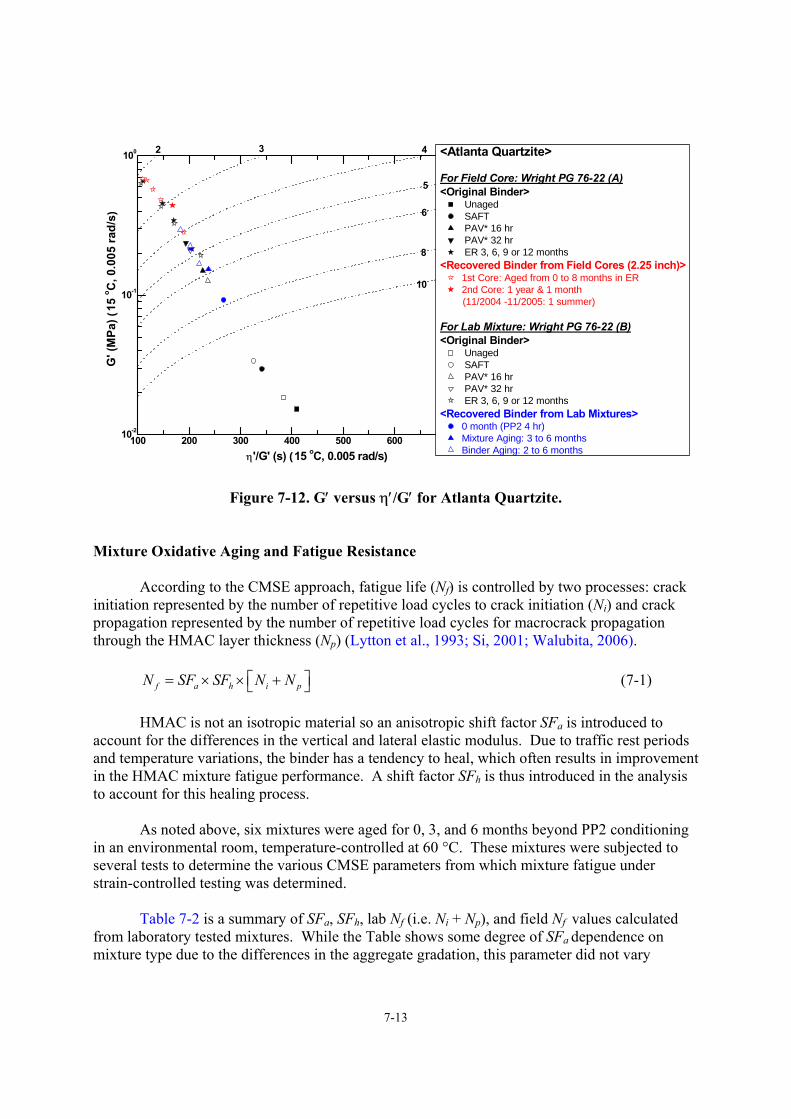
7-13
100 200 300 400 500 600 700 80010-2
10-1
100 <Atlanta Quartzite>
For Field Core: Wright PG 76-22 (A)<Original Binder>
Unaged SAFT PAV* 16 hr PAV* 32 hr ER 3, 6, 9 or 12 months
<Recovered Binder from Field Cores (2.25 inch)>1st Core: Aged from 0 to 8 months in ER2nd Core: 1 year & 1 month
(11/2004 -11/2005: 1 summer)
For Lab Mixture: Wright PG 76-22 (B)<Original Binder>
Unaged SAFT PAV* 16 hr PAV* 32 hr ER 3, 6, 9 or 12 months
<Recovered Binder from Lab Mixtures>0 month (PP2 4 hr)Mixture Aging: 3 to 6 monthsBinder Aging: 2 to 6 months
G' (
MPa
) (15
o C, 0
.005
rad/
s)
η'/G' (s) (15 oC, 0.005 rad/s)
8
10
5
6
3 42
Figure 7-12. G′ versus η′/G′ for Atlanta Quartzite. Mixture Oxidative Aging and Fatigue Resistance
According to the CMSE approach, fatigue life (Nf) is controlled by two processes: crack initiation represented by the number of repetitive load cycles to crack initiation (Ni) and crack propagation represented by the number of repetitive load cycles for macrocrack propagation through the HMAC layer thickness (Np) (Lytton et al., 1993; Si, 2001; Walubita, 2006).
f a h i pN SF SF N N⎡ ⎤= × × +⎣ ⎦ (7-1)
HMAC is not an isotropic material so an anisotropic shift factor SFa is introduced to account for the differences in the vertical and lateral elastic modulus. Due to traffic rest periods and temperature variations, the binder has a tendency to heal, which often results in improvement in the HMAC mixture fatigue performance. A shift factor SFh is thus introduced in the analysis to account for this healing process.
As noted above, six mixtures were aged for 0, 3, and 6 months beyond PP2 conditioning
in an environmental room, temperature-controlled at 60 °C. These mixtures were subjected to several tests to determine the various CMSE parameters from which mixture fatigue under strain-controlled testing was determined.
Table 7-2 is a summary of SFa, SFh, lab Nf (i.e. Ni + Np), and field Nf values calculated
from laboratory tested mixtures. While the Table shows some degree of SFa dependence on mixture type due to the differences in the aggregate gradation, this parameter did not vary
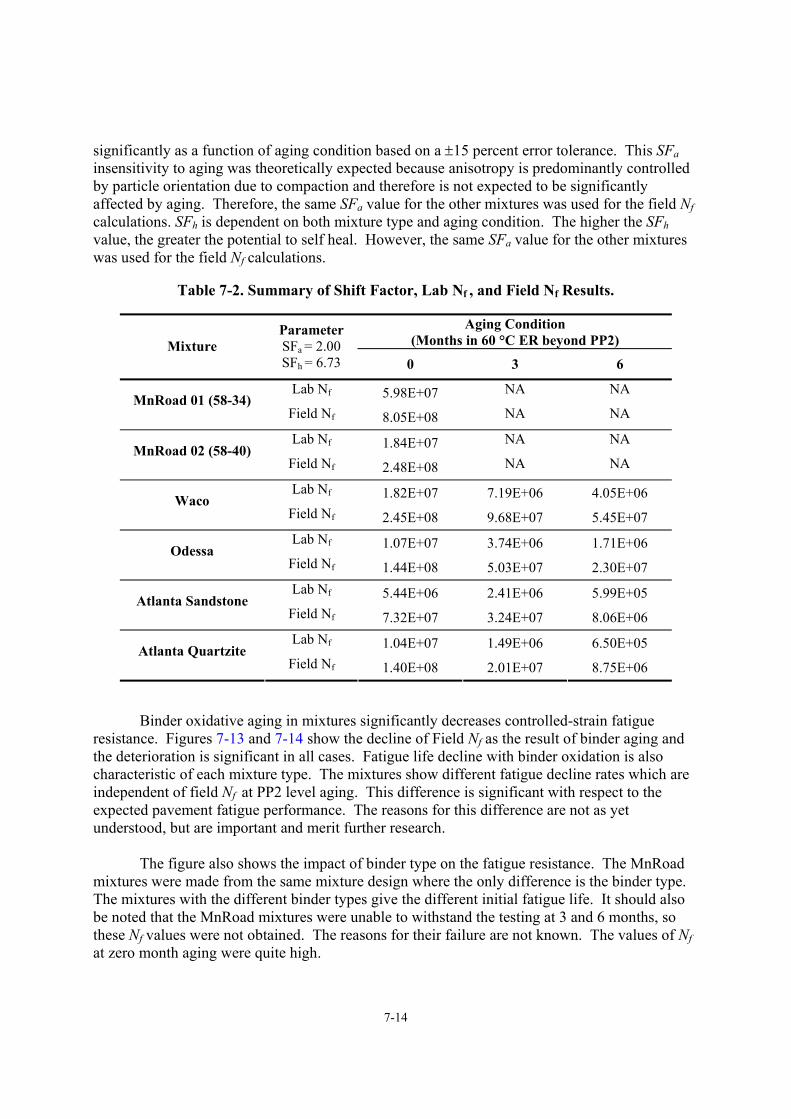
7-14
significantly as a function of aging condition based on a ±15 percent error tolerance. This SFa insensitivity to aging was theoretically expected because anisotropy is predominantly controlled by particle orientation due to compaction and therefore is not expected to be significantly affected by aging. Therefore, the same SFa value for the other mixtures was used for the field Nf calculations. SFh is dependent on both mixture type and aging condition. The higher the SFh value, the greater the potential to self heal. However, the same SFa value for the other mixtures was used for the field Nf calculations.
Table 7-2. Summary of Shift Factor, Lab Nf , and Field Nf Results.
Aging Condition
(Months in 60 °C ER beyond PP2) Mixture Parameter SFa = 2.00 SFh = 6.73 0 3 6
Lab Nf 5.98E+07 NA NA MnRoad 01 (58-34)
Field Nf 8.05E+08 NA NA
Lab Nf 1.84E+07 NA NA MnRoad 02 (58-40)
Field Nf 2.48E+08 NA NA
Lab Nf 1.82E+07 7.19E+06 4.05E+06 Waco Field Nf 2.45E+08 9.68E+07 5.45E+07 Lab Nf 1.07E+07 3.74E+06 1.71E+06 Odessa
Field Nf 1.44E+08 5.03E+07 2.30E+07 Lab Nf 5.44E+06 2.41E+06 5.99E+05 Atlanta Sandstone
Field Nf 7.32E+07 3.24E+07 8.06E+06 Lab Nf 1.04E+07 1.49E+06 6.50E+05 Atlanta Quartzite
Field Nf 1.40E+08 2.01E+07 8.75E+06
Binder oxidative aging in mixtures significantly decreases controlled-strain fatigue resistance. Figures 7-13 and 7-14 show the decline of Field Nf as the result of binder aging and the deterioration is significant in all cases. Fatigue life decline with binder oxidation is also characteristic of each mixture type. The mixtures show different fatigue decline rates which are independent of field Nf at PP2 level aging. This difference is significant with respect to the expected pavement fatigue performance. The reasons for this difference are not as yet understood, but are important and merit further research.
The figure also shows the impact of binder type on the fatigue resistance. The MnRoad
mixtures were made from the same mixture design where the only difference is the binder type. The mixtures with the different binder types give the different initial fatigue life. It should also be noted that the MnRoad mixtures were unable to withstand the testing at 3 and 6 months, so these Nf values were not obtained. The reasons for their failure are not known. The values of Nf at zero month aging were quite high.
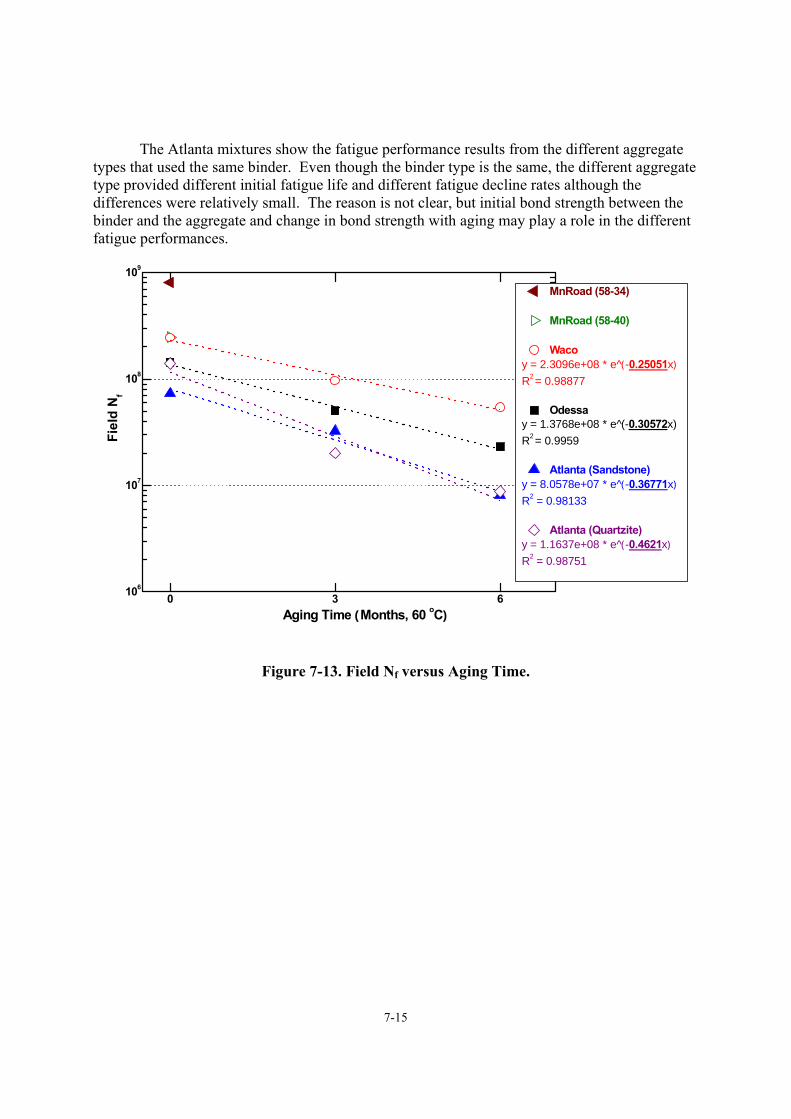
7-15
The Atlanta mixtures show the fatigue performance results from the different aggregate types that used the same binder. Even though the binder type is the same, the different aggregate type provided different initial fatigue life and different fatigue decline rates although the differences were relatively small. The reason is not clear, but initial bond strength between the binder and the aggregate and change in bond strength with aging may play a role in the different fatigue performances.
0 3 6106
107
108
109
MnRoad (58-34)
MnRoad (58-40)
Wacoy = 2.3096e+08 * e^(-0.25051x) R2 = 0.98877
Odessay = 1.3768e+08 * e (̂-0.30572x) R2 = 0.9959
Atlanta (Sandstone)y = 8.0578e+07 * e^(-0.36771x) R2 = 0.98133
Atlanta (Quartzite)y = 1.1637e+08 * e^(-0.4621x) R2 = 0.98751
Fiel
d N
f
Aging Time (Months, 60 oC)
Figure 7-13. Field Nf versus Aging Time.
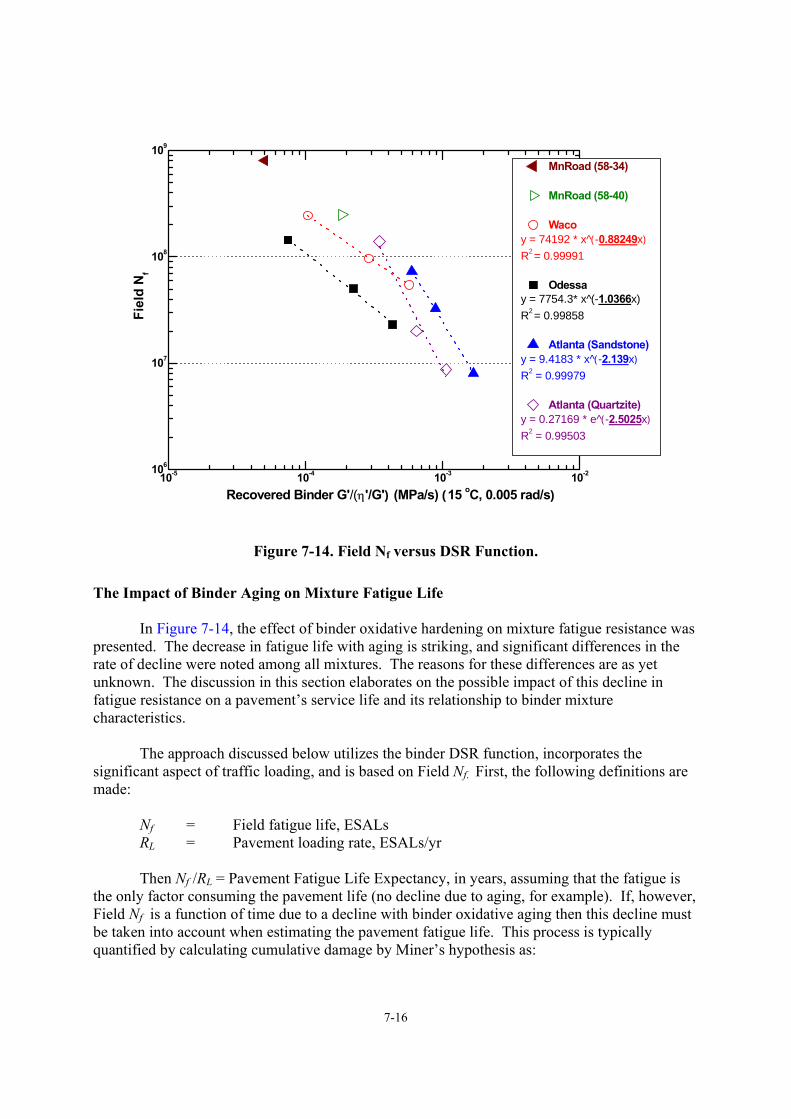
7-16
10-5 10-4 10-3 10-2106
107
108
109
MnRoad (58-34)
MnRoad (58-40)
Wacoy = 74192 * x (̂-0.88249x) R2 = 0.99991
Odessay = 7754.3* x (̂-1.0366x) R2 = 0.99858
Atlanta (Sandstone)y = 9.4183 * x (̂-2.139x) R2 = 0.99979
Atlanta (Quartzite)y = 0.27169 * e (̂-2.5025x) R2 = 0.99503
Fiel
d N
f
Recovered Binder G'/(η'/G') (MPa/s) (15 oC, 0.005 rad/s)
Figure 7-14. Field Nf versus DSR Function. The Impact of Binder Aging on Mixture Fatigue Life
In Figure 7-14, the effect of binder oxidative hardening on mixture fatigue resistance was presented. The decrease in fatigue life with aging is striking, and significant differences in the rate of decline were noted among all mixtures. The reasons for these differences are as yet unknown. The discussion in this section elaborates on the possible impact of this decline in fatigue resistance on a pavement’s service life and its relationship to binder mixture characteristics.
The approach discussed below utilizes the binder DSR function, incorporates the
significant aspect of traffic loading, and is based on Field Nf. First, the following definitions are made:
Nf = Field fatigue life, ESALs RL = Pavement loading rate, ESALs/yr
Then Nf /RL = Pavement Fatigue Life Expectancy, in years, assuming that the fatigue is
the only factor consuming the pavement life (no decline due to aging, for example). If, however, Field Nf is a function of time due to a decline with binder oxidative aging then this decline must be taken into account when estimating the pavement fatigue life. This process is typically quantified by calculating cumulative damage by Miner’s hypothesis as:
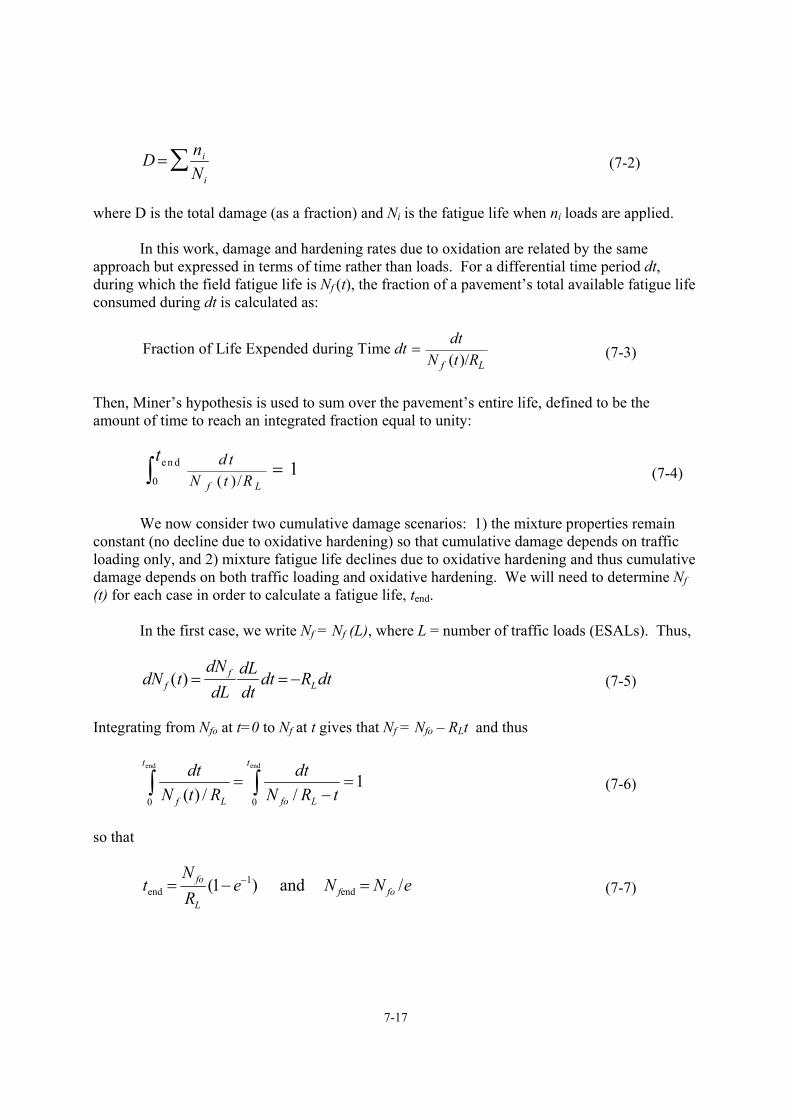
7-17
D =ni
Ni∑ (7-2)
where D is the total damage (as a fraction) and Ni is the fatigue life when ni loads are applied.
In this work, damage and hardening rates due to oxidation are related by the same approach but expressed in terms of time rather than loads. For a differential time period dt, during which the field fatigue life is Nf (t), the fraction of a pavement’s total available fatigue life consumed during dt is calculated as:
Fraction of Life Expended during Time ( )/f L
dtdt
N t R= (7-3)
Then, Miner’s hypothesis is used to sum over the pavement’s entire life, defined to be the amount of time to reach an integrated fraction equal to unity:
en d
0 ( )/1
f L
d tN t R
t=∫ (7-4)
We now consider two cumulative damage scenarios: 1) the mixture properties remain
constant (no decline due to oxidative hardening) so that cumulative damage depends on traffic loading only, and 2) mixture fatigue life declines due to oxidative hardening and thus cumulative damage depends on both traffic loading and oxidative hardening. We will need to determine Nf (t) for each case in order to calculate a fatigue life, tend.
In the first case, we write Nf = Nf (L), where L = number of traffic loads (ESALs). Thus,
dN f (t) =dN f
dLdLdt
dt = −RLdt (7-5)
Integrating from Nfo at t=0 to Nf at t gives that Nf = Nfo – RLt and thus
1//)(
endend
00
=−
= ∫∫t
Lfo
t
Lf tRNdt
RtNdt
(7-6)
so that
tend =N fo
RL
(1− e−1) and N fend = N fo /e (7-7)
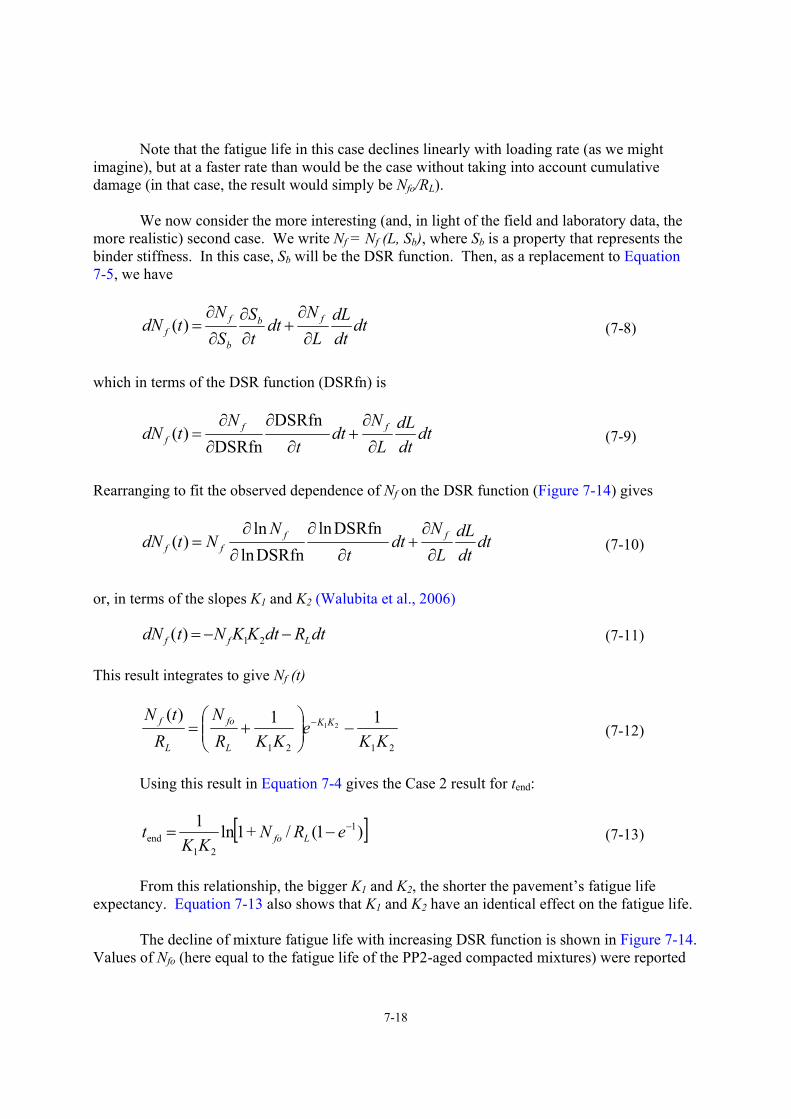
7-18
Note that the fatigue life in this case declines linearly with loading rate (as we might imagine), but at a faster rate than would be the case without taking into account cumulative damage (in that case, the result would simply be Nfo/RL).
We now consider the more interesting (and, in light of the field and laboratory data, the more realistic) second case. We write Nf = Nf (L, Sb), where Sb is a property that represents the binder stiffness. In this case, Sb will be the DSR function. Then, as a replacement to Equation 7-5, we have
dtdtdL
LN
dttS
SN
tdN fb
b
ff ∂
∂+
∂∂
∂
∂=)( (7-8)
which in terms of the DSR function (DSRfn) is
dtdtdL
LN
dtt
NtdN ff
f ∂
∂+
∂
∂
∂
∂=
DSRfnDSRfn
)( (7-9)
Rearranging to fit the observed dependence of Nf on the DSR function (Figure 7-14) gives
dtdtdL
LN
dtt
NNtdN ff
ff ∂
∂+
∂
∂
∂
∂=
DSRfnlnDSRfnlnln
)( (7-10)
or, in terms of the slopes K1 and K2 (Walubita et al., 2006)
dN f (t) = −N f K1K2dt − RLdt (7-11)
This result integrates to give Nf (t)
2121
11)(21
KKe
KKRN
RtN KK
L
fo
L
f −⎟⎟⎠
⎞⎜⎜⎝
⎛+= −
(7-12)
Using this result in Equation 7-4 gives the Case 2 result for tend:
[ ])1(/+1ln1 1
21end
−−= eRNKK
t Lfo (7-13)
From this relationship, the bigger K1 and K2, the shorter the pavement’s fatigue life
expectancy. Equation 7-13 also shows that K1 and K2 have an identical effect on the fatigue life. The decline of mixture fatigue life with increasing DSR function is shown in Figure 7-14.
Values of Nfo (here equal to the fatigue life of the PP2-aged compacted mixtures) were reported
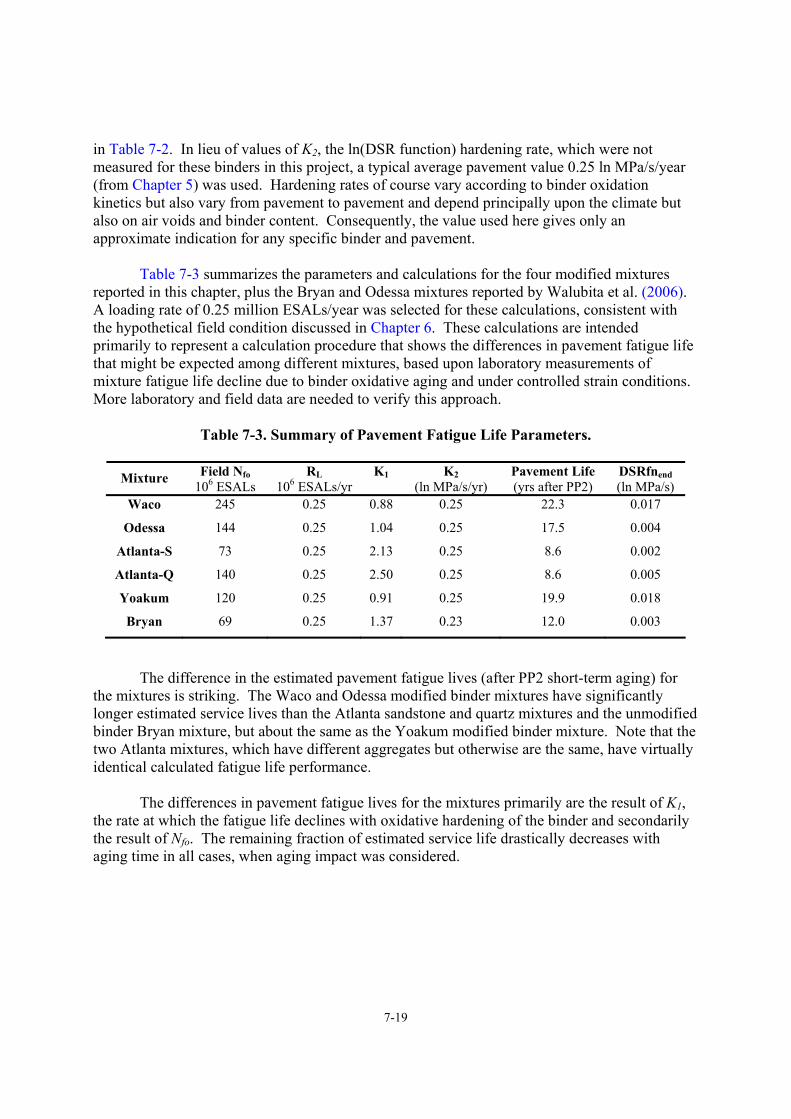
7-19
in Table 7-2. In lieu of values of K2, the ln(DSR function) hardening rate, which were not measured for these binders in this project, a typical average pavement value 0.25 ln MPa/s/year (from Chapter 5) was used. Hardening rates of course vary according to binder oxidation kinetics but also vary from pavement to pavement and depend principally upon the climate but also on air voids and binder content. Consequently, the value used here gives only an approximate indication for any specific binder and pavement.
Table 7-3 summarizes the parameters and calculations for the four modified mixtures reported in this chapter, plus the Bryan and Odessa mixtures reported by Walubita et al. (2006). A loading rate of 0.25 million ESALs/year was selected for these calculations, consistent with the hypothetical field condition discussed in Chapter 6. These calculations are intended primarily to represent a calculation procedure that shows the differences in pavement fatigue life that might be expected among different mixtures, based upon laboratory measurements of mixture fatigue life decline due to binder oxidative aging and under controlled strain conditions. More laboratory and field data are needed to verify this approach.
Table 7-3. Summary of Pavement Fatigue Life Parameters.
Field Nfo RL K1 K2 Pavement Life DSRfnend Mixture 106 ESALs 106 ESALs/yr (ln MPa/s/yr) (yrs after PP2) (ln MPa/s)
Waco 245 0.25 0.88 0.25 22.3 0.017
Odessa 144 0.25 1.04 0.25 17.5 0.004
Atlanta-S 73 0.25 2.13 0.25 8.6 0.002
Atlanta-Q 140 0.25 2.50 0.25 8.6 0.005
Yoakum 120 0.25 0.91 0.25 19.9 0.018
Bryan 69 0.25 1.37 0.23 12.0 0.003
The difference in the estimated pavement fatigue lives (after PP2 short-term aging) for the mixtures is striking. The Waco and Odessa modified binder mixtures have significantly longer estimated service lives than the Atlanta sandstone and quartz mixtures and the unmodified binder Bryan mixture, but about the same as the Yoakum modified binder mixture. Note that the two Atlanta mixtures, which have different aggregates but otherwise are the same, have virtually identical calculated fatigue life performance.
The differences in pavement fatigue lives for the mixtures primarily are the result of K1,
the rate at which the fatigue life declines with oxidative hardening of the binder and secondarily the result of Nfo. The remaining fraction of estimated service life drastically decreases with aging time in all cases, when aging impact was considered.
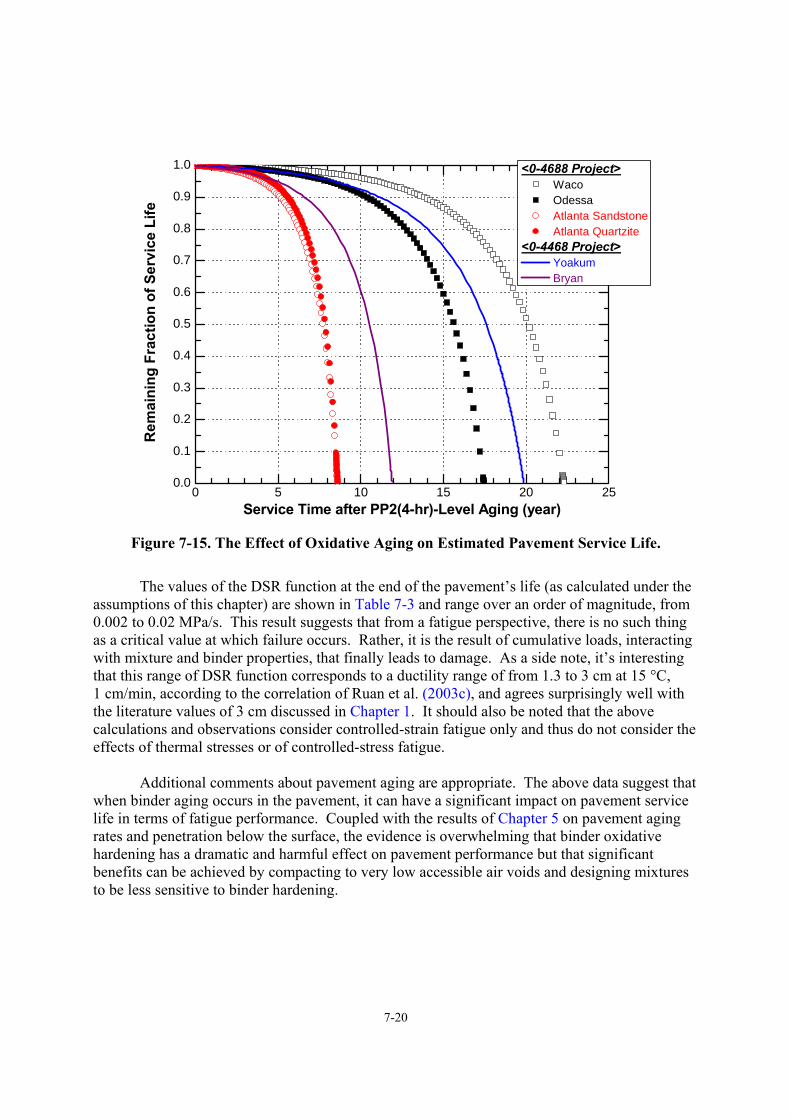
7-20
0 5 10 15 20 250.0
0.1
0.2
0.3
0.4
0.5
0.6
0.7
0.8
0.9
1.0R
emai
ning
Fra
ctio
n of
Ser
vice
Life
Service Time after PP2(4-hr)-Level Aging (year)
<0-4688 Project> Waco Odessa Atlanta Sandstone Atlanta Quartzite
<0-4468 Project> Yoakum Bryan
Figure 7-15. The Effect of Oxidative Aging on Estimated Pavement Service Life.
The values of the DSR function at the end of the pavement’s life (as calculated under the assumptions of this chapter) are shown in Table 7-3 and range over an order of magnitude, from 0.002 to 0.02 MPa/s. This result suggests that from a fatigue perspective, there is no such thing as a critical value at which failure occurs. Rather, it is the result of cumulative loads, interacting with mixture and binder properties, that finally leads to damage. As a side note, it’s interesting that this range of DSR function corresponds to a ductility range of from 1.3 to 3 cm at 15 °C, 1 cm/min, according to the correlation of Ruan et al. (2003c), and agrees surprisingly well with the literature values of 3 cm discussed in Chapter 1. It should also be noted that the above calculations and observations consider controlled-strain fatigue only and thus do not consider the effects of thermal stresses or of controlled-stress fatigue. Additional comments about pavement aging are appropriate. The above data suggest that when binder aging occurs in the pavement, it can have a significant impact on pavement service life in terms of fatigue performance. Coupled with the results of Chapter 5 on pavement aging rates and penetration below the surface, the evidence is overwhelming that binder oxidative hardening has a dramatic and harmful effect on pavement performance but that significant benefits can be achieved by compacting to very low accessible air voids and designing mixtures to be less sensitive to binder hardening.
7-21
SUMMARY AND CONCLUSIONS
Six types of mixtures with different aging levels have been studied to determine the impact of binder oxidation on the HMAC fatigue performance as measured under strain-controlled conditions in the laboratory. Mixture aging was compared to neat binder aging to determine whether mixture aging follows the same aging mechanism as neat binder aging. Field fatigue life was calculated from laboratory measurements to determine the effect of different binder oxidation levels on fatigue resistance. Following are the conclusions and findings from this study:
• Binder oxidation significantly decreases strain-controlled fatigue life as measured in the laboratory.
• Binder oxidation in mixtures follows a path similar to neat binders (DSR function
hardening rate, DSR map) even though hardening rates in mixtures are slower than those in neat binder thin films due to oxygen diffusion resistance.
• The DSR function is a very useful rheological parameter for tracking binder durability
changes due to oxidative hardening.
• The standard PAV aging procedure is not sufficient for representing long-term aging in Texas pavements.
• HMAC mixture fatigue performance is a function of mixture design (including aggregate
type and binder content) and binder type, as measured under strain-controlled conditions in the laboratory.
• The cumulative damage approach provides a rational method for quantitatively
estimating pavement service life by simultaneously considering both the pavement loading rate and the fatigue life decline due to binder oxidative aging.
• Differences in cumulative damage calculations of pavement fatigue life arise from
differences in initial fatigue lives but much more significantly from different declines in fatigue life with binder stiffening combined with different binder hardening rates in the mixtures.
• The cumulative damage controlled-strain calculation shows a rapidly accelerating decline
in pavement life as oxidative aging progresses.
• The PP2 level aging process ages binders more severely than SAFT level aging. However, the PP2 level aged binders for this project still are not out of the initial jump.

8-1
CHAPTER 8
A PROTOCOL FOR ASSESSING POLYMER MODIFIED ASPHALT DURABILITY IN PAVEMENT
BACKGROUND Binders in pavements oxidize over time and, as a result, become brittle and more susceptible to thermal and fatigue cracking failure. While it is desirable to determine a critical binder condition at which failure will occur, such a condition, as a matter of fundamentals, cannot exist. Fatigue cracking, for example, is a function not just of binder properties, but also of traffic loading (frequency and amount of load), pavement system stiffness, and mixture design (probably including variables such as binder content, aggregate gradation, and air voids). Nevertheless, binder properties play a critical role; after all, it is the binder that ultimately cracks in a pavement under normal usage and the passage of time, and binders in old pavements suffer fatigue cracking while binders in new pavements do not. Within the context of these observations, this protocol is based on the properties of neat, laboratory-compacted mixtures, and pavement-aged binders; an improved understanding of the fundamentals that govern binder aging rates in pavements and their impact on fatigue cracking, and methods for predicting pavement life from the perspective of binder fatigue cracking. This protocol consists of two steps: 1) determine measures of modified binder properties and performance, and 2) estimate pavement fatigue life based upon these and other measures and using a cumulative damage approach. The first step may be used in a method of classifying the various binders as to expected durability in pavements while the second step provides a rationale for estimating that durability in terms of pavement life. The second step provides two procedures; one is based on the measured binder properties and assumed pavement structural properties, whereas the other procedure includes measured binder and mixture properties, along with assumed pavement structural properties. It is recognized that this second step requires non-conventional information on pavement mixtures that is not currently available and not easily obtained, and thus, likely cannot yet be implemented; a far better fundamental understanding of the impact of binder oxidative aging on fatigue life decline, and as it relates to mixture parameters, is required. However, it is anticipated that by putting forth this protocol, pavement design engineers and researchers will begin the effort to obtain this required understanding and of working toward design and maintenance planning that will incorporate binder aging in a more fundamental approach than is now used. This protocol of course is preliminary and will require revision and correction as more and better data are obtained and a better fundamental understanding is achieved.
8-2
DETERMINE MEASURES OF MODIFIED BINDER PERFORMANCE These binder conditioning steps and measurements are designed to estimate the impact of (change due to) polymer modifier on three base binder properties: 1) hardening rate (in terms of the DSR function) in 1 mm films at 90 °C and 20 atm air; 2) level of binder stiffness (in terms of the DSR function), and 3) elongation at break (either in terms of direct tension or ductility). A fourth measure addresses the absolute level of the modified binder stiffness (in terms of the DSR function): 4) DSR function stiffness relative to an arbitrary value of 0.0001 MPa/s. The rationale for these measures is as follows.
1) It is desirable that polymer modification slow a binder’s rate of stiffening due to oxidation relative to that of the base binder. While it is desired that such a measurement be made at conditions close to actual pavement oxidation (60 °C, 1 atm air, say), the length of time required for such measurements is prohibitive. Therefore the 90 °C measurement at 20 atm air pressure is used. Aging in a 1 mm film (instead of the conventional PAV 3 mm film) is used to reduce oxygen diffusion resistance to the binder and therefore to accelerate the oxidation rate, relative to standard PAV conditions. Aging for 16 hours at the PAV* conditions brings binders to being close to (or beyond) the initial jump region of oxidation kinetics. (The most desired oxidation reaction kinetics data would be measurements of oxidative reaction and hardening rates over a range of temperatures so as to provide reaction activation energies that can then be used to calculate accurate pavement oxidation rates. However, such measurements are very time consuming. Even so, there is no substitute for correct data, and such measurements should be considered.)
2) It is desired that polymer modification should not unduly stiffen the binder for elongational flow, relative to the base binder. Excessive stiffening is believed to act counter to a prolonged pavement fatigue service life.
3) It is desired that polymer modification serve to improve a binder’s elongational flow characteristics. A direct tension or ductility measurement is a direct indication of this property.
4) While measure 2 (above) is a measure of a binder’s ability to undergo elongational flow, relative to that of the base binder, an absolute measure also is desired, and that is provided by this fourth measurement. The binder conditioning and measurement procedures, and calculations of the screening parameters, are outlined below. Age Both the Base and Modified Binders
• Age unmodified and modified base binders to (RTFOT or SAFT plus) PAV* 16 hr and PAV* 32 hr aging levels. The 16 hr level of aging corresponds quite well to PP2 4-hr aging and, according to measured pavement binders, approximates the initial state of a binder early in the pavement life. PAV* aging uses the standard Superpave PAV apparatus, but the binder is aged in 1 mm thick films, one-third the standard PAV
8-3
thickness, and the temperature is fixed at 90 °C. The pressure is 20 atm air, standard for the PAV apparatus.
Measure Aged Binder Properties
• Measure the DSR function (DSRfn) after PAV* 16 hr aging for both the modified and base binder.
• Measure the DSRfn after PAV* 32 hr aging for both the modified and base binder. • Measure the direct tension (DT) failure strain at -12 °C after PAV* 16 hr aging for both
the modified and base binder, (or measure the ductility at 15 °C, 1 cm/min) The DSRfn is defined as G'/(η'/G') = ωG'/tan δ, where the DSR properties are measured at 44.7 °C, 10 rad/s but converted to 15 °C , 0.005 rad/s by a time-temperature superposition (TTSP) frequency conversion ratio of 2000:
rad/s 10 C, 44.7rad/s 0.005 C, 15 )'/'(
'2000
1)'/'(
'DSRfn
°°⎥⎦
⎤⎢⎣
⎡⎥⎦
⎤⎢⎣
⎡≈≡
GG
GG
ηη (8-1)
The TTSP calculation is approximate, based on the observation that binders all have
approximately (but not exactly) the same TTSP shift factors, but the convenience of the measurement, using standard DSR equipment, warrants the approximation. Calculate Screening Measures of Binder Performance
• Calculate PAV* 16 hr to PAV* 32 hr hardening in the DSRfn for the modified binder:
)DSRfn/ ln(DSRfn=
)DSRfnln()DSRfnln(HardeningBinder PMA
hr 16hr 32
hr 16hr 32 −= (8-2)
Calculate PAV* 16 hr to PAV* 32 hr hardening in DSRfn for the base binder:
)DSRfn/ ln(DSRfn=
)DSRfnln()DSRfnln(=HardeningBinder Base
hr 16hr 32
hr 16hr 32 − (8-3)
• Estimate a measured ductility from Ductility-DT correlation:
Ductility = 4.2(DT)2.60 (8-4)
where the ductility is at 15 °C, 1 cm/min, and DT is measured at -12 °C, 1 mm/min. If the measured value of ductility is obtained, use this value.
8-4
• Calculate ductility based on the Ductility-DSRfn correlation: 44.0)DSRfn(23.0Ductility Calculated −= (8-5)
where the Calculated Ductility is at 15 °C, 1 cm/min, and the DSRfn is measured at 44.7 °C, 10 rad/s.
Based upon the above measurements, calculate the four screening measures of modified binders: 1) Calculate ratio of modified binder hardening to the base binder hardening for PAV* aging (Figure 2-35). Desired ratio < 1 Less hardening is desired and assessed with this ratio. 2) Calculate the ratio: DSRfnmod/ DSRfnbase after PAV* 16 hr aging (Figure 2-34). Desired ratio <1 This ratio assumes that reducing a base binder’s DSR function through polymer modification while at the same time achieving the desired performance grade is beneficial. To increase the DSR function is presumed to move the binder farther along the path to failure. 3) Calculate (ductility)/(calculated ductility) ratio at PAV* 16 hr conditions for both the base and modified binders, giving two measures (Figure 2-33). a) Desired modified binder ratio >1; b) Desired unmodified base binder ratio ~ 1 (or greater). Criterion 3b recognizes that too low a value for the unmodified binder shows poor elongational properties of the base binder, to which the modified binder will revert after sufficient oxidative aging. A value of the criterion 3a that exceeds unity provides a modified binder with enhanced ductility, presumably giving it an extended time before failure. 4) Calculate (DSRfn after PAV* 16 hr)/10-4 (Figure 2-36).
Desired ratio = 1 or less This ratio is an indication of the absolute level of stiffness of the modified binder, independent of the amount of improvement relative to the base binder stiffness (Criterion 2). Seven PG 70-22 and six PG 76-22 SBS modified binders plus one PG 76-22 SBR modified binder are summarized in Figures 8-1 and 8-2. It is noted that modification generally results in a hardening rate that is less than that of the base binder, together with an improved ductility (thereby meeting those two goals), but that stiffness improvement (relative to the base binder) and initial stiffness (the absolute measure) generally fall short of the goal. Also shown in these figures are the unmodified base binder (ductility/calculated ductility) ratios (measure 3b). This ratio varies from 0.8 to 2 for all of these base binders except one clear underperformer, for which the ratio is approximately 0.4. It should be noted that the ductility of PG 76-22 SBR modified binder was greatly improved (relative to the base binder), and more so than the SBS modified binders, suggesting that SBR modification should be further studied beyond this sample of one.
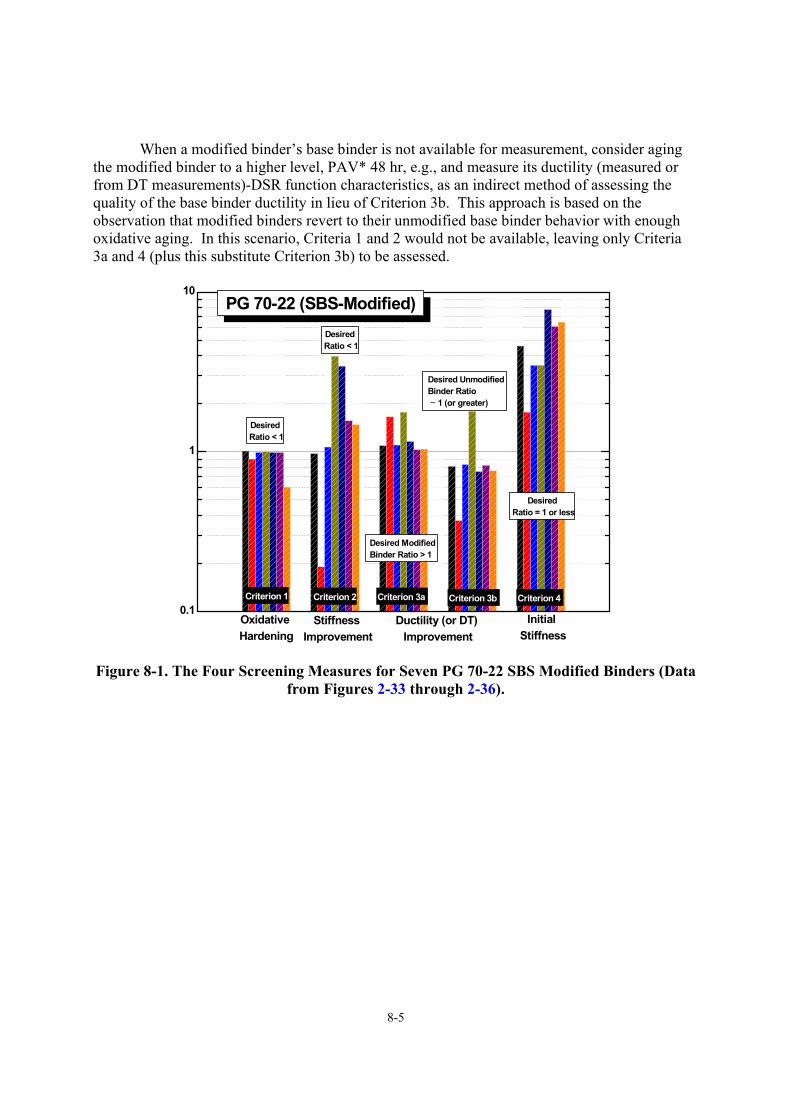
8-5
When a modified binder’s base binder is not available for measurement, consider aging the modified binder to a higher level, PAV* 48 hr, e.g., and measure its ductility (measured or from DT measurements)-DSR function characteristics, as an indirect method of assessing the quality of the base binder ductility in lieu of Criterion 3b. This approach is based on the observation that modified binders revert to their unmodified base binder behavior with enough oxidative aging. In this scenario, Criteria 1 and 2 would not be available, leaving only Criteria 3a and 4 (plus this substitute Criterion 3b) to be assessed.
0.1
1
10
Criterion 3a Criterion 1 Criterion 2 Criterion 4 Criterion 3b
Desired Modified Binder Ratio > 1
Oxidative Hardening
PG 70-22 (SBS-Modified)
Desired Ratio = 1 or less
Desired Unmodified Binder Ratio ~ 1 (or greater)
Desired Ratio < 1
Stiffness Improvement
Initial Stiffness
Ductility (or DT) Improvement
Desired Ratio < 1
Figure 8-1. The Four Screening Measures for Seven PG 70-22 SBS Modified Binders (Data
from Figures 2-33 through 2-36).
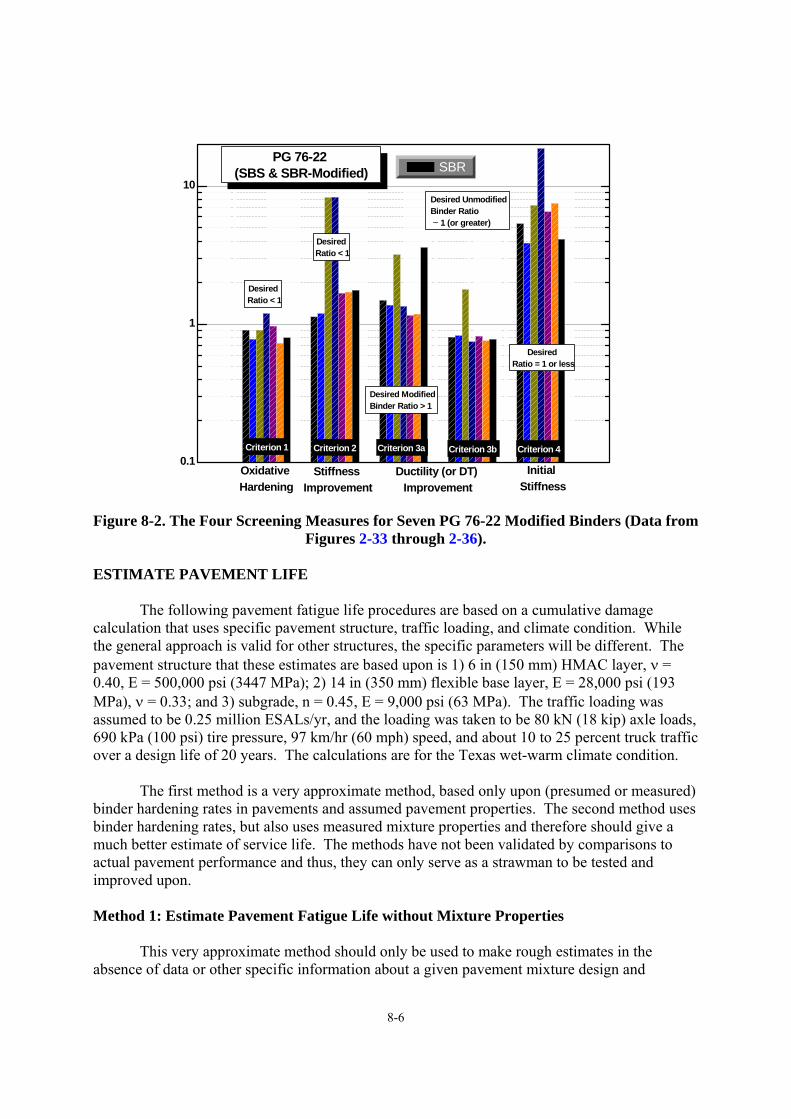
8-6
0.1
1
10 SBR
PG 76-22 (SBS & SBR-Modified)
Criterion 3a Criterion 1 Criterion 2 Criterion 4 Criterion 3b
Desired Modified Binder Ratio > 1
Oxidative Hardening
Desired Ratio = 1 or less
Desired Unmodified Binder Ratio ~ 1 (or greater)
Desired Ratio < 1
Stiffness Improvement
Initial Stiffness
Ductility (or DT) Improvement
Desired Ratio < 1
Figure 8-2. The Four Screening Measures for Seven PG 76-22 Modified Binders (Data from Figures 2-33 through 2-36).
ESTIMATE PAVEMENT LIFE The following pavement fatigue life procedures are based on a cumulative damage calculation that uses specific pavement structure, traffic loading, and climate condition. While the general approach is valid for other structures, the specific parameters will be different. The pavement structure that these estimates are based upon is 1) 6 in (150 mm) HMAC layer, ν = 0.40, E = 500,000 psi (3447 MPa); 2) 14 in (350 mm) flexible base layer, E = 28,000 psi (193 MPa), ν = 0.33; and 3) subgrade, n = 0.45, E = 9,000 psi (63 MPa). The traffic loading was assumed to be 0.25 million ESALs/yr, and the loading was taken to be 80 kN (18 kip) axle loads, 690 kPa (100 psi) tire pressure, 97 km/hr (60 mph) speed, and about 10 to 25 percent truck traffic over a design life of 20 years. The calculations are for the Texas wet-warm climate condition. The first method is a very approximate method, based only upon (presumed or measured) binder hardening rates in pavements and assumed pavement properties. The second method uses binder hardening rates, but also uses measured mixture properties and therefore should give a much better estimate of service life. The methods have not been validated by comparisons to actual pavement performance and thus, they can only serve as a strawman to be tested and improved upon. Method 1: Estimate Pavement Fatigue Life without Mixture Properties This very approximate method should only be used to make rough estimates in the absence of data or other specific information about a given pavement mixture design and
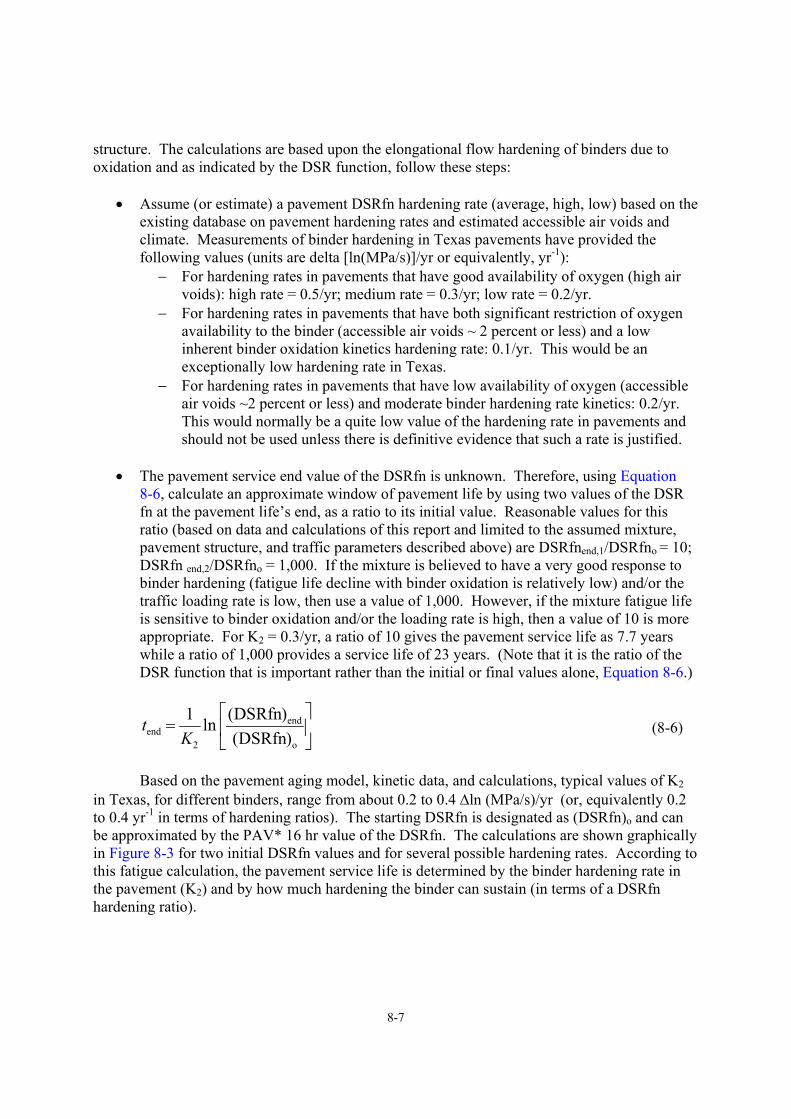
8-7
structure. The calculations are based upon the elongational flow hardening of binders due to oxidation and as indicated by the DSR function, follow these steps:
• Assume (or estimate) a pavement DSRfn hardening rate (average, high, low) based on the existing database on pavement hardening rates and estimated accessible air voids and climate. Measurements of binder hardening in Texas pavements have provided the following values (units are delta [ln(MPa/s)]/yr or equivalently, yr-1):
− For hardening rates in pavements that have good availability of oxygen (high air voids): high rate = 0.5/yr; medium rate = 0.3/yr; low rate = 0.2/yr.
− For hardening rates in pavements that have both significant restriction of oxygen availability to the binder (accessible air voids ~ 2 percent or less) and a low inherent binder oxidation kinetics hardening rate: 0.1/yr. This would be an exceptionally low hardening rate in Texas.
− For hardening rates in pavements that have low availability of oxygen (accessible air voids ~2 percent or less) and moderate binder hardening rate kinetics: 0.2/yr. This would normally be a quite low value of the hardening rate in pavements and should not be used unless there is definitive evidence that such a rate is justified.
• The pavement service end value of the DSRfn is unknown. Therefore, using Equation
8-6, calculate an approximate window of pavement life by using two values of the DSR fn at the pavement life’s end, as a ratio to its initial value. Reasonable values for this ratio (based on data and calculations of this report and limited to the assumed mixture, pavement structure, and traffic parameters described above) are DSRfnend,1/DSRfno = 10; DSRfn end,2/DSRfno = 1,000. If the mixture is believed to have a very good response to binder hardening (fatigue life decline with binder oxidation is relatively low) and/or the traffic loading rate is low, then use a value of 1,000. However, if the mixture fatigue life is sensitive to binder oxidation and/or the loading rate is high, then a value of 10 is more appropriate. For K2 = 0.3/yr, a ratio of 10 gives the pavement service life as 7.7 years while a ratio of 1,000 provides a service life of 23 years. (Note that it is the ratio of the DSR function that is important rather than the initial or final values alone, Equation 8-6.)
⎥⎦
⎤⎢⎣
⎡=
o
end
2end )DSRfn(
)DSRfn(ln 1K
t (8-6)
Based on the pavement aging model, kinetic data, and calculations, typical values of K2 in Texas, for different binders, range from about 0.2 to 0.4 ∆ln (MPa/s)/yr (or, equivalently 0.2 to 0.4 yr-1 in terms of hardening ratios). The starting DSRfn is designated as (DSRfn)o and can be approximated by the PAV* 16 hr value of the DSRfn. The calculations are shown graphically in Figure 8-3 for two initial DSRfn values and for several possible hardening rates. According to this fatigue calculation, the pavement service life is determined by the binder hardening rate in the pavement (K2) and by how much hardening the binder can sustain (in terms of a DSRfn hardening ratio).
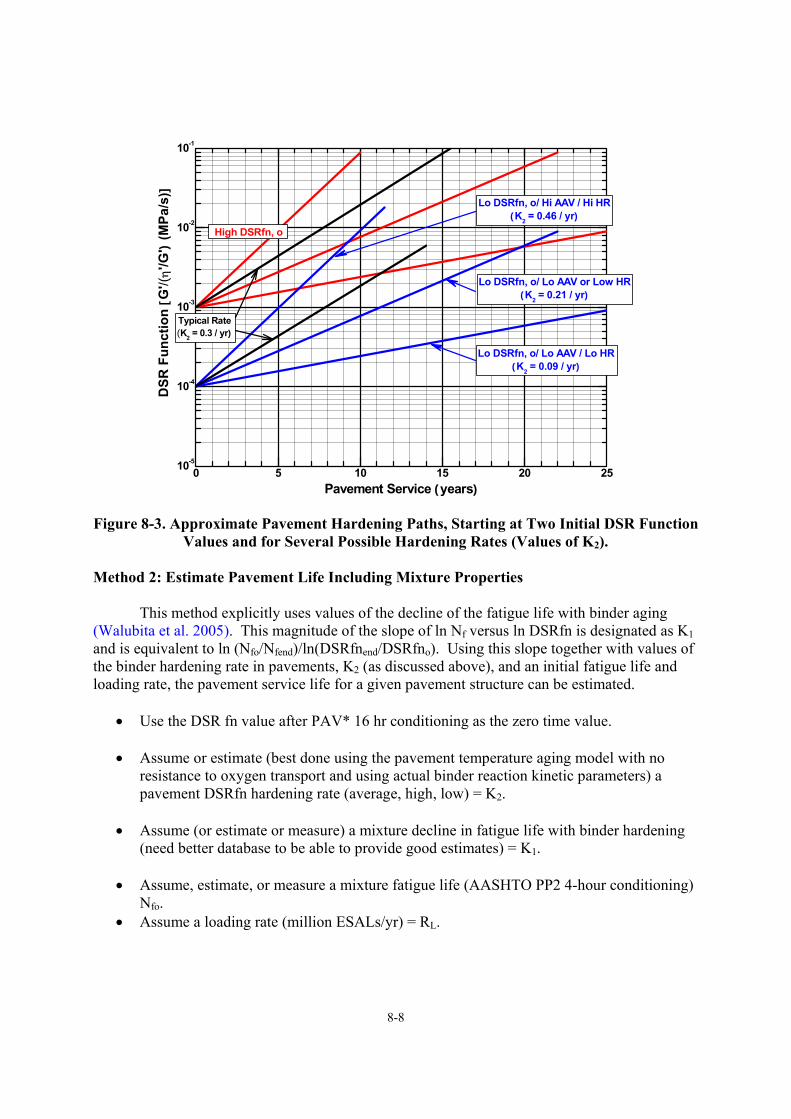
8-8
0 5 10 15 20 2510-5
10-4
10-3
10-2
10-1
DSR
Fun
ctio
n [G
'/(η
'/G')
(MPa
/s)]
Typical Rate(K2 = 0.3 / yr)
Lo DSRfn, o/ Hi AAV / Hi HR(K2 = 0.46 / yr)
Lo DSRfn, o/ Lo AAV / Lo HR(K2 = 0.09 / yr)
Lo DSRfn, o/ Lo AAV or Low HR(K2 = 0.21 / yr)
High DSRfn, o
Pavement Service (years) Figure 8-3. Approximate Pavement Hardening Paths, Starting at Two Initial DSR Function
Values and for Several Possible Hardening Rates (Values of K2). Method 2: Estimate Pavement Life Including Mixture Properties This method explicitly uses values of the decline of the fatigue life with binder aging (Walubita et al. 2005). This magnitude of the slope of ln Nf versus ln DSRfn is designated as K1 and is equivalent to ln (Nfo/Nfend)/ln(DSRfnend/DSRfno). Using this slope together with values of the binder hardening rate in pavements, K2 (as discussed above), and an initial fatigue life and loading rate, the pavement service life for a given pavement structure can be estimated.
• Use the DSR fn value after PAV* 16 hr conditioning as the zero time value.
• Assume or estimate (best done using the pavement temperature aging model with no resistance to oxygen transport and using actual binder reaction kinetic parameters) a pavement DSRfn hardening rate (average, high, low) = K2.
• Assume (or estimate or measure) a mixture decline in fatigue life with binder hardening
(need better database to be able to provide good estimates) = K1.
• Assume, estimate, or measure a mixture fatigue life (AASHTO PP2 4-hour conditioning) Nfo.
• Assume a loading rate (million ESALs/yr) = RL.
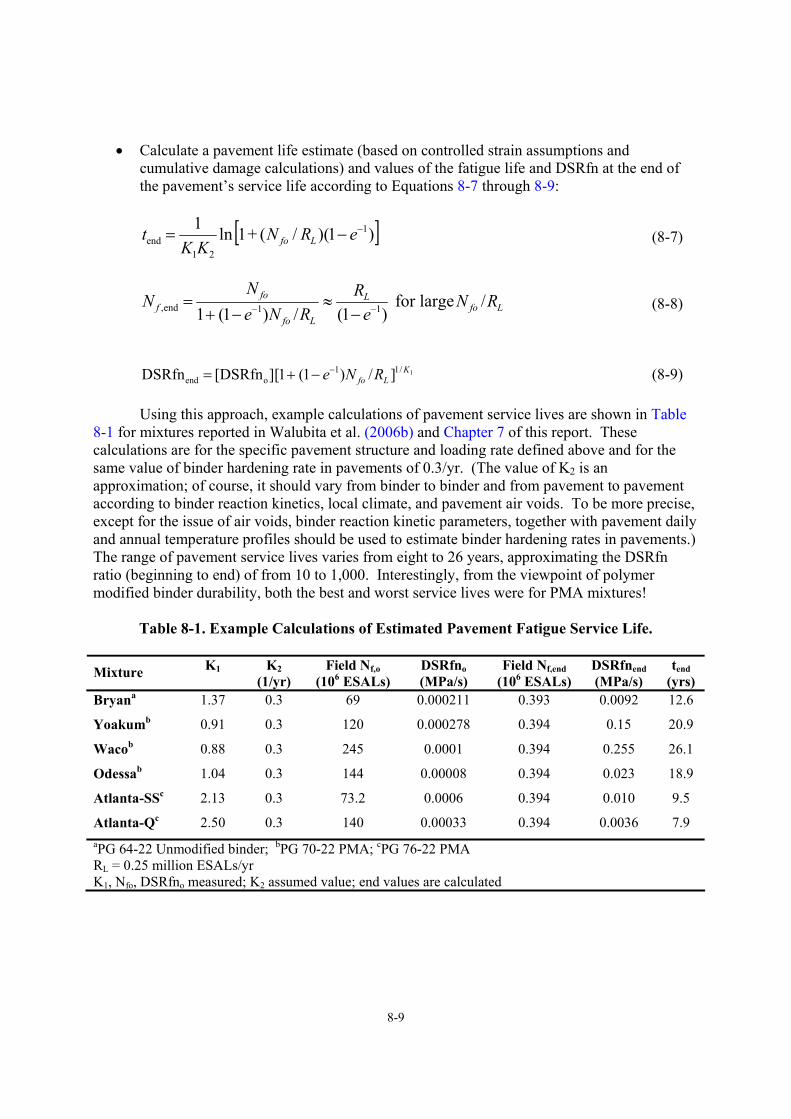
8-9
• Calculate a pavement life estimate (based on controlled strain assumptions and cumulative damage calculations) and values of the fatigue life and DSRfn at the end of the pavement’s service life according to Equations 8-7 through 8-9:
[ ])1)(/(+1ln 1 1
21end
−−= eRNKK
t Lfo (8-7)
N f ,end =N fo
1+ (1− e−1)N fo /RL
≈RL
(1− e−1) for large N fo /RL (8-8)
DSRfnend = [DSRfno][1+ (1− e−1)N fo /RL ]1/ K1 (8-9) Using this approach, example calculations of pavement service lives are shown in Table 8-1 for mixtures reported in Walubita et al. (2006b) and Chapter 7 of this report. These calculations are for the specific pavement structure and loading rate defined above and for the same value of binder hardening rate in pavements of 0.3/yr. (The value of K2 is an approximation; of course, it should vary from binder to binder and from pavement to pavement according to binder reaction kinetics, local climate, and pavement air voids. To be more precise, except for the issue of air voids, binder reaction kinetic parameters, together with pavement daily and annual temperature profiles should be used to estimate binder hardening rates in pavements.) The range of pavement service lives varies from eight to 26 years, approximating the DSRfn ratio (beginning to end) of from 10 to 1,000. Interestingly, from the viewpoint of polymer modified binder durability, both the best and worst service lives were for PMA mixtures!
Table 8-1. Example Calculations of Estimated Pavement Fatigue Service Life.
K1 K2 Field Nf,o DSRfno Field Nf,end DSRfnend tend Mixture (1/yr) (106 ESALs) (MPa/s) (106 ESALs) (MPa/s) (yrs) Bryana 1.37 0.3 69 0.000211 0.393 0.0092 12.6
Yoakumb 0.91 0.3 120 0.000278 0.394 0.15 20.9
Wacob 0.88 0.3 245 0.0001 0.394 0.255 26.1
Odessab 1.04 0.3 144 0.00008 0.394 0.023 18.9
Atlanta-SSc 2.13 0.3 73.2 0.0006 0.394 0.010 9.5
Atlanta-Qc 2.50 0.3 140 0.00033 0.394 0.0036 7.9 aPG 64-22 Unmodified binder; bPG 70-22 PMA; cPG 76-22 PMA RL = 0.25 million ESALs/yr K1, Nfo, DSRfno measured; K2 assumed value; end values are calculated
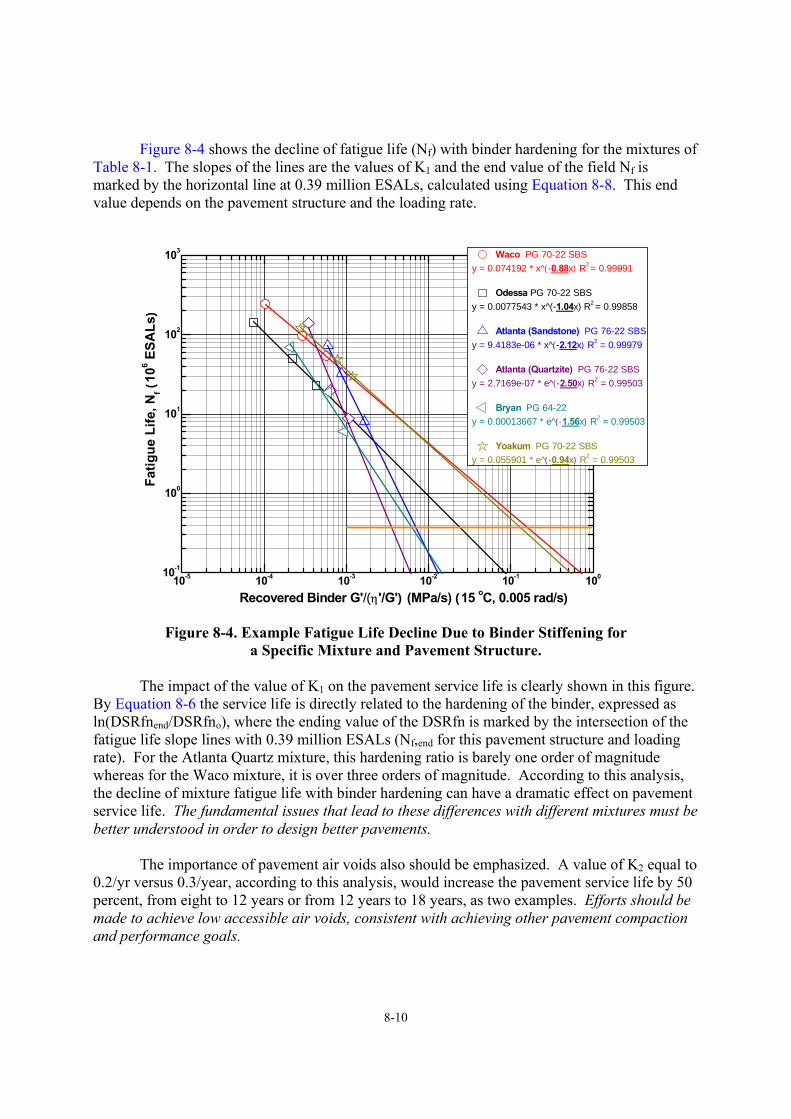
8-10
Figure 8-4 shows the decline of fatigue life (Nf) with binder hardening for the mixtures of Table 8-1. The slopes of the lines are the values of K1 and the end value of the field Nf is marked by the horizontal line at 0.39 million ESALs, calculated using Equation 8-8. This end value depends on the pavement structure and the loading rate.
10-5 10-4 10-3 10-2 10-1 10010-1
100
101
102
103 Waco PG 70-22 SBSy = 0.074192 * x^(-0.88x) R2 = 0.99991
Odessa PG 70-22 SBSy = 0.0077543 * x^(-1.04x) R2 = 0.99858
Atlanta (Sandstone) PG 76-22 SBSy = 9.4183e-06 * x^(-2.12x) R2 = 0.99979
Atlanta (Quartzite) PG 76-22 SBSy = 2.7169e-07 * e^(-2.50x) R2 = 0.99503
Bryan PG 64-22y = 0.00013667 * e^(-1.56x) R2 = 0.99503
Yoakum PG 70-22 SBSy = 0.055901 * e^(-0.94x) R2 = 0.99503
Fatig
ue L
ife, N
f (10
6 ESA
Ls)
Recovered Binder G'/(η'/G') (MPa/s) (15 oC, 0.005 rad/s)
Figure 8-4. Example Fatigue Life Decline Due to Binder Stiffening for a Specific Mixture and Pavement Structure.
The impact of the value of K1 on the pavement service life is clearly shown in this figure. By Equation 8-6 the service life is directly related to the hardening of the binder, expressed as ln(DSRfnend/DSRfno), where the ending value of the DSRfn is marked by the intersection of the fatigue life slope lines with 0.39 million ESALs (Nf,end for this pavement structure and loading rate). For the Atlanta Quartz mixture, this hardening ratio is barely one order of magnitude whereas for the Waco mixture, it is over three orders of magnitude. According to this analysis, the decline of mixture fatigue life with binder hardening can have a dramatic effect on pavement service life. The fundamental issues that lead to these differences with different mixtures must be better understood in order to design better pavements. The importance of pavement air voids also should be emphasized. A value of K2 equal to 0.2/yr versus 0.3/year, according to this analysis, would increase the pavement service life by 50 percent, from eight to 12 years or from 12 years to 18 years, as two examples. Efforts should be made to achieve low accessible air voids, consistent with achieving other pavement compaction and performance goals.
9-1
CHAPTER 9
POLYMER MODIFIED ASPHALT DURABILITY IN PAVEMENTS: SUMMARY OF THE PROJECT PROBLEM, ACTIVITIES, FINDINGS,
AND RECOMMENDATIONS
Polymer modification has been increasingly employed in asphalt concrete, primarily for control of short-term permanent deformation (rutting). By adding polymer to a conventional asphalt, the Superpave performance grade span (low temperature grade plus high temperature grade, e.g., PG 64-22 span is 86) can be increased by increasing the upper grade without harming the lower grade significantly. Some state DOTs, including Texas, require that if a binder is to have a grade span of 92 or above, then it must be a modified material. At the same time, polymer modification typically improves binder ductility, thereby providing a binder that is more durable to pavement stress and deformation, due, for example, to low temperature thermal contraction or traffic loads, including the effects of fatigue. Finally, there is evidence that polymer modifiers may improve the aging characteristics of a binder, thereby delaying the deleterious impact of oxidative aging and providing a more durable pavement. While all of these effects positively impact the durability of polymer-modified pavements, there is a need to quantify these improvements and their duration in the presence of oxidative aging. Such an improved understanding will lead to better modified binder selection and to a better cost-benefit analysis, thereby leading to more efficient use of Texas highway construction dollars. This project was designed to develop a better quantitative understanding of the relation between laboratory accelerated binder aging and field aging, a test procedure to measure a property of an aged binder that correlates to failure on the road, and a proposed specification for estimating the relative durability of binders in the presence of oxidative aging. The results are very significant and should be evaluated for implementation and further research. METHODOLOGY This project evaluated polymer modified asphalt durability through a number of determinations that included original binder property characterization, pavement-aged binder characterization (in both Texas and Minnesota), and laboratory mixture characterization, all for both modified and unmodified binders. The data measurements were very extensive and tedious, but necessary to provide a comprehensive view of PMA durability in pavements. The original binder measurements included rheological characterization (DSR, force-ductility, direct tension), composition characterization (Corbett analysis, size exclusion chromatography, FT-IR measurement of oxidation), and changes to these properties with
9-2
oxidative aging (60 °C environmental room aging, pavement aging, accelerated aging in the PAV apparatus). Laboratory-compacted mixture measurements included fundamental mixture properties (tensile strength, relaxation modulus, repeated direct tension, dissipated pseudo strain energy, surface energies) for the calibrated mechanistic with surface energy approach to fatigue analysis, and changes to the properties due to environmental room (60 °C) mixture oxidative aging. Ultimately, these measurements provided values for mixture fatigue life as a function of binder oxidation. Pavement measurements included recovered binder properties (DSR, SEC, FT-IR) and their changes over time in the pavement and pavement total and accessible (interconnected air voids). Sixteen pavements in 11 Texas districts, plus four MnRoad (Minnesota) pavements (one unmodified, three unmodified binders) were evaluated. Many of the pavement cores were sawed into 0.5 in layers with the binder and air void properties determined for each layer. For some of the pavements, original binder was available and tested for its initial and aging properties. For the unmodified binder MnRoad site, binder was recovered from a pavement core and aged at three temperatures to obtain oxidative hardening kinetic data for use in developing a pavement oxidative hardening model. Finally, from these laboratory and pavement performance data, important DSR and aging methods for predicting modifier effectiveness and durability were developed. RESULTS Changes to Binder Properties with Polymer Modification and Oxidative Aging Corbett compositions of both modified and unmodified binders change with aging, as has been observed previously and reported in the literature. There is a clear trend that polymer modification leads to an improvement in binder ductility, relative to the base binder, at low levels of oxidation. However, with increased oxidation, the ductility improvement dissipates. Size exclusion chromatography of polymer-modified binders clearly shows a decrease in the size of the polymer peak maximum but an increase in polymeric material at smaller molecular weights due to oxidation. The DSR function G'/(η'/G'), which relates to binder ductility for oxidatively aged unmodified binders, may either decrease or increase with polymer modification. Oxidative aging causes an increase in the DSR function so that modification, if it serves to start binder pavement service at a higher value of the DSR function, may work against its long-term durability. Most of the modified binders show a DSR function hardening rate that is less than that for the modified binder, by as much as 40 percent. This result suggests that the polymer
9-3
degradation that occurs due to oxidation may serve to moderate the hardening that occurs due to asphaltene formation and other composition changes that occur due to oxidation. Mechanisms of PMA Loss of Ductility with Binder Oxidation
Oxidative aging of asphalt materials causes an embrittlement, and thus a loss of ductility, of both unmodified and modified binders.
SBS and SBR polymer modification typically results in ductility improvements to the
base binder but oxidative aging degrades this improvement significantly over the life of the pavement. Dynamic shear rheometer, ductility, and force-ductility measurements show that the primary cause of this degradation is base binder stiffening due to the oxidation. A secondary cause is polymer degradation (molecular size reduction), also from oxidation.
Softening a modified binder, either by raising the temperature or by blending with a
softer asphaltic material, recovers the enhanced ductility performance of the modifier to a significant degree, but not fully. However, polymer degradation that may have occurred due to oxidation remains a factor contributing to reduced ductility performance. Asphalt and Modified Asphalt Fluorescence Microscopy Imaging Asphalt materials and typical polymer modifiers self fluoresce, thereby providing a mechanism for imaging the black and otherwise difficult-to-observe asphalt materials. Images show that the level of fluorescence increases with polymer modification but decreases with oxidative aging. Also, apparent inhomogeneity (polymer-rich regions versus asphalt-rich regions) tends to become less distinctive with increased oxidative aging. A Model for Binder Oxidation Rates in Pavements A simple 1-D, unsteady-state semi-infinite slab heat conduction model works surprisingly well for describing the temperature response of pavements to daily and annual thermal cycles. This temperature response, coupled with binder reaction kinetics parameters and rheological data can be used to calculate the hardening of binders in pavements over time. The agreement to actual binder aging is surprisingly good. The model and pavement core data suggest that normal air voids in pavements is sufficient to oxidize binders almost as though there is no diffusion resistance slowing the oxidation. The model calculations show and the pavement data confirm that binder oxidation can occur at very significant rates well below the surface of the pavement, contrary to a long and widely held belief to the contrary in the asphalt community. Tight accessible air voids result in measurably and significantly slower rates of hardening of the binder. The slower rates can have a very significant beneficial impact on pavement durability.
9-4
Model calculations using known binder kinetic parameters for a variety of Texas binders show that even measuring hardening rates at 60 °C does not give accurate relative comparisons of pavement hardening, due to the activation energy effect on hardening rates at different temperatures. Thus, the only method for comparing pavement hardening rates of different binders accurately is to determine the oxidation and hardening kinetic parameters at several temperatures and then to calculate pavement rates using a temperature history model. Mixture Fatigue Life Decline with Oxidative Aging
The CMSE approach utilizes fundamental material properties and was found to be an effective approach to determine the fatigue resistance of HMAC, in agreement with the results of a previous study by Walubita et al. (2006a). The CMSE approach utilizes test protocols that represent actual field HMAC conditions including anisotropy, healing, crack initiation, crack propagation, and the effects of binder oxidative aging. Under strain-controlled conditions, mixture fatigue data showed that HMAC fatigue life follows a power-law decline with oxidative aging. As a general observation based on the mixtures evaluated in this project and consistent with the effect of oxidative hardening on fatigue resistance, the softer the HMAC mixture as indicated by RM parameters, the better the HMAC mixture performs in terms of fatigue resistance. Mixture fatigue resistance decline with oxidative aging can be a very strong function of mixture design. However, little is understood about the fundamental mixture properties that are responsible for these variations. Utility Theory was used to explain the effect of geometric aggregate properties on the HMAC mixture properties and ultimately mixture fatigue life. The rate of binder hardening in pavements, coupled with the impact of the hardening on mixture fatigue can lead to widely different performances between different mixture designs and between different polymer modified binders. A cumulative damage model developed for project 0-4468 shows expected fatigue lives (considering simultaneous traffic loading and binder aging throughout pavement service) provide estimates of 5, 10, and 15 years service for three polymer-modified mixture designs evaluated in this project. These very significant differences need further study. A Protocol for Assessing PMA Durability in Pavements A protocol was developed that consists of two steps: 1) determine measures of modified binder durability, and 2) estimate pavement fatigue life based upon these and other measures using a cumulative damage approach. The first step provides a method of classifying binders as to expected durability in pavements while the second step provides a rationale for expressing that durability in terms of pavement life.
9-5
The second step requires non-conventional information on pavement mixtures that is not currently available and is not easily obtained, and thus, likely cannot yet be implemented; a far better fundamental understanding of the impact of binder oxidative aging on fatigue life decline, and as it relates to mixture parameters, is required. The protocol is preliminary and will require revision and correction as more and better data are obtained and as a better fundamental understanding of mixture performance and the impact of binder oxidation is achieved. Binder Durability Measures Binder conditioning steps and measurements were developed to estimate the impact of polymer modifier on three base binder properties: 1) hardening rate (in terms of the DSR function) in 1 mm films at 90 °C and 20 atm air; 2) level of binder stiffness (in terms of the DSR function), and 3) elongation at break (either in terms of direct tension or ductility). A fourth measure addresses the absolute level of the modified binder stiffness (in terms of the DSR function): 4) DSR function stiffness relative to an arbitrary value of 0.0001 MPa/s. Estimating Pavement Fatigue Life Two methods were developed for estimating pavement fatigue life. The first method is very approximate, based only upon (presumed or measured) binder hardening rates in pavements and assumed pavement properties. The second method uses binder hardening rates, but also uses measured mixture properties and therefore should give a much better estimate of service life. The methods have not been validated by comparisons to actual pavement performance and thus, the protocol is a strawman, to be tested and improved upon. RECOMMENDATIONS Implement Methods for Maximizing Pavement Durability
The following methods for significantly improving pavement durability have been identified and should be implemented as soon as possible.
• Construct pavements with the lowest possible accessible (interconnected) air voids, consistent with other best construction and mix design practices. Target achieving less than 2 percent, the lower the better from an aging perspective. Decreasing the binder hardening rate in pavements by about 50 percent appears to be a reasonable goal.
• Use mix designs that have an inherently low decrease in fatigue life with binder
oxidation, coupled with an appropriately high initial fatigue life.
• Use the pavement aging model for pavement design on a trial basis so that engineers become familiar with pavement aging rates in Texas.
• Use binders with a minimum DSR function at the PAV* 16 hr condition (consistent with
the appropriate performance grade).
9-6
• Use polymer-modified asphalts that have a good base binder ductility-DSR function behavior at the PAV* 16 hr condition and for which modification improves the behavior.
• When a modified binder’s base binder is not available for measurement, consider aging
the modified binder to a higher level, PAV* 48 hr, e.g., and measure its ductility (measured or from DT measurements)-DSR function characteristics, as an indirect method of assessing the quality of the base binder ductility (direct tension) in lieu of Criterion 3b (Chapter 8). This approach is based on the observation that modified binders revert to their unmodified base binder behavior with enough oxidative aging. In this scenario, Criteria 1 and 2 would not be available, leaving only Criteria 3a and 4 (plus this substitute Criterion 3b) to be assessed.
• As a perpetual pavement strategy, use a porous friction course surface overlay of from 2
to 3 inches to reduce the oxidation rate of the top of the sub-layer by about 15 percent by reducing its maximum temperature. Remove and replace the PFC as needed. Further reductions in the oxidation rate by using a thicker overlay would be minimal and probably not cost-effective, based on the oxidation model calculations. The life-cycle cost-effectiveness of such an overlay should be determined.
• Assure that the base, subbase, and subgrade are firm and stable, to the extent feasible.
The more rigid the pavement system (except when created by a stiffer binder), the better.
Other factors, not easily controlled or determined, also can lead to improved durability.
• Use binders that have inherently slow hardening rates in pavements. This objective requires detailed binder oxidation kinetics studies over at least a range of temperatures and ideally over a range of oxygen pressures as well.
• Use modifiers that provide the most reduction in the hardening rate. Detailed kinetics data on the modified binders are also required.
Further Research and Development A number of research and development efforts, based on the above methods for improving pavement durability, should be established.
• Determine the parameters that govern the decline of mixture fatigue life with binder hardening. This is a very high priority. This project should include studying the rich bottom layer (RBL) mixture design, as well as others. The work should develop procedures for optimizing mixture performance of all types, taken as a whole: rutting, thermal cracking, and initial fatigue resistance, in addition to the decline of fatigue resistance with binder oxidative hardening.
• Develop a database of mixture design fatigue parameters and use these parameters in mix
design optimization and selection.

9-7
• Determine methods to reliably and with minimal risk to other construction parameters, achieve very low accessible air voids in pavements. This also should be a very high priority. The RBL may be an excellent candidate for which construction and performance results are already available.
• Develop an improved binder pavement aging model by adding oxygen transport as a
function of accessible air voids. Such a method should then be implemented in pavement design in different climates.
• Develop and implement major changes to the MEPDG with respect to binder oxidative
aging. The current MEPDG has almost everything wrong with respect to binder aging. This effort may impact some of the other assumptions of pavement design as well.

10-1
CHAPTER 10
REFERENCES AASHTO. (1993) AASHTO Designation: PP19, Standard Practice for Bulk Specific Gravity of Compacted Bituminous Mixtures Using Saturated Surface Dry Specimens. AASHTO Provisional Standards, Washington, D.C., June Ed. AASHTO. (1994) AASHTO Designation: PP2, Standard Practice for Short and Long Term Aging of Hot Mix Asphalt. AASHTO Provisional Standards, Washington, D.C., June Ed. AASHTO. (2000) AASHTO Designation: T 166-00, Standard Method of Test for Bulk Specific Gravity of Compacted Bituminous Mixtures Using Saturated Surface Dry Specimens. Washington D.C. AASHTO. (2002) (NCHRP 1-37A) Pavement Design Guide. http://trb.org/mepdg, Accessed November 2004. Al-Azri, N.A., S.H. Jung, K.M. Lusford, A. Ferry, J.A. Bullin, R.R. Davison, and C.J. Glover. (2006) Binder Oxidative Aging in Texas Pavements: Hardening Rates, Hardening Susceptibilities, and the Impact of Pavement Depth. Transportation Research Record, No. 1962, pp. 12-20. Alrousan, T.M. (2004) Characterization of Aggregate Shape Properties Using a Computer Automated System. Ph.D. Dissertation, Texas A&M University, College Station, TX. ASTM D 4124. (1994) Standard Test Methods for Separation of Asphalt into Four Fractions. 1994 Annual Book of ASTM Standards, 04.03, ASTM, Easton , MD. ASTM D 6752. (2004) Standard Test Methods for Bulk Specific Gravity and Density of Compacted Bituminous Mixtures Using Automatic Vacuum Sealing Method. 2004 Annual Book of ASTM Standards, 04.03, ASTM, West Conshohocken, PA. ASTM D 6857. (2003) Standard Test Methods for Maximum Specific Gravity and Density of Bituminous Paving Mixtures Using Automatic Vacuum Sealing Method. 2003 Annual Book of ASTM Standards, 04.03, ASTM, West Conshohocken, PA. Bhasin, A. (2006) Development of Methods to Quantify Bitumen-Aggregate Adhesion and Loss of Adhesion Due to Water. Ph.D. Dissertation, Texas A&M University, College Station, Texas. Blanco, R., R. Rodriguez, M. Carcia-Carduno, and V.M. Castano. (1995) Morphology and Tensile Properties of Styrene-Butadiene Copolymer Reinforced Asphalt. Journal of Applied Polymer Science, Vol. 56, pp. 57-64. Bouldin, M.G., and J.H. Collins. (1992) Influence of Binder Rheology on Rutting Resistance of Polymer Modified and Unmodified Hot Mix Asphalt. In ASTM STP 1108: Polymer Modified
10-2
Asphalt Binders, K.R. Wardlaw and S. Shuler (Eds.), American Society for Testing and Materials, San Antonio, TX, pp. 55-60. Burr, B.L., R.R. Davison, C.J. Glover, and J.A. Bullin. (1990) Solvent Removal from Asphalt. Transportation Research Record, No. 1269, pp. 1-8. Burr, B.L., R.R. Davison, H.B. Jemison, C.J. Glover, and J.A. Bullin. (1991) Asphalt Hardening in Extraction Solvents, Transportation Research Record, No.1323, pp. 70-76. Burr, B.L., C.J. Glover, R.R. Davison, and J.A. Bullin. (1993) New Apparatus and Procedure for the Extraction and Recovery of Asphalt Binder from Pavement Mixtures. Transportation Research Record, No.1391, pp. 20-29. Burr, B.L., R.R. Davison, C.J. Glover, and J.A. Bullin. (1994) Softening of Asphalts in Dilute Solutions at Primary Distillation Conditions, Transportation Research Record, No.1436, pp. 47-53. Carslaw, H.S., and J.C. Jaeger. (1959) Conduction of Heat in Solids. 2nd edition, Oxford Science Publications. Chaffin, J.M., R.R. Davison, C.J. Glover, and J.A. Bullin. (1995) Viscosity Mixing Rules for Asphalt Recycling. Transportation Research Record, No. 1507, pp. 78-85. Chen, J.S., M.C. Liao, and M.S. Shiah. (2002) Asphalt Modified by Styrene-Butadiene-Styrene Triblock Copolymer: Morphology and Model. Journal of Materials in Civil Engineering, Vol. 14, No. 3, pp. 224-229. Cheng, D. (2002) Surface Free Energy of Asphalt-Aggregate System and Performance Analysis of Asphalt Concrete Based on Surface Energy. Ph.D. Dissertation, Texas A&M University, College Station, TX. Cipione, C.A., R.R. Davison, B.L. Burr, C.J. Glover, and J.A. Bullin. (1991) Evaluation of Solvents for the Extraction of Residual Asphalt from Aggregates, Transportation Research Record, No. 1323, pp.47-52. Clark, R.C. (1958) Practical Results of Asphalt Hardening on Pavement Life. Journal of Association of Asphalt Paving Technologists, Vol. 27, pp. 196-208. Coons, R.F., and P.H. Wright. (1968) An Investigation of the Hardening of Asphalt Recovered from Pavements of Various Ages. Association of Asphalt Paving Technologists, Vol. 37, pp. 510. Corbett, L.W. (1979) Dumbbell Mix for Better Asphalt. Hydrocarbon Processing, Vol. 58, pp. 173. Domke, C.H., R.R. Davison, and C.J. Glover. (1999) Effect of Oxidation Pressure on Asphalt Hardening Susceptibility. Transportation Research Record, No. 1661, pp. 114-121.
10-3
Domke, C.H., R.R. Davison, and C.J. Glover. (2000) Effect of Oxygen Pressure on Asphalt Oxidation Kinetics. Industrial & Engineering Chemistry Research, Vol. 39 (3), pp. 592-598. Doyle, P.C. (1958) Cracking Characteristic of Asphalt Cement. Association of Asphalt Paving Technologists, Vol. 27, pp. 581-597. Freeman, T. (2004) Flexible Pavement Database. Research Project 187-06, Texas Transportation Institute, College Station, TX. Fu, H., L. Xie, D. Dou, L. Li, M. Yu, and S. Yao. (2006) Storage Stability and Compatibility of Asphalt Binder Modified by SBS Graft Copolymer. Construction and Building Materials, Article in Press. Glover, C.J., R.R. Davison, C.H. Domke, Y. Ruan, P. Juristyarini, D.B. Knorr, and S.H. Jung. (2005) Development of a New Method for Assessing Asphalt Binder Durability with Field Validation. Report FHWA/TX-03/1872-2, Texas Transportation Institute, College Station, TX. Goodrich, J.L. (1998) Asphalt and Polymer Modified Asphalt Properties Related to the Performance of Asphalt Concrete Mixes. Association of Asphalt Paving Technologists, Vol. 57, pp. 116-175. Halstead, W.J. (1963) The Relation of Asphalt Ductility to Pavement Performance. Association of Asphalt Paving Technologists, Vol. 32, pp. 247-270. Halstead, W.J. (1984) Relation of Asphalt Chemistry to Physical Properties and Specifications. Research Report No. FHWA/VA-84/85, Virginia Department of Highways and Transportation, VA. Halstead, W.J. (1985) Relation of Asphalt Chemistry to Physical Properties and Specifications. Journal of Association of Asphalt Paving Technologists, Vol. 54, pp. 91-117. Huang, Y.H. (1993) Pavement Analysis and Design. Prentice Hall, Englewood Cliffs, NJ. Huang, Y.H. (2004) Pavement Analysis and Design. 2nd Edition, Pearson Education, Inc. Jemison, H.B., B.L. Burr, R.R. Davison, J.A. Bullin, and C.J. Glover. (1992) Application and Use of the ATR, FTIR Method to Asphalt Aging Studies. Fuel Science and Technology International, Vol. 10, pp. 795-808. Juristyarini, P. (2003) Asphalt Modification and Testing of Performance-Related Cracking Failure Properties. Ph.D. Dissertation, Texas A&M University, College Station, TX. Kandhal, P.S., and M.E. Wenger (1975) Asphalt Properties in Relation to Pavement Performance. Transportation Research Record, No. 544, pp. 1-13.
10-4
Kandhal, P.S. (1977) Low-Temperature Ductility in Relation to Pavement Performance. In ASTM STP 628: Low-Temperature Properties of Bituminous Materials and Compacted Bituminous Paving Mixtures. American Society for Testing and Materials, Philadelphia, PA, pp.95-106. Kandhal, P.S., and W.C. Koehler. (1984) Significant studies on asphalt durability: Pennsylvania experience. Transportation Research Record, No. 999, pp. 41-50. Kim, Y.R., H.J. Lee, and D.N. Little. (1997a) Fatigue Characterization of Asphalt Concrete Using Viscoelasticity and Continuum Damage Theory (with Discussion). Journal of the Association of Asphalt Paving Technologists, Vol. 66, pp. 520-569. Kim, Y.R., H.J. Lee, Y. Kim, and D.N. Little. (1997b) Mechanistic Evaluation of Fatigue Damage Growth and Healing of Asphalt Concrete: Laboratory and Field Experiments. In Eighth International Conference on Asphalt Pavements, University of Washington, Seattle, WA, pp. 1089-1107. Lau, C.K., K.M. Lunsford, C.J. Glover, R.R. Davison, and J.A. Bullin. (1992) Reaction Rates and Hardening Susceptibilities as Determined from POV Aging of Asphalts. Transportation Research Record, No. 1342, pp. 50-57. Lee, D.Y., and R.J. Huang. (1973) Weathering of Asphalts as Characterized by Infrared Multiple Internal Reflection Spectra. Analytical Chemistry, Vol. 46, p. 2242. Leicht, S.E., P. Juristyarini, R.R. Davison, and C.J. Glover. (2001) An Investigation of Oxidative Curing on the Properties of High Cure Asphalt Rubber. Petroleum Science and Technology, Vol. 19, Nos. 3 and 4, pp. 317-334. Lin, M.S., J.M. Chaffin, M.Liu, C.J. Glover, R.R. Davison, and J.A. Bullin. (1996) The Effect of Asphalt Composition on the Formation of Asphaltenes and Their Contribution to Asphalt Viscosity. Fuel Science and Technology International, Vol. 14 (1&2), pp. 139-162. Lin, M.S., J.M. Chaffin, R.R. Davison, C.J. Glover, and J.A. Bullin. (1998) A New Suspension Viscosity Model and Its Application to Asphaltene Association. Thermodynamics and Structures. Lin, M.S., K.M. Lunsford, C.J. Glover, R.R. Davison, and J.A. Bullin. (1995) The Effects of Asphaltenes on the Chemical and Physical Characteristics of Asphalts. In Asphaltenes: Fundamentals and Applications, E.Y. Sheu and O.C. Mullins (Eds.), Plenum Press, NY. Liu, M., K.M. Lunsford, R.R. Davison, C.J. Glover, and J.A. Bullin. (1996) The Kinetics of Carbonyl Formation in Asphalt. AIChE J., Vol. 42 (4), pp. 1069-1076 Liu, M., J.M. Chaffin, R.R. Davison, C.J. Glover, and J.A. Bullin. (1997) Reactivity of Asphalt Supercritical Fractions. Industrial & Engineering Chemistry Researc, Vol. 36 (6), pp. 2177-2183.
10-5
Liu, M., J.M. Chaffin, R.R. Davison, C.J. Glover, and J.A. Bullin. (1998a) Changes in Corbett Fraction Composition during Oxidation of Asphalt Fractions. Transportation Research Record, No. 1638, pp. 40-46. Liu, M., M.A. Ferry, R.R. Davison, C.J. Glover, and J.A. Bullin. (1998b) Oxygen Uptake as Correlated to Carbonyl Growth in Aged Asphalts and Asphalt Corbett Fractions. Industrial & Engineering Chemistry Research, Vol. 37, pp. 4669-4674. Lu, X., and U. Isacsson. (1997a) Chemical and Rheological Evaluation of Aging Properties of SBS Polymer Modified Bitumens. Fuel, Vol. 77, pp. 961-972. Lu X., and U. Isacsson. (1997b) Rheological Characterization of Styrene-Butadiene-Styrene Copolymer Modified Asphalt. Construction and Building Materials, Vol. 11, No. 1, pp. 1811-1824. Lu X., and U. Isacsson. (1999) Chemical and Rheological Characteristics of Styrene-Butadiene- Styrene Polymer-Modified Bitumens. Transportation Research Record, No. 1661, pp. 83-92. Lu, X., and U. Isacsson. (2000) Artificial Aging of Polymer Modified Bitumens. Journal of Applied Polymer Science, Vol. 76, No. 12, pp. 1811-1824. Lu, X., and U. Isacsson. (2001) Modification of Road Bitumens with Thermoplastic Polymers. Polymer Testing, Vol. 20, pp. 77-86. Lytton, R.L., J. Uzan, E.G. Fernando, R. Roque, D. Hiltunen, and S. Stoffels. (1993) Development and Validation of Performance Prediction Models and Specifications for Asphalt Binders and Paving Mixes. Report SHRP-A-357, Strategic Highway Research Program, National Research Council, Washington, D.C. Martin, K.L., R.R. Davison, C.J. Glover, and J.A. Bullin. (1990) Asphalt Aging in Texas Roads and Test Sections. Transportation Research Record, No. 1269, pp. 9-19. Ofori-Abebresse, E. (2006) Fatigue Resistance of Hot-Mix Asphalt Concrete (HMAC) Mixture Using the Calibrated Mechanistic with Surface Energy (CMSE) Measurements Approach. M.S. Dissertation, Texas A&M University, College Station, TX. Palmouist, D., B. Worel, and W. Zerfas. (2002) 2002 Mn/Road Hot-Mix Asphalt Mainline Test Cell Condition Report. Minesota Road Research Project, Minnesota Department of Transportation, MN. Petersen, J.C., J.F. Branthaver, R.E. Robertson, P.M. Harnsberger, J.J. Duvall, and E.K. Ensley. (1993) Effects of Physicochemical Factors on Asphalt Oxidation Kinetics. Transportation Research Record, No. 1391, p. 1. Ruan, Y., R.R. Davison, and C.J. Glover. (2003a) Oxidation and Viscosity Hardening of Polymer-Modified Asphalts. Energy & Fuel, Vol. 17 pp. 991-998.
10-6
Ruan, Y., R.R. Davison, and C.J. Glover. (2003b) The Effect of Long-Term Oxidation on the Rheological Properties of Polymer Modified Asphalts. Fuel, Vol. 82, pp. 1763-1773. Ruan, Y., R.R. Davison, and C.J. Glover. (2003c) An Investigation of Asphalt Durability: Relationships between Ductility and Rheological Properties for Unmodified Asphalts. Petroleum Science and Technology, Vol. 21, Nos. 1-2, pp. 231-254. Schapery, R.A. (1984) Correspondence Principles and a Generalized J Integral for Large Deformation and Fracture-Analysis of Viscoelastic Media. International Journal of Fracture, Vol. 25, No. 3, pp. 195-223. Shuler, T.S., J.H. Collins, and J.P. Kirkpatrick. (1987) Polymer-Modified Asphalt Properties Related to Asphalt Concrete Performance. ASTM STP 941, ASTM, Philadelphia, PA. Si, Z. (2001) Characterization of Microdamage and Healing of Asphalt Concrete Mixtures. Ph.D. Dissertation, Texas A&M University, College Station, TX. Slavik, J. (1996) Fluorescence Microscopy and Fluorescent Probes. New York Plenum Press. Smith, R.E., M.I. Darter, and S.M. Herrin. (1979) Highway Pavement Distress Identification Manual for Highway Condition and Quality of Highway Construction Survey. NCHRP 1-19, Federal Highway Administration. Streitel, S.G. (1995) Luminescent Materials (Fluorescent). Kirk Othmer Encyclopedia of Chemical Technology, 4th Edition, John Wiley and Sons. Thenoux, G., C.A. Bell, and J.E. Wilson. (1988) Evaluation of Asphalt Physical and Fractional Properties and Their Interrelationship, TRB Annual Meeting, Washington D.C. TxDOT. (2003) Condition of Texas Pavements. Pavement Management Information System (PMIS) Annual Report, FY 2001-2003. Texas Dept. of Transportation, Construction Division, Materials and Pavement Section, Austin, TX. U.S. Geological Survey. A Global Crustal Model. http://www.usgs.gov, Accessed October, 2006. Vassiliev, N.Y., R.R. Davison, and C.J. Glover. (2002) Development of a Stirred Airflow Test Procedure for Short-Term Aging of Asphaltic Materials. Bituminous Binders, No. 1810, 2002, pp. 25-32. Vellerga, B.A., and W.J. Halstead. (1971) Effects of Field Aging on Fundamental Properties of Paving Asphalts, Highway Research Record, Vol. 361, pp. 71-92. Walubita, L.F., A.E. Martin, S.H. Jung, C.J. Glover, E.S. Park, A. Chowdhury, and R.L. Lytton (2005) Comparison of Fatigue Analysis Approaches for Two Hot Mix Asphalt Concrete (HMAC) Mixtures. FHWA/TX-05/0-4468-2, Texas Transportation Institute, College Station, TX.
10-7
Walubita, L.F. (2006a) Comparison of Fatigue Analysis Approaches for Predicting Fatigue Lives of Hot Mix Asphalt Concrete Mixtures (HMAC). Ph.D. Dissertation, Texas A&M University, College Station, TX. Walubita, L.F., A.E. Martin, S.H. Jung, C.J. Glover, and E.S. Park. (2006b) Application of Calibrated Mechanistic Fatigue Analysis with Aging Effects. Report FHWA/TX-06/0-4468-3, Texas Transportation Institute, College Station, TX. Walubita, L.F., A.E. Martin, and G.S. Cleveland. (2006c) Application of the New M-E Pavement Design Guide Software for Fatigue Characterization of Three Texas Asphalt Mixtures. Paper accepted for presentation at the 10th ICAP 2006 Conference in Quebec, Canada, August 12-17. Welborn, J.Y. (1984) Physical Properties as Related to Asphalt Durability: State of the Art. Transportation Research Record, No. 999, pp. 31-36. Worel, B., T. Anderson, and R. Mulvaney. (2003) 1999 MnRoad SuperPave Tracking (S.P. 8816-40) Low Volume Road Cells 33-35. Minnesota Road Research Project, Minnesota Department of Transportation, MN.

2-A-1
APPENDICES FOR CHAPTER 2
APPENDIX 2-A
TABLES OF CORBETT ANALYSIS DATA

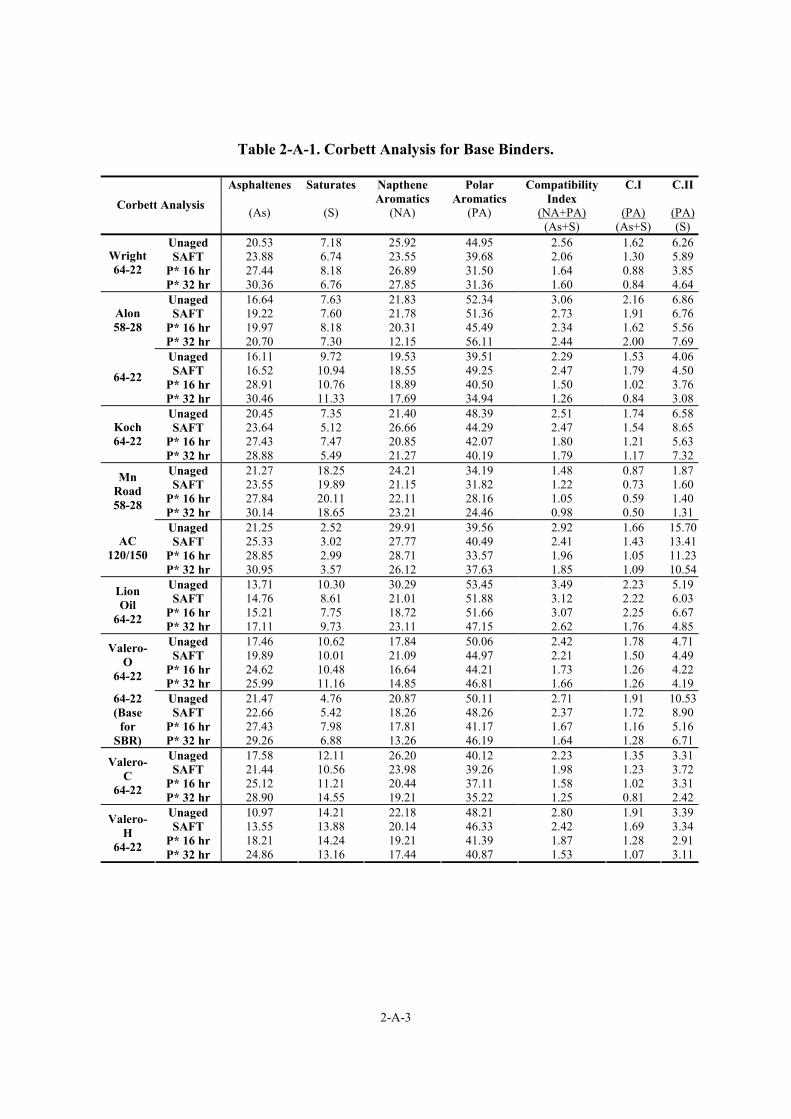
2-A-3
Table 2-A-1. Corbett Analysis for Base Binders.
Asphaltenes Saturates Napthene Polar Compatibility C.I C.II Aromatics Aromatics Index
(As) (S) (NA) (PA) (NA+PA) (PA) (PA)Corbett Analysis
(As+S) (As+S) (S) Unaged 20.53 7.18 25.92 44.95 2.56 1.62 6.26SAFT 23.88 6.74 23.55 39.68 2.06 1.30 5.89
P* 16 hr 27.44 8.18 26.89 31.50 1.64 0.88 3.85Wright 64-22
P* 32 hr 30.36 6.76 27.85 31.36 1.60 0.84 4.64Unaged 16.64 7.63 21.83 52.34 3.06 2.16 6.86SAFT 19.22 7.60 21.78 51.36 2.73 1.91 6.76
P* 16 hr 19.97 8.18 20.31 45.49 2.34 1.62 5.56Alon 58-28
P* 32 hr 20.70 7.30 12.15 56.11 2.44 2.00 7.69Unaged 16.11 9.72 19.53 39.51 2.29 1.53 4.06SAFT 16.52 10.94 18.55 49.25 2.47 1.79 4.50
P* 16 hr 28.91 10.76 18.89 40.50 1.50 1.02 3.7664-22
P* 32 hr 30.46 11.33 17.69 34.94 1.26 0.84 3.08Unaged 20.45 7.35 21.40 48.39 2.51 1.74 6.58SAFT 23.64 5.12 26.66 44.29 2.47 1.54 8.65
P* 16 hr 27.43 7.47 20.85 42.07 1.80 1.21 5.63Koch 64-22
P* 32 hr 28.88 5.49 21.27 40.19 1.79 1.17 7.32Unaged 21.27 18.25 24.21 34.19 1.48 0.87 1.87SAFT 23.55 19.89 21.15 31.82 1.22 0.73 1.60
P* 16 hr 27.84 20.11 22.11 28.16 1.05 0.59 1.40
Mn Road 58-28 P* 32 hr 30.14 18.65 23.21 24.46 0.98 0.50 1.31
Unaged 21.25 2.52 29.91 39.56 2.92 1.66 15.70SAFT 25.33 3.02 27.77 40.49 2.41 1.43 13.41
P* 16 hr 28.85 2.99 28.71 33.57 1.96 1.05 11.23AC
120/150 P* 32 hr 30.95 3.57 26.12 37.63 1.85 1.09 10.54Unaged 13.71 10.30 30.29 53.45 3.49 2.23 5.19SAFT 14.76 8.61 21.01 51.88 3.12 2.22 6.03
P* 16 hr 15.21 7.75 18.72 51.66 3.07 2.25 6.67
Lion Oil
64-22 P* 32 hr 17.11 9.73 23.11 47.15 2.62 1.76 4.85Unaged 17.46 10.62 17.84 50.06 2.42 1.78 4.71SAFT 19.89 10.01 21.09 44.97 2.21 1.50 4.49
P* 16 hr 24.62 10.48 16.64 44.21 1.73 1.26 4.22
Valero-O
64-22 P* 32 hr 25.99 11.16 14.85 46.81 1.66 1.26 4.19Unaged 21.47 4.76 20.87 50.11 2.71 1.91 10.53SAFT 22.66 5.42 18.26 48.26 2.37 1.72 8.90
P* 16 hr 27.43 7.98 17.81 41.17 1.67 1.16 5.16
64-22 (Base
for SBR) P* 32 hr 29.26 6.88 13.26 46.19 1.64 1.28 6.71
Unaged 17.58 12.11 26.20 40.12 2.23 1.35 3.31SAFT 21.44 10.56 23.98 39.26 1.98 1.23 3.72
P* 16 hr 25.12 11.21 20.44 37.11 1.58 1.02 3.31
Valero- C
64-22 P* 32 hr 28.90 14.55 19.21 35.22 1.25 0.81 2.42Unaged 10.97 14.21 22.18 48.21 2.80 1.91 3.39SAFT 13.55 13.88 20.14 46.33 2.42 1.69 3.34
P* 16 hr 18.21 14.24 19.21 41.39 1.87 1.28 2.91
Valero-H
64-22 P* 32 hr 24.86 13.16 17.44 40.87 1.53 1.07 3.11
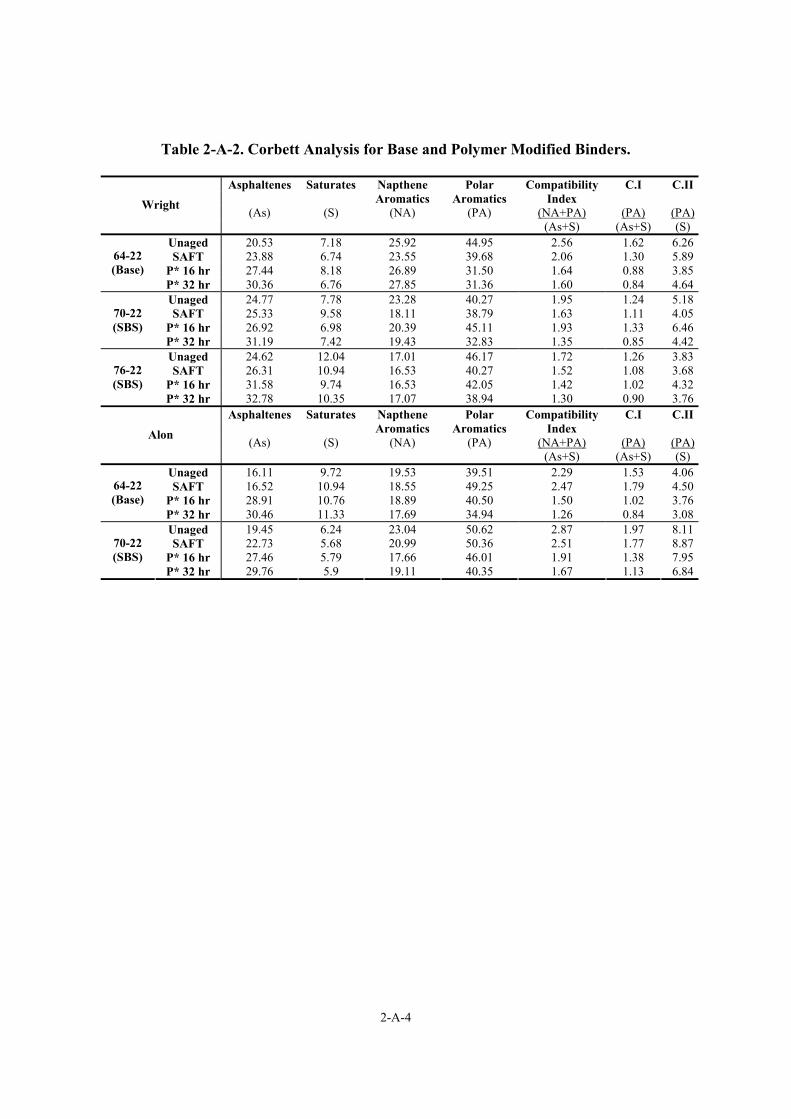
2-A-4
Table 2-A-2. Corbett Analysis for Base and Polymer Modified Binders.
Asphaltenes Saturates Napthene Polar Compatibility C.I C.II Aromatics Aromatics Index
(As) (S) (NA) (PA) (NA+PA) (PA) (PA)Wright
(As+S) (As+S) (S) Unaged 20.53 7.18 25.92 44.95 2.56 1.62 6.26SAFT 23.88 6.74 23.55 39.68 2.06 1.30 5.89
P* 16 hr 27.44 8.18 26.89 31.50 1.64 0.88 3.8564-22 (Base)
P* 32 hr 30.36 6.76 27.85 31.36 1.60 0.84 4.64Unaged 24.77 7.78 23.28 40.27 1.95 1.24 5.18SAFT 25.33 9.58 18.11 38.79 1.63 1.11 4.05
P* 16 hr 26.92 6.98 20.39 45.11 1.93 1.33 6.4670-22 (SBS)
P* 32 hr 31.19 7.42 19.43 32.83 1.35 0.85 4.42Unaged 24.62 12.04 17.01 46.17 1.72 1.26 3.83SAFT 26.31 10.94 16.53 40.27 1.52 1.08 3.68
P* 16 hr 31.58 9.74 16.53 42.05 1.42 1.02 4.3276-22 (SBS)
P* 32 hr 32.78 10.35 17.07 38.94 1.30 0.90 3.76Asphaltenes Saturates Napthene Polar Compatibility C.I C.II
Aromatics Aromatics Index (As) (S) (NA) (PA) (NA+PA) (PA) (PA)Alon
(As+S) (As+S) (S) Unaged 16.11 9.72 19.53 39.51 2.29 1.53 4.06SAFT 16.52 10.94 18.55 49.25 2.47 1.79 4.50
P* 16 hr 28.91 10.76 18.89 40.50 1.50 1.02 3.7664-22 (Base)
P* 32 hr 30.46 11.33 17.69 34.94 1.26 0.84 3.08Unaged 19.45 6.24 23.04 50.62 2.87 1.97 8.11SAFT 22.73 5.68 20.99 50.36 2.51 1.77 8.87
P* 16 hr 27.46 5.79 17.66 46.01 1.91 1.38 7.9570-22 (SBS)
P* 32 hr 29.76 5.9 19.11 40.35 1.67 1.13 6.84
2-B-1
APPENDICES FOR CHAPTER 2
APPENDIX 2-B
TABLES OF RHEOLOGICAL PROPERTIES, DUCTILITY, AND CARBONYL AREA DATA

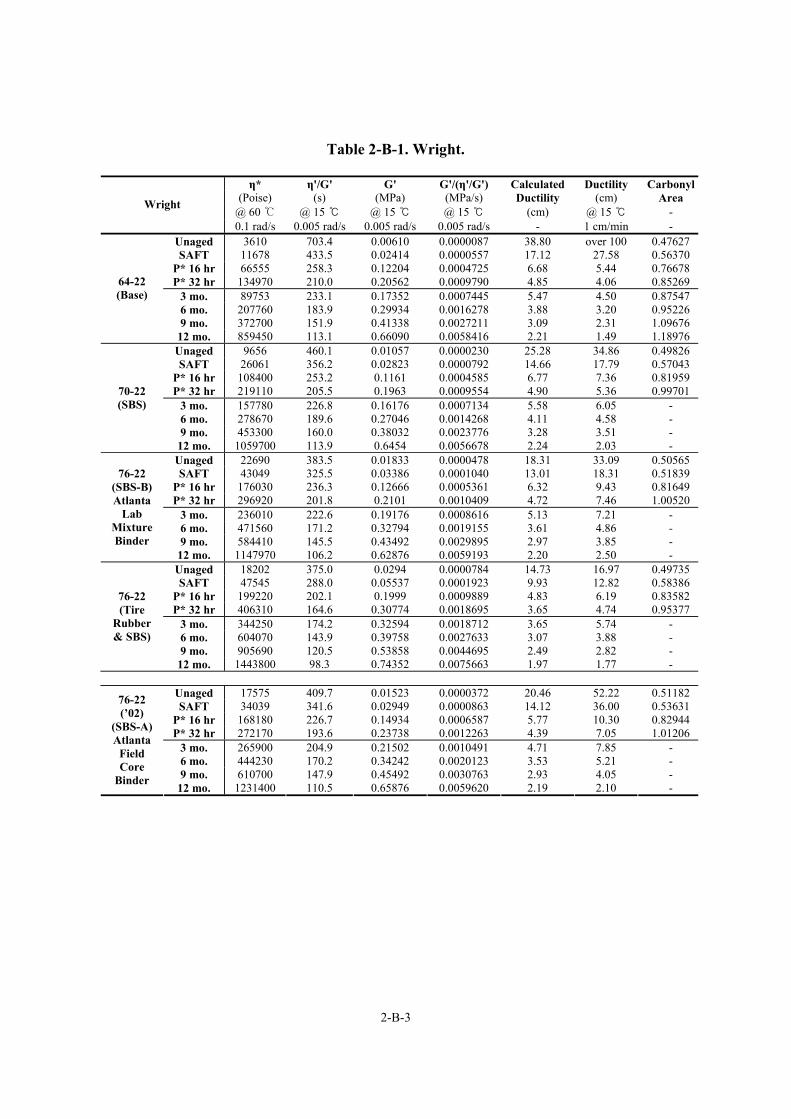
2-B-3
Table 2-B-1. Wright.
η* η'/G' G' G'/(η'/G') Calculated Ductility Carbonyl(Poise) (s) (MPa) (MPa/s) Ductility (cm) Area
@ 60 ℃ @ 15 ℃ @ 15 ℃ @ 15 ℃ (cm) @ 15 ℃ - Wright
0.1 rad/s 0.005 rad/s 0.005 rad/s 0.005 rad/s - 1 cm/min - Unaged 3610 703.4 0.00610 0.0000087 38.80 over 100 0.47627 SAFT 11678 433.5 0.02414 0.0000557 17.12 27.58 0.56370
P* 16 hr 66555 258.3 0.12204 0.0004725 6.68 5.44 0.76678 P* 32 hr 134970 210.0 0.20562 0.0009790 4.85 4.06 0.85269
3 mo. 89753 233.1 0.17352 0.0007445 5.47 4.50 0.87547 6 mo. 207760 183.9 0.29934 0.0016278 3.88 3.20 0.95226 9 mo. 372700 151.9 0.41338 0.0027211 3.09 2.31 1.09676
64-22 (Base)
12 mo. 859450 113.1 0.66090 0.0058416 2.21 1.49 1.18976 Unaged 9656 460.1 0.01057 0.0000230 25.28 34.86 0.49826 SAFT 26061 356.2 0.02823 0.0000792 14.66 17.79 0.57043
P* 16 hr 108400 253.2 0.1161 0.0004585 6.77 7.36 0.81959 P* 32 hr 219110 205.5 0.1963 0.0009554 4.90 5.36 0.99701
3 mo. 157780 226.8 0.16176 0.0007134 5.58 6.05 - 6 mo. 278670 189.6 0.27046 0.0014268 4.11 4.58 - 9 mo. 453300 160.0 0.38032 0.0023776 3.28 3.51 -
70-22 (SBS)
12 mo. 1059700 113.9 0.6454 0.0056678 2.24 2.03 - Unaged 22690 383.5 0.01833 0.0000478 18.31 33.09 0.50565 SAFT 43049 325.5 0.03386 0.0001040 13.01 18.31 0.51839
P* 16 hr 176030 236.3 0.12666 0.0005361 6.32 9.43 0.81649 P* 32 hr 296920 201.8 0.2101 0.0010409 4.72 7.46 1.00520
3 mo. 236010 222.6 0.19176 0.0008616 5.13 7.21 - 6 mo. 471560 171.2 0.32794 0.0019155 3.61 4.86 - 9 mo. 584410 145.5 0.43492 0.0029895 2.97 3.85 -
76-22 (SBS-B) Atlanta
Lab Mixture Binder
12 mo. 1147970 106.2 0.62876 0.0059193 2.20 2.50 - Unaged 18202 375.0 0.0294 0.0000784 14.73 16.97 0.49735 SAFT 47545 288.0 0.05537 0.0001923 9.93 12.82 0.58386
P* 16 hr 199220 202.1 0.1999 0.0009889 4.83 6.19 0.83582 P* 32 hr 406310 164.6 0.30774 0.0018695 3.65 4.74 0.95377
3 mo. 344250 174.2 0.32594 0.0018712 3.65 5.74 - 6 mo. 604070 143.9 0.39758 0.0027633 3.07 3.88 - 9 mo. 905690 120.5 0.53858 0.0044695 2.49 2.82 -
76-22 (Tire
Rubber & SBS)
12 mo. 1443800 98.3 0.74352 0.0075663 1.97 1.77 -
Unaged 17575 409.7 0.01523 0.0000372 20.46 52.22 0.51182 SAFT 34039 341.6 0.02949 0.0000863 14.12 36.00 0.53631
P* 16 hr 168180 226.7 0.14934 0.0006587 5.77 10.30 0.82944 P* 32 hr 272170 193.6 0.23738 0.0012263 4.39 7.05 1.01206
3 mo. 265900 204.9 0.21502 0.0010491 4.71 7.85 - 6 mo. 444230 170.2 0.34242 0.0020123 3.53 5.21 - 9 mo. 610700 147.9 0.45492 0.0030763 2.93 4.05 -
76-22 (’02)
(SBS-A) Atlanta
Field Core
Binder 12 mo. 1231400 110.5 0.65876 0.0059620 2.19 2.10 -
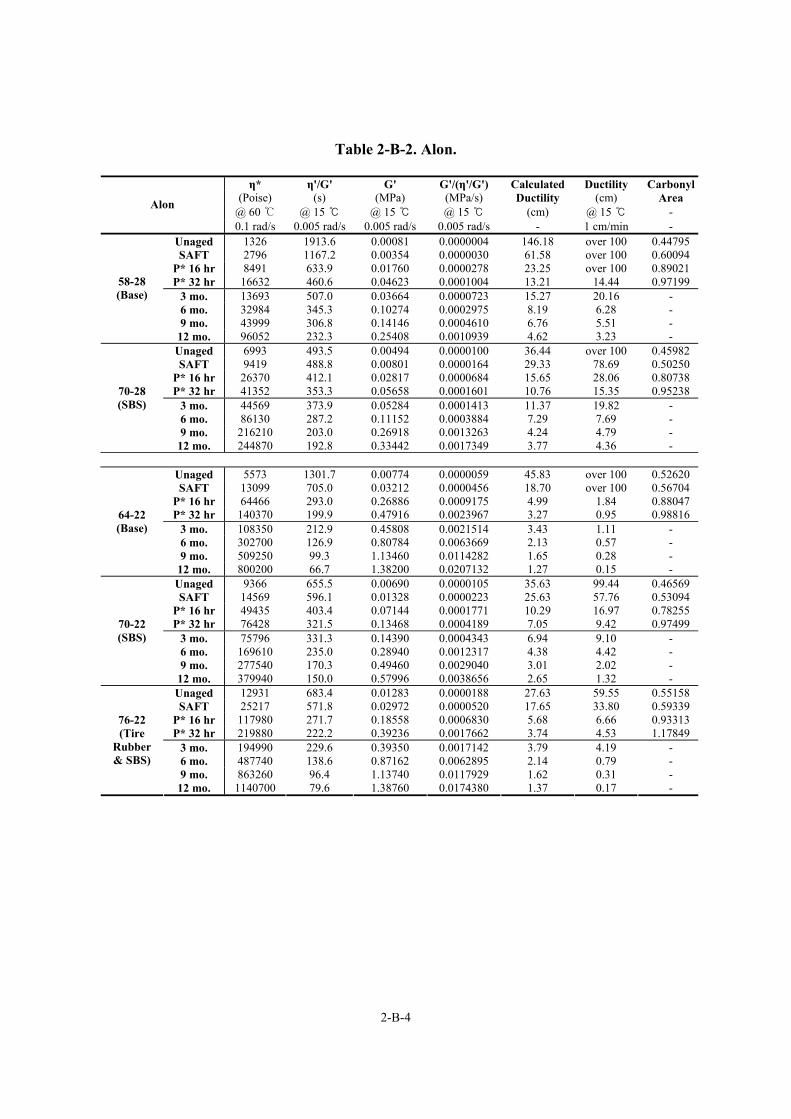
2-B-4
Table 2-B-2. Alon.
η* η'/G' G' G'/(η'/G') Calculated Ductility Carbonyl(Poise) (s) (MPa) (MPa/s) Ductility (cm) Area
@ 60 ℃ @ 15 ℃ @ 15 ℃ @ 15 ℃ (cm) @ 15 ℃ - Alon
0.1 rad/s 0.005 rad/s 0.005 rad/s 0.005 rad/s - 1 cm/min - Unaged 1326 1913.6 0.00081 0.0000004 146.18 over 100 0.44795 SAFT 2796 1167.2 0.00354 0.0000030 61.58 over 100 0.60094
P* 16 hr 8491 633.9 0.01760 0.0000278 23.25 over 100 0.89021 P* 32 hr 16632 460.6 0.04623 0.0001004 13.21 14.44 0.97199
3 mo. 13693 507.0 0.03664 0.0000723 15.27 20.16 - 6 mo. 32984 345.3 0.10274 0.0002975 8.19 6.28 - 9 mo. 43999 306.8 0.14146 0.0004610 6.76 5.51 -
58-28 (Base)
12 mo. 96052 232.3 0.25408 0.0010939 4.62 3.23 - Unaged 6993 493.5 0.00494 0.0000100 36.44 over 100 0.45982 SAFT 9419 488.8 0.00801 0.0000164 29.33 78.69 0.50250
P* 16 hr 26370 412.1 0.02817 0.0000684 15.65 28.06 0.80738 P* 32 hr 41352 353.3 0.05658 0.0001601 10.76 15.35 0.95238
3 mo. 44569 373.9 0.05284 0.0001413 11.37 19.82 - 6 mo. 86130 287.2 0.11152 0.0003884 7.29 7.69 - 9 mo. 216210 203.0 0.26918 0.0013263 4.24 4.79 -
70-28 (SBS)
12 mo. 244870 192.8 0.33442 0.0017349 3.77 4.36 -
Unaged 5573 1301.7 0.00774 0.0000059 45.83 over 100 0.52620 SAFT 13099 705.0 0.03212 0.0000456 18.70 over 100 0.56704
P* 16 hr 64466 293.0 0.26886 0.0009175 4.99 1.84 0.88047 P* 32 hr 140370 199.9 0.47916 0.0023967 3.27 0.95 0.98816
3 mo. 108350 212.9 0.45808 0.0021514 3.43 1.11 - 6 mo. 302700 126.9 0.80784 0.0063669 2.13 0.57 - 9 mo. 509250 99.3 1.13460 0.0114282 1.65 0.28 -
64-22 (Base)
12 mo. 800200 66.7 1.38200 0.0207132 1.27 0.15 - Unaged 9366 655.5 0.00690 0.0000105 35.63 99.44 0.46569 SAFT 14569 596.1 0.01328 0.0000223 25.63 57.76 0.53094
P* 16 hr 49435 403.4 0.07144 0.0001771 10.29 16.97 0.78255 P* 32 hr 76428 321.5 0.13468 0.0004189 7.05 9.42 0.97499
3 mo. 75796 331.3 0.14390 0.0004343 6.94 9.10 - 6 mo. 169610 235.0 0.28940 0.0012317 4.38 4.42 - 9 mo. 277540 170.3 0.49460 0.0029040 3.01 2.02 -
70-22 (SBS)
12 mo. 379940 150.0 0.57996 0.0038656 2.65 1.32 - Unaged 12931 683.4 0.01283 0.0000188 27.63 59.55 0.55158 SAFT 25217 571.8 0.02972 0.0000520 17.65 33.80 0.59339
P* 16 hr 117980 271.7 0.18558 0.0006830 5.68 6.66 0.93313 P* 32 hr 219880 222.2 0.39236 0.0017662 3.74 4.53 1.17849
3 mo. 194990 229.6 0.39350 0.0017142 3.79 4.19 - 6 mo. 487740 138.6 0.87162 0.0062895 2.14 0.79 - 9 mo. 863260 96.4 1.13740 0.0117929 1.62 0.31 -
76-22 (Tire
Rubber & SBS)
12 mo. 1140700 79.6 1.38760 0.0174380 1.37 0.17 -
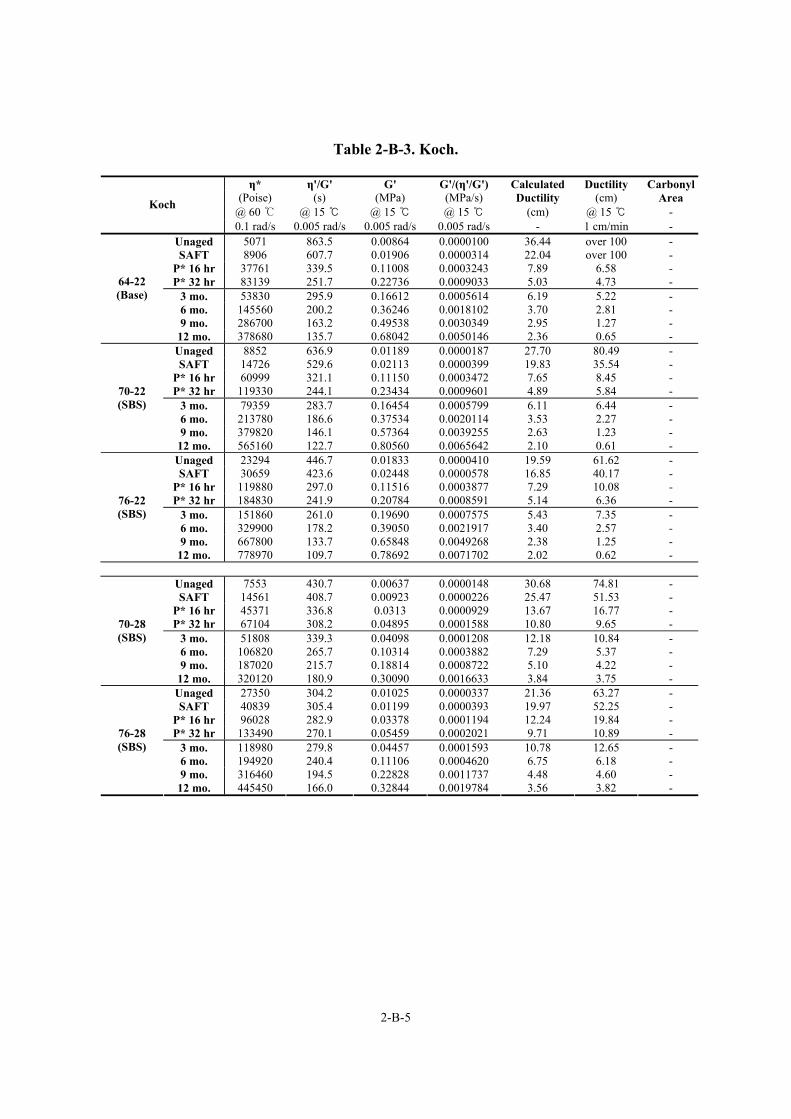
2-B-5
Table 2-B-3. Koch.
η* η'/G' G' G'/(η'/G') Calculated Ductility Carbonyl(Poise) (s) (MPa) (MPa/s) Ductility (cm) Area
@ 60 ℃ @ 15 ℃ @ 15 ℃ @ 15 ℃ (cm) @ 15 ℃ - Koch
0.1 rad/s 0.005 rad/s 0.005 rad/s 0.005 rad/s - 1 cm/min - Unaged 5071 863.5 0.00864 0.0000100 36.44 over 100 - SAFT 8906 607.7 0.01906 0.0000314 22.04 over 100 -
P* 16 hr 37761 339.5 0.11008 0.0003243 7.89 6.58 - P* 32 hr 83139 251.7 0.22736 0.0009033 5.03 4.73 -
3 mo. 53830 295.9 0.16612 0.0005614 6.19 5.22 - 6 mo. 145560 200.2 0.36246 0.0018102 3.70 2.81 - 9 mo. 286700 163.2 0.49538 0.0030349 2.95 1.27 -
64-22 (Base)
12 mo. 378680 135.7 0.68042 0.0050146 2.36 0.65 - Unaged 8852 636.9 0.01189 0.0000187 27.70 80.49 - SAFT 14726 529.6 0.02113 0.0000399 19.83 35.54 -
P* 16 hr 60999 321.1 0.11150 0.0003472 7.65 8.45 - P* 32 hr 119330 244.1 0.23434 0.0009601 4.89 5.84 -
3 mo. 79359 283.7 0.16454 0.0005799 6.11 6.44 - 6 mo. 213780 186.6 0.37534 0.0020114 3.53 2.27 - 9 mo. 379820 146.1 0.57364 0.0039255 2.63 1.23 -
70-22 (SBS)
12 mo. 565160 122.7 0.80560 0.0065642 2.10 0.61 - Unaged 23294 446.7 0.01833 0.0000410 19.59 61.62 - SAFT 30659 423.6 0.02448 0.0000578 16.85 40.17 -
P* 16 hr 119880 297.0 0.11516 0.0003877 7.29 10.08 - P* 32 hr 184830 241.9 0.20784 0.0008591 5.14 6.36 -
3 mo. 151860 261.0 0.19690 0.0007575 5.43 7.35 - 6 mo. 329900 178.2 0.39050 0.0021917 3.40 2.57 - 9 mo. 667800 133.7 0.65848 0.0049268 2.38 1.25 -
76-22 (SBS)
12 mo. 778970 109.7 0.78692 0.0071702 2.02 0.62 -
Unaged 7553 430.7 0.00637 0.0000148 30.68 74.81 - SAFT 14561 408.7 0.00923 0.0000226 25.47 51.53 -
P* 16 hr 45371 336.8 0.0313 0.0000929 13.67 16.77 - P* 32 hr 67104 308.2 0.04895 0.0001588 10.80 9.65 -
3 mo. 51808 339.3 0.04098 0.0001208 12.18 10.84 - 6 mo. 106820 265.7 0.10314 0.0003882 7.29 5.37 - 9 mo. 187020 215.7 0.18814 0.0008722 5.10 4.22 -
70-28 (SBS)
12 mo. 320120 180.9 0.30090 0.0016633 3.84 3.75 - Unaged 27350 304.2 0.01025 0.0000337 21.36 63.27 - SAFT 40839 305.4 0.01199 0.0000393 19.97 52.25 -
P* 16 hr 96028 282.9 0.03378 0.0001194 12.24 19.84 - P* 32 hr 133490 270.1 0.05459 0.0002021 9.71 10.89 -
3 mo. 118980 279.8 0.04457 0.0001593 10.78 12.65 - 6 mo. 194920 240.4 0.11106 0.0004620 6.75 6.18 - 9 mo. 316460 194.5 0.22828 0.0011737 4.48 4.60 -
76-28 (SBS)
12 mo. 445450 166.0 0.32844 0.0019784 3.56 3.82 -
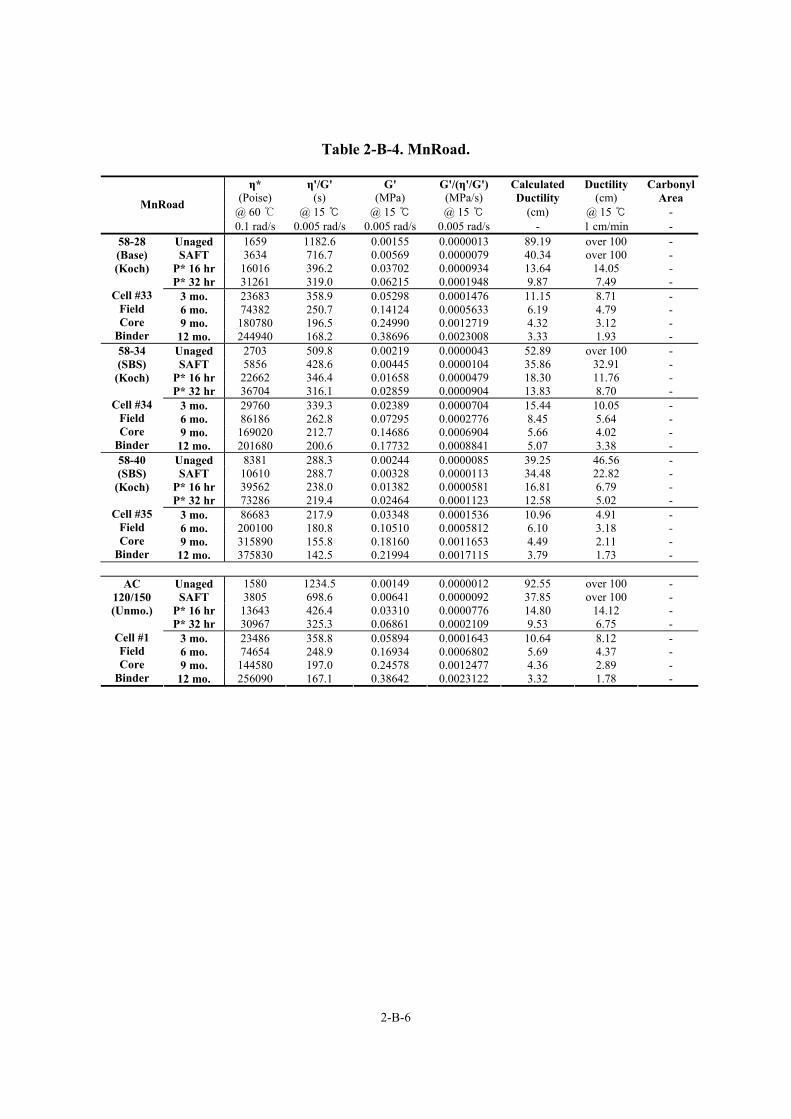
2-B-6
Table 2-B-4. MnRoad.
η* η'/G' G' G'/(η'/G') Calculated Ductility Carbonyl(Poise) (s) (MPa) (MPa/s) Ductility (cm) Area
@ 60 ℃ @ 15 ℃ @ 15 ℃ @ 15 ℃ (cm) @ 15 ℃ - MnRoad
0.1 rad/s 0.005 rad/s 0.005 rad/s 0.005 rad/s - 1 cm/min - Unaged 1659 1182.6 0.00155 0.0000013 89.19 over 100 - SAFT 3634 716.7 0.00569 0.0000079 40.34 over 100 -
P* 16 hr 16016 396.2 0.03702 0.0000934 13.64 14.05 - P* 32 hr 31261 319.0 0.06215 0.0001948 9.87 7.49 -
3 mo. 23683 358.9 0.05298 0.0001476 11.15 8.71 - 6 mo. 74382 250.7 0.14124 0.0005633 6.19 4.79 - 9 mo. 180780 196.5 0.24990 0.0012719 4.32 3.12 -
58-28 (Base) (Koch)
Cell #33
Field Core
Binder 12 mo. 244940 168.2 0.38696 0.0023008 3.33 1.93 - Unaged 2703 509.8 0.00219 0.0000043 52.89 over 100 - SAFT 5856 428.6 0.00445 0.0000104 35.86 32.91 -
P* 16 hr 22662 346.4 0.01658 0.0000479 18.30 11.76 - P* 32 hr 36704 316.1 0.02859 0.0000904 13.83 8.70 -
3 mo. 29760 339.3 0.02389 0.0000704 15.44 10.05 - 6 mo. 86186 262.8 0.07295 0.0002776 8.45 5.64 - 9 mo. 169020 212.7 0.14686 0.0006904 5.66 4.02 -
58-34 (SBS)
(Koch)
Cell #34 Field Core
Binder 12 mo. 201680 200.6 0.17732 0.0008841 5.07 3.38 - Unaged 8381 288.3 0.00244 0.0000085 39.25 46.56 - SAFT 10610 288.7 0.00328 0.0000113 34.48 22.82 -
P* 16 hr 39562 238.0 0.01382 0.0000581 16.81 6.79 - P* 32 hr 73286 219.4 0.02464 0.0001123 12.58 5.02 -
3 mo. 86683 217.9 0.03348 0.0001536 10.96 4.91 - 6 mo. 200100 180.8 0.10510 0.0005812 6.10 3.18 - 9 mo. 315890 155.8 0.18160 0.0011653 4.49 2.11 -
58-40 (SBS)
(Koch)
Cell #35 Field Core
Binder 12 mo. 375830 142.5 0.21994 0.0017115 3.79 1.73 -
Unaged 1580 1234.5 0.00149 0.0000012 92.55 over 100 - SAFT 3805 698.6 0.00641 0.0000092 37.85 over 100 -
P* 16 hr 13643 426.4 0.03310 0.0000776 14.80 14.12 - P* 32 hr 30967 325.3 0.06861 0.0002109 9.53 6.75 -
3 mo. 23486 358.8 0.05894 0.0001643 10.64 8.12 - 6 mo. 74654 248.9 0.16934 0.0006802 5.69 4.37 - 9 mo. 144580 197.0 0.24578 0.0012477 4.36 2.89 -
AC 120/150 (Unmo.)
Cell #1 Field Core
Binder 12 mo. 256090 167.1 0.38642 0.0023122 3.32 1.78 -
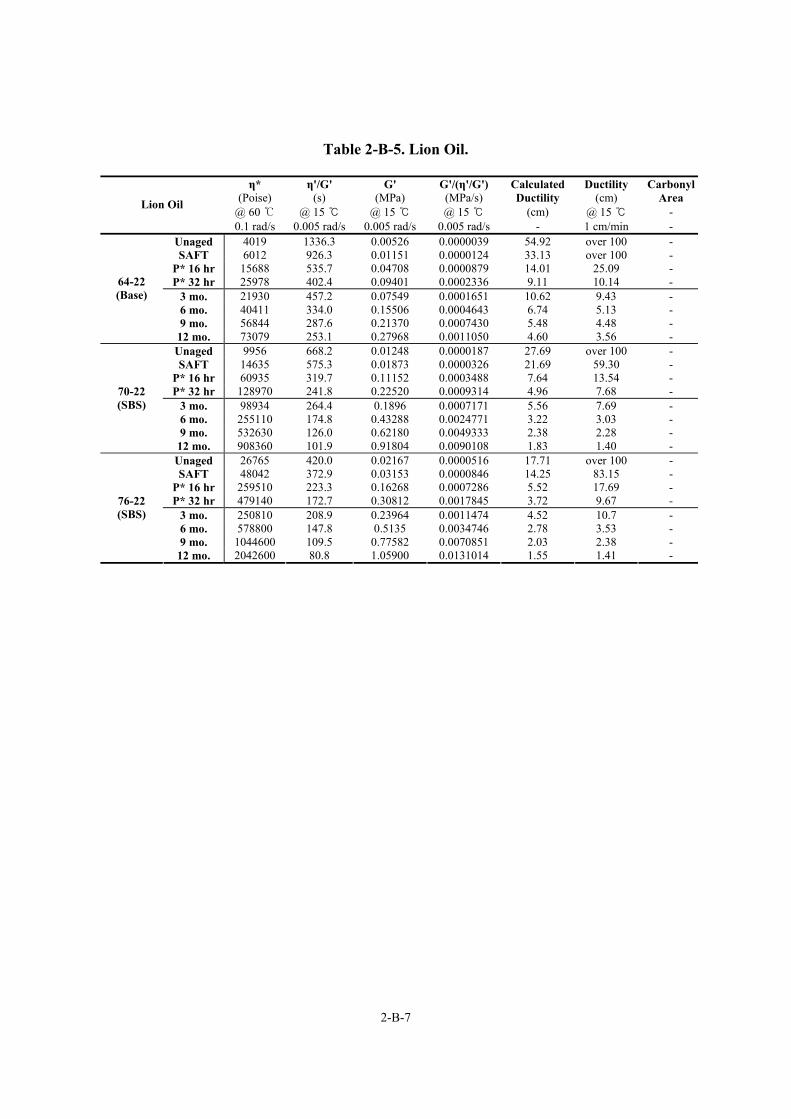
2-B-7
Table 2-B-5. Lion Oil.
η* η'/G' G' G'/(η'/G') Calculated Ductility Carbonyl(Poise) (s) (MPa) (MPa/s) Ductility (cm) Area
@ 60 ℃ @ 15 ℃ @ 15 ℃ @ 15 ℃ (cm) @ 15 ℃ - Lion Oil
0.1 rad/s 0.005 rad/s 0.005 rad/s 0.005 rad/s - 1 cm/min - Unaged 4019 1336.3 0.00526 0.0000039 54.92 over 100 - SAFT 6012 926.3 0.01151 0.0000124 33.13 over 100 -
P* 16 hr 15688 535.7 0.04708 0.0000879 14.01 25.09 - P* 32 hr 25978 402.4 0.09401 0.0002336 9.11 10.14 -
3 mo. 21930 457.2 0.07549 0.0001651 10.62 9.43 - 6 mo. 40411 334.0 0.15506 0.0004643 6.74 5.13 - 9 mo. 56844 287.6 0.21370 0.0007430 5.48 4.48 -
64-22 (Base)
12 mo. 73079 253.1 0.27968 0.0011050 4.60 3.56 - Unaged 9956 668.2 0.01248 0.0000187 27.69 over 100 - SAFT 14635 575.3 0.01873 0.0000326 21.69 59.30 -
P* 16 hr 60935 319.7 0.11152 0.0003488 7.64 13.54 - P* 32 hr 128970 241.8 0.22520 0.0009314 4.96 7.68 -
3 mo. 98934 264.4 0.1896 0.0007171 5.56 7.69 - 6 mo. 255110 174.8 0.43288 0.0024771 3.22 3.03 - 9 mo. 532630 126.0 0.62180 0.0049333 2.38 2.28 -
70-22 (SBS)
12 mo. 908360 101.9 0.91804 0.0090108 1.83 1.40 - Unaged 26765 420.0 0.02167 0.0000516 17.71 over 100 - SAFT 48042 372.9 0.03153 0.0000846 14.25 83.15 -
P* 16 hr 259510 223.3 0.16268 0.0007286 5.52 17.69 - P* 32 hr 479140 172.7 0.30812 0.0017845 3.72 9.67 -
3 mo. 250810 208.9 0.23964 0.0011474 4.52 10.7 - 6 mo. 578800 147.8 0.5135 0.0034746 2.78 3.53 - 9 mo. 1044600 109.5 0.77582 0.0070851 2.03 2.38 -
76-22 (SBS)
12 mo. 2042600 80.8 1.05900 0.0131014 1.55 1.41 -
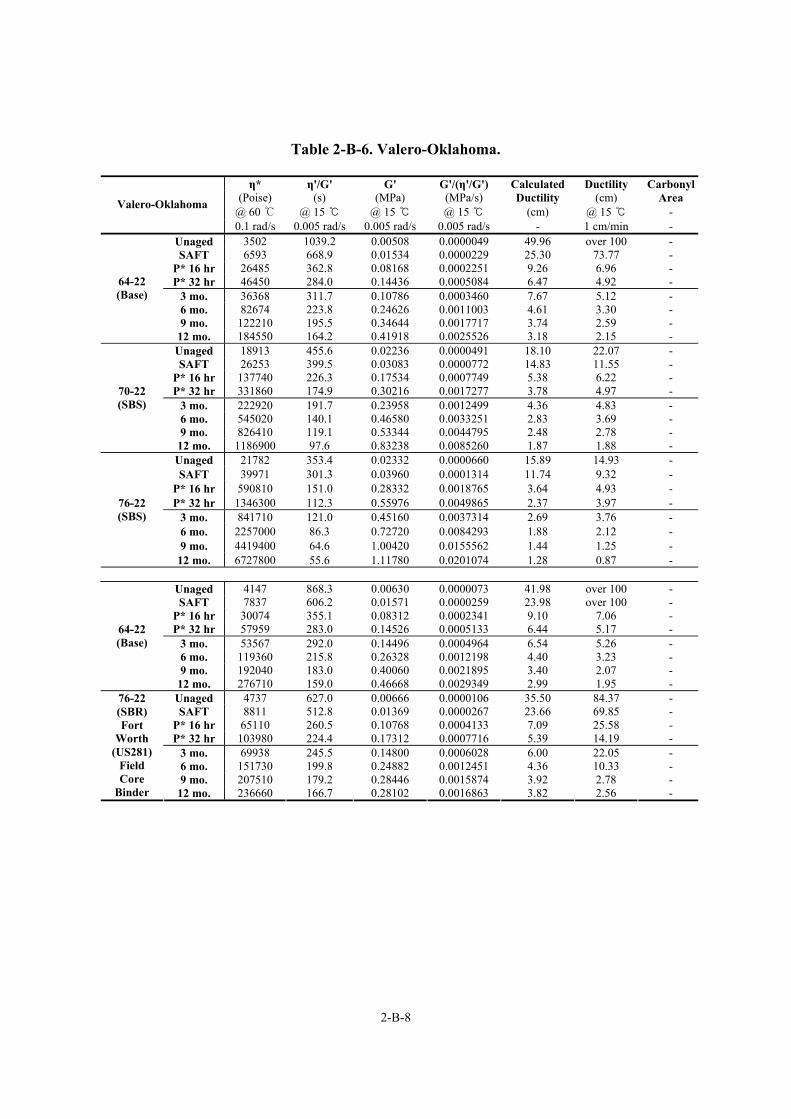
2-B-8
Table 2-B-6. Valero-Oklahoma.
η* η'/G' G' G'/(η'/G') Calculated Ductility Carbonyl(Poise) (s) (MPa) (MPa/s) Ductility (cm) Area
@ 60 ℃ @ 15 ℃ @ 15 ℃ @ 15 ℃ (cm) @ 15 ℃ - Valero-Oklahoma
0.1 rad/s 0.005 rad/s 0.005 rad/s 0.005 rad/s - 1 cm/min - Unaged 3502 1039.2 0.00508 0.0000049 49.96 over 100 - SAFT 6593 668.9 0.01534 0.0000229 25.30 73.77 -
P* 16 hr 26485 362.8 0.08168 0.0002251 9.26 6.96 - P* 32 hr 46450 284.0 0.14436 0.0005084 6.47 4.92 -
3 mo. 36368 311.7 0.10786 0.0003460 7.67 5.12 - 6 mo. 82674 223.8 0.24626 0.0011003 4.61 3.30 - 9 mo. 122210 195.5 0.34644 0.0017717 3.74 2.59 -
64-22 (Base)
12 mo. 184550 164.2 0.41918 0.0025526 3.18 2.15 - Unaged 18913 455.6 0.02236 0.0000491 18.10 22.07 - SAFT 26253 399.5 0.03083 0.0000772 14.83 11.55 -
P* 16 hr 137740 226.3 0.17534 0.0007749 5.38 6.22 - P* 32 hr 331860 174.9 0.30216 0.0017277 3.78 4.97 -
3 mo. 222920 191.7 0.23958 0.0012499 4.36 4.83 - 6 mo. 545020 140.1 0.46580 0.0033251 2.83 3.69 - 9 mo. 826410 119.1 0.53344 0.0044795 2.48 2.78 -
70-22 (SBS)
12 mo. 1186900 97.6 0.83238 0.0085260 1.87 1.88 - Unaged 21782 353.4 0.02332 0.0000660 15.89 14.93 - SAFT 39971 301.3 0.03960 0.0001314 11.74 9.32 -
P* 16 hr 590810 151.0 0.28332 0.0018765 3.64 4.93 - P* 32 hr 1346300 112.3 0.55976 0.0049865 2.37 3.97 -
3 mo. 841710 121.0 0.45160 0.0037314 2.69 3.76 - 6 mo. 2257000 86.3 0.72720 0.0084293 1.88 2.12 - 9 mo. 4419400 64.6 1.00420 0.0155562 1.44 1.25 -
76-22 (SBS)
12 mo. 6727800 55.6 1.11780 0.0201074 1.28 0.87 -
Unaged 4147 868.3 0.00630 0.0000073 41.98 over 100 - SAFT 7837 606.2 0.01571 0.0000259 23.98 over 100 -
P* 16 hr 30074 355.1 0.08312 0.0002341 9.10 7.06 - P* 32 hr 57959 283.0 0.14526 0.0005133 6.44 5.17 -
3 mo. 53567 292.0 0.14496 0.0004964 6.54 5.26 - 6 mo. 119360 215.8 0.26328 0.0012198 4.40 3.23 - 9 mo. 192040 183.0 0.40060 0.0021895 3.40 2.07 -
64-22 (Base)
12 mo. 276710 159.0 0.46668 0.0029349 2.99 1.95 - Unaged 4737 627.0 0.00666 0.0000106 35.50 84.37 - SAFT 8811 512.8 0.01369 0.0000267 23.66 69.85 -
P* 16 hr 65110 260.5 0.10768 0.0004133 7.09 25.58 - P* 32 hr 103980 224.4 0.17312 0.0007716 5.39 14.19 -
3 mo. 69938 245.5 0.14800 0.0006028 6.00 22.05 - 6 mo. 151730 199.8 0.24882 0.0012451 4.36 10.33 - 9 mo. 207510 179.2 0.28446 0.0015874 3.92 2.78 -
76-22 (SBR) Fort
Worth (US281)
Field Core
Binder 12 mo. 236660 166.7 0.28102 0.0016863 3.82 2.56 -
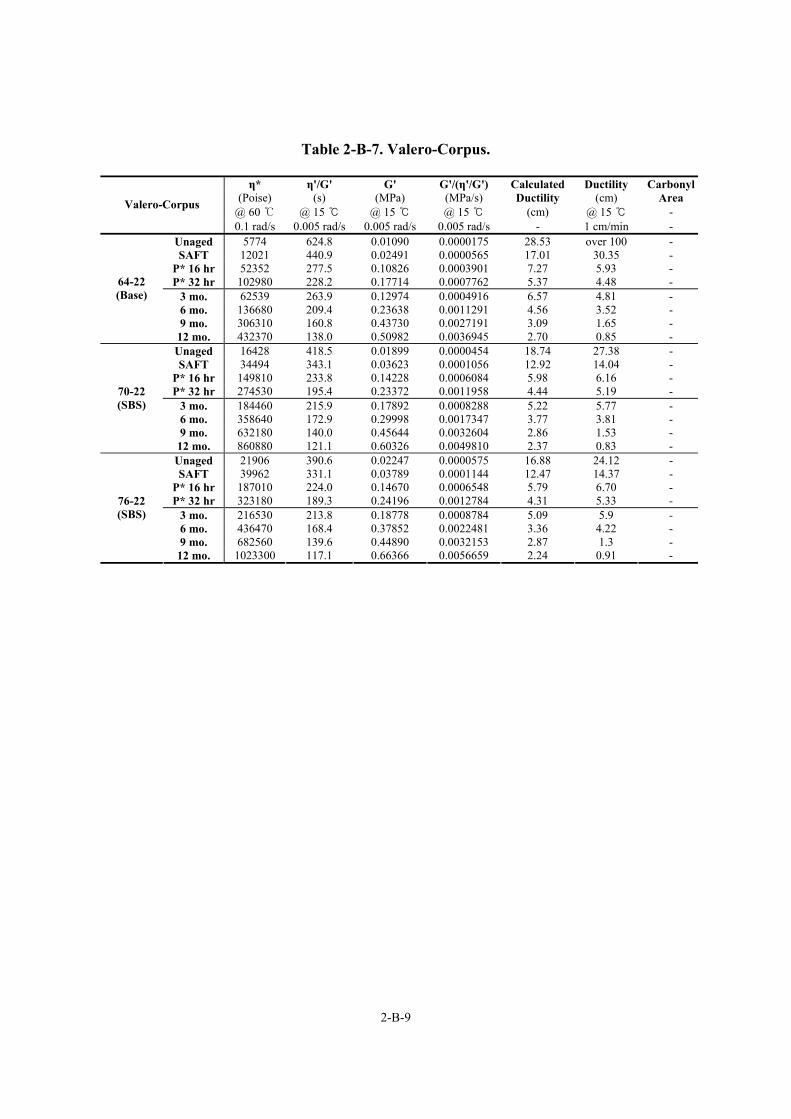
2-B-9
Table 2-B-7. Valero-Corpus.
η* η'/G' G' G'/(η'/G') Calculated Ductility Carbonyl(Poise) (s) (MPa) (MPa/s) Ductility (cm) Area
@ 60 ℃ @ 15 ℃ @ 15 ℃ @ 15 ℃ (cm) @ 15 ℃ - Valero-Corpus
0.1 rad/s 0.005 rad/s 0.005 rad/s 0.005 rad/s - 1 cm/min - Unaged 5774 624.8 0.01090 0.0000175 28.53 over 100 - SAFT 12021 440.9 0.02491 0.0000565 17.01 30.35 -
P* 16 hr 52352 277.5 0.10826 0.0003901 7.27 5.93 - P* 32 hr 102980 228.2 0.17714 0.0007762 5.37 4.48 -
3 mo. 62539 263.9 0.12974 0.0004916 6.57 4.81 - 6 mo. 136680 209.4 0.23638 0.0011291 4.56 3.52 - 9 mo. 306310 160.8 0.43730 0.0027191 3.09 1.65 -
64-22 (Base)
12 mo. 432370 138.0 0.50982 0.0036945 2.70 0.85 - Unaged 16428 418.5 0.01899 0.0000454 18.74 27.38 - SAFT 34494 343.1 0.03623 0.0001056 12.92 14.04 -
P* 16 hr 149810 233.8 0.14228 0.0006084 5.98 6.16 - P* 32 hr 274530 195.4 0.23372 0.0011958 4.44 5.19 -
3 mo. 184460 215.9 0.17892 0.0008288 5.22 5.77 - 6 mo. 358640 172.9 0.29998 0.0017347 3.77 3.81 - 9 mo. 632180 140.0 0.45644 0.0032604 2.86 1.53 -
70-22 (SBS)
12 mo. 860880 121.1 0.60326 0.0049810 2.37 0.83 - Unaged 21906 390.6 0.02247 0.0000575 16.88 24.12 - SAFT 39962 331.1 0.03789 0.0001144 12.47 14.37 -
P* 16 hr 187010 224.0 0.14670 0.0006548 5.79 6.70 - P* 32 hr 323180 189.3 0.24196 0.0012784 4.31 5.33 -
3 mo. 216530 213.8 0.18778 0.0008784 5.09 5.9 - 6 mo. 436470 168.4 0.37852 0.0022481 3.36 4.22 - 9 mo. 682560 139.6 0.44890 0.0032153 2.87 1.3 -
76-22 (SBS)
12 mo. 1023300 117.1 0.66366 0.0056659 2.24 0.91 -
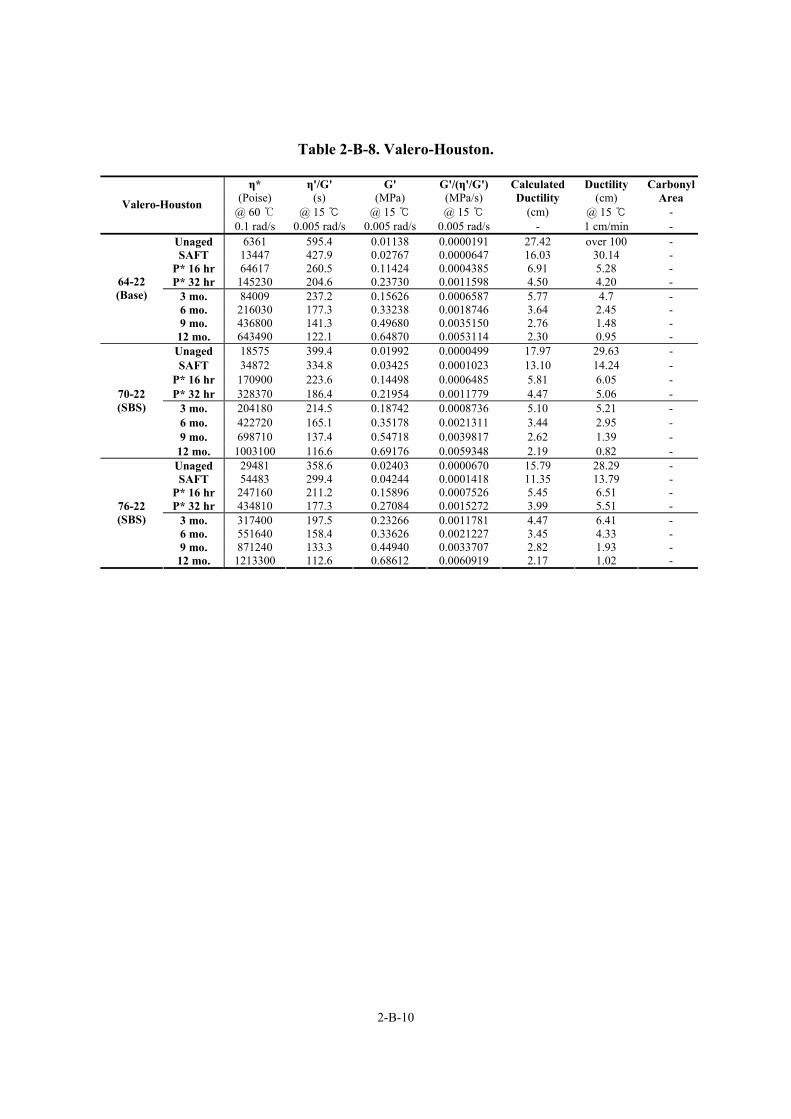
2-B-10
Table 2-B-8. Valero-Houston.
η* η'/G' G' G'/(η'/G') Calculated Ductility Carbonyl(Poise) (s) (MPa) (MPa/s) Ductility (cm) Area
@ 60 ℃ @ 15 ℃ @ 15 ℃ @ 15 ℃ (cm) @ 15 ℃ - Valero-Houston
0.1 rad/s 0.005 rad/s 0.005 rad/s 0.005 rad/s - 1 cm/min - Unaged 6361 595.4 0.01138 0.0000191 27.42 over 100 - SAFT 13447 427.9 0.02767 0.0000647 16.03 30.14 -
P* 16 hr 64617 260.5 0.11424 0.0004385 6.91 5.28 - P* 32 hr 145230 204.6 0.23730 0.0011598 4.50 4.20 -
3 mo. 84009 237.2 0.15626 0.0006587 5.77 4.7 - 6 mo. 216030 177.3 0.33238 0.0018746 3.64 2.45 - 9 mo. 436800 141.3 0.49680 0.0035150 2.76 1.48 -
64-22 (Base)
12 mo. 643490 122.1 0.64870 0.0053114 2.30 0.95 - Unaged 18575 399.4 0.01992 0.0000499 17.97 29.63 - SAFT 34872 334.8 0.03425 0.0001023 13.10 14.24 -
P* 16 hr 170900 223.6 0.14498 0.0006485 5.81 6.05 - P* 32 hr 328370 186.4 0.21954 0.0011779 4.47 5.06 -
3 mo. 204180 214.5 0.18742 0.0008736 5.10 5.21 - 6 mo. 422720 165.1 0.35178 0.0021311 3.44 2.95 - 9 mo. 698710 137.4 0.54718 0.0039817 2.62 1.39 -
70-22 (SBS)
12 mo. 1003100 116.6 0.69176 0.0059348 2.19 0.82 - Unaged 29481 358.6 0.02403 0.0000670 15.79 28.29 - SAFT 54483 299.4 0.04244 0.0001418 11.35 13.79 -
P* 16 hr 247160 211.2 0.15896 0.0007526 5.45 6.51 - P* 32 hr 434810 177.3 0.27084 0.0015272 3.99 5.51 -
3 mo. 317400 197.5 0.23266 0.0011781 4.47 6.41 - 6 mo. 551640 158.4 0.33626 0.0021227 3.45 4.33 - 9 mo. 871240 133.3 0.44940 0.0033707 2.82 1.93 -
76-22 (SBS)
12 mo. 1213300 112.6 0.68612 0.0060919 2.17 1.02 -

2-C-1
APPENDICES FOR CHAPTER 2
APPENDIX 2-C
FIGURES OF DUCTILITY DATA

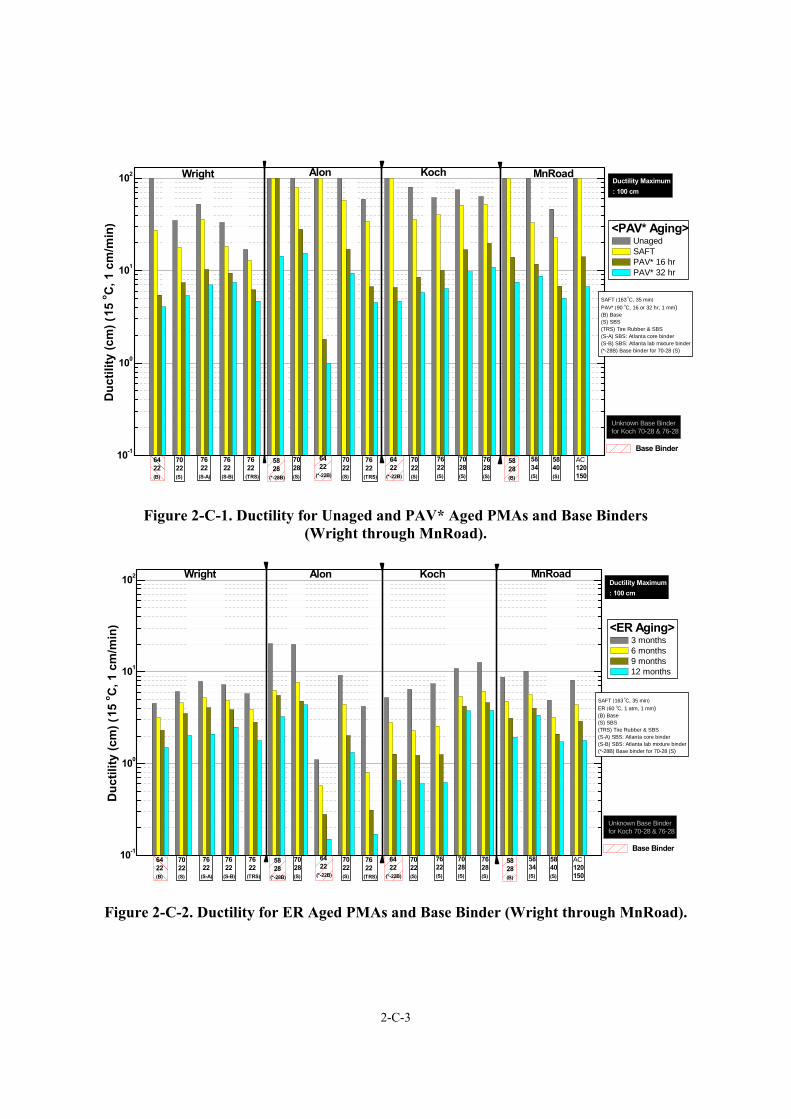
2-C-3
10-1
100
101
102
76 22(S-B)
AC120150
5840(S)
MnRoad
5834(S)
5828(B)
7622(S)
64 22(*-22B)
7628(S)
7028(S)
Koch
Base Binder
SAFT (163 oC, 35 min)
PAV* (90 oC, 16 or 32 hr, 1 mm)(B) Base (S) SBS (TRS) Tire Rubber & SBS(S-A) SBS: Atlanta core binder(S-B) SBS: Atlanta lab mixture binder(*-28B) Base binder for 70-28 (S)
Ductility Maximum: 100 cm
Duc
tility
(cm
) (15
o C, 1
cm
/min
) <PAV* Aging> Unaged SAFT PAV* 16 hr PAV* 32 hr
Wright Alon
7022(S)
76 22(TRS)
7022(S)
64 22(*-22B)
7028(S)
58 28(*-28B)
76 22(TRS)
76 22(S-A)
7022(S)
6422(B)
Unknown Base Binderfor Koch 70-28 & 76-28
Figure 2-C-1. Ductility for Unaged and PAV* Aged PMAs and Base Binders (Wright through MnRoad).
10-1
100
101
102
76 22(S-B)
AC120150
5840(S)
MnRoad
5834(S)
5828(B)
7622(S)
64 22(*-22B)
7628(S)
7028(S)
Koch
Base Binder
SAFT (163 oC, 35 min)
ER (60 oC, 1 atm, 1 mm)(B) Base (S) SBS (TRS) Tire Rubber & SBS(S-A) SBS: Atlanta core binder(S-B) SBS: Atlanta lab mixture binder(*-28B) Base binder for 70-28 (S)
Ductility Maximum: 100 cm
Duc
tility
(cm
) (15
o C, 1
cm
/min
) <ER Aging> 3 months 6 months 9 months 12 months
Wright Alon
7022(S)
76 22(TRS)
7022(S)
64 22(*-22B)
7028(S)
58 28(*-28B)
76 22(TRS)
76 22(S-A)
7022(S)
6422(B)
Unknown Base Binderfor Koch 70-28 & 76-28
Figure 2-C-2. Ductility for ER Aged PMAs and Base Binder (Wright through MnRoad).
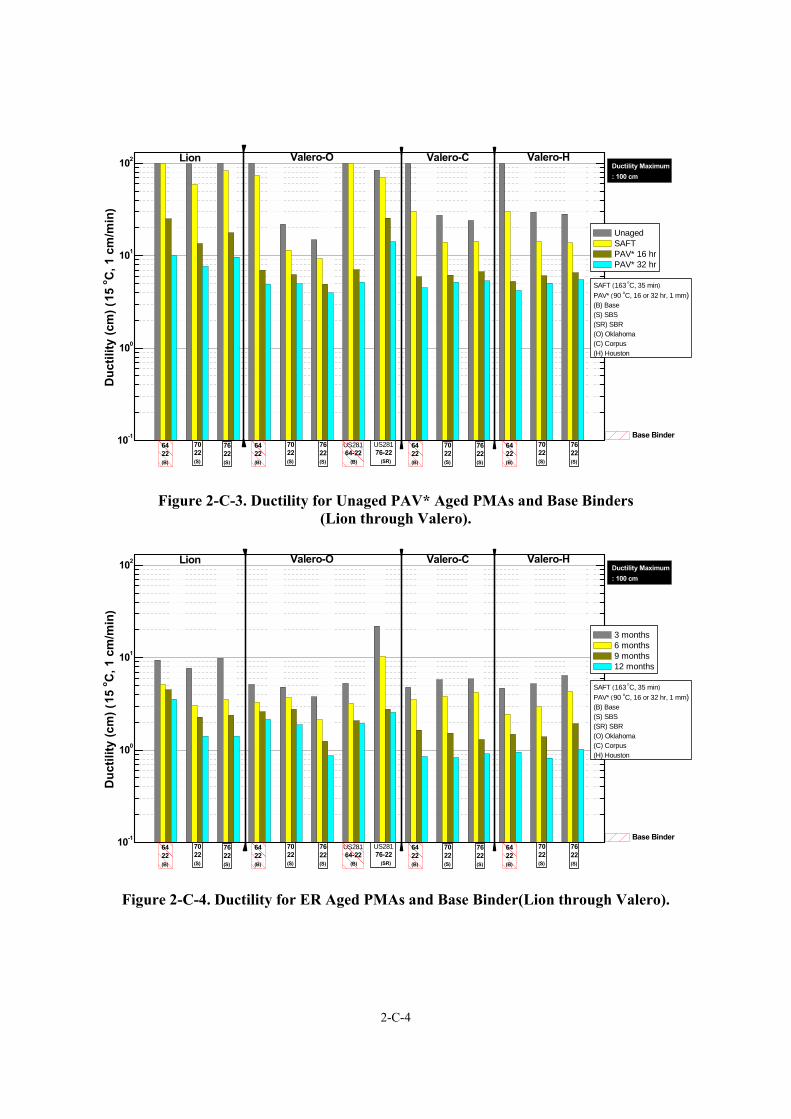
2-C-4
10-1
100
101
102 Valero-HValero-C
7622(S)
Lion Valero-O
Base Binder
SAFT (163 oC, 35 min)
PAV* (90 oC, 16 or 32 hr, 1 mm)(B) Base (S) SBS (SR) SBR(O) Oklahoma(C) Corpus(H) Houston
Ductility Maximum: 100 cm
Duc
tility
(cm
) (15
o C, 1
cm
/min
)
Unaged SAFT PAV* 16 hr PAV* 32 hr
7022(S)
6422(B)
7622(S)
7022(S)
6422(B)
US281 64-22 (B)
US281 76-22 (SR)
7622(S)
7022(S)
6422(B)
7622(S)
7022(S)
6422(B)
Figure 2-C-3. Ductility for Unaged PAV* Aged PMAs and Base Binders
(Lion through Valero).
10-1
100
101
102 Valero-HValero-C
7622(S)
Lion Valero-O
Base Binder
SAFT (163 oC, 35 min)
PAV* (90 oC, 16 or 32 hr, 1 mm)(B) Base (S) SBS (SR) SBR(O) Oklahoma(C) Corpus(H) Houston
Ductility Maximum: 100 cm
Duc
tility
(cm
) (15
o C, 1
cm
/min
)
3 months 6 months 9 months 12 months
7022(S)
6422(B)
7622(S)
7022(S)
6422(B)
US281 64-22 (B)
US281 76-22 (SR)
7622(S)
7022(S)
6422(B)
7622(S)
7022(S)
6422(B)
Figure 2-C-4. Ductility for ER Aged PMAs and Base Binder(Lion through Valero).
2-D-1
APPENDICES FOR CHAPTER 2
APPENDIX 2-D
FIGURES OF HARDENING RATE AND RATIO DATA

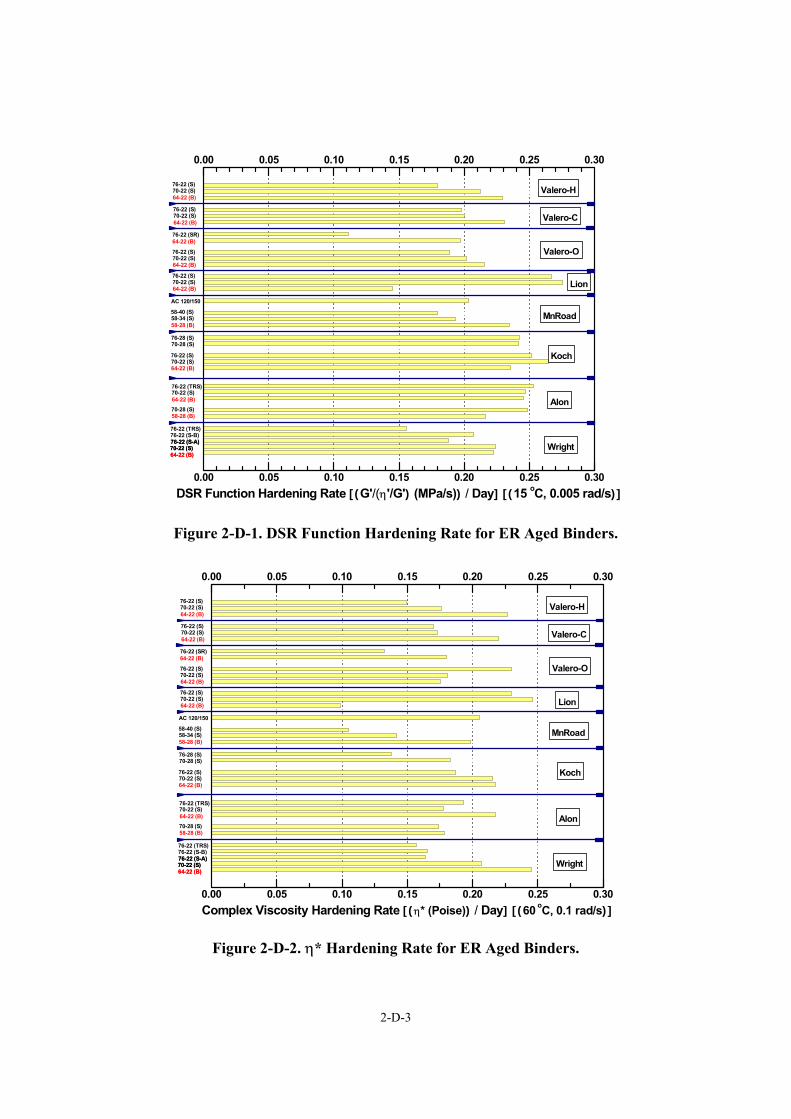
2-D-3
0.00 0.05 0.10 0.15 0.20 0.25 0.30
0.00 0.05 0.10 0.15 0.20 0.25 0.30
AC 120/150
76-22 (TRS)76-22 (S-B)76-22 (S-A)70-22 (S)
Valero-H
Valero-C
Valero-O
Lion
MnRoad
Koch
Alon
Wright
DSR Function Hardening Rate [(G'/(η'/G') (MPa/s)) / Day] [(15 oC, 0.005 rad/s)]
64-22 (B)
76-22 (TRS)70-22 (S)64-22 (B)
70-28 (S)58-28 (B)
76-22 (S-A)70-22 (S)64-22 (B)
76-22 (S)70-22 (S)64-22 (B)
76-28 (S)70-28 (S)
58-40 (S)58-34 (S)58-28 (B)
76-22 (S)70-22 (S)64-22 (B)
76-22 (S)70-22 (S)64-22 (B)
76-22 (S)70-22 (S)64-22 (B)
76-22 (S)70-22 (S)64-22 (B)
76-22 (SR)64-22 (B)
Figure 2-D-1. DSR Function Hardening Rate for ER Aged Binders.
0.00 0.05 0.10 0.15 0.20 0.25 0.30
0.00 0.05 0.10 0.15 0.20 0.25 0.30
AC 120/150
76-22 (TRS)76-22 (S-B)76-22 (S-A)70-22 (S)
Valero-H
Valero-C
Valero-O
Lion
MnRoad
Koch
Alon
Wright
Complex Viscosity Hardening Rate [(η* (Poise)) / Day] [(60 oC, 0.1 rad/s)]
64-22 (B)
76-22 (TRS)70-22 (S)64-22 (B)
70-28 (S)58-28 (B)
76-22 (S-A)70-22 (S)64-22 (B)
76-22 (S)70-22 (S)64-22 (B)
76-28 (S)70-28 (S)
58-40 (S)58-34 (S)58-28 (B)
76-22 (S)70-22 (S)64-22 (B)
76-22 (S)70-22 (S)64-22 (B)
76-22 (S)70-22 (S)64-22 (B)
76-22 (S)70-22 (S)64-22 (B)
76-22 (SR)64-22 (B)
Figure 2-D-2. η* Hardening Rate for ER Aged Binders.
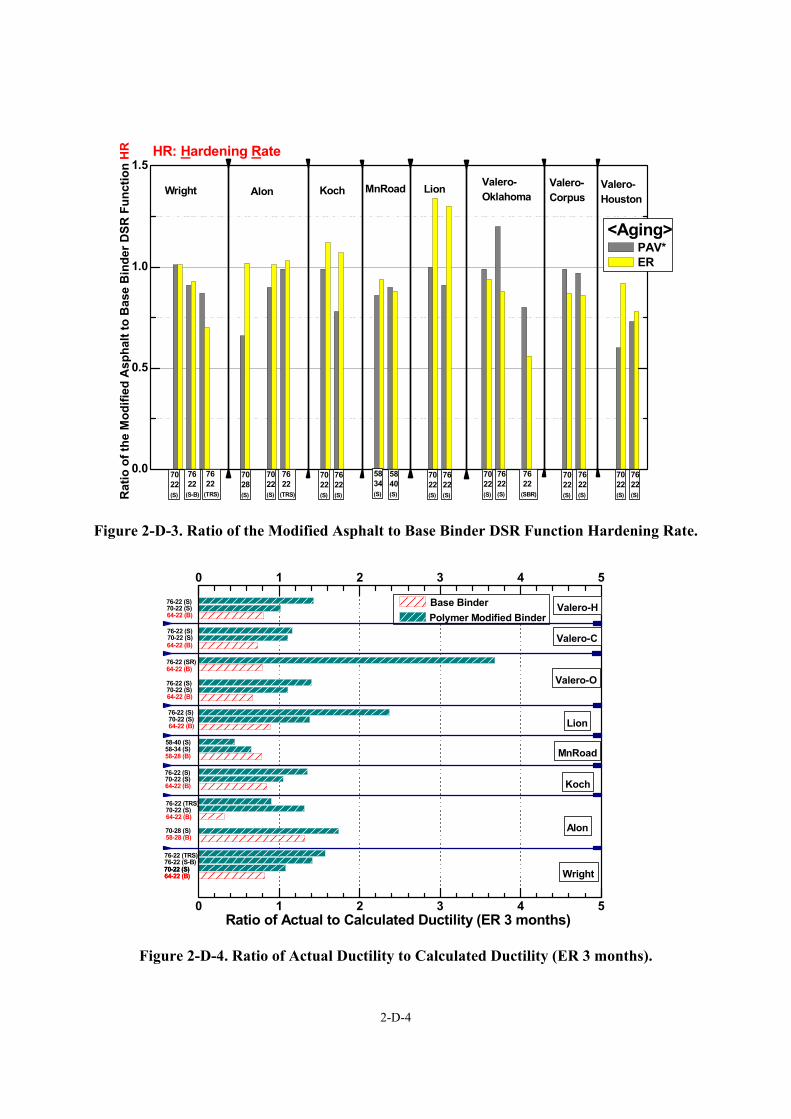
2-D-4
0.0
0.5
1.0
1.5HR: Hardening Rate
Valero-Houston
Valero-Corpus
76 22(SBR)
Valero-Oklahoma
Lion
76 22(S-B)
5840(S)
MnRoad
5834(S)
7622(S)
Koch
Rat
io o
f the
Mod
ified
Asp
halt
to B
ase
Bin
der D
SR F
unct
ion
HR
<Aging> PAV* ER
Wright Alon
7022(S)
76 22(TRS)
7022(S)
7028(S)
76 22(TRS)
7022(S)
7622(S)
7022(S)
7622(S)
7022(S)
7622(S)
7022(S)
7622(S)
7022(S)
Figure 2-D-3. Ratio of the Modified Asphalt to Base Binder DSR Function Hardening Rate.
0 1 2 3 4 5
0 1 2 3 4 5
Base Binder Polymer Modified Binder
76-22 (TRS)76-22 (S-B)70-22 (S)
Valero-H
Valero-C
Valero-O
Lion
MnRoad
Koch
Alon
Wright
Ratio of Actual to Calculated Ductility (ER 3 months)
64-22 (B)
76-22 (TRS)70-22 (S)64-22 (B)
70-28 (S)58-28 (B)
70-22 (S)64-22 (B)
76-22 (S)70-22 (S)64-22 (B)
58-40 (S)58-34 (S)58-28 (B)
76-22 (S)70-22 (S)64-22 (B)
76-22 (S)70-22 (S)64-22 (B)
76-22 (S)70-22 (S)64-22 (B)
76-22 (SR)64-22 (B)
76-22 (S)70-22 (S)64-22 (B)
Figure 2-D-4. Ratio of Actual Ductility to Calculated Ductility (ER 3 months).
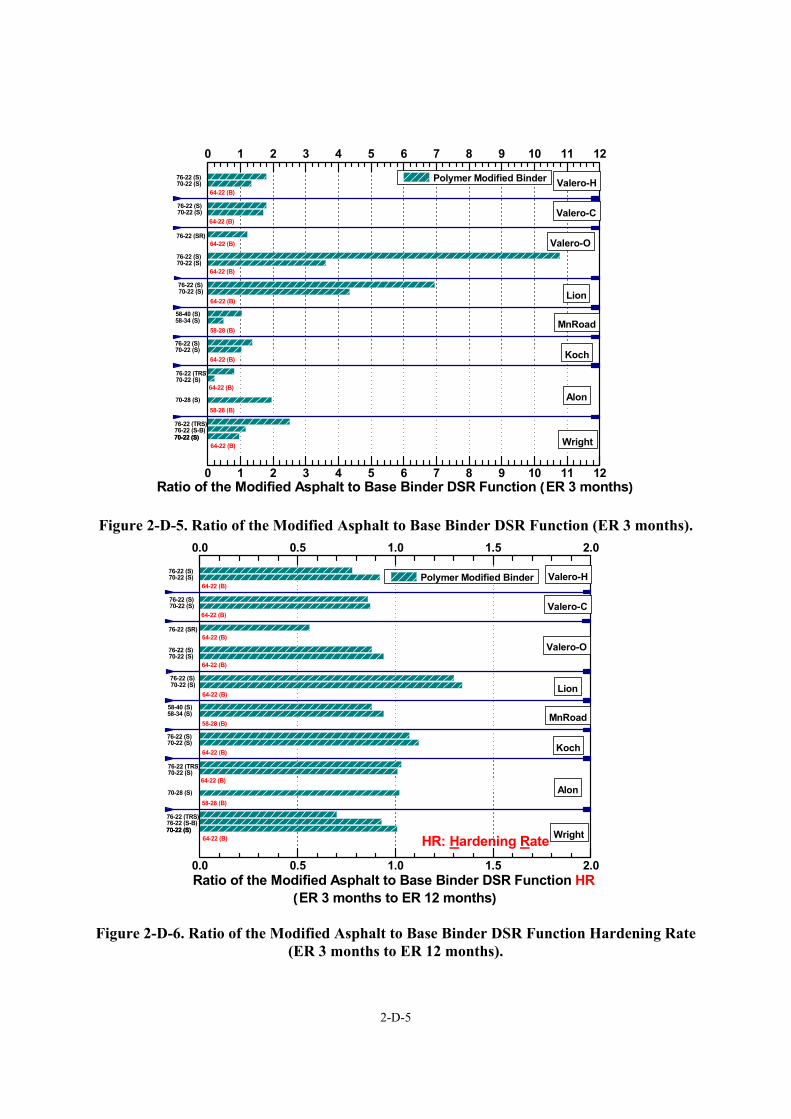
2-D-5
0 1 2 3 4 5 6 7 8 9 10 11 12
0 1 2 3 4 5 6 7 8 9 10 11 12
Polymer Modified Binder
76-22 (TRS)76-22 (S-B)70-22 (S)
Valero-H
Valero-C
Valero-O
Lion
MnRoad
Koch
Alon
Wright
Ratio of the Modified Asphalt to Base Binder DSR Function (ER 3 months)
76-22 (TRS)70-22 (S)
64-22 (B)
70-28 (S)58-28 (B)
70-22 (S)64-22 (B)
76-22 (S)70-22 (S)
64-22 (B)
58-40 (S)58-34 (S)
58-28 (B)
76-22 (S)70-22 (S)
64-22 (B)
76-22 (S)70-22 (S)
64-22 (B)
76-22 (S)70-22 (S)
64-22 (B)
76-22 (SR)64-22 (B)
76-22 (S)70-22 (S)
64-22 (B)
Figure 2-D-5. Ratio of the Modified Asphalt to Base Binder DSR Function (ER 3 months).
0.0 0.5 1.0 1.5 2.0
0.0 0.5 1.0 1.5 2.0
Polymer Modified Binder
76-22 (TRS)76-22 (S-B)70-22 (S)
Valero-H
Valero-C
Valero-O
Lion
MnRoad
Koch
Alon
Wright
Ratio of the Modified Asphalt to Base Binder DSR Function HR (ER 3 months to ER 12 months)
76-22 (TRS)70-22 (S)
64-22 (B)
70-28 (S)58-28 (B)
70-22 (S)64-22 (B)
76-22 (S)70-22 (S)
64-22 (B)
58-40 (S)58-34 (S)
58-28 (B)
76-22 (S)70-22 (S)
64-22 (B)
76-22 (S)70-22 (S)
64-22 (B)
76-22 (S)70-22 (S)
64-22 (B)
76-22 (SR)64-22 (B)
76-22 (S)70-22 (S)
64-22 (B)
HR: Hardening Rate
Figure 2-D-6. Ratio of the Modified Asphalt to Base Binder DSR Function Hardening Rate
(ER 3 months to ER 12 months).
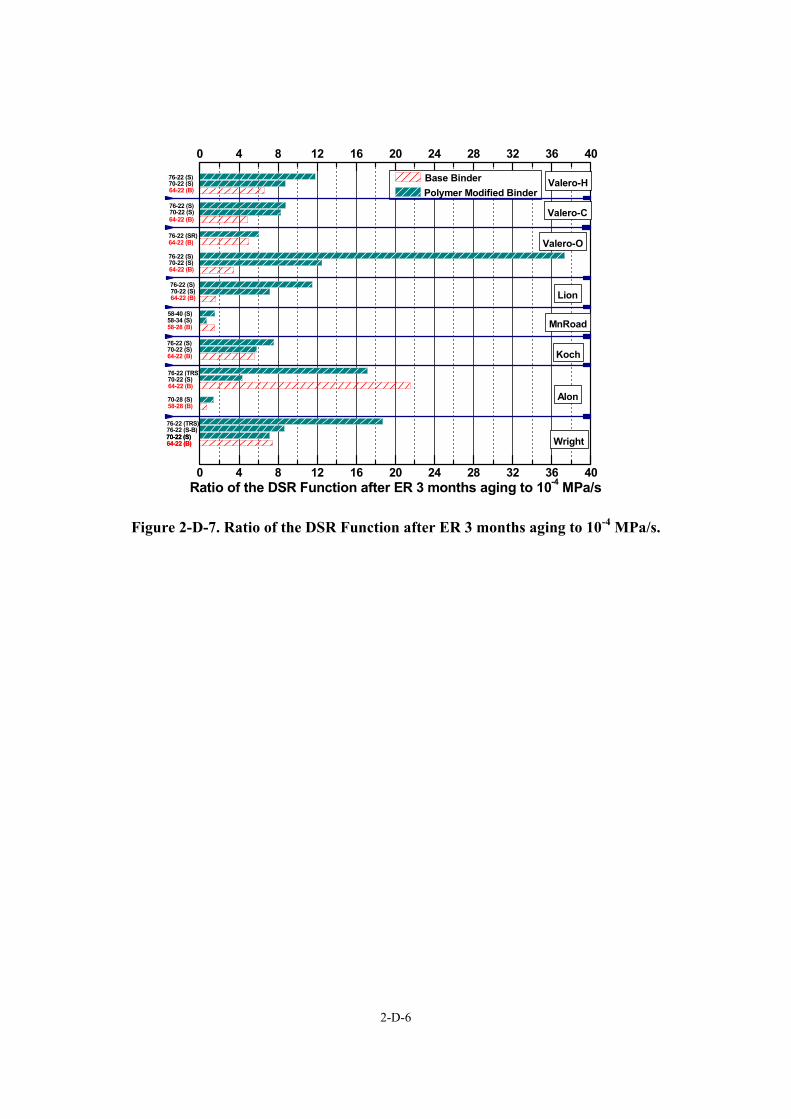
2-D-6
0 4 8 12 16 20 24 28 32 36 40
0 4 8 12 16 20 24 28 32 36 40
Base Binder Polymer Modified Binder
76-22 (TRS)76-22 (S-B)70-22 (S)
Valero-H
Valero-C
Valero-O
Lion
MnRoad
Koch
Alon
Wright
Ratio of the DSR Function after ER 3 months aging to 10-4 MPa/s
64-22 (B)
76-22 (TRS)70-22 (S)64-22 (B)
70-28 (S)58-28 (B)
70-22 (S)64-22 (B)
76-22 (S)70-22 (S)64-22 (B)
58-40 (S)58-34 (S)58-28 (B)
76-22 (S)70-22 (S)64-22 (B)
76-22 (S)70-22 (S)64-22 (B)
76-22 (S)70-22 (S)64-22 (B)
76-22 (SR)64-22 (B)
76-22 (S)70-22 (S)64-22 (B)
Figure 2-D-7. Ratio of the DSR Function after ER 3 months aging to 10-4 MPa/s.
2-E-1
APPENDICES FOR CHAPTER 2
APPENDIX 2-E
FIGURES OF MASTER CURVE DATA

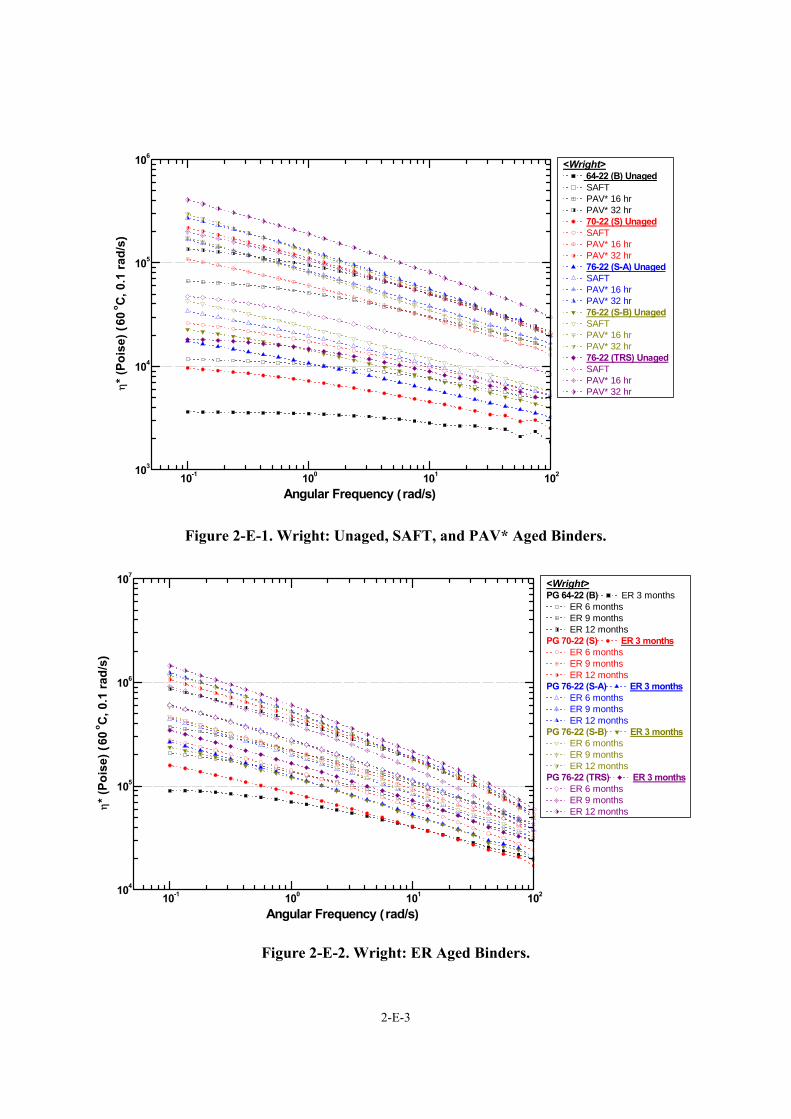
2-E-3
10-1 100 101 102103
104
105
106
Angular Frequency (rad/s)
η* (
Pois
e) (
60 o C
, 0.1
rad/
s)
<Wright> 64-22 (B) Unaged SAFT PAV* 16 hr PAV* 32 hr 70-22 (S) Unaged SAFT PAV* 16 hr PAV* 32 hr 76-22 (S-A) Unaged SAFT PAV* 16 hr PAV* 32 hr 76-22 (S-B) Unaged SAFT PAV* 16 hr PAV* 32 hr 76-22 (TRS) Unaged SAFT PAV* 16 hr PAV* 32 hr
Figure 2-E-1. Wright: Unaged, SAFT, and PAV* Aged Binders.
10-1 100 101 102104
105
106
107
Angular Frequency (rad/s)
η* (
Pois
e) (
60 o C
, 0.1
rad/
s)
<Wright>PG 64-22 (B) ER 3 months
ER 6 months ER 9 months ER 12 months
PG 70-22 (S) ER 3 months ER 6 months ER 9 months ER 12 months
PG 76-22 (S-A) ER 3 months ER 6 months ER 9 months ER 12 months
PG 76-22 (S-B) ER 3 months ER 6 months ER 9 months ER 12 months
PG 76-22 (TRS) ER 3 months ER 6 months ER 9 months ER 12 months
Figure 2-E-2. Wright: ER Aged Binders.
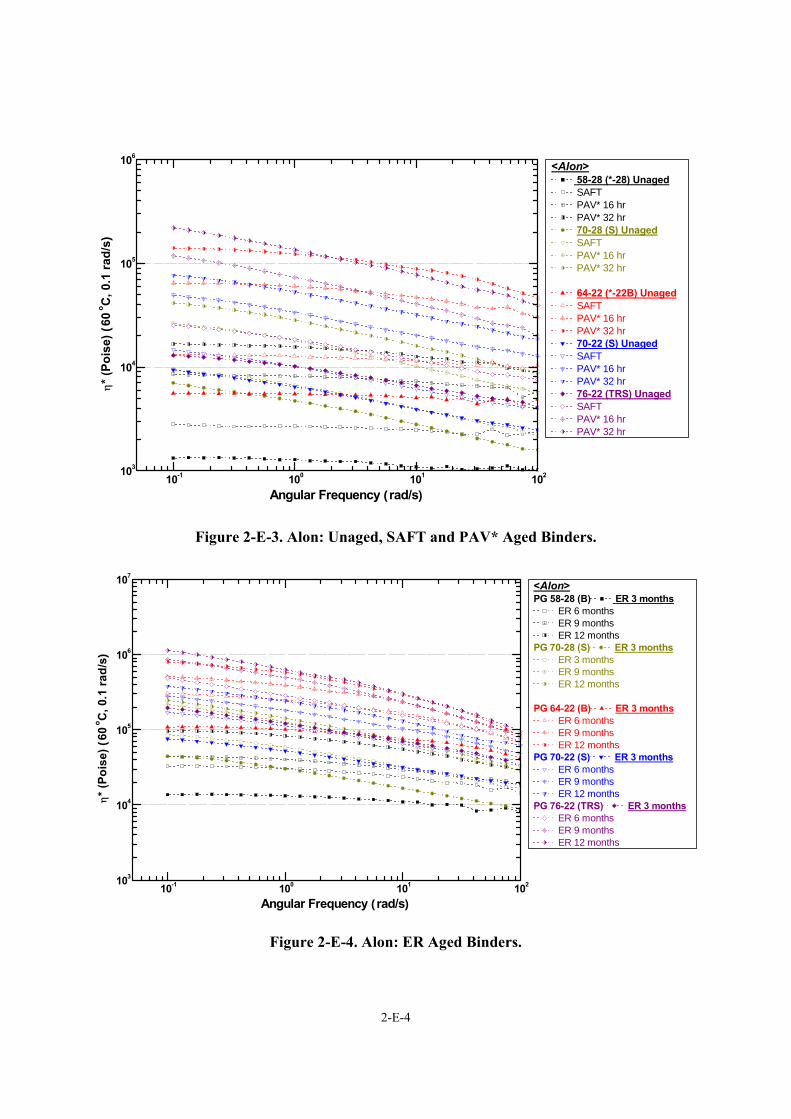
2-E-4
10-1 100 101 102103
104
105
106
Angular Frequency (rad/s)
η* (
Pois
e) (
60 o C
, 0.1
rad/
s)
<Alon> 58-28 (*-28) Unaged SAFT PAV* 16 hr PAV* 32 hr 70-28 (S) Unaged SAFT PAV* 16 hr PAV* 32 hr
64-22 (*-22B) Unaged SAFT PAV* 16 hr PAV* 32 hr 70-22 (S) Unaged SAFT PAV* 16 hr PAV* 32 hr 76-22 (TRS) Unaged SAFT PAV* 16 hr PAV* 32 hr
Figure 2-E-3. Alon: Unaged, SAFT and PAV* Aged Binders.
10-1 100 101 102103
104
105
106
107
Angular Frequency (rad/s)
η* (
Pois
e) (
60 o C
, 0.1
rad/
s)
<Alon>PG 58-28 (B) ER 3 months
ER 6 months ER 9 months ER 12 months
PG 70-28 (S) ER 3 months ER 3 months ER 9 months ER 12 months
PG 64-22 (B) ER 3 months ER 6 months ER 9 months ER 12 months
PG 70-22 (S) ER 3 months ER 6 months ER 9 months ER 12 months
PG 76-22 (TRS) ER 3 months ER 6 months ER 9 months ER 12 months
Figure 2-E-4. Alon: ER Aged Binders.
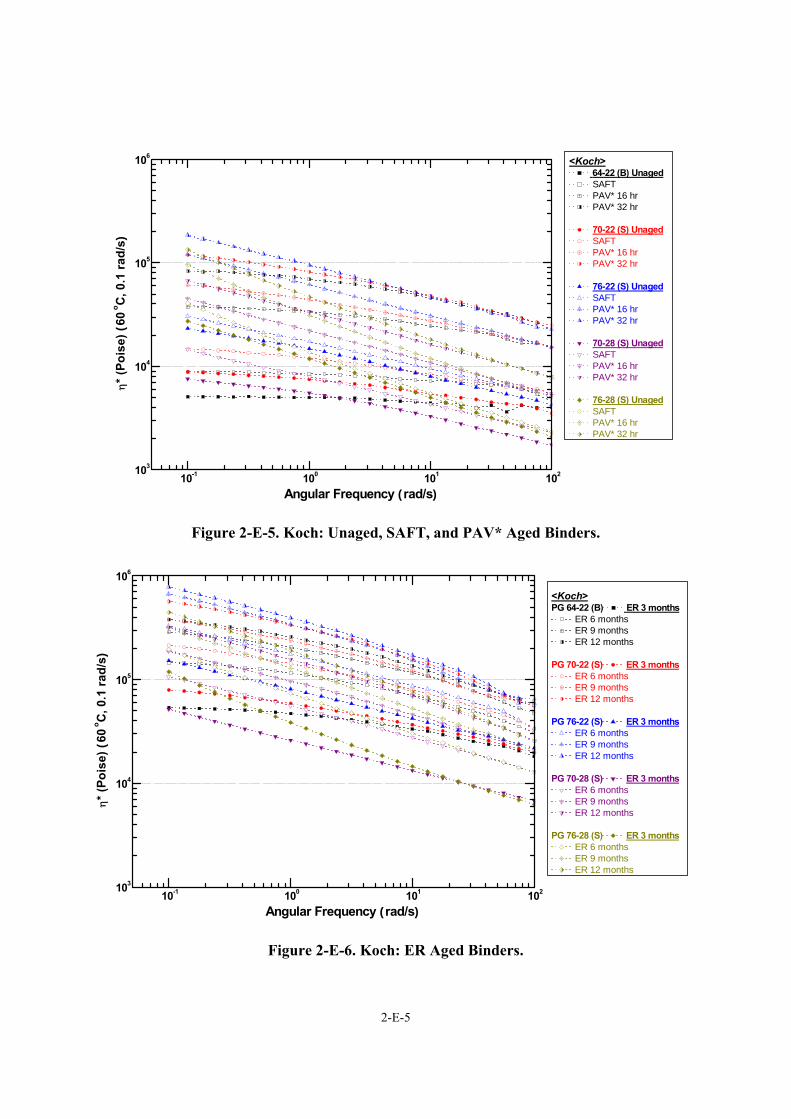
2-E-5
10-1 100 101 102103
104
105
106
Angular Frequency (rad/s)
η* (
Pois
e) (
60 o C
, 0.1
rad/
s)
<Koch> 64-22 (B) Unaged SAFT PAV* 16 hr PAV* 32 hr
70-22 (S) Unaged SAFT PAV* 16 hr PAV* 32 hr
76-22 (S) Unaged SAFT PAV* 16 hr PAV* 32 hr
70-28 (S) Unaged SAFT PAV* 16 hr PAV* 32 hr
76-28 (S) Unaged SAFT PAV* 16 hr PAV* 32 hr
Figure 2-E-5. Koch: Unaged, SAFT, and PAV* Aged Binders.
10-1 100 101 102103
104
105
106
Angular Frequency (rad/s)
η* (
Pois
e) (
60 o C
, 0.1
rad/
s)
<Koch>PG 64-22 (B) ER 3 months
ER 6 months ER 9 months ER 12 months
PG 70-22 (S) ER 3 months ER 6 months ER 9 months ER 12 months
PG 76-22 (S) ER 3 months ER 6 months ER 9 months ER 12 months
PG 70-28 (S) ER 3 months ER 6 months ER 9 months ER 12 months
PG 76-28 (S) ER 3 months ER 6 months ER 9 months ER 12 months
Figure 2-E-6. Koch: ER Aged Binders.
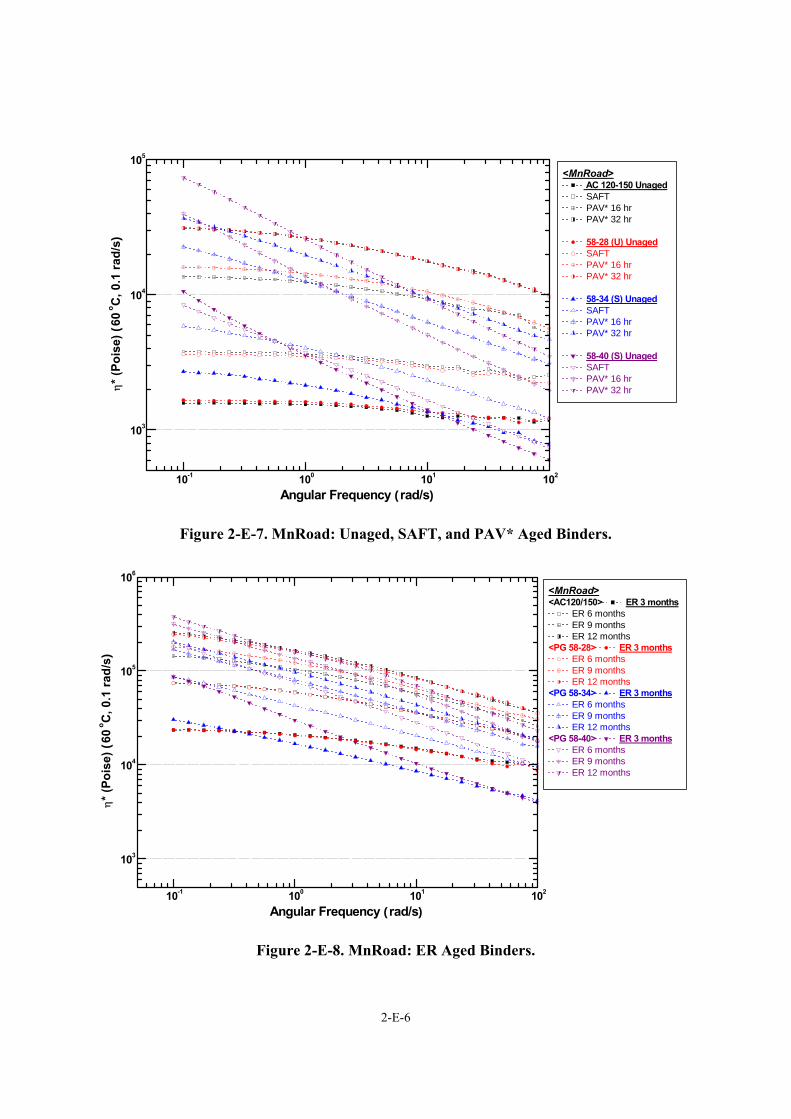
2-E-6
10-1 100 101 102
103
104
105
Angular Frequency (rad/s)
η* (
Pois
e) (
60 o C
, 0.1
rad/
s)
<MnRoad> AC 120-150 Unaged SAFT PAV* 16 hr PAV* 32 hr
58-28 (U) Unaged SAFT PAV* 16 hr PAV* 32 hr
58-34 (S) Unaged SAFT PAV* 16 hr PAV* 32 hr
58-40 (S) Unaged SAFT PAV* 16 hr PAV* 32 hr
Figure 2-E-7. MnRoad: Unaged, SAFT, and PAV* Aged Binders.
10-1 100 101 102
103
104
105
106
Angular Frequency (rad/s)
η* (
Pois
e) (
60 o C
, 0.1
rad/
s)
<MnRoad><AC120/150> ER 3 months
ER 6 months ER 9 months ER 12 months
<PG 58-28> ER 3 months ER 6 months ER 9 months ER 12 months
<PG 58-34> ER 3 months ER 6 months ER 9 months ER 12 months
<PG 58-40> ER 3 months ER 6 months ER 9 months ER 12 months
Figure 2-E-8. MnRoad: ER Aged Binders.
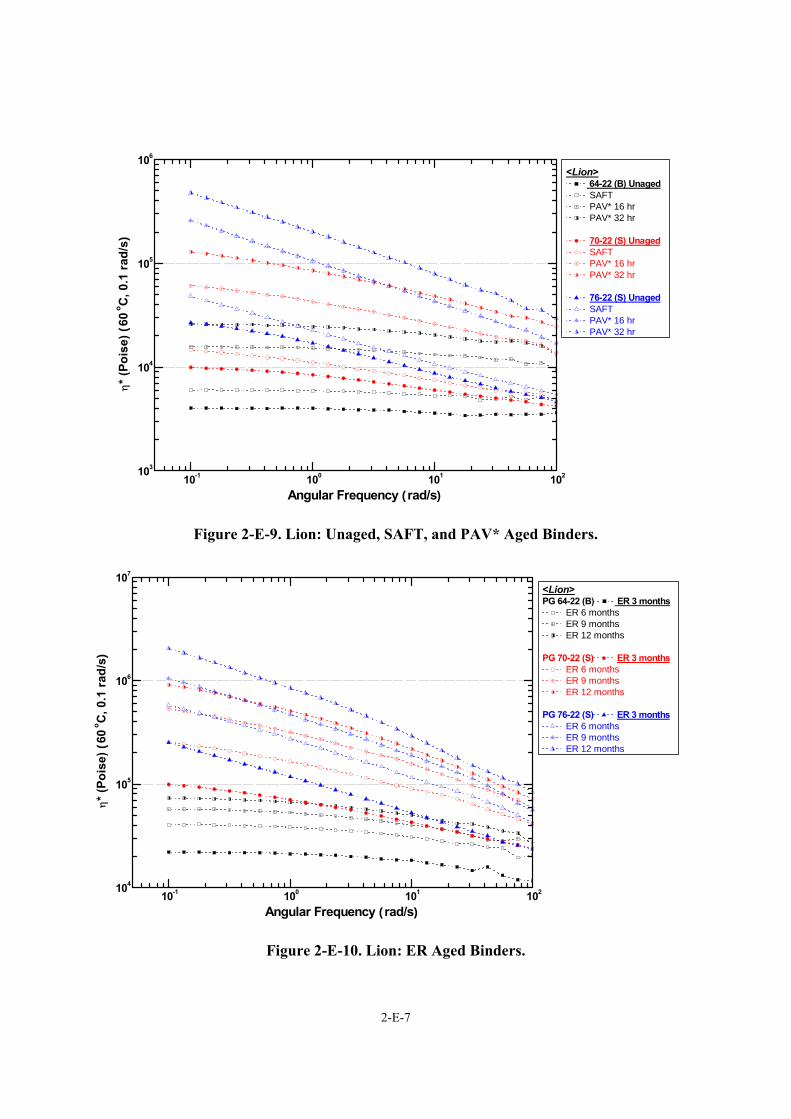
2-E-7
10-1 100 101 102103
104
105
106
Angular Frequency (rad/s)
η* (
Pois
e) (
60 o C
, 0.1
rad/
s)
<Lion> 64-22 (B) Unaged SAFT PAV* 16 hr PAV* 32 hr
70-22 (S) Unaged SAFT PAV* 16 hr PAV* 32 hr
76-22 (S) Unaged SAFT PAV* 16 hr PAV* 32 hr
Figure 2-E-9. Lion: Unaged, SAFT, and PAV* Aged Binders.
10-1 100 101 102104
105
106
107
Angular Frequency (rad/s)
η* (
Pois
e) (
60 o C
, 0.1
rad/
s)
<Lion>PG 64-22 (B) ER 3 months
ER 6 months ER 9 months ER 12 months
PG 70-22 (S) ER 3 months ER 6 months ER 9 months ER 12 months
PG 76-22 (S) ER 3 months ER 6 months ER 9 months ER 12 months
Figure 2-E-10. Lion: ER Aged Binders.
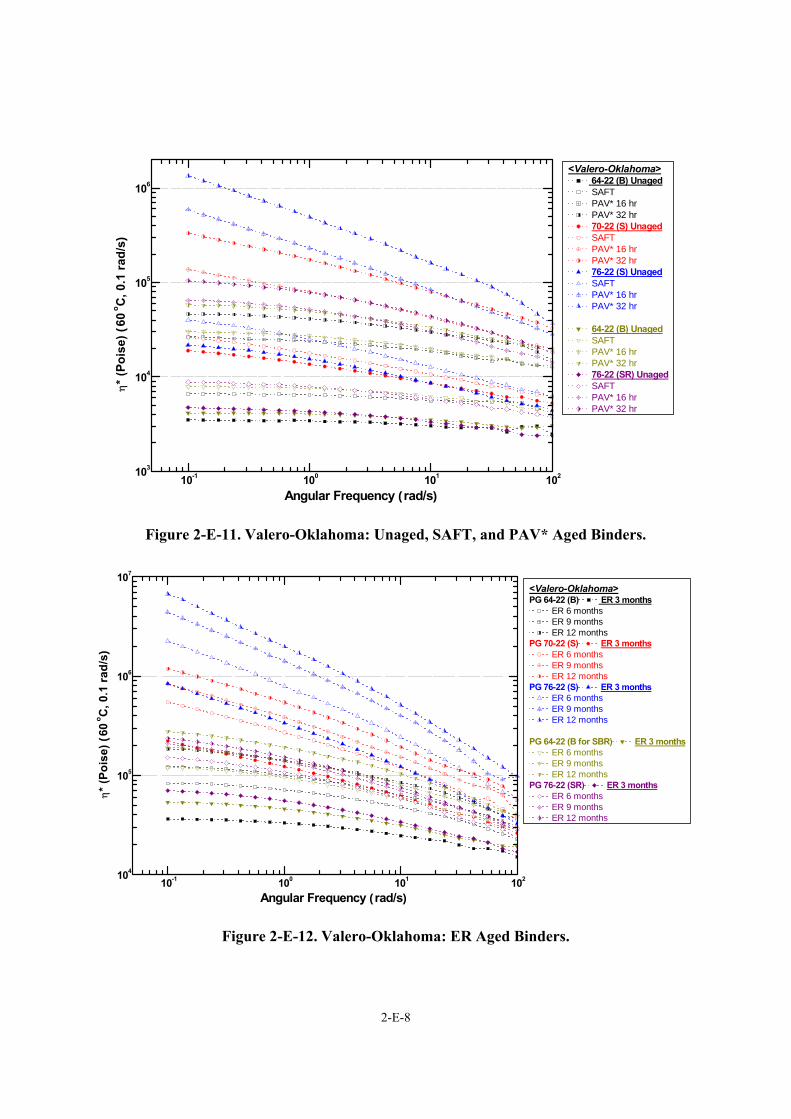
2-E-8
10-1 100 101 102103
104
105
106
Angular Frequency (rad/s)
η* (
Pois
e) (
60 o C
, 0.1
rad/
s)
<Valero-Oklahoma> 64-22 (B) Unaged SAFT PAV* 16 hr PAV* 32 hr 70-22 (S) Unaged SAFT PAV* 16 hr PAV* 32 hr 76-22 (S) Unaged SAFT PAV* 16 hr PAV* 32 hr
64-22 (B) Unaged SAFT PAV* 16 hr PAV* 32 hr 76-22 (SR) Unaged SAFT PAV* 16 hr PAV* 32 hr
Figure 2-E-11. Valero-Oklahoma: Unaged, SAFT, and PAV* Aged Binders.
10-1 100 101 102104
105
106
107
Angular Frequency (rad/s)
η* (
Pois
e) (
60 o C
, 0.1
rad/
s)
<Valero-Oklahoma>PG 64-22 (B) ER 3 months
ER 6 months ER 9 months ER 12 months
PG 70-22 (S) ER 3 months ER 6 months ER 9 months ER 12 months
PG 76-22 (S) ER 3 months ER 6 months ER 9 months ER 12 months
PG 64-22 (B for SBR) ER 3 months ER 6 months ER 9 months ER 12 months
PG 76-22 (SR) ER 3 months ER 6 months ER 9 months ER 12 months
Figure 2-E-12. Valero-Oklahoma: ER Aged Binders.
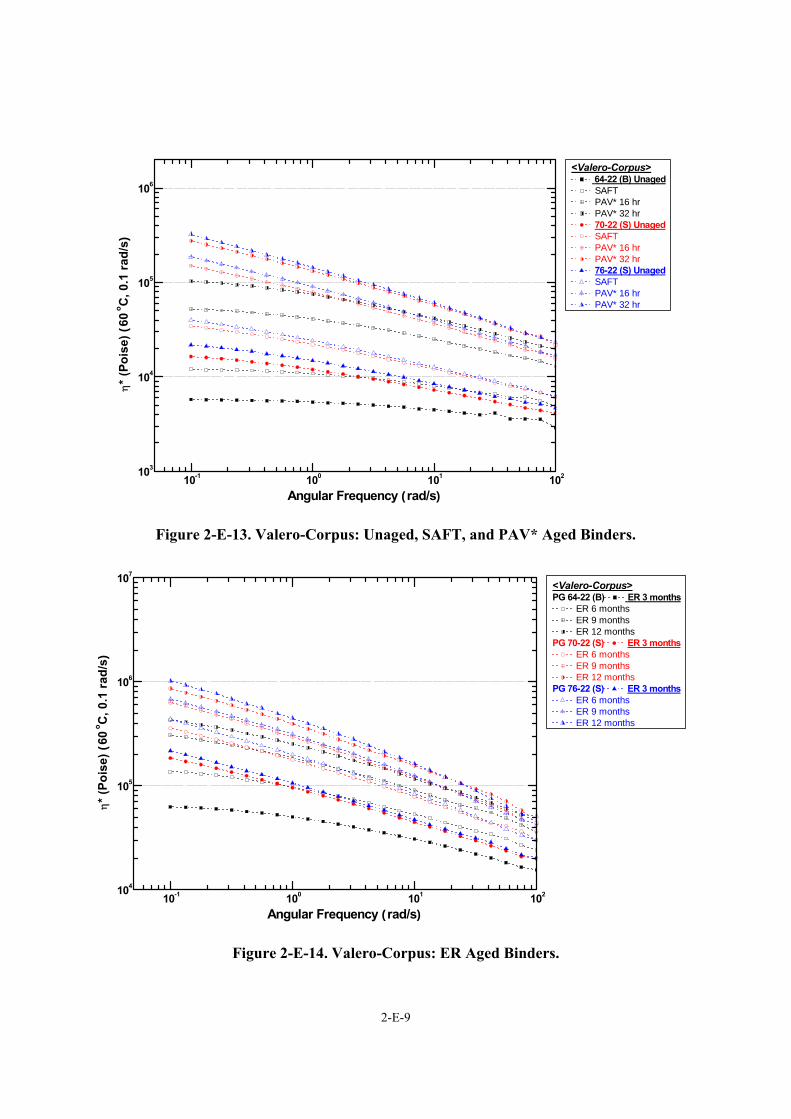
2-E-9
10-1 100 101 102103
104
105
106
Angular Frequency (rad/s)
η* (
Pois
e) (
60 o C
, 0.1
rad/
s)
<Valero-Corpus> 64-22 (B) Unaged SAFT PAV* 16 hr PAV* 32 hr 70-22 (S) Unaged SAFT PAV* 16 hr PAV* 32 hr 76-22 (S) Unaged SAFT PAV* 16 hr PAV* 32 hr
Figure 2-E-13. Valero-Corpus: Unaged, SAFT, and PAV* Aged Binders.
10-1 100 101 102104
105
106
107
Angular Frequency (rad/s)
η* (
Pois
e) (
60 o C
, 0.1
rad/
s)
<Valero-Corpus>PG 64-22 (B) ER 3 months
ER 6 months ER 9 months ER 12 months
PG 70-22 (S) ER 3 months ER 6 months ER 9 months ER 12 months
PG 76-22 (S) ER 3 months ER 6 months ER 9 months ER 12 months
Figure 2-E-14. Valero-Corpus: ER Aged Binders.
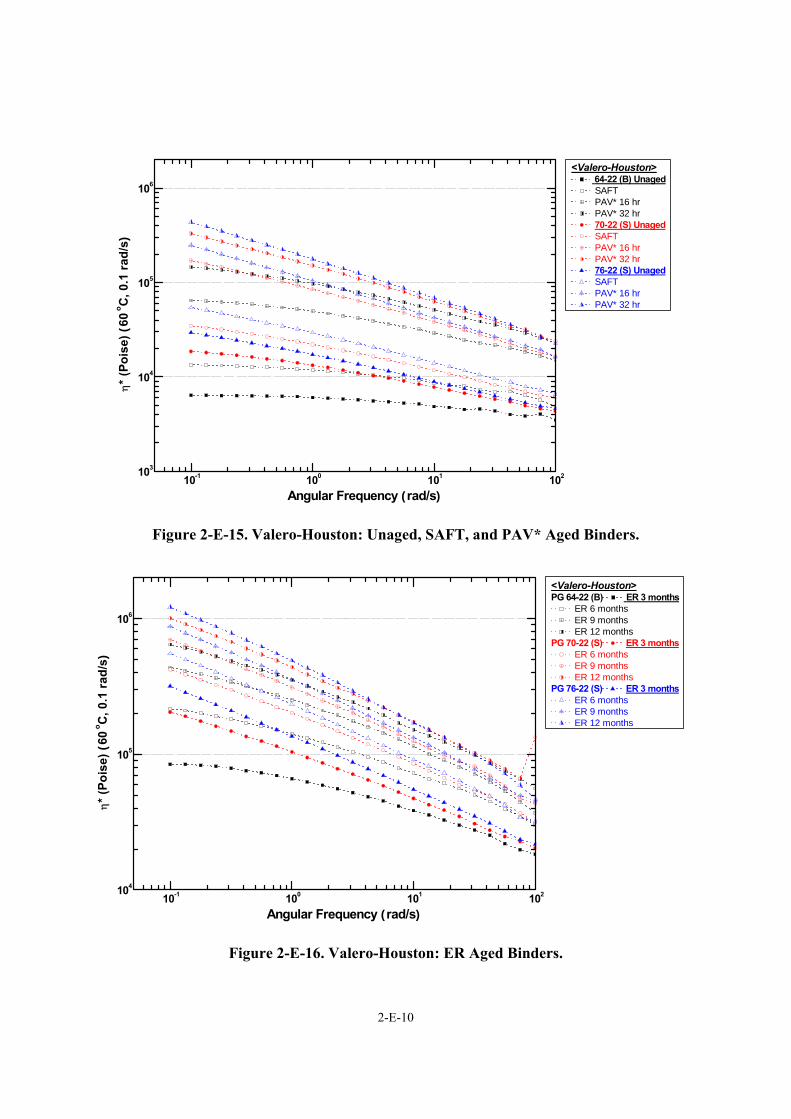
2-E-10
10-1 100 101 102103
104
105
106
Angular Frequency (rad/s)
η* (
Pois
e) (
60 o C
, 0.1
rad/
s)
<Valero-Houston> 64-22 (B) Unaged SAFT PAV* 16 hr PAV* 32 hr 70-22 (S) Unaged SAFT PAV* 16 hr PAV* 32 hr 76-22 (S) Unaged SAFT PAV* 16 hr PAV* 32 hr
Figure 2-E-15. Valero-Houston: Unaged, SAFT, and PAV* Aged Binders.
10-1 100 101 102104
105
106
Angular Frequency (rad/s)
η* (
Pois
e) (
60 o C
, 0.1
rad/
s)
<Valero-Houston>PG 64-22 (B) ER 3 months
ER 6 months ER 9 months ER 12 months
PG 70-22 (S) ER 3 months ER 6 months ER 9 months ER 12 months
PG 76-22 (S) ER 3 months ER 6 months ER 9 months ER 12 months
Figure 2-E-16. Valero-Houston: ER Aged Binders.

2-F-1
APPENDICES FOR CHAPTER 2
APPENDIX 2-F
FIGURES OF GPC DATA

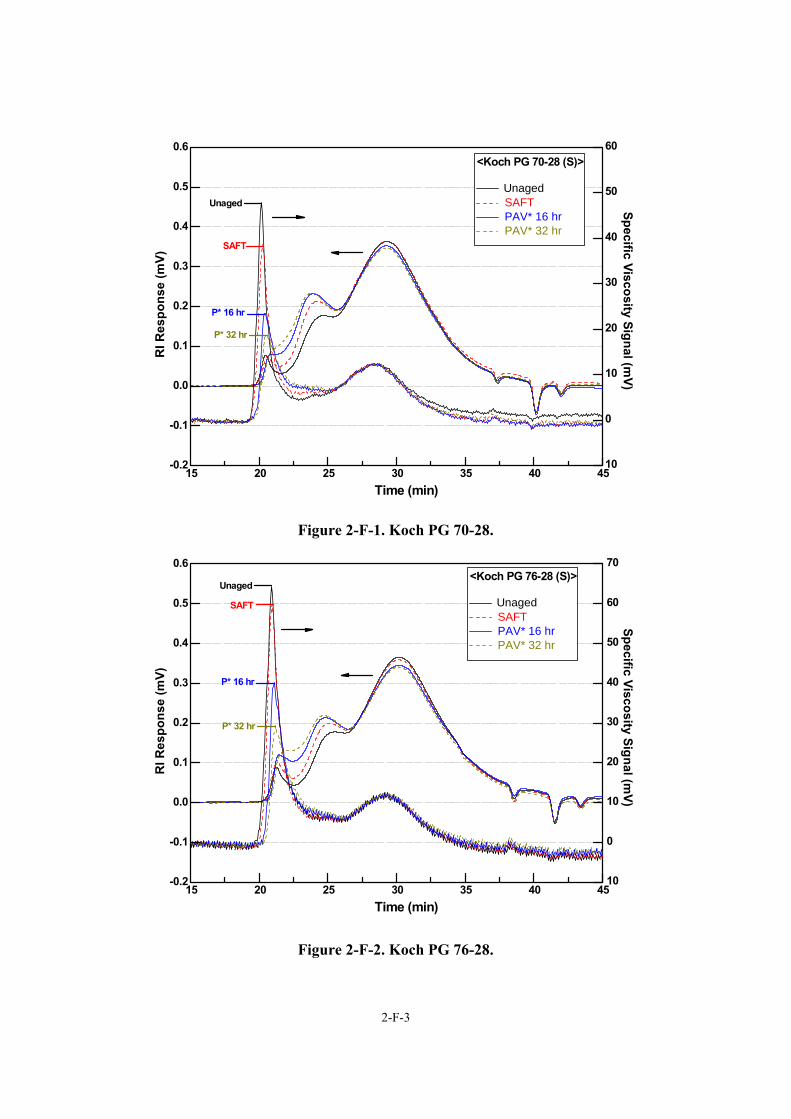
2-F-3
10
0
10
20
30
40
50
60
15 20 25 30 35 40 45-0.2
-0.1
0.0
0.1
0.2
0.3
0.4
0.5
0.6
P* 32 hr
P* 16 hr
SAFT
<Koch PG 70-28 (S)>
Unaged SAFT PAV* 16 hr PAV* 32 hr
Specific Viscosity Signal (mV)
Time (min)
RI R
espo
nse
(mV)
Unaged
Figure 2-F-1. Koch PG 70-28.
10
0
10
20
30
40
50
60
70
15 20 25 30 35 40 45-0.2
-0.1
0.0
0.1
0.2
0.3
0.4
0.5
0.6
P* 32 hr
P* 16 hr
SAFT
<Koch PG 76-28 (S)>
Unaged SAFT PAV* 16 hr PAV* 32 hr
Specific Viscosity Signal (mV)
Time (min)
RI R
espo
nse
(mV)
Unaged
Figure 2-F-2. Koch PG 76-28.
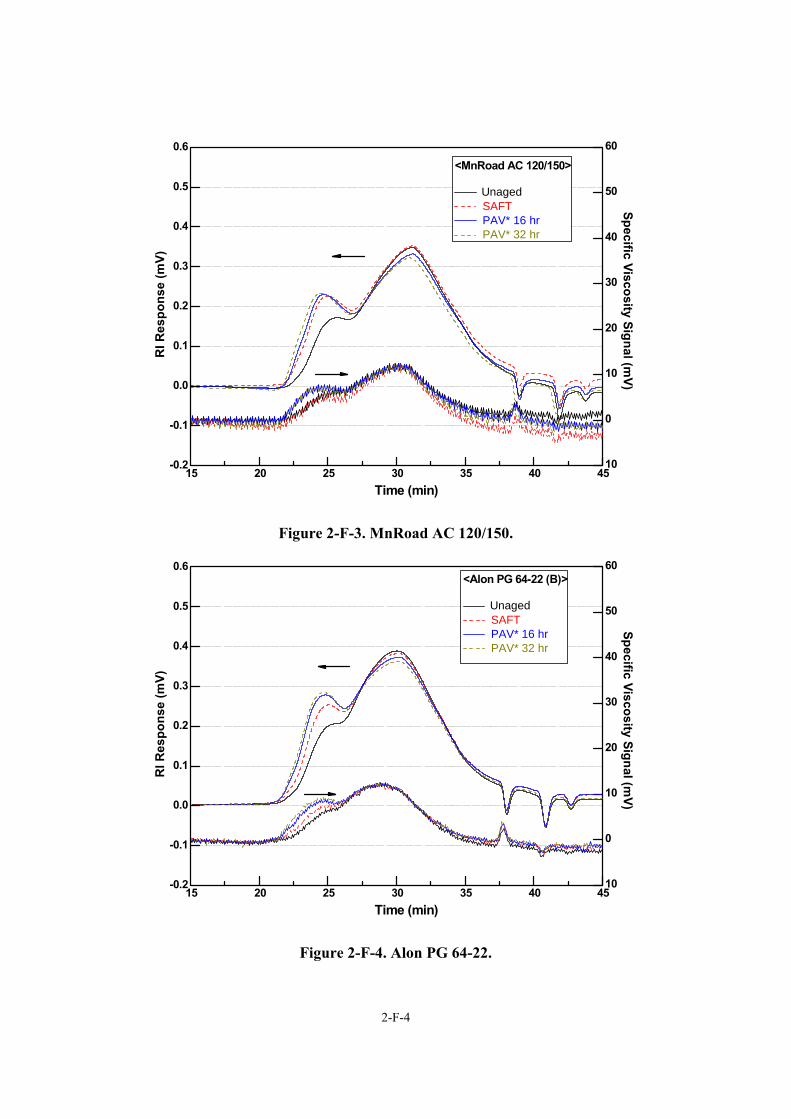
2-F-4
10
0
10
20
30
40
50
60
15 20 25 30 35 40 45-0.2
-0.1
0.0
0.1
0.2
0.3
0.4
0.5
0.6Specific Viscosity Signal (m
V)
Time (min)
RI R
espo
nse
(mV)
<MnRoad AC 120/150>
Unaged SAFT PAV* 16 hr PAV* 32 hr
Figure 2-F-3. MnRoad AC 120/150.
10
0
10
20
30
40
50
60
15 20 25 30 35 40 45-0.2
-0.1
0.0
0.1
0.2
0.3
0.4
0.5
0.6<Alon PG 64-22 (B)>
Unaged SAFT PAV* 16 hr PAV* 32 hr
Specific Viscosity Signal (mV)
Time (min)
RI R
espo
nse
(mV)
Figure 2-F-4. Alon PG 64-22.
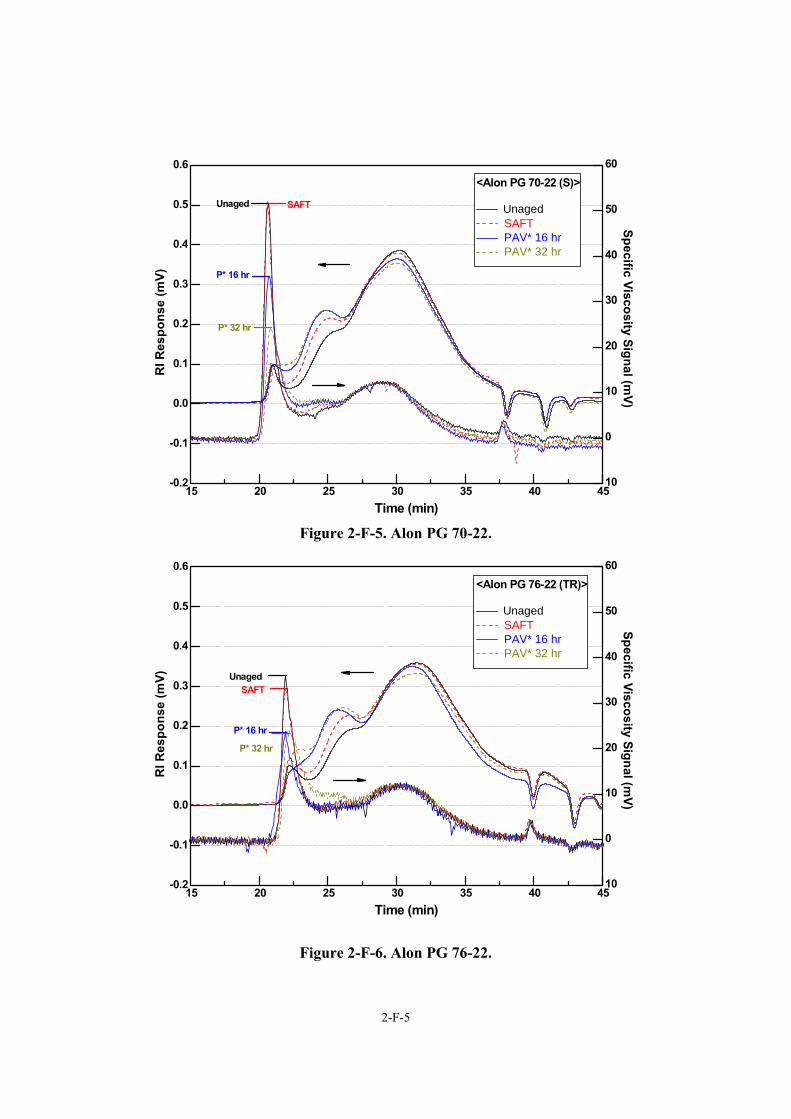
2-F-5
10
0
10
20
30
40
50
60
15 20 25 30 35 40 45-0.2
-0.1
0.0
0.1
0.2
0.3
0.4
0.5
0.6
P* 32 hr
P* 16 hr
SAFT
<Alon PG 70-22 (S)>
Unaged SAFT PAV* 16 hr PAV* 32 hr
Specific Viscosity Signal (mV)
Time (min)
RI R
espo
nse
(mV)
Unaged
Figure 2-F-5. Alon PG 70-22.
10
0
10
20
30
40
50
60
15 20 25 30 35 40 45-0.2
-0.1
0.0
0.1
0.2
0.3
0.4
0.5
0.6
P* 32 hr
P* 16 hr
SAFT
<Alon PG 76-22 (TR)>
Unaged SAFT PAV* 16 hr PAV* 32 hr
Specific Viscosity Signal (mV)
Time (min)
RI R
espo
nse
(mV) Unaged
Figure 2-F-6. Alon PG 76-22.
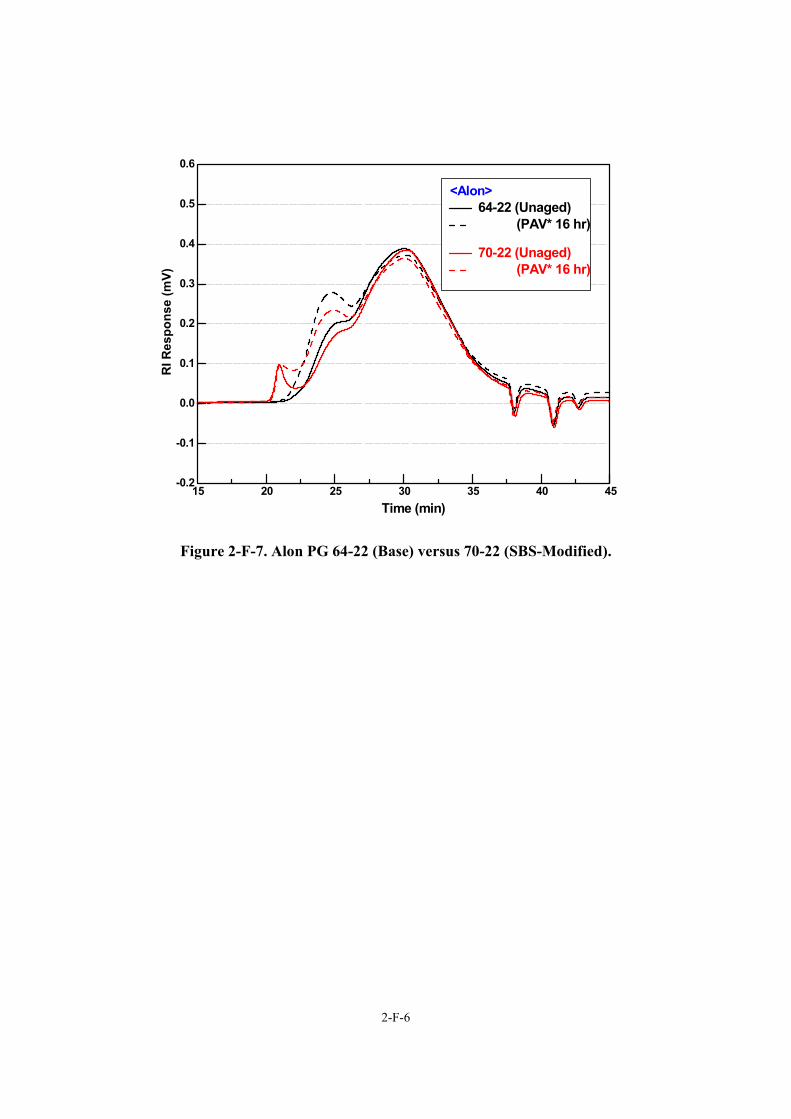
2-F-6
15 20 25 30 35 40 45-0.2
-0.1
0.0
0.1
0.2
0.3
0.4
0.5
0.6
<Alon> 64-22 (Unaged) (PAV* 16 hr)
70-22 (Unaged) (PAV* 16 hr)
Time (min)
RI R
espo
nse
(mV)
Figure 2-F-7. Alon PG 64-22 (Base) versus 70-22 (SBS-Modified).
2-G-1
APPENDICES FOR CHAPTER 2
APPENDIX 2-G
FIGURES OF FORCE DUCTILITY DATA

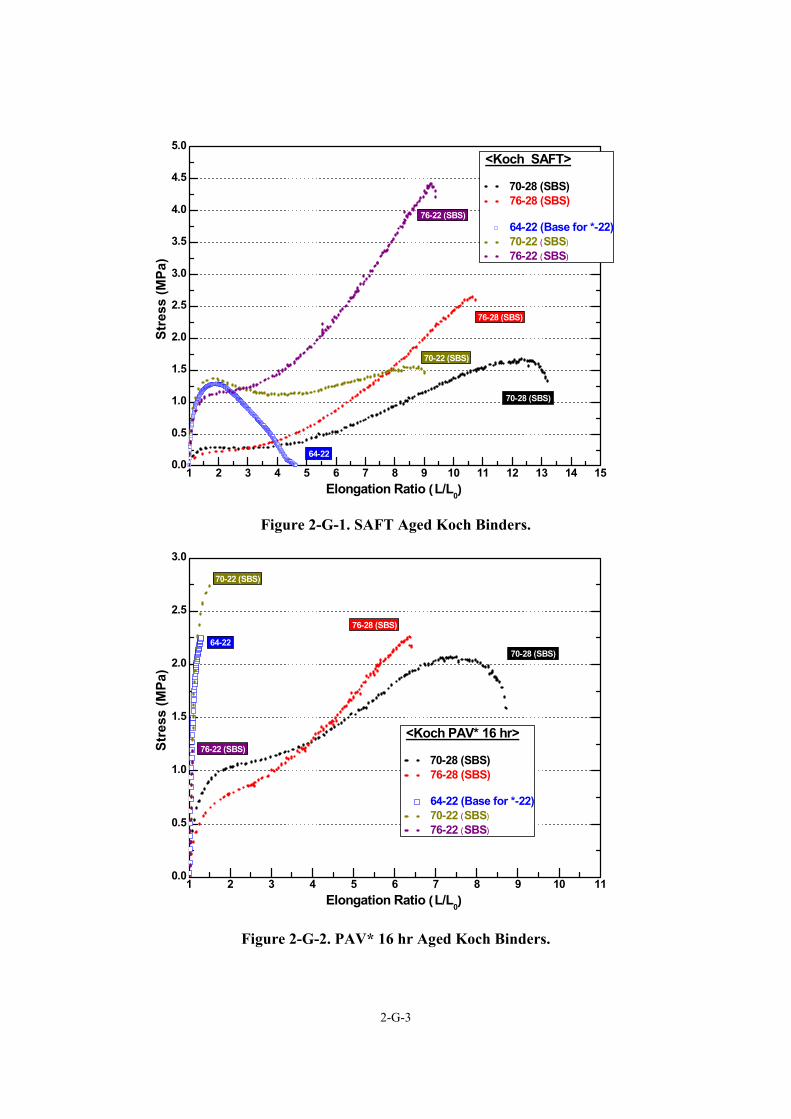
2-G-3
1 2 3 4 5 6 7 8 9 10 11 12 13 14 150.0
0.5
1.0
1.5
2.0
2.5
3.0
3.5
4.0
4.5
5.0<Koch SAFT>
70-28 (SBS) 76-28 (SBS)
64-22 (Base for *-22) 70-22 (SBS)
76-22 (SBS)
Stre
ss (M
Pa)
Elongation Ratio (L/L0)
70-22 (SBS)
76-22 (SBS)
70-28 (SBS)
76-28 (SBS)
64-22
Figure 2-G-1. SAFT Aged Koch Binders.
1 2 3 4 5 6 7 8 9 10 110.0
0.5
1.0
1.5
2.0
2.5
3.0
76-28 (SBS)
<Koch PAV* 16 hr>
70-28 (SBS) 76-28 (SBS)
64-22 (Base for *-22) 70-22 (SBS)
76-22 (SBS)
Stre
ss (M
Pa)
Elongation Ratio (L/L0)
70-22 (SBS)
76-22 (SBS)
70-28 (SBS)64-22
Figure 2-G-2. PAV* 16 hr Aged Koch Binders.
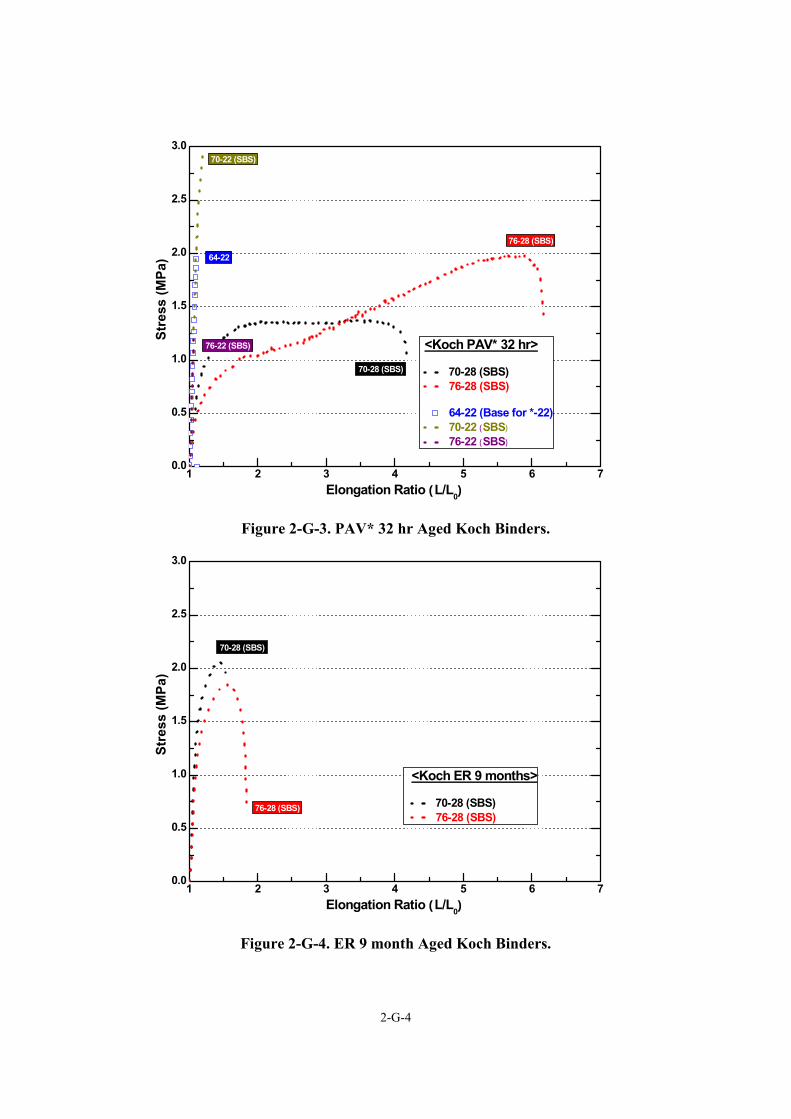
2-G-4
1 2 3 4 5 6 70.0
0.5
1.0
1.5
2.0
2.5
3.070-22 (SBS)
76-22 (SBS)
Stre
ss (M
Pa)
Elongation Ratio (L/L0)
70-28 (SBS)
76-28 (SBS)
64-22
<Koch PAV* 32 hr>
70-28 (SBS) 76-28 (SBS)
64-22 (Base for *-22) 70-22 (SBS)
76-22 (SBS)
Figure 2-G-3. PAV* 32 hr Aged Koch Binders.
1 2 3 4 5 6 70.0
0.5
1.0
1.5
2.0
2.5
3.0
Stre
ss (M
Pa)
Elongation Ratio (L/L0)
70-28 (SBS)
76-28 (SBS)
<Koch ER 9 months>
70-28 (SBS) 76-28 (SBS)
Figure 2-G-4. ER 9 month Aged Koch Binders.
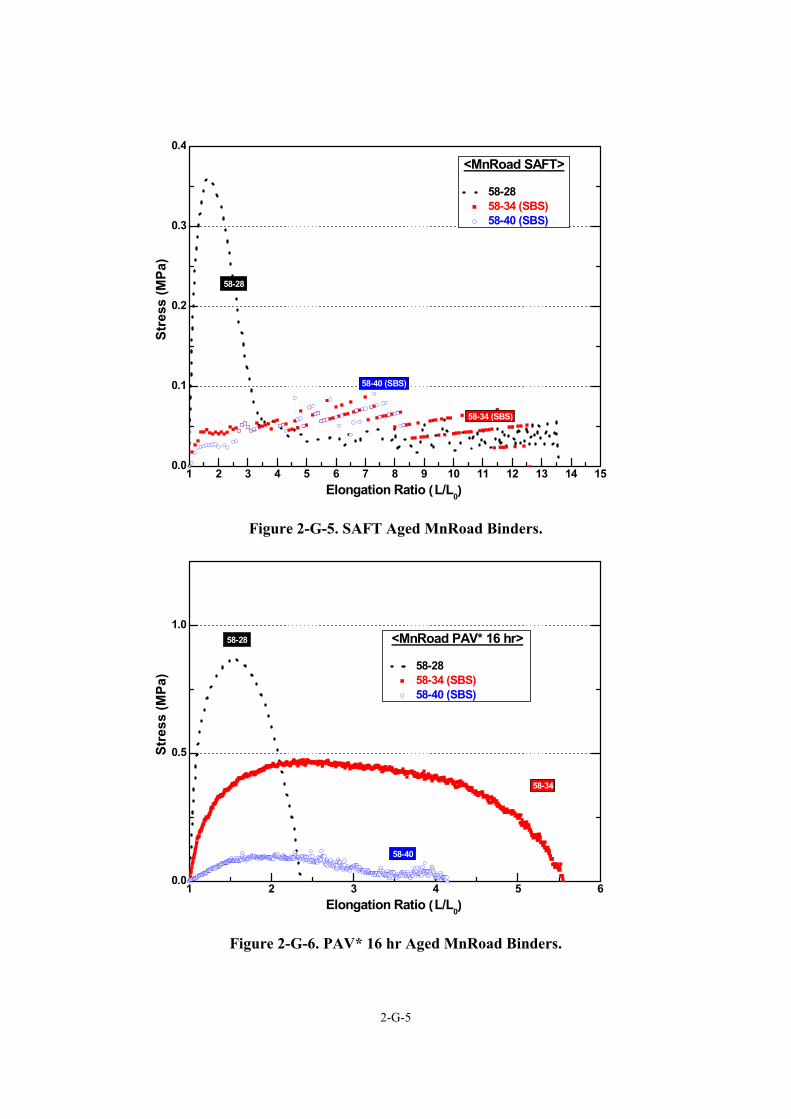
2-G-5
1 2 3 4 5 6 7 8 9 10 11 12 13 14 150.0
0.1
0.2
0.3
0.4
58-34 (SBS)
Stre
ss (M
Pa)
Elongation Ratio (L/L0)
58-28
58-40 (SBS)
<MnRoad SAFT>
58-28 58-34 (SBS) 58-40 (SBS)
Figure 2-G-5. SAFT Aged MnRoad Binders.
1 2 3 4 5 60.0
0.5
1.0
Stre
ss (M
Pa)
Elongation Ratio (L/L0)
58-28
58-34
58-40
<MnRoad PAV* 16 hr>
58-28 58-34 (SBS) 58-40 (SBS)
Figure 2-G-6. PAV* 16 hr Aged MnRoad Binders.
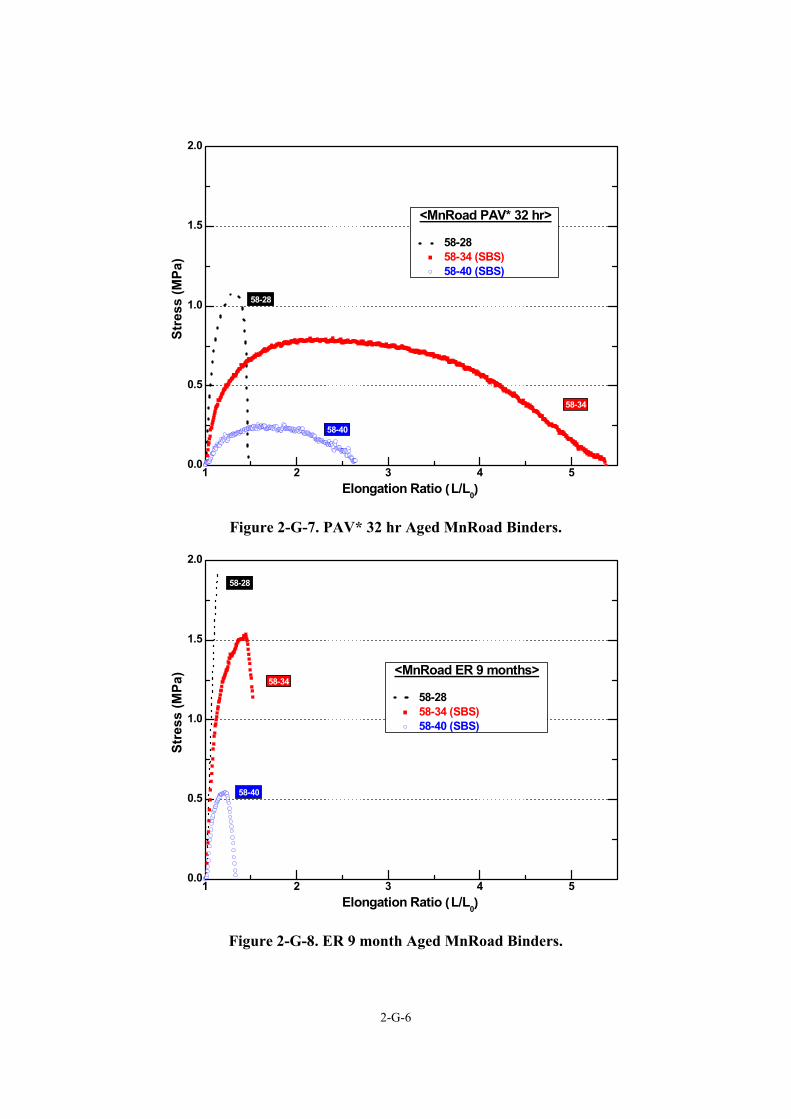
2-G-6
1 2 3 4 50.0
0.5
1.0
1.5
2.0
Stre
ss (M
Pa)
Elongation Ratio (L/L0)
58-28
58-34
58-40
<MnRoad PAV* 32 hr>
58-28 58-34 (SBS) 58-40 (SBS)
Figure 2-G-7. PAV* 32 hr Aged MnRoad Binders.
1 2 3 4 50.0
0.5
1.0
1.5
2.0
Stre
ss (M
Pa)
Elongation Ratio (L/L0)
58-28
58-34
58-40
<MnRoad ER 9 months>
58-28 58-34 (SBS) 58-40 (SBS)
Figure 2-G-8. ER 9 month Aged MnRoad Binders.
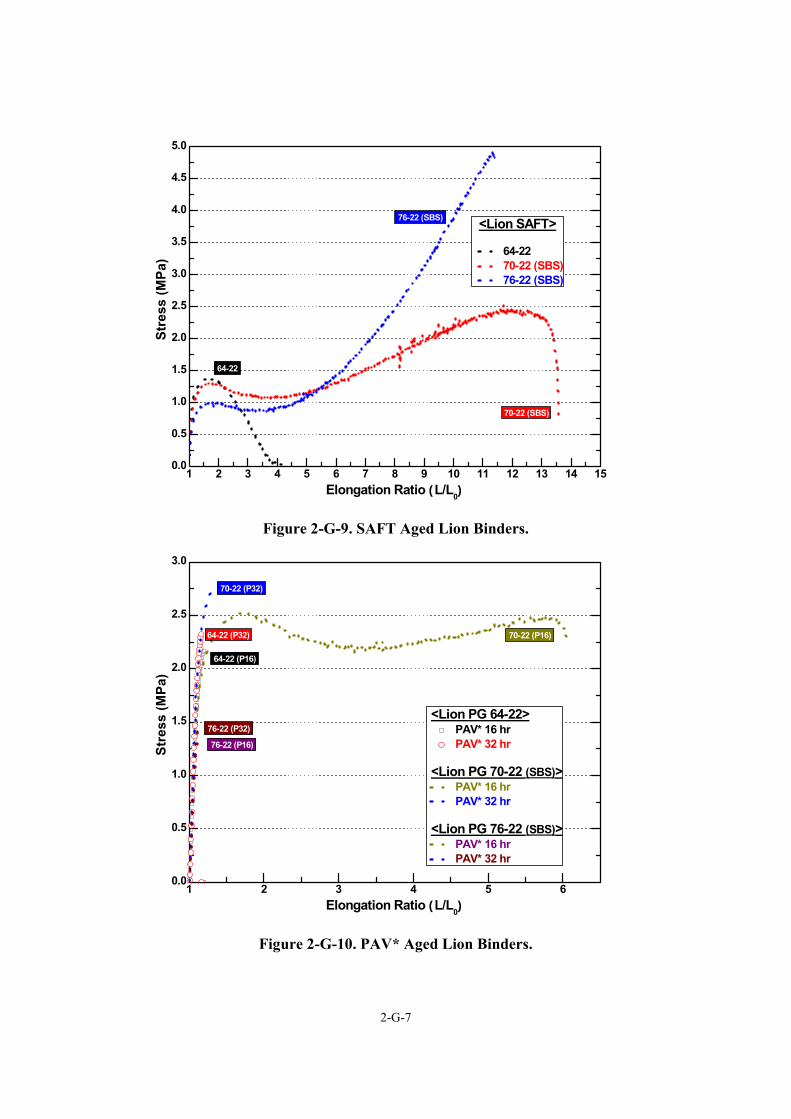
2-G-7
1 2 3 4 5 6 7 8 9 10 11 12 13 14 150.0
0.5
1.0
1.5
2.0
2.5
3.0
3.5
4.0
4.5
5.0
Stre
ss (M
Pa)
Elongation Ratio (L/L0)
64-22
70-22 (SBS)
76-22 (SBS) <Lion SAFT>
64-22 70-22 (SBS) 76-22 (SBS)
Figure 2-G-9. SAFT Aged Lion Binders.
1 2 3 4 5 60.0
0.5
1.0
1.5
2.0
2.5
3.0
76-22 (P32)
76-22 (P16)
70-22 (P32)
Stre
ss (M
Pa)
Elongation Ratio (L/L0)
64-22 (P16)
64-22 (P32) 70-22 (P16)
<Lion PG 64-22> PAV* 16 hr PAV* 32 hr
<Lion PG 70-22 (SBS)> PAV* 16 hr PAV* 32 hr
<Lion PG 76-22 (SBS)> PAV* 16 hr PAV* 32 hr
Figure 2-G-10. PAV* Aged Lion Binders.
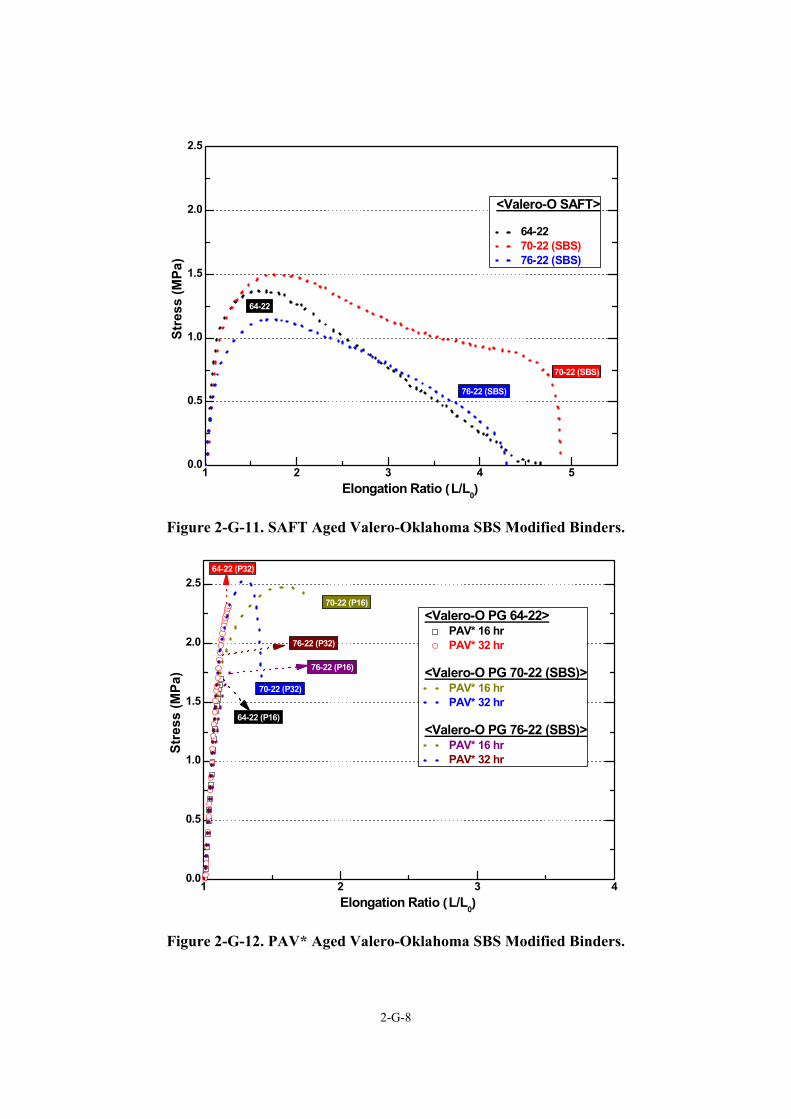
2-G-8
1 2 3 4 50.0
0.5
1.0
1.5
2.0
2.5
Stre
ss (M
Pa)
Elongation Ratio (L/L0)
64-22
70-22 (SBS)
76-22 (SBS)
<Valero-O SAFT>
64-22 70-22 (SBS) 76-22 (SBS)
Figure 2-G-11. SAFT Aged Valero-Oklahoma SBS Modified Binders.
1 2 3 40.0
0.5
1.0
1.5
2.0
2.5
76-22 (P32)
76-22 (P16)
70-22 (P32)
Stre
ss (M
Pa)
Elongation Ratio (L/L0)
64-22 (P16)
64-22 (P32)
70-22 (P16)<Valero-O PG 64-22>
PAV* 16 hr PAV* 32 hr
<Valero-O PG 70-22 (SBS)> PAV* 16 hr PAV* 32 hr
<Valero-O PG 76-22 (SBS)> PAV* 16 hr PAV* 32 hr
Figure 2-G-12. PAV* Aged Valero-Oklahoma SBS Modified Binders.
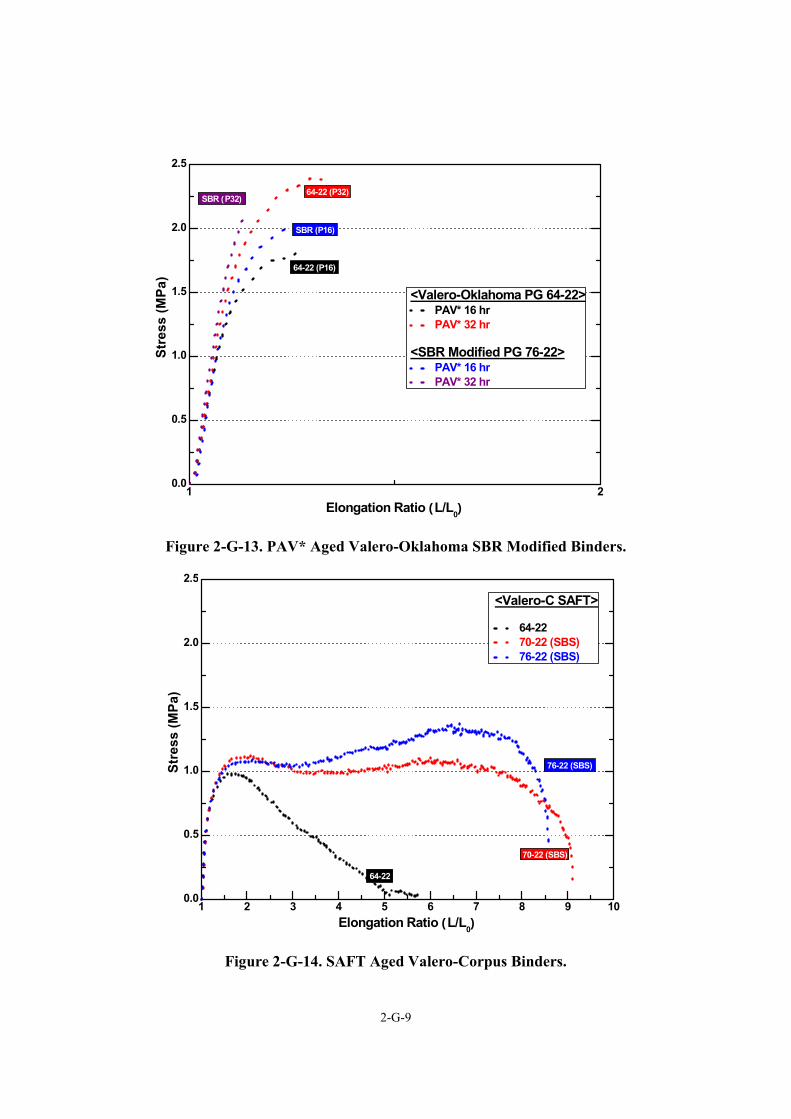
2-G-9
1 20.0
0.5
1.0
1.5
2.0
2.5
SBR (P32)
Stre
ss (M
Pa)
Elongation Ratio (L/L0)
64-22 (P16)
64-22 (P32)
SBR (P16)
<Valero-Oklahoma PG 64-22> PAV* 16 hr PAV* 32 hr
<SBR Modified PG 76-22> PAV* 16 hr PAV* 32 hr
Figure 2-G-13. PAV* Aged Valero-Oklahoma SBR Modified Binders.
1 2 3 4 5 6 7 8 9 100.0
0.5
1.0
1.5
2.0
2.5
Stre
ss (M
Pa)
Elongation Ratio (L/L0)
64-22
70-22 (SBS)
76-22 (SBS)
<Valero-C SAFT>
64-22 70-22 (SBS) 76-22 (SBS)
Figure 2-G-14. SAFT Aged Valero-Corpus Binders.
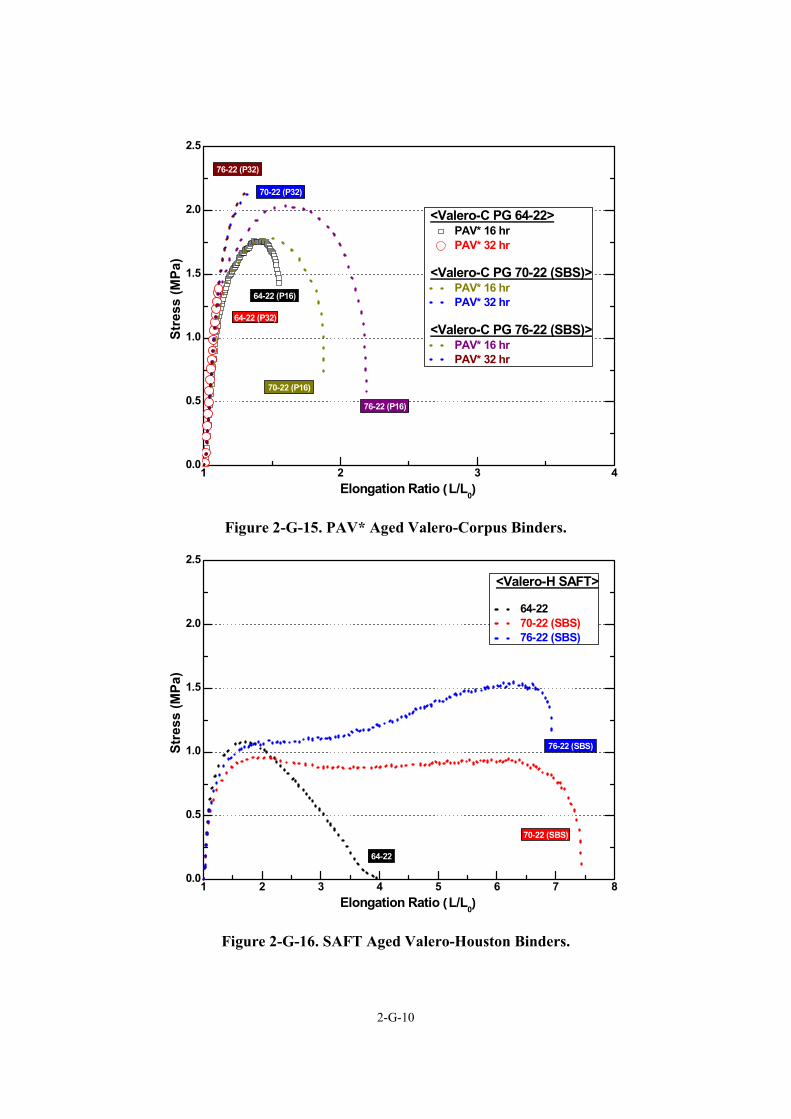
2-G-10
1 2 3 40.0
0.5
1.0
1.5
2.0
2.5
76-22 (P32)
76-22 (P16)
70-22 (P32)
Stre
ss (M
Pa)
Elongation Ratio (L/L0)
64-22 (P16)
64-22 (P32)
70-22 (P16)
<Valero-C PG 64-22> PAV* 16 hr PAV* 32 hr
<Valero-C PG 70-22 (SBS)> PAV* 16 hr PAV* 32 hr
<Valero-C PG 76-22 (SBS)> PAV* 16 hr PAV* 32 hr
Figure 2-G-15. PAV* Aged Valero-Corpus Binders.
1 2 3 4 5 6 7 80.0
0.5
1.0
1.5
2.0
2.5
Stre
ss (M
Pa)
Elongation Ratio (L/L0)
64-22
70-22 (SBS)
76-22 (SBS)
<Valero-H SAFT>
64-22 70-22 (SBS) 76-22 (SBS)
Figure 2-G-16. SAFT Aged Valero-Houston Binders.
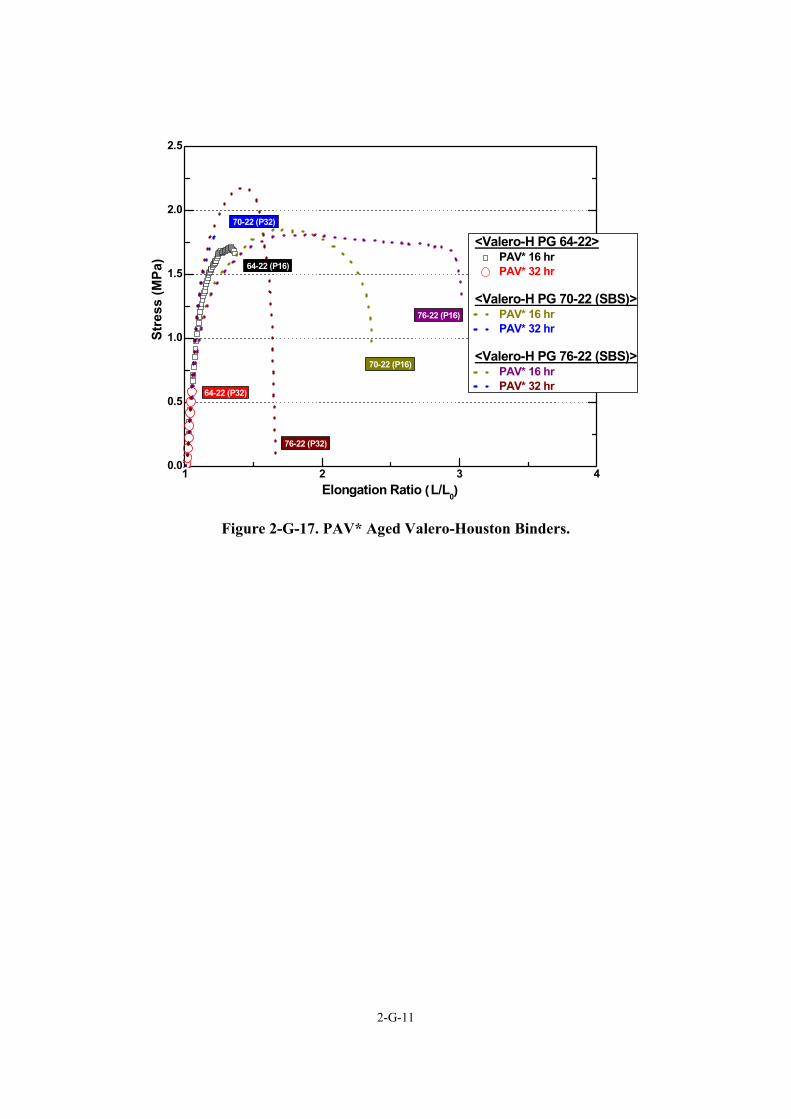
2-G-11
1 2 3 40.0
0.5
1.0
1.5
2.0
2.5
76-22 (P32)
76-22 (P16)
70-22 (P32)
Stre
ss (M
Pa)
Elongation Ratio (L/L0)
64-22 (P16)
64-22 (P32)
70-22 (P16)
<Valero-H PG 64-22> PAV* 16 hr PAV* 32 hr
<Valero-H PG 70-22 (SBS)> PAV* 16 hr PAV* 32 hr
<Valero-H PG 76-22 (SBS)> PAV* 16 hr PAV* 32 hr
Figure 2-G-17. PAV* Aged Valero-Houston Binders.

2-H-1
APPENDICES FOR CHAPTER 2
APPENDIX 2-H
FIGURES OF FT-IR DATA

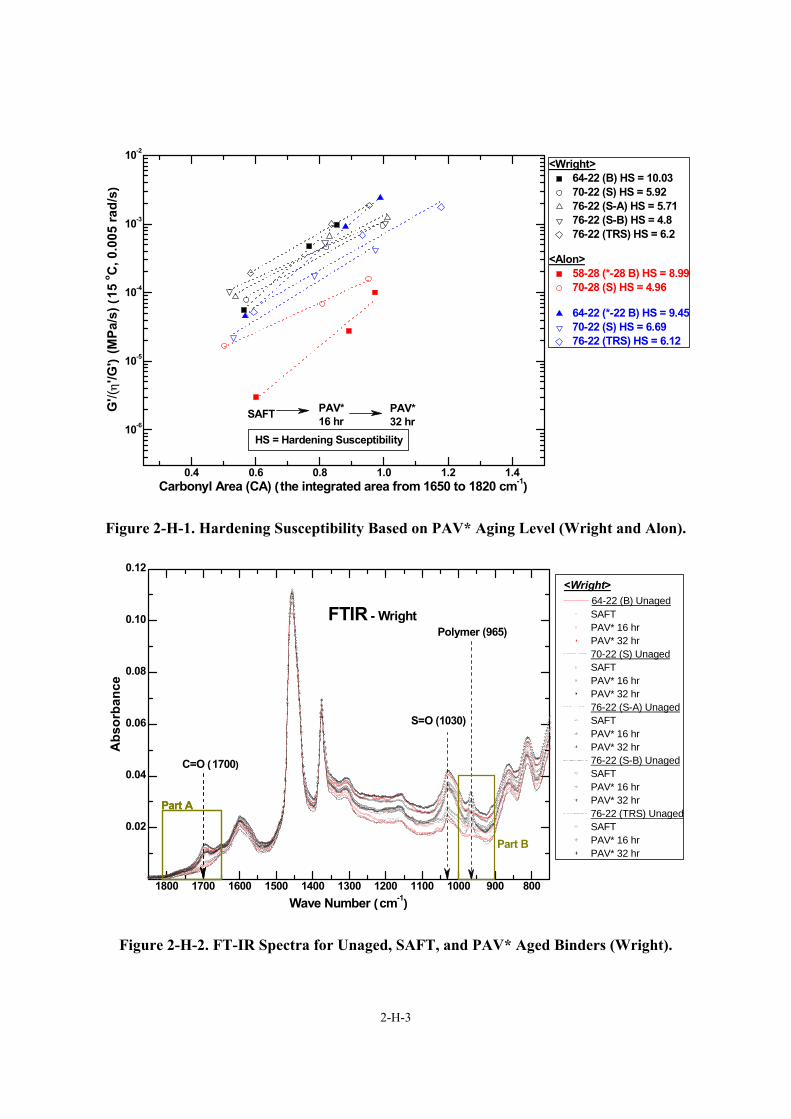
2-H-3
0.4 0.6 0.8 1.0 1.2 1.4
10-6
10-5
10-4
10-3
10-2
PAV* 32 hr
SAFT
<Wright> 64-22 (B) HS = 10.03 70-22 (S) HS = 5.92 76-22 (S-A) HS = 5.71 76-22 (S-B) HS = 4.8 76-22 (TRS) HS = 6.2
<Alon> 58-28 (*-28 B) HS = 8.99 70-28 (S) HS = 4.96
64-22 (*-22 B) HS = 9.45 70-22 (S) HS = 6.69 76-22 (TRS) HS = 6.12
HS = Hardening Susceptibility
G'/(
η'/G
') (M
Pa/s
) (15
o C, 0
.005
rad/
s)
Carbonyl Area (CA) (the integrated area from 1650 to 1820 cm-1)
PAV* 16 hr
Figure 2-H-1. Hardening Susceptibility Based on PAV* Aging Level (Wright and Alon).
1800 1700 1600 1500 1400 1300 1200 1100 1000 900 800
0.02
0.04
0.06
0.08
0.10
0.12<Wright>
64-22 (B) Unaged SAFT PAV* 16 hr PAV* 32 hr 70-22 (S) Unaged SAFT PAV* 16 hr PAV* 32 hr 76-22 (S-A) Unaged SAFT PAV* 16 hr PAV* 32 hr 76-22 (S-B) Unaged SAFT PAV* 16 hr PAV* 32 hr 76-22 (TRS) Unaged SAFT PAV* 16 hr PAV* 32 hr
Polymer (965) FTIR - Wright
Abs
orba
nce
Wave Number (cm-1)
C=O (1700)
S=O (1030)
Part APart A
Part B
Figure 2-H-2. FT-IR Spectra for Unaged, SAFT, and PAV* Aged Binders (Wright).
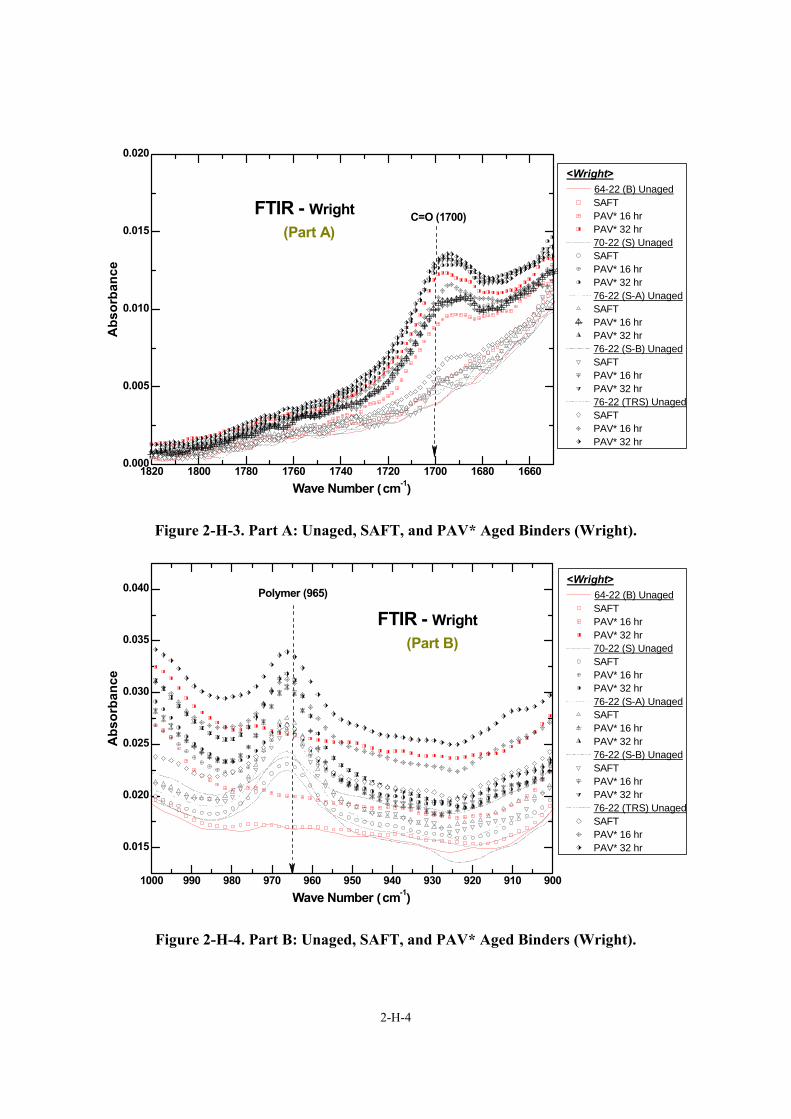
2-H-4
1820 1800 1780 1760 1740 1720 1700 1680 16600.000
0.005
0.010
0.015
0.020
<Wright> 64-22 (B) Unaged SAFT PAV* 16 hr PAV* 32 hr 70-22 (S) Unaged SAFT PAV* 16 hr PAV* 32 hr 76-22 (S-A) Unaged SAFT PAV* 16 hr PAV* 32 hr 76-22 (S-B) Unaged SAFT PAV* 16 hr PAV* 32 hr 76-22 (TRS) Unaged SAFT PAV* 16 hr PAV* 32 hr
Abs
orba
nce
Wave Number (cm-1)
FTIR - Wright (Part A)
C=O (1700)
Figure 2-H-3. Part A: Unaged, SAFT, and PAV* Aged Binders (Wright).
1000 990 980 970 960 950 940 930 920 910 900
0.015
0.020
0.025
0.030
0.035
0.040<Wright>
64-22 (B) Unaged SAFT PAV* 16 hr PAV* 32 hr 70-22 (S) Unaged SAFT PAV* 16 hr PAV* 32 hr 76-22 (S-A) Unaged SAFT PAV* 16 hr PAV* 32 hr 76-22 (S-B) Unaged SAFT PAV* 16 hr PAV* 32 hr 76-22 (TRS) Unaged SAFT PAV* 16 hr PAV* 32 hr
Abs
orba
nce
Wave Number (cm-1)
FTIR - Wright (Part B)
Polymer (965)
Figure 2-H-4. Part B: Unaged, SAFT, and PAV* Aged Binders (Wright).
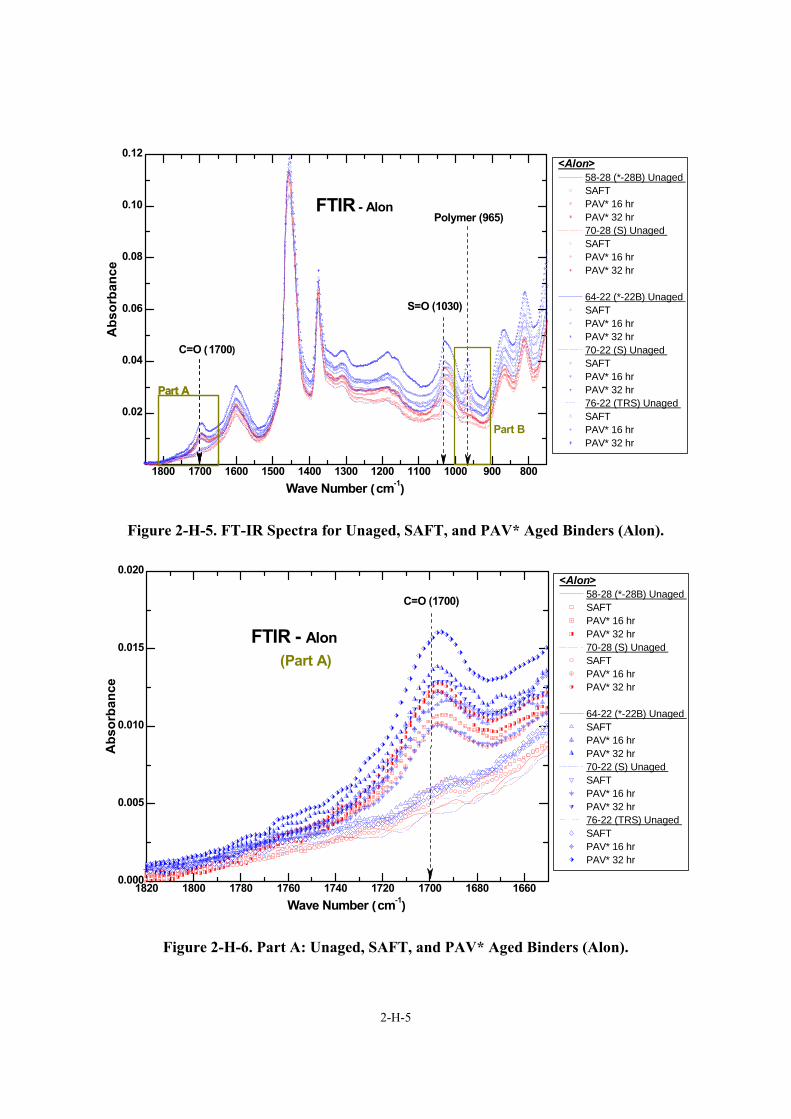
2-H-5
1800 1700 1600 1500 1400 1300 1200 1100 1000 900 800
0.02
0.04
0.06
0.08
0.10
0.12<Alon>
58-28 (*-28B) Unaged SAFT PAV* 16 hr PAV* 32 hr 70-28 (S) Unaged SAFT PAV* 16 hr PAV* 32 hr
64-22 (*-22B) Unaged SAFT PAV* 16 hr PAV* 32 hr 70-22 (S) Unaged SAFT PAV* 16 hr PAV* 32 hr 76-22 (TRS) Unaged SAFT PAV* 16 hr PAV* 32 hr
Abs
orba
nce
Wave Number (cm-1)
C=O (1700)
Part APart A
Polymer (965) FTIR - Alon
S=O (1030)
Part B
Figure 2-H-5. FT-IR Spectra for Unaged, SAFT, and PAV* Aged Binders (Alon).
1820 1800 1780 1760 1740 1720 1700 1680 16600.000
0.005
0.010
0.015
0.020<Alon>
58-28 (*-28B) Unaged SAFT PAV* 16 hr PAV* 32 hr 70-28 (S) Unaged SAFT PAV* 16 hr PAV* 32 hr
64-22 (*-22B) Unaged SAFT PAV* 16 hr PAV* 32 hr 70-22 (S) Unaged SAFT PAV* 16 hr PAV* 32 hr 76-22 (TRS) Unaged SAFT PAV* 16 hr PAV* 32 hr
FTIR - Alon (Part A)
Abs
orba
nce
Wave Number (cm-1)
C=O (1700)
Figure 2-H-6. Part A: Unaged, SAFT, and PAV* Aged Binders (Alon).
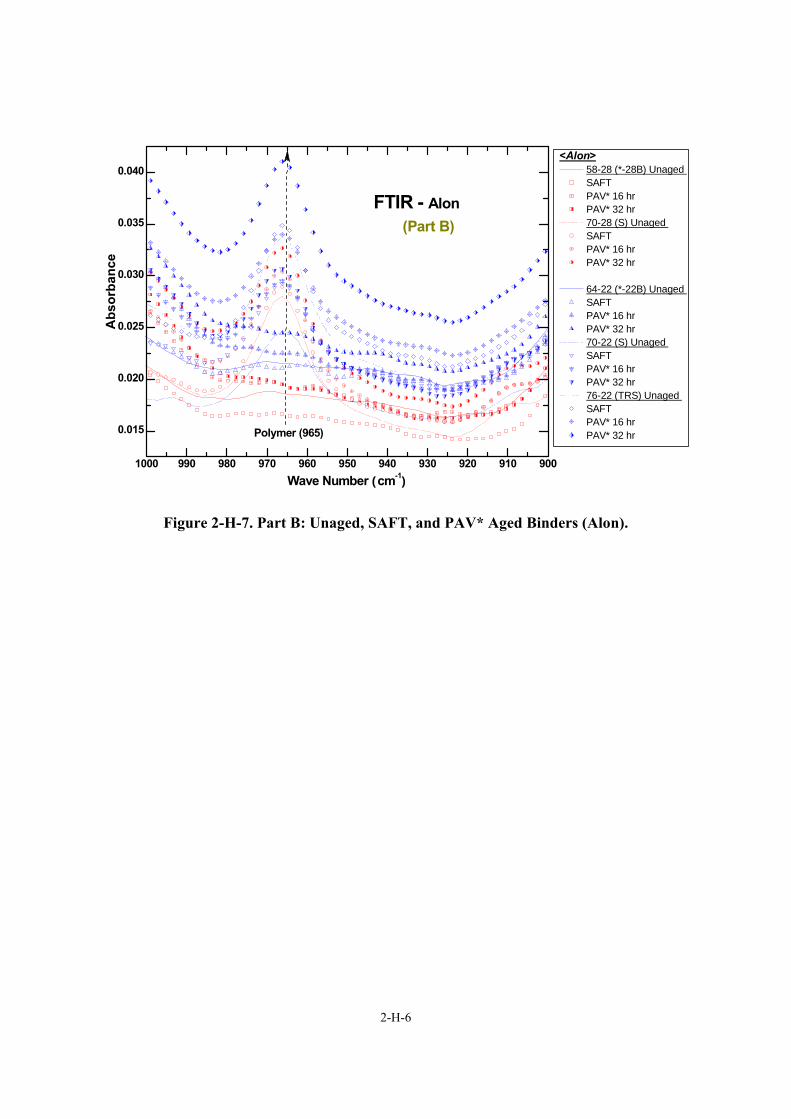
2-H-6
1000 990 980 970 960 950 940 930 920 910 900
0.015
0.020
0.025
0.030
0.035
0.040<Alon>
58-28 (*-28B) Unaged SAFT PAV* 16 hr PAV* 32 hr 70-28 (S) Unaged SAFT PAV* 16 hr PAV* 32 hr
64-22 (*-22B) Unaged SAFT PAV* 16 hr PAV* 32 hr 70-22 (S) Unaged SAFT PAV* 16 hr PAV* 32 hr 76-22 (TRS) Unaged SAFT PAV* 16 hr PAV* 32 hr
FTIR - Alon (Part B)
Abs
orba
nce
Wave Number (cm-1)
Polymer (965)
Figure 2-H-7. Part B: Unaged, SAFT, and PAV* Aged Binders (Alon).
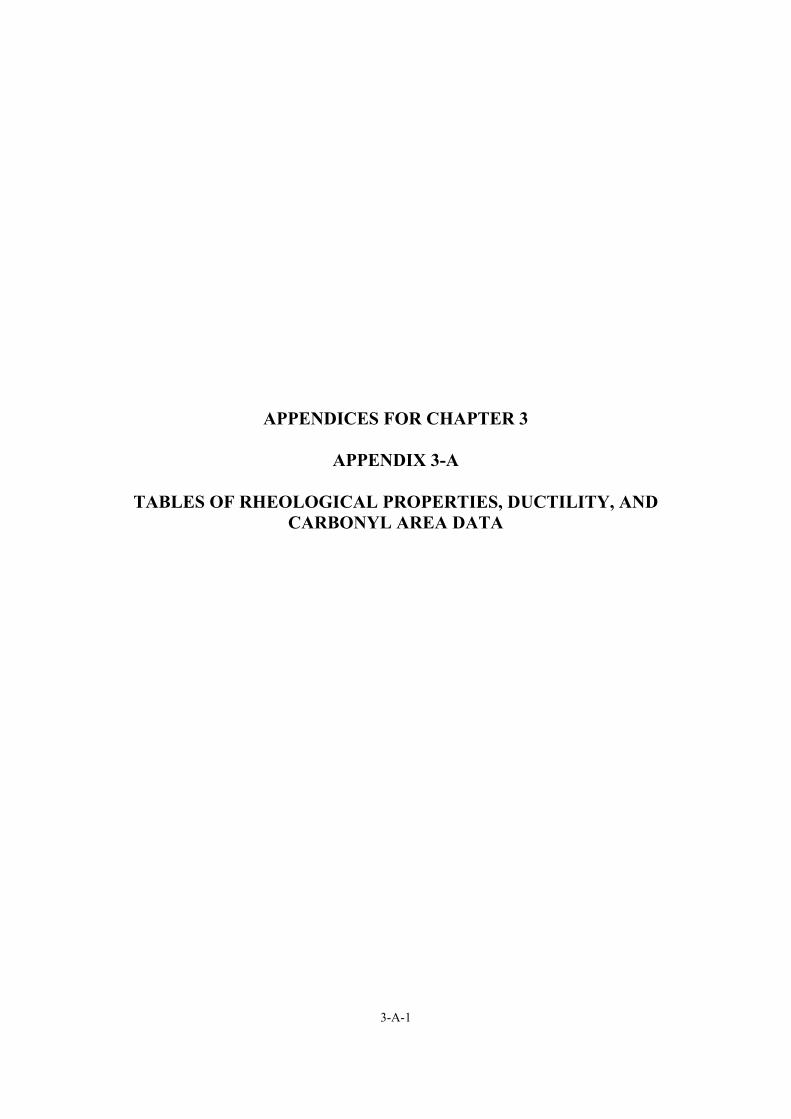
3-A-1
APPENDICES FOR CHAPTER 3
APPENDIX 3-A
TABLES OF RHEOLOGICAL PROPERTIES, DUCTILITY, AND CARBONYL AREA DATA

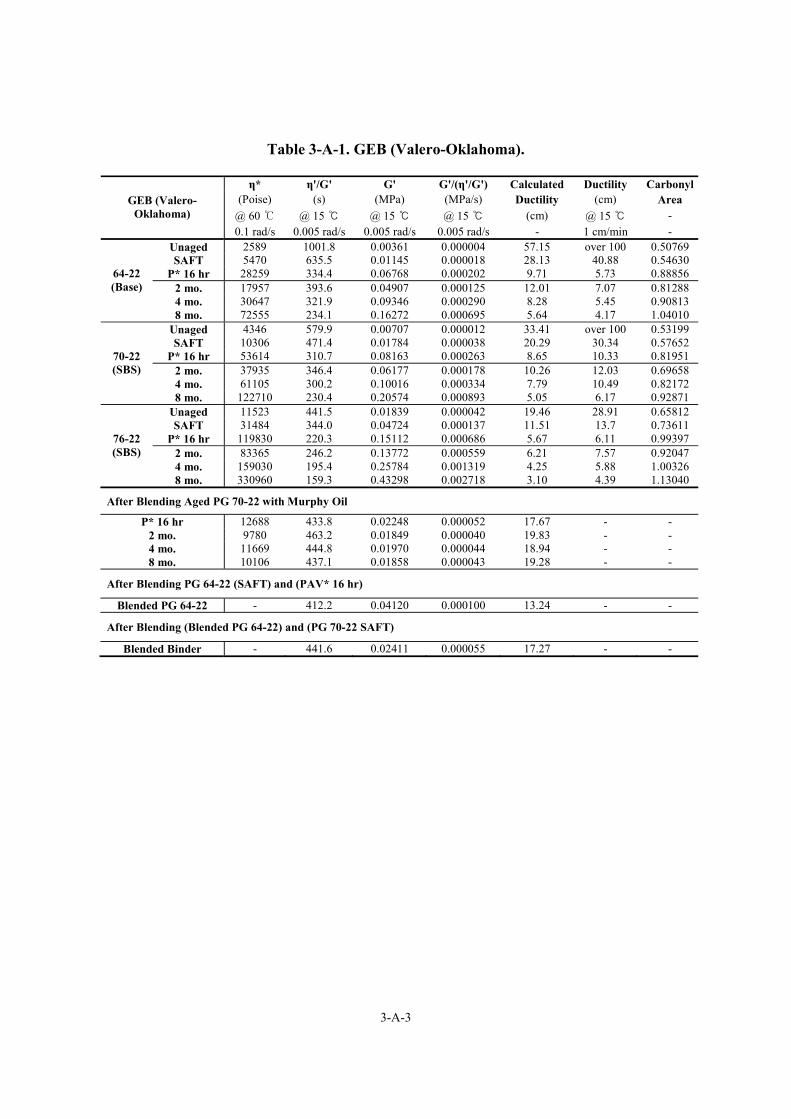
3-A-3
Table 3-A-1. GEB (Valero-Oklahoma).
η* η'/G' G' G'/(η'/G') Calculated Ductility Carbonyl(Poise) (s) (MPa) (MPa/s) Ductility (cm) Area
@ 60 ℃ @ 15 ℃ @ 15 ℃ @ 15 ℃ (cm) @ 15 ℃ - GEB (Valero-
Oklahoma) 0.1 rad/s 0.005 rad/s 0.005 rad/s 0.005 rad/s - 1 cm/min -
Unaged 2589 1001.8 0.00361 0.000004 57.15 over 100 0.50769 SAFT 5470 635.5 0.01145 0.000018 28.13 40.88 0.54630
P* 16 hr 28259 334.4 0.06768 0.000202 9.71 5.73 0.88856 2 mo. 17957 393.6 0.04907 0.000125 12.01 7.07 0.81288 4 mo. 30647 321.9 0.09346 0.000290 8.28 5.45 0.90813
64-22 (Base)
8 mo. 72555 234.1 0.16272 0.000695 5.64 4.17 1.04010 Unaged 4346 579.9 0.00707 0.000012 33.41 over 100 0.53199 SAFT 10306 471.4 0.01784 0.000038 20.29 30.34 0.57652
P* 16 hr 53614 310.7 0.08163 0.000263 8.65 10.33 0.81951 2 mo. 37935 346.4 0.06177 0.000178 10.26 12.03 0.69658 4 mo. 61105 300.2 0.10016 0.000334 7.79 10.49 0.82172
70-22 (SBS)
8 mo. 122710 230.4 0.20574 0.000893 5.05 6.17 0.92871 Unaged 11523 441.5 0.01839 0.000042 19.46 28.91 0.65812 SAFT 31484 344.0 0.04724 0.000137 11.51 13.7 0.73611
P* 16 hr 119830 220.3 0.15112 0.000686 5.67 6.11 0.99397 2 mo. 83365 246.2 0.13772 0.000559 6.21 7.57 0.92047 4 mo. 159030 195.4 0.25784 0.001319 4.25 5.88 1.00326
76-22 (SBS)
8 mo. 330960 159.3 0.43298 0.002718 3.10 4.39 1.13040
After Blending Aged PG 70-22 with Murphy Oil
P* 16 hr 12688 433.8 0.02248 0.000052 17.67 - - 2 mo. 9780 463.2 0.01849 0.000040 19.83 - - 4 mo. 11669 444.8 0.01970 0.000044 18.94 - - 8 mo. 10106 437.1 0.01858 0.000043 19.28 - -
After Blending PG 64-22 (SAFT) and (PAV* 16 hr)
Blended PG 64-22 - 412.2 0.04120 0.000100 13.24 - -
After Blending (Blended PG 64-22) and (PG 70-22 SAFT)
Blended Binder - 441.6 0.02411 0.000055 17.27 - -

3-B-1
APPENDICES FOR CHAPTER 3
APPENDIX 3-B
FIGURES OF GPC DATA

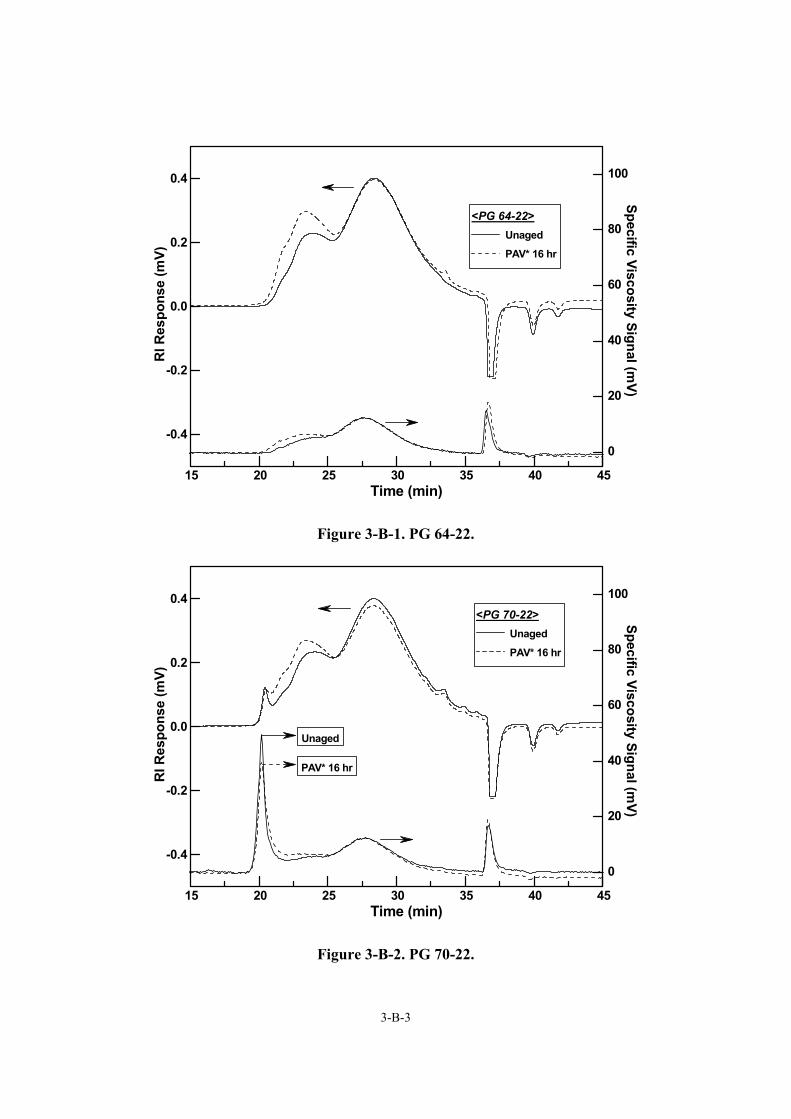
3-B-3
0
20
40
60
80
100
15 20 25 30 35 40 45
-0.4
-0.2
0.0
0.2
0.4
<PG 64-22> Unaged
PAV* 16 hr
Specific Viscosity Signal (mV)
Time (min)
RI R
espo
nse
(mV)
Figure 3-B-1. PG 64-22.
0
20
40
60
80
100
15 20 25 30 35 40 45
-0.4
-0.2
0.0
0.2
0.4<PG 70-22>
Unaged
PAV* 16 hr
Specific Viscosity Signal (mV)
Time (min)
RI R
espo
nse
(mV)
PAV* 16 hr
Unaged
Figure 3-B-2. PG 70-22.
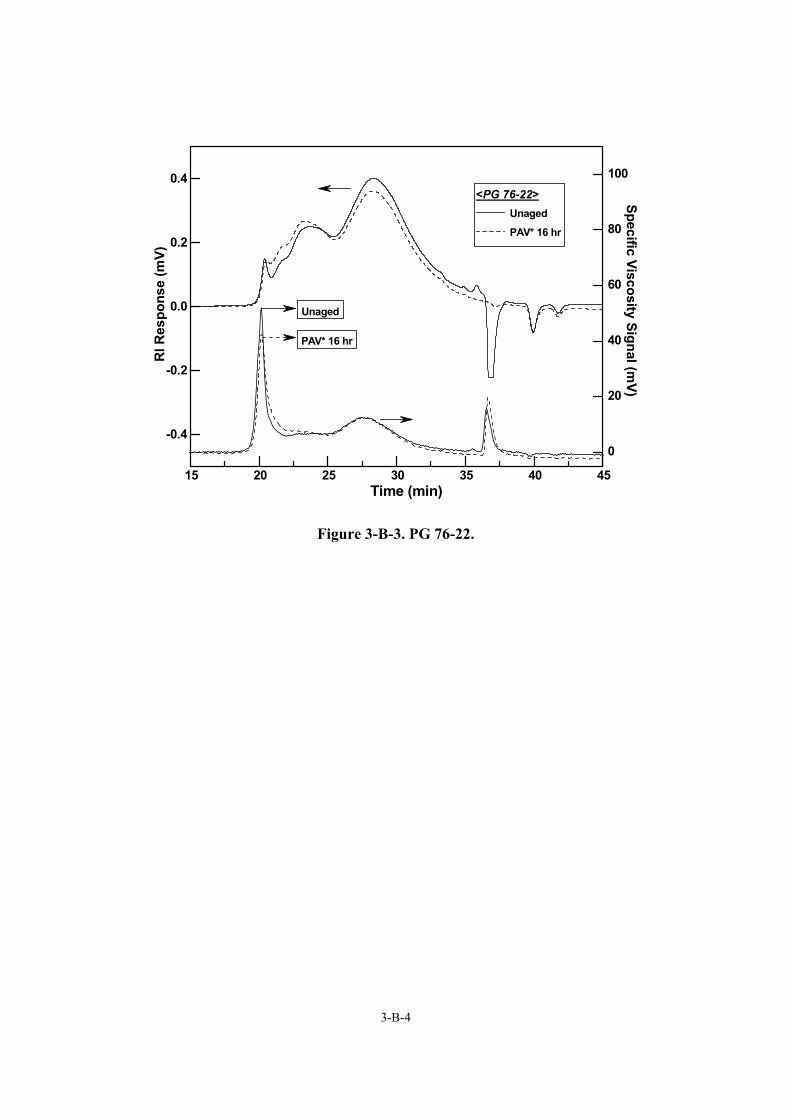
3-B-4
0
20
40
60
80
100
15 20 25 30 35 40 45
-0.4
-0.2
0.0
0.2
0.4<PG 76-22>
Unaged
PAV* 16 hr
Specific Viscosity Signal (mV)
Time (min)
RI R
espo
nse
(mV)
PAV* 16 hr
Unaged
Figure 3-B-3. PG 76-22.
5-A-1
APPENDICES FOR CHAPTER 5
APPENDIX 5-A
TABLES OF RHEOLOGICAL PROPERTIES, CARBONYL AREA, AND DSR FUNCTION HARDENING
WITH PAVEMENT SERVICE TIME DATA

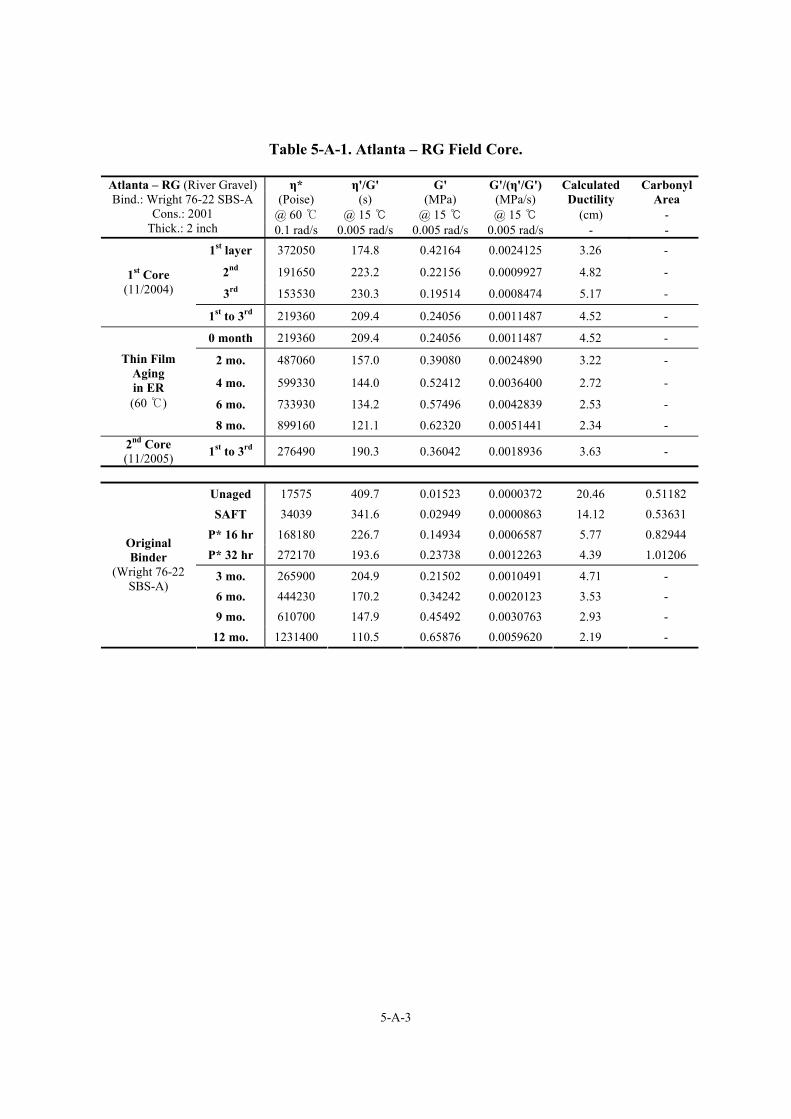
5-A-3
Table 5-A-1. Atlanta – RG Field Core.
η* η'/G' G' G'/(η'/G') Calculated Carbonyl(Poise) (s) (MPa) (MPa/s) Ductility Area
@ 60 ℃ @ 15 ℃ @ 15 ℃ @ 15 ℃ (cm) -
Atlanta – RG (River Gravel) Bind.: Wright 76-22 SBS-A
Cons.: 2001 Thick.: 2 inch 0.1 rad/s 0.005 rad/s 0.005 rad/s 0.005 rad/s - -
1st layer 372050 174.8 0.42164 0.0024125 3.26 -
2nd 191650 223.2 0.22156 0.0009927 4.82 -
3rd 153530 230.3 0.19514 0.0008474 5.17 - 1st Core
(11/2004)
1st to 3rd 219360 209.4 0.24056 0.0011487 4.52 -
0 month 219360 209.4 0.24056 0.0011487 4.52 -
2 mo. 487060 157.0 0.39080 0.0024890 3.22 -
4 mo. 599330 144.0 0.52412 0.0036400 2.72 -
6 mo. 733930 134.2 0.57496 0.0042839 2.53 -
Thin Film Aging in ER (60 ℃)
8 mo. 899160 121.1 0.62320 0.0051441 2.34 - 2nd Core (11/2005) 1st to 3rd 276490 190.3 0.36042 0.0018936 3.63 -
Unaged 17575 409.7 0.01523 0.0000372 20.46 0.51182 SAFT 34039 341.6 0.02949 0.0000863 14.12 0.53631
P* 16 hr 168180 226.7 0.14934 0.0006587 5.77 0.82944 P* 32 hr 272170 193.6 0.23738 0.0012263 4.39 1.01206
3 mo. 265900 204.9 0.21502 0.0010491 4.71 - 6 mo. 444230 170.2 0.34242 0.0020123 3.53 - 9 mo. 610700 147.9 0.45492 0.0030763 2.93 -
Original Binder
(Wright 76-22 SBS-A)
12 mo. 1231400 110.5 0.65876 0.0059620 2.19 -
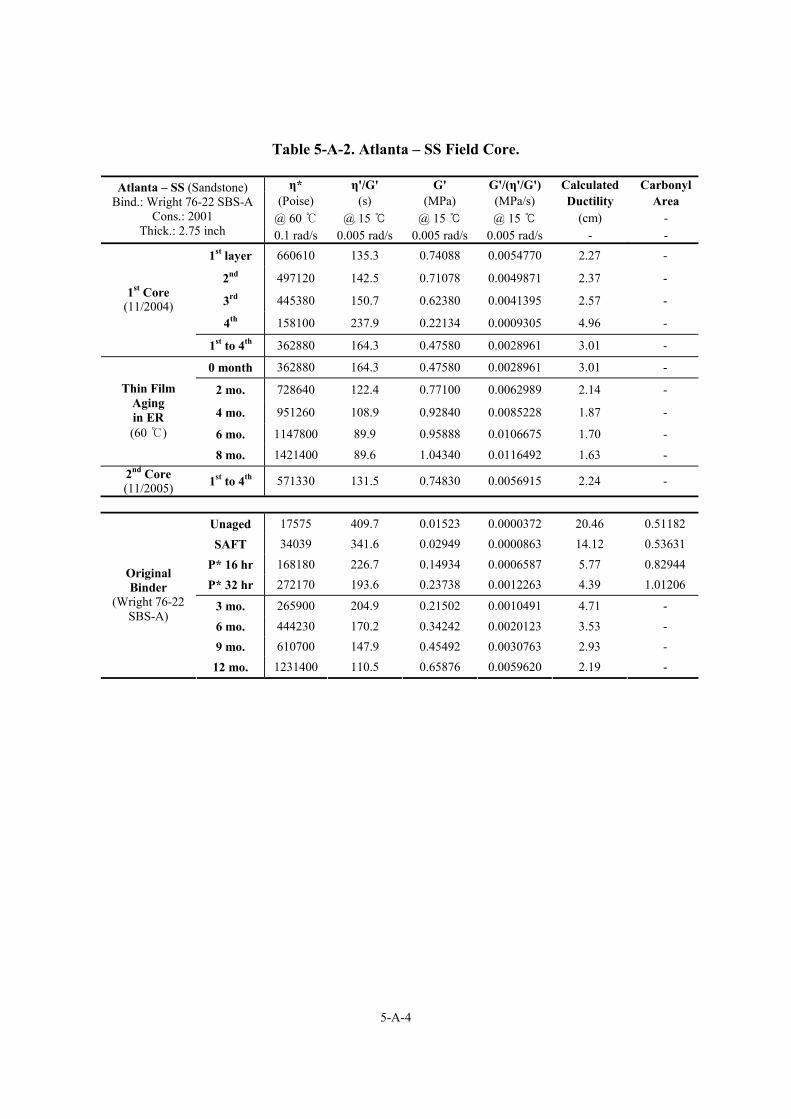
5-A-4
Table 5-A-2. Atlanta – SS Field Core.
η* η'/G' G' G'/(η'/G') Calculated Carbonyl (Poise) (s) (MPa) (MPa/s) Ductility Area
@ 60 ℃ @ 15 ℃ @ 15 ℃ @ 15 ℃ (cm) -
Atlanta – SS (Sandstone) Bind.: Wright 76-22 SBS-A
Cons.: 2001 Thick.: 2.75 inch 0.1 rad/s 0.005 rad/s 0.005 rad/s 0.005 rad/s - -
1st layer 660610 135.3 0.74088 0.0054770 2.27 -
2nd 497120 142.5 0.71078 0.0049871 2.37 -
3rd 445380 150.7 0.62380 0.0041395 2.57 -
4th 158100 237.9 0.22134 0.0009305 4.96 -
1st Core (11/2004)
1st to 4th 362880 164.3 0.47580 0.0028961 3.01 -
0 month 362880 164.3 0.47580 0.0028961 3.01 -
2 mo. 728640 122.4 0.77100 0.0062989 2.14 -
4 mo. 951260 108.9 0.92840 0.0085228 1.87 -
6 mo. 1147800 89.9 0.95888 0.0106675 1.70 -
Thin Film Aging in ER (60 ℃)
8 mo. 1421400 89.6 1.04340 0.0116492 1.63 - 2nd Core (11/2005) 1st to 4th 571330 131.5 0.74830 0.0056915 2.24 -
Unaged 17575 409.7 0.01523 0.0000372 20.46 0.51182 SAFT 34039 341.6 0.02949 0.0000863 14.12 0.53631
P* 16 hr 168180 226.7 0.14934 0.0006587 5.77 0.82944 P* 32 hr 272170 193.6 0.23738 0.0012263 4.39 1.01206
3 mo. 265900 204.9 0.21502 0.0010491 4.71 -
6 mo. 444230 170.2 0.34242 0.0020123 3.53 - 9 mo. 610700 147.9 0.45492 0.0030763 2.93 -
Original Binder
(Wright 76-22 SBS-A)
12 mo. 1231400 110.5 0.65876 0.0059620 2.19 -
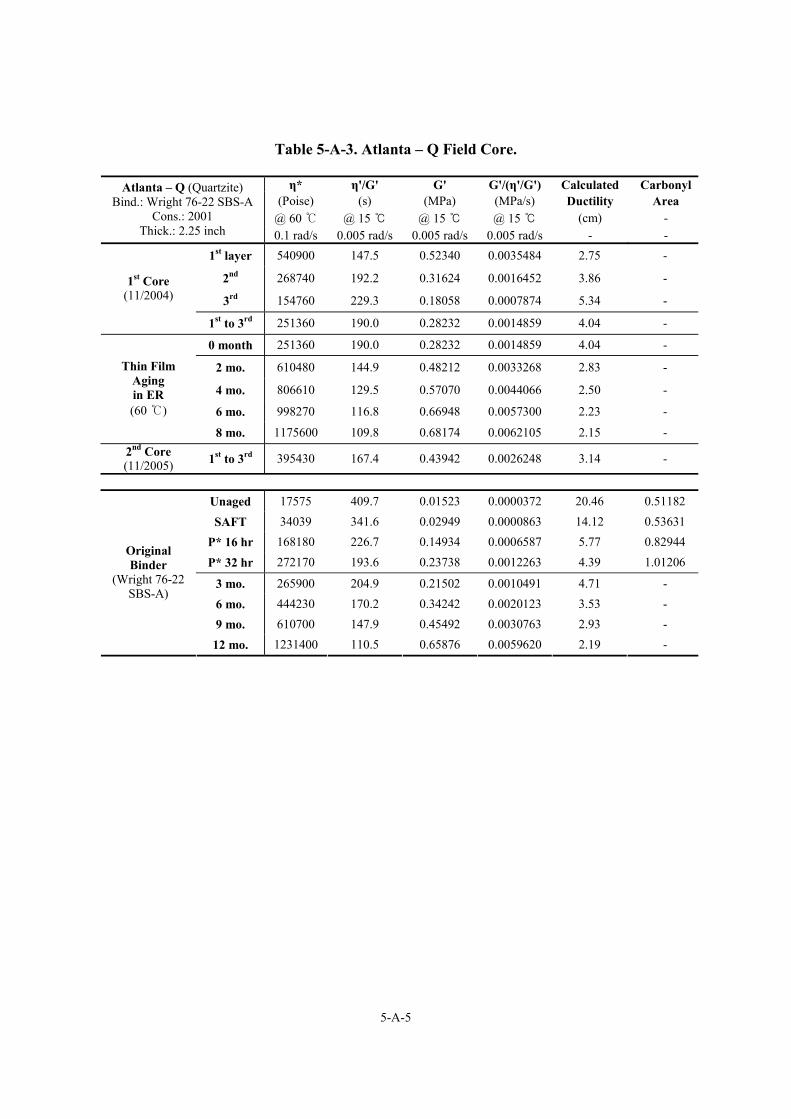
5-A-5
Table 5-A-3. Atlanta – Q Field Core.
η* η'/G' G' G'/(η'/G') Calculated Carbonyl (Poise) (s) (MPa) (MPa/s) Ductility Area
@ 60 ℃ @ 15 ℃ @ 15 ℃ @ 15 ℃ (cm) -
Atlanta – Q (Quartzite) Bind.: Wright 76-22 SBS-A
Cons.: 2001 Thick.: 2.25 inch 0.1 rad/s 0.005 rad/s 0.005 rad/s 0.005 rad/s - -
1st layer 540900 147.5 0.52340 0.0035484 2.75 -
2nd 268740 192.2 0.31624 0.0016452 3.86 -
3rd 154760 229.3 0.18058 0.0007874 5.34 - 1st Core
(11/2004)
1st to 3rd 251360 190.0 0.28232 0.0014859 4.04 -
0 month 251360 190.0 0.28232 0.0014859 4.04 -
2 mo. 610480 144.9 0.48212 0.0033268 2.83 -
4 mo. 806610 129.5 0.57070 0.0044066 2.50 -
6 mo. 998270 116.8 0.66948 0.0057300 2.23 -
Thin Film Aging in ER (60 ℃)
8 mo. 1175600 109.8 0.68174 0.0062105 2.15 - 2nd Core (11/2005) 1st to 3rd 395430 167.4 0.43942 0.0026248 3.14 -
Unaged 17575 409.7 0.01523 0.0000372 20.46 0.51182 SAFT 34039 341.6 0.02949 0.0000863 14.12 0.53631
P* 16 hr 168180 226.7 0.14934 0.0006587 5.77 0.82944 P* 32 hr 272170 193.6 0.23738 0.0012263 4.39 1.01206
3 mo. 265900 204.9 0.21502 0.0010491 4.71 - 6 mo. 444230 170.2 0.34242 0.0020123 3.53 - 9 mo. 610700 147.9 0.45492 0.0030763 2.93 -
Original Binder
(Wright 76-22 SBS-A)
12 mo. 1231400 110.5 0.65876 0.0059620 2.19 -
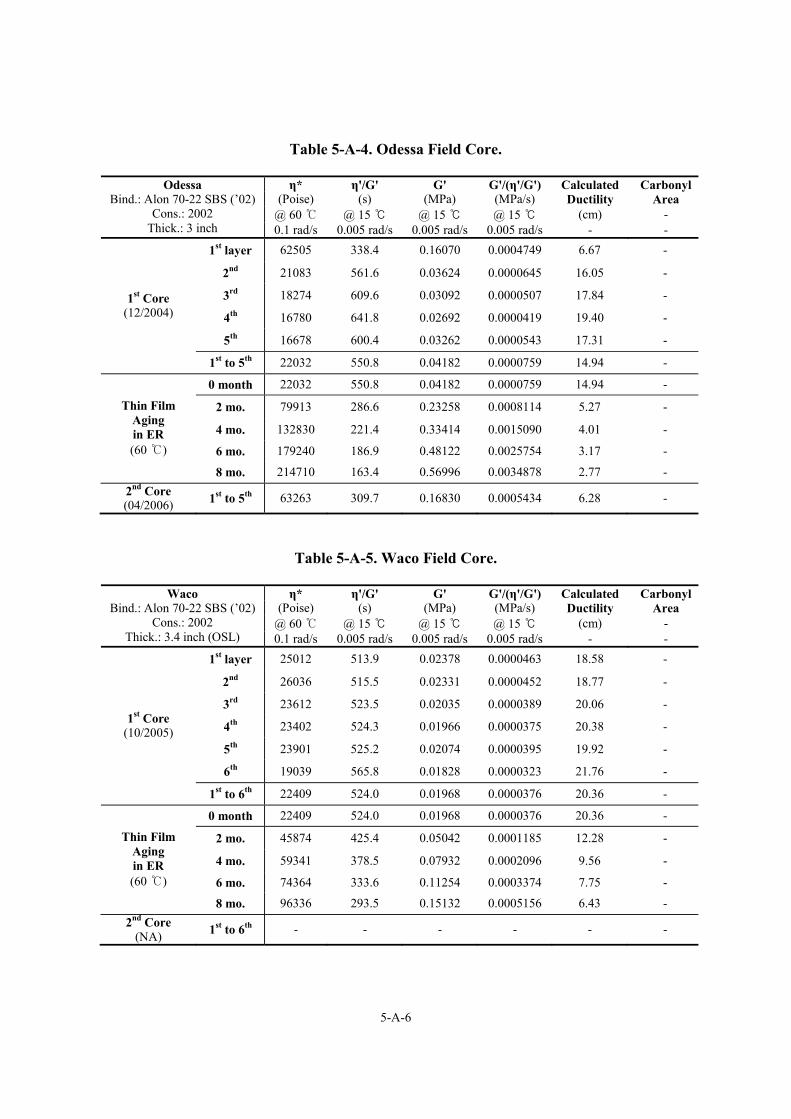
5-A-6
Table 5-A-4. Odessa Field Core.
η* η'/G' G' G'/(η'/G') Calculated Carbonyl (Poise) (s) (MPa) (MPa/s) Ductility Area
@ 60 ℃ @ 15 ℃ @ 15 ℃ @ 15 ℃ (cm) -
Odessa Bind.: Alon 70-22 SBS (’02)
Cons.: 2002 Thick.: 3 inch 0.1 rad/s 0.005 rad/s 0.005 rad/s 0.005 rad/s - -
1st layer 62505 338.4 0.16070 0.0004749 6.67 -
2nd 21083 561.6 0.03624 0.0000645 16.05 -
3rd 18274 609.6 0.03092 0.0000507 17.84 -
4th 16780 641.8 0.02692 0.0000419 19.40 -
5th 16678 600.4 0.03262 0.0000543 17.31 -
1st Core (12/2004)
1st to 5th 22032 550.8 0.04182 0.0000759 14.94 -
0 month 22032 550.8 0.04182 0.0000759 14.94 -
2 mo. 79913 286.6 0.23258 0.0008114 5.27 -
4 mo. 132830 221.4 0.33414 0.0015090 4.01 -
6 mo. 179240 186.9 0.48122 0.0025754 3.17 -
Thin Film Aging in ER (60 ℃)
8 mo. 214710 163.4 0.56996 0.0034878 2.77 - 2nd Core (04/2006) 1st to 5th 63263 309.7 0.16830 0.0005434 6.28 -
Table 5-A-5. Waco Field Core.
η* η'/G' G' G'/(η'/G') Calculated Carbonyl (Poise) (s) (MPa) (MPa/s) Ductility Area
@ 60 ℃ @ 15 ℃ @ 15 ℃ @ 15 ℃ (cm) -
Waco Bind.: Alon 70-22 SBS (’02)
Cons.: 2002 Thick.: 3.4 inch (OSL) 0.1 rad/s 0.005 rad/s 0.005 rad/s 0.005 rad/s - -
1st layer 25012 513.9 0.02378 0.0000463 18.58 -
2nd 26036 515.5 0.02331 0.0000452 18.77 -
3rd 23612 523.5 0.02035 0.0000389 20.06 -
4th 23402 524.3 0.01966 0.0000375 20.38 -
5th 23901 525.2 0.02074 0.0000395 19.92 -
6th 19039 565.8 0.01828 0.0000323 21.76 -
1st Core (10/2005)
1st to 6th 22409 524.0 0.01968 0.0000376 20.36 -
0 month 22409 524.0 0.01968 0.0000376 20.36 -
2 mo. 45874 425.4 0.05042 0.0001185 12.28 -
4 mo. 59341 378.5 0.07932 0.0002096 9.56 -
6 mo. 74364 333.6 0.11254 0.0003374 7.75 -
Thin Film Aging in ER (60 ℃)
8 mo. 96336 293.5 0.15132 0.0005156 6.43 - 2nd Core
(NA) 1st to 6th - - - - - -
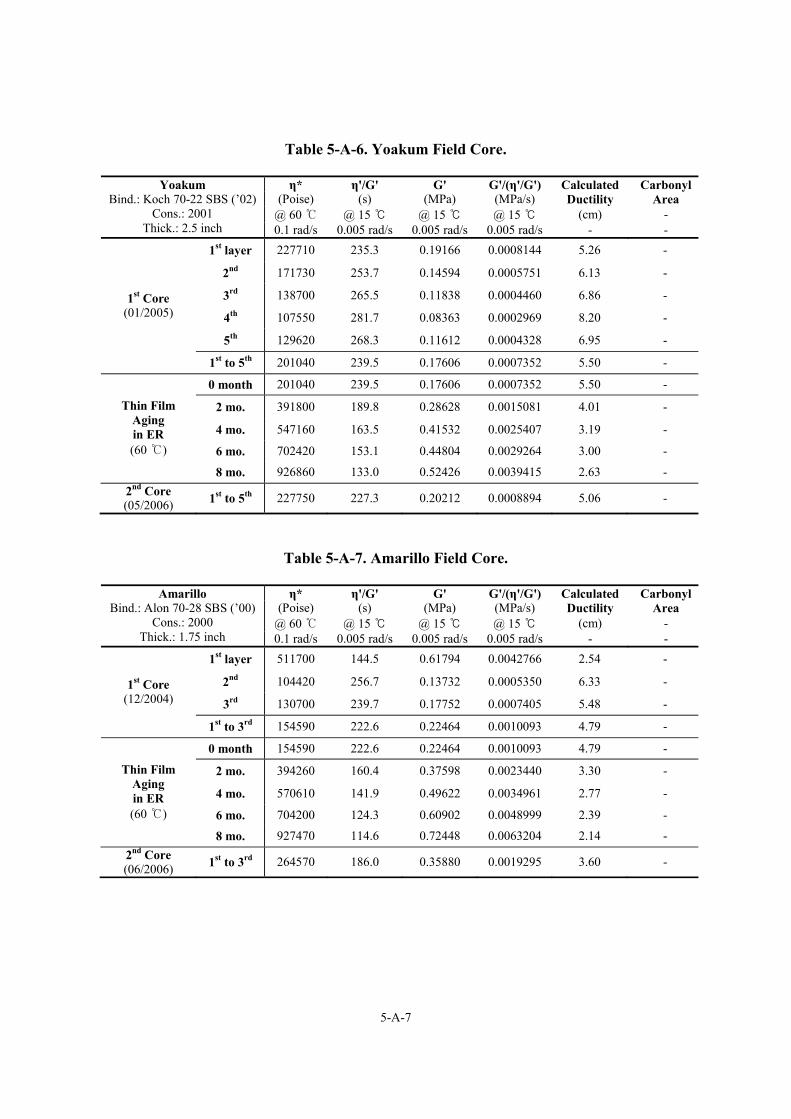
5-A-7
Table 5-A-6. Yoakum Field Core.
η* η'/G' G' G'/(η'/G') Calculated Carbonyl (Poise) (s) (MPa) (MPa/s) Ductility Area
@ 60 ℃ @ 15 ℃ @ 15 ℃ @ 15 ℃ (cm) -
Yoakum Bind.: Koch 70-22 SBS (’02)
Cons.: 2001 Thick.: 2.5 inch 0.1 rad/s 0.005 rad/s 0.005 rad/s 0.005 rad/s - -
1st layer 227710 235.3 0.19166 0.0008144 5.26 -
2nd 171730 253.7 0.14594 0.0005751 6.13 -
3rd 138700 265.5 0.11838 0.0004460 6.86 -
4th 107550 281.7 0.08363 0.0002969 8.20 -
5th 129620 268.3 0.11612 0.0004328 6.95 -
1st Core (01/2005)
1st to 5th 201040 239.5 0.17606 0.0007352 5.50 -
0 month 201040 239.5 0.17606 0.0007352 5.50 -
2 mo. 391800 189.8 0.28628 0.0015081 4.01 -
4 mo. 547160 163.5 0.41532 0.0025407 3.19 -
6 mo. 702420 153.1 0.44804 0.0029264 3.00 -
Thin Film Aging in ER (60 ℃)
8 mo. 926860 133.0 0.52426 0.0039415 2.63 - 2nd Core (05/2006) 1st to 5th 227750 227.3 0.20212 0.0008894 5.06 -
Table 5-A-7. Amarillo Field Core.
η* η'/G' G' G'/(η'/G') Calculated Carbonyl (Poise) (s) (MPa) (MPa/s) Ductility Area
@ 60 ℃ @ 15 ℃ @ 15 ℃ @ 15 ℃ (cm) -
Amarillo Bind.: Alon 70-28 SBS (’00)
Cons.: 2000 Thick.: 1.75 inch 0.1 rad/s 0.005 rad/s 0.005 rad/s 0.005 rad/s - -
1st layer 511700 144.5 0.61794 0.0042766 2.54 -
2nd 104420 256.7 0.13732 0.0005350 6.33 -
3rd 130700 239.7 0.17752 0.0007405 5.48 - 1st Core
(12/2004)
1st to 3rd 154590 222.6 0.22464 0.0010093 4.79 -
0 month 154590 222.6 0.22464 0.0010093 4.79 -
2 mo. 394260 160.4 0.37598 0.0023440 3.30 -
4 mo. 570610 141.9 0.49622 0.0034961 2.77 -
6 mo. 704200 124.3 0.60902 0.0048999 2.39 -
Thin Film Aging in ER (60 ℃)
8 mo. 927470 114.6 0.72448 0.0063204 2.14 - 2nd Core (06/2006) 1st to 3rd 264570 186.0 0.35880 0.0019295 3.60 -
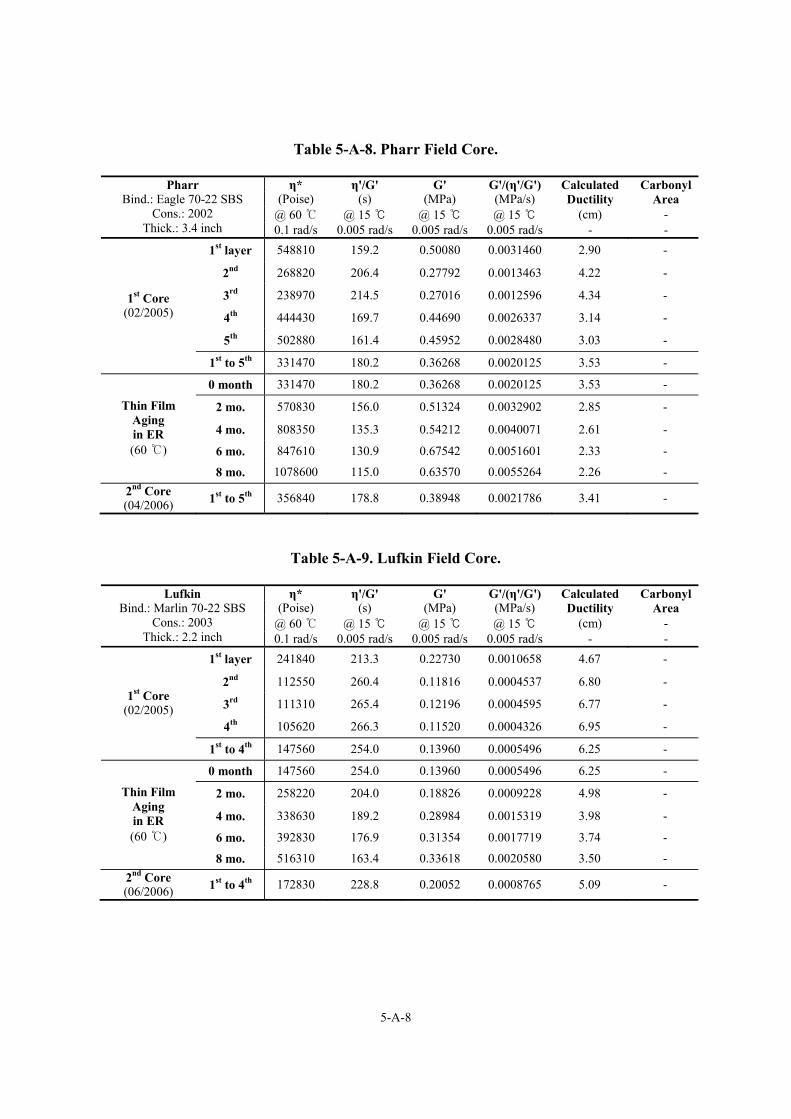
5-A-8
Table 5-A-8. Pharr Field Core.
η* η'/G' G' G'/(η'/G') Calculated Carbonyl (Poise) (s) (MPa) (MPa/s) Ductility Area
@ 60 ℃ @ 15 ℃ @ 15 ℃ @ 15 ℃ (cm) -
Pharr Bind.: Eagle 70-22 SBS
Cons.: 2002 Thick.: 3.4 inch 0.1 rad/s 0.005 rad/s 0.005 rad/s 0.005 rad/s - -
1st layer 548810 159.2 0.50080 0.0031460 2.90 -
2nd 268820 206.4 0.27792 0.0013463 4.22 -
3rd 238970 214.5 0.27016 0.0012596 4.34 -
4th 444430 169.7 0.44690 0.0026337 3.14 -
5th 502880 161.4 0.45952 0.0028480 3.03 -
1st Core (02/2005)
1st to 5th 331470 180.2 0.36268 0.0020125 3.53 -
0 month 331470 180.2 0.36268 0.0020125 3.53 -
2 mo. 570830 156.0 0.51324 0.0032902 2.85 -
4 mo. 808350 135.3 0.54212 0.0040071 2.61 -
6 mo. 847610 130.9 0.67542 0.0051601 2.33 -
Thin Film Aging in ER (60 ℃)
8 mo. 1078600 115.0 0.63570 0.0055264 2.26 - 2nd Core (04/2006) 1st to 5th 356840 178.8 0.38948 0.0021786 3.41 -
Table 5-A-9. Lufkin Field Core.
η* η'/G' G' G'/(η'/G') Calculated Carbonyl (Poise) (s) (MPa) (MPa/s) Ductility Area
@ 60 ℃ @ 15 ℃ @ 15 ℃ @ 15 ℃ (cm) -
Lufkin Bind.: Marlin 70-22 SBS
Cons.: 2003 Thick.: 2.2 inch 0.1 rad/s 0.005 rad/s 0.005 rad/s 0.005 rad/s - -
1st layer 241840 213.3 0.22730 0.0010658 4.67 -
2nd 112550 260.4 0.11816 0.0004537 6.80 -
3rd 111310 265.4 0.12196 0.0004595 6.77 -
4th 105620 266.3 0.11520 0.0004326 6.95 -
1st Core (02/2005)
1st to 4th 147560 254.0 0.13960 0.0005496 6.25 -
0 month 147560 254.0 0.13960 0.0005496 6.25 -
2 mo. 258220 204.0 0.18826 0.0009228 4.98 -
4 mo. 338630 189.2 0.28984 0.0015319 3.98 -
6 mo. 392830 176.9 0.31354 0.0017719 3.74 -
Thin Film Aging in ER (60 ℃)
8 mo. 516310 163.4 0.33618 0.0020580 3.50 - 2nd Core (06/2006) 1st to 4th 172830 228.8 0.20052 0.0008765 5.09 -
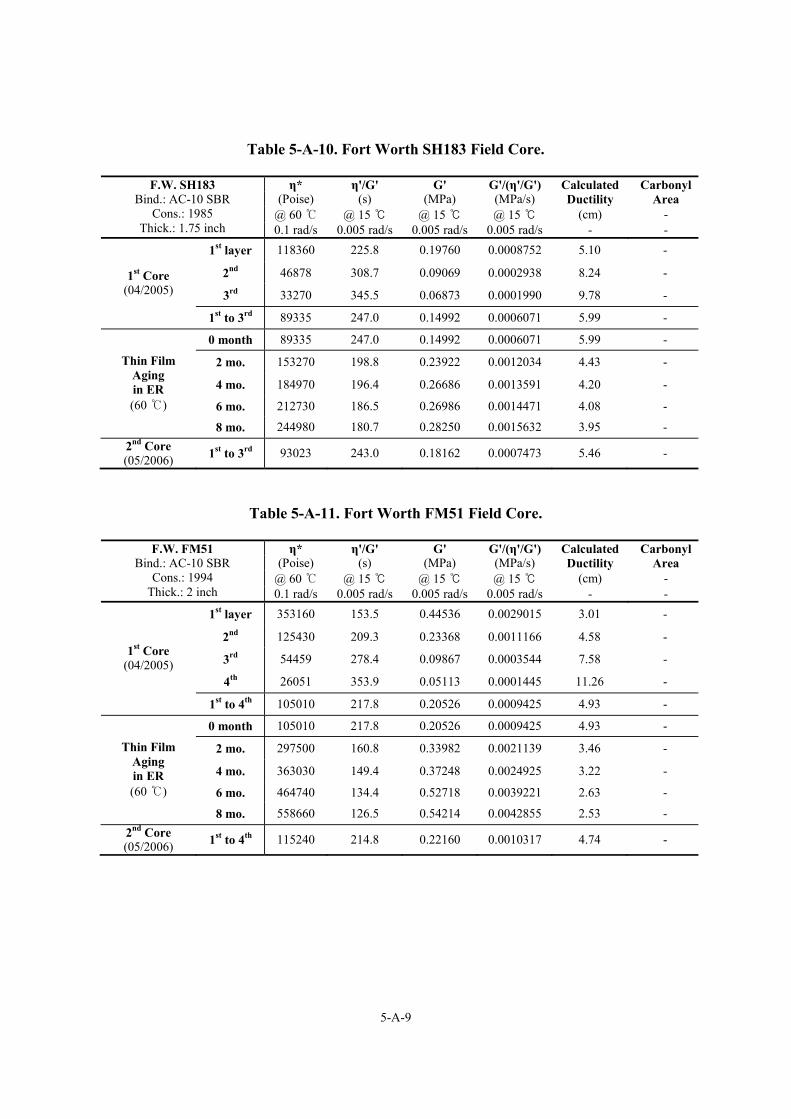
5-A-9
Table 5-A-10. Fort Worth SH183 Field Core.
η* η'/G' G' G'/(η'/G') Calculated Carbonyl (Poise) (s) (MPa) (MPa/s) Ductility Area
@ 60 ℃ @ 15 ℃ @ 15 ℃ @ 15 ℃ (cm) -
F.W. SH183 Bind.: AC-10 SBR
Cons.: 1985 Thick.: 1.75 inch 0.1 rad/s 0.005 rad/s 0.005 rad/s 0.005 rad/s - -
1st layer 118360 225.8 0.19760 0.0008752 5.10 -
2nd 46878 308.7 0.09069 0.0002938 8.24 -
3rd 33270 345.5 0.06873 0.0001990 9.78 - 1st Core
(04/2005)
1st to 3rd 89335 247.0 0.14992 0.0006071 5.99 -
0 month 89335 247.0 0.14992 0.0006071 5.99 -
2 mo. 153270 198.8 0.23922 0.0012034 4.43 -
4 mo. 184970 196.4 0.26686 0.0013591 4.20 -
6 mo. 212730 186.5 0.26986 0.0014471 4.08 -
Thin Film Aging in ER (60 ℃)
8 mo. 244980 180.7 0.28250 0.0015632 3.95 - 2nd Core (05/2006) 1st to 3rd 93023 243.0 0.18162 0.0007473 5.46 -
Table 5-A-11. Fort Worth FM51 Field Core.
η* η'/G' G' G'/(η'/G') Calculated Carbonyl (Poise) (s) (MPa) (MPa/s) Ductility Area
@ 60 ℃ @ 15 ℃ @ 15 ℃ @ 15 ℃ (cm) -
F.W. FM51 Bind.: AC-10 SBR
Cons.: 1994 Thick.: 2 inch 0.1 rad/s 0.005 rad/s 0.005 rad/s 0.005 rad/s - -
1st layer 353160 153.5 0.44536 0.0029015 3.01 -
2nd 125430 209.3 0.23368 0.0011166 4.58 -
3rd 54459 278.4 0.09867 0.0003544 7.58 -
4th 26051 353.9 0.05113 0.0001445 11.26 -
1st Core (04/2005)
1st to 4th 105010 217.8 0.20526 0.0009425 4.93 -
0 month 105010 217.8 0.20526 0.0009425 4.93 -
2 mo. 297500 160.8 0.33982 0.0021139 3.46 -
4 mo. 363030 149.4 0.37248 0.0024925 3.22 -
6 mo. 464740 134.4 0.52718 0.0039221 2.63 -
Thin Film Aging in ER (60 ℃)
8 mo. 558660 126.5 0.54214 0.0042855 2.53 - 2nd Core (05/2006) 1st to 4th 115240 214.8 0.22160 0.0010317 4.74 -
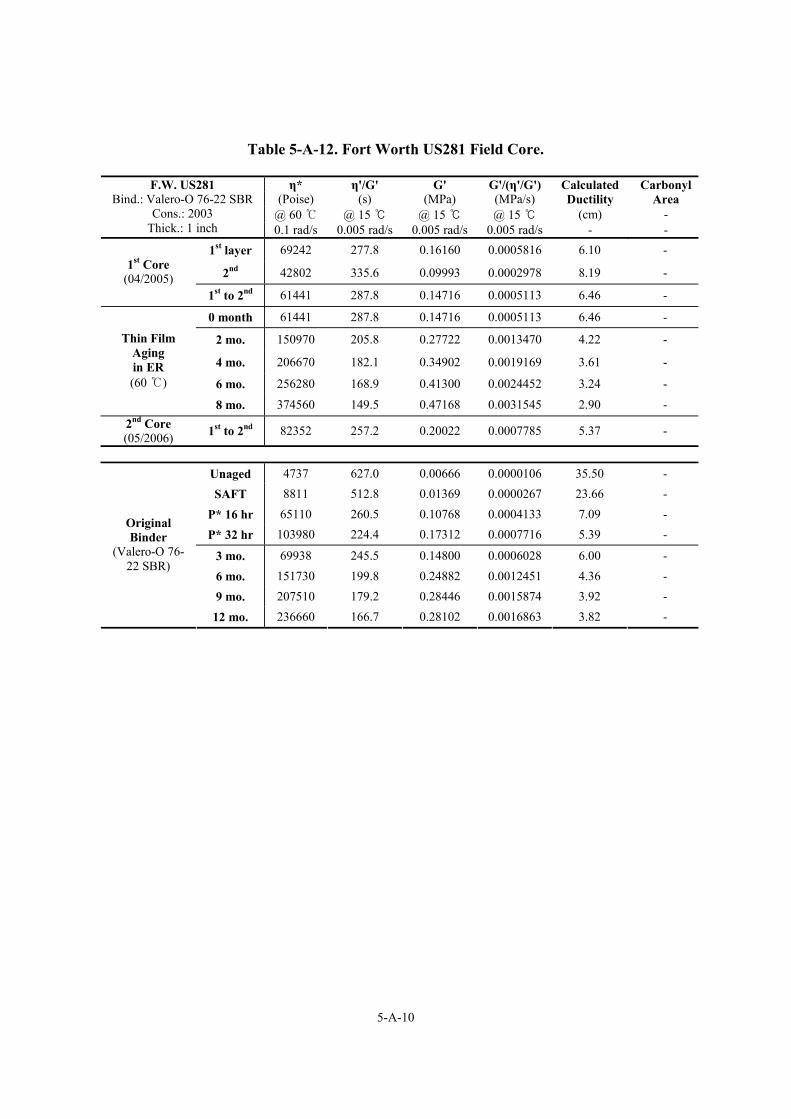
5-A-10
Table 5-A-12. Fort Worth US281 Field Core.
η* η'/G' G' G'/(η'/G') Calculated Carbonyl (Poise) (s) (MPa) (MPa/s) Ductility Area
@ 60 ℃ @ 15 ℃ @ 15 ℃ @ 15 ℃ (cm) -
F.W. US281 Bind.: Valero-O 76-22 SBR
Cons.: 2003 Thick.: 1 inch 0.1 rad/s 0.005 rad/s 0.005 rad/s 0.005 rad/s - -
1st layer 69242 277.8 0.16160 0.0005816 6.10 -
2nd 42802 335.6 0.09993 0.0002978 8.19 - 1st Core (04/2005)
1st to 2nd 61441 287.8 0.14716 0.0005113 6.46 -
0 month 61441 287.8 0.14716 0.0005113 6.46 -
2 mo. 150970 205.8 0.27722 0.0013470 4.22 -
4 mo. 206670 182.1 0.34902 0.0019169 3.61 -
6 mo. 256280 168.9 0.41300 0.0024452 3.24 -
Thin Film Aging in ER (60 ℃)
8 mo. 374560 149.5 0.47168 0.0031545 2.90 - 2nd Core (05/2006) 1st to 2nd 82352 257.2 0.20022 0.0007785 5.37 -
Unaged 4737 627.0 0.00666 0.0000106 35.50 - SAFT 8811 512.8 0.01369 0.0000267 23.66 -
P* 16 hr 65110 260.5 0.10768 0.0004133 7.09 - P* 32 hr 103980 224.4 0.17312 0.0007716 5.39 -
3 mo. 69938 245.5 0.14800 0.0006028 6.00 - 6 mo. 151730 199.8 0.24882 0.0012451 4.36 - 9 mo. 207510 179.2 0.28446 0.0015874 3.92 -
Original Binder
(Valero-O 76-22 SBR)
12 mo. 236660 166.7 0.28102 0.0016863 3.82 -
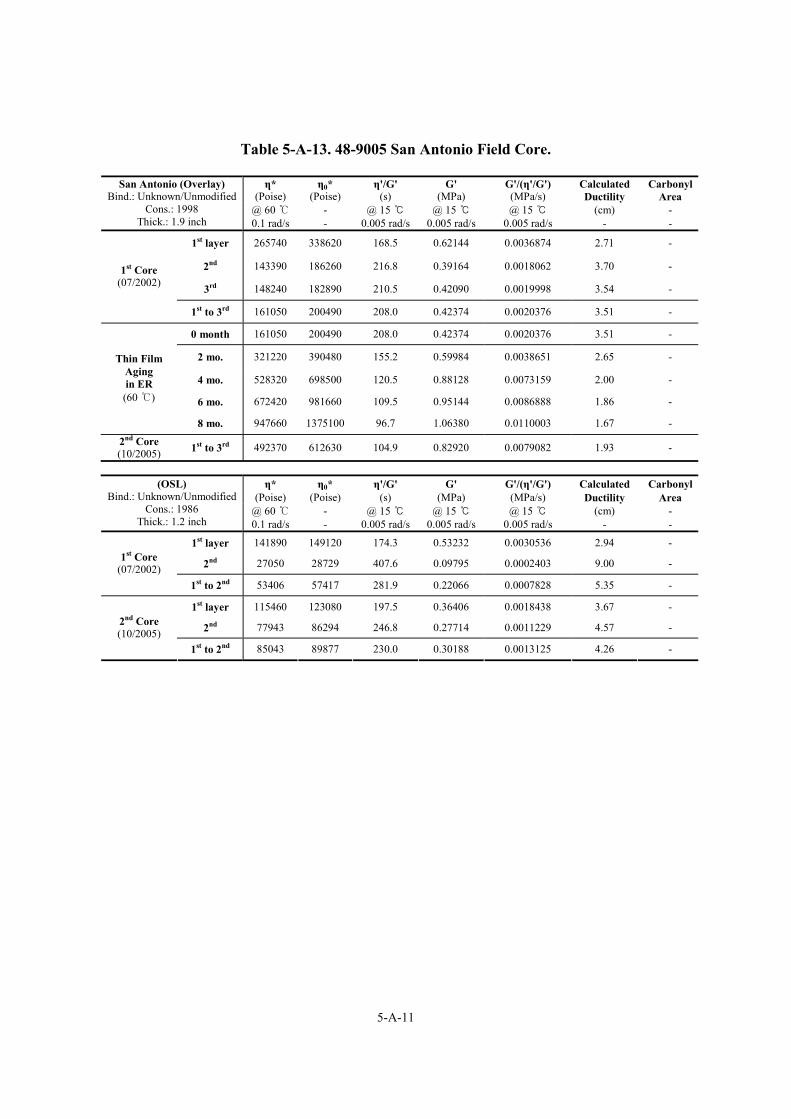
5-A-11
Table 5-A-13. 48-9005 San Antonio Field Core.
η* η0* η'/G' G' G'/(η'/G') Calculated Carbonyl(Poise) (Poise) (s) (MPa) (MPa/s) Ductility Area
@ 60 ℃ - @ 15 ℃ @ 15 ℃ @ 15 ℃ (cm) -
San Antonio (Overlay) Bind.: Unknown/Unmodified
Cons.: 1998 Thick.: 1.9 inch 0.1 rad/s - 0.005 rad/s 0.005 rad/s 0.005 rad/s - -
1st layer 265740 338620 168.5 0.62144 0.0036874 2.71 -
2nd 143390 186260 216.8 0.39164 0.0018062 3.70 -
3rd 148240 182890 210.5 0.42090 0.0019998 3.54 -
1st Core (07/2002)
1st to 3rd 161050 200490 208.0 0.42374 0.0020376 3.51 -
0 month 161050 200490 208.0 0.42374 0.0020376 3.51 -
2 mo. 321220 390480 155.2 0.59984 0.0038651 2.65 -
4 mo. 528320 698500 120.5 0.88128 0.0073159 2.00 -
6 mo. 672420 981660 109.5 0.95144 0.0086888 1.86 -
Thin Film Aging in ER (60 ℃)
8 mo. 947660 1375100 96.7 1.06380 0.0110003 1.67 -
2nd Core (10/2005) 1st to 3rd 492370 612630 104.9 0.82920 0.0079082 1.93 -
η* η0* η'/G' G' G'/(η'/G') Calculated Carbonyl
(Poise) (Poise) (s) (MPa) (MPa/s) Ductility Area @ 60 ℃ - @ 15 ℃ @ 15 ℃ @ 15 ℃ (cm) -
(OSL) Bind.: Unknown/Unmodified
Cons.: 1986 Thick.: 1.2 inch 0.1 rad/s - 0.005 rad/s 0.005 rad/s 0.005 rad/s - -
1st layer 141890 149120 174.3 0.53232 0.0030536 2.94 -
2nd 27050 28729 407.6 0.09795 0.0002403 9.00 - 1st Core (07/2002)
1st to 2nd 53406 57417 281.9 0.22066 0.0007828 5.35 -
1st layer 115460 123080 197.5 0.36406 0.0018438 3.67 -
2nd 77943 86294 246.8 0.27714 0.0011229 4.57 - 2nd Core (10/2005)
1st to 2nd 85043 89877 230.0 0.30188 0.0013125 4.26 -
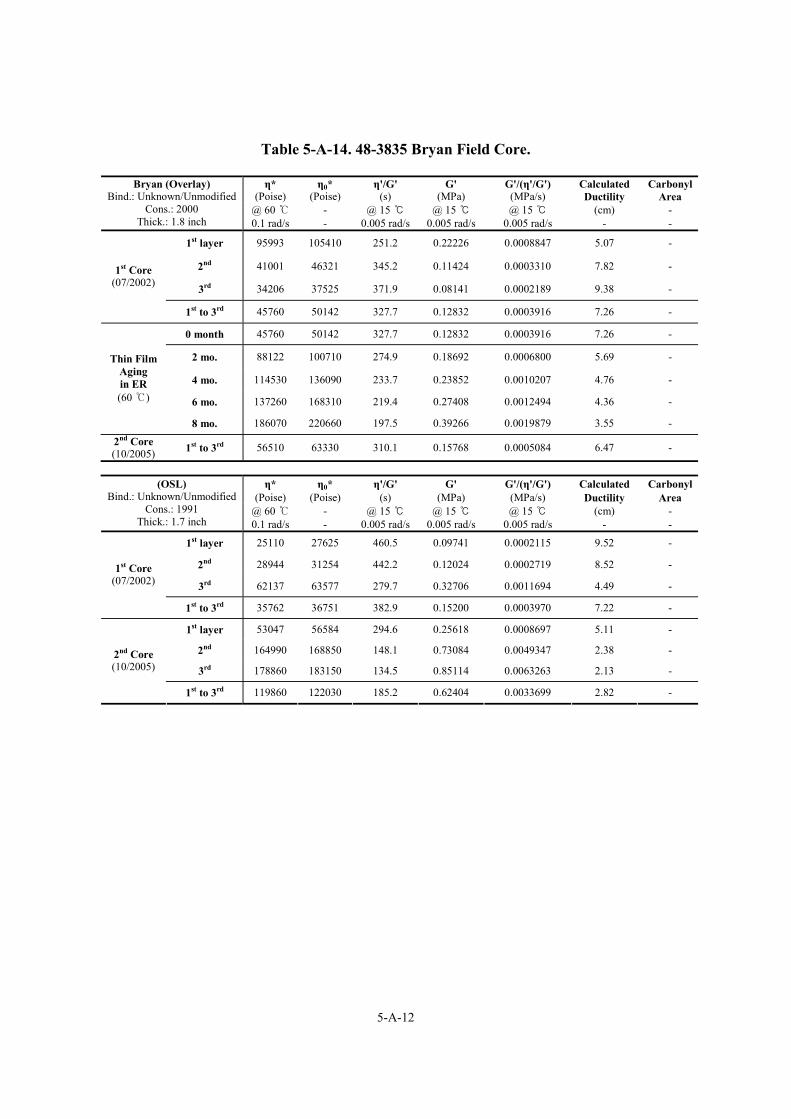
5-A-12
Table 5-A-14. 48-3835 Bryan Field Core.
η* η0* η'/G' G' G'/(η'/G') Calculated Carbonyl(Poise) (Poise) (s) (MPa) (MPa/s) Ductility Area
@ 60 ℃ - @ 15 ℃ @ 15 ℃ @ 15 ℃ (cm) -
Bryan (Overlay) Bind.: Unknown/Unmodified
Cons.: 2000 Thick.: 1.8 inch 0.1 rad/s - 0.005 rad/s 0.005 rad/s 0.005 rad/s - -
1st layer 95993 105410 251.2 0.22226 0.0008847 5.07 -
2nd 41001 46321 345.2 0.11424 0.0003310 7.82 -
3rd 34206 37525 371.9 0.08141 0.0002189 9.38 -
1st Core (07/2002)
1st to 3rd 45760 50142 327.7 0.12832 0.0003916 7.26 -
0 month 45760 50142 327.7 0.12832 0.0003916 7.26 -
2 mo. 88122 100710 274.9 0.18692 0.0006800 5.69 -
4 mo. 114530 136090 233.7 0.23852 0.0010207 4.76 -
6 mo. 137260 168310 219.4 0.27408 0.0012494 4.36 -
Thin Film Aging in ER (60 ℃)
8 mo. 186070 220660 197.5 0.39266 0.0019879 3.55 -
2nd Core (10/2005) 1st to 3rd 56510 63330 310.1 0.15768 0.0005084 6.47 -
η* η0* η'/G' G' G'/(η'/G') Calculated Carbonyl
(Poise) (Poise) (s) (MPa) (MPa/s) Ductility Area @ 60 ℃ - @ 15 ℃ @ 15 ℃ @ 15 ℃ (cm) -
(OSL) Bind.: Unknown/Unmodified
Cons.: 1991 Thick.: 1.7 inch 0.1 rad/s - 0.005 rad/s 0.005 rad/s 0.005 rad/s - -
1st layer 25110 27625 460.5 0.09741 0.0002115 9.52 -
2nd 28944 31254 442.2 0.12024 0.0002719 8.52 -
3rd 62137 63577 279.7 0.32706 0.0011694 4.49 - 1st Core
(07/2002)
1st to 3rd 35762 36751 382.9 0.15200 0.0003970 7.22 -
1st layer 53047 56584 294.6 0.25618 0.0008697 5.11 -
2nd 164990 168850 148.1 0.73084 0.0049347 2.38 -
3rd 178860 183150 134.5 0.85114 0.0063263 2.13 - 2nd Core (10/2005)
1st to 3rd 119860 122030 185.2 0.62404 0.0033699 2.82 -
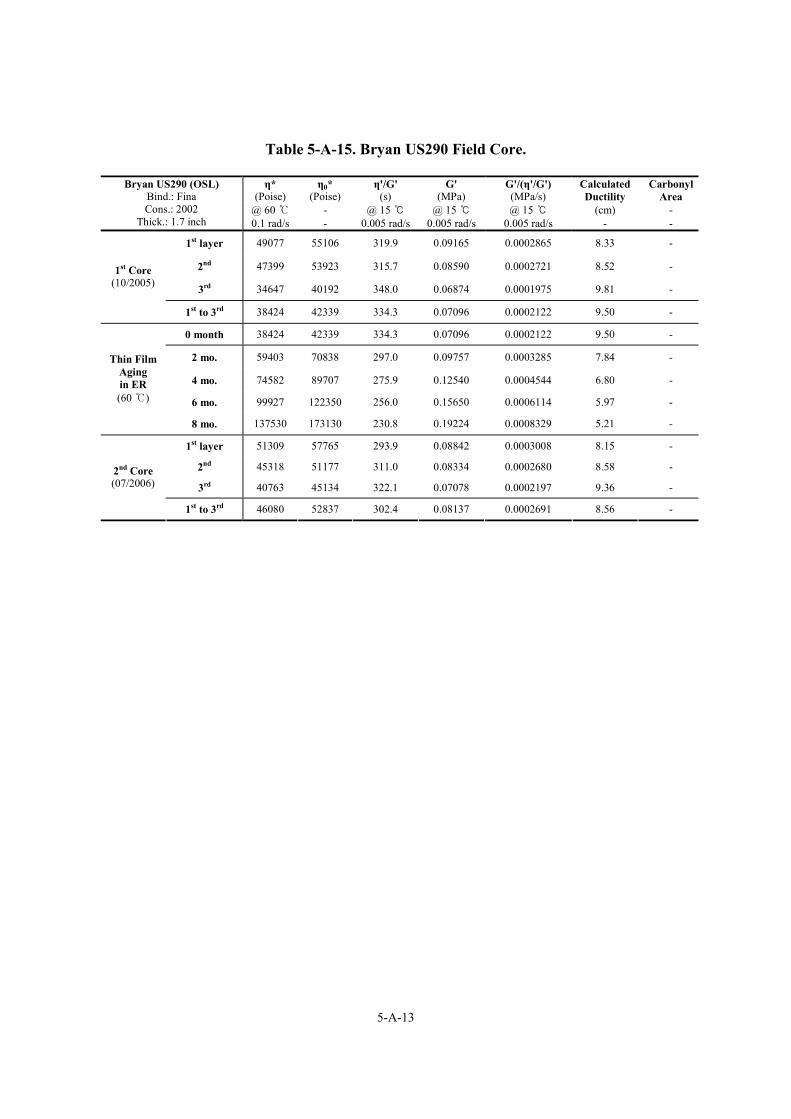
5-A-13
Table 5-A-15. Bryan US290 Field Core.
η* η0* η'/G' G' G'/(η'/G') Calculated Carbonyl(Poise) (Poise) (s) (MPa) (MPa/s) Ductility Area
@ 60 ℃ - @ 15 ℃ @ 15 ℃ @ 15 ℃ (cm) -
Bryan US290 (OSL) Bind.: Fina Cons.: 2002
Thick.: 1.7 inch 0.1 rad/s - 0.005 rad/s 0.005 rad/s 0.005 rad/s - -
1st layer 49077 55106 319.9 0.09165 0.0002865 8.33 -
2nd 47399 53923 315.7 0.08590 0.0002721 8.52 -
3rd 34647 40192 348.0 0.06874 0.0001975 9.81 -
1st Core (10/2005)
1st to 3rd 38424 42339 334.3 0.07096 0.0002122 9.50 -
0 month 38424 42339 334.3 0.07096 0.0002122 9.50 -
2 mo. 59403 70838 297.0 0.09757 0.0003285 7.84 -
4 mo. 74582 89707 275.9 0.12540 0.0004544 6.80 -
6 mo. 99927 122350 256.0 0.15650 0.0006114 5.97 -
Thin Film Aging in ER (60 ℃)
8 mo. 137530 173130 230.8 0.19224 0.0008329 5.21 -
1st layer 51309 57765 293.9 0.08842 0.0003008 8.15 -
2nd 45318 51177 311.0 0.08334 0.0002680 8.58 -
3rd 40763 45134 322.1 0.07078 0.0002197 9.36 - 2nd Core (07/2006)
1st to 3rd 46080 52837 302.4 0.08137 0.0002691 8.56 -
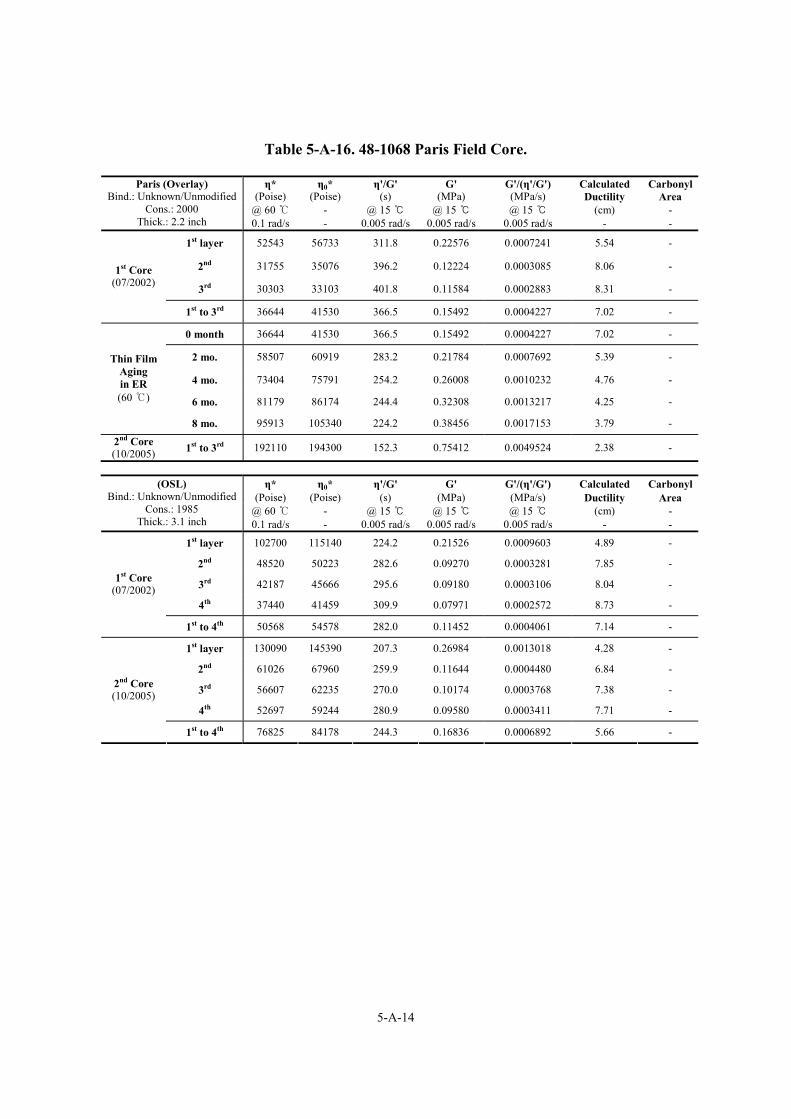
5-A-14
Table 5-A-16. 48-1068 Paris Field Core.
η* η0* η'/G' G' G'/(η'/G') Calculated Carbonyl(Poise) (Poise) (s) (MPa) (MPa/s) Ductility Area
@ 60 ℃ - @ 15 ℃ @ 15 ℃ @ 15 ℃ (cm) -
Paris (Overlay) Bind.: Unknown/Unmodified
Cons.: 2000 Thick.: 2.2 inch 0.1 rad/s - 0.005 rad/s 0.005 rad/s 0.005 rad/s - -
1st layer 52543 56733 311.8 0.22576 0.0007241 5.54 -
2nd 31755 35076 396.2 0.12224 0.0003085 8.06 -
3rd 30303 33103 401.8 0.11584 0.0002883 8.31 -
1st Core (07/2002)
1st to 3rd 36644 41530 366.5 0.15492 0.0004227 7.02 -
0 month 36644 41530 366.5 0.15492 0.0004227 7.02 -
2 mo. 58507 60919 283.2 0.21784 0.0007692 5.39 -
4 mo. 73404 75791 254.2 0.26008 0.0010232 4.76 -
6 mo. 81179 86174 244.4 0.32308 0.0013217 4.25 -
Thin Film Aging in ER (60 ℃)
8 mo. 95913 105340 224.2 0.38456 0.0017153 3.79 -
2nd Core (10/2005) 1st to 3rd 192110 194300 152.3 0.75412 0.0049524 2.38 -
η* η0* η'/G' G' G'/(η'/G') Calculated Carbonyl
(Poise) (Poise) (s) (MPa) (MPa/s) Ductility Area @ 60 ℃ - @ 15 ℃ @ 15 ℃ @ 15 ℃ (cm) -
(OSL) Bind.: Unknown/Unmodified
Cons.: 1985 Thick.: 3.1 inch 0.1 rad/s - 0.005 rad/s 0.005 rad/s 0.005 rad/s - -
1st layer 102700 115140 224.2 0.21526 0.0009603 4.89 -
2nd 48520 50223 282.6 0.09270 0.0003281 7.85 -
3rd 42187 45666 295.6 0.09180 0.0003106 8.04 -
4th 37440 41459 309.9 0.07971 0.0002572 8.73 -
1st Core (07/2002)
1st to 4th 50568 54578 282.0 0.11452 0.0004061 7.14 -
1st layer 130090 145390 207.3 0.26984 0.0013018 4.28 -
2nd 61026 67960 259.9 0.11644 0.0004480 6.84 -
3rd 56607 62235 270.0 0.10174 0.0003768 7.38 -
4th 52697 59244 280.9 0.09580 0.0003411 7.71 -
2nd Core (10/2005)
1st to 4th 76825 84178 244.3 0.16836 0.0006892 5.66 -
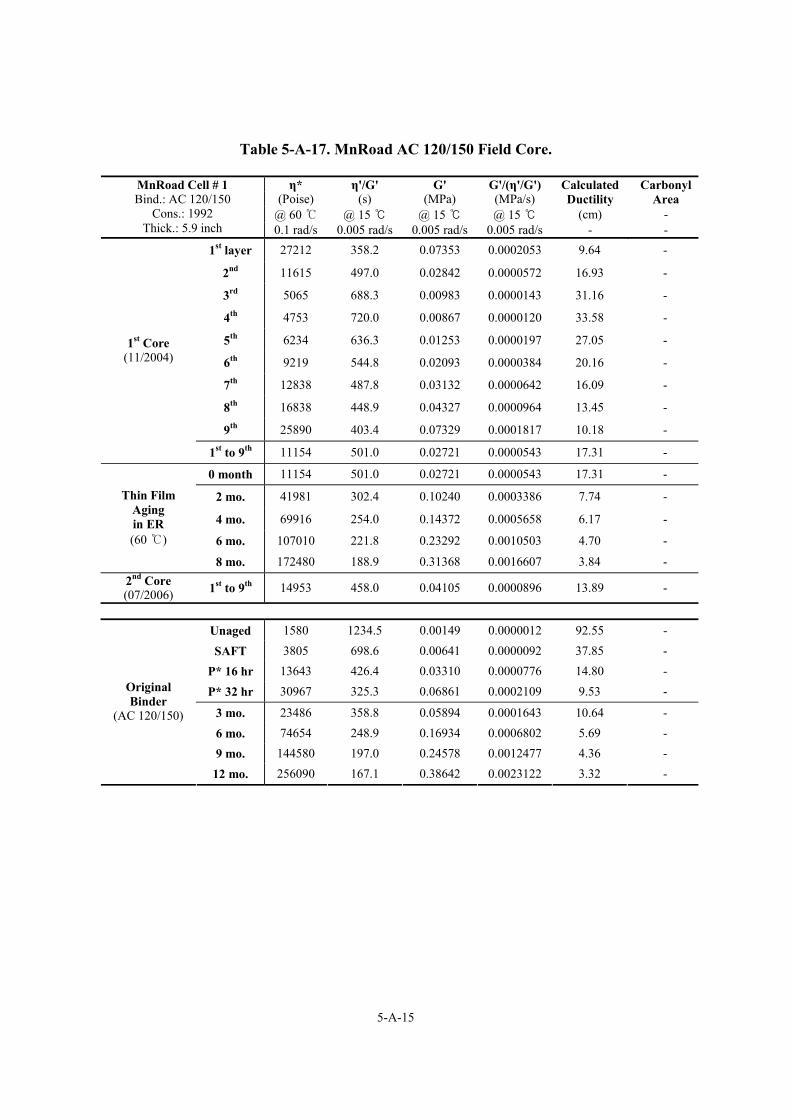
5-A-15
Table 5-A-17. MnRoad AC 120/150 Field Core.
η* η'/G' G' G'/(η'/G') Calculated Carbonyl (Poise) (s) (MPa) (MPa/s) Ductility Area
@ 60 ℃ @ 15 ℃ @ 15 ℃ @ 15 ℃ (cm) -
MnRoad Cell # 1 Bind.: AC 120/150
Cons.: 1992 Thick.: 5.9 inch 0.1 rad/s 0.005 rad/s 0.005 rad/s 0.005 rad/s - -
1st layer 27212 358.2 0.07353 0.0002053 9.64 -
2nd 11615 497.0 0.02842 0.0000572 16.93 -
3rd 5065 688.3 0.00983 0.0000143 31.16 -
4th 4753 720.0 0.00867 0.0000120 33.58 -
5th 6234 636.3 0.01253 0.0000197 27.05 -
6th 9219 544.8 0.02093 0.0000384 20.16 -
7th 12838 487.8 0.03132 0.0000642 16.09 -
8th 16838 448.9 0.04327 0.0000964 13.45 -
9th 25890 403.4 0.07329 0.0001817 10.18 -
1st Core (11/2004)
1st to 9th 11154 501.0 0.02721 0.0000543 17.31 -
0 month 11154 501.0 0.02721 0.0000543 17.31 -
2 mo. 41981 302.4 0.10240 0.0003386 7.74 -
4 mo. 69916 254.0 0.14372 0.0005658 6.17 -
6 mo. 107010 221.8 0.23292 0.0010503 4.70 -
Thin Film Aging in ER (60 ℃)
8 mo. 172480 188.9 0.31368 0.0016607 3.84 - 2nd Core (07/2006) 1st to 9th 14953 458.0 0.04105 0.0000896 13.89 -
Unaged 1580 1234.5 0.00149 0.0000012 92.55 - SAFT 3805 698.6 0.00641 0.0000092 37.85 -
P* 16 hr 13643 426.4 0.03310 0.0000776 14.80 - P* 32 hr 30967 325.3 0.06861 0.0002109 9.53 -
3 mo. 23486 358.8 0.05894 0.0001643 10.64 - 6 mo. 74654 248.9 0.16934 0.0006802 5.69 - 9 mo. 144580 197.0 0.24578 0.0012477 4.36 -
Original Binder
(AC 120/150)
12 mo. 256090 167.1 0.38642 0.0023122 3.32 -
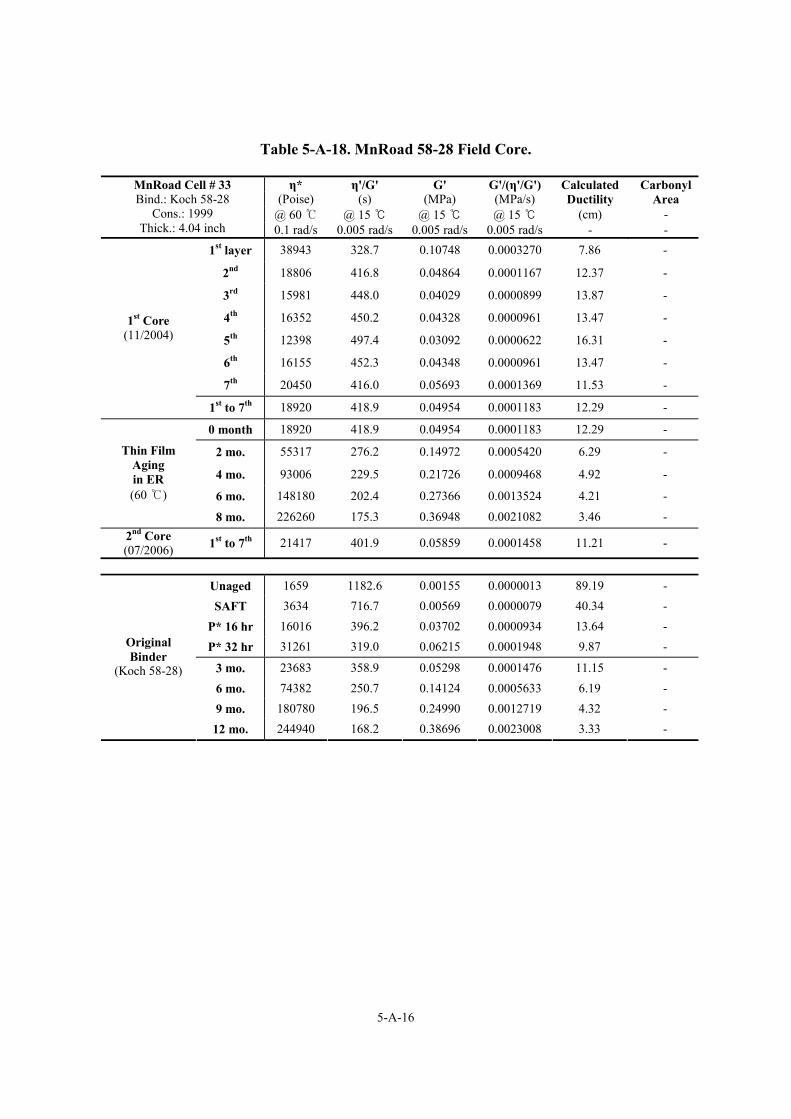
5-A-16
Table 5-A-18. MnRoad 58-28 Field Core.
η* η'/G' G' G'/(η'/G') Calculated Carbonyl (Poise) (s) (MPa) (MPa/s) Ductility Area
@ 60 ℃ @ 15 ℃ @ 15 ℃ @ 15 ℃ (cm) -
MnRoad Cell # 33 Bind.: Koch 58-28
Cons.: 1999 Thick.: 4.04 inch 0.1 rad/s 0.005 rad/s 0.005 rad/s 0.005 rad/s - -
1st layer 38943 328.7 0.10748 0.0003270 7.86 -
2nd 18806 416.8 0.04864 0.0001167 12.37 -
3rd 15981 448.0 0.04029 0.0000899 13.87 -
4th 16352 450.2 0.04328 0.0000961 13.47 -
5th 12398 497.4 0.03092 0.0000622 16.31 -
6th 16155 452.3 0.04348 0.0000961 13.47 -
7th 20450 416.0 0.05693 0.0001369 11.53 -
1st Core (11/2004)
1st to 7th 18920 418.9 0.04954 0.0001183 12.29 -
0 month 18920 418.9 0.04954 0.0001183 12.29 -
2 mo. 55317 276.2 0.14972 0.0005420 6.29 -
4 mo. 93006 229.5 0.21726 0.0009468 4.92 -
6 mo. 148180 202.4 0.27366 0.0013524 4.21 -
Thin Film Aging in ER (60 ℃)
8 mo. 226260 175.3 0.36948 0.0021082 3.46 - 2nd Core (07/2006) 1st to 7th 21417 401.9 0.05859 0.0001458 11.21 -
Unaged 1659 1182.6 0.00155 0.0000013 89.19 - SAFT 3634 716.7 0.00569 0.0000079 40.34 -
P* 16 hr 16016 396.2 0.03702 0.0000934 13.64 - P* 32 hr 31261 319.0 0.06215 0.0001948 9.87 -
3 mo. 23683 358.9 0.05298 0.0001476 11.15 -
6 mo. 74382 250.7 0.14124 0.0005633 6.19 - 9 mo. 180780 196.5 0.24990 0.0012719 4.32 -
Original Binder
(Koch 58-28)
12 mo. 244940 168.2 0.38696 0.0023008 3.33 -
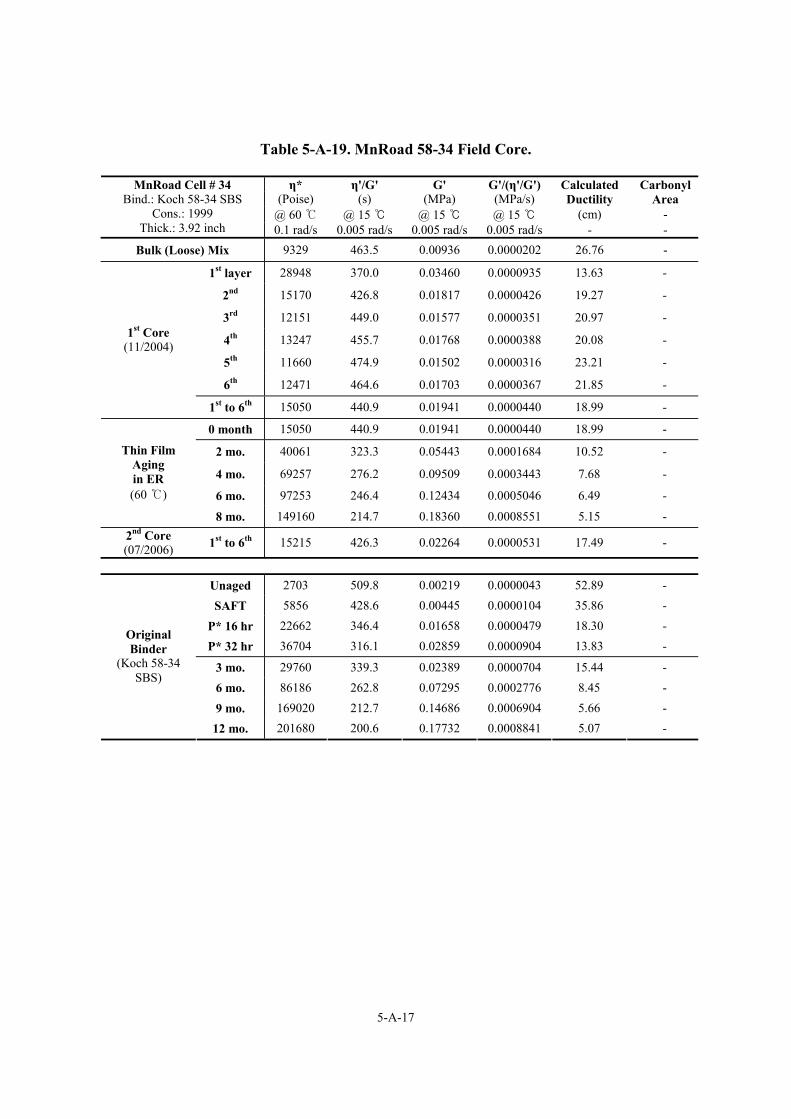
5-A-17
Table 5-A-19. MnRoad 58-34 Field Core.
η* η'/G' G' G'/(η'/G') Calculated Carbonyl (Poise) (s) (MPa) (MPa/s) Ductility Area
@ 60 ℃ @ 15 ℃ @ 15 ℃ @ 15 ℃ (cm) -
MnRoad Cell # 34 Bind.: Koch 58-34 SBS
Cons.: 1999 Thick.: 3.92 inch 0.1 rad/s 0.005 rad/s 0.005 rad/s 0.005 rad/s - -
Bulk (Loose) Mix 9329 463.5 0.00936 0.0000202 26.76 -
1st layer 28948 370.0 0.03460 0.0000935 13.63 -
2nd 15170 426.8 0.01817 0.0000426 19.27 -
3rd 12151 449.0 0.01577 0.0000351 20.97 -
4th 13247 455.7 0.01768 0.0000388 20.08 -
5th 11660 474.9 0.01502 0.0000316 23.21 -
6th 12471 464.6 0.01703 0.0000367 21.85 -
1st Core (11/2004)
1st to 6th 15050 440.9 0.01941 0.0000440 18.99 -
0 month 15050 440.9 0.01941 0.0000440 18.99 -
2 mo. 40061 323.3 0.05443 0.0001684 10.52 -
4 mo. 69257 276.2 0.09509 0.0003443 7.68 -
6 mo. 97253 246.4 0.12434 0.0005046 6.49 -
Thin Film Aging in ER (60 ℃)
8 mo. 149160 214.7 0.18360 0.0008551 5.15 - 2nd Core (07/2006) 1st to 6th 15215 426.3 0.02264 0.0000531 17.49 -
Unaged 2703 509.8 0.00219 0.0000043 52.89 - SAFT 5856 428.6 0.00445 0.0000104 35.86 -
P* 16 hr 22662 346.4 0.01658 0.0000479 18.30 - P* 32 hr 36704 316.1 0.02859 0.0000904 13.83 -
3 mo. 29760 339.3 0.02389 0.0000704 15.44 - 6 mo. 86186 262.8 0.07295 0.0002776 8.45 - 9 mo. 169020 212.7 0.14686 0.0006904 5.66 -
Original Binder
(Koch 58-34 SBS)
12 mo. 201680 200.6 0.17732 0.0008841 5.07 -
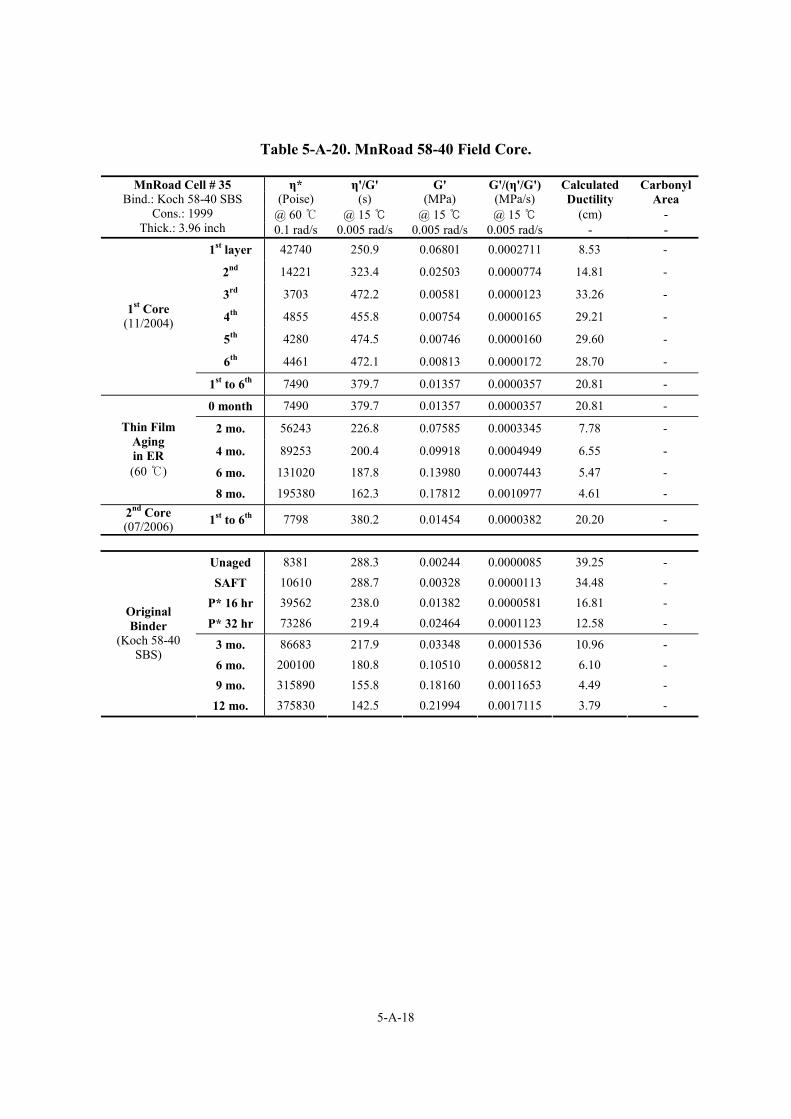
5-A-18
Table 5-A-20. MnRoad 58-40 Field Core.
η* η'/G' G' G'/(η'/G') Calculated Carbonyl (Poise) (s) (MPa) (MPa/s) Ductility Area
@ 60 ℃ @ 15 ℃ @ 15 ℃ @ 15 ℃ (cm) -
MnRoad Cell # 35 Bind.: Koch 58-40 SBS
Cons.: 1999 Thick.: 3.96 inch 0.1 rad/s 0.005 rad/s 0.005 rad/s 0.005 rad/s - -
1st layer 42740 250.9 0.06801 0.0002711 8.53 -
2nd 14221 323.4 0.02503 0.0000774 14.81 -
3rd 3703 472.2 0.00581 0.0000123 33.26 -
4th 4855 455.8 0.00754 0.0000165 29.21 -
5th 4280 474.5 0.00746 0.0000160 29.60 -
6th 4461 472.1 0.00813 0.0000172 28.70 -
1st Core (11/2004)
1st to 6th 7490 379.7 0.01357 0.0000357 20.81 -
0 month 7490 379.7 0.01357 0.0000357 20.81 -
2 mo. 56243 226.8 0.07585 0.0003345 7.78 -
4 mo. 89253 200.4 0.09918 0.0004949 6.55 -
6 mo. 131020 187.8 0.13980 0.0007443 5.47 -
Thin Film Aging in ER (60 ℃)
8 mo. 195380 162.3 0.17812 0.0010977 4.61 - 2nd Core (07/2006) 1st to 6th 7798 380.2 0.01454 0.0000382 20.20 -
Unaged 8381 288.3 0.00244 0.0000085 39.25 - SAFT 10610 288.7 0.00328 0.0000113 34.48 -
P* 16 hr 39562 238.0 0.01382 0.0000581 16.81 - P* 32 hr 73286 219.4 0.02464 0.0001123 12.58 -
3 mo. 86683 217.9 0.03348 0.0001536 10.96 -
6 mo. 200100 180.8 0.10510 0.0005812 6.10 - 9 mo. 315890 155.8 0.18160 0.0011653 4.49 -
Original Binder
(Koch 58-40 SBS)
12 mo. 375830 142.5 0.21994 0.0017115 3.79 -
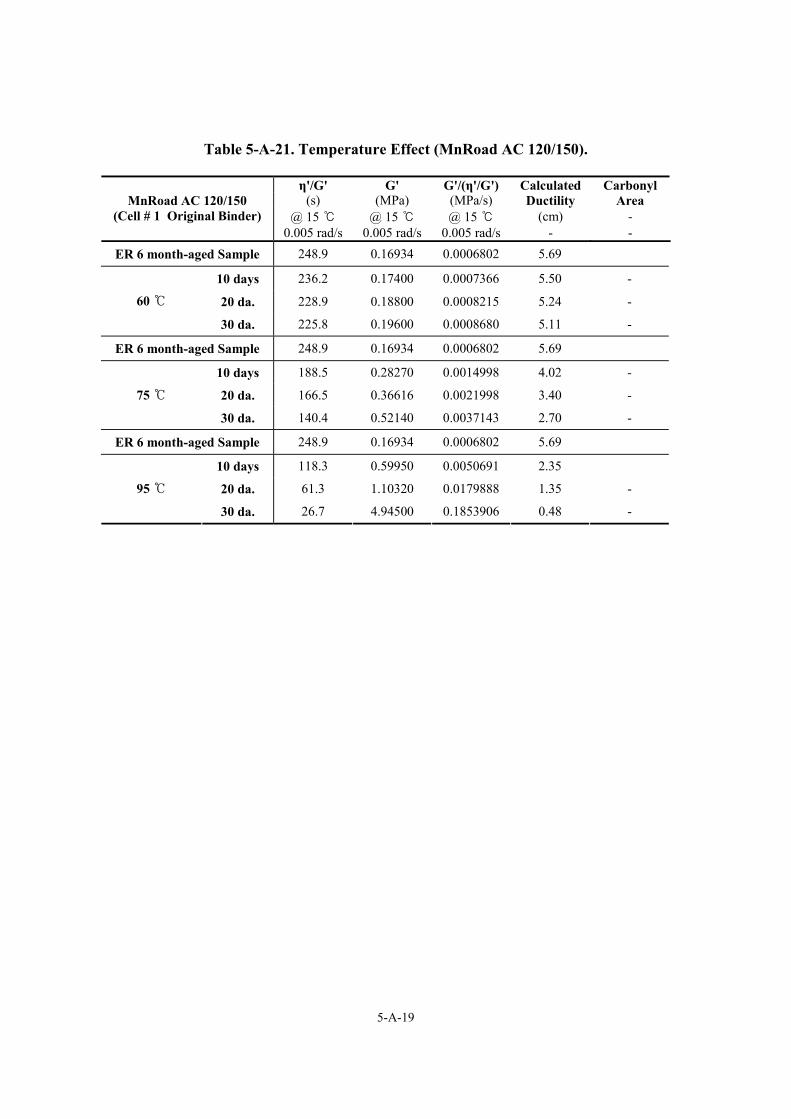
5-A-19
Table 5-A-21. Temperature Effect (MnRoad AC 120/150).
η'/G' G' G'/(η'/G') Calculated Carbonyl (s) (MPa) (MPa/s) Ductility Area
@ 15 ℃ @ 15 ℃ @ 15 ℃ (cm) - MnRoad AC 120/150
(Cell # 1 Original Binder) 0.005 rad/s 0.005 rad/s 0.005 rad/s - -
ER 6 month-aged Sample 248.9 0.16934 0.0006802 5.69
10 days 236.2 0.17400 0.0007366 5.50 -
20 da. 228.9 0.18800 0.0008215 5.24 - 60 ℃
30 da. 225.8 0.19600 0.0008680 5.11 -
ER 6 month-aged Sample 248.9 0.16934 0.0006802 5.69
10 days 188.5 0.28270 0.0014998 4.02 -
20 da. 166.5 0.36616 0.0021998 3.40 - 75 ℃
30 da. 140.4 0.52140 0.0037143 2.70 -
ER 6 month-aged Sample 248.9 0.16934 0.0006802 5.69
10 days 118.3 0.59950 0.0050691 2.35
20 da. 61.3 1.10320 0.0179888 1.35 - 95 ℃
30 da. 26.7 4.94500 0.1853906 0.48 -
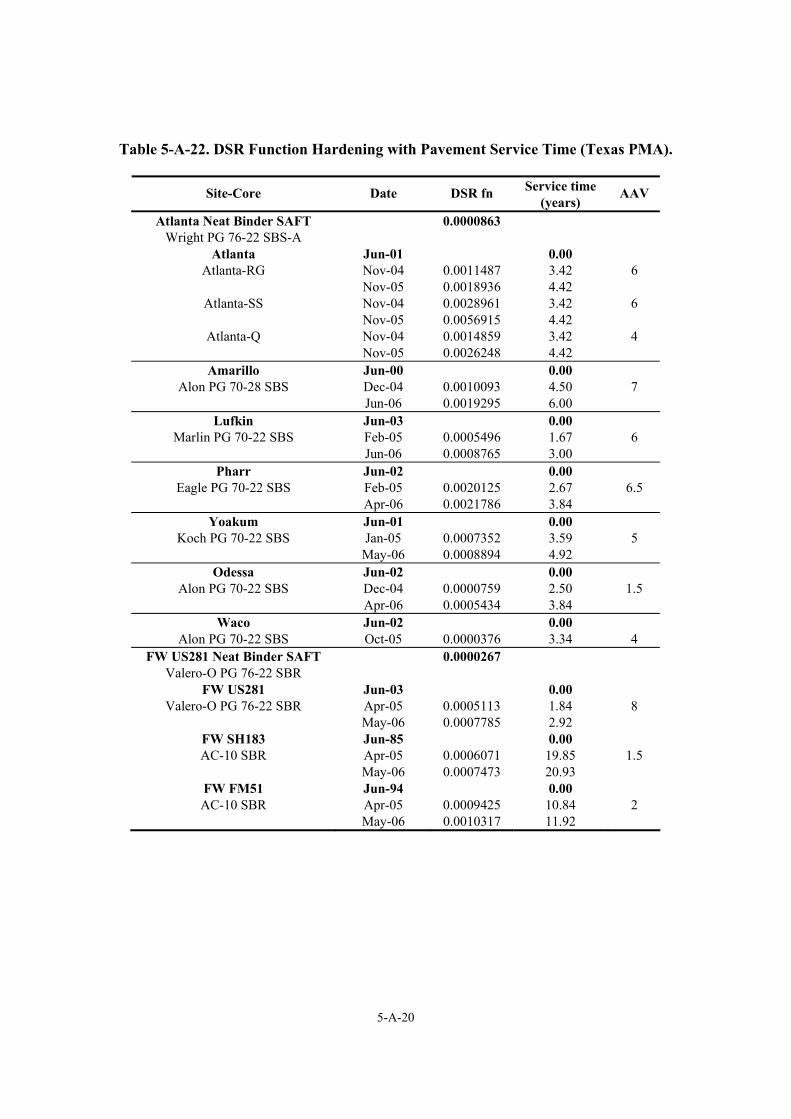
5-A-20
Table 5-A-22. DSR Function Hardening with Pavement Service Time (Texas PMA).
Service time Site-Core Date DSR fn (years)
AAV
Atlanta Neat Binder SAFT 0.0000863 Wright PG 76-22 SBS-A
Atlanta Jun-01 0.00 Atlanta-RG Nov-04 0.0011487 3.42 6
Nov-05 0.0018936 4.42 Atlanta-SS Nov-04 0.0028961 3.42 6
Nov-05 0.0056915 4.42 Atlanta-Q Nov-04 0.0014859 3.42 4
Nov-05 0.0026248 4.42 Amarillo Jun-00 0.00
Alon PG 70-28 SBS Dec-04 0.0010093 4.50 7 Jun-06 0.0019295 6.00
Lufkin Jun-03 0.00 Marlin PG 70-22 SBS Feb-05 0.0005496 1.67 6
Jun-06 0.0008765 3.00 Pharr Jun-02 0.00
Eagle PG 70-22 SBS Feb-05 0.0020125 2.67 6.5 Apr-06 0.0021786 3.84
Yoakum Jun-01 0.00 Koch PG 70-22 SBS Jan-05 0.0007352 3.59 5
May-06 0.0008894 4.92 Odessa Jun-02 0.00
Alon PG 70-22 SBS Dec-04 0.0000759 2.50 1.5 Apr-06 0.0005434 3.84
Waco Jun-02 0.00 Alon PG 70-22 SBS Oct-05 0.0000376 3.34 4
FW US281 Neat Binder SAFT 0.0000267 Valero-O PG 76-22 SBR
FW US281 Jun-03 0.00 Valero-O PG 76-22 SBR Apr-05 0.0005113 1.84 8
May-06 0.0007785 2.92 FW SH183 Jun-85 0.00 AC-10 SBR Apr-05 0.0006071 19.85 1.5
May-06 0.0007473 20.93 FW FM51 Jun-94 0.00 AC-10 SBR Apr-05 0.0009425 10.84 2
May-06 0.0010317 11.92
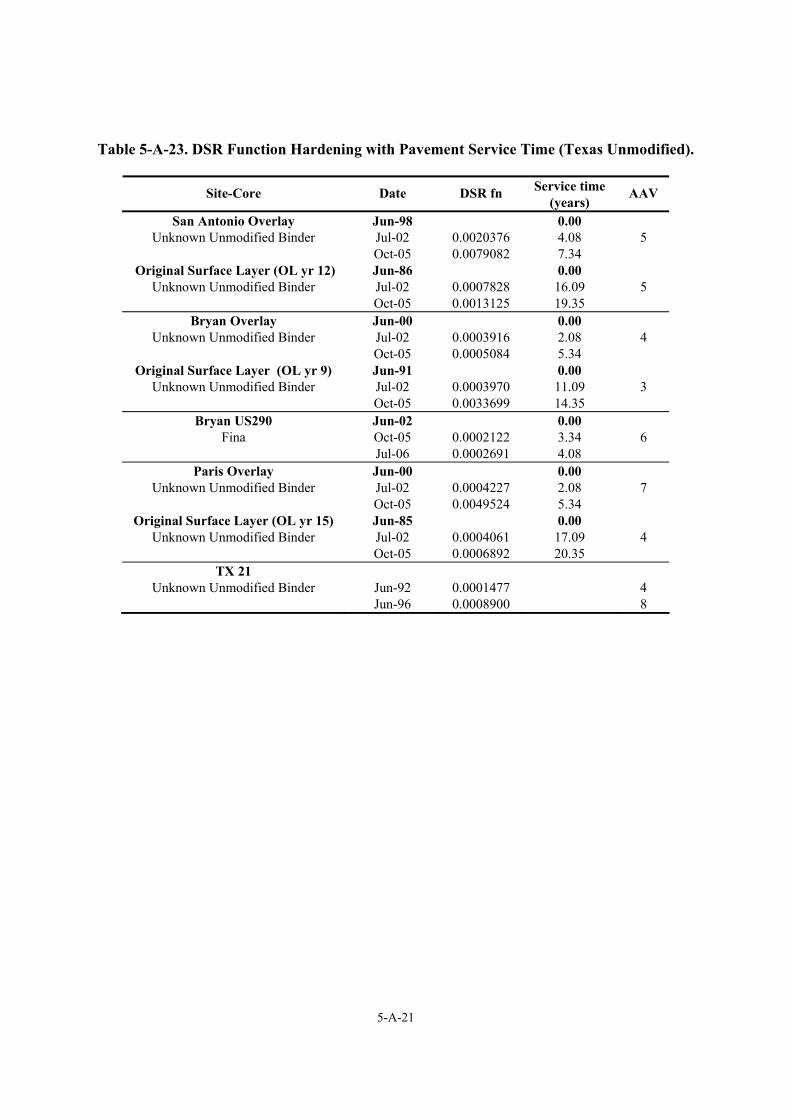
5-A-21
Table 5-A-23. DSR Function Hardening with Pavement Service Time (Texas Unmodified).
Service time Site-Core Date DSR fn (years)
AAV
San Antonio Overlay Jun-98 0.00 Unknown Unmodified Binder Jul-02 0.0020376 4.08 5
Oct-05 0.0079082 7.34 Original Surface Layer (OL yr 12) Jun-86 0.00
Unknown Unmodified Binder Jul-02 0.0007828 16.09 5 Oct-05 0.0013125 19.35
Bryan Overlay Jun-00 0.00 Unknown Unmodified Binder Jul-02 0.0003916 2.08 4
Oct-05 0.0005084 5.34 Original Surface Layer (OL yr 9) Jun-91 0.00
Unknown Unmodified Binder Jul-02 0.0003970 11.09 3 Oct-05 0.0033699 14.35
Bryan US290 Jun-02 0.00 Fina Oct-05 0.0002122 3.34 6
Jul-06 0.0002691 4.08 Paris Overlay Jun-00 0.00
Unknown Unmodified Binder Jul-02 0.0004227 2.08 7 Oct-05 0.0049524 5.34
Original Surface Layer (OL yr 15) Jun-85 0.00 Unknown Unmodified Binder Jul-02 0.0004061 17.09 4
Oct-05 0.0006892 20.35 TX 21
Unknown Unmodified Binder Jun-92 0.0001477 4 Jun-96 0.0008900 8
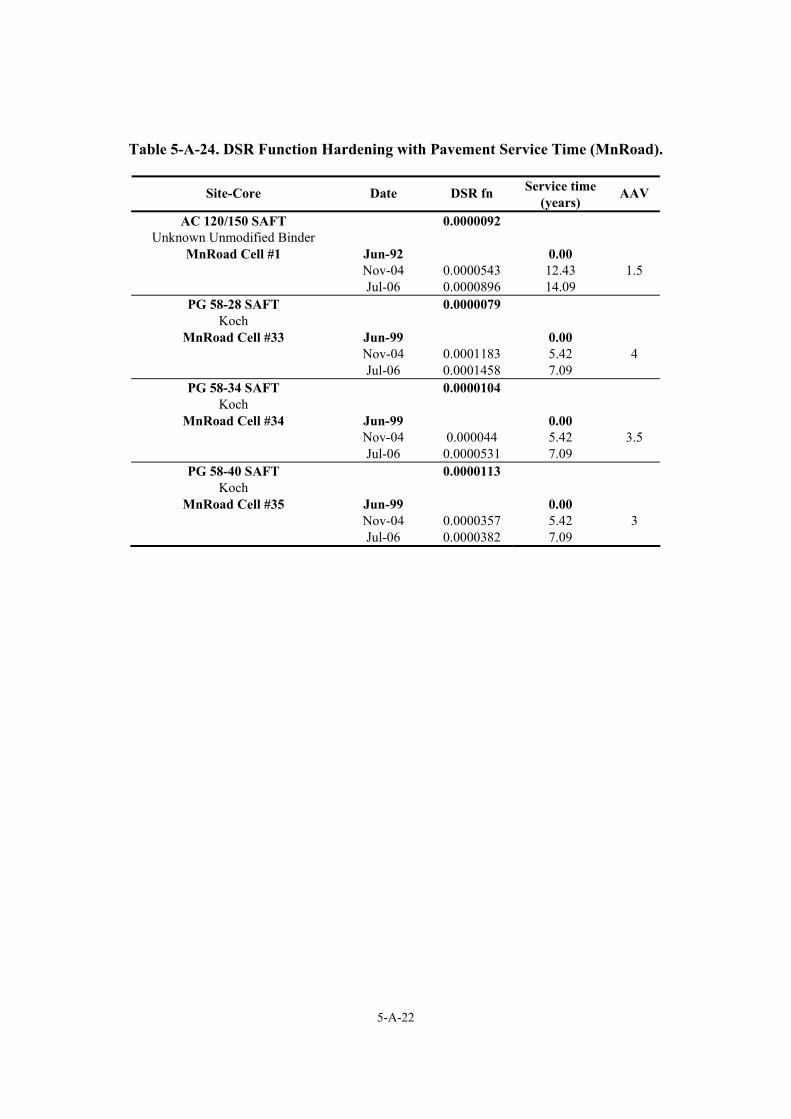
5-A-22
Table 5-A-24. DSR Function Hardening with Pavement Service Time (MnRoad).
Service time Site-Core Date DSR fn (years)
AAV
AC 120/150 SAFT 0.0000092 Unknown Unmodified Binder
MnRoad Cell #1 Jun-92 0.00 Nov-04 0.0000543 12.43 1.5
Jul-06 0.0000896 14.09 PG 58-28 SAFT 0.0000079
Koch MnRoad Cell #33 Jun-99 0.00
Nov-04 0.0001183 5.42 4 Jul-06 0.0001458 7.09
PG 58-34 SAFT 0.0000104 Koch
MnRoad Cell #34 Jun-99 0.00 Nov-04 0.000044 5.42 3.5
Jul-06 0.0000531 7.09 PG 58-40 SAFT 0.0000113
Koch MnRoad Cell #35 Jun-99 0.00
Nov-04 0.0000357 5.42 3 Jul-06 0.0000382 7.09
5-B-1
APPENDICES FOR CHAPTER 5
APPENDIX 5-B
TABLES OF BULK S.G., AIR VOID, AND BINDER CONTENT DATA

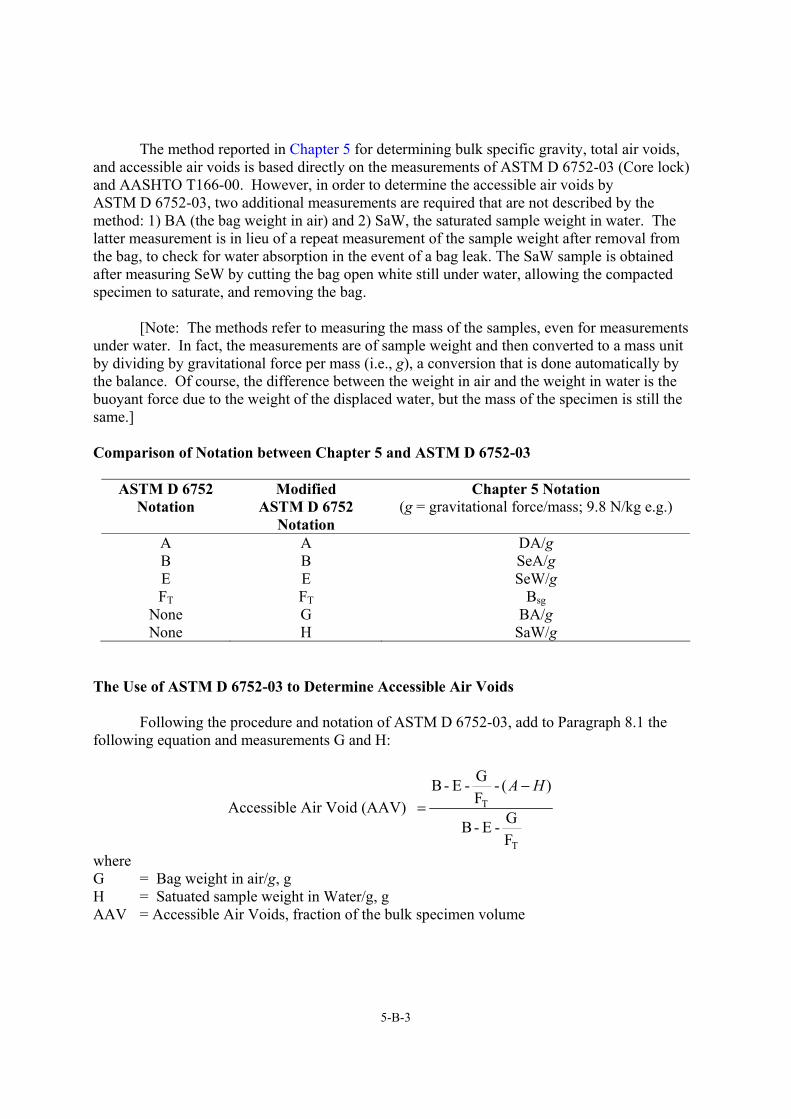
5-B-3
The method reported in Chapter 5 for determining bulk specific gravity, total air voids, and accessible air voids is based directly on the measurements of ASTM D 6752-03 (Core lock) and AASHTO T166-00. However, in order to determine the accessible air voids by ASTM D 6752-03, two additional measurements are required that are not described by the method: 1) BA (the bag weight in air) and 2) SaW, the saturated sample weight in water. The latter measurement is in lieu of a repeat measurement of the sample weight after removal from the bag, to check for water absorption in the event of a bag leak. The SaW sample is obtained after measuring SeW by cutting the bag open white still under water, allowing the compacted specimen to saturate, and removing the bag.
[Note: The methods refer to measuring the mass of the samples, even for measurements
under water. In fact, the measurements are of sample weight and then converted to a mass unit by dividing by gravitational force per mass (i.e., g), a conversion that is done automatically by the balance. Of course, the difference between the weight in air and the weight in water is the buoyant force due to the weight of the displaced water, but the mass of the specimen is still the same.]
Comparison of Notation between Chapter 5 and ASTM D 6752-03
ASTM D 6752
Notation Modified
ASTM D 6752 Notation
Chapter 5 Notation (g = gravitational force/mass; 9.8 N/kg e.g.)
A A DA/g B B SeA/g E E SeW/g FT FT Bsg
None G BA/g None H SaW/g
The Use of ASTM D 6752-03 to Determine Accessible Air Voids Following the procedure and notation of ASTM D 6752-03, add to Paragraph 8.1 the following equation and measurements G and H:
Accessible Air Void (AAV) =B- E - G
FT
- (A − H )
B- E - GFT
where G = Bag weight in air/g, g H = Satuated sample weight in Water/g, g AAV = Accessible Air Voids, fraction of the bulk specimen volume
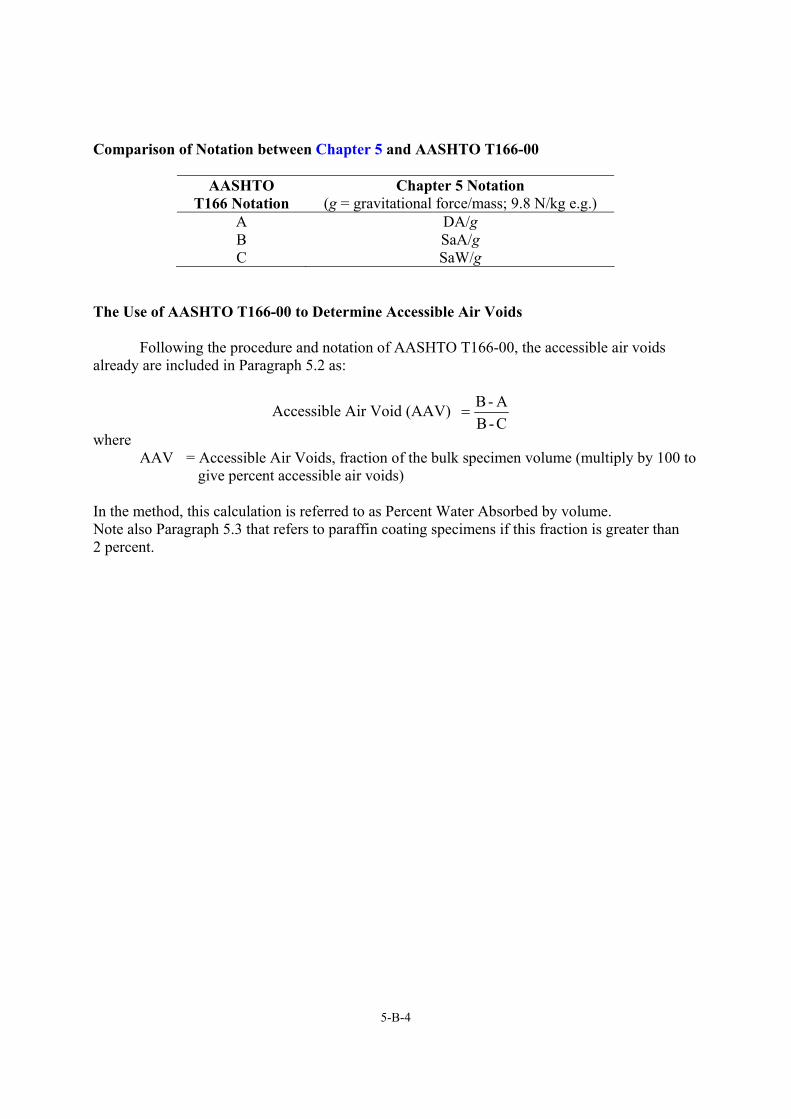
5-B-4
Comparison of Notation between Chapter 5 and AASHTO T166-00
AASHTO T166 Notation
Chapter 5 Notation (g = gravitational force/mass; 9.8 N/kg e.g.)
A DA/g B SaA/g C SaW/g
The Use of AASHTO T166-00 to Determine Accessible Air Voids Following the procedure and notation of AASHTO T166-00, the accessible air voids already are included in Paragraph 5.2 as:
Accessible Air Void (AAV) = B- AB- C
where AAV = Accessible Air Voids, fraction of the bulk specimen volume (multiply by 100 to give percent accessible air voids) In the method, this calculation is referred to as Percent Water Absorbed by volume. Note also Paragraph 5.3 that refers to paraffin coating specimens if this fraction is greater than 2 percent.
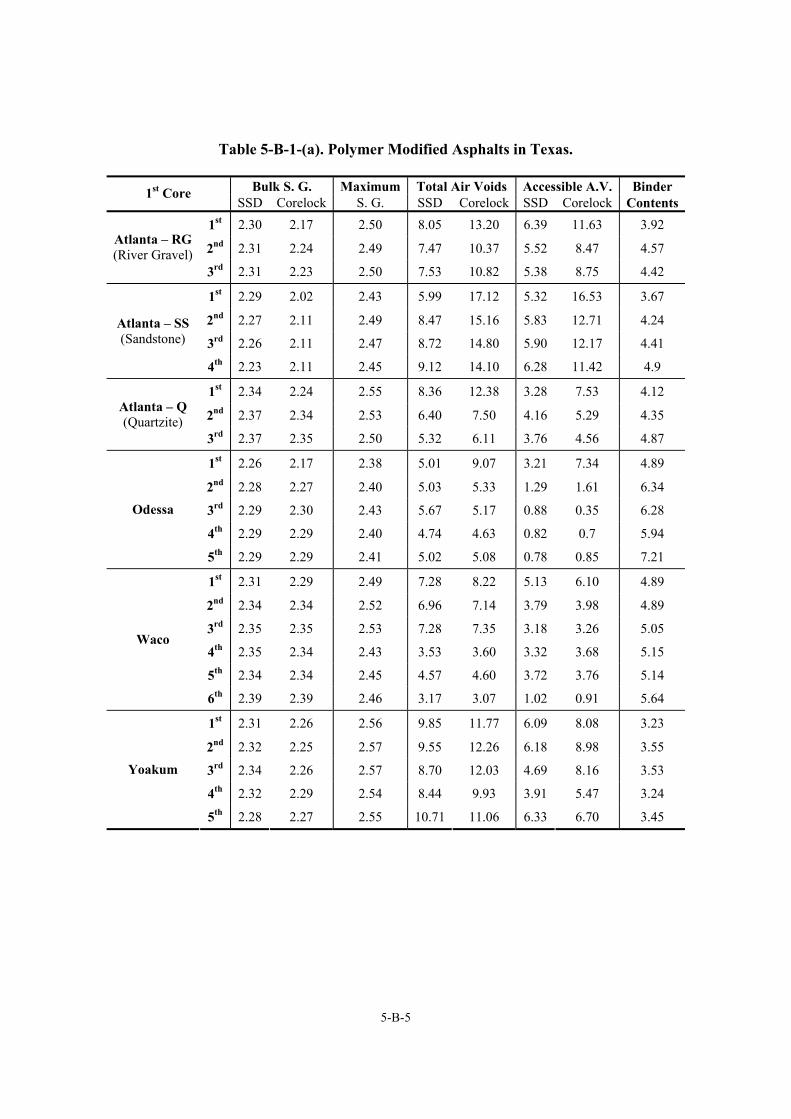
5-B-5
Table 5-B-1-(a). Polymer Modified Asphalts in Texas.
Bulk S. G. Maximum Total Air Voids Accessible A.V. Binder 1st Core SSD Corelock S. G. SSD Corelock SSD Corelock Contents
1st 2.30 2.17 2.50 8.05 13.20 6.39 11.63 3.92
2nd 2.31 2.24 2.49 7.47 10.37 5.52 8.47 4.57 Atlanta – RG (River Gravel)
3rd 2.31 2.23 2.50 7.53 10.82 5.38 8.75 4.42
1st 2.29 2.02 2.43 5.99 17.12 5.32 16.53 3.67
2nd 2.27 2.11 2.49 8.47 15.16 5.83 12.71 4.24
3rd 2.26 2.11 2.47 8.72 14.80 5.90 12.17 4.41 Atlanta – SS (Sandstone)
4th 2.23 2.11 2.45 9.12 14.10 6.28 11.42 4.9
1st 2.34 2.24 2.55 8.36 12.38 3.28 7.53 4.12
2nd 2.37 2.34 2.53 6.40 7.50 4.16 5.29 4.35 Atlanta – Q (Quartzite)
3rd 2.37 2.35 2.50 5.32 6.11 3.76 4.56 4.87
1st 2.26 2.17 2.38 5.01 9.07 3.21 7.34 4.89
2nd 2.28 2.27 2.40 5.03 5.33 1.29 1.61 6.34
3rd 2.29 2.30 2.43 5.67 5.17 0.88 0.35 6.28
4th 2.29 2.29 2.40 4.74 4.63 0.82 0.7 5.94
Odessa
5th 2.29 2.29 2.41 5.02 5.08 0.78 0.85 7.21
1st 2.31 2.29 2.49 7.28 8.22 5.13 6.10 4.89
2nd 2.34 2.34 2.52 6.96 7.14 3.79 3.98 4.89
3rd 2.35 2.35 2.53 7.28 7.35 3.18 3.26 5.05
4th 2.35 2.34 2.43 3.53 3.60 3.32 3.68 5.15
5th 2.34 2.34 2.45 4.57 4.60 3.72 3.76 5.14
Waco
6th 2.39 2.39 2.46 3.17 3.07 1.02 0.91 5.64
1st 2.31 2.26 2.56 9.85 11.77 6.09 8.08 3.23
2nd 2.32 2.25 2.57 9.55 12.26 6.18 8.98 3.55
3rd 2.34 2.26 2.57 8.70 12.03 4.69 8.16 3.53
4th 2.32 2.29 2.54 8.44 9.93 3.91 5.47 3.24
Yoakum
5th 2.28 2.27 2.55 10.71 11.06 6.33 6.70 3.45
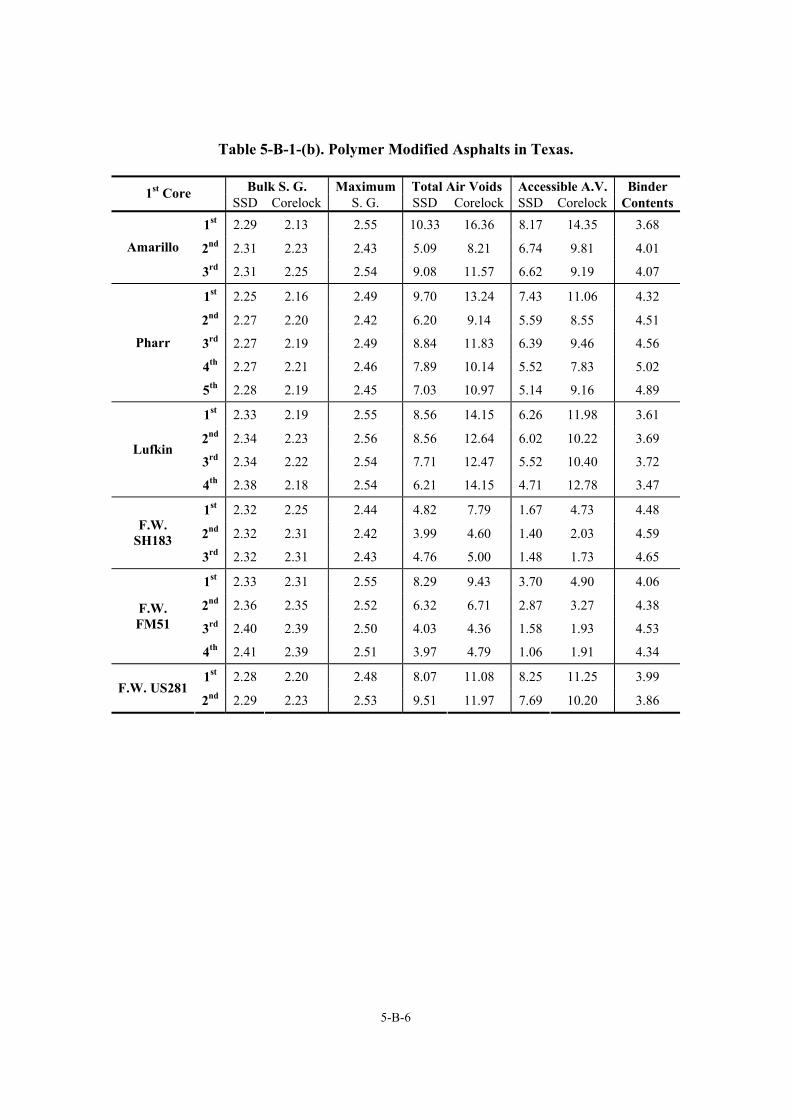
5-B-6
Table 5-B-1-(b). Polymer Modified Asphalts in Texas.
Bulk S. G. Maximum Total Air Voids Accessible A.V. Binder 1st Core SSD Corelock S. G. SSD Corelock SSD Corelock Contents
1st 2.29 2.13 2.55 10.33 16.36 8.17 14.35 3.68
2nd 2.31 2.23 2.43 5.09 8.21 6.74 9.81 4.01 Amarillo
3rd 2.31 2.25 2.54 9.08 11.57 6.62 9.19 4.07
1st 2.25 2.16 2.49 9.70 13.24 7.43 11.06 4.32
2nd 2.27 2.20 2.42 6.20 9.14 5.59 8.55 4.51
3rd 2.27 2.19 2.49 8.84 11.83 6.39 9.46 4.56
4th 2.27 2.21 2.46 7.89 10.14 5.52 7.83 5.02
Pharr
5th 2.28 2.19 2.45 7.03 10.97 5.14 9.16 4.89
1st 2.33 2.19 2.55 8.56 14.15 6.26 11.98 3.61
2nd 2.34 2.23 2.56 8.56 12.64 6.02 10.22 3.69
3rd 2.34 2.22 2.54 7.71 12.47 5.52 10.40 3.72 Lufkin
4th 2.38 2.18 2.54 6.21 14.15 4.71 12.78 3.47
1st 2.32 2.25 2.44 4.82 7.79 1.67 4.73 4.48
2nd 2.32 2.31 2.42 3.99 4.60 1.40 2.03 4.59 F.W. SH183
3rd 2.32 2.31 2.43 4.76 5.00 1.48 1.73 4.65
1st 2.33 2.31 2.55 8.29 9.43 3.70 4.90 4.06
2nd 2.36 2.35 2.52 6.32 6.71 2.87 3.27 4.38
3rd 2.40 2.39 2.50 4.03 4.36 1.58 1.93 4.53 F.W. FM51
4th 2.41 2.39 2.51 3.97 4.79 1.06 1.91 4.34
1st 2.28 2.20 2.48 8.07 11.08 8.25 11.25 3.99 F.W. US281
2nd 2.29 2.23 2.53 9.51 11.97 7.69 10.20 3.86
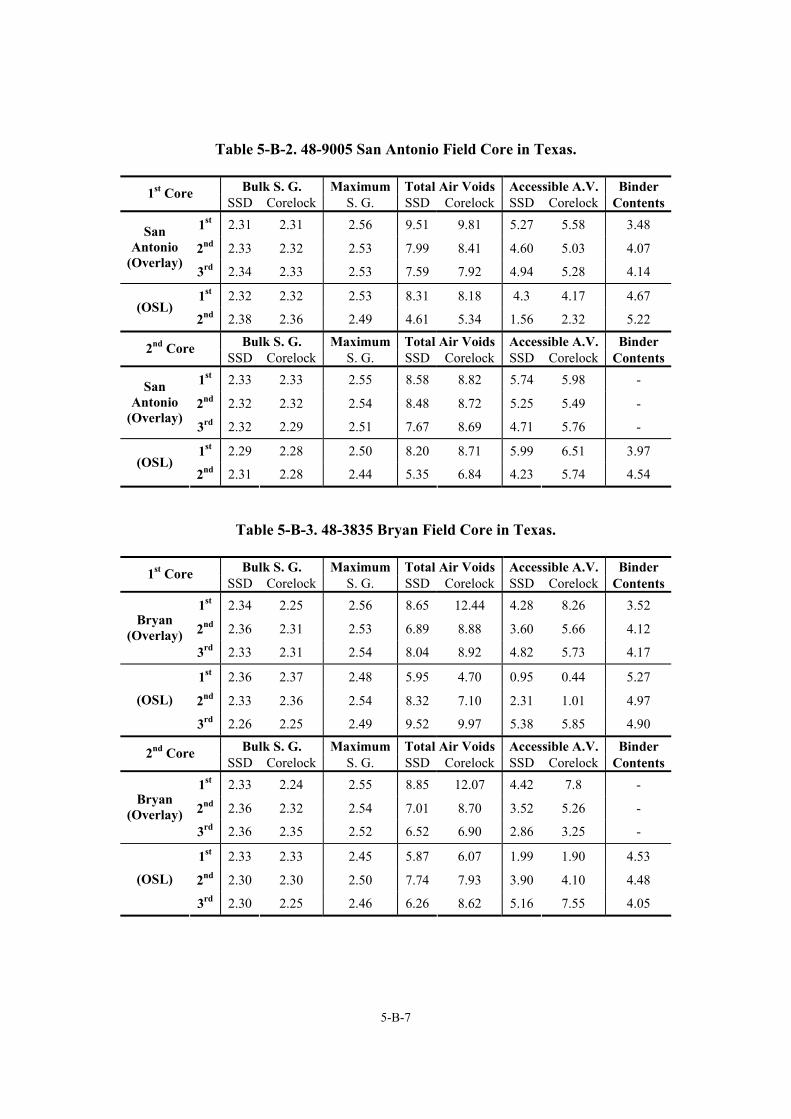
5-B-7
Table 5-B-2. 48-9005 San Antonio Field Core in Texas.
Bulk S. G. Maximum Total Air Voids Accessible A.V. Binder 1st Core SSD Corelock S. G. SSD Corelock SSD Corelock Contents
1st 2.31 2.31 2.56 9.51 9.81 5.27 5.58 3.48
2nd 2.33 2.32 2.53 7.99 8.41 4.60 5.03 4.07 San
Antonio (Overlay)
3rd 2.34 2.33 2.53 7.59 7.92 4.94 5.28 4.14
1st 2.32 2.32 2.53 8.31 8.18 4.3 4.17 4.67 (OSL)
2nd 2.38 2.36 2.49 4.61 5.34 1.56 2.32 5.22
Bulk S. G. Maximum Total Air Voids Accessible A.V. Binder 2nd Core SSD Corelock S. G. SSD Corelock SSD Corelock Contents
1st 2.33 2.33 2.55 8.58 8.82 5.74 5.98 -
2nd 2.32 2.32 2.54 8.48 8.72 5.25 5.49 - San
Antonio (Overlay)
3rd 2.32 2.29 2.51 7.67 8.69 4.71 5.76 -
1st 2.29 2.28 2.50 8.20 8.71 5.99 6.51 3.97 (OSL)
2nd 2.31 2.28 2.44 5.35 6.84 4.23 5.74 4.54
Table 5-B-3. 48-3835 Bryan Field Core in Texas.
Bulk S. G. Maximum Total Air Voids Accessible A.V. Binder 1st Core SSD Corelock S. G. SSD Corelock SSD Corelock Contents
1st 2.34 2.25 2.56 8.65 12.44 4.28 8.26 3.52
2nd 2.36 2.31 2.53 6.89 8.88 3.60 5.66 4.12 Bryan
(Overlay) 3rd 2.33 2.31 2.54 8.04 8.92 4.82 5.73 4.17
1st 2.36 2.37 2.48 5.95 4.70 0.95 0.44 5.27
2nd 2.33 2.36 2.54 8.32 7.10 2.31 1.01 4.97 (OSL)
3rd 2.26 2.25 2.49 9.52 9.97 5.38 5.85 4.90
Bulk S. G. Maximum Total Air Voids Accessible A.V. Binder 2nd Core SSD Corelock S. G. SSD Corelock SSD Corelock Contents
1st 2.33 2.24 2.55 8.85 12.07 4.42 7.8 -
2nd 2.36 2.32 2.54 7.01 8.70 3.52 5.26 - Bryan
(Overlay) 3rd 2.36 2.35 2.52 6.52 6.90 2.86 3.25 -
1st 2.33 2.33 2.45 5.87 6.07 1.99 1.90 4.53
2nd 2.30 2.30 2.50 7.74 7.93 3.90 4.10 4.48 (OSL)
3rd 2.30 2.25 2.46 6.26 8.62 5.16 7.55 4.05
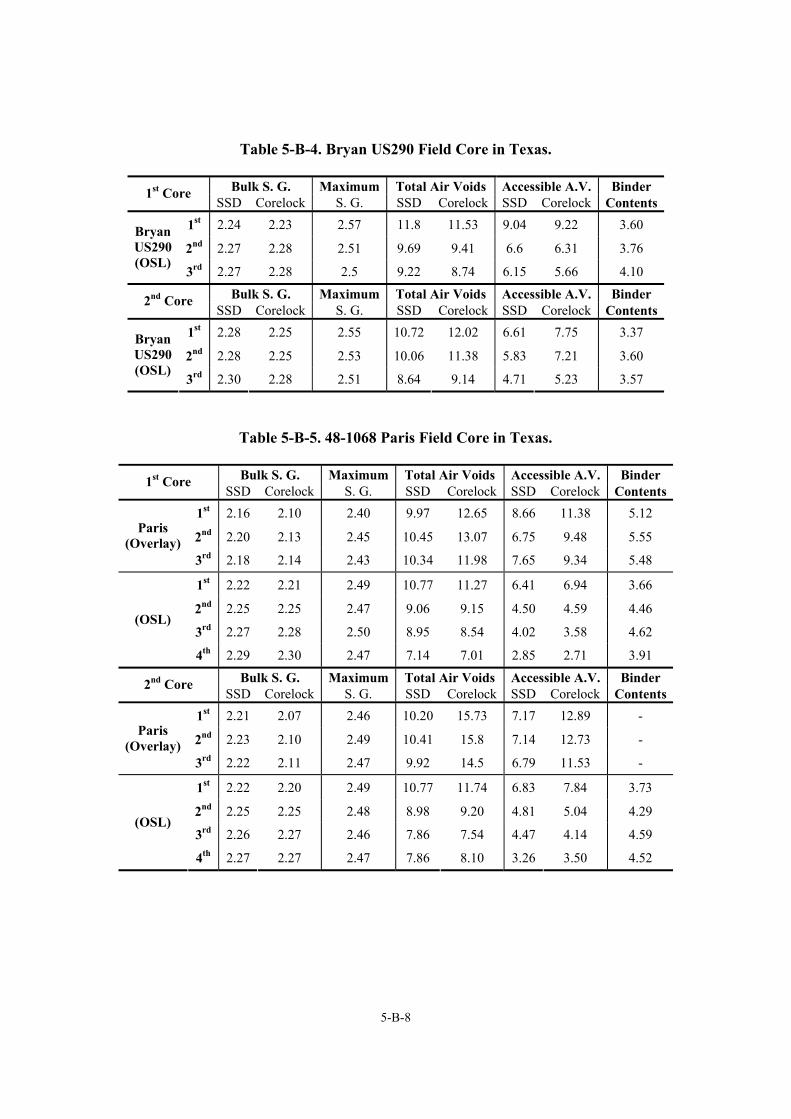
5-B-8
Table 5-B-4. Bryan US290 Field Core in Texas.
Bulk S. G. Maximum Total Air Voids Accessible A.V. Binder 1st Core SSD Corelock S. G. SSD Corelock SSD Corelock Contents
1st 2.24 2.23 2.57 11.8 11.53 9.04 9.22 3.60
2nd 2.27 2.28 2.51 9.69 9.41 6.6 6.31 3.76 Bryan US290 (OSL)
3rd 2.27 2.28 2.5 9.22 8.74 6.15 5.66 4.10
Bulk S. G. Maximum Total Air Voids Accessible A.V. Binder 2nd Core SSD Corelock S. G. SSD Corelock SSD Corelock Contents
1st 2.28 2.25 2.55 10.72 12.02 6.61 7.75 3.37
2nd 2.28 2.25 2.53 10.06 11.38 5.83 7.21 3.60 Bryan US290 (OSL)
3rd 2.30 2.28 2.51 8.64 9.14 4.71 5.23 3.57
Table 5-B-5. 48-1068 Paris Field Core in Texas.
Bulk S. G. Maximum Total Air Voids Accessible A.V. Binder 1st Core SSD Corelock S. G. SSD Corelock SSD Corelock Contents
1st 2.16 2.10 2.40 9.97 12.65 8.66 11.38 5.12
2nd 2.20 2.13 2.45 10.45 13.07 6.75 9.48 5.55 Paris
(Overlay) 3rd 2.18 2.14 2.43 10.34 11.98 7.65 9.34 5.48
1st 2.22 2.21 2.49 10.77 11.27 6.41 6.94 3.66
2nd 2.25 2.25 2.47 9.06 9.15 4.50 4.59 4.46
3rd 2.27 2.28 2.50 8.95 8.54 4.02 3.58 4.62 (OSL)
4th 2.29 2.30 2.47 7.14 7.01 2.85 2.71 3.91
Bulk S. G. Maximum Total Air Voids Accessible A.V. Binder 2nd Core SSD Corelock S. G. SSD Corelock SSD Corelock Contents
1st 2.21 2.07 2.46 10.20 15.73 7.17 12.89 -
2nd 2.23 2.10 2.49 10.41 15.8 7.14 12.73 - Paris
(Overlay) 3rd 2.22 2.11 2.47 9.92 14.5 6.79 11.53 -
1st 2.22 2.20 2.49 10.77 11.74 6.83 7.84 3.73
2nd 2.25 2.25 2.48 8.98 9.20 4.81 5.04 4.29
3rd 2.26 2.27 2.46 7.86 7.54 4.47 4.14 4.59 (OSL)
4th 2.27 2.27 2.47 7.86 8.10 3.26 3.50 4.52
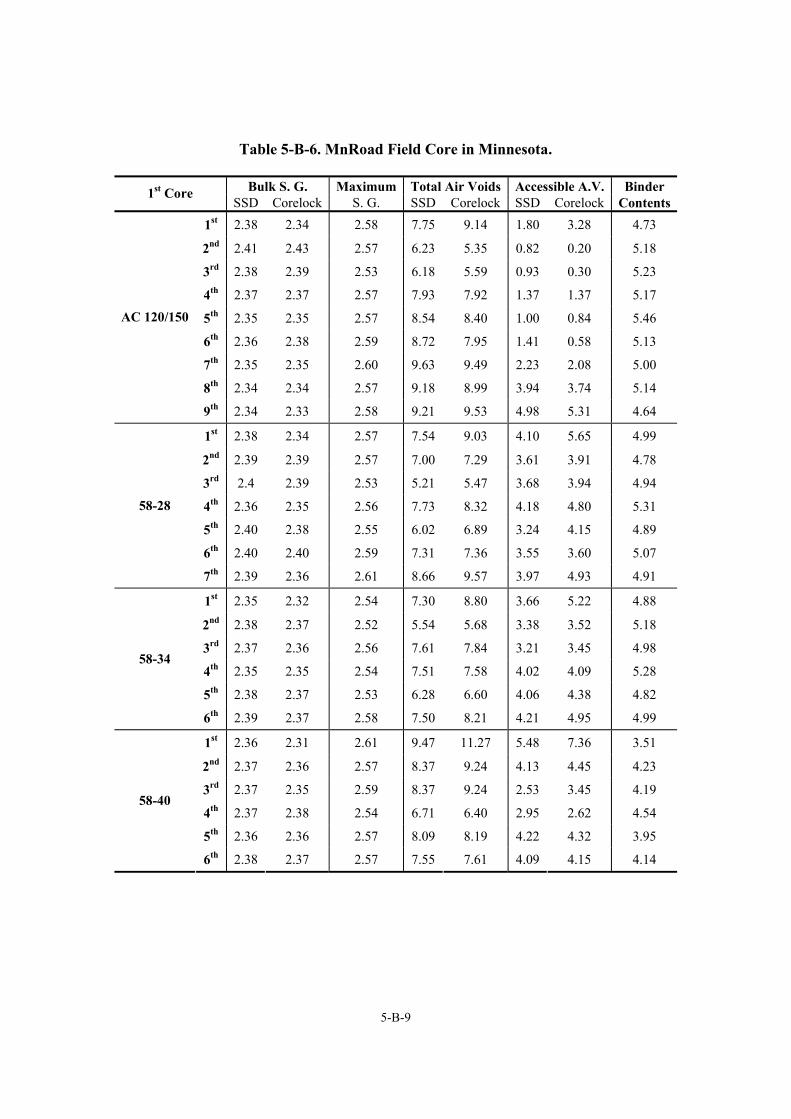
5-B-9
Table 5-B-6. MnRoad Field Core in Minnesota.
Bulk S. G. Maximum Total Air Voids Accessible A.V. Binder 1st Core SSD Corelock S. G. SSD Corelock SSD Corelock Contents
1st 2.38 2.34 2.58 7.75 9.14 1.80 3.28 4.73
2nd 2.41 2.43 2.57 6.23 5.35 0.82 0.20 5.18
3rd 2.38 2.39 2.53 6.18 5.59 0.93 0.30 5.23
4th 2.37 2.37 2.57 7.93 7.92 1.37 1.37 5.17
5th 2.35 2.35 2.57 8.54 8.40 1.00 0.84 5.46
6th 2.36 2.38 2.59 8.72 7.95 1.41 0.58 5.13
7th 2.35 2.35 2.60 9.63 9.49 2.23 2.08 5.00
8th 2.34 2.34 2.57 9.18 8.99 3.94 3.74 5.14
AC 120/150
9th 2.34 2.33 2.58 9.21 9.53 4.98 5.31 4.64
1st 2.38 2.34 2.57 7.54 9.03 4.10 5.65 4.99
2nd 2.39 2.39 2.57 7.00 7.29 3.61 3.91 4.78
3rd 2.4 2.39 2.53 5.21 5.47 3.68 3.94 4.94
4th 2.36 2.35 2.56 7.73 8.32 4.18 4.80 5.31
5th 2.40 2.38 2.55 6.02 6.89 3.24 4.15 4.89
6th 2.40 2.40 2.59 7.31 7.36 3.55 3.60 5.07
58-28
7th 2.39 2.36 2.61 8.66 9.57 3.97 4.93 4.91
1st 2.35 2.32 2.54 7.30 8.80 3.66 5.22 4.88
2nd 2.38 2.37 2.52 5.54 5.68 3.38 3.52 5.18
3rd 2.37 2.36 2.56 7.61 7.84 3.21 3.45 4.98
4th 2.35 2.35 2.54 7.51 7.58 4.02 4.09 5.28
5th 2.38 2.37 2.53 6.28 6.60 4.06 4.38 4.82
58-34
6th 2.39 2.37 2.58 7.50 8.21 4.21 4.95 4.99
1st 2.36 2.31 2.61 9.47 11.27 5.48 7.36 3.51
2nd 2.37 2.36 2.57 8.37 9.24 4.13 4.45 4.23
3rd 2.37 2.35 2.59 8.37 9.24 2.53 3.45 4.19
4th 2.37 2.38 2.54 6.71 6.40 2.95 2.62 4.54
5th 2.36 2.36 2.57 8.09 8.19 4.22 4.32 3.95
58-40
6th 2.38 2.37 2.57 7.55 7.61 4.09 4.15 4.14

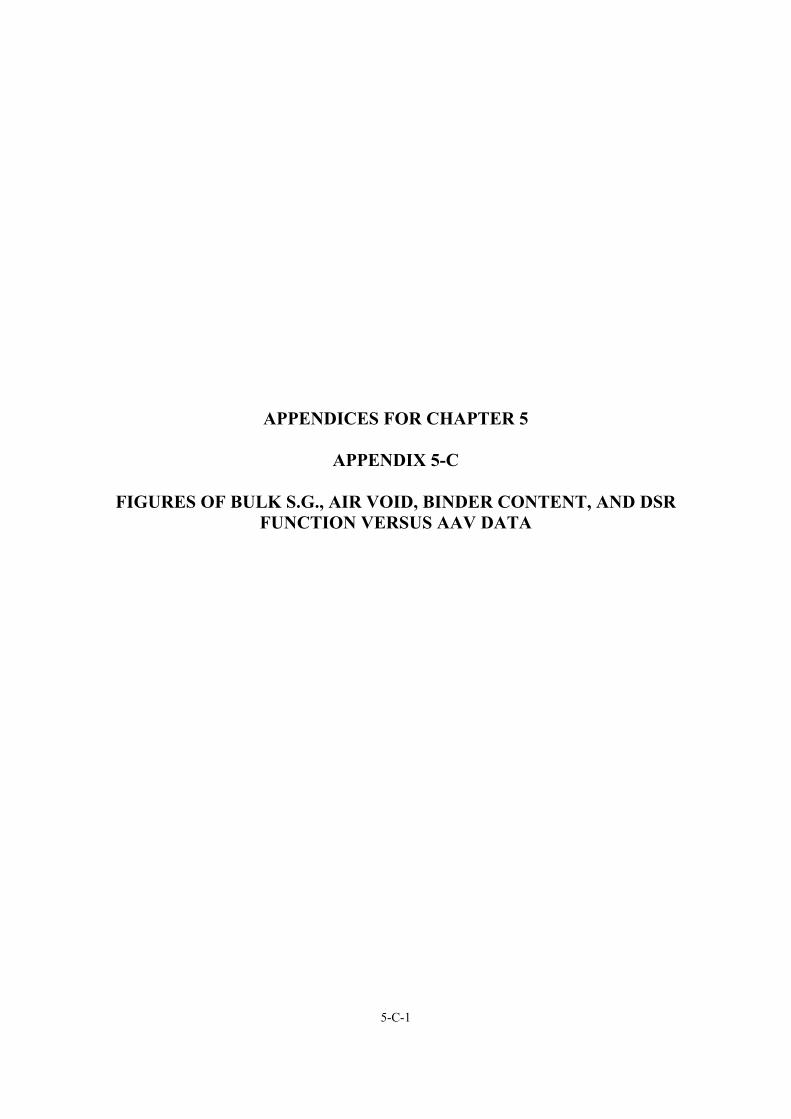
5-C-1
APPENDICES FOR CHAPTER 5
APPENDIX 5-C
FIGURES OF BULK S.G., AIR VOID, BINDER CONTENT, AND DSR FUNCTION VERSUS AAV DATA

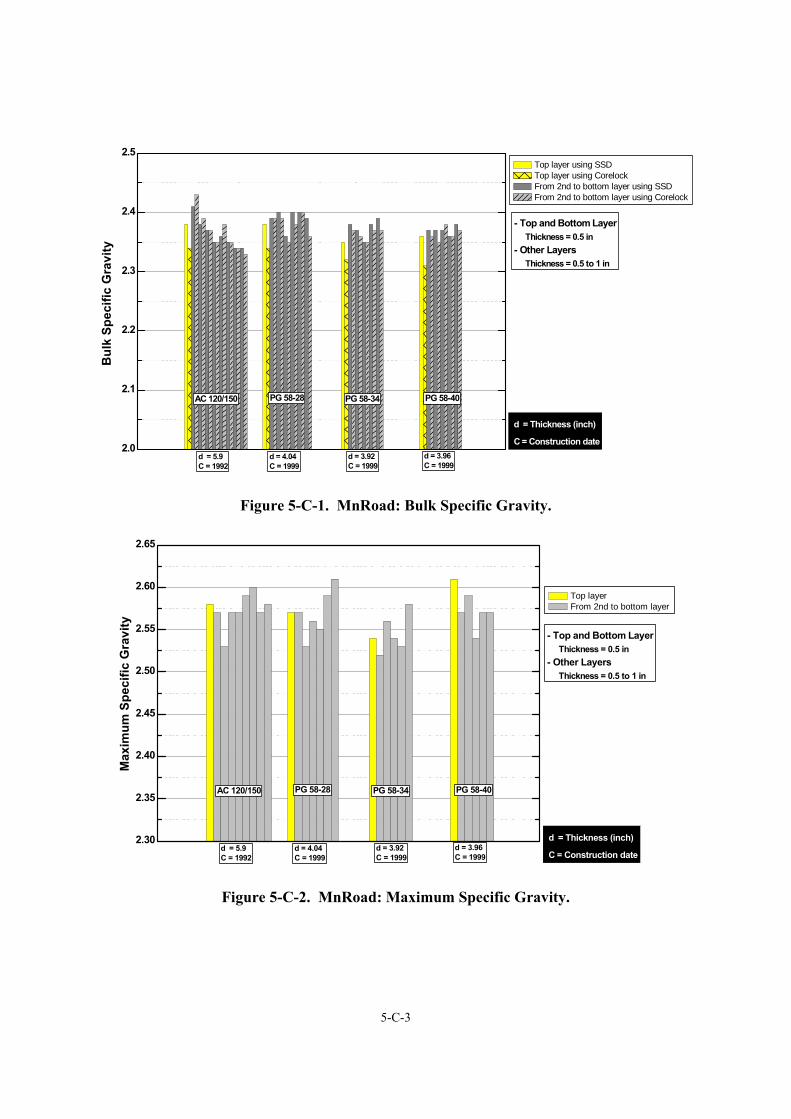
5-C-3
2.0
2.1
2.2
2.3
2.4
2.5
d = Thickness (inch)
C = Construction date
- Top and Bottom Layer Thickness = 0.5 in- Other Layers Thickness = 0.5 to 1 in
PG 58-40PG 58-28 PG 58-34
Bul
k Sp
ecifi
c G
ravi
ty
Top layer using SSD Top layer using Corelock From 2nd to bottom layer using SSD From 2nd to bottom layer using Corelock
AC 120/150
d = 3.96 C = 1999
d = 3.92 C = 1999
d = 4.04 C = 1999
d = 5.9 C = 1992
Figure 5-C-1. MnRoad: Bulk Specific Gravity.
2.30
2.35
2.40
2.45
2.50
2.55
2.60
2.65
d = Thickness (inch)
C = Construction date
- Top and Bottom Layer Thickness = 0.5 in- Other Layers Thickness = 0.5 to 1 in
Max
imum
Spe
cific
Gra
vity
Top layer From 2nd to bottom layer
PG 58-40PG 58-28 PG 58-34AC 120/150
d = 3.96 C = 1999
d = 3.92 C = 1999
d = 4.04 C = 1999
d = 5.9 C = 1992
Figure 5-C-2. MnRoad: Maximum Specific Gravity.
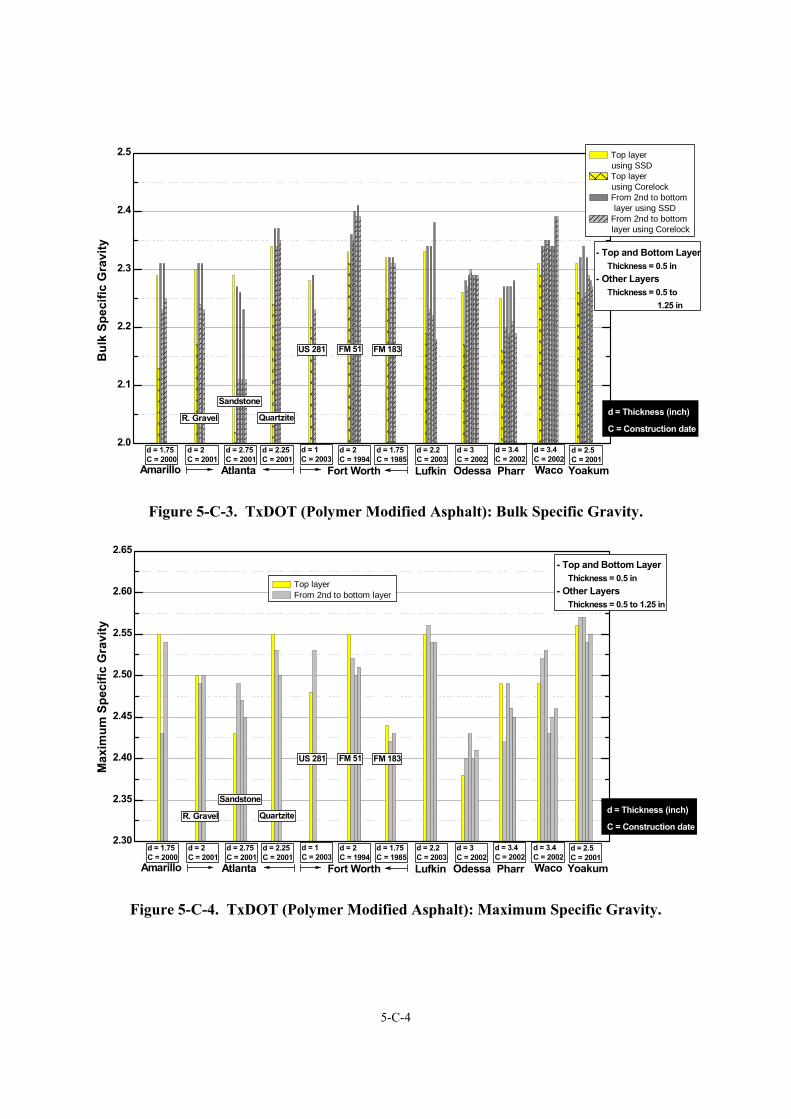
5-C-4
2.0
2.1
2.2
2.3
2.4
2.5
Bul
k Sp
ecifi
c G
ravi
ty
Waco
d = 3.4 C = 2002
Top layer using SSD
Top layer using Corelock
From 2nd to bottom layer using SSD
From 2nd to bottom layer using Corelock
- Top and Bottom Layer Thickness = 0.5 in- Other Layers Thickness = 0.5 to 1.25 in
FM 51
d = 1.75 C = 1985
d = 2 C = 1994
FM 183US 281
Atlanta
d = 1.75 C = 2000
d = 2.25 C = 2001
Quartzite
Sandstone
R. Gravel
d = 2.75C = 2001
d = Thickness (inch)
C = Construction date
d = 2 C = 2001
Amarillo
d = 3 C = 2002
d = 2.5 C = 2001
Odessa Yoakum
d = 2.2 C = 2003Lufkin
d = 3.4 C = 2002Pharr
d = 1C = 2003
Fort Worth
Figure 5-C-3. TxDOT (Polymer Modified Asphalt): Bulk Specific Gravity.
2.30
2.35
2.40
2.45
2.50
2.55
2.60
2.65- Top and Bottom Layer Thickness = 0.5 in- Other Layers Thickness = 0.5 to 1.25 in
Max
imum
Spe
cific
Gra
vity
Top layer From 2nd to bottom layer
Waco
d = 3.4 C = 2002
FM 51
d = 1.75 C = 1985
d = 2 C = 1994
FM 183US 281
Atlanta
d = 1.75 C = 2000
d = 2.25 C = 2001
Quartzite
Sandstone
R. Gravel
d = 2.75C = 2001
d = Thickness (inch)
C = Construction date
d = 2 C = 2001
Amarillo
d = 3 C = 2002
d = 2.5 C = 2001
Odessa Yoakum
d = 2.2 C = 2003Lufkin
d = 3.4 C = 2002Pharr
d = 1C = 2003
Fort Worth
Figure 5-C-4. TxDOT (Polymer Modified Asphalt): Maximum Specific Gravity.
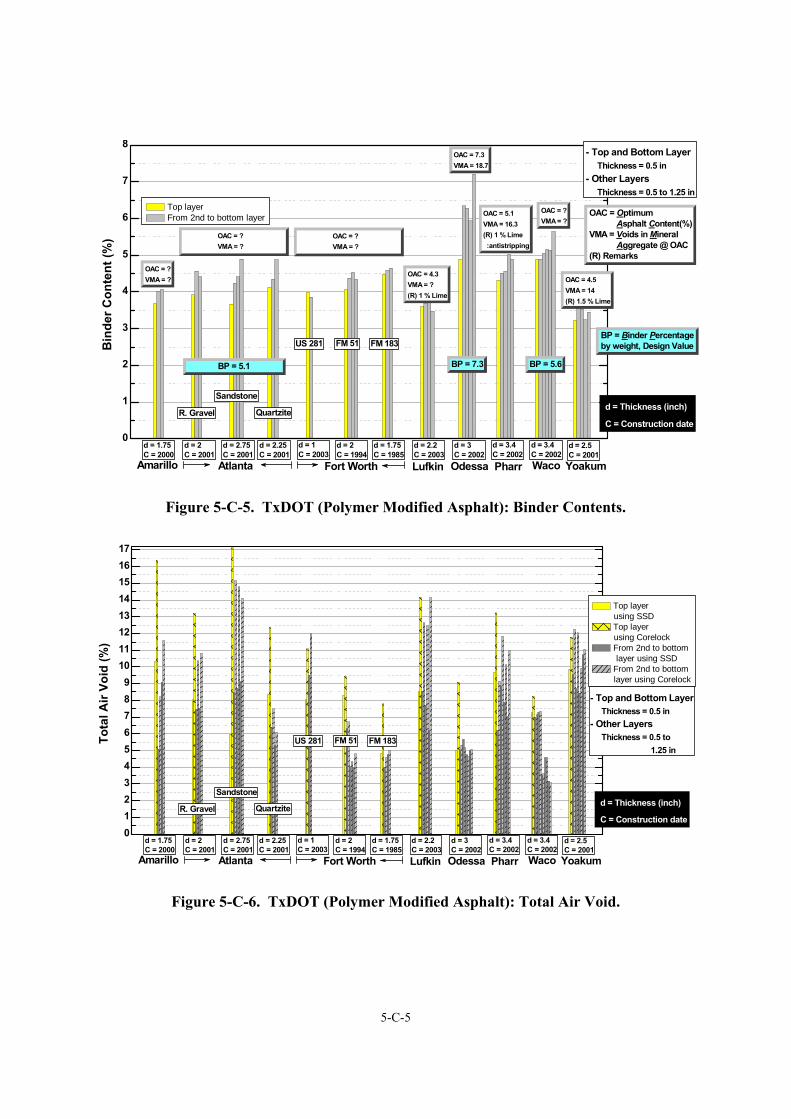
5-C-5
0
1
2
3
4
5
6
7
8
BP = Binder Percentageby weight, Design Value
OAC = ?VMA = ?
BP = 5.6
OAC = ? VMA = ?
OAC = ? VMA = ?
OAC = ?VMA = ? OAC = 4.5
VMA = 14(R) 1.5 % Lime
OAC = 4.3VMA = ?(R) 1 % Lime
OAC = 7.3VMA = 18.7
OAC = Optimum Asphalt Content(%)VMA = Voids in Mineral Aggregate @ OAC(R) Remarks
OAC = 5.1VMA = 16.3(R) 1 % Lime :antistripping
BP = 5.1 BP = 7.3
Bin
der C
onte
nt (%
)
Top layer From 2nd to bottom layer
- Top and Bottom Layer Thickness = 0.5 in- Other Layers Thickness = 0.5 to 1.25 in
Waco
d = 3.4 C = 2002
FM 51
d = 1.75 C = 1985
d = 2 C = 1994
FM 183US 281
Atlanta
d = 1.75 C = 2000
d = 2.25 C = 2001
Quartzite
Sandstone
R. Gravel
d = 2.75C = 2001
d = Thickness (inch)
C = Construction date
d = 2 C = 2001
Amarillo
d = 3 C = 2002
d = 2.5 C = 2001
Odessa Yoakum
d = 2.2 C = 2003Lufkin
d = 3.4 C = 2002Pharr
d = 1C = 2003
Fort Worth
Figure 5-C-5. TxDOT (Polymer Modified Asphalt): Binder Contents.
0123456789
1011121314151617
Tota
l Air
Void
(%)
Top layer
using SSD Top layer
using Corelock From 2nd to bottom
layer using SSD From 2nd to bottom
layer using Corelock
- Top and Bottom Layer Thickness = 0.5 in- Other Layers Thickness = 0.5 to 1.25 in
Waco
d = 3.4 C = 2002
FM 51
d = 1.75 C = 1985
d = 2 C = 1994
FM 183US 281
Atlanta
d = 1.75 C = 2000
d = 2.25 C = 2001
Quartzite
Sandstone
R. Gravel
d = 2.75C = 2001
d = Thickness (inch)
C = Construction date
d = 2 C = 2001
Amarillo
d = 3 C = 2002
d = 2.5 C = 2001
Odessa Yoakum
d = 2.2 C = 2003Lufkin
d = 3.4 C = 2002Pharr
d = 1C = 2003
Fort Worth
Figure 5-C-6. TxDOT (Polymer Modified Asphalt): Total Air Void.
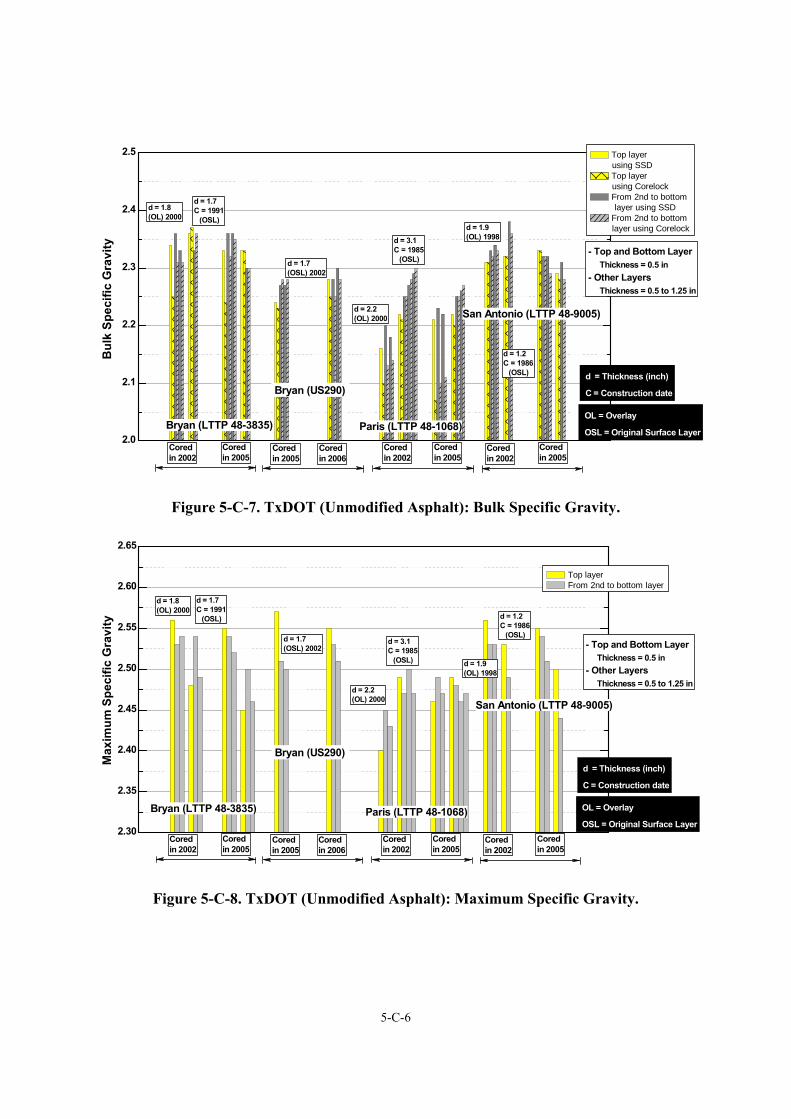
5-C-6
2.0
2.1
2.2
2.3
2.4
2.5
d = 1.7 (OSL) 2002
Bul
k Sp
ecifi
c G
ravi
ty
San Antonio (LTTP 48-9005)
Paris (LTTP 48-1068)
d = 3.1C = 1985 (OSL)
d = 2.2 (OL) 2000
d = 1.2 C = 1986 (OSL)
d = 1.9 (OL) 1998
Bryan (US290)
Cored in 2005
Cored in 2002
d = 1.7 C = 1991 (OSL)
d = 1.8 (OL) 2000
Bryan (LTTP 48-3835)OL = Overlay
OSL = Original Surface Layer
d = Thickness (inch)
C = Construction date
Cored in 2005
Cored in 2002
Cored in 2005
Cored in 2002
Top layer using SSD
Top layer using Corelock
From 2nd to bottom layer using SSD
From 2nd to bottom layer using Corelock
- Top and Bottom Layer Thickness = 0.5 in- Other Layers Thickness = 0.5 to 1.25 in
Cored in 2006
Cored in 2005
Figure 5-C-7. TxDOT (Unmodified Asphalt): Bulk Specific Gravity.
2.30
2.35
2.40
2.45
2.50
2.55
2.60
2.65
d = 1.7 (OSL) 2002
Bryan (US290)
Max
imum
Spe
cific
Gra
vity
Top layer From 2nd to bottom layer
San Antonio (LTTP 48-9005)
Paris (LTTP 48-1068)
d = 3.1C = 1985 (OSL)
d = 2.2 (OL) 2000
d = 1.2 C = 1986 (OSL)
d = 1.9 (OL) 1998
d = 1.7 C = 1991 (OSL)
d = 1.8 (OL) 2000
Bryan (LTTP 48-3835) OL = Overlay
OSL = Original Surface Layer
d = Thickness (inch)
C = Construction date
- Top and Bottom Layer Thickness = 0.5 in- Other Layers Thickness = 0.5 to 1.25 in
Cored in 2005
Cored in 2002
Cored in 2005
Cored in 2002
Cored in 2005
Cored in 2002
Cored in 2006
Cored in 2005
Figure 5-C-8. TxDOT (Unmodified Asphalt): Maximum Specific Gravity.
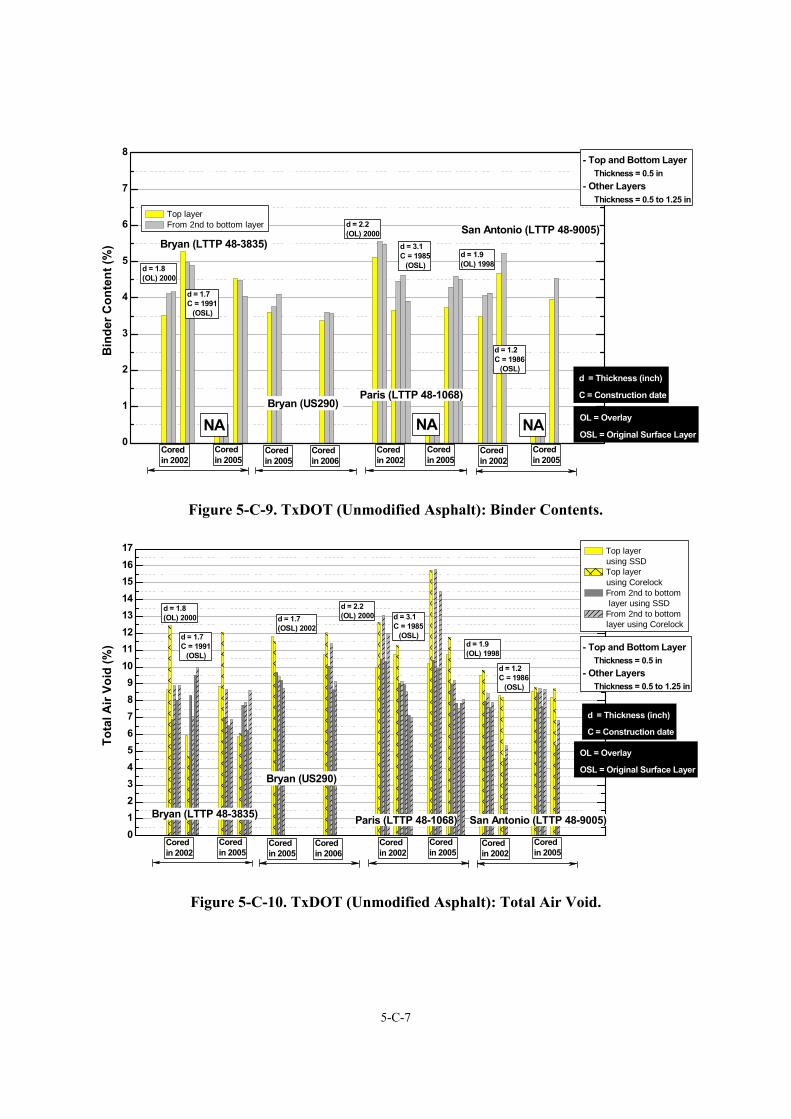
5-C-7
0
1
2
3
4
5
6
7
8
Bryan (US290)
NANA
Bin
der C
onte
nt (%
)
Top layer From 2nd to bottom layer
- Top and Bottom Layer Thickness = 0.5 in- Other Layers Thickness = 0.5 to 1.25 in
San Antonio (LTTP 48-9005)
Paris (LTTP 48-1068)
d = 3.1C = 1985 (OSL)
d = 2.2 (OL) 2000
d = 1.2 C = 1986 (OSL)
d = 1.9 (OL) 1998
d = 1.7 C = 1991 (OSL)
d = 1.8 (OL) 2000
Bryan (LTTP 48-3835)
OL = Overlay
OSL = Original Surface Layer
d = Thickness (inch)
C = Construction date
NACored in 2005
Cored in 2002
Cored in 2005
Cored in 2002
Cored in 2005
Cored in 2002
Cored in 2006
Cored in 2005
Figure 5-C-9. TxDOT (Unmodified Asphalt): Binder Contents.
0123456789
1011121314151617
Bryan (US290)
d = 1.7 (OSL) 2002
Tota
l Air
Void
(%)
San Antonio (LTTP 48-9005)Paris (LTTP 48-1068)
d = 3.1C = 1985 (OSL)
d = 2.2 (OL) 2000
d = 1.2 C = 1986 (OSL)
d = 1.9 (OL) 1998
d = 1.7 C = 1991 (OSL)
d = 1.8 (OL) 2000
Bryan (LTTP 48-3835)
OL = Overlay
OSL = Original Surface Layer
d = Thickness (inch)
C = Construction date
Top layer using SSD
Top layer using Corelock
From 2nd to bottom layer using SSD
From 2nd to bottom layer using Corelock
- Top and Bottom Layer Thickness = 0.5 in- Other Layers Thickness = 0.5 to 1.25 in
Cored in 2005
Cored in 2002
Cored in 2005
Cored in 2002
Cored in 2005
Cored in 2002
Cored in 2006
Cored in 2005
Figure 5-C-10. TxDOT (Unmodified Asphalt): Total Air Void.
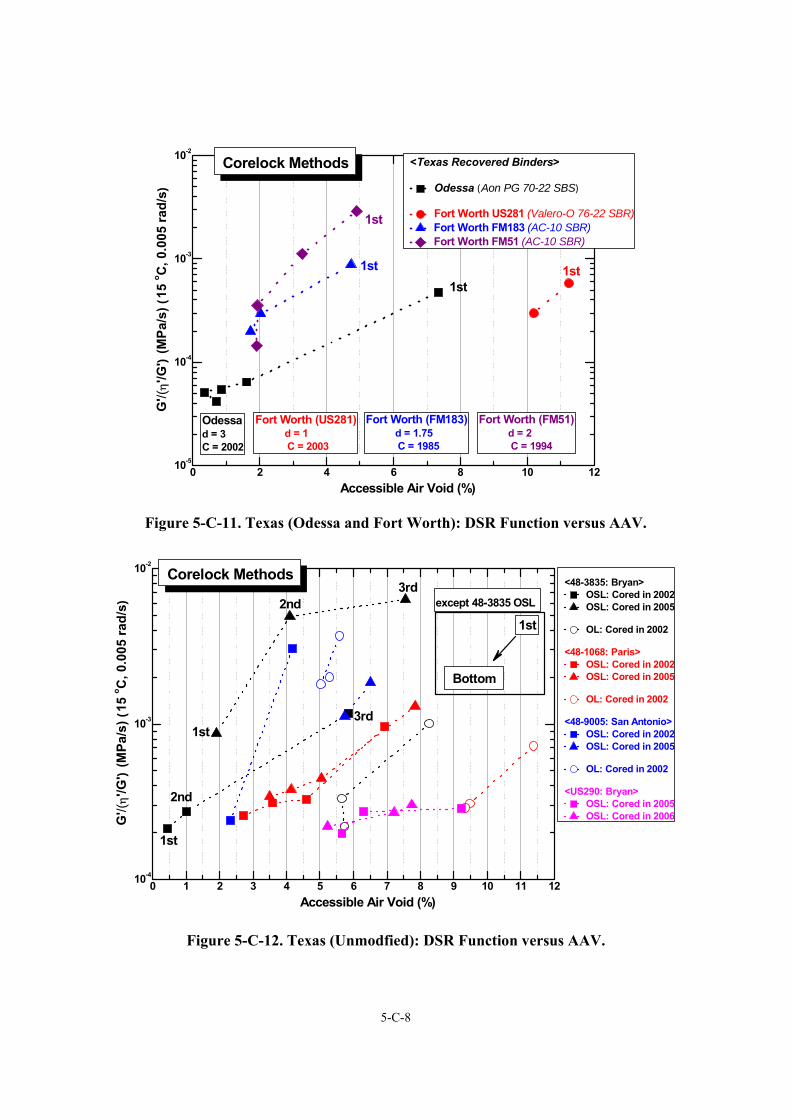
5-C-8
0 2 4 6 8 10 1210-5
10-4
10-3
10-2
Odessad = 3 C = 2002
1st
1st 1st
Corelock Methods <Texas Recovered Binders>
Odessa (Aon PG 70-22 SBS)
Fort Worth US281 (Valero-O 76-22 SBR) Fort Worth FM183 (AC-10 SBR) Fort Worth FM51 (AC-10 SBR)
G'/(
η'/G
') (M
Pa/s
) (15
o C, 0
.005
rad/
s)
Accessible Air Void (%)
1st
Fort Worth (FM183) d = 1.75 C = 1985
Fort Worth (FM51) d = 2 C = 1994
Fort Worth (US281) d = 1 C = 2003
Figure 5-C-11. Texas (Odessa and Fort Worth): DSR Function versus AAV.
0 1 2 3 4 5 6 7 8 9 10 11 1210-4
10-3
10-2
Corelock Methods3rd
3rd
2nd
2nd
1st
Bottom
1st
<48-3835: Bryan> OSL: Cored in 2002 OSL: Cored in 2005
OL: Cored in 2002
<48-1068: Paris> OSL: Cored in 2002 OSL: Cored in 2005
OL: Cored in 2002
<48-9005: San Antonio> OSL: Cored in 2002 OSL: Cored in 2005
OL: Cored in 2002
<US290: Bryan> OSL: Cored in 2005 OSL: Cored in 2006
G'/(
η'/G
') (M
Pa/s
) (15
o C, 0
.005
rad/
s)
Accessible Air Void (%)
1st
except 48-3835 OSL
Figure 5-C-12. Texas (Unmodfied): DSR Function versus AAV.
5-D-1
APPENDICES FOR CHAPTER 5
APPENDIX 5-D
FIGURES OF AGING PATH DATA

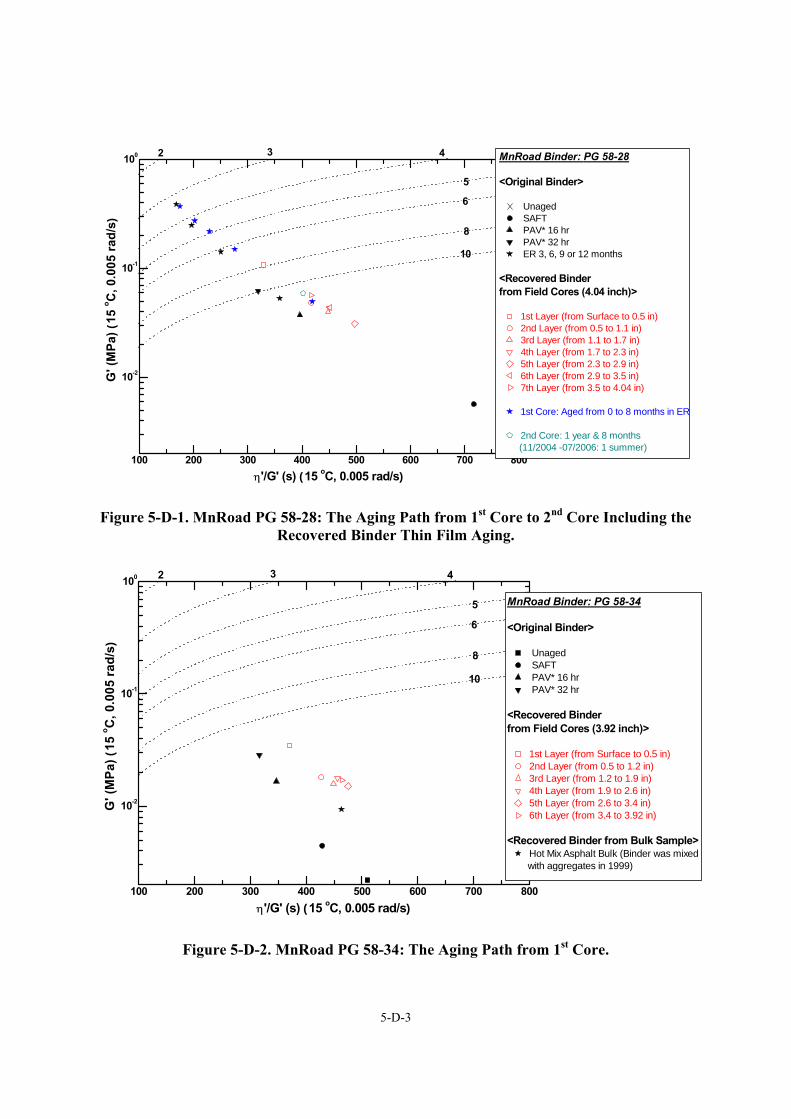
5-D-3
100 200 300 400 500 600 700 800
10-2
10-1
100 MnRoad Binder: PG 58-28
<Original Binder>
Unaged SAFT PAV* 16 hr PAV* 32 hr ER 3, 6, 9 or 12 months
<Recovered Binder from Field Cores (4.04 inch)>
1st Layer (from Surface to 0.5 in)2nd Layer (from 0.5 to 1.1 in)3rd Layer (from 1.1 to 1.7 in)4th Layer (from 1.7 to 2.3 in)5th Layer (from 2.3 to 2.9 in)6th Layer (from 2.9 to 3.5 in)7th Layer (from 3.5 to 4.04 in)
1st Core: Aged from 0 to 8 months in ER
2nd Core: 1 year & 8 months (11/2004 -07/2006: 1 summer)
G' (
MPa
) (15
o C, 0
.005
rad/
s)
η'/G' (s) (15 oC, 0.005 rad/s)
8
10
5
6
3 42
Figure 5-D-1. MnRoad PG 58-28: The Aging Path from 1st Core to 2nd Core Including the
Recovered Binder Thin Film Aging.
100 200 300 400 500 600 700 800
10-2
10-1
100
MnRoad Binder: PG 58-34
<Original Binder>
Unaged SAFT PAV* 16 hr PAV* 32 hr
<Recovered Binder from Field Cores (3.92 inch)>
1st Layer (from Surface to 0.5 in)2nd Layer (from 0.5 to 1.2 in)3rd Layer (from 1.2 to 1.9 in)4th Layer (from 1.9 to 2.6 in)5th Layer (from 2.6 to 3.4 in)6th Layer (from 3.4 to 3.92 in)
<Recovered Binder from Bulk Sample>Hot Mix Asphalt Bulk (Binder was mixed
with aggregates in 1999)
G' (
MPa
) (15
o C, 0
.005
rad/
s)
η'/G' (s) (15 oC, 0.005 rad/s)
8
10
5
6
3 42
Figure 5-D-2. MnRoad PG 58-34: The Aging Path from 1st Core.
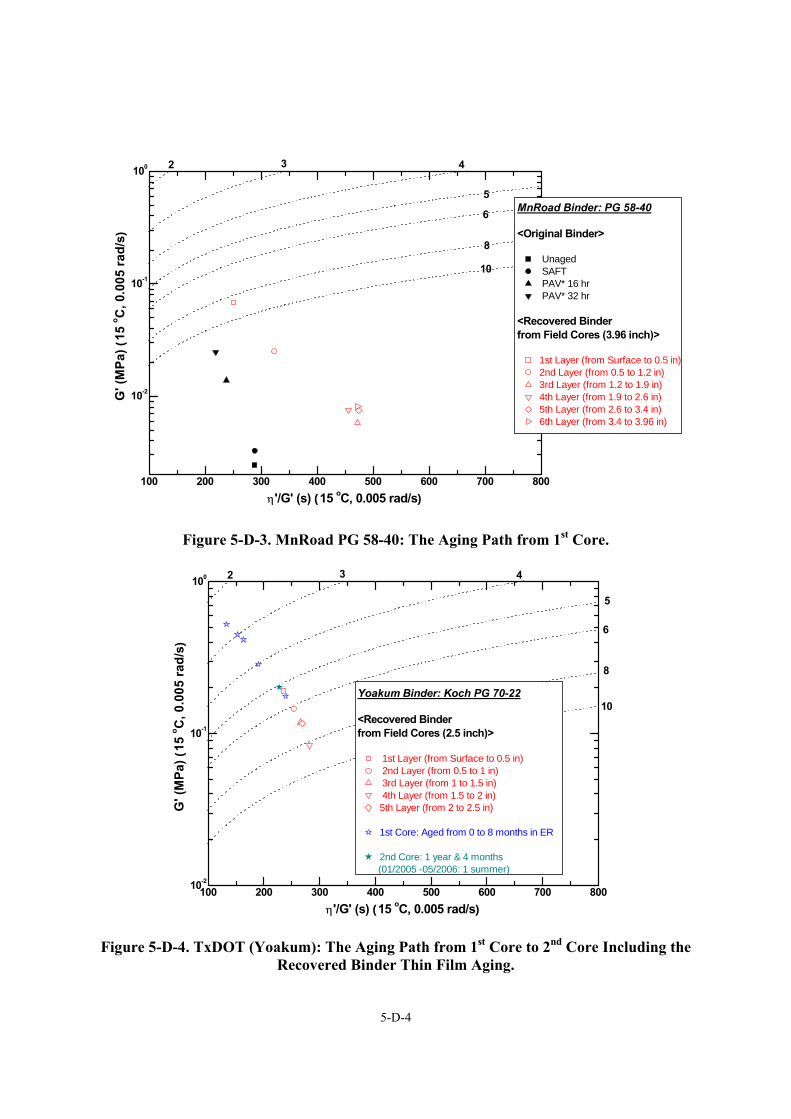
5-D-4
100 200 300 400 500 600 700 800
10-2
10-1
100
MnRoad Binder: PG 58-40
<Original Binder>
Unaged SAFT PAV* 16 hr PAV* 32 hr
<Recovered Binder from Field Cores (3.96 inch)>
1st Layer (from Surface to 0.5 in)2nd Layer (from 0.5 to 1.2 in)3rd Layer (from 1.2 to 1.9 in)4th Layer (from 1.9 to 2.6 in)5th Layer (from 2.6 to 3.4 in)6th Layer (from 3.4 to 3.96 in)
G' (
MPa
) (15
o C, 0
.005
rad/
s)
η'/G' (s) (15 oC, 0.005 rad/s)
8
10
5
6
3 42
Figure 5-D-3. MnRoad PG 58-40: The Aging Path from 1st Core.
100 200 300 400 500 600 700 80010-2
10-1
100
Yoakum Binder: Koch PG 70-22
<Recovered Binder from Field Cores (2.5 inch)>
1st Layer (from Surface to 0.5 in) 2nd Layer (from 0.5 to 1 in) 3rd Layer (from 1 to 1.5 in) 4th Layer (from 1.5 to 2 in)5th Layer (from 2 to 2.5 in)
1st Core: Aged from 0 to 8 months in ER
2nd Core: 1 year & 4 months (01/2005 -05/2006: 1 summer)
G' (
MPa
) (15
o C, 0
.005
rad/
s)
η'/G' (s) (15 oC, 0.005 rad/s)
8
10
5
6
3 42
Figure 5-D-4. TxDOT (Yoakum): The Aging Path from 1st Core to 2nd Core Including the
Recovered Binder Thin Film Aging.
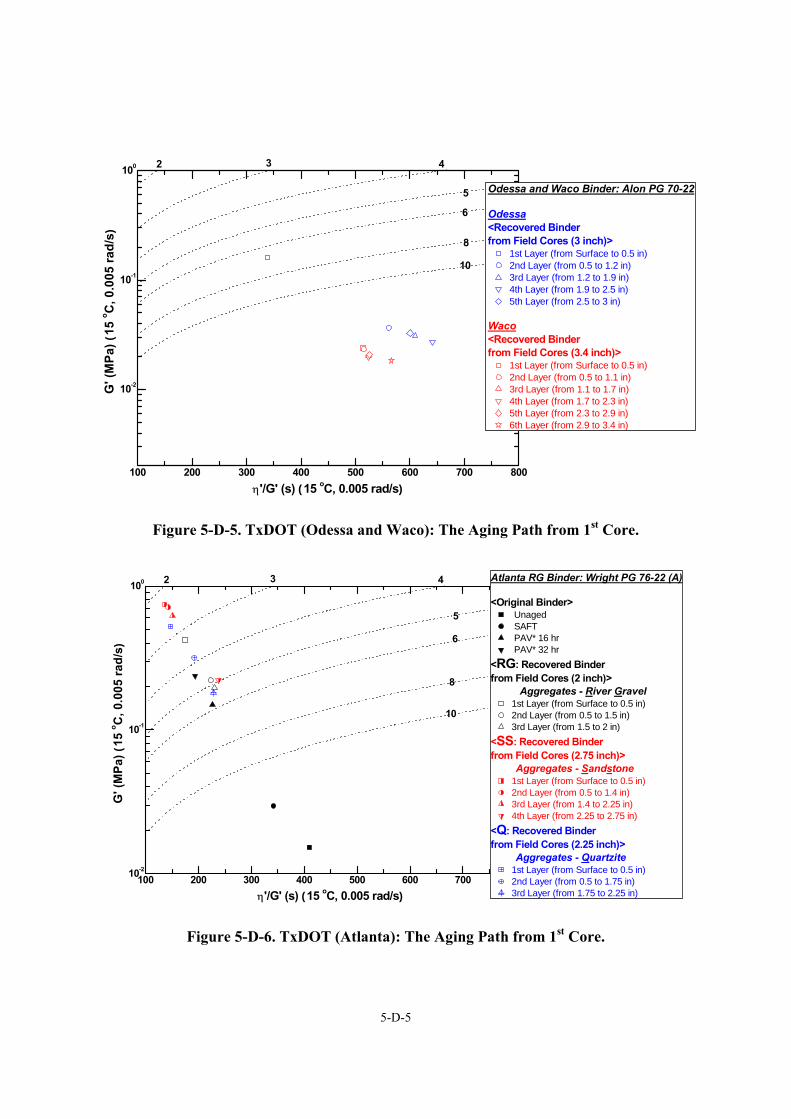
5-D-5
100 200 300 400 500 600 700 800
10-2
10-1
100
Odessa and Waco Binder: Alon PG 70-22
Odessa<Recovered Binder from Field Cores (3 inch)>
1st Layer (from Surface to 0.5 in)2nd Layer (from 0.5 to 1.2 in)3rd Layer (from 1.2 to 1.9 in)4th Layer (from 1.9 to 2.5 in)5th Layer (from 2.5 to 3 in)
Waco<Recovered Binder from Field Cores (3.4 inch)>
1st Layer (from Surface to 0.5 in)2nd Layer (from 0.5 to 1.1 in)3rd Layer (from 1.1 to 1.7 in)4th Layer (from 1.7 to 2.3 in)5th Layer (from 2.3 to 2.9 in)6th Layer (from 2.9 to 3.4 in)
G' (
MPa
) (15
o C, 0
.005
rad/
s)
η'/G' (s) (15 oC, 0.005 rad/s)
8
10
5
6
3 42
Figure 5-D-5. TxDOT (Odessa and Waco): The Aging Path from 1st Core.
100 200 300 400 500 600 700 80010-2
10-1
100 Atlanta RG Binder: Wright PG 76-22 (A)
<Original Binder> Unaged SAFT PAV* 16 hr PAV* 32 hr
<RG: Recovered Binder from Field Cores (2 inch)> Aggregates - River Gravel
1st Layer (from Surface to 0.5 in)2nd Layer (from 0.5 to 1.5 in)3rd Layer (from 1.5 to 2 in)
<SS: Recovered Binder from Field Cores (2.75 inch)> Aggregates - Sandstone
1st Layer (from Surface to 0.5 in)2nd Layer (from 0.5 to 1.4 in)3rd Layer (from 1.4 to 2.25 in)4th Layer (from 2.25 to 2.75 in)
<Q: Recovered Binder from Field Cores (2.25 inch)> Aggregates - Quartzite
1st Layer (from Surface to 0.5 in)2nd Layer (from 0.5 to 1.75 in)3rd Layer (from 1.75 to 2.25 in)
G' (
MPa
) (15
o C, 0
.005
rad/
s)
η'/G' (s) (15 oC, 0.005 rad/s)
8
10
5
6
3 42
Figure 5-D-6. TxDOT (Atlanta): The Aging Path from 1st Core.
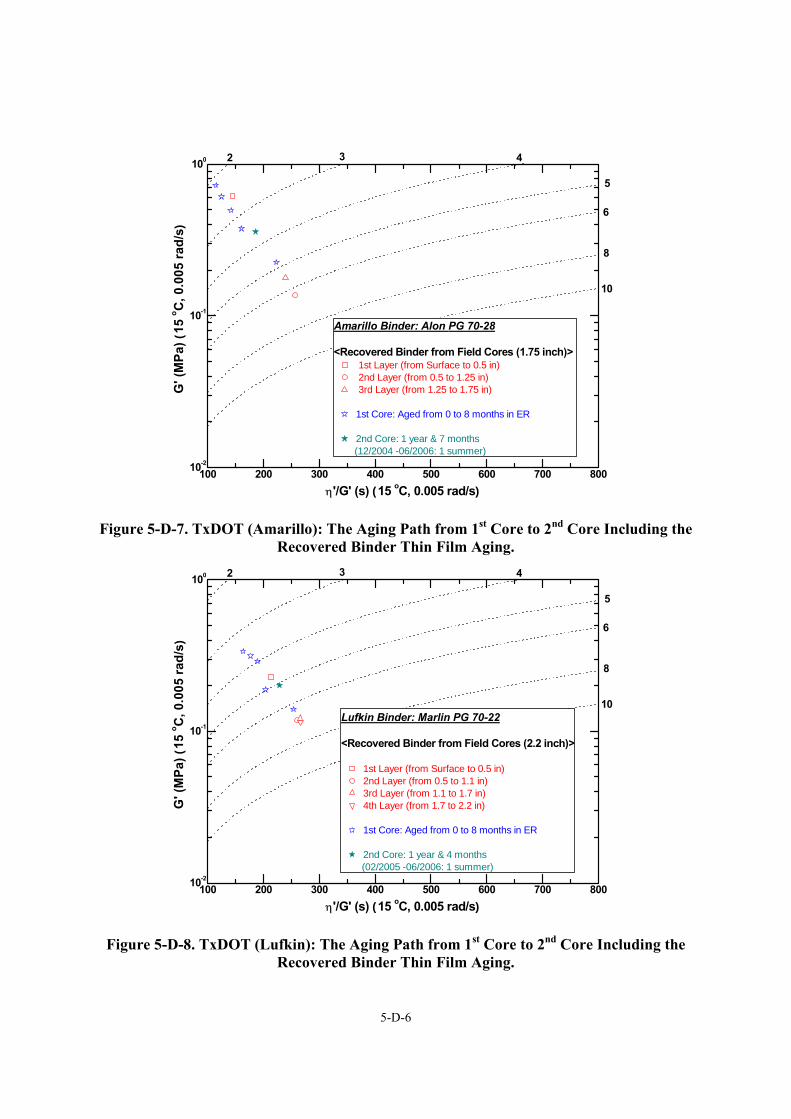
5-D-6
100 200 300 400 500 600 700 80010-2
10-1
100
Amarillo Binder: Alon PG 70-28
<Recovered Binder from Field Cores (1.75 inch)> 1st Layer (from Surface to 0.5 in) 2nd Layer (from 0.5 to 1.25 in) 3rd Layer (from 1.25 to 1.75 in)
1st Core: Aged from 0 to 8 months in ER
2nd Core: 1 year & 7 months (12/2004 -06/2006: 1 summer)
G' (
MPa
) (15
o C, 0
.005
rad/
s)
η'/G' (s) (15 oC, 0.005 rad/s)
3 42
8
10
5
6
Figure 5-D-7. TxDOT (Amarillo): The Aging Path from 1st Core to 2nd Core Including the Recovered Binder Thin Film Aging.
100 200 300 400 500 600 700 80010-2
10-1
100
Lufkin Binder: Marlin PG 70-22
<Recovered Binder from Field Cores (2.2 inch)>
1st Layer (from Surface to 0.5 in)2nd Layer (from 0.5 to 1.1 in)3rd Layer (from 1.1 to 1.7 in)4th Layer (from 1.7 to 2.2 in)
1st Core: Aged from 0 to 8 months in ER
2nd Core: 1 year & 4 months (02/2005 -06/2006: 1 summer)
G' (
MPa
) (15
o C, 0
.005
rad/
s)
η'/G' (s) (15 oC, 0.005 rad/s)
3 42
8
10
5
6
Figure 5-D-8. TxDOT (Lufkin): The Aging Path from 1st Core to 2nd Core Including the Recovered Binder Thin Film Aging.
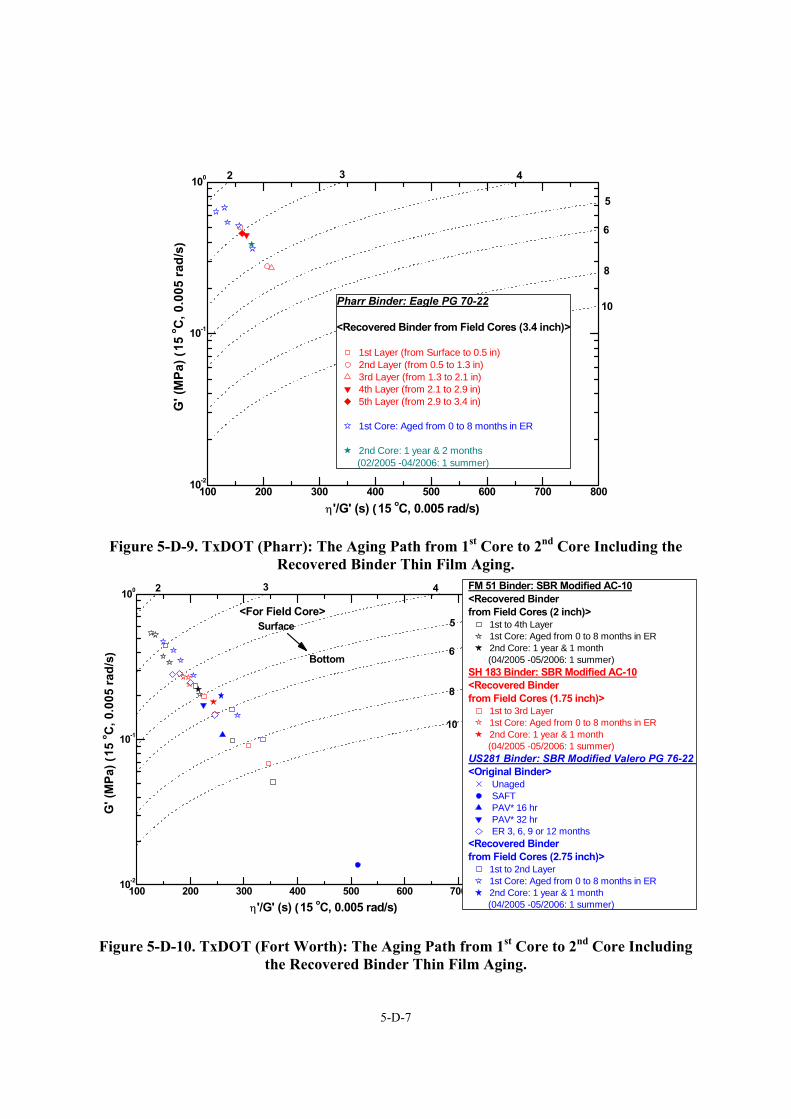
5-D-7
100 200 300 400 500 600 700 80010-2
10-1
100
Pharr Binder: Eagle PG 70-22
<Recovered Binder from Field Cores (3.4 inch)>
1st Layer (from Surface to 0.5 in)2nd Layer (from 0.5 to 1.3 in)3rd Layer (from 1.3 to 2.1 in)4th Layer (from 2.1 to 2.9 in)5th Layer (from 2.9 to 3.4 in)
1st Core: Aged from 0 to 8 months in ER
2nd Core: 1 year & 2 months (02/2005 -04/2006: 1 summer)
G' (
MPa
) (15
o C, 0
.005
rad/
s)
η'/G' (s) (15 oC, 0.005 rad/s)
3 42
8
10
5
6
Figure 5-D-9. TxDOT (Pharr): The Aging Path from 1st Core to 2nd Core Including the Recovered Binder Thin Film Aging.
100 200 300 400 500 600 700 80010-2
10-1
100
Bottom
FM 51 Binder: SBR Modified AC-10<Recovered Binder from Field Cores (2 inch)>
1st to 4th Layer1st Core: Aged from 0 to 8 months in ER2nd Core: 1 year & 1 month
(04/2005 -05/2006: 1 summer)SH 183 Binder: SBR Modified AC-10<Recovered Binder from Field Cores (1.75 inch)>
1st to 3rd Layer1st Core: Aged from 0 to 8 months in ER2nd Core: 1 year & 1 month
(04/2005 -05/2006: 1 summer)US281 Binder: SBR Modified Valero PG 76-22 <Original Binder>
Unaged SAFT PAV* 16 hr PAV* 32 hr ER 3, 6, 9 or 12 months
<Recovered Binder from Field Cores (2.75 inch)>
1st to 2nd Layer1st Core: Aged from 0 to 8 months in ER2nd Core: 1 year & 1 month
(04/2005 -05/2006: 1 summer)
G' (
MPa
) (15
o C, 0
.005
rad/
s)
η'/G' (s) (15 oC, 0.005 rad/s)
8
10
5
6
3 42
Surface <For Field Core>
Figure 5-D-10. TxDOT (Fort Worth): The Aging Path from 1st Core to 2nd Core Including
the Recovered Binder Thin Film Aging.
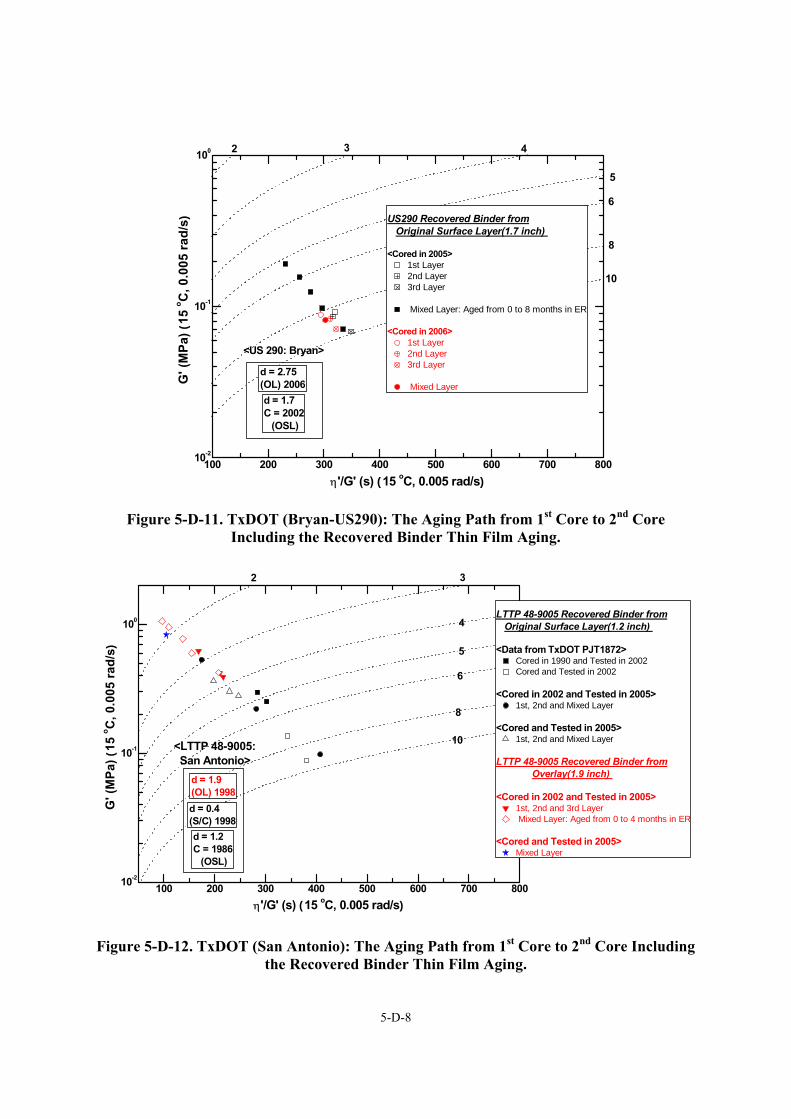
5-D-8
100 200 300 400 500 600 700 80010-2
10-1
100
US290 Recovered Binder from Original Surface Layer(1.7 inch)
<Cored in 2005>1st Layer2nd Layer3rd Layer
Mixed Layer: Aged from 0 to 8 months in ER
<Cored in 2006>1st Layer2nd Layer3rd Layer
Mixed Layer
G' (
MPa
) (15
o C, 0
.005
rad/
s)
η'/G' (s) (15 oC, 0.005 rad/s)
8
10
5
6
3 42
<US 290: Bryan>
d = 1.7 C = 2002 (OSL)
d = 2.75 (OL) 2006
Figure 5-D-11. TxDOT (Bryan-US290): The Aging Path from 1st Core to 2nd Core Including the Recovered Binder Thin Film Aging.
100 200 300 400 500 600 700 80010-2
10-1
100LTTP 48-9005 Recovered Binder from Original Surface Layer(1.2 inch)
<Data from TxDOT PJT1872>Cored in 1990 and Tested in 2002Cored and Tested in 2002
<Cored in 2002 and Tested in 2005>1st, 2nd and Mixed Layer
<Cored and Tested in 2005>1st, 2nd and Mixed Layer
LTTP 48-9005 Recovered Binder from Overlay(1.9 inch)
<Cored in 2002 and Tested in 2005>1st, 2nd and 3rd Layer Mixed Layer: Aged from 0 to 4 months in ER
<Cored and Tested in 2005>Mixed Layer
G' (
MPa
) (15
o C, 0
.005
rad/
s)
η'/G' (s) (15 oC, 0.005 rad/s)
8
10
5
6
3
4
2
d = 0.4(S/C) 1998d = 1.2 C = 1986 (OSL)
d = 1.9 (OL) 1998
<LTTP 48-9005: San Antonio>
Figure 5-D-12. TxDOT (San Antonio): The Aging Path from 1st Core to 2nd Core Including
the Recovered Binder Thin Film Aging.
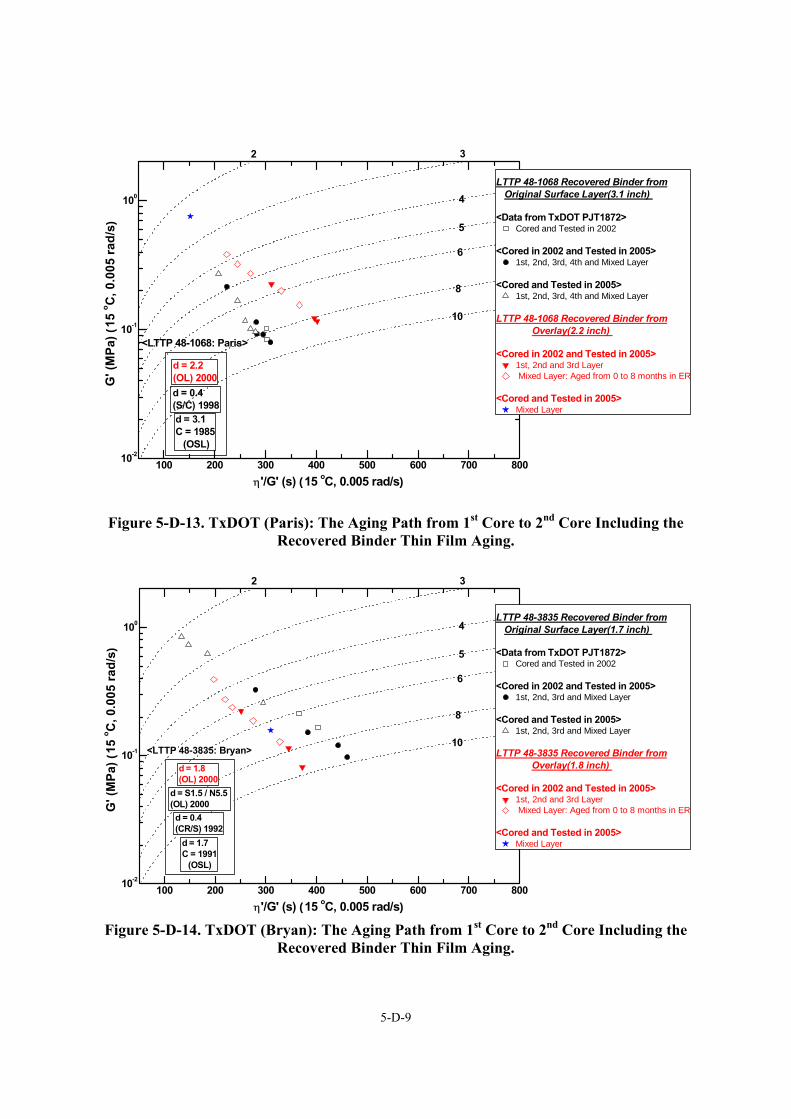
5-D-9
100 200 300 400 500 600 700 80010-2
10-1
100
LTTP 48-1068 Recovered Binder from Original Surface Layer(3.1 inch)
<Data from TxDOT PJT1872>Cored and Tested in 2002
<Cored in 2002 and Tested in 2005>1st, 2nd, 3rd, 4th and Mixed Layer
<Cored and Tested in 2005>1st, 2nd, 3rd, 4th and Mixed Layer
LTTP 48-1068 Recovered Binder from Overlay(2.2 inch)
<Cored in 2002 and Tested in 2005>1st, 2nd and 3rd Layer Mixed Layer: Aged from 0 to 8 months in ER
<Cored and Tested in 2005>Mixed Layer
G' (
MPa
) (15
o C, 0
.005
rad/
s)
η'/G' (s) (15 oC, 0.005 rad/s)
8
10
5
6
3
4
2
d = 0.4(S/C) 1998d = 3.1 C = 1985 (OSL)
d = 2.2 (OL) 2000
<LTTP 48-1068: Paris>
Figure 5-D-13. TxDOT (Paris): The Aging Path from 1st Core to 2nd Core Including the Recovered Binder Thin Film Aging.
100 200 300 400 500 600 700 80010-2
10-1
100LTTP 48-3835 Recovered Binder from Original Surface Layer(1.7 inch)
<Data from TxDOT PJT1872>Cored and Tested in 2002
<Cored in 2002 and Tested in 2005>1st, 2nd, 3rd and Mixed Layer
<Cored and Tested in 2005>1st, 2nd, 3rd and Mixed Layer
LTTP 48-3835 Recovered Binder from Overlay(1.8 inch)
<Cored in 2002 and Tested in 2005>1st, 2nd and 3rd Layer Mixed Layer: Aged from 0 to 8 months in ER
<Cored and Tested in 2005>Mixed Layer
G' (
MPa
) (15
o C, 0
.005
rad/
s)
η'/G' (s) (15 oC, 0.005 rad/s)
8
10
5
6
3
4
2
<LTTP 48-3835: Bryan>
d = S1.5 / N5.5 (OL) 2000d = 0.4 (CR/S) 1992
d = 1.7 C = 1991 (OSL)
d = 1.8 (OL) 2000
Figure 5-D-14. TxDOT (Bryan): The Aging Path from 1st Core to 2nd Core Including the
Recovered Binder Thin Film Aging.
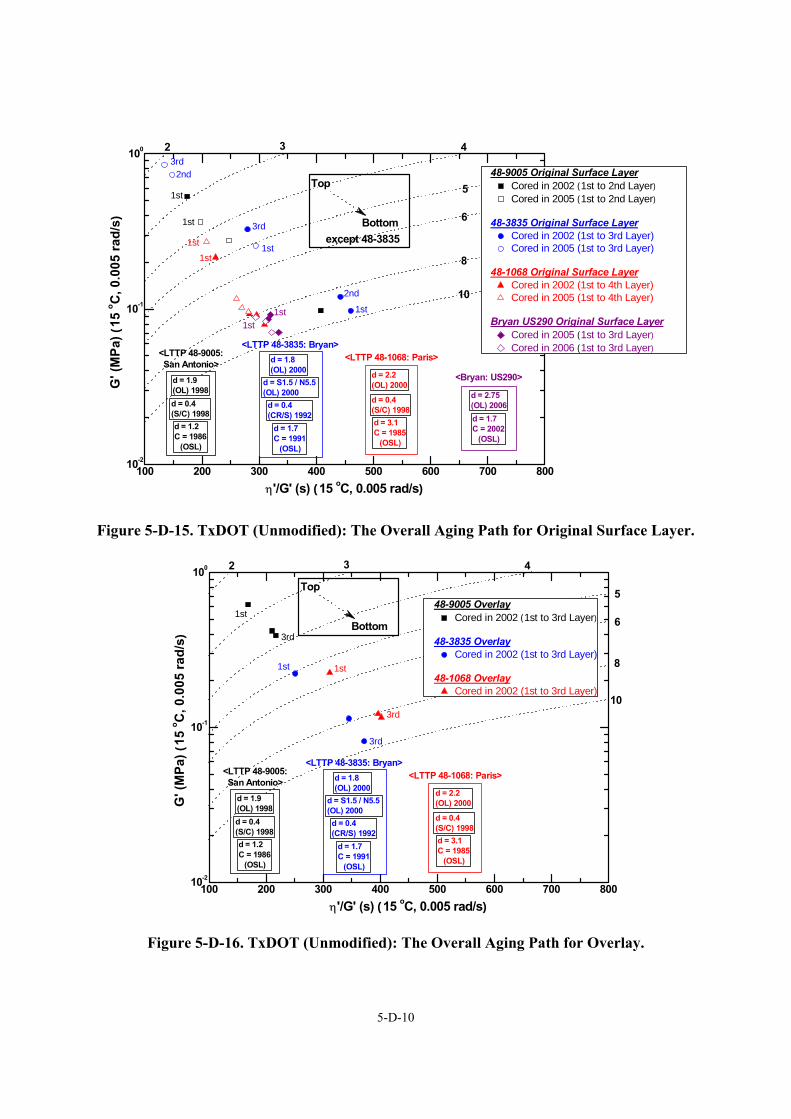
5-D-10
100 200 300 400 500 600 700 80010-2
10-1
100
1st
2nd
2nd
1st
1st
3rd
1st
1st
1st
1st
3rd
48-9005 Original Surface LayerCored in 2002 (1st to 2nd Layer)Cored in 2005 (1st to 2nd Layer)
48-3835 Original Surface LayerCored in 2002 (1st to 3rd Layer)Cored in 2005 (1st to 3rd Layer)
48-1068 Original Surface LayerCored in 2002 (1st to 4th Layer) Cored in 2005 (1st to 4th Layer)
Bryan US290 Original Surface Layer
Cored in 2005 (1st to 3rd Layer)Cored in 2006 (1st to 3rd Layer)
G' (
MPa
) (15
o C, 0
.005
rad/
s)
η'/G' (s) (15 oC, 0.005 rad/s)
8
10
5
6
3 42
<Bryan: US290>
d = 1.7 C = 2002 (OSL)
d = 2.75 (OL) 2006d = 0.4
(S/C) 1998d = 1.2 C = 1986 (OSL)
d = 1.9 (OL) 1998
<LTTP 48-9005: San Antonio>
<LTTP 48-3835: Bryan>
d = S1.5 / N5.5 (OL) 2000
d = 0.4 (CR/S) 1992
d = 1.7 C = 1991 (OSL)
d = 1.8 (OL) 2000
d = 0.4(S/C) 1998d = 3.1 C = 1985 (OSL)
d = 2.2 (OL) 2000
<LTTP 48-1068: Paris>
1st
Top
Bottom except 48-3835
Figure 5-D-15. TxDOT (Unmodified): The Overall Aging Path for Original Surface Layer.
100 200 300 400 500 600 700 80010-2
10-1
100
3rd
1st
3rd
1st
3rd
48-9005 OverlayCored in 2002 (1st to 3rd Layer)
48-3835 OverlayCored in 2002 (1st to 3rd Layer)
48-1068 OverlayCored in 2002 (1st to 3rd Layer)
G' (
MPa
) (15
o C, 0
.005
rad/
s)
η'/G' (s) (15 oC, 0.005 rad/s)
8
10
5
6
3 42
d = 0.4(S/C) 1998d = 1.2 C = 1986 (OSL)
d = 1.9 (OL) 1998
<LTTP 48-9005: San Antonio>
<LTTP 48-3835: Bryan>
d = S1.5 / N5.5 (OL) 2000d = 0.4 (CR/S) 1992
d = 1.7 C = 1991 (OSL)
d = 1.8 (OL) 2000
d = 0.4(S/C) 1998d = 3.1 C = 1985 (OSL)
d = 2.2 (OL) 2000
<LTTP 48-1068: Paris>
1st
Top
Bottom
Figure 5-D-16. TxDOT (Unmodified): The Overall Aging Path for Overlay.
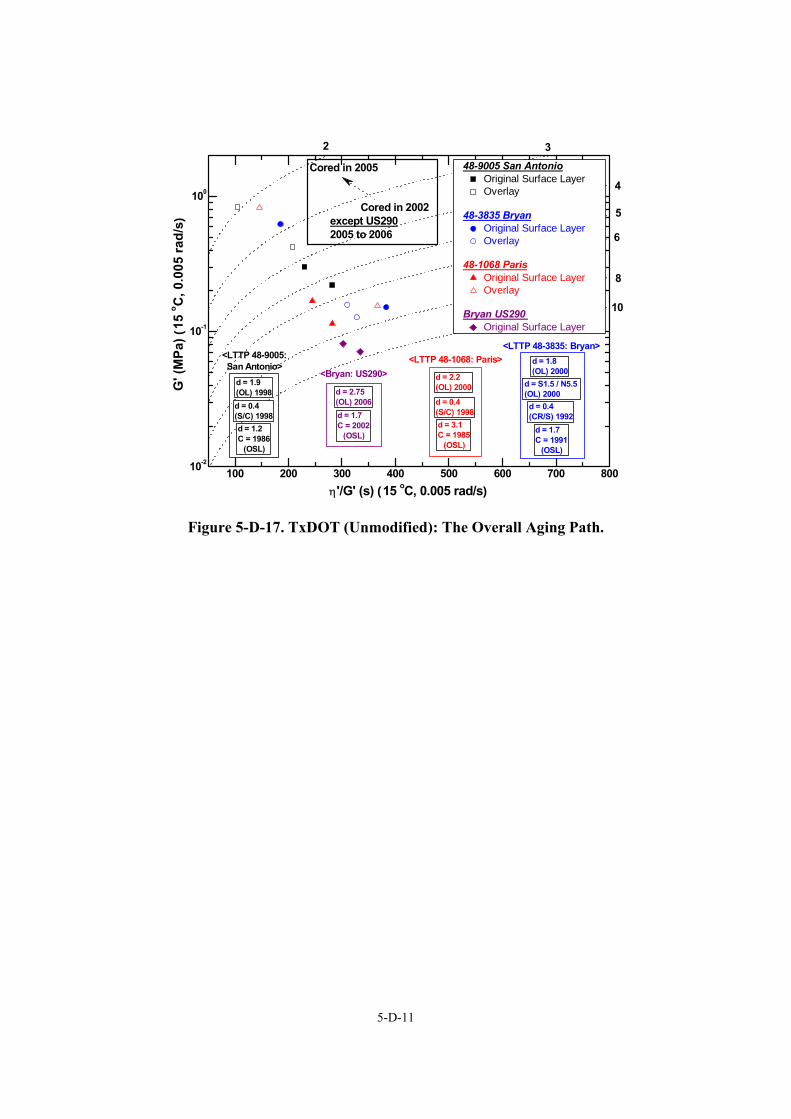
5-D-11
100 200 300 400 500 600 700 80010-2
10-1
100
except US2902005 to 2006
48-9005 San AntonioOriginal Surface LayerOverlay
48-3835 BryanOriginal Surface LayerOverlay
48-1068 ParisOriginal Surface Layer Overlay
Bryan US290 Original Surface Layer
G' (
MPa
) (15
o C, 0
.005
rad/
s)
η'/G' (s) (15 oC, 0.005 rad/s)
8
10
5
6
3
4
2
<Bryan: US290>
d = 1.7 C = 2002 (OSL)
d = 2.75 (OL) 2006d = 0.4
(S/C) 1998d = 1.2 C = 1986 (OSL)
d = 1.9 (OL) 1998
<LTTP 48-9005: San Antonio>
<LTTP 48-3835: Bryan>
d = S1.5 / N5.5 (OL) 2000d = 0.4 (CR/S) 1992
d = 1.7 C = 1991 (OSL)
d = 1.8 (OL) 2000
d = 0.4(S/C) 1998d = 3.1 C = 1985 (OSL)
d = 2.2 (OL) 2000
<LTTP 48-1068: Paris>
Cored in 2005
Cored in 2002
Figure 5-D-17. TxDOT (Unmodified): The Overall Aging Path.

5-E-1
APPENDICES FOR CHAPTER 5
APPENDIX 5-E
FIGURES OF HARDENING RATE DATA

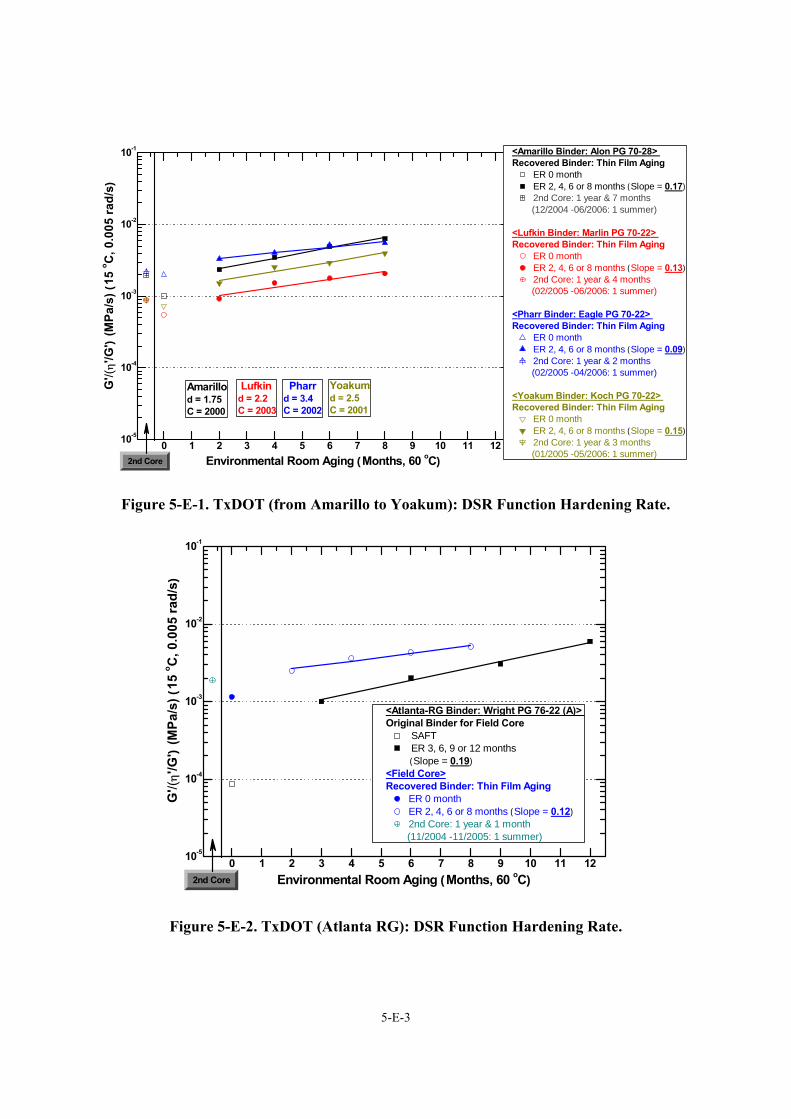
5-E-3
0 1 2 3 4 5 6 7 8 9 10 11 1210-5
10-4
10-3
10-2
10-1
Environmental Room Aging (Months, 60 oC)
<Amarillo Binder: Alon PG 70-28> Recovered Binder: Thin Film Aging
ER 0 monthER 2, 4, 6 or 8 months (Slope = 0.17)2nd Core: 1 year & 7 months
(12/2004 -06/2006: 1 summer)
<Lufkin Binder: Marlin PG 70-22> Recovered Binder: Thin Film Aging
ER 0 monthER 2, 4, 6 or 8 months (Slope = 0.13)2nd Core: 1 year & 4 months
(02/2005 -06/2006: 1 summer)
<Pharr Binder: Eagle PG 70-22> Recovered Binder: Thin Film Aging
ER 0 monthER 2, 4, 6 or 8 months (Slope = 0.09)2nd Core: 1 year & 2 months
(02/2005 -04/2006: 1 summer)
<Yoakum Binder: Koch PG 70-22> Recovered Binder: Thin Film Aging
ER 0 monthER 2, 4, 6 or 8 months (Slope = 0.15)2nd Core: 1 year & 3 months
(01/2005 -05/2006: 1 summer)
G'/(
η'/G
') (M
Pa/s
) (15
o C, 0
.005
rad/
s)
2nd Core
Pharrd = 3.4 C = 2002
Lufkind = 2.2 C = 2003
Amarillod = 1.75 C = 2000
Yoakumd = 2.5 C = 2001
Figure 5-E-1. TxDOT (from Amarillo to Yoakum): DSR Function Hardening Rate.
0 1 2 3 4 5 6 7 8 9 10 11 1210-5
10-4
10-3
10-2
10-1
Environmental Room Aging (Months, 60 oC)
<Atlanta-RG Binder: Wright PG 76-22 (A)> Original Binder for Field Core
SAFT ER 3, 6, 9 or 12 months
(Slope = 0.19)<Field Core>Recovered Binder: Thin Film Aging
ER 0 monthER 2, 4, 6 or 8 months (Slope = 0.12)2nd Core: 1 year & 1 month
(11/2004 -11/2005: 1 summer)
G'/(
η'/G
') (M
Pa/s
) (15
o C, 0
.005
rad/
s)
2nd Core
Figure 5-E-2. TxDOT (Atlanta RG): DSR Function Hardening Rate.
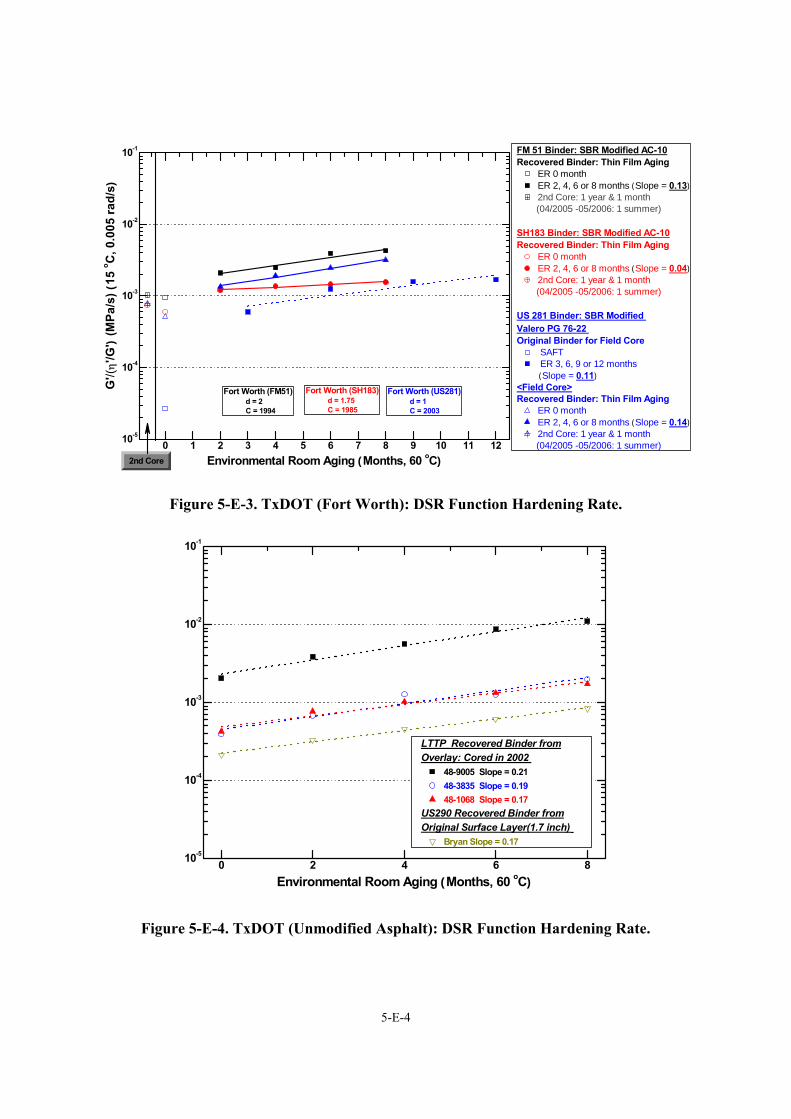
5-E-4
0 1 2 3 4 5 6 7 8 9 10 11 1210-5
10-4
10-3
10-2
10-1
Environmental Room Aging (Months, 60 oC)
FM 51 Binder: SBR Modified AC-10Recovered Binder: Thin Film Aging
ER 0 monthER 2, 4, 6 or 8 months (Slope = 0.13)2nd Core: 1 year & 1 month
(04/2005 -05/2006: 1 summer)
SH183 Binder: SBR Modified AC-10Recovered Binder: Thin Film Aging
ER 0 monthER 2, 4, 6 or 8 months (Slope = 0.04)2nd Core: 1 year & 1 month
(04/2005 -05/2006: 1 summer)
US 281 Binder: SBR Modified Valero PG 76-22 Original Binder for Field Core
SAFT ER 3, 6, 9 or 12 months
(Slope = 0.11)<Field Core>Recovered Binder: Thin Film Aging
ER 0 monthER 2, 4, 6 or 8 months (Slope = 0.14)2nd Core: 1 year & 1 month
(04/2005 -05/2006: 1 summer)
G'/(
η'/G
') (M
Pa/s
) (15
o C, 0
.005
rad/
s)
2nd Core
Fort Worth (SH183) d = 1.75 C = 1985
Fort Worth (FM51) d = 2 C = 1994
Fort Worth (US281) d = 1 C = 2003
Figure 5-E-3. TxDOT (Fort Worth): DSR Function Hardening Rate.
0 2 4 6 810-5
10-4
10-3
10-2
10-1
Environmental Room Aging (Months, 60 oC)
LTTP Recovered Binder fromOverlay: Cored in 2002
48-9005 Slope = 0.2148-3835 Slope = 0.1948-1068 Slope = 0.17
US290 Recovered Binder fromOriginal Surface Layer(1.7 inch)
Bryan Slope = 0.17
Figure 5-E-4. TxDOT (Unmodified Asphalt): DSR Function Hardening Rate.
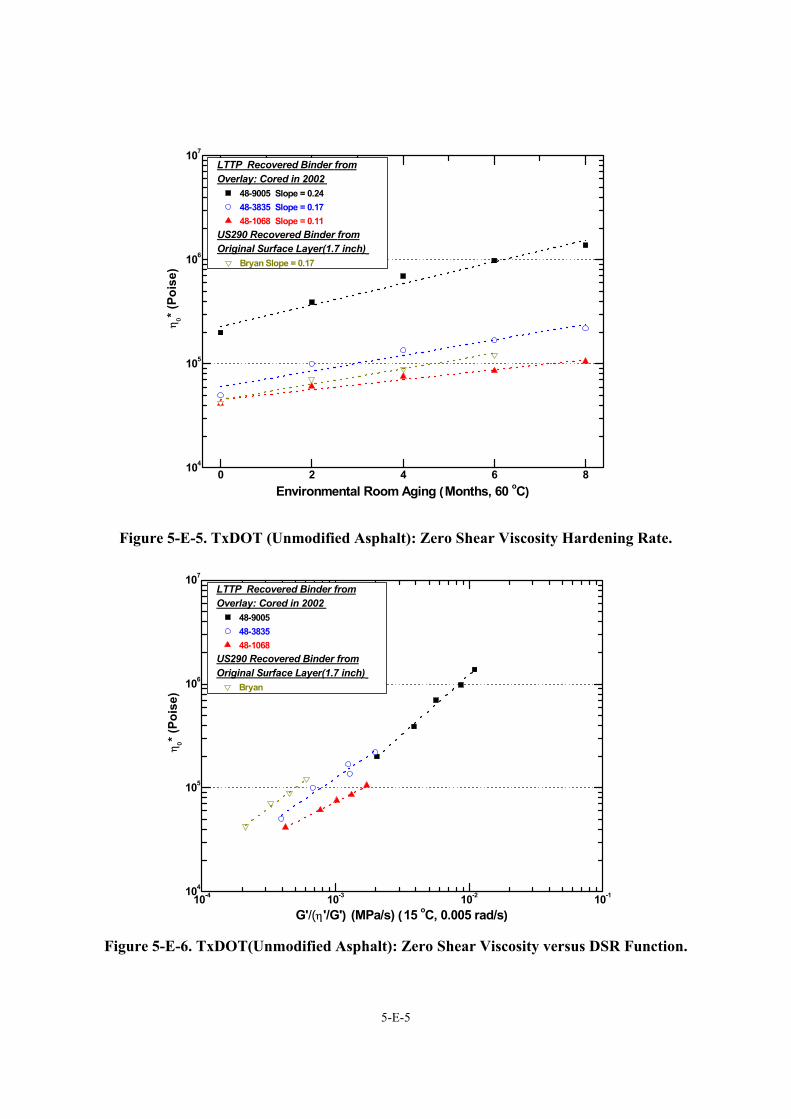
5-E-5
0 2 4 6 8104
105
106
107
LTTP Recovered Binder fromOverlay: Cored in 2002
48-9005 Slope = 0.2448-3835 Slope = 0.1748-1068 Slope = 0.11
US290 Recovered Binder fromOriginal Surface Layer(1.7 inch)
Bryan Slope = 0.17
η0* (
Pois
e)
Environmental Room Aging (Months, 60 oC)
Figure 5-E-5. TxDOT (Unmodified Asphalt): Zero Shear Viscosity Hardening Rate.
10-4 10-3 10-2 10-1104
105
106
107
LTTP Recovered Binder fromOverlay: Cored in 2002
48-900548-383548-1068
US290 Recovered Binder fromOriginal Surface Layer(1.7 inch)
Bryan
η0* (
Pois
e)
G'/(η'/G') (MPa/s) (15 oC, 0.005 rad/s)
Figure 5-E-6. TxDOT(Unmodified Asphalt): Zero Shear Viscosity versus DSR Function.


5-F-1
APPENDICES FOR CHAPTER 5
APPENDIX 5-F
FIGURES OF MASTER CURVE DATA

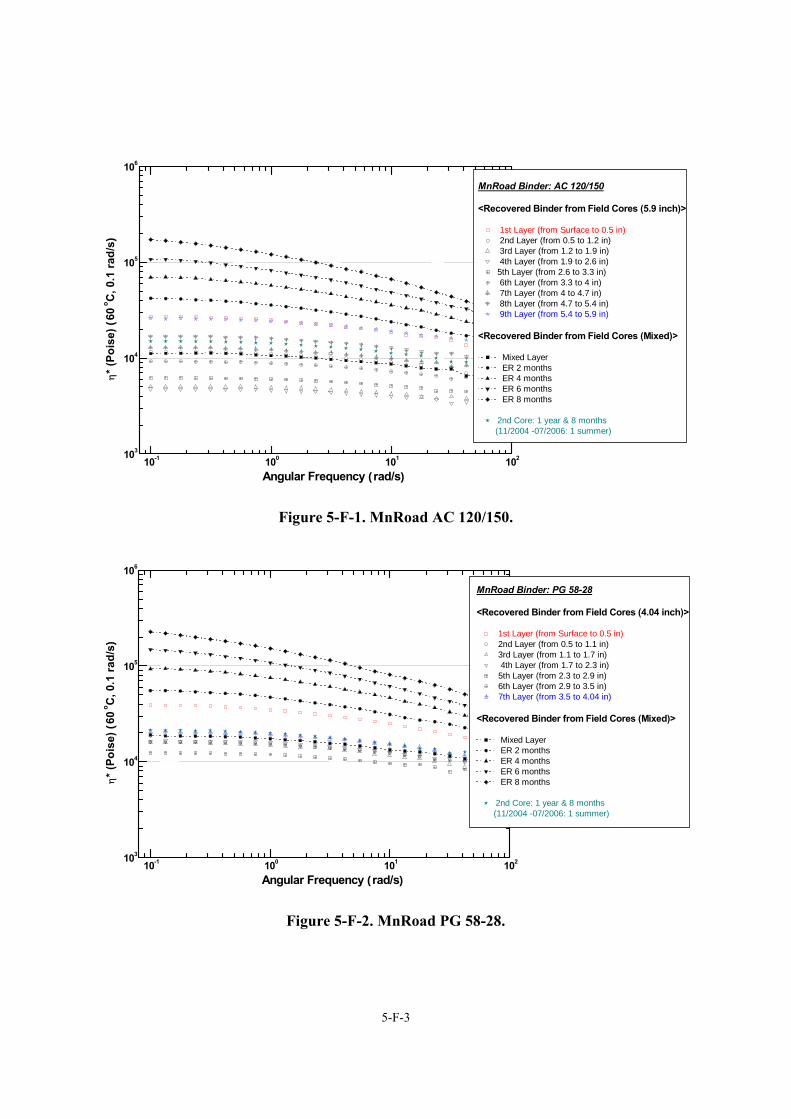
5-F-3
10-1 100 101 102103
104
105
106
Angular Frequency (rad/s)
η* (
Pois
e) (
60 o C
, 0.1
rad/
s)
MnRoad Binder: AC 120/150
<Recovered Binder from Field Cores (5.9 inch)>
1st Layer (from Surface to 0.5 in) 2nd Layer (from 0.5 to 1.2 in) 3rd Layer (from 1.2 to 1.9 in) 4th Layer (from 1.9 to 2.6 in)5th Layer (from 2.6 to 3.3 in) 6th Layer (from 3.3 to 4 in) 7th Layer (from 4 to 4.7 in) 8th Layer (from 4.7 to 5.4 in) 9th Layer (from 5.4 to 5.9 in)
<Recovered Binder from Field Cores (Mixed)>
Mixed Layer ER 2 months ER 4 months ER 6 months ER 8 months
2nd Core: 1 year & 8 months (11/2004 -07/2006: 1 summer)
Figure 5-F-1. MnRoad AC 120/150.
10-1 100 101 102103
104
105
106
Angular Frequency (rad/s)
η* (
Pois
e) (
60 o C
, 0.1
rad/
s)
MnRoad Binder: PG 58-28
<Recovered Binder from Field Cores (4.04 inch)>
1st Layer (from Surface to 0.5 in) 2nd Layer (from 0.5 to 1.1 in) 3rd Layer (from 1.1 to 1.7 in) 4th Layer (from 1.7 to 2.3 in) 5th Layer (from 2.3 to 2.9 in) 6th Layer (from 2.9 to 3.5 in) 7th Layer (from 3.5 to 4.04 in)
<Recovered Binder from Field Cores (Mixed)>
Mixed Layer ER 2 months ER 4 months ER 6 months ER 8 months
2nd Core: 1 year & 8 months (11/2004 -07/2006: 1 summer)
Figure 5-F-2. MnRoad PG 58-28.
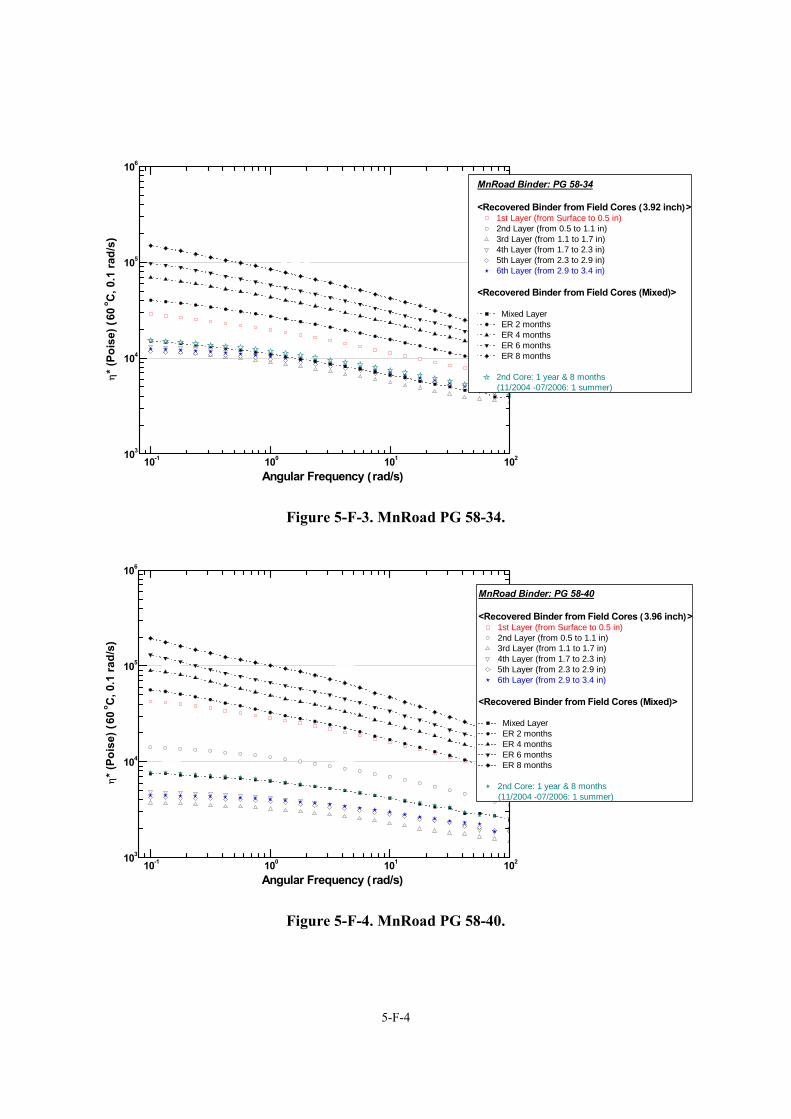
5-F-4
10-1 100 101 102103
104
105
106
Angular Frequency (rad/s)
η* (
Pois
e) (
60 o C
, 0.1
rad/
s)
MnRoad Binder: PG 58-34
<Recovered Binder from Field Cores (3.92 inch)>1st Layer (from Surface to 0.5 in)2nd Layer (from 0.5 to 1.1 in)3rd Layer (from 1.1 to 1.7 in)4th Layer (from 1.7 to 2.3 in)5th Layer (from 2.3 to 2.9 in)6th Layer (from 2.9 to 3.4 in)
<Recovered Binder from Field Cores (Mixed)>
Mixed Layer ER 2 months ER 4 months ER 6 months ER 8 months
2nd Core: 1 year & 8 months (11/2004 -07/2006: 1 summer)
Figure 5-F-3. MnRoad PG 58-34.
10-1 100 101 102103
104
105
106
Angular Frequency (rad/s)
η* (
Pois
e) (
60 o C
, 0.1
rad/
s)
MnRoad Binder: PG 58-40
<Recovered Binder from Field Cores (3.96 inch)>1st Layer (from Surface to 0.5 in)2nd Layer (from 0.5 to 1.1 in)3rd Layer (from 1.1 to 1.7 in)4th Layer (from 1.7 to 2.3 in)5th Layer (from 2.3 to 2.9 in)6th Layer (from 2.9 to 3.4 in)
<Recovered Binder from Field Cores (Mixed)>
Mixed Layer ER 2 months ER 4 months ER 6 months ER 8 months
2nd Core: 1 year & 8 months (11/2004 -07/2006: 1 summer)
Figure 5-F-4. MnRoad PG 58-40.
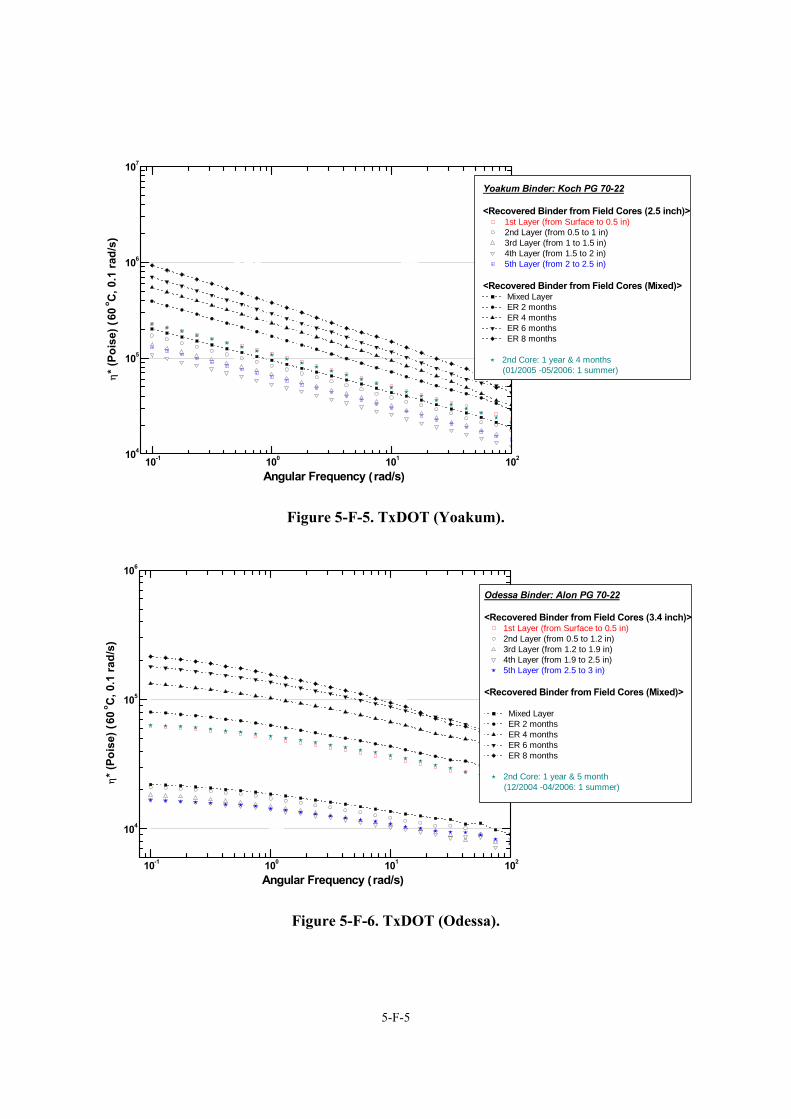
5-F-5
10-1 100 101 102104
105
106
107
Angular Frequency (rad/s)
η* (
Pois
e) (
60 o C
, 0.1
rad/
s)
Yoakum Binder: Koch PG 70-22
<Recovered Binder from Field Cores (2.5 inch)> 1st Layer (from Surface to 0.5 in) 2nd Layer (from 0.5 to 1 in) 3rd Layer (from 1 to 1.5 in) 4th Layer (from 1.5 to 2 in) 5th Layer (from 2 to 2.5 in)
<Recovered Binder from Field Cores (Mixed)> Mixed Layer ER 2 months ER 4 months ER 6 months ER 8 months
2nd Core: 1 year & 4 months (01/2005 -05/2006: 1 summer)
Figure 5-F-5. TxDOT (Yoakum).
10-1 100 101 102
104
105
106
Angular Frequency (rad/s)
η* (
Pois
e) (
60 o C
, 0.1
rad/
s)
Odessa Binder: Alon PG 70-22
<Recovered Binder from Field Cores (3.4 inch)>1st Layer (from Surface to 0.5 in)2nd Layer (from 0.5 to 1.2 in)3rd Layer (from 1.2 to 1.9 in)4th Layer (from 1.9 to 2.5 in)5th Layer (from 2.5 to 3 in)
<Recovered Binder from Field Cores (Mixed)>
Mixed Layer ER 2 months ER 4 months ER 6 months ER 8 months
2nd Core: 1 year & 5 month (12/2004 -04/2006: 1 summer)
Figure 5-F-6. TxDOT (Odessa).
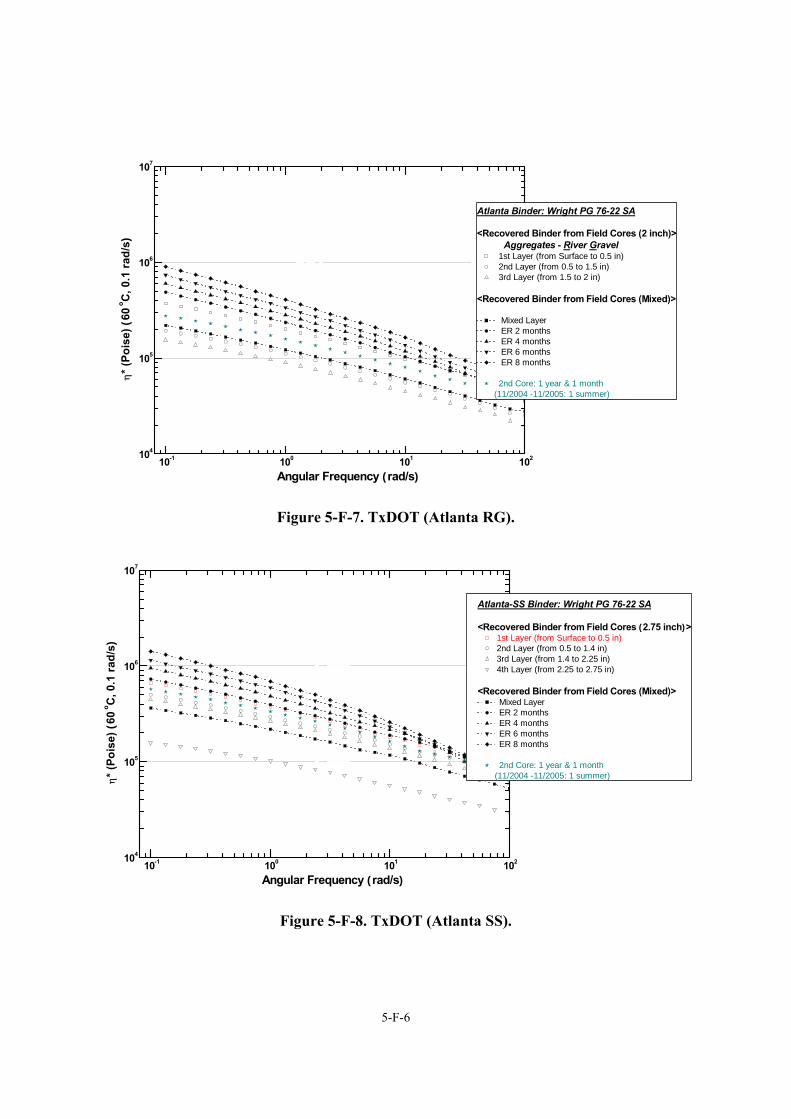
5-F-6
10-1 100 101 102104
105
106
107
Angular Frequency (rad/s)
η* (
Pois
e) (
60 o C
, 0.1
rad/
s)
Atlanta Binder: Wright PG 76-22 SA
<Recovered Binder from Field Cores (2 inch)> Aggregates - River Gravel
1st Layer (from Surface to 0.5 in) 2nd Layer (from 0.5 to 1.5 in) 3rd Layer (from 1.5 to 2 in)
<Recovered Binder from Field Cores (Mixed)>
Mixed Layer ER 2 months ER 4 months ER 6 months ER 8 months
2nd Core: 1 year & 1 month (11/2004 -11/2005: 1 summer)
Figure 5-F-7. TxDOT (Atlanta RG).
10-1 100 101 102104
105
106
107
Angular Frequency (rad/s)
η* (
Pois
e) (
60 o C
, 0.1
rad/
s)
Atlanta-SS Binder: Wright PG 76-22 SA
<Recovered Binder from Field Cores (2.75 inch)>1st Layer (from Surface to 0.5 in)2nd Layer (from 0.5 to 1.4 in)3rd Layer (from 1.4 to 2.25 in)4th Layer (from 2.25 to 2.75 in)
<Recovered Binder from Field Cores (Mixed)> Mixed Layer ER 2 months ER 4 months ER 6 months ER 8 months
2nd Core: 1 year & 1 month (11/2004 -11/2005: 1 summer)
Figure 5-F-8. TxDOT (Atlanta SS).
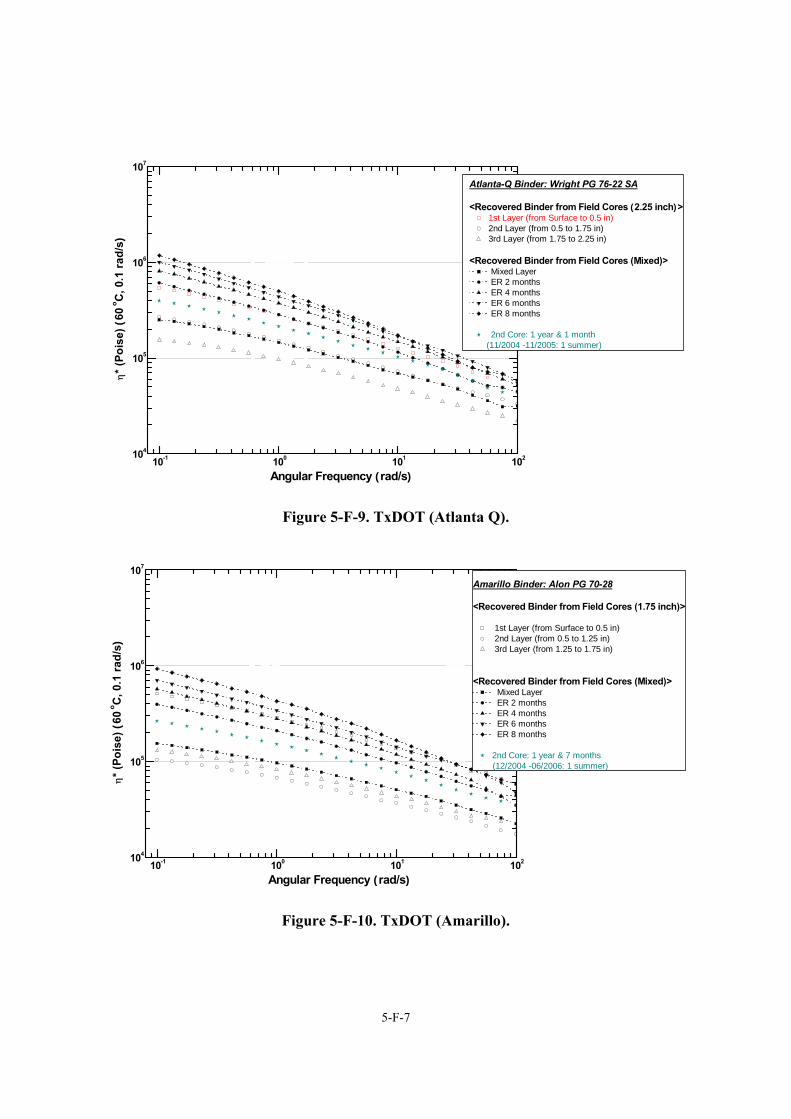
5-F-7
10-1 100 101 102104
105
106
107
Angular Frequency (rad/s)
η* (
Pois
e) (
60 o C
, 0.1
rad/
s)
Atlanta-Q Binder: Wright PG 76-22 SA
<Recovered Binder from Field Cores (2.25 inch)>1st Layer (from Surface to 0.5 in)2nd Layer (from 0.5 to 1.75 in)3rd Layer (from 1.75 to 2.25 in)
<Recovered Binder from Field Cores (Mixed)> Mixed Layer ER 2 months ER 4 months ER 6 months ER 8 months
2nd Core: 1 year & 1 month (11/2004 -11/2005: 1 summer)
Figure 5-F-9. TxDOT (Atlanta Q).
10-1 100 101 102104
105
106
107
Angular Frequency (rad/s)
η* (
Pois
e) (
60 o C
, 0.1
rad/
s)
Amarillo Binder: Alon PG 70-28
<Recovered Binder from Field Cores (1.75 inch)>
1st Layer (from Surface to 0.5 in) 2nd Layer (from 0.5 to 1.25 in) 3rd Layer (from 1.25 to 1.75 in)
<Recovered Binder from Field Cores (Mixed)> Mixed Layer ER 2 months ER 4 months ER 6 months ER 8 months
2nd Core: 1 year & 7 months (12/2004 -06/2006: 1 summer)
Figure 5-F-10. TxDOT (Amarillo).
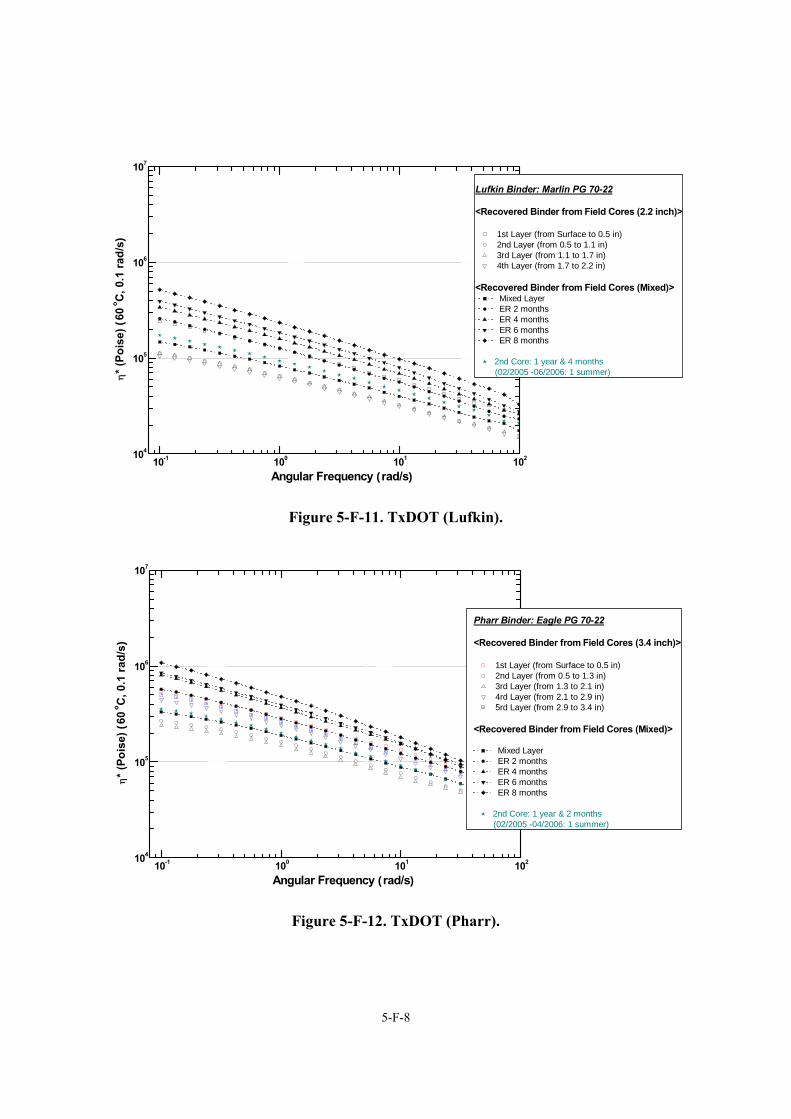
5-F-8
10-1 100 101 102104
105
106
107
Angular Frequency (rad/s)
η* (
Pois
e) (
60 o C
, 0.1
rad/
s)
Lufkin Binder: Marlin PG 70-22
<Recovered Binder from Field Cores (2.2 inch)>
1st Layer (from Surface to 0.5 in) 2nd Layer (from 0.5 to 1.1 in) 3rd Layer (from 1.1 to 1.7 in) 4th Layer (from 1.7 to 2.2 in)
<Recovered Binder from Field Cores (Mixed)> Mixed Layer ER 2 months ER 4 months ER 6 months ER 8 months
2nd Core: 1 year & 4 months (02/2005 -06/2006: 1 summer)
Figure 5-F-11. TxDOT (Lufkin).
10-1 100 101 102104
105
106
107
Pharr Binder: Eagle PG 70-22
<Recovered Binder from Field Cores (3.4 inch)>
1st Layer (from Surface to 0.5 in) 2nd Layer (from 0.5 to 1.3 in) 3rd Layer (from 1.3 to 2.1 in) 4rd Layer (from 2.1 to 2.9 in) 5rd Layer (from 2.9 to 3.4 in)
<Recovered Binder from Field Cores (Mixed)>
Mixed Layer ER 2 months ER 4 months ER 6 months ER 8 months
2nd Core: 1 year & 2 months (02/2005 -04/2006: 1 summer)
Angular Frequency (rad/s)
η* (
Pois
e) (
60 o C
, 0.1
rad/
s)
Figure 5-F-12. TxDOT (Pharr).
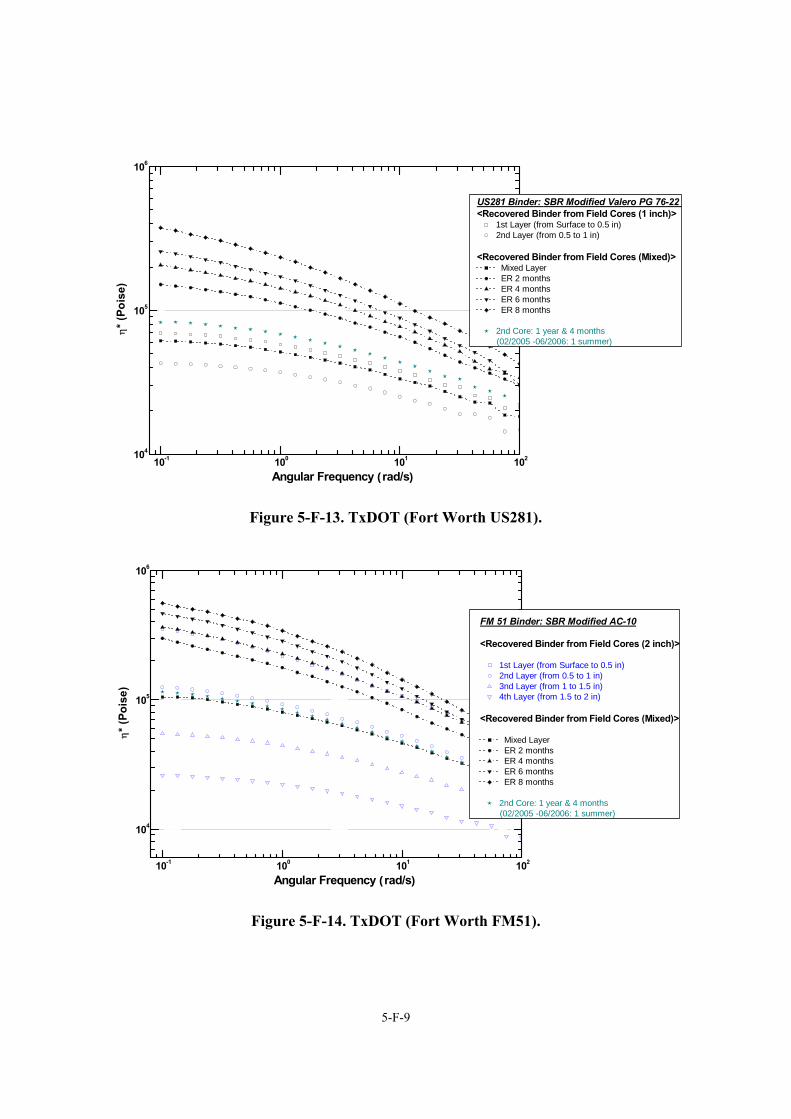
5-F-9
10-1 100 101 102104
105
106
Angular Frequency (rad/s)
η* (
Pois
e)
US281 Binder: SBR Modified Valero PG 76-22 <Recovered Binder from Field Cores (1 inch)>
1st Layer (from Surface to 0.5 in)2nd Layer (from 0.5 to 1 in)
<Recovered Binder from Field Cores (Mixed)> Mixed Layer ER 2 months ER 4 months ER 6 months ER 8 months
2nd Core: 1 year & 4 months (02/2005 -06/2006: 1 summer)
Figure 5-F-13. TxDOT (Fort Worth US281).
10-1 100 101 102
104
105
106
Angular Frequency (rad/s)
η* (
Pois
e)
FM 51 Binder: SBR Modified AC-10
<Recovered Binder from Field Cores (2 inch)>
1st Layer (from Surface to 0.5 in)2nd Layer (from 0.5 to 1 in)3nd Layer (from 1 to 1.5 in)4th Layer (from 1.5 to 2 in)
<Recovered Binder from Field Cores (Mixed)>
Mixed Layer ER 2 months ER 4 months ER 6 months ER 8 months
2nd Core: 1 year & 4 months (02/2005 -06/2006: 1 summer)
Figure 5-F-14. TxDOT (Fort Worth FM51).
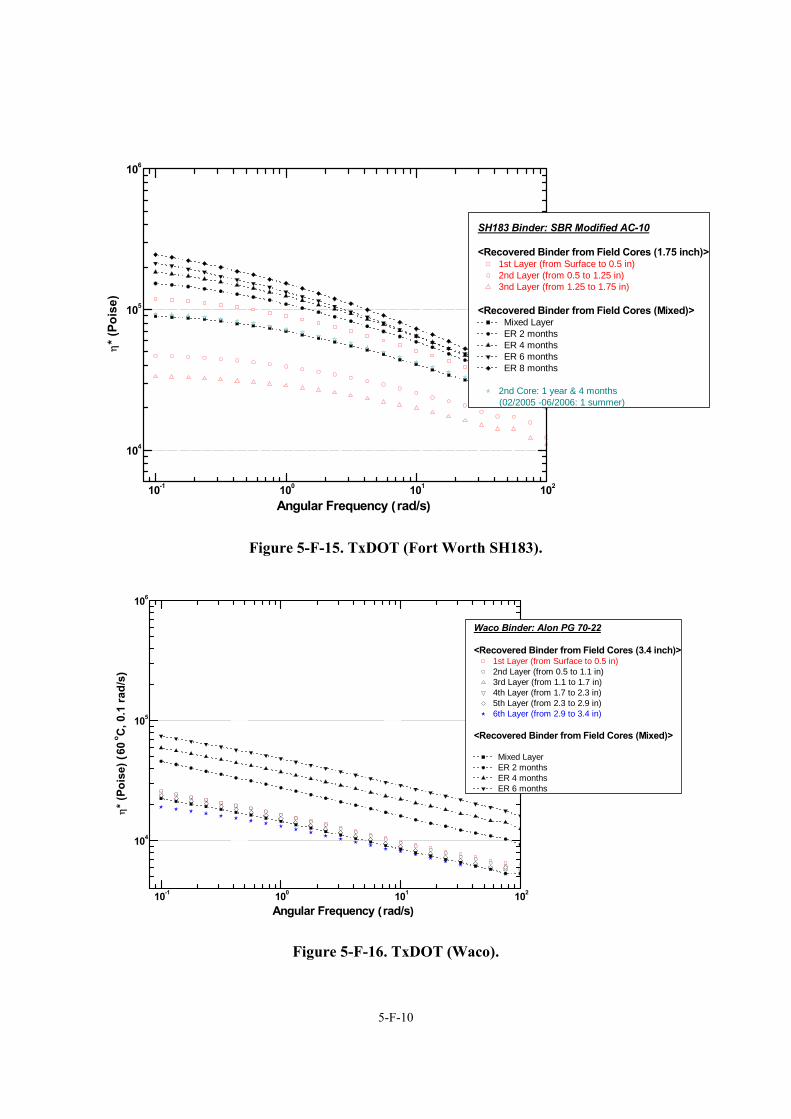
5-F-10
10-1 100 101 102
104
105
106
Angular Frequency (rad/s)
η* (
Pois
e)
SH183 Binder: SBR Modified AC-10
<Recovered Binder from Field Cores (1.75 inch)>1st Layer (from Surface to 0.5 in)2nd Layer (from 0.5 to 1.25 in)3nd Layer (from 1.25 to 1.75 in)
<Recovered Binder from Field Cores (Mixed)> Mixed Layer ER 2 months ER 4 months ER 6 months ER 8 months
2nd Core: 1 year & 4 months (02/2005 -06/2006: 1 summer)
Figure 5-F-15. TxDOT (Fort Worth SH183).
10-1 100 101 102
104
105
106
Angular Frequency (rad/s)
η* (
Pois
e) (
60 o C
, 0.1
rad/
s)
Waco Binder: Alon PG 70-22
<Recovered Binder from Field Cores (3.4 inch)>1st Layer (from Surface to 0.5 in)2nd Layer (from 0.5 to 1.1 in)3rd Layer (from 1.1 to 1.7 in)4th Layer (from 1.7 to 2.3 in)5th Layer (from 2.3 to 2.9 in)6th Layer (from 2.9 to 3.4 in)
<Recovered Binder from Field Cores (Mixed)>
Mixed Layer ER 2 months ER 4 months ER 6 months
Figure 5-F-16. TxDOT (Waco).
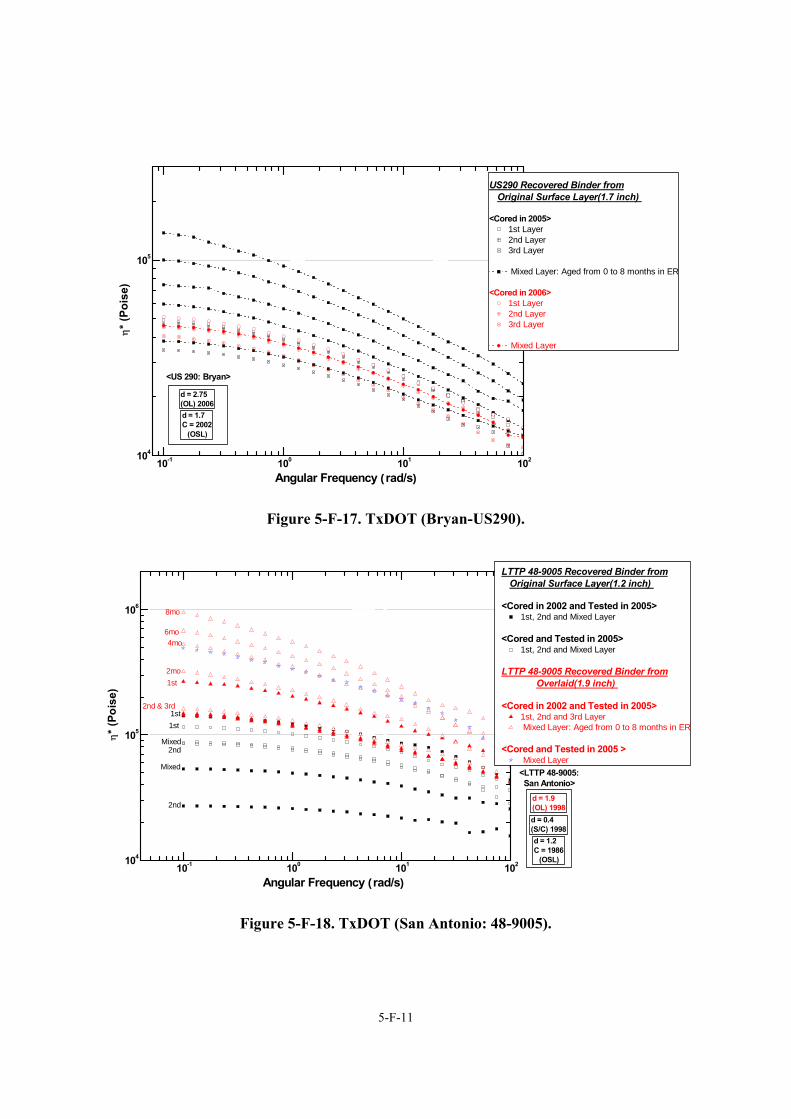
5-F-11
10-1 100 101 102104
105
US290 Recovered Binder from Original Surface Layer(1.7 inch)
<Cored in 2005>1st Layer2nd Layer3rd Layer
Mixed Layer: Aged from 0 to 8 months in ER
<Cored in 2006>1st Layer2nd Layer3rd Layer
Mixed Layer
Angular Frequency (rad/s)
η* (
Pois
e)
<US 290: Bryan>
d = 1.7 C = 2002 (OSL)
d = 2.75 (OL) 2006
Figure 5-F-17. TxDOT (Bryan-US290).
10-1 100 101 102104
105
1068mo
6mo4mo
2mo
Mixed
Mixed
2nd & 3rd
1st
2nd
1st1st
Angular Frequency (rad/s)
η* (
Pois
e)
LTTP 48-9005 Recovered Binder from Original Surface Layer(1.2 inch)
<Cored in 2002 and Tested in 2005>1st, 2nd and Mixed Layer
<Cored and Tested in 2005>1st, 2nd and Mixed Layer
LTTP 48-9005 Recovered Binder from Overlaid(1.9 inch)
<Cored in 2002 and Tested in 2005>1st, 2nd and 3rd Layer Mixed Layer: Aged from 0 to 8 months in ER
<Cored and Tested in 2005 > Mixed Layer
d = 0.4(S/C) 1998d = 1.2 C = 1986 (OSL)
d = 1.9 (OL) 1998
<LTTP 48-9005: San Antonio>
2nd
Figure 5-F-18. TxDOT (San Antonio: 48-9005).
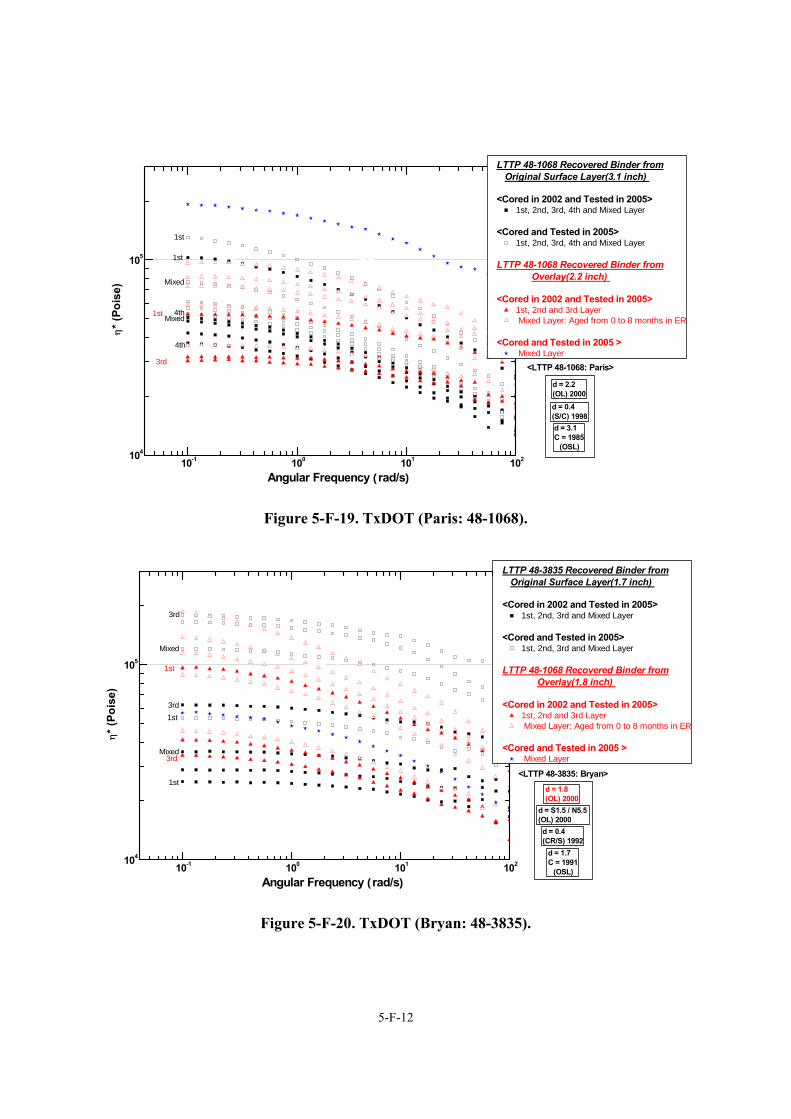
5-F-12
10-1 100 101 102104
105
4th
1st
Mixed
Mixed
3rd
1st
1st
Angular Frequency (rad/s)
η* (
Pois
e)
LTTP 48-1068 Recovered Binder from Original Surface Layer(3.1 inch)
<Cored in 2002 and Tested in 2005>1st, 2nd, 3rd, 4th and Mixed Layer
<Cored and Tested in 2005>1st, 2nd, 3rd, 4th and Mixed Layer
LTTP 48-1068 Recovered Binder from Overlay(2.2 inch)
<Cored in 2002 and Tested in 2005>1st, 2nd and 3rd Layer Mixed Layer: Aged from 0 to 8 months in ER
<Cored and Tested in 2005 > Mixed Layer
4th
d = 0.4(S/C) 1998d = 3.1 C = 1985 (OSL)
d = 2.2 (OL) 2000
<LTTP 48-1068: Paris>
Figure 5-F-19. TxDOT (Paris: 48-1068).
10-1 100 101 102104
105
3rd
1st
Mixed
Mixed3rd
1st
1st
Angular Frequency (rad/s)
η* (
Pois
e)
LTTP 48-3835 Recovered Binder from Original Surface Layer(1.7 inch)
<Cored in 2002 and Tested in 2005>1st, 2nd, 3rd and Mixed Layer
<Cored and Tested in 2005>1st, 2nd, 3rd and Mixed Layer
LTTP 48-1068 Recovered Binder from Overlay(1.8 inch)
<Cored in 2002 and Tested in 2005>1st, 2nd and 3rd Layer Mixed Layer: Aged from 0 to 8 months in ER
<Cored and Tested in 2005 > Mixed Layer
3rd
<LTTP 48-3835: Bryan>
d = S1.5 / N5.5 (OL) 2000d = 0.4 (CR/S) 1992
d = 1.7 C = 1991 (OSL)
d = 1.8 (OL) 2000
Figure 5-F-20. TxDOT (Bryan: 48-3835).

5-G-1
APPENDICES FOR CHAPTER 5
APPENDIX 5-G
FIGURES OF GPC DATA

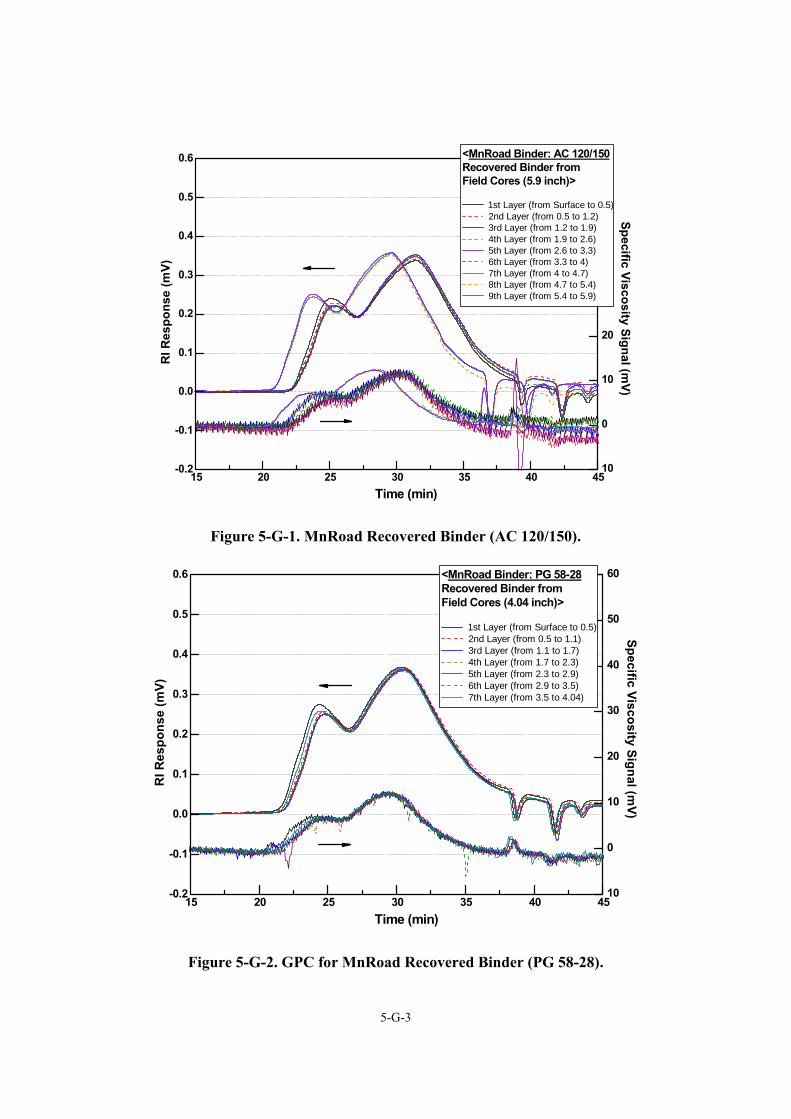
5-G-3
10
0
10
20
30
40
50
60
15 20 25 30 35 40 45-0.2
-0.1
0.0
0.1
0.2
0.3
0.4
0.5
0.6 <MnRoad Binder: AC 120/150Recovered Binder from Field Cores (5.9 inch)>
1st Layer (from Surface to 0.5) 2nd Layer (from 0.5 to 1.2) 3rd Layer (from 1.2 to 1.9) 4th Layer (from 1.9 to 2.6) 5th Layer (from 2.6 to 3.3) 6th Layer (from 3.3 to 4) 7th Layer (from 4 to 4.7) 8th Layer (from 4.7 to 5.4) 9th Layer (from 5.4 to 5.9)
Specific Viscosity Signal (mV)
Time (min)
RI R
espo
nse
(mV)
Figure 5-G-1. MnRoad Recovered Binder (AC 120/150).
10
0
10
20
30
40
50
60
15 20 25 30 35 40 45-0.2
-0.1
0.0
0.1
0.2
0.3
0.4
0.5
0.6 <MnRoad Binder: PG 58-28Recovered Binder from Field Cores (4.04 inch)>
1st Layer (from Surface to 0.5) 2nd Layer (from 0.5 to 1.1) 3rd Layer (from 1.1 to 1.7) 4th Layer (from 1.7 to 2.3) 5th Layer (from 2.3 to 2.9) 6th Layer (from 2.9 to 3.5) 7th Layer (from 3.5 to 4.04)
Specific Viscosity Signal (mV)
Time (min)
RI R
espo
nse
(mV)
Figure 5-G-2. GPC for MnRoad Recovered Binder (PG 58-28).
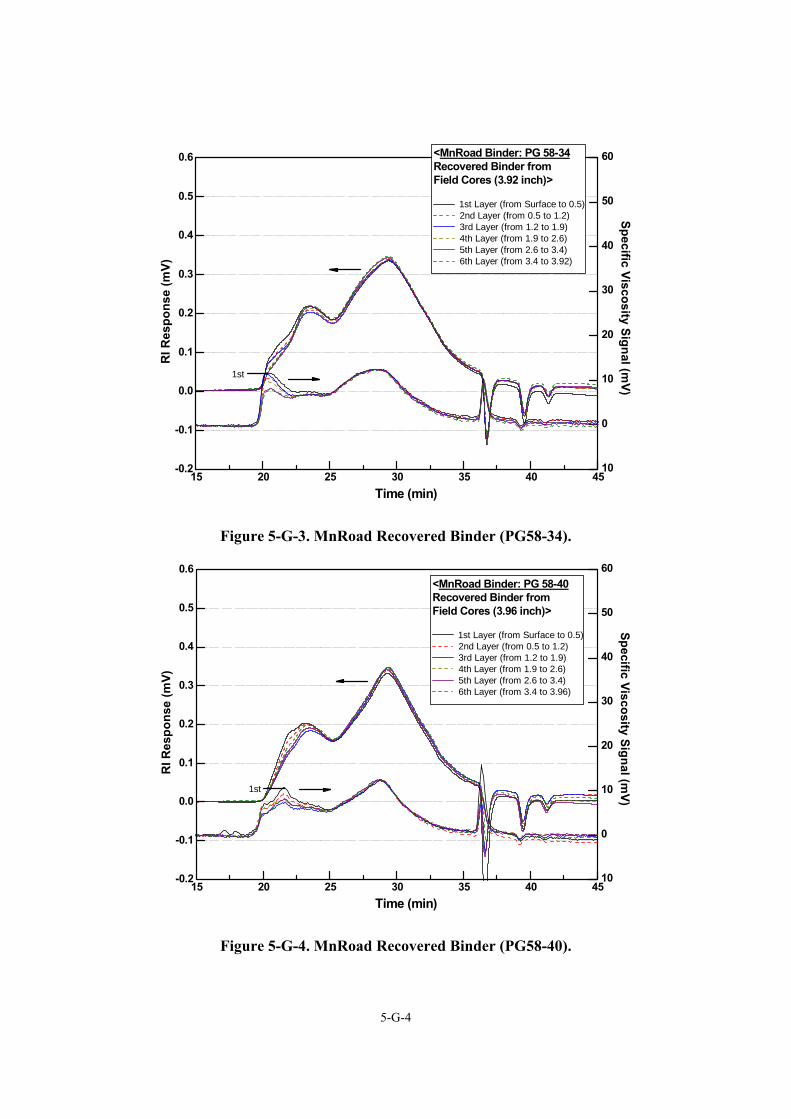
5-G-4
10
0
10
20
30
40
50
60
15 20 25 30 35 40 45-0.2
-0.1
0.0
0.1
0.2
0.3
0.4
0.5
0.6 <MnRoad Binder: PG 58-34Recovered Binder from Field Cores (3.92 inch)>
1st Layer (from Surface to 0.5) 2nd Layer (from 0.5 to 1.2) 3rd Layer (from 1.2 to 1.9) 4th Layer (from 1.9 to 2.6) 5th Layer (from 2.6 to 3.4) 6th Layer (from 3.4 to 3.92)
Specific Viscosity Signal (mV)
Time (min)
RI R
espo
nse
(mV)
1st
Figure 5-G-3. MnRoad Recovered Binder (PG58-34).
10
0
10
20
30
40
50
60
15 20 25 30 35 40 45-0.2
-0.1
0.0
0.1
0.2
0.3
0.4
0.5
0.6<MnRoad Binder: PG 58-40Recovered Binder from Field Cores (3.96 inch)>
1st Layer (from Surface to 0.5) 2nd Layer (from 0.5 to 1.2) 3rd Layer (from 1.2 to 1.9) 4th Layer (from 1.9 to 2.6) 5th Layer (from 2.6 to 3.4) 6th Layer (from 3.4 to 3.96)
Specific Viscosity Signal (mV)
Time (min)
RI R
espo
nse
(mV)
1st
Figure 5-G-4. MnRoad Recovered Binder (PG58-40).
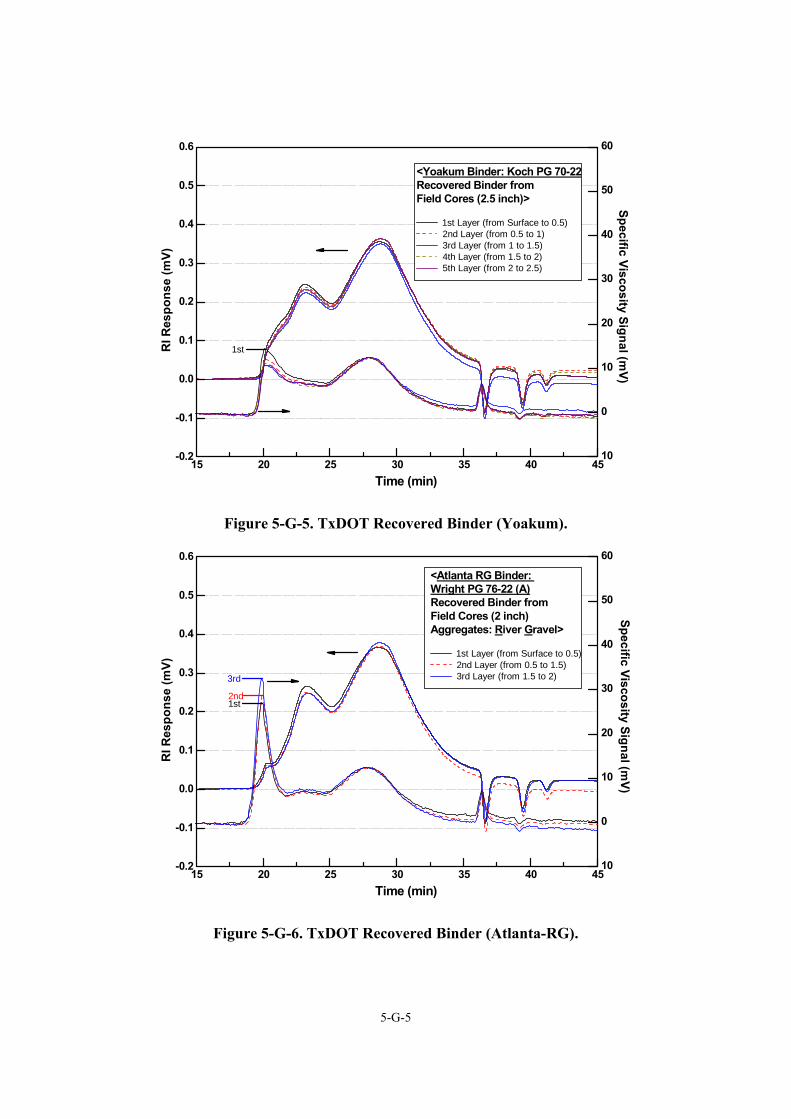
5-G-5
10
0
10
20
30
40
50
60
15 20 25 30 35 40 45-0.2
-0.1
0.0
0.1
0.2
0.3
0.4
0.5
0.6
<Yoakum Binder: Koch PG 70-22Recovered Binder from Field Cores (2.5 inch)>
1st Layer (from Surface to 0.5) 2nd Layer (from 0.5 to 1) 3rd Layer (from 1 to 1.5) 4th Layer (from 1.5 to 2) 5th Layer (from 2 to 2.5)
Specific Viscosity Signal (mV)
Time (min)
RI R
espo
nse
(mV)
1st
Figure 5-G-5. TxDOT Recovered Binder (Yoakum).
10
0
10
20
30
40
50
60
15 20 25 30 35 40 45-0.2
-0.1
0.0
0.1
0.2
0.3
0.4
0.5
0.6
<Atlanta RG Binder: Wright PG 76-22 (A)Recovered Binder from Field Cores (2 inch)Aggregates: River Gravel>
1st Layer (from Surface to 0.5) 2nd Layer (from 0.5 to 1.5) 3rd Layer (from 1.5 to 2)
Specific Viscosity Signal (mV)
Time (min)
RI R
espo
nse
(mV)
1st2nd
3rd
Figure 5-G-6. TxDOT Recovered Binder (Atlanta-RG).
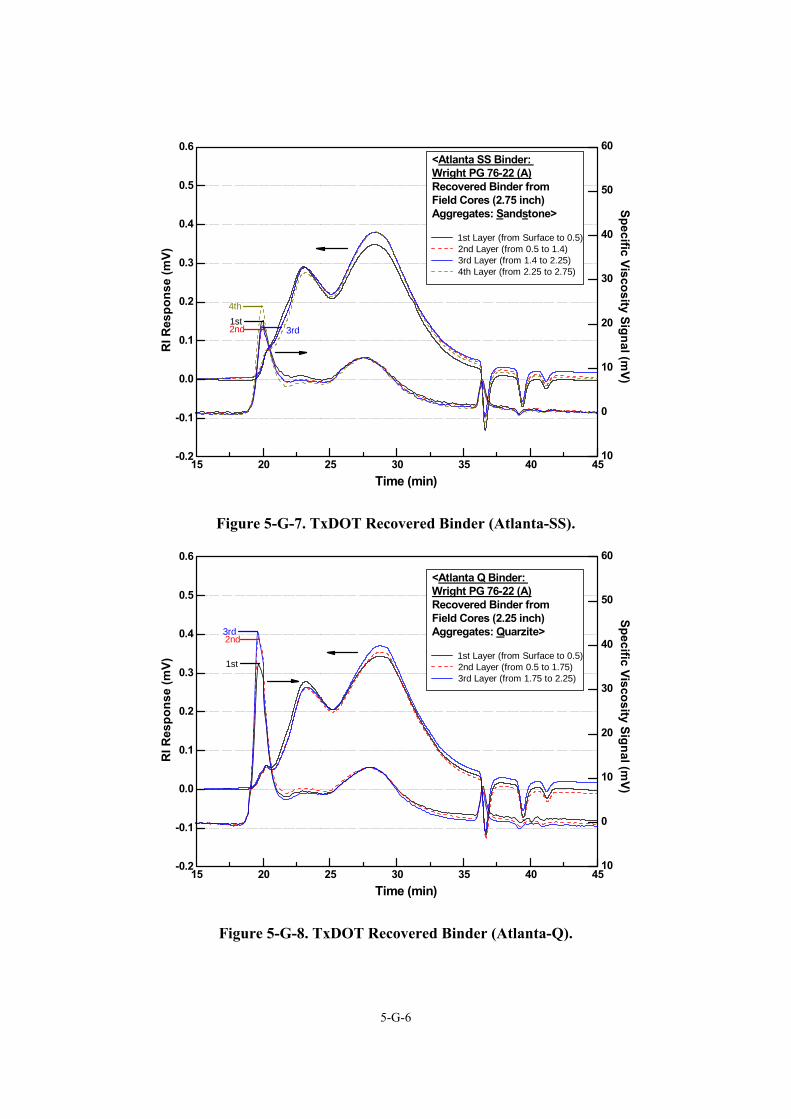
5-G-6
10
0
10
20
30
40
50
60
15 20 25 30 35 40 45-0.2
-0.1
0.0
0.1
0.2
0.3
0.4
0.5
0.6<Atlanta SS Binder: Wright PG 76-22 (A)Recovered Binder from Field Cores (2.75 inch)Aggregates: Sandstone>
1st Layer (from Surface to 0.5) 2nd Layer (from 0.5 to 1.4) 3rd Layer (from 1.4 to 2.25) 4th Layer (from 2.25 to 2.75)
Specific Viscosity Signal (mV)
Time (min)
RI R
espo
nse
(mV)
1st2nd 3rd
4th
Figure 5-G-7. TxDOT Recovered Binder (Atlanta-SS).
10
0
10
20
30
40
50
60
15 20 25 30 35 40 45-0.2
-0.1
0.0
0.1
0.2
0.3
0.4
0.5
0.6
<Atlanta Q Binder: Wright PG 76-22 (A)Recovered Binder from Field Cores (2.25 inch)Aggregates: Quarzite>
1st Layer (from Surface to 0.5) 2nd Layer (from 0.5 to 1.75) 3rd Layer (from 1.75 to 2.25)
Specific Viscosity Signal (mV)
Time (min)
RI R
espo
nse
(mV) 1st
2nd3rd
Figure 5-G-8. TxDOT Recovered Binder (Atlanta-Q).
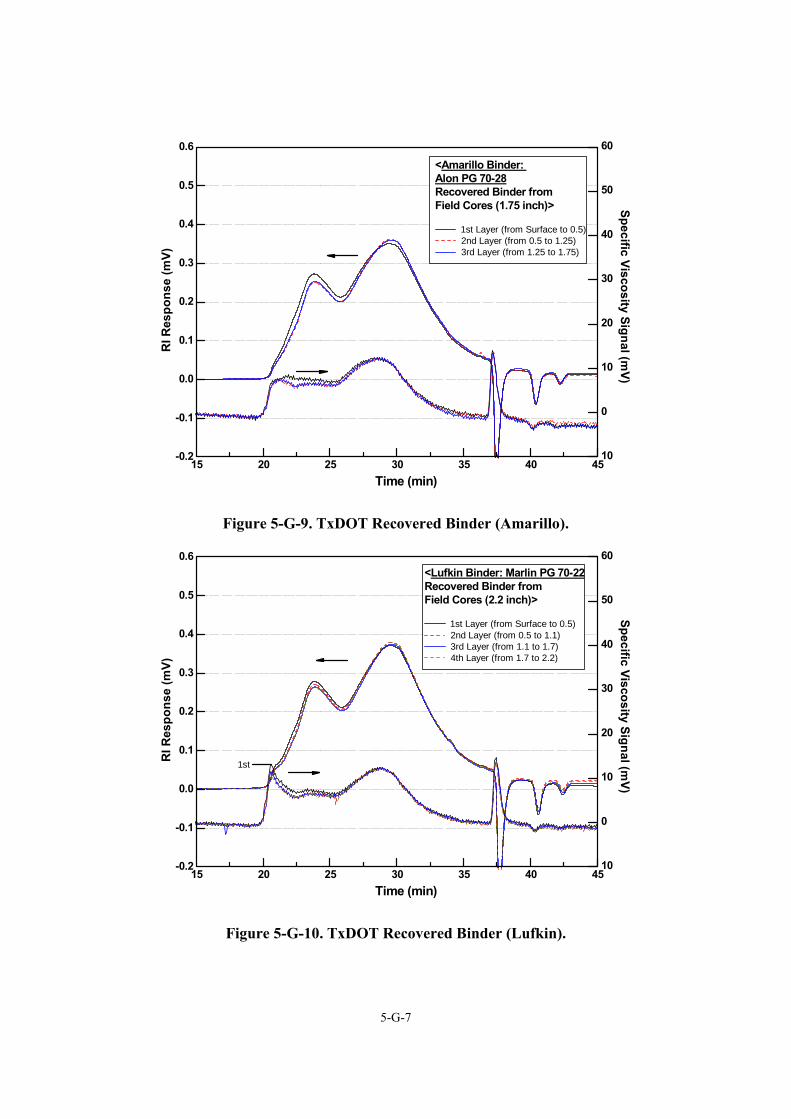
5-G-7
10
0
10
20
30
40
50
60
15 20 25 30 35 40 45-0.2
-0.1
0.0
0.1
0.2
0.3
0.4
0.5
0.6<Amarillo Binder: Alon PG 70-28Recovered Binder from Field Cores (1.75 inch)>
1st Layer (from Surface to 0.5) 2nd Layer (from 0.5 to 1.25) 3rd Layer (from 1.25 to 1.75)
Specific Viscosity Signal (mV)
Time (min)
RI R
espo
nse
(mV)
Figure 5-G-9. TxDOT Recovered Binder (Amarillo).
10
0
10
20
30
40
50
60
15 20 25 30 35 40 45-0.2
-0.1
0.0
0.1
0.2
0.3
0.4
0.5
0.6<Lufkin Binder: Marlin PG 70-22Recovered Binder from Field Cores (2.2 inch)>
1st Layer (from Surface to 0.5) 2nd Layer (from 0.5 to 1.1) 3rd Layer (from 1.1 to 1.7) 4th Layer (from 1.7 to 2.2)
Specific Viscosity Signal (mV)
Time (min)
RI R
espo
nse
(mV)
1st
Figure 5-G-10. TxDOT Recovered Binder (Lufkin).
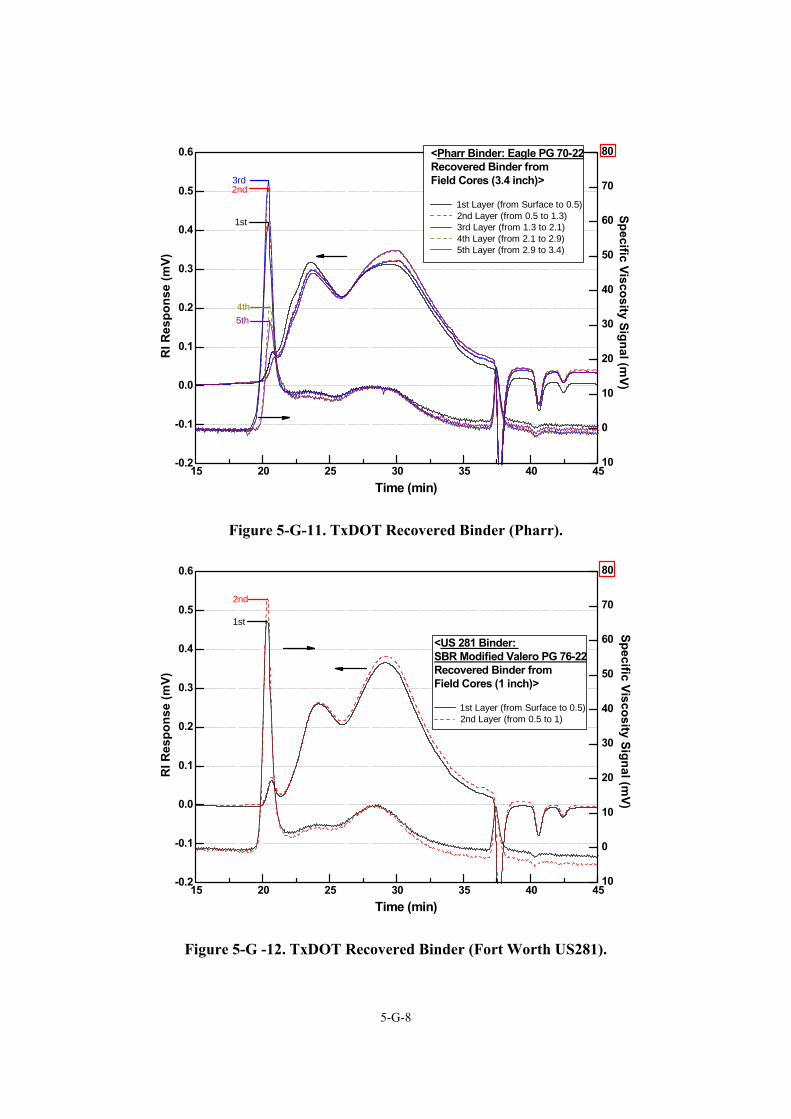
5-G-8
10
0
10
20
30
40
50
60
70
80
15 20 25 30 35 40 45-0.2
-0.1
0.0
0.1
0.2
0.3
0.4
0.5
0.6
5th4th
2nd3rd
<Pharr Binder: Eagle PG 70-22Recovered Binder from Field Cores (3.4 inch)>
1st Layer (from Surface to 0.5) 2nd Layer (from 0.5 to 1.3) 3rd Layer (from 1.3 to 2.1) 4th Layer (from 2.1 to 2.9) 5th Layer (from 2.9 to 3.4)
Specific Viscosity Signal (mV)
Time (min)
RI R
espo
nse
(mV)
1st
Figure 5-G-11. TxDOT Recovered Binder (Pharr).
10
0
10
20
30
40
50
60
70
80
15 20 25 30 35 40 45-0.2
-0.1
0.0
0.1
0.2
0.3
0.4
0.5
0.6
<US 281 Binder: SBR Modified Valero PG 76-22Recovered Binder from Field Cores (1 inch)>
1st Layer (from Surface to 0.5) 2nd Layer (from 0.5 to 1)
Specific Viscosity Signal (mV)
Time (min)
RI R
espo
nse
(mV)
1st
2nd
Figure 5-G -12. TxDOT Recovered Binder (Fort Worth US281).
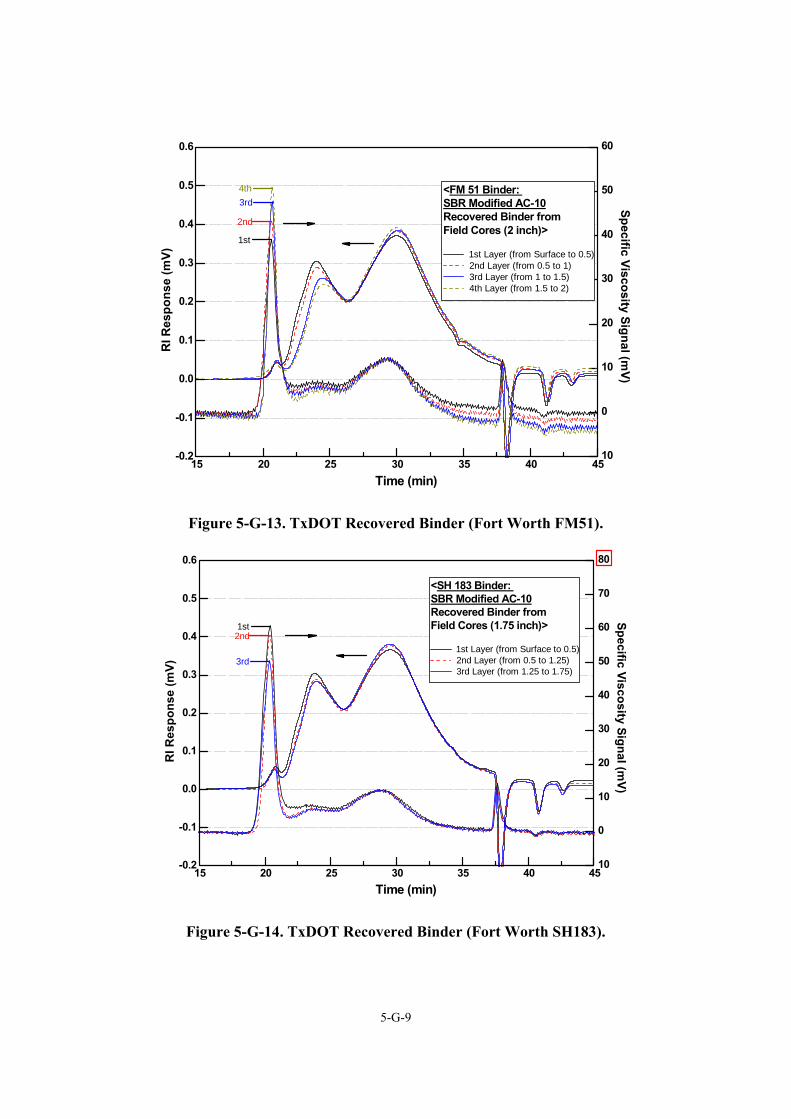
5-G-9
10
0
10
20
30
40
50
60
15 20 25 30 35 40 45-0.2
-0.1
0.0
0.1
0.2
0.3
0.4
0.5
0.6
<FM 51 Binder: SBR Modified AC-10Recovered Binder from Field Cores (2 inch)>
1st Layer (from Surface to 0.5) 2nd Layer (from 0.5 to 1) 3rd Layer (from 1 to 1.5) 4th Layer (from 1.5 to 2)
Specific Viscosity Signal (mV)
Time (min)
RI R
espo
nse
(mV)
1st
2nd
3rd4th
Figure 5-G-13. TxDOT Recovered Binder (Fort Worth FM51).
10
0
10
20
30
40
50
60
70
80
15 20 25 30 35 40 45-0.2
-0.1
0.0
0.1
0.2
0.3
0.4
0.5
0.6
<SH 183 Binder: SBR Modified AC-10Recovered Binder from Field Cores (1.75 inch)>
1st Layer (from Surface to 0.5) 2nd Layer (from 0.5 to 1.25) 3rd Layer (from 1.25 to 1.75)
Specific Viscosity Signal (mV)
Time (min)
RI R
espo
nse
(mV)
1st2nd
3rd
Figure 5-G-14. TxDOT Recovered Binder (Fort Worth SH183).
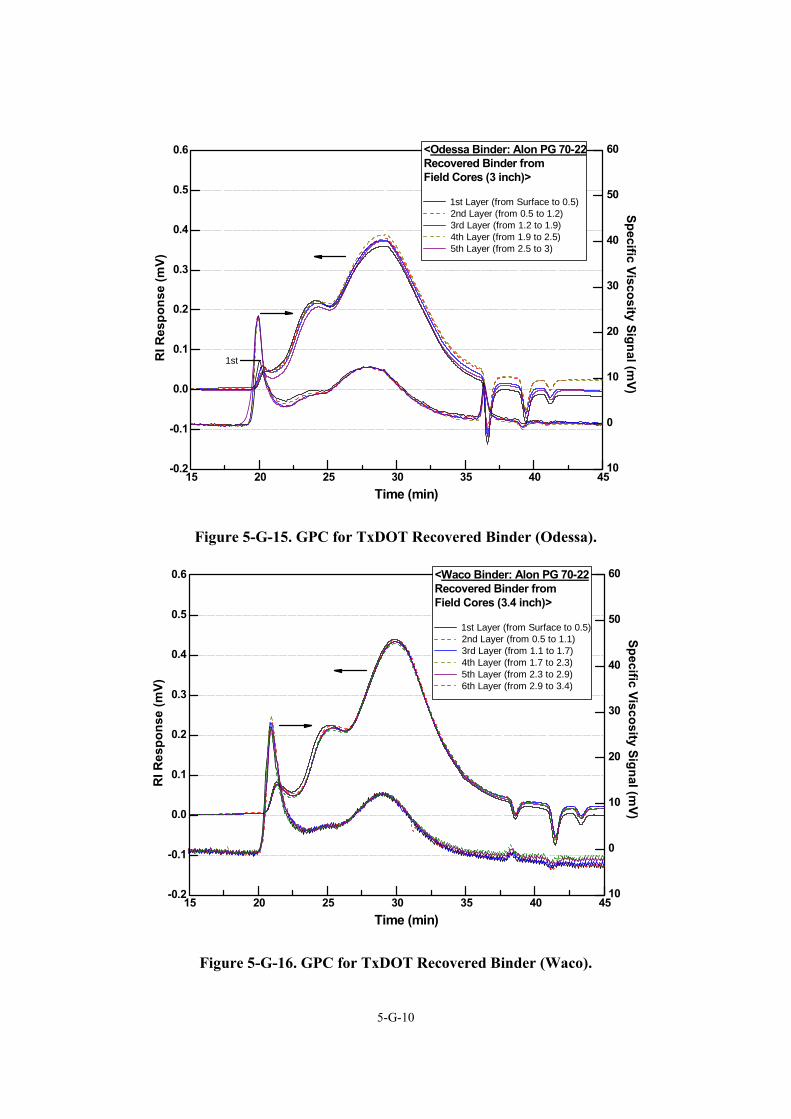
5-G-10
10
0
10
20
30
40
50
60
15 20 25 30 35 40 45-0.2
-0.1
0.0
0.1
0.2
0.3
0.4
0.5
0.6 <Odessa Binder: Alon PG 70-22Recovered Binder from Field Cores (3 inch)>
1st Layer (from Surface to 0.5) 2nd Layer (from 0.5 to 1.2) 3rd Layer (from 1.2 to 1.9) 4th Layer (from 1.9 to 2.5) 5th Layer (from 2.5 to 3)
Specific Viscosity Signal (mV)
Time (min)
RI R
espo
nse
(mV)
1st
Figure 5-G-15. GPC for TxDOT Recovered Binder (Odessa).
10
0
10
20
30
40
50
60
15 20 25 30 35 40 45-0.2
-0.1
0.0
0.1
0.2
0.3
0.4
0.5
0.6 <Waco Binder: Alon PG 70-22Recovered Binder from Field Cores (3.4 inch)>
1st Layer (from Surface to 0.5) 2nd Layer (from 0.5 to 1.1) 3rd Layer (from 1.1 to 1.7) 4th Layer (from 1.7 to 2.3) 5th Layer (from 2.3 to 2.9) 6th Layer (from 2.9 to 3.4)
Specific Viscosity Signal (mV)
Time (min)
RI R
espo
nse
(mV)
Figure 5-G-16. GPC for TxDOT Recovered Binder (Waco).
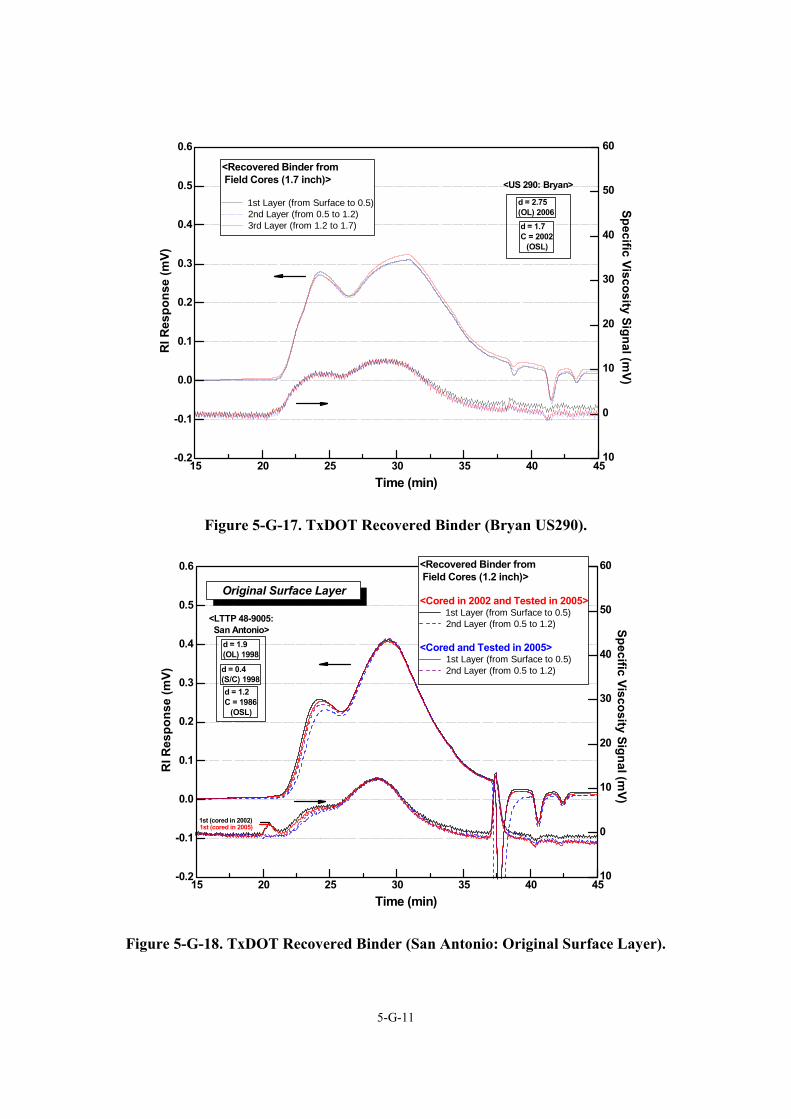
5-G-11
10
0
10
20
30
40
50
60
15 20 25 30 35 40 45-0.2
-0.1
0.0
0.1
0.2
0.3
0.4
0.5
0.6
<Recovered Binder from Field Cores (1.7 inch)>
1st Layer (from Surface to 0.5) 2nd Layer (from 0.5 to 1.2) 3rd Layer (from 1.2 to 1.7)
Specific Viscosity Signal (mV)
Time (min)
RI R
espo
nse
(mV)
<US 290: Bryan>
d = 1.7 C = 2002 (OSL)
d = 2.75 (OL) 2006
Figure 5-G-17. TxDOT Recovered Binder (Bryan US290).
10
0
10
20
30
40
50
60
15 20 25 30 35 40 45-0.2
-0.1
0.0
0.1
0.2
0.3
0.4
0.5
0.6
1st (cored in 2005)
<Recovered Binder from Field Cores (1.2 inch)>
<Cored in 2002 and Tested in 2005> 1st Layer (from Surface to 0.5) 2nd Layer (from 0.5 to 1.2)
<Cored and Tested in 2005> 1st Layer (from Surface to 0.5) 2nd Layer (from 0.5 to 1.2)
Specific Viscosity Signal (mV)
Original Surface Layer
Time (min)
RI R
espo
nse
(mV) d = 0.4
(S/C) 1998d = 1.2 C = 1986 (OSL)
d = 1.9 (OL) 1998
<LTTP 48-9005: San Antonio>
1st (cored in 2002)
Figure 5-G-18. TxDOT Recovered Binder (San Antonio: Original Surface Layer).
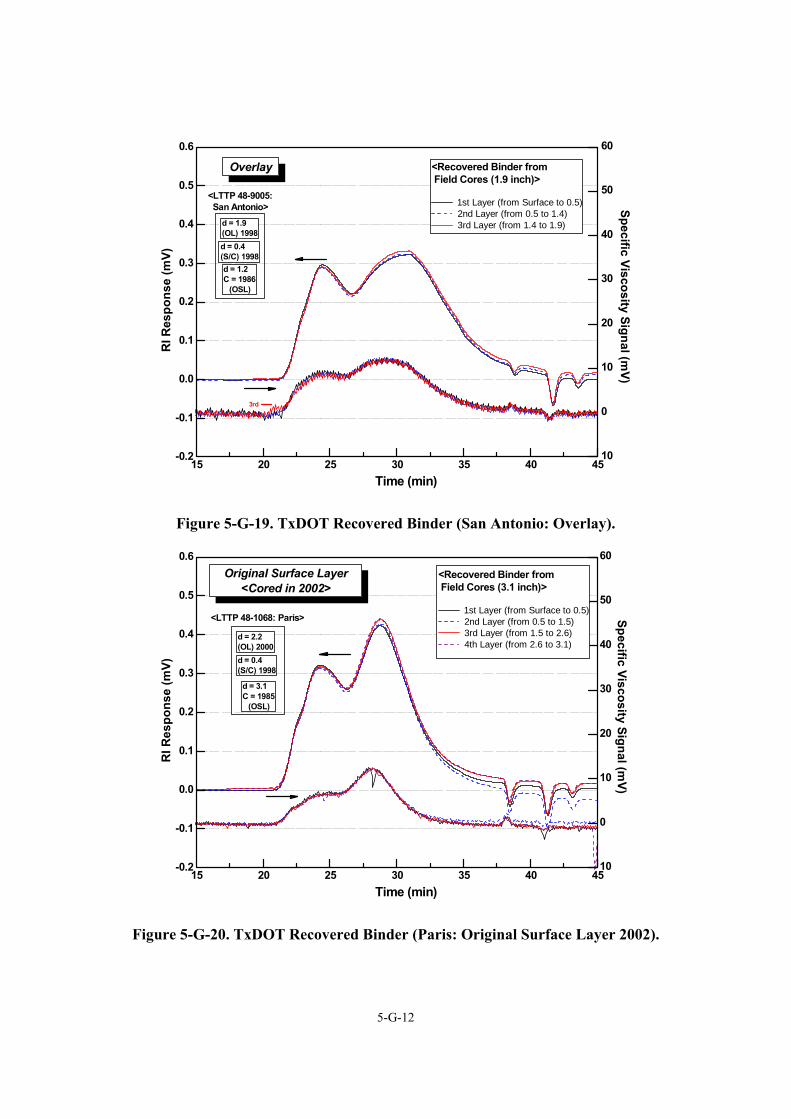
5-G-12
10
0
10
20
30
40
50
60
15 20 25 30 35 40 45-0.2
-0.1
0.0
0.1
0.2
0.3
0.4
0.5
0.6
<Recovered Binder from Field Cores (1.9 inch)>
1st Layer (from Surface to 0.5) 2nd Layer (from 0.5 to 1.4) 3rd Layer (from 1.4 to 1.9)
Specific Viscosity Signal (mV)
Overlay
Time (min)
RI R
espo
nse
(mV)
3rd
d = 0.4(S/C) 1998d = 1.2 C = 1986 (OSL)
d = 1.9 (OL) 1998
<LTTP 48-9005: San Antonio>
Figure 5-G-19. TxDOT Recovered Binder (San Antonio: Overlay).
10
0
10
20
30
40
50
60
15 20 25 30 35 40 45-0.2
-0.1
0.0
0.1
0.2
0.3
0.4
0.5
0.6Original Surface Layer
<Cored in 2002><Recovered Binder from Field Cores (3.1 inch)>
1st Layer (from Surface to 0.5) 2nd Layer (from 0.5 to 1.5) 3rd Layer (from 1.5 to 2.6) 4th Layer (from 2.6 to 3.1)
Specific Viscosity Signal (mV)
Time (min)
RI R
espo
nse
(mV) d = 0.4
(S/C) 1998
d = 3.1 C = 1985 (OSL)
d = 2.2 (OL) 2000
<LTTP 48-1068: Paris>
Figure 5-G-20. TxDOT Recovered Binder (Paris: Original Surface Layer 2002).
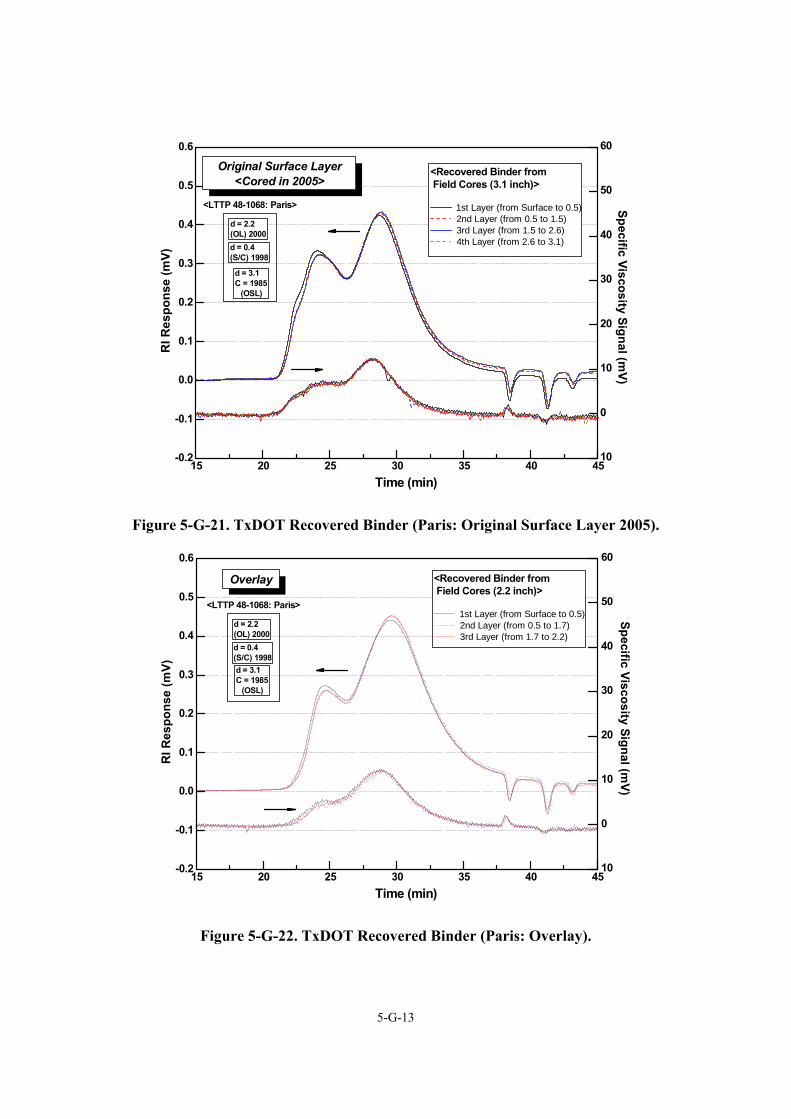
5-G-13
10
0
10
20
30
40
50
60
15 20 25 30 35 40 45-0.2
-0.1
0.0
0.1
0.2
0.3
0.4
0.5
0.6
Original Surface Layer<Cored in 2005>
<Recovered Binder from Field Cores (3.1 inch)>
1st Layer (from Surface to 0.5) 2nd Layer (from 0.5 to 1.5) 3rd Layer (from 1.5 to 2.6) 4th Layer (from 2.6 to 3.1)
Specific Viscosity Signal (mV)
Time (min)
RI R
espo
nse
(mV)
d = 0.4(S/C) 1998
d = 3.1 C = 1985 (OSL)
d = 2.2 (OL) 2000
<LTTP 48-1068: Paris>
Figure 5-G-21. TxDOT Recovered Binder (Paris: Original Surface Layer 2005).
10
0
10
20
30
40
50
60
15 20 25 30 35 40 45-0.2
-0.1
0.0
0.1
0.2
0.3
0.4
0.5
0.6
Overlay <Recovered Binder from Field Cores (2.2 inch)>
1st Layer (from Surface to 0.5) 2nd Layer (from 0.5 to 1.7) 3rd Layer (from 1.7 to 2.2)
Specific Viscosity Signal (mV)
Time (min)
RI R
espo
nse
(mV)
d = 0.4(S/C) 1998d = 3.1 C = 1985 (OSL)
d = 2.2 (OL) 2000
<LTTP 48-1068: Paris>
Figure 5-G-22. TxDOT Recovered Binder (Paris: Overlay).
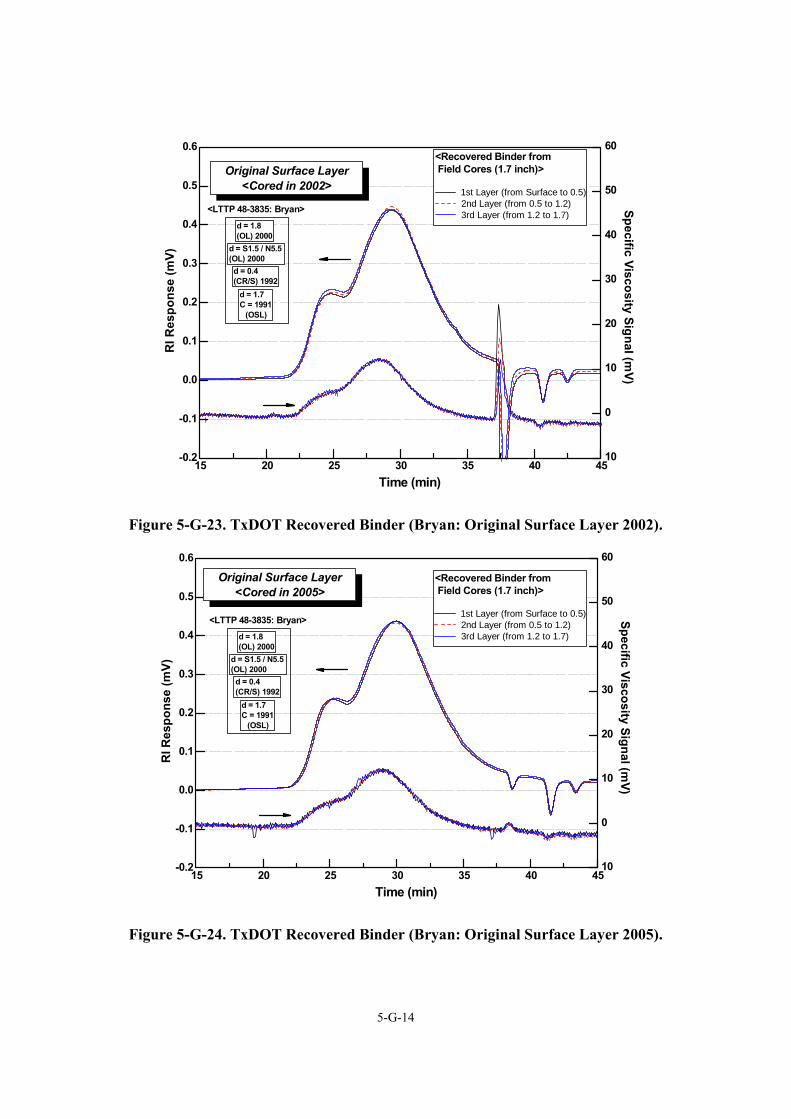
5-G-14
10
0
10
20
30
40
50
60
15 20 25 30 35 40 45-0.2
-0.1
0.0
0.1
0.2
0.3
0.4
0.5
0.6
Original Surface Layer<Cored in 2002>
<Recovered Binder from Field Cores (1.7 inch)>
1st Layer (from Surface to 0.5) 2nd Layer (from 0.5 to 1.2) 3rd Layer (from 1.2 to 1.7)
Specific Viscosity Signal (mV)
Time (min)
RI R
espo
nse
(mV)
<LTTP 48-3835: Bryan>
d = S1.5 / N5.5 (OL) 2000d = 0.4 (CR/S) 1992
d = 1.7 C = 1991 (OSL)
d = 1.8 (OL) 2000
Figure 5-G-23. TxDOT Recovered Binder (Bryan: Original Surface Layer 2002).
10
0
10
20
30
40
50
60
15 20 25 30 35 40 45-0.2
-0.1
0.0
0.1
0.2
0.3
0.4
0.5
0.6
Original Surface Layer<Cored in 2005>
<Recovered Binder from Field Cores (1.7 inch)>
1st Layer (from Surface to 0.5) 2nd Layer (from 0.5 to 1.2) 3rd Layer (from 1.2 to 1.7)
Specific Viscosity Signal (mV)
Time (min)
RI R
espo
nse
(mV)
<LTTP 48-3835: Bryan>
d = S1.5 / N5.5 (OL) 2000d = 0.4 (CR/S) 1992
d = 1.7 C = 1991 (OSL)
d = 1.8 (OL) 2000
Figure 5-G-24. TxDOT Recovered Binder (Bryan: Original Surface Layer 2005).
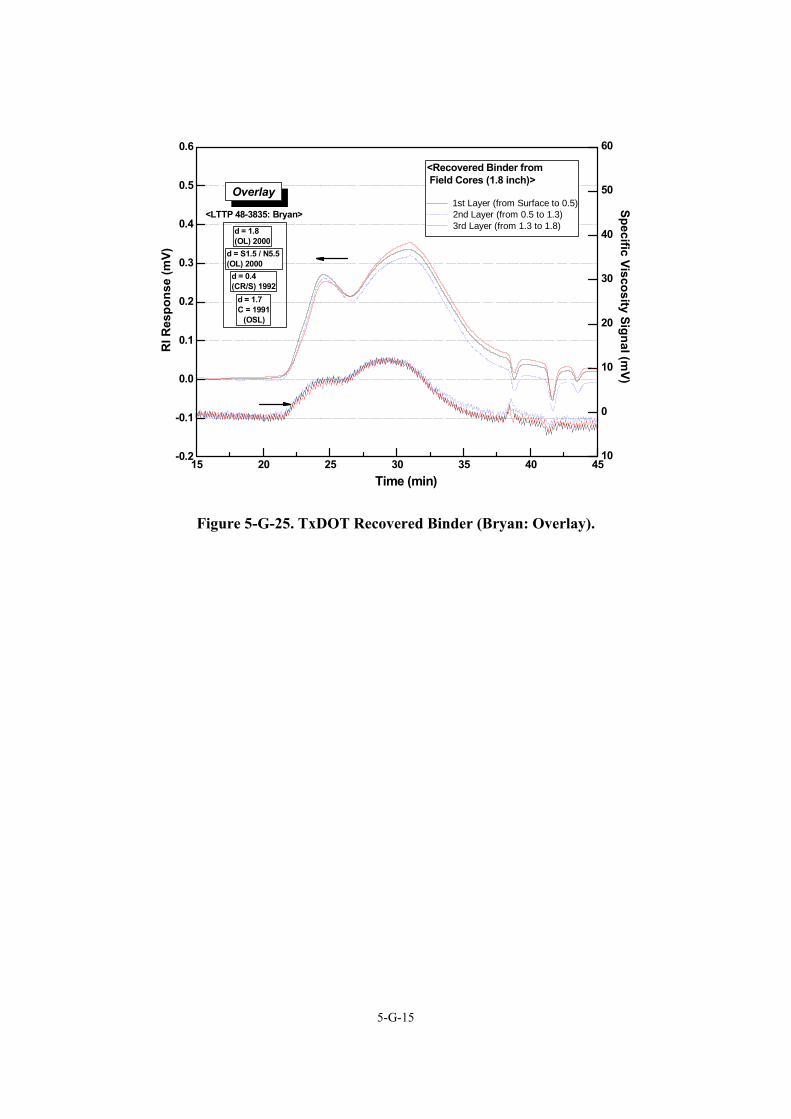
5-G-15
10
0
10
20
30
40
50
60
15 20 25 30 35 40 45-0.2
-0.1
0.0
0.1
0.2
0.3
0.4
0.5
0.6
Overlay
<Recovered Binder from Field Cores (1.8 inch)>
1st Layer (from Surface to 0.5) 2nd Layer (from 0.5 to 1.3) 3rd Layer (from 1.3 to 1.8)
Specific Viscosity Signal (mV)
Time (min)
RI R
espo
nse
(mV)
<LTTP 48-3835: Bryan>
d = S1.5 / N5.5 (OL) 2000
d = 0.4 (CR/S) 1992
d = 1.7 C = 1991 (OSL)
d = 1.8 (OL) 2000
Figure 5-G-25. TxDOT Recovered Binder (Bryan: Overlay).

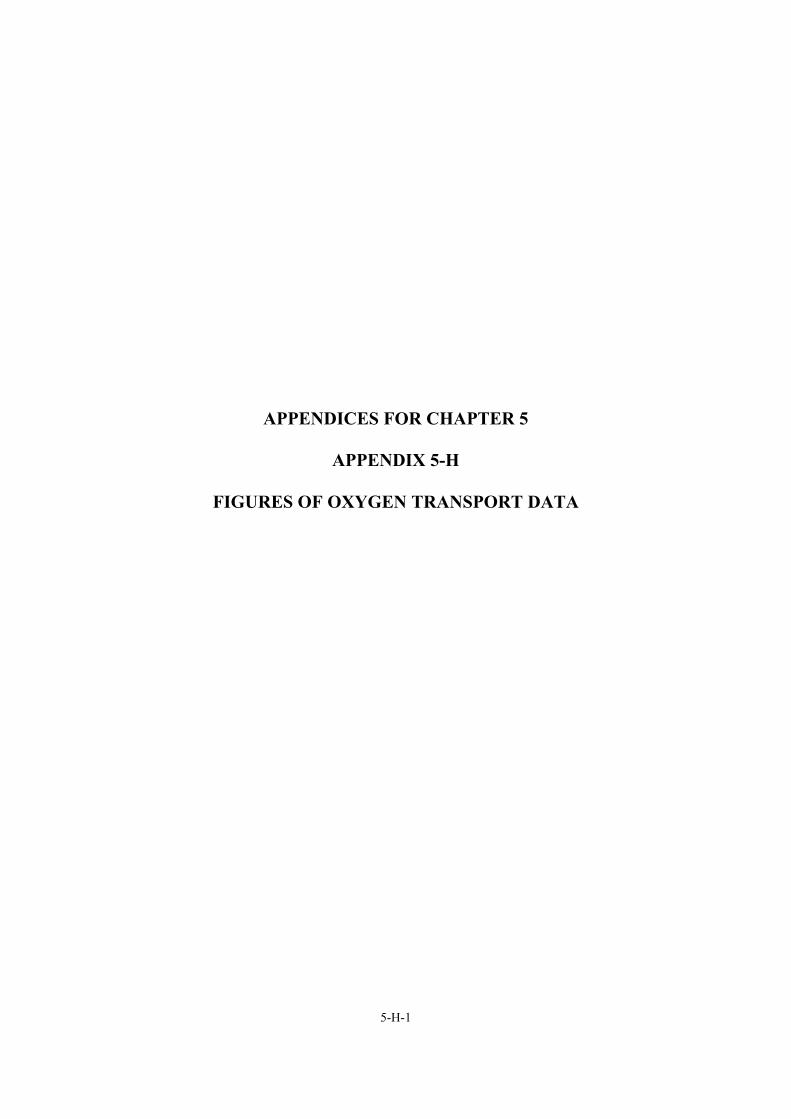
5-H-1
APPENDICES FOR CHAPTER 5
APPENDIX 5-H
FIGURES OF OXYGEN TRANSPORT DATA

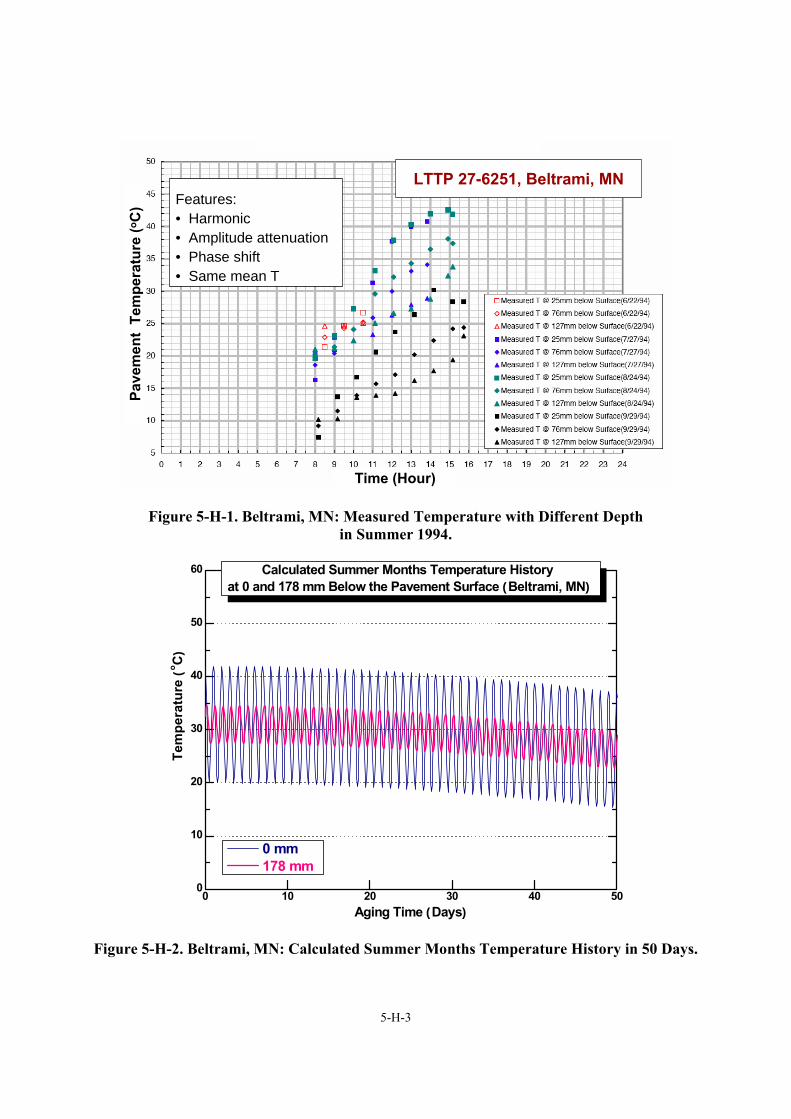
5-H-3
Time (Hour)
Pave
men
t Te
mpe
ratu
re (o
C)
LTTP 27-6251, Beltrami, MNmm
Features:• Harmonic• Amplitude attenuation• Phase shift• Same mean T
Time (Hour)
Pave
men
t Te
mpe
ratu
re (o
C)
Time (Hour)
Pave
men
t Te
mpe
ratu
re (o
C)
LTTP 27-6251, Beltrami, MNmm
Features:• Harmonic• Amplitude attenuation• Phase shift• Same mean T
Figure 5-H-1. Beltrami, MN: Measured Temperature with Different Depth in Summer 1994.
0 10 20 30 40 500
10
20
30
40
50
60
Tem
pera
ture
(o C
)
Aging Time (Days)
Calculated Summer Months Temperature History at 0 and 178 mm Below the Pavement Surface (Beltrami, MN)
0 mm 178 mm
Figure 5-H-2. Beltrami, MN: Calculated Summer Months Temperature History in 50 Days.
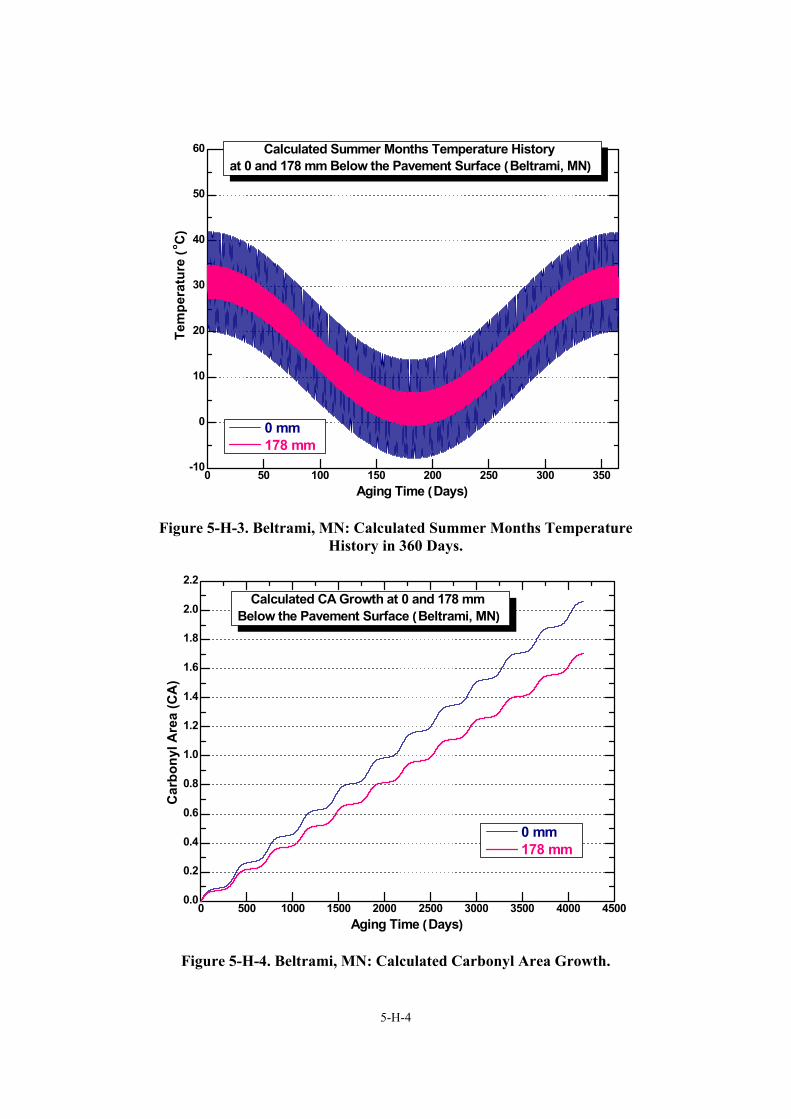
5-H-4
0 50 100 150 200 250 300 350-10
0
10
20
30
40
50
60
Tem
pera
ture
(o C
)
Aging Time (Days)
Calculated Summer Months Temperature History at 0 and 178 mm Below the Pavement Surface (Beltrami, MN)
0 mm 178 mm
Figure 5-H-3. Beltrami, MN: Calculated Summer Months Temperature History in 360 Days.
0 500 1000 1500 2000 2500 3000 3500 4000 45000.0
0.2
0.4
0.6
0.8
1.0
1.2
1.4
1.6
1.8
2.0
2.2
Car
bony
l Are
a (C
A)
0 mm 178 mm
Aging Time (Days)
Calculated CA Growth at 0 and 178 mm Below the Pavement Surface (Beltrami, MN)
Figure 5-H-4. Beltrami, MN: Calculated Carbonyl Area Growth.
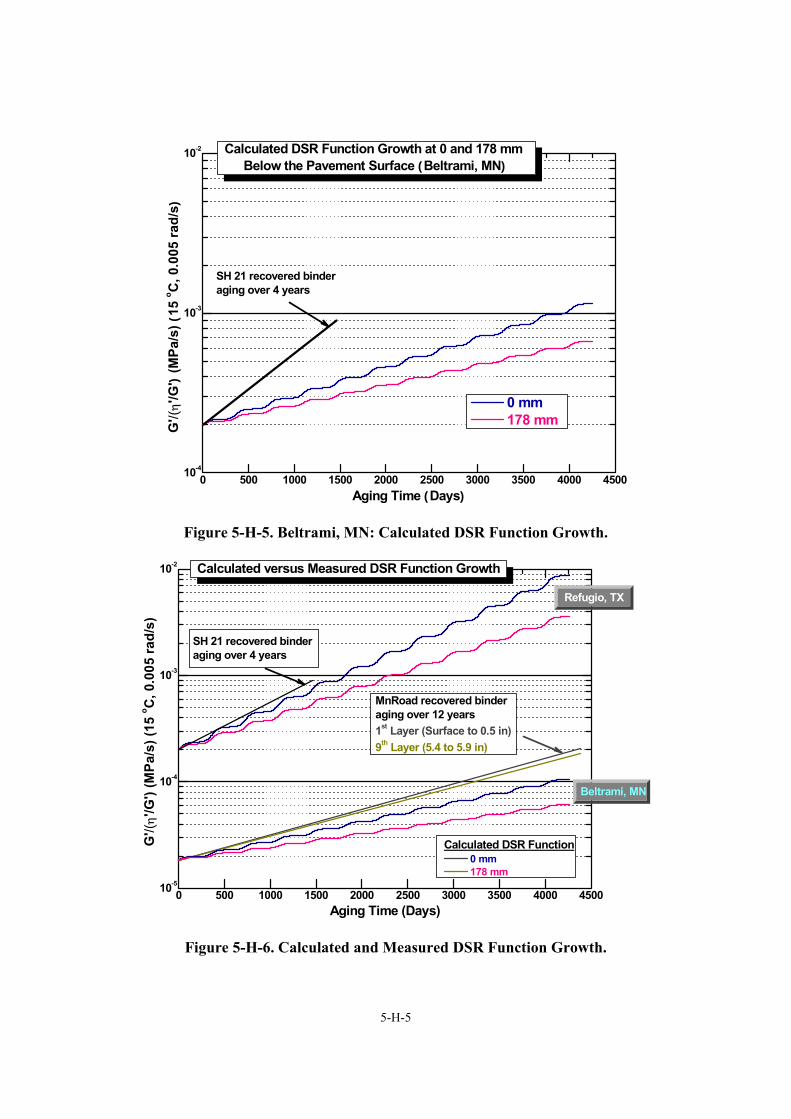
5-H-5
0 500 1000 1500 2000 2500 3000 3500 4000 450010-4
10-3
10-2
G'/(
η'/G
') (M
Pa/s
) (15
o C, 0
.005
rad/
s)
0 mm 178 mm
Aging Time (Days)
Calculated DSR Function Growth at 0 and 178 mm Below the Pavement Surface (Beltrami, MN)
SH 21 recovered binder aging over 4 years
Figure 5-H-5. Beltrami, MN: Calculated DSR Function Growth.
0 500 1000 1500 2000 2500 3000 3500 4000 450010-5
10-4
10-3
10-2
MnRoad recovered binder aging over 12 years1st Layer (Surface to 0.5 in)9th Layer (5.4 to 5.9 in)
Beltrami, MN
Refugio, TX
G'/(
η'/G
') (M
Pa/s
) (15
o C, 0
.005
rad/
s)
Calculated DSR Function 0 mm 178 mm
Aging Time (Days)
Calculated versus Measured DSR Function Growth
SH 21 recovered binder aging over 4 years
Figure 5-H-6. Calculated and Measured DSR Function Growth.

6-A-1
APPENDIX FOR CHAPTER 6
APPENDIX 6-A
TABLES OF BINDER SURFACE ENERGY AND HMAC MIXTURE PROPERTY DATA

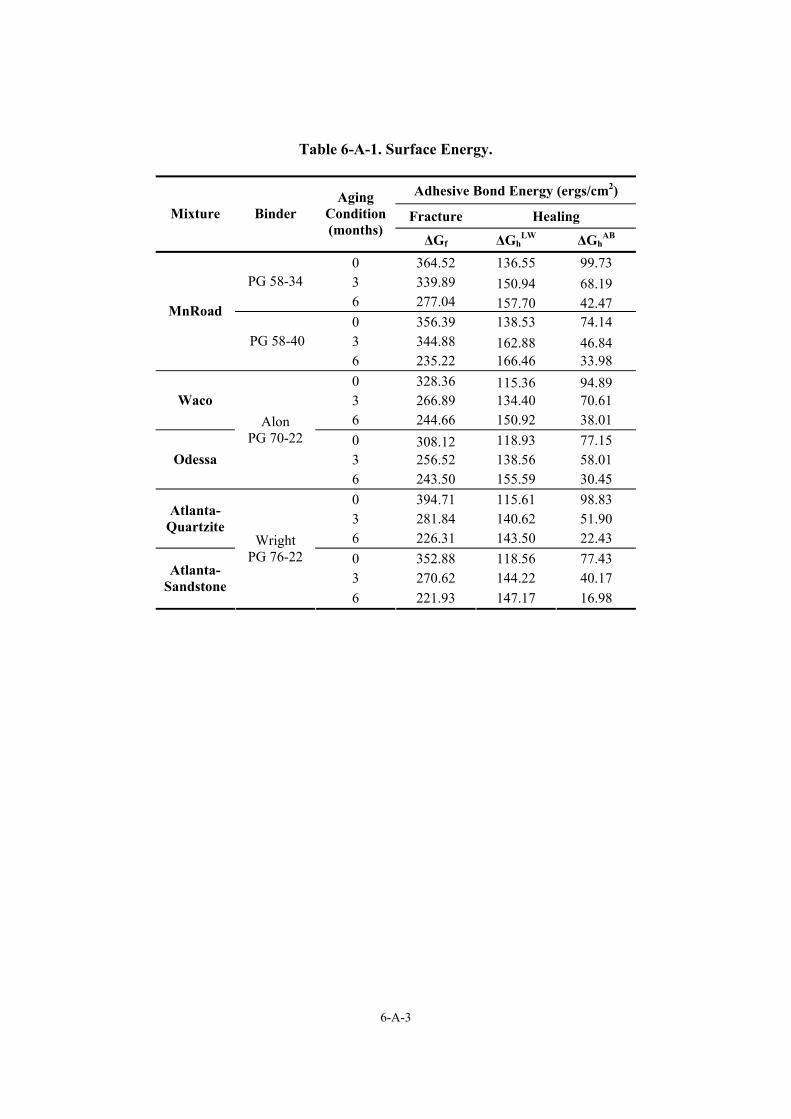
6-A-3
Table 6-A-1. Surface Energy.
Adhesive Bond Energy (ergs/cm2)
Fracture Healing Mixture Binder Aging
Condition (months)
∆Gf ∆GhLW ∆Gh
AB 0 364.52 136.55 99.73 3 339.89 150.94 68.19 PG 58-34 6 277.04 157.70 42.47 0 356.39 138.53 74.14 3 344.88 162.88 46.84
MnRoad
PG 58-40 6 235.22 166.46 33.98 0 328.36 115.36 94.89 3 266.89 134.40 70.61 Waco 6 244.66 150.92 38.01 0 308.12 118.93 77.15 3 256.52 138.56 58.01 Odessa
Alon PG 70-22
6 243.50 155.59 30.45 0 394.71 115.61 98.83 3 281.84 140.62 51.90 Atlanta-
Quartzite 6 226.31 143.50 22.43 0 352.88 118.56 77.43 3 270.62 144.22 40.17 Atlanta-
Sandstone
Wright PG 76-22
6 221.93 147.17 16.98
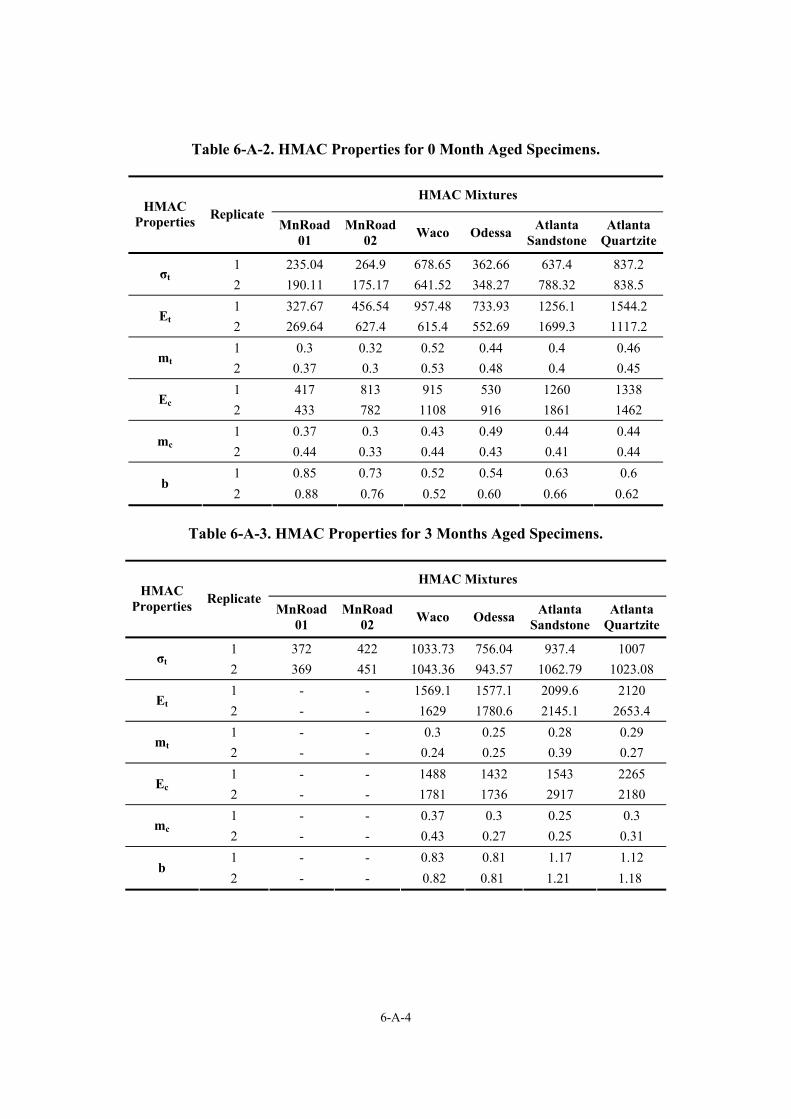
6-A-4
Table 6-A-2. HMAC Properties for 0 Month Aged Specimens.
HMAC Mixtures HMAC
Properties Replicate MnRoad
01 MnRoad
02 Waco Odessa Atlanta Sandstone
Atlanta Quartzite
1 235.04 264.9 678.65 362.66 637.4 837.2 σt
2 190.11 175.17 641.52 348.27 788.32 838.5 1 327.67 456.54 957.48 733.93 1256.1 1544.2
Et 2 269.64 627.4 615.4 552.69 1699.3 1117.2 1 0.3 0.32 0.52 0.44 0.4 0.46
mt 2 0.37 0.3 0.53 0.48 0.4 0.45 1 417 813 915 530 1260 1338
Ec 2 433 782 1108 916 1861 1462 1 0.37 0.3 0.43 0.49 0.44 0.44
mc 2 0.44 0.33 0.44 0.43 0.41 0.44 1 0.85 0.73 0.52 0.54 0.63 0.6
b 2 0.88 0.76 0.52 0.60 0.66 0.62
Table 6-A-3. HMAC Properties for 3 Months Aged Specimens.
HMAC Mixtures HMAC
Properties Replicate MnRoad
01 MnRoad
02 Waco Odessa Atlanta Sandstone
Atlanta Quartzite
1 372 422 1033.73 756.04 937.4 1007 σt
2 369 451 1043.36 943.57 1062.79 1023.08 1 - - 1569.1 1577.1 2099.6 2120
Et 2 - - 1629 1780.6 2145.1 2653.4 1 - - 0.3 0.25 0.28 0.29
mt 2 - - 0.24 0.25 0.39 0.27 1 - - 1488 1432 1543 2265
Ec 2 - - 1781 1736 2917 2180 1 - - 0.37 0.3 0.25 0.3
mc 2 - - 0.43 0.27 0.25 0.31 1 - - 0.83 0.81 1.17 1.12
b 2 - - 0.82 0.81 1.21 1.18
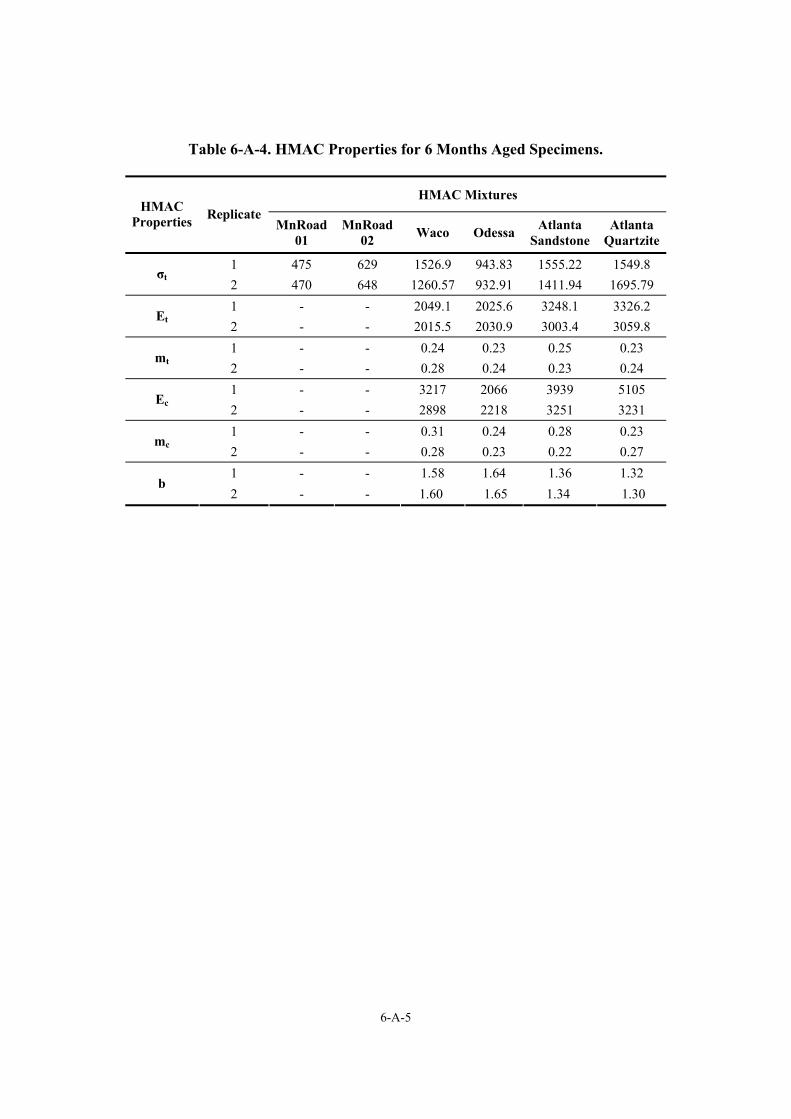
6-A-5
Table 6-A-4. HMAC Properties for 6 Months Aged Specimens.
HMAC Mixtures HMAC
Properties Replicate MnRoad
01 MnRoad
02 Waco Odessa Atlanta Sandstone
Atlanta Quartzite
1 475 629 1526.9 943.83 1555.22 1549.8 σt
2 470 648 1260.57 932.91 1411.94 1695.79 1 - - 2049.1 2025.6 3248.1 3326.2
Et 2 - - 2015.5 2030.9 3003.4 3059.8 1 - - 0.24 0.23 0.25 0.23
mt 2 - - 0.28 0.24 0.23 0.24 1 - - 3217 2066 3939 5105
Ec 2 - - 2898 2218 3251 3231 1 - - 0.31 0.24 0.28 0.23
mc 2 - - 0.28 0.23 0.22 0.27 1 - - 1.58 1.64 1.36 1.32
b 2 - - 1.60 1.65 1.34 1.30

7-A-1
APPENDICES FOR CHAPTER 7
APPENDIX 7-A
TABLES OF RHEOLOGICAL PROPERTIES AND CARBONYL AREA DATA

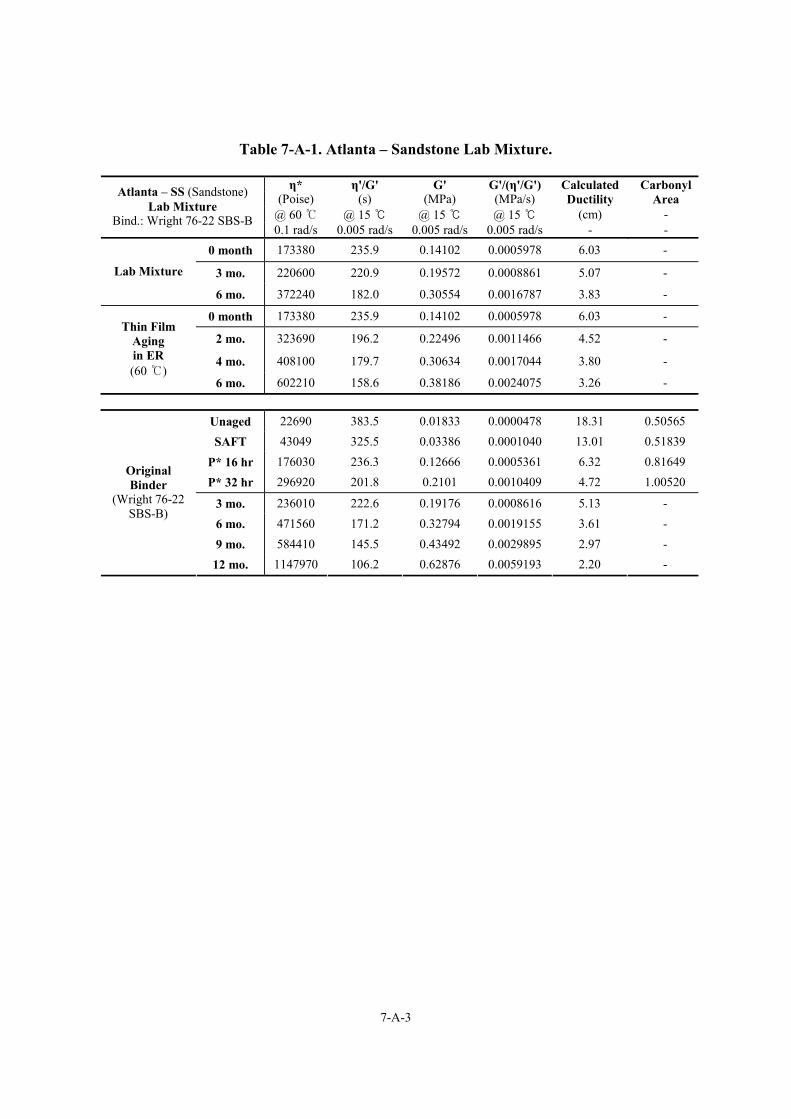
7-A-3
Table 7-A-1. Atlanta – Sandstone Lab Mixture.
η* η'/G' G' G'/(η'/G') Calculated Carbonyl (Poise) (s) (MPa) (MPa/s) Ductility Area
@ 60 ℃ @ 15 ℃ @ 15 ℃ @ 15 ℃ (cm) -
Atlanta – SS (Sandstone) Lab Mixture
Bind.: Wright 76-22 SBS-B 0.1 rad/s 0.005 rad/s 0.005 rad/s 0.005 rad/s - -
0 month 173380 235.9 0.14102 0.0005978 6.03 -
3 mo. 220600 220.9 0.19572 0.0008861 5.07 - Lab Mixture
6 mo. 372240 182.0 0.30554 0.0016787 3.83 -
0 month 173380 235.9 0.14102 0.0005978 6.03 -
2 mo. 323690 196.2 0.22496 0.0011466 4.52 -
4 mo. 408100 179.7 0.30634 0.0017044 3.80 -
Thin Film Aging in ER (60 ℃)
6 mo. 602210 158.6 0.38186 0.0024075 3.26 -
Unaged 22690 383.5 0.01833 0.0000478 18.31 0.50565 SAFT 43049 325.5 0.03386 0.0001040 13.01 0.51839
P* 16 hr 176030 236.3 0.12666 0.0005361 6.32 0.81649 P* 32 hr 296920 201.8 0.2101 0.0010409 4.72 1.00520
3 mo. 236010 222.6 0.19176 0.0008616 5.13 - 6 mo. 471560 171.2 0.32794 0.0019155 3.61 - 9 mo. 584410 145.5 0.43492 0.0029895 2.97 -
Original Binder
(Wright 76-22 SBS-B)
12 mo. 1147970 106.2 0.62876 0.0059193 2.20 -
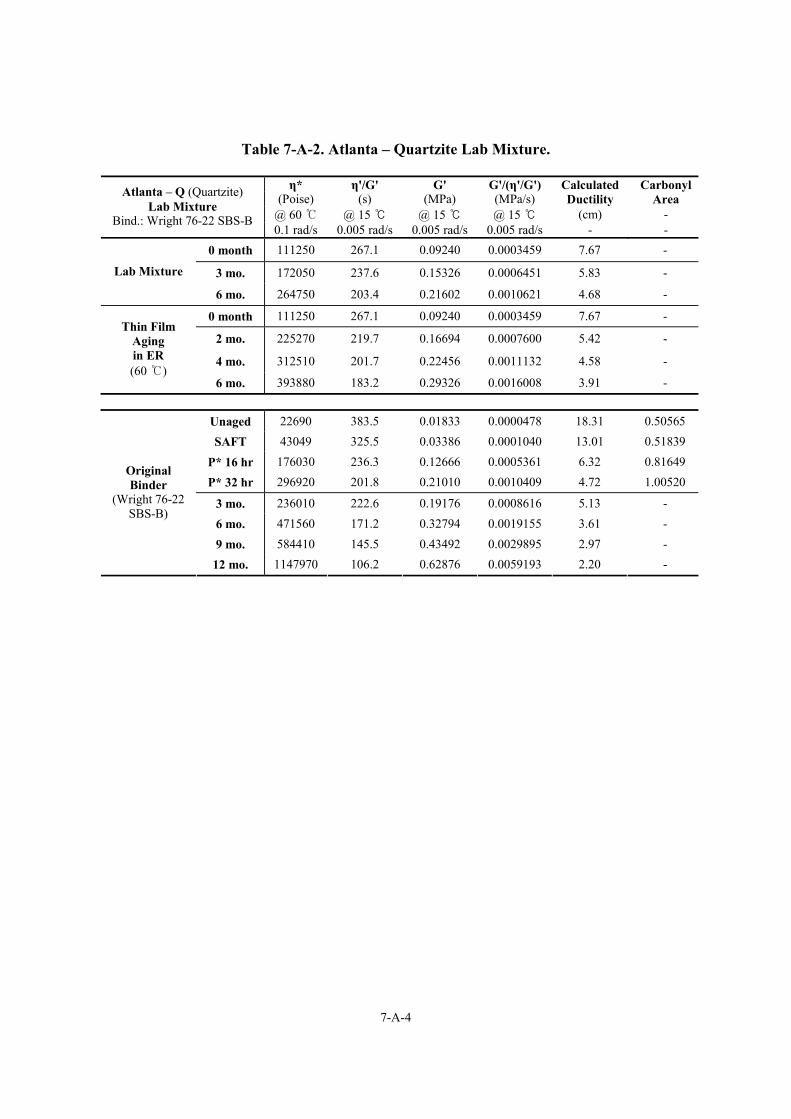
7-A-4
Table 7-A-2. Atlanta – Quartzite Lab Mixture.
η* η'/G' G' G'/(η'/G') Calculated Carbonyl (Poise) (s) (MPa) (MPa/s) Ductility Area
@ 60 ℃ @ 15 ℃ @ 15 ℃ @ 15 ℃ (cm) -
Atlanta – Q (Quartzite) Lab Mixture
Bind.: Wright 76-22 SBS-B 0.1 rad/s 0.005 rad/s 0.005 rad/s 0.005 rad/s - -
0 month 111250 267.1 0.09240 0.0003459 7.67 -
3 mo. 172050 237.6 0.15326 0.0006451 5.83 - Lab Mixture
6 mo. 264750 203.4 0.21602 0.0010621 4.68 -
0 month 111250 267.1 0.09240 0.0003459 7.67 -
2 mo. 225270 219.7 0.16694 0.0007600 5.42 -
4 mo. 312510 201.7 0.22456 0.0011132 4.58 -
Thin Film Aging in ER (60 ℃)
6 mo. 393880 183.2 0.29326 0.0016008 3.91 -
Unaged 22690 383.5 0.01833 0.0000478 18.31 0.50565 SAFT 43049 325.5 0.03386 0.0001040 13.01 0.51839
P* 16 hr 176030 236.3 0.12666 0.0005361 6.32 0.81649 P* 32 hr 296920 201.8 0.21010 0.0010409 4.72 1.00520
3 mo. 236010 222.6 0.19176 0.0008616 5.13 - 6 mo. 471560 171.2 0.32794 0.0019155 3.61 - 9 mo. 584410 145.5 0.43492 0.0029895 2.97 -
Original Binder
(Wright 76-22 SBS-B)
12 mo. 1147970 106.2 0.62876 0.0059193 2.20 -
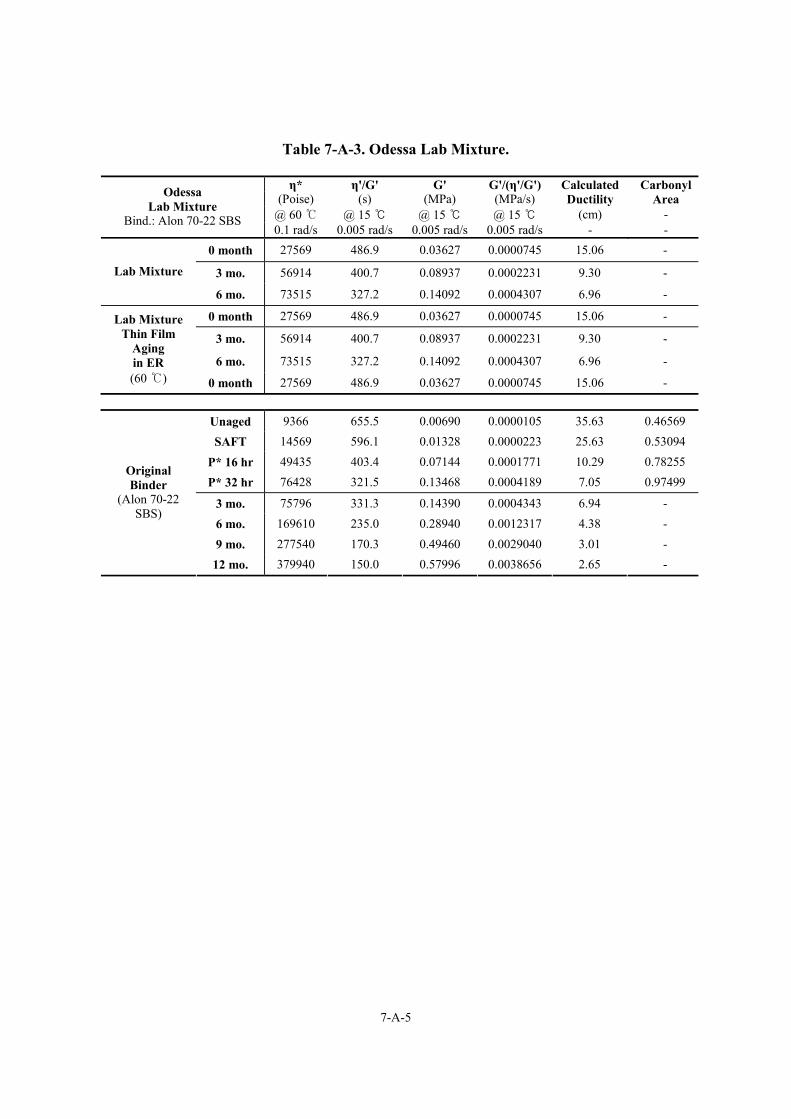
7-A-5
Table 7-A-3. Odessa Lab Mixture.
η* η'/G' G' G'/(η'/G') Calculated Carbonyl (Poise) (s) (MPa) (MPa/s) Ductility Area
@ 60 ℃ @ 15 ℃ @ 15 ℃ @ 15 ℃ (cm) -
Odessa Lab Mixture
Bind.: Alon 70-22 SBS 0.1 rad/s 0.005 rad/s 0.005 rad/s 0.005 rad/s - -
0 month 27569 486.9 0.03627 0.0000745 15.06 -
3 mo. 56914 400.7 0.08937 0.0002231 9.30 - Lab Mixture
6 mo. 73515 327.2 0.14092 0.0004307 6.96 -
0 month 27569 486.9 0.03627 0.0000745 15.06 -
3 mo. 56914 400.7 0.08937 0.0002231 9.30 -
6 mo. 73515 327.2 0.14092 0.0004307 6.96 -
Lab Mixture Thin Film
Aging in ER (60 ℃) 0 month 27569 486.9 0.03627 0.0000745 15.06 -
Unaged 9366 655.5 0.00690 0.0000105 35.63 0.46569 SAFT 14569 596.1 0.01328 0.0000223 25.63 0.53094
P* 16 hr 49435 403.4 0.07144 0.0001771 10.29 0.78255 P* 32 hr 76428 321.5 0.13468 0.0004189 7.05 0.97499
3 mo. 75796 331.3 0.14390 0.0004343 6.94 - 6 mo. 169610 235.0 0.28940 0.0012317 4.38 - 9 mo. 277540 170.3 0.49460 0.0029040 3.01 -
Original Binder
(Alon 70-22 SBS)
12 mo. 379940 150.0 0.57996 0.0038656 2.65 -
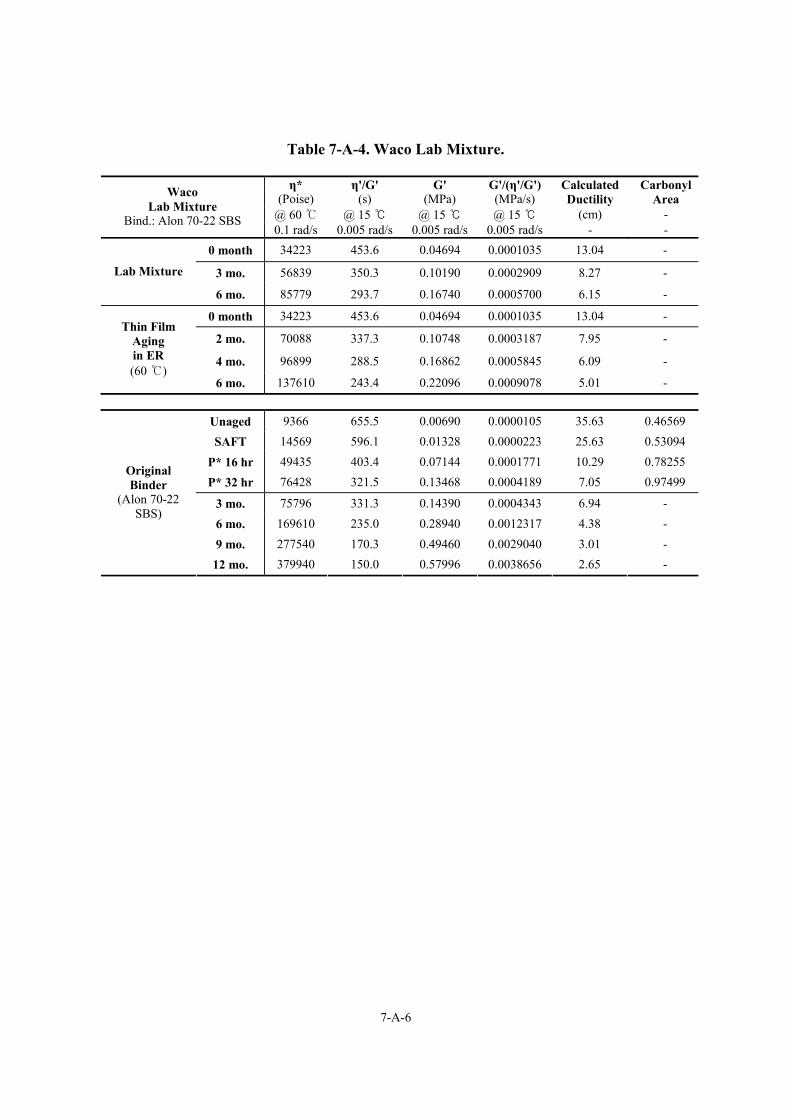
7-A-6
Table 7-A-4. Waco Lab Mixture.
η* η'/G' G' G'/(η'/G') Calculated Carbonyl (Poise) (s) (MPa) (MPa/s) Ductility Area
@ 60 ℃ @ 15 ℃ @ 15 ℃ @ 15 ℃ (cm) -
Waco Lab Mixture
Bind.: Alon 70-22 SBS 0.1 rad/s 0.005 rad/s 0.005 rad/s 0.005 rad/s - -
0 month 34223 453.6 0.04694 0.0001035 13.04 -
3 mo. 56839 350.3 0.10190 0.0002909 8.27 - Lab Mixture
6 mo. 85779 293.7 0.16740 0.0005700 6.15 -
0 month 34223 453.6 0.04694 0.0001035 13.04 -
2 mo. 70088 337.3 0.10748 0.0003187 7.95 -
4 mo. 96899 288.5 0.16862 0.0005845 6.09 -
Thin Film Aging in ER (60 ℃)
6 mo. 137610 243.4 0.22096 0.0009078 5.01 -
Unaged 9366 655.5 0.00690 0.0000105 35.63 0.46569 SAFT 14569 596.1 0.01328 0.0000223 25.63 0.53094
P* 16 hr 49435 403.4 0.07144 0.0001771 10.29 0.78255 P* 32 hr 76428 321.5 0.13468 0.0004189 7.05 0.97499
3 mo. 75796 331.3 0.14390 0.0004343 6.94 - 6 mo. 169610 235.0 0.28940 0.0012317 4.38 - 9 mo. 277540 170.3 0.49460 0.0029040 3.01 -
Original Binder
(Alon 70-22 SBS)
12 mo. 379940 150.0 0.57996 0.0038656 2.65 -
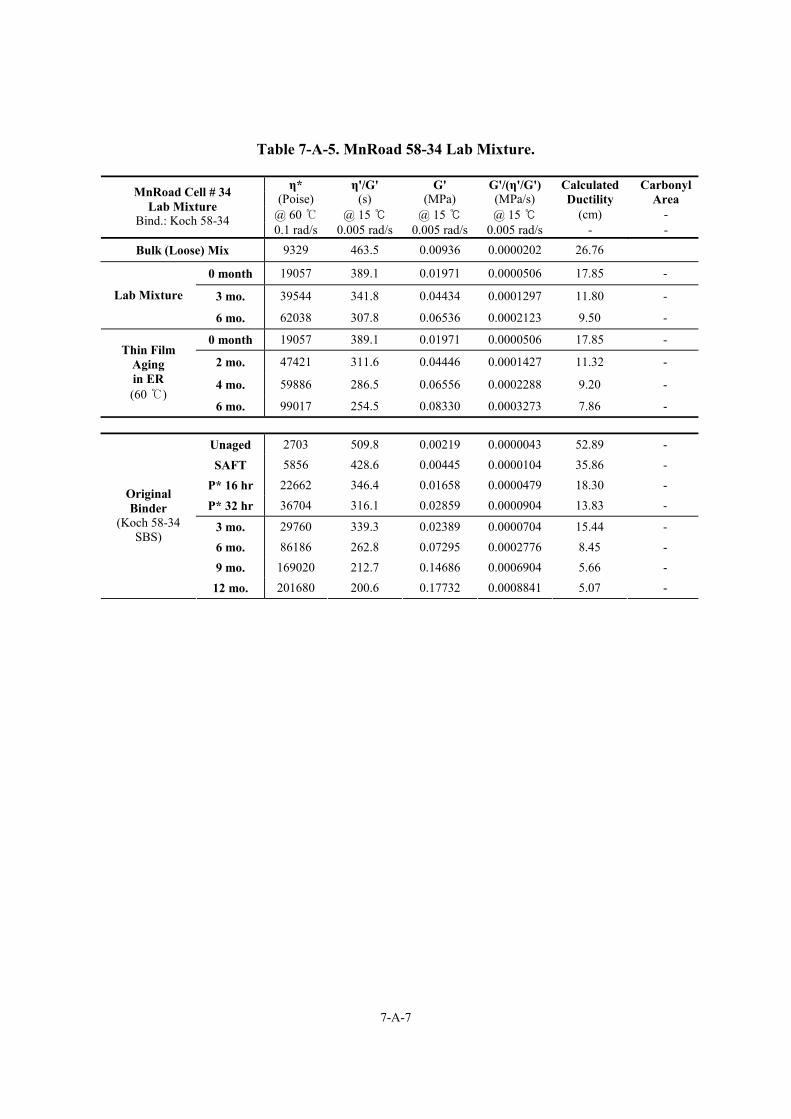
7-A-7
Table 7-A-5. MnRoad 58-34 Lab Mixture.
η* η'/G' G' G'/(η'/G') Calculated Carbonyl (Poise) (s) (MPa) (MPa/s) Ductility Area
@ 60 ℃ @ 15 ℃ @ 15 ℃ @ 15 ℃ (cm) -
MnRoad Cell # 34 Lab Mixture
Bind.: Koch 58-34 0.1 rad/s 0.005 rad/s 0.005 rad/s 0.005 rad/s - -
Bulk (Loose) Mix 9329 463.5 0.00936 0.0000202 26.76
0 month 19057 389.1 0.01971 0.0000506 17.85 -
3 mo. 39544 341.8 0.04434 0.0001297 11.80 - Lab Mixture
6 mo. 62038 307.8 0.06536 0.0002123 9.50 -
0 month 19057 389.1 0.01971 0.0000506 17.85 -
2 mo. 47421 311.6 0.04446 0.0001427 11.32 -
4 mo. 59886 286.5 0.06556 0.0002288 9.20 -
Thin Film Aging in ER (60 ℃)
6 mo. 99017 254.5 0.08330 0.0003273 7.86 -
Unaged 2703 509.8 0.00219 0.0000043 52.89 - SAFT 5856 428.6 0.00445 0.0000104 35.86 -
P* 16 hr 22662 346.4 0.01658 0.0000479 18.30 - P* 32 hr 36704 316.1 0.02859 0.0000904 13.83 -
3 mo. 29760 339.3 0.02389 0.0000704 15.44 - 6 mo. 86186 262.8 0.07295 0.0002776 8.45 - 9 mo. 169020 212.7 0.14686 0.0006904 5.66 -
Original Binder
(Koch 58-34 SBS)
12 mo. 201680 200.6 0.17732 0.0008841 5.07 -
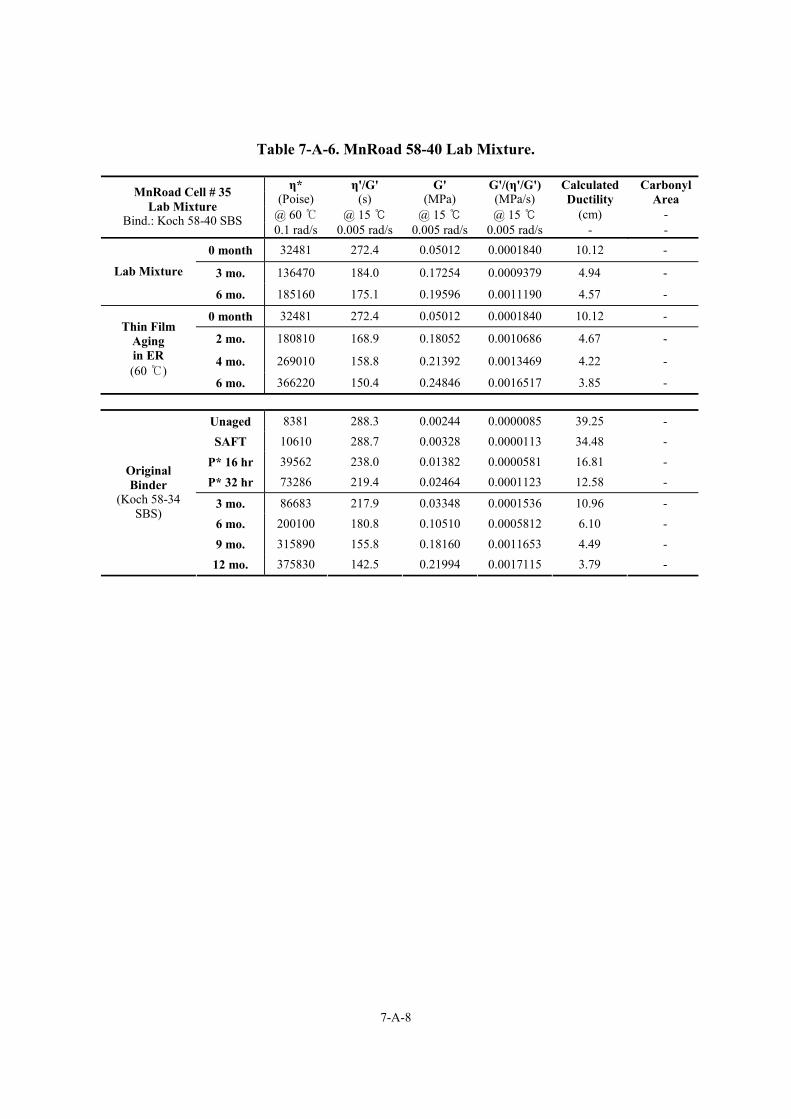
7-A-8
Table 7-A-6. MnRoad 58-40 Lab Mixture.
η* η'/G' G' G'/(η'/G') Calculated Carbonyl (Poise) (s) (MPa) (MPa/s) Ductility Area
@ 60 ℃ @ 15 ℃ @ 15 ℃ @ 15 ℃ (cm) -
MnRoad Cell # 35 Lab Mixture
Bind.: Koch 58-40 SBS 0.1 rad/s 0.005 rad/s 0.005 rad/s 0.005 rad/s - -
0 month 32481 272.4 0.05012 0.0001840 10.12 -
3 mo. 136470 184.0 0.17254 0.0009379 4.94 - Lab Mixture
6 mo. 185160 175.1 0.19596 0.0011190 4.57 -
0 month 32481 272.4 0.05012 0.0001840 10.12 -
2 mo. 180810 168.9 0.18052 0.0010686 4.67 -
4 mo. 269010 158.8 0.21392 0.0013469 4.22 -
Thin Film Aging in ER (60 ℃)
6 mo. 366220 150.4 0.24846 0.0016517 3.85 -
Unaged 8381 288.3 0.00244 0.0000085 39.25 - SAFT 10610 288.7 0.00328 0.0000113 34.48 -
P* 16 hr 39562 238.0 0.01382 0.0000581 16.81 - P* 32 hr 73286 219.4 0.02464 0.0001123 12.58 -
3 mo. 86683 217.9 0.03348 0.0001536 10.96 - 6 mo. 200100 180.8 0.10510 0.0005812 6.10 - 9 mo. 315890 155.8 0.18160 0.0011653 4.49 -
Original Binder
(Koch 58-34 SBS)
12 mo. 375830 142.5 0.21994 0.0017115 3.79 -
7-B-1
APPENDICES FOR CHAPTER 7
APPENDIX 7-B
FIGURES OF BINDER CONTENT AND MASTER CURVE DATA

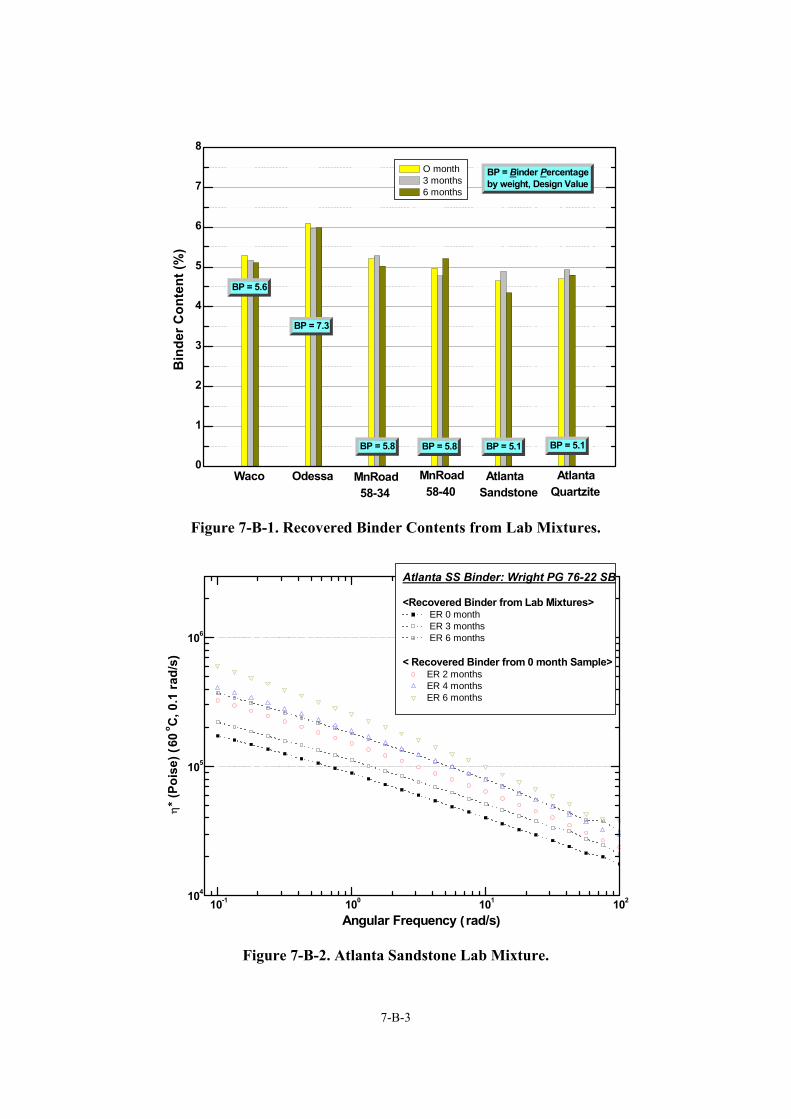
7-B-3
0
1
2
3
4
5
6
7
8
BP = Binder Percentageby weight, Design Value
BP = 5.1BP = 5.1BP = 5.8BP = 5.8
AtlantaQuartzite
AtlantaSandstone
MnRoad 58-40
MnRoad 58-34
Odessa
BP = 5.6
BP = 7.3
Bin
der C
onte
nt (%
) O month 3 months 6 months
Waco
Figure 7-B-1. Recovered Binder Contents from Lab Mixtures.
10-1 100 101 102104
105
106
Angular Frequency (rad/s)
η* (
Pois
e) (
60 o C
, 0.1
rad/
s)
Atlanta SS Binder: Wright PG 76-22 SB
<Recovered Binder from Lab Mixtures> ER 0 month ER 3 months ER 6 months
< Recovered Binder from 0 month Sample> ER 2 months ER 4 months ER 6 months
Figure 7-B-2. Atlanta Sandstone Lab Mixture.
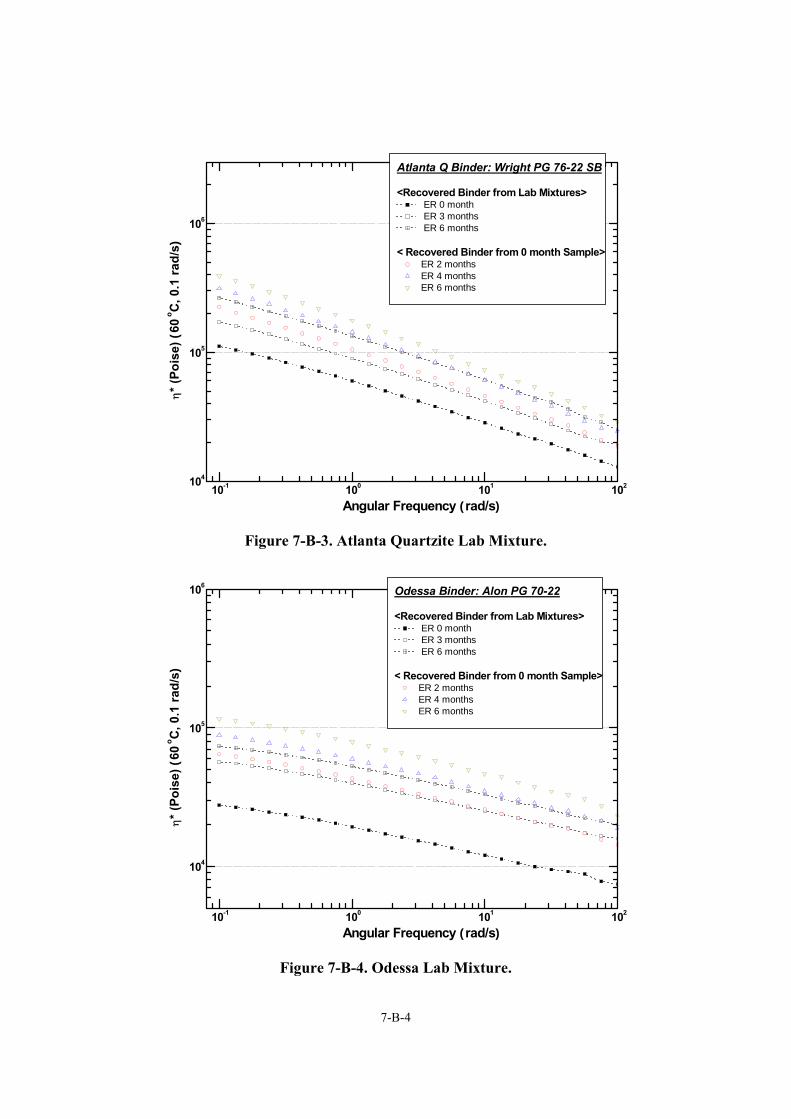
7-B-4
10-1 100 101 102104
105
106
Angular Frequency (rad/s)
η* (
Pois
e) (
60 o C
, 0.1
rad/
s)Atlanta Q Binder: Wright PG 76-22 SB
<Recovered Binder from Lab Mixtures> ER 0 month ER 3 months ER 6 months
< Recovered Binder from 0 month Sample> ER 2 months ER 4 months ER 6 months
Figure 7-B-3. Atlanta Quartzite Lab Mixture.
10-1 100 101 102
104
105
106
Angular Frequency (rad/s)
η* (
Pois
e) (
60 o C
, 0.1
rad/
s)
Odessa Binder: Alon PG 70-22
<Recovered Binder from Lab Mixtures> ER 0 month ER 3 months ER 6 months
< Recovered Binder from 0 month Sample> ER 2 months ER 4 months ER 6 months
Figure 7-B-4. Odessa Lab Mixture.
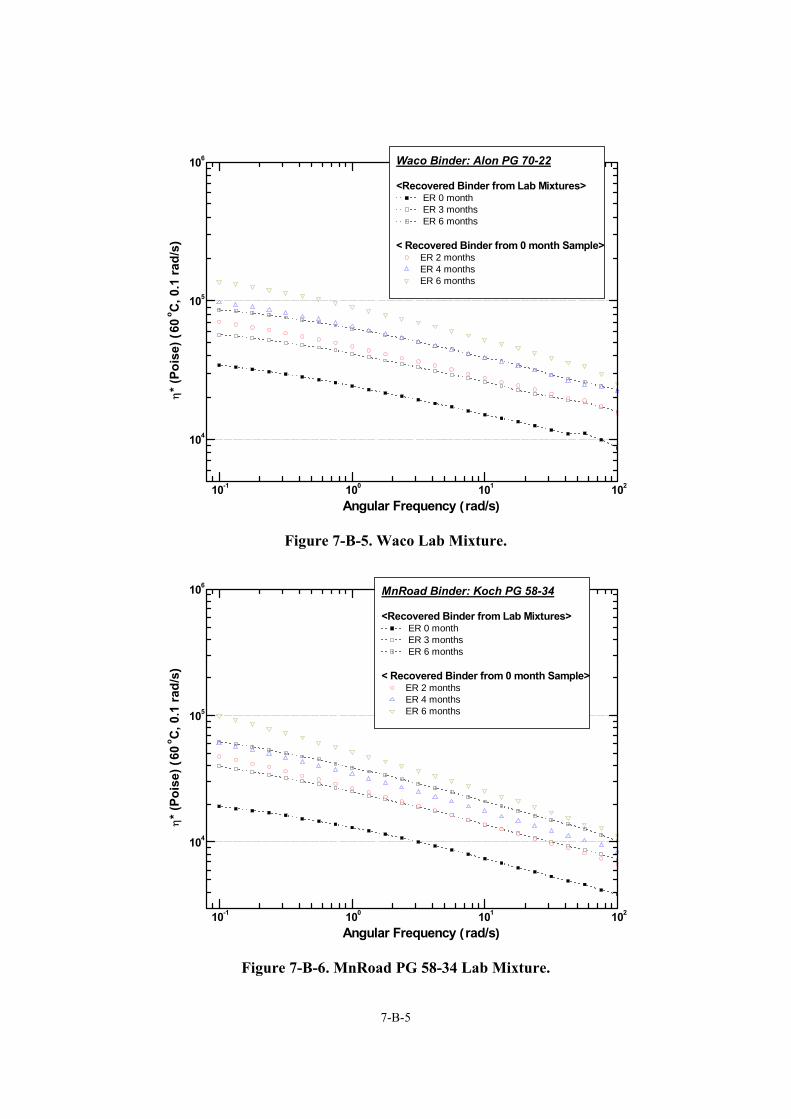
7-B-5
10-1 100 101 102
104
105
106
Angular Frequency (rad/s)
η* (
Pois
e) (
60 o C
, 0.1
rad/
s)Waco Binder: Alon PG 70-22
<Recovered Binder from Lab Mixtures> ER 0 month ER 3 months ER 6 months
< Recovered Binder from 0 month Sample> ER 2 months ER 4 months ER 6 months
Figure 7-B-5. Waco Lab Mixture.
10-1 100 101 102
104
105
106
Angular Frequency (rad/s)
η* (
Pois
e) (
60 o C
, 0.1
rad/
s)
MnRoad Binder: Koch PG 58-34
<Recovered Binder from Lab Mixtures> ER 0 month ER 3 months ER 6 months
< Recovered Binder from 0 month Sample> ER 2 months ER 4 months ER 6 months
Figure 7-B-6. MnRoad PG 58-34 Lab Mixture.
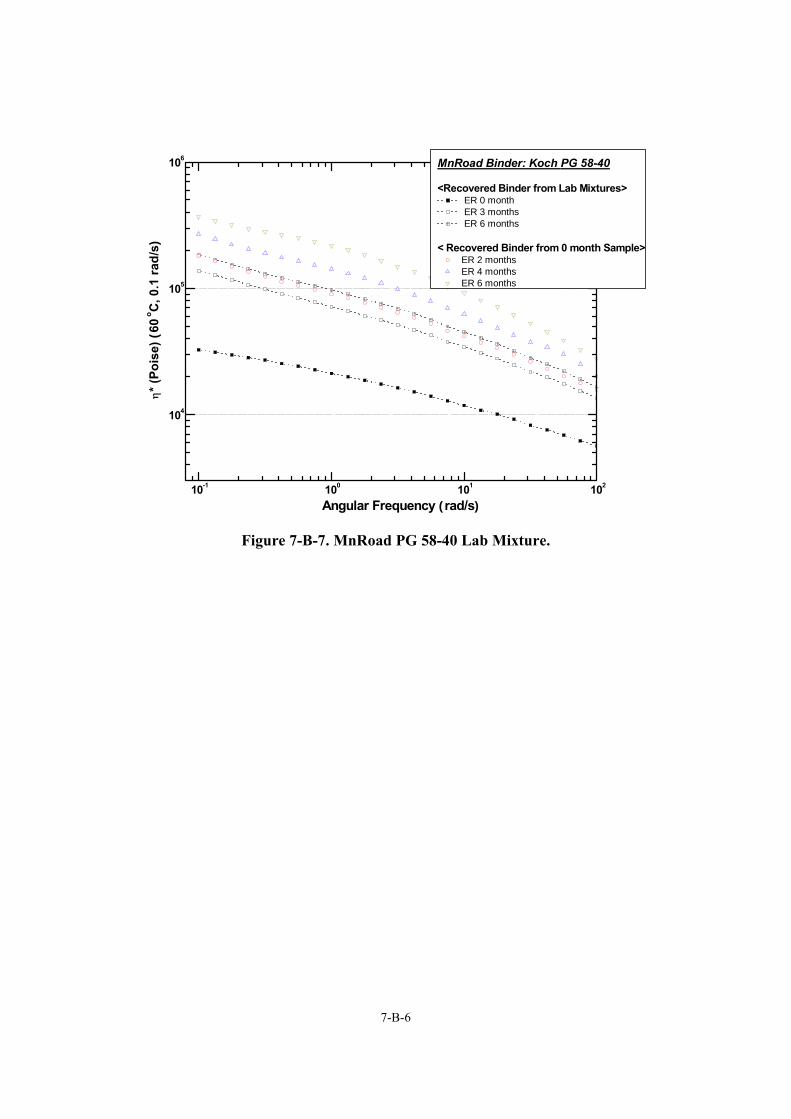
7-B-6
10-1 100 101 102
104
105
106
Angular Frequency (rad/s)
η* (
Pois
e) (
60 o C
, 0.1
rad/
s)MnRoad Binder: Koch PG 58-40
<Recovered Binder from Lab Mixtures> ER 0 month ER 3 months ER 6 months
< Recovered Binder from 0 month Sample> ER 2 months ER 4 months ER 6 months
Figure 7-B-7. MnRoad PG 58-40 Lab Mixture.
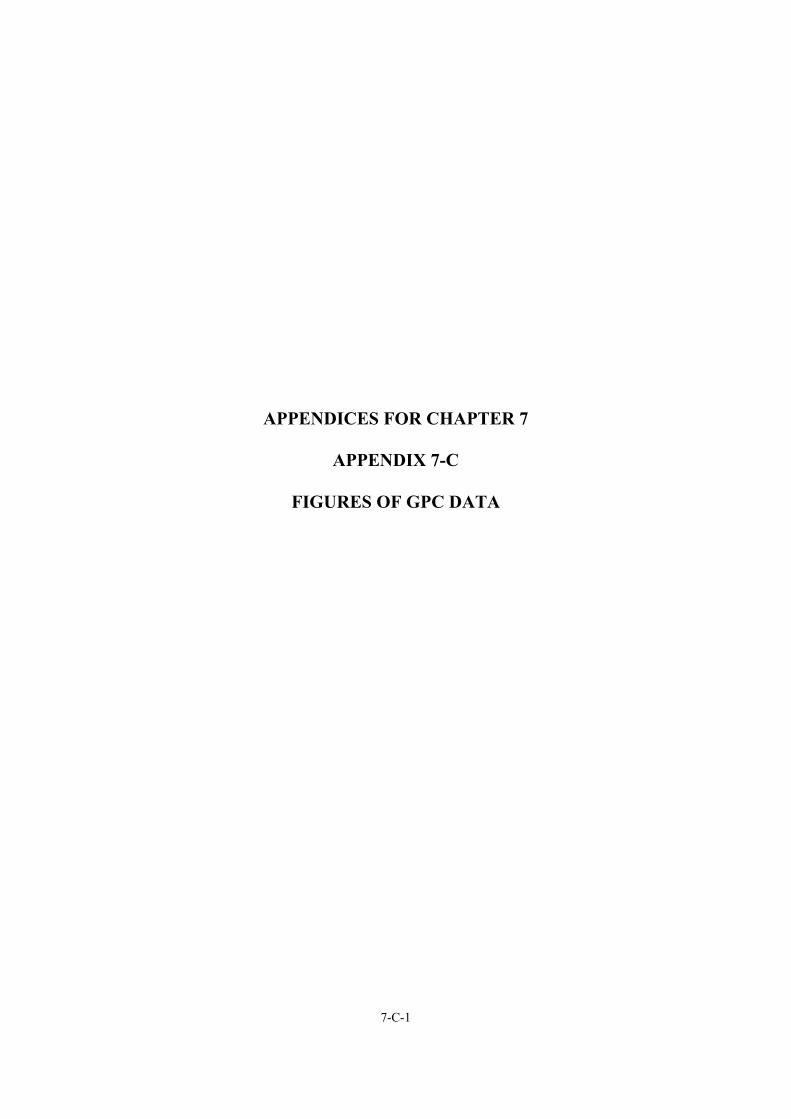
7-C-1
APPENDICES FOR CHAPTER 7
APPENDIX 7-C
FIGURES OF GPC DATA

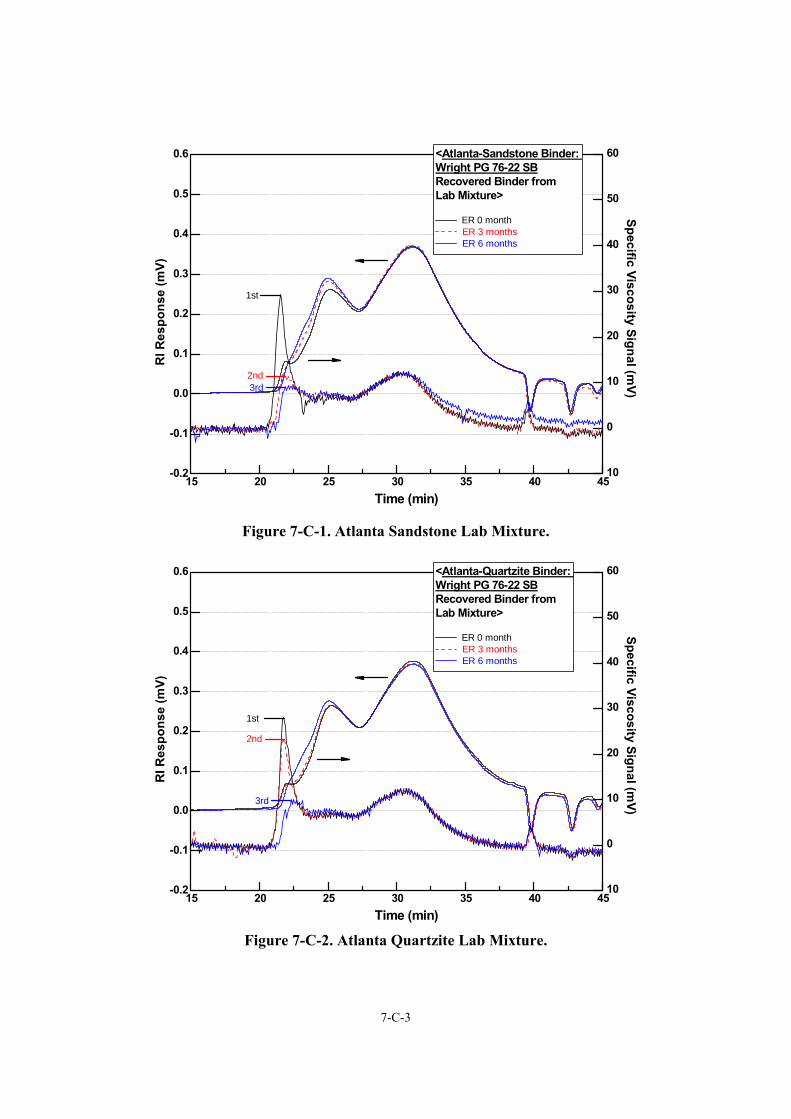
7-C-3
10
0
10
20
30
40
50
60
15 20 25 30 35 40 45-0.2
-0.1
0.0
0.1
0.2
0.3
0.4
0.5
0.6 <Atlanta-Sandstone Binder: Wright PG 76-22 SBRecovered Binder from Lab Mixture>
ER 0 month ER 3 months ER 6 months
Specific Viscosity Signal (mV)
Time (min)
RI R
espo
nse
(mV)
1st
2nd3rd
Figure 7-C-1. Atlanta Sandstone Lab Mixture.
10
0
10
20
30
40
50
60
15 20 25 30 35 40 45-0.2
-0.1
0.0
0.1
0.2
0.3
0.4
0.5
0.6 <Atlanta-Quartzite Binder: Wright PG 76-22 SBRecovered Binder from Lab Mixture>
ER 0 month ER 3 months ER 6 months
Specific Viscosity Signal (mV)
Time (min)
RI R
espo
nse
(mV)
1st
2nd
3rd
Figure 7-C-2. Atlanta Quartzite Lab Mixture.
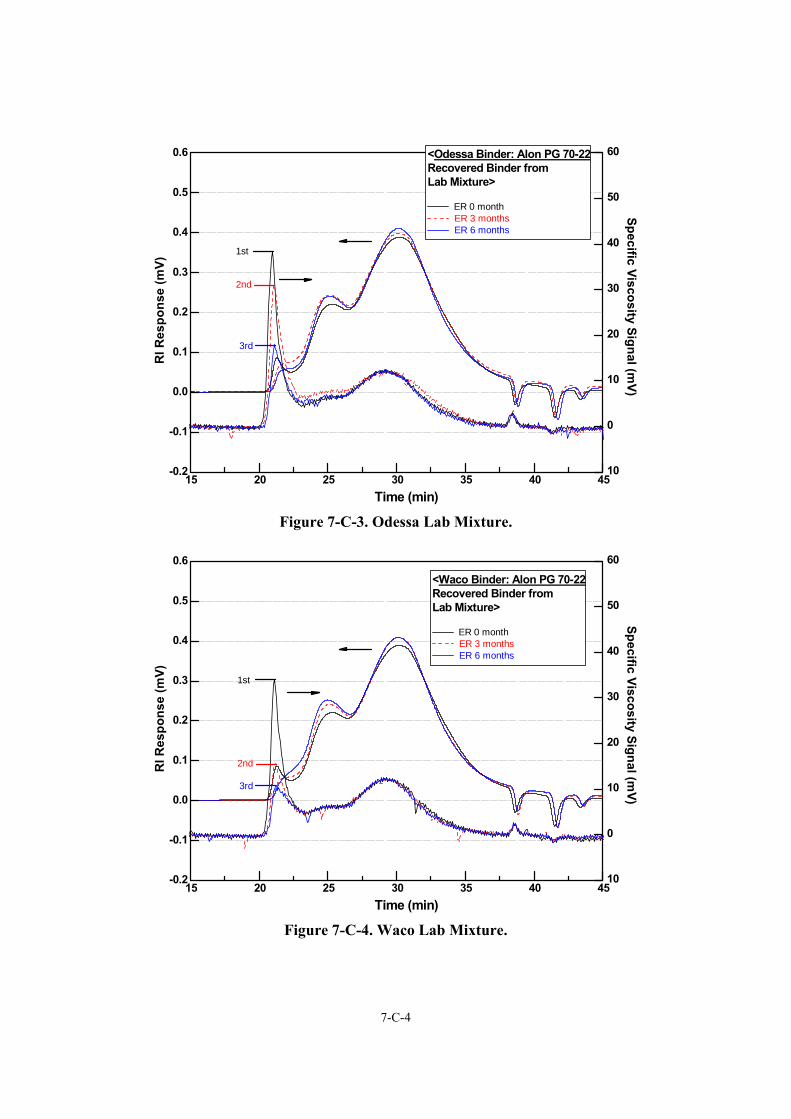
7-C-4
10
0
10
20
30
40
50
60
15 20 25 30 35 40 45-0.2
-0.1
0.0
0.1
0.2
0.3
0.4
0.5
0.6 <Odessa Binder: Alon PG 70-22Recovered Binder from Lab Mixture>
ER 0 month ER 3 months ER 6 months
Specific Viscosity Signal (mV)
Time (min)
RI R
espo
nse
(mV)
1st
2nd
3rd
Figure 7-C-3. Odessa Lab Mixture.
10
0
10
20
30
40
50
60
15 20 25 30 35 40 45-0.2
-0.1
0.0
0.1
0.2
0.3
0.4
0.5
0.6<Waco Binder: Alon PG 70-22Recovered Binder from Lab Mixture>
ER 0 month ER 3 months ER 6 months
Specific Viscosity Signal (mV)
Time (min)
RI R
espo
nse
(mV) 1st
2nd
3rd
Figure 7-C-4. Waco Lab Mixture.
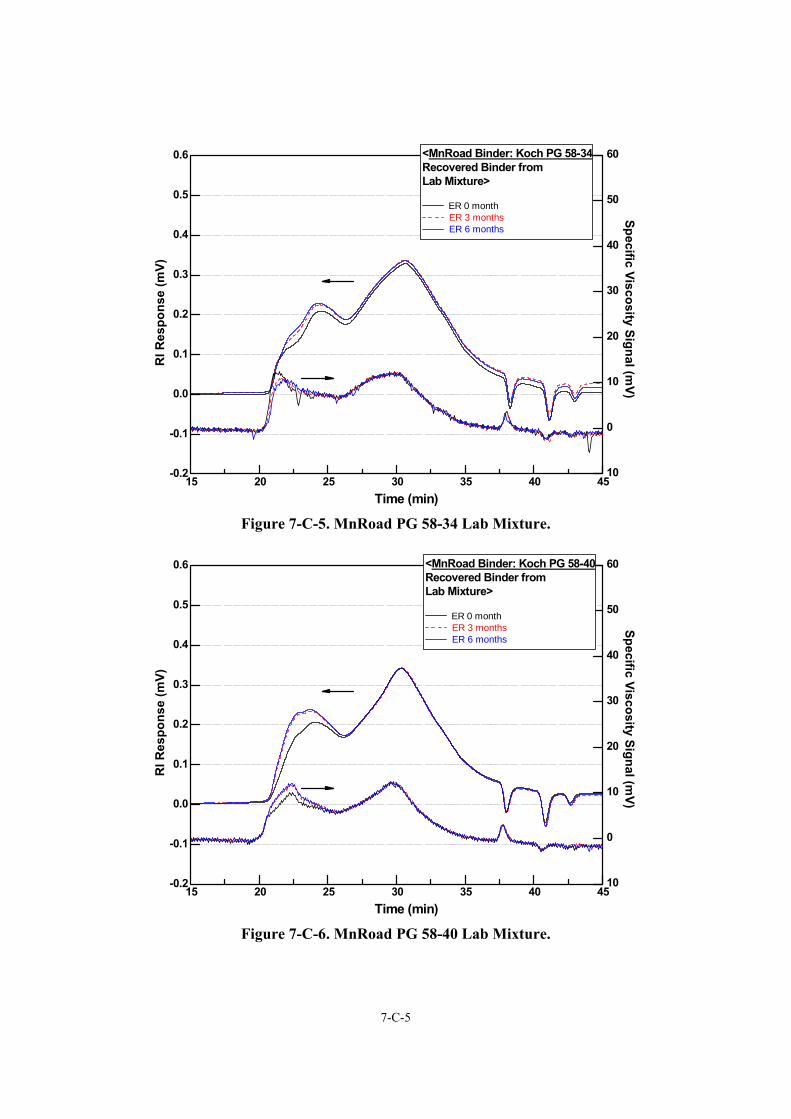
7-C-5
10
0
10
20
30
40
50
60
15 20 25 30 35 40 45-0.2
-0.1
0.0
0.1
0.2
0.3
0.4
0.5
0.6 <MnRoad Binder: Koch PG 58-34Recovered Binder from Lab Mixture>
ER 0 month ER 3 months ER 6 months
Specific Viscosity Signal (mV)
Time (min)
RI R
espo
nse
(mV)
Figure 7-C-5. MnRoad PG 58-34 Lab Mixture.
10
0
10
20
30
40
50
60
15 20 25 30 35 40 45-0.2
-0.1
0.0
0.1
0.2
0.3
0.4
0.5
0.6 <MnRoad Binder: Koch PG 58-40Recovered Binder from Lab Mixture>
ER 0 month ER 3 months ER 6 months
Specific Viscosity Signal (mV)
Time (min)
RI R
espo
nse
(mV)
Figure 7-C-6. MnRoad PG 58-40 Lab Mixture.

8-A-1
APPENDICES FOR CHAPTER 8
APPENDIX 8-A
TABLE AND FIGURES OF PROTOCOL CRITERIA DATA

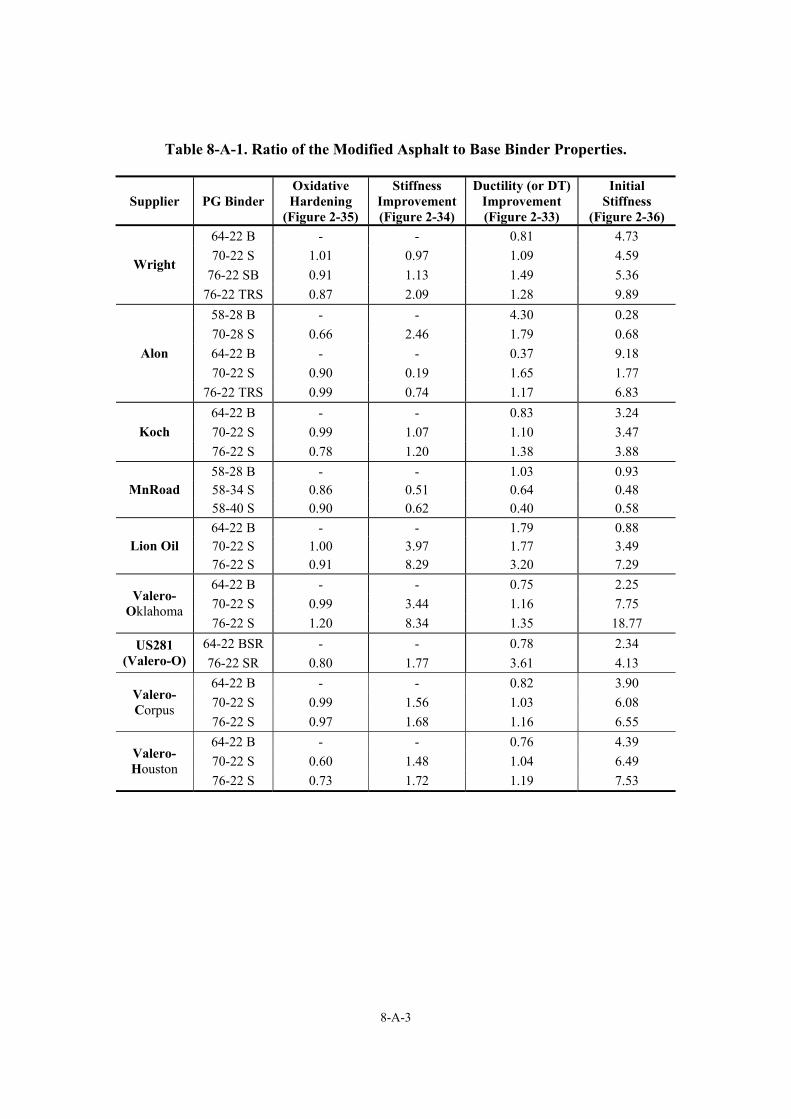
8-A-3
Table 8-A-1. Ratio of the Modified Asphalt to Base Binder Properties.
Supplier PG Binder Oxidative Hardening
(Figure 2-35)
Stiffness Improvement (Figure 2-34)
Ductility (or DT) Improvement (Figure 2-33)
Initial Stiffness
(Figure 2-36) 64-22 B - - 0.81 4.73 70-22 S 1.01 0.97 1.09 4.59
76-22 SB 0.91 1.13 1.49 5.36 Wright
76-22 TRS 0.87 2.09 1.28 9.89 58-28 B - - 4.30 0.28 70-28 S 0.66 2.46 1.79 0.68 64-22 B - - 0.37 9.18 70-22 S 0.90 0.19 1.65 1.77
Alon
76-22 TRS 0.99 0.74 1.17 6.83 64-22 B - - 0.83 3.24 70-22 S 0.99 1.07 1.10 3.47 Koch 76-22 S 0.78 1.20 1.38 3.88 58-28 B - - 1.03 0.93 58-34 S 0.86 0.51 0.64 0.48 MnRoad 58-40 S 0.90 0.62 0.40 0.58 64-22 B - - 1.79 0.88 70-22 S 1.00 3.97 1.77 3.49 Lion Oil 76-22 S 0.91 8.29 3.20 7.29 64-22 B - - 0.75 2.25 70-22 S 0.99 3.44 1.16 7.75 Valero-
Oklahoma 76-22 S 1.20 8.34 1.35 18.77
64-22 BSR - - 0.78 2.34 US281 (Valero-O) 76-22 SR 0.80 1.77 3.61 4.13
64-22 B - - 0.82 3.90 70-22 S 0.99 1.56 1.03 6.08 Valero-
Corpus 76-22 S 0.97 1.68 1.16 6.55 64-22 B - - 0.76 4.39 70-22 S 0.60 1.48 1.04 6.49 Valero-
Houston 76-22 S 0.73 1.72 1.19 7.53
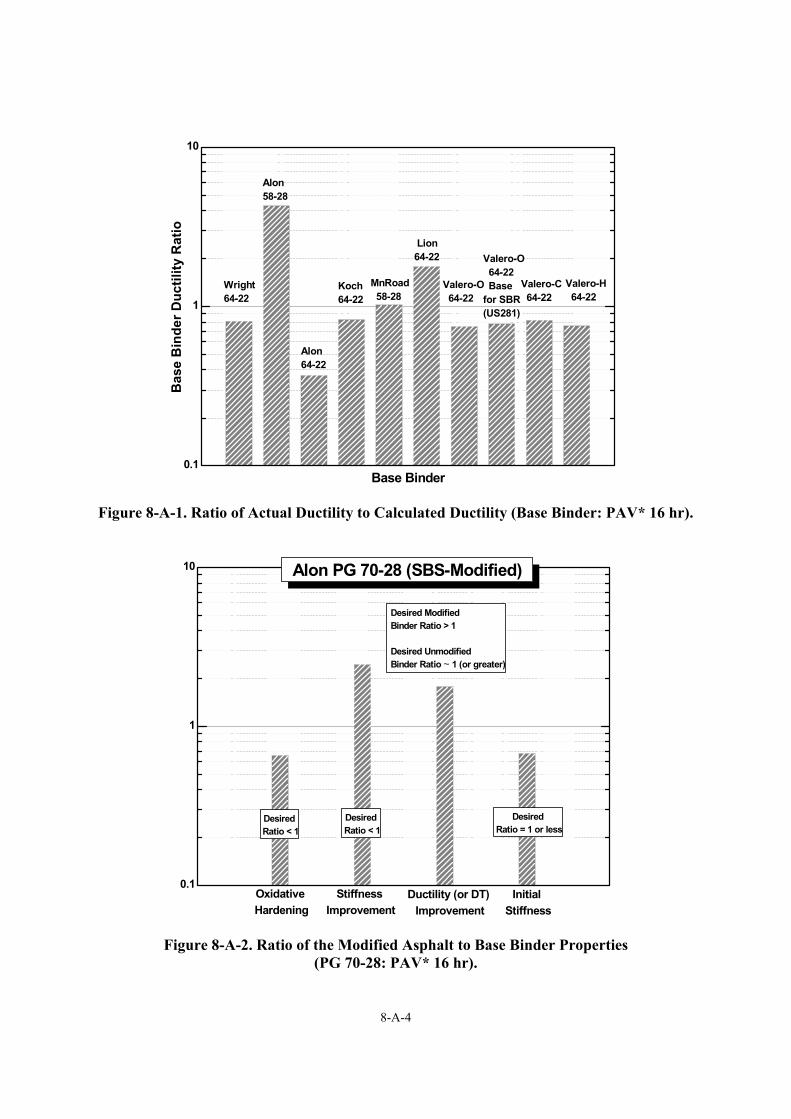
8-A-4
0.1
1
10
Base Binder
Lion64-22
Valero-H 64-22
Valero-C 64-22
Valero-O 64-22 Base for SBR(US281)
Valero-O 64-22
Alon58-28
MnRoad 58-28
Koch64-22
Bas
e B
inde
r Duc
tility
Rat
io
Wright64-22
Alon64-22
Figure 8-A-1. Ratio of Actual Ductility to Calculated Ductility (Base Binder: PAV* 16 hr).
0.1
1
10
Desired Ratio = 1 or less
Desired Modified Binder Ratio > 1
Desired Unmodified Binder Ratio ~ 1 (or greater)
Desired Ratio < 1
Alon PG 70-28 (SBS-Modified)
Stiffness Improvement
Initial Stiffness
Ductility (or DT) Improvement
Oxidative Hardening
Desired Ratio < 1
Figure 8-A-2. Ratio of the Modified Asphalt to Base Binder Properties (PG 70-28: PAV* 16 hr).
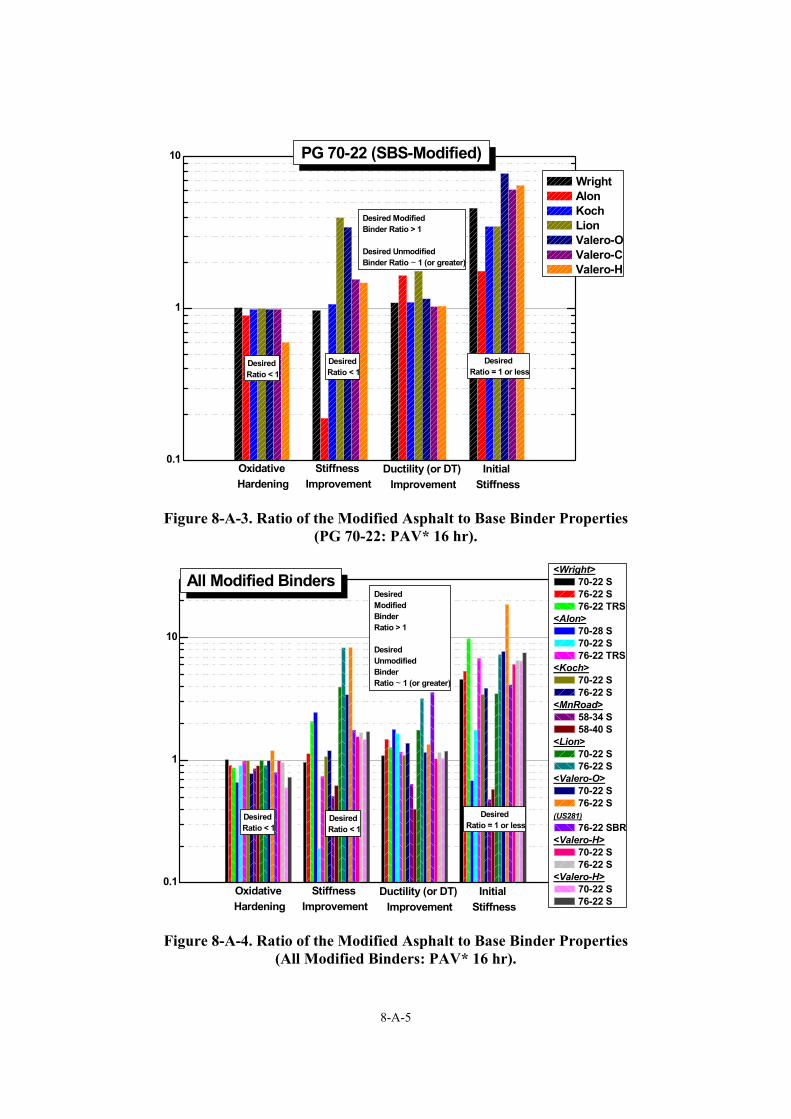
8-A-5
0.1
1
10
Wright Alon Koch Lion Valero-O Valero-C Valero-H
PG 70-22 (SBS-Modified)
Desired Ratio = 1 or less
Desired Modified Binder Ratio > 1
Desired Unmodified Binder Ratio ~ 1 (or greater)
Desired Ratio < 1
Stiffness Improvement
Initial Stiffness
Ductility (or DT) Improvement
Oxidative Hardening
Desired Ratio < 1
Figure 8-A-3. Ratio of the Modified Asphalt to Base Binder Properties (PG 70-22: PAV* 16 hr).
0.1
1
10
<Wright> 70-22 S 76-22 S 76-22 TRS
<Alon> 70-28 S 70-22 S 76-22 TRS
<Koch> 70-22 S 76-22 S
<MnRoad> 58-34 S 58-40 S
<Lion> 70-22 S 76-22 S
<Valero-O> 70-22 S 76-22 S
(US281) 76-22 SBR
<Valero-H> 70-22 S 76-22 S
<Valero-H> 70-22 S 76-22 S
All Modified Binders
Desired Ratio = 1 or less
Desired Modified Binder Ratio > 1
Desired Unmodified Binder Ratio ~ 1 (or greater)
Desired Ratio < 1
Desired Ratio < 1
Stiffness Improvement
Initial Stiffness
Ductility (or DT) Improvement
Oxidative Hardening
Figure 8-A-4. Ratio of the Modified Asphalt to Base Binder Properties
(All Modified Binders: PAV* 16 hr).

8-B-1
APPENDICES FOR CHAPTER 8
APPENDIX 8-B
TABLE OF DSR FUNCTION AND FATIGUE LIFE DATA

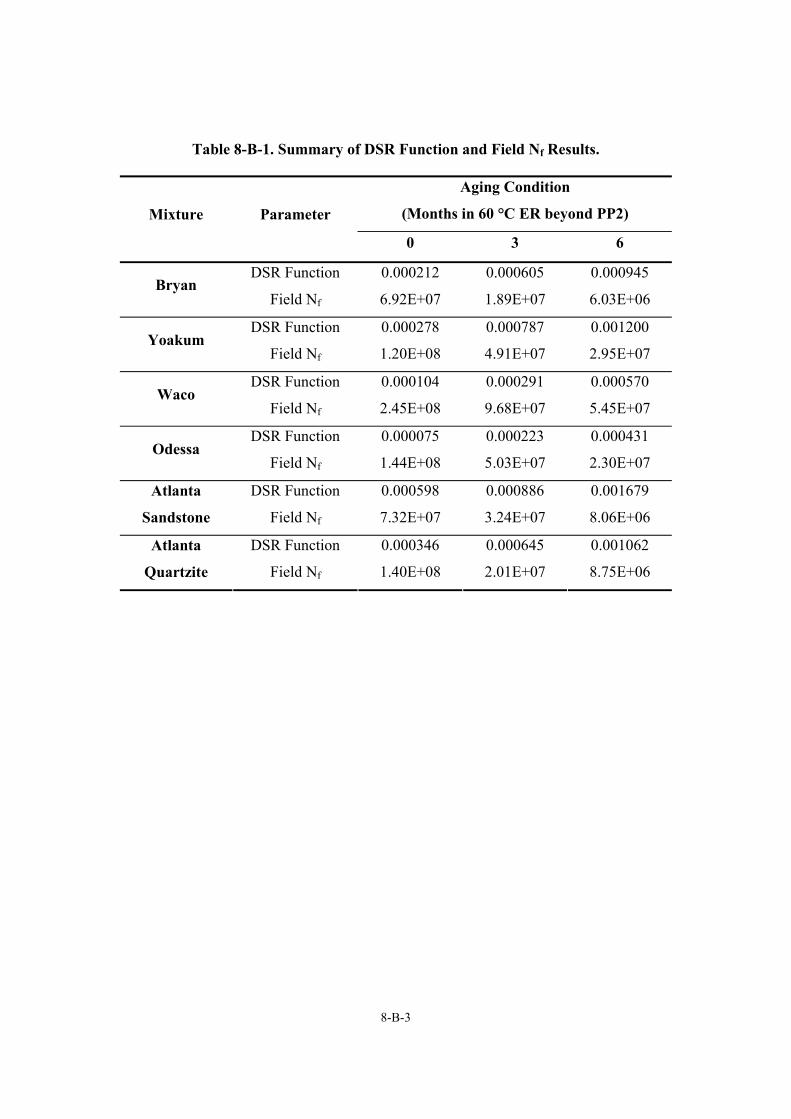
8-B-3
Table 8-B-1. Summary of DSR Function and Field Nf Results.
Aging Condition
(Months in 60 °C ER beyond PP2) Mixture Parameter
0 3 6
DSR Function 0.000212 0.000605 0.000945 Bryan
Field Nf 6.92E+07 1.89E+07 6.03E+06
DSR Function 0.000278 0.000787 0.001200 Yoakum
Field Nf 1.20E+08 4.91E+07 2.95E+07
DSR Function 0.000104 0.000291 0.000570 Waco
Field Nf 2.45E+08 9.68E+07 5.45E+07
DSR Function 0.000075 0.000223 0.000431 Odessa
Field Nf 1.44E+08 5.03E+07 2.30E+07
DSR Function 0.000598 0.000886 0.001679 Atlanta
Sandstone Field Nf 7.32E+07 3.24E+07 8.06E+06
DSR Function 0.000346 0.000645 0.001062 Atlanta
Quartzite Field Nf 1.40E+08 2.01E+07 8.75E+06