Embed Size (px)
Citation preview

Regulation of tissue growth: a molecular bridge between extrinsic and intrinsic mechanisms
Regulación del crecimiento tisular: un puente molecular
entre los mecanismos extrínsecos e intrínsecos
Ana Patricia de Almeida Ferreira
ADVERTIMENT. La consulta d’aquesta tesi queda condicionada a l’acceptació de les següents condicions d'ús: La difusió d’aquesta tesi per mitjà del servei TDX (www.tdx.cat) i a través del Dipòsit Digital de la UB (diposit.ub.edu) ha estat autoritzada pels titulars dels drets de propietat intel·lectual únicament per a usos privats emmarcats en activitats d’investigació i docència. No s’autoritza la seva reproducció amb finalitats de lucre ni la seva difusió i posada a disposició des d’un lloc aliè al servei TDX ni al Dipòsit Digital de la UB. No s’autoritza la presentació del seu contingut en una finestra o marc aliè a TDX o al Dipòsit Digital de la UB (framing). Aquesta reserva de drets afecta tant al resum de presentació de la tesi com als seus continguts. En la utilització o cita de parts de la tesi és obligat indicar el nom de la persona autora. ADVERTENCIA. La consulta de esta tesis queda condicionada a la aceptación de las siguientes condiciones de uso: La difusión de esta tesis por medio del servicio TDR (www.tdx.cat) y a través del Repositorio Digital de la UB (diposit.ub.edu) ha sido autorizada por los titulares de los derechos de propiedad intelectual únicamente para usos privados enmarcados en actividades de investigación y docencia. No se autoriza su reproducción con finalidades de lucro ni su difusión y puesta a disposición desde un sitio ajeno al servicio TDR o al Repositorio Digital de la UB. No se autoriza la presentación de su contenido en una ventana o marco ajeno a TDR o al Repositorio Digital de la UB (framing). Esta reserva de derechos afecta tanto al resumen de presentación de la tesis como a sus contenidos. En la utilización o cita de partes de la tesis es obligado indicar el nombre de la persona autora. WARNING. On having consulted this thesis you’re accepting the following use conditions: Spreading this thesis by the TDX (www.tdx.cat) service and by the UB Digital Repository (diposit.ub.edu) has been authorized by the titular of the intellectual property rights only for private uses placed in investigation and teaching activities. Reproduction with lucrative aims is not authorized nor its spreading and availability from a site foreign to the TDX service or to the UB Digital Repository. Introducing its content in a window or frame foreign to the TDX service or to the UB Digital Repository is not authorized (framing). Those rights affect to the presentation summary of the thesis as well as to its contents. In the using or citation of parts of the thesis it’s obliged to indicate the name of the author.
Programa de Doctorado del Departamento de Genética
Facultad de Biología
Universidad de Barcelona
Regulation of tissue growth: a molecular bridge
between extrinsic and intrinsic mechanisms
Regulación del crecimiento tisular: un puente molecular
entre los mecanismos extrínsecos e intrínsecos
Memoria presentada por
Ana Patricia de Almeida Ferreira
para optar al grado de Doctor por la Universidad de Barcelona
Development and growth control laboratory
ICREA and Institute for Research in Biomedicine (IRB)
Parc Científic de Barcelona
Barcelona, December 2015
Marco Milán Ana Ferreira Florenci Serras (Director) (Alumna) (Tutor)


Agradecimientos
Muchas gracias a todas las personas que, de una manera u otra, han contribuido durante estos años y han hecho posible que llegara hasta aquí. Y si me olvido de alguien, gracias también!
Marco, no hay palabras suficientes para agradecerte! Gracias por acogerme dos veces en el laboratorio. ¡Me lo pasé tan bien la primera vez que quise volver! Y volví a pasármelo muy bien. Gracias por ser tan buena persona y tan buen jefe, haces que sea muy fácil trabajar y hablar contigo. Por la pasión que transmites por la ciencia que nos contagia. Por ser siempre tan positivo y conseguir levantar el ánimo cuando estamos más negativos, y por el apoyo y ayuda durante toda la tesis, y sobre todo durante la dura revisión que nos ha tocado! Por los cafés, por las conversaciones en los pasillos, por las discusiones, no solo las científicas, pero también las del Madrid-Barça, de política y por todo lo demás ¡¡Muchas gracias jefe!!
Larita, bestie, nó sé ni por dónde empezar! Como te eche de menos los meses que estuviste por las américas… y cuanto me alegro de que hayas vuelto!!! Además porque sin ti esta tesis no hubiera sido posible. Gracias por la ayuda con el Word, Photoshop, etc. Y sobre todo gracias por todo lo demás, por ser tan buena persona (demasiada a veces ya lo sabes ;)), por el apoyo, las risas, las borracheras, las lágrimas, los viajes y por siempre estar disponible para ayudar. Te echaré muchísimo de menos pero estoy segura que es una amistad para toda la vida, para lo que sea y cuando sea sabes que puedes contar conmigo! Sólo tengo una cosa a apuntar, aparte de que estás un poco sorda: el hecho de que nunca has podido hablar conmigo en catalán (jaja). Estoy segura que te espera un futuro brillante, sea lo que sea que decidas, sé que puedes hacerlo perfecto!
Laurita, como hemos sufrido con Brat!!! Gracias por hacer posible que el proyecto interminable se terminara, ¡qué alivio fue! No se me olvidará nunca la gráfica esa que hemos hecho del timeline de la “motivation over time” del Brat Project! Y te tengo que agradecer por muchas otras cosas, por la amistad, por las discusiones (no solo científicas), por las noches de copas, por enseñarnos Paris (¡que guay fue ese viaje con la Larita!). Merci beaucoup por tout!!! Te he hechado mucho de menos por aquí!
Andrés, boludo, ¡muchas gracias por todo! Por las discusiones científicas que tanto nos ayudaron y enseñaron. Tengo que decir que te admiro mucho por la manera que tienes de ver la vida y de hacerlo parecer todo tan sencillo. Y por el crack que eres. ¡Que falta hiciste por aquí en los últimos años de mi tesis!

Juanchi, ¡cómo te he echado de menos en estos últimos meses! Llegaste al laboratorio como el mejicano muy tímido, que poco hablaba pero que siempre estaba ahí, compañero de office y de las noches en la fly room. Me alegro mucho que todo te ha ido bien en tu regreso a Méjico. Ahora solo falta ir a visitarte a Cuernavaca para comer fajitas y beber tequila, ya que la que dejaste aquí sigue intacta!!! (..muy mal, te has ido y ¡¡no hemos abierto la botella!!). ¡Gracias por todo!
Lídia, gracias por hacer que este laboratorio funcione, ¡sin ti no funcionaría! Gracias por ayudar tanto a la gente cuando necesita y por saber tanto de molecular!! Y gracias por ayudarme a mejorar mi castellano, principalmente al principio, y por las barbacoas/paellas/calçotadas en tu casa! No sé cómo haré cuando tenga que hacer un clonaje y no te tenga a ti para pedir ayuda!
Marta, ¡nuestra andaluza! Gracias por habernos enseñado la bella Sevilla, me entraron ganas de ir a vivir allí. Que sigas disfrutando del lab, de Barcelona y ahora del nuevo miembro de la familia, Julia.
Mariana, te has vuelto una verdadera motard!! Al principio con la moto azul de 50, pero ahora tienes una moto de verdad! Jaja Gracias por estar siempre ahí y por las sugerencias de sitios para comer. Espero que todo te vaya bien tanto en el lab como a nivel personal.
Najate, merci por haberme enseñado tanto sobre Notch (jaja)!!! Es broma, ahora en serio, sin ti esta tesis no tendría los modelitos esos guapos del illustrator, ¡gracias! Me encantan tus fotos de migration tan guapas que sacas en el confo! Merci beaucoup por ayudarme siempre que necesité y te deseo lo mejor! Tenemos que volver al bowling porque quiero la revancha! jaja
Terriente, la portada te la dedico a ti por haberme pasado el stock cuando estaba en apuros con la revisión del paper, ¡gracias! Y gracias por la alegría que traes al lab cada día y por haber sido compañera del turno nocturno! Suerte con las lymph glands y con ese paper!
Lada, seguirá vivo el legado de los fenotipos no autónomos!!! Me alegro de que así sea porque son muy guapos! ¡Seguro que lograrás una buena tesis! ¡Ánimos!
Célia, ai el p53 sensor... no es fácil trabajar con él pero ya le has pillado el truco! Estoy segura que te irá bien el PhD porque en este laboratorio no hay otra manera. ¡Ánimos con la tesis!
Mercedes, gracias por la alegría diaria y por cuidar de nuestras mosquitas!
Jery, we haven’t overlap much in the lab but I’m sure everything will go very good during your PhD. Enjoy Barcelona and good luck in the future!
Héctor, fue un placer trabajar contigo, ¡de verdad! A ti te tengo que agradecer por enseñarme moscas y por trasmitirme de alguna manera la pasión por ellas, por la

paciencia de ensenarme a diseccionar y a montar (ya sé que al principio era muy mala!!), por ser como eres, me encanta como llevas la vida y que seas tan buena persona! Qué pena no haber compartido contigo mis años de PhD!
Duarte, nunca me vou esquecer daquela “entrevista” no “Mocho” e tenho que confessar que estava nervosa…! Mas no final de contas tenho que te agradecer (e muito!) porque foi graças a ti que vim aqui parar! Não sei o que dizeste ao Marco quando voltaste de Lisboa, mas obrigada!!! E obrigada por tudo, por ensinar-me a trabalhar com moscas, por ajudar-me sempre que precisei e pela alegria que trazias todos os días ao laboratorio. Sentiu-se muito a tua falta por aqui desde que te foste embora.
Isabelle, aunque dejaste un vacío en el laboratorio al irte a Paris, me alegro muchísimo de que todo te haya ido bien por ahí. Confeso que al principio me costaba mucho entender tu “french accent” pero era lo que te hacia ser nuestra Isa!!! Gracias por alegrar mis días al entrar en el lab y verte ahí sentada en tu sitio.
Neus, aún me recuerdo de tu ultimo día en el laboratorio, que al salir te quedaste un rato mirando la puerta… pronto me pasara lo mismo! supongo que te has vuelto una verdadera New Yorker con los años que llevas ahí, no? Me alegro que te haya ido bien esa aventura por la Big Apple!!
A todos las personas que pasaran por el laboratorio durante estos años y en especial a Guillem y a Aleix, “mis” estudiantes de máster. Espero haber sido una buena “jefa”¡Gracias!
A Florenci, por ser un tutor tan positivo, por las discusiones científicas y por la ayuda en esta fase final de la entrega de la tesis. Moltes gràcies!
A los miembros de mi TAC, Ángel Nebreda, Jordi Casanova y Florenci Serras por vuestra importante ayuda y vuestros consejos anuales.
A la Microscopy Facility del IRB por la ayuda con los microscopios y procesamiento de imágenes, y sobre todo por los Plugins del ImageJ que nos facilitan mucho la vida, gracias!
A Pere Martínez, por la disponibilidad y ayuda en la fase final de la entrega de esta tesis, ¡gracias!
A recursos humanos del IRB que siempre que necesité han sido muy rápidos y eficientes, ¡gracias!
A toda la gente del IRB/PCB con quién me cruce a lo largo de estos años.
Obrigada a todos os meus amigos por fazerem com que tudo seja mais fácil (ainda que para muitos deles a mosca era motivo de gozo) e pelos cafés/jantares/copos muitas vezes de última hora.

Obrigada Pai e Mãe! Sem vocês nada disto seria possível, o orgulho que tenho de vocês é enorme e é também a minha inspiração! Obrigada pelo apoio incondicional e constante que, apesar da distância, sempre me fizeram sentir! Obrigada pelas várias e longas viagens de carro com o carro cheio de coisas, pelas encomendas que me enviaram, pelos menús à minha descrição sempre que ia a Lisboa. Enfim, não há outra palavra que um grande e muito obrigada do coração!!
Obrigada Marta, por seres a melhor irmã que alguém poderia ter (e a sério que não digo isto por seres a única!). Obrigada por apoiar-me sempre, pelas visitas a Barcelona (a ida ao Puerto Aventura tem que ser repetida já que tu não andaste em todas!), pelas horas a trocar mensagens e por me aguentares!! Não sabes o quanto me faz feliz ver que tudo te corre tão bem, mas para teres uma noção que saibas que a ti te desejo melhor que a mim própria! Obrigada por tudo!
Obrigada Diogo, que não me esqueço de ti e das tuas piadas sobre as moscas que também têm a sua importância (jaja)!
Carles, a ti te tengo que agradecer más que a nadie y me temo que para eso necesitaría otras 200 páginas! Podría decirte muchísimas cosas, pero simplemente te diré muchas gracias por ser como eres, por apoyarme incondicionalmente en todo y por haber hecho que esta tesis fuera posible.

TABLE OF CONTENTS


Table of Contents
ABSTRACT ................................................................................................................ 1
INTRODUCTION ...................................................................................................... 5
Development and Growth Control: General notions ......................................... 5
How organs get to their appropriate size? .................................................................... 5
Drosophila as a model organism to study growth control ...................................... 6
Patterning and Growth of the Wing Imaginal Disc ............................................. 9
How is the wing established and develops? .................................................................. 9
Regulation of organ growth .............................................................................................. 12
Proliferation/Cell Cycle ......................................................................................... 12
Growth Signaling Pathways................................................................................. 14
Organ-Extrinsic Signals: ................................................................................... 14
Insulin Signaling Pathway .......................................................................................... 15
TOR Signaling Pathway ............................................................................................... 18
Organ-Intrinsic Signals: .................................................................................... 21
Hippo Signaling Pathway ........................................................................................... 22
Morphogens ..................................................................................................................... 24
The Dpp morphogen gradient .......................................................................................... 26
Dpp functions: from patterning to growth .................................................... 28
How Dpp regulates organ growth? ................................................................... 32
Dpp gradient formation ........................................................................................ 34
An important role of HSPGs in Dpp gradient formation .......................... 37
Scaling of the Dpp gradient during growth ................................................... 39
Cell Interactions and Tissue Homeostasis .......................................................... 44
Cell Competition .................................................................................................................... 44
Hallmarks of cell competition ............................................................................. 48

What are the cells competing for? .................................................................... 49
The function of cell competition ....................................................................... 50
Tumor suppressor or pro-tumoral role ......................................................... 51
Metabolic Competition ....................................................................................................... 54
Coordination of growth ...................................................................................................... 56
Project and Objectives ............................................................................................... 58
RESULTS ................................................................................................................. 61
Effects of Targeted Activation of Growth in Epithelial Cells......................... 61
Activation of PI3K/PTEN and TSC/TOR signaling pathways cause tissue
overgrowth in the wing primordia ................................................................................ 61
Activation of growth in specific territories causes a non-autonomous
reduction in tissue size ....................................................................................................... 63
Targeted Activation of the PI3K/PTEN or TSC/TOR Pathways Induces a Non-
autonomous Reduction of Growth Rates in Adjacent Cell Populations ......... 69
Targeted Activation of the PI3K/PTEN or TSC/TOR Pathways Induces a Non-
autonomous Reduction of Proliferation Rates in Adjacent Cell Populations70
Mechanism of the Non-autonomous Response ................................................. 75
The non-autonomous response is not due to a systemic effect on growth .. 75
The non-autonomous effects on tissue growth are independent of apoptosis
and “classic” cell competition .......................................................................................... 76
The non-autonomous effects on tissue growth are not due to competition for
nutrients ................................................................................................................................... 81
The non-autonomous effects on tissue growth are due to competition for Dpp
ligand availability ................................................................................................................. 82
A New Role for the Dally Proteoglycan ................................................................ 89
Expression of the Thickveins receptor is not regulated by targeted activation
of the PTEN/PI3K and TSC/TOR pathways ............................................................... 89
Dally glypican is upregulated upon activation of the PI3K/PTEN and
TSC/TOR signaling pathways .......................................................................................... 90
Dally overexpression is able to phenocopy targeted activation of growth .. 92
Dally overexpression has an impact specifically in Dpp morphogen ............. 94

Dally contributes to the autonomous and non-autonomous effects on tissue
growth upon targeted activation of PI3K/PTEN and TSC/TOR signaling
pathways ................................................................................................................................... 98
Dally contributes to the autonomous and non-autonomous effects on tissue
growth upon targeted inactivation of the Hippo signaling pathway ............ 103
Inactivation of the Hippo pathway causes a reduction in tissue size in adjacent
wild type cell populations ................................................................................................ 103
Dally, and not Dally-like, contributes to the autonomous and non-autonomous
effects on tissue growth upon targeted inactivation Hippo/Yorkie signaling .... 105
Dpp trapping, by modulation of its receptor, also causes a non-autonomous
reduction in tissue size .................................................................................................... 108
Dally, a Molecular Bridge between Nutrition and Wing Scaling ............... 111
Depletion of Dally rescues the overgrowth caused by activation of
PI3K/PTEN and TSC/TOR signaling pathways ...................................................... 111
Dally expression is reduced upon reduced PI3K/PTEN and TSC/TOR activity
.................................................................................................................................................... 112
DISCUSSION ......................................................................................................... 119
A new process of cell competition ....................................................................... 120
A new role for Dally .................................................................................................. 122
Dpp signaling in growth control .......................................................................... 126
Downstream of Dally and Dpp in growth .......................................................... 128
Biological relevance of this mechanism ............................................................ 129
Compartments and coordination of growth .................................................... 130
CONCLUSIONS ..................................................................................................... 135
MATERIAL AND METHODS ............................................................................ 139
Drosophila Strains ........................................................................................................ 139
Mosaic analysis ............................................................................................................. 140
Antibodies ...................................................................................................................... 140

Immunostaining .......................................................................................................... 140
TUNEL Assay ................................................................................................................ 141
BrdU incorporation ..................................................................................................... 141
In situ hybridization .................................................................................................... 141
Quantification of Tissue and Cell Size in Adult Wings ........................................ 141
Quantification of Tissue Growth in Developing Wing Discs .............................. 142
Proliferation and Growth Rate Measurements by Clonal Analysis .................. 142
Flow Cytometry Analysis ........................................................................................... 143
pMAD Expression Profile .......................................................................................... 143
Fly Food with Varying Concentrations of Yeast ................................................... 145
Statistical Analyses ..................................................................................................... 145
Quantification of Pupal Volume ............................................................................... 145
BIBLIOGRAPHY .................................................................................................. 149
SUPPORTING TABLES ...................................................................................... 171
INDEX OF FIGURES ............................................................................................ 189
ABBREVIATIONS ................................................................................................ 192
RESUMEN EN CASTELLANO............................................................................ 195
ANNEXES .............................................................................................................. 201
Main Publication……….…………………………………………………………………….205
Publication 2…………………………………………………………………………………..235
1
Abstract
The final size of a developing organ is finely modulated by nutrient conditions
through the activity of nutrient sensing pathways, such as Insulin and TOR
signaling pathways. In addition, patterning signals operate in an autonomous way
to control the growth of an organ. How cells integrate distinct inputs (extrinsic
and intrinsic signals) to generate organs of appropriate size and shape remains an
open question.
The phosphatidylinositol 3-kinase (PI3K)–phosphatase with tensin homology
(PTEN) and tuberous sclerosis complex (TSC)–target of rapamycin (TOR)
pathways are frequently activated in human cancer, and this activation is often
causative of tumorigenesis. How cells acquiring mutations in tumor suppressor
genes outcompete neighboring wild type cells is poorly understood.
We utilized the Gal4-UAS system in Drosophila imaginal primordia, highly
proliferative and growing tissues, to analyze the impact of restricted activation of
these pathways on neighboring wild type cell populations. The results presented
in this thesis show that activation of these pathways leads to an autonomous
induction of tissue overgrowth and to a remarkable non-autonomous reduction in
growth and proliferation rates of adjacent cell populations. We show that this non-
autonomous response occurs independently of where these pathways are
activated, is functional all throughout development, takes place across
compartments, and is distinct from cell competition.
We present evidence that the observed autonomous and non-autonomous effects
on tissue growth rely on the up-regulation of the proteoglycan Dally, a major
element involved in modulating the spreading, stability, and activity of the growth
promoting Decapentaplegic (Dpp)/transforming growth factor β (TGF-β)
signaling molecule. Our data indicate that a reduction in the amount of available
growth factors contributes to the out-competition of wild type cells by
overgrowing cell populations.

2
Whereas nutrient-sensing pathways modulate the final size of the adult structure
according to nutrient availability to the feeding animal, Dpp plays an organ-
intrinsic role in the coordination of growth and patterning. Our results also
unravel a role of Dally as a molecular bridge between the organ-intrinsic and
organ-extrinsic mechanisms that regulate organ size. As such, it contributes to
integrate nutrient sensing and organ scaling, the fitting of pattern to size.

INTRODUCTION


INTRODUCTION
5
Introduction
Development and Growth Control: General notions
How organs get to their appropriate size?
Control of organ size is a fundamental aspect of biology and it is crucial for
organism fitness. During development, organs must grow to the appropriate size,
whereas many organs of adult organisms also display homeostatic size-control
mechanisms. In general, the final size of an organ or an animal is determined by
the number and size of the cells it contains. Therefore, differences in organ or
organism size between animals of the same or different species reflect changes in
cell number, cell size, or both.
Decades of experimentation have identified multiple regulators of organ size.
Broadly, these can be grouped into organ-extrinsic and -intrinsic regulators of
size. Organ-extrinsic regulators act in a humoral fashion to scale the size of
multiple organs within an organism. They provide systemic information about the
organismal status, such as nutrition and developmental stage, and hormones, such
as insulin and steroids, are the main players. Organ-intrinsic regulators act in a
local fashion to modulate the size and shape of individual organs. They provide
information about the local cellular environment, including position within an
organ and cell–cell contacts. The idea of growth being controlled in an
autonomous manner was initially suggested by transplantation and regeneration
experiments and later identified and characterized through genetic studies.
However, elucidating mechanisms by which organ-intrinsic cues interface with
extrinsic cues to control organ size remains unresolved.

INTRODUCTION
6
Drosophila as a model organism to study growth control
Since 1900, when Charles Woodworth and Thomas Hunt Morgan started to breed
and work with the fruit fly Drosophila melanogaster in the laboratory, this tiny fly
became one of the most widely used model systems in biological research. Due to
its long tradition and well-established knowledge [in 2000 its genome was
completely sequenced (Adams et al., 2000)], Drosophila became a very powerful
model system with sophisticated genetic and molecular tools. These tools allowed
to quickly generate loss-of-function mutant animals to query gene function, and
epistasis experiments to question gene relationships. Moreover, techniques based
on the alteration of gene expression in a particular tissue or group of cells, like the
UAS/Gal4 system (Brand and Perrimon, 1993) or the generation of genetic
mosaics, allowed the study of essential genes and in many cases to bypass
lethality. This also allowed tissue-specific screens to be performed, which
permitted to identify and characterize new genetic loci and signaling networks.
The ease of genetic studies is due, in part, to the fact that Drosophila is a simple
organism with only four pairs of chromosomes (three autosomes and the sex
chromosomes). However, about 75% of known human disease genes have a
recognizable match in the genetic code of the fruit fly (Reiter and Bier, 2002) and
50% of fly protein sequences have mammalian homologues, which makes the fly
an important model organism to help us to understand human biology. Another
aspect that makes Drosophila such a good model system is its high fecundity rates
and the short life generation time, about 10 days at 25C. The life cycle of the fruit
fly is divided into four stages (Figure 1). The embryonic stage, where the body
axes are first established, takes about 24h at 25C ending with the hatching of the
larva. During the larval stage, the feeding and growing period, animals go through
three different larval instars before metamorphosis. The larvae are composed of
two types of tissues: the endo-replicative and the proliferative/imaginal tissues.
While the first ones go through successive rounds of genome duplication leading

INTRODUCTION
7
to an increase in cell size without cell division, the second ones are proliferative
tissues that will form the adult epidermal structures of the body called imaginal
discs (Figure 2). At the end of the third instar larva, animals enter into pupariation,
which marks the beginning of metamorphosis. During this pupal stage, there is an
intensive tissue remodeling in which larval tissues are histolyzed, while imaginal
tissues metamorphose to form the adult structures, and the rigid exoskeleton
constrains any future increase in the body dimension. Consequently, body growth
is restricted to the feeding period of larval development, and the transition from
larva to pupa fixes the future adult size.
Figure 1. The life cycle of Drosophila melanogaster. Drosophila melanogaster produces new adults in 10 days at 25C. Twenty-four hours after the egg is laid, the larva hatches. The fruit fly has three larval instars: first-instar larva (L1) that longs about 24h; afterwards the second-instar larva (L2) hatches and will take also 24h; finally, the third-instar larva (L3) stage will close the larval stage and finish with the encapsulation in the puparium. The puparium is where metamorphosis takes place, after which the adults eclose.

INTRODUCTION
8
In this thesis, we mainly used the wing imaginal disc of Drosophila melanogaster
as a model tissue to analyze the effects of targeted activation of growth signaling
pathways in specific territories of an organ.
Figure 2. Drosophila melanogaster imaginal discs origin and their respective adult organs. The imaginal discs originate early in development as clusters of 5 to 50 undifferentiated groups of cells in the embryonic ectoderm (A). These cells start to develop inside the embryo and are segregated from their neighbors by invagination from the ectoderm (B). During larval development, these groups of cells start to proliferate to give rise to a sac-like structure (C). After the fly has passed through the larval stages, it undergoes metamorphosis. During this process, the imaginal disc extends along its proximal-distal axis by turning inside out in a process called eversion (D, E). Each imaginal disc gives rise to a specific adult structure, such as legs or wings, the body wall, eyes and head cuticle, halteres, antennae or genitalia, and each of them depends on its own genetic cues (F). Adapted from the Atlas of Drosophila Development by Volker Hartenstein.
INTRODUCTION
9
Patterning and Growth of the Wing Imaginal Disc
How is the wing established and develops?
The wing imaginal disc is a sac-like structure composed of a continuous epithelial
monolayer that forms a two-sided epithelial sac, which surrounds the disc lumen:
on one side of the disc lumen the pseudostratified epithelium – columnar
epithelium (ce) – and on the other side the peripodial membrane (pm), a
squamous epithelium formed by flat cells (Figure 3). The wing imaginal disc arises
from the embryo as a cluster of around 40 cells that proliferate exponentially
during the larval period to reach about 33 000 cells. There are about 10-11
divisions in the progeny of each initial cell, each of which takes around 10 hours
(Garcia-Bellido and Merriam, 1971; Martín et al., 2009). Shortly after the
beginning of pupariation, cell divisions cease and the differentiation of the adult
structures begins (Milán et al., 1996). During development, the primordia receives
patterning cues to establish the anterior-posterior (AP), dorsal-ventral (DV) and
proximal-distal axes. The AP and the DV subdivisions constitute developmental
compartments, that had been defined as groups of cells that do not mix with those
cells of adjacent compartments (Garcia-Bellido et al., 1973), most probably as a
consequence of the compartment specific expression of adhesion molecules
(Milán et al., 2001).
During embryogenesis, the wing primordium is first subdivided into anterior and
posterior compartments by the activity of the homeodomain transcription factors
Engrailed/Invected in posterior cells (Kornberg et al., 1985). Engrailed generates
an asymmetry by repressing the expression of the transcription factor Cubitus
interruptus (Ci) in posterior cells, and so, Ci is not able to repress the expression
of the diffusible protein Hedgehog (Hh). Hh coming from the posterior cells signals
to cells in the anterior compartment to induce several target genes like the
secreted molecule Decapentaplegic (Dpp) (Zecca et al., 1995), which in turn

INTRODUCTION
10
organizes pattern and controls growth symmetrically in both compartments
(Figure 4).
Figure 3. The wing imaginal disc: specification of territories and cellular organization. (A) Cartoon depicting the wing imaginal disc. The horizontal red line corresponds to the dorsal-ventral boundary (DV), and the perpendicular purple line to the anterior-posterior boundary (AP). The notum (body wall) region is in blue, the hinge region in yellow and the wing blade in green. (B) Cartoon depicting a cross-section of the wing imaginal disc. The wing primordium is a cellular monolayer that forms a two-sided epithelial sac. One side of the sac forms a thin squamous sheet, the peripodial membrane, whereas the opposed epithelial surface, the columnar epithelium adopts a pseudostratified columnar morphology. The apical side of both epithelia is oriented towards the lumen of the sac, while the basal side is the external surface. Adapted from (Butler et al., 2003).
The wing primordium contains the progenitors of both the adult body wall
(notum) and the wing (Figure 3). This developmental decision, which takes place
in second instar stage, is carried out by the opposing activities of two secreted
signaling molecules, Wingless (Wg) and the EGFR ligand Vein (Vn), in the most
distal and proximal regions of the primordium, respectively (Wang et al., 2000).
Hh induces Wg in the ventral-anterior domain where it is required to specify the
primordium of the wing blade by activating transcription of nubbin (nub) and
vestigial (vg) in the wing field and restricting the expression of homothorax (hth),

INTRODUCTION
11
teashirt (tsh) and vein (vn) to the proximal region of the wing disc (Ng et al., 1996;
Wu and Cohen, 2002). In the other hand, Vn has a dual role in early wing disc
development. First, it instructs cells to adopt body wall fate by antagonizing wing
fate and activating notum-specifying genes (Diez Del Corral et al., 1999; Wang et
al., 2000; Zecca and Struhl, 2002a; Zecca and Struhl, 2002b). Second, EGFR
signaling triggers the establishment of a dorsal-ventral axis by inducing the
expression of the transcription factor and selector gene Apterous in dorsal cells
(Wang et al., 2000; Zecca and Struhl, 2002a; Zecca and Struhl, 2002b). Apterous
activates the expression of a Notch ligand, Serrate, in dorsal cells and restricts the
expression of another ligand, Delta, in ventral cells (Diaz-Benjumea and Cohen,
1993; Doherty et al., 1996; Irvine and Vogt, 1997). This leads to the symmetric
activation of Notch on both sides of the DV boundary. Notch activation leads to
expression of Wg at the DV boundary that plays a fundamental role in patterning
and growth along de DV axis (Diaz-Benjumea and Cohen, 1995) (Figure 4).
Figure 4. Compartment boundaries and local signaling centers in the developing fly wing. (A) The Drosophila wing is subdivided into anterior and posterior cells by a cell lineage restriction boundary that expresses the morphogen Decapentaplegic (DPP, orange). The posterior compartment expresses Hedgehog (HH, green), the expression of which depends on Engrailed (EN). (B) The dorsal compartment of the wing disc expresses the transcription factor Apterous (AP), which results in activation of the Notch ligands Delta (DL) and Serrate (SER) at the dorsal-ventral compartment boundary (dark blue). Once the boundary has been established, it expresses Wingless (WG), which regulates patterning along the DV axis.

INTRODUCTION
12
Regulation of organ growth
Organ growth is the consequence of an increase in cell number, cell size or both.
The balance between cell proliferation and cell death determines cell number,
while cell size depends on cell growth (accumulation of mass). During
development, mitogens stimulate cell proliferation whereby cell division is driven
by the replication of the DNA content and progression of the cell cycle. In the other
hand, cell death is a genetically programmed process in which cells commit
suicide by inducing DNA fragmentation and protein degradation. Both
developmental cues and lack of survival factors can trigger cell death. Cell growth,
which is also regulated by extracellular growth factors, entails protein synthesis
and organelle biogenesis, leading to an increase in cell mass and size. Thus, size is
regulated by extracellular factors that impinge on these three main aspects
occurring at the cellular, organ and organismal levels. Since the number of
apoptotic cells during normal development of the wing disc is very low, its final
size relies on cell growth and cell proliferation.
Proliferation/Cell Cycle
The cell cycle or the cell-division cycle is the sum of events that leads to cell
division, producing two daughter cells. The cell cycle of eukaryotes is divided into
four distinct phases: G1 phase (GAP1, cell increases size), S phase (DNA
replication), G2 phase (GAP2, cell increases size) and M phase (mitosis, cell
division) (Figure 5). Entry into each of these phases is dependent on the proper
progression and completion of the previous one.
In Drosophila, different types of regulators drive cell cycle progression. One of the
most important groups of cell cycle regulators is the family of serine-threonine
protein kinases, the Cyclin Dependent Kinases (CDK), that are activated in a
sequential fashion. The timing of their activation is defined by their post-
translational modifications (phosphorylations/ dephosphorylations), and by the

INTRODUCTION
13
association with proteins called Cyclins (Cyc), which act as the regulatory subunits
of the kinase complex. The Cyclin family is divided into two main classes: the ‘G1
cyclins’ which comprise Cyclin D and Cyclin E, and their accumulation is rate-
limiting for progression from the G1 to S phase; and the ‘mitotic or G2 cyclins’
which include Cyclin A and Cyclin B and are involved in the control of G2 to M
transition and mitosis. Cyclins bind to and activate the CDKs, which lead to
phosphorylation and inhibition of different cell cycle inhibitors.
Figure 5. Cell cycle of Drosophila melanogaster. The cell cycle is subdivided into four phases: G1, S, G2 and M phases. Two key regulatory checkpoints are represented. In G1, CyclinE limits S phase initiation by binding to CDK1. CycE is regulated by Dacapo/p21 and by E2F which is repressed by the retinoblastoma-like protein RBF. In G2, CyclinA-B bind and activate CDK2 which induce String/Cdc25 thus allowing mitosis initiation. Tribbles functions as a negative regulator of this process.
There are also several transcription factors known to have a role on cell cycle
regulation. One example is the E2F transcription factor that, together with its co-
factor DP, forms a protein complex that acts as transcription activator promoting
Cyclin E (CycE) expression and thus transition from G1 to S phase [(Dynlacht et
al., 1994), see Figure 5]. The activity of String/Cdc25, a critical regulator of the

INTRODUCTION
14
activity of the CycA-B/CDK2 complex, is rate limiting for entry into mitosis [Edgar
and O’Farrell, 1989), see Figure 5].
The cell cycle regulators presented above induce and allow cell cycle progression.
However, different checkpoint mechanisms ensure that cells do not progress
through the cell cycle when defects occur. As expected, one of the ways to repress
cell cycle progression is through the inhibition of the Cyclins. The Drosophila gene
dacapo (dap), which is a member of the p21/p27 family of CDK inhibitors, inhibits
CycE/CDK2 activity therefore blocking G1 to S transition (De Nooij et al., 1996;
Lane et al., 1996). The Retinoblastoma-family protein (RBF) is a family of tumor
suppressor proteins known to be able to bind to E2F, thus preventing CycE
activation and, as a consequence, G1 to S transition is compromised (Du et al.,
1996). tribbles is another cell cycle progression repressor that specifically induces
degradation of String protein and consequently inhibits G2 to M transition (Mata
et al., 2000).
Despite manipulation of cell proliferation in the wing imaginal disc, the resulting
wings often attain the normal size. It seems that there is a defined adult size and
that either the wing is formed by fewer but larger cells (if cell cycle is blocked), or
more but smaller cells (if cell cycle is induced) (Neufeld et al., 1998; Weigmann et
al., 1997). Therefore, despite the close relationship between cell proliferation and
cell growth, they are independently controlled.
Growth Signaling Pathways
Organ-Extrinsic Signals:
The Insulin/IGF signaling (IIS) and the TOR signaling pathways are two highly
conserved pathways that sense energetic and nutrient status in animals from flies
to humans. These pathways are the main players in sensing nutritional
information in order to coordinate growth and metabolism with nutrient
availability. Information about the nutritional status is directly sensed at the level

INTRODUCTION
15
of individual cells via the TOR pathway, while the systemic response is carried out
by the hormonal action of insulin.
Insulin Signaling Pathway
The insulin signaling pathway is highly conserved from Drosophila to mammals.
In the fly, as in mammals, insulin signaling regulates a number of physiological
functions, such as metabolism, tissue growth and longevity. In the past decade,
studies in Drosophila allowed to identify important conserved components of the
signaling pathway. Flies and humans indeed show a surprising amount of
conservation and parallelism at the level of the molecular components of the
insulin signaling pathway, but also at the level of the physiological outputs of the
pathway.
In vertebrates, the metabolic functions of the pathway are mediated by insulin,
whereas growth is promoted by the activity of IGFs (Nakae et al., 2001). These
different biological functions can be attributed, at least in part, to their binding to
different receptors, the insulin receptor (IR) and the IGF-1 receptor (IGF-1R).
Given the fact that insects possess a single insulin-like system, they might
represent a possible ancestor of the IIS (Wu and Brown, 2006). Drosophila insulin-
like peptides (Dilps) indeed carry both the metabolic functions of mammalian
insulins and the growth-promoting functions of IGFs (Garofalo, 2002), and act
through a very well conserved signaling pathway.
To date, eight insulin-like peptides (Dilps1-8) have been identified in Drosophila.
With the exception of the recently discovered Dilp8 (Colombani et al., 2012;
Garelli et al., 2012), which does not signal through the known Insulin-like
Receptor [InR, see (Colombani et al., 2015; Vallejo et al., 2015)], Dilps activate a
canonical pathway that regulates cell growth and metabolism. Circulating Dilps
act systemically on remote target tissues by binding to a receptor tyrosine kinase
at the cell surface. Activation of the single Drosophila InR by the ligand triggers a

INTRODUCTION
16
downstream signaling cascade that is strongly conserved between vertebrates
and invertebrates (Figure 6).
The first event upon activation of InR is the recruitment of the adaptor protein
Insulin receptor substrate (IRS), named Chico in Drosophila, as well as the
regulatory (p60) and catalytic (Dp110) subunits of the phosphoinositide 3-kinase
(PI3K, also called Dp110) to the receptor, which leads to the activation of the
catalytic subunit (Engelman et al., 2006). Activated PI3K phosphorylates
phosphatidylinositol-4,5-diphosphate (PIP2) on the plasma membrane to
produce phosphatidylinositol-triphosphate (PIP3). This stimulation is reversed
by the action of PTEN (phosphatase and tensin homolog), a negative regulator of
the PI3K pathway (Goberdhan et al., 1999) that has been identified as a tumor
suppressor gene in mammals. PIP3 recruits Akt (a proto-oncogene also known as
PKB, protein kinase B) to the plasma membrane and its subsequent
phosphorylation. The protein kinase Akt has several distinct effectors and
functions that I will briefly described. In one hand, Akt activation promotes the
uptake of glucose through the insertion of glucose transporters into the
membrane and glycogen synthesis. In this way it increases the energy supply of
the cell by inducing glucose storage (Taniguchi et al., 2006). Moreover, Akt is
involved in growth regulation and has as main effectors TOR (described below)
and the Forkhead Box O (FOXO) transcription factor (Figure 6). Phosphorylation
of FOXO by AKT promotes growth by preventing FOXO of entering into the nucleus
where it acts as a transcriptional repressor and a negative regulator of growth.
FOXO is activated only when insulin signaling is low and although FoxO mutants
do not show tissue overgrowth under normal conditions, FoxO limits growth in
adverse conditions such as poor nutrition thus mediating the response to
starvation (Jünger et al., 2003; Kramer et al., 2003; Puig et al., 2003).
Overexpression of Drosophila FOXO (dFOXO) can inhibit cell proliferation and
leads to reduced organ size by reducing cell number (Puig et al., 2003). FOXO is
known to negatively regulate growth by targeting different pathways. In response
to cellular stresses, such as nutrient deprivation or increased levels of reactive
INTRODUCTION
17
oxygen species, dFOXO is activated and inhibits growth through the action of
target genes such as the eukaryotic initiation factor 4E binding protein 4EBP
(Jünger et al., 2003). 4EBP, in its non-phosphorylated form, is normally bound to
the Eukaryotic translation initiation factor 4E (eIF4E) inhibiting translation
initiation. When phosphorylated, 4EBP is unable to bind to the eIF4E thus
allowing protein translation to occur (Jastrzebski et al., 2007). The transcription
factor dMyc is another known target of the PI3K pathway via direct binding of
FOXO to the Drosophila myc promoter (Teleman et al., 2008). dMyc is known to
have a role in promoting ribosome biogenesis (Grewal et al., 2005). The role of
PI3K pathway in size and growth control emerged from studies in Drosophila,
where loss-of-function mutants of components of the pathway were found to
display reduction of tissue growth associated with either lethality or severely
reduced body size. For example, viable mutants of chico, the Drosophila ortholog
of IRS, are smaller than wild type flies as a consequence of smaller and fewer cells
(Böhni et al., 1999). A similar outcome is observed by mutations in the insulin
receptor gene or by severe nutrient deprivation. On the contrary, PTEN mutants
show dramatic tissue overgrowth. Similarly, flies in which other positively
regulators of the pathway, such as PI3K, are activated also show overgrown
phenotypes (Leevers et al., 1996).
Consistent with the role in tissue growth, hyperactivation of PI3K signaling is
commonly observed in various types of human cancer (Yuan and Cantley, 2008).
Deletion of PTEN is associated with aggressive metastatic potential and poor
prognosis (Cully et al., 2006), and targeted depletion of PTEN in epithelial cells
leads to rapid development of endometrial, prostate, and thyroid neoplasias in
mouse models (Mirantes et al., 2013). Interestingly, even malignant growth can
be promoted by systemic nutritional signaling. Caloric restriction, which lowers
levels of circulating IGF-1 and insulin, can reduce growth of several types of
tumors. The sensitivity of tumors to caloric restriction depends on the status of
PI3K signaling: constitutive activation of the PI3K, e.g., by loss of PTEN, renders
the tumors insensitive to caloric restriction (Kalaany and Sabatini, 2009). In

INTRODUCTION
18
contrast, PTEN mutant cells in Drosophila tissues become more aggressive upon
nutrient restriction (Nowak et al., 2013).
Figure 6. Diagram showing the IIS and TOR signaling pathways. The main elements of the conserved IIS and TOR signaling pathways are shown in green and orange, respectively. Another input signals controlling this nutrient sensing pathway are also depicted. In blue are some of the most important downstream effectors of these pathways. Black arrows represent positive regulation and red bar-ended lines indicate inhibitory interactions. Details of each interaction are described in the main text.
TOR Signaling Pathway
The protein kinase TOR (target of rapamycin) is the main mediator of cellular
nutrient sensing, role that is conserved from yeast to mammals. TOR complex 1
(TORC1) is the major rapamycin sensitive form of TOR, and it is the primary
mediator of energy and amino acid sensing for growth control. TOR complex 2
(TORC2) is insensitive to the inhibitory effects of rapamycin, and it
phosphorylates substrates distinct from those phosphorylated by TORC1 (review
in Hietakangas & Cohen 2009). The main mechanism by which TORC1 regulates
INTRODUCTION
19
tissue growth is by adjusting protein biosynthesis in response to nutrient levels,
which is a rate limiting process in cell growth. It does so mainly by regulating two
translational regulators: ribosomal protein S6 kinase (S6K) and eukaryotic
initiation factor 4E binding protein (4EBP) (Figure 6). TOR allows the assembly of
the translation preinitiation complex and stimulates peptide chain elongation by
inhibition of 4EBP and activation of S6K respectively (Holz et al., 2005; Wang et
al., 2001). In Drosophila, inhibition of dTOR has been shown to reduce body
growth and cause larval lethality (Zhang et al., 2000). Moreover, TORC1-
depentent transcriptional regulation of genes involved in ribosome assembly was
shown to be in part through the transcriptional activation of dMyc transcription
factor (Teleman et al., 2008). As stated above, dMyc promotes ribosome
biogenesis (Grewal et al., 2005). In this way, TORC1 allows the rate of translation
to be coupled with the amount of ribosomes. It has been recently shown that most
of the transcriptional output downstream of TORC1 is controlled by two
transcription factors REPTOR and REPTOR-BP in Drosophila (Tiebe et al., 2015).
The small GTPase Rheb (Ras homologue enriched in brain) controls the activity of
TORC1, although the mechanism by which Rheb activates TORC1 is still a matter
of discussion. Rheb mutant flies show severe undergrowth as a consequence of
reduced cell size and cell number (Saucedo et al. 2003; Stocker et al. 2003), and
Rheb overexpression gives rise to overgrowth phenotypes (Saucedo et al. 2003).
The tumor suppressors TSC1 and TSC2 (Tuberous Sclerosis Complex genes 1 and
2) regulate Rheb activity. As a complex, they act as a Rheb-GTPase activating
protein (Rheb-GAP), promoting GTP hydrolysis and driving Rheb to the inactive
GDP-bound state (Inoki et al., 2003a; Tee et al., 2003; Zhang et al., 2003).
Mutations in TSC1 and TSC2, that lead to hyperactivation of the target of
rapamycin (TOR) pathway, are causative of tuberous sclerosis, a hamartoma
syndrome associated with a predisposition to malignancy (Inoki et al., 2005).
Likewise, heterozygous Tsc1 or Tsc2 mutant mice have been shown to develop
renal and extrarenal tumors such as hepatic hemangiomas (Kobayashi et al.,
2001). In Drosophila, TSC1 and TSC2 mutants are lethal, but clones of cells lacking
INTRODUCTION
20
TSC1/2 activity show strong overgrowth as a result of an increase in cell size and
number (Potter et al., 2001; Tapon et al., 2001).
TORC1 activity is regulated by the amount of cellular amino acids, thus linking the
nutritional status of the cell with the rate of protein synthesis (Avruch et al., 2009).
This regulation occurs downstream of the TSC1/2 complex (Smith et al., 2005) but
Rheb function is essential for TORC1 to be active by amino acids (Kim et al., 2008;
Sancak et al., 2008). TORC1 activation by amino acids also requires another group
of small GTPases, the Rag proteins (Kim et al., 2008; Sancak et al., 2008) (Figure
6). The mechanism by which amino acids regulate Rag complex activity is still
unknown. Expression of a constitutively active form of RagA promotes tissue
growth in the Drosophila wing, whereas expression of dominant negative form of
RagA inhibits it, as expected by its ability to activate TORC1 (Kim et al., 2008).
TORC1-mediated cell growth is also under control of an energy sensing-
mechanism that depends on AMPK (AMP-activated protein kinase). AMPK activity
monitors the immediately available energy by measuring the cellular ATP levels
(Hardie, 2007) as well as energy stores in form of glycogen (McBride et al., 2009).
AMPK signaling, when ATP levels are low, regulates growth by phosphorylating
and activating TSC2, which results in TORC1 inhibition (Inoki et al., 2003b)
(Figure 6).
Crosstalk between Insulin and TOR pathways
As stated above, one effector of Akt in growth regulation is TOR (Figure 6). Such
regulation allows the link between the systemic nutrient sensing and the cell-
intrinsic nutrient sensing components. However, in the last years this connection
has been under debate. Studies in Drosophila showed in vitro that Akt
phosphorylates and inhibits TSC2 activity, which leads to TORC1 activation
(Potter et al., 2002). However, two distinct studies in vivo showed that mutant
forms of TSC1 and TSC2 lacking the Akt phosphorylation sites do not present
defects in TOR activity (Dong and Pan, 2004; Schleich and Teleman, 2009) thus

INTRODUCTION
21
challenging the idea that this link is functionally relevant under physiological
conditions. Recently, the protein PRAS40 (Proline-rich AKT substrate 40) has
been shown to directly interact with TORC1 and inhibits its interaction with
substrates (Figure 6). PRAS40 is phosphorylated by Akt on a single site, thus
relieving TORC1 inhibition (Sancak et al., 2007; Vander Haar et al., 2007). This
phosphorylation event is then necessary for insulin-induced TORC1 activation. In
Drosophila, overexpression of dPRAS40 reduces tissue growth in an autonomous
manner by reducing cell size, which is consistent with an inhibition of TORC1.
However, while changes in TORC1 activity strongly affect body size, PRAS40
mutant flies are viable and present no obvious changes in body growth, which
suggests that PRAS40 does not regulate TORC1 activity during the growth period.
Nevertheless, in PRAS40 mutant females TORC1 canonical targets are upregulated
specifically in the ovaries, revealing that PRAS40 represses TORC1 specifically in
this tissue. Ubiquitous reduction of insulin signaling decreases TORC1 activity in
a PRAS40-dependent manner only in the ovary and not in the rest of the body
probably due to PRAS40 being maintained inactive in those tissues. Consistently,
removal of PRAS40 in chico mutants rescues female fertility bur not body
undergrowth. These results show that Insulin and TOR signaling are linked only
in specific tissues and that PRAS40 mediates this crosstalk (Pallares-Cartes et al.,
2012).
Organ-Intrinsic Signals:
Even though environmental conditions have an important role in organ growth,
size, shape or pattern of every Drosophila adult structure is genetically
determined in an autonomous manner by each imaginal disc through the action of
several signalling pathways. This idea comes from transplantation experiments in
which young wing discs when transplanted into the abdomen of adult flies grow
fine until they achieve the normal size of a mature wing disc (Bryant and Simpson,
1984).

INTRODUCTION
22
Hippo Signaling Pathway
The Hippo signaling pathway has been implicated in the regulation of organ size
due to its fundamental roles in promoting cell proliferation and in inhibiting
apoptosis. This pathway was first discovered in Drosophila by means of genetic
screens and its evolutionary conservation is certainly extensive. Actually,
mutations in the Hippo pathway induce tumors in mouse models and occur in a
broad range of human carcinomas, including lung, colorectal, ovarian, and liver
cancers [reviewed in (Harvey et al., 2013)].
The Hippo pathway consists of three major modules: a core kinase cassette,
downstream transcriptional regulatory proteins, and multiple upstream
regulatory proteins (Figure 7). The core kinase cassette is composed of two
kinases, Hippo (Hpo) and Warts (Wts), and two adaptor proteins, Salvador (Sav)
and Mob as tumor suppressor (Mats). Hpo together with the scaffold protein
Salvador (Sav) mediates Wts activation. Wts together with the other scaffold
protein, Mats, phosphorylates the transcriptional co-activator Yki. This
phosphorylation event causes Yki retention in the cytosol and its repression,
leading to cell cycle exit, apoptosis and growth inhibition (Huang et al., 2005; Udan
et al., 2003). Yki promotes tissue growth and survival in conjunction with several
transcription factors, including Scalloped (Sd), Homothorax (Hth), Teashirt (Tsh)
and Mothers against decapentaplegic (Mad). Yki has as transcriptional targets
many genes involved in growth, proliferation and apoptosis (Figure 7). The
bantam microRNA is a well-known target of Yki that promotes cell survival and
proliferation (Nolo et al., 2006; Thompson and Cohen, 2006). cycE, which
regulates the G1 to S transition during the cell cycle, is also induced by Yki (Tapon
et al., 2002). Another known target of the Hippo pathway is the Drosophila
Inhibitor of Apoptosis (DIAP-1), a fundamental gene involved in promoting cell
survival (Tapon et al., 2002; Wu et al., 2003). Imaginal discs with clones of cells
mutant for Hpo, Sav, Wts or Mats show outgrowths with extra folding of the tissue
but preserve their epithelial nature (Wu et al., 2003). More recently, it has been

INTRODUCTION
23
shown that the expression of the Drosophila dMyc protein (dMyc) is also regulated
by the Hippo pathway and that it functions as an essential cellular growth effector
of the pathway (Neto-Silva et al., 2010).
Figure 7. Diagram showing the Hippo signaling pathway in Drosophila. The main elements of the conserved Hippo signaling pathway are shown. Black arrows represent positive regulation and black bar-ended lines indicate inhibitory interactions. Dashed lines indicate unknown mechanisms. Details of each interaction are described in the main text. Adapted from (Zhao et al., 2011). The upstream branches of the Hippo pathway are complex since they involve
multiple regulatory proteins and their mode of action is not yet fully understood.
Nevertheless, it seems clear that many of these upstream regulatory proteins
concentrate at cell junctions and they allow the Hippo pathway to be regulated by
cell-cell contact, cell polarity, and the actin cytoskeleton, thereby enabling the

INTRODUCTION
24
activity of the pathway to respond to tissue organization and integrity. Once the
cadherin Dachsous (Ds) forms an heterodimeric bridge with the cadherin Fat of
an adjacent cell, Fat activates both kinases, Hpo and Wts (Bennett and Harvey,
2006; Cho et al., 2006). Three membrane-associated proteins, Kibra, Expanded
(Ex) and Merlin (Mer) work as adaptor proteins and it was reported that they have
redundant and overlapping roles in activating the Hippo pathway. These proteins
can interact with each other and they have similar loss-of-function overgrowth
phenotypes (Baumgartner et al., 2010; Genevet et al., 2010; McCartney et al.,
2000; Yu et al., 2010). Despite the fact that it is not entirely clear how they
influence the activity of the Hippo core kinase cassette, overexpression of Kibra,
Ex and Mer was shown to stimulate activity of Hpo and Wts, whereas its
knockdown reduced apical membrane localization of Hpo (Baumgartner et al.,
2010; Genevet et al., 2010; Yu et al., 2010). The apicobasal polarity proteins Discs
large (Dlg), Lethal giant larvae (Lgl) and Scribble (Scrib) form a complex that
localizes to the basolateral membrane of epithelial cells. Mutations in these three
genes and also in the apicobasal polarity protein Crumbs (Crb) caused
translocation of Yki into the nucleus and the consequent upregulation of the Hippo
pathway target genes (Chen et al., 2010; Grzeschik et al., 2010a; Ling et al., 2010;
Robinson et al., 2010; Zhao et al., 2008). The mechanism by which these proteins
control Hippo pathway activity is not completely clear. The regulation of the
Hippo pathway by cadherin-mediated cell-cell interactions makes it likely that it
is influenced by many developmental signaling pathways and thus plays a key role
in defining organ size and shape.
Morphogens
Classically, a morphogen is defined as a molecule that spreads from a localized
source such that its concentration declines in a continuous and predictable
fashion, providing a series of concentration thresholds, and thus, controlling the

INTRODUCTION
25
behavior of surrounding cells as a function of their distance from the source. In
this way, they specify distinct cell fates in a concentration-dependent manner.
In particular, Hedgehog (Hh), Wingless (Wg) and Decapentaplegic (Dpp) have
been shown to act directly at a distance and in a concentration-dependent manner
in the fly limbs (Lecuit et al., 1996; Nellen et al., 1996; Neumann and Cohen, 1997;
Strigini and Cohen, 1997; Zecca et al., 1996). Hedgehog is expressed in the
posterior compartment and signals to the anterior compartment in order to
activate its target genes (Figure 8). Dpp is a target of Hh signaling and is induced
in a stripe of cells adjacent to the AP boundary of the wing disc (Zecca et al., 1995)
(Figure 8). Dpp spreads towards both anterior and posterior cells to act as a long-
range morphogen by inducing expression of its target genes (in detail below). Wg
is secreted from the DV border of the wing disc and acts as a long-range
morphogen (Figure 8) by inducing the expression of Wg target genes, including
senseless (sens), distalless (dll), and vestigial (vg) (Neumann and Cohen, 1997;
Zecca et al., 1996). When Wg and/or Dpp were ectopically expressed in clones of
cells, it was observed that they were capable of organizing supernumerary limbs
(Struhl and Basler, 1993; Zecca et al., 1995). Although morphogens were first
presented as the master regulators of tissue patterning, several genetic
experiments have shown that Dpp and Wg also have a role in growth, survival and
proliferation of the cells. It was shown that loss of Dpp or Wg activity in the
developing wing leads to growth defects and loss of wing tissue (Zecca et al., 1995;
Zecca et al., 1996). In the opposite direction, Wg or Dpp can promote growth when
ectopically activated within the wing disc indicating again that there is a strict
correlation between patterning and growth (Basler and Struhl, 1994; Johnston
and Schubiger, 1996). However, a recent study points out that the graded
distribution of Wg is not required to stimulate cell proliferation at least during the
later stages of wing development (Baena-Lopez et al., 2009). As organ-intrinsic
regulators of growth, these molecules likely account for the autonomous control
of organ size.

INTRODUCTION
26
Figure 8. Distribution of Wg, Hh and Dpp morphogens in the Drosophila wing imaginal disc. In third instar larvae wing discs, Wg is expressed at the DV boundary and (red) acts as a long-range morphogen to organize patterning along the DV axis (light red). Hh is expressed in the P compartment (green) and moves into the A compartment to activate gene expression in a stripe of cells adjacent to the AP boundary (light green). Dpp is produced at the AP boundary (blue) and acts as a long-range morphogen that controls growth and patterning of wing cells along the AP axis (light blue). Adapted from (Yan and Lin, 2009).
The Dpp morphogen gradient
Decapentaplegic (Dpp), the fly homologue of vertebrate bone morphogenetic
proteins BMP2 and BMP4, belongs to the transforming growth factor-β (TGF-β)
family and functions directly at a distance to specify gene expression patterns in
a concentration-dependent manner. Dpp, induced by Hh signaling coming from
posterior cells (Zecca et al., 1995), is expressed along the boundary between the
anterior and posterior compartments of the wing imaginal disc, and forms a
concentration gradient along the AP axis of the wing primordium (Lecuit et al.,
1996; Nellen et al., 1996). The local synthesis of the ligand and its action at a
distance indicated that Dpp forms a protein gradient, with its highest level at the
center of the wing along the AP compartment boundary, with levels declining as

INTRODUCTION
27
the distance from this boundary increases. Different scenarios have been
proposed to participate in or regulate gradient formation and interpretation
which I will describe bellow in detail.
Upon binding to the type I-type II/Thick veins (Tkv)-Punt receptor complex, the
intracellular signal transducer and transcription factor Mothers against Dpp
(Mad) becomes phosphorylated and activated (Kim et al., 1997; Ruberte et al.,
1995). Activated Mad forms a complex with Medea and enters the nucleus to
inhibit the expression of the transcriptional repressor Brinker (Brk) (Figure 9).
These events convert the Dpp morphogen gradient into an inverse gradient of Brk
repressor activity that mediates many of the patterning and growth functions of
Dpp (Martín et al., 2004; Müller et al., 2003; Pyrowolakis et al., 2004; Schwank et
al., 2008). When brk is ectopically expressed, cells that normally respond to Dpp
become refractory to it. Therefore, in order to activate target genes, the Dpp
signaling pathway must remove Brk. This downregulation of brk occurs at the
transcriptional level. Both Brk and P-Mad regulate Dpp target genes, such as
daughters against dpp (dad), spalt (sal) and optomotor-blind (omb) (Figure 9). Dad
is an inhibitory SMAD that downregulates Dpp signaling in the wing primordium
(Tsuneizumi et al., 1997). As it is induced by Dpp, its inhibitory function is highest
in regions of high Dpp activity. This negative feedback loop might modulate the
duration and intensity of the signal. The Spalt and Omb target genes are activated
by P-Mad in a concentration-dependent manner, and the inverse gradient of Brk
repressor is fundamental to control the expression state of these Dpp-induced
genes along the AP axis (Moser and Campbell, 2005; Müller et al., 2003; Winter
and Campbell, 2004). Expression boundaries of both sal and omb are set by Brk
(Campbell and Tomlinson, 1999; Jaźwińska et al., 1999); omb is less sensitive to
Brk than sal and as such its domain of expression is broader. Although it is still
unclear how sal and omb are repressed at different concentrations of Brk, one
study suggests that different repression domains of Brk are sufficient to repress
omb but not sal (Kirkpatrick et al., 2001).

INTRODUCTION
28
Figure 9. Dpp morphogen signaling cascade in the Drosophila wing imaginal disc. (A) In the upper panel representation of the expression patterns of dpp (in blue), brk (in red), sal (in green) and omb (in yellow). Dpp is secreted from its site of production at the center of the disc and spreads into the A and P compartments, establishing a gradient with highest levels in the center and lowest in the lateral regions. Brk forms an inverse gradient to the Dpp gradient. Brk levels are important, together with Dpp activity levels, to set the expression boundaries of sal and omb. As omb is repressed by high levels of Brk and sal by lower levels, omb is expressed in a broader domain than sal (lower panel). (B) Representation of the transcriptional activity of the Dpp signaling cascade in cells with two extreme levels of Dpp: a medial cell with high Dpp activity levels in green and a lateral cell with low Dpp activity levels in blue. The question mark highlights the unknown transcriptional activator of brk and pent. SE: Silencer Element, AE: Activating Element, BE: Brinker Element. Details are described in the main text. Adapted from (Hamaratoglu et al., 2014; Schwank and Basler, 2010).
Dpp functions: from patterning to growth
Ectopic expression of Dpp in clones of cells both in the anterior or posterior
compartments caused reorganizations of the wing pattern suggestive of a long-
range activity of this morphogen (Capdevila and Guerrero, 1994; Zecca et al.,
1995). In addition, these clones induce over-proliferation of surrounding cells and
sometimes lead to organ duplications (Zecca et al., 1995). Hence, ectopic Dpp can
induce proliferation of an extra tissue and, at the same time, patterns it in the same
way as the wild type tissue. How the growth and patterning of developing tissues
are controlled and coordinated has been a long-standing question in

INTRODUCTION
29
developmental biology. The Dpp morphogen, that plays a role in both of these
processes by providing positional information to the cells in the tissue and by
acting as a trigger for tissue growth, is of crucial importance in the coordination
of growth and patterning of the wing imaginal disc.
In the mature wing of the fly, the positioning of the veins along the anteroposterior
axis are manifestations of different Dpp patterning outputs. Together with Brk, Sal
and Omb, encoding transcriptional regulators, Dpp is involved in the vein
positioning of the adult wing. Sal and Brk are required for the specification of the
longitudinal vein 2 in the anterior compartment, while Omb and Brk are
important in the establishment of the vein 5 in the posterior compartment
(reviewed in De Celis, 2003).
The conclusion that Dpp is critical for growth of the wing imaginal disc comes
from the observation that mutant flies lacking Dpp expression in the wing
imaginal disc fail to form wings (Zecca et al., 1995) and clones of cells unable to
transduce Dpp are eliminated from the wing blade (Burke and Basler, 1996). In
an opposite way, overexpression of Dpp in its own domain causes overgrown wing
imaginal discs (Burke and Basler, 1996). Since Dpp is a potent growth promoter,
one would expect that growth takes place where Dpp activity is highest. But
actually, proliferation is uniform across the wing disc (Milán et al., 1996), while
Dpp activity is graded. This morphogen gradient is required for uniform
proliferation since uniform Dpp signaling, by overexpression of Dpp throughout
the wing disc, causes lateral cells to proliferate more (Schwank et al., 2008).
Several models have been proposed in order to explain how the gradient of Dpp
activity drives uniform proliferation in the wing imaginal disc. Some of these
models propose an instructive role of Dpp in growth, while others suggest a
permissive one.

INTRODUCTION
30
1. The Memory Model
According to this model, the Dpp gradient at the onset of wing disc development
programs the cells of the disc along the AP axis to acquire different sensitivities
towards a mitogenic activity of Dpp—such that lateral cells become more
sensitive relative to medial cells. Thus, during the growth period of the disc, the
Dpp morphogen gradient would lead to uniform proliferation despite elevated
Dpp activity in medial compared with lateral regions. If this model is correct, an
early exposure to equal levels of Dpp activity throughout the wing disc would
make the sensitivity to the mitogenic action of Dpp the same in all the cells.
However, by doing so lateral cells still proliferate faster than medial cells
(Schwank et al., 2008), indicating that the different sensitivities according to the
position in the disc are not due to an early exposure to a gradient of Dpp.
2. The Threshold Model
This model states that Dpp would drive uniform proliferation because its activity
exceeds a certain minimal level throughout the disc. It would then predict that
once the minimal value is exceeded, differences in Dpp levels should no longer
matter. A couple of experimental data contradicts this model: (1) ectopic
activation of Dpp leads to overgrown discs (Burke and Basler, 1996; Capdevila
and Guerrero, 1994); and (2) lateral clones with constitutively active Dpp
signaling grow faster than wild type clones (Martín-Castellanos and Edgar, 2002).
3. The Gradient Models
This model predicts that cells compare the levels of Dpp they are exposed to with
those of their neighbors. When the differences between these levels are
sufficiently high (the gradient of Dpp is sufficiently steep) cells proliferate (Day
and Lawrence, 2000). According to this model, one would expect proliferation to
stop where these differences are zero, such as in discs with ubiquitous Dpp
expression, and this is not the case. This discrepancy led to a refinement of the
model (Rogulja and Irvine, 2005). During early wing disc development, lateral
cells may become differently programmed, such that they not only react to the

INTRODUCTION
31
steepness of the gradient, like medial cells, but also to the absolute levels of local
Dpp - even when these are uniform. The observation that juxtaposition of cells
with distinct Dpp signaling levels does not drive proliferation (eg. expression of a
constitutively active form of the Tkv receptor exclusively in the medial region
leads to normal growth within the whole disc (Schwank et al., 2008)) challenges
the legitimacy of this model.
4. The Inhibitor Model
This model postulates that a growth inhibitor forms an opposite gradient to the
one generated by Dpp and by doing so, this inhibitor guides the near-uniform
activation of the Dpp pathway and the corresponding un-patterned cell
proliferation (Serrano and O’Farrell, 1997). Two scenarios might be possible:
either the expression of the growth inhibitor is controlled by Dpp or arises in an
independent way. If the first situation is correct, then homogeneous activation of
Dpp would lead to homogenous growth and, as described above, this is not the
case. For the second scenario, one could speculate that Hh signaling could control,
as it regulates all known AP patterning genes such as Dpp itself, the expression of
such putative inhibitor. However, uniform activation of Hh signaling in the
anterior half of the wing disc shows overgrowth and high proliferative rates in the
anterior lateral region (Basler and Struhl, 1994). These observations, together
with the fact that no such inhibitor has been identified so far, make this model
quite speculative.
5. The Steamroller Model / Growth Equalization Model
This model, as the previous one, is based on multiple growth inputs. Dpp levels
along the AP axis set different Brk expression levels: high laterally and low
medially. This model postulates that lateral cells have a growth advantage
compared with medial cells, and that the Dpp/Brk system is necessary to restrict
lateral proliferation. The high lateral Brk levels are required to restrict the over-
proliferation that would otherwise occur in this region (Martín et al., 2004;
Schwank et al., 2008). This idea comes from the observation that wing discs

INTRODUCTION
32
lacking both Dpp and Brk resulted in a non-uniform proliferation pattern with
increased growth laterally and decreased growth medially (Schwank et al., 2008).
In the absence of the Dpp/Brk system, lateral over-proliferation inhibits growth
in the medial area by an unknown mechanism. Another recent piece of evidence
that supports this model is that in the absence of Dpp spreading, by trapping Dpp
at its source, lateral cells still divide at normal rates, while medial cells divide at a
lower rate (Harmansa et al., 2015).
6. Opposing growth-pathways Model In this model, the distinct activities of Dpp and Fat signaling complement each
other and provide the basis for a relatively even proliferation pattern along the AP
axis of the wing primordium. Fat signaling pathway is regulated in a Dpp-
independent manner. In medial cells, Dpp activity inhibits Brk and thus allowing
cells to proliferate. In contrast, Fat activity in medial cells represses growth via
the Hippo signaling pathway. In lateral cells, Brk is expressed and is responsible
to repress growth, while the absence of Fat activity allows cells to proliferate. fat
mutant wing discs show higher proliferation rates in the medial region (Schwank
et al., 2011). Uniform Dpp gives rise to hyper-proliferation specifically of lateral
cells. However, simultaneous depletion of Fat and Dpp signaling leads to high
proliferation levels both in medial and lateral regions of the wing primordium
(Schwank et al., 2011). Inhibition of the Dpp pathway fully counteracted the
increased proliferation rates occurring in the medial region of fat mutant discs.
How Dpp regulates organ growth?
The observation that there are no changes in cell size when Dpp levels are altered
indicates that Dpp does not regulate organ growth by affecting cell size (Martín-
Castellanos and Edgar, 2002). Evidence for an existing relationship between Dpp
signaling and proliferation rates comes from different studies. It was first shown
that ectopic activation of Dpp signaling in the lateral regions of the wing disc,
where endogenous levels are very low, causes an increase in proliferation rates

INTRODUCTION
33
(Martín et al., 2004; Martín-Castellanos and Edgar, 2002; Rogulja and Irvine, 2005;
Schwank et al., 2008).
dpp loss-of-function and brk gain-of-function clones are eliminated from the wing
disc (Adachi-Yamada et al., 1999; Burke and Basler, 1996; Moreno et al., 2002)
which supports the idea that Dpp has a role in cell survival. Moreover, brk gain-of-
function clones are eliminated by apoptosis which is prevented by blocking
apoptosis (Moreno et al., 2002). In this sense, Dpp acts as a survival factor.
Despite the above-mentioned evidences, the molecular components linking Dpp
signaling activity to the cell cycle or to the apoptotic machinery are still unknown.
What is demonstrated so far is that Dpp uses the transcriptional repressor Brk to
regulate tissue growth (Jaźwińska et al., 1999; Martín et al., 2004; Schwank et al.,
2008). Several observations coming from genetic interactions corroborate this
conclusion. Mutants for dpp present rudimentary wings. However, brk mutant
clones induced in this genetic background are able to induce outgrowths of wing
material (Jaźwińska et al., 1999). As stated before, ubiquitous activation of Dpp
signaling causes over-proliferation of the lateral region of the wing disc and a
decrease in the proliferation rates in the most medial part of the primordium
(Schwank et al., 2008). The same effect on proliferation rates along the AP axis of
the wing in observed in wing discs that lack Brk (Schwank et al., 2008). Moreover,
the dramatic reduction in size of wing imaginal discs observed in dpp mutants is
completely rescued by the removal of brk. In fact, wing discs of double mutants
(dpp and brk) present the same phenotype as the brk mutant alone, which
indicates that Dpp induces growth via Brk repression. Moreover, this observation
also supports the idea that the graded distribution of neither Dpp nor Brk is a
prerequisite for proliferation (Schwank et al., 2008). However, it remains obscure
the downstream machinery linking Brk to cell proliferation or/and survival. One
known transcriptional target of Dpp is Vestigial (Vg). Cells in the wing disc lacking
vg function undergo cell death, causing a loss of the corresponding structures in
the adult (Agrawal et al., 1995). However, ubiquitous expression of vg does not
lead to larger wing discs (Baena-Lopez and García-Bellido, 2006). Two different
INTRODUCTION
34
studies suggest that the Hippo pathway might be important for the regulatory
activity of Dpp. One of them shows that Brk has an effect on the expression levels
of the microRNA bantam (Martín et al., 2004), a known Hippo target able to
promote cell survival and proliferation (Nolo et al., 2006; Thompson and Cohen,
2006). The other study shows that the Dpp gradient controls the expression of the
four-jointed (fj) and dachsous (ds) genes. Graded Fj and Ds levels lead to partial
inactivation of Fat and hence decreased Hippo pathway activity (Rogulja et al.,
2008). However, fj and ds expression is also influenced by Vg (Baena-Lopez and
García-Bellido, 2006), and it is possible that Dpp affects its expression only
indirectly via vg. dMyc, which drives cellular growth by promoting ribosome
biogenesis, has also been shown to be a direct target of Brk (Doumpas et al., 2013).
Dpp gradient formation
The mechanism by which Dpp disperses in a long-range fashion has been a matter
of debate since the first studies of Dpp gradient formation were published. A
gradient is generated because the morphogen is not able to accumulate
indefinitely but rather is cleared either by receptor-mediated uptake or by
degradation (Müller et al., 2013). Several models have been proposed to explain
how Dpp diffuses away from the source (Figure 10). The simplest explanation
would be that morphogens diffuse through the extracellular matrix. However, the
reliability of the capacity of morphogens to diffuse over long morphogenetic fields
lead to the proposition of cell-based models of transport. In this way, the proposed
models for explaining the Dpp gradient formation can be divided into two
categories: one that comprises cell-based models of active morphogen transport
(transcytosis and cytonemes) and the other one that is based on the diffusion
through the extracellular space (free diffusion and hindered diffusion). Of course,
the models described above are not exclusive; they may work together in order to
fine tune the amplitude and range of morphogen gradient.
INTRODUCTION
35
1. Transcytosis
Transcytosis is a mode of transport by which morphogens are shuttled across cells
through repeated cycles of endocytosis and exocytosis (Figure 10A). Signaling
molecules bind to the cell surface, resulting in their cellular uptake by endocytosis.
Upon exocytosis, the signal is released again from the cell. By undergoing multiple
rounds of cellular uptake and release, the molecules become dispersed in the
target tissue. Some observations have linked receptor-mediated endocytosis to
Dpp dispersal through transcytosis [for example, the restricted range of Dpp
signaling when endocytosis is prevented (González-Gaitán and Jäckle, 1999)].
Also, in clones of cells in which Dpp uptake was prevented, Dpp accumulates in
wild type cells on the edge of the clones, closer to its source, while cells situated
behind the clone, that is farther away from the morphogen source, show reduced
amounts of Dpp signaling (Entchev et al., 2000). However, another study has
shown that transcytosis is not essential for Dpp transport (Belenkaya et al., 2004).
2. Cytonemes
This model proposes that long cytoplasmic processes called cytonemes extend
from target cells towards the source of morphogens to shuttle the morphogen
bound to its receptor back to target cell bodies (Figure 10B). Cytonemes are apical
actin-based filopodia, and, by extending these structures ,cells can directly contact
with the morphogen-producing cells regardless of their distance from the source.
It has been reported that cytonemes contain punctae of the Dpp ligand and its
receptor Tkv (Hsiung et al., 2005; Roy et al., 2011). However, due to lack of tools
to abolish cytoneme function and to the difficulty to observe them, it is not clear
yet if they play any role in generating the Dpp morphogen gradient.

INTRODUCTION
36
Figure 10. Models of Dpp gradient formation. (A) Transcytosis: following this hypothesis, Dpp is shuttled from cell to cell along the AP axis inside of endosomes. (B) Cytonemes: in this scenario, Dpp is transported on long cell extensions that contact the zone of Dpp production. (C) Free diffusion: in this model, the Dpp simply diffuses in the extracellular fluid. (D) Hindered diffusion: this model proposes that Dpp diffuses through the extracellular matrix and interacts with local proteins that help to its diffusion.
3. Free Diffusion
In the simplest case of morphogen dispersal, Dpp molecules move by free
diffusion from the source to the target tissue (Figure 10C). This implies that
morphogen molecules are not significantly affected either by the tortuosity of the
extracellular space, or by transient binding interactions with other proteins, such
as receptors or components of the extracellular matrix. Some FRAP (Fluorescence
Recovery After Photobleaching) experiments, using a Dpp-GFP transgene,
revealed a fraction of Dpp moving at speeds that would resemble those expected
if Dpp was dispersing by free diffusion (Zhou et al., 2012). However, it was shown
in wing imaginal discs that a secreted form of green fluorescence protein (GFP)
fails to form a concentration gradient, indicating that simple diffusion alone
cannot explain the graded distribution of the Dpp morphogen (Entchev et al.,
2000).

INTRODUCTION
37
4. Hindered diffusion
This model considers that both sinuosity and binding interactions slow down the
dispersion speed of a morphogen across the field and that it might even be
required for proper morphogen gradient formation (Figure 10D). Interactions of
morphogens with their receptors and extracellular matrix (ECM) proteins can
help to shape their gradients. Recent experimental data unraveled an important
role of interactions between the morphogens and the heparan sulfate
proteoglycans (HPSGs) in the regulation of morphogen gradients. Furthermore,
since HPSGs can bind to many cell surface co-receptors and secreted proteins,
they can offer a platform to morphogens to interact with other important
components.
Given the fact that the largest fraction of the Dpp ligand is extracellular and that it
seems to correspond to the signaling pool, nowadays the view that the Dpp
gradient is established by a diffusion-based mechanism is gaining weight. In that
sense, from now on we will assume that Dpp disperses by diffusion.
An important role of HSPGs in Dpp gradient formation
Heparan sulfate proteoglycans (HPSGs) have been shown to play an important
role in the regulation of the Dpp gradient formation. HSPGs are cell-surface or
extracellular matrix (ECM) macromolecules that comprise a protein core to which
heparan sulfate (HS) glycosaminoglycan (GAG) chains are attached (Bernfield et
al., 1999). They can be classified into three families based on their core protein
structure: syndecans, glypicans and perlecans. Glypicans and syndecans are cell
surface HSPGs and are linked to the plasma membrane by a glycosylphosphatidyl
inositol (GPI) anchor or a transmembrane domain, respectively. Perlecans are
secreted HSPGs that are mainly distributed in the ECM. All these three families are
evolutionary conserved from vertebrates to Drosophila (Yan and Lin, 2009). The
Drosophila genome encodes for two glypicans – Division abnormally delayed
(Dally) and Dally-like (Dlp)-, a single syndecan (sdc), and a single perlecan -
INTRODUCTION
38
terrible reduced optic lobes (trol). Considerable evidence suggests that the
glypicans Dally and Dally-like play major roles in regulating the Dpp gradient
formation. Biochemical studies have shown that Dpp is an heparin-binding
protein (Groppe et al., 1998). In fact, both Dpp activity and extracellular levels of
Dpp-GFP have been reported to be reduced in clones of cells that lack one of the
enzymes required for the biosynthesis of proteoglycans, Sulfateless (sfl)
(Belenkaya et al., 2004). In addition, in these sfl mutant clones Dpp-GFP
movement is blocked, which favors that Dpp moves from cell to cell by a hindered
diffusion mechanism (Belenkaya et al., 2004). Animals mutant for Dally show Dpp-
like patterning defects in the wing and genetically interact with the Dpp signaling
pathway (Jackson et al., 1997). In addition, ectopic expression of Dally results in
enhanced Dpp signaling in the wing disc (Fujise et al., 2003). Altogether, these
results strongly suggest that Dally has a positive impact in Dpp signaling. In vivo
experiments using a Dpp-GFP fusion protein that lacks a domain essential for its
interaction with Dally showed a shorter half-life when compared to a wild type
Dpp-GFP, suggesting that Dally stabilizes Dpp in the ECM (Akiyama et al., 2008).
Genetic interaction experiments revealed that dally suppresses the effect of tkv on
the Dpp gradient formation. The receptor Tkv can downregulate Dpp signaling by
receptor-mediated endocytosis of Dpp. Since Dally is able to antagonize Tkv,
probably by inhibiting this process, it regulates Dpp distribution and signaling by
interfering with receptor-mediated internalization and degradation of the Dpp–
receptor complex (Akiyama et al., 2008). Both in haltere and wing imaginal discs,
Dpp mobility is biased towards cells with higher levels of Dally (Akiyama et al.,
2008; Crickmore and Mann, 2007). Removal of Dally and Dlp show stronger
defects in both Dpp signaling and extracellular levels of Dpp when compared to
single depletion of these proteins, suggesting that Dally and Dlp are partially
redundant in Dpp gradient formation (Belenkaya et al., 2004).
Despite the above implications of the glypicans Dally and Dlp in Dpp gradient
formation, they have also been associated with other morphogens. They were
shown to be essential for Wg gradient formation (Han et al., 2005; Lin and
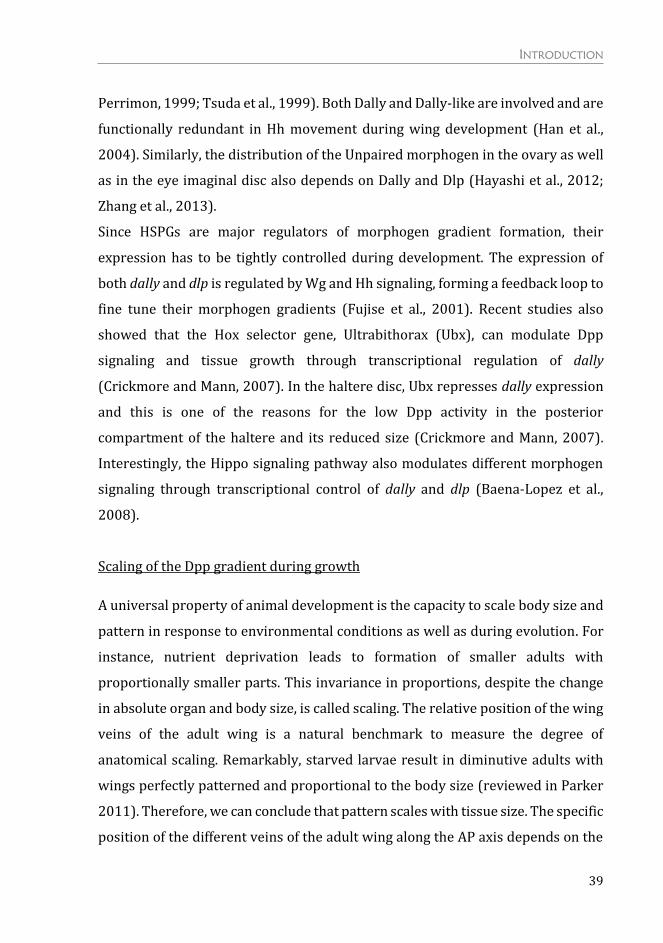
INTRODUCTION
39
Perrimon, 1999; Tsuda et al., 1999). Both Dally and Dally-like are involved and are
functionally redundant in Hh movement during wing development (Han et al.,
2004). Similarly, the distribution of the Unpaired morphogen in the ovary as well
as in the eye imaginal disc also depends on Dally and Dlp (Hayashi et al., 2012;
Zhang et al., 2013).
Since HSPGs are major regulators of morphogen gradient formation, their
expression has to be tightly controlled during development. The expression of
both dally and dlp is regulated by Wg and Hh signaling, forming a feedback loop to
fine tune their morphogen gradients (Fujise et al., 2001). Recent studies also
showed that the Hox selector gene, Ultrabithorax (Ubx), can modulate Dpp
signaling and tissue growth through transcriptional regulation of dally
(Crickmore and Mann, 2007). In the haltere disc, Ubx represses dally expression
and this is one of the reasons for the low Dpp activity in the posterior
compartment of the haltere and its reduced size (Crickmore and Mann, 2007).
Interestingly, the Hippo signaling pathway also modulates different morphogen
signaling through transcriptional control of dally and dlp (Baena-Lopez et al.,
2008).
Scaling of the Dpp gradient during growth
A universal property of animal development is the capacity to scale body size and
pattern in response to environmental conditions as well as during evolution. For
instance, nutrient deprivation leads to formation of smaller adults with
proportionally smaller parts. This invariance in proportions, despite the change
in absolute organ and body size, is called scaling. The relative position of the wing
veins of the adult wing is a natural benchmark to measure the degree of
anatomical scaling. Remarkably, starved larvae result in diminutive adults with
wings perfectly patterned and proportional to the body size (reviewed in Parker
2011). Therefore, we can conclude that pattern scales with tissue size. The specific
position of the different veins of the adult wing along the AP axis depends on the

INTRODUCTION
40
activity of Dpp. Thus, it is legitimate to say that in starved animals the Dpp activity
gradient scales down with tissue size in order to maintain correctly proportioned
and fully functional wings (Figure 11).
Figure 11. Scaling of Dpp activity gradient. A morphogen or activity gradient is read out in the target field, establishing a pattern. In a bigger tissue where Dpp expands and the gradient scales, the resulting pattern keeps the same proportions (1/3 of blue, red and white) and thus scales perfectly, provided that the boundaries are defined at the same threshold concentrations.
The first evidence for the scaling ability of Dpp comes from the observation that
the spalt expression domain scaled when the size of the posterior compartment
was experimentally altered (Teleman and Cohen, 2000). Three different studies
showed that both the Dpp morphogen (visualized by a Dpp-GFP fusion protein
expressed in the Dpp stripe) as well as the cellular response to the Dpp gradient
(visualized by P-Mad antibody and a GFP driven by a Dpp responsive dad
enhancer) expand and adjust to the growing tissue size throughout development
(Ben-Zvi et al., 2011; Hamaratoglu et al., 2011; Wartlick et al., 2011b). In this
sense, the Dpp gradient scales with tissue size as the wing imaginal disc grows. It
is interesting to note that it is not so clear whether this hypothesis is correct for
later stages of development, since late third instar wing discs showed less robust
scaling (Wartlick et al., 2011a). Moreover, scaling of the downstream targets of
Dpp, such as the genes sal and omb, is not equally good at all positions of the field.
While the Sal domain scaled extremely well in the anterior compartment, it does
not in the posterior compartment. On the contrary, the Omb domain scaled very
well in the posterior compartment but not in the anterior compartment

INTRODUCTION
41
(Hamaratoglu et al., 2011). Remarkably, this is consistent with the fact that Sal is
required for the positioning of the vein 2 in the anterior compartment, while Omb
is responsible for the positioning of the vein 5 in the posterior compartment (De
Celis, 2003).
Two models have been proposed to explain how scaling of the Dpp gradient is
obtained, one based on the decrease of Dpp degradation and the other on the
increase of Dpp diffusion.
1. Expansion by dilution mechanism
In this model, a long-lived secreted expander molecule promotes Dpp
degradation. In the other hand, tissue growth stabilizes Dpp by diluting this
antagonist. The reduction in the Dpp degradation rate occurs in response to cell
division events, so that the degradation rate is inversely proportional to the
number of cells (Wartlick et al., 2011a). Analysis of Dpp gradient scaling in
anisotropic (directional) growth conditions showed that the gradient scales better
with area than with length which suggests that Dpp scales due to a dilution-type
mechanism (Wartlick et al., 2011a).
2. Expansion-repression mechanism
This model suggests that scaling arises because of a feedback loop comprised by
the morphogen itself and a hypothetical expander molecule (Ben-Zvi and Barkai,
2010; Ben-Zvi et al., 2011; Hamaratoglu et al., 2011). The expander molecule
diffuses from the lateral part of the wing disc and helps the morphogen to spread.
Its expression is repressed in the medial region by Dpp itself (Ben-Zvi and Barkai,
2010). One prediction of this model is that the expander is a stable molecule and
consequently it accumulates in the tissue, keeping the gradient extended.
Eventually, the morphogen reaches the most lateral region of the disc and the
expander production is shut off. As the disc grows, the lateral areas can again
transcribe the expander and as such, the morphogen gradient spreads.

INTRODUCTION
42
Consistent with this model, the secreted molecule Pentagone (Pent) has been
identified as an expander of the Dpp morphogen in the wing disc. Absence of pent
in the wing imaginal disc causes a severe contraction of the Dpp activity gradient
resulting in patterning and growth defects (Vuilleumier et al., 2010). In these
mutant wing discs, the P-Mad gradient does not scale with tissue size throughout
development (Ben-Zvi et al., 2011; Hamaratoglu et al., 2011) and neither the
expression domains of most of Dpp target genes (Hamaratoglu et al., 2011). In an
inverse way, when pent is ubiquitously expressed in the posterior compartment
causes an overexpansion of the P-Mad gradient (Ben-Zvi et al., 2011). Overall,
these results demonstrate that Pent is required for the adjustment of the Dpp
activity gradient to tissue size. Secreted Pent molecules move towards the center
of the disc and help Dpp to reach further away. This expansion of Dpp gradient
narrows the lateral domain of Pent-producing cells. However, high enough
concentrations of Dpp never reach the most lateral regions of the disc and
therefore Pent expression is never completely shut off (Hamaratoglu et al., 2011).
Since Pentagone does not seem to directly interact with Dpp, it has been proposed
that it may do so indirectly via binding the glypican Dally (Vuilleumier et al.,
2010). Dally binds and enriches extracellular Dpp at the cell surface of wing
imaginal cells. Glypican-bound ligand is then passed either to receptors for
endocytosis and signaling (co-receptor activity of glypicans) or to glypicans of
neighboring cells for further lateral movement (facilitated transport activity – see
Hindered Diffusion Model) (Belenkaya et al., 2004; Fujise et al., 2003). Somehow,
Pent is involved in keeping the balance between these two activities maybe by
distracting a fraction of the ligand from local signaling to lateral movement
through its interaction with Dally. This could be achieved by having an active role,
acting on glypicans to promote the lateral movement of the ligand, or a more
indirect role, antagonizing the co-receptor function of glypicans. In an alternative
view, instead of interacting with Dally, Pent might regulate the interaction of
glypicans with Dpp. A similar activity has been assigned to Shifted, who has been
proposed to mediate the interaction of Dally with Hedgehog and is required for its
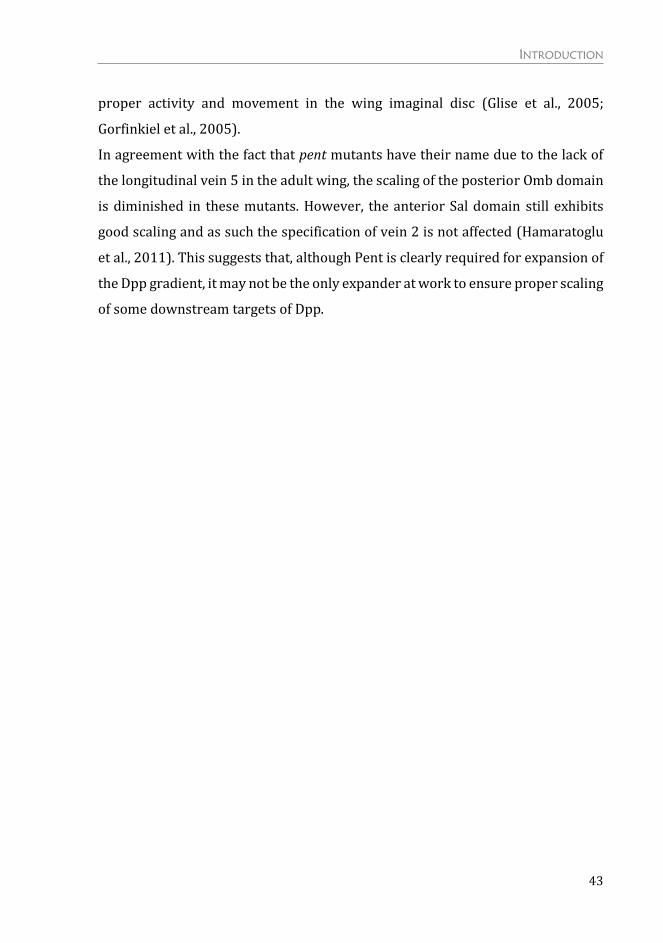
INTRODUCTION
43
proper activity and movement in the wing imaginal disc (Glise et al., 2005;
Gorfinkiel et al., 2005).
In agreement with the fact that pent mutants have their name due to the lack of
the longitudinal vein 5 in the adult wing, the scaling of the posterior Omb domain
is diminished in these mutants. However, the anterior Sal domain still exhibits
good scaling and as such the specification of vein 2 is not affected (Hamaratoglu
et al., 2011). This suggests that, although Pent is clearly required for expansion of
the Dpp gradient, it may not be the only expander at work to ensure proper scaling
of some downstream targets of Dpp.

INTRODUCTION
44
Cell Interactions and Tissue Homeostasis
Maintenance of tissue homeostasis is vital for the survival of multicellular
organisms. Interestingly, even unicellular organisms, like the social amoebae
Dictyostelium discoideum, take advantage of cell-cell interactions to cooperate and
build multicellular structures such as the stalk for sporulation. Cell-cell
interactions within a tissue allow cells to communicate with each other in
response to changes in their microenvironment. As such, the ability of cells to send
and receive signals plays a crucial role in the development and function of
multicellular organisms, as it is essential for the survival of the cell.
Cell Competition
Cell competition is a homeostatic mechanism evolved to identify and
subsequently eliminate cells that are poorly adapted to their developmental
environment and may compromise the overall fitness of animal tissues. The
concept of competition for survival has been intensively studied by
microbiologists [the microbial antagonism induced by bacteriocin of Escherichia
coli is a representative example (reviewed by Riley and Wertz, 2002)]. By
contrast, biologists studying multicellular systems had barely considered the
concept of competition between cells of the same species in a tissue until 1975
when Morata and Ripoll discovered the phenomenon of cell competition in
Drosophila (Morata and Ripoll, 1975). They used the wing imaginal disc to study
the behavior of a class of dominant mutations called Minutes that encode for
ribosomal proteins and that reduce the rate of cell division in a cell-autonomous
manner. Minute heterozygous (Minute+/-) flies develop more slowly than wild type
flies but are viable and show normal body size (Morata and Ripoll, 1975).
However, when mitotic wild type clones were generated in a slower-growing
Minute+/- field, they found that the wild type clones occupied most areas of the

INTRODUCTION
45
adult wing, and at the same time, Minute+/- cells were eliminated from the tissue.
Later on, it was shown that wild type cells adjacent to Minute+/- cells tended to
divide more often than those positioned in the center of the clone and that
Minute+/- cells not in contact with wild type cells were not eliminated (Simpson
and Morata, 1981). Therefore, the phenomenon of cell competition, defined by the
elimination of slow-dividing cells (losers) when confronted with a faster growing
population (winners), depends on short-range cell-cell interactions (Figure 12).
The recovery of Minute+/- tissue increased when induced late or upon larvae
starvation, which suggested that elimination required a differential growth rate
(Simpson, 1979). Interestingly, the final size of the wings was unaffected by
competition, which suggests that wild type cells grow at the expense of Minute+/-
cells, and this phenomenon is ineffective across compartments (Simpson and
Morata, 1981). Elimination of loser cells was shown to require an active induction
of apoptosis in Minute+/- cells by the surrounding wild type (Minute+) cells
(Abrams, 2002; Milán, 2002; Moreno et al., 2002). Thus, cell competition could
work as a quality control mechanism that maximizes tissue fitness by eliminating
suboptimal cells. Several reports have shown that cell competition also occurs in
the mammalian system. Interestingly, a mutation in a ribosomal protein led to
competitive interactions in mouse blastocysts (Oliver et al., 2004). Furthermore,
cell competition was shown to occur in mammalian culture cells (Norman et al.,
2012).

INTRODUCTION
46
Figure 12. The phenomenon of cell competition. (A) In “classical” cell competition, mutant cells (green) surrounded by cells of the same genotype do survive (top). However, when surrounded by wild type cells (white cells) they are eliminated from the epithelia (bottom). Due to a growth advantage over the mutant cells, the wild type cells become winners (dark purple) and replenish the tissue by compensatory proliferation. (B) Supercompetitors cells (light purple) do not induce apoptosis when surrounded by cells with the same genotype (top). Nevertheless, they can grow at the expense of the surrounding wild type cells (white) by inducing their death (bottom). The compensatory proliferation of the winner cells is due to the secretion of mitogens, such as Dpp, Wg, Hh and Upd by the dying cells (black arrow). The loser fate and the winner fate are depicted in green and dark purple respectively. Adapted from (Levayer and Moreno, 2013).
Relevant to the cancer field was the discovery of super-competitors. In a similar
fashion as the first steps of cancer progression, mutations that lead to increased
cell fitness lead to clonal invasion of the tissue at expense of wild type surrounding
cells (Figure 12). The first candidate to fit in this super-competitor definition was
the proto-oncogene dMyc, since clones expressing high levels of dMyc overgrew

INTRODUCTION
47
at the expense of the surrounding tissue until they filled the compartment (De La
Cova et al., 2004; Moreno and Basler, 2004). Clone expansion required the
elimination of the surrounding cells by apoptosis, which was induced through JNK
activation (Moreno and Basler, 2004), and induction of the apoptotic gene Hid in
the loser cells (De La Cova et al., 2004). In an opposite manner, downregulation of
dmyc in clones led to their elimination (Johnston et al., 1999). Remarkably, cells
with two additional copies of dmyc behaved as super-competitors or losers when
confronted with wild type cells or cells with four copies of dmyc, respectively
(Moreno and Basler, 2004), which demonstrates that competition is based on
relative and not absolute levels of dmyc. The Minute mutation suppressed the
super-competitor phenotype of dmyc overexpression (Moreno and Basler, 2004),
which suggests that dmyc competition could be genetically related to Minute.
Interestingly, in the mouse embryo, cells with lower levels of Myc are eliminated
(Clavería et al., 2013; Sancho et al., 2013).
The Hippo pathway was also demonstrated to be involved in cell competition.
Resembling dmyc overexpression, mutations in components of the Hippo pathway
produced super-competitive clones of cells, which invade the whole compartment
(Tyler et al., 2007). This is probably driven by the upregulation of dmyc by Yki, as
dMyc downregulation was enough to abolish the super-competitive status of
activated Yki clones (Ziosi et al., 2010).
Defects in polarity genes also induce cell competition. It was extensively shown
that clones of cells mutant for lgl/dlg/scrib, when surrounded by wild type cells,
are eliminated by a JNK-dependent apoptosis due to loss of apico-basal polarity
(Froldi et al., 2010; Grzeschik et al., 2010b; Menéndez et al., 2010; Tamori et al.,
2010). The close relationship between the Hippo pathway and apico-basal
polarity cues (described earlier in the introduction), in addition to several
epistatic experiments suggest that the Hippo pathway is the major inducer of cell
competition downstream of polarity defects.
Since the discovery of the Minute- and dMyc-driven cell competition, the collection
of pathways that induce competitive interactions has been continuously growing

INTRODUCTION
48
and many of them depend, at the end, on Minute or dMyc. However, this is not true
for all the cases. Some of the exceptions include modulations of Wg and JAK-STAT
signaling pathways. Local downregulation of Wg signaling lead to clone
elimination, while its hyper-activation generated super-competitive interactions
(Giraldez and Cohen, 2003; Johnston and Sanders, 2003). Similarly,
downregulation of JAK-STAT signaling in a group of cells lead to their elimination
by apoptosis, whereas STAT hyper-activation produced super-competitors that
grow at the expense of the surrounding wild type cells (Rodrigues et al., 2012).
Cell competition induced by both Wg and JAK-STAT signaling has been shown to
be independent of dMyc (Amoyel and Bach, 2014; Giraldez and Cohen, 2003;
Johnston and Sanders, 2003; Rodrigues et al., 2012). Yet, super-competition is not
a general feature induced by any hyper-proliferative clone, as overexpression of
the PI3K/Dp110 or the cell cycle regulators Cyclin D and Cdk4 both generated
large clones, but no elimination of the surrounding cells was observed (De La Cova
et al., 2004; Moreno and Basler, 2004). These observations suggest that a
difference in growth rates alone does not always trigger cell competition.
Hallmarks of cell competition
The first trademark is the survival defect of loser cells. Outcompeted cells undergo
apoptosis and are eventually eliminated from the tissue. Most of this apoptosis is
observed at the boundary between the two confronting cell populations, the
winners and the losers, since cell competition is based on direct cell-cell
interactions between two different types of clones.
The second hallmark is that loser cells remain viable in a homotypic environment,
when surrounded by cells with the same genetic background. In fact, in a group of
loser cells, the cells in the center of the clone do not undergo apoptosis since they
are surrounded by cells with the same fitness.
When a Minute background is able to both rescue the elimination of mutant cells
and the competition-dependent cell death observed at a boundary with wild type
cells, one can say that the mutant cells fulfill the third hallmark of cell competition.

INTRODUCTION
49
What are the cells competing for?
One intriguing question in the field is what could be the limiting factors for which
cells are competing. The ligand capture hypothesis proposes that cells compete
for extracellular survival and growth factors (Moreno, 2008). This was suggested
based on the observation that the elimination of Minute clones was driven by a
relative deficit of Dpp activation, leading to ectopic upregulation of its negative
downstream target Brinker (Moreno et al., 2002). Therefore, cells compete for the
uptake of limiting growth and survival factors, such as Dpp, so that any cell
showing a relative fitness disadvantage might result in reduction of Dpp uptake,
which is translated into a low survival signaling and their consequent elimination
(Figure 13). It remains to be understood how less fits cells end up with a lower
Dpp uptake.
Figure 13. The ligand-capture hypothesis. Cells compete for extracellular survival and growth factors such as Dpp. Somehow, winner cells (in red) are able to obtain more Dpp growth and survival factor. Consequently, the nearby loser cells (in blue) have a lower survival signaling, activate the JNK signaling and/or Hid transcription, which leads to apoptosis. Cells compare Dpp signaling levels between them, which leads to the definition of which become the losers. Adapted from (Moreno, 2008).

INTRODUCTION
50
Another possibility could be that cell competition occurs because of limited space
and mechanical constraints. Despite of events of cell competition, the final wing
and compartment size is largely unaffected compared to wild type wings. Growth
in a limited space could be a key factor to drive cell competition. Differential
growth rates between neighboring cells could induce mechanical stress and
feedback on the rate of cell division and apoptosis (Shraiman, 2005). In this sense,
elimination of the loser cells could be due to mechanical constraints induced by
fast-growing cells.
The function of cell competition
The conservation of cell competition from invertebrates to mammals suggests
that this phenomenon has important evolutionary purposes. The elimination of
less fit cells suggests that cell competition is a mechanism by which tissues
maximize their fitness and buffer potential genetic fluctuations at the cellular
level.
Since elimination of suboptimal loser cells is accompanied by compensatory
proliferation of optimal winner cells, resulting in organs with the normal final size
and shape, cell competition has been proposed to be a size-control mechanism.
Moreover, adult organ size becomes more variable when cell competition is
blocked in developing tissues, suggesting that it is also important to reduce size
variability (De La Cova et al., 2004).
In addition, the observation that discontinuities in the Dpp gradient in imaginal
discs generate local apoptosis mediated by the activation of the JNK pathway
suggested that there is a mechanism by which incorrectly specified cells are
identified and removed (Adachi-Yamada and O’Connor, 2002). This process was
called morphogenetic apoptosis and is likely related to cell competition since
apoptosis is triggered in the loser cells between 24-48 hours after the onset of the
cell interactions (Adachi-Yamada and O’Connor, 2002). It has also been shown
that clones of cells overexpressing spalt, which is normally expressed in the
medial part of the wing disc, are eliminated in the lateral regions where spalt is

INTRODUCTION
51
not normally expressed but they do survive in medial region (Milan et al., 2002).
Ectopic Spalt activity in the lateral region leads cells to acquire an incorrect medial
identity that is recognized as aberrant by the neighboring cells thus triggering cell
competition.
The universal proposition is that cell competition fulfills a general surveillance
role to recognize and eliminate cells with developmental/metabolic features
different from those of normal cells of the same population. Interestingly, the
elimination of less fit cells has been shown to delay aging and prolong lifespan in
Drosophila (Merino et al., 2015).
Tumor suppressor or pro-tumoral role
Tumors are caused by uncontrolled proliferation of transformed mutant cells with
either activated oncogenes or inactivated tumor suppressors, and malignant
neoplasias arise from tumor cells that have lost the ability to assemble and create
tissues of normal form and function. In other words, cancer can be seen as a
disease that arises when mutant cells fail to obey the intrinsic tissue-integrity and
organ-size control systems. Since the process of cell competition is deeply
involved in the maintenance of tissue integrity and regulation of organ size, the
relationship between cell competition and cancer progression is currently an
issue of interest. Actually, there is now evidence that cell competition can function
as both a tumor promoter as well as a tumor suppressor. Deriving from the
general surveillance function described above it comes the idea of cell competition
as a tumor suppressor mechanism. It assures elimination of potentially
deleterious (precancerous) cells and promotes epithelial integration. This idea
comes from the studies revealing that epithelial cells mutant for tumor suppressor
genes, such as lgl, dlg and scrib, which show overgrowth and tumorigenesis in a
homotypic situation, are frequently eliminated through cell competition when
surrounded by wild type cells (Froldi et al., 2010; Grzeschik et al., 2010b;
Menéndez et al., 2010; Tamori et al., 2010). Elimination of abnormal cells that

INTRODUCTION
52
would otherwise over-proliferate could mitigate the appearance of the fast-
growing clonal population and the expansion of a precancerous field.
However, it was demonstrated that the surveillance role of cell competition can
sometimes be evaded since induction of lgl and scrib mutant clones can eventually
generate tumors. Clones of cells mutant for lgl or scrib in which either the Ras
signaling pathway is constitutively active or Yki is overexpressed are frequently
not eliminated and can develop overgrowing tumors colonizing the entire disc
(Menéndez et al., 2010). By acquiring a higher proliferation rate, lgl or scrib
mutant cells become super-competitors and eliminate the surrounding non-
tumor cells. This would be a reversion of the normal process and now cell
competition behaves as a tumor promoting mechanism. So, tumor cells by
creating a protective microenvironment, evade cell competition and become
tumorigenic. Another example is the observation that, while individual
endocytosis defective Rab5 mutant cells are eliminated by cell competition, if a
group of about 400-500 cells, also surrounded by normal cells, are simultaneously
made defective for Rab5 activity they do survive and form an invasive tumor
(Ballesteros-Arias et al., 2013). It is worth to note that these Rab5 defective cells
do not have a proliferative advantage. They continue proliferating while the rest
of the disc grows at a lower rate.
Super-competitive interactions could be exploited by the early tumor in order to
kill neighboring normal cells and accelerate its expansion. The observation that
cells with high dMyc levels, and as such higher proliferation rates, are able to
eliminate the wild type cells that surround them, indicates that cell competition
favors cells with high dMyc activity. In fact, higher Myc activity is a characteristic
feature of many tumor cells (Gabay et al., 2014).
Another possibility is that the tumorigenic potential of cell competition is a side
effect of the mechanism of cell removal by apoptosis. This is because it is well
known that cells that enter the apoptotic program not only activate the caspases
for self-destruction but they also secrete mitogenic signals that induce
proliferation of neighboring cells (Pérez-Garijo et al., 2004; Ryoo et al., 2004). In

INTRODUCTION
53
cases of large-scale cell competition, the amount of proliferative signaling
emanating from the dying cells may be sufficient to stimulate growth of the tissue
close by and outside the range of cell competition, becoming tumorigenic.
In the example above mentioned concerning simultaneous generation of cells
defective for Rab5, the interface between normal and Rab5 mutant cells has been
shown to be highly proliferative and the dividing cells are often very close to those
dying by apoptosis (Ballesteros-Arias et al., 2013). This suggests that the
proliferative signaling from apoptotic cells may contribute to the growth of the
tumor. In fact, suppression of apoptosis in the Rab5 mutant domain strongly
inhibits the overgrowth of the tumor (Ballesteros-Arias et al., 2013). Thus, under
these circumstances cell competition reverses its normal anti-tumoral role and
stimulates growth through proliferative signals from apoptotic cells.
Genetic mosaic analysis also revealed an unusual tumor-promoting cell
population called “oncogenic niche cells” (ONCs). Oncogenic niche cells drive non-
autonomous tumor progression through cellular competition and cooperation
with surrounding cells (reviewed in Enomoto et al., 2015). Clones of cells that
overexpress Src in the Drosophila wing imaginal disc are eliminated by cell
competition (Vidal et al., 2006). However, these clones also function as ONCs
causing non-autonomous overgrowth of surrounding tissue (Enomoto and Igaki,
2012). Similarly, cell mutants for Rab5 are able to form ONCs that, through the
secretion of the growth factor Unpaired, causes overgrowth of the nearby cells
(Takino et al., 2014). In a similar phenomenon, when cell death is induced but not
executed, typically through expression of the caspase inhibitor p35, persistent
“undead” cells become ONCs and trigger non-autonomous overgrowth through
the secretion of the growth factors Dpp and Wg (Huh et al., 2004; Pérez-Garijo et
al., 2004; Ryoo et al., 2004). Aneuploid cells when maintained in the tissue also
trigger non-autonomous hyperplasia by secreting Wg (Dekanty et al., 2012).
Intriguingly, undead cells can also cause non-autonomous apoptosis (Pérez-Garijo
et al., 2013). Overall, dying ONCs may unleash an autocatalytic wave of death,
growth factor secretion and proliferation.
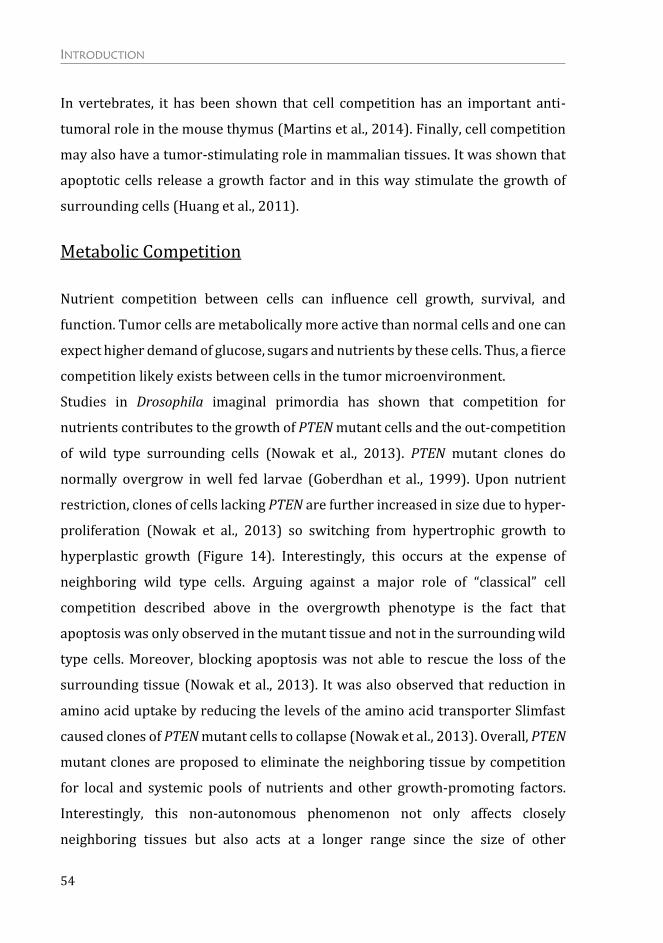
INTRODUCTION
54
In vertebrates, it has been shown that cell competition has an important anti-
tumoral role in the mouse thymus (Martins et al., 2014). Finally, cell competition
may also have a tumor-stimulating role in mammalian tissues. It was shown that
apoptotic cells release a growth factor and in this way stimulate the growth of
surrounding cells (Huang et al., 2011).
Metabolic Competition
Nutrient competition between cells can influence cell growth, survival, and
function. Tumor cells are metabolically more active than normal cells and one can
expect higher demand of glucose, sugars and nutrients by these cells. Thus, a fierce
competition likely exists between cells in the tumor microenvironment.
Studies in Drosophila imaginal primordia has shown that competition for
nutrients contributes to the growth of PTEN mutant cells and the out-competition
of wild type surrounding cells (Nowak et al., 2013). PTEN mutant clones do
normally overgrow in well fed larvae (Goberdhan et al., 1999). Upon nutrient
restriction, clones of cells lacking PTEN are further increased in size due to hyper-
proliferation (Nowak et al., 2013) so switching from hypertrophic growth to
hyperplastic growth (Figure 14). Interestingly, this occurs at the expense of
neighboring wild type cells. Arguing against a major role of “classical” cell
competition described above in the overgrowth phenotype is the fact that
apoptosis was only observed in the mutant tissue and not in the surrounding wild
type cells. Moreover, blocking apoptosis was not able to rescue the loss of the
surrounding tissue (Nowak et al., 2013). It was also observed that reduction in
amino acid uptake by reducing the levels of the amino acid transporter Slimfast
caused clones of PTEN mutant cells to collapse (Nowak et al., 2013). Overall, PTEN
mutant clones are proposed to eliminate the neighboring tissue by competition
for local and systemic pools of nutrients and other growth-promoting factors.
Interestingly, this non-autonomous phenomenon not only affects closely
neighboring tissues but also acts at a longer range since the size of other

INTRODUCTION
55
structures of the fly was also reduced (Nowak et al., 2013). This suggests that the
PTEN mutant tissue efficiently competes with other larval tissues for common
resources to support their massive growth, thereby launching a vicious cycle in
the neighboring tissue that is further starved and reduced. Remarkably, it was
demonstrated that human cancer cell lines lacking PTEN or with increased PI3K
activity are more resistant to dietary restriction (Kalaany and Sabatini, 2009).
Figure 14. Metabolic competition upon nutrient challenge. (A) Under standard food conditions, PTEN mutant tissue overgrows in a hypertrophic manner, giving rise to bigger structures. (B) Upon nutrient restriction, the PTEN mutant tissue is metabolically more active and outcompetes the surrounding wild type tissue, resulting in a hyperplastic overgrowth. The size of the tissue is further increased because of more PTEN mutant cells. The PTEN mutant tissue is susceptible to apoptosis, and it depends on the function of the amino acid transporter Slimfast. Under both conditions, the PTEN mutant tissue exhibits high insulin signaling activity and is dependent on the functions of PKB and TORC1. Adapted from (Nowak et al., 2013).
Glucose competition in the tumor microenvironment was also demonstrated to
influence cancer progression. In a mouse model it was shown that tumor cells can
metabolically restrict immune cells and, and as such, affect their functionality
which can thus influence cancer progression (Chang et al., 2015).

INTRODUCTION
56
Coordination of growth
In order to give rise to a fully functional organism, growth has to be coordinated
between and within the different structures of an animal. Therefore, organ-
autonomous signals must assure that growth is coordinated within the organs,
namely between its different cell populations such as the compartments of the
wing imaginal disc. The observation that cell competition does not cross the
boundaries between adjacent compartments led to the hypothesis that
compartments might be independent units of growth, providing evolution with
building blocks that could be changed while insulating the rest of the animal (Crick
and Lawrence, 1975). Consistent with this view is the observation that
compartments with different growth rates behave as independent developmental
units. The generation of fast-growing (M+) compartments in slow developing
larvae (M/+) showed that each compartment grows at its own rate and manifests
autonomous regulation in the expression of the developmental genes wingless and
vestigial (Martín and Morata, 2006). In spite of these differences, they differentiate
into adult wings of the correct size and shape.
However, there are also evidences that support the idea that adjacent
compartments can adjust their growth rates in a coordinated manner. In
Contrabithorax mutant wings, in which one compartment is reduced in size due to
the transformation to haltere by the ectopic expression of Ubx, the adjacent
compartment adjust its final size resulting in smaller but proportional adult wings
(Gonzalez-Gaitan et al., 1990). Similarly, when the number of cells in one
compartment is reduced, cells in the adjacent compartment reduce proliferation
and enter apoptosis (Milán et al., 1997). Moreover, when growth rates are reduced
in one defined territory within the developing wing primordia, adjacent cell
populations respond as a whole by decreasing their growth and proliferation rates
(Mesquita et al., 2010). In the latter case, the non-autonomous response depends
on the activation of dp53 in the affected territory, which mediates the regulation
of growth and proliferation rates in the neighboring domain. Downstream of dp53,

INTRODUCTION
57
the effector caspases have an important role in reducing the proliferation rates of
the adjacent territories (Mesquita et al., 2010).
Although stated that compartments are independent developmental units, it is
clear that upon insults affecting growth/proliferation rates of a specific territory,
the adjacent cell population is able to respond in a coordinated manner in order
to maintain tissue homeostasis and achieve a fully functional adult structure.
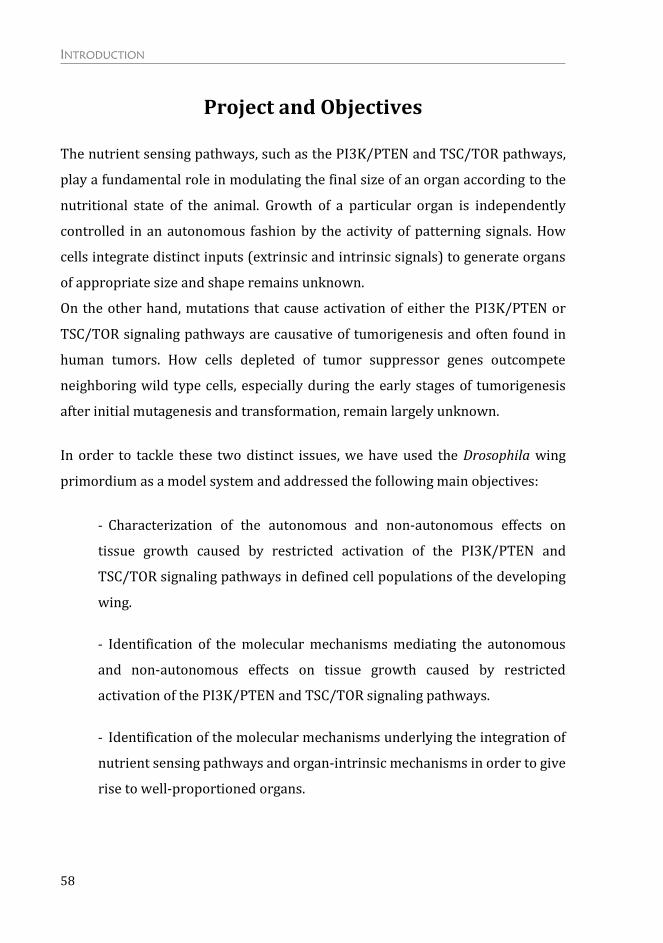
INTRODUCTION
58
Project and Objectives
The nutrient sensing pathways, such as the PI3K/PTEN and TSC/TOR pathways,
play a fundamental role in modulating the final size of an organ according to the
nutritional state of the animal. Growth of a particular organ is independently
controlled in an autonomous fashion by the activity of patterning signals. How
cells integrate distinct inputs (extrinsic and intrinsic signals) to generate organs
of appropriate size and shape remains unknown.
On the other hand, mutations that cause activation of either the PI3K/PTEN or
TSC/TOR signaling pathways are causative of tumorigenesis and often found in
human tumors. How cells depleted of tumor suppressor genes outcompete
neighboring wild type cells, especially during the early stages of tumorigenesis
after initial mutagenesis and transformation, remain largely unknown.
In order to tackle these two distinct issues, we have used the Drosophila wing
primordium as a model system and addressed the following main objectives:
- Characterization of the autonomous and non-autonomous effects on
tissue growth caused by restricted activation of the PI3K/PTEN and
TSC/TOR signaling pathways in defined cell populations of the developing
wing.
- Identification of the molecular mechanisms mediating the autonomous
and non-autonomous effects on tissue growth caused by restricted
activation of the PI3K/PTEN and TSC/TOR signaling pathways.
- Identification of the molecular mechanisms underlying the integration of
nutrient sensing pathways and organ-intrinsic mechanisms in order to give
rise to well-proportioned organs.

RESULTS


RESULTS
61
Results
Effects of Targeted Activation of Growth in Epithelial Cells
In order to address whether activation of growth promoting pathways in specific
cell populations has any effect on the surrounding cell populations, we made use
of the Gal4/UAS system (Brand and Perrimon, 1993) to drive expression of
different transgenes in specific territories of the wing imaginal disc. To promote
growth, we activated the PI3K/PTEN and TSC/TOR pathways, which are known
to induce tissue growth in the developing imaginal primordia and to give rise to
overgrown adult structures (Gao and Pan, 2001; Goberdhan et al., 1999; Huang et
al., 1999; Ito and Rubin, 1999; Tapon et al., 2001). To activate the PI3K/PTEN
pathway, we made use of two different transgenes: UAS-PI3K-92E (also termed
Drosophila p110 or Dp110); and a double stranded RNA (dsRNA) form of PTEN (a
negative regulator of PI3K/Dp110), a tumor suppressor gene that acts negatively
on the insulin pathway in invertebrate and mammalian systems (Goberdhan et al.,
1999). To activate the TSC/TOR pathway we used a UAS-Rheb transgene, to
express the guanosine-5'-triphosphate (GTP)-binding protein Rheb, which binds
and activates TOR (Stocker et al., 2003; Zhang et al., 2003). Larvae containing the
Gal4 driver and the UAS transgene were grown at 25°C until eclosion of the adult
flies in order to analyse the resulting adult wings in what concerns size. Larvae
expressing an UAS-GFP transgene and the corresponding Gal4 driver were
subjected to the same temperature schemes and used as controls.
Activation of PI3K/PTEN and TSC/TOR signaling pathways cause
tissue overgrowth in the wing primordia
The activation of the PI3K/PTEN pathway in the whole wing blade (with the
nubbin-gal4 driver, Figure 15), either by expression of Dp110/PI3K or a double
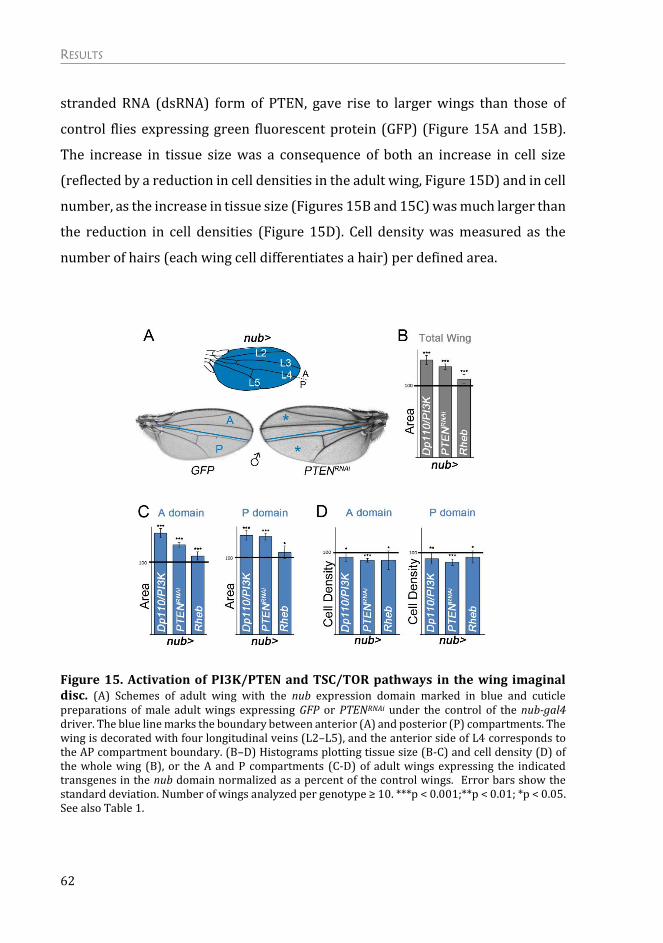
RESULTS
62
stranded RNA (dsRNA) form of PTEN, gave rise to larger wings than those of
control flies expressing green fluorescent protein (GFP) (Figure 15A and 15B).
The increase in tissue size was a consequence of both an increase in cell size
(reflected by a reduction in cell densities in the adult wing, Figure 15D) and in cell
number, as the increase in tissue size (Figures 15B and 15C) was much larger than
the reduction in cell densities (Figure 15D). Cell density was measured as the
number of hairs (each wing cell differentiates a hair) per defined area.
Figure 15. Activation of PI3K/PTEN and TSC/TOR pathways in the wing imaginal disc. (A) Schemes of adult wing with the nub expression domain marked in blue and cuticle preparations of male adult wings expressing GFP or PTENRNAi under the control of the nub-gal4 driver. The blue line marks the boundary between anterior (A) and posterior (P) compartments. The wing is decorated with four longitudinal veins (L2–L5), and the anterior side of L4 corresponds to the AP compartment boundary. (B–D) Histograms plotting tissue size (B-C) and cell density (D) of the whole wing (B), or the A and P compartments (C-D) of adult wings expressing the indicated transgenes in the nub domain normalized as a percent of the control wings. Error bars show the standard deviation. Number of wings analyzed per genotype ≥ 10. ***p < 0.001;**p < 0.01; *p < 0.05. See also Table 1.
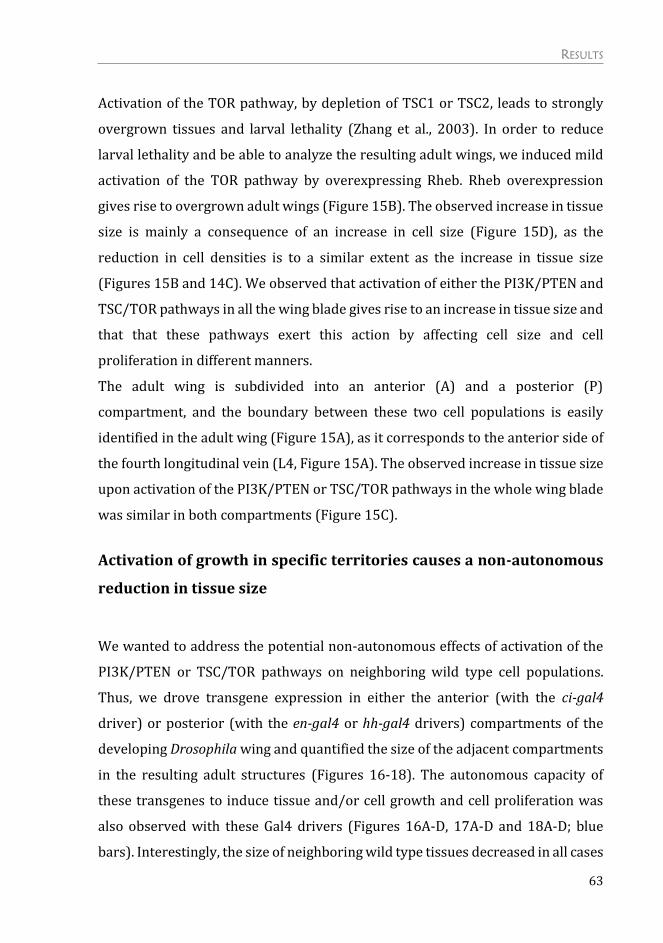
RESULTS
63
Activation of the TOR pathway, by depletion of TSC1 or TSC2, leads to strongly
overgrown tissues and larval lethality (Zhang et al., 2003). In order to reduce
larval lethality and be able to analyze the resulting adult wings, we induced mild
activation of the TOR pathway by overexpressing Rheb. Rheb overexpression
gives rise to overgrown adult wings (Figure 15B). The observed increase in tissue
size is mainly a consequence of an increase in cell size (Figure 15D), as the
reduction in cell densities is to a similar extent as the increase in tissue size
(Figures 15B and 14C). We observed that activation of either the PI3K/PTEN and
TSC/TOR pathways in all the wing blade gives rise to an increase in tissue size and
that that these pathways exert this action by affecting cell size and cell
proliferation in different manners.
The adult wing is subdivided into an anterior (A) and a posterior (P)
compartment, and the boundary between these two cell populations is easily
identified in the adult wing (Figure 15A), as it corresponds to the anterior side of
the fourth longitudinal vein (L4, Figure 15A). The observed increase in tissue size
upon activation of the PI3K/PTEN or TSC/TOR pathways in the whole wing blade
was similar in both compartments (Figure 15C).
Activation of growth in specific territories causes a non-autonomous
reduction in tissue size
We wanted to address the potential non-autonomous effects of activation of the
PI3K/PTEN or TSC/TOR pathways on neighboring wild type cell populations.
Thus, we drove transgene expression in either the anterior (with the ci-gal4
driver) or posterior (with the en-gal4 or hh-gal4 drivers) compartments of the
developing Drosophila wing and quantified the size of the adjacent compartments
in the resulting adult structures (Figures 16-18). The autonomous capacity of
these transgenes to induce tissue and/or cell growth and cell proliferation was
also observed with these Gal4 drivers (Figures 16A-D, 17A-D and 18A-D; blue
bars). Interestingly, the size of neighboring wild type tissues decreased in all cases

RESULTS
64
(Figures 16A, 16C, 17A, 17C, 18A and 18C; white bars), and this decrease was
accompanied by a reduction in cell size (reflected by an increase in cell densities
in the adult wing) (Figures 16D, 17D and 18D, white bars). Therefore, activation
of growth promoting pathways in specific territories of the wing imaginal disc
causes a reduction in tissue and cell size of the neighboring wild type cell
population. The total size of the wing is mostly maintained upon targeted
activation of these pathways in the anterior or posterior compartments of the
wing primordia (Figures 16B, 17B and 18B).
Figure 16. Activation of PI3K/PTEN and TSC/TOR pathways in the anterior compartment. (A) Schemes of adult wing with the ci expression domain marked in blue and cuticle preparations of male adult wings expressing GFP or PTENRNAi under the control of the ci-gal4 driver. The blue line marks the boundary between anterior (A) and posterior (P) compartments. The wing is decorated with four longitudinal veins (L2–L5), and the anterior side of L4 corresponds to the AP compartment boundary. The affected territory is marked with a blue asterisk. (B–D) Histograms plotting tissue size (B-C) and cell density (D) of the whole wing (B), or the A (blue bars) and P (white bars) compartments (C-D) of adult wings expressing the indicated transgenes in the ci domain normalized as a percent of the control wings. Error bars show the standard deviation. Number of wings analyzed per genotype ≥ 10. ***p < 0.001. See also Table 2.
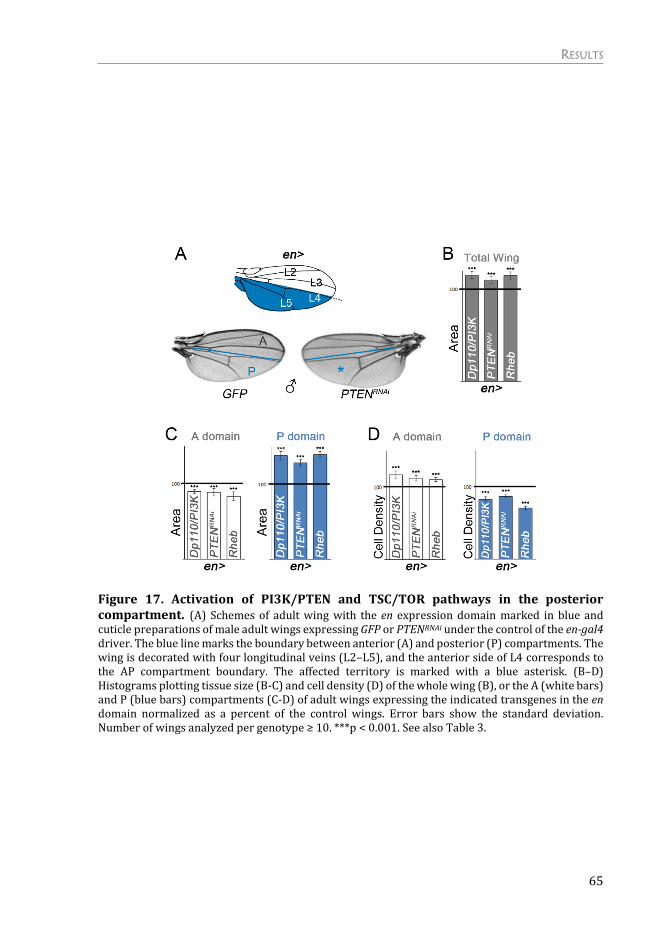
RESULTS
65
Figure 17. Activation of PI3K/PTEN and TSC/TOR pathways in the posterior compartment. (A) Schemes of adult wing with the en expression domain marked in blue and cuticle preparations of male adult wings expressing GFP or PTENRNAi under the control of the en-gal4 driver. The blue line marks the boundary between anterior (A) and posterior (P) compartments. The wing is decorated with four longitudinal veins (L2–L5), and the anterior side of L4 corresponds to the AP compartment boundary. The affected territory is marked with a blue asterisk. (B–D) Histograms plotting tissue size (B-C) and cell density (D) of the whole wing (B), or the A (white bars) and P (blue bars) compartments (C-D) of adult wings expressing the indicated transgenes in the en domain normalized as a percent of the control wings. Error bars show the standard deviation. Number of wings analyzed per genotype ≥ 10. ***p < 0.001. See also Table 3.

RESULTS
66
Figure 18. Activation of PI3K/PTEN and TSC/TOR pathways in the posterior compartment. (A) Cuticle preparations of male adult wings expressing GFP or PTENRNAi under the control of the hh-gal4 driver. The blue line marks the boundary between anterior (A) and posterior (P) compartments. The affected territory is marked with a blue asterisk. (B–D) Histograms plotting tissue size (B-C) and cell density (D) of the whole wing (B), or the A (white bars) and P (blue bars) compartments (C-D) of adult wings expressing the indicated transgenes in the hh domain normalized as a percent of the control wings. Error bars show the standard deviation. Number of wings analyzed per genotype ≥ 10. ***p < 0.001. See also Table 4.
Whether the reductions in cell and tissue size are two independent processes non-
autonomously regulated by the PI3K/PTEN and TSC/TOR pathways or whether
there is a causal relationship between them is further analyzed in the following
sections. The non-autonomous effects on tissue growth were also obtained with
other Gal4 drivers not specific to compartments (Figure 19). Activation of the
PI3K/PTEN pathway in the medial region of the wing primordia (in spaltPE-gal4;
UAS-PTENRNAi individuals) caused a reduction in size of the most lateral regions of
the adult wing (Figure 19A and 19B, white bars) and a non-autonomous reduction

RESULTS
67
in cell size (Figure 19B, white bars). As expected, an autonomous increase in tissue
and cell size was observed in the transgene-expressing domain (Figure 19A and
19B, blue bars).
Figure 19. Non-autonomous effect of activation of growth is not specific to compartments. (A) Cuticle preparations of male adult wings expressing GFP or PTENRNAi under the control of the spaltPE-gal4 driver. The blue lines mark the borders between the medial and lateral regions of the wing. The affected territory is marked with a blue asterisk. (B) Histograms plotting tissue size (on the left) and cell density (on the right) of the medial (blue bars) and lateral (white bars) regions of adult wings expressing PTENRNAi in the spalt domain normalized as a percent of the control wings. Error bars show the standard deviation. Number of wings analyzed per genotype ≥ 10. ***p < 0.001;**p < 0.01. See also Table 5.
Since one of the effects of activation of the PI3K/PTEN signaling pathway is an
increase in the cell proliferation rates, we wondered whether driving cell
proliferation alone was able to produce a non-autonomous effect on the adjacent
cell population. Increased cell proliferation, by means of overexpression of the cell
cycle regulators String/Dcdc25 and CycE (which drive G2/M and G1/S transitions,
respectively), gave rise to a higher number of cells as a consequence of increased
mitotic activity [Figures 20B and 21B, see also (Neufeld et al., 1998)] but was not
sufficient to promote tissue growth (Figure 20A and 20B, blue bars). The
transgene-expressing compartment was, if anything, slightly smaller (Figure 20B,
blue bars), most probably because of the observed increase in the number of
apoptotic cells in the tissue [Figure 21A, see also (Neufeld et al., 1998)]. Thus, the
capacity of PI3K/PTEN to promote tissue growth does not depend only on
increased cell proliferation rates. Driving cell proliferation was not sufficient to
exert any non-autonomous effects on tissue or cell growth either (Figure 20A and
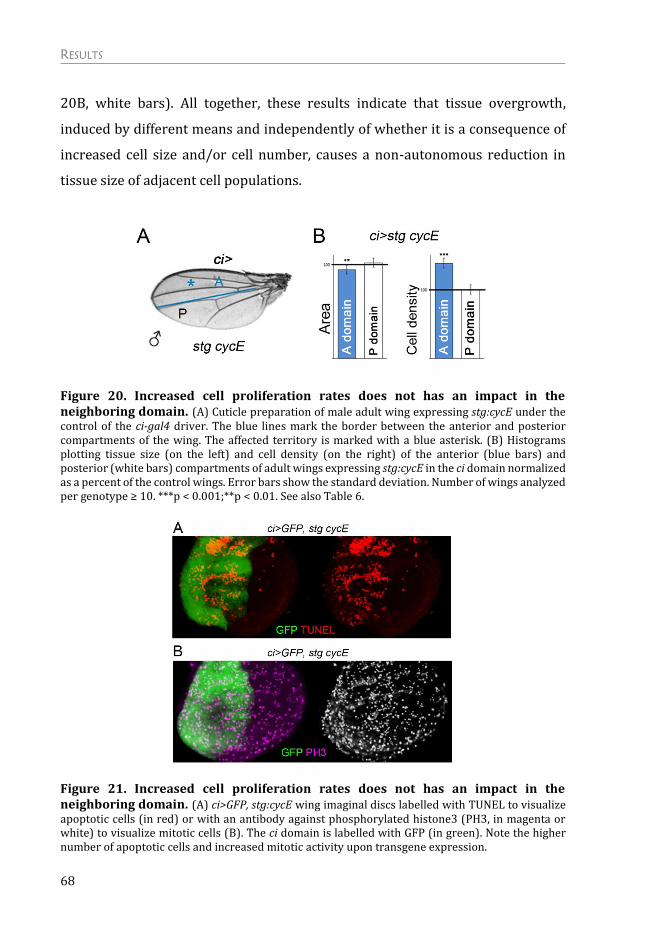
RESULTS
68
20B, white bars). All together, these results indicate that tissue overgrowth,
induced by different means and independently of whether it is a consequence of
increased cell size and/or cell number, causes a non-autonomous reduction in
tissue size of adjacent cell populations.
Figure 20. Increased cell proliferation rates does not has an impact in the neighboring domain. (A) Cuticle preparation of male adult wing expressing stg:cycE under the control of the ci-gal4 driver. The blue lines mark the border between the anterior and posterior compartments of the wing. The affected territory is marked with a blue asterisk. (B) Histograms plotting tissue size (on the left) and cell density (on the right) of the anterior (blue bars) and posterior (white bars) compartments of adult wings expressing stg:cycE in the ci domain normalized as a percent of the control wings. Error bars show the standard deviation. Number of wings analyzed per genotype ≥ 10. ***p < 0.001;**p < 0.01. See also Table 6.
Figure 21. Increased cell proliferation rates does not has an impact in the neighboring domain. (A) ci>GFP, stg:cycE wing imaginal discs labelled with TUNEL to visualize apoptotic cells (in red) or with an antibody against phosphorylated histone3 (PH3, in magenta or white) to visualize mitotic cells (B). The ci domain is labelled with GFP (in green). Note the higher number of apoptotic cells and increased mitotic activity upon transgene expression.

RESULTS
69
Targeted Activation of the PI3K/PTEN or TSC/TOR Pathways Induces
a Non-autonomous Reduction of Growth Rates in Adjacent Cell
Populations
The results presented so far indicate that activation of growth promoting
pathways in defined territories of the wing primordia causes a non-autonomous
decrease in final tissue size of nearby cell populations. To understand whether
this non-autonomous response is an active mechanism that takes place during
development, we monitored the size of the A and P compartments throughout
development after targeted expression of growth-promoting transgenes in
anterior cells. Larvae expressing Dp110/PI3K, Rheb, or GFP in the A compartment
(with the ci-gal4 driver) were grown at 25°C, and the absolute size of the
transgene-expressing (A) and non-expressing (P) compartments was quantified
at a range of time points of larval development. We focused our attention on third
instar wing discs (from 72h to 140h after egg laying [AEL]), as primordia of the
future adult wings are specified in late second instar (around 60 h AEL, (Ng et al.,
1996)). The autonomous impact of Dp110/PI3K or Rheb on tissue growth was
already visible in mid–late third instar wing discs (96–140h AEL), and, most
interestingly, this was accompanied by a clear reduction in tissue size of the
neighboring P compartment (Figure 22A and 22B). Both the autonomous increase
in tissue size as well as the reduction in the size of the adjacent domain was more
evident as development proceeds (Figure 22). Thus, activation of growth
promoting pathways in one territory causes a non-autonomous reduction in
growth rates of the adjacent cell population throughout development.

RESULTS
70
Figure 22. Reduction of growth rates of the neighboring domain. (A) Quantification of tissue size (in arbitrary units [a.u.]) of both anterior (A, dark colors) and posterior (P, light colors) domains of wing imaginal discs where GFP (grey curves), Dp110 (green curves) and Rheb (red curves) were expressed in the anterior compartment using the ci-gal4 driver in three distinct time points during development (in hours [h] AEL). Error bars show the standard deviation. Number of wing discs analyzed per genotype ≥ 15. ***p < 0.001; **p < 0.01. (B). Examples of ci>2xGFP (upper panel) and ci>GFP, Dp110 (lower panel) wing imaginal discs in the developmental time points shown in panel A. The transgene-expressing domain is marked with GFP (in green), and the disc is labelled with DAPI (in blue). The A and P compartments are indicated. See also Table 7.
Targeted Activation of the PI3K/PTEN or TSC/TOR Pathways Induces
a Non-autonomous Reduction of Proliferation Rates in Adjacent Cell
Populations
In order to investigate whether cell proliferation rates are also regulated in a non-
autonomous manner, we induced neutral clones of cells at the beginning of the
third instar period (72h AEL) and examined the size of these clones 72h after
induction in late third instar wing imaginal discs. Clone size (in arbitrary units
[a.u.]) and number of cells per clone were measured in ci-gal4; UAS-GFP/UAS-
Dp110 wing discs and these two measurements were compared to those of control
clones induced in ci-gal4; UAS-GFP/+ wing discs grown in parallel. In Dp110-

RESULTS
71
expressing wing discs, the size of the clones in the A compartment was, as
expected, significantly larger than the size of clones quantified in the A
compartment of GFP-expressing discs (Figure 23A and 23B). However, these
clones were not composed by a higher number of cells (Figure 23C). Interestingly,
the clone size and the number of cells per clone were significantly smaller in the
posterior compartment of Dp110-expressing wing discs than in GFP-expressing
ones (Figure 23A–23C).
Figure 23. Reduction of proliferation rates in the neighboring territory. (A) Examples of clones of cells in ci>GFP (left panel) and ci>GFP, Dp110 (right panel) wing discs 72h after clone induction. The transgene-expressing domain is marked with GFP (in green), and the clones are labelled by the absence of nuclear red fluorescent protein (RFP, red) expression. The A and P compartments are indicated. (B, C). Histograms plotting the size of clones (in a.u., B) and the number of cells per clone (C) located in the A or P compartment of ci>GFP and ci>GFP, Dp110 wing discs. Error bars indicate the standard deviation. Number of clones analyzed per genotype ≥ 30. ***p < 0.001; ns, not significant. See also Table 8.
From the clonal analysis, we can conclude that activation of growth promoting
pathways in one territory of the wing imaginal disc causes a reduction in the
proliferation rates of the adjacent cell population, in addition to the already
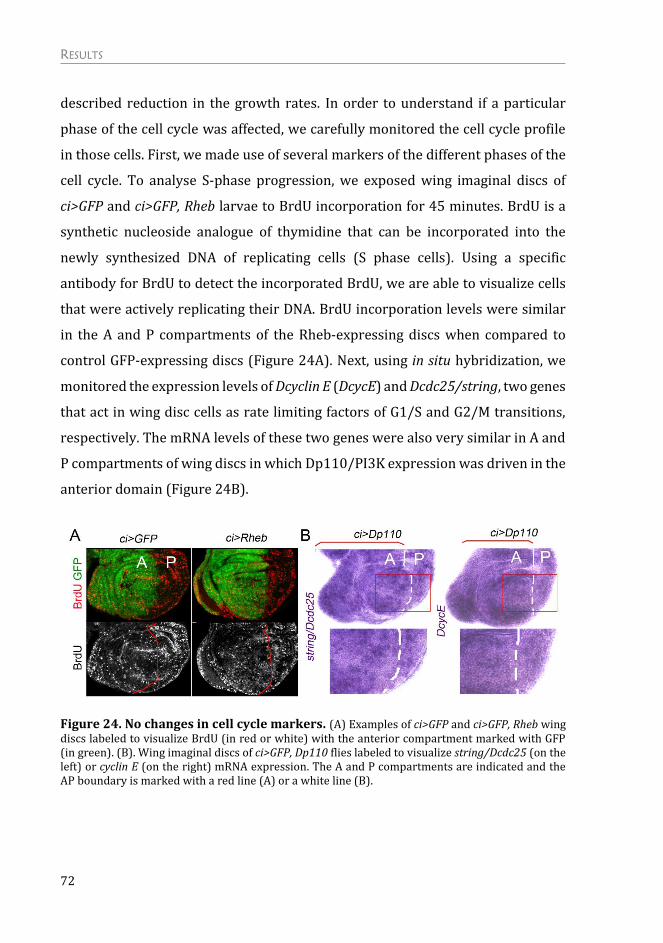
RESULTS
72
described reduction in the growth rates. In order to understand if a particular
phase of the cell cycle was affected, we carefully monitored the cell cycle profile
in those cells. First, we made use of several markers of the different phases of the
cell cycle. To analyse S-phase progression, we exposed wing imaginal discs of
ci>GFP and ci>GFP, Rheb larvae to BrdU incorporation for 45 minutes. BrdU is a
synthetic nucleoside analogue of thymidine that can be incorporated into the
newly synthesized DNA of replicating cells (S phase cells). Using a specific
antibody for BrdU to detect the incorporated BrdU, we are able to visualize cells
that were actively replicating their DNA. BrdU incorporation levels were similar
in the A and P compartments of the Rheb-expressing discs when compared to
control GFP-expressing discs (Figure 24A). Next, using in situ hybridization, we
monitored the expression levels of Dcyclin E (DcycE) and Dcdc25/string, two genes
that act in wing disc cells as rate limiting factors of G1/S and G2/M transitions,
respectively. The mRNA levels of these two genes were also very similar in A and
P compartments of wing discs in which Dp110/PI3K expression was driven in the
anterior domain (Figure 24B).
Figure 24. No changes in cell cycle markers. (A) Examples of ci>GFP and ci>GFP, Rheb wing discs labeled to visualize BrdU (in red or white) with the anterior compartment marked with GFP (in green). (B). Wing imaginal discs of ci>GFP, Dp110 flies labeled to visualize string/Dcdc25 (on the left) or cyclin E (on the right) mRNA expression. The A and P compartments are indicated and the AP boundary is marked with a red line (A) or a white line (B).

RESULTS
73
To analyse mitotic activity, we stained third instar wing imaginal discs with an
antibody against a phosphorylated form of histone H3 at serine 10 (PH3) that
labels mitotic cells. No qualitative difference was observed in PH3 staining in wing
imaginal discs where PI3K/PTEN or TSC/TOR signalling pathways were activated
in the anterior compartment when compared to control discs (Figure 25A).
Quantifying the number of mitotic cells (cells positive for PH3) per area of each
compartment showed that no major differences in mitotic activity occur in neither
the autonomous and non-autonomous compartments of wing discs where Rheb or
Dp110 were overexpressed either in the anterior or posterior compartment when
compared to control wing discs (Figure 25B and 25C). Altogether, these
observations suggest that the non-autonomous impact on proliferation rates is
not due to any obvious arrest in a specific phase of the cell cycle.
Figure 25. Mitotic activity remains unchanged. (A) Examples of ci>GFP, ci>GFP, Rheb and ci>GFP, Dp110 wing discs stained for PH3 (in magenta or white) with the anterior compartment marked with GFP (in green). The A and P compartments are indicated. (B, C). Histograms plotting the number of mitotic figures/area for the anterior and posterior compartments of wing discs of ci>GFP, ci>GFP, Rheb, ci>GFP, Dp110 (B) and en>GFP, en>GFP, Rheb and en>GFP, Dp110 (C). Error bars indicate the standard deviation. No significant differences where observed. Number of discs analyzed per genotype ≥ 10. *p < 0.05; ns, not significant. See also Table 9.
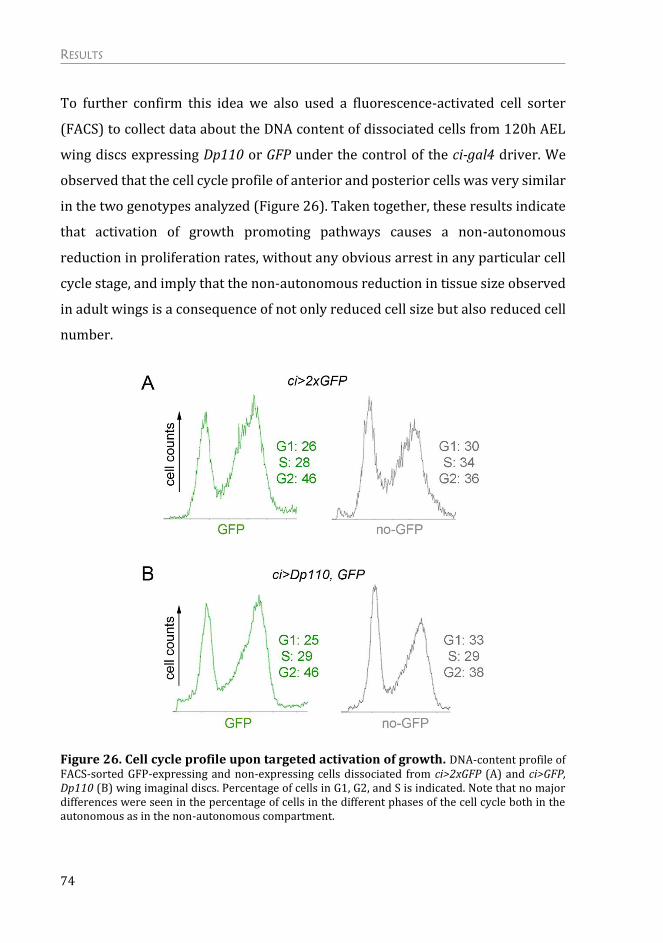
RESULTS
74
To further confirm this idea we also used a fluorescence-activated cell sorter
(FACS) to collect data about the DNA content of dissociated cells from 120h AEL
wing discs expressing Dp110 or GFP under the control of the ci-gal4 driver. We
observed that the cell cycle profile of anterior and posterior cells was very similar
in the two genotypes analyzed (Figure 26). Taken together, these results indicate
that activation of growth promoting pathways causes a non-autonomous
reduction in proliferation rates, without any obvious arrest in any particular cell
cycle stage, and imply that the non-autonomous reduction in tissue size observed
in adult wings is a consequence of not only reduced cell size but also reduced cell
number.
Figure 26. Cell cycle profile upon targeted activation of growth. DNA-content profile of FACS-sorted GFP-expressing and non-expressing cells dissociated from ci>2xGFP (A) and ci>GFP, Dp110 (B) wing imaginal discs. Percentage of cells in G1, G2, and S is indicated. Note that no major differences were seen in the percentage of cells in the different phases of the cell cycle both in the autonomous as in the non-autonomous compartment.

RESULTS
75
Mechanism of the Non-autonomous Response
The results presented so far point out that when growth-promoting pathways are
activated in specific territories of the developing wing, a non-autonomous
response is triggered and a reduction in growth and proliferation rates of nearby
wild type territories is observed. Next, we wanted to understand the mechanism
behind this non-autonomous response.
The non-autonomous response is not due to a systemic effect on
growth
In some situations, an insult to the imaginal discs can trigger a systemic response
in what concerns its growth rates and developmental timing. For example,
abnormally growing imaginal discs present a developmental delay, which is a
consequence of secretion of Dilp8 by those cells (Colombani et al., 2012; Garelli et
al., 2012). We wondered whether the non-autonomous effects on tissue size that
we observed are a local response or a systemic response triggered by the insult
given to imaginal cells. Expression of Rheb, Dp110/PI3K or a dsRNA against PTEN
under the control of the ci-gal4 driver did not cause major changes in the final
pupal volume when compared to the GFP control animals (Figure 27A). The same
was observed in larvae expressing the same transgenes in the engrailed
expressing domain (Figure 27B). These observations indicate that, targeted
activation of growth promoting pathways in specific territories of the wing
imaginal disc does not affect final body size.

RESULTS
76
Figure 27. Restricted activation of growth does not affect final body size. Quantification of pupal volume upon expression of Rheb, Dp110 and PTENRNAi under the control of the ci-gal4 (A) or the en-gal4 (B) drivers, expressed in percentage of control animals. Error bars represent standard deviation. At least 10 pupas per genotype were measured. *p < 0.05; ns, not significant. See also Table 10.
These results show that no systemic effects in the growth rates and final body size
occur upon restricted activation of growth to specific cell populations of the wing
imaginal disc. This strongly suggests that the observed non-autonomous effects
on growth and proliferation rates are most probably a local response within the
wing imaginal disc. These observations also led us to reject the possibility that the
non-autonomous effects are due to the expression of the gal4 driver in other
tissues besides the anterior or posterior domains of the wing primordia.
Furthermore, when we induced the activation of the growth pathways with the
spaltPE-gal4 driver, which is specific to the wing imaginal disc and is not expressed
in any other tissue, we also observed a non-autonomous reduction in tissue size
(Figure 19).
The non-autonomous effects on tissue growth are independent of
apoptosis and “classic” cell competition
The non-autonomous reduction in growth rates caused by activation of the
PI3K/PTEN or TSC/TOR pathways in defined cell populations of the developing
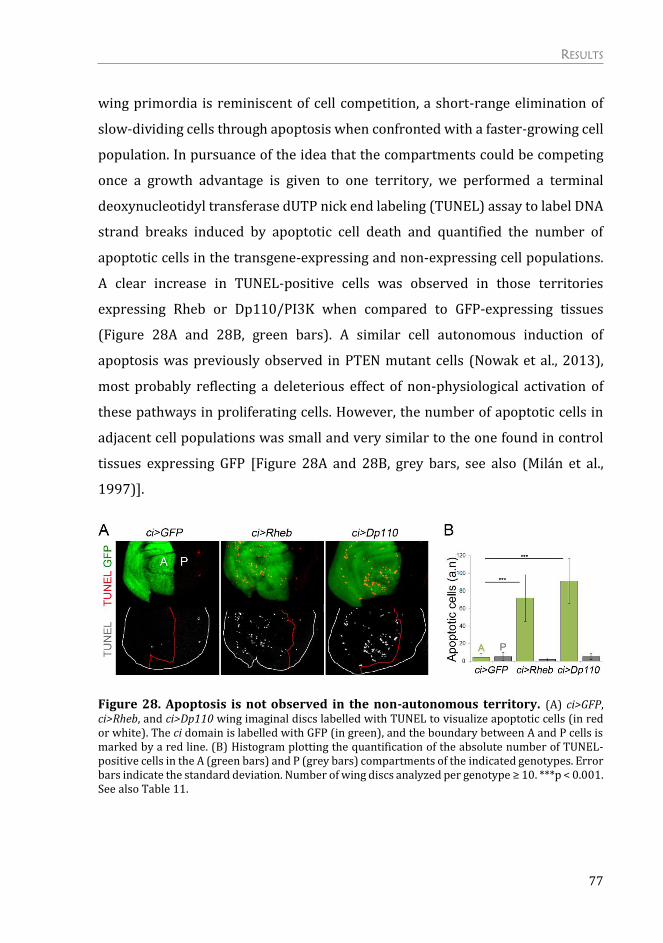
RESULTS
77
wing primordia is reminiscent of cell competition, a short-range elimination of
slow-dividing cells through apoptosis when confronted with a faster-growing cell
population. In pursuance of the idea that the compartments could be competing
once a growth advantage is given to one territory, we performed a terminal
deoxynucleotidyl transferase dUTP nick end labeling (TUNEL) assay to label DNA
strand breaks induced by apoptotic cell death and quantified the number of
apoptotic cells in the transgene-expressing and non-expressing cell populations.
A clear increase in TUNEL-positive cells was observed in those territories
expressing Rheb or Dp110/PI3K when compared to GFP-expressing tissues
(Figure 28A and 28B, green bars). A similar cell autonomous induction of
apoptosis was previously observed in PTEN mutant cells (Nowak et al., 2013),
most probably reflecting a deleterious effect of non-physiological activation of
these pathways in proliferating cells. However, the number of apoptotic cells in
adjacent cell populations was small and very similar to the one found in control
tissues expressing GFP [Figure 28A and 28B, grey bars, see also (Milán et al.,
1997)].
Figure 28. Apoptosis is not observed in the non-autonomous territory. (A) ci>GFP, ci>Rheb, and ci>Dp110 wing imaginal discs labelled with TUNEL to visualize apoptotic cells (in red or white). The ci domain is labelled with GFP (in green), and the boundary between A and P cells is marked by a red line. (B) Histogram plotting the quantification of the absolute number of TUNEL-positive cells in the A (green bars) and P (grey bars) compartments of the indicated genotypes. Error bars indicate the standard deviation. Number of wing discs analyzed per genotype ≥ 10. ***p < 0.001. See also Table 11.

RESULTS
78
When apoptosis was reduced in the whole animal by halving the dose of the pro-
apoptotic genes hid, grim, and reaper (in Df(H99)/+ larvae), the number of
apoptotic cells in the tissue was reduced (Figure 29F, green bars), but the non-
autonomous reduction in tissue size was not rescued (Figure 29A, 29B, 29D and
29E, white bars). This reduction in the number of apoptotic cells did not have any
impact on cell size (Figure 29C).
Figure 29. The non-autonomous reduction in tissue size does not rely on Dp53 nor apoptosis. (A, D) Cuticle preparations of en>GFP, Rheb (A), and ci>GFP, Dp110 (D) adult wings either in a wild type background, in a heterozygous background for H99, or coexpressing a dominant negative form of Dp53 (Dp53Ct). The blue line marks the boundary between the A and P compartments. The domains of transgene expression are marked with a blue asterisk. (B, C, E) Histograms plotting tissue size (B, E) and cell density values (C) of the transgene-expressing compartment (blue bars) and the adjacent cell populations (white bars) of adult wings with the indicated genotypes normalized as a percent of the control wings. (F) Histogram plotting the quantification of the absolute number of TUNEL-positive cells in the P (green bars) and A (grey bars) compartments of the indicated genotypes. Error bars show the standard deviation. Number of wings analyzed per genotype ≥ 10. ***p < 0.001;**p < 0.01; *p < 0.05. See also Table 12.

RESULTS
79
The transcription factor and tumor suppressor p53, a short-lived, nonabundant
protein in healthy cells, plays a fundamental role in regulating the response of
mammalian cells to stress, in part through the transcriptional activation of genes
involved in apoptosis and cell cycle regulation (Levine, 1997). Impaired protein
translation in Drosophila tissues has been previously shown to induce Dp53
activation and Dp53-dependent inhibition of growth and proliferation rates in
adjacent tissues (Mesquita et al., 2010). Indeed, the apoptosis observed upon
overexpression of Rheb was in part due to Dp53 activity since co-expression of a
dominant negative form of Dp53 was able to decrease the number of apoptotic
cells (Dp53Ct, Figure 29F). However, the non-autonomous effects on tissue growth
and cell size caused by Rheb overexpression were unaffected by expression of a
dominant negative version of Dp53 (Dp53Ct, Figure 29A, 29B and 29C). Taken
together, all these results indicate that Dp53 is not required in the overgrown
territory to non-autonomously reduce the growth rates of neighboring cell
populations and that the non-autonomous decrease in growth rates is not a
consequence of programmed cell death.
Apoptotic cells can produce signals to instruct neighboring cells either to undergo
additional proliferation or apoptosis (Huh et al., 2004; Pérez-Garijo et al., 2004;
Pérez-Garijo et al., 2013; Ryoo et al., 2004). We thus analyzed whether the
apoptotic cells observed in the transgene-expressing compartment exerted any
non-autonomous effect on the neighboring compartment. Expression of p35, a
baculovirus protein well known to block apoptosis at the level of the effector
apoptotic caspases (Hay et al., 1994), was not able to rescue the non-autonomous
decrease in tissue growth caused by Rheb overexpression (Figure 30A, white
bars). In fact, we find out that expression of p35 slightly reduce the autonomous
overgrowth caused by Rheb expression (Figure 30A, blue bars) and further
reduced the size of the adjacent territory (Figure 30A, white bars). We found out
that p35 expression caused an increase in cell density in both the transgene-
expressing compartment (Figure 30B, blue bars) as well as in the neighboring
domain (Figure 30B, white bars), most probably reflecting apoptosis-induced cell

RESULTS
80
proliferation caused by undead cells. Indeed, mitotic activity was both
autonomously and non-autonomously increased in the developing primordia
expressing p35 (Figure 30C, blue and grey bars). These results indicate that dying
cells in the transgene expressing compartment do not contribute to the non-
autonomous reduction in tissue and cell size.
Figure 30. The dying cells do not contribute to the non-autonomous reduction in tissue and cell size. (A, B) Histograms plotting tissue size (A) and cell density (B) values of the transgene-expressing compartment (blue bars) and the adjacent cell populations (white bars) of adult wings of en>GFP, Rheb and en>Rheb, p35 normalized as a percent of the control GFP-expressing wings. (C) Histogram plotting the number of mitotic figures/area for the anterior (grey bars) and posterior (blue bars) compartments of wing discs of en>2xGFP; en>GFP, Rheb; en>Rheb, p35; en>GFP, Dp110 and en>Dp110, p35. Error bars indicate the standard deviation. Number of wings/discs analyzed per genotype ≥ 10. ***p < 0.001; **p < 0.01; *p < 0.05. See also Table 13.

RESULTS
81
The non-autonomous effects on tissue growth are not due to
competition for nutrients
PTEN mutant cells generated in Drosophila tissues have been recently shown to
acquire a growth advantage under starvation conditions at the expense of the wild
type neighboring cells, and this growth advantage has been proposed to rely on
the withdrawal of nutrients from neighboring cells (Nowak et al., 2013). To assess
the impact of nutrient availability on the autonomous and non-autonomous
effects caused by expression of Rheb or PTENRNAi in defined territories of the wing
primordium, larvae expressing these transgenes in either the A or P compartment
were reared on food with varying yeast content, the main source of
micronutrients and amino acids in fly media. Our standard medium contains 50
g/l yeast. We thus subjected experimental larvae expressing either a dsRNA
against PTEN or Rheb and control larvae expressing GFP to media containing 100
g/l and 20 g/l yeast and analyzed the size of the transgene-expressing and non-
expressing cell populations in the resulting adult wings. Despite the expected
reduction in the total wing size of animals reared on food containing 20 g/l yeast
(Figure 31A), the extent (in percentage) of the non-autonomous decrease in tissue
size caused by activation of PI3K/PTEN or TSC/TOR signaling pathways was
similar to that observed in animals reared on food containing 100 g/l yeast (Fig
30B and 30C, white bars) when compared to control GFP-expressing wings raised
in the same food. Thus, the non-autonomous reduction in growth rates is not
affected by starvation and is most probably not a direct consequence of the
withdrawal of nutrients from neighboring cells.

RESULTS
82
Figure 31. The non-autonomous reduction in tissue size does not rely on competition for nutrients. (A) Cuticle preparations of ci>GFP adult wings of well-fed (100 g/L yeast food, top) and starved (20 g/L yeast food, bottom) animals. Note the reduction in wing size caused by starvation. (B, C) Histograms plotting tissue size of the transgene-expressing compartment (blue bars) and the adjacent cell populations (white bars) of adult wings of en>GFP, PTENRNAi and ci>GFP,Rheb animals normalized as a percent of the control GFP-expressing flies raised in well-fed (100 g/L yeast food, B) and starved (20 g/L yeast food, C). Error bars show the standard deviation. Number of wings analyzed per genotype ≥ 10. ***p<0.001; **p<0.01; *p<0.05. See also Table 14.
The non-autonomous effects on tissue growth are due to competition
for Dpp ligand availability
We noticed that activation of the PI3K/PTEN or TSC/TOR pathways in defined
populations of the wing primordium gave rise to larger but well-proportioned
adult structures, perceived by the localization of the veins (Figure 32A, blue
arrows). The adjacent wild-type territories were reduced in size, but the
patterning elements (e.g., longitudinal veins) were also proportionally well
located (Figure 32A, grey arrows).

RESULTS
83
Figure 32. Pattern scales with tissue size upon targeted activation of growth. (A) Cuticle preparation of adult wings expressing GFP or Dp110 under the control of the ci-gal4 driver, which drives transgene expression in the anterior compartment. Note the expansion of the anterior intervein regions (blue arrows) upon induction of growth and the corresponding reduction of the posterior intervein regions (grey arrows). The anterior and posterior compartments are labelled, and the AP boundary is marked by a red line and the numbers indicate the different veins of the wing. (B) Wing imaginal discs of ci>GFP and ci>PTENRNAi larvae labelled to visualized Ci protein (in green) and β-galactosidase (βGal, in red or white) to visualize dpp (dpp-lacZ) expression. The width of the dpp-lacZ stripe (normalized with respect to the width of the wing pouch) was ci>GFP = 0.082 ± 0.005; ci>PTENRNAi =0.088 ± 0.003; p = 0.55; n > 6. (C) Wing imaginal discs of ci>GFP and ci>GFP, Dp110 larva labelled to visualize Spalt (in red) and GFP (in green) protein expression. The white dashed line marks the boundary between A and P cells. The lower panels show magnification of the Spalt domain. Note that the anterior Spalt domain is wider upon Dp110 expression (thick bracket) whereas the posterior Spalt domain (thin brackets) is reduced.
The signaling molecule Dpp, a member of the TGF-β superfamily, is expressed at
the boundary between the A and P compartments in the developing wing (Figure
32B) and plays a major role in positioning the wing veins along the
anteroposterior axis (see Introduction for details). Interestingly, the Dpp gradient
scales with size in order to correctly maintain the wing proportions and, as such,
the positioning of the veins. Moreover, Dpp is well known to promote tissue
growth making it a good candidate to function as a bridge between growth and
patterning. We thus wondered whether the autonomous and non-autonomous
effects of Rheb or Dp110/PI3K overexpression on tissue growth relies on
modulating the range of Dpp activity. We first monitored dpp expression using a
dpp-lacZ reporter. No major changes were observed upon activation of
RESULTS
84
PI3K/PTEN signaling pathway in the anterior compartment of the wing discs
when compared to control wing discs (Figure 32B). Since dpp production was not
affected, we next monitored the range of the Dpp activity gradient visualized by
the expression of the Dpp target gene Spalt and with an antibody against the
phosphorylated form of the Dpp transducer Mothers Against Dpp (pMAD). As
expected, and as a result of the capacity of Dpp gradient to scale with tissue size,
we noticed that the Spalt domain was wider upon Dp110 expression whereas the
domain of Spalt expression in the neighboring territory was reduced (Figure 32C,
white brackets). The activity of the pathway, which can be visualized with the
pMAD antibody, also expanded in the overgrowing transgene-expressing
compartment (Figure 33A). In order to quantify the autonomous and non-
autonomous impact of tissue growth on the Dpp activity gradient, we extracted
the pMAD profiles along four lines perpendicular to the dpp expression domain
(yellow lines in Figure 33A) and plotted the average pMAD values along the AP
axis in experimental (blue in Figure 33B, 33C, 33E and 33G) and control (red in
Figure 33B, 33C, 33E and 33G) wing discs. The control and the experimental
larvae were raised in the same conditions and immunolabelled in the same tube.
Since the boundary between A and P cells is out of phase in control and Dp110-
expressing wing discs (Figure 33B), the pMAD profiles were aligned with respect
to the AP boundary to better visualize the autonomous and non-autonomous
effects on the Dpp activity gradient (Figure 33C, 33E and 33G). We observed a
visible expansion along the AP axis of the pMAD gradient towards the
overgrowing compartment, either by promoting growth in the anterior or in the
posterior territory of the wing primordium (black asterisk in Figure 33C, 33E and
33G). Despite of that, the total amount of pMAD, quantified as total pixel intensity
within each compartment (see Materials and Methods), was comparable in
overgrowing and control compartments in the three experimental setups (Figure
33D, 33F and 33H, blue bars).

RESULTS
85
Figure 33. Autonomous and non-autonomous effects on the Dpp activity gradient. (A) Wing imaginal discs of ci>GFP and ci>GFP, Dp110 larva labelled to visualize pMAD protein (in red or white) and GFP (in green). Lower panels show magnifications of the pMAD domains with a red line marking the boundary between the A and P compartments. Horizontal yellow lines were used to generate the pMAD profiles. (B, C, E, G) Average pMAD profiles of wing discs expressing GFP (red line) or GFP and the corresponding transgenes (blue line) under the control of the ci-gal4 (B, C, E) or the en-gal4 (G) drivers. Profiles were taken along the AP axis and plotted in absolute positions. The standard error to the mean is shown in the corresponding color for each genotype. In B, the AP boundary of each experiment is marked by a dashed line of the corresponding color. In C, E and G, the AP boundary of both experiments was aligned to allow comparison of the profile in each compartment. The domains of transgene expression are marked with a black asterisk. Arrows mark the limits of the Dpp activity gradients. (D, F, H) Histograms plotting the total intensity of the pMAD signal in a.u. of the autonomous (blue bars) and non-autonomous (white bars) territories of ci>GFP and ci>Dp110 (D) or ci>Rheb (F) and of en>GFP and en>PTENRNAi wing discs (H). Error bars indicate the standard deviation. Number of wing discs analyzed per genotype ≥ 5. ***p < 0.001; *p < 0.05; ns, not significant. See also Table 15.
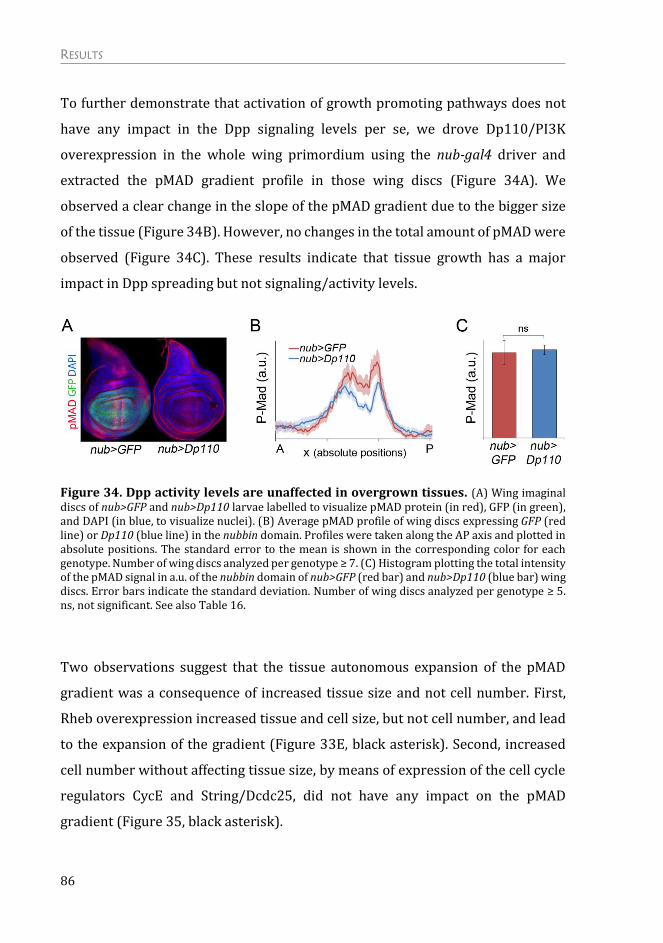
RESULTS
86
To further demonstrate that activation of growth promoting pathways does not
have any impact in the Dpp signaling levels per se, we drove Dp110/PI3K
overexpression in the whole wing primordium using the nub-gal4 driver and
extracted the pMAD gradient profile in those wing discs (Figure 34A). We
observed a clear change in the slope of the pMAD gradient due to the bigger size
of the tissue (Figure 34B). However, no changes in the total amount of pMAD were
observed (Figure 34C). These results indicate that tissue growth has a major
impact in Dpp spreading but not signaling/activity levels.
Figure 34. Dpp activity levels are unaffected in overgrown tissues. (A) Wing imaginal discs of nub>GFP and nub>Dp110 larvae labelled to visualize pMAD protein (in red), GFP (in green), and DAPI (in blue, to visualize nuclei). (B) Average pMAD profile of wing discs expressing GFP (red line) or Dp110 (blue line) in the nubbin domain. Profiles were taken along the AP axis and plotted in absolute positions. The standard error to the mean is shown in the corresponding color for each genotype. Number of wing discs analyzed per genotype ≥ 7. (C) Histogram plotting the total intensity of the pMAD signal in a.u. of the nubbin domain of nub>GFP (red bar) and nub>Dp110 (blue bar) wing discs. Error bars indicate the standard deviation. Number of wing discs analyzed per genotype ≥ 5. ns, not significant. See also Table 16.
Two observations suggest that the tissue autonomous expansion of the pMAD
gradient was a consequence of increased tissue size and not cell number. First,
Rheb overexpression increased tissue and cell size, but not cell number, and lead
to the expansion of the gradient (Figure 33E, black asterisk). Second, increased
cell number without affecting tissue size, by means of expression of the cell cycle
regulators CycE and String/Dcdc25, did not have any impact on the pMAD
gradient (Figure 35, black asterisk).

RESULTS
87
Figure 35. Increased cell number does not change the Dpp activity gradient. Average pMAD profile of wing discs expressing GFP (red line) or Stg,CycE (blue line) in the ci domain. Profiles were taken along the AP axis and plotted in absolute positions. The standard error to the mean is shown in the corresponding color for each genotype. The AP boundary of both experiments was aligned to allow comparison of the profile in each compartment. The domain of transgene expression are marked with a black asterisk. Number of wing discs analyzed per genotype ≥ 5.
Interestingly, we noticed that the width of the Dpp activity gradient, monitored by
the expression of Spalt (Figure 32C) and pMAD (Figure 33A, 33B, 33C, 33E and
33G), was non-autonomously reduced upon activation of the PI3K/PTEN and
TSC/TOR pathways. Furthermore, the total amount of pMAD signaling was lower
in the adjacent wild type territories (Figure 33D, 33F and 33H, white bars). This
non-autonomous effect was not observed upon expression of cell cycle regulators
CycE and String/Dcdc25 (Figure 35). This led us to propose that the non-
autonomous reduction in tissue size is due to competition for the Dpp ligand
triggered by the activation of PI3K/PTEN and TSC/TOR signaling in distinct cell
populations. To test this hypothesis, we compared the size of the Dp110/PI3K-
expressing territory and the corresponding adjacent compartment upon
depletion of Dpp, by means of expression of a dsRNA against dpp in the anterior
compartment (Figure 36). Since depletion of dpp with ci-gal4 caused pupal
lethality, we measured third instar wing imaginal discs. Overexpression of
Dp110/PI3K in a wild type background caused, as extensively shown above, a
reduction in tissue size of the adjacent territory (Figure 36A, white bars).
Expression of a dsRNA against dpp in A cells gave rise to a strong reduction in
tissue size (Figure 36B and 36C), comparable to those of wing discs mutant for
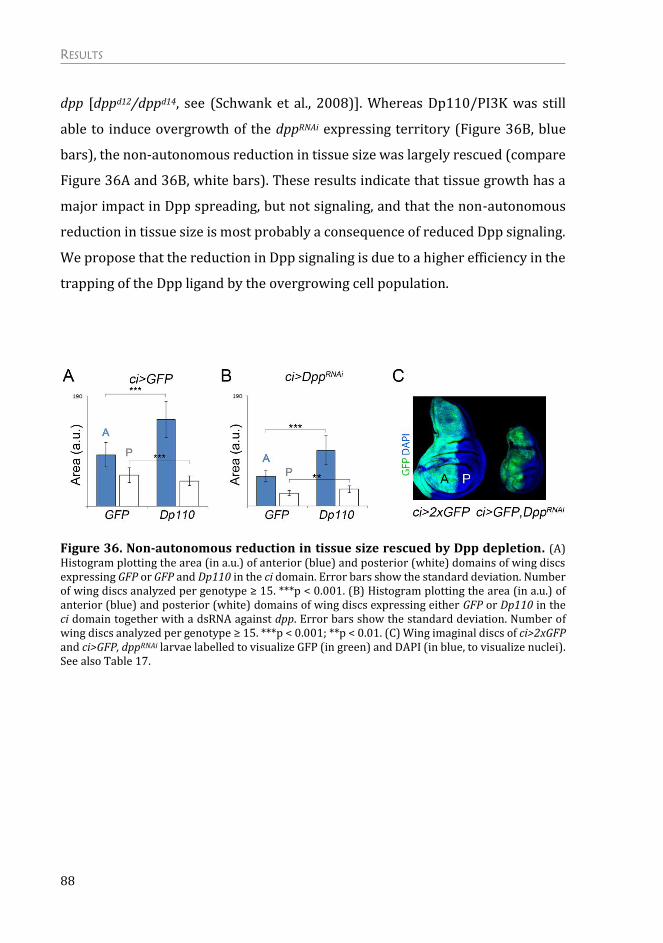
RESULTS
88
dpp [dppd12/dppd14, see (Schwank et al., 2008)]. Whereas Dp110/PI3K was still
able to induce overgrowth of the dppRNAi expressing territory (Figure 36B, blue
bars), the non-autonomous reduction in tissue size was largely rescued (compare
Figure 36A and 36B, white bars). These results indicate that tissue growth has a
major impact in Dpp spreading, but not signaling, and that the non-autonomous
reduction in tissue size is most probably a consequence of reduced Dpp signaling.
We propose that the reduction in Dpp signaling is due to a higher efficiency in the
trapping of the Dpp ligand by the overgrowing cell population.
Figure 36. Non-autonomous reduction in tissue size rescued by Dpp depletion. (A) Histogram plotting the area (in a.u.) of anterior (blue) and posterior (white) domains of wing discs expressing GFP or GFP and Dp110 in the ci domain. Error bars show the standard deviation. Number of wing discs analyzed per genotype ≥ 15. ***p < 0.001. (B) Histogram plotting the area (in a.u.) of anterior (blue) and posterior (white) domains of wing discs expressing either GFP or Dp110 in the ci domain together with a dsRNA against dpp. Error bars show the standard deviation. Number of wing discs analyzed per genotype ≥ 15. ***p < 0.001; **p < 0.01. (C) Wing imaginal discs of ci>2xGFP and ci>GFP, dppRNAi larvae labelled to visualize GFP (in green) and DAPI (in blue, to visualize nuclei). See also Table 17.

RESULTS
89
A New Role for the Dally Proteoglycan
As described above we observed an impact of PI3K/PTEN and TSC/TOR signaling
in Dpp spreading, which suggests that diffusion of Dpp is affected. So, both
PI3K/PTEN and TSC/TOR pathways might have an impact on the expression of
genes important for Dpp diffusion.
Expression of the Thickveins receptor is not regulated by targeted
activation of the PTEN/PI3K and TSC/TOR pathways
The Dpp type I receptor Thickveins (Tkv) has been shown to trap the Dpp ligand
and limit its spreading. Clones of cells overexpressing Tkv located in a region
where the level of Dpp activity falls below the normally required to induce Spalt,
show high Spalt expression on the side of the clone facing the source of Dpp and
its decreases across the clone. (Lecuit and Cohen, 1998).
To discard the possibility of the contribution of Tkv to the non-autonomous effects
on tissue size upon targeted deregulation of the PI3K/PTEN pathway, we checked
Tkv expression upon depletion of PTEN. When PTEN was depleted in the anterior
compartment of the wing disc, Tkv expression levels were unaffected, visualized
with both an enhancer and a protein trap (Figure 37). Despite the fact that higher
levels of the Tkv receptor are able to trap Dpp, our results indicate that Tkv does
not appear to be a good candidate to be mediating the non-autonomous effects on
tissue growth caused by activation of the PI3K/PTEN and TSC/TOR signaling
pathways.

RESULTS
90
Figure 37. Thickveins expression is unaffected by depletion of PTEN. (A, B) Wing imaginal discs of ci>GFP and ci>PTENRNAi labelled to visualize thickveins expression with a tkv-lacZ reporter (antibody to β-Gal, green or white) and GFP (A) or Ci (B) expression (in green) to mark the transgene-expressing domain. (C, D) Wing imaginal discs of ci>myrT (C) and ci>PTENRNAi (D) labelled to visualize Thickveins protein levels using a Tkv-YFP reporter (in green or white) and Ci expression (in red) to mark the transgene-expressing territory. Note that no changes in Tkv expression were observed upon targeted activation of PI3K/PTEN signaling pathway (red brackets).
Dally glypican is upregulated upon activation of the PI3K/PTEN and
TSC/TOR signaling pathways
Heparan sulfate proteoglycans (HSPGs) of the glypican family play key roles in the
regulation of morphogen signaling and distribution. Glypicans are
glycosylphosphatidylinositol (GPI)-anchored HSPGs that have a protein core to
which heparan sulfate (HS) chains are covalently attached. HS chains provide
binding sites for many growth factors, and the glypicans Dally and Dally-like
contribute to the spreading of the Dpp ligand (see Introduction for details). We
wondered whether the impact of PI3K/PTEN and TSC/TOR pathways on Dpp
spreading are mediated by one or both of these glypicans. Dally-like protein levels
were largely unaffected upon targeted activation of PI3K/PTEN and TSC/TOR
signaling pathways in one compartment of the wing (Figure 38). By contrast, the
expression levels of Dally, visualized with two distinct reporters, an enhancer-trap
and a protein trap, were clearly increased upon activation of the PI3K/PTEN or
TSC/TOR pathways (Figure 39).

RESULTS
91
Figure 38. Dally-like levels are not modulated by activation of the PI3K/PTEN and TSC/TOR signaling pathways. (A, C) Wing imaginal discs of ci>GFP (A), ci>GFP, Rheb (B) and en>GFP, PTENRNAi labelled to visualize Dally-like protein (in red or white) and GFP expression to mark the transgene-expressing domain. Note unchanged levels of Dlp in Rheb and PTENRNAi
expressing cells (red brackets).
Figure 39. Dally upregulation upon activation of PI3K/PTEN and TSC/TOR pathways. (A, B) Representative wing discs of the indicated genotypes labelled to visualize dally-lacZ (antibody to β-Gal, green or white) and myrTomato (myrT, in red) expression to mark the transgene-expressing domain. Note stronger expression of dally-lacZ upon activation of the PI3K/PTEN and TSC/TOR pathways (red brackets). (C, D) Wing imaginal discs of ci>myrT (C) and ci>PTENRNAi (D) labelled to visualize Dally expression by means of a Dally-YFP reporter. Red brackets indicate the domain of transgene expression. High magnification of the squared region is shown in the right panel (D’).

RESULTS
92
Dally overexpression is able to phenocopy targeted activation of
growth
We next checked the capacity of targeted overexpression of Dally to phenocopy
the autonomous and non-autonomous effects on tissue growth, proliferation rates
and Dpp gradient formation caused by targeted activation of the PI3K/PTEN or
TSC/TOR signaling pathways. Overexpression of Dally in the anterior or posterior
compartments of the developing wing resulted in a tissue-autonomous increase
in size (Figure 40A-D, blue bars) and, most importantly, a non-autonomous
reduction in the size of the adjacent wild type territories (Figure 40A-D, white
bars). In contrast to what happened when the PI3K/PTEN or TSC/TOR pathways
were activated, the increase in tissue size was accompanied by an increase in cell
number, observed by an increase in cell density of the transgene expressing
compartment (Figure 40B and 40D, blue bars). Moreover, the non-autonomous
reduction in tissue size caused by Dally overexpression was not accompanied by
a decrease in cell size as cell densities, if anything, decreased (Figure 40B and 40D,
white bars). Thus, other elements regulated by the PI3K/PTEN and TSC/TOR
growth-promoting pathways, besides Dally, might have a non-autonomous impact
on cell size. These results reinforce our previous observations that the non-
autonomous reduction in cell size are observed in adult wings and not in wing
primordia.
With the aim of addressing whether growth and proliferation rates are also
regulated in a non-autonomous manner by the overexpression of Dally, we
induced wild type clones at the beginning of the third instar larval period (72h
AEL) and examined the size of these clones 72h later in late third instar wing discs.
Clone size and number of cells per clone were measured both in the anterior and
posterior compartments of ci-gal4; UAS-GFP/UAS-Dally wing discs, and these two
measurements were compared to those of control clones induced in ci-gal4; UAS-
GFP/+ wing discs and grown in parallel. In Dally-overexpressing wing discs, the
size of the clones and the number of cells per clone in the anterior compartment
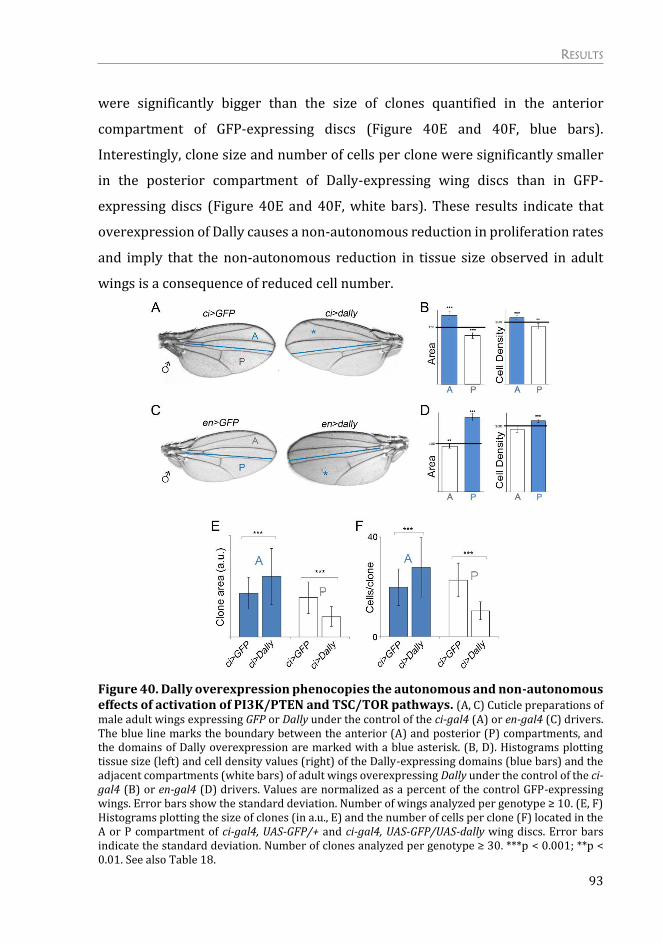
RESULTS
93
were significantly bigger than the size of clones quantified in the anterior
compartment of GFP-expressing discs (Figure 40E and 40F, blue bars).
Interestingly, clone size and number of cells per clone were significantly smaller
in the posterior compartment of Dally-expressing wing discs than in GFP-
expressing discs (Figure 40E and 40F, white bars). These results indicate that
overexpression of Dally causes a non-autonomous reduction in proliferation rates
and imply that the non-autonomous reduction in tissue size observed in adult
wings is a consequence of reduced cell number.
Figure 40. Dally overexpression phenocopies the autonomous and non-autonomous effects of activation of PI3K/PTEN and TSC/TOR pathways. (A, C) Cuticle preparations of male adult wings expressing GFP or Dally under the control of the ci-gal4 (A) or en-gal4 (C) drivers. The blue line marks the boundary between the anterior (A) and posterior (P) compartments, and the domains of Dally overexpression are marked with a blue asterisk. (B, D). Histograms plotting tissue size (left) and cell density values (right) of the Dally-expressing domains (blue bars) and the adjacent compartments (white bars) of adult wings overexpressing Dally under the control of the ci-gal4 (B) or en-gal4 (D) drivers. Values are normalized as a percent of the control GFP-expressing wings. Error bars show the standard deviation. Number of wings analyzed per genotype ≥ 10. (E, F) Histograms plotting the size of clones (in a.u., E) and the number of cells per clone (F) located in the A or P compartment of ci-gal4, UAS-GFP/+ and ci-gal4, UAS-GFP/UAS-dally wing discs. Error bars indicate the standard deviation. Number of clones analyzed per genotype ≥ 30. ***p < 0.001; **p < 0.01. See also Table 18.

RESULTS
94
Dally overexpression has an impact specifically in Dpp morphogen
Dally is known to have a role in Dpp gradient formation. Accordingly, targeted
overexpression of Dally also gave rise to a tissue-autonomous increase in the
width of the pMAD signaling gradient and to a remarkable reduction in pMAD
signaling in nearby territories (Figure 41A and 41B). In this case, the total amount
of pMAD was higher in Dally overexpressing territories than in the control one
(Figure 41C, blue bars) and reduced in the neighboring territory when compared
to GFP-expressing discs (Figure 41C, white bars).
Figure 41. Impact of Dally overexpression on the Dpp gradient. (A) Wing imaginal discs of ci>GFP and ci>GFP, dally larvae labelled to visualize pMAD protein (in red or white) and GFP (in green) to mark the anterior compartment. (B) Average pMAD profiles of wing discs expressing GFP (red line) or GFP and Dally (blue line) under the control of the ci-gal4 driver. Profiles were taken along the AP axis and plotted in absolute positions. The standard error to the mean is shown in the corresponding color for each genotype. The AP boundary of both experiments was aligned to allow comparison of the profile in each compartment. The domain of transgene expression are marked with a black asterisk. Number of wing discs analyzed per genotype ≥ 5. (C) Histogram plotting the total intensity of the pMAD signal (in a.u.) of the anterior (blue bars) and posterior (white bars) compartments of ci>GFP and ci>GFP, dally wing discs. Error bars indicate the standard deviation. Number of wing discs analyzed per genotype ≥ 5. ***p < 0.001; **p < 0.01. See also Table 19.

RESULTS
95
We noticed that the patterning elements, including wing veins and the wing
margin, were well located and formed, thus indicating that Dally overexpression
exerts a specific role on Dpp gradient formation and a minor role on the other
secreted signaling molecules involved in wing growth and patterning. It was
previously shown that Dally is essential for Wg gradient formation (Han et al.,
2005) and also to Hh movement (Han et al., 2004) in wing disc cells. We checked
whether Dally affects Hh and Wg signaling in the wing imaginal disc.
In wild type wing discs, Hh stabilizes Cubitus interruptus (Ci) protein as far as 8–
10 cells away from the AP boundary (Strigini and Cohen, 1997). Patched (Ptc),
another target that requires higher levels of Hh, can be detected as far as five cells
away from the boundary in the wild type wing disc (Alexandre et al., 1996).
Neither the Ci nor the Ptc expression domains were extended upon
overexpression of Dally in either the anterior or posterior compartments of the
wing disc (Figure 42A and 42B). Wg is expressed along the DV boundary and
activates its targets genes, such as Distalless (Dll), in a concentration-dependent
manner. Overexpression of Dally either in the posterior or in the anterior
compartment of the wing primordium did not affect Wg expression nor spreading
(Figure 42B). In addition, the expression domain of one of its target genes Dll
remained unchanged (Figure 42C). These results indicate that Dally does not
appear to have a major influence on Hh and Wg morphogen movement.

RESULTS
96
Figure 42. Impact of Dally overexpression on Hh and Wg signaling. (A) Wing imaginal disc of ci>dally larvae labelled to visualize Dally (in blue or white), Ptc (in red or white) and Ci (in green or white) proteins. (B) Wing imaginal disc of en>GFP, dally larvae labelled to visualize Wg (in red or white), Ci (in blue or white) and GFP (in green) proteins. (C) Wing imaginal disc of ci>GFP, dally larvae labelled to visualize Dll (in red or white), and GFP (in green) proteins. The red line marks the boundary between the A and P compartments (in B and C). The horizontal red lines highlight the unchanged width of Ci and Ptc expression domains upon Dally overexpression (in A and B).
By overexpressing Dally we were able to further enhance the phenotype of
targeted activation of growth in specific territories of the wing imaginal discs.
Activation of PI3K/PTEN signaling in the anterior domain, either with expression
of Dp110 or a dsRNA against PTEN, together with overexpression of Dally gave
rise to an autonomous increase in size (Figure 43B and 43E, blue bars) and a
further non-autonomous reduction in tissue size (Figure 43B and 43E, white bars)
when compared to expression of growth promoting transgenes alone. No changes
in the autonomous nor in the non-autonomous territories in what concerns cell
size were observed (Figure 43C and 43F).

RESULTS
97
Figure 43. Dally co-expression further enhances the autonomous and non-autonomous effects in tissue size of targeted activation of growth. (A, D) Cuticle preparations of male adult wings of ci>GFP, Dp110 and ci>Dp110, dally (A), ci>GFP, PTENRNAi and ci>PTENRNAi, dally (D). The blue line marks the boundary between the anterior (A) and posterior (P) compartments, and the domains of transgene expression are marked with a blue asterisk. (B-F). Histograms plotting tissue size (B, E) and cell density values (C, F) of the transgene expressing domains (blue bars) and the adjacent compartments (white bars) of adult wings of the indicated genotypes. Values are normalized as a percent of the control GFP-expressing wings. Error bars show the standard deviation. Number of wings analyzed per genotype ≥ 10. ***p < 0.001; **p < 0.01; *p < 0.05; ns, not significant. See also Table 20.

RESULTS
98
Dally contributes to the autonomous and non-autonomous effects on
tissue growth upon targeted activation of PI3K/PTEN and TSC/TOR
signaling pathways
Since targeted activation of PI3K/PTEN and TSC/TOR signaling pathways
upregulates Dally expression levels and its overexpression is able to phenocopy
the effects on tissue growth, we next addressed whether Dally contributes to the
autonomous and non-autonomous effects on tissue growth caused by targeted
deregulation of the PI3K/PTEN and TSC/TOR signaling pathways. We thus
depleted Dally in a condition where we drove Dp110 or Rheb expression in one
compartment of the wing disc. For this purpose, we made use of a dsRNA against
Dally. Expression of dallyRNAi in either the anterior or the posterior compartment
of the wing, in an otherwise wild type background, caused a mild tissue-
autonomous size reduction (Figure 44A and 44B, blue bars), but no visible size
effects were observed in adjacent compartments (Figure 44A and 44B, white
bars). The width of the Dpp activity gradient, monitored by the profile of pMAD
expression, was mildly reduced in the transgene-expressing compartment (Figure
44E and 44F).
Interestingly, depletion of Dally was able to largely rescue not only the
autonomous but also the non-autonomous effects on tissue growth caused by
Rheb or Dp110/PI3K expression (Figure 45). The autonomous tissue overgrowth
caused by Rheb expression in either the anterior or the posterior compartment of
the wing was rescued when dally was depleted in those cells (Figure 45A, 45B,
45D and 45E, blue bars). The non-autonomous reduction in tissue size was
completely rescued upon Dally depletion (Figure 45A, 45B, 45D and 45E, white
bars). However, the non-autonomous reduction in cell size upon Rheb expression
was not rescued upon dallyRNAi co-expression (Figure 45C and 45F, white bars).
We observed similar autonomous and non-autonomous effects on tissue and cell
size by depleting Dally upon Dp110/PI3K expression in the anterior domain
(Figure 45G, 45H and 45I).

RESULTS
99
Figure 44. Dally depletion has little impact on tissue growth. (A, C) Cuticle preparations of male adult wings of ci>dallyRNAi (A) and en>dallyRNAi (C). The blue line marks the boundary between the anterior (A) and posterior (P) compartments, and the domains of transgene expression are marked with a blue asterisk. (B, D) Histograms plotting tissue size (on the left) and cell density values (on the right) of the transgene expressing domains (blue bars) and the adjacent compartments (white bars) of adult wings of ci>dallyRNAi (B) and en>dallyRNAi (D) animals. Values are normalized as a percent of the control GFP-expressing wings. Error bars show the standard deviation. Number of wings analyzed per genotype ≥ 10. ***p < 0.001; **p < 0.01; *p < 0.05; ns, not significant. (E) Wing imaginal discs of ci>GFP and ci>dallyRNAi larvae labelled to visualize pMAD protein (in white). Red brackets show the transgene-expressing compartment. (F) Average pMAD profiles of wing discs expressing GFP (red line) or dallyRNAi (green line) in the ci domain. Profiles were taken along the AP axis and plotted in absolute positions. The standard error to the mean is shown in the corresponding color for each genotype. The AP boundary of both experiments was aligned to allow comparison of the profile in each compartment. Number of wing discs analyzed per genotype ≥ 7. The domains of transgene expression are marked with a black asterisk. Arrows mark the limits of the Dpp activity gradients. See also Table 21.

RESULTS
100
Figure 45. Dally contributes to the autonomous and non-autonomous effects of targeted activation of PI3K/PTEN and TSC/TOR pathways. (A, D, G) Cuticle preparations of adult wings expressing the indicated transgenes under the control of the ci-gal4 (A, G) or en-gal4 (D) drivers. The blue line marks the boundary between the anterior (A) and posterior (P) compartments and the domains of transgene expression are marked with a blue asterisk. (B, C, E, F, H, I) Histograms plotting tissue size (B, E, H) and cell density (C, F, I) values of the transgene-expressing (blue bars) or nonexpressing (white bars) compartments of adult wings driving expression of the indicated transgenes under the control of the ci-gal4 (B, C, H, I) or en-gal4 (E, F) drivers. Values are normalized as a percent of the control GFP-expressing wings .Error bars show the standard deviation. Number of wings analyzed per genotype ≥ 10. ***p < 0.001; ** p < 0.01; ns, not significant. See also Table 22.

RESULTS
101
Upon expression of a dsRNA against Dally in wing discs expressing Dp110/PI3K
in the anterior compartment, the autonomous expansion of the Dpp activity
gradient and the non-autonomous retraction caused by targeted expression of
Dp110 were both largely rescued (Figure 46A). We observed a slight increase in
Dpp signaling in the non-autonomous territory upon Dally depletion when
compared to targeted activation of Dp110 alone (Figure 46B, white bars).
Figure 46. Dally contributes to the expansion of the Dpp activity gradient upon activation of growth. (A) Average pMAD profiles of wing discs expressing GFP and Dp110 (blue line) or GFP, a dsRNA against dally and Dp110 (green line) under the control of the ci-gal4 driver. Profiles were taken along the AP axis and plotted in absolute positions. The standard error to the mean is shown in the corresponding color for each genotype. The AP boundary of both experiments was aligned to allow comparison of the profile in each compartment. Number of wing discs analyzed per genotype ≥ 5. The domains of transgene expression are marked with a black asterisk. Arrows mark the limits of the Dpp activity gradients. (B) Histogram plotting the total intensity of pMAD signal in a.u. of the anterior (blue bars) and posterior (white bars) compartments of ci>GFP, Dp110 and ci>Dp110, dallyRNAi wing discs. Error bars indicate the standard error to the mean. Number of wing discs analyzed per genotype ≥ 5. ns, not significant. See also Table 23.
Sulfateless (Sfl), an enzyme needed for the modification of HS chains within
glypicans (Lin and Perrimon, 1999), is essential in the biosynthetic cascade of
Dally. Additionally, it has been shown that in sfl mutant clones Dpp-GFP
movement is blocked (Belenkaya et al., 2004), probably due to lack of a functional
form of Dally. When we depleted sulfateless in posterior cells with activated
PI3K/PTEN signaling, we observed that both the autonomous increase and the
non-autonomous reduction in tissue size were rescued (Figure 47A and 47B). The

RESULTS
102
drastic autonomous reduction in compartment size is most probably due to the
strong impact on tissue size that depletion of this enzyme already causes in an
otherwise wild type background (Figure 48A-D, blue bars). Most importantly, the
targeted expression of dsRNA forms against sfl in otherwise wild type wings has
little effect on growth of adjacent cell territories (Figure 48A-D, white bars).
Overall, we conclude that Dally contributes to the autonomous and non-
autonomous effects on tissue growth caused by activation of PI3K/PTEN and
TSC/TOR signaling pathways. However, given the fact that depletion of Dally was
not able to rescue the non-autonomous reduction in cell size caused by activation
of these pathways (Figure 45C, 45F and 45I, white bars), we propose that cell size
is non-autonomously regulated by the PI3K/PTEN and TSC/TOR pathways in a
Dally-independent manner.
Figure 47. Depletion of sfl rescues the autonomous and non-autonomous effects on tissue growth. (A) Cuticle preparations of adult wings expressing GFP and PTENRNAi or PTENRNAi and sulfatelessRNAi under the control of the en-gal4 driver. The blue line marks the boundary between the anterior (A) and posterior (P) compartments, and the domains of transgene expression are marked with a blue asterisk. (B) Histogram plotting tissue size of the transgene-expressing (blue bars) or nonexpressing (white bars) compartments of adult wings showed in A. Values are normalized as a percent of the control GFP-expressing wings. Error bars show the standard deviation. Number of wings analyzed per genotype ≥ 10. ***p < 0.001. See also Table 24.

RESULTS
103
Figure 48. Depletion of sfl strongly reduces tissue size autonomously. (A, C) Cuticle preparations of adult wings expressing sulfatelessRNAi under the control of the ci-gal4 (A) or the en-gal4 (C) drivers. The blue line marks the boundary between the anterior (A) and posterior (P) compartments and the domains of transgene expression are marked with a blue asterisk. (B, D) Histograms plotting tissue size of the transgene-expressing (blue bars) or nonexpressing (white bars) compartments of adult wings of ci>sulfatelessRNAi (B) or en>sulfatelessRNAi (D). Values are normalized as a percent of the control GFP-expressing wings. Error bars show the standard deviation. Number of wings analyzed per genotype ≥ 10. ***p < 0.001; ns, not significant. See also Table 25.
Dally contributes to the autonomous and non-autonomous effects on
tissue growth upon targeted inactivation of the Hippo signaling
pathway
Inactivation of the Hippo pathway causes a reduction in tissue size in adjacent
wild type cell populations
Mutations in the Hippo pathway, originally identified in Drosophila by their
capacity to induce cell proliferation and organ growth, induce tumors in mouse
models and occur in a broad range of human carcinomas, including lung,
colorectal, ovarian, and liver cancers (reviewed in (Harvey et al., 2013)). Similar
to what happened to TOR activation, deregulation of the Hippo/Yorkie pathway
causes strong overgrowth and larval lethality (Justice et al., 1995). We thus
induced a mild activation of the pathway by expressing a wild type form of the
transcription factor Yorkie (Yki). Overexpression of Yki in the anterior or
posterior compartments of the developing wing gave rise to a tissue-autonomous
increase in size (Figure 49A, 49B, 49D and 49E, blue bars) and, most interestingly,
a non-autonomous size reduction of the adjacent wild type territories (Figure 49A,

RESULTS
104
49B, 49D and 49E, white bars). Consisting with the role of Hippo signaling in
driving cell proliferation, the cell densities were higher than GFP-expressing
controls in the transgene expressing compartment (Figure 49C and 49F, blue
bars). As shown before in the case of PI3K/PTEN and TSC/TOR activation, Yki
overexpression also caused a non-autonomous decrease in cell size (Figure 49C
and 49F, white bars).
Figure 49. Yki overexpression causes a reduction in tissue and cell size of the adjacent domains. (A, D) Cuticle preparations of adult wings expressing Yki under the control of the en-gal4 (A) or ci-gal4 (D) drivers. The blue line marks the boundary between the anterior (A) and posterior (P) compartments and the domains of transgene expression are marked with a blue asterisk. (B, C, E, F) Histograms plotting tissue size (B, E) and cell density (C, F) of the transgene-expressing (blue bars) or nonexpressing (white bars) compartments of adult wings expressing Yki under the control of the en-gal4 (B, C) or ci-gal4 (E, F) drivers. Values are normalized as a percent of the control GFP-expressing wings .Error bars show the standard deviation. Number of wings analyzed per genotype ≥ 10. ***p < 0.001; * p < 0.05. See also Table 26.
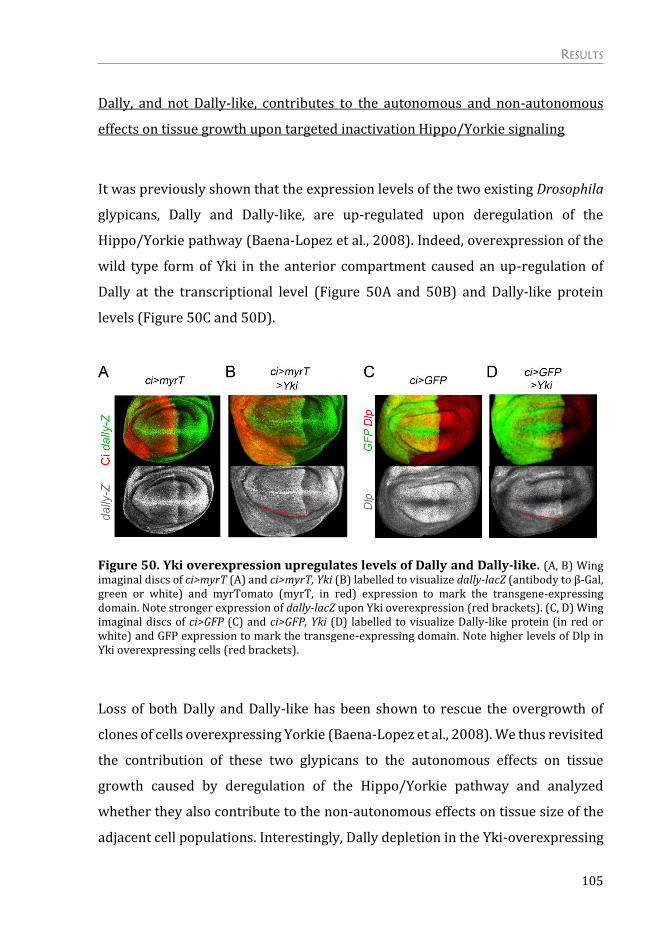
RESULTS
105
Dally, and not Dally-like, contributes to the autonomous and non-autonomous
effects on tissue growth upon targeted inactivation Hippo/Yorkie signaling
It was previously shown that the expression levels of the two existing Drosophila
glypicans, Dally and Dally-like, are up-regulated upon deregulation of the
Hippo/Yorkie pathway (Baena-Lopez et al., 2008). Indeed, overexpression of the
wild type form of Yki in the anterior compartment caused an up-regulation of
Dally at the transcriptional level (Figure 50A and 50B) and Dally-like protein
levels (Figure 50C and 50D).
Figure 50. Yki overexpression upregulates levels of Dally and Dally-like. (A, B) Wing imaginal discs of ci>myrT (A) and ci>myrT, Yki (B) labelled to visualize dally-lacZ (antibody to β-Gal, green or white) and myrTomato (myrT, in red) expression to mark the transgene-expressing domain. Note stronger expression of dally-lacZ upon Yki overexpression (red brackets). (C, D) Wing imaginal discs of ci>GFP (C) and ci>GFP, Yki (D) labelled to visualize Dally-like protein (in red or white) and GFP expression to mark the transgene-expressing domain. Note higher levels of Dlp in Yki overexpressing cells (red brackets).
Loss of both Dally and Dally-like has been shown to rescue the overgrowth of
clones of cells overexpressing Yorkie (Baena-Lopez et al., 2008). We thus revisited
the contribution of these two glypicans to the autonomous effects on tissue
growth caused by deregulation of the Hippo/Yorkie pathway and analyzed
whether they also contribute to the non-autonomous effects on tissue size of the
adjacent cell populations. Interestingly, Dally depletion in the Yki-overexpressing

RESULTS
106
domain was able to rescue both the autonomous and non-autonomous effects on
tissue size (Figure 51A and 51B).
Figure 51. The autonomous and non-autonomous effects on tissue growth due to Yki overexpression depend on Dally. (A) Cuticle preparations of adult wings expressing Yki and GFP or Yki and dallyRNAi under the control of the en-gal4 driver. The blue line marks the boundary between the anterior (A) and posterior (P) compartments and the domains of transgene expression are marked with a blue asterisk. (B) Histogram plotting tissue size of the transgene-expressing (blue bars) or nonexpressing (white bars) compartments of adult wings showed in A. Values are normalized as a percent of the control GFP-expressing wings. Error bars show the standard deviation. Number of wings analyzed per genotype ≥ 10. ***p < 0.001. See also Table 27.
By contrast, Dally-like depletion, using two different dsRNA forms able to reduce
its protein levels (Figure 52C), was not able to rescue the non-autonomous
decrease in tissue size caused by Yki activation (Figure 52A and 52B, white bars).
It was previously described that Dally-like contributes to the overgrowth caused
by Yki overexpression (Baena-Lopez et al., 2008). However, in our case depletion
of Dally-like was not able to rescue the overgrowth of Yki overexpression (Figure
52A and 52B, blue bars).

RESULTS
107
Figure 52. Dally-like does not contribute to the non-autonomous effects on tissue growth due to Yki overexpression. (A) Cuticle preparations of adult wings expressing Yki and GFP or Yki and two different dsRNA against Dally-like under the control of the en-gal4 driver. The blue line marks the boundary between the anterior (A) and posterior (P) compartments and the domains of transgene expression are marked with a blue asterisk. (B) Histogram plotting tissue size of the transgene-expressing (blue bars) or nonexpressing (white bars) compartments of adult wings showed in A. Values are normalized as a percent of the control GFP-expressing wings. Error bars show the standard deviation. Number of wings analyzed per genotype ≥ 10. ***p < 0.001; ns, not significant. (C) Wing imaginal disc driving expression of a dsRNA against Dally-like in the anterior domain labelled to visualized Dlp protein levels (in red or white) and GFP (in green) expression to mark the transgene-expressing domain. Note that the dally-likeRNAi is able to strongly reduce Dally-like protein levels. See also Table 28.
Altogether, the results presented above indicate that Dally, and not Dally-like,
contributes to the tissue-autonomous and non-autonomous effects on tissue
growth caused by targeted deregulation of the PI3K/PTEN, TSC/TOR, and
Hippo/Yorkie signaling pathways. These pathways exert their tissue-autonomous
action through Dally, most probably by modulating the spreading of the Dpp
morphogen and other secreted growth factors, as Dp110 overexpression was still
able to induce growth in Dpp-depleted tissues (Figure 36B, blue bars). We
hypothesize that the non-autonomous effects are a consequence of withdrawal of
Dpp from neighboring cells. To further reinforce this idea, we carried out some
experiments in which Dpp is trapped to specific territories in a Dally-independent
manner.

RESULTS
108
Dpp trapping, by modulation of its receptor, also causes a non-
autonomous reduction in tissue size
The Dpp type I receptor Thickveins (Tkv) has been shown to trap the Dpp ligand
and limit its spreading. Clones of cells overexpressing the receptor show graded
expression of Dpp target genes with higher levels closer to the Dpp source (Lecuit
and Cohen, 1998). Therefore, we decided to analyze the capacity of Tkv to
phenocopy the non-autonomous effects on tissue growth observed upon targeted
deregulation of the PI3K/PTEN, TSC/TOR and Hippo/Yorkie pathways. For this
purpose, we overexpressed a wild type or a dominant negative form of the
receptor that is able to bind the Dpp ligand but unable to transduce the signal
(Kumar and Moses, 2001). Driving expression of both transgenes in the anterior
or in the posterior compartment of the wing primordia gave rise to an expected
autonomous reduction in tissue size due to a dampening in the activity of the Dpp
pathway (Figure 53, blue bars). Remarkably, it caused a non-autonomous size
reduction of the adjacent wild type territories (Figure 53, white bars). Expression
of the dominant negative form of Tkv did not influence cell size, since no major
changes were observed in cell densities values in the autonomous nor in the non-
autonomous compartment (Figure 53F and 53H). This latter observation is
consistent with the fact that changes in Dpp signaling do not cause any effect on
cell size (Martín-Castellanos and Edgar, 2002). This, together with the result that
overexpression of Dally did not cause a non-autonomous reduction in cell size
(Figure 40B and 40D), indicate that Dally and Dpp are regulating cell number but
not cell size. Once again, these data reinforce the idea that the non-autonomous
effects on cell size observed upon deregulation of the PI3K/PTEN, TSC/TOR, or
Hippo/Yorkie pathways are Dally and Dpp independent.
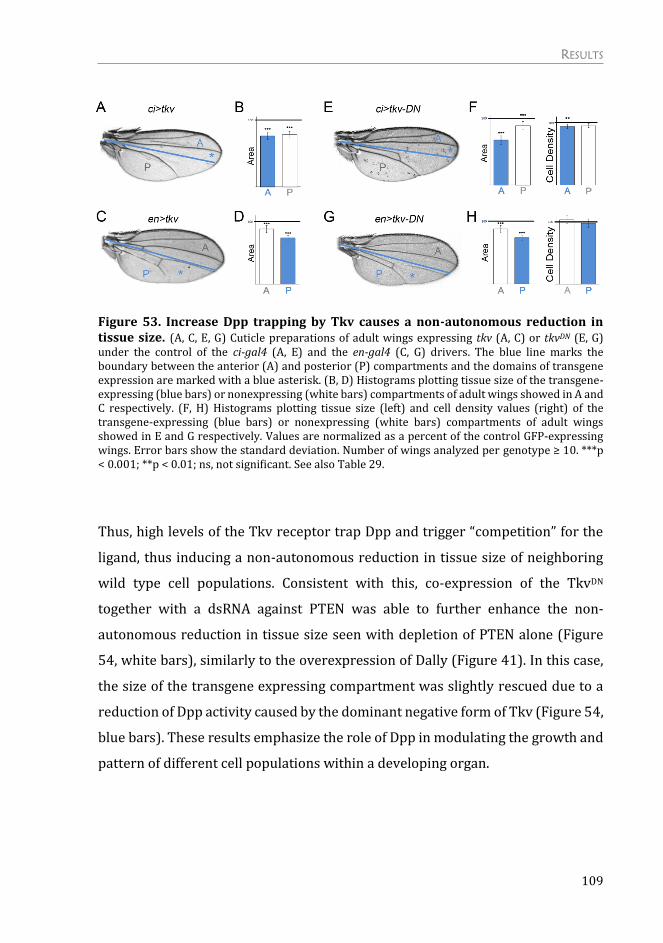
RESULTS
109
Figure 53. Increase Dpp trapping by Tkv causes a non-autonomous reduction in tissue size. (A, C, E, G) Cuticle preparations of adult wings expressing tkv (A, C) or tkvDN (E, G) under the control of the ci-gal4 (A, E) and the en-gal4 (C, G) drivers. The blue line marks the boundary between the anterior (A) and posterior (P) compartments and the domains of transgene expression are marked with a blue asterisk. (B, D) Histograms plotting tissue size of the transgene-expressing (blue bars) or nonexpressing (white bars) compartments of adult wings showed in A and C respectively. (F, H) Histograms plotting tissue size (left) and cell density values (right) of the transgene-expressing (blue bars) or nonexpressing (white bars) compartments of adult wings showed in E and G respectively. Values are normalized as a percent of the control GFP-expressing wings. Error bars show the standard deviation. Number of wings analyzed per genotype ≥ 10. ***p < 0.001; **p < 0.01; ns, not significant. See also Table 29.
Thus, high levels of the Tkv receptor trap Dpp and trigger “competition” for the
ligand, thus inducing a non-autonomous reduction in tissue size of neighboring
wild type cell populations. Consistent with this, co-expression of the TkvDN
together with a dsRNA against PTEN was able to further enhance the non-
autonomous reduction in tissue size seen with depletion of PTEN alone (Figure
54, white bars), similarly to the overexpression of Dally (Figure 41). In this case,
the size of the transgene expressing compartment was slightly rescued due to a
reduction of Dpp activity caused by the dominant negative form of Tkv (Figure 54,
blue bars). These results emphasize the role of Dpp in modulating the growth and
pattern of different cell populations within a developing organ.

RESULTS
110
Figure 54. Increase Dpp trapping by Tkv upon targeted activation of PI3K/PTEN signaling pathway enhances the non-autonomous reduction in tissue size. (A, C) Cuticle preparations of adult wings expressing GFP and PTENRNAi or PTENRNAi and tkvDN under the control of the en-gal4 (A) and the ci-gal4 (C) drivers. The blue line marks the boundary between the anterior (A) and posterior (P) compartments and the domains of transgene expression are marked with a blue asterisk. (B, D) Histograms plotting tissue size of the transgene-expressing (blue bars) or nonexpressing (white bars) compartments of adult wings showed in A and C respectively. Values are normalized as a percent of the control GFP-expressing wings. Error bars show the standard deviation. Number of wings analyzed per genotype ≥ 10. ***p < 0.001. See also Table 30.
Overall, we show that targeted activation of growth promoting pathways to
specific territories of the wing imaginal disc triggers the trapping of the Dpp ligand
towards those cells, due to an increase in Dally levels, and as such the adjacent
wild type cell populations suffer a decrease in the growth and proliferation rates
due to a reduction in Dpp activity. Moreover, trapping of the Dpp ligand by other
means also showed a non-autonomous reduction in size of the adjacent
territories. We speculate that this could be one strategy used by malignant
mutation-carrying cells, in the early stages of tumorigenesis, to outcompete the
surrounding wild type cells and, as such, accelerate their colonization.
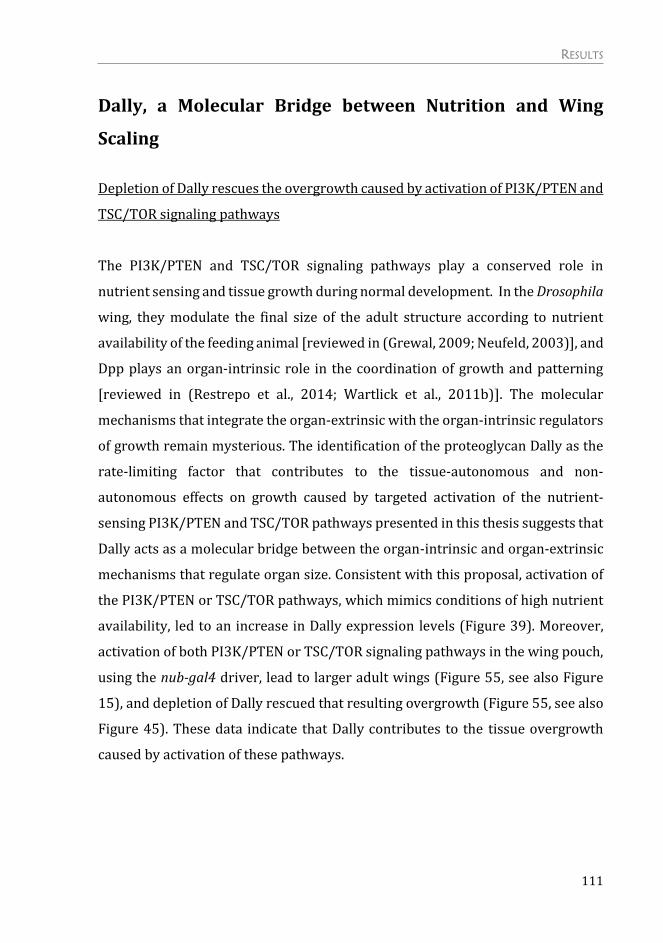
RESULTS
111
Dally, a Molecular Bridge between Nutrition and Wing
Scaling
Depletion of Dally rescues the overgrowth caused by activation of PI3K/PTEN and
TSC/TOR signaling pathways
The PI3K/PTEN and TSC/TOR signaling pathways play a conserved role in
nutrient sensing and tissue growth during normal development. In the Drosophila
wing, they modulate the final size of the adult structure according to nutrient
availability of the feeding animal [reviewed in (Grewal, 2009; Neufeld, 2003)], and
Dpp plays an organ-intrinsic role in the coordination of growth and patterning
[reviewed in (Restrepo et al., 2014; Wartlick et al., 2011b)]. The molecular
mechanisms that integrate the organ-extrinsic with the organ-intrinsic regulators
of growth remain mysterious. The identification of the proteoglycan Dally as the
rate-limiting factor that contributes to the tissue-autonomous and non-
autonomous effects on growth caused by targeted activation of the nutrient-
sensing PI3K/PTEN and TSC/TOR pathways presented in this thesis suggests that
Dally acts as a molecular bridge between the organ-intrinsic and organ-extrinsic
mechanisms that regulate organ size. Consistent with this proposal, activation of
the PI3K/PTEN or TSC/TOR pathways, which mimics conditions of high nutrient
availability, led to an increase in Dally expression levels (Figure 39). Moreover,
activation of both PI3K/PTEN or TSC/TOR signaling pathways in the wing pouch,
using the nub-gal4 driver, lead to larger adult wings (Figure 55, see also Figure
15), and depletion of Dally rescued that resulting overgrowth (Figure 55, see also
Figure 45). These data indicate that Dally contributes to the tissue overgrowth
caused by activation of these pathways.
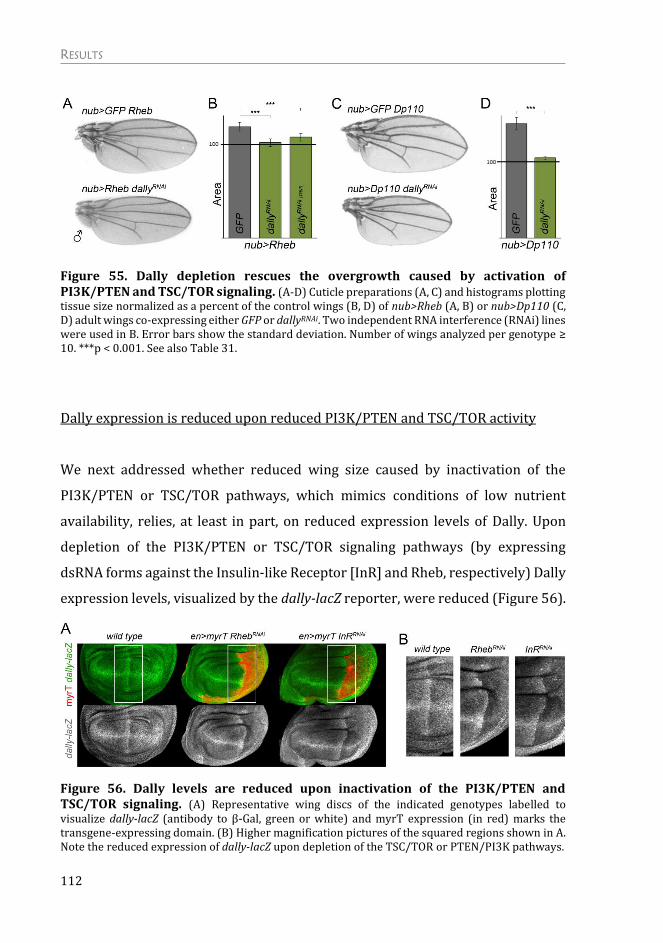
RESULTS
112
Figure 55. Dally depletion rescues the overgrowth caused by activation of PI3K/PTEN and TSC/TOR signaling. (A-D) Cuticle preparations (A, C) and histograms plotting tissue size normalized as a percent of the control wings (B, D) of nub>Rheb (A, B) or nub>Dp110 (C, D) adult wings co-expressing either GFP or dallyRNAi. Two independent RNA interference (RNAi) lines were used in B. Error bars show the standard deviation. Number of wings analyzed per genotype ≥ 10. ***p < 0.001. See also Table 31.
Dally expression is reduced upon reduced PI3K/PTEN and TSC/TOR activity
We next addressed whether reduced wing size caused by inactivation of the
PI3K/PTEN or TSC/TOR pathways, which mimics conditions of low nutrient
availability, relies, at least in part, on reduced expression levels of Dally. Upon
depletion of the PI3K/PTEN or TSC/TOR signaling pathways (by expressing
dsRNA forms against the Insulin-like Receptor [InR] and Rheb, respectively) Dally
expression levels, visualized by the dally-lacZ reporter, were reduced (Figure 56).
Figure 56. Dally levels are reduced upon inactivation of the PI3K/PTEN and TSC/TOR signaling. (A) Representative wing discs of the indicated genotypes labelled to visualize dally-lacZ (antibody to β-Gal, green or white) and myrT expression (in red) marks the transgene-expressing domain. (B) Higher magnification pictures of the squared regions shown in A. Note the reduced expression of dally-lacZ upon depletion of the TSC/TOR or PTEN/PI3K pathways.
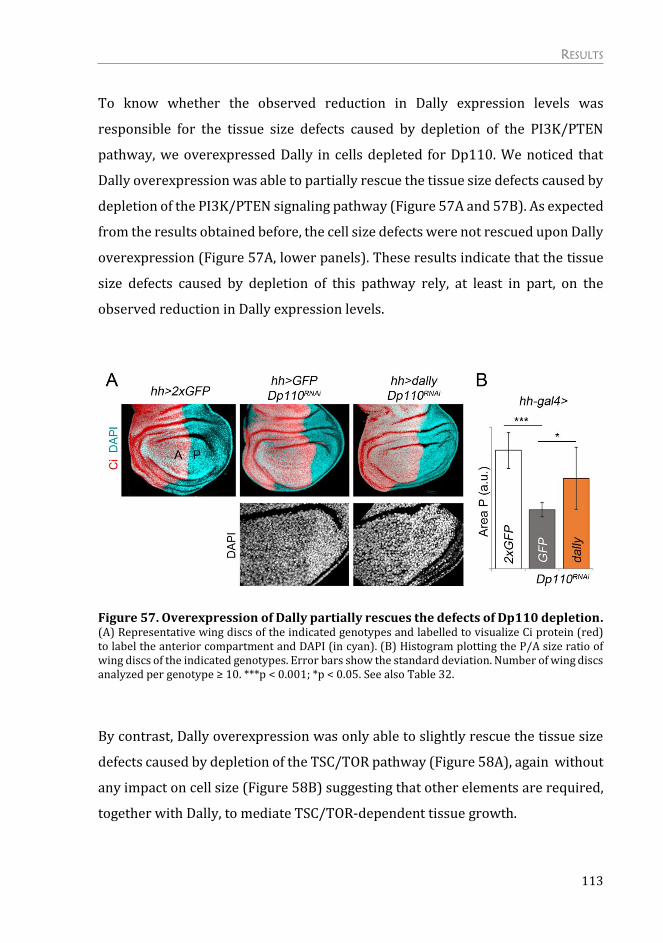
RESULTS
113
To know whether the observed reduction in Dally expression levels was
responsible for the tissue size defects caused by depletion of the PI3K/PTEN
pathway, we overexpressed Dally in cells depleted for Dp110. We noticed that
Dally overexpression was able to partially rescue the tissue size defects caused by
depletion of the PI3K/PTEN signaling pathway (Figure 57A and 57B). As expected
from the results obtained before, the cell size defects were not rescued upon Dally
overexpression (Figure 57A, lower panels). These results indicate that the tissue
size defects caused by depletion of this pathway rely, at least in part, on the
observed reduction in Dally expression levels.
Figure 57. Overexpression of Dally partially rescues the defects of Dp110 depletion. (A) Representative wing discs of the indicated genotypes and labelled to visualize Ci protein (red) to label the anterior compartment and DAPI (in cyan). (B) Histogram plotting the P/A size ratio of wing discs of the indicated genotypes. Error bars show the standard deviation. Number of wing discs analyzed per genotype ≥ 10. ***p < 0.001; *p < 0.05. See also Table 32.
By contrast, Dally overexpression was only able to slightly rescue the tissue size
defects caused by depletion of the TSC/TOR pathway (Figure 58A), again without
any impact on cell size (Figure 58B) suggesting that other elements are required,
together with Dally, to mediate TSC/TOR-dependent tissue growth.

RESULTS
114
Figure 58. Overexpression of Dally slightly rescues the defects of Rheb depletion. (A, B) Histograms plotting tissue size (A) and cell density (B) values normalized as a percent of the control (nub>GFP) of nub>RhebRNAi adult wings co-expressing either GFP or Dally. Error bars show the standard deviation. Number of wings analyzed per genotype ≥ 10. *p < 0.05. See also Table 33.
In order to further reinforce the idea of Dally working as a molecular bridge
between nutrient-sensing pathways and organ-intrinsic mechanisms, we
subjected experimental and control larvae to media containing high (100 g/L
yeast) or low (20 g/L yeast) levels of amino acids and analyzed the size of the
resulting adult wings upon expression of Dally or a dsRNA form against Dally in
the whole wing primordium. As expected, the total wing size of control nub>GFP
animals was reduced in those larvae reared on food containing 20 g/L yeast
(Figure 59, grey bars). Despite of that, the size of Dally-overexpressing wings
(which slightly increases the range of Dpp signaling without affecting the shape of
the activity gradient, see Figure 60) was comparable to that of animals receiving
food containing 100 g/L yeast (Figure 59, orange bar). Similarly, despite the
expected increase in animal size reared on food containing 100 g/L yeast, the size
of Dally depleted wings was comparable to that of animals receiving 20 g/L yeast
food (Figure 59, green bar).

RESULTS
115
Figure 59. Modulation of Dally in different nutrient conditions. Histogram plotting absolute size in a.u. of adult wings of the indicated genotypes. Quantification was made in well-fed (100 g/L yeast food) and starved (20 g/L yeast food) animals. Error bars show the standard deviation. Number of wings analyzed per genotype ≥ 10. ***p < 0.001; ns, not significant. See also Table 34.
Figure 60. Dally overexpression in the wing pouch affects the range but not the shape of the activity gradient. (A) Wing imaginal discs of nub>GFP and nub>dally larvae labelled to visualize pMAD protein (in red). (B) Average pMAD profiles of wing discs expressing GFP (red line) or Dally (blue line) in the nubbin domain. Profiles were taken along the AP axis and plotted in absolute positions. The standard error to the mean is shown in the corresponding color for each genotype. The AP boundary of both experiments was aligned to allow comparison of the profile in each compartment. Number of wing discs analyzed per genotype ≥ 7. Arrows mark the limits of the Dpp activity gradients.
All together, these results reveal that Dally proteoglycan participates in
integrating nutrient conditions into wing scaling, most probably through its
ability to facilitate the spread of Dpp throughout the tissue.


DISCUSSION


DISCUSSION
119
Discussion
During development, the coordination of growth between and within organs is
fundamental to assure the emergence of animals with proper body/organ size and
proportions. Nutrient conditions, through the activity of nutrient sensing
pathways, such as the phosphatidylinositol 3-kinase (PI3K)–phosphatase with
tensin homology (PTEN) and the tuberous sclerosis complex (TSC)–target of
rapamycin (TOR) signaling pathways, cautiously modulate the final size of a
developing organ. In addition, patterning signals operate in an autonomous way
to control growth of an organ. How cells integrate distinct inputs (extrinsic and
intrinsic signals) to generate organs of appropriate size and shape remains
unknown. Interestingly, the PI3K/PTEN and TSC/TOR pathways are frequently
activated in human cancer. This activation is often causative of tumorigenesis and
raises the question of how cells acquiring mutations in tumor suppressor genes
outcompete neighboring wild type cells. In order to tackle these two issues, we
used the Drosophila wing to deregulate the PI3K/PTEN and TSC/TOR pathways in
specific cell populations. The results presented in this thesis unravel a new role
for the glypican Dally, which functions in regulating the spread of Dpp in
Drosophila tissues, in contributing to the autonomous and non-autonomous
effects of deregulation of these tumor suppressor pathways. The ability of Dally to
trap the growth factor Dpp helps to integrate organ-extrinsic with organ-intrinsic
signals that modulate the growth of the wing imaginal disc. Moreover, this
strategy might be used by cancer cells to efficiently outcompete the neighboring
wild type cells.

DISCUSSION
120
A new process of cell competition
Targeted deregulation of the PI3K/PTEN, TSC/TOR, or Hippo/Yorkie signaling
pathways not only promotes tissue overgrowth in an autonomous manner by
increasing the number and/or size of cells, but also induces a consistent non-
autonomous reduction in tissue size of the adjacent wild type cell populations.
This non-autonomous effect is a consequence of a reduction in both cell size and
proliferation rates (cell number). The reduction in proliferation rates is most
probably a consequence of longer cell division cycles as we did not see any
obvious arrest in any particular cell cycle stage. The non-autonomous reduction
in size resembles the process of cell competition described as the ability of cells
with a growth advantage to eliminate the neighboring wild type cells by apoptosis.
However, targeted activation of these pathways did not induce non-autonomous
apoptosis and, moreover, reducing the apoptotic machinery by different means
did not rescue the non-autonomous reduction in tissue size. Effector caspases and
the Dp53 tumor suppressor protein have an important role in reducing the growth
and proliferation rates of adjacent wild type territories upon targeted depletion
of the translational machinery (Mesquita et al., 2010). Even though targeted
deregulation of the PI3K/PTEN, TSC/TOR, or Hippo/Yorkie signaling pathways
induced a clear autonomous increase in the number of apoptotic cells, neither the
caspases nor Dp53 were responsible for the non-autonomous reduction in tissue
size and proliferation rates in our case. Another possibility is that the non-
autonomous reduction in size is a consequence of the withdrawal of nutrients
from neighboring tissues by the overgrowing populations based on the
observation that competition for nutrients contributes to the growth of PTEN
mutant cells and to the out-competition of wild type surrounding cells (Nowak et
al., 2013). However, this idea was over-ruled by the experimental observation that
subjecting larvae to different amino acid diets did not have any impact on the size
reduction of neighboring cell populations. This difference may rely on the fact that

DISCUSSION
121
Dpp is only required from growth in the wing imaginal disc while in the eye disc
it is not.
Interestingly, we observed that the width of the Dpp activity gradient as well as
the total amount of Dpp activity were both reduced in adjacent cell populations
upon targeted de-regulation of these tumor suppressor pathways. This led us to
propose that the non-autonomous reduction in tissue size is a consequence of
reduced Dpp signaling, most probably reflecting increased number of Dpp
molecules bound to the overgrowing tissue and a consequent reduction in the
number of Dpp molecules available in the neighboring cell population (Figure 61).
Consistent with this proposal, the non-autonomous effects on tissue size were no
longer seen in the absence of the Dpp ligand, suggesting that targeted activation
of growth promoting pathways triggers competition for the growth factor Dpp
availability. It has been proposed that classical cell competition can be also due to
competition for Dpp ligand availability, since loser cells upregulate Brk expression
which triggers JNK activation and apoptosis (Moreno et al., 2002). Again, we did
not see apoptosis in the territories with reduced Dpp activity. One possibility is
that confronting cells with drastic differences in Brk expression levels is the
responsible for triggering apoptosis. Another possibility is that elimination of
loser clones could also be partially induced by the mechanical constraints
imposed by the vicinity of fast growing clones and cell crowding. This could
explain the insulating role of compartment boundaries on cell competition, which
through the local upregulation of cortical tension, could mitigate the
communication of mechanical stress from one compartment to the other
(Landsberg et al., 2009).
Whether the term competition can be used to describe what we see upon targeted
activation of growth might be controversial mainly because the concept of cell
competition is tightly linked to apoptosis and also it does not cross the
compartment boundaries of the wing imaginal disc. However, taking the concept
of competition as a contest, between two or more groups, for resources, we can
say that upon targeted activation of growth a competition for the amount of Dpp

DISCUSSION
122
ligand is being triggered. Nevertheless, this competition is not normally occurring
during development, since making a territory less efficient in the trapping of the
ligand (depleting Dally, for example) did not cause any overgrowth and/or an
increase in Dpp activity in the neighboring cell populations. Finally, other
pathways have been related to cell competition, and yet they differ from the
classical view as they do not require induction of apoptosis. This includes
activation of Ras (Hogan et al., 2009) and Scr in mammalian epithelial cultured
cells (Kajita et al., 2010), and clones of cells mutant for Csk in Drosophila (Vidal et
al., 2006) and, in those scenarios, their out-competition is due to context-
dependent effects on epithelial cell extrusion. As mentioned before, competition
for nutrients availability has also been shown to contribute to the out-competition
of wild type cells by PTEN mutant cells (Nowak et al., 2013). All these examples
may fit into a broader definition of cell competition than the one that is currently
accepted.
A new role for Dally
We showed that the glypican Dally, which plays a major role in regulating the
spread of Dpp in Drosophila tissues, is upregulated upon activation of the
PI3K/PTEN, TSC/TOR, or Hippo/Yorkie signaling pathways and that the increase
in Dally expression levels contributes to the autonomous effects on tissue size and
to the non-autonomous reduction in cell number. Whereas the autonomous
effects on tissue size caused by deregulation of these tumor suppressor pathways
are most probably due to, as least in part, the capacity of Dally to facilitate Dpp
spreading throughout the tissue, we propose that the non-autonomous effects on
cell number are a consequence of withdrawal of Dpp from neighboring tissues
(Figure 61). The non-autonomous reduction in tissue size is a consequence of
reduced Dpp signaling, most probably reflecting increased number of Dpp

DISCUSSION
123
molecules bound to the overgrowing (Dally-upregulated) tissue and a consequent
reduction in the number of Dpp molecules available in the neighboring cell
population. This proposal is based on a number of observations. First, the width
of the Dpp activity gradient, as well as the total amount of Dpp activity, was
reduced in adjacent cell populations upon targeted depletion of tumor suppressor
pathways. Second, the non-autonomous effects on tissue size did not occur in the
absence of Dpp. Third, the non-autonomous effects on tissue size were fully
rescued by Dally depletion, which has a rather specific role on the spread of Dpp
when overexpressed. Fourth, the non-autonomous effects on tissue size, growth
and proliferation rates, and/or Dpp availability and signaling can be phenocopied
by overexpression of Dally. Fifth, increasing the levels of the Dpp receptor Tkv also
causes a non-autonomous reduction in tissue size. Still, it would be very helpful to
visualize Dpp distribution upon targeted activation of these pathways, which has
some technical limitations. So far, the only way to do so is by overexpressing a
Dpp-GFP construct in the Dpp expression domain. This non-physiological
overexpression leads to strong overgrowth of the wing disc, which impairs the
interpretation of the results. Boosting Dpp signaling to the maximum and showing
that the non-autonomous effect is lost would also be very insightful. The main
effector of Dpp signaling on growth is Brinker. We have increased Dpp signaling
by different means (by using mutations in brinker or by overexpressing Dpp in its
own expression domain using the lexA system) and, unfortunately, the resulting
wing primordia were in all cases largely overgrown and no adult flies were
isolated. Unluckily, Dp110 expression in the anterior domain in a brk mutant
background was lethal in early larval development, and no larval primordia could
be isolated.

DISCUSSION
124
Figure 61. A role of Dally in mediating the non-autonomous effects on tissue growth. Activation of the PI3K/PTEN, TSC/TOR, or Hippo/Yorkie pathways in a defined cell population (in blue) increases cell and/or tissue size in an autonomous manner and induces a non-autonomous reduction in both cell size and number in neighboring cell populations (in grey). Whereas the autonomous and non-autonomous effects on tissue size are mediated by Dally, the effects on cell size are Dally independent. The non-autonomous reduction in tissue size is a consequence of reduced Dpp signaling, most probably reflecting increased number of Dpp molecules (in orange) bound to the overgrowing (Dally-upregulated, dark blue) tissue and a consequent reduction in the number of available Dpp molecules to the neighboring cell population.
We observed different strengths of the autonomous and non-autonomous effects
upon deregulation of these tumor suppressor pathways (or overexpression of
Dally) in either the A or P compartments. Despite the mild autonomous induction
of tissue growth caused by the ci-gal4 driver in A cells, it caused a relatively strong
non-autonomous reduction of the neighboring compartment. On the contrary, the
en-gal4 driver caused a strong autonomous induction of tissue growth in P cells
but a relatively weak non-autonomous reduction of the neighboring
compartment. The differential autonomous response might simply reflect
different strengths of these Gal4 drivers. Systemic effects due to expression of the
Gal4 drivers in other places besides the compartments of the wing imaginal disc
could affect the growth of the whole larvae. This possibility was rejected by the

DISCUSSION
125
fact that no changes in body size were observed upon targeted activation of these
pathways in the wing disc. By contrast, the strongest non-autonomous effects
caused by the ci-gal4 driver (when compared to the en-gal4 driver) might be
because Dpp expression is restricted to the A compartment and increased levels
of Dally in Dpp expressing cells are more efficient at titrating out the levels of this
growth factor from the neighboring compartment. Additionally, studies of a
second Drosophila BMP-family member, Glass bottom boat (Gbb), suggest that
Dpp might not act alone in specifying BMP signaling-dependent positional
information along the anteroposterior axis. Either alone or in heterodimers with
Dpp, Gbb uses the same signal transduction system as Dpp. Gbb seems to
contribute to the BMP morphogen gradient, most strongly in the posterior
compartment (Bangi and Wharton, 2006a; Bangi and Wharton, 2006b). It might
be that Dally is also able to cause the withdrawal of Gbb from the extracellular
matrix.
We noticed that the non-autonomous effects on cell size observed upon
deregulation of the PI3K/PTEN, TSC/TOR, or Hippo/Yorkie pathways are Dally
independent, as overexpression of Dally did not cause a non-autonomous
reduction in cell size. Moreover, depletion of Dally did not rescue the non-
autonomous reduction in cell size caused by activation of these pathways. These
results are consistent with the fact that changes in Dpp signaling do not cause any
effect on cell size (Martín-Castellanos and Edgar, 2002), which is also confirmed
by the overexpression of a dominant negative form of the Thickveins receptor,
thus indicating that Dally and Dpp regulate cell number but not cell size. A Dally-
independent mechanism, triggered by activation of these signaling pathways, may
be at work in order to induce a non-autonomous reduction in cell size. It is known
that experimentally induced alterations in cell proliferation are often
compensated by changes in cell size (Weigmann et al., 1997). However, since Dally
depletion rescues cell number and proliferation rates, but not cell size, these
compensation mechanism seems not to be functioning in this situation. Given the
fact that in the wing imaginal disc we could not observe the reduction in cell size

DISCUSSION
126
it might be that the reduction seen in the adult wing is due to an adjustment of cell
size during pupal stages. It is known that during pupal development, wing cells go
through two rounds of cell division and the pattern of cell proliferation is spatially
heterogeneous associated with wing vein and intervein regions (García-Bellido et
al., 1994; Milan et al., 1996).
Still, one open question is how Dally is commonly regulated by the PI3K/PTEN,
TSC/TOR and Hippo/Yorkie signaling pathways. Dally regulation is indeed
occurring at the transcriptional level, since the dally-lacZ reporter was
upregulated upon activation of these growth promoting pathways. One possibility
is that regulation of Dally by the PI3K/PTEN and TSC/TOR signaling pathways
goes through regulation of Yki. This hypothesis is based on the fact that both IIS
and TOR signaling regulate Yki expression or activity in vivo (Parker and Struhl,
2015; Straßburger et al., 2012). It was shown that IIS activates Yki in vivo, and that
Yki plays an important role in the ability of IIS to drive cell proliferation in wing
cells (Straßburger et al., 2012). TOR signaling has been shown to govern Yki action
after it reaches the nucleus by allowing it to gain access to its target genes (Parker
and Struhl, 2015). A less likely alternative could be that the three signaling
pathways independently activate Dally through its respective transcription
factors. In this sense, identification and characterization of putative binding sites
for each transcription factor in the Dally locus/regulatory region could be very
insightful.
Dpp signaling in growth control
Interestingly, deregulation of these pathways, and the resulting tissue
overgrowth, leads to the expansion of the Dpp gradient without affecting the total
levels of Dpp signaling. These results imply that Dpp activity levels do not play an
instructive role in promoting tissue growth but rather that it is the range of the
Dpp gradient what regulates final tissue size. Consistent with this proposal,

DISCUSSION
127
depletion of Dally levels in one compartment (which might lead to increased levels
of available Dpp to the neighboring cell population) does not cause any visible
non-autonomous effect in tissue size. This could be due to the capacity of Dpp to
restrict its own spreading through the repression of Pentagone, a diffusible
protein that interacts with Dally and contributes to the expansion of the Dpp
gradient (Ben-Zvi et al., 2011; Hamaratoglu et al., 2011; Vuilleumier et al., 2010).
The graded distribution of Dpp leads, via the interaction with its receptor
complex, to the graded activation of Mad/Medea, which in turn represses the
transcription of brinker (brk). This creates a gradient of Brk expression that is
reciprocal to the Dpp gradient. Brk is a transcriptional repressor that acts
negatively to establish, in a dose-dependent manner, the expression domain of
Dpp target genes like spalt (Campbell and Tomlinson, 1999; Jaźwińska et al., 1999;
Minami et al., 1999). Thus, Dpp regulates the expression of target genes by
repressing brinker. Remarkably, the reduced size of the wing primordium
observed in hypomorphic alleles of dpp is restored when combined with brk
mutants (Schwank et al., 2008). This experimental evidence indicates that Dpp
controls wing growth entirely via repression of brk. The Dally-mediated increase
in the width of the Dpp gradient observed upon deregulation of the PI3K/PTEN or
TSC/TOR pathways might contribute to restrict the expression domain of brk to
the lateral sides of the wing primordium. Similarly, the non-autonomous decrease
in the width of the Dpp gradient might cause an expansion of the brk domain,
which is known to repress growth.
However, an issue that has been a matter of intense debate is how graded Dpp
activity drives uniform proliferation throughout the wing imaginal discs. It has
been suggested that Dpp sustains proliferation of the central cells, by removal of
the growth repressor Brinker. A recent report shows that in the absence of Dpp
spreading, by trapping Dpp at its source, lateral cells still divide at normal rates,
while medial cells divide at a lower rate (Harmansa et al., 2015). Our results of
targeted Dally overexpression experiments are consistent with this idea in the
sense that the adjacent wild type territory, which has reduced Dpp spreading

DISCUSSION
128
presents a lower proliferation rate. We assume that this occurs especially in the
medial region of the posterior compartment.
Although we show that Dally has a rather specific impact on the Dpp morphogen,
Dally-mediated spreading of other secreted growth factors might also contribute
to the autonomous effects on tissue growth caused by deregulation of the
PI3K/PTEN, TSC/TOR, or Hippo/Yorkie pathways. This is revealed by the fact that
Dally depletion rescues both the autonomous and the non-autonomous effects,
whereas deregulation of these pathways are still able to induce some growth upon
Dpp knock down.
Downstream of Dally and Dpp in growth
It is clear that Dally and Dpp signaling have an impact on tissue growth. Dally
overexpression gives rise to an increase in tissue size as well as an increase in Dpp
signaling by different means. The role of Dpp in driving tissue growth has been
shown to be exclusively through repression of Brinker and the creation of an
inverse gradient of its expression levels. In fact, in a similar fashion as
overexpression of Dpp throughout the wing imaginal disc, Brk mutant discs
present a dramatic increase in tissue size.
The identification of downstream effectors of the Dpp pathway on growth remains
largely mysterious. Only a few transcriptional target genes of Brk are known, such
as vestigial (vg), the microRNA bantam known to promote cell survival and
proliferation (Nolo et al., 2006; Thompson and Cohen, 2006), and the proto-
oncogene dMyc (Doumpas et al., 2013). Dally has been shown to affect cell cycle
progression via Cyclin A in the optic lobe and retina of the Drosophila eye
primordium, but whether it does so via Dpp signaling remains unknown (Nakato
et al., 2002).
To generate larger structures, an increase/accumulation of mass has to occur, and
this implies uptake of more nutrients required for protein synthesis and organelle
DISCUSSION
129
biogenesis. Given the fact that activation of the Dpp signaling pathway generates
a remarkable increase in tissue mass, it must by any mean lead to a higher nutrient
uptake. Which are the downstream targets/effectors of Dpp signaling that allow
this to occur remain unidentified.
Biological relevance of this mechanism
Somatic mutations in tumor suppressor genes such as PTEN or TSC are frequently
observed in early events of tumor development, and these mutations are thought
to contribute to the selection of tumorigenic cells. Competition for available
growth factors, by modulating the levels of glypicans, such as Dally, might
contribute to the out-competition of wild type cells and to the selection of
malignant mutation-carrying cells in human cancer. Tumor cells, by acquiring an
advantage in tethering growth factors from the media, might cause a reduction in
the amount of these factors available to the surrounding cells, thus causing a non-
autonomous reduction in growth and proliferate rates. Interestingly, in
Drosophila epithelial cells it was demonstrated that the secreted proteoglycan
Perlecan can cooperate with EGFR to promote tumorigenesis (Herranz et al.,
2014). Coexpression of Perlecan in the EGFR-expressing epithelial cells
potentiates endogenous Wg and Dpp signals from the epithelial cells to support
expansion of tumor cells. Wg activity is required in the epithelial compartment,
whereas Dpp activity is required non-autonomously in the mesenchymal
compartment (Herranz et al., 2014). In mammalian epithelial cells, it has been
shown that insulin, through Akt activation, enhances the delivery of TGF-β
receptors at the cell surface thereby enhancing TGF-β responsiveness which
promotes the migration of these cells (Budi et al., 2015). The authors proposed
that this mechanism may help to explain the progression/malignancy of cancers
in which Akt is activated.

DISCUSSION
130
The PI3K/PTEN and TSC/TOR signaling pathways play a role not only in disease
but also during normal development. These two pathways modulate the final size
of the developing organism according to nutrient availability. In a condition of
high nutrient availability, which leads to the activation of the nutrient-sensing
PI3K/PTEN and TSC/TOR pathways, increased levels of Dally facilitate the spread
of the Dpp morphogen throughout the growing tissue and contribute to the
generation of larger but well-proportioned and scaled adult structures. Depletion
of Dally expression levels rescues the tissue growth caused by high levels of
nutrients or activation of the nutrient-sensing pathways and gives rise to smaller
and, again, well-proportioned and scaled adult structures. Of remarkable interest
is the capacity of Dally to induce tissue overgrowth when overexpressed or to
mediate the overgrowth upon deregulation of the PI3K/PTEN, TSC/TOR, or
Hippo/Yorkie pathways. In this context, our results identify Dally as a molecular
bridge between nutrient sensing and wing scaling in Drosophila (Figure 62).
Figure 62. A role of Dally in tissue growth. Within the feeding animal, the PI3K/PTEN and TSC/TOR pathways sense nutrient conditions and modulate both cell and tissue size. Whereas the effects on tissue size are mediated by the glypican Dally, which modulates the spreading of the Dpp morphogen throughout the tissue, the effects on cell size are Dally independent.
Compartments and coordination of growth
Compartments have been proposed to be individual units of growth control
(Martín and Morata, 2006). In other words, the size of each compartment is
controlled independently. Our results on the lack of non-autonomous effects on
tissue growth upon depletion of Dally or Sulfateless, the enzyme needed for the

DISCUSSION
131
modification of HS chains within glypicans, indicate that this is the case. Targeted
depletion of glypican expression or activity in developing compartments gave rise
to an autonomous reduction in tissue size without affecting the neighboring
compartment. However, independent lines of evidence support the view that
adjacent compartments buffer local variations in tissue growth caused by
different means, including a non-autonomous reduction in tissue size upon
depletion of the protein biosynthetic machinery (Mesquita et al., 2010) or reduced
epidermal growth factor receptor (EGFR) activity (García-Bellido et al., 1994). Our
results on the capacity of overgrowing compartments to withdraw Dpp from
neighboring tissues and to cause a non-autonomous reduction in growth and
proliferation rates reinforce the view that compartments are susceptible to
modulate their growth rates upon different types of stress, including depletion of
tumor suppressor genes.
Interestingly, the halteres and wings of Drosophila are homologous thoracic
appendages, and the activity of the Ultrabithorax (Ubx) Hox gene in the haltere
imaginal discs contributes to defining its reduced size. The reason for the small
posterior compartment of the haltere is that Ubx, together with Engrailed,
downregulates Dpp signaling in the posterior compartment. Interestingly, it does
so by reducing the expression levels of Dally and Tkv (Crickmore and Mann, 2006;
Crickmore and Mann, 2007; de Navas et al., 2006; Makhijani et al., 2007), thus
reinforcing the role of Dally in modulating tissue growth in epithelial organs.
Furthermore, overexpression of Dally in the P compartment gives rise to an
overall increase in size of haltere discs, and a non-autonomous reduction in pMAD
labeling in the A cells immediately adjacent to the AP boundary (Crickmore and
Mann, 2007). It would be interesting to known whether activation of PI3K/PTEN
and TSC/TOR signaling in P cells of the halteres is able to upregulate Dally
expression levels even in the presence of Ubx.
Upon reduction of growth in one compartment, the adjacent cell populations
reduce its growth rates (Mesquita et al., 2010), favoring the maintenance of the
proportions between the distinct territories. In this thesis we showed that upon
DISCUSSION
132
activation of growth in one territory, the adjacent cell populations reduce its
growth rates, favoring the maintenance of roughly its normal total size. So, the
wing rather favors maintenance of proportions or of total final size. Which are the
biological constrains behind this choice is an interesting question. Preservation of
proportional wings is important for maximum functionality. However, up to
certain point, since very small wings would not allow the animal to fly.
Conservation of total final size at the expense of the proportionality could be due
to weight issues, since very large wings might be incompatible with flying.
The results presented in this thesis unravel properties of the system not described
so far: cells can compete for available growth factors such as Dpp. Moreover, the
unraveled mechanism by which activation of the PI3K/PTEN, TSC/TOR and
Hippo/Yorkie pathways induce a non-autonomous tissue undergrowth might
contribute to the understanding of these pathways in tumorigenesis. In addition,
the fact that Dally influences Dpp gradient formation and its expression is
controlled by the nutrient sensing pathways, demonstrates that it might act as a
molecular bridge between organ-extrinsic and organ-intrinsic factors that control
wing growth during development of the fly.

CONCLUSIONS

CONCLUSIONS
135
Conclusions
1. Targeted activation of PI3K/PTEN, TSC/TOR and Hippo/Yorkie signaling
pathways induces a non-autonomous reduction in tissue size of adjacent
wild type cell populations.
2. The non-autonomous reduction in tissue size is a consequence of a
reduction in both growth and proliferation rates throughout development.
3. The non-autonomous response is independent of apoptosis and does not
rely on competition for nutrients.
4. The activation of PI3K/PTEN and TSC/TOR pathways affects the spreading,
but not activity, of the Dpp morphogen, and consequently Dpp activity levels
are reduced in adjacent wild type populations.
5. The activity of the PI3K/PTEN, TSC/TOR and Hippo/Yorkie pathways
regulate Dally expression levels.
6. Dally overexpression causes an autonomous increase in tissue size
accompanied by an increase in cell number and higher Dpp activity levels.
7. The non-autonomous effects on tissue size, growth and proliferation rates,
and/or Dpp availability and signaling are phenocopied by targeted
overexpression of Dally.
8. Trapping of the Dpp morphogen by increasing the levels of its receptor
causes a non-autonomous reduction in tissue size.

CONCLUSIONS
136
9. Dally contributes to the autonomous and non-autonomous effects on tissue
size upon targeted activation of PI3K/PTEN, TSC/TOR and Hippo/Yorkie
pathways.
10. Dally couples the organ-extrinsic (nutrient-sensing pathways) to the organ-
intrinsic (Dpp signaling) growth properties in the wing imaginal disc.

MATERIAL
AND
METHODS


MATERIAL AND METHODS
139
Material and Methods
Drosophila Strains
Flies were raised at 25° C (unless otherwise specified) in a 12/12 h day/night
period on standard Drosophila medium containing 4% glucose, 55 g/L yeast,
0,65% agar, 28 g/L wheat flour, 4 ml/L propionic acid and 1,1 g/L nipagin).
Gal4 driver lines: en-gal4, hh-gal4, ci-gal4, nub-gal4 were from the Bloomington
Stock Center and are described in Flybase; spaltPE-gal4 (Barrio and de Celis, 2004).
UAS – lines: UAS-PTENRNAi (ID 101475), UAS-dallyRNAi (ID 14136), UAS-dally-likeRNAi
(ID 100268), UAS-sulfatelessRNAi (ID 5070), UAS-InRRNAi (ID 992), UAS-Dp110RNAi (ID
38985) were obtained from the Vienna Drosophila RNAi Center; UAS-RhebRNAi
(HMS00923), UAS-dallyRNAi (HMS00905), UAS-dally-likeRNAi (HMS00875 and
HMS00903), UAS-sulfatelessRNAi (HMS00543), UAS-dppRNAi (JF01371) were
obtained from the Bloomington Stock Center TRiP collection; UAS-p35 (Hay et al.,
1994); UAS-yki (kind gift from S. Cohen); UAS-tkv and UAS-tkvDN (a dominant
negative version of tkv that lacked the cytoplasmic kinase domain necessary for
signal transduction (Kumar and Moses, 2001)); UAS-dp53ct (a dominant negative
version of Dp53, (Brodsky et al., 2000)); UAS-dally ( (Nakato et al., 1995), kind gift
from E. Sánchez-Herrero); UAS-cyclin-E and UAS-string (kind gifts from B. Edgar),
UAS–Dp110/PI3K and UAS-Rheb were obtained from the Bloomington Stock
Center and are described in Flybase.
Other lines: dally-YFP (115511), tkv-YFP (115298) were obtained from the DGRC;
tkv-lacZ (P(lacZ)tkvk16713) was obtained from Bloomington Stock Center and is
described in Flybase; dally-lacZ (P(lacZ)dally06464, (Nakato et al., 1995), kind gift

MATERIAL AND METHODS
140
from E. Sánchez-Herrero); Df(3L)H99 (a deficiency that covers the pro-apoptotic
genes hid, grim, and reaper, (Steller, 2008)); dpp-lacZ (Basler and Struhl, 1994).
Mosaic analysis
FRT clones. The following Drosophila genotypes were used to generate loss-of-
function clones in wing discs by the FLP/FRT system (Xu and Rubin, 1993):
(1) hs-FLP, ubi-nls-RFP, FRT19A/FRT19A; ci-gal4, UAS-GFP/+,
(2) hs-FLP, ubi-nls-RFP, FRT19A/FRT19A; ci-gal4,UAS-GFP/UAS-Dp110
(3) hs-FLP, ubi-nls-RFP, FRT19A/FRT19A; ci-gal4, UAS-GFP/UAS-Dally
Heat-shock (1h at 38°C) was induced at early third instar (72h AEL), grown at
25°C and wing discs were dissected 72h after clone induction. The clones were
marked by the absence of RFP expression.
Antibodies
The antibodies used were rabbit anti-Spalt (a kind gift from R. Barrio, (Barrio and
de Celis, 2004)), rabbit anti-pMAD (a kind gift from G. Morata), guinea-pig anti-
Dally (kind gift from A. Gallet (Ayers et al., 2012)), mouse anti-Distalless (kind gift
from S. Cohen), rabbit anti–phosphorylated histone 3 (PH3) (Cell Signaling), rat
anti-BrdU (Abcam), rabbit anti-βgal (Cappel), rat anti-Ci (2A1, DSHB), mouse anti-
Patched (Drosophila Ptc - Apa 1, DSHB), mouse anti-Wingless (4D4, DSHB) and
mouse anti-Dally-like (13G8, DSHB). The fluorescent secondary antibodies that
have been used are from Molecular Probes (used 1/500).
Immunostaining
Larvae were dissected in PBS, fixed for 20 minutes in PBS + 4% formaldehyde,
rinsed 3 times during 15 minutes with PBT (PBS + 0.1% Triton X-100), and
blocked for 1 hour with BBT (PBT + BSA 0’3% + 250 mM NaCl). Incubation with
primary antibodies in 50μl of BBT was performed overnight at 4°C. After
incubation, samples were rinsed 4 times during 15 minutes with BBT and stained

MATERIAL AND METHODS
141
with secondary antibodies conjugated with different Alexa-fluorophores in 100μl
of BBT for 2 hours at room temperature. DAPI was added to the last 15 minutes of
secondary antibody staining to detect DNA. Samples were finally rinsed with PBT
and mounted in mounting medium (40ml Glycerol + 5ml PBS10X + 400μl N-
propyl-gallate 50% diluted in ethanol). Images were captured using a Leica TCS
SP2 confocal microscope and process and treated with Fiji Software (NIH, USA)
and Adobe Photoshop Software.
TUNEL Assay
TUNEL analysis was performed as described in (Milán et al., 1996) and it was used
to label the DNA break of death cells (kit provided by Roche Diagnostics).
BrdU incorporation
BrdU incorporation was performed as described in (Milán et al., 1996). It was used
to measure DNA synthesis (S phase) in proliferating cells. 5-bromo2’-deoxy-
uridine (BrdU) was incorporated into DNA in place of thymidine. Then, cells which
have incorporated BrdU into DNA were detected using an antibody against BrdU.
In situ hybridization
In situ hybridization was performed as described in (Milán et al., 1996). The
antisense probes of string and cycE were previously generated in the laboratory
(Mesquita et al., 2010).
Quantification of Tissue and Cell Size in Adult Wings
Virgins of the different gal4-lines were crossed with males carrying different UAS-
transgenes and allowed to lay eggs for 24h at 25°C. The resulting larvae developed
at 25°C until adulthood. The sizes of the wing and of the A and P compartments
were measured using Fiji Software (NIH, USA). Cell density was measured as the
number of hairs (each wing cell differentiates a hair) per defined area. Two
conserved regions between veins L4 and L5 (P compartment) and veins L2 and L3

MATERIAL AND METHODS
142
(A compartment) were used to measure cell densities. The final area and cell
density values were normalized as a percent of the control values of GFP
expressing samples under the corresponding gal4-drivers. At least ten adult wings
per genotype were scored. Only adult males were scored. The average values and
the corresponding standard deviation were calculated, and a t-test analysis was
carried out. The average values, the corresponding standard deviations, and the
corresponding p-values are included in the annexes tables.
Quantification of Tissue Growth in Developing Wing Discs
Hatched first instar larvae were sorted from egg laying plates (egg laying period
of 4h at 25°C), transferred to fresh tubes, allowed to growth at 25°C, and dissected
at three time points of development (72h, 96h and 140h). The size of the A and P
compartments in the wing primordia was measured using Fiji Software (NIH,
USA). At least ten wing discs per genotype and per time point were scored. The
corresponding standard deviation was calculated, and a t-test analysis was
carried out. The average values, the corresponding standard deviations, and the
corresponding p-values are included in the annexes tables.
Proliferation and Growth Rate Measurements by Clonal
Analysis
Early third instar (72h AEL) larvae of the following genotypes: (1) hs-FLP, ubi-nls-
RFP, FRT19A/FRT19A; ci-gal4, UAS-GFP/+, (2) hs-FLP, ubi-nls-RFP,
FRT19A/FRT19A; ci-gal4, UAS-GFP/UAS-Dp110, and (3) hs-FLP, ubi-nls-RFP,
FRT19A/FRT19A; ci-gal4, UAS-GFP/UAS-Dally, were heat-shocked at 38°C for 1h
and then transferred to 25°C. Wing discs were dissected 72h after clone induction.
The size of clones, visualized by the absence of RFP expression, was quantified
from confocal images with Fiji Software (NIH, USA). Wing discs were also labeled
with DAPI to quantify cell number. At least 30 clones were quantified. Average
values and the corresponding standard deviations were calculated, and a t-test

MATERIAL AND METHODS
143
analysis was carried out. Clones in the three different genotypes were induced and
dissected in parallel, and the same control wing discs (genotype nr 1) were used
in Figures 23 and 40. The average values, the corresponding standard deviations,
and the corresponding p-values are included in the annexes tables.
Flow Cytometry Analysis
Wing imaginal discs of each genotype were dissected in cold PBS, dissociated with
trypsin-EDTA at 32°C for 45 min, and fixed with 4% formaldehyde for 20 min.
Cells were centrifuged at 2,000 rpm for 2 min, resuspended in 1 ml of 70%
ethanol, and incubated for 1 h at room temperature (RT). After centrifugation, the
pellet was resuspended in PBS with DAPI 1 mg/ml and RNase 100 mg/ml and
incubated for 1h at RT. DAPI fluorescence was determined by flow cytometry
using a FacsAria I SORP sorter (Beckton Dickinson, San Jose, California). Excitation
with the blue line of the laser (488 nm) permits the acquisition of scatter
parameters. Blue laser (488 nm) was used for GFP excitation, and a UV laser (350
nm) for DAPI excitation. Doublets were discriminated using an integral/peak dot
plot of DAPI fluorescence. Cell cycle histograms were obtained on each sample
according to the GFP fluorescence, and cell cycle analysis was done on DAPI
fluorescence collected at 440 nm. DNA analysis on single fluorescence histograms
was done using Summit software (Dako Colorado).
pMAD Expression Profile
In order to obtain the pMAD expression profile at the same developmental stage
in all genotypes analyzed, larvae were fed with food complemented with
bromophenol blue (0,2 g in 100 ml of fly food), as described in (Andres and
Thummel, 1994)), and wandering larvae with empty (white) gut, corresponding
to 1–6h before the entry into pupal stage, were used to dissect the wing discs. As
previously described in (Hamaratoglu et al., 2011), all wing discs from a dataset
(GFP control and experimental discs) were fixed and stained together to avoid
variability between discs and mounted on the same slide to reduce potential

MATERIAL AND METHODS
144
variation in thickness between the slide and the coverslip across different
samples. All discs from a dataset were imaged under identical settings using a
Leica SP2 confocal microscope (0.36 μm of step size). Confocal conditions were
adjusted to avoid saturated pixels with maximal intensity. After image acquisition,
four consecutive slices (above and below the brightest slice from each stack) were
manually selected by visual inspection, and a mean projection of these nine slices
was subsequently performed. Using a reduced number of slices and performing
the mean projection allowed us to reduce the noise as well as to avoid the signal
from the peripodial membrane. Indeed, we made sure that these nine slices
contained signal from the columnar cells of the pouch only. All discs were rotated
to have anterior to the left and dorsal upwards orientation. The remaining
analyses were applied solely to the wing pouch. We extracted the profiles along
the anterior–posterior (AP) axis parallel to the dorsal-ventral (DV) boundary in
four different offsets (two in the dorsal compartment and two in the ventral one).
The positioning of the AP boundary was scored by the GFP expression driven by
the gal4 line. To quantify total pMAD signaling of a particular region of interest (A
or P compartments or the whole wing pouch), signal intensities per pixel were
first collected from raw images taken with the same laser confocal conditions
using the histogram function of Fiji Software (NIH, USA). Confocal conditions were
adjusted to avoid saturated pixels with maximal intensity. Total pMAD signaling
per region of interest was quantified as the sum of all pixel intensities. All wing
discs from a dataset (GFP control and experimental discs) were fixed and stained
together. All of the image processing and data extraction were performed using
Fiji Software (NIH, USA). At least five discs per genotype were analyzed. The
average values, the corresponding standard deviations, and the corresponding p-
values are included in the annexes tables.

MATERIAL AND METHODS
145
Fly Food with Varying Concentrations of Yeast
We adapted the food recipe described in (Bass et al., 2007). The following recipes
were used to vary the concentration of yeast: (A) 100 g/L yeast food: 1 liter of
standard fly medium contains 100 g of fresh yeast, 100 g of sucrose, 27 g
bacteriological agar, 3 mL of propionic acid, and 30 mL of nipagin; and (B) 20 g/L
yeast food (starvation): it was generated by reducing the amount of fresh yeast
without altering the other ingredients. Hatched first instar larvae were sorted
from egg laying plates (egg laying period of 8h at 25°C), transferred to tubes with
the different yeast concentration foods and allowed to grow at 25°C to adulthood.
Control animals were analyzed in parallel in each experimental condition.
Statistical Analyses
The average values, the corresponding standard deviations or standard error to
the mean, and the corresponding p-values were calculated using the Microsoft
Excel. In all quantifications, the Student’s t-test (two-tailed) was used to test for
significance. Significance is indicated in the figures using the following symbols:
*p < 0.05, **p < 0.01, ***p < 0.001. Error bars represent either the standard
deviation (in the case of tissue size and cell density measurements) or the
standard error to the mean (in the case of quantification of mitotic figures,
apoptotic cells, and pMAD signal intensity).
Quantification of Pupal Volume
Hatched first instar female larvae were sorted from egg laying plates (egg laying
period of 4h at 25°C), transferred to fresh tubes, allowed to growth at 25°C until
pupa formation to determine pupa volume. For pupal size measurements pictures
were taken with an Olympus MVX10 Macroscope, measures were done using Fiji
Software (NIH, USA), and volume was given by the formula 4/3π(L/2)(l/2)2 (L,
length; l, diameter). The corresponding standard deviation was calculated, and a
t-test analysis was carried out.


BIBLIOGRAPHY


BIBLIOGRAPHY
149
Bibliography
Abrams, J. M. (2002). Competition and compensation: Coupled to death in development and cancer. Cell 110, 403–406.
Adachi-Yamada, T. and O’Connor, M. B. (2002). Morphogenetic Apoptosis: A Mechanism for Correcting Discontinuities in Morphogen Gradients. Dev. Biol. 251, 74–90.
Adachi-Yamada, T., Fujimura-Kamada, K., Nishida, Y. and Matsumoto, K. (1999). Distortion of proximodistal information causes JNK-dependent apoptosis in Drosophila wing. Nature 400, 166–169.
Adams, M. D., Celniker, S. E., Holt, R. a, Evans, C. a, Gocayne, J. D., Amanatides, P. G., Scherer, S. E., Li, P. W., Hoskins, R. a, Galle, R. F., et al. (2000). The genome sequence of Drosophila melanogaster. Science 287, 2185–2195.
Agrawal, N., Joshi, S., Kango, M., Saha, D., Mishra, A. and Sinha, P. (1995). Epithelial Hyperplasia of Imaginal Discs Induced by Mutations in Drosophila Tumor Suppressor Genes: Growth and Pattern Formation in Genetic Mosaics. Dev. Biol. 169, 387–398.
Akiyama, T., Kamimura, K., Firkus, C., Takeo, S., Shimmi, O. and Nakato, H. (2008). Dally regulates Dpp morphogen gradient formation by stabilizing Dpp on the cell surface. Dev. Biol. 313, 408–419.
Alexandre, C., Jacinto, A. and Ingham, P. W. (1996). Transcriptional activation of hedgehog target genes in Drosophila is mediated directly by the Cubitus interruptus protein, a member of the GLI family of zinc finger DNA-binding proteins. Genes Dev. 10, 2003–2013.
Amoyel, M. and Bach, E. a (2014). Cell competition: how to eliminate your neighbours. Development 141, 988–1000.
Andres, A. J. and Thummel, C. S. (1994). Methods for quantitative analysis of transcription in larvae and prepupae. 44, 565–573.
Avruch, J., Long, X., Ortiz-Vega, S., Rapley, J., Papageorgiou, A. and Dai, N. (2009). Amino acid regulation of TOR complex 1. Am. J. … 1, 592–602.
Ayers, K. L., Mteirek, R., Cervantes, a., Lavenant-Staccini, L., Therond, P. P. and Gallet, a. (2012). Dally and Notum regulate the switch between low and high level Hedgehog pathway signalling. Development 139, 3168–3179.
Baena-Lopez, L. a and García-Bellido, a (2006). Control of growth and positional information by the graded vestigial expression pattern in the wing of Drosophila melanogaster. Proc. Natl. Acad. Sci. U. S. A. 103, 13734–13739.
BIBLIOGRAPHY
150
Baena-Lopez, L. A., Rodríguez, I. and Baonza, A. (2008). The tumor suppressor genes dachsous and fat modulate different signalling pathways by regulating dally and dally-like. Proc. Natl. Acad. Sci. U. S. A. 105, 9645–9650.
Baena-Lopez, L. A., Franch-Marro, X. and Vincent, J.-P. (2009). Wingless promotes proliferative growth in a gradient-independent manner. Sci. Signal. 2, ra60.
Ballesteros-Arias, L., Saavedra, V. and Morata, G. (2013). Cell competition may function either as tumour-suppressing or as tumour-stimulating factor in Drosophila. Oncogene 1–8.
Bangi, E. and Wharton, K. (2006a). Dual function of the Drosophila Alk1/Alk2 ortholog Saxophone shapes the Bmp activity gradient in the wing imaginal disc. Development 133, 3295–303.
Bangi, E. and Wharton, K. (2006b). Dpp and Gbb exhibit different effective ranges in the establishment of the BMP activity gradient critical for Drosophila wing patterning. Dev. Biol. 295, 178–193.
Barrio, R. and de Celis, J. F. (2004). Regulation of spalt expression in the Drosophila wing blade in response to the Decapentaplegic signaling pathway. Proc. Natl. Acad. Sci. U. S. A. 101, 6021–6026.
Basler, K. and Struhl, G. (1994). Compartment boundaries and the control of Drosophila limb pattern by hedgehog protein. Nature 368, 208–214.
Bass, T. M., Grandison, R. C., Wong, R., Martinez, P., Partridge, L. and Piper, M. D. W. (2007). Optimization of dietary restriction protocols in Drosophila. J. Gerontol. A. Biol. Sci. Med. Sci. 62, 1071–1081.
Baumgartner, R., Poernbacher, I., Buser, N., Hafen, E. and Stocker, H. (2010). The WW Domain Protein Kibra Acts Upstream of Hippo in Drosophila. Dev. Cell 18, 309–316.
Belenkaya, T. Y., Han, C., Yan, D., Opoka, R. J., Khodoun, M., Liu, H. and Lin, X. (2004). Drosophila Dpp morphogen movement is independent of dynamin-mediated endocytosis but regulated by the glypican members of heparan sulfate proteoglycans. Cell 119, 231–244.
Bennett, F. C. and Harvey, K. F. (2006). Fat Cadherin Modulates Organ Size in Drosophila via the Salvador/Warts/Hippo Signaling Pathway. Curr. Biol. 16, 2101–2110.
Ben-Zvi, D. and Barkai, N. (2010). Scaling of morphogen gradients by an expansion-repression integral feedback control. Proc. Natl. Acad. Sci. U. S. A. 107, 6924–6929.

BIBLIOGRAPHY
151
Ben-Zvi, D., Pyrowolakis, G., Barkai, N. and Shilo, B. Z. (2011). Expansion-repression mechanism for scaling the Dpp activation gradient in drosophila wing imaginal discs. Curr. Biol. 21, 1391–1396.
Bernfield, M., Götte, M., Park, P. W., Reizes, O., Fitzgerald, M. L., Lincecum, J. and Zako, M. (1999). Functions of Cell Surface Heparan sulfate Proteoglycans. Annu. Rev. Biochem. 729–777.
Böhni, R., Riesgo-Escovar, J., Oldham, S., Brogiolo, W., Stocker, H., Andruss, B. F., Beckingham, K. and Hafen, E. (1999). Autonomous Control of Cell and Organ Size by CHICO, a< i> Drosophila</i> Homolog of Vertebrate IRS1--4. Cell 97, 865–875.
Brand, a H. and Perrimon, N. (1993). Targeted gene expression as a means of altering cell fates and generating dominant phenotypes. Development 118, 401–415.
Brodsky, M. H., Nordstrom, W., Tsang, G., Kwan, E., Rubin, G. M. and Abrams, J. M. (2000). Drosophila p53 binds a damage response element at the reaper locus. Cell 101, 103–113.
Bryant, P. and Simpson, P. (1984). Intrinsic and extrinsic control of growth in developing organs. Q. Rev. Biol. 59, 387–415.
Budi, E. H., Muthusamy, B. and Derynck, R. (2015). The insulin response integrates increased TGF- b signaling through Akt-induced enhancement of cell surface delivery of TGF- b receptors. 8, 1–16.
Burke, R. and Basler, K. (1996). Dpp receptors are autonomously required for cell proliferation in the entire developing Drosophila wing. Development 122, 2261–2269.
Butler, M. J., Jacobsen, T. L., Cain, D. M., Jarman, M. G., Hubank, M., Whittle, J. R. S., Phillips, R. and Simcox, A. (2003). Discovery of genes with highly restricted expression patterns in the Drosophila wing disc using DNA oligonucleotide microarrays. Development 130, 659–670.
Campbell, G. and Tomlinson, a (1999). Transducing the Dpp morphogen gradient in the wing of Drosophila: regulation of Dpp targets by brinker. Cell 96, 553–562.
Capdevila, J. and Guerrero, I. (1994). Targeted expression of the signaling molecule decapentaplegic induces pattern duplications and growth alterations in Drosophila wings. EMBO J. 13, 4459–4468.
Chang, C.-H., Qiu, J., O’Sullivan, D., Buck, M. D., Noguchi, T., Curtis, J. D., Chen, Q., Gindin, M., Gubin, M. M., van der Windt, G. J. W., et al. (2015). Metabolic Competition in the Tumor Microenvironment Is a Driver of Cancer Progression. Cell 162, 1229–1241.

BIBLIOGRAPHY
152
Chen, C.-L., Gajewski, K. M., Hamaratoglu, F., Bossuyt, W., Sansores-Garcia, L., Tao, C. and Halder, G. (2010). The apical-basal cell polarity determinant Crumbs regulates Hippo signaling in Drosophila. Proc. Natl. Acad. Sci. U. S. A. 107, 15810–15815.
Cho, E., Feng, Y., Rauskolb, C., Maitra, S., Fehon, R. and Irvine, K. D. (2006). Delineation of a Fat tumor suppressor pathway. Nat. Genet. 38, 1142–1150.
Clavería, C., Giovinazzo, G., Sierra, R. and Torres, M. (2013). Myc-driven endogenous cell competition in the early mammalian embryo. Nature 500, 39–44.
Colombani, J., Andersen, D. S. and Leopold, P. (2012). Secreted Peptide Dilp8 Coordinates Drosophila Tissue Growth with Developmental Timing. Science (80-. ). 336, 582–585.
Colombani, J., Andersen, D. S., Boulan, L., Boone, E., Romero, N., Virolle, V., Texada, M. and Léopold, P. (2015). Drosophila Lgr3 Couples Organ Growth with Maturation and Ensures Developmental Stability. Curr. Biol. 2723–2729.
Crick, F. H. and Lawrence, P. a (1975). Compartments and polyclones in insect development. Science (80-. ). 189, 340–347.
Crickmore, M. a and Mann, R. S. (2006). Hox control of organ size by regulation of morphogen production and mobility. Science 313, 63–68.
Crickmore, M. a and Mann, R. S. (2007). Hox control of morphogen mobility and organ development through regulation of glypican expression. Development 134, 327–334.
Cully, M., You, H., Levine, A. J. and Mak, T. W. (2006). Beyond PTEN mutations: the PI3K pathway as an integrator of multiple inputs during tumorigenesis. Nat. Rev. Cancer 6, 184–192.
Day, S. J. and Lawrence, P. a (2000). Measuring dimensions: the regulation of size and shape. Development 127, 2977–2987.
De Celis, J. F. (2003). Pattern formation in the Drosophila wing: The development of the veins. BioEssays 25, 443–451.
De La Cova, C., Abril, M., Bellosta, P., Gallant, P. and Johnston, L. a. (2004). Drosophila myc regulates organ size by inducing cell competition. Cell 117, 107–116.
de Navas, L. F., Garaulet, D. L. and Sánchez-Herrero, E. (2006). The ultrabithorax Hox gene of Drosophila controls haltere size by regulating the Dpp pathway. Development 133, 4495–4506.

BIBLIOGRAPHY
153
De Nooij, J. C., Letendre, M. A. and Hariharan, I. K. (1996). A cyclin-dependent kinase inhibitor, dacapo, is necessary for timely exit from the cell cycle during Drosophila embryogenesis. Cell 87, 1237–1247.
Dekanty, A., Barrio, L., Muzzopappa, M., Auer, H. and Milán, M. (2012). Aneuploidy-induced delaminating cells drive tumorigenesis in Drosophila epithelia. Proc. Natl. Acad. Sci. U. S. A. 109, 20549–54.
Diaz-Benjumea, F. J. and Cohen, S. M. (1993). Interaction between dorsal and ventral cells in the imaginal disc directs wing development in Drosophila. Cell 75, 741–752.
Diaz-Benjumea, F. J. and Cohen, S. M. (1995). Serrate signals through Notch to establish a Wingless-dependent organizer at the dorsal/ventral compartment boundary of the Drosophila wing. Development 121, 4215–4225.
Diez Del Corral, R., Aroca, P., Gómez-Skarmeta, J. L., Cavodeassi, F. and Modolell, J. (1999). The iroquois homeodomain proteins are required to specify body wall identity in Drosophila. Genes Dev. 13, 1754–1761.
Doherty, D., Feger, G., Younger-Shepherd, S., Jan, L. Y. and Jan, Y. N. (1996). Delta is a ventral to dorsal signal complementary to Serrate, another notch ligand, in Drosophila wing formation. Genes Dev. 10, 421–434.
Dong, J. and Pan, D. (2004). Tsc2 is not a critical target of Akt during normal Drosophila development. Genes Dev. 18, 2479–2484.
Doumpas, N., Ruiz-Romero, M., Blanco, E., Edgar, B., Corominas, M. and Teleman, A. a (2013). Brk regulates wing disc growth in part via repression of Myc expression. EMBO Rep. 14, 261–8.
Du, W. E. I., Vidal, M., Xie, J.-E. and Dyson, N. (1996). RBF, a nove RB-related gene that regulates E2F activvity and interacts with cyclin E in Drosophila. Genes Dev. 10, 1206–1218.
Dynlacht, B. D., Brook, a, Dembski, M., Yenush, L. and Dyson, N. (1994). DNA-binding and trans-activation properties of Drosophila E2F and DP proteins. Proc. Natl. Acad. Sci. U. S. A. 91, 6359–6363.
Edgar, B. a and O’Farrell, P. H. (1989). Genetic control of cell division patterns in the Drosophila embryo. Cell 57, 177–187.
Engelman, J. a, Luo, J. and Cantley, L. C. (2006). The evolution of phosphatidylinositol 3-kinases as regulators of growth and metabolism. Nat. Rev. Genet. 7, 606–619.
Enomoto, M. and Igaki, T. (2012). Src controls tumorigenesis via JNK-dependent regulation of the Hippo pathway in Drosophila. EMBO Rep. 14, 65–72.

BIBLIOGRAPHY
154
Enomoto, M., Vaughen, J. and Igaki, T. (2015). Non-autonomous overgrowth by oncogenic niche cells: cellular cooperation and competition in tumorigenesis. Cancer Sci. n/a–n/a.
Entchev, E. V, Schwabedissen, a and González-Gaitán, M. (2000). Gradient formation of the TGF-beta homolog Dpp. Cell 103, 981–991.
Froldi, F., Ziosi, M., Garoia, F., Pession, A., Grzeschik, N. a, Bellosta, P., Strand, D., Richardson, H. E., Pession, A. and Grifoni, D. (2010). The lethal giant larvae tumour suppressor mutation requires dMyc oncoprotein to promote clonal malignancy. BMC Biol. 8, 33.
Fujise, M., Izumi, S., Selleck, S. B. and Nakato, H. (2001). Regulation of dally, an integral membrane proteoglycan, and its function during adult sensory organ formation of Drosophila. Dev. Biol. 235, 433–448.
Fujise, M., Takeo, S., Kamimura, K., Matsuo, T., Aigaki, T., Izumi, S. and Nakato, H. (2003). Dally regulates Dpp morphogen gradient formation in the Drosophila wing. Development 130, 1515–1522.
Gabay, M., Li, Y. and Felsher, D. W. (2014). MYC activation is a hallmark of cancer initiation and maintenance. Cold Spring Harb. Perspect. Med. 4, 1–14.
Gao, X. and Pan, D. (2001). TSC1 and TSC2 tumor suppressors antagonize insulin signaling in cell growth. Genes Dev. 1383–1392.
Garcia-Bellido, a and Merriam, J. R. (1971). Parameters of the wing imaginal disc development of Drosophila melanogaster. Dev. Biol. 24, 61–87.
Garcia-Bellido, A., Ripoll, P. and Morata, G. (1973). Developmental compartimentalisation of the wing disk of Drosophila. Nat New Biol 245, 251–3.
García-Bellido, a, Cortés, F. and Milán, M. (1994). Cell interactions in the control of size in Drosophila wings. Proc. Natl. Acad. Sci. U. S. A. 91, 10222–10226.
Garelli, a., Gontijo, a. M., Miguela, V., Caparros, E. and Dominguez, M. (2012). Imaginal Discs Secrete Insulin-Like Peptide 8 to Mediate Plasticity of Growth and Maturation. Science (80-. ). 336, 579–582.
Garofalo, R. S. (2002). Genetic analysis of insulin signaling in Drosophila. Trends Endocrinol. Metab. 13, 156–162.
Genevet, A., Wehr, M. C., Brain, R., Thompson, B. J. and Tapon, N. (2010). Kibra Is a Regulator of the Salvador/Warts/Hippo Signaling Network. Dev. Cell 18, 300–308.
BIBLIOGRAPHY
155
Giraldez, A. J. and Cohen, S. M. (2003). Wingless and Notch signaling provide cell survival cues and control cell proliferation during wing development. Development 130, 6533–6543.
Glise, B., Miller, C. a., Crozatier, M., Halbisen, M. a., Wise, S., Olson, D. J., Vincent, A. and Blair, S. S. (2005). Shifted, the Drosophila ortholog of Wnt inhibitory factor-1, controls the distribution and movement of hedgehog. Dev. Cell 8, 255–266.
Goberdhan, D. C. I., Paricio, N., Goodman, E. C., Mlodzik, M. and Wilson, C. (1999). Drosophila tumor suppressor PTEN controls cell size and number by antagonizing the Chico / PI3-kinase signaling pathway. Genes Dev. 3244–3258.
Gonzalez-Gaitan, M. a., Micol, J. L. and Garcia-Bellido, a. (1990). Developmental genetic analysis of Contrabithorax mutations in Drosophila melanogaster. Genetics 126, 139–155.
González-Gaitán, M. and Jäckle, H. (1999). The range of spalt-activating Dpp signalling is reduced in endocytosis-defective Drosophila wing discs. Mech. Dev. 87, 143–151.
Gorfinkiel, N., Sierra, J., Callejo, A., Ibañez, C. and Guerrero, I. (2005). The Drosophila ortholog of the human Wnt inhibitor factor shifted controls the diffusion of lipid-modified hedgehog. Dev. Cell 8, 241–253.
Grewal, S. S. (2009). Insulin/TOR signaling in growth and homeostasis: A view from the fly world. Int. J. Biochem. Cell Biol. 41, 1006–1010.
Grewal, S. S., Li, L., Orian, A., Eisenman, R. N. and Edgar, B. a (2005). Myc-dependent regulation of ribosomal RNA synthesis during Drosophila development. Nat. Cell Biol. 7, 295–302.
Groppe, J., Rumpel, K., Economides, A. N., Stahl, N., Sebald, W. and Affolter, M. (1998). Biochemical and biophysical characterization of refolded Drosophila DPP, a homolog of bone morphogenetic proteins 2 and 4. J. Biol. Chem. 273, 29052–29065.
Grzeschik, N. a., Parsons, L. M., Allott, M. L., Harvey, K. F. and Richardson, H. E. (2010a). Lgl, aPKC, and Crumbs Regulate the Salvador/Warts/Hippo Pathway through Two Distinct Mechanisms. Curr. Biol. 20, 573–581.
Grzeschik, N. a., Parsons, L. M. and Richardson, H. E. (2010b). Lgl, the SWH pathway and tumorigenesis: It’s a matter of context & competition! Cell Cycle 9, 3202–3212.
Hamaratoglu, F., de Lachapelle, A. M., Pyrowolakis, G., Bergmann, S. and Affolter, M. (2011). Dpp signaling activity requires pentagone to scale with tissue size in the growing drosophila wing imaginal disc. PLoS Biol. 9, e1001182.
BIBLIOGRAPHY
156
Hamaratoglu, F., Affolter, M. and Pyrowolakis, G. (2014). Dpp/BMP signaling in flies: From molecules to biology. Semin. Cell Dev. Biol. 32, 128–136.
Han, C., Belenkaya, T. Y., Wang, B. and Lin, X. (2004). Drosophila glypicans control the cell-to-cell movement of Hedgehog by a dynamin-independent process. Development 131, 601–611.
Han, C., Yan, D., Belenkaya, T. Y. and Lin, X. (2005). Drosophila glypicans Dally and Dally-like shape the extracellular Wingless morphogen gradient in the wing disc. Development 132, 667–679.
Hardie, D. G. (2007). AMP-activated/SNF1 protein kinases: conserved guardians of cellular energy. Nat. Rev. Mol. Cell Biol. 8, 774–785.
Harmansa, S., Hamaratoglu, F., Affolter, M. and Caussinus, E. (2015). Dpp spreading is required for medial but not for lateral wing disc growth. Nature 1–18.
Harvey, K. F., Zhang, X. and Thomas, D. M. (2013). The Hippo pathway and human cancer. Nat Rev Cancer 13, 246–257.
Hay, B. a, Wolff, T. and Rubin, G. M. (1994). Expression of baculovirus P35 prevents cell death in Drosophila. Development 120, 2121–2129.
Hayashi, Y., Sexton, T. R., Dejima, K., Perry, D. W., Takemura, M., Kobayashi, S., Nakato, H. and Harrison, D. a. (2012). Glypicans regulate JAK/STAT signaling and distribution of the Unpaired morphogen. Development 139, 4162–4171.
Herranz, H., Weng, R. and Cohen, S. M. (2014). Crosstalk between epithelial and mesenchymal tissues in tumorigenesis and imaginal disc development. Curr. Biol. 24, 1476–1484.
Hietakangas, V. and Cohen, S. M. (2009). Regulation of tissue growth through nutrient sensing. Annu. Rev. Genet. 43, 389–410.
Hogan, C., Dupré-Crochet, S., Norman, M., Kajita, M., Zimmermann, C., Pelling, A. E., Piddini, E., Baena-López, L. A., Vincent, J.-P., Itoh, Y., et al. (2009). Characterization of the interface between normal and transformed epithelial cells. Nat. Cell Biol. 11, 460–467.
Holz, M. K., Ballif, B. A., Gygi, S. P. and Blenis, J. (2005). mTOR and S6K1 mediate assembly of the translation preinitiation complex through dynamic protein interchange and ordered phosphorylation events. Cell 123, 569–580.
Hsiung, F., Ramirez-Weber, F.-A., Iwaki, D. D. and Kornberg, T. B. (2005). Dependence of Drosophila wing imaginal disc cytonemes on Decapentaplegic. Nature 437, 8–11.

BIBLIOGRAPHY
157
Huang, H., Potter, C. J., Tao, W., Li, D., Brogiolo, W. and Hafen, E. (1999). PTEN affects cell size , cell proliferation and apoptosis during Drosophila eye development. 5372, 5365–5372.
Huang, J., Wu, S., Barrera, J., Matthews, K. and Pan, D. (2005). The Hippo signaling pathway coordinately regulates cell proliferation and apoptosis by inactivating Yorkie, the Drosophila homolog of YAP. Cell 122, 421–434.
Huang, Q., Li, F., Liu, X., Li, W., Shi, W., Liu, F.-F., O’Sullivan, B., He, Z., Peng, Y., Tan, A.-C., et al. (2011). Caspase 3–mediated stimulation of tumor cell repopulation during cancer radiotherapy. Nat. Med. 17, 860–866.
Huh, J. R., Guo, M. and Hay, B. A. (2004). Compensatory Proliferation Induced by Cell Death in the Drosophila Wing Disc Requires Activity of the Apical Cell Death Caspase Dronc in a Nonapoptotic Role. Curr. Biol. 14, 1262–1266.
Inoki, K., Li, Y., Xu, T. and Guan, K.-L. (2003a). Rheb GTPase is a direct target of TSC2 GAP activity and regulates mTOR signaling. Genes Dev. 17, 1829–1834.
Inoki, K., Zhu, T. and Guan, K.-L. (2003b). TSC2 mediates cellular energy response to control cell growth and survival. Cell 115, 577–590.
Inoki, K., Corradetti, M. N. and Guan, K.-L. (2005). Dysregulation of the TSC-mTOR pathway in human disease. Nat. Genet. 37, 19–24.
Irvine, K. D. and Vogt, T. F. (1997). Dorsal-ventral signaling in limb development. Curr. Opin. Cell Biol. 9, 867–876.
Ito, N. and Rubin, G. M. (1999). gigas, a Drosophila Homolog of Tuberous Sclerosis Gene Product-2, Regulates the Cell Cycle. Cell 105, 415.
Jackson, S. M., Nakato, H., Sugiura, M., Jannuzi, a, Oakes, R., Kaluza, V., Golden, C. and Selleck, S. B. (1997). dally, a Drosophila glypican, controls cellular responses to the TGF-beta-related morphogen, Dpp. Development 124, 4113–4120.
Jastrzebski, K., Hannan, K. M., Tchoubrieva, E. B., Hannan, R. D. and Pearson, R. B. (2007). Coordinate regulation of ribosome biogenesis and function by the ribosomal protein S6 kinase, a key mediator of mTOR function. Growth Factors 25, 209–226.
Jaźwińska, a, Kirov, N., Wieschaus, E., Roth, S. and Rushlow, C. (1999). The Drosophila gene brinker reveals a novel mechanism of Dpp target gene regulation. Cell 96, 563–573.
Johnston, L. a and Sanders, A. L. (2003). Wingless promotes cell survival but constrains growth during Drosophila wing development. Nat. Cell Biol. 5, 827–833.

BIBLIOGRAPHY
158
Johnston, L. a and Schubiger, G. (1996). Ectopic expression of wingless in imaginal discs interferes with decapentaplegic expression and alters cell determination. Development 122, 3519–3529.
Johnston, L. a., Prober, D. a., Edgar, B. a., Eisenman, R. N. and Gallant, P. (1999). Drosophila myc regulates cellular growth during development. Cell 98, 779–790.
Jünger, M. a, Rintelen, F., Stocker, H., Wasserman, J. D., Végh, M., Radimerski, T., Greenberg, M. E. and Hafen, E. (2003). The Drosophila forkhead transcription factor FOXO mediates the reduction in cell number associated with reduced insulin signaling. J. Biol.
Justice, R. W., Zilian, O., Woods, D. F., Noll, M. and Bryant, P. J. (1995). The Drosophila tumor suppressor gene warts encodes a homolog of human myotonic dystrophy kinase and is required for the control of cell shape and proliferation. Genes Dev. 9, 534–546.
Kajita, M., Hogan, C., Harris, A. R., Dupre-Crochet, S., Itasaki, N., Kawakami, K., Charras, G., Tada, M. and Fujita, Y. (2010). Interaction with surrounding normal epithelial cells influences signalling pathways and behaviour of Src-transformed cells. J. Cell Sci. 123, 171–180.
Kalaany, N. Y. and Sabatini, D. M. (2009). Tumours with PI3K activation are resistant to dietary restriction. Nature 458, 725–731.
Kim, J., Johnson, K., Chen, H. J., Carroll, S. and Laughon, a (1997). Drosophila Mad binds to DNA and directly mediates activation of vestigial by Decapentaplegic. Nature 388, 304–308.
Kim, E., Goraksha-Hicks, P., Li, L., Neufeld, T. P. and Guan, K.-L. (2008). Regulation of TORC1 by Rag GTPases in nutrient response. Nat. Cell Biol. 10, 935–945.
Kirkpatrick, H., Johnson, K. and Laughon, A. (2001). Repression of Dpp Targets by Binding of Brinker to Mad Sites. J. Biol. Chem. 276, 18216–18222.
Kobayashi, T., Minowa, O., Sugitani, Y., Takai, S., Mitani, H., Kobayashi, E., Noda, T. and Hino, O. (2001). A germ-line Tsc1 mutation causes tumor development and embryonic lethality that are similar, but not identical to, those caused by Tsc2 mutation in mice. Proc. Natl. Acad. Sci. U. S. A. 98, 8762–8767.
Kornberg, T., Sidén, I., O’Farrell, P. and Simon, M. (1985). The engrailed locus of Drosophila: in situ localization of transcripts reveals compartment-specific expression. Cell 40, 45–53.
Kramer, J. M., Davidge, J. T., Lockyer, J. M. and Staveley, B. E. (2003). Expression of Drosophila FOXO regulates growth and can phenocopy starvation. BMC Dev. Biol. 3, 5.

BIBLIOGRAPHY
159
Kumar, J. P. and Moses, K. (2001). The EGF receptor and notch signaling pathways control the initiation of the morphogenetic furrow during Drosophila eye development. Development 128, 2689–2697.
Landsberg, K. P., Farhadifar, R., Ranft, J., Umetsu, D., Widmann, T. J., Bittig, T., Said, A., Jülicher, F. and Dahmann, C. (2009). Increased Cell Bond Tension Governs Cell Sorting at the Drosophila Anteroposterior Compartment Boundary. Curr. Biol. 19, 1950–1955.
Lane, M. E., Sauer, K., Wallace, K., Jan, Y. N., Lehner, C. F. and Vaessin, H. (1996). Dacapo, a cyclin-dependent kinase inhibitor, stops cell proliferation during Drosophila development. Cell 87, 1225–1235.
Lecuit, T. and Cohen, S. M. (1998). Dpp receptor levels contribute to shaping the Dpp morphogen gradient in the Drosophila wing imaginal disc. Development 125, 4901–4907.
Lecuit, T., Brook, W. J., Ng, M., Calleja, M., Sun, H. and Cohen, S. M. (1996). Two distinct mechanisms for long-range patterning by Decapentaplegic in the Drosophila wing. Nature 381, 387–393.
Leevers, S. J., Weinkove, D., MacDougall, L. K., Hafen, E. and Waterfield, M. D. (1996). The Drosophila phosphoinositide 3-kinase Dp110 promotes cell growth. EMBO J. 15, 6584–6594.
Levayer, R. and Moreno, E. (2013). Mechanisms of cell competition: Themes and variations. J. Cell Biol. 200, 689–698.
Levine, A. J. (1997). P53, the Cellular Gatekeeper for Growth and Division. Cell 88, 323–331.
Lin, X. and Perrimon, N. (1999). Dally cooperates with Drosophila Frizzled 2 to transduce Wingless signalling. Nature 400, 281–284.
Ling, C., Zheng, Y., Yin, F., Yu, J., Huang, J., Hong, Y., Wu, S. and Pan, D. (2010). The apical transmembrane protein Crumbs functions as a tumor suppressor that regulates Hippo signaling by binding to Expanded. Proc. Natl. Acad. Sci. U. S. A. 107, 10532–10537.
Makhijani, K., Kalyani, C., Srividya, T. and Shashidhara, L. S. (2007). Modulation of Decapentaplegic gradient during haltere specification in Drosophila. Dev. Biol. 302, 243–255.
Martín, F. a and Morata, G. (2006). Compartments and the control of growth in the Drosophila wing imaginal disc. Development 133, 4421–4426.
Martín, F. a, Pérez-Garijo, A., Moreno, E. and Morata, G. (2004). The brinker gradient controls wing growth in Drosophila. Development 131, 4921–4930.

BIBLIOGRAPHY
160
Martín, F. a, Herrera, S. C. and Morata, G. (2009). Cell competition, growth and size control in the Drosophila wing imaginal disc. Development 136, 3747–3756.
Martín-Castellanos, C. and Edgar, B. a (2002). A characterization of the effects of Dpp signaling on cell growth and proliferation in the Drosophila wing. Development 129, 1003–1013.
Martins, V. C., Busch, K., Juraeva, D., Blum, C., Ludwig, C., Rasche, V., Lasitschka, F., Mastitsky, S. E., Brors, B., Hielscher, T., et al. (2014). Cell competition is a tumour suppressor mechanism in the thymus. Nature 509, 465–70.
Mata, J., Curado, S., Ephrussi, a and Rørth, P. (2000). Tribbles coordinates mitosis and morphogenesis in Drosophila by regulating string/CDC25 proteolysis. Cell 101, 511–522.
McBride, A., Ghilagaber, S., Nikolaev, A. and Hardie, D. G. (2009). The Glycogen-Binding Domain on the AMPK β Subunit Allows the Kinase to Act as a Glycogen Sensor. Cell Metab. 9, 23–34.
McCartney, B. M., Kulikauskas, R. M., LaJeunesse, D. R. and Fehon, R. G. (2000). The neurofibromatosis-2 homologue, Merlin, and the tumor suppressor expanded function together in Drosophila to regulate cell proliferation and differentiation. Development 127, 1315–1324.
Menéndez, J., Pérez-Garijo, A., Calleja, M. and Morata, G. (2010). A tumor-suppressing mechanism in Drosophila involving cell competition and the Hippo pathway. Proc. Natl. Acad. Sci. U. S. A. 107, 14651–14656.
Merino, M. M., Rhiner, C., Lopez-gay, J. M., Buechel, D., Hauert, B. and Moreno, E. (2015). Article Elimination of Unfit Cells Maintains Tissue Health and Prolongs Lifespan. Cell 160, 461–476.
Mesquita, D., Dekanty, A. and Milán, M. (2010). A dp53-dependent mechanism involved in coordinating tissue growth in Drosophila. PLoS Biol. 8, e1000566.
Milan, M., Campuzano, S. and GarciaBellido, A. (1996). Cell cycling and patterned cell proliferation in the Drosophila wing during metamorphosis. 93, 11687–11692.
Milan, M., Perez, L. and Cohen, S. M. (2002). Short-range cell interactions and cell survival in the Drosophila wing. Dev. Cell 2, 797–805.
Milán, M. (2002). Survival of the fittest. Cell competition in the Drosophila wing. EMBO Rep. 3, 724–725.
Milán, M., Campuzano, S. and García-Bellido, a (1996). Cell cycling and patterned cell proliferation in the wing primordium of Drosophila. Proc. Natl. Acad. Sci. U. S. A. 93, 640–645.
BIBLIOGRAPHY
161
Milán, M., Campuzano, S. and García-Bellido, a (1997). Developmental parameters of cell death in the wing disc of Drosophila. Proc. Natl. Acad. Sci. U. S. A. 94, 5691–5696.
Milán, M., Weihe, U., Pérez, L. and Cohen, S. M. (2001). The LRR proteins Capricious and Tartan mediate cell interactions during DV boundary formation in the Drosophila wing. Cell 106, 785–794.
Minami, M., Kinoshita, N., Kamoshida, Y., Tanimoto, H. and Tabata, T. (1999). brinker is a target of Dpp in Drosophila that negatively regulates Dpp-dependent genes. Nature 398, 242–246.
Mirantes, C., Eritja, N., Dosil, M. A., Santacana, M., Pallares, J., Gatius, S., Bergadà, L., Maiques, O., Matias-Guiu, X. and Dolcet, X. (2013). An inducible knockout mouse to model the cell-autonomous role of PTEN in initiating endometrial, prostate and thyroid neoplasias. Dis. Model. Mech. 6, 710–20.
Morata, G. and Ripoll, P. (1975). Minutes: mutants of drosophila autonomously affecting cell division rate. Dev. Biol. 42, 211–221.
Moreno, E. (2008). Is cell competition relevant to cancer? Nat. Rev. Cancer 8, 141–147.
Moreno, E. and Basler, K. (2004). dMyc transforms cells into super-competitors. Cell 117, 117–129.
Moreno, E., Basler, K. and Morata, G. (2002). Cells compete for decapentaplegic survival factor to prevent apoptosis in Drosophila wing development. Nature 416, 755–759.
Moser, M. and Campbell, G. (2005). Generating and interpreting the Brinker gradient in the Drosophila wing. Dev. Biol. 286, 647–658.
Müller, B., Hartmann, B., Pyrowolakis, G., Affolter, M. and Basler, K. (2003). Conversion of an extracellular Dpp/BMP morphogen gradient into an inverse transcriptional gradient. Cell 113, 221–233.
Müller, P., Rogers, K. W., Yu, S. R., Brand, M. and Schier, A. F. (2013). Morphogen transport. Development 140, 1621–38.
Nakae, J., Kido, Y. and Accili, D. (2001). Distinct and overlapping functions of insulin and IGF-I receptors. Endocr. Rev. 22, 818–835.
Nakato, H., Futch, T. a and Selleck, S. B. (1995). The division abnormally delayed (dally) gene: a putative integral membrane proteoglycan required for cell division patterning during postembryonic development of the nervous system in Drosophila. Development 121, 3687–3702.

BIBLIOGRAPHY
162
Nakato, H., Fox, B. and Selleck, S. B. (2002). dally, a Drosophila member of the glypican family of integral membrane proteoglycans, affects cell cycle progression and morphogenesis via a Cyclin A-mediated process. J. Cell Sci. 115, 123–30.
Nellen, D., Burke, R., Struhl, G. and Basler, K. (1996). Direct and Long-Range Action of a DPP Morphogen Gradient. Cell 85, 357–368.
Neto-Silva, R. M., de Beco, S. and Johnston, L. a. (2010). Evidence for a growth-stabilizing regulatory feedback mechanism between Myc and Yorkie, the drosophila homolog of Yap. Dev. Cell 19, 507–520.
Neufeld, T. P. (2003). Body building: Regulation of shape and size by PI3K/TOR signaling during development. Mech. Dev. 120, 1283–1296.
Neufeld, T. P., de la Cruz, a F., Johnston, L. a and Edgar, B. a (1998). Coordination of growth and cell division in the Drosophila wing. Cell 93, 1183–93.
Neumann, C. and Cohen, S. (1997). Morphogens and pattern formation. Bioessays 19, 721–729.
Ng, M., Diaz-Benjumea, F. J., Vincent, J. P., Wu, J. and Cohen, S. M. (1996). Specification of the wing by localized expression of wingless protein. Nature 381, 316–318.
Nolo, R., Morrison, C. M., Tao, C., Zhang, X. and Halder, G. (2006). The bantam MicroRNA Is a Target of the Hippo Tumor-Suppressor Pathway. Curr. Biol. 16, 1895–1904.
Norman, M., Wisniewska, K., Lawrenson, K., Garcia-Miranda, P., Tada, M., Kajita, M., Mano, H., Ishikawa, S., Ikegawa, M., Shimada, T., et al. (2012). Loss of Scribble causes cell competition in mammalian cells. J. Cell Sci.
Nowak, K., Seisenbacher, G., Hafen, E. and Stocker, H. (2013). Nutrient restriction enhances the proliferative potential of cells lacking the tumor suppressor PTEN in mitotic tissues. Elife 2013, e00380–e00380.
Oliver, E. R., Saunders, T. L., Tarlé, S. a and Glaser, T. (2004). Ribosomal protein L24 defect in belly spot and tail (Bst), a mouse Minute. Development 131, 3907–3920.
Pallares-Cartes, C., Cakan-Akdogan, G. and Teleman, A. a. (2012). Tissue-Specific Coupling between Insulin/IGF and TORC1 Signaling via PRAS40 in Drosophila. Dev. Cell 22, 172–182.
Parker, J. (2011). Morphogens, nutrients, and the basis of organ scaling. Evol. Dev. 13, 304–314.

BIBLIOGRAPHY
163
Parker, J. and Struhl, G. (2015). Scaling the Drosophila Wing: TOR-Dependent Target Gene Access by the Hippo Pathway Transducer Yorkie. PLOS Biol. 13, e1002274.
Pérez-Garijo, A., Martín, F. a and Morata, G. (2004). Caspase inhibition during apoptosis causes abnormal signalling and developmental aberrations in Drosophila. Development 131, 5591–5598.
Pérez-Garijo, A., Fuchs, Y. and Steller, H. (2013). Apoptotic cells can induce non-autonomous apoptosis through the TNF pathway. Elife 2013, e01004.
Potter, C. J., Huang, H. and Xu, T. (2001). Drosophila Tsc1 functions with Tsc2 to antagonize insulin signaling in regulating cell growth, cell proliferation, and organ size. Cell 105, 357–368.
Potter, C. J., Pedraza, L. G. and Xu, T. (2002). Akt regulates growth by directly phosphorylating Tsc2. Nat. Cell Biol. 4, 658–665.
Puig, O., Marr, M. T. M., Ruhf, M. L. and Tjian, R. (2003). Control of cell number by Drosophila FOXO : downstream and feedback regulation of the insulin receptor pathway. Genes Dev. 17, 2006–2020.
Pyrowolakis, G., Hartmann, B., Müller, B., Basler, K. and Affolter, M. (2004). A simple molecular complex mediates widespread BMP-induced repression during Drosophila development. Dev. Cell 7, 229–240.
Reiter, L. T. and Bier, E. (2002). Using Drosophila melanogaster to uncover human disease gene function and potential drug target proteins. Expert Opin. Ther. Targets 6, 387–399.
Restrepo, S., Zartman, J. J. and Basler, K. (2014). Coordination of patterning and growth by the morphogen DPP. Curr. Biol. 24, R245–R255.
Riley, M. a and Wertz, J. E. (2002). Bacteriocins: evolution, ecology, and application. Annu. Rev. Microbiol. 56, 117–137.
Robinson, B. S., Huang, J., Hong, Y. and Moberg, K. H. (2010). Crumbs Regulates Salvador/Warts/Hippo Signaling in Drosophila via the FERM-Domain Protein Expanded. Curr. Biol. 20, 582–590.
Rodrigues, a. B., Zoranovic, T., Ayala-Camargo, a., Grewal, S., Reyes-Robles, T., Krasny, M., Wu, D. C., Johnston, L. a. and Bach, E. a. (2012). Activated STAT regulates growth and induces competitive interactions independently of Myc, Yorkie, Wingless and ribosome biogenesis. Development 139, 4051–4061.
Rogulja, D. and Irvine, K. D. (2005). Regulation of cell proliferation by a morphogen gradient. Cell 123, 449–461.

BIBLIOGRAPHY
164
Rogulja, D., Rauskolb, C. and Irvine, K. D. (2008). Morphogen Control of Wing Growth through the Fat Signaling Pathway. Dev. Cell 15, 309–321.
Roy, S., Hsiung, F. and Kornberg, T. B. (2011). Specificity of Drosophila Cytonemes for Distinct Signaling Pathways. Science (80-. ). 332, 354–359.
Ruberte, E., Marty, T., Nellen, D., Affolter, M. and Basler, K. (1995). An absolute requirement for both the type II and type I receptors, punt and thick veins, for dpp signaling in vivo. Cell 80, 889–897.
Ryoo, H. D., Gorenc, T. and Steller, H. (2004). Apoptotic cells can induce compensatory cell proliferation through the JNK and the wingless signaling pathways. Dev. Cell 7, 491–501.
Sancak, Y., Thoreen, C. C., Peterson, T. R., Lindquist, R. a., Kang, S. a., Spooner, E., Carr, S. a. and Sabatini, D. M. (2007). PRAS40 Is an Insulin-Regulated Inhibitor of the mTORC1 Protein Kinase. Mol. Cell 25, 903–915.
Sancak, Y., Peterson, T. R., Shaul, Y. D., Lindquist, R. A., Thoreen, C. C., Bar-Peled, L. and Sabatini, D. M. (2008). The Rag GTPases bind raptor and mediate amino acid signaling to mTORC1. Science (80-. ). 320, 1496–1501.
Sancho, M., Di-Gregorio, A., George, N., Pozzi, S., Sánchez, J., Pernaute, B. and Rodríguez, T. (2013). Competitive interactions eliminate unfit embryonic stem cells at the onset of differentiation. Dev. Cell 26, 19–30.
Saucedo, L. J., Gao, X., Chiarelli, D. a, Li, L., Pan, D. and Edgar, B. a (2003a). Rheb promotes cell growth as a component of the insulin/TOR signalling network. Nat. Cell Biol. 5, 566–571.
Saucedo, L. J., Gao, X., Chiarelli, D. A., Li, L., Pan, D. and Edgar, B. A. (2003b). Rheb promotes cell growth as a component of the insulin/TOR signalling network. Nat Cell Biol 5, 566–571.
Schleich, S. and Teleman, A. a. (2009). Akt phosphorylates both Tsc1 and Tsc2 in drosophila, but neither phosphorylation is required for normal animal growth. PLoS One 4,.
Schwank, G. and Basler, K. (2010). Regulation of organ growth by morphogen gradients. Cold Spring Harb. Perspect. Biol. 2, a001669.
Schwank, G., Restrepo, S. and Basler, K. (2008). Growth regulation by Dpp: an essential role for Brinker and a non-essential role for graded signaling levels. Development 135, 4003–4013.
Schwank, G., Tauriello, G., Yagi, R., Kranz, E., Koumoutsakos, P. and Basler, K. (2011). Antagonistic Growth Regulation by Dpp and Fat Drives Uniform Cell Proliferation. Dev. Cell 20, 123–130.

BIBLIOGRAPHY
165
Serrano, N. and O’Farrell, P. H. (1997). Limb morphogenesis: connections between patterning and growth. Curr. Biol. 7, R186–R195.
Shraiman, B. I. (2005). Mechanical feedback as a possible regulator of tissue growth. Proc. Natl. Acad. Sci. U. S. A. 102, 3318–3323.
Simpson, P. (1979). Parameters of cell competition in the compartments of the wing disc of Drosophila. Dev. Biol. 69, 182–193.
Simpson, P. and Morata, G. (1981). Differential mitotic rates and patterns of growth in compartments in the Drosophila wing. Dev. Biol. 85, 299–308.
Smith, E. M., Finn, S. G., Tee, A. R., Brownei, G. J. and Proud, C. G. (2005). The tuberous sclerosis protein TSC2 is not required for the regulation of the mammalian target of rapamycin by amino acids and certain cellular stresses. J. Biol. Chem. 280, 18717–18727.
Steller, H. (2008). Regulation of apoptosis in Drosophila. Cell Death Differ. 15, 1132–1138.
Stocker, H., Radimerski, T., Schindelholz, B., Wittwer, F., Belawat, P., Daram, P., Breuer, S., Thomas, G. and Hafen, E. (2003). Rheb is an essential regulator of S6K in controlling cell growth in Drosophila. Nat. Cell Biol. 5, 559–565.
Straßburger, K., Tiebe, M., Pinna, F., Breuhahn, K. and Teleman, A. a. (2012). Insulin/IGF signaling drives cell proliferation in part via Yorkie/YAP. Dev. Biol. 367, 187–196.
Strigini, M. and Cohen, S. M. (1997). A Hedgehog activity gradient contributes to AP axial patterning of the Drosophila wing. Development 124, 4697–4705.
Struhl, G. and Basler, K. (1993). Organizing activity of wingless protein in Drosophila. Cell 72, 527–540.
Takino, K., Ohsawa, S. and Igaki, T. (2014). Loss of Rab5 drives non-autonomous cell proliferation through TNF and Ras signaling in Drosophila. Dev. Biol. 395, 19–28.
Tamori, Y., Bialucha, C. U., Tian, A. G., Kajita, M., Huang, Y. C., Norman, M., Harrison, N., Poulton, J., Ivanovitch, K., Disch, L., et al. (2010). Involvement of Lgl and Mahjong/VprBP in Cell Competition. PLoS Biol. 8, 1–10.
Taniguchi, C. M., Emanuelli, B. and Kahn, C. R. (2006). Critical nodes in signalling pathways: insights into insulin action. Nat. Rev. Mol. Cell Biol. 7, 85–96.
BIBLIOGRAPHY
166
Tapon, N., Ito, N., Dickson, B. J., Treisman, J. E. and Hariharan, I. K. (2001). The Drosophila tuberous sclerosis complex gene homologs restrict cell growth and cell proliferation. Cell 105, 345–355.
Tapon, N., Harvey, K. F., Bell, D. W., Wahrer, D. C. R., Schiripo, T. a., Haber, D. a. and Hariharan, I. K. (2002). salvador promotes both cell cycle exit and apoptosis in Drosophila and is mutated in human cancer cell lines. Cell 110, 467–478.
Tee, A. R., Manning, B. D., Roux, P. P., Cantley, L. C. and Blenis, J. (2003). Tuberous sclerosis complex gene products, Tuberin and Hamartin, control mTOR signaling by acting as a GTPase-activating protein complex toward Rheb. Curr. Biol. 13, 1259–1268.
Teleman, a a and Cohen, S. M. (2000). Dpp gradient formation in the Drosophila wing imaginal disc. Cell 103, 971–980.
Teleman, A. a., Hietakangas, V., Sayadian, A. C. and Cohen, S. M. (2008). Nutritional Control of Protein Biosynthetic Capacity by Insulin via Myc in Drosophila. Cell Metab. 7, 21–32.
Thompson, B. J. and Cohen, S. M. (2006). The Hippo Pathway Regulates the bantam microRNA to Control Cell Proliferation and Apoptosis in Drosophila. Cell 126, 767–774.
Tiebe, M., Lutz, M., De La Garza, A., Buechling, T., Boutros, M. and Teleman, A. A. (2015). REPTOR and REPTOR-BP Regulate Organismal Metabolism and Transcription Downstream of TORC1. Dev. Cell 33, 272–284.
Tsuda, M., Kamimura, K., Nakato, H., Archer, M., Staatz, W., Fox, B., Humphrey, M., Olson, S., Futch, T., Kaluza, V., et al. (1999). The cell-surface proteoglycan Dally regulates Wingless signalling in Drosophila. Nature 400, 276–280.
Tsuneizumi, K., Nakayama, T., Kamoshida, Y., Kornberg, T. B., Christian, J. L. and Tabata, T. (1997). Daughters against dpp modulates dpp organizing activity in Drosophila wing development. Nature 389, 627–631.
Tyler, D. M., Li, W., Zhuo, N., Pellock, B. and Baker, N. E. (2007). Genes Affecting Cell Competition in Drosophila. Genetics 175, 643–657.
Udan, R. S., Kango-Singh, M., Nolo, R., Tao, C. and Halder, G. (2003). Hippo promotes proliferation arrest and apoptosis in the Salvador/Warts pathway. Nat. Cell Biol. 5, 914–920.
Vallejo, D. M., Juarez-Carreño, S., Bolivar, J., Morante, J. and Dominguez, M. (2015). A brain circuit that synchronizes growth and maturation revealed through Dilp8 binding to Lgr3. Science (80-. ). 1–16.
BIBLIOGRAPHY
167
Vander Haar, E., Lee, S.-I., Bandhakavi, S., Griffin, T. J. and Kim, D.-H. (2007). Insulin signalling to mTOR mediated by the Akt/PKB substrate PRAS40. Nat. Cell Biol. 9, 316–323.
Vidal, M., Larson, D. E. and Cagan, R. L. (2006). Csk-Deficient Boundary Cells Are Eliminated from Normal Drosophila Epithelia by Exclusion, Migration, and Apoptosis. Dev. Cell 10, 33–44.
Vuilleumier, R., Springhorn, A., Patterson, L., Koidl, S., Hammerschmidt, M., Affolter, M. and Pyrowolakis, G. (2010). Control of Dpp morphogen signalling by a secreted feedback regulator. Nat. Cell Biol. 12, 611–617.
Wang, S. H., Simcox, A. and Campbell, G. (2000). Dual role for Drosophila epidermal growth factor receptor signaling in early wing disc development. Genes Dev. 14, 2271–2276.
Wang, X., Li, W., Williams, M., Terada, N., Alessi, D. R. and Proud, C. G. (2001). Regulation of elongation factor 2 kinase by p90(RSK1) and p70 S6 kinase. Eur. Mol. Biol. Organ. J. 20, 4370–4379.
Wartlick, O., Mumcu, P., Kicheva, a, Bittig, T., Seum, C., Jülicher, F. and González-Gaitán, M. (2011a). Dynamics of Dpp signaling and proliferation control. Science 331, 1154–1159.
Wartlick, O., Mumcu, P., Jülicher, F. and Gonzalez-Gaitan, M. (2011b). Understanding morphogenetic growth control - lessons from flies. Nat. Rev. Mol. Cell Biol. 12, 594–604.
Weigmann, K., Cohen, S. M. and Lehner, C. F. (1997). Cell cycle progression, growth and patterning in imaginal discs despite inhibition of cell division after inactivation of Drosophila Cdc2 kinase. Development 124, 3555–3563.
Winter, S. E. and Campbell, G. (2004). Repression of Dpp targets in the Drosophila wing by Brinker. Development 131, 6071–6081.
Wu, Q. and Brown, M. R. (2006). Signaling and function of insulin-like peptides in insects. Annu. Rev. Entomol. 51, 1–24.
Wu, J. and Cohen, S. M. (2002). Repression of Teashirt marks the initiation of wing development. Development 129, 2411–2418.
Wu, S., Huang, J., Dong, J. and Pan, D. (2003). hippo encodes a Ste-20 family protein kinase that restricts cell proliferation and promotes apoptosis in conjunction with salvador and warts. Cell 114, 445–456.
Xu, T. and Rubin, G. M. (1993). Analysis of genetic mosaics in developing and adult Drosophila tissues. Development 117, 1223–1237.
Yan, D. and Lin, X. (2009). Shaping morphogen gradients by proteoglycans. Cold Spring Harb. Perspect. Biol. 1, a002493.

BIBLIOGRAPHY
168
Yu, J., Zheng, Y., Dong, J., Klusza, S., Deng, W. M. and Pan, D. (2010). Kibra Functions as a Tumor Suppressor Protein that Regulates Hippo Signaling in Conjunction with Merlin and Expanded. Dev. Cell 18, 288–299.
Yuan, T. L. and Cantley, L. C. (2008). PI3K pathway alterations in cancer: variations on a theme. Oncogene 27, 5497–5510.
Zecca, M. and Struhl, G. (2002a). Control of growth and patterning of the Drosophila wing imaginal disc by EGFR-mediated signaling. Development 129, 1369–1376.
Zecca, M. and Struhl, G. (2002b). Subdivision of the Drosophila wing imaginal disc by EGFR-mediated signaling. Development 129, 1357–1368.
Zecca, M., Basler, K. and Struhl, G. (1995). Sequential organizing activities of engrailed, hedgehog and decapentaplegic in the Drosophila wing. Development 121, 2265–2278.
Zecca, M., Basler, K. and Struhl, G. (1996). Direct and long-range action of a wingless morphogen gradient. Cell 87, 833–844.
Zhang, H., Stallock, J. P., Ng, J. C., Reinhard, C. and Neufeld, T. P. (2000). Regulation of cellular growth by the Drosophila target of rapamycin dTOR. Genes Dev. 14, 2712–2724.
Zhang, Y., Gao, X., Saucedo, L. J., Ru, B., Edgar, B. A. and Pan, D. (2003). Rheb is a direct target of the tuberous sclerosis tumour suppressor proteins. Nat Cell Biol 5, 578–581.
Zhang, Y., You, J., Ren, W. and Lin, X. (2013). Drosophila glypicans Dally and Dally-like are essential regulators for JAK/STAT signaling and Unpaired distribution in eye development. Dev. Biol. 375, 23–32.
Zhao, M., Szafranski, P., Hall, C. A. and Goode, S. (2008). Basolateral junctions utilize warts signaling to control epithelial-mesenchymal transition and proliferation crucial for migration and invasion of drosophila ovarian epithelial cells. Genetics 178, 1947–1971.
Zhao, B., Tumaneng, K. and Guan, K.-L. (2011). The Hippo pathway in organ size control, tissue regeneration and stem cell self-renewal. Nat. Cell Biol. 13, 877–883.
Zhou, S., Lo, W. C., Suhalim, J. L., Digman, M. a., Gratton, E., Nie, Q. and Lander, A. D. (2012). Free extracellular diffusion creates the Dpp morphogen gradient of the Drosophila wing disc. Curr. Biol. 22, 668–675.
Ziosi, M., Baena-López, L. A., Grifoni, D., Froldi, F., Pession, A., Garoia, F., Trotta, V., Bellosta, P., Cavicchi, S. and Pession, A. (2010). dMyc Functions Downstream of Yorkie to Promote the Supercompetitive Behavior of Hippo Pathway Mutant Cells. PLoS Genet. 6, e1001140.

SUPPORTING TABLES


SUPPORTING TABLES
171
Supporting Tables
Table 1. Quantitative measurements regarding Figure 15. Tissue size values of whole wings (total) and its anterior and posterior compartments of flies expressing Dp110, PTENRNAi or Rheb transgenes in the nub domain measured as a ratio (in percentage) with respect to control wings expressing GFP in the same domain. Cell density values of both anterior and posterior compartments measured as a ratio (in percentage) with respect to control wings expressing GFP in the same domains. These values correspond to the average of 10 adult wings with their corresponding standard deviations. A t-test was carried out to calculate the p-value as a measurement of the statistical significance of the difference between transgene expressing and GFP expressing wings. Total, anterior and posterior areas were significantly increased. Cell density values were significantly reduced in both compartments.
AREA (% CONTROL) ± STD DEV
Genotype Total p-value Anterior p-value Posterior p-value
nub>GFP 100 ± 1,0 - 100 ± 1,9 - 100 ± 2,1 -
nub>Dp110 136 ± 6,4 10-12 142 ± 6,5 10-13 129 ± 2,0 10-11
nub>PTENRNAi 126 ± 3,7 10-15 125 ± 3,3 10-15 127 ± 4,2 10-14
nub>Rheb 109 ± 6,7 10-4 110 ± 1,8 10-5 107 ± 2,6 0,02
CELL DENSITY (% CONTROL) ± STD DEV
Genotype Anterior p-value Posterior p-value
nub>GFP 100 ± 5,9 - 100 ± 2,4 -
nub>Dp110 94 ± 5,7 0,03 93 ± 6,8 0,004
nub>PTENRNAi 90 ± 2,5 10-4 88 ± 4,0 10-7
nub>Rheb 90 ± 11,3 0,02 95 ± 7,2 0,04

SUPPORTING TABLES
172
AREA (% CONTROL) ± STD DEV
Genotype Total p-value Anterior p-value Posterior p-value
ci>GFP 100 ± 2,5 - 100 ± 3,5 - 100 ± 2,9 -
ci>Dp110 93 ± 2,8 10-5 113 ± 3,9 10-7 77 ± 3,0 10-12
ci>PTENRNAi 96 ± 4,5 0,03 118 ± 4,7 10-10 77 ± 4,9 10-12
ci>Rheb 96 ± 4,4 0,02 114 ± 6,2 10-6 80 ± 3,8 10-10
CELL DENSITY (% CONTROL) ± STD DEV
Genotype Anterior p-value Posterior p-value
ci>GFP 100 ± 3,2 - 100 ± 5,5 -
ci>Dp110 97 ± 5,3 0,1 123 ± 6,4 10-8
ci>PTENRNAi 91 ± 3,3 10-6 126 ± 4,4 10-9
ci>Rheb 82 ± 4,1 10-9 114 ± 4,1 10-6
Table 2. Quantitative measurements regarding Figure 16. Tissue size values of whole wings (total) and its anterior and posterior compartments of flies expressing Dp110, PTENRNAi or Rheb transgenes in the ci domain measured as a ratio (in percentage) with respect to control wings expressing GFP in the same domain. Cell density values of both anterior and posterior compartments measured as a ratio (in percentage) with respect to control wings expressing GFP in the same domain. These values correspond to the average of 10 adult wings with their corresponding standard deviations. A t-test was carried out to calculate the p-value as a measurement of the statistical significance of the difference between transgene expressing and GFP expressing wings. Total and anterior were significantly increased while posterior areas were significantly reduced. Cell density values were significantly increased in the transgene non-expressing compartment.
AREA (% CONTROL) ± STD DEV
Genotype Total p-value Anterior p-value Posterior p-value
en>GFP 100 ± 3,8 - 100 ± 4,1 - 100 ± 2,8 -
en>Dp110 115 ± 4,0 10-9 90 ± 2,7 10-8 138 ± 5,6 10-14
en>PTENRNAi 110 ± 3,5 10-6 89 ± 4,6 10-6 129 ± 4,2 10-14
en>Rheb 115 ± 3,9 10-8 84 ± 5,8 10-7 139 ± 4,3 10-15
CELL DENSITY (% CONTROL) ± STD DEV
Genotype Anterior p-value Posterior p-value
en>GFP 100 ± 6,4 - 100 ± 4,1 -
en>Dp110 118 ± 5,1 10-7 84 ± 3,0 10-9
en>PTENRNAi 113 ± 4,0 10-5 87 ± 1,6 10-8
en>Rheb 111 ± 2,8 10-4 71 ± 2,7 10-13
Table 3. Quantitative measurements regarding Figure 17. Tissue size values of whole wings (total) and its anterior and posterior compartments of flies expressing Dp110, PTENRNAi or Rheb transgenes in the en domain measured as a ratio (in percentage) with respect to control wings expressing GFP in the same domain. Cell density values of both anterior and posterior compartments measured as a ratio (in percentage) with respect to control wings expressing GFP in the same domain. These values correspond to the average of 10 adult wings with their corresponding standard deviations. A t-test was carried out to calculate the p-value as a measurement of the statistical significance of the difference between transgene expressing and GFP expressing wings. Total and posterior were significantly increased while anterior areas were significantly reduced. Cell density values were significantly increased in the transgene non-expressing compartment.
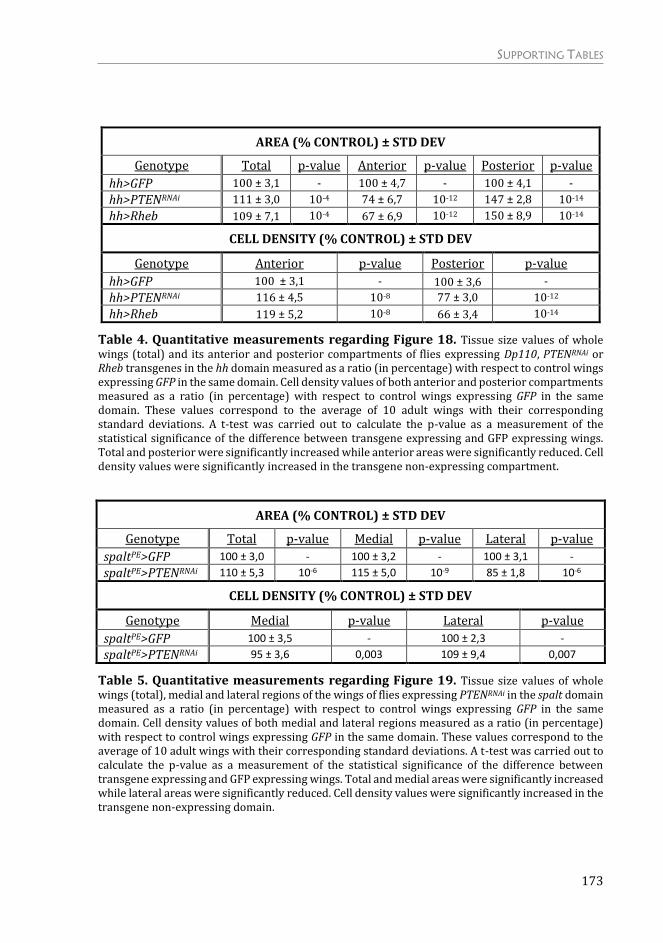
SUPPORTING TABLES
173
AREA (% CONTROL) ± STD DEV
Genotype Total p-value Anterior p-value Posterior p-value
hh>GFP 100 ± 3,1 - 100 ± 4,7 - 100 ± 4,1 -
hh>PTENRNAi 111 ± 3,0 10-4 74 ± 6,7 10-12 147 ± 2,8 10-14
hh>Rheb 109 ± 7,1 10-4 67 ± 6,9 10-12 150 ± 8,9 10-14
CELL DENSITY (% CONTROL) ± STD DEV
Genotype Anterior p-value Posterior p-value
hh>GFP 100 ± 3,1 - 100 ± 3,6 -
hh>PTENRNAi 116 ± 4,5 10-8 77 ± 3,0 10-12
hh>Rheb 119 ± 5,2 10-8 66 ± 3,4 10-14
Table 4. Quantitative measurements regarding Figure 18. Tissue size values of whole wings (total) and its anterior and posterior compartments of flies expressing Dp110, PTENRNAi or Rheb transgenes in the hh domain measured as a ratio (in percentage) with respect to control wings expressing GFP in the same domain. Cell density values of both anterior and posterior compartments measured as a ratio (in percentage) with respect to control wings expressing GFP in the same domain. These values correspond to the average of 10 adult wings with their corresponding standard deviations. A t-test was carried out to calculate the p-value as a measurement of the statistical significance of the difference between transgene expressing and GFP expressing wings. Total and posterior were significantly increased while anterior areas were significantly reduced. Cell density values were significantly increased in the transgene non-expressing compartment.
Table 5. Quantitative measurements regarding Figure 19. Tissue size values of whole wings (total), medial and lateral regions of the wings of flies expressing PTENRNAi in the spalt domain measured as a ratio (in percentage) with respect to control wings expressing GFP in the same domain. Cell density values of both medial and lateral regions measured as a ratio (in percentage) with respect to control wings expressing GFP in the same domain. These values correspond to the average of 10 adult wings with their corresponding standard deviations. A t-test was carried out to calculate the p-value as a measurement of the statistical significance of the difference between transgene expressing and GFP expressing wings. Total and medial areas were significantly increased while lateral areas were significantly reduced. Cell density values were significantly increased in the transgene non-expressing domain.
AREA (% CONTROL) ± STD DEV
Genotype Total p-value Medial p-value Lateral p-value
spaltPE>GFP 100 ± 3,0 - 100 ± 3,2 - 100 ± 3,1 -
spaltPE>PTENRNAi 110 ± 5,3 10-6 115 ± 5,0 10-9 85 ± 1,8 10-6
CELL DENSITY (% CONTROL) ± STD DEV
Genotype Medial p-value Lateral p-value
spaltPE>GFP 100 ± 3,5 - 100 ± 2,3 -
spaltPE>PTENRNAi 95 ± 3,6 0,003 109 ± 9,4 0,007

SUPPORTING TABLES
174
AREA (% CONTROL) ± STD DEV
Genotype Total p-value Anterior p-value Posterior p-value
ci>GFP 100 ± 2,5 - 100 ± 3,5 - 100 ± 2,9 -
ci>GFP, stg:cycE 98 ± 4,6 0,2 95 ± 4,7 0,005 102 ± 4,8 0,2
CELL DENSITY (% CONTROL) ± STD DEV
Genotype Anterior p-value Posterior p-value
ci>GFP 100 ± 3,2 - 100 ± 5,5 -
ci>GFP, stg:cycE 139 ± 7,1 10-11 100 ± 6,9 0,9
Table 6. Quantitative measurements regarding Figure 20. Tissue size values of whole wings (total), anterior and posterior compartments of the wing of flies expressing stg:cycE in the ci domain measured as a ratio (in percentage) with respect to control wings expressing GFP in the same domain. Cell density values of both anterior and posterior compartments measured as a ratio (in percentage) with respect to control wings expressing GFP in the same domain. These values correspond to the average of 10 adult wings with their corresponding standard deviations. A t-test was carried out to calculate the p-value as a measurement of the statistical significance of the difference between transgene expressing and GFP expressing wings. Anterior area was significantly reduced while total and posterior areas were unchanged. Cell density values were significantly increased in the transgene expressing domain.
AREA (a.u.) ± STD DEV
Genotype Hours AEL
Anterior p-
value Posterior
p-value
ci>GFP 72h
8182410 ± 2962836 - 3503880 ± 1415256 -
ci>Dp110 8917929 ± 1891782 0,53 2425304 ± 564358 0,05
ci>Rheb 9159519 ± 2152243 0,35 3311393 ± 780111 0,68
ci>GFP 96h
34534581 ± 8828190 - 17853186 ± 4972073 -
ci>Dp110 54019999 ± 7312248 10-11 14733415 ± 1903948 0,005
ci>Rheb 37851396 ± 7855633 0,17 14055889 ± 2426341 0,001
ci>GFP 140h
88998852 ± 20829964 - 53998521 ± 12343187 -
ci>Dp110 149811761 ± 30924178 10-10 43848257 ± 8465028 0,002
ci>Rheb 123603449 ± 17092310 10-5 39487669 ± 8321698 0,002
Table 7. Quantitative measurements regarding Figure 22. Tissue size values (in arbitrary units) of anterior and posterior compartments of the wing imaginal discs of flies expressing GFP, Dp110 and Rheb in the ci domain in three different time points during development. These values correspond to the average of ≥ 15 wing imaginal discs per genotype and per time point with their corresponding standard deviations. A t-test was carried out to calculate the p-value as a measurement of the statistical significance of the difference between transgene expressing and GFP expressing discs. The nonautonomous reduction in tissue size is already statistically significant at 96h AEL.

SUPPORTING TABLES
175
CLONE AREA (a.u.) ± STD DEV
Genotype Anterior p-value Posterior p-value
ci>GFP 388 ± 141 - 348 ± 140 -
ci>GFP, Dp110 587 ± 249 10-4 114 ± 67 10-13
NUMBER OF CELLS/CLONE ± STD DEV
Genotype Anterior p-value Posterior p-value
ci>GFP 20 ± 7 - 23 ± 7 -
ci>GFP, Dp110 23 ± 8 0,21 9 ± 4 10-14
Table 8. Quantitative measurements regarding Figure 23. Size values (in arbitrary units) and number of cells of wild type clones in anterior and posterior compartments of wing imaginal discs of flies expressing GFP and Dp110 in the ci domain. Clones were generated at the beginning of the third instar period and quantified 72h later in late third instar wing discs. These values correspond to the average of ≥ 30 clones with their corresponding standard deviations. A t-test was carried out to calculate the p-value as a measurement of the statistical significance of the difference between transgene expressing and GFP expressing discs. Clonal size and number of cells/clone values were significantly increased and decrease respectively in the transgene nonexpressing domain.
MITOTIC FIGURES/AREA (A.U.) ± STD DEV
Genotype Anterior p-value Posterior p-value
ci>GFP 3,397 ± 0,001 - 4,358 ± 0,001 -
ci>GFP, Rheb 3,276 ± 0,001 0,7 4,626 ± 0,001 0,6
ci>GFP, Dp110 2,954 ± 0,001 0,2 3,711 ± 0,001 0,2
Genotype Anterior p-value Posterior p-value
en>GFP 6,542 ± 0,001 - 6,495 ± 0,002 -
en>GFP, Rheb 5,260 ± 0,001 0,02 5,204 ± 0,001 0,08
en>GFP, Dp110 8,135 ± 0,001 0,06 7,555 ± 0,001 0,07
Table 9. Quantitative measurements regarding Figure 24. Mitotic figures/area (in arbitrary units) in anterior and posterior compartments of wing imaginal discs of flies expressing GFP, Rheb or Dp110 in the ci or en domains. A t-test was carried out to calculate the p-value as a measurement of the statistical significance of the difference between transgene expressing and GFP expressing discs. No significant changes were observed.

SUPPORTING TABLES
176
PUPAL VOLUME (% CONTROL) ± STD DEV
Genotype Pupal Volume p-value
ci>GFP 100 ± 13,4 -
ci>GFP, Rheb 86 ± 8,7 0,01
ci>GFP, Dp110 109 ± 15,2 0,2 ci>GFP, PTENRNAi 93 ± 15,4 0,3
Genotype Pupal Volume p-value
en>GFP 100 ± 4,3 -
en>GFP, Rheb 105 ± 5,5 0,3
en>GFP, Dp110 112 ± 13,9 0,2
en>GFP, PTENRNAi 101 ± 13,2 0,8
Table 10. Quantitative measurements regarding Figure 27. Pupa volume values of animals expressing Rheb, Dp110 or PTENRNAi either with ci-gal4 or en-gal4 driver measured as a ratio (in percentage) with respect to controls expressing GFP in the same domain. These values correspond to the average of at least 10 pupae with their corresponding standard deviations. A t-test was carried out to calculate the p-value as a measurement of the statistical significance of the difference between transgene expressing and GFP expressing animals. No significant changes were observed.
APOPTOTIC CELLS (A.U.) ± STD DEV
Genotype Anterior p-value Posterior p-value
ci>GFP 4,4 ± 4,2 - 5,5 ± 4,7 -
ci>GFP, Rheb 72,0 ± 26,5 10-10 2,0 ± 1,7 0,02
ci>GFP, Dp110 91,4 ± 25,4 10-12 5,5 ± 3,4 0,98
Table 11. Quantitative measurements regarding Figure 28. Absolute number of apoptotic cells in anterior and posterior compartments of wing imaginal discs of flies expressing GFP, Rheb or Dp110 in the ci domain. A t-test was carried out to calculate the p-value as a measurement of the statistical significance of the difference between transgene expressing and GFP expressing discs. No significant changes were observed in the nonautonomous domain.
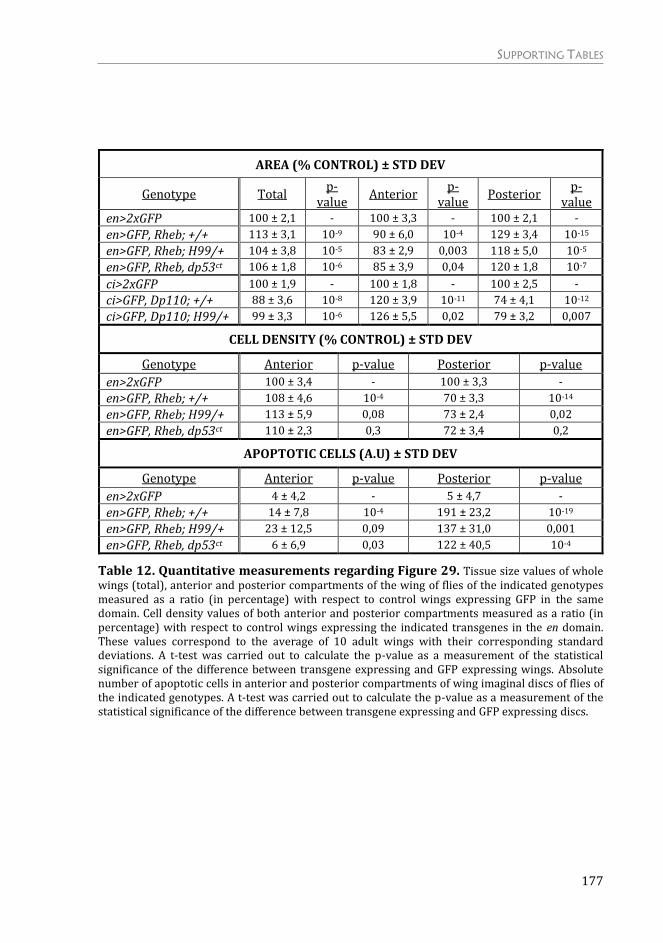
SUPPORTING TABLES
177
AREA (% CONTROL) ± STD DEV
Genotype Total p-
value Anterior
p-value
Posterior p-
value en>2xGFP 100 ± 2,1 - 100 ± 3,3 - 100 ± 2,1 -
en>GFP, Rheb; +/+ 113 ± 3,1 10-9 90 ± 6,0 10-4 129 ± 3,4 10-15
en>GFP, Rheb; H99/+ 104 ± 3,8 10-5 83 ± 2,9 0,003 118 ± 5,0 10-5
en>GFP, Rheb, dp53ct 106 ± 1,8 10-6 85 ± 3,9 0,04 120 ± 1,8 10-7
ci>2xGFP 100 ± 1,9 - 100 ± 1,8 - 100 ± 2,5 -
ci>GFP, Dp110; +/+ 88 ± 3,6 10-8 120 ± 3,9 10-11 74 ± 4,1 10-12
ci>GFP, Dp110; H99/+ 99 ± 3,3 10-6 126 ± 5,5 0,02 79 ± 3,2 0,007
CELL DENSITY (% CONTROL) ± STD DEV
Genotype Anterior p-value Posterior p-value
en>2xGFP 100 ± 3,4 - 100 ± 3,3 -
en>GFP, Rheb; +/+ 108 ± 4,6 10-4 70 ± 3,3 10-14
en>GFP, Rheb; H99/+ 113 ± 5,9 0,08 73 ± 2,4 0,02
en>GFP, Rheb, dp53ct 110 ± 2,3 0,3 72 ± 3,4 0,2
APOPTOTIC CELLS (A.U) ± STD DEV
Genotype Anterior p-value Posterior p-value
en>2xGFP 4 ± 4,2 - 5 ± 4,7 -
en>GFP, Rheb; +/+ 14 ± 7,8 10-4 191 ± 23,2 10-19
en>GFP, Rheb; H99/+ 23 ± 12,5 0,09 137 ± 31,0 0,001
en>GFP, Rheb, dp53ct 6 ± 6,9 0,03 122 ± 40,5 10-4
Table 12. Quantitative measurements regarding Figure 29. Tissue size values of whole wings (total), anterior and posterior compartments of the wing of flies of the indicated genotypes measured as a ratio (in percentage) with respect to control wings expressing GFP in the same domain. Cell density values of both anterior and posterior compartments measured as a ratio (in percentage) with respect to control wings expressing the indicated transgenes in the en domain. These values correspond to the average of 10 adult wings with their corresponding standard deviations. A t-test was carried out to calculate the p-value as a measurement of the statistical significance of the difference between transgene expressing and GFP expressing wings. Absolute number of apoptotic cells in anterior and posterior compartments of wing imaginal discs of flies of the indicated genotypes. A t-test was carried out to calculate the p-value as a measurement of the statistical significance of the difference between transgene expressing and GFP expressing discs.

SUPPORTING TABLES
178
AREA (% CONTROL) ± STD DEV
Genotype Total p-
value Anterior
p-value
Posterior p-
value en>2xGFP 100 ± 1,5 - 100 ± 2,6 - 100 ± 1,3 -
en>GFP, Rheb 118 ± 3,1 10-12 91 ± 2,0 10-7 142 ± 4,7 10-16
en>p35, Rheb 97 ± 14,4 10-4 69 ± 15,8 10-4 121 ± 13,9 10-4
CELL DENSITY (% CONTROL) ± STD DEV
Genotype Anterior p-value Posterior p-value
en>2xGFP 100 ± 2,2 - 100 ± 4,6 -
en>GFP, Rheb 113 ± 3,1 10-9 68 ± 3,3 10-13
en>p35, Rheb 121 ± 8,2 0,01 84 ± 7,3 10-6
MITOTIC FIGURES/AREA (A.U.) ± STD DEV
Genotype Anterior p-value Posterior p-value
en>2xGFP 6,542 ± 0,001 - 6,495 ± 0,002 -
en>GFP, Rheb 5,260 ± 0,001 0,02 5,204 ± 0,001 0,08
en>p35, Rheb 9,6 ± 0,002 0,002 8,4 ± 0,002 0,05
en>GFP, Dp110 8,135 ± 0,001 0,06 7,555 ± 0,001 0,07
en>p35, Dp110 10,6 ± 0,002 10-4 9,8 ± 0,003 0,04
Table 13. Quantitative measurements regarding Figure 30. Tissue size values of whole wings (total), anterior and posterior compartments of the wing of flies of the indicated genotypes measured as a ratio (in percentage) with respect to control wings expressing GFP in the en domain. Cell density values of both anterior and posterior compartments measured as a ratio (in percentage) with respect to control wings expressing the indicated transgenes in the en domain. These values correspond to the average of 10 adult wings with their corresponding standard deviations. Number of mitotic figures/area in anterior and posterior compartments of wing imaginal discs of flies of the indicated genotypes. A t-test was carried out to calculate the p-value as a measurement of the statistical significance of the difference between transgene expressing and GFP expressing discs.
AREA (% CONTROL) ± STD DEV
Genotype Yeast Total p-
value Anterior
p-value
Posterior p-
value ci>2xGFP
100 g/L
100 ± 2,4 - 100 ± 2,9 - 100 ± 2,2 -
ci>GFP, Rheb 95 ± 6,0 0,02 116 ± 6,7 10-6 78 ± 6,0 10-8
en>2xGFP 100 ± 5,9 - 100 ± 5,5 - 100 ± 6,7 -
en>GFP, PTENRNAi 118 ± 4,3 10-7 82 ± 4,1 10-7 149 ± 5,8 10-12
ci>2xGFP
20 g/L
100 ± 2,1 - 100 ± 3,3 - 100 ± 1,6 -
ci>GFP, Rheb 101 ± 7,7 0,7 115 ± 6,3 10-5 90 ± 9,2 0,004
en>2xGFP 100 ± 6,3 - 100 ± 5,0 - 100 ± 17,3 -
en>GFP, PTENRNAi 124 ± 6,7 0,01 81 ± 6,1 0,02 159 ± 8,0 10-5
Table 14. Quantitative measurements regarding Figure 31. Tissue size values of whole wings (total), anterior and posterior compartments of the wing of flies of the indicated genotypes measured as a ratio (in percentage) with respect to control wings expressing GFP in the ci or en domains in animals raised in food with two different concentrations of yeast. These values correspond to the average of 10 adult wings with their corresponding standard deviations.

SUPPORTING TABLES
179
P-MAD INTENSITY (A.U.) ± STD DEV
Genotype Anterior p-value Posterior p-value
ci>2xGFP 4607545 ± 543956 - 2833571 ± 367250 -
ci>GFP, Dp110 5304664 ± 744489 0,1 1160516 ± 183531 10-6
ci>2xGFP 2182006 ± 467961 - 1064266 ± 208610 -
ci>GFP, Rheb 2116653 ± 306063 0,8 604659 ± 48722 10-5
en>2xGFP 3457660 ± 718594 - 2623238 ± 597625 -
en>GFP, PTENRNAi 2563141 ± 327462 0,05 3198569 ± 704604 0,2
Table 15. Quantitative measurements regarding Figure 33. P-MAD intensity values, in arbitrary units, of anterior and posterior compartments of the wing imaginal discs of the indicated genotypes. These values correspond to the average of at least 5 wing discs with their corresponding standard deviations. Note reduced p-MAD intensity in the nonautonomous compartments.
P-MAD INTENSITY (A.U.) ± STD DEV
Genotype Wing pouch p-value
nub>GFP 6292233 ± 907108 -
nub> Dp110 6502790 ± 339713 0,6
Table 16. Quantitative measurements regarding Figure 34. P-MAD intensity values, in arbitrary units, of the wing pouch region of imaginal discs of the indicated genotypes. These values correspond to the average of at least 5 wing discs with their corresponding standard deviations. No statistical significance between control and experiment was observed.
AREA (a.u.) ± STD DEV
Genotype Anterior p-value Posterior p-value
ci>2xGFP 88998852 ± 20829964
- 53998521 ± 12343187
-
ci>GFP, Dp110 149811761 ±
30924178 10-10
43848257 ± 8465028
0,002
ci>GFP, DppRNAi 51455732 ±
9535773 -
22527304 ± 4171354
-
ci>Dp110, DppRNAi 96182227 ± 24732022
10-7 29010165 ±
6287990 0,002
Table 17. Quantitative measurements regarding Figure 36. Tissue size values (in arbitrary units) of anterior and posterior compartments of the wing imaginal discs of late third wing imaginal discs expressing GFP or Dp110 in the ci domain in the presence or absence of Dpp. These values correspond to the average of ≥ 15 wing imaginal discs per genotype with their corresponding standard deviations. A t-test was carried out to calculate the p-value as a measurement of the statistical significance of the difference between Dp110-expressing discs and its corresponding controls. Note that, in the absence of Dpp, the nonautonomous compartment no longer reduces its size.
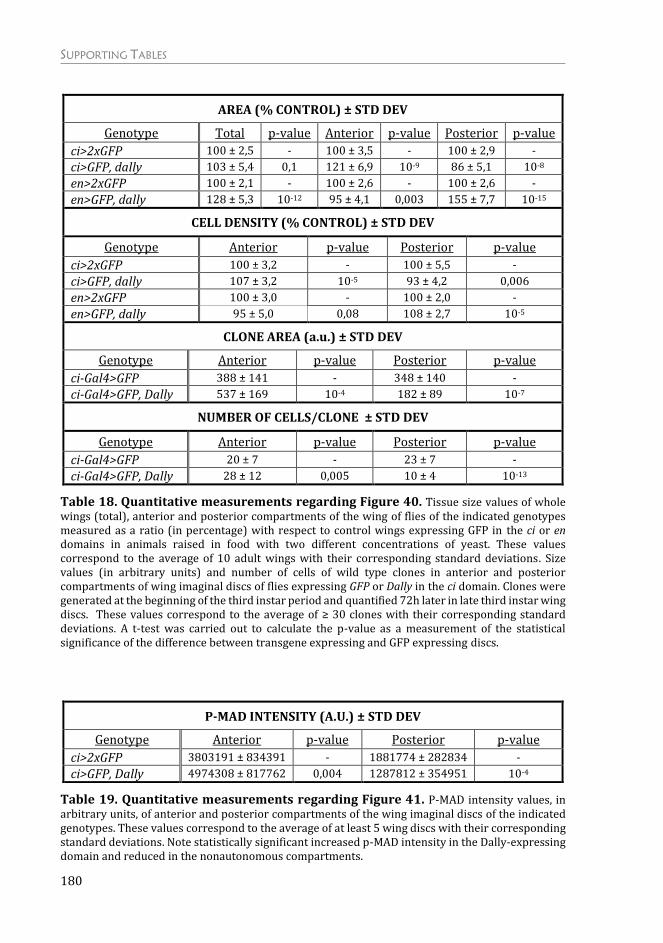
SUPPORTING TABLES
180
AREA (% CONTROL) ± STD DEV
Genotype Total p-value Anterior p-value Posterior p-value
ci>2xGFP 100 ± 2,5 - 100 ± 3,5 - 100 ± 2,9 -
ci>GFP, dally 103 ± 5,4 0,1 121 ± 6,9 10-9 86 ± 5,1 10-8
en>2xGFP 100 ± 2,1 - 100 ± 2,6 - 100 ± 2,6 -
en>GFP, dally 128 ± 5,3 10-12 95 ± 4,1 0,003 155 ± 7,7 10-15
CELL DENSITY (% CONTROL) ± STD DEV
Genotype Anterior p-value Posterior p-value
ci>2xGFP 100 ± 3,2 - 100 ± 5,5 -
ci>GFP, dally 107 ± 3,2 10-5 93 ± 4,2 0,006
en>2xGFP 100 ± 3,0 - 100 ± 2,0 -
en>GFP, dally 95 ± 5,0 0,08 108 ± 2,7 10-5
CLONE AREA (a.u.) ± STD DEV
Genotype Anterior p-value Posterior p-value
ci-Gal4>GFP 388 ± 141 - 348 ± 140 -
ci-Gal4>GFP, Dally 537 ± 169 10-4 182 ± 89 10-7
NUMBER OF CELLS/CLONE ± STD DEV
Genotype Anterior p-value Posterior p-value
ci-Gal4>GFP 20 ± 7 - 23 ± 7 -
ci-Gal4>GFP, Dally 28 ± 12 0,005 10 ± 4 10-13
Table 18. Quantitative measurements regarding Figure 40. Tissue size values of whole wings (total), anterior and posterior compartments of the wing of flies of the indicated genotypes measured as a ratio (in percentage) with respect to control wings expressing GFP in the ci or en domains in animals raised in food with two different concentrations of yeast. These values correspond to the average of 10 adult wings with their corresponding standard deviations. Size values (in arbitrary units) and number of cells of wild type clones in anterior and posterior compartments of wing imaginal discs of flies expressing GFP or Dally in the ci domain. Clones were generated at the beginning of the third instar period and quantified 72h later in late third instar wing discs. These values correspond to the average of ≥ 30 clones with their corresponding standard deviations. A t-test was carried out to calculate the p-value as a measurement of the statistical significance of the difference between transgene expressing and GFP expressing discs.
P-MAD INTENSITY (A.U.) ± STD DEV
Genotype Anterior p-value Posterior p-value
ci>2xGFP 3803191 ± 834391 - 1881774 ± 282834 -
ci>GFP, Dally 4974308 ± 817762 0,004 1287812 ± 354951 10-4
Table 19. Quantitative measurements regarding Figure 41. P-MAD intensity values, in arbitrary units, of anterior and posterior compartments of the wing imaginal discs of the indicated genotypes. These values correspond to the average of at least 5 wing discs with their corresponding standard deviations. Note statistically significant increased p-MAD intensity in the Dally-expressing domain and reduced in the nonautonomous compartments.

SUPPORTING TABLES
181
AREA (% CONTROL) ± STD DEV
Genotype Total p-value Anterior p-value Posterior p-value
ci>2xGFP 100 ± 2,5 - 100 ± 3,5 - 100 ± 2,9 -
ci>GFP, Dp110 91 ± 4,1 10-6 112 ± 5,3 10-7 74 ± 3,2 10-16
ci>Dp110, dally 102 ± 5,0 10-5 139 ± 8,6 10-8 70 ± 3,2 0,02
ci>GFP, PTENRNAi 90 ± 4,8 10-6 107 ± 5,1 0,001 74 ± 4,7 10-16
ci>PTENRNAi, dally 94 ± 7,5 0,1 127 ± 6,4 10-6 63 ± 8,6 0,002
CELL DENSITY (% CONTROL) ± STD DEV
Genotype Anterior p-value Posterior p-value
ci>2xGFP 100 ± 3,2 - 100 ± 5,5 -
ci>GFP, Dp110 88 ± 5,3 10-4 120 ± 6,4 10-7
ci>Dp110, dally 91 ± 5,8 0,2 119 ± 10,3 0,7
ci>GFP, PTENRNAi 91 ± 3,3 10-6 126 ± 4,4 10-9
ci>PTENRNAi, dally 95 ± 4,5 0,06 121 ± 9,9 0,2
Table 20. Quantitative measurements regarding Figure 43. Tissue size values of whole wings (total), anterior and posterior compartments of the wing of flies of the indicated genotypes measured as a ratio (in percentage) with respect to control wings expressing GFP in the ci domain. Cell density values of both anterior and posterior compartments measured as a ratio (in percentage) with respect to control wings expressing the indicated transgenes in the ci domain. These values correspond to the average of 10 adult wings with their corresponding standard deviations. A t-test was carried out to calculate the p-value as a measurement of the statistical significance.
AREA (% CONTROL) ± STD DEV
Genotype Total p-value Anterior p-value Posterior p-value
ci>2xGFP 100 ± 1,9 - 100 ± 2,9 - 100 ± 2,0 -
ci>GFP, dallyRNAi 92 ± 1,9 10-9 82 ± 1,7 10-14 98 ± 2,8 0,08
en>2xGFP 100 ± 1,8 - 100 ± 2,7 - 100 ± 3,4 -
en>GFP, dallyRNAi 86 ± 1,5 10-14 97 ± 2,4 0,03 76 ± 2,0 10-14
CELL DENSITY (% CONTROL) ± STD DEV
Genotype Anterior p-value Posterior p-value
ci>2xGFP 100 ± 2,8 - 100 ± 4,2 -
ci>GFP, dallyRNAi 89 ± 6,1 10-5 104 ± 5,9 0,1
en>2xGFP 100 ± 2,9 - 100 ± 2,4 -
en>GFP, dallyRNAi 105 ± 4,5 0,01 94 ± 5,3 0,007
Table 21. Quantitative measurements regarding Figure 44. Tissue size values of whole wings (total), anterior and posterior compartments of the wing of flies of the indicated genotypes measured as a ratio (in percentage) with respect to control wings expressing GFP in the same domain. Cell density values of both anterior and posterior compartments measured as a ratio (in percentage) with respect to control wings expressing the indicated transgenes in the same domain. These values correspond to the average of 10 adult wings with their corresponding standard deviations. A t-test was carried out to calculate the p-value as a measurement of the statistical significance.

SUPPORTING TABLES
182
AREA (% CONTROL) ± STD DEV
Genotype Total p-value Anterior p-value Posterior p-value
ci>2xGFP 100 ± 1,9 - 100 ± 2,9 - 100 ± 2,0 -
ci>GFP, Rheb 93 ± 4,0 10-5 118 ± 4,6 10-9 77 ± 4,5 10-12
ci>Rheb, dallyRNAi 95 ± 2,5 0,1 104 ± 5,5 10-6 90 ± 4,2 10-6
en>2xGFP 100 ± 1,8 - 100 ± 2,7 - 100 ± 3,4 -
en>GFP, Rheb 101 ± 4,3 0,7 71 ± 4,7 10-12 128 ± 5,0 10-11
en>Rheb, dallyRNAi 100 ± 5,2 0,9 94 ± 7,7 10-7 106 ± 14,4 10-4
ci>2xGFP 100 ± 2,5 - 100 ± 3,0 - 100 ± 3,7 -
ci>GFP, Dp110 92 ± 5,0 10-4 116 ± 4,8 10-8 77 ± 6,2 10-9
ci>Dp110, dallyRNAi 89 ± 2,6 0,05 92 ± 3,4 10-10 86 ± 3,6 10-4
CELL DENSITY (% CONTROL) ± STD DEV
Genotype Anterior p-value Posterior p-value
ci>2xGFP 100 ± 2,8 - 100 ± 4,2 -
ci>GFP, Rheb 84 ± 3,0 10-9 118 ± 5,1 10-7
ci>Rheb, dallyRNAi 80 ± 3,7 10-11 121 ± 4,5 10-9
en>2xGFP 100 ± 2,9 - 100 ± 2,4 -
en>GFP, Rheb 122 ± 6,7 10-8 59 ± 3,8 10-16
en>Rheb, dallyRNAi 115 ± 10,1 0,09 81 ± 14,5 10-4
ci>2xGFP 100 ± 4,0 - 100 ± 3,6 -
ci>GFP, Dp110 81 ± 4,0 10-9 122 ± 5,6 10-9
ci>Dp110, dallyRNAi 87 ± 4,6 0,01 122 ± 7,9 0,9
Table 22. Quantitative measurements regarding Figure 45. Tissue size values of whole wings (total), anterior and posterior compartments of the wing of flies of the indicated genotypes measured as a ratio (in percentage) with respect to control wings expressing GFP in the same domain. Cell density values of both anterior and posterior compartments measured as a ratio (in percentage) with respect to control wings expressing the indicated transgenes in the same domain. These values correspond to the average of 10 adult wings with their corresponding standard deviations. A t-test was carried out to calculate the p-value as a measurement of the statistical significance.
P-MAD INTENSITY (A.U.) ± STD DEV
Genotype Anterior p-value Posterior p-value
ci>GFP, Dp110 2479183 ± 497488 - 709408 ± 143401 -
ci>Dp110, dallyRNAi 1864771 ± 754103 0,2 892940 ± 334898 0,3
Table 23. Quantitative measurements regarding Figure 46. P-MAD intensity values, in arbitrary units, of anterior and posterior compartments of the wing imaginal discs of the indicated genotypes. These values correspond to the average of at least 5 wing discs with their corresponding standard deviations. A t-test was carried out to calculate the p-value as a measurement of the statistical significance.

SUPPORTING TABLES
183
AREA (% CONTROL) ± STD DEV
Genotype Total p-value Anterior p-value Posterior p-value
en>2xGFP
100 ± 3,8 - 100 ± 2,8 - 100 ± 4,1 -
en>GFP, PTENRNAi
116 ± 3,2 10-9 139 ± 3,5 10-17 88 ± 2,8 10-7
en>PTENRNAi, sulfatelessRNAi
67 ± 5,3 10-17 39 ± 5,8 10-22 98 ± 5,6 10-5
Table 24. Quantitative measurements regarding Figure 47. Tissue size values of whole wings (total), anterior and posterior compartments of the wing of flies of the indicated genotypes measured as a ratio (in percentage) with respect to control wings expressing GFP in the en domain. These values correspond to the average of 10 adult wings with their corresponding standard deviations. A t-test was carried out to calculate the p-value as a measurement of the statistical significance.
AREA (% CONTROL) ± STD DEV
Genotype Total p-
value Anterior
p-value
Posterior p-
value ci>2xGFP 100 ± 3,1 - 100 ± 2,8 - 100 ± 2,7 -
ci>GFP, sulfatelessRNAi 79 ± 6,1 10-9 51 ± 4,8 10-17 103 ± 6,9 0,3
en>2xGFP 100 ± 2,1 - 100 ± 2,6 - 100 ± 2,6 -
en>GFP, sulfatelessRNAi 77 ± 2,8 10-16 108 ± 4,1 10-5 47 ± 3,0 10-22
Table 25. Quantitative measurements regarding Figure 48. Tissue size values of whole wings (total), anterior and posterior compartments of the wing of flies of the indicated genotypes measured as a ratio (in percentage) with respect to control wings expressing GFP in the en domain. These values correspond to the average of 10 adult wings with their corresponding standard deviations. A t-test was carried out to calculate the p-value as a measurement of the statistical significance.
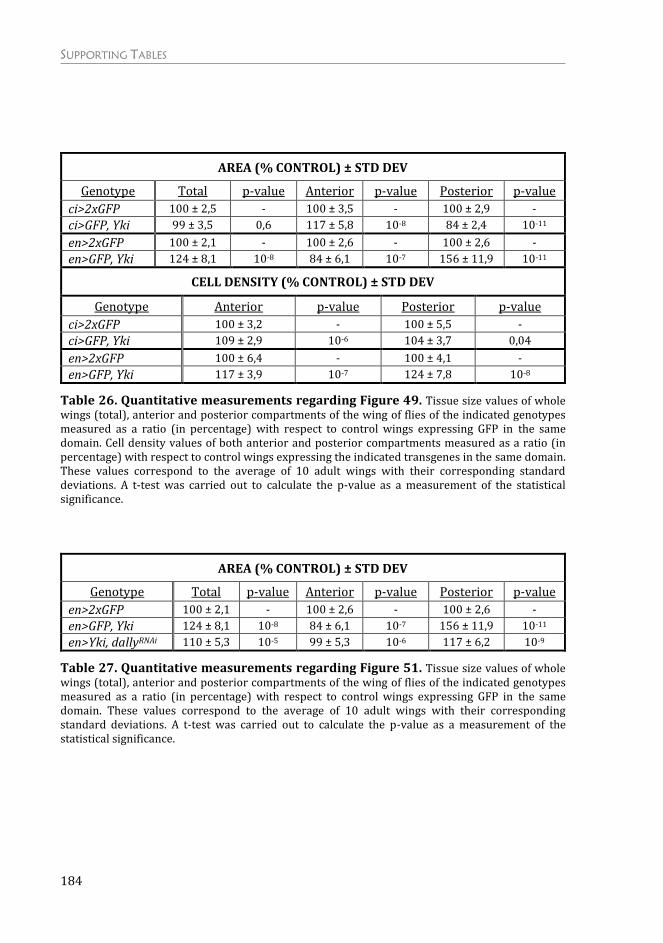
SUPPORTING TABLES
184
AREA (% CONTROL) ± STD DEV
Genotype Total p-value Anterior p-value Posterior p-value
ci>2xGFP 100 ± 2,5 - 100 ± 3,5 - 100 ± 2,9 -
ci>GFP, Yki 99 ± 3,5 0,6 117 ± 5,8 10-8 84 ± 2,4 10-11
en>2xGFP 100 ± 2,1 - 100 ± 2,6 - 100 ± 2,6 -
en>GFP, Yki 124 ± 8,1 10-8 84 ± 6,1 10-7 156 ± 11,9 10-11
CELL DENSITY (% CONTROL) ± STD DEV
Genotype Anterior p-value Posterior p-value
ci>2xGFP 100 ± 3,2 - 100 ± 5,5 -
ci>GFP, Yki 109 ± 2,9 10-6 104 ± 3,7 0,04
en>2xGFP 100 ± 6,4 - 100 ± 4,1 -
en>GFP, Yki 117 ± 3,9 10-7 124 ± 7,8 10-8
Table 26. Quantitative measurements regarding Figure 49. Tissue size values of whole wings (total), anterior and posterior compartments of the wing of flies of the indicated genotypes measured as a ratio (in percentage) with respect to control wings expressing GFP in the same domain. Cell density values of both anterior and posterior compartments measured as a ratio (in percentage) with respect to control wings expressing the indicated transgenes in the same domain. These values correspond to the average of 10 adult wings with their corresponding standard deviations. A t-test was carried out to calculate the p-value as a measurement of the statistical significance.
AREA (% CONTROL) ± STD DEV
Genotype Total p-value Anterior p-value Posterior p-value
en>2xGFP 100 ± 2,1 - 100 ± 2,6 - 100 ± 2,6 -
en>GFP, Yki 124 ± 8,1 10-8 84 ± 6,1 10-7 156 ± 11,9 10-11
en>Yki, dallyRNAi 110 ± 5,3 10-5 99 ± 5,3 10-6 117 ± 6,2 10-9
Table 27. Quantitative measurements regarding Figure 51. Tissue size values of whole wings (total), anterior and posterior compartments of the wing of flies of the indicated genotypes measured as a ratio (in percentage) with respect to control wings expressing GFP in the same domain. These values correspond to the average of 10 adult wings with their corresponding standard deviations. A t-test was carried out to calculate the p-value as a measurement of the statistical significance.
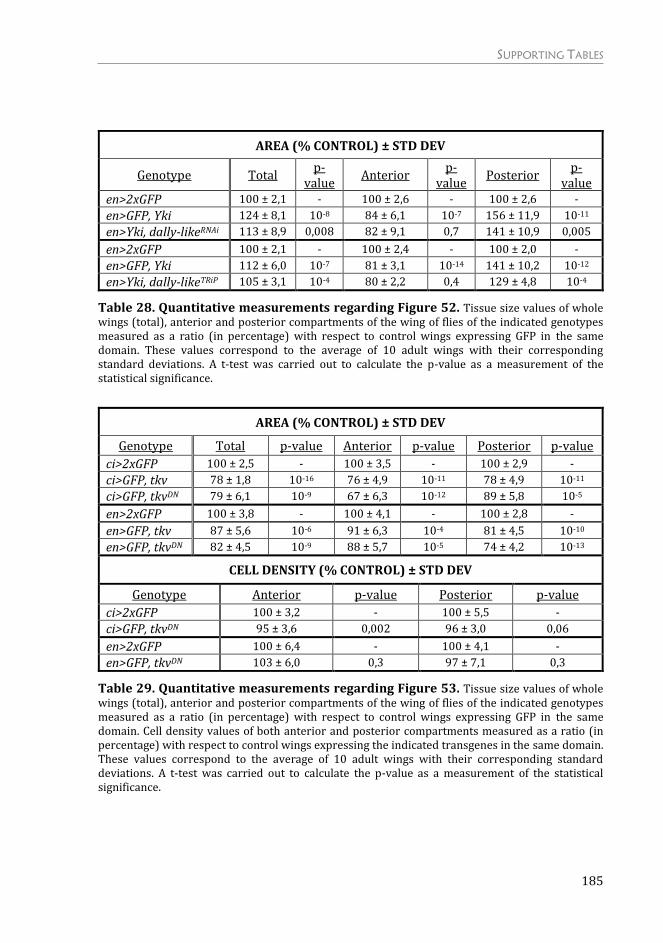
SUPPORTING TABLES
185
AREA (% CONTROL) ± STD DEV
Genotype Total p-
value Anterior
p-value
Posterior p-
value en>2xGFP 100 ± 2,1 - 100 ± 2,6 - 100 ± 2,6 -
en>GFP, Yki 124 ± 8,1 10-8 84 ± 6,1 10-7 156 ± 11,9 10-11
en>Yki, dally-likeRNAi 113 ± 8,9 0,008 82 ± 9,1 0,7 141 ± 10,9 0,005
en>2xGFP 100 ± 2,1 - 100 ± 2,4 - 100 ± 2,0 -
en>GFP, Yki 112 ± 6,0 10-7 81 ± 3,1 10-14 141 ± 10,2 10-12
en>Yki, dally-likeTRiP 105 ± 3,1 10-4 80 ± 2,2 0,4 129 ± 4,8 10-4
Table 28. Quantitative measurements regarding Figure 52. Tissue size values of whole wings (total), anterior and posterior compartments of the wing of flies of the indicated genotypes measured as a ratio (in percentage) with respect to control wings expressing GFP in the same domain. These values correspond to the average of 10 adult wings with their corresponding standard deviations. A t-test was carried out to calculate the p-value as a measurement of the statistical significance.
AREA (% CONTROL) ± STD DEV
Genotype Total p-value Anterior p-value Posterior p-value
ci>2xGFP 100 ± 2,5 - 100 ± 3,5 - 100 ± 2,9 -
ci>GFP, tkv 78 ± 1,8 10-16 76 ± 4,9 10-11 78 ± 4,9 10-11
ci>GFP, tkvDN 79 ± 6,1 10-9 67 ± 6,3 10-12 89 ± 5,8 10-5
en>2xGFP 100 ± 3,8 - 100 ± 4,1 - 100 ± 2,8 -
en>GFP, tkv 87 ± 5,6 10-6 91 ± 6,3 10-4 81 ± 4,5 10-10
en>GFP, tkvDN 82 ± 4,5 10-9 88 ± 5,7 10-5 74 ± 4,2 10-13
CELL DENSITY (% CONTROL) ± STD DEV
Genotype Anterior p-value Posterior p-value
ci>2xGFP 100 ± 3,2 - 100 ± 5,5 -
ci>GFP, tkvDN 95 ± 3,6 0,002 96 ± 3,0 0,06
en>2xGFP 100 ± 6,4 - 100 ± 4,1 -
en>GFP, tkvDN 103 ± 6,0 0,3 97 ± 7,1 0,3
Table 29. Quantitative measurements regarding Figure 53. Tissue size values of whole wings (total), anterior and posterior compartments of the wing of flies of the indicated genotypes measured as a ratio (in percentage) with respect to control wings expressing GFP in the same domain. Cell density values of both anterior and posterior compartments measured as a ratio (in percentage) with respect to control wings expressing the indicated transgenes in the same domain. These values correspond to the average of 10 adult wings with their corresponding standard deviations. A t-test was carried out to calculate the p-value as a measurement of the statistical significance.
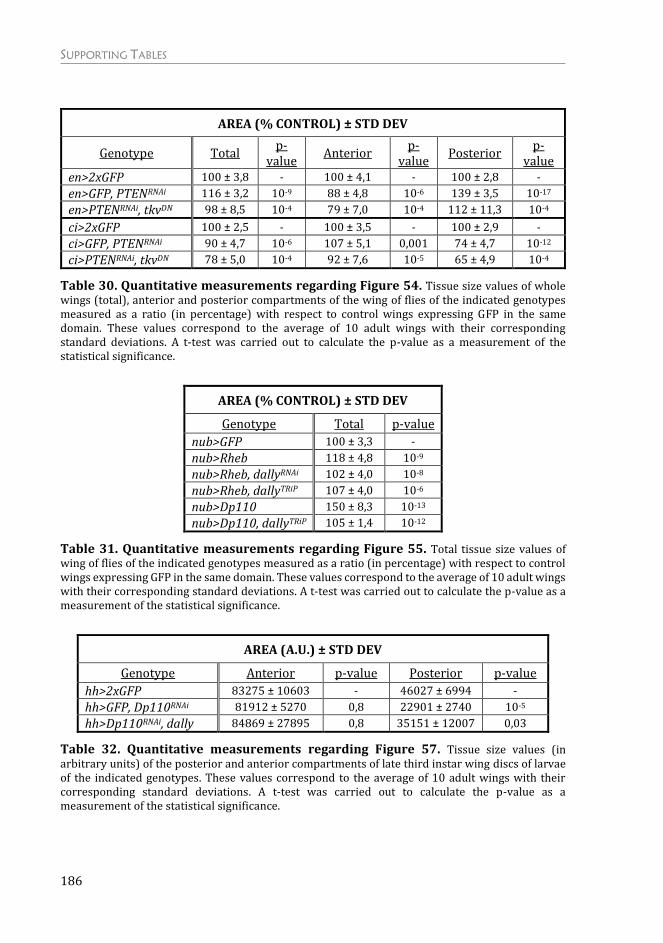
SUPPORTING TABLES
186
AREA (% CONTROL) ± STD DEV
Genotype Total p-
value Anterior
p-value
Posterior p-
value en>2xGFP 100 ± 3,8 - 100 ± 4,1 - 100 ± 2,8 -
en>GFP, PTENRNAi 116 ± 3,2 10-9 88 ± 4,8 10-6 139 ± 3,5 10-17
en>PTENRNAi, tkvDN 98 ± 8,5 10-4 79 ± 7,0 10-4 112 ± 11,3 10-4
ci>2xGFP 100 ± 2,5 - 100 ± 3,5 - 100 ± 2,9 -
ci>GFP, PTENRNAi 90 ± 4,7 10-6 107 ± 5,1 0,001 74 ± 4,7 10-12
ci>PTENRNAi, tkvDN 78 ± 5,0 10-4 92 ± 7,6 10-5 65 ± 4,9 10-4
Table 30. Quantitative measurements regarding Figure 54. Tissue size values of whole wings (total), anterior and posterior compartments of the wing of flies of the indicated genotypes measured as a ratio (in percentage) with respect to control wings expressing GFP in the same domain. These values correspond to the average of 10 adult wings with their corresponding standard deviations. A t-test was carried out to calculate the p-value as a measurement of the statistical significance.
AREA (% CONTROL) ± STD DEV
Genotype Total p-value
nub>GFP 100 ± 3,3 -
nub>Rheb 118 ± 4,8 10-9
nub>Rheb, dallyRNAi 102 ± 4,0 10-8
nub>Rheb, dallyTRiP 107 ± 4,0 10-6
nub>Dp110 150 ± 8,3 10-13
nub>Dp110, dallyTRiP 105 ± 1,4 10-12
Table 31. Quantitative measurements regarding Figure 55. Total tissue size values of wing of flies of the indicated genotypes measured as a ratio (in percentage) with respect to control wings expressing GFP in the same domain. These values correspond to the average of 10 adult wings with their corresponding standard deviations. A t-test was carried out to calculate the p-value as a measurement of the statistical significance.
AREA (A.U.) ± STD DEV
Genotype Anterior p-value Posterior p-value
hh>2xGFP 83275 ± 10603 - 46027 ± 6994 -
hh>GFP, Dp110RNAi 81912 ± 5270 0,8 22901 ± 2740 10-5
hh>Dp110RNAi, dally 84869 ± 27895 0,8 35151 ± 12007 0,03
Table 32. Quantitative measurements regarding Figure 57. Tissue size values (in arbitrary units) of the posterior and anterior compartments of late third instar wing discs of larvae of the indicated genotypes. These values correspond to the average of 10 adult wings with their corresponding standard deviations. A t-test was carried out to calculate the p-value as a measurement of the statistical significance.
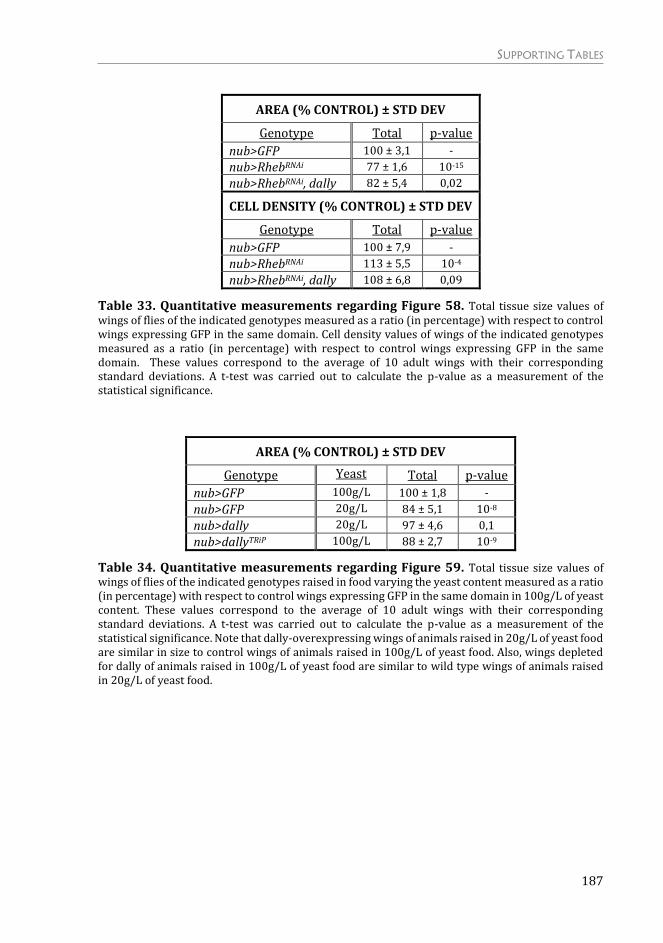
SUPPORTING TABLES
187
AREA (% CONTROL) ± STD DEV
Genotype Total p-value
nub>GFP 100 ± 3,1 -
nub>RhebRNAi 77 ± 1,6 10-15
nub>RhebRNAi, dally 82 ± 5,4 0,02
CELL DENSITY (% CONTROL) ± STD DEV
Genotype Total p-value
nub>GFP 100 ± 7,9 -
nub>RhebRNAi 113 ± 5,5 10-4
nub>RhebRNAi, dally 108 ± 6,8 0,09
Table 33. Quantitative measurements regarding Figure 58. Total tissue size values of wings of flies of the indicated genotypes measured as a ratio (in percentage) with respect to control wings expressing GFP in the same domain. Cell density values of wings of the indicated genotypes measured as a ratio (in percentage) with respect to control wings expressing GFP in the same domain. These values correspond to the average of 10 adult wings with their corresponding standard deviations. A t-test was carried out to calculate the p-value as a measurement of the statistical significance.
AREA (% CONTROL) ± STD DEV
Genotype Yeast Total p-value
nub>GFP 100g/L 100 ± 1,8 -
nub>GFP 20g/L 84 ± 5,1 10-8
nub>dally 20g/L 97 ± 4,6 0,1
nub>dallyTRiP 100g/L 88 ± 2,7 10-9
Table 34. Quantitative measurements regarding Figure 59. Total tissue size values of wings of flies of the indicated genotypes raised in food varying the yeast content measured as a ratio (in percentage) with respect to control wings expressing GFP in the same domain in 100g/L of yeast content. These values correspond to the average of 10 adult wings with their corresponding standard deviations. A t-test was carried out to calculate the p-value as a measurement of the statistical significance. Note that dally-overexpressing wings of animals raised in 20g/L of yeast food are similar in size to control wings of animals raised in 100g/L of yeast food. Also, wings depleted for dally of animals raised in 100g/L of yeast food are similar to wild type wings of animals raised in 20g/L of yeast food.


INDEX OF FIGURES
189
Index of Figures
Figure 1. The life cycle of Drosophila Melanogaster…………………………………………………………7
Figure 2. Drosophila melanogaster imaginal discs origin and their respective adult organs ………………………………………………………………………………………………………………………………......8 Figure 3. The wing imaginal disc: specification of territories and cellular organization...10 Figure 4. Compartment boundaries and local signaling centers in the developing fly wing …………………………………………… ...…………………………………………………………………………………11 Figure 5. Cell cycle of Drosophila melanogaster………………………………………………………..…..13 Figure 6. Diagram showing the IIS and TOR signaling pathways……………………….…………. 18 Figure 7. Diagram showing the Hippo signaling pathway in Drosophila ……………………….23 Figure 8. Distribution of Wg, Hh and Dpp morphogens in the Drosophila wing imaginal disc....………………………………………………………………………………………………………………………..26 Figure 9. Dpp morphogen signaling cascade in the Drosophila wing imaginal disc………….28 Figure 10. Models of Dpp gradient formation………………………………………………………………36 Figure 11. Scaling of Dpp activity gradient…………………………………………………………………..40 Figure 12. The phenomenon of cell competition…………………………………………………………..46 Figure 13. The ligand-capture hypothesis……………………………………………………………………49 Figure 14. Metabolic competition upon nutrient challenge………………………………………..…55 Figure 15. Activation of PI3K/PTEN and TSC/TOR pathways in the wing imaginal disc…..62 Figure 16. Activation of PI3K/PTEN and TSC/TOR pathways in the anterior compartment …………………………………………………………………………………………………………………………………64 Figure 17. Activation of PI3K/PTEN and TSC/TOR pathways in the posterior compartment …………………………………………………………………………………………………………………………………65 Figure 18. Activation of PI3K/PTEN and TSC/TOR pathways in the posterior compartment …………………………………………………………………………………………………………………………………66 Figure 19. Non-autonomous effect of activation of growth is not specific to compartments …………………………………………………………………………………………………………………………………67

INDEX OF FIGURES
190
Figure 20. Increased cell proliferation rates does not has an impact in the neighboring domain……………………………………………………………………………………………………………………..68 Figure 21. Increased cell proliferation rates does not has an impact in the neighboring domain……………………………………………………………………………………………………………………..68 Figure 22. Reduction of growth rates of the neighboring domain…………………………………..70 Figure 23. Reduction of proliferation rates in the neighboring territory………………………...71 Figure 24. No changes in cell cycle markers…………………………………………………………………72 Figure 25. Mitotic activity remains unchanged………………………………………………………….....73 Figure 26. Cell cycle profile upon targeted activation of growth…………………………………….74 Figure 27. Restricted activation of growth does not affect final body size………………………76 Figure 28. Apoptosis is not observed in the non-autonomous territory…………………………77
Figure 29. The non-autonomous reduction in tissue size does not rely on Dp53 nor
apoptosis…………………………………………………………………………………………………………………..78
Figure 30. The non-autonomous reduction in tissue size does not rely on Dp53 nor on
apoptosis…………………………………………………………………………………………………………………..80
Figure 31. The non-autonomous reduction in tissue size does not rely on competition for
nutrients …………………………………………………………………………………………………………………..82
Figure 32. Pattern scales with tissue size upon targeted activation of growth………………...83
Figure 33. Autonomous and non-autonomous effects on the Dpp activity gradient………...85
Figure 34. Dpp activity levels are not affected in overgrown tissues………………………………86
Figure 35. Increased cell number does not change the Dpp activity gradient………………….87
Figure 36. Non-autonomous reduction in tissue size rescued by Dpp depletion……………..88
Figure 37. Thickveins expression is unaffected by depletion of PTEN……………………………90
Figure 38. Dally-like levels are not modulated by activation of the PI3K/PTEN and
TSC/TOR signaling pathways……………………………………………………………………………………..91
Figure 39. Dally upregulation upon activation of PI3K/PTEN and TSC/TOR pathways…...91
Figure 40. Dally overexpression phenocopies the autonomous and non-autonomous
effects of activation of PI3K/PTEN and TSC/TOR pathways………………………………………….93
Figure 41. Impact of Dally overexpression on the Dpp gradient…………………………………….94
Figure 42. Impact of Dally overexpression on Hh and Wg signaling……………………………….96

INDEX OF FIGURES
191
Figure 43. Dally co-expression further enhances the autonomous and non-autonomous
effects in tissue size of targeted activation of growth……………………………………………………97
Figure 44. Dally depletion has little impact on tissue growth………………………………………...99
Figure 45. Dally contributes to the autonomous and non-autonomous effects of targeted
activation of PI3K/PTEN and TSC/TOR pathways……………………………………………………...100
Figure 46. Dally contributes to the expansion of the Dpp activity gradient upon activation
of growth………………………………………………………………………………………………………………...101
Figure 47. Depletion of sfl rescues the autonomous and non-autonomous effects on tissue
growth……………………………………………………………………………………………………………………102
Figure 48. Depletion of sfl strongly reduces tissue size autonomously…………………………103
Figure 49. Yki overexpression causes a reduction in tissue size of the adjacent domains
……………………………………………………………………………………………………………………………….104
Figure 50. Yki overexpression upregulates levels of Dally and Dally-like……………………..105
Figure 51. The autonomous and non-autonomous effects on tissue growth due to Yki
overexpression depend on Dally………………………………………………………………………………106
Figure 52. Dally-like does not contribute to the non-autonomous effects on tissue growth
due to Yki overexpression………………………………………………………………………………………..107
Figure 53. Increase Dpp trapping by Tkv causes a non-autonomous reduction in tissue
size…………………………………………………………………………………………………………………………109
Figure 54. Increase Dpp trapping by Tkv upon targeted activation of PI3K/PTEN signaling
pathway enhances the non-autonomous reduction in tissue size………………………………..110
Figure 55. Dally depletion rescues the overgrowth caused by activation of PI3K/PTEN and
TSC/TOR signaling…………………………………………………………………………………………………..112
Figure 56. Dally levels are reduced upon inactivation of the PI3K/PTEN and TSC/TOR
signaling ...………………………………………………………………………………………………………………112
Figure 57. Overexpression of Dally partially rescues the defects of Dp110 depletion……113
Figure 58. Overexpression of Dally slightly rescues the defects of Rheb depletion………..114
Figure 59. Modulation of Dally in different nutrient conditions…………………………………...115
Figure 60. Dally overexpression in the wing pouch affects the range but not the shape of
the activity gradient…………………………………………………………………………………………………115
Figure 61. A role of Dally in mediating the nonautonomous effects on tissue growth…….124
Figure 62. A role of Dally in tissue growth………………………………………………………………….130

ABBREVIATIONS
192
Abbreviations
4EBP: Eukaryotic translation
initiation factor 4E-binding protein
A: Anterior
AEL: After Egg Laying
AMPK: AMP-activated protein kinase
AP: Anterior-Posterior
BrdU: Bromodeoxyuridine
Brk: Brinker
CDK: Cyclin-dependent kinases
Ci: Cubitus Interuptus
CycE: Cyclin E
D: Dorsal
Dad: Daughters against dpp
Dally: Division abnormally delayed
Diap1: Death-associated inhibitor of
apoptosis 1
DILPs: Drosophila Insulin-like
Peptides
Dlg: Discs-large
Dlp: Dally-like protein
DNA: Deoxyribonucleic Acid
Dpp: Decapentaplegic
Dll: Distalless
Ds: dachsous
dsRNA: double strand ribonucleic acid
DV: Dorsal-Ventral
ECM: Extracellular Matrix
eIF4E: Eukaryotic translation
initiation factor 4E
En: Engrailed
Ex: Expanded
FACs: Fluorescence-activated cell
sorting
FOXO: Forkhead box, sub-group O
FRAP: Fluorescence recovery after
photobleaching
FSC: Forward Scatter
GAG: glycosaminoglycan
GFP: Green Fluorescent Protein
GPI: Glycosylphosphatidyl inositol
Hh: Hedgehog
HPSGs: Heparan sulfate
proteoglycans
Hpo: Hippo
HS: Heparan sulfate
Hth: Homothorax
IGF: Insulin-like Growth Factors
IIS: insulin/insulin growth factor
signaling
InR: Insulin Receptor
IRS: Insulin receptor substrate
L1: First larval stage
L2: Second larval stage
L3: Third larval stage

ABBREVIATIONS
193
Lgl: lethal (2) giant larvae
MAD: Mothers against decapentaplegic
Mats: mob as tumor suppressor
Mer: Merlin
mRNA: Messenger Ribonucleic Acid
Omb: Optomotor-blind
ONCs: Oncogenic Niche Cells
P: Posterior
Pent: Pentagone
PI3K: Phosphotidylinositol 3 Kinase
PIP2: Phosphatidylinositol 4,5-
bisphosphate
PIP3: Phosphatidylinositol (3,4,5)-
trisphosphate
PH3: Phosphorylated Histone 3
PRAS40: Proline-rich AKT1 substrate 1
protein
Ptc: Patched
PTEN: Phosphatase and Tensin
Homolog
RBF: Retinoblastoma-family protein
RNAi: RNA interference
Rheb: Ras homolog enriched in brain
ortholog
Sal: Spalt
Sav: Salvador
Scrib: Scribble
Sd: Scalloped
Sens: Senseless
Sfl: Sulfateless
S6K: Ribosomal protein S6 kinase
Stg: String
TGFβ: Transforming growth
factor beta
Tkv: Thickveins
TOR: Target of Rapamycin
TSC1: tuberous sclerosis complex 1
TSC2: tuberous sclerosis complex 2
Tsh: Teashirt UAS: Upstream Activation Sequence
V: Ventral
Vg: Vestigial
Wg: Wingless
Wts: Warts

RESUMEN EN CASTELLANO
195
Resumen en castellano
Para obtener organismos estructuralmente funcionales, el tamaño de sus órganos
tiene que estar altamente regulado durante el desarrollo. Por un lado, dicho
tamaño final depende del estado nutricional del organismo y de la actividad de
vías de señalización que responden a la disponibilidad de nutrientes. Por otro
lado, existen señales intrínsecas en estos órganos que operan de forma autónoma
para controlar su crecimiento y su forma. Cómo integran las células y los tejidos
estas señales extrínsecas e intrínsecas para generar órganos del tamaño y forma
apropiados sigue siendo, en gran parte, una incógnita.
Las vías de señalización PI3K (Phosphatidylinositol 3-Kinase)/PTEN
(Phosphatase with Tensin Homology) y TSC (Tuberous Sclerosis Complex)/TOR
(Target of Rapamycin) que responden a la disponibilidad de nutrientes están
involucradas en el control del crecimiento. Además, se encuentran hiper-
activadas con frecuencia en diferentes cánceres humanos, y su activación es
muchas veces la causa inicial del desarrollo de los tumores. Una pregunta
interesante, y todavía poco explorada, es entender cómo células mutantes para
genes supresores de tumores compiten con las células adyacentes salvajes
durante las primeras etapas de la tumorigénesis y hasta llegar a eliminarlas
completamente.
Para analizar el impacto de la activación restringida a determinadas regiones de
estas vías de señalización sobre poblaciones celulares adyacentes de tipo salvaje,
hemos utilizado como sistema modelo los primordios imaginales de Drosophila,
tejidos epiteliales altamente proliferativos y en continuo crecimiento durante el
desarrollo larvario.
Los resultados presentados en esta tesis demuestran que la activación restringida
a determinadas regiones de estas vías genera, como esperábamos, un sobre-
crecimiento del tejido afectado y, sorprendentemente, una clara reducción del

RESUMEN EN CASTELLANO
196
crecimiento y la proliferación de las poblaciones celulares adyacentes no
afectadas. Demostramos que esta respuesta no autónoma: (1) se produce
independientemente de la región dentro del primordio dónde se activan estas
vías; (2) es funcional durante todo el desarrollo; (3) es independiente a la
inducción de muerte celular y, por tanto, distinta de la competición celular; y (4)
no se ve influenciada por el estado nutricional del organismo.
También identificamos el mecanismo molecular involucrado en dichos fenotipos.
Demostramos que los efectos observados en el crecimiento de los tejidos, tanto
autónomos como no autónomos, están mediados por Dally, un proteoglicano
implicado en la regulación de la difusión, la estabilidad y la actividad del factor de
crecimiento Dpp (Decapentaplegic)/ TGF- β (Transforming Growth Factor β).
Activación de las vías de señalización PI3K/PTEN y TSC/TOR aumenta los niveles
de expresión de Dally; la sobreexpresión de Dally fenocopia los efectos producidos
por la activación de estas vías a nivel autónomo y no autónomo tanto en el
crecimiento como en la proliferación celular, y finalmente, la disminución de los
niveles de Dally es capaz de rescatar los efectos en la proliferación celular y en el
tamaño inducidos por estas vías.
En nuestro modelo, proponemos que la reducción no autónoma del tamaño del
tejido se genera debido a una reducción en los niveles de señalización de la vía de
Dpp. El incremento en los niveles de Dally inducido por la activación de estas vías
conlleva un mayor secuestro de moléculas de Dpp y, como consecuencia, una
reducción del número de moléculas de Dpp disponibles para las poblaciones
celulares adyacentes. Asimismo, sugerimos que ambas poblaciones celulares
compiten por la cantidad de moléculas de Dpp, y que la reducción de estas
promueve la eliminación de las células salvajes por parte de la población celular
que está sobrecreciendo. Consistente con esta hipótesis, un aumento de los niveles
del receptor de Dpp, Thickveins, capaz de retirar/internalizar el ligando Dpp del
espacio extracelular, también causa una reducción no autónoma del tamaño del
tejido adyacente.

RESUMEN EN CASTELLANO
197
Mientras que las vías de señalización que detectan los nutrientes modulan el
tamaño final de las estructuras adultas de un organismo en función a la
disponibilidad de nutrientes, Dpp juega un papel intrínseco a nivel del órgano en
la coordinación de crecimiento con la generación de patrón. Por lo tanto, nuestros
resultados revelan una función de Dally como un puente molecular entre los
mecanismos intrínsecos y extrínsecos que regulan el tamaño final de los órganos.
Como tal, contribuye a integrar la disponibilidad de nutrientes con el “scaling” de
los órganos.


ANNEXES


201
Annexes
In addition to the project addressed in this PhD thesis and that has been
successfully published in PLOS Biology in 2015 (Main Publication), I have also
contributed to a different research project that resulted in another publication
from the lab.
In collaboration with Laura Boulan, I was involved in a project related with the
interaction between TRIM-NHL proteins and dMyc specifically and exclusively in
growth control in epithelial cells that lead to publication of one original research
article (Publication 2). For this paper, I contributed to conduct all the
experiments.
TRIM-NHL proteins are a family of translational regulators that control cell
growth, proliferation, and differentiation during development. Drosophila Brat
and Mei-P26 TRIM-NHL proteins serve as tumor suppressors in stem cell lineages
and have been proposed to exert this action, in part, via the repression of the
protooncogene dMyc. We analyzed the role of Brat, Mei-P26, and dMyc in
regulating growth in Drosophila imaginal discs. As in stem cell lineages, we found
that Brat and Mei-P26 repress dMyc in epithelial cells by acting at the post-
transcriptional and protein level, respectively. Loss-of-function of brat and
overexpression of dMyc induce overgrowth in stem cell lineages and eventually
can participate in tumor formation. In contrast, we found that an increase in Mei-
P26 levels inhibits growth of epithelial cells in these two conditions. Upon
depletion of Brat, Mei-P26 up-regulation prevents an increase in dMyc protein
levels and leads to tissue undergrowth. This mechanism appears to be tissue-
specific since we did not observe Mei-P26 upregulation in brain tumors resulting
from brat loss-of-function. We observed that driving Mei-P26 expression in these
tumors —mimicking the situation in epithelial cells— is sufficient to prevent
dMyc accumulation, thus rescuing the overgrowth. Finally, we showed that Mei-

202
P26 upregulation mediates dMyc-induced apoptosis and limits dMyc growth
potential in epithelial cells. These findings shed light on the tumor suppressor
roles of TRIM-NHL proteins and underscore a new mechanism that maintains
tissue homeostasis upon dMyc deregulation.

203
Main Publication
“Dally Proteoglycan Mediates the Autonomous and
Nonautonomous Effects on Tissue Growth Caused by Activation
of the PI3K and TOR Pathways”


RESEARCH ARTICLE
Dally Proteoglycan Mediates theAutonomous and Nonautonomous Effects onTissue Growth Caused by Activation of thePI3K and TOR PathwaysAna Ferreira1, Marco Milán1,2*
1 Institute for Research in Biomedicine (IRB Barcelona), Barcelona, Spain, 2 Institucio Catalana de Recercai Estudis Avançats (ICREA), Barcelona, Spain
AbstractHow cells acquiring mutations in tumor suppressor genes outcompete neighboring wild-
type cells is poorly understood. The phosphatidylinositol 3-kinase (PI3K)–phosphatase with
tensin homology (PTEN) and tuberous sclerosis complex (TSC)-target of rapamycin (TOR)
pathways are frequently activated in human cancer, and this activation is often causative of
tumorigenesis. We utilized the Gal4-UAS system in Drosophila imaginal primordia, highly
proliferative and growing tissues, to analyze the impact of restricted activation of these
pathways on neighboring wild-type cell populations. Activation of these pathways leads to
an autonomous induction of tissue overgrowth and to a remarkable nonautonomous reduc-
tion in growth and proliferation rates of adjacent cell populations. This nonautonomous
response occurs independently of where these pathways are activated, is functional all
throughout development, takes place across compartments, and is distinct from cell compe-
tition. The observed autonomous and nonautonomous effects on tissue growth rely on the
up-regulation of the proteoglycan Dally, a major element involved in modulating the spread-
ing, stability, and activity of the growth promoting Decapentaplegic (Dpp)/transforming
growth factor β(TGF-β) signaling molecule. Our findings indicate that a reduction in the
amount of available growth factors contributes to the outcompetition of wild-type cells by
overgrowing cell populations. During normal development, the PI3K/PTEN and TSC/TOR
pathways play a major role in sensing nutrient availability and modulating the final size of
any developing organ. We present evidence that Dally also contributes to integrating nutri-
ent sensing and organ scaling, the fitting of pattern to size.
Author Summary
The final size of a developing organ is finely modulated by nutrient conditions through theactivity of nutrient sensing pathways, and deregulation of these pathways is often causativeof tumorigenesis. Besides the well-known roles of these pathways in inducing tissue and
PLOS Biology | DOI:10.1371/journal.pbio.1002239 August 27, 2015 1 / 28
OPEN ACCESS
Citation: Ferreira A, Milán M (2015) DallyProteoglycan Mediates the Autonomous andNonautonomous Effects on Tissue Growth Causedby Activation of the PI3K and TOR Pathways. PLoSBiol 13(8): e1002239. doi:10.1371/journal.pbio.1002239
Academic Editor: Konrad Basler, University ofZurich, SWITZERLAND
Received: December 19, 2014
Accepted: July 31, 2015
Published: August 27, 2015
Copyright: © 2015 Ferreira, Milán. This is an openaccess article distributed under the terms of theCreative Commons Attribution License, which permitsunrestricted use, distribution, and reproduction in anymedium, provided the original author and source arecredited.
Data Availability Statement: All relevant data arewithin the paper and its Supporting Information files.
Funding: This work was funded by the Ministerio deEconomia y Competitividad (BFU2010-21123 andBFU2013-44485 grants), AGAUR (2005 SGR 00118grant), and Fundação para a Ciência e a Tecnologia(SFRH/BD/68745/2010 grant). The funders had norole in study design, data collection and analysis,decision to publish, or preparation of the manuscript.
Competing Interests: The authors have declaredthat no competing interests exist.

cell growth, here we identify a nonautonomous effect of activation of these pathways ongrowth and proliferation rates and on the final size of neighboring cell populations. Wereveal that the observed autonomous and nonautonomous effects on tissue growth andproliferation rates rely on the up-regulation of the proteoglycan Dally, a major factorinvolved in modulating the spreading, stability, and activity of the growth promoting Dec-apentaplegic (Dpp)/transforming growth factor β(TGF-β) signaling molecule. Our dataindicate that a reduction in the amount of available growth factors contributes to the out-competition of wild-type cells by overgrowing cell populations. Whereas nutrient-sensingpathways modulate the final size of the adult structure according to nutrient availability tothe feeding animal, Dpp plays an organ-intrinsic role in the coordination of growth andpatterning. We identify the proteoglycan Dally as the rate-limiting factor that contributesto the tissue-autonomous and nonautonomous effects on growth caused by targeted acti-vation of the nutrient-sensing pathways. Thus, our results unravel a role of Dally as amolecular bridge between the organ-intrinsic and organ-extrinsic mechanisms that regu-late organ size.
IntroductionSeveral conserved signaling pathways involved in the control of organ size in many species arefrequently deregulated in a broad range of human cancers, and this deregulation is often causa-tive of tumorigenesis. The phosphatidylinositol 3-kinase (PI3K)–phosphatase with tensinhomology (PTEN) is one of the most commonly altered pathways in human tumors. Deletionof PTEN is associated with aggressive metastatic potential and poor prognosis (reviewed in[1]), and targeted depletion of PTEN in epithelial cells leads to rapid development of endome-trial, prostate, and thyroid neoplasias in mouse models [2]. Mutations in tuberous sclerosiscomplex 1 (TSC1) and tuberous sclerosis complex 2 (TSC2) that lead to hyperactivation of thetarget of rapamycin (TOR) pathway are causative of tuberous sclerosis, a hamartoma syndromeassociated with a predisposition to malignancy [3], and heterozygous Tsc1 or Tsc2mutantmice develop renal and extrarenal tumors such as hepatic hemangiomas [4].
In Drosophila, the PI3K/PTEN and TSC/TOR pathways modulate the final size of the devel-oping organism according to nutrient availability, and their activation promotes cell and tissuegrowth (reviewed in [5,6]). Thus, the identification of the molecular players and cellular inter-actions underlying the induction of growth upon loss of these tumor suppressor genes inmodel organisms will bring new insight into their contribution to the initial steps of tumori-genesis, as somatic mutations in these pathways appear to be frequently accumulated in earlyevents of tumor development. In this context, the imaginal primordia of Drosophila, mono-layered epithelial tissues that grow and proliferate 1,000-fold in size in about five days insidethe feeding larvae, have proved to be a valuable model system to address the impact of tumorsuppressor genes in the early events of tumorigenesis (reviewed in [7,8]). Their simple architec-ture enables both the labelling and tracking of cell populations that can be genetically manipu-lated with the help of sophisticated tools as well as the analysis of the cell-autonomous andnonautonomous impact of loss of these tumor suppressor genes.
Of particular interest is the understanding of how cells depleted of tumor suppressor genesoutcompete neighboring wild-type cells, especially during early stages of tumorigenesis follow-ing initial mutagenesis and transformation. Cell competition, a process favoring fit over weakor harmful cells, was originally identified in Drosophila [9] and has been proposed to play aprotumoral role in this process [10]. However, cell competition has been recently shown to
Dally and Growth Control
PLOS Biology | DOI:10.1371/journal.pbio.1002239 August 27, 2015 2 / 28
Abbreviations: βGal, β-galactosidase; A, anterior;AEL, after egg laying; AP, anterior–posterior; a.u.,arbitrary units; brk, brinker; cycE, cyclin E; Dpp,Decapentaplegic; DSHB, Developmental StudiesHybridoma Bank; dsRNA, double-stranded RNA; DV,dorsal-ventral; EGFR, epidermal growth factorreceptor; FACS, fluorescence-activated cell sorter;GFP, green fluorescent protein; GPI,glycosylphosphatidylinositol; GTP, guanosine-5'-triphosphate; HS, heparan sulfate; HSPG, heparansulfate proteoglycan; InR, insulin-like receptor; MAD,Mothers against Dpp; P, posterior; PH3,phosphorylated histone H3; PI3K,phosphatidylinositol 3-kinase; PTEN, phosphataseand tensin homolog; RFP, red fluorescent protein;RNAi, RNA interference; RT, room temperature; Sfl,Sulfateless; stg, string; TGF-β, transforming growthfactor β; Tkv, Thickveins; TOR, target of rapamycin;TSC, tuberous sclerosis complex; TUNEL, terminaldeoxynucleotidyl transferase dUTP nick end labeling;UAS, upstream activation sequence; Ubx,Ultrabithorax; VDRC, Vienna Drosophila RNAi Center
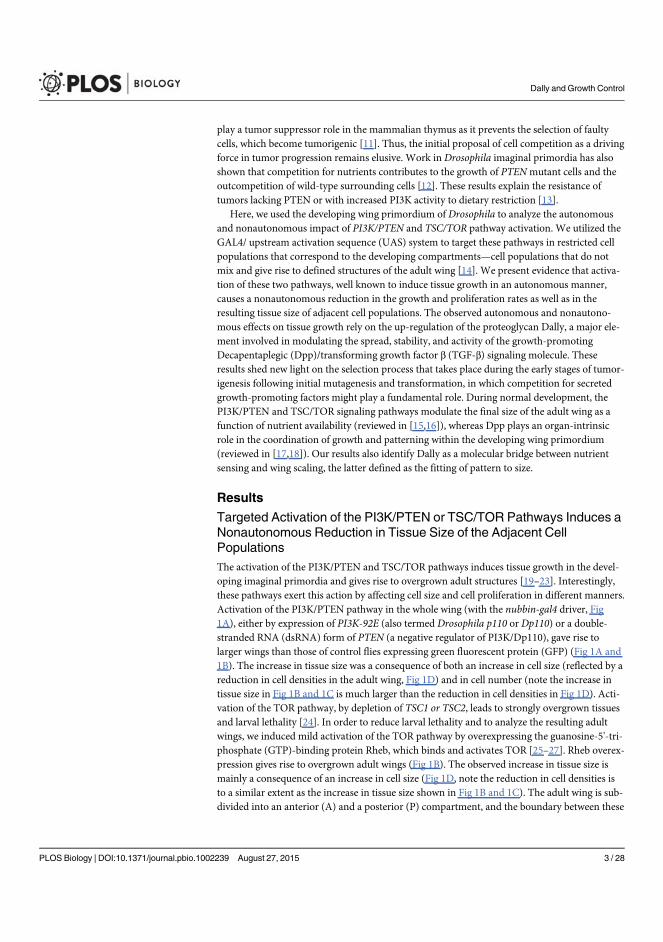
play a tumor suppressor role in the mammalian thymus as it prevents the selection of faultycells, which become tumorigenic [11]. Thus, the initial proposal of cell competition as a drivingforce in tumor progression remains elusive. Work in Drosophila imaginal primordia has alsoshown that competition for nutrients contributes to the growth of PTENmutant cells and theoutcompetition of wild-type surrounding cells [12]. These results explain the resistance oftumors lacking PTEN or with increased PI3K activity to dietary restriction [13].
Here, we used the developing wing primordium of Drosophila to analyze the autonomousand nonautonomous impact of PI3K/PTEN and TSC/TOR pathway activation. We utilized theGAL4/ upstream activation sequence (UAS) system to target these pathways in restricted cellpopulations that correspond to the developing compartments—cell populations that do notmix and give rise to defined structures of the adult wing [14]. We present evidence that activa-tion of these two pathways, well known to induce tissue growth in an autonomous manner,causes a nonautonomous reduction in the growth and proliferation rates as well as in theresulting tissue size of adjacent cell populations. The observed autonomous and nonautono-mous effects on tissue growth rely on the up-regulation of the proteoglycan Dally, a major ele-ment involved in modulating the spread, stability, and activity of the growth-promotingDecapentaplegic (Dpp)/transforming growth factor β (TGF-β) signaling molecule. Theseresults shed new light on the selection process that takes place during the early stages of tumor-igenesis following initial mutagenesis and transformation, in which competition for secretedgrowth-promoting factors might play a fundamental role. During normal development, thePI3K/PTEN and TSC/TOR signaling pathways modulate the final size of the adult wing as afunction of nutrient availability (reviewed in [15,16]), whereas Dpp plays an organ-intrinsicrole in the coordination of growth and patterning within the developing wing primordium(reviewed in [17,18]). Our results also identify Dally as a molecular bridge between nutrientsensing and wing scaling, the latter defined as the fitting of pattern to size.
Results
Targeted Activation of the PI3K/PTEN or TSC/TOR Pathways Induces aNonautonomous Reduction in Tissue Size of the Adjacent CellPopulationsThe activation of the PI3K/PTEN and TSC/TOR pathways induces tissue growth in the devel-oping imaginal primordia and gives rise to overgrown adult structures [19–23]. Interestingly,these pathways exert this action by affecting cell size and cell proliferation in different manners.Activation of the PI3K/PTEN pathway in the whole wing (with the nubbin-gal4 driver, Fig1A), either by expression of PI3K-92E (also termed Drosophila p110 or Dp110) or a double-stranded RNA (dsRNA) form of PTEN (a negative regulator of PI3K/Dp110), gave rise tolarger wings than those of control flies expressing green fluorescent protein (GFP) (Fig 1A and1B). The increase in tissue size was a consequence of both an increase in cell size (reflected by areduction in cell densities in the adult wing, Fig 1D) and in cell number (note the increase intissue size in Fig 1B and 1C is much larger than the reduction in cell densities in Fig 1D). Acti-vation of the TOR pathway, by depletion of TSC1 or TSC2, leads to strongly overgrown tissuesand larval lethality [24]. In order to reduce larval lethality and to analyze the resulting adultwings, we induced mild activation of the TOR pathway by overexpressing the guanosine-5'-tri-phosphate (GTP)-binding protein Rheb, which binds and activates TOR [25–27]. Rheb overex-pression gives rise to overgrown adult wings (Fig 1B). The observed increase in tissue size ismainly a consequence of an increase in cell size (Fig 1D, note the reduction in cell densities isto a similar extent as the increase in tissue size shown in Fig 1B and 1C). The adult wing is sub-divided into an anterior (A) and a posterior (P) compartment, and the boundary between these
Dally and Growth Control
PLOS Biology | DOI:10.1371/journal.pbio.1002239 August 27, 2015 3 / 28

Fig 1. Nonautonomous effects on tissue size upon targeted activation of PI3K/PTEN and TSC/TOR pathways. (A, E, I) Schemes of adult wings withthe nub (A), ci (E), and en (I) expression domains marked in blue and cuticle preparations of male adult wings expressingGFP or PTENRNAi under the controlof the nub-gal4 (A), ci-gal4 (E), and en-gal4 (I) drivers. The blue line marks the boundary between anterior (A) and posterior (P) compartments. The wing isdecorated with four longitudinal veins (L2–L5), and the anterior side of L4 corresponds to the AP compartment boundary. (B–D, F–H, J–L) Histogramsplotting tissue size (B, C, F, G, J, K) and cell density (D, H, L) of the whole wing (B, F, J), or the A and P compartments of adult wings expressing the indicatedtransgenes in the nub (B–D), ci (F–H) or en (J–L) domains normalized as a percent of the control wings. Note a consistent reduction in tissue size of theadjacent cell populations in G and K (white bars). (M) Cuticle preparation of a ci>stg, cycE adult wing. The blue line marks the boundary between the A and Pcompartments. On the right are histograms plotting tissue size and cell density values of the A (blue bars) and P (white bars) domains of ci>stg, cycE adultwings normalized as a percent of the control (ci>GFP) wings. ci-gal4 drives gene expression to the A compartment of the wing. (N) Cuticle preparations ofspaltPE>GFP and spaltPE>PTENRNAi adult wings. The blue lines mark the lateral and medial regions of the wing. On the right are histograms plotting tissuesize and cell density values of the medial (blue bars) and lateral (white bars) regions of spaltPE>PTENRNAi adult wings normalized as a percent of the control(spaltPE>GFP) wings. spalt-gal4 drives gene expression to the medial part of the wing. The domains of transgene expression in A, E, I, M, and N are markedwith a blue asterisk. Error bars show the standard deviation. Number of wings analyzed per genotype� 10. ***p < 0.001; **p < 0.01; *p < 0.05. Area andcell density values of the cell populations driving transgene expression are labeled in blue, and the values of the nonexpressing domain are represented inwhite.
doi:10.1371/journal.pbio.1002239.g001
Dally and Growth Control
PLOS Biology | DOI:10.1371/journal.pbio.1002239 August 27, 2015 4 / 28

two cell populations is easily identified in the adult wing (Fig 1A), as it corresponds to the ante-rior side of the fourth longitudinal vein (L4, Fig 1A). The observed increase in tissue size uponactivation of the PI3K/PTEN or TSC/TOR pathways in the whole wing was similar in bothcompartments (Fig 1C).
To address the potential nonautonomous roles of the PTEN and TSC tumor suppressorgenes on neighboring wild-type cell populations, we drove transgene expression in either the A(with the ci-gal4 driver) or P (with the en-gal4 or hh-gal4 drivers) compartments of the devel-oping Drosophila wing (Fig 1E and 1I and S1 Fig) and quantified the size of the adjacent com-partments in the resulting adult structures. The autonomous capacity of these transgenes toinduce tissue and/or cell growth and cell proliferation was also observed with these Gal4 drivers(Fig 1E, 1G, 1H and 1K and 1L and S1 Fig, blue bars). Interestingly, the size of neighboringwild-type tissues decreased in all cases (Fig 1E, 1G, 1I and 1K and S1 Fig, white bars), and thisdecrease was accompanied by a reduction in cell size (reflected by an increase in cell densitiesin the adult wing (Fig 1H and 1L and S1 Fig, white bars). Whether the reductions in cell andtissue size are two independent processes nonautonomously regulated by the PI3K/PTEN andTSC/TOR pathways or whether there is a causal relationship between them is further analyzedin the following sections. The nonautonomous effects on tissue growth were also obtainedwith other Gal4 drivers not specific to compartments (Fig 1N). Increased cell proliferation, bymeans of overexpression of the cell cycle regulators String/Dcdc25 and CycE (which drive G2/M and G1/S transitions, respectively [28–30]), gave rise to a higher number of cells as a conse-quence of increased mitotic activity (Fig 1M and S1 Fig, see also [31]) but was not sufficient topromote tissue growth (Fig 1M, blue bar). The transgene-expressing compartment was, if any-thing, slightly smaller (Fig 1M, blue bar), most probably because of the observed increase in thenumber of apoptotic cells in the tissue (S1 Fig, see also [31]). Thus, the capacity of PI3K/PTENto promote tissue growth does not depend only on increased cell proliferation rates. Drivingcell proliferation was not sufficient to exert any nonautonomous effects on tissue or cell growtheither (Fig 1M, white bars). All together, these results indicate that tissue overgrowth, inducedby different means and independently of whether it is a consequence of increased cell size and/or cell number, causes a nonautonomous reduction in tissue size of adjacent cell populations.
Targeted Activation of the PI3K/PTEN or TSC/TOR Pathways Induces aNonautonomous Reduction of Growth Rates in Adjacent CellPopulationsThe results presented so far indicate that induction of tissue overgrowth in defined territoriesof the wing primordia causes a nonautonomous decrease in tissue size of nearby cell popula-tions. To understand whether this nonautonomous response is an active mechanism that takesplace during development, we monitored the size of the A and P compartments throughoutdevelopment after targeted expression of growth-promoting transgenes in anterior cells. Larvaeexpressing PI3K/Dp110, Rheb, or GFP in the A compartment (with the ci-gal4 driver) weregrown at 25°C, and the absolute size of the transgene-expressing (A) and nonexpressing (P)compartments was quantified at a range of time points of larval development. We focused ourattention on third instar wing discs (from 72 to 140 h after egg laying [AEL]), as primordia ofthe future adult wings are specified in late second instar (around 60 h AEL, [32]). The autono-mous impact of PI3K/Dp110 or Rheb on tissue growth was already visible in mid–late thirdinstar wing discs (96–140 h AEL), and, most interestingly, this was accompanied by a clearreduction in tissue size of the neighboring P compartment (Fig 2A and 2B). Thus, activation ofgrowth promoting pathways in one territory causes a nonautonomous reduction in growthrates of the adjacent cell population.
Dally and Growth Control
PLOS Biology | DOI:10.1371/journal.pbio.1002239 August 27, 2015 5 / 28

In order to investigate whether cell proliferation rates are also regulated in a nonautono-mous manner, we induced neutral clones of cells at the beginning of the third instar period(72 h AEL) and examined the size of these clones 72 h later in late third instar wing discs.Clone size (in arbitrary units [a.u.]) and number of cells per clone were measured in ci-gal4;UAS-GFP/UAS-Dp110 wing discs, and these two measurements were compared to thoseof control clones induced in ci-gal4; UAS-GFP/+ wing discs and grown in parallel. In
Fig 2. Targeted activation of the PI3K/PTEN and TSC/TOR pathways induces a nonautonomous reduction in growth rates in adjacent cellpopulations. (A) Quantification of tissue size (in arbitrary units [a.u.]) of both anterior (A) and posterior (P) domains of wing imaginal discs of the indicatedgenotypes in three distinct time points during development (in hours [h] AEL). Error bars show the standard deviation. Number of wing discs analyzed pergenotype� 15. ***p < 0.001; **p < 0.01. (B) Examples of ci>GFP (upper panel) and ci>GFP, Dp110 (lower panel) wing imaginal discs in the developmentaltime points shown in panel A. The transgene-expressing domain is marked with GFP (in green), and the disc is labelled with DAPI (in blue). The A and Pcompartments are indicated. (C, D) Histograms plotting the size of clones (in a.u., C) and the number of cells per clone (D) located in the A or P compartmentof ci-gal4,UAS-GFP and ci-gal4, UAS-GFP/UAS-Dp110 wing discs. Clones were generated at the beginning of the third instar period and quantified 72 h laterin late third instar wing discs. Error bars indicate the standard deviation. Number of clones analyzed per genotype� 30. ***p < 0.001. Size of clones (Acompartment, a.u.): ci>GFP = 388 ± 141; ci>GFP, Dp110 = 587 ± 249. Size of clones (P compartment, a.u.): ci>GFP = 348 ± 140; ci>GFP, Dp110 = 114 ± 67.Number of cells per clone (A compartment): ci>GFP = 20 ± 7; ci>GFP, Dp110 = 23 ± 8. Number of cells per clone (P compartment): ci>GFP = 23 ± 7; ci>GFP,Dp110 = 9 ± 4. (E) Examples of clones of cells in ci>GFP (left panel) and ci>GFP, Dp110 (right panel) wing discs and induced in the developmental timepoints shown in C and D. The transgene-expressing domain is marked with GFP (in green), and the clones are labeled by the absence of nuclear redfluorescent protein (RFP, red) expression. The A and P compartments are indicated.
doi:10.1371/journal.pbio.1002239.g002
Dally and Growth Control
PLOS Biology | DOI:10.1371/journal.pbio.1002239 August 27, 2015 6 / 28

Dp110-expressing wing discs, the size of the clones in the A compartment was, as expected, sig-nificantly larger than the size of clones quantified in the A compartment of GFP-expressingdiscs (Fig 2C–2E). Interestingly, the clone size and the number of cells per clone were signifi-cantly smaller in the P compartment of Dp110-expressing wing discs than in GFP-expressingdiscs (Fig 2C–2E). We also used a fluorescence-activated cell sorter (FACS) to collect dataabout the DNA content of dissociated cells from 120 h AEL wing discs expressing Dp110 orGFP under the control of the ci-gal4 driver. As shown in S1 Fig, the cell cycle profile of A and Pcells was very similar in the two genotypes analyzed. Taken together, these results indicate thatactivation of growth promoting pathways causes a nonautonomous reduction in proliferationrates, without any obvious arrest in any particular cell cycle stage, and imply that the nonau-tonomous reduction in tissue size observed in adult wings is a consequence of not only reducedcell size but also cell number.
Nonautonomous Effects on Tissue Growth Are Independent ofApoptosis and Dietary RestrictionThe nonautonomous reduction in growth rates caused by activation of the PI3K/PTEN orTSC/TOR pathways in defined cell populations of the developing wing primordia is reminis-cent of cell competition, a short-range elimination of slow-dividing cells through apoptosiswhen confronted with a faster-growing cell population [33]. We thus performed a terminaldeoxynucleotidyl transferase dUTP nick end labeling (TUNEL) assay to label DNA strandbreaks induced by apoptotic cell death and quantified the number of apoptotic cells in thetransgene-expressing and nonexpressing cell populations. A clear increase in TUNEL-positivecells was observed in those territories expressing Rheb or Dp110/PI3K when compared toGFP-expressing tissues (Fig 3A and 3B, green bars). A similar cell autonomous induction ofapoptosis was previously observed in PTENmutant cells [12], most probably reflecting a dele-terious effect of nonphysiological activation of these pathways in proliferating cells. However,the number of apoptotic cells in adjacent cell populations was small and very similar to thatfound in control tissues expressing GFP (Fig 3A and 3B, grey bars, see also [34]). We nextanalyzed a potential contribution of apoptotic cell death to the nonautonomous reduction ingrowth rates caused by Rheb or Dp110/PI3K expression. When apoptosis was reduced in thewhole animal by halving the dose of the proapoptotic genes hid, grim, and reaper (in Df(H99)/+ larvae, [35]), the number of apoptotic cells in the tissue was reduced (S1 Fig), but the nonau-tonomous reduction in tissue size was unaffected (Fig 3C, 3C’, 3D and 3D’). The transcriptionfactor and tumor suppressor p53, a short-lived, nonabundant protein in healthy cells, playsa fundamental role in regulating the response of mammalian cells to stress, in part throughthe transcriptional activation of genes involved in apoptosis and cell cycle regulation [36].Impaired protein translation in Drosophila tissues has been previously shown to induce Dp53activation and Dp53-dependent inhibition of growth and proliferation rates in adjacent tissues[37]. However, the nonautonomous effects on tissue growth caused by Rheb or Dp110/PI3Koverexpression were unaffected by expression of a dominant negative version of Dp53 (Dp53ct,Fig 3C and 3C’). Taken together, all these results indicate that Dp53 is not required in the over-grown territory to nonautonomously reduce the growth rates in neighboring cell populationsand that the nonautonomous decrease in growth rates is not a consequence of programmedcell death.
Apoptotic cells can produce signals to instruct neighboring cells either to undergo addi-tional proliferation or apoptosis [34,38–40]. We thus analyzed whether the apoptotic cellsobserved in the transgene-expressing compartment exerted any nonautonomous effect on theneighboring compartment. Expression of p35, a baculovirus protein well known to block
Dally and Growth Control
PLOS Biology | DOI:10.1371/journal.pbio.1002239 August 27, 2015 7 / 28

Fig 3. The nonautonomous reduction in tissue size upon targeted activation of the PI3K/PTEN and TSC/TOR pathways does not rely on Dp53activity and apoptosis and is not affected by nutrient restriction. (A) ci>GFP, ci>Rheb, and ci>Dp110 wing imaginal discs labelled with TUNEL tovisualize apoptotic cells (in red or white). The ci domain is labelled with GFP (in green), and the boundary between A and P cells is marked by a red line. (B)Histogram plotting the quantification of the absolute number of TUNEL-positive cells in the A (light green bars) and P (grey bars) compartments of theindicated genotypes. Error bars indicate the standard deviation. Number of wing discs analyzed per genotype� 10. ***p < 0.001. (C, D) Cuticle preparationsof en>GFP, Rheb (C), and ci>GFP, Dp110 (D) adult wings either in a wild-type background, in a heterozygous background for H99 (a deficiency that uncoversreaper, hid, and grim proapoptotic genes), or coexpressing a dominant negative form of Dp53 (Dp53Ct). The blue line marks the boundary between the A andP compartments. The domains of transgene expression are marked with a blue asterisk. (C’, D’, E) Histograms plotting tissue size (C’, D’, E) and cell densityvalues (C’, E) of the transgene-expressing compartment (blue bars) and the adjacent cell populations (white bars) of adult wings with the indicated genotypesnormalized as a percent of the control wings. Error bars show the standard deviation. Number of wings analyzed per genotype� 10. ***p < 0.001;**p < 0.01; *p < 0.05. (F) Cuticle preparations of ci>GFP adult wings of well-fed (100 g/L yeast food, top) and starved (20 g/L yeast food, bottom) animals.Note the reduction in wing size caused by starvation. (G, H) Histograms plotting tissue size of the transgene-expressing compartment (blue bars) and theadjacent cell populations (white bars) of adult wings with the indicated genotypes normalized as a percent of the control wings. Error bars show the standarddeviation. Number of wings analyzed per genotype� 10. ***p < 0.001; **p < 0.01; *p < 0.05. Quantification was made in well-fed (100 g/L yeast food, lefthistogram) and starved (20 g/L yeast food, right histogram) animals of identical genotypes.
doi:10.1371/journal.pbio.1002239.g003
Dally and Growth Control
PLOS Biology | DOI:10.1371/journal.pbio.1002239 August 27, 2015 8 / 28

apoptosis at the level of the effector apoptotic Caspases [41], was not able to rescue the nonau-tonomous decrease in tissue growth caused by Rheb overexpression (Fig 3E). We found outthat p35 expression caused an increase in cell density in both the transgene-expressingcompartment and in the neighboring one, most probably reflecting apoptosis-induced cellproliferation caused by undead cells. Indeed, mitotic activity was increased in the developingprimordia expressing p35 (S1 Fig). These results indicate that dying cells in the transgene-expressing compartment do not contribute to the nonautonomous reduction in tissue and cellsize.
PTENmutant cells generated in Drosophila tissues have been recently shown to acquire agrowth advantage under starvation conditions at the expense of the wild-type neighboringcells, and this growth advantage has been proposed to rely on the withdrawal of nutrients fromneighboring cells [12]. To assess the impact of nutrient availability on the autonomous andnonautonomous effects caused by expression of Rheb or PTEN-RNAi in defined territories ofthe wing primordium, larvae expressing these transgenes in either the A or P compartmentwere reared on food with varying yeast content, the main source of micronutrients and aminoacids in fly media. Our standard medium contains 50 g/l yeast. We thus subjected experimentallarvae expressing either a dsRNA form of PTEN or Rheb and control larvae expressing GFP tomedia containing 100 g/l and 20 g/l yeast and analyzed the size of the transgene-expressing andnonexpressing cell populations in the resulting adult wings. Despite the expected reduction inthe size of wings of animals reared on food containing 20 g/l yeast (Fig 3F), the extent (in per-centage) of the nonautonomous decrease in tissue size caused by transgene expression was sim-ilar to that observed in animals reared on food containing 100 g/l yeast (Fig 3G and 3H). Thus,the nonautonomous reduction in growth rates is not a consequence of the withdrawal of nutri-ents from neighboring cells.
Autonomous and Nonautonomous Effects on the Dpp Activity GradientWe noticed that activation of the PI3K/PTEN or TSC/TOR pathways in defined populations ofthe wing primordium gave rise to larger but well-proportioned adult structures (Fig 4A, seealso Fig 1). The adjacent wild-type territories were reduced in size, but the patterning elements(e.g., longitudinal veins) were also proportionally well located. The signaling molecule Dpp, amember of the TGF-β superfamily, is expressed at the boundary between the A and P compart-ments in the developing wing (Fig 4B) and plays a major role in positioning the wing veinsalong the anterior–posterior axis [42]. Interestingly, the Dpp gradient scales with size in orderto correctly maintain the wing proportions [43–46], and Dpp is well known to promote tissuegrowth (reviewed in [17,18]). Thus, the autonomous and nonautonomous effects of Rheb orDp110/PI3K overexpression on tissue growth might rely on modulating the range of Dppactivity. Since dpp expression was largely unaffected in transgene-expressing tissues (Fig 4B),we monitored the range of the Dpp activity gradient, visualized by the expression of the Dpptarget gene Spalt (Fig 4C, [47]) and with an antibody against the phosphorylated form of theDpp transducer Mothers Against Dpp (pMAD, Fig 4D). As expected and as a result of thecapacity of the Dpp gradient to scale with tissue size, the range of the Dpp activity gradientwas expanded in the overgrowing transgene-expressing compartment (Fig 4C and 4D). Inorder to quantify the cell-autonomous impact of tissue growth on the Dpp activity gradient, weextracted the pMAD profiles along four lines perpendicular to the dpp expression domain (yel-low lines in Fig 4D) and plotted the average pMAD values along the AP axis in experimental(blue in Fig 4E, 4F, 4H and 4I) and control (red in Fig 4E, 4F, 4H and 4I) wing primordia raisedin the same conditions and immunolabeled in the same tube (as previously done in [45]). Sincethe boundary between A and P cells is out of phase in control and Dp110-expressing wing
Dally and Growth Control
PLOS Biology | DOI:10.1371/journal.pbio.1002239 August 27, 2015 9 / 28

Fig 4. Autonomous and nonautonomous effects on Dpp activity levels upon targeted activation of the PI3K/PTEN and TSC/TOR pathways. (A)Cuticle preparation of adult wings expressingGFP or Dp110 under the control of the ci-gal4 driver, which drives transgene expression in the anterior
Dally and Growth Control
PLOS Biology | DOI:10.1371/journal.pbio.1002239 August 27, 2015 10 / 28

discs (Fig 4E), the pMAD profiles were aligned with respect to the AP boundary to better visu-alize the autonomous and nonautonomous effects on the Dpp activity gradient (Fig 4F and 4I).Despite the visible expansion along the AP axis of the pMAD gradient in the overgrowing com-partment (black asterisk in Fig 4E, 4F and 4I, see also S2 Fig), the total amount of pMAD,quantified as total pixel intensity within each compartment (see Materials and Methods), wascomparable in overgrowing and control compartments (Fig 4G and 4J, see also S2 Fig). A simi-lar relationship between the range of the pMAD gradient and the total amount of pMAD wasobserved when transgene expression was driven in the whole wing primordium (Fig 4K–4M).These results indicate that tissue growth has a major impact in Dpp spreading but not signal-ing. Two observations suggest that the tissue-autonomous expansion of the pMAD gradient isa consequence of increased tissue size, and that this expansion is not solely a consequence ofincreased number of cells. First, Rheb overexpression increased tissue and cell size, but not cellnumber, and led to the expansion of the pMAD gradient (Fig 4I, black asterisk). Second,increased cell number without affecting tissue size (by means of expression of the cell cycle reg-ulators CycE and String/Dcdc25) did not have any impact on the pMAD gradient (Fig 4H,black asterisk).
Interestingly, both the width of the Dpp activity gradient, monitored by the expression ofSpalt (Fig 4C) and pMAD (Fig 4D, 4E, 4F and 4I and S2 Fig), and the total amount of pMADsignaling (Fig 4G and 4J and S2 Fig) were reduced in adjacent wild-type territories. This nonau-tonomous effect was not observed upon expression of cell cycle regulators CycE and String/Dcdc25 (Fig 4H). We next addressed whether the nonautonomous reduction in tissue sizerelied on the capacity of the tissue to compete for the Dpp ligand. For this purpose, we com-pared the size of PI3K/Dp110-expressing and nonexpressing compartments upon depletionof Dpp, by means of expression of a dsRNA form against dpp in the A compartment (Fig 4Nand 4O). Expression of a dsRNA form against dpp in A cells gave rise to a strong reduction intissue size (Fig 4P). Whereas PI3K/Dp110 was still able to induce overgrowth of the transgene-expressing territory (Fig 4N and 4O, blue bars), the nonautonomous reduction in tissue sizewas largely rescued (compare Fig 4N and 4O, white bars). Taken together, these results indicate
compartment. Note the expansion of the anterior intervein regions (blue arrows) upon induction of growth and the corresponding reduction of the posteriorintervein regions (grey arrows). The anterior (A) and posterior (P) compartments are labeled, and the AP boundary is marked by a red line. (B) Wing imaginaldisc of ci>GFP and ci>PTENRNAi larvae labelled to visualized Ci protein (in green) and β-galactosidase (βGal) (in red or white) to visualize dpp (dpp-lacZ)expression. The width of the dpp-lacZ stripe (normalized with respect to the width of the wing pouch) was ci>GFP = 0.082 ± 0.005; ci>PTENRNAi =0.088 ± 0.003; p = 0.55; n > 6. (C) Wing imaginal discs of ci>GFP and ci>GFP, Dp110 larva labelled to visualize Spalt (in red) and GFP (in green) proteinexpression. The white dashed line marks the boundary between A and P cells. The lower panels showmagnification of the Spalt domain. Note that theanterior Spalt domain is wider upon Dp110 expression (thick bracket) whereas the posterior Spalt domain (thin brackets) gets reduced. (D) Wing imaginaldiscs of ci>GFP and ci>GFP, Dp110 larva labelled to visualize pMAD protein (in red or white) and GFP (in green). Lower panels showmagnifications of thepMAD domains, and the red line marks the boundary between the A and P compartments. Horizontal yellow lines were used to generate the pMAD profilesshown in E–I. (E, F, H, I) Average pMAD profiles of wing discs expressingGFP (red line) orGFP and the corresponding transgenes (blue line) under thecontrol of the ci-gal4 driver. Profiles were taken along the AP axis and plotted in absolute positions. The standard error to the mean is shown in thecorresponding color for each genotype. In E, the AP boundary of each experiment is marked by a dashed line of the corresponding color. In F, the APboundary of both experiments was aligned to allow comparison of the profile in each compartment. Number of wing discs analyzed per genotype� 5. Thedomains of transgene expression are marked with a black asterisk. Arrows mark the limits of the Dpp activity gradients. (G, J) Histograms plotting the totalintensity of the pMAD signal in a.u. of the anterior (blue bars) and posterior (white bars) compartments of ci>GFP (G, J) and ci>Dp110 (G) or ci>Rheb (J) wingdiscs. Error bars indicate the standard deviation. Number of wing discs analyzed per genotype� 5. ***p < 0.001. (K) Wing imaginal discs of nub>GFP andnub>Dp110 larvae labelled to visualize pMAD protein (in red), GFP (in green), and DAPI (in blue, to visualize nuclei). (L) Average pMAD profile of wing discsexpressingGFP (red line) or Dp110 (blue line) in the nubbin domain. Profiles were taken along the AP axis and plotted in absolute positions. The standarderror to the mean is shown in the corresponding color for each genotype. Number of wing discs analyzed per genotype� 7. (M) Histogram plotting the totalintensity of the pMAD signal in a.u. of the nubbin domain of nub>GFP (red bar) and nub>Dp110 (blue bar) discs. Error bars indicate the standard deviation.Number of wing discs analyzed per genotype� 5. (N) Histogram plotting the area (in a.u.) of anterior (blue) and posterior (white) domains of wing discsexpressingGFP orGFP and Dp110 in the ci domain. Error bars show the standard deviation. Number of wing discs analyzed per genotype� 15.***p < 0.001 (O) Histogram plotting the area (in a.u.) of anterior (blue) and posterior (white) domains of wing discs expressing eitherGFP or Dp110 in the cidomain together with a dsRNA form against dpp. Error bars show the standard deviation. Number of wing discs analyzed per genotype� 15. ***p < 0.001,**p < 0.01. (P) Wing imaginal discs of ci>GFP and ci>dppRNAi larvae labelled to visualize GFP (in green) and DAPI (in blue, to visualize nuclei).
doi:10.1371/journal.pbio.1002239.g004
Dally and Growth Control
PLOS Biology | DOI:10.1371/journal.pbio.1002239 August 27, 2015 11 / 28

that tissue growth has a major impact in Dpp spreading but not signaling and that the nonau-tonomous reduction in tissue size is most probably a consequence of reduced Dpp signaling.
Dally Contributes to the Autonomous and Nonautonomous Effects onTissue GrowthHeparan sulfate proteoglycans (HSPGs) of the glypican family play key roles in the regulationof morphogen signaling and distribution (reviewed in [48]). Glypicans are glycosylphosphati-dylinositol (GPI)-anchored HSPGs that have a protein core to which heparan sulfate (HS)chains are covalently attached. HS chains provide binding sites for many growth factors, andthe glypican Dally contributes to the spreading of the Dpp ligand over the wing primordium[49–52]. Interestingly, the expression levels of Dally (visualized with two distinct reporters, anenhancer-trap and a proteintrap, see Fig 5A and 5B and S2 Fig) were clearly increased uponactivation of the PI3K/PTEN or TSC/TOR pathways. We next monitored the capacity of tar-geted overexpression of Dally to phenocopy the autonomous and nonautonomous effects ontissue growth, proliferation rates, and Dpp gradient formation observed upon activation ofthese two pathways. Overexpression of Dally in the A or P compartments of the developingwing gave rise to a tissue-autonomous increase in size (Fig 5C–5F, blue bars) and, most impor-tantly, a nonautonomous reduction in size of the adjacent wild-type territories (Fig 5C–5F,white bars). The increase in tissue size was accompanied by an increase in cell number (notethe higher cell density in the transgene expressing compartment, Fig 5D, blue bars). In contrastto the PI3K/PTEN and TSC/TOR pathways, the nonautonomous reduction in tissue sizecaused by Dally overexpression was not accompanied by a decrease in cell size (note that celldensities, if anything, decreased, Fig 5D and 5F, white bars). Thus, other elements regulated bythe growth-promoting pathways, apart from Dally, might have a nonautonomous impact oncell size. In order to address whether growth and proliferation rates are also regulated in a non-autonomous manner by the overexpression of Dally, we induced neutral clones of cells at thebeginning of the third instar period (72 h AEL) and examined the size of these clones 72 h laterin late third instar wing discs. Clone size and number of cells per clone were measured in the Aand P compartments of ci-gal4; UAS-GFP/UAS-Dally wing discs, and these two measurementswere compared to those of control clones induced in ci-gal4; UAS-GFP/+ wing discs and grownin parallel. In Dally-overexpressing wing discs, the size of the clones and the number of cellsper clone in the A compartment were significantly bigger than the size of clones quantified inthe A compartment of GFP-expressing discs (Fig 5G and 5H). Interestingly, clone size andnumber of cells per clone were significantly smaller in the P compartment of Dally-expressingwing discs than in GFP-expressing discs (Fig 5G and 5H). These results indicate that overex-pression of Dally causes a nonautonomous reduction in proliferation rates and imply that thenonautonomous reduction in tissue size observed in adult wings is a consequence of reducedcell number. Targeted overexpression of Dally also gave rise to a tissue-autonomous increase inthe width of the pMAD signaling gradient and to a remarkable reduction in pMAD signalingin nearby territories (Fig 5I–5K). In this case, the total amount of pMAD was higher in Dally-overexpressing compartments than in the control one (Fig 5K). We noticed that the patterningelements, including wing veins and the wing margin, were well located and formed, thus indi-cating that Dally overexpression exerts a specific role on Dpp gradient formation and a minorrole on the other secreted signaling molecules involved in wing growth and patterning.
We next monitored the contribution of Dally to the autonomous and nonautonomouseffects on tissue growth caused by targeted deregulation of the PI3K/PTEN and TSC/TORpathways. For this purpose, we expressed a dsRNA form of Dally together with Dp110/PI3Kor Rheb. Expression of a dsRNA form of Dally in otherwise wild-type wings caused a mild
Dally and Growth Control
PLOS Biology | DOI:10.1371/journal.pbio.1002239 August 27, 2015 12 / 28
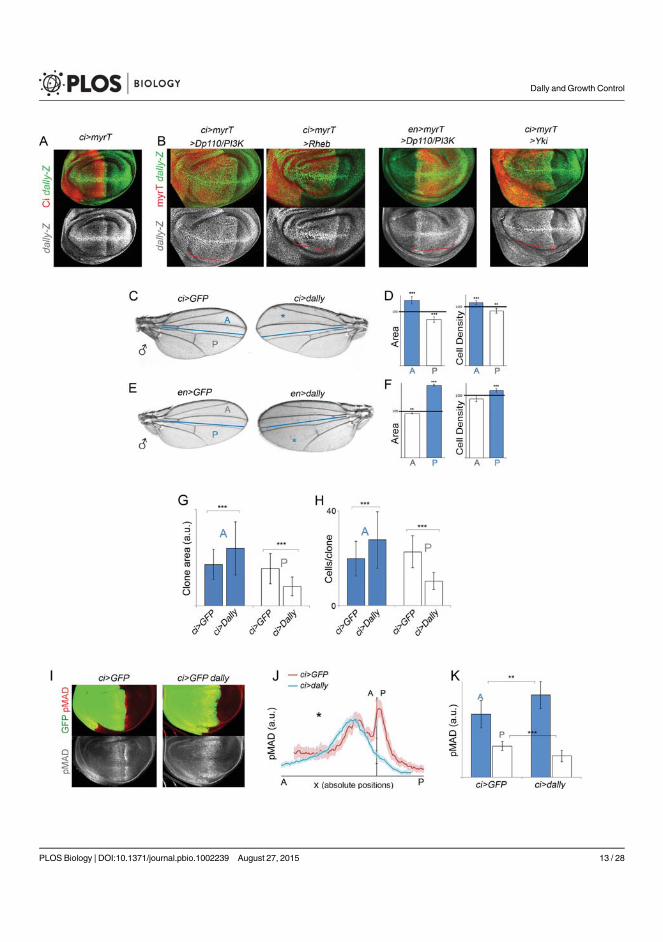
Dally and Growth Control
PLOS Biology | DOI:10.1371/journal.pbio.1002239 August 27, 2015 13 / 28

tissue-autonomous size reduction (S2 Fig, blue bars), but no visible effect was observed in adja-cent cell territories (S2 Fig, white bars). The width of the Dpp activity gradient was mildlyreduced in the transgene-expressing compartment (S2 Fig). Interestingly, depletion of Dallywas able to largely rescue not only the autonomous but also the nonautonomous effects on tis-sue growth caused by Rheb or PI3K/Dp110 expression (Fig 6A–6C). The autonomous expan-sion of the Dpp activity gradient and the nonautonomous retraction caused by targetedexpression of Dp110 was also largely rescued by the dsRNA form of Dally (S2 Fig). Depletionof Sulfateless (Sfl), an enzyme needed for the modification of HS chains within glypicans [53],also rescued the autonomous and nonautonomous effects on tissue growth caused by PTENdepletion (Fig 6E). Targeted expression of dsRNA forms of sfl in otherwise wild-type wingscaused a strong tissue-autonomous size reduction (S2 Fig, blue bars), but little effect wasobserved in adjacent cell territories (S2 Fig, white bars). Interestingly, depletion of Dally wasnot able to rescue the nonautonomous reduction in cell size caused by activation of the PI3K/PTEN and TSC/TOR pathways (Fig 6A–6C), reinforcing the proposal that cell size is nonauto-nomously regulated by the PI3K/PTEN and TSC/TOR pathways in a Dally-independentmanner.
Mutations in the hippo pathway, originally identified in Drosophila by their capacity toinduce cell proliferation and organ growth, induce tumors in mouse models and occur in abroad range of human carcinomas, including lung, colorectal, ovarian, and liver cancers(reviewed in [54]). Interestingly, the expression levels of the two existing Drosophila glypicans,Dally and Dally-like, are up-regulated upon deregulation of the hippo/Yorkie pathway (Fig 5Band [55]). Moreover, simultaneous mutations of both Dally and Dally-like have been shown torescue the overgrowth caused by clones of cells overexpressing Yorkie [55]. We thus revisitedthe contribution of these two glypicans to the autonomous effects on tissue growth caused byderegulation of the hippo/Yorkie pathway and analyzed the potential nonautonomous effectson tissue size of the adjacent cell populations. Similar to what happened to TOR activation,deregulation of the hippo/Yorkie pathway causes strong overgrowth and larval lethality [56].We thus induced a mild activation of the pathway by expressing a wild-type form of thetranscription factor Yorkie. Overexpression of Yorkie in the A or P compartments of the devel-oping wing gave rise to a tissue-autonomous increase in size and, most interestingly, a nonau-tonomous size reduction of the adjacent wild-type territories (Fig 6D and S2 Fig). Interestingly,both the autonomous and nonautonomous effects on tissue size were rescued by depletion of
Fig 5. Overexpression of Dally phenocopies the autonomous and nonautonomous effects of targeted activation of the PI3K/PTEN and TSC/TORpathways. (A, B) Representative wing discs of the indicated genotypes labeled to visualize dally-lacZ (antibody to β-Gal, green or white) and myrTomato (myrT,in red) expression to mark the transgene-expressing domain. Note stronger expression of dally-lacZ upon activation of the PI3K/PTEN, TSC/TOR, or hippo/Yorkie pathways (red brackets). (C, E) Cuticle preparations of male adult wings overexpressing Dally under the control of the ci-gal4 (C) or en-gal4 (E) drivers.The blue line marks the boundary between the anterior (A) and posterior (P) compartments, and the domains of Dally overexpression are marked with a blueasterisk. (D, F). Histograms plotting tissue size (left) and cell density values (right) of the Dally-expressing domains (blue bars) and the adjacent compartments(white bars) of adult wings overexpressing Dally under the control of the ci-gal4 (D) or en-gal4 (F) drivers. Values are normalized as a percent of the control(GFP-expressing) wings. Error bars show the standard deviation. Number of wings analyzed per genotype� 10. ***p < 0.001; **p < 0.01. (G, H) Histogramsplotting the size of clones (in a.u., G) and the number of cells per clone (H) located in the A or P compartment of ci-gal4,UAS-GFP and ci-gal4,UAS-GFP/UAS-Dallywing discs. Clones were generated at the beginning of the third instar period and quantified 72 h later in late third instar wing discs. Error bars indicatethe standard deviation. Number of clones analyzed per genotype� 30. ***p < 0.001. Size of clones (A compartment, a.u.): ci>GFP = 388 ± 141; ci>GFP,Dally = 537 ± 169. Size of clones (P compartment, a.u.): ci>GFP = 348 ± 140; ci>GFP, Dally = 182 ± 89. Number of cells per clone (A compartment):ci>GFP = 20 ± 7; ci>GFP, Dally = 28 ± 12. Number of cells per clone (P compartment): ci>GFP = 23 ± 7; ci>GFP, Dally = 10 ± 4. (I) Wing imaginal discs ofci>GFP and ci>GFP, Dally larvae labelled to visualize pMAD protein (in red or white) and GFP (in green). (J) Average pMAD profiles of wing discs expressingGFP (red line) orGFP andDally (blue line) under the control of the ci-gal4 driver. Profiles were taken along the AP axis and plotted in absolute positions. Thestandard error to the mean is shown in the corresponding color for each genotype. The AP boundary of both experiments was aligned to allow comparison of theprofile in each compartment. Number of wing discs analyzed per genotype� 5. (K) Histogram plotting the total intensity of the pMAD signal in a.u. of the anterior(blue bars) and posterior (white bars) compartments of ci>GFP and ci>Dally,GFPwing discs. Error bars indicate the standard deviation. Number of wing discsanalyzed per genotype� 5. ***p < 0.001; **p < 0.01.
doi:10.1371/journal.pbio.1002239.g005
Dally and Growth Control
PLOS Biology | DOI:10.1371/journal.pbio.1002239 August 27, 2015 14 / 28

Dally (Fig 6D). In contrast, depletion of Dally-like, using two different dsRNA forms able toreduce its protein levels, did not have this effect (S2 Fig).
Taken together, the above results indicate that Dally, and not Dally-like, contributes to thetissue-autonomous and nonautonomous effects on tissue growth caused by targeted deregula-tion of the PI3K/PTEN, TSC/TOR, and hippo/Yorkie pathways. These pathways exert their tis-sue-autonomous action through Dally, most probably by modulating the spreading of the Dppmorphogen and other secreted growth factors, as Dp110 overexpression was still able to inducesome growth in Dpp-depleted tissues (Fig 4O). We hypothesize that the nonautonomouseffects are a consequence of withdrawal of Dpp from neighboring cells. In order to reinforcethe latter notion, we analyzed the capacity of the Dpp type I receptor Thickveins (Tkv), whichhas been shown to trap Dpp and limit its spreading [43,57], to phenocopy the nonautonomouseffects on tissue growth observed upon targeted deregulation of these pathways. Although theexpression levels of Tkv (visualized with both an enhancer and a protein trap) were unaffectedby targeted deregulation of the PI3K/PTEN pathway (S3 Fig), targeted expression of a wild-type form of Tkv or a dominant negative form of the receptor able to bind Dpp but unable to
Fig 6. Dally contributes to the autonomous and nonautonomous effects of targeted deregulation of the PI3K/PTEN, TSC/TOR, and hippo/yorkiepathways. (A–E) Cuticle preparations of adult wings expressing the indicated transgenes under the control of the ci-gal4 (A, C) or en-gal4 (B, D, E) drivers. Theblue linemarks the boundary between the anterior (A) and posterior (P) compartments, and the domains of transgene expression are marked with a blueasterisk. On the right side of each panel, histograms plotting tissue size (A–E) and cell density (A–D) of the transgene-expressing (blue bars) or nonexpressing(white bars) compartments of adult wings expressing the indicated transgenes. Error bars show the standard deviation. Number of wings analyzed pergenotype� 10. ***p < 0.001; ** p < 0.01; *p < 0.05.
doi:10.1371/journal.pbio.1002239.g006
Dally and Growth Control
PLOS Biology | DOI:10.1371/journal.pbio.1002239 August 27, 2015 15 / 28
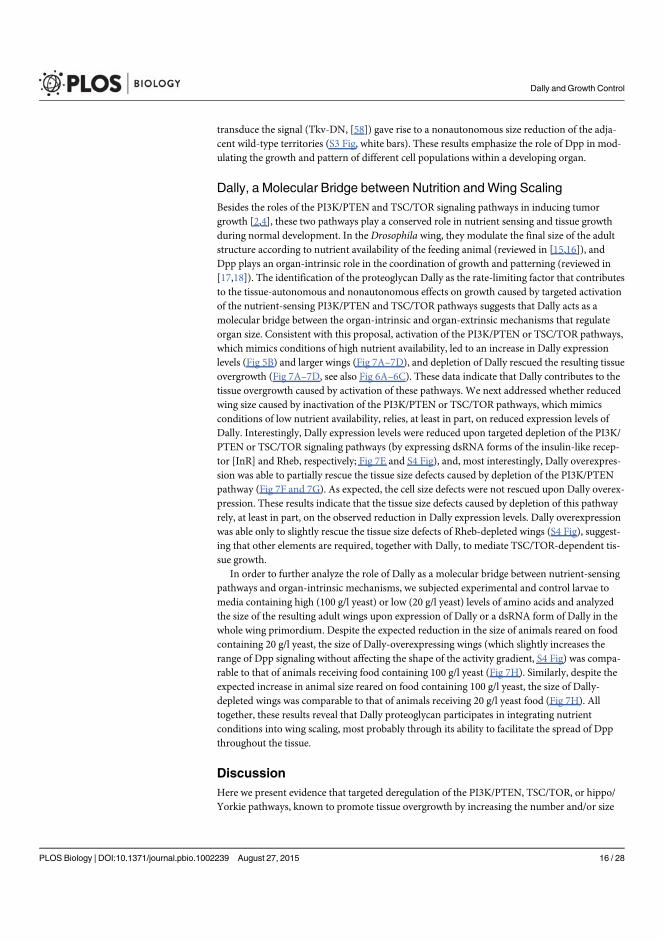
transduce the signal (Tkv-DN, [58]) gave rise to a nonautonomous size reduction of the adja-cent wild-type territories (S3 Fig, white bars). These results emphasize the role of Dpp in mod-ulating the growth and pattern of different cell populations within a developing organ.
Dally, a Molecular Bridge between Nutrition andWing ScalingBesides the roles of the PI3K/PTEN and TSC/TOR signaling pathways in inducing tumorgrowth [2,4], these two pathways play a conserved role in nutrient sensing and tissue growthduring normal development. In the Drosophila wing, they modulate the final size of the adultstructure according to nutrient availability of the feeding animal (reviewed in [15,16]), andDpp plays an organ-intrinsic role in the coordination of growth and patterning (reviewed in[17,18]). The identification of the proteoglycan Dally as the rate-limiting factor that contributesto the tissue-autonomous and nonautonomous effects on growth caused by targeted activationof the nutrient-sensing PI3K/PTEN and TSC/TOR pathways suggests that Dally acts as amolecular bridge between the organ-intrinsic and organ-extrinsic mechanisms that regulateorgan size. Consistent with this proposal, activation of the PI3K/PTEN or TSC/TOR pathways,which mimics conditions of high nutrient availability, led to an increase in Dally expressionlevels (Fig 5B) and larger wings (Fig 7A–7D), and depletion of Dally rescued the resulting tissueovergrowth (Fig 7A–7D, see also Fig 6A–6C). These data indicate that Dally contributes to thetissue overgrowth caused by activation of these pathways. We next addressed whether reducedwing size caused by inactivation of the PI3K/PTEN or TSC/TOR pathways, which mimicsconditions of low nutrient availability, relies, at least in part, on reduced expression levels ofDally. Interestingly, Dally expression levels were reduced upon targeted depletion of the PI3K/PTEN or TSC/TOR signaling pathways (by expressing dsRNA forms of the insulin-like recep-tor [InR] and Rheb, respectively; Fig 7E and S4 Fig), and, most interestingly, Dally overexpres-sion was able to partially rescue the tissue size defects caused by depletion of the PI3K/PTENpathway (Fig 7F and 7G). As expected, the cell size defects were not rescued upon Dally overex-pression. These results indicate that the tissue size defects caused by depletion of this pathwayrely, at least in part, on the observed reduction in Dally expression levels. Dally overexpressionwas able only to slightly rescue the tissue size defects of Rheb-depleted wings (S4 Fig), suggest-ing that other elements are required, together with Dally, to mediate TSC/TOR-dependent tis-sue growth.
In order to further analyze the role of Dally as a molecular bridge between nutrient-sensingpathways and organ-intrinsic mechanisms, we subjected experimental and control larvae tomedia containing high (100 g/l yeast) or low (20 g/l yeast) levels of amino acids and analyzedthe size of the resulting adult wings upon expression of Dally or a dsRNA form of Dally in thewhole wing primordium. Despite the expected reduction in the size of animals reared on foodcontaining 20 g/l yeast, the size of Dally-overexpressing wings (which slightly increases therange of Dpp signaling without affecting the shape of the activity gradient, S4 Fig) was compa-rable to that of animals receiving food containing 100 g/l yeast (Fig 7H). Similarly, despite theexpected increase in animal size reared on food containing 100 g/l yeast, the size of Dally-depleted wings was comparable to that of animals receiving 20 g/l yeast food (Fig 7H). Alltogether, these results reveal that Dally proteoglycan participates in integrating nutrientconditions into wing scaling, most probably through its ability to facilitate the spread of Dppthroughout the tissue.
DiscussionHere we present evidence that targeted deregulation of the PI3K/PTEN, TSC/TOR, or hippo/Yorkie pathways, known to promote tissue overgrowth by increasing the number and/or size
Dally and Growth Control
PLOS Biology | DOI:10.1371/journal.pbio.1002239 August 27, 2015 16 / 28

of cells, induces a nonautonomous reduction in tissue size of adjacent cell populations. Thisnonautonomous effect is a consequence of a reduction in both cell size and proliferation rates(cell number), and it is not a consequence of programmed cell death or the withdrawal of nutri-ents from neighboring tissues, as reducing the levels of proapoptotic genes or subjecting larvae
Fig 7. Dally acts as a bridge between nutrient sensing and wing scaling. (A–D) Cuticle preparations (A, C) and histograms plotting tissue sizenormalized as a percent of the control wings (B, D) of nub>Rheb (A, B) or nub>Dp110 (C, D) adult wings coexpressing eitherGFP or dallyRNAi. Twoindependent RNA interference (RNAi) lines were used in B. Error bars show the standard deviation. Number of wings analyzed per genotype� 10.***p < 0.001. (E) Representative wing discs of the indicated genotypes labeled to visualize dally-lacZ (antibody to β-Gal, green or white) and myrTexpression (in red) to mark the transgene-expressing domain. Higher magnification pictures of the squared regions are shown on the right side. Note thereduced expression of dally-lacZ upon depletion of the TSC/TOR or PTEN/PI3K pathways. (F) Representative wing discs of the indicated genotypes andlabeled to visualize Ci (red) and DAPI (in blue). Ci labels the anterior compartment. A, anterior compartment; P, posterior compartment. (G) Histogramplotting the P/A size ratio of wing discs of the indicated genotypes. Error bars show the standard deviation. Number of wing discs analyzed pergenotype� 10. ***p < 0.001. P/A ratios: hh>2XGFP = 0.55 ± 0.02; hh>GFP, Dp110-RNAi = 0.29 ± 0.06; hh>dally, Dp110-RNAi = 0.42 ± 0.07. (H) Histogramplotting absolute size in a.u. of adult wings of the indicated genotypes. Quantification was made in well-fed (100 g/L yeast food) and starved (20 g/L yeastfood) animals. Error bars show the standard deviation. Number of wings analyzed per genotype� 10. ***p < 0.001. ns, not significant.
doi:10.1371/journal.pbio.1002239.g007
Dally and Growth Control
PLOS Biology | DOI:10.1371/journal.pbio.1002239 August 27, 2015 17 / 28
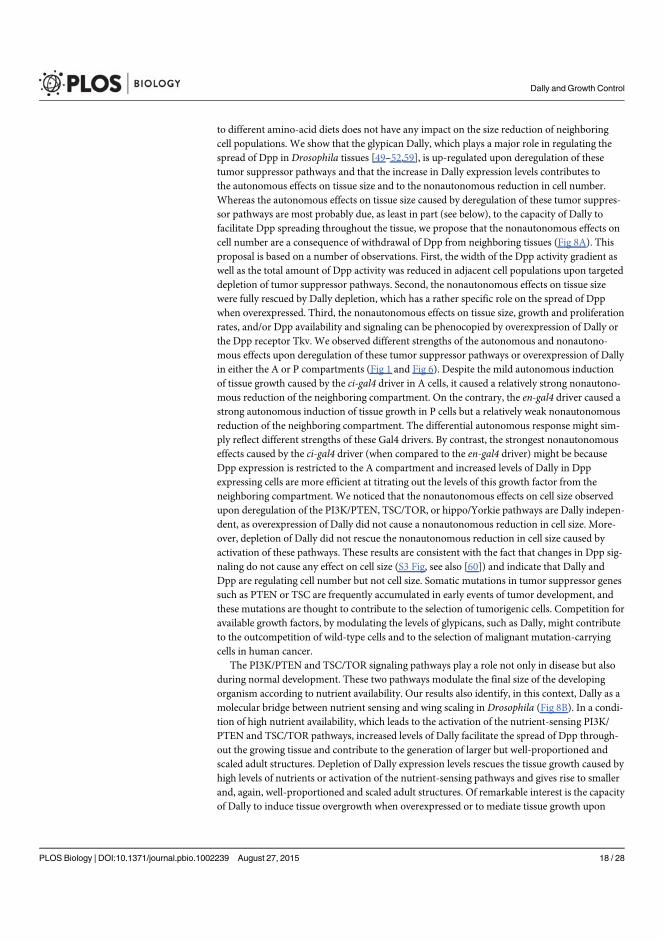
to different amino-acid diets does not have any impact on the size reduction of neighboringcell populations. We show that the glypican Dally, which plays a major role in regulating thespread of Dpp in Drosophila tissues [49–52,59], is up-regulated upon deregulation of thesetumor suppressor pathways and that the increase in Dally expression levels contributes tothe autonomous effects on tissue size and to the nonautonomous reduction in cell number.Whereas the autonomous effects on tissue size caused by deregulation of these tumor suppres-sor pathways are most probably due, as least in part (see below), to the capacity of Dally tofacilitate Dpp spreading throughout the tissue, we propose that the nonautonomous effects oncell number are a consequence of withdrawal of Dpp from neighboring tissues (Fig 8A). Thisproposal is based on a number of observations. First, the width of the Dpp activity gradient aswell as the total amount of Dpp activity was reduced in adjacent cell populations upon targeteddepletion of tumor suppressor pathways. Second, the nonautonomous effects on tissue sizewere fully rescued by Dally depletion, which has a rather specific role on the spread of Dppwhen overexpressed. Third, the nonautonomous effects on tissue size, growth and proliferationrates, and/or Dpp availability and signaling can be phenocopied by overexpression of Dally orthe Dpp receptor Tkv. We observed different strengths of the autonomous and nonautono-mous effects upon deregulation of these tumor suppressor pathways or overexpression of Dallyin either the A or P compartments (Fig 1 and Fig 6). Despite the mild autonomous inductionof tissue growth caused by the ci-gal4 driver in A cells, it caused a relatively strong nonautono-mous reduction of the neighboring compartment. On the contrary, the en-gal4 driver caused astrong autonomous induction of tissue growth in P cells but a relatively weak nonautonomousreduction of the neighboring compartment. The differential autonomous response might sim-ply reflect different strengths of these Gal4 drivers. By contrast, the strongest nonautonomouseffects caused by the ci-gal4 driver (when compared to the en-gal4 driver) might be becauseDpp expression is restricted to the A compartment and increased levels of Dally in Dppexpressing cells are more efficient at titrating out the levels of this growth factor from theneighboring compartment. We noticed that the nonautonomous effects on cell size observedupon deregulation of the PI3K/PTEN, TSC/TOR, or hippo/Yorkie pathways are Dally indepen-dent, as overexpression of Dally did not cause a nonautonomous reduction in cell size. More-over, depletion of Dally did not rescue the nonautonomous reduction in cell size caused byactivation of these pathways. These results are consistent with the fact that changes in Dpp sig-naling do not cause any effect on cell size (S3 Fig, see also [60]) and indicate that Dally andDpp are regulating cell number but not cell size. Somatic mutations in tumor suppressor genessuch as PTEN or TSC are frequently accumulated in early events of tumor development, andthese mutations are thought to contribute to the selection of tumorigenic cells. Competition foravailable growth factors, by modulating the levels of glypicans, such as Dally, might contributeto the outcompetition of wild-type cells and to the selection of malignant mutation-carryingcells in human cancer.
The PI3K/PTEN and TSC/TOR signaling pathways play a role not only in disease but alsoduring normal development. These two pathways modulate the final size of the developingorganism according to nutrient availability. Our results also identify, in this context, Dally as amolecular bridge between nutrient sensing and wing scaling in Drosophila (Fig 8B). In a condi-tion of high nutrient availability, which leads to the activation of the nutrient-sensing PI3K/PTEN and TSC/TOR pathways, increased levels of Dally facilitate the spread of Dpp through-out the growing tissue and contribute to the generation of larger but well-proportioned andscaled adult structures. Depletion of Dally expression levels rescues the tissue growth caused byhigh levels of nutrients or activation of the nutrient-sensing pathways and gives rise to smallerand, again, well-proportioned and scaled adult structures. Of remarkable interest is the capacityof Dally to induce tissue overgrowth when overexpressed or to mediate tissue growth upon
Dally and Growth Control
PLOS Biology | DOI:10.1371/journal.pbio.1002239 August 27, 2015 18 / 28
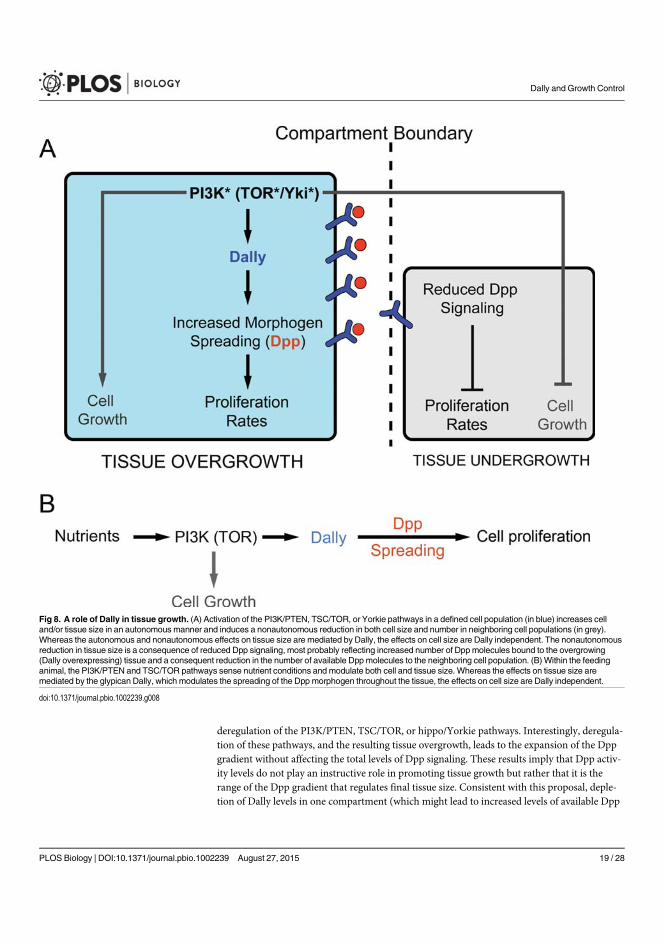
deregulation of the PI3K/PTEN, TSC/TOR, or hippo/Yorkie pathways. Interestingly, deregula-tion of these pathways, and the resulting tissue overgrowth, leads to the expansion of the Dppgradient without affecting the total levels of Dpp signaling. These results imply that Dpp activ-ity levels do not play an instructive role in promoting tissue growth but rather that it is therange of the Dpp gradient that regulates final tissue size. Consistent with this proposal, deple-tion of Dally levels in one compartment (which might lead to increased levels of available Dpp
Fig 8. A role of Dally in tissue growth. (A) Activation of the PI3K/PTEN, TSC/TOR, or Yorkie pathways in a defined cell population (in blue) increases celland/or tissue size in an autonomous manner and induces a nonautonomous reduction in both cell size and number in neighboring cell populations (in grey).Whereas the autonomous and nonautonomous effects on tissue size are mediated by Dally, the effects on cell size are Dally independent. The nonautonomousreduction in tissue size is a consequence of reduced Dpp signaling, most probably reflecting increased number of Dppmolecules bound to the overgrowing(Dally overexpressing) tissue and a consequent reduction in the number of available Dppmolecules to the neighboring cell population. (B) Within the feedinganimal, the PI3K/PTEN and TSC/TOR pathways sense nutrient conditions and modulate both cell and tissue size. Whereas the effects on tissue size aremediated by the glypican Dally, which modulates the spreading of the Dpp morphogen throughout the tissue, the effects on cell size are Dally independent.
doi:10.1371/journal.pbio.1002239.g008
Dally and Growth Control
PLOS Biology | DOI:10.1371/journal.pbio.1002239 August 27, 2015 19 / 28

in the neighboring cell population) does not cause any visible nonautonomous effect in tissuesize (S2 Fig). These results are reminiscent of the capacity of Dpp to restrict its own spreadingthrough the repression of Pentagone, a diffusible protein that interacts with Dally and contrib-utes to the expansion of the Dpp gradient [45,46,61]. The graded distribution of Dpp leads, viathe interaction with its receptor complex, to the graded activation of Mad/Medea, which inturn represses the transcription of brinker (brk, reviewed in [42]). This creates a gradient ofBrk expression that is reciprocal to the Dpp gradient. Brk is a transcriptional repressor thatacts negatively to establish, in a dose-dependent manner, the expression domain of Dpp targetgenes like spalt [62–64]. Thus, Dpp regulates the expression of target genes by repressing brin-ker. Remarkably, the reduced size of the wing primordium observed in hypomorphic alleles ofdpp is restored when combined with brkmutants [65]. This experimental evidence indicatesthat Dpp controls wing growth entirely via repression of brk. The Dally-mediated increase inthe width of the Dpp gradient observed upon deregulation of the PI3K/PTEN, TSC/TOR, orhippo/Yorkie pathways might contribute to restrict the expression domain of brk to the lateralsides of the wing primordium. Similarly, the nonautonomous decrease in the width of the Dppgradient might cause an expansion of the brk domain, which is known to repress growth. Inter-estingly, Dally-mediated spreading of other secreted growth factors might also contribute tothe autonomous effects on tissue growth caused by deregulation of the PI3K/PTEN, TSC/TOR,or hippo/Yorkie pathways. This is revealed by the fact that Dally depletion rescues both theautonomous and the nonautonomous effects (Fig 6), whereas deregulation of these pathwaysare still able to induce some growth upon knocking down Dpp (Fig 4O).
Compartments have been proposed to be units of growth control [66]. In other words, thesize of each compartment is controlled independently. Our results on the lack of nonautono-mous effects on tissue growth upon depletion of Dally or Sfl, the enzyme needed for the modifi-cation of HS chains within glypicans, indicate that this is the case. Targeted depletion ofglypican expression or activity in the developing compartments gave rise to an autonomousreduction in tissue size without affecting the neighboring compartment (S2 Fig). However,independent lines of evidence support the view that adjacent compartments buffer local varia-tions in tissue growth caused by different means, including a nonautonomous reduction in tis-sue size upon depletion of the protein biosynthetic machinery [37] or reduced epidermalgrowth factor receptor (EGFR) activity [67]. Our results on the capacity of overgrowing com-partments to withdraw Dpp from neighboring tissues upon targeted deregulation of the PI3K/PTEN, TSC/TOR, or hippo/Yorkie pathways and to cause a nonautonomous reduction ingrowth and proliferation rates reinforce the view that compartments are susceptible to modu-late their growth rates upon different types of stress, including depletion of tumor suppressorgenes. Interestingly, the halteres and wings of Drosophila are homologous thoracic appendages,and the activity of the Ultrabithorax (Ubx) Hox gene in the haltere discs contributes to definingits reduced size. Remarkably, it does so by reducing the expression levels of Dally [68–71], thusreinforcing the role of Dally in modulating tissue growth in epithelial organs.
Materials and Methods
Drosophila StrainsTheDrosophila strains used were UAS–PTENRNAi (ID 101475, VDRC); UAS-RhebRNAi
(HMS00923, TRiP);UAS-dallyRNAi (ID 14136, VDRC and HMS00905, TRiP); UAS-dlpRNAi (ID100268, VDRC; HMS00875, TRiP and HMS00903, TRiP); UAS-sulfatelessRNAi (ID 5070, VDRCand HMS00543, TRiP); UAS-dppRNAi (JF01371, TRiP); UAS-InRRNAi (ID 992, VDRC); UAS-Dp110RNAi (ID 38985, VDRC); dally-YFP (115511, DGRC); tkv-YFP (115298, DGRC); tkv-lacZ(P(lacZ)tkvk16713, Bloomington),UAS-dally and dally-lacZ (P(lacZ)dally06464, [50], kind gifts
Dally and Growth Control
PLOS Biology | DOI:10.1371/journal.pbio.1002239 August 27, 2015 20 / 28
from E. Sánchez-Herrero);UAS-dp53ct (a dominant negative version of Dp53, [72]); Df(3L)H99(a deficiency that covers the pro-apoptotic genes hid, grim, and reaper, [35]); salPE-Gal4 [47];dpp-lacZ [73]. en-gal4, ci-gal4, nub-gal4, UAS-dlp,UAS-cyclin-E andUAS-string (kind gifts fromB. Edgar),UAS-tkv andUAS-tkvDN (a dominant negative version of tkv that lacked the cyto-plasmic kinase domain necessary for signal transduction [58]),UAS–yki (a kind gift from S.Cohen), UAS–Dp110/PI3K andUAS-Rheb are described in Flybase.
ImmunohistochemistryThe antibodies used were rabbit anti-Spalt (a kind gift from R. Barrio, [47]), rabbit anti-pMAD(a kind gift from G. Morata), rabbit anti–phosphorylated histone 3 (PH3) (Cell Signaling),rabbit anti-βgal (Cappel), rat anti-Ci (2A1, DSHB), and mouse anti-Dally-like (13G8, DSHB).Secondary antibodies were obtained from Molecular Probes. TUNEL analysis was performedas described in [74].
Quantification of Tissue and Cell Size in Adult WingsThe sizes of the wing and of the A and P compartments were measured using Image J Software(NIH, United States). Cell density was measured as the number of hairs (each wing cell differ-entiates a hair) per defined area. Two conserved regions between veins L4 and L5 (P compart-ment) and veins L2 and L3 (A compartment) were used to measure cell densities. The finalarea and cell density values were normalized as a percent of the control values of GFP express-ing samples under the corresponding Gal4-drivers. At least ten adult wings per genotype werescored. Only adult males were scored. The average values and the corresponding standard devi-ation were calculated, and a t-test analysis was carried out. The average values, the correspond-ing standard deviations, and the corresponding p-values are included in S1 Data.
Quantification of Tissue Growth in Developing Wing DiscsHatched first instar larvae were sorted from egg laying plates (egg laying period of 4 h at 25°C),transferred to fresh tubes, allowed to growth at 25°C, and dissected at three time points ofdevelopment (72 h, 96 h and 140 h). The size of the A and P compartments in the wing primor-dia was measured using Fiji Software (NIH, US). At least ten wing discs per genotype and pertime point were scored. The corresponding standard deviation was calculated, and a t-test anal-ysis was carried out. The average values, the corresponding standard deviations, and the corre-sponding p-values are included in S1 Data.
Proliferation and Growth Rate Measurements by Clonal AnalysisEarly third instar (72 h AEL) larvae of the following genotypes: (1) hs-FLP, ubi-nls-RFP,FRT19A/FRT19A; ci-gal4, UAS-GFP/+, (2) hs-FLP, ubi-nls-RFP, FRT19A/FRT19A; ci-gal4,UAS-GFP/UAS-Dp110, and (3) hs-FLP, ubi-nls-RFP, FRT19A/FRT19A; ci-gal4, UAS-GFP/UAS-Dally, were heat-shocked at 38°C for 1 h and then transferred to 25°C. Wing discs weredissected 72 h after clone induction. The size of clones, visualized by the absence of RFPexpression, was quantified from confocal images with ImageJ software (NIH, US). Wing discswere also labelled with DAPI to quantify cell number. At least 30 clones were quantified. Aver-age values and the corresponding standard deviations were calculated, and a t-test analysis wascarried out. Clones in the three different genotypes were induced and dissected in parallel, andthe same control wing discs (genotype nr 1) were used in Figs 2 and 5. The average values, thecorresponding standard deviations, and the corresponding p-values are included in S1 Data.
Dally and Growth Control
PLOS Biology | DOI:10.1371/journal.pbio.1002239 August 27, 2015 21 / 28

Flow Cytometry AnalysisWing imaginal discs of each genotype were dissected in cold PBS, dissociated with trypsin-EDTA at 32°C for 45 min, and fixed with 4% formaldehyde for 20 min. Cells were centrifugedat 2,000 rpm for 2 min, resuspended in 1 ml of 70% ethanol, and incubated for 1 h at roomtemperature (RT). After centrifugation, the pellet was resuspended in PBS with DAPI 1 mg/mland RNase 100 mg/ml and incubated for 1 h at RT. DAPI fluorescence was determined by flowcytometry using a FacsAria I SORP sorter (Beckton Dickinson, San Jose, California). Excitationwith the blue line of the laser (488 nm) permits the acquisition of scatter parameters. Blue laser(488 nm) was used for GFP excitation, and a UV laser (350 nm) for DAPI excitation. Doubletswere discriminated using an integral/peak dot plot of DAPI fluorescence. Cell cycle histogramswere obtained on each sample according to the GFP fluorescence, and cell cycle analysis wasdone on DAPI fluorescence collected at 440 nm. DNA analysis on single fluorescence histo-grams was done using Summit software (Dako Colorado).
pMAD Expression ProfileIn order to obtain the pMAD expression profile at the same developmental stage in all geno-types analyzed, larvae were fed with food complemented with bromophenol blue (0,2 g in 100ml of fly food), as described in [75], and wandering larvae with empty (white) gut, correspond-ing to 1–6 h before the entry into pupal stage, were used to dissect the wing discs. As previouslydescribed in [45], all wing discs from a dataset (GFP control and experimental discs) were fixedand stained together to avoid variability between discs and mounted on the same slide toreduce potential variation in thickness between the slide and the coverslip across different sam-ples. All discs from a dataset were imaged under identical settings using a Leica SP2 confocalmicroscope (0.36 μm of step size). Confocal conditions were adjusted to avoid saturated pixelswith maximal intensity. After image acquisition, four consecutive slices (above and below thebrightest slice from each stack) were manually selected by visual inspection, and a mean projec-tion of these nine slices was subsequently performed. Using a reduced number of slices andperforming the mean projection allowed us to reduce the noise as well as to avoid the signalfrom the peripodial membrane. Indeed, we made sure that these nine slices contained signalfrom the columnar cells of the pouch only. All discs were rotated to have anterior to the leftand dorsal upwards orientation. The remaining analyses were applied solely to the wing pouch.We extracted the profiles along the anterior–posterior (AP) axis parallel to the dorsal-ventral(DV) boundary in four different offsets (two in the dorsal compartment and two in the ventralone). The positioning of the AP boundary was scored by the GFP expression driven by the gal4line. Data are included in S1 Data. To quantify total pMAD signaling of a particular region ofinterest (A or P compartments or the whole wing pouch), signal intensities per pixel were firstcollected from raw images taken with the same laser confocal conditions using the histogramfunction of Fiji Software (NIH, US). Confocal conditions were adjusted to avoid saturated pix-els with maximal intensity. Total pMAD signaling per region of interest was quantified as thesum of all pixel intensities. All wing discs from a dataset (GFP control and experimental discs)were fixed and stained together. All of the image processing and data extraction were per-formed using Fiji Software (NIH, USA). At least five discs per genotype were analyzed. Theaverage values, the corresponding standard deviations, and the corresponding p-values areincluded in S1 Data.
Fly Food with Varying Concentrations of YeastWe adapted the food recipe described in [76]. The following recipes were used to vary the con-centration of yeast: (A) 100 g/L yeast food: 1 liter of standard fly medium contains 100 g of
Dally and Growth Control
PLOS Biology | DOI:10.1371/journal.pbio.1002239 August 27, 2015 22 / 28

fresh yeast, 100 g of sucrose, 27 g bacto agar, 3 mL of propionic acid, and 30 mL of nipagin;and (B) 20 g/L yeast food (starvation): it was generated by reducing the amount of fresh yeastwithout altering the other ingredients.
Hatched first instar larvae were sorted from egg laying plates (egg laying period of 8 h at25°C), transferred to tubes with the different yeast concentration foods and allowed to grow at25°C to adulthood. Control animals were analyzed in parallel in each experimental condition.
Statistical AnalysesIn all quantifications, the Student’s t-test (two-tailed) was used to test for significance.Significance is indicated in the figures using the following symbols: �p< 0.05, ��p< 0.01,���p< 0.001. Error bars represent either the standard deviation (in the case of tissue size andcell density measurements) or the standard error to the mean (in the case of quantification ofmitotic figures, apoptotic cells, and pMAD signal intensity).
Supporting InformationS1 Data. Quantitative measurements with their corresponding standard deviations of tis-sue size and/or cell density values in adult wings (Figs 1–3, Figs 5–7, and S1–S4 Figs) orwing imaginal discs (Fig 4 and Fig 7), clonal area and number of cells per clone (Fig 2 andFig 5), number of apoptotic cells (Fig 3 and S1 Fig), pMAD intensity (Fig 4, Fig 5, andS2 Fig), and mitotic figures (S1 Fig) of individuals expressing the indicated transgenesunder the control of the corresponding Gal4 drivers. A t-test was carried out to calculate thep-value as a measurement of the statistical significance. Data are ordered with respect to thecorresponding main or supplementary figures. Further tabs present the underlying numericaldata used to generate the pMAD profiles shown in Figs 4E, 4F, 4H, 4I, 4L, and 5J and S2A, S2J,S2K and S4C Figs.(XLSX)
S1 Fig. Nonautonomous effects on tissue size upon targeted activation of PI3K/PTEN andTSC/TOR pathways. (A) Cuticle preparations of male adult wings expressing GFP or PTENR-
NAi under the control of the hh-gal4 driver. The blue line marks the boundary between the ante-rior (A) and posterior (P) compartments. (B–D) Histograms plotting tissue size of the wholewing (B) and tissue size and cell density of A (white bars) and P (blue bars) compartments (C,D) of adult wings expressing the indicated transgenes in the hh domain normalized as a percentof the control wings. Note a consistent reduction in tissue size of the adjacent cell populations(white bars). Error bars indicate the standard deviation. Number of wings analyzed pergenotype� 10. ���p< 0.001. (E, F) ci>GFP, CycE, string wing imaginal discs labelled withTUNEL to visualize apoptotic cells (in red, E) or with an antibody against phosphorylated his-tone 3 (PH3, in magenta or white) to visualize mitotic cells (F). The ci domain is labelled withGFP (in green). (G, H) DNA-content profile of FACS-sorted GFP-expressing and nonexpres-sing cells dissociated from ci>GFP and ci>GFP, Dp110 wing imaginal discs. Percentage of cellsin G1, G2, and S is indicated. (I) Histogram plotting the quantification of mitotic figures perarea in the A (grey bars) and P (blue bars) compartments of the indicated genotypes. Errorbars indicate the standard deviation. Number of wing discs analyzed per genotype� 10.���p< 0.001; ��p< 0.01; �p< 0.05. (J) Histogram plotting the quantification of the absolutenumber of TUNEL-positive cells in the P (light green bars) and A (grey bars) compartments ofthe indicated genotypes. Error bars indicate the standard deviation. Number of wing discs ana-lyzed per genotype� 10. ���p< 0.001.(TIF)
Dally and Growth Control
PLOS Biology | DOI:10.1371/journal.pbio.1002239 August 27, 2015 23 / 28

S2 Fig. Glypicans and tissue growth. (A) Average pMAD profile of wing discs expressing GFP(red line) or GFP and the corresponding transgenes (blue line) under the control of the en-gal4driver. Profiles were taken along the AP axis and plotted in absolute positions. The standarderror to the mean is shown in the corresponding color for each genotype. The AP boundary ofboth experiments was aligned to allow comparison of the profile in each compartment. Num-ber of wing discs analyzed per genotype� 5. The domains of transgene expression are markedwith a black asterisk. Arrows mark the limits of the Dpp activity gradients. (A’) Histogramsplotting the total intensity of pMAD signal in a.u. of the posterior (blue bars) and anterior(white bars) compartments of en>2xGFP and en>GFP, PTENRNAi wing discs. Error barsindicate the standard error to the mean. Number of wing discs analyzed per genotype� 5.�p< 0.05 (B) Wing imaginal discs of the indicated genotypes labelled to visualize Dally expres-sion. Expression of Dally was analyzed in flies carrying a Dally-YFP reporter. Red bracketsindicate the domain of transgene (myrT or PTENRNAi) expression. High magnification of thesquared region is shown in the right panel. (C–H) On the left, cuticle preparations of adultwings of the indicated genotypes. On the right, histograms plotting tissue size (C–H) and celldensity (C, D) values of the transgene-expressing compartment (blue bars) and adjacentcompartment (white bars), normalized as a percent of the control wings. Error bars show thestandard deviation. Number of wings analyzed per genotype� 10. ���p< 0.001; ��p< 0.01;�p< 0.05. The blue line marks the boundary between the A and P compartments, and thedomains of transgene expression are marked with a blue asterisk. (I) Wing imaginal disc of theindicated genotype labelled to visualize Dally-like (in red or white) and GFP (in green) proteinexpression. (J) Average pMAD profiles of wing discs expressing GFP and Dp110 (blue line) orGFP, a dsRNA form against Dally and Dp110 (green line) under the control of the ci-gal4driver. Profiles were taken along the AP axis and plotted in absolute positions. The standarderror to the mean is shown in the corresponding color for each genotype. The AP boundary ofboth experiments was aligned to allow comparison of the profile in each compartment. Num-ber of wing discs analyzed per genotype� 5. The domains of transgene expression are markedwith a black asterisk. Arrows mark the limits of the Dpp activity gradients. (J’) Histogramsplotting the total intensity of pMAD signal in a.u. of the anterior (blue bars) and posterior(white bars) compartments of ci>GFP, Dp110 and ci>Dp110, Dally-RNAi wing discs. Errorbars indicate the standard error to the mean. Number of wing discs analyzed per genotype� 5.(K) Wing imaginal discs (left panels) of ci>GFP and ci>dally RNAi larvae labelled to visualizepMAD protein (in white) and average pMAD profiles (right panels) of wing discs expressingGFP (red line) or dally RNAi (green line) in the ci domain. Profiles were taken along the AP axisand plotted in absolute positions. The standard error to the mean is shown in the correspond-ing color for each genotype. The AP boundary of both experiments was aligned to allow com-parison of the profile in each compartment. Number of wing discs analyzed per genotype� 7.The domains of transgene expression are marked with a black asterisk. Arrows mark the limitsof the Dpp activity gradients.(TIF)
S3 Fig. Thickveins and tissue growth. (A, B) Wing imaginal discs of the indicated genotypeslabelled to visualize thickveins expression. Expression of thickveins was analyzed in flies carry-ing tkv-lacZ (A) or tkv-YFP (B) reporters. Red brackets indicate the domain of transgene(myrT or PTENRNAi) expression. (C, D) On the left, cuticle preparations of adult wings of theindicated genotypes. On the right, histograms plotting tissue size (C,D) and cell density (D)values of the transgene-expressing compartment (blue bars) and of the adjacent compartment(white bars), normalized as a percent of the control wings. Error bars show the standard devia-tion. Number of wings analyzed per genotype� 10. ���p< 0.001; ��p< 0.01; �p< 0.05. The
Dally and Growth Control
PLOS Biology | DOI:10.1371/journal.pbio.1002239 August 27, 2015 24 / 28

blue line marks the boundary between the anterior (A) and posterior (P) compartments, andthe domains of transgene expression are marked with a blue asterisk.(TIF)
S4 Fig. Regulation of Dally by the PI3K and TOR pathways. (A) Wing imaginal discs of theindicated genotypes labelled to visualize Dally expression (in red or white) and DAPI (in blueto visualize nuclei). The transgene-expressing domain is labelled with GFP (in green). Expres-sion of Dally was analyzed in flies carrying a Dally-lacZ reporter. (B) Histogram plotting tissuesize and cell density values normalized as a percent of the control (nub>GFP) of nub>RhebR-NAi adult wings coexpressing either GFP or Dally. Error bars show the standard deviation.Number of wings analyzed per genotype� 10. �p< 0.05. (C) Wing imaginal discs (left panels)of nub>GFP and nub>dally larvae labelled to visualize pMAD protein (in red) and averagepMAD profiles (right panels) of wing discs expressing GFP (red line) or Dally (blue line) in thenubbin domain. Profiles were taken along the AP axis and plotted in absolute positions. Thestandard error to the mean is shown in the corresponding color for each genotype. The APboundary of both experiments was aligned to allow comparison of the profile in each compart-ment. Number of wing discs analyzed per genotype� 7. Arrows mark the limits of the Dppactivity gradients.(TIF)
AcknowledgmentsWe thank R. Barrio, S. Cohen, B. Edgar, G. Morata, E. Sánchez-Herrero, the BloomingtonStock Center, the Developmental Studies Hybridoma Bank (DSHB), and the Vienna Drosoph-ila RNAi Center (VDRC) for flies and reagents, T. Yates for text editing, and L. Boulan, L. Bar-rio, C. Recasens, and A. Terriente-Félix for comments on the manuscript.
Author ContributionsConceived and designed the experiments: AF MM. Performed the experiments: AF. Analyzedthe data: AF MM. Wrote the paper: MM.
References1. Cully M, You H, Levine AJ, Mak TW. Beyond PTENmutations: the PI3K pathway as an integrator of
multiple inputs during tumorigenesis. Nat Rev Cancer. 2006; 6(3):184–92. PMID: 16453012
2. Mirantes C, Eritja N, Dosil MA, Santacana M, Pallares J, Gatius S, et al. An inducible knockout mouseto model the cell-autonomous role of PTEN in initiating endometrial, prostate and thyroid neoplasias.Dis Model Mech. 2013; 6(3):710–20. doi: 10.1242/dmm.011445 PMID: 23471917
3. Inoki K, Corradetti MN, Guan KL. Dysregulation of the TSC-mTOR pathway in human disease. NatGenet. 2005; 37(1):19–24. PMID: 15624019
4. Kobayashi T, Minowa O, Sugitani Y, Takai S, Mitani H, Kobayashi E, et al. A germ-line Tsc1 mutationcauses tumor development and embryonic lethality that are similar, but not identical to, those causedby Tsc2 mutation in mice. Proc Natl Acad Sci U S A. 2001; 98(15):8762–7. PMID: 11438694
5. Hariharan IK, Bilder D. Regulation of imaginal disc growth by tumor-suppressor genes in Drosophila.Annu Rev Genet. 2006; 40:335–61. PMID: 16872256
6. Hietakangas V, Cohen SM. Regulation of tissue growth through nutrient sensing. Annu Rev Genet.2009; 43:389–410. doi: 10.1146/annurev-genet-102108-134815 PMID: 19694515
7. Pastor-Pareja JC, Xu T. Dissecting social cell biology and tumors using Drosophila genetics. Annu RevGenet. 2013; 47:51–74. doi: 10.1146/annurev-genet-110711-155414 PMID: 23988119
8. Brumby AM, Richardson HE. Using Drosophila melanogaster to map human cancer pathways. NatRev Cancer. 2005; 5(8):626–39. PMID: 16034367
9. Morata G, Ripoll P. Minutes: mutants of drosophila autonomously affecting cell division rate. Dev Biol.1975; 42(2):211–21. PMID: 1116643
Dally and Growth Control
PLOS Biology | DOI:10.1371/journal.pbio.1002239 August 27, 2015 25 / 28

10. Moreno E. Is cell competition relevant to cancer? Nat Rev Cancer. 2008; 8(2):141–7. doi: 10.1038/nrc2252 PMID: 18185517
11. Martins VC, Busch K, Juraeva D, Blum C, Ludwig C, Rasche V, et al. Cell competition is a tumour sup-pressor mechanism in the thymus. Nature. 2014; 509(7501):465–70. doi: 10.1038/nature13317 PMID:24828041
12. Nowak K, Seisenbacher G, Hafen E, Stocker H. Nutrient restriction enhances the proliferative potentialof cells lacking the tumor suppressor PTEN in mitotic tissues. Elife. 2013; 2:e00380. doi: 10.7554/eLife.00380 PMID: 23853709
13. Kalaany NY, Sabatini DM. Tumours with PI3K activation are resistant to dietary restriction. Nature.2009; 458(7239):725–31. doi: 10.1038/nature07782 PMID: 19279572
14. Garcia-Bellido A, Ripoll P, Morata G. Developmental compartmentalisation of the wing disk of Drosoph-ila. Nature: New biology. 1973; 245(147):251–3.
15. Neufeld TP. Body building: regulation of shape and size by PI3K/TOR signaling during development.Mech Dev. 2003; 120(11):1283–96. PMID: 14623438
16. Grewal SS. Insulin/TOR signaling in growth and homeostasis: a view from the fly world. Int J BiochemCell Biol. 2009; 41(5):1006–10. doi: 10.1016/j.biocel.2008.10.010 PMID: 18992839
17. Restrepo S, Zartman JJ, Basler K. Coordination of patterning and growth by the morphogen DPP. CurrBiol. 2014; 24(6):R245–55. doi: 10.1016/j.cub.2014.01.055 PMID: 24650915
18. Wartlick O, Mumcu P, Julicher F, Gonzalez-Gaitan M. Understanding morphogenetic growth control—lessons from flies. Nat Rev Mol Cell Biol. 2011; 12(9):594–604. doi: 10.1038/nrm3169 PMID: 21850035
19. Goberdhan DC, Paricio N, Goodman EC, Mlodzik M, Wilson C. Drosophila tumor suppressor PTENcontrols cell size and number by antagonizing the Chico/PI3-kinase signaling pathway. Genes Dev.1999; 13(24):3244–58. PMID: 10617573
20. Ito N, Rubin GM. gigas, a Drosophila homolog of tuberous sclerosis gene product-2, regulates the cellcycle. Cell. 1999; 96(4):529–39. PMID: 10052455
21. Huang H, Potter CJ, TaoW, Li DM, Brogiolo W, Hafen E, et al. PTEN affects cell size, cell proliferationand apoptosis during Drosophila eye development. Development. 1999; 126(23):5365–72. PMID:10556061
22. Gao X, Pan D. TSC1 and TSC2 tumor suppressors antagonize insulin signaling in cell growth. GenesDev. 2001; 15(11):1383–92. PMID: 11390358
23. Tapon N, Ito N, Dickson BJ, Treisman JE, Hariharan IK. The Drosophila tuberous sclerosis complexgene homologs restrict cell growth and cell proliferation. Cell. 2001; 105(3):345–55. PMID: 11348591
24. Radimerski T, Montagne J, Hemmings-Mieszczak M, Thomas G. Lethality of Drosophila lacking TSCtumor suppressor function rescued by reducing dS6K signaling. Genes Dev. 2002; 16(20):2627–32.PMID: 12381661
25. Stocker H, Radimerski T, Schindelholz B, Wittwer F, Belawat P, Daram P, et al. Rheb is an essentialregulator of S6K in controlling cell growth in Drosophila. Nat Cell Biol. 2003; 5(6):559–65. PMID:12766775
26. Zhang Y, Gao X, Saucedo LJ, Ru B, Edgar BA, Pan D. Rheb is a direct target of the tuberous sclerosistumour suppressor proteins. Nat Cell Biol. 2003; 5(6):578–81. PMID: 12771962
27. Saucedo LJ, Gao X, Chiarelli DA, Li L, Pan D, Edgar BA. Rheb promotes cell growth as a component ofthe insulin/TOR signalling network. Nat Cell Biol. 2003; 5(6):566–71. PMID: 12766776
28. Edgar BA, O'Farrell PH. The three postblastoderm cell cycles of Drosophila embryogenesis are regu-lated in G2 by string. Cell. 1990; 62(3):469–80. PMID: 2199063
29. Knoblich JA, Sauer K, Jones L, Richardson H, Saint R, Lehner CF. Cyclin E controls S phase progres-sion and its down-regulation during Drosophila embryogenesis is required for the arrest of cell prolifera-tion. Cell. 1994; 77(1):107–20. PMID: 8156587
30. Milan M, Campuzano S, Garcia-Bellido A. Cell cycling and patterned cell proliferation in the Drosophilawing during metamorphosis. Proc Natl Acad Sci U S A. 1996; 93(21):11687–92. PMID: 8876197
31. Neufeld TP, de la Cruz AF, Johnston LA, Edgar BA. Coordination of growth and cell division in the Dro-sophila wing. Cell. 1998; 93(7):1183–93. PMID: 9657151
32. NgM, Diaz-Benjumea FJ, Vincent JP, Wu J, Cohen SM. Specification of the wing by localized expres-sion of wingless protein. Nature. 1996; 381(6580):316–8. PMID: 8692268
33. Moreno E, Basler K, Morata G. Cells compete for decapentaplegic survival factor to prevent apoptosisin Drosophila wing development. Nature. 2002; 416(6882):755–9. PMID: 11961558
34. Milan M, Campuzano S, Garcia-Bellido A. Developmental parameters of cell death in the wing disc ofDrosophila. Proc Natl Acad Sci U S A. 1997; 94(11):5691–6. PMID: 9159134
Dally and Growth Control
PLOS Biology | DOI:10.1371/journal.pbio.1002239 August 27, 2015 26 / 28

35. Steller H. Regulation of apoptosis in Drosophila. Cell Death Differ. 2008; 15(7):1132–8. doi: 10.1038/cdd.2008.50 PMID: 18437164
36. Levine AJ. p53, the cellular gatekeeper for growth and division. Cell. 1997; 88(3):323–31. PMID:9039259
37. Mesquita D, Dekanty A, Milan M. A dp53-dependent mechanism involved in coordinating tissue growthin Drosophila. PLoS Biol. 2010; 8(12):e1000566. doi: 10.1371/journal.pbio.1000566 PMID: 21179433
38. Perez-Garijo A, Fuchs Y, Steller H. Apoptotic cells can induce non-autonomous apoptosis through theTNF pathway. Elife. 2013; 2:e01004. doi: 10.7554/eLife.01004 PMID: 24066226
39. Ryoo HD, Gorenc T, Steller H. Apoptotic cells can induce compensatory cell proliferation through theJNK and the Wingless signaling pathways. Dev Cell. 2004; 7(4):491–501. PMID: 15469838
40. Perez-Garijo A, Shlevkov E, Morata G. The role of Dpp andWg in compensatory proliferation and in theformation of hyperplastic overgrowths caused by apoptotic cells in the Drosophila wing disc. Develop-ment. 2009; 136(7):1169–77. doi: 10.1242/dev.034017 PMID: 19244279
41. Hay BA, Wolff T, Rubin GM. Expression of baculovirus P35 prevents cell death in Drosophila. Develop-ment. 1994; 120(8):2121–9. PMID: 7925015
42. Affolter M, Basler K. The Decapentaplegic morphogen gradient: from pattern formation to growth regu-lation. Nat Rev Genet. 2007; 8(9):663–74. PMID: 17703237
43. Teleman AA, Cohen SM. Dpp gradient formation in the Drosophila wing imaginal disc. Cell. 2000; 103(6):971–80. PMID: 11136981
44. Wartlick O, Mumcu P, Kicheva A, Bittig T, SeumC, Julicher F, et al. Dynamics of Dpp signaling and pro-liferation control. Science. 2011; 331(6021):1154–9. doi: 10.1126/science.1200037 PMID: 21385708
45. Hamaratoglu F, de Lachapelle AM, Pyrowolakis G, Bergmann S, Affolter M. Dpp signaling activityrequires Pentagone to scale with tissue size in the growing Drosophila wing imaginal disc. PLoS Biol.2011; 9(10):e1001182. doi: 10.1371/journal.pbio.1001182 PMID: 22039350
46. Ben-Zvi D, Pyrowolakis G, Barkai N, Shilo BZ. Expansion-repression mechanism for scaling the Dppactivation gradient in Drosophila wing imaginal discs. Curr Biol. 2011; 21(16):1391–6. doi: 10.1016/j.cub.2011.07.015 PMID: 21835621
47. Barrio R, de Celis JF. Regulation of spalt expression in the Drosophila wing blade in response to theDecapentaplegic signaling pathway. Proc Natl Acad Sci U S A. 2004; 101(16):6021–6. PMID:15079076
48. Yan D, Lin X. Shaping morphogen gradients by proteoglycans. Cold Spring Harb Perspect Biol. 2009; 1(3):a002493. doi: 10.1101/cshperspect.a002493 PMID: 20066107
49. Jackson SM, Nakato H, Sugiura M, Jannuzi A, Oakes R, Kaluza V, et al. dally, a Drosophila glypican,controls cellular responses to the TGF-beta-related morphogen, Dpp. Development. 1997; 124(20):4113–20. PMID: 9374407
50. Nakato H, Futch TA, Selleck SB. The division abnormally delayed (dally) gene: a putative integral mem-brane proteoglycan required for cell division patterning during postembryonic development of the ner-vous system in Drosophila. Development. 1995; 121(11):3687–702. PMID: 8582281
51. Fujise M, Takeo S, Kamimura K, Matsuo T, Aigaki T, Izumi S, et al. Dally regulates Dpp morphogen gra-dient formation in the Drosophila wing. Development. 2003; 130(8):1515–22. PMID: 12620978
52. Khare N, Baumgartner S. Dally-like protein, a new Drosophila glypican with expression overlappingwith wingless. Mech Dev. 2000; 99(1–2):199–202. PMID: 11091094
53. Lin X, Perrimon N. Dally cooperates with Drosophila Frizzled 2 to transduceWingless signalling.Nature. 1999; 400(6741):281–4. PMID: 10421372
54. Harvey KF, Zhang X, Thomas DM. The Hippo pathway and human cancer. Nat Rev Cancer. 2013; 13(4):246–57. doi: 10.1038/nrc3458 PMID: 23467301
55. Baena-Lopez LA, Rodriguez I, Baonza A. The tumor suppressor genes dachsous and fat modulate dif-ferent signalling pathways by regulating dally and dally-like. Proc Natl Acad Sci U S A. 2008; 105(28):9645–50. doi: 10.1073/pnas.0803747105 PMID: 18621676
56. Justice RW, Zilian O, Woods DF, Noll M, Bryant PJ. The Drosophila tumor suppressor gene wartsencodes a homolog of humanmyotonic dystrophy kinase and is required for the control of cell shapeand proliferation. Genes Dev. 1995; 9(5):534–46. PMID: 7698644
57. Lecuit T, Cohen SM. Dpp receptor levels contribute to shaping the Dpp morphogen gradient in the Dro-sophila wing imaginal disc. Development. 1998; 125(24):4901–7. PMID: 9811574
58. Kumar JP, Moses K. The EGF receptor and notch signaling pathways control the initiation of the mor-phogenetic furrow during Drosophila eye development. Development. 2001; 128(14):2689–97. PMID:11526075
Dally and Growth Control
PLOS Biology | DOI:10.1371/journal.pbio.1002239 August 27, 2015 27 / 28

59. Belenkaya TY, Han C, Yan D, Opoka RJ, Khodoun M, Liu H, et al. Drosophila Dpp morphogen move-ment is independent of dynamin-mediated endocytosis but regulated by the glypican members ofheparan sulfate proteoglycans. Cell. 2004; 119(2):231–44. PMID: 15479640
60. Martin-Castellanos C, Edgar BA. A characterization of the effects of Dpp signaling on cell growth andproliferation in the Drosophila wing. Development. 2002; 129(4):1003–13. PMID: 11861483
61. Vuilleumier R, Springhorn A, Patterson L, Koidl S, Hammerschmidt M, Affolter M, et al. Control of Dppmorphogen signalling by a secreted feedback regulator. Nat Cell Biol. 2010; 12(6):611–7. doi: 10.1038/ncb2064 PMID: 20453847
62. Minami M, Kinoshita N, Kamoshida Y, Tanimoto H, Tabata T. brinker is a target of Dpp in Drosophilathat negatively regulates Dpp-dependent genes. Nature. 1999; 398(6724):242–6. PMID: 10094047
63. Campbell G, Tomlinson A. Transducing the Dpp morphogen gradient in the wing of Drosophila: regula-tion of Dpp targets by brinker. Cell. 1999; 96(4):553–62. PMID: 10052457
64. Jazwinska A, Kirov N, Wieschaus E, Roth S, Rushlow C. The Drosophila gene brinker reveals a novelmechanism of Dpp target gene regulation. Cell. 1999; 96(4):563–73. PMID: 10052458
65. Schwank G, Restrepo S, Basler K. Growth regulation by Dpp: an essential role for Brinker and a non-essential role for graded signaling levels. Development. 2008; 135(24):4003–13. doi: 10.1242/dev.025635 PMID: 19029041
66. Martin FA, Morata G. Compartments and the control of growth in the Drosophila wing imaginal disc.Development. 2006; 133(22):4421–6. PMID: 17035294
67. Garcia-Bellido A, Cortes F, Milan M. Cell interactions in the control of size in Drosophila wings. ProcNatl Acad Sci U S A. 1994; 91(21):10222–6. PMID: 7937866
68. de Navas LF, Garaulet DL, Sanchez-Herrero E. The ultrabithorax Hox gene of Drosophila controls hal-tere size by regulating the Dpp pathway. Development. 2006; 133(22):4495–506. PMID: 17050628
69. Crickmore MA, Mann RS. Hox control of organ size by regulation of morphogen production and mobil-ity. Science. 2006; 313(5783):63–8. PMID: 16741075
70. Makhijani K, Kalyani C, Srividya T, Shashidhara LS. Modulation of Decapentaplegic gradient duringhaltere specification in Drosophila. Dev Biol. 2007; 302(1):243–55. PMID: 17045257
71. Crickmore MA, Mann RS. Hox control of morphogen mobility and organ development through regula-tion of glypican expression. Development. 2007; 134(2):327–34. PMID: 17166918
72. Brodsky MH, NordstromW, Tsang G, Kwan E, Rubin GM, Abrams JM. Drosophila p53 binds a damageresponse element at the reaper locus. Cell. 2000; 101(1):103–13. PMID: 10778860
73. Basler K, Struhl G. Compartment boundaries and the control of Drosophila limb pattern by hedgehogprotein. Nature. 1994; 368(6468):208–14. PMID: 8145818
74. Milan M, Campuzano S, Garcia-Bellido A. Cell cycling and patterned cell proliferation in the wing pri-mordium of Drosophila. Proc Natl Acad Sci U S A. 1996; 93(2):640–5. PMID: 8570608
75. Andres AJ, Thummel CS. Methods for quantitative analysis of transcription in larvae and prepupae.Methods in cell biology. 1994; 44:565–73. PMID: 7535884
76. Bass TM, Grandison RC, Wong R, Martinez P, Partridge L, Piper MD. Optimization of dietary restrictionprotocols in Drosophila. The journals of gerontology Series A, Biological sciences and medical sci-ences. 2007; 62(10):1071–81. PMID: 17921418
Dally and Growth Control
PLOS Biology | DOI:10.1371/journal.pbio.1002239 August 27, 2015 28 / 28

233
Publication 2
“Mei-P26 Mediates Tissue-Specific Responses to the Brat
Tumor Suppressor and the dMyc Proto-Oncogene in
Drosophila”


HIGHLIGHTED ARTICLEINVESTIGATION
Mei-P26 Mediates Tissue-Specific Responses to theBrat Tumor Suppressor and the dMyc
Proto-Oncogene in DrosophilaAna Ferreira,*,1 Laura Boulan,*,1 Lidia Perez,* and Marco Milán*,†,2
*Institute for Research in Biomedicine (IRB Barcelona), 08028 Barcelona, Spain, and †Institució Catalana de Recerca i EstudisAvançats (ICREA), 08010 Barcelona, Spain
ABSTRACT TRIM-NHL proteins are a family of translational regulators that control cell growth, proliferation, and differentiation duringdevelopment. Drosophila Brat and Mei-P26 TRIM-NHL proteins serve as tumor suppressors in stem cell lineages and have beenproposed to exert this action, in part, via the repression of the protooncogene dMyc. Here we analyze the role of Brat, Mei-P26,and dMyc in regulating growth in Drosophila imaginal discs. As in stem cell lineages, Brat and Mei-P26 repress dMyc in epithelial cellsby acting at the post-transcriptional and protein level, respectively. Analysis of cell and organ size unravel that Mei-P26 mediates tissue-specific responses to Brat and dMyc activities. Loss-of-function of brat and overexpression of dMyc induce overgrowth in stem celllineages and eventually can participate in tumor formation. In contrast, an increase in Mei-P26 levels inhibits growth of epithelial cellsin these two conditions. Upon depletion of Brat, Mei-P26 up-regulation prevents an increase in dMyc protein levels and leads to tissueundergrowth. This mechanism appears to be tissue-specific since Mei-P26 is not upregulated in brain tumors resulting from brat loss-of-function. Driving Mei-P26 expression in these tumors —mimicking the situation in epithelial cells— is sufficient to prevent dMycaccumulation, thus rescuing the overgrowth. Finally, we show that Mei-P26 upregulation mediates dMyc-induced apoptosis and limitsdMyc growth potential in epithelial cells. These findings shed light on the tumor suppressor roles of TRIM-NHL proteins and underscorea new mechanism that maintains tissue homeostasis upon dMyc deregulation.
TRIM-NHL proteins, which are present in many animalspecies ranging from Caenorhabditis elegans to mammals,
are characterized by the presence of a tripartite motif, namelyRING, B-box, and coil-coiled domains, in their N terminal.The RING domain confers these proteins E3-ubiquitin ligaseactivity (Meroni and Diez-Roux 2005). In the C-terminal part,these proteins carry several repeats of a NHL domain (firstidentified in NCL-1, HT2A, and LIN-41 proteins; Slack andRuvkun 1998), which mediate specific protein–protein inter-actions and translational inhibition (Sonoda and Wharton2001; Loedige et al. 2013). The highly conserved structureof these proteins points to common biological functions, suchas the regulation of asymmetric cell division or microRNA
levels (Neumüller et al. 2008; Kohlmaier and Edgar 2008;Hammell et al. 2009; Loedige and Filipowicz 2009; Schwambornet al. 2009). TRIM-NHL proteins have also been shown to actas translational inhibitors (Sonoda and Wharton 2001; Harriset al. 2011; Loedige et al. 2013). Of the four members presentin Drosophila, Brat and Mei-P26 act as tumor suppressors instem cell lineages, as mutations in these two proteins give riseto tumor formation in the brain and in the germline, respec-tively (Arama et al. 2000; Page et al. 2000).
During the cell division of larval neuroblasts, the asymmet-ric segregation of Brat promotes differentiation and inhibitscell growth and proliferation (Bello et al. 2006; Betschingeret al. 2006; Lee et al. 2006). Consequently, brat loss of functionresults in the malignant proliferation of a subset of neuralprogenitors at the expense of differentiated neurons (Bowmanet al. 2008). Similarly, Mei-P26 activity in transit-amplifyingcells in the female germline inhibits cell growth and prolifer-ation and promotes differentiation (Neumüller et al. 2008). Arecent study also unraveled a tumor suppressor function forTRIM3 in mammals (Liu et al. 2014), suggesting that this rolemight constitute a key feature of TRIM-NHL proteins. Studies
Copyright © 2014 by the Genetics Society of Americadoi: 10.1534/genetics.114.167502Manuscript received January 1, 2014; accepted for publication June 24, 2014;published Early Online July 1, 2014.Supporting information is available online at http://www.genetics.org/lookup/suppl/doi:10.1534/genetics.114.167502/-/DC1.1These authors contributed equally to this work.2Corresponding author: Baldiri Reixac, 10-12, 08028 Barcelona, Spain.E-mail: [email protected]
Genetics, Vol. 198, 249–258 September 2014 249

in stem cell lineages have proposed that both Brat and Mei-P26 inhibit cell growth by repressing the protooncogene dMyc(Betschinger et al. 2006; Neumüller et al., 2008). Interestingly,their closest mammalian ortholog, TRIM32, also prevents theself-renewal of mouse neural progenitors and induces neuronaldifferentiation by targeting c-Myc for degradation (Schwambornet al. 2009).
The conserved transcription factor Myc is a key regulatorof many biological activities (Gallant 2013). It also functionsas an oncogene that contributes to the formation of manyhuman cancers and thus constitutes a therapeutic target(Vita and Henriksson 2006; Dang 2012). As such, it hasbeen extensively studied both in developmental and cancerbiology. In Drosophila, dMyc promotes cell growth and ribo-some biogenesis (Johnston et al. 1999; Grewal et al. 2005).In addition, as in mammalian tumors, dMyc overexpressionalso induces apoptosis through an unknown mechanism(Montero et al. 2008). This dual role of dMyc in triggeringboth cell growth and cell death has been proposed to beresponsible for the maintenance of final tissue size (De LaCova et al. 2004).
The complex relationship between growth and differen-tiation in stem cell lineages makes it difficult to study theinteraction between TRIM-NHL proteins and dMyc specificallyand exclusively in growth control. We therefore addressed thisquestion in a highly proliferating epithelial tissue, the wingprimordium. The development of this tissue has the advantagethat growth and differentiation are separated in time: growthtakes place mainly during the juvenile period (larval stages),while differentiation is restricted to metamorphosis (Cohen1993). Our results reveal that, unlike stem cell lineages,epithelial cells possess a tissue-specific mechanism basedon the interaction between TRIM-NHL tumor suppressorsand the dMyc protooncogene. Modifications of Mei-P26levels appear to constitute a safety mechanism that helpsto maintain tissue homeostasis upon brat loss of functionand dMyc overexpression.
Materials and Methods
Drosophila strains
The Drosophila strains used in this study are as follows: UAS-Mei-P26DNHL (kind gift from S. M. Cohen) (Li et al. 2012); UAS-dMyc42 (Johnston et al. 1999); bantam sensor and controlsensor (Brennecke et al. 2003); UAS-bratRNAi and UAS-mei-P26RNAi (ID nos. 105054 and 101060, Vienna Drosophila RNAiCenter, Austria); and brat192, UAS-Brat, and UAS-Mei-P26 fromthe Bloomington Stock Center. Other stocks are described inFlyBase.
Immunohistochemistry and in situ hybridization
For the overexpression of Mei-P26, larvae were raised at 18�and exposed to 29� 18 h before dissection to potentiate theUAS-Gal4 system. To generate MARCM clones, a heat shockof 45 min at 37� was given during early second instar to the
following genotypes: (1) hs-FLP; FRT40A/tub-Gal80 FRT40A;tub-Gal4 UAS-GFP/+; (2) hs-FLP; brat192 FRT40A/tub-Gal80FRT40A; tub-Gal4 UAS-GFP/+; and (3) hs-FLP; brat192
FRT40A/tub-Gal80 FRT40A; and UAS-Mei-P26/tub-Gal4 UAS-GFP. Wing imaginal discs were dissected 72 h and 96 h afterclone induction, and clones were marked by the presenceof GFP.
For the generation of brat mutant clones in the wing disc,hs-FLP; brat192FRT40A /arm-lacZ FRT40A larvae were grownat 25�, heat shocked for 60 min at 37� during early secondinstar, and dissected 72 h later. Mutant cells were marked bythe absence of GFP expression and their twins by the expres-sion of two copies of GFP.
Samples were dissected in ice-cold PBS and fixed for 20 minat room temperature in 4% formaldehyde. Rabbit anti-Brat(kindly provided by G. Morata), guinea pig anti-dMyc (Herranzet al. 2008), rabbit anti-Mei-P26 (Liu et al. 2009), rat anti-Elav(Hybridoma Bank), and rabbit anti-bGal (Cappel) were used.Secondary antibodies were obtained from Molecular Probes.TUNEL staining and in situ hybridizations were performed aspreviously described (Herranz et al. 2010).
Generation of the GFP-39-UTR sensors
For the GFP-dMyc-39-UTR sensor, the 39-UTR of dMyc was am-plified from genomic DNA by PCR with the following primers:dMyc-UTR-Fwd: 59-CCTCGAGTGTTGTCTCATACTATCGGCTT-39; dMyc-UTR-Rev: 59-ATTTGCGGCCGCGTTTTTCCCTTCAGTTTCTTT-39; digested with XhoI/NotI and cloned into the controlsensor plasmid (P-Casper-tub-GFP) via the XhoI/NotI site.
For the GFP-Mei-P26-39-UTR sensor, the 39-UTR ofmei-P26was amplified from genomic DNA by PCR with the followingprimers: mei-P26-UTR-Fwd: 59-TCAGAATGCGGCCGCAGTCCTGAACACCCTCTATGTT-39; mei-P26-UTR-Rev: 59-CCGCTCGAGGTAACATGTAAAGTAGTCGTGTTTGTG-39; digested withXhoI/NotI and cloned into the control sensor plasmid (P-Casper-tub-GFP) via the XhoI/NotI site.
Quantification of cell and tissue growth parameters inadult wings and wing discs
The size of the nubbin (nub), engrailed (en), and cubitus inter-ruptus (ci) domains was measured using ImageJ software(National Institutes of Health). Cell density was measuredas the number of hairs (each wing cell differentiates a hair)per defined area. The following areas were used to measurecell densities: a conserved region between veins L2 and L3 (cidomain) in the ci-Gal4 experiments and a conserved regionbetween veins L4 and L5 (en domain) in the en-Gal4 and nub-Gal4 experiments. At least 10 female adult wings per geno-type were scored. A T-test analysis was performed.
Results
dMyc is repressed by Brat and Mei-P26 in epithelial cells
Brat acts as a translational inhibitor by binding to the 39-UTR of target mRNAs (Sonoda and Wharton 2001) and
250 A. Ferreira et al.

was shown to repress dMyc translation in neural progenitors(Betschinger et al. 2006). To analyze the post-transcriptionalregulation of dMyc expression, we constructed a dMyc-39UTRsensor transgene consisting of the dMyc 39UTR cloned intoa tubulin-promoter-EGFP reporter plasmid (dMyc-39UTR sen-sor, Figure 1A). On one hand, targeted overexpression of Bratto specific territories within the developing wing primordiuminduced a clear reduction in GFP levels of the dMyc-39UTRsensor (Figure 1B), while a control GFP sensor (Brenneckeet al. 2003) remained unaffected (Supporting Information,Figure S1A). On the other hand, clones of cells mutant fora genetically null allele of brat (brat192) displayed a cell-autonomous increase in GFP expression levels of thedMyc-39UTR sensor (Figure 1C, red arrows). A similar de-repression of the sensor was obtained by targeted expres-sion of a dsRNA form of brat (bratRNAi, Figure 1D). Theseresults imply a conserved role of Brat in the negativeregulation of dMyc translation, in both neural progenitorsand epithelial cells.
The vertebrate TRIM-NHL protein TRIM32 displaysubiquitin ligase activity and binds and targets c-Myc fordegradation (Schwamborn et al. 2009). Similarly, theoverexpression of Mei-P26, the Drosophila ortholog ofTRIM32 (Page et al. 2000), strongly reduces dMyc proteinlevels in a proteasome-dependent manner ((Herranz et al.2010) (see also Figure S2A). In contrast, overexpressinga form of Mei-P26 lacking the NHL domain, which medi-ates specific protein–protein interactions, did not affectdMyc levels (Figure S2B). Equivalent amounts of full-length Mei-P26 and the truncated version were found tobe expressed with the GAL4/UAS system in the Drosophilaovary (Li et al. 2012). Thus, both the ubiquitin ligaseactivity (Herranz et al. 2010) and the NHL domain (thiswork) of Mei-P26 are required to target dMyc for degra-dation. These observations confirm that the overexpres-sion of Brat or Mei-P26 also reduces dMyc levels inepithelial cells, acting at the mRNA and protein levels,respectively.
Brat depletion does not affect dMyc protein levels anddoes not cause tissue overgrowth
Consistent with the repression of the dMyc-39UTR sensorupon Brat overexpression, dMyc protein levels were alsodiminished when compared to neighboring wild-type cells(Figure 1, E and F). By using two different Gal4 lines tooverexpress Brat in specific territories of the wing, we foundthat increased Brat levels lead to smaller wings (Figure S1, Band C) as a result of a reduced cell size (Figure S1D). Thesefindings, together with previous observations (Frank et al.2002), show that Brat overexpression inhibits cell growthand represses dMyc expression.
Surprisingly, dMyc protein levels were unaffected inbrat192 mutant and in bratRNAi-expressing cells (Figure 1,G and H), whereas the dMyc-39UTR sensor was derepressedunder the same experimental conditions (Figure 1, C and D).Moreover, targeted depletion of brat in specific territories
of the wing primordium resulted in decreased cell and tis-sue size of the resulting adult structure (Figure 1, I–K).Thus, in contrast to what happens in neural progenitors,brat loss of function in epithelial cells has no effect ondMyc protein levels and causes tissue undergrowth. Wenext addressed the molecular bases mediating the tissue-specific activities of Brat.
Mei-P26 mediates tissue undergrowth and preventsdMyc up-regulation upon depletion of brat inepithelial cells
The observation that the dMyc-39UTR sensor, but notdMyc protein, is up-regulated in epithelial cells in theabsence of Brat suggests that dMyc is finely regulated atthe protein level in this condition. Interestingly, we ob-served an increase in Mei-P26 protein levels in brat192
mutant as well as in bratRNAi-expressing cells when com-pared to the wild-type neighboring tissue (Figure 2, A andB). Moreover, the depletion of Brat led to increased mei-P26 mRNA levels (Figure 2, C and C9).
Brat binds AGO1 (Neumüller et al. 2008), and severalTRIM-NHL proteins regulate microRNAs (Neumüller et al.2008; Hammell et al. 2009; Schwamborn et al. 2009).Since Mei-P26 is controlled by several miRNAs in the wingepithelium (Herranz et al. 2010), we addressed whetherBrat modulates Mei-P26 levels by regulating microRNAs.We found no changes in mature miRNA levels (Figure S3A)or in the activity of the well-described growth-promotingmiRNA bantam (Brennecke et al. 2003; Figure S3, B–D)upon brat depletion. These observations thus suggest thatmiRNAs do not mediate Brat functions in this tissue. Further-more, depletion of brat did not affect a GFP-mei-P26-39UTRsensor (Figure 2, D and F), suggesting that the repression ofmei-P26 by Brat most probably occurs at the transcrip-tional level.
The simultaneous expression of mei-P26RNAi in brat-depleted cells resulted in the up-regulation of dMyc protein(Figure 2E). Consistent with the role of dMyc in promotingcell growth (Figure S2), the double knockdown of brat andmei-P26 led to increased cell size in wing discs (reflected bya reduction in nuclear density, Figure 2, G and H) and adultwings (reflected by a reduction in cell density, Figure 2K).It also rescued the tissue undergrowth observed upon deple-tion of brat alone (Figure 2, I and J). Mei-P26 is normallypresent at very low levels in the wing epithelium (Herranzet al. 2010), and its depletion alone did not have any impacton dMyc levels or cell or tissue size (Figure S2, C–F).
Taken together, these findings reveal that the increase inMei-P26 levels observed in brat mutant cells inhibitsgrowth and prevents dMyc upregulation in the wing epi-thelium. Surprisingly, the up-regulation of dMyc proteincaused by the double knockdown of brat and mei-P26 in-creased cell but not tissue size under these conditions, sug-gesting that other homeostatic mechanisms might dampenthe capacity of dMyc up-regulation to induce tissue over-growth (see Discussion).
Mei-P26 and Tissue Homeostasis 251

No crosstalk between Brat and Mei-P26 in theneural lineage
To analyze the crosstalk between Brat and Mei-P26 in theneural lineage, we first generated MARCM clones mutantfor brat and considered only those induced in specificregions of the larval brain where the loss of Brat leads totumor formation (Bowman et al. 2008). As previously
described (Bello et al. 2006; Betschinger et al. 2006; Leeet al. 2006), these clones displayed strong overgrowth andincreased dMyc protein levels when compared to wild-typeclones 96 hr after induction (Figure 3, A, A9, and B). Theovergrowth was already seen 72 hr after clone induction(Figure 3B). Unlike in epithelial cells, brat mutant clonesin the brain did not show increased levels of Mei-P26
Figure 1 brat loss of function induces tissue undergrowth in epithelial cells. (A–D) Wing imaginal discs carrying the dMyc-39UTR sensor (in green orwhite) in a wild-type background (A), in larvae overexpressing brat in the apterous domain (B, red brackets), in brat192 homozygous mutant clonesmarked by absence of bGal (C, in red) and in larvae expressing bratRNAi in the apterous domain (D, red brackets). Wing discs in B and D were stained forBrat protein in red. (E) Wild-type wing imaginal disc labeled to visualize dMyc protein (in white). (F) Larval wing primordium overexpressing brat in theapterous domain (red brackets), labeled to visualize Brat (in red) and dMyc (in white) proteins. (G and H) Larval wing primordia labeled to visualize dMycprotein (red or white) and GFP (green) in brat192 homozygous mutant clones marked by the absence of GFP (G) and in bratRNAi-expressing cells (H,transgene expressed in the ci domain). (I) Cuticle preparations of female adult wings, expressing either the driver alone or bratRNAi in the ci or endomains (highlighted in gray and red in controls and experiments, respectively). (J and K) Histograms plotting tissue size (J) and cell density values (K) ofthe ci and en domains expressing bratRNAi, normalized as a percentage of control wing values. In both ci . bratRNAi and en . bratRNAi adult wings,a significant reduction in tissue and cell size was observed in the anterior and posterior compartments, respectively, when compared to control wingsraised in the same conditions. Errors bars represent standard deviation. ***P , 0.001. Number of wings analyzed per genotype, $10.
252 A. Ferreira et al.

Figure 2 Mei-P26 upregulation limits dMyc protein levels and cell growth upon depletion of Brat in epithelial cells. (A) brat192 homozygous mutant clones,marked by the absence of bGal (in red) and stained for Mei-P26 protein (in green or white). (B) bratRNAi-expressing cells labeled to visualize GFP in green(transgene expressed in the ci domain, red brackets) and Mei-P26 protein (in red or white). (C) In situ hybridization monitoring mei-P26 mRNA (in purple)levels in wing primordia from wild-type larvae (C) or larvae with decreased brat expression in the ci domain (C9, red brackets). (D) Larval wing primordiumexpressing bratRNAi in the apterous domain (red brackets), labeled to visualize Brat protein (in red) and a GFP-mei-P26-39-UTR sensor (in white). (E) Larvalwing primordium where bratRNAi was coexpressed with mei-P26RNAi under the control of the en-Gal4 driver (red brackets) and labeled to visualize Brat (inred) and dMyc (in blue and white) proteins. (F) brat192 homozygous mutant clones marked by the absence of bGal (in red) carrying the GFP-mei-P26-39-UTRsensor (in white). (G) Larval wing primordium expressing bratRNAi and mei-P26RNAiin the engrailed domain (red brackets), stained with DAPI (white) tomonitor cell densities. (H) Higher magnification of the anterior and posterior compartments of the wing primordium shown in G. Note reduced cell density inthe posterior compartment. Anterior (a) and posterior (p) compartments are labeled in G and H. (I) Cuticle preparations of female adult wings expressing theindicated transgenes in the en domain (highlighted in colors). (J and K) Histograms plotting tissue size (J) and cell density values (K), normalized asa percentage of control wing values, of the en domain expressing the indicated transgenes. In en . bratRNAi, GFP adult wings, a significant reductionin tissue and cell size was observed in the posterior compartment when compared to control wings raised in the same conditions. Coexpression of mei-P26RNAi significantly rescued tissue and cell size. Error bars represent standard deviation. ***P , 0.001. Number of wings analyzed per genotype, $10.
Mei-P26 and Tissue Homeostasis 253

(Figure 3C). Instead, we observed a decrease in Mei-P26levels in this condition (Figure 3C), consistent with the factthat Mei-P26 is normally expressed in differentiating neu-rons (Neumüller et al. 2008) and that neurons fail to differen-tiate in overgrowing bratmutant clones (as seen by the absenceof cells positive for the neuronal marker Elav; Figure 3D).
Driving the expression of Mei-P26 in brat mutant cloneswas sufficient to significantly rescue the overgrowth pheno-type (Figure 3, A99 and B) and prevent dMyc up-regulation(Figure 3A99) 72 and 96 hr after induction. However, neu-ral progenitors still failed to differentiate, as reflected bythe absence of Elav-positive neurons (Figure 3D9). Thus,Mei-P26 can also prevent the overgrowth of brat mutantcells in the neural lineage, most probably through the inhibi-tion of dMyc rather than by driving cell differentiation. Theseresults also illustrate that tumorous overgrowth can beuncoupled from differentiation in neural progenitors.
We propose that this tissue-specific regulation of Mei-P26 by Brat accounts for the opposite growth phenotypesobserved in the neural lineage and in the wing epithelium.While in stem cell lineages the depletion of brat or mei-P26alone is sufficient to induce dMyc upregulation, the cross-talk between the two TRIM-NHL proteins in epithelial cellsadds another layer of control to prevent an increase indMyc levels and in cell and tissue size (Figure 3E).
Mei-P26 up-regulation maintains tissue homeostasisupon dMyc overexpression
Although dMyc is a cellular growth promoter, as shown byits ability to increase cell size when overexpressed (quanti-fied as cell density in Figure 4A; Johnston et al. 1999), dMycoverexpression does not cause tissue overgrowth (Figure 4,B and C; Doumpas et al. 2013). Strikingly, we observed thatdMyc overexpression in the wing primordium strongly up-regulates Mei-P26 protein and mRNA levels (Figure 4, D andE). Could Mei-P26 also act as a brake in the context of dMycgain of function?
Tissue overgrowth is prevented upon dMyc overex-pression by the induction of apoptosis (De La Cova et al.2004) through a Dp53-independent mechanism (Monteroet al. 2008). Interestingly, the depletion of mei-P26 wassufficient to strongly reduce the number of apoptotic cellsin a dMyc-overexpressing tissue (Figure 4, F–H and seequantification in Figure 4I). Moreover, it further enhancedcell growth (Figure 4A) and led to increased tissue size(Figure 4, B and C) when compared to dMyc overexpres-sion alone. These observations indicate that Mei-P26 up-regulation contributes to maintaining tissue homeostasisupon dMyc overexpression in epithelial cells, by limitingdMyc growth potential and by mediating dMyc-inducedapoptosis (Figure 4J).
Discussion
Our results unravel an unexpected tissue-specific growth-regulatory activity of the TRIM-NHL protein Brat. While
brat loss of function gives rise to overgrowth, dMyc up-regulation, and tumor formation in the neural lineage(Bello et al. 2006; Betschinger et al. 2006; Lee et al.2006), it causes the opposite phenotype in the prolifera-tive wing epithelium by reducing cell and tissue size. Thus,Brat functions as a tumor suppressor in a context-dependentmanner. In epithelial cells, like in neural progenitors, thedepletion of brat leads to the post-transcriptional derepres-sion of dMyc through its 39UTR. It also triggers the up-regulation of Mei-P26, which in turn targets dMyc proteinfor degradation (Herranz et al. 2010). In the neural line-age, brat loss of function does not result in increased Mei-P26 levels. However, Mei-P26 overexpression significantlyrescues the overgrowth of brat mutant clones in the brain.This tumor suppressor activity is most likely due to thecapacity of Mei-P26 to prevent the up-regulation of dMycin these cells. Driving Mei-P26 expression in overgrowingbrat mutant clones in the brain does not induce neuronaldifferentiation, although Mei-P26 overexpression has beenshown to trigger premature neuronal differentiation in oth-erwise wild-type brains (Neumüller et al. 2008). Thus, theability of Mei-P26 to promote neuronal differentiationappears to depend on the presence of functional Brat.
The oncogene Myc has been extensively studied inmammals for its role in normal conditions and in tumor-igenesis (Eilers and Eisenman 2008). In normal cells, anincrease in Myc levels promotes growth but concomi-tantly activates safety mechanisms—such as apoptosisor increased dependency on nutrients—that maintain tis-sue homeostasis. Hence, the tumorigenic potential of Mycoverexpression requires additional mutations that disablethese mechanisms. In line with this, we and others haveobserved that dMyc overexpression in the wing primor-dium of Drosophila promotes cell growth but does notcause tissue overgrowth. These findings suggest that ep-ithelial cells also activate such safety mechanisms. Herewe show that dMyc overexpression triggers a strong up-regulation of Mei-P26, thereby establishing a feedbackmechanism between the two factors. Increased Mei-P26levels limit dMyc growth potential and mediate dMyc-induced apoptosis. The activation of Mei-P26 by dMyc pro-vides a new mechanism that contributes to tissue homeostasisin dMyc-overexpressing epithelial cells.
We observed that the capacity of overexpressed dMycto drive tissue growth in the absence of Mei-P26 was stilllimited, opening the possibility that other homeostaticmechanisms limiting dMyc activity might be at play inepithelial cells. A feedback mechanism between dMyc andYorkie, the Drosophila homolog of the Hippo pathwaytransducer, has also been proposed to regulate tissue size(Neto-Silva et al. 2010). dMyc overexpression reduces thelevels of Yorkie, a potent inducer of tissue growth andinhibitor of apoptosis. Thus, both Mei-P26 up-regulationand Yorkie down-regulation contribute to dMyc-inducedapoptosis and limit dMyc potential to drive cell and tissuegrowth.
254 A. Ferreira et al.

To date, Mei-P26 has been shown to negatively regulatetissue growth by degrading the dMyc protein (Herranzet al. 2010). Our results suggest that other molecular effec-tors are involved in this process. We observed that in-creased Mei-P26 levels are responsible for tissue and cellundergrowth upon depletion of Brat. However, dMyc protein
levels remain unchanged in this condition, pointing to adMyc-independent role of Mei-P26 in inhibiting cell growth.Furthermore, we show that Mei-P26 antagonizes dMyc-induced cell growth and mediates dMyc-induced apoptosis,thereby preventing tissue overgrowth upon dMyc overex-pression in epithelial cells. The challenge is now to further
Figure 3 No crosstalk between Brat and Mei-P26 in the neural lineage. (A–A99) Larval brains with wild-type (A), brat192 mutant clones (A9), and brat192
mutant clones coexpressing mei-P26 (A99) marked with GFP (in green), and labeled to visualize dMyc protein (in red or white). Brains were dissected96 hr after induction. Note that dMyc was up-regulated in brat192 mutant clones (red arrows in A9) compared to wild-type clones (red arrow in A). Thisaccumulation was lost when mei-P26 was coexpressed in the clones (red arrows in A99). (B) Quantification of clonal area, 72 and 96 hr after induction.Note that coexpression of mei-P26 rescued the size of brat192 mutant clones. ***P , 0.001. (C) Larval brains with homozygous brat192 mutant clonesmarked with GFP and labeled to visualize Mei-P26 protein (in red or white). Mei-P26 was not up-regulated in overgrowing brat mutant clones (redarrow). Brains were dissected 96 hr after induction. (D–D9) Larval brains with brat192 mutant clones (D) and brat192 mutant clones coexpressing mei-P26(D9), marked by GFP expression and labeled to visualize the neuronal marker Elav (in blue or white). Brains were dissected 72 hr after induction. Notethat the loss of differentiated cells in brat192 mutant clones was not rescued by mei-P26 coexpression (red arrows). (E) Model explaining the tissue-specific outcomes of brat loss of function in terms of dMyc levels and tissue growth.
Mei-P26 and Tissue Homeostasis 255

characterize the mechanisms by which Mei-P26 regulatescell growth and apoptosis and thus provide greater insightinto the homeostasis of epithelial tissues.
In conclusion, the use of the wing epithelium as a modelsystem has allowed us to analyze the participation of Brat,Mei-P26, and dMyc in growth control. Surprisingly, we have
observed that brat loss of function and dMyc overexpressionhave a negative impact on growth in this tissue. In bothcases, we have identified the up-regulation of Mei-P26 tobe responsible for the tissue-specific growth alteration. Aprevious study also identified Mei-P26 as a target of themiRNA machinery and showed that the depletion of the
Figure 4 The up-regulation of Mei-P26 maintainstissue homeostasis upon dMyc overexpression. (Aand B) Histograms plotting cell density (A) and tis-sue size (B) values of the nubbin domain expressingthe different transgenes, normalized as a percent-age of control GFP-expressing wings. In nub .dMyc, GFP adult wings, no significant change intissue size was observed when compared to controlwings raised in the same conditions (B). However,in this condition the cells were significantly larger(A). Coexpression of mei-P26RNAi gave rise to sig-nificantly larger wings when compared to GFP-expressing wings and to wings overexpressingdMyc and GFP (B). Concerning cell size, the cellswere larger when mei-P26RNAi was coexpressedwhen compared to the GFP-expressing cells andto wings overexpressing dMyc alone (A). Errors barsrepresent standard deviation. **P, 0.01 and ***P,0.001. Number of wings analyzed per genotype,$10. (C) Cuticle preparations of male adult wingsexpressing GFP, expressing dMyc and GFP, orexpressing GFP and mei-P26RNAi in the nubbin do-main. (D and E) Larval wing primordia from individ-uals in which dMyc and GFP (green, D) or dMycalone (E) were overexpressed in the ci domain, andlabeled to visualize Mei-P26 protein (in red orwhite, D) and mei-P26 mRNA (in purple, E). (F–H)Larval wing primordia from individuals in whichGFP (F), dMyc and GFP (G), or dMyc, GFP andmei-P26RNAi (H), were expressed in the ci domain.Wing primordia were labeled to visualize GFP (ingreen) and apoptotic cells by TUNEL (in red orwhite). Note that the number of UAS-transgeneswas similar in G and H. (I) Histogram plotting thenumber of apoptotic nuclei (a.n.) per anterior com-partment of wing discs expressing the indicatedtransgenes under the control of the ci-Gal4 driver.(J) Model explaining the epithelial-specific responseto dMyc overexpression.
256 A. Ferreira et al.

miRNA machinery in the wing disc causes undergrowth asa result of increased Mei-P26 levels (Herranz et al. 2010).The observation that Mei-P26 mediates the response to per-turbations opens up the possibility that modulations of Mei-P26 levels serve to maintain the homeostasis of epithelialtissues.
Mutations leading to the overexpression of an onco-gene constitute the starting point of tumorigenesis. Yet,abnormal cell proliferation and tissue growth also activatewell-described tumor suppressor mechanisms preventingneoplastic growth, such as oncogene-induced cell death(Lowe et al. 2004). The formation of a malignant tumortherefore requires additional mutations that disable thesetumor suppressor mechanisms. Different types of tumorsdisplay different oncogenic signatures, which are sugges-tive of tumor-specific therapies (Ciriello et al. 2013). Thesensitivity to a given oncogene therefore varies from onetissue to another and may depend on the activation—ornot—of tissue-specific tumor suppressive mechanisms.Our study illustrates how the interplay between onco-genes and tumor suppressors can mediate tissue-specificresponses to genetic alterations in terms of growth andapoptosis.
Acknowledgments
We thank S. Cohen, G. Morata, P. Lasko, the Bloomington StockCenter, the Developmental Studies Hybridoma Bank, Cappel,and the Vienna Drosophila RNAi Center for flies and reagents;T. Yates for text editing; L. Barrio and C. Recasens for helpfulcomments on the manuscript; and H. Herranz for his contribu-tion to the initial steps of this project. A.F. was funded by a PhDfellowship from the Fundação para a Ciência e a Tecnologia andL.B. was funded by a PhD fellowship from “la Caixa” Foun-dation. M.M. is an Institució Catalana de Recerca i EstudisAvançats research professor and this work was funded byBFU2010-21123, CSD2007-00008, and 2005 SGR 00118 grants.
Literature Cited
Arama, E., D. Dickman, and Z. Kimchie, A. Shearn, and Z. Lev,2000 Mutations in the beta-propeller domain of the Drosoph-ila brain tumor (brat) protein induce neoplasm in the larvalbrain. Oncogene 19: 3706–3716.
Bello, B., H. Reichert, and F. Hirth, 2006 The brain tumor genenegatively regulates neural progenitor cell proliferation in thelarval central brain of Drosophila. Development 133: 2639–2648.
Betschinger, J., K. Mechtler, and J. A. Knoblich, 2006 Asymmetricsegregation of the tumor suppressor brat regulates self-renewalin Drosophila neural stem cells. Cell 124: 1241–1253.
Bowman, S. K., V. Rolland, J. Betschinger, K. A. Kinsey, G. Emeryet al., 2008 The tumor suppressors Brat and Numb regulatetransit-amplifying neuroblast lineages in Drosophila. Dev. Cell14: 535–546.
Brennecke, J., D. R. Hipfner, A. Stark, R. B. Russell, and S. M.Cohen, 2003 bantam encodes a developmentally regulatedmicroRNA that controls cell proliferation and regulates theproapoptotic gene hid in Drosophila. Cell 113: 25–36.
Ciriello, G., M. L. Miller, B. A. Aksoy, Y. Senbabaoglu, N. Schultzet al., 2013 Emerging landscape of oncogenic signaturesacross human cancers. Nat. Genet. 45: 1127–1133.
Cohen, S. M., 1993 Imaginal disc development, pp. 747–841 inDrosophila Development, edited by A. Martinez-Arias, and M. Bate.Cold Spring Harbor Laboratory Press, Cold Spring Harbor, NY.
Dang, C. V., 2012 MYC on the path to cancer. Cell 149: 22–35.De la Cova, C., M. Abril, P. Bellosta, P. Gallant, and L. A. Johnston,
2004 Drosophila myc regulates organ size by inducing cellcompetition. Cell 117: 107–116.
Doumpas, N., M. Ruiz-Romero, E. Blanco, B. Edgar, and M. Corominaset al., 2013 Brk regulates wing disc growth in part via repressionof Myc expression. EMBO Rep. 14: 261–268.
Eilers, M., and R. N. Eisenman, 2008 Myc’s broad reach. GenesDev. 22: 2755–2766.
Frank, D. J., B. A. Edgar, and M. B. Roth, 2002 The Drosophilamelanogaster gene brain tumor negatively regulates cell growthand ribosomal RNA synthesis. Development 129: 399–407.
Gallant, P., 2013 Myc Function in Drosophila. Cold Spring Harb.Perspect. Med. 3: a014324.
Grewal, S. S., L. Li, A. Orian, R. N. Eisenman, and B. A. Edgar,2005 Myc-dependent regulation of ribosomal RNA synthesisduring Drosophila development. Nat. Cell Biol. 7: 295–302.
Hammell, C. M., I. Lubin, P. R. Boag, T. K. Blackwell, and V. Ambros,2009 nhl-2 Modulates microRNA activity in Caenorhabditiselegans. Cell 136: 926–938.
Harris, R. E., M. Pargett, C. Sutcliffe, D. Umulis, and H. L. Ashe,2011 Brat promotes stem cell differentiation via control ofa bistable switch that restricts BMP signaling. Dev. Cell 20:72–83.
Herranz, H., L. Perez, F. A. Martin, and M. Milan, 2008 A Winglessand Notch double-repression mechanism regulates G1-S tran-sition in the Drosophila wing. EMBO J. 27: 1633–1645.
Herranz, H., X. Hong, L. Perez, A. Ferreira, D. Olivieri et al.,2010 The miRNA machinery targets Mei-P26 and regulatesMyc protein levels in the Drosophila wing. EMBO J. 29: 1688–1698.
Johnston, L. A., D. A. Prober, B. A. Edgar, R. N. Eisenman, and P.Gallant, 1999 Drosophila myc regulates cellular growth dur-ing development. Cell 98: 779–790.
Kohlmaier, A., and B. A. Edgar, 2008 Proliferative control in Dro-sophila stem cells. Curr. Opin. Cell Biol. 20: 699–706.
Lee, C.-Y., B. D. Wilkinson, S. E. Siegrist, R. P. Wharton, and C. Q.Doe, 2006 Brat is a Miranda cargo protein that promotes neu-ronal differentiation and inhibits neuroblast self-renewal. Dev.Cell 10: 441–449.
Li, Y., J. Z. Maines, O. Y. Tastan, D. M. McKearin, and M. Buszczak,2012 Mei-P26 regulates the maintenance of ovarian germlinestem cells by promoting BMP signaling. Development 139:1547–1556.
Liu, N., H. Han, and P. Lasko, 2009 Vasa promotes Drosophilagermline stem cell differentiation by activating mei-P26 trans-lation by directly interacting with a (U)-rich motif in its 39 UTR.Genes Dev. 23: 2742–2752.
Liu, Y., R. Raheja, N. Yeh, and D. Ciznadija, 2014 TRIM3, a tumorsuppressor linked to regulation of p21(Waf1/Cip1). Oncogene33: 308–315.
Loedige, I., and W. Filipowicz, 2009 TRIM-NHL proteins take onmiRNA regulation. Cell 136: 818–820.
Loedige, I., D. Gaidatzis, R. Sack, G. Meister, and W. Filipowicz,2013 The mammalian TRIM-NHL protein TRIM71/LIN-41 isa repressor of mRNA function. Nucleic Acids Res. 41: 518–532.
Lowe, S. W., E. Cepero, and G. Evan, 2004 Intrinsic tumour sup-pression. Nature 432: 307–315.
Meroni, G., and G. Diez-Roux, 2005 TRIM/RBCC, a novel class of“single protein RING finger” E3 ubiquitin ligases. BioEssays 27:1147–1157.
Mei-P26 and Tissue Homeostasis 257

Montero, L., N. Müller, and P. Gallant, 2008 Induction of apopto-sis by Drosophila Myc. Genesis 46: 104–111.
Neto-Silva, R. M., S. de Beco, and L. A. Johnston, 2010 Evidencefor a growth stabilizing regulatory feedback mechanism be-tween Myc and Yorkie, the Drosophila homolog of Yap. Dev.Cell 19: 507–520.
Neumüller, R. A., J. Betschinger, A. Fischer, N. Bushati, I. Poernbacheret al., 2008 Mei-P26 regulates microRNAs and cell growth inthe Drosophila ovarian stem cell lineage. Nature 454: 241–245.
Page, S. L., K. S. McKim, B. Deneen, T. L. Van Hook, and R. S.Hawley, 2000 Genetic studies of mei-P26 reveal a link be-tween the processes that control germ cell proliferation in bothsexes and those that control meiotic exchange in Drosophila.Genetics 155: 1757–1772.
Schwamborn, J. C., E. Berezikov, and J. A. Knoblich, 2009 TheTRIM-NHL protein TRIM32 activates microRNAs and pre-vents self-renewal in mouse neural progenitors. Cell 136:913–925.
Slack, F. J., and G. Ruvkun, 1998 A novel repeat domain that isoften associated with RING finger and B-box motifs. TrendsBiochem. Sci. 23: 474–475.
Sonoda, J., and R. P. Wharton, 2001 Drosophila brain tumor isa translational repressor. Genes Dev. 15: 762–773.
Vita, M., and M. Henriksson, 2006 The Myc oncoprotein as a ther-apeutic target for human cancer. Semin. Cancer Biol. 16: 318–330.
Communicating editor: I. Hariharan
258 A. Ferreira et al.

GENETICSSupporting Information
http://www.genetics.org/lookup/suppl/doi:10.1534/genetics.114.167502/-/DC1
Mei-P26 Mediates Tissue-Specific Responses to theBrat Tumor Suppressor and the dMyc
Proto-Oncogene in DrosophilaAna Ferreira, Laura Boulan, Lidia Perez, and Marco Milán
Copyright © 2014 by the Genetics Society of AmericaDOI: 10.1534/genetics.114.167502

2�SI� A.�Ferreira�et�al.
Figure�S1���brat�overexpression�represses�dMyc�at�the�post�transcriptional�level.�
(A)� Larval�wing�primordium�overexpressing�brat� in� the�apterous� domain� (red�brackets)� stained� for�Brat�protein� (in� red),� and�
carrying�a�GFP�control�sensor�(in�white).�
(B)�Cuticle�preparations�of� female�adult�wings�expressing�either�the�Gal4�driver�alone�or�UAS�brat� in�the�en�or�patched� (ptc)�
domains�(highlighted�in�gray�and�green�in�controls�and�experiments,�respectively).���
(C,D)� Histograms� plotting� tissue� size� (C)� and� cell� density� values� (D)� of� the� en� and� ptc� domains� expressing� the� transgene,�
normalized�as�a�percentage�of�control�wings.�Overexpression�of�brat�induced�a�significant�reduction�in�tissue�and�cell�size�in�the�
corresponding� domains� compared� to� control�wings� raised� in� the� same� conditions.� Errors� bars� represent� standard� deviation.�
***p<0.001.�Number�of�wings�analyzed�per�genotype�10.�

A.�Ferreira�et�al.� 3�SI
Figure�S2���Regulation�of�dMyc�by�Mei�P26�and�endogenous�Mei�P26�activity.�
(A�C)�Larval�wing�primordia�overexpressing�mei�P26�(A),�a�form�of�mei�P26�that�lacks�the�NHL�domain�(B),�or�expressing�a�dsRNA�
against�mei�P26� (C)� in� the� en� domain� (red� brackets)� labeled� to� visualize� En� or� GFP� (in� green)� and� dMyc� (in� red� or� white)�
proteins.�
(D)�Cuticle�preparations�of�female�adult�wings�expressing�GFP�or�mei�P26RNAi�in�the�nubbin�domain.�
(E,F)�Histograms�plotting�tissue�size�(E)�and�cell�density�(F),�normalized�as�a�percentage�of�control�GFP�expressing�wings,�of�the�
nubbin� domain� expressing�mei�P26RNAi.� No� significant� change� in� tissue� size� was� observed�when� compared� to� control� wings�
raised� in� the� same� conditions.� However,� in� this� condition� the� cells�were� significantly� larger.� Errors� bars� represent� standard�
deviation.�***p<0.001.�Number�of�wings�analyzed�per�genotype�10.��
(G)�Larval�wing�primordium�overexpressing�dMyc�in�the�hh�domain�(red�brackets),�stained�for�DAPI�(white)�to�visualize�nuclear�
densities�as�a�proxy�to�cell�densities.�
�

4�SI� A.�Ferreira�et�al.
Figure�S3���Brat�does�not�modulate�microRNAs.�
(A)� Levels� of� six� mature� microRNAs� in� nub>bratRNAi� (gray� bars)� compared� with� nub>GFP� (black� bars)� wing� imaginal� discs,�
measured�by�qRT�PCR.�No�significant�changes�were�observed.�
(B�D)�Larval�wing�primordia�carrying�the�bantam�sensor�(in�white)�in�wild�type�conditions�(B),�in�cells�overexpressing�brat�in�the�
apterous� domain� (C,� red� brackets)� stained� for� Brat� protein� (in� red),� or� in�brat192�homozygous�mutant� clones�marked� by� the�
absence�of��Gal�(D,�in�red).�
�
�
�
�

A.�Ferreira�et�al.� 5�SI
File�S1�
Supporting�Material�and�Methods�
Quantification�of�miRNA�expression�levels��
Ten�wing� discs� from� nub�gal4;� UAS�GFP� and� nub�gal4;� UAS�bratRNAi� larvae� at� the� wandering� stage� were� dissected,� and� the�
notum� domain� was� cut� and� removed.� Total� RNA� was� extracted� using� the� TRIzol� Reagent� (Life� Technologies).� Biological�
triplicates� were� performed� for� each� genotype.� Mature� miRNAs� were� amplified� from� 20� ng� total� RNA� samples� from� the�
respective� genotypes� using� TaqMan� microRNA� assays� (Applied� Biosystems).� Relative� expression� levels� were� obtained� by�
quantitative�PCR,�using�a�TaqMan�Universal�PCR�Mastermix�(Applied�Biosystems).�U27�was�used�as�a�reference�gene�for�data�
normalization.�
�