Embed Size (px)
Citation preview
Evaluating ProductDevelopment SystemsUsing Network AnalysisShawn T. Collins,1, * Ali A. Yassine,2 and Stephen P. Borgatti3
1Control Systems Engineering Department, Rolls-Royce, Indianapolis, IN 46206
2Department of Industrial and Enterprise Systems Engineering, University of Illinois at Urbana-Champaign, Urbana, IL61801
3Department of Management, University of Kentucky, Lexington, KY 40506
EVALUATING PRODUCT DEVELOPMENT SYSTEMS USING NETWORK ANALYSIS
Received 8 January 2008; Accepted 16 April 2008, after one or more revisionsPublished online 18 June 2008 in Wiley InterScience (www.interscience.wiley.com)DOI 10.1002/sys.20108
ABSTRACT
This paper proposes the integration of two systems engineering analysis tools, the DesignStructure Matrix (DSM) and Network Analysis (NA), to study task interactions in a ProductDevelopment Process (PDP). The DSM is a matrix-based systems engineering tool thatanalyzes task sequences to improve PDP execution. Using NA metrics to measure propertiesof information flow helps to identify important product development tasks and interactionsthat constrain PDP execution. Project managers can use these data to structure team integra-tion mechanisms or to identify coordinating mechanisms for groups of concurrently scheduledPDP tasks. Functional managers and process architects can use these data to identify impor-tant or overloaded tasks. They can also evaluate whether tasks like stage gates and designreviews are acting as effective information flow regulators in the PDP. This new SystemsEngineering approach provides a rigorous decision support tool for managers who must alterideal task sequences due to specific schedule, budget, and expertise constraints encounteredon their projects. © 2008 Wiley Periodicals, Inc. Syst Eng 12: 55–68, 2009
Regular Paper
*Author to whom all correspondence should be addressed (E-mail: [email protected]).
This paper is based on material presented in a prior INCOSE conference paper [Collins and Yassine, 2007] and an unpublished PhD dissertation[Collins, 2007]. The authors thank four anonymous reviewers for helpful comments on an earlier draft.
Systems Engineering Vol. 12, No. 1, 2009© 2008 Wiley Periodicals, Inc.
55

Key words: design structure matrix; network analysis; product development execution; taskinformation flow; engineering process improvement
1. OVERVIEW
The product development process (PDP) is a complexsystem composed of an integrated set of tasks thatcollectively accomplish a defined objective—e.g., de-veloping a new product [Browning, Fricke, and Negele,2006; INCOSE, 2004]. As such, many existing systemsengineering tools can be used to improve our under-standing and analysis of these kinds of systems (i.e.,product development processes). Graph based tech-niques, such as CPM/PERT [Spinner, 1989],1 IDEF[Kusiak, 1999],2 and flowcharts, and matrix based tech-niques, such as DSM and the N2 method, were success-ful in capturing the relationships between the tasks in aPDP and in scheduling these tasks accordingly [Brown-ing, 2001; Bustnay and Ben-Asher, 2005]. However,these tools lack the sophistication to uncover the under-lying statistical properties of the PDP, such as the aver-age number of links per node (incoming and outgoing),the average path lengths between tasks involved in acyclic flow of information, and clustering or dispersionmetrics reflecting the amount of connectedness be-tween tasks [Braha and Bar-Yam, 2007]. Furthermore,as the number of tasks or ties between tasks increases,the corresponding complexity makes these systems in-creasingly difficult to analyze.3 As such, standard Sys-tem Engineering tools only provide a partial view of thedevelopment processes they analyze.
We can enhance our understanding of these systemsby using established network analysis (NA) techniques.These methods help uncover previously unnoticedtrends and properties in the PDP. For example, it ispossible to look at patterns of the overall PDP structureand the location of individual tasks within this structure.This is an important analytical shift from viewing a taskas having individually-determined characteristics (as isthe case in the above-mentioned Systems Engineeringtools) to viewing it as representing emergent proper-ties—emerging from patterns of information flow be-tween tasks.
In particular, using NA techniques to measure prop-erties of information flow (such as degree centrality,influence, and brokerage) provides a methodology toidentify important product development tasks and inter-
actions (information flow among two or more tasks)that constrain PDP execution. Project managers can usethese data to structure team integration mechanisms[Browning, 1998, 1999] based on the information shar-ing characteristics of their PDP. They can also use thesedata to identify coordinating mechanisms for groups ofconcurrently scheduled PDP tasks. Functional manag-ers and process architects can use these data to identifycritical or overloaded tasks based on the input / outputinformation relationships. They can also evaluatewhether tasks defined as important in the Systems En-gineering literature, such as stage gates, exercise sig-nificant control over the PDP.
After an overview of the Design Structure Matrixand Network Analysis in Sections 2 and 3, Sections 4and 5 use a case study at a small engineering company(Smallcomp) to analyze task interactions in the PDP.This analysis provides insight into critical interactionsbetween key PDP tasks at the overall process, individ-ual design phase, and specific task levels. The resultsare evaluated visually using standard engineering tools,like control charts, and standard NA tools, like networkmaps. Each case rapidly condenses the entire PDP toshow key individual tasks based on different NA met-rics. Section 6 discusses lessons learned, applications,and proposes areas for future work.
2. THE DESIGN STRUCTURE MATRIX
The Design Structure Matrix (DSM) is a system engi-neering tool that uses matrices to model and analyzecomplex projects, processes or systems [Browning,2001; Steward, 1981; Whitney, 1990; Yassine andBraha, 2003]. The collected data in a DSM captures thestructure of interactions, interdependencies and inter-faces between physical system elements like subsys-tems and modules, product development teams, andinformation flow between project tasks. Static DSManalysis uses clustering algorithms to identify groupsof coupled components to place in subsystems or fre-quently interacting individuals to assign to projectteams [Sosa, Eppinger, and Rowles, 2004] or productmodules [Sharman and Yassine, 2004]. Time-basedDSM analysis uses partitioning algorithms that opti-mally sequence project tasks to minimize the impact ofrework and unexpected feedback [Yassine et al., 2003].The information about task cross-coupling, rework im-pact, and rework probability identifies a range of pos-sible project durations to assist in planning and resource
1Critical Path Method / Program Evaluation & Review Technique.2Integrated DEFinition (IDEF) is a family of methods designed tomodel the decisions, actions, and activities of a system.3We thank an anonymous Systems Engineering reviewer for pointingthis out.
56 COLLINS, YASSINE, AND BORGATTI
Systems Engineering DOI 10.1002/sys
allocation. This inclusion of interdependencies and it-eration is an improvement over the assumption of line-arly independent, sequentially ordered tasks in timebased planning tools like MS Project and sequenceanalysis tools like Value Stream Mapping [Tapping andShuker, 2003].
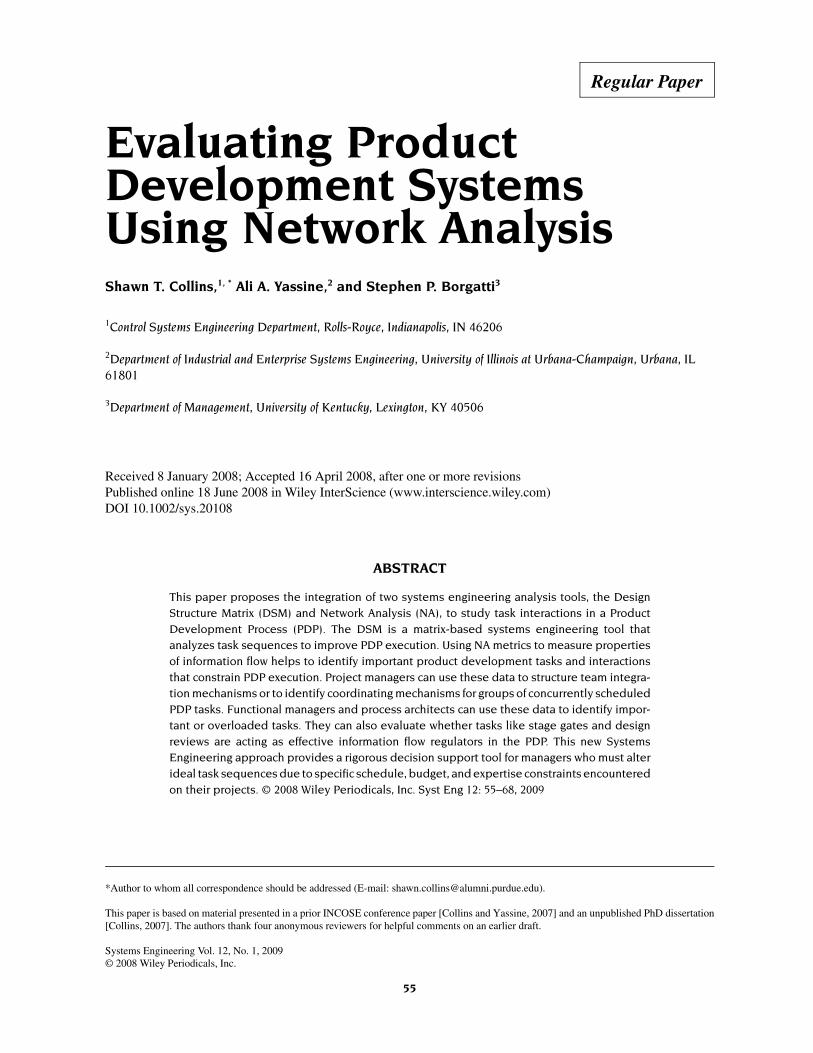
Figure 1 shows the two different approaches to ana-lyzing DSM data. The strength of interaction is a twopoint scale of “Does not interact” (matrix cell is empty)and “Output has some influence” (matrix cell value of1). The Original DSM has potential for rework becausethe outputs from tasks G and F provide input to earlierchronological tasks E, C, and B. The Partitioned DSMin Figure 1 has reordered the task execution sequenceso that the only feedback loop is between tasks G andF.
One criticism of project management using the DSMis that the task interaction matrix assumes that feedbackto earlier tasks is undesirable. This is not true if activi-ties are concurrent or intentionally iterative, as is thecase in research and development environments. Analternative approach is to cluster the DSM into tasksubsets that are mutually exclusive or minimally inter-acting. Static DSM analysis uses this approach for datathat typically do not contain time-dependent informa-tion, such as hardware components or team responsi-bilities. In principal, it can be used to identify groups ofR&D tasks that are intentionally iterative or concur-rently scheduled. The Clustered DSM in Figure 1 dem-onstrates the difference in task sequencing compared tothe Partitioned DSM. A weakness of this approach forrigorous understanding of information flow in a PDP isthat DSM techniques currently do not include methods
to evaluate the within and between cluster task relation-ships once clusters are identified. However, a numberof diagnostic metrics are available from NetworkAnalysis (NA).
3. NETWORK ANALYSIS CONCEPTS FORPRODUCT DEVELOPMENT
Collecting data in network form and applying socialnetwork metrics has a number of conceptual benefitsfor evaluating complex systems [Batallas and Yassine,2006; Kilduff and Tsai, 2003; Scott, 2000]. First, net-work analysis focuses on relations and patterns of rela-tions rather than attributes of actors or tasks. Second, itis amenable to multiple levels of analysis, allowinginsight into micro-macro linkages. For example, whilean overall network influences patterns of individualmembers, individual actions create subgroups that exertinfluence for a particular type of relationship. The net-work approach thus provides insight into how individ-ual elements affect institutions they are part of, and howinstitutions constrain their individual elements.
One major benefit is that the overall structure tendsto be emergent, in that no individual in the networkunderstands the entire system. Network analysis usespatterns of ties to define and analyze the emergentstructure. This is a significant benefit when there is no“right answer” about what the structure should looklike. Finally, network analysis integrates quantitative,qualitative, and graphical data, thus allowing more thor-ough and in depth analysis.
The basic element of NA is an adjacency matrix thatdefines relationships between each row and column
Figure 1. Clustered vs. partitioned DSM analysis. [Color figure can be viewed in the online issue, which is available atwww.interscience.wiley.com.]
EVALUATING PRODUCT DEVELOPMENT SYSTEMS USING NETWORK ANALYSIS 57
Systems Engineering DOI 10.1002/sys
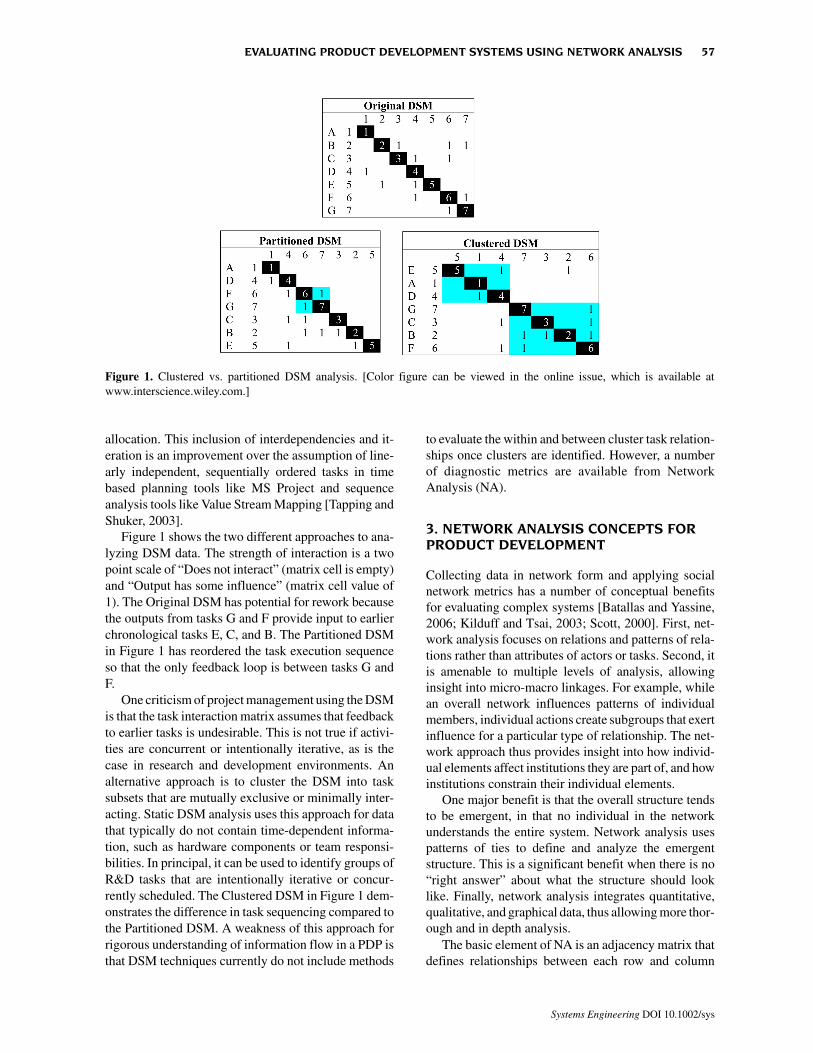
element. A one-mode matrix is built when the row andcolumn elements are the same, as with frequency ofinteraction among a group of people or distance be-tween cities. For symmetric one-mode data, the upperand lower halves of the matrix are identical. For di-rected one-mode data, the two halves are different.Directed data is collected on ties that are not reciprocal,as with authority structures or transfer of advice. For amatrix of product development tasks collected in DSMformat, directed data indicates the input / output flowof information between each task. Figure 2 shows thenetwork drawn from the data in Figure 1. The arrowsindicate a tie from the row task to the column task. For
example, task A receives output from task D, while taskB provides output to tasks C, F, and G.
Once data are collected in matrix form, NA methodscontain a variety of analytic techniques [Chartrand,1985; Hanneman and Riddle, 2005; Scott, 2000; Was-serman and Faust, 1999] that have been used to studytopics as diverse as world systems [Brieger and Patti-son, 1981; Snyder and Kick, 1979], diffusion of inno-vation [Burt, 1978, 1987], production of scientificknowledge [Brymn, 1988], and organizational influ-ence [Galaskiewicz and Krohn, 1984; Roethlisbergerand Dickson, 1939]. These methods target three differ-ent levels of analysis [Kilduff and Tsai, 2003] First, theyexamine patterns of the overall structure and the loca-tion of individuals within the structure. Second, theyidentify substructures (groups of nodes that are closerto each other than to other groups) based on patterns ofrelations. Examples are blocks, factions, cliques, andbridges. Third, they evaluate positions of individualswithin the structure. This is an analytical shift fromviewing a node as having individually unique charac-teristics to viewing it as representing some categoricalattribute. Demographic attributes are based on variablesimilarity like age (for people) or time to complete (fortasks). Network position analysis looks at attributesemerging from patterns of ties between nodes. Networkcategories are thus inherently relational roles ratherthan individual categories. Table I summarizes a set ofkey NA metrics for evaluating interacting product de-velopment tasks [Wasserman and Faust, 1999]. Theremaining sections of this paper discuss these metricsin more detail.
Figure 2. Network map of Figure 1.
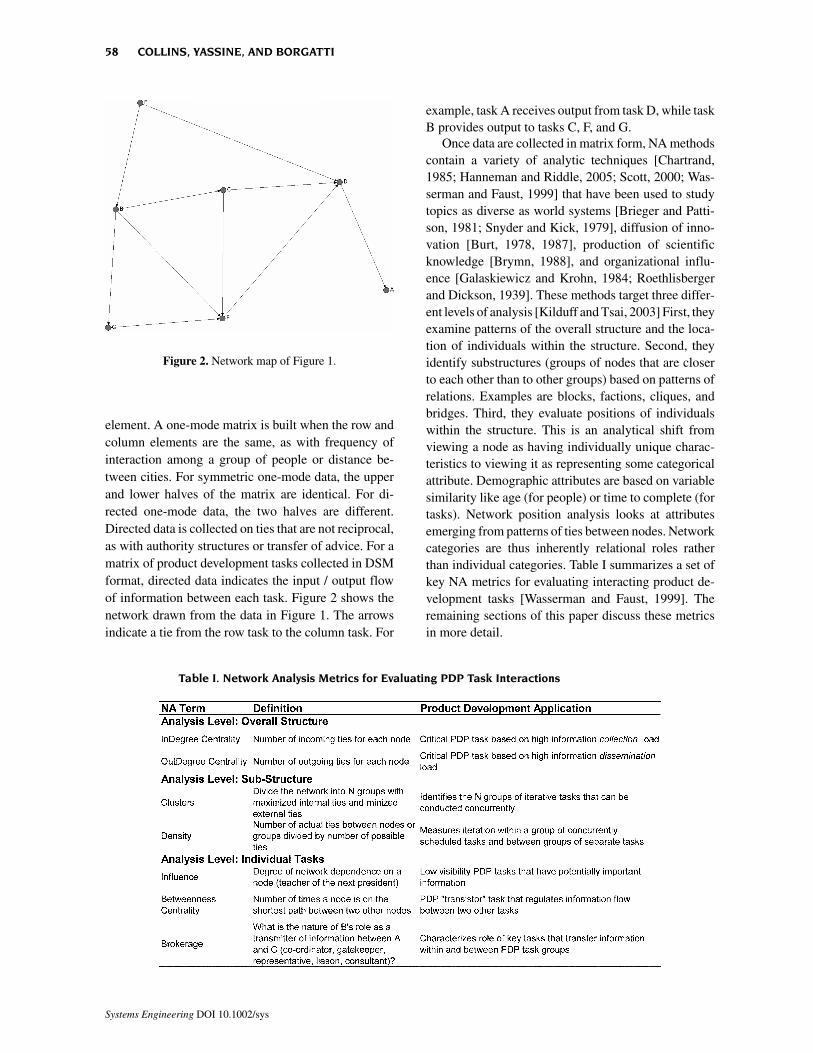
Table I. Network Analysis Metrics for Evaluating PDP Task Interactions
58 COLLINS, YASSINE, AND BORGATTI
Systems Engineering DOI 10.1002/sys
4. NETWORK ANALYSIS OF PRODUCTDEVELOPMENT TASKS
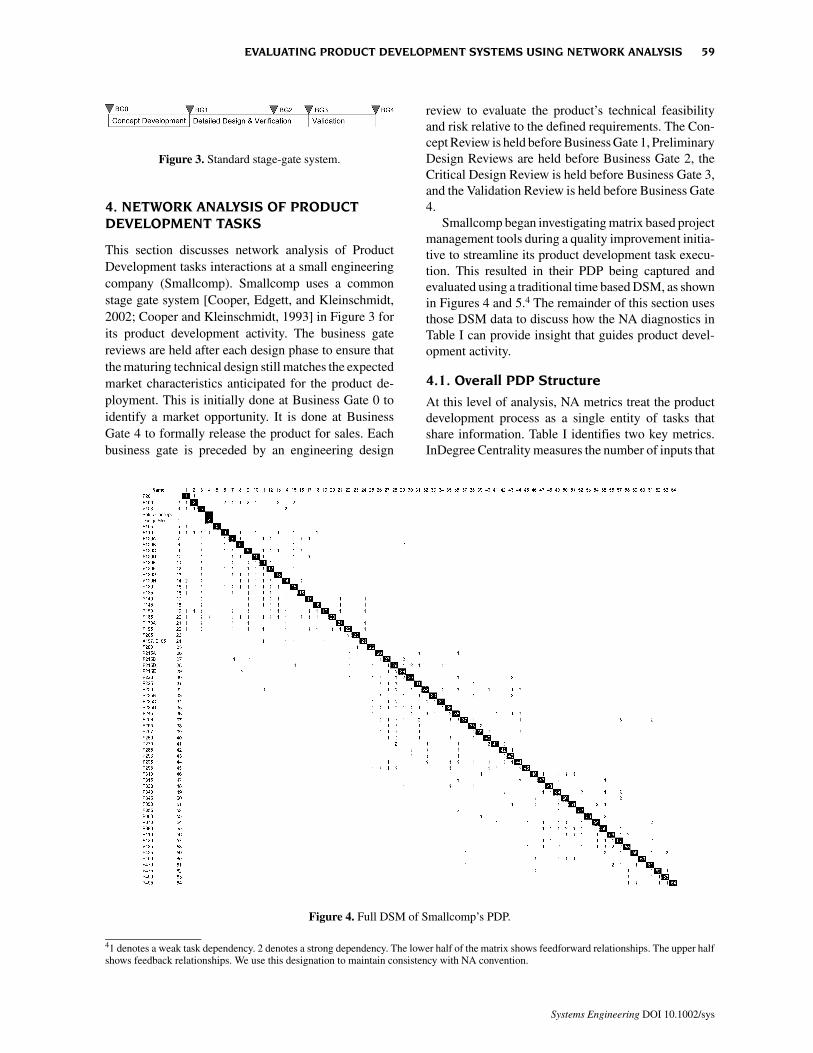
This section discusses network analysis of ProductDevelopment tasks interactions at a small engineeringcompany (Smallcomp). Smallcomp uses a commonstage gate system [Cooper, Edgett, and Kleinschmidt,2002; Cooper and Kleinschmidt, 1993] in Figure 3 forits product development activity. The business gatereviews are held after each design phase to ensure thatthe maturing technical design still matches the expectedmarket characteristics anticipated for the product de-ployment. This is initially done at Business Gate 0 toidentify a market opportunity. It is done at BusinessGate 4 to formally release the product for sales. Eachbusiness gate is preceded by an engineering design
review to evaluate the product’s technical feasibilityand risk relative to the defined requirements. The Con-cept Review is held before Business Gate 1, PreliminaryDesign Reviews are held before Business Gate 2, theCritical Design Review is held before Business Gate 3,and the Validation Review is held before Business Gate4.
Smallcomp began investigating matrix based projectmanagement tools during a quality improvement initia-tive to streamline its product development task execu-tion. This resulted in their PDP being captured andevaluated using a traditional time based DSM, as shownin Figures 4 and 5.4 The remainder of this section usesthose DSM data to discuss how the NA diagnostics inTable I can provide insight that guides product devel-opment activity.
4.1. Overall PDP Structure
At this level of analysis, NA metrics treat the productdevelopment process as a single entity of tasks thatshare information. Table I identifies two key metrics.InDegree Centrality measures the number of inputs that
Figure 3. Standard stage-gate system.
Figure 4. Full DSM of Smallcomp’s PDP.
41 denotes a weak task dependency. 2 denotes a strong dependency. The lower half of the matrix shows feedforward relationships. The upper halfshows feedback relationships. We use this designation to maintain consistency with NA convention.
EVALUATING PRODUCT DEVELOPMENT SYSTEMS USING NETWORK ANALYSIS 59
Systems Engineering DOI 10.1002/sys
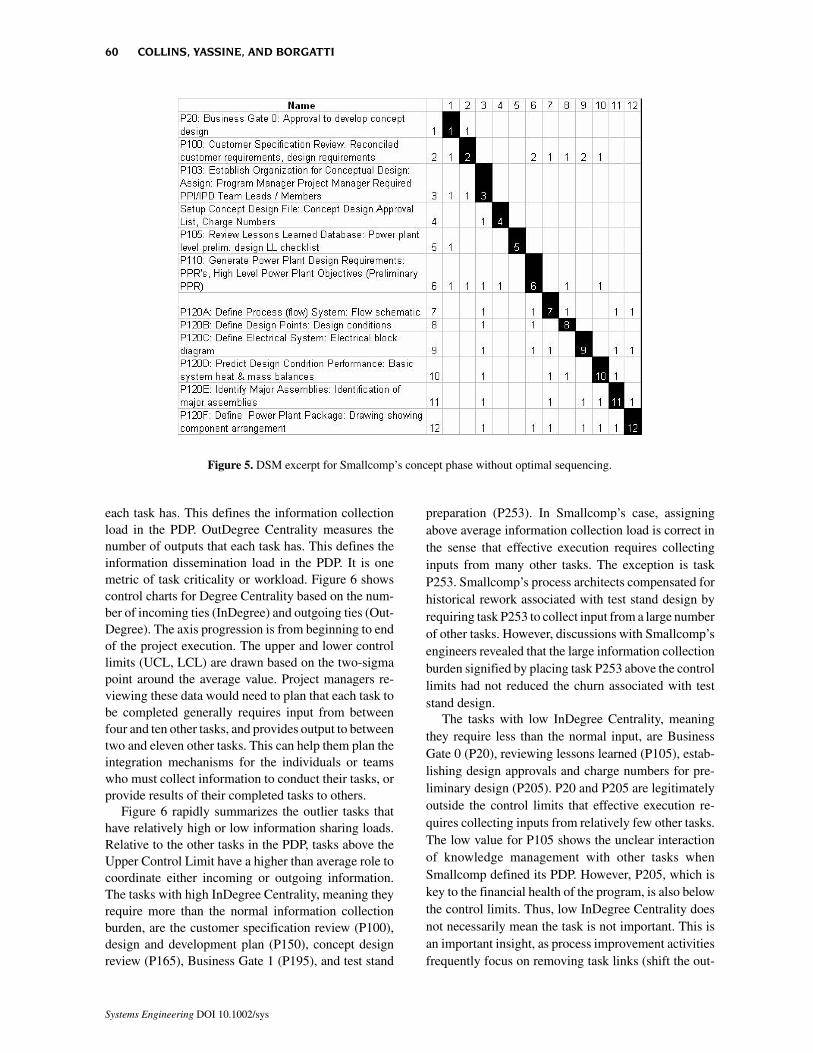
each task has. This defines the information collectionload in the PDP. OutDegree Centrality measures thenumber of outputs that each task has. This defines theinformation dissemination load in the PDP. It is onemetric of task criticality or workload. Figure 6 showscontrol charts for Degree Centrality based on the num-ber of incoming ties (InDegree) and outgoing ties (Out-Degree). The axis progression is from beginning to endof the project execution. The upper and lower controllimits (UCL, LCL) are drawn based on the two-sigmapoint around the average value. Project managers re-viewing these data would need to plan that each task tobe completed generally requires input from betweenfour and ten other tasks, and provides output to betweentwo and eleven other tasks. This can help them plan theintegration mechanisms for the individuals or teamswho must collect information to conduct their tasks, orprovide results of their completed tasks to others.
Figure 6 rapidly summarizes the outlier tasks thathave relatively high or low information sharing loads.Relative to the other tasks in the PDP, tasks above theUpper Control Limit have a higher than average role tocoordinate either incoming or outgoing information.The tasks with high InDegree Centrality, meaning theyrequire more than the normal information collectionburden, are the customer specification review (P100),design and development plan (P150), concept designreview (P165), Business Gate 1 (P195), and test stand
preparation (P253). In Smallcomp’s case, assigningabove average information collection load is correct inthe sense that effective execution requires collectinginputs from many other tasks. The exception is taskP253. Smallcomp’s process architects compensated forhistorical rework associated with test stand design byrequiring task P253 to collect input from a large numberof other tasks. However, discussions with Smallcomp’sengineers revealed that the large information collectionburden signified by placing task P253 above the controllimits had not reduced the churn associated with teststand design.
The tasks with low InDegree Centrality, meaningthey require less than the normal input, are BusinessGate 0 (P20), reviewing lessons learned (P105), estab-lishing design approvals and charge numbers for pre-liminary design (P205). P20 and P205 are legitimatelyoutside the control limits that effective execution re-quires collecting inputs from relatively few other tasks.The low value for P105 shows the unclear interactionof knowledge management with other tasks whenSmallcomp defined its PDP. However, P205, which iskey to the financial health of the program, is also belowthe control limits. Thus, low InDegree Centrality doesnot necessarily mean the task is not important. This isan important insight, as process improvement activitiesfrequently focus on removing task links (shift the out-
Figure 5. DSM excerpt for Smallcomp’s concept phase without optimal sequencing.
60 COLLINS, YASSINE, AND BORGATTI
Systems Engineering DOI 10.1002/sys

liers within the control limits), or else eliminating taskswith few links (remove the low outliers).
The control chart in Figure 6 quickly identifies twoimprovement opportunities by examining tasks outsidethe information collection and dissemination controllimits. The first questioning whether the most effectiveway to address task P253’s importance is to give it arelatively high information collection burden. The sec-ond is identifying the need to increase ties from P105so that lessons learned reviews are better integrated withthe other design activities.
4.2. PDP Substructures
At this level of analysis, NA metrics identify and meas-ure groups of tasks that interact more with each otherthan with other tasks in the PDP. Table I identifies twokey metrics. Clustering identifies groups of tasks thatare strongly connected to each other as a basis forscheduling concurrent activity. Density measures thenumber of actual and potential ties within a cluster, andbetween clusters. This describes the strength of concur-rency, as well as the strength of coupling betweengroups of tasks.
Table II divides Smallcomp’s PDP into five taskclusters.5 The algorithm maximizes within-cluster task
Table II. Clusters of Concurrent PDP Tasks
Figure 6. Control chart for degree centrality. [Color figure can be viewed in the online issue, which is available at www.inter-science.wiley.com.]
5The upper half of the table shows feedforward ties. The lower half shows feedback ties.
EVALUATING PRODUCT DEVELOPMENT SYSTEMS USING NETWORK ANALYSIS 61
Systems Engineering DOI 10.1002/sys

interaction and minimizes between-cluster task interac-tion. The diagonal values in Table II measure the densityof ties within the cluster. The off-diagonal measures thedensity of ties between clusters. For example, there are41% of the potential connections within the SystemDefinition phase, 3% of the potential connections fromSystem Definition outputs to Preliminary FunctionalIntegration inputs, and 1% of potential connectionsfrom Preliminary Functional Integration outputs to Sys-tem Definition inputs. Several tasks conducted early inPDP execution (P20—Business Gate 0, P100—Cus-tomer Specification Review, Set up Design File, andP105—Lessons Learned) are placed in the Validationcluster based on loose ties to the rest of the PDPnetwork. This placement shows that the relationship ofthese tasks to other System Definition tasks was notwell defined in Smallcomp’s original DSM.
The low off-diagonal density values in Table II showthat the clustering intent, which was to identify groupsof iterative or concurrent tasks that are independent ofthe rest of the PDP activities, was mostly successful.The primary exception is the ties between the Prelimi-nary Functional and Mechanical Integration phase. TheFunctional–Mechanical tie is relatively strong (18%between-phase compared to 39% and 37% within-phase), while the Mechanical–Functional tie is slightlyweaker (11% between-phase compared to 39% and37% within-phase). Both are considerably higher thanthe between-phase ties indicated by the remainder ofthe off-diagonal values in Table II. Project planningwould define a single set of activities called PreliminaryIntegration, which would need coordinating mecha-nisms in place to manage the interdependencies be-tween these two sets of concurrent activities(Functional and Mechanical Integration). The interde-pendencies are defined by determining which taskslinks create the off-diagonal density values in Table II.
4.3. Individual PDP Tasks
At this level of analysis, NA metrics identify key tasksbased on their relational roles as information transmit-ters in the product development process network. TableI identifies four metrics. Betweenness centrality meas-ures the number of times a particular task is on theshortest path between two other tasks. The steps withthe highest betweenness centrality are Design PointDefinition (P120B), Detailed Heat and Mass Balance(P215E), P&ID and Electrical 1-line (P215B), BusinessGate 1 (P195), and Audit Preliminary Design (P215D).Like standard critical path identification, tasks withhigh betweenness centrality have a high schedule im-pact on the overall PDP if they are not completed ontime.
As a measure of shortest information flow, between-ness centrality also identifies which tasks have thegreatest control of information in the PDP. Measuringbetweenness centrality provides a way to determinewhether tasks that are expected to be critical for PDPexecution actually control information flow in the PDPtask input / output relationships. The tasks identifiedhere show that Smallcomp has a strong focus on tasksthat control the transition between from the Concept toPreliminary Design phases. Tasks performed later in thePDP, such as at the transition from Detailed Design toVerification, do not score high on this measure. Busi-ness Gates 2 and 3, which Figure 3 defines as critical tomanaging PDP execution, also do not score high onbetweenness centrality.
Centrality evaluates the number of immediate tiesthat each PDP task has. Influence measures the degreeof connectedness between each task and every othertask in the PDP. Tasks with high influence have infor-mation that is important to the entire PDP, even if theydo not appear on the critical path. Tasks with lowinfluence have information that is not important to theentire PDP. The most influential steps are P215E (De-tailed Heat and Mass Balance) and P120B (DesignPoint Definition). It makes intuitive sense that thesteady state model and design points would be highlyinfluential, because these concept level activities con-tain information that constrains shapes execution for therest of the PDP. The least influential steps are P120F(Define Power Plant Package) and P120E (IdentifyMajor Assemblies). This shows the low priority givento physical packaging during concept definition. Thelow priority stems from Smallcomp’s heritage of creat-ing demonstration units where physical space was nottypically a design concern.
Another metric of individual position is brokerage.Brokerage occurs for the triad of nodes A, B and C inFigure 7. In this network, B is a broker because it passesinformation from A to C. Node B has three potentialbrokerage roles between nodes A and C. B is a coordi-nator if all three nodes are in the same group. B is agatekeeper if A is in a different group from B and C. Bis a representative if C is in a different group from Aand B.
Figure 7. Example brokerage by node B.
62 COLLINS, YASSINE, AND BORGATTI
Systems Engineering DOI 10.1002/sys
Brokerage identifies tasks that have critical informa-tion sharing roles within and between the task clustersin Table II. Expected brokerage calculates the numberof times each task in a cluster would be expected to playeach brokerage role based on the number of clusters andsize of each cluster. Relative brokerage ratios the actualnumber of roles each task plays against the expectednumber of roles. High relative brokerage values indi-cate a task is playing a particular role more than ex-pected. Low relative brokerage indicates the task isplaying a role less then expected.
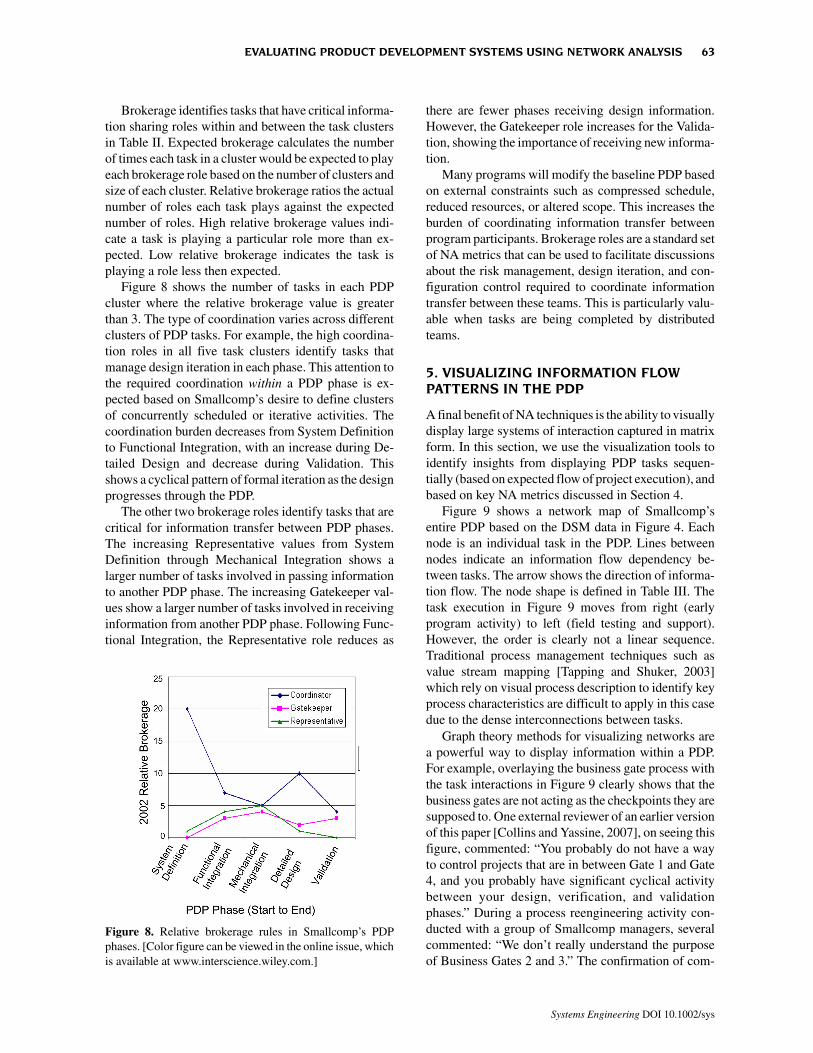
Figure 8 shows the number of tasks in each PDPcluster where the relative brokerage value is greaterthan 3. The type of coordination varies across differentclusters of PDP tasks. For example, the high coordina-tion roles in all five task clusters identify tasks thatmanage design iteration in each phase. This attention tothe required coordination within a PDP phase is ex-pected based on Smallcomp’s desire to define clustersof concurrently scheduled or iterative activities. Thecoordination burden decreases from System Definitionto Functional Integration, with an increase during De-tailed Design and decrease during Validation. Thisshows a cyclical pattern of formal iteration as the designprogresses through the PDP.
The other two brokerage roles identify tasks that arecritical for information transfer between PDP phases.The increasing Representative values from SystemDefinition through Mechanical Integration shows alarger number of tasks involved in passing informationto another PDP phase. The increasing Gatekeeper val-ues show a larger number of tasks involved in receivinginformation from another PDP phase. Following Func-tional Integration, the Representative role reduces as
there are fewer phases receiving design information.However, the Gatekeeper role increases for the Valida-tion, showing the importance of receiving new informa-tion.
Many programs will modify the baseline PDP basedon external constraints such as compressed schedule,reduced resources, or altered scope. This increases theburden of coordinating information transfer betweenprogram participants. Brokerage roles are a standard setof NA metrics that can be used to facilitate discussionsabout the risk management, design iteration, and con-figuration control required to coordinate informationtransfer between these teams. This is particularly valu-able when tasks are being completed by distributedteams.
5. VISUALIZING INFORMATION FLOWPATTERNS IN THE PDP
A final benefit of NA techniques is the ability to visuallydisplay large systems of interaction captured in matrixform. In this section, we use the visualization tools toidentify insights from displaying PDP tasks sequen-tially (based on expected flow of project execution), andbased on key NA metrics discussed in Section 4.
Figure 9 shows a network map of Smallcomp’sentire PDP based on the DSM data in Figure 4. Eachnode is an individual task in the PDP. Lines betweennodes indicate an information flow dependency be-tween tasks. The arrow shows the direction of informa-tion flow. The node shape is defined in Table III. Thetask execution in Figure 9 moves from right (earlyprogram activity) to left (field testing and support).However, the order is clearly not a linear sequence.Traditional process management techniques such asvalue stream mapping [Tapping and Shuker, 2003]which rely on visual process description to identify keyprocess characteristics are difficult to apply in this casedue to the dense interconnections between tasks.
Graph theory methods for visualizing networks area powerful way to display information within a PDP.For example, overlaying the business gate process withthe task interactions in Figure 9 clearly shows that thebusiness gates are not acting as the checkpoints they aresupposed to. One external reviewer of an earlier versionof this paper [Collins and Yassine, 2007], on seeing thisfigure, commented: “You probably do not have a wayto control projects that are in between Gate 1 and Gate4, and you probably have significant cyclical activitybetween your design, verification, and validationphases.” During a process reengineering activity con-ducted with a group of Smallcomp managers, severalcommented: “We don’t really understand the purposeof Business Gates 2 and 3.” The confirmation of com-
Figure 8. Relative brokerage rules in Smallcomp’s PDPphases. [Color figure can be viewed in the online issue, whichis available at www.interscience.wiley.com.]
EVALUATING PRODUCT DEVELOPMENT SYSTEMS USING NETWORK ANALYSIS 63
Systems Engineering DOI 10.1002/sys

ments from Smallcomp’s managers by a reviewer who,despite no knowledge of Smallcomp’s specific proc-esses or products, was able to make a remarkably accu-rate assessment of Smallcomp’s recent history, suggeststhe underlying value of NA visualization methods. Thishistory would not be immediately obvious from thebusiness gate flow chart in Figure 3, nor would it beclear from the classical DSM matrix display in Figure4.
The visual display in Figure 9 confirms the findingfrom the centrality control chart in Section 0, whichshowed that the tasks for Business Gates 2 and 3 werenot acting as the check points they were intended to be.There are two options for PDP management. First,redesign the PDP to increase the information controlauthority of these tasks. Second, use the brokerageanalysis from Figure 8 to look at the tasks that are actingas gatekeepers between PDP phases, and focus energyon making sure those steps are robust.
Figure 10 shows a redrawn PDP network map fromFigure 9. The x-axis places tasks by increasing influ-ence. The y-axis places tasks by increasing betweennesscentrality. It visually summarizes important tasks basedon two NA metrics that are important to PDP execution.Figure 10 condenses interactions between all the PDPtasks to show the six or seven critical tasks. The unique-ness of these tasks would not be immediately obvioususing a swimlane, value stream map, or even normal
network map. These tasks would be hard to identify inFigure 9.
Filtering a small list of tasks from the entire PDPenables more effective discussions about improvingPDP execution. Are the highlighted tasks as importantas the filter claims? If so, do they get appropriateattention during program execution? If not, whatchanges need to be made on future programs? Whereare the steps we claim are critical, like technical andbusiness reviews? Should they be showing up with highvalues on key analytical dimensions?
For the relationships in Figure 10, there would betwo questions. First, what tasks should have high con-
Table III. Task Node Shapes in Figures 9 and 10
Figure 9. Network map of Smallcomp’s PDP.
64 COLLINS, YASSINE, AND BORGATTI
Systems Engineering DOI 10.1002/sys
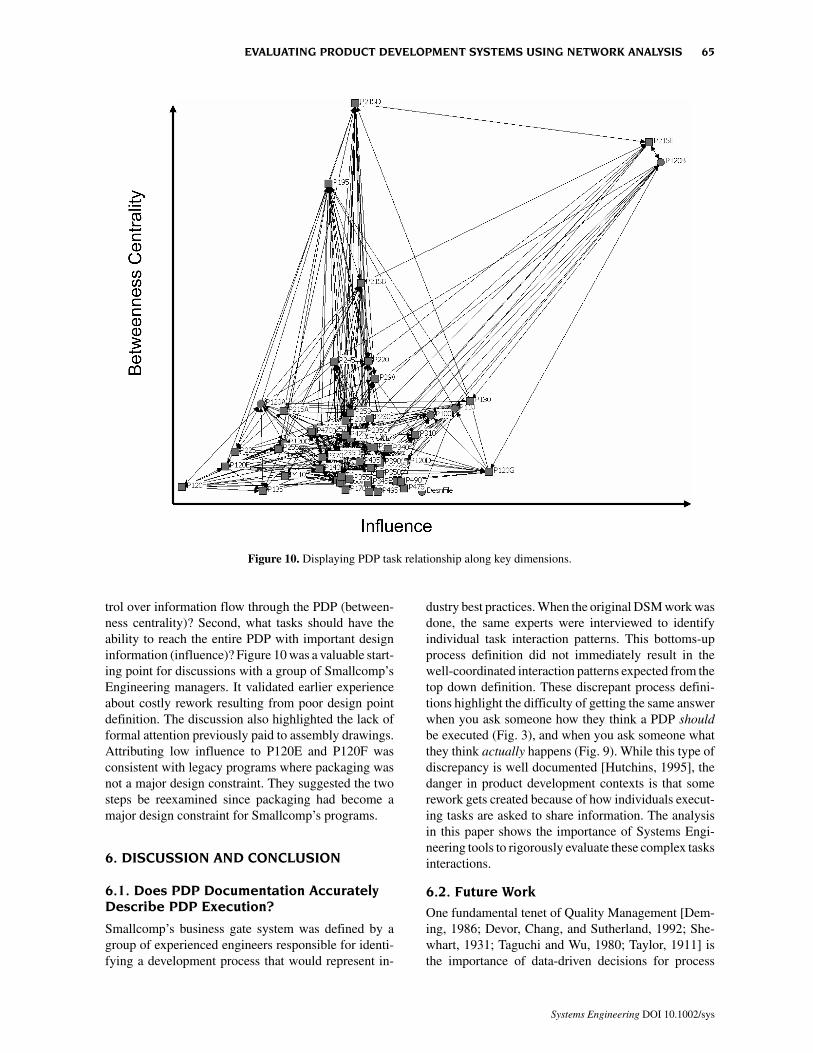
trol over information flow through the PDP (between-ness centrality)? Second, what tasks should have theability to reach the entire PDP with important designinformation (influence)? Figure 10 was a valuable start-ing point for discussions with a group of Smallcomp’sEngineering managers. It validated earlier experienceabout costly rework resulting from poor design pointdefinition. The discussion also highlighted the lack offormal attention previously paid to assembly drawings.Attributing low influence to P120E and P120F wasconsistent with legacy programs where packaging wasnot a major design constraint. They suggested the twosteps be reexamined since packaging had become amajor design constraint for Smallcomp’s programs.
6. DISCUSSION AND CONCLUSION
6.1. Does PDP Documentation AccuratelyDescribe PDP Execution?
Smallcomp’s business gate system was defined by agroup of experienced engineers responsible for identi-fying a development process that would represent in-
dustry best practices. When the original DSM work wasdone, the same experts were interviewed to identifyindividual task interaction patterns. This bottoms-upprocess definition did not immediately result in thewell-coordinated interaction patterns expected from thetop down definition. These discrepant process defini-tions highlight the difficulty of getting the same answerwhen you ask someone how they think a PDP shouldbe executed (Fig. 3), and when you ask someone whatthey think actually happens (Fig. 9). While this type ofdiscrepancy is well documented [Hutchins, 1995], thedanger in product development contexts is that somerework gets created because of how individuals execut-ing tasks are asked to share information. The analysisin this paper shows the importance of Systems Engi-neering tools to rigorously evaluate these complex tasksinteractions.
6.2. Future Work
One fundamental tenet of Quality Management [Dem-ing, 1986; Devor, Chang, and Sutherland, 1992; She-whart, 1931; Taguchi and Wu, 1980; Taylor, 1911] isthe importance of data-driven decisions for process
Figure 10. Displaying PDP task relationship along key dimensions.
EVALUATING PRODUCT DEVELOPMENT SYSTEMS USING NETWORK ANALYSIS 65
Systems Engineering DOI 10.1002/sys

control. With the shift in emphasis upstream of manu-facturing to product design [Nichols, 1992], a growingbody of literature emphasizes the importance of im-proving processes that involves creation and transfer ofdesign knowledge [Cooper, 1994; Cooper, Edgett, andKleinschmidt, 2002; Cooper and Kleinschmidt, 1993;Tapping and Shuker, 2003; Thomke and Reinersten,1998]. In this context, transmitting information be-tween groups is a significant element of engineeringprogram execution. Managers seeking to make mean-ingful improvements in the product development cyclemay often incorrectly identify actual sources of inter-dependencies because of the complex and interactingnature of organizational processes, tasks, and relation-ships [Brehmer, 1992; Repenning, Conclaves, andBlack, 2001; Siggelkow, 2002; Sterman, 1989]. It is asignificant challenge to understand the underlying pat-terns in the complex interactions shown by a full DSM(Fig. 4) or network map (Fig. 9).
Network Analysis offers a suite of metrics to analyti-cally measure the information flow characteristics incomplex product development environments, ratherthan relying on an individual or set of individuals toaccurately understand the entire process. This allowsthe PDP to be emergent, rather than predefined phe-nomena. In particular, the NA metrics in this paperidentify important tasks and task interactions in a PDP.Project managers can use these data to structure teamintegration mechanisms or to identify coordinatingmechanisms for groups of concurrently scheduledtasks. Functional managers and process architects canuse these data to understand which tasks and interac-tions truly constrain information flow in the PDP. Theycan then evaluate whether tasks like stage gates anddesign reviews are acting as effective information flowregulators in the PDP.
Real time adjustment to ideal sequences is often afact of life due to schedule, budget, and expertise con-straints. We believe that using NA metrics to evaluateinformation flow provides tools that help managersresponsible for making decisions in these contexts.Indeed, metrics that we have not discussed in this paper,such as equivalence [Wasserman and Faust, 1999],reachability [Wasserman and Faust, 1999], and keyplayers [Borgatti, 2006], provide additional opportuni-ties to develop robust measures of information flow incomplex product development environments.
REFERENCES
D. Batallas and A. Yassine, Information leaders in productdevelopment organizational networks: Social networkanalysis of the design structure matrix, IEEE Trans EngManagement 43(4) (2006), 570–582.
S.P. Borgatti, Identifying sets of key players in a socialnetwork, Comput Math Org Theory 12(1) (2006), 21–34.
D. Braha and Y. Bar-Yam, The statistical mechanics of com-plex product development: Empirical and analytical re-sults, Management Sci 53(7) (2007), 1127–1145.
B. Brehmer, Dynamic decision making: Human control ofcomplex systems, Acta Psychol 81(3) (1992), 211–241.
R.L. Brieger and P.E. Pattison, “Structures of economic inter-dependence among nations,” Continuities in structuralinquiry, P.M. Blau and R. Merton (Editors), The FreePress, New York, 1981, pp. 353–380.
T.R. Browning, Integrative mechanisms for multiteam inte-gration: Findings from five case studies, Syst Eng 1(2)(1998), 95–112.
T.R. Browning, Designing system development projects fororganizational integration, Syst Eng 2(4) (1999), 217–225.
T. Browning, F. Fricke, and H. Negele, Key concepts inmodeling product development processes, Syst Eng 9(2)(2006), 104–128.
T.R. Browning, Applying the design structure matrix to sys-tem decomposition and integration problems: A reviewand new directions, IEEE Trans Eng Management 48(3)(2001), 292–306.
R.J. Brymn, “Structural location and ideological divergence:Jewish Marxist intellectuals in turn-of-the-century Rus-sia,” Social structures, B. Wellman and S.D. Berkowitz(Editors), Cambridge University Press, Cambridge, 1988,pp. 359–379.
R.S. Burt, Cohesion versus structural equivalence as a basisfor network subgroups, Sociol Methods Res 7 (1978),189–212.
R.S. Burt, Social contagion and innovation: Cohesion versusstructural equivalence, Amer J Sociol 92 (1987), 1287–1335.
T. Bustnay and J. Ben-Asher, How many systems are there?—using the N2 method for systems partitioning, Syst Eng8(2) (2005), 109–118.
G. Chartrand, Introductory graph theory, Dover, Mineola,NY, 1985.
S.T. Collins, Expertise, disagreement, and bad things: Turbu-lent knowledge amidst organizational stress in engineer-ing R&D, Unpublished Ph.D. Dissertation, University ofConnecticut, Storrs, 2007.
S.T. Collins and A.A. Yassine, Evaluating product develop-ment task interactions using network analysis, Proceed-ings of the Seventeeth Annu Int Symp Int Council SystEng (San Diego, CA), Seattle: INCOSE, June 24–27,2007.
R.G. Cooper, Perspective: Third-generation new productprocesses, J Prod Innovation Management 11(1) (1994),3–14.
R.G. Cooper, S.J. Edgett and E.J. Kleinschmidt, Optimizingthe stage-gate process: What best practice companiesdo—II, Res Technol Management 45(5) (2002), 21–27.
R.G. Cooper and E.J. Kleinschmidt, Stage gate systems fornew product success, Market Management 1(4) (1993),10–29.
66 COLLINS, YASSINE, AND BORGATTI
Systems Engineering DOI 10.1002/sys
W.E. Deming, Out of the crisis, MIT Center for AdvancedEngineering Studies, Cambridge, MA, 1986.
R.E. Devor, T. Chang, and J.W. Sutherland, Statistical qualitydesign and control, Prentice Hall, Upper Saddle River, NJ,1992.
J. Galaskiewicz and K.R. Krohn, Positions, roles, and depend-encies in a community integration system, Sociol Quart25 (1984), 527–550.
R.A. Hanneman and M. Riddle, Introduction to social net-work methods, University of California, Riverside, 2005,http://faculty.ucr.edu/~hanneman/).
E. Hutchins, Cognition in the wild, The MIT Press, Cam-bridge, MA, 1995.
INCOSE, Systems engineering handbook: A “what to” guidefor all SE practitioners, International Council on SystemsEngineering, Seattle, 2004.
M. Kilduff and W. Tsai, Social networks and organizations,Sage, Thousand Oaks, CA, 2003.
A. Kusiak, Engineering design: Products, processes, and sys-tems, Academic, San Diego, CA, 1999.
K. Nichols, Better, cheaper, faster products - by design, J EngDes 3(3) (1992), 217–228.
N.P. Repenning, P. Goncalves and L.J. Black, Past the tippingpoint: The persistence of fire-fighting in product develop-ment, Calif Management Rev 43(4) (2001), 44–63.
F.J. Roethlisberger and W.J. Dickson, Management and theworker, Harvard University Press, Cambridge, MA, 1939.
J. Scott, Social network analysis: A handbook, Sage, London,2000.
D. Sharman and A. Yassine, Characterizing complex productarchitectures, Syst Eng 7(1) (2004), 35–60.
W. A. Shewhart, Economic control of quality of manufacturedproduct, Van Nostrand, Princeton, NJ, 1931.
N. Siggelkow, Misperceiving interactions among comple-ments and substitutes: Organizational consequences,Management Sci 48(7) (2002), 900–917.
D. Snyder and E.L. Kick, Structural position in the worldsystem and economic growth, 1955–1970: A multiple-network analysis of transnational interactions, Amer JSociol 84 (1979), 1096–1126.
M.E. Sosa, S.D. Eppinger and C.M. Rowles, The misalign-ment of product architecture and organizational structurein complex product development, Management Sci 50(12)(2004), 1674–1689.
M. Spinner, Improving project management skills and tech-niques, Prentice-Hall, Englewood Cliffs, NJ, 1989.
J.D. Sterman, Modeling managerial behavior: Mispercep-tions of feedback in a dynamic decision making experi-ment, Management Sci 35(3) (1989), 321–339.
D.V. Steward, The design structure system—a method formanaging the design of complex systems, IEEE Trans EngManagement EM-28 (August 1981), 71–74.
G. Taguchi and Y. Wu, Introduction to off-line quality control,Central Japan Quality Control Association, Nogoya, Ja-pan, 1980.
D. Tapping and T. Shuker, Value stream management for thelean office, Productivity Press, New York, 2003.
F. Taylor, The principles of scientific management, Harper,New York, 1911.
S. Thomke and D. Reinersten, Agile product development:Managing development flexibility in uncertain environ-ments, Calif Management Rev 41(1) (1998), 8–30.
S. Wasserman and K. Faust, Social network analysis methodsand applications, Cambridge University Press, Cam-bridge, 1999.
D. Whitney, Designing the design process, Res Eng Des 2(1)(1990), 3–13.
A. Yassine and D. Braha, Four complex problems in concur-rent engineering and the design structure matrix method,Concurrent Eng Res Appl 11(3) (2003).
A. Yassine, N. Joglekar, D. Braha, S. Eppinger, and D. Whit-ney, Information hiding in product development: The de-sign churn effect, Res Eng Des 14(3) (2003), 145–161.
Shawn T. Collins holds the position of Specialist, Controls Systems in the Engineering department atRolls-Royce in Indianapolis. His professional and academic work focuses on applying anthropologicalinsight to engineering product development. This has led to anthropology interests in ethnographicmethods, social network analysis, and cognitive anthropology; and to engineering interests in productdevelopment methods, process control, systems engineering, and team performance. Dr. Collins receivedthe B.S. degree in Mechanical Engineering from Purdue University in 1999, the M.S. degree in MechanicalEngineering in 2004 from Renssalaer Polytechnic Institute, and the M.A. and Ph.D. degrees in Anthropol-ogy in 2003 and 2007 from the University of Connecticut. He is a member of INCOSE, the Society forApplied Anthropology and the American Anthropological Association.
Ali A. Yassine is an assistant professor in the Department of Industrial and Enterprise Systems Engineering(IESE) at the University of Illinois at Urbana-Champaign (UIUC) and the director of the ProductDevelopment Research Laboratory. His research involves managing the development process of complexengineering systems, design process modeling, and IT-enabled concurrent engineering. Dr. Yassinereceived the B.E. degree in Mechanical Engineering in 1988 from the American University of Beirut andthe M.S. and Ph.D. degrees in Industrial and Manufacturing Engineering in 1989 and 1994 from WayneState University in Detroit, MI. He is a member of INFORMS, ASME, and PDMA.
EVALUATING PRODUCT DEVELOPMENT SYSTEMS USING NETWORK ANALYSIS 67
Systems Engineering DOI 10.1002/sys

Stephen P. Borgatti is a professor at the University of Kentucky in the Gatton College of Business andEconomics, where he holds the Chellgren Endowed Chair in the Management department. His researchinterests and consulting activities include knowledge management, culture and cognition and mathemati-cal/computational approaches to organizational theory. He is author of the most widely used social networkanalysis software, UCINET, and is a 2-term past president of INSNA, the professional association forsocial network researchers. Dr. Borgatti received the B.A. degree in Anthropology in 1977 from CornellUniversity and the Ph.D. degree in Mathematical Social Science in 1988 from the University of California,Irvine. He is currently a Senior Editor of Organization Science, and sits on the editorial boards of severalsocial science journals.
68 COLLINS, YASSINE, AND BORGATTI
Systems Engineering DOI 10.1002/sys