Embed Size (px)
Citation preview

WIB BOARD MEMBERS
LARRY BOOTH Frank M. Booth, Inc.
LESLIE BOTOS Blood Source
BRIAN BROADWAY Sacramento Job Corps
BILL CAMP Sacramento Central Labor Council
PAUL CASTRO California Human Development Corporation
LYNN R. CONNER Parasec
MICHAEL DOURGARIAN MDDV, Inc.
DIANE FERRARI Employment Development Department
TROY GIVANS County of Sacramento, Economic Development
DAVID W. GORDON Sacramento County Office of Education
JASON HANSON Sierra Pacific Home and Comfort, Inc.
LISA HARR Vision Service Plan
NOAH HARRIS Veterans Business Outreach Center
BARBARA HAYES Sacramento Area Commerce & Trade Organization
THOMAS P. KANDRIS American River Packaging
MATTHEW KELLY
GARY R. KING SMUD
DANIEL KOEN California Teachers Association
KATHY KOSSICK Sacramento Employment & Training Agency
STEVEN M. LADD, Ed.D Elk Grove Unified School District
PAUL LAKE County Department of Human Assistance
FRANK A. LOUIE Xerox Corporation
JOANNE MAHANEY-BUEHLER Area 4 Agency on Aging
SUSAN MANSFIELD A. Teichert & Son, Inc.
ELIZABETH MCCLATCHY The Safety Center, Inc.
DENNIS MORIN Sacramento Area Electrical Training Center
ROGER NIELLO Sacramento Metropolitan Chamber of Commerce
JAY ONASCH California Department of Rehabilitation
KIM PARKER California Employers Association
MARTHA PENRY California School Employees Association
DEBORAH PORTELA Casa Coloma Health Care Center
JONATHAN RAYMOND Sacramento City Unified School District
MAURICE READ Sacramento Sierra Building & Construction Trades Council
LORENDA T. SANCHEZ California Indian Manpower Consortium
ANETTE SMITH-DOHRING Sutter Health – Sacramento Sierra Region
MICHAEL R. TESTA Sacramento Convention & Visitors Bureau
DR. DAN THROGMORTON Los Rios Community College District
TERRY A. WILLS, ESQ. Cook Brown, LLP
RICK WYLIE Beutler Corporation
DAVID P. YOUNGER Lionakis Beaumont Design Group
REGULAR MEETING OF THE SACRAMENTO WORKS, INC. BOARD
DATE: Wednesday, September 25, 2013 TIME: 8:00 a.m.
LOCATION: SETA Board Room 925 Del Paso Blvd. Sacramento, California 95815
While the Sacramento Works, Inc. Board welcomes and encourages participation in the Sacramento Works, Inc. meetings, it would be appreciated if you would limit your comments to five minutes so that everyone may be heard. Matters under the jurisdiction of the Sacramento Works, Inc. Board and not on the posted agenda may be addressed by the general public following completion of the regular agenda. The Sacramento Works, Inc. Board limits testimony on matters not on the agenda to five minutes per person and not more than fifteen minutes for a particular subject. Meeting facilities are accessible to persons with disabilities. Requests for Assisted Listening Devices or other considerations should be made through the Clerk’s office at (916) 263-3827. This document and other Board meeting information may be accessed through the Internet by accessing the SETA home page: www.seta.net.
A G E N D A
PAGE NUMBER I. Call to Order/Roll Call Introduction of New Member: Susan Mansfield, A. Teichert & Son, Inc. Presentation: Progress Report: Next Economy Core
Business Cluster Initiative II. Consent Item (2 minutes) A. Approval of Minutes of the July 24, 2013 Meeting 1-6 III. Discussion/Action Items (20 Minutes) A. Approval of Board Initiative Funding Allocation for 7 Employer Outreach Activities (Terri Carpenter) B. Approval to Modify Deliverables for Sacramento 8-11 Works, Inc. Board Initiative Support of Next Economy - Core Business Cluster Engagement and Support (Robin Purdy)

C. Approval of Final Negotiated Local Workforce Investment Area 12-14 Performance Goals PY 2013-14 (Robin Purdy) IV. Information Items (20 Minutes) A. California Workforce Investment Board Additional Performance 15-17
Measures
B. Sacramento Works One Stop Career Center System Annual 18 Performance Reports July 1, 2012 –June 30, 2013
C. Dislocated Worker Report (William Walker) 19-20
D. Employer Recruitment Activity Report (William Walker) 21-24
E. Unemployment Update from the Employment Development 25-33
Department (Robin Purdy)
F. Committee Updates 34 V. Other Reports (5 minutes) 35 1. Chair 2. Members of the Board 3. Counsel 4. Public Participation VI. Adjournment
DISTRIBUTION DATE: THURSDAY, SEPTEMBER 19, 2013
WIB Sept. 25, 2013
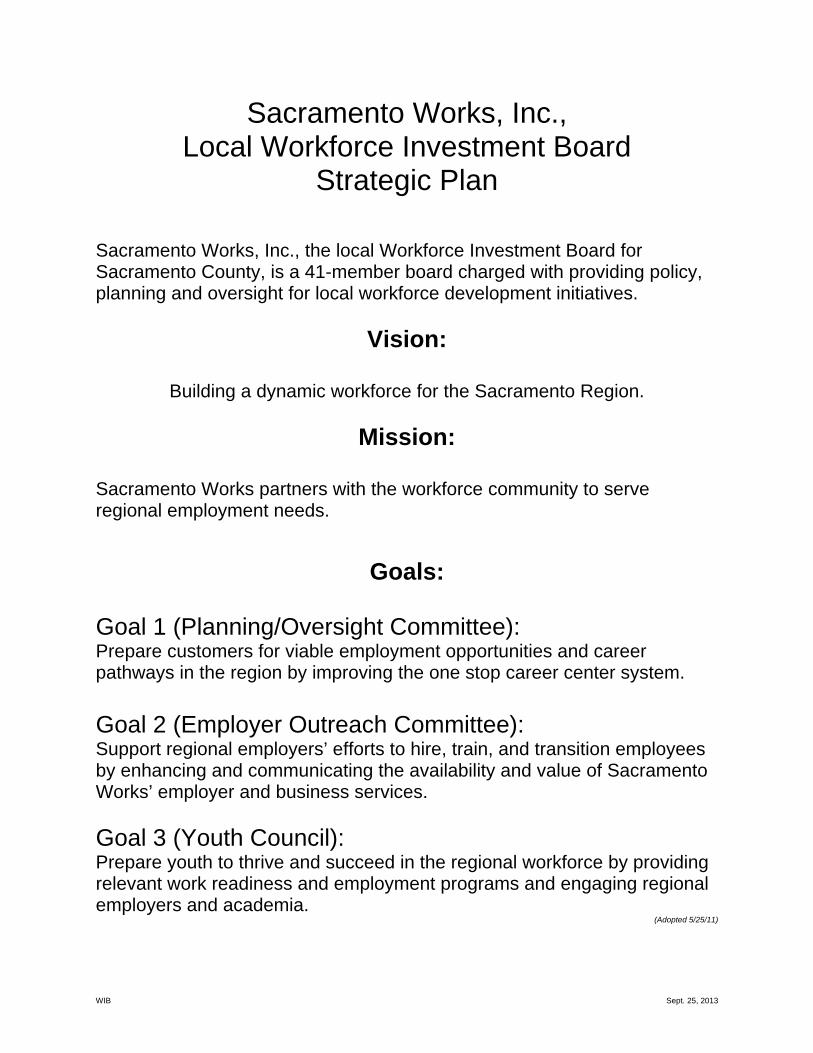
Sacramento Works, Inc., Local Workforce Investment Board
Strategic Plan Sacramento Works, Inc., the local Workforce Investment Board for Sacramento County, is a 41-member board charged with providing policy, planning and oversight for local workforce development initiatives.
Vision:
Building a dynamic workforce for the Sacramento Region.
Mission:
Sacramento Works partners with the workforce community to serve regional employment needs.
Goals:
Goal 1 (Planning/Oversight Committee): Prepare customers for viable employment opportunities and career pathways in the region by improving the one stop career center system.
Goal 2 (Employer Outreach Committee): Support regional employers’ efforts to hire, train, and transition employees by enhancing and communicating the availability and value of Sacramento Works’ employer and business services.
Goal 3 (Youth Council): Prepare youth to thrive and succeed in the regional workforce by providing relevant work readiness and employment programs and engaging regional employers and academia.
(Adopted 5/25/11)

WIB Sept. 25, 2013
ITEM II-A – CONSENT
APPROVAL OF MINUTES OF THE JULY 24, 2013 MEETING BACKGROUND: Attached are the minutes of the July 24, 2013 meeting for review. RECOMMENDATION: That your Board review, modify if necessary, and approve the attached minutes.
Page 1
WIB Sept. 25, 2013
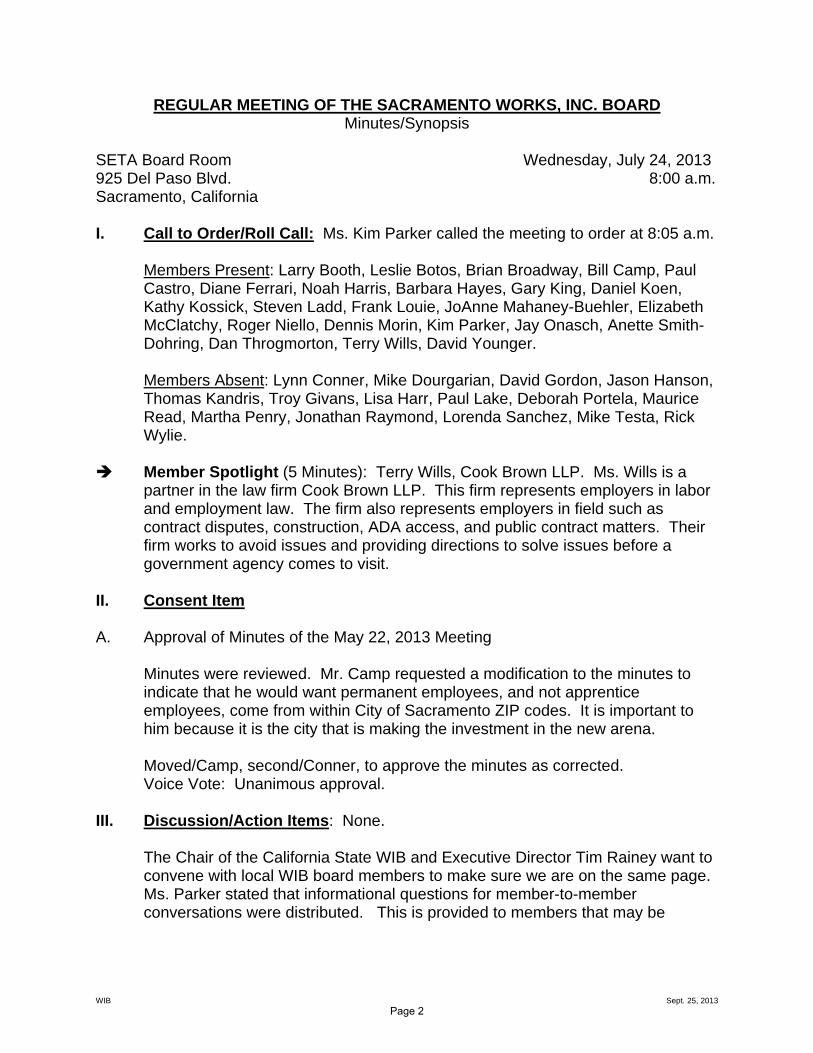
REGULAR MEETING OF THE SACRAMENTO WORKS, INC. BOARD Minutes/Synopsis
SETA Board Room Wednesday, July 24, 2013 925 Del Paso Blvd. 8:00 a.m. Sacramento, California I. Call to Order/Roll Call: Ms. Kim Parker called the meeting to order at 8:05 a.m.
Members Present: Larry Booth, Leslie Botos, Brian Broadway, Bill Camp, Paul Castro, Diane Ferrari, Noah Harris, Barbara Hayes, Gary King, Daniel Koen, Kathy Kossick, Steven Ladd, Frank Louie, JoAnne Mahaney-Buehler, Elizabeth McClatchy, Roger Niello, Dennis Morin, Kim Parker, Jay Onasch, Anette Smith-Dohring, Dan Throgmorton, Terry Wills, David Younger. Members Absent: Lynn Conner, Mike Dourgarian, David Gordon, Jason Hanson, Thomas Kandris, Troy Givans, Lisa Harr, Paul Lake, Deborah Portela, Maurice Read, Martha Penry, Jonathan Raymond, Lorenda Sanchez, Mike Testa, Rick Wylie.
Member Spotlight (5 Minutes): Terry Wills, Cook Brown LLP. Ms. Wills is a partner in the law firm Cook Brown LLP. This firm represents employers in labor and employment law. The firm also represents employers in field such as contract disputes, construction, ADA access, and public contract matters. Their firm works to avoid issues and providing directions to solve issues before a government agency comes to visit.
II. Consent Item A. Approval of Minutes of the May 22, 2013 Meeting Minutes were reviewed. Mr. Camp requested a modification to the minutes to
indicate that he would want permanent employees, and not apprentice employees, come from within City of Sacramento ZIP codes. It is important to him because it is the city that is making the investment in the new arena.
Moved/Camp, second/Conner, to approve the minutes as corrected. Voice Vote: Unanimous approval. III. Discussion/Action Items: None.
The Chair of the California State WIB and Executive Director Tim Rainey want to convene with local WIB board members to make sure we are on the same page. Ms. Parker stated that informational questions for member-to-member conversations were distributed. This is provided to members that may be
Page 2

WIB Sept. 25, 2013
contacted by the State WIB. If and when a board member is chosen, staff will provide additional information to those board members.
Board member comments:
T Mr. Camp thinks Career GPS is a great accomplishment for this board. T Mr. Noah Harris asked if the Small Business Administration’s cluster initiatives included in Career GPS? To what degree is that data included in this resource? Cull the data to see if there are relevant correlations between regional job clusters and national job clusters. T Ms. Parker stated that one thing she has seen since they do business
throughout the state; the regional collaboration here is not representative of the whole state. We have better success due to our partnerships regionally. There is consistency in the provision of services because of our strong linkages.
T Mr. King mentioned that there is some focus on the statewide basis looking at costs measurement and assessing value and return on investment. This board has a very strong measure of success. On the national level there is the same discussion on return on investment.
T Ms. Ferrari stated that one of the successes is how successful the local integrated service delivery system has been. This LWIB has seen more clients than any other WIB in the state. There has been a huge effort on the part of the partners and agencies in the region.
T Ms. Kossick stated that our board is able to collaborate with the community college programs and every board member works well together. Our board loves to collaborate; the spirit and culture of collaboration is very positive on our board. Ms. Kossick stated that the state WIB will be inviting members to participate in discussion of how they can help the local WIBS; there will be communication back and forth. Ms. Parker requested a report out on the collaboration.
Ms. Smith-Dohring stated that the state board meetings are open to the public; the next meeting is August 13. Everyone is invited to the meeting to see how the meeting works. Ms. Parker stated that the meetings are very lively.
IV. Information Items A. SETA Workforce Development Discretionary Grants
Ms. Robin Purdy stated that this report provides an overview of the kind of discretionary grants and the amount of funds coming into the area. This year, about $20 million total has been received and the discretionary grants are targeted to a particular segment of the population. WIA money funds the infrastructure, staffing, and systems, and the discretionary funds allow for the provision of other services. The Agency received Veterans employment assistance funds which enabled a partnership between American River College, PG&E and SMUD for the PowerPathways program. Wages for the graduates
Page 3

WIB Sept. 25, 2013
are extremely high and it has been a really great program overall. This is an example of funding with a targeted population. The largest discretionary grant is the 25% grant received from EDD through collaboration of 17 WIBs in the state; Sacramento Works receives $6 million to serve 800 dislocated employees recently dislocated in the area. There are a couple of high risk youth programs working to divert youth from high risk behavior. This group probably would not get services unless staff went after funds specifically for this group.
B. Update on Sacramento Works Training Center Implementation
Ms. Robin Purdy stated that the Agency needed to shift the service strategy to provide more training and less universal services. The model was changed 7/1 which eliminated six career centers and funded eight training centers. The five remaining career centers have seen double the amount of people coming through. There are 56 approved training providers and the One Stops can provide eligible customers with scholarships. There are 20 vendors that provide a variety of services, i.e. mental health, etc. Staff is working on contracts with all four Los Rios campuses to identify the courses that are impacted at the colleges due to their budget cuts but are very high needs for the employers. Staff is also working with Mr. Morin and all apprenticeship programs to support apprenticeship people to provide financial assistance and support. Mr. Camp suggested that the state WIB board push the boards that have a regional plan to make sure that the critical training needed in that region be provided by the local colleges and local providers. It is important that programs that provide job training not be cut. Ms. Parker urged Mr. Camp to bring this up at the regional level. Ms. Purdy stated that she has sat in on conversations where there was discussion of giving collaborative WIBs points for their collaborations.
C. Career GPS Updated Website Review
Ms. Terri Carpenter reviewed the Career GPS web site. Ms. Carpenter stated that the color pallets of the two organizations ‘marry’ very well. Ms. Carpenter stated that there are a few bugs to work out and there will be a media campaign announcing the revised site to the public. Mr. Camp asked how to we make this useful to those that have a challenge with the English language. Ms. Carpenter stated that there is a need to look at the organizations that engage in the occupations and educate them so they take it to the populations we work with.
Page 4
WIB Sept. 25, 2013
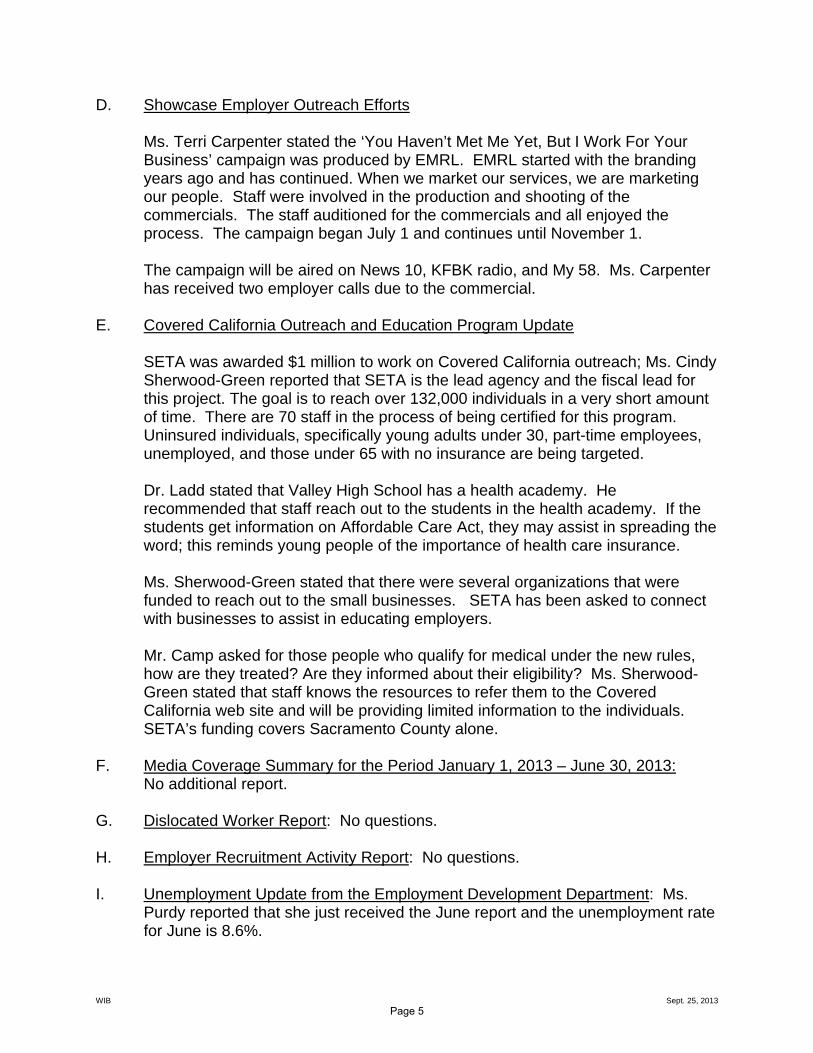
D. Showcase Employer Outreach Efforts
Ms. Terri Carpenter stated the ‘You Haven’t Met Me Yet, But I Work For Your Business’ campaign was produced by EMRL. EMRL started with the branding years ago and has continued. When we market our services, we are marketing our people. Staff were involved in the production and shooting of the commercials. The staff auditioned for the commercials and all enjoyed the process. The campaign began July 1 and continues until November 1.
The campaign will be aired on News 10, KFBK radio, and My 58. Ms. Carpenter has received two employer calls due to the commercial. E. Covered California Outreach and Education Program Update
SETA was awarded $1 million to work on Covered California outreach; Ms. Cindy Sherwood-Green reported that SETA is the lead agency and the fiscal lead for this project. The goal is to reach over 132,000 individuals in a very short amount of time. There are 70 staff in the process of being certified for this program. Uninsured individuals, specifically young adults under 30, part-time employees, unemployed, and those under 65 with no insurance are being targeted. Dr. Ladd stated that Valley High School has a health academy. He recommended that staff reach out to the students in the health academy. If the students get information on Affordable Care Act, they may assist in spreading the word; this reminds young people of the importance of health care insurance. Ms. Sherwood-Green stated that there were several organizations that were funded to reach out to the small businesses. SETA has been asked to connect with businesses to assist in educating employers. Mr. Camp asked for those people who qualify for medical under the new rules, how are they treated? Are they informed about their eligibility? Ms. Sherwood-Green stated that staff knows the resources to refer them to the Covered California web site and will be providing limited information to the individuals. SETA’s funding covers Sacramento County alone.
F. Media Coverage Summary for the Period January 1, 2013 – June 30, 2013: No additional report. G. Dislocated Worker Report: No questions. H. Employer Recruitment Activity Report: No questions.
I. Unemployment Update from the Employment Development Department: Ms. Purdy reported that she just received the June report and the unemployment rate for June is 8.6%.
Page 5

WIB Sept. 25, 2013
J. Committee Updates
Employer Outreach: No report. Youth Council: The next meeting is in September. Planning Committee: No report. Executive: No report.
V. Other Reports 1. Chair: Ms. Parker congratulated Mr. Castro on his promotion to director of
Workforce Development at CHDC. 2. Members of the Board
Mr. Camp stated that he is excited on the arena progress. Concern has been expressed to the City Council that the people that work there permanently come from the low income ZIP code areas in the city. This should be an opportunity for low income people in the city to be considered for employment. Mr. Camp would like to schedule a discussion to develop an agreement with investors that we require that anyone applying for a position at the new arena have successfully passed a soft-skills program AND come out of low income areas. Ms. McClatchy agreed that it is important to have soft skills prior to employment but she has issues with telling employers who they can hire. Mr. Niello stated that it is really not a good idea; this organization is not a City of Sacramento organization and we should not advocate on behalf of the city. Mr. Niello stated that we can suggest but not require where employers must hire from. The more controlling issue is that if we advocate policies that will dictate how and who employers can hire, it will severely compromise the mission of this agency. After discussion, Mr. Camp withdrew his suggestion; he will follow through in his own way. Ms. Kossick acknowledged Ms. Purdy for her 25 years at SETA.
3. Counsel: No report. 4. Public Participation: No report. VI. Adjournment: Meeting adjourned at 9:38 a.m.
Page 6
WIB Sept. 25, 2013
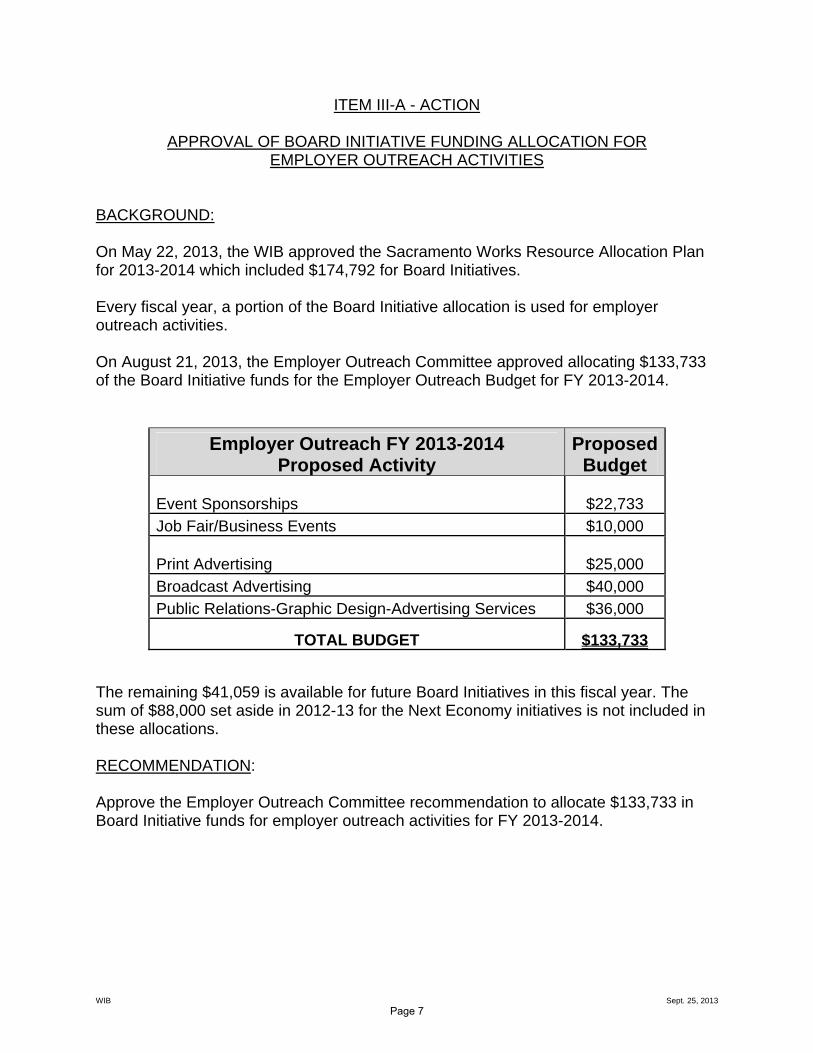
ITEM III-A - ACTION
APPROVAL OF BOARD INITIATIVE FUNDING ALLOCATION FOR EMPLOYER OUTREACH ACTIVITIES
BACKGROUND: On May 22, 2013, the WIB approved the Sacramento Works Resource Allocation Plan for 2013-2014 which included $174,792 for Board Initiatives. Every fiscal year, a portion of the Board Initiative allocation is used for employer outreach activities. On August 21, 2013, the Employer Outreach Committee approved allocating $133,733 of the Board Initiative funds for the Employer Outreach Budget for FY 2013-2014. The remaining $41,059 is available for future Board Initiatives in this fiscal year. The sum of $88,000 set aside in 2012-13 for the Next Economy initiatives is not included in these allocations. RECOMMENDATION: Approve the Employer Outreach Committee recommendation to allocate $133,733 in Board Initiative funds for employer outreach activities for FY 2013-2014.
Employer Outreach FY 2013-2014 Proposed Activity
Proposed Budget
Event Sponsorships
$22,733 Job Fair/Business Events $10,000
Print Advertising
$25,000
Broadcast Advertising $40,000 Public Relations-Graphic Design-Advertising Services $36,000
TOTAL BUDGET $133,733
Page 7

WIB Sept. 25, 2013
ITEM III-B – ACTION
APPROVAL TO MODIFY DELIVERABLES FOR
SACRAMENTO WORKS, INC. BOARD INITIATIVE SUPPORT OF NEXT ECONOMY - CORE BUSINESS CLUSTER ENGAGEMENT AND SUPPORT
BACKGROUND: On May 15, 2013 the Planning/Oversight Committee reviewed the scope of work for Next Economy Core Business Cluster Engagement and Support. The Committee approved investing $28,000 for convening and oversight of the Next Economy planning process and administration ($18,000), and developing accountability and reporting systems ($10,000), including monthly updates to the Planning/Oversight Committee. This is considered overarching support for the Next Economy. The Committee also approved investing up to $60,000 for the facilitation of cluster alliance groups focused on identifying the priorities and action plans to increase jobs and drive implementation of needed growth activities. The initial allocation was for $20,000 to be focused on conducting the first two cluster alliance groups: Information and Communications Technology and Life Sciences & Health Services. At the August meeting of the Planning/Oversight Committee, the committee authorized staff to revise the deliverables of the cluster alliance groups to reflect functions necessary to complete all cluster alliance plans rather than deliverables for each of the clusters. Staff has met with Valley Vision and is recommending the following modification to the agreements. Valley Vision will be available to provide an update on the work completed and to answer questions. Agreement #1 Overarching Support of Next Economy (no change) Provide Funding for convening, coordination, and development of accountability and reporting systems and provide monthly updates to Planning/Oversight Committee of Sacramento Works.
Deliverables Budget Due Date
Convening and oversight of Next Economy planning process, administration and monthly reports to the Planning/Oversight Committee of Sacramento Works
$18,000 June, 2014
Development of accountability and reporting systems (CSER)
$10,000 March, 2014
Total $28,000
Page 8

WIB Sept. 25, 2013
ITEM III-B – ACTION (continued) Page 2 Agreement #2: Diversify the Economy Through Growth and Support of Core Business Clusters Invest in the facilitation of cluster alliance groups focused on identifying the priorities and action plans to increase jobs and drive implementation of needed growth activities. Fund project manager to develop sector plans for five identified industry business clusters, beginning with Information and Communications Technology.
Core Business Clusters
Information and Communications Technology
Life Sciences & Health Services
Advanced Manufacturing
Clean Energy Technology
Agriculture & Food
Revised Scope of Work and Cluster Deliverables:
Cluster Planning - Scope of Work and Deliverables Budget Timeline
Complete, update, or expand database/list of the region’s cluster companies and identify companies for inclusion in outreach efforts within the industry cluster. These will serve as a first set of annual benchmarks by collecting employment counts, growth prospects, identification of peers and suppliers, and an assessment of business climate. Blend the SARTA and CSER databases of ICT
companies (we expect there are about 220 companies).
Update contact information and gather employment data as available on websites.
Use Phase II outreach conversations to add detailed information on a subset of companies (growth, employment, peers & suppliers)
(Payment of 25% upon completion of lists)
$12,500
September 30, 2013
Page 9
WIB Sept. 25, 2013
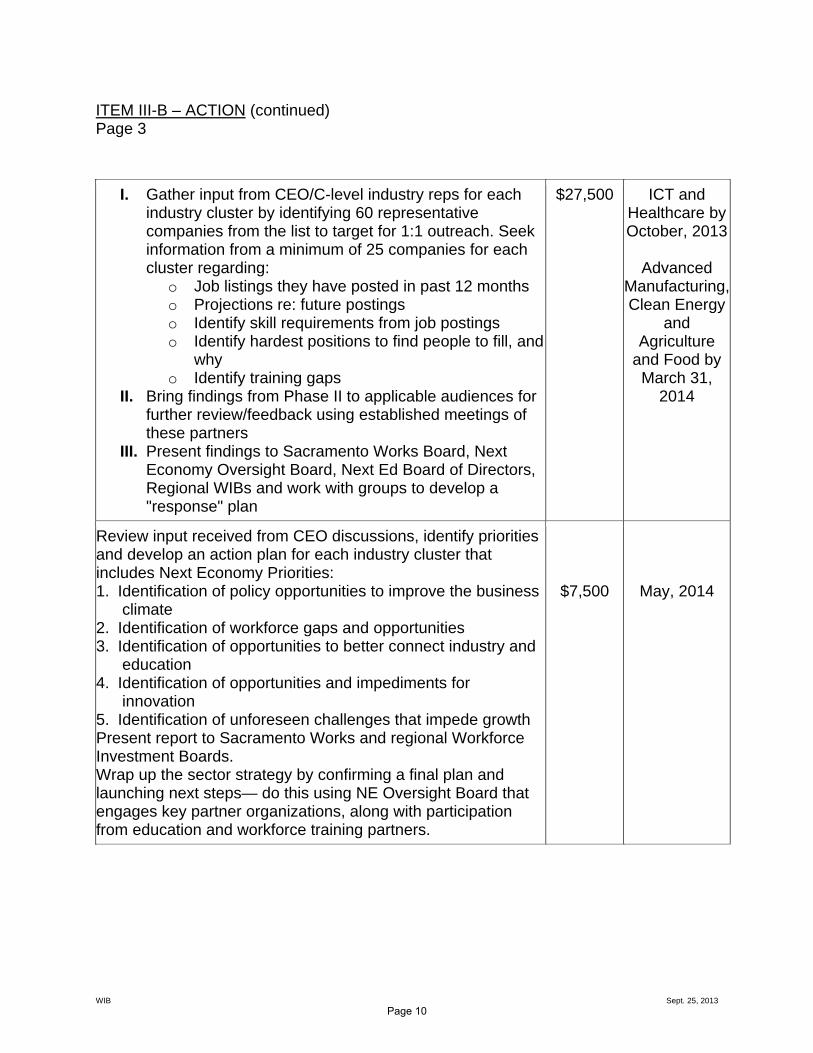
ITEM III-B – ACTION (continued) Page 3
I. Gather input from CEO/C-level industry reps for each industry cluster by identifying 60 representative companies from the list to target for 1:1 outreach. Seek information from a minimum of 25 companies for each cluster regarding:
o Job listings they have posted in past 12 months o Projections re: future postings o Identify skill requirements from job postings o Identify hardest positions to find people to fill, and
why o Identify training gaps
II. Bring findings from Phase II to applicable audiences for further review/feedback using established meetings of these partners
III. Present findings to Sacramento Works Board, Next Economy Oversight Board, Next Ed Board of Directors, Regional WIBs and work with groups to develop a "response" plan
$27,500 ICT and Healthcare by October, 2013
Advanced
Manufacturing, Clean Energy
and Agriculture
and Food by March 31,
2014
Review input received from CEO discussions, identify priorities and develop an action plan for each industry cluster that includes Next Economy Priorities: 1. Identification of policy opportunities to improve the business
climate 2. Identification of workforce gaps and opportunities 3. Identification of opportunities to better connect industry and
education 4. Identification of opportunities and impediments for
innovation 5. Identification of unforeseen challenges that impede growth Present report to Sacramento Works and regional Workforce Investment Boards. Wrap up the sector strategy by confirming a final plan and launching next steps— do this using NE Oversight Board that engages key partner organizations, along with participation from education and workforce training partners.
$7,500
May, 2014
Page 10

WIB Sept. 25, 2013
ITEM III-B – ACTION (continued) Page 4
When CEO Business discussions and Industry Action Plans are complete, convene regional organizations and institutions to identify and assign duties as appropriate for each entity.
$2,500 June, 2014
Total $50,000
Agreement #3 - Contract with subject matter experts to assist with cluster identification of employers and interviews with CEOs. $10,000 Total Initiative Amount Allocated: $88,000 RECOMMENDATION: Review the staff report and approve the modification of modify deliverables for Sacramento Works, Inc. board initiative support of Next Economy - core business cluster engagement and support
Page 11

WIB Sept. 25, 2013
ITEM III-C – ACTION
APPROVAL OF FINAL NEGOTIATED LOCAL WORKFORCE INVESTMENT AREA PERFORMANCE GOALS PY 2013-14
BACKGROUND: On June 14, 2013 the State of California, Employment Development Department (EDD) and the California Workforce Investment Board (CWIB) released a draft Directive reflecting the Program Year(PY) 2013-14 State Proposed Local Workforce Investment Area (LWIA) Adult, Dislocated Worker, and Youth Performance Goals. The Directive informed LWIAs of the option to negotiate local performance goal levels, and included the process for doing so. LWIAs interested in negotiating performance goals were required to submit a local performance proposal. Proposals submitted were to be prepared considering the following:
• The Governor’s performance goals for PY 2013;
• The local area’s desired performance levels, taking into account the statewide performance levels; and,
• The rationale for the proposed performance goals based on the economics,
demographics and service mix within the local area. SETA staff prepared a PY 2013-14 local performance goals proposal consistent with the client populations served, the local economic landscape, and based on LWIA performance over the last three program years. The proposal was submitted to the CWIB by the deadline of June 24, 2013. On August 2, 2013 SETA and staff of the CWIB entered into formal negotiations and reached agreement on the final PY 2013-14 Adult, Dislocated Worker, and Youth LWIA Performance Goals. The goals (State Proposed and Final Negotiated) are as follows:
WIA Requirement at Section 136(c) State Proposed
SETA/SWI PY 2013-14 Goals
SETA/SWI Negotiated PY 2013-14 Goals
Adults
Entered Employment Rate 58.1% 51%
Employment Retention Rate 84.8% 78%
Average Earnings $13,081 $12,177
Page 12

WIB Sept. 25, 2013
ITEM III-C – ACTION (continued)
Page 2
Dislocated Workers
Entered Employment Rate 69.1% 57.6%
Employment Retention Rate 91.0% 79.7%
Average Earnings $17,600 $15,500
Youth (ages 14-21)
Placement in Employment or Education 56.7% 64.3%
Attainment of a Degree or Certificate 71.0% 60.5%
Literacy and Numeracy Gains 71.8% 55%
RECOMMENDATION: Approve the final negotiated Local Workforce Investment Area (LWIA) Adult, Dislocated Worker, and Youth performance goals for PY 2013-14. The State will take future action to make these final.
Page 13

Sacramento LWIA Performance Comparison Chart (past, proposed, final negotiated)
2010-11 Actual*
2011-12 Actual*
2012-13 Actual* 3-year Avg.
2013-14 Proposed
Plan Goals
State 2013-14 Proposed
Goals
Proposed (State)
increase from 2012-13
Proposed (State)
Increase from 3-year Avg.
Plan Goal Increases
compared to 3-Year Avg.
Final Negotiated PY 2013-14
Goals
Exiters (Adult) 11,153 2413Served (Adult) 9,486 3384num Adult EER 5,418 1792 1417 8,627den Adult EER 13,362 4071 2682 20,115Adult Entered Employment 40.5% 44.0% 52.8% 42.9% 52% 58.1% 5.3% 15.2% 9.1% 51%num Adult Retention 4,629 3832 1767 10,228den Adult Retention 6,131 5078 2291 13,500Adult Retention 75.5% 75.5% 77.1% 75.8% 80% 84.8% 7.7% 9.0% 4.2% 78%num Adult Avg Earnings $54,949,548 44203798 22277649 121430995den Adult Avg Earnings 4,629 3831 1761 10,221Adult Avg Earnings $11,871 11,538$ 12,651$ 11,881$ 11,500$ 13,081$ 430$ 1,200$ (381)$ 12,177$ Exiters (DW) 3,672 1088Served (DW) 3,919 1574num DW EER 2,076 1041 860 3,977den DW EER 4,655 1866 1370 7,891DW Entered Employment 44.6% 55.8% 62.8% 50.4% 55% 69.1% 6.3% 18.7% 4.6% 57.6%num DW Retention 1,030 1367 893 3,290den DW Retention 1,353 1776 1080 4,209DW Retention 76.1% 77.0% 82.7% 78.2% 81% 91.0% 8.3% 12.8% 2.8% 79.7%num DW Avg Earnings $14,375,374 20595175 15200230 $50,170,779den DW Avg Earnings 1,030 1367 893 3,290DW Avg Earnings $13,957 15,066$ 17,022$ 15,249$ 15,500$ 17,600$ 578$ 2,351$ 251$ 15,500$ Exiters (Youth) 685 449Served (Youth) 748 991num Youth Placement 321 282 269 872den Youth Placement 701 531 522 1,754Youth Placement 45.8% 53.1% 51.5% 49.7% 72% 56.7% 5.2% 7.0% 22.3% 64.3%num Youth Degree 304 205 213 722den Youth Degree 522 342 330 1,194Youth Attain Degree 58.2% 59.9% 64.5% 60.5% 60% 71.1% 6.6% 10.6% -0.5% 60.5%num Lit Num 68 19 92 179den Lit Num 91 30 141 262Literacy Numeracy 74.7% 63.3% 65.2% 68.3% 54% 71.8% 6.6% 3.5% -14.3% 55%
*FutureWorks--Performance Mattesr Quarterly (PMQ)
Page 14

WIB Sept. 25, 2013
ITEM IV-A - INFORMATION
CALIFORNIA WORKFORCE INVESTMENT BOARD ADDITIONAL PERFORMANCE MEASURES
BACKGROUND: On August 13, 2013, the California Workforce Investment Board, through the work of an ad hoc subcommittee of the Issues and Policy Committee, approved seven “additional” performance measures for use in evaluating customer and system progress. These measures complement and further define the WIA common measures that are standard for the California system (these include job placement, job retention, and income increases for adult and dislocated workers, and placement in employment or education, skills increases, and certificate or degree attainment for youth). In selecting these measures, it was the State Board’s intention to create measurements that are directly tied to the goals of the State and local strategic plans, and tailored to reflect meaningful outcomes for jobseekers, workers, and employers. The additional performance measures are attached for your review. Sacramento Works, Inc. Board member Bill Camp and Deputy Director Robin Purdy have participated in the development of the additional performance measures and will be working with the CWIB to implement and test the effectiveness of the measures.
Page 15

Item 2c, Attachment 2 Page 1 of 2
What is the Policy Goal? How Will Success Be
Measured?
How is the Measure Defined? What Are the Details?
Increase the number of Californians with
the skills necessary to compete in
today’s economy.
Attainment of Industry-Valued
Credentials
Certificates and credentials that enable
students to enter middle skill jobs or career
pathways.
Credentials/certificates recognized by
employers, trade associations, and licensing
entities as meeting occupational requirements
and used in hiring decisions.
“Industry –Valued” are those certificates, degrees, or credentials (C/D/C) that are
necessary to:
Enter into an occupation, without which the job seeker would not be allowed to
practice or is at a disadvantage in the application process.
Enter into an occupation at a substantially higher wage rate than applicants w/o
the C/D/C.
Advance in an occupation or along a career path, as evidenced by wage gain or
job advancement (e.g. title change, scope of work change).
Increase the number of Californians who
earn enough to make ends meet.
Placement in Quality Jobs
(living wage jobs)
Jobs that meet a minimum threshold for wage
and/or benefits.
A living wage is a wage that is high enough to
maintain a decent standard of living (adequate
food, shelter, and other necessities). Living
wage varies based on the area-specific cost of
living.
Quality jobs are those that meet or exceed the Self Sufficiency Standard or Lower Living
Standard Income Level for a single adult for the county in which the job is located. This
will be measured by the hourly wage at placement.
Increase the number of Californians with
jobs and careers in high-demand,
priority industries in the regional or
State economy.
Placement in Targeted
Industry Sectors
Occupations in priority industry sectors as
identified by the State Board or local WIBs.
Sectors may be high-demand (new jobs or
replacement job openings), high-wage, or
represent a critical or emerging role in the
State/local economy.
Defined as placement of unemployed job seeker in a job in the priority industry,
transition of an employed worker (in a different industry) to a job in priority industry
sector, or advancement of current industry worker into new occupation in the same
priority industry sector.
Page 16

Item 2c, Attachment 2 Page 2 of 2
What is the Policy Goal? How Will Success Be
Measured?
How is the Measure Defined? What Are the Details?
Increase the income of Californians who
participate in workforce services and/or
training.
Return on Investment
Expenditures for workforce services as
compared against outcomes achieved.
Defined as income increase for workers placed in a new job or advanced to a new
occupation as a result of services delivered through the local WIB.
Return on Investment will be measured by the ratio between workforce service cost as
compared to income change.
Increase the value of the workforce
system to businesses/employers.
Employer Engagement &
Employer Investment
Employers are active partners in and
customers of workforce services, and provide
meaningful contributions – financial and in-
kind- to programs.
Measurement of the:
Percentage of employers who are repeat customers of the local workforce
system, and/or
Increase in the dollar value of percentage of total budget from employer
contribution to training, internships, equipment, or other services.
Increase the responsiveness of the
workforce system to local, regional, and
State-wide economic conditions.
Industry Sector Partnerships
Collaboration among workforce system
providers, educational and training
institutions, labor, and employers that target
the supply and demand gaps (hiring, training,
productivity, diversity, etc.) in targeted
industries.
Increase in the number and /or strength of industry sector partnerships, as measured
by:
Number or percentage of workers hired from sector programs.
Number or percentage of credentials achieved for sector program graduates.
Improvement in sector employer/industry outcomes (increased productivity,
decrease time to hire, etc.)
Increase the impact of the workforce
system and limit duplication of services.
Alignment of Funding Streams Local and/or regional funding decisions are
reflective of workforce system goals.
Funding that is dedicated to workforce system performance and outcome measures
defined in the local WIB plan (including those listed here), as measured by the
percentage of total LWIB budget.
Page 17

WIB Sept. 25, 2013
ITEM IV-B - INFORMATION
SACRAMENTO WORKS ONE STOP CAREER CENTER SYSTEM ANNUAL PERFORMANCE REPORTS JULY 1, 2012 –JUNE 30, 2013
BACKGROUND:
A copy of the Annual Performance Reports for last fiscal will be sent under separate cover. Staff will be available to answer questions.
Page 18

WIB Sept. 25, 2013
ITEM IV-C – INFORMATION
DISLOCATED WORKER REPORT
BACKGROUND: The most current dislocated worker update is attached; staff will be available to answer questions.
Page 19

MONTH RECEIVE NOTICE COMPANY AND ADDRESS WARN STATUS# OF
AFFECTED WORKERS
SETA'S INTERVENTION
Official 7/1/2013
AT&T 7405 Greenhaven Drive Sacramento, CA 95831 9/1/2013 97 8/26/2013
Official 7/9/2013
Point Walker, Inc. dba Lucky Derby Casino 7433 Greenback Lane Citrus Heights, CA 95610 7/29/2013 113 7/25/2013
Unofficial 8/5/2013
Orchard Supply Hardware 6124 San Juan Ave. Citrus Heights, CA 95610 8/31/2013 48 8/11/2013
Unofficial 8/9/2013
Sears 1200 Blumfeld Dr. Sacramento, CA 95815 8/30/2013 20 8/21/2013
Unofficial 9/6/2013
Fresh & Easy 2540 Watt Ave. Sacramento, CA 95821 9/6/2013 72 9/16 - 19/2013
Official 9/6/2013
Bimbo Bakery 7125 Governors Cir. Sacramento, CA 95823 9/6/2013 100 9/24/2013
Total # of Affected Workers 450
Dislocated Worker Information PY 2013/2014The following is an update of information as of September 18, 2013 on the Worker Adjustment and Training Notification (WARN) notices and Non WARN notifications in Sacramento County
Page 20

WIB Sept. 25, 2013
ITEM IV–D – INFORMATION
EMPLOYER RECRUITMENT ACTIVITY REPORT BACKGROUND: Staff at Sacramento Works Career Centers and internal Employer Services staff work with local employers to recruit qualified employees. The most current update is attached. Mr. William Walker will be available to answer questions.
Page 21

Employer Activity ReportJuly 1 ‐ August 19, 2013
EMPLOYER CRITICAL CLUSTERS
JOBS NO OF POSITIONS
ALSCO, INC 7 Maintenance Technician 18 Utility Laundry Worker 10
Atlas Disposal Industries 7 Diesel Mechanic 1Babe's Famous for Ribs 8 Cashier Host/Hostess 2California Association for Health Services at Home
1Registration Assistant 1
California Association of Winegrape Growers
1Administrative Assistant 1
California Department of Fish & Wildlife 10 Fish and Wildlife Seasonal Aide 1California Primary Care Association 1 Senior Administrative Assistant 1Center for Employment Training 1 Business Office Technology Instructor/Advisor 1
1 Medical Assistant Instructor/Advisor 1Cenveo 1 Adjuster 2Certified Employment Group
1Customer Service Representative (CSR) 30
Crossroads Diversified Services 1 Adult Education Instructor 1Daniel B. Dunleuy, M.D., Inc. 1 Receptionist 1Direct Marketing Specialists (DMS) 1 Residential Account Executive 15Donor Development Strategies
1Grassroots Canvassing and Field Managers in Training
5
Elk Grove Food Bank Services 1 Administrative Assistant 1Fairytale Town 1 Education & Program Assistant 1
1 Part-Time Grounds Keeper 1General Produce Company 9 Commercial Drivers 4
9 Delivery Route Truck Driver 39 Order Selector 5
Gold Country Water 1 Customer Service/ Driver and Delivery 1Golden State Overnight 1 Customer Service Representatives 5International Homestay America 10 Homestay Host Family 25Kyle's Rock & Redi-Mix, Inc. 10 Yard Laborer 1Los Rios Community College District 1 Administrative Assistant I 1
1 Administrative Assistant II 1
1Assistant Financial Aid Officer (Temporary)
1Associate Vice President of Instruction and Student Learning
1
1Automotive Collision Technology Adjunct Professor Pool
1
1 Clerk II 11 Clerk III 11 College Police Sergeant (2 Positions) 11 Custodian 21 Educational Media Design Specialist 1
1Facilities Management Operations Supervisor
1
1 Grant Coordination Clerk 11 Groundskeeper (2 Positions) 2
Critical Occupational Clusters Key: 1=Administrative & Support Services; 2=Architecture & Engineering; 3=Construction; 4=Healthcare & Supportive Service; 5=Human Services; 6=Information Technology; 7= Installation, Maintenance & Repair; 8=Tourism/Hospitality; 9=Transportation & Production; 10=Non-Critical Occupations
Page 1 of 3Page 22

Employer Activity ReportJuly 1 ‐ August 19, 2013
EMPLOYER CRITICAL CLUSTERS
JOBS NO OF POSITIONS
Critical Occupational Clusters Key: 1=Administrative & Support Services; 2=Architecture & Engineering; 3=Construction; 4=Healthcare & Supportive Service; 5=Human Services; 6=Information Technology; 7= Installation, Maintenance & Repair; 8=Tourism/Hospitality; 9=Transportation & Production; 10=Non-Critical Occupations
Los Rios Community College District 1 Instructional Assistant - Math 1
1Instructional Assistant - Mechanical/Electrical Technology (Temporary)
1
1 Instructional Services Assistant I 11 Instructional Services Assistant II 11 Outreach Clerk 11 Payroll Clerk I 110 President, American River College 1
1Special Projects - Human Resources Training (Temporary)
1
1Student Personnel Assistant - Student Services
1
1Vice President, Administrative Services and Student Support (REVISED)
1
Matrix Absence Management1
Clerical Assistant- Temporary Assignment
1
1Workers' Compensation Claims Assistant 1
Mid Valley Funding 1 Mortgage Loan Processor 1Nonprofit Resource Center
1Administrative Assistant Part Time/Temporary
1
Northern Sheets LLC1
Customer Service Representative (CSR) 1
Pacific Protection INC 1 Unarmed Security Officer 4Prime Flight Aviation Services 10 Cabin Service Cleaner 3Relationship Skills Center 10 REact Coordinator 1Sacramento Employment and Training Agency
1Associate Teacher III 1
Sacramento Loaves & Fishes1
Part-Time Student Resource Specialist 1
Sacramento Regional Transit District 1 Clerk II 11 Customer Service Supervisor 14 Facilities Maintenance Mechanic 1
Society for the Blind 1 Part-Time Administrative Assistant 1Staffing Network LLC 9 Production Workers 10Stroppini Enterprises 7 Machinists 3Support For Home 4 Home Care Aide 1SVS GROUP, INC. 10 General Laborer 50The Fresh Market 10 Assistant Deli Manager 1
10 Assistant Front End Manager 110 Assistant Grocery Specialist 210 Assistant Produce Manager 210 Baker 410 Bulk Specialist 410 Candy/Coffee Specialist 410 Cheese Specialist 410 Gift/Floral Specialist 410 Meat Cutter 410 Seafood Specialist 4
Page 2 of 3Page 23

Employer Activity ReportJuly 1 ‐ August 19, 2013
EMPLOYER CRITICAL CLUSTERS
JOBS NO OF POSITIONS
Critical Occupational Clusters Key: 1=Administrative & Support Services; 2=Architecture & Engineering; 3=Construction; 4=Healthcare & Supportive Service; 5=Human Services; 6=Information Technology; 7= Installation, Maintenance & Repair; 8=Tourism/Hospitality; 9=Transportation & Production; 10=Non-Critical Occupations
Transglobal Solutions, LLC. 9 Class A Commercial Truck Driver 20Tony's Fine Foods, Inc. 10 Order Selector - Truckee 1
10 Order Selector - West Sacramento 4Visiting Angels Senior Home Care 4 In-Home Personal Attendants 10WINDWALKER SECURITY PATROL, INC.
1Security Guard 4
Youth Development Network 5 Youth Development Trainer Specialist 1TOTAL 302
Page 3 of 3Page 24

WIB Sept. 25, 2013
ITEM IV–E – INFORMATION
UNEMPLOYMENT UPDATE/PRESS RELEASE FROM THE EMPLOYMENT DEVELOPMENT DEPARTMENT
BACKGROUND: The unemployment rate for Sacramento County for the month July was 8.9%. Attached is a copy of a press release from the Employment Development Department breaking down the job losses and job creations for the regional area. Staff will be available to answer questions.
Page 25

# # # # #
State of California August 16, 2013 EMPLOYMENT DEVELOPMENT DEPARTMENT Labor Market Information Division Contact: Diane Patterson 7000 Franklin Blvd., Bldg. 1100 (916) 865-2453 Sacramento, CA 95823 SACRAMENTO-ARDEN-ARCADE-ROSEVILLE METROPOLITAN STATISTICAL AREA (MSA)
(EL DORADO, PLACER, SACRAMENTO, AND YOLO COUNTIES) Total employment declined over-the-month, but increased over-the-year.
The unemployment rate in the Sacramento-Arden Arcade-Roseville MSA was 8.9 percent in July 2013, up from a revised 8.4 percent in June 2013, and below the year-ago estimate of 10.9 percent. This compares with an unadjusted unemployment rate of 9.3 percent for California and 7.7 percent for the nation during the same period. The unemployment rate was 8.4 percent in El Dorado County, 7.8 percent in Placer County, 9.2 percent in Sacramento County, and 8.7 percent in Yolo County.
Between June 2013 and July 2013, total wage and salary employment located in the counties of El Dorado, Placer, Sacramento, and Yolo decreased by 13,500 to total 837,300 jobs.
Government cutback 13,000 jobs, predominately in local government (down 10,900 jobs), a normal seasonal change.
Educational and health services lost 1,000 jobs over the month. Educational services led the decline (down 700 jobs).
Construction (down 500 jobs) and other services (down 500 jobs) each contributed to the month-over reduction.
Manufacturing added 900 jobs. Food manufacturing (up 500 jobs) and computer and electronic product manufacturing (up 400 jobs) lead the expansion.
Between July 2012 and July 2013, total jobs in the region increased by 5,000, or 0.6 percent.
Trade, transportation, and utilities dominated the year-over growth with an increase of 5,100 jobs. Retail trade was the largest contributing factor, with a gain of 3,600 jobs.
Leisure and hospitality picked up 3,600 jobs. The majority of the gains were in accommodation and food services (up 3,200 jobs).
Educational and health services added 3,100 jobs over the year. The increase was split between health care and social assistance (up 1,600 jobs) and education services (up 1,500 jobs).
Construction lost 4,100 jobs. Residual construction (down 2,600 jobs), specialty trade contractors (down 800 jobs), and construction of buildings (down 700 jobs) all contributed to the decline.
Page 26

State of CaliforniaEMPLOYMENT DEVELOPMENT DEPARTMENTLabor Market Information Division Diane Patterson7000 Franklin Blvd., Bldg. 1100 916/865-2453Sacramento, CA 95823
Jun-2013 Jul-2013 Jul-2013Revised Prelim Prelim
Total, All Industries 850,800 837,300 (13,500) 832,300 837,300 5,000Total Farm 9,600 9,700 100 10,400 9,700 (700)Total Nonfarm 841,200 827,600 (13,600) 821,900 827,600 5,700Mining and Logging 400 400 0 400 400 0Construction 37,000 36,500 (500) 40,600 36,500 (4,100)Manufacturing 34,600 35,500 900 34,300 35,500 1,200Trade, Transportation & Utilities 143,100 143,200 100 138,100 143,200 5,100Information 14,500 14,500 0 15,300 14,500 (800)Financial Activities 47,300 47,300 0 48,200 47,300 (900)Professional & Business Services 115,100 115,300 200 114,300 115,300 1,000Educational & Health Services 107,500 106,500 (1,000) 103,400 106,500 3,100Leisure & Hospitality 89,700 89,900 200 86,300 89,900 3,600Other Services 26,700 26,200 (500) 28,600 26,200 (2,400)Government 225,300 212,300 (13,000) 212,400 212,300 (100)
Notes: Data not adjusted for seasonality. Data may not add due to rounding Labor force data are revised month to month Additional data are available on line at www.labormarketinfo.edd.ca.gov
August 16, 2013
IMMEDIATE RELEASESACRAMENTO-ARDEN ARCADE-ROSEVILLE METROPOLITAN STATISTICAL AREA (MSA)
(El Dorado, Placer, Sacramento, and Yolo Counties)
The unemployment rate in the Sacramento-Arden Arcade-Roseville MSA was 8.9 percent in July 2013, up from a revised 8.4 percent in June 2013, and below the year-ago estimate of 10.9 percent. This compares with an unadjusted unemployment rate of 9.3 percent for California and 7.7 percent for the nation during the same period. The unemployment rate was 8.4 percent in El Dorado County, 7.8 percent in Placer County, 9.2 percent in Sacramento County, and 8.7 percent in Yolo County.
Industry Change Jul-2012 Change
7.0%
8.0%
9.0%
10.0%
11.0%
12.0%
13.0%
Unemployment Rate Historical Trend
Page 27

Employment Development DepartmentLabor Market Information Division
http://www.labormarketinfo.edd.ca.gov(916) 262-2162
RANK BY RATE LABOR FORCE EMPLOYMENT UNEMPLOYMENT RATE
--- 18,690,400 16,947,000 1,743,500 9.3%12 780,800 720,200 60,600 7.8%44 410 360 50 12.0%29 16,570 14,920 1,650 9.9%34 100,300 89,400 10,900 10.8%31 19,550 17,520 2,030 10.4%55 12,060 10,320 1,740 14.4%11 538,900 497,500 41,400 7.7%45 10,900 9,580 1,320 12.1%22 90,000 82,500 7,500 8.4%47 447,200 391,200 56,000 12.5%52 12,410 10,790 1,620 13.1%25 58,800 53,500 5,300 9.0%58 75,900 56,100 19,800 26.1%16 9,280 8,540 730 7.9%42 394,500 348,500 45,900 11.6%49 62,100 54,300 7,900 12.6%47 25,060 21,920 3,140 12.5%31 12,440 11,140 1,300 10.4%34 4,991,800 4,451,600 540,200 10.8%40 68,700 60,900 7,800 11.3%1 143,400 135,800 7,600 5.3%
10 10,350 9,580 770 7.4%16 42,170 38,830 3,340 7.9%56 108,500 92,700 15,800 14.6%33 3,930 3,520 420 10.6%19 8,360 7,680 680 8.1%20 237,300 217,800 19,400 8.2%4 81,200 76,300 4,900 6.0%
12 50,040 46,130 3,910 7.8%5 1,638,400 1,531,900 106,500 6.5%
12 178,600 164,700 14,000 7.8%30 10,050 9,010 1,040 10.3%38 933,600 829,600 103,900 11.1%26 681,600 618,500 63,000 9.2%28 26,300 23,700 2,600 9.8%34 850,100 758,700 91,500 10.8%12 1,615,900 1,490,100 125,900 7.8%3 486,400 457,600 28,800 5.9%
50 298,800 260,700 38,200 12.8%7 146,100 136,000 10,100 6.9%2 403,000 380,100 22,900 5.7%6 234,100 218,400 15,800 6.7%8 928,700 862,800 65,900 7.1%
20 159,500 146,300 13,200 8.2%37 80,500 71,700 8,800 10.9%38 1,510 1,340 170 11.1%41 19,140 16,940 2,200 11.5%23 220,300 201,600 18,700 8.5%8 258,800 240,500 18,300 7.1%
51 238,200 207,300 30,800 12.9%53 42,200 36,500 5,800 13.6%46 24,450 21,460 2,980 12.2%43 4,950 4,370 580 11.8%54 204,800 176,600 28,200 13.8%26 25,610 23,250 2,370 9.2%18 441,000 405,800 35,200 8.0%24 97,000 88,600 8,400 8.7%56 27,900 23,900 4,100 14.6%
State of CaliforniaAugust 16, 2013March 2012 Benchmark
REPORT 400 C
Monthly Labor Force Data for CountiesJuly 2013 - Preliminary
Data Not Seasonally Adjusted
COUNTY
STATE TOTALALAMEDAALPINEAMADORBUTTECALAVERASCOLUSACONTRA COSTADEL NORTEEL DORADOFRESNOGLENNHUMBOLDTIMPERIALINYOKERNKINGSLAKELASSENLOS ANGELESMADERAMARINMARIPOSAMENDOCINOMERCEDMODOCMONOMONTEREYNAPANEVADAORANGEPLACERPLUMASRIVERSIDESACRAMENTOSAN BENITOSAN BERNARDINOSAN DIEGOSAN FRANCISCOSAN JOAQUINSAN LUIS OBISPOSAN MATEOSANTA BARBARASANTA CLARASANTA CRUZ
VENTURA
SHASTASIERRASISKIYOUSOLANOSONOMASTANISLAUS
YOLOYUBA
Notes
1) Data may not add due to rounding. The unemployment rate is calculated using unrounded data.
2) Labor force data for all geographic areas now reflect the March 2012 benchmark and Census 2010 population controls at the state level.
SUTTERTEHAMATRINITYTULARETUOLUMNE
Page 28

State of California Employment Development DepartmentAugust 16, 2013 Labor Market Information DivisionMarch 2012 Benchmark http://www.labormarketinfo.edd.ca.gov
(916) 262-2162
AreaRANK BY
RATE LABOR FORCE EMPLOYMENT UNEMPLOYMENT RATE
STATE TOTAL --- 18,690,400 16,947,000 1,743,500 9.3%
BAKERSFIELD DELANO MSA (Kern Co.) 47 394,500 348,500 45,900 11.6%
CHICO MSA (Butte Co.) 38 100,300 89,400 10,900 10.8%
EL CENTRO MSA (Imperial Co.) 64 75,900 56,100 19,800 26.1%
FRESNO MSA (Fresno Co.) 52 447,200 391,200 56,000 12.5%
HANFORD CORCORAN MSA (Kings Co.) 54 62,100 54,300 7,900 12.6%
LOS ANGELES LONG BEACH GLENDALE MD (Los Angeles Co.) 38 4,991,800 4,451,600 540,200 10.8%
MADERA CHOWCHILLA MSA (Madera Co.) 45 68,700 60,900 7,800 11.3%
MERCED MSA (Merced Co.) 62 108,500 92,700 15,800 14.6%
MODESTO MSA (Stanislaus Co.) 56 238,200 207,300 30,800 12.9%
NAPA MSA (Napa Co.) 5 81,200 76,300 4,900 6.0%
OAKLAND FREMONT HAYWARD MD 13 1,319,700 1,217,700 102,000 7.7%
Alameda Co. 15 780,800 720,200 60,600 7.8%
Contra Costa Co. 13 538,900 497,500 41,400 7.7%
OXNARD THOUSAND OAKS VENTURA MSA (Ventura Co.) 21 441,000 405,800 35,200 8.0%
REDDING MSA (Shasta Co.) 41 80,500 71,700 8,800 10.9%
RIVERSIDE SAN BERNARDINO ONTARIO MSA 42 1,783,700 1,588,300 195,400 11.0%
Riverside Co. 43 933,600 829,600 103,900 11.1%
San Bernardino Co. 38 850,100 758,700 91,500 10.8%
SACRAMENTO ARDEN ARCADE ROSEVILLE MSA 28 1,047,300 954,300 92,900 8.9%
El Dorado Co. 25 90,000 82,500 7,500 8.4%
Placer Co. 15 178,600 164,700 14,000 7.8%
Sacramento Co. 30 681,600 618,500 63,000 9.2%
Yolo Co. 27 97,000 88,600 8,400 8.7%
SALINAS MSA (Monterey Co.) 23 237,300 217,800 19,400 8.2%
SAN DIEGO CARLSBAD SAN MARCOS MSA (San Diego Co.) 15 1,615,900 1,490,100 125,900 7.8%
SAN FRANCISCO SAN MATEO REDWOOD CITY MD 2 1,032,800 973,600 59,200 5.7%
Marin Co. 1 143,400 135,800 7,600 5.3%
San Francisco Co. 4 486,400 457,600 28,800 5.9%
San Mateo Co. 2 403,000 380,100 22,900 5.7%
SAN JOSE SUNNYVALE SANTA CLARA MSA 11 955,000 886,500 68,500 7.2%
San Benito Co. 32 26,300 23,700 2,600 9.8%
Santa Clara Co. 9 928,700 862,800 65,900 7.1%
SAN LUIS OBISPO PASO ROBLES MSA (San Luis Obispo Co.) 8 146,100 136,000 10,100 6.9%
SANTA ANA ANAHEIM IRVINE MD (Orange Co.) 6 1,638,400 1,531,900 106,500 6.5%
SANTA BARBARA SANTA MARIA GOLETA MSA (Santa Barbara Co.) 7 234,100 218,400 15,800 6.7%
SANTA CRUZ WATSONVILLE MSA (Santa Cruz Co.) 23 159,500 146,300 13,200 8.2%
SANTA ROSA PETALUMA MSA (Sonoma Co.) 9 258,800 240,500 18,300 7.1%
STOCKTON MSA (San Joaquin Co.) 55 298,800 260,700 38,200 12.8%
VALLEJO FAIRFIELD MSA (Solano Co.) 26 220,300 201,600 18,700 8.5%
VISALIA PORTERVILLE MSA (Tulare Co.) 59 204,800 176,600 28,200 13.8%
YUBA CITY MSA 60 70,200 60,300 9,800 14.0%
Sutter Co. 58 42,200 36,500 5,800 13.6%
Yuba Co. 62 27,900 23,900 4,100 14.6%
Alpine Co. 49 410 360 50 12.0%
Amador Co. 33 16,570 14,920 1,650 9.9%
Calaveras Co. 35 19,550 17,520 2,030 10.4%
Colusa Co. 61 12,060 10,320 1,740 14.4%
Del Norte Co. 50 10,900 9,580 1,320 12.1%
Glenn Co. 57 12,410 10,790 1,620 13.1%
Humboldt Co. 29 58,800 53,500 5,300 9.0%
Inyo Co. 19 9,280 8,540 730 7.9%
Lake Co. 52 25,060 21,920 3,140 12.5%
Lassen Co. 35 12,440 11,140 1,300 10.4%
Mariposa Co. 12 10,350 9,580 770 7.4%
Mendocino Co. 19 42,170 38,830 3,340 7.9%
Modoc Co. 37 3,930 3,520 420 10.6%
Mono Co. 22 8,360 7,680 680 8.1%
Nevada Co. 15 50,040 46,130 3,910 7.8%
Plumas Co. 34 10,050 9,010 1,040 10.3%
Sierra Co. 43 1,510 1,340 170 11.1%
Siskiyou Co. 46 19,140 16,940 2,200 11.5%
Tehama Co. 51 24,450 21,460 2,980 12.2%
Trinity Co. 48 4,950 4,370 580 11.8%
Tuolumne Co. 30 25,610 23,250 2,370 9.2%
1) Data may not add due to rounding. The unemployment rate is calculated using unrounded data.
2) Labor force data for all geographic areas now reflect the March 2012 benchmark and Census 2010 population controls at the state level.
REPORT 400 M
Monthly Labor Force Data for CaliforniaCounties and Metropolitan Statistical Areas
July 2013 - PreliminaryData Not Seasonally Adjusted
Notes
Page 29

August 16, 2013
Employment Development Department Sacramento Arden Arcade Roseville MSALabor Market Information Division (El Dorado, Placer, Sacramento, and Yolo Counties)(916) 262-2162 Industry Employment & Labor Force
March 2012 Benchmark
Data Not Seasonally AdjustedJul 12 May 13 Jun 13 Jul 13 Percent Change
Revised Prelim Month YearCivilian Labor Force (1) 1,055,200 1,044,600 1,051,900 1,047,300 -0.4% -0.7% Civilian Employment 940,300 962,900 963,200 954,300 -0.9% 1.5% Civilian Unemployment 114,800 81,800 88,700 92,900 4.7% -19.1%Civilian Unemployment Rate 10.9% 7.8% 8.4% 8.9%(CA Unemployment Rate) 11.0% 8.1% 8.9% 9.3%(U.S. Unemployment Rate) 8.6% 7.3% 7.8% 7.7%
Total, All Industries (2) 832,300 842,900 850,800 837,300 -1.6% 0.6% Total Farm 10,400 9,200 9,600 9,700 1.0% -6.7% Total Nonfarm 821,900 833,700 841,200 827,600 -1.6% 0.7% Total Private 609,500 608,600 615,900 615,300 -0.1% 1.0% Goods Producing 75,300 69,900 72,000 72,400 0.6% -3.9% Mining and Logging 400 300 400 400 0.0% 0.0% Construction 40,600 34,800 37,000 36,500 -1.4% -10.1% Construction of Buildings 9,700 8,800 8,900 9,000 1.1% -7.2% Specialty Trade Contractors 25,900 23,300 24,900 25,100 0.8% -3.1% Building Foundation & Exterior Contractors 6,400 4,900 5,100 5,200 2.0% -18.8% Building Equipment Contractors 10,200 10,400 10,900 10,900 0.0% 6.9% Building Finishing Contractors 5,800 4,700 5,200 5,200 0.0% -10.3% Manufacturing 34,300 34,800 34,600 35,500 2.6% 3.5% Durable Goods 23,300 23,800 23,600 23,900 1.3% 2.6% Computer & Electronic Product Manufacturing 7,800 8,400 8,300 8,700 4.8% 11.5% Nondurable Goods 11,000 11,000 11,000 11,600 5.5% 5.5% Food Manufacturing 4,800 4,500 4,800 5,300 10.4% 10.4% Service Providing 746,600 763,800 769,200 755,200 -1.8% 1.2% Private Service Providing 534,200 538,700 543,900 542,900 -0.2% 1.6% Trade, Transportation & Utilities 138,100 140,600 143,100 143,200 0.1% 3.7% Wholesale Trade 25,300 26,000 26,100 26,300 0.8% 4.0% Merchant Wholesalers, Durable Goods 13,800 14,000 14,100 14,200 0.7% 2.9% Merchant Wholesalers, Nondurable Goods 8,700 8,700 8,700 8,800 1.1% 1.1% Retail Trade 90,700 92,100 94,300 94,300 0.0% 4.0% Motor Vehicle & Parts Dealer 12,000 12,500 12,500 12,600 0.8% 5.0% Building Material & Garden Equipment Stores 7,500 7,600 7,700 7,700 0.0% 2.7% Grocery Stores 16,900 17,400 17,600 17,600 0.0% 4.1% Health & Personal Care Stores 5,500 5,400 5,500 5,500 0.0% 0.0% Clothing & Clothing Accessories Stores 7,400 7,100 7,300 7,400 1.4% 0.0% Sporting Goods, Hobby, Book & Music Stores 4,000 4,000 4,000 4,000 0.0% 0.0% General Merchandise Stores 18,700 18,200 18,400 18,600 1.1% -0.5% Transportation, Warehousing & Utilities 22,100 22,500 22,700 22,600 -0.4% 2.3% Information 15,300 14,600 14,500 14,500 0.0% -5.2% Publishing Industries (except Internet) 2,800 2,700 2,700 2,700 0.0% -3.6% Telecommunications 7,500 7,200 7,200 7,200 0.0% -4.0% Financial Activities 48,200 47,300 47,300 47,300 0.0% -1.9% Finance & Insurance 35,400 34,700 34,500 34,500 0.0% -2.5% Credit Intermediation & Related Activities 12,500 12,700 12,700 12,700 0.0% 1.6% Depository Credit Intermediation 8,400 8,300 8,200 8,200 0.0% -2.4% Nondepository Credit Intermediation 2,200 2,500 2,500 2,500 0.0% 13.6% Insurance Carriers & Related 18,800 18,600 18,600 18,600 0.0% -1.1% Real Estate & Rental & Leasing 12,800 12,600 12,800 12,800 0.0% 0.0% Real Estate 9,500 9,300 9,400 9,300 -1.1% -2.1% Professional & Business Services 114,300 115,100 115,100 115,300 0.2% 0.9% Professional, Scientific & Technical Services 52,300 54,700 54,400 53,600 -1.5% 2.5% Architectural, Engineering & Related Services 9,000 9,000 9,100 9,100 0.0% 1.1% Management of Companies & Enterprises 9,500 9,700 9,800 9,800 0.0% 3.2% Administrative & Support & Waste Services 52,500 50,700 50,900 51,900 2.0% -1.1% Administrative & Support Services 50,200 48,500 48,500 49,100 1.2% -2.2% Employment Services 21,000 20,600 20,700 20,600 -0.5% -1.9%
Page 30
August 16, 2013
Employment Development Department Sacramento Arden Arcade Roseville MSALabor Market Information Division (El Dorado, Placer, Sacramento, and Yolo Counties)(916) 262-2162 Industry Employment & Labor Force
March 2012 Benchmark
Data Not Seasonally AdjustedJul 12 May 13 Jun 13 Jul 13 Percent Change
Revised Prelim Month Year Services to Buildings & Dwellings 12,000 12,100 12,200 12,300 0.8% 2.5% Educational & Health Services 103,400 108,000 107,500 106,500 -0.9% 3.0% Education Services 12,000 15,100 14,200 13,500 -4.9% 12.5% Health Care & Social Assistance 91,400 92,900 93,300 93,000 -0.3% 1.8% Ambulatory Health Care Services 39,800 40,700 40,700 40,700 0.0% 2.3% Hospitals 23,200 22,900 22,800 22,900 0.4% -1.3% Nursing & Residential Care Facilities 14,700 15,000 15,100 15,100 0.0% 2.7% Leisure & Hospitality 86,300 85,900 89,700 89,900 0.2% 4.2% Arts, Entertainment & Recreation 15,100 14,400 15,200 15,500 2.0% 2.6% Accommodation & Food Services 71,200 71,500 74,500 74,400 -0.1% 4.5% Accommodation 8,400 7,800 8,300 8,500 2.4% 1.2% Food Services & Drinking Places 62,800 63,700 66,200 65,900 -0.5% 4.9% Full-Service Restaurants 29,900 29,200 30,200 30,800 2.0% 3.0% Limited-Service Eating Places 29,900 30,000 31,000 31,200 0.6% 4.3% Other Services 28,600 27,200 26,700 26,200 -1.9% -8.4% Repair & Maintenance 8,100 8,300 8,300 8,300 0.0% 2.5% Government 212,400 225,100 225,300 212,300 -5.8% 0.0% Federal Government 13,700 13,700 13,600 13,800 1.5% 0.7% Department of Defense 1,700 1,700 1,700 1,700 0.0% 0.0% State & Local Government 198,700 211,400 211,700 198,500 -6.2% -0.1% State Government 106,500 110,300 110,600 108,300 -2.1% 1.7% State Government Education 25,500 28,500 28,500 26,100 -8.4% 2.4% State Government Excluding Education 81,000 81,800 82,100 82,200 0.1% 1.5% Local Government 92,200 101,100 101,100 90,200 -10.8% -2.2% Local Government Education 48,500 57,900 56,900 46,300 -18.6% -4.5% Local Government Excluding Education 43,700 43,200 44,200 43,900 -0.7% 0.5% County 18,000 18,000 18,000 18,000 0.0% 0.0% City 10,100 9,700 10,300 10,100 -1.9% 0.0% Special Districts plus Indian Tribes 15,600 15,500 15,900 15,800 -0.6% 1.3%
Diane Patterson 916/865-2453
These data, as well as other labor market data, are available via the Internetat http://www.labormarketinfo.edd.ca.gov. If you need assistance, please call (916) 262-2162.
#####
(2) Industry employment is by place of work; excludes self-employed individuals,unpaid family workers, household domestic workers, & workers on strike.Data may not add due to rounding.
These data are produced by the Labor Market Information Division of the CaliforniaEmployment Development Department (EDD). Questions should be directed to:
Notes:
(1) Civilian labor force data are by place of residence; include self-employedindividuals, unpaid family workers, household domestic workers, & workers on strike.Data may not add due to rounding. The unemployment rate is calculated using unrounded data.
Page 31

State of California Employment Development DepartmentAugust 16, 2013 Labor Market Information DivisionMarch 2012 Benchmark http://www.labormarketinfo.edd.ca.gov
(916) 262-2162
Labor Employ-Area Name Force ment Number Rate Emp Unemp
Sacramento County 681,600 618,500 63,000 9.2% 1.000000 1.000000
Arden Arcade CDP 56,700 51,500 5,200 9.2% 0.083249 0.082638Carmichael CDP 29,400 27,300 2,100 7.1% 0.044196 0.033389Citrus Heights city 50,800 47,500 3,300 6.5% 0.076838 0.052031Elk Grove CDP 35,400 32,800 2,600 7.5% 0.052995 0.042014Fair Oaks CDP 17,400 16,500 900 4.9% 0.026690 0.013634Florin CDP 12,600 10,800 1,800 14.6% 0.017414 0.029215Folsom city 27,400 26,300 1,100 4.2% 0.042525 0.018086Foothill Farms CDP 9,700 8,400 1,200 12.7% 0.013648 0.019477Galt city 10,800 9,100 1,600 15.1% 0.014787 0.025876Gold River CDP 4,900 4,800 100 1.8% 0.007807 0.001391Isleton city 400 400 100 12.4% 0.000606 0.000835La Riviera CDP 7,000 6,700 400 5.5% 0.010764 0.006121Laguna CDP 20,700 19,700 1,000 5.0% 0.031834 0.016416Laguna West Lakeside CDP 5,400 5,000 400 6.6% 0.008082 0.005565North Highlands CDP 22,400 19,100 3,200 14.5% 0.030952 0.051475Orangevale CDP 16,000 15,000 1,000 6.2% 0.024229 0.015860Parkway South Sacramento CD 15,800 13,200 2,600 16.4% 0.021400 0.041180Rancho Cordova City 30,900 27,600 3,300 10.6% 0.044619 0.052031Rancho Murieta CDP 2,300 2,200 100 3.0% 0.003619 0.001113Rio Linda CDP 5,700 4,900 800 14.7% 0.007917 0.013356Rosemont CDP 14,000 12,900 1,100 7.8% 0.020867 0.017251Sacramento city 215,600 192,200 23,400 10.9% 0.310678 0.371731Vineyard CDP 6,000 5,700 300 4.7% 0.009185 0.004452Walnut Grove CDP 500 400 100 23.0% 0.000569 0.001669Wilton CDP 2,800 2,600 200 6.3% 0.004225 0.002782
Monthly Labor Force Data for Cities and Census Designated Places (CDP)July 2013 - Preliminary
Data Not Seasonally Adjusted
Unemployment Census Ratios
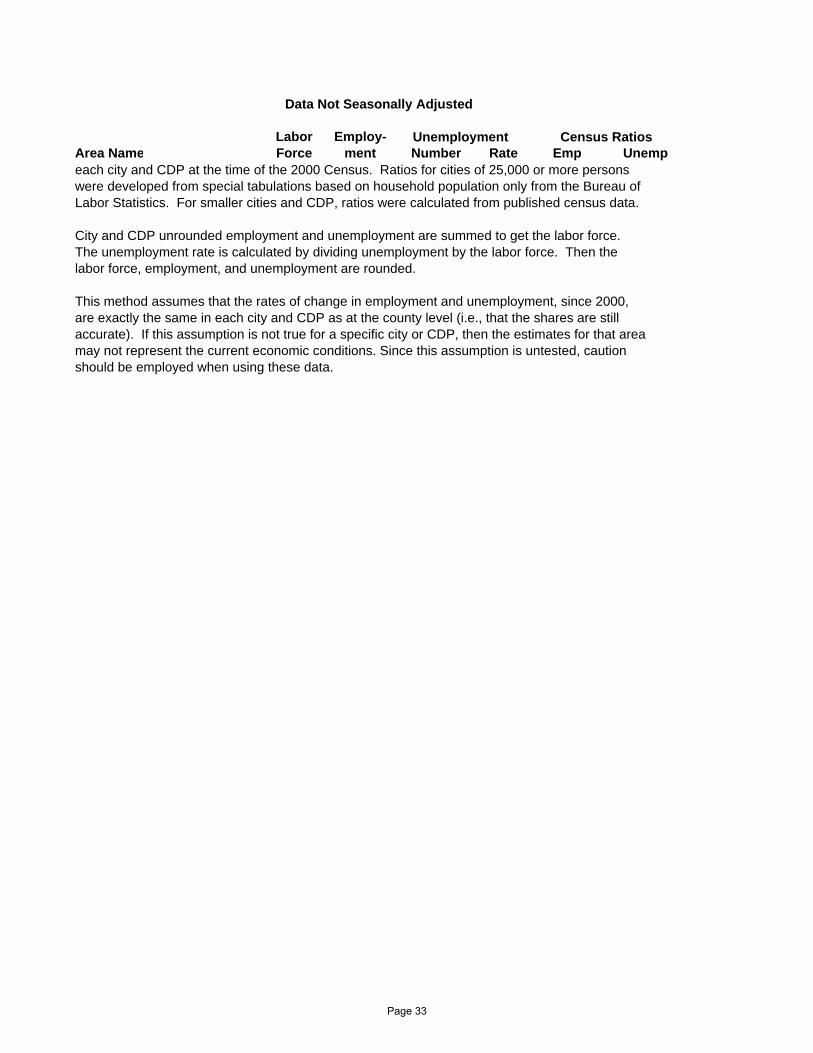
CDP is "Census Designated Place" - a recognized community that was unincorporated at the time of the 2000 Census.
Notes:1) Data may not add due to rounding. All unemployment rates shown are calculated on unrounded data. 2) These data are not seasonally adjusted.
Methodology:Monthly city and CDP labor force data are derived by multiplying current estimates of county employment and unemployment by the employment and unemployment shares (ratios) of
Page 32
Labor Employ-Area Name Force ment Number Rate Emp Unemp
Data Not Seasonally Adjusted
Unemployment Census Ratios
each city and CDP at the time of the 2000 Census. Ratios for cities of 25,000 or more persons were developed from special tabulations based on household population only from the Bureau of
This method assumes that the rates of change in employment and unemployment, since 2000, are exactly the same in each city and CDP as at the county level (i.e., that the shares are still accurate). If this assumption is not true for a specific city or CDP, then the estimates for that area may not represent the current economic conditions. Since this assumption is untested, caution should be employed when using these data.
Labor Statistics. For smaller cities and CDP, ratios were calculated from published census data.
City and CDP unrounded employment and unemployment are summed to get the labor force. The unemployment rate is calculated by dividing unemployment by the labor force. Then the labor force, employment, and unemployment are rounded.
Page 33

WIB Sept. 25, 2013
ITEM IV–F – INFORMATION
COMMITTEE UPDATES BACKGROUND: This item provides an opportunity for a report from the following committees:
Youth Council – Matt Kelly
Planning/Oversight Committee – Lynn Conner
Employer Outreach Committee – Terry Wills
Page 34
WIB Sept. 25, 2013
ITEM IV - OTHER REPORTS
1. CHAIR'S REPORT
The Chair of the Sacramento Works, Inc. Board, on a regular basis, receives numerous items of information concerning employment and training legislation, current programs, agency activities, and miscellaneous articles.
The important information from the material received and meetings attended will be shared with the entire Board and the method proposed by the Chair is to give a verbal report at each regular meeting. It will also allow time for the Board to provide input on items that may require future action.
2. MEMBERS OF THE BOARD
This item provides the opportunity for Workforce Investment Board members to raise any items for consideration not covered under the formal agenda. It also provides the opportunity for Board members to request staff to research or follow up on specific requests or to ask that certain items be placed on the next agenda.
3. COUNSEL REPORT:
The Sacramento Works, Inc. Legal Counsel is the firm of Phillip M. Cunningham, Attorney at Law. This item provides the opportunity for Legal Counsel to provide the Sacramento Works, Inc. Board with an oral or written report on legal activities
4. PUBLIC PARTICIPATION: Participation of the general public at Sacramento Works, Inc. Board meetings is
encouraged. The Sacramento Works, Inc. Board has decided to incorporate participants of the audience as part of its agenda for all meetings. Members of the audience are asked to address their requests to the Chair, if they wish to speak.
Page 35