Embed Size (px)
Citation preview

Regional Means-Based
Fare Pilot Program
Board of Directors
February 7, 2019
Agenda Item #10
Overview
• Pilot program overview
• Caltrain ridership demographics
• Caltrain Fare Policy goal
• Potential effects of Caltrain’s participation
• Pilot program conclusion
• Recommended next steps
2

Pilot Program Overview
3
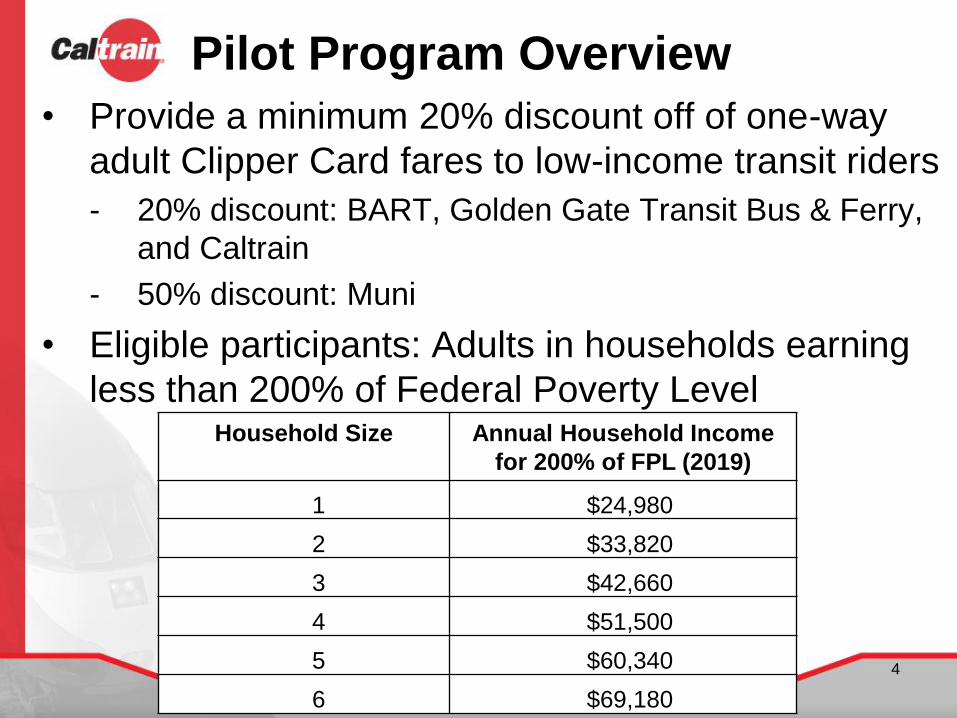
Pilot Program Overview
• Provide a minimum 20% discount off of one-way
adult Clipper Card fares to low-income transit riders
- 20% discount: BART, Golden Gate Transit Bus & Ferry,
and Caltrain
- 50% discount: Muni
• Eligible participants: Adults in households earning
less than 200% of Federal Poverty Level
4
Household Size Annual Household Income
for 200% of FPL (2019)
1 $24,980
2 $33,820
3 $42,660
4 $51,500
5 $60,340
6 $69,180

Pilot Program Overview
• Duration: 12 – 18 months
- Targeted launch: Oct – Nov 2019
• Implemented on existing Clipper system;
participants will receive special Clipper card
• Centrally administered for the region
• Funding for pilot program:
- $11M per year from MTC, using SB1 and LCTOP funds
- Funding will first cover administrative costs for program
(estimated at $3M per year)
- Remaining funds will then defray transit operators’
revenue losses (total per year to be distributed
estimated at $8M)
5

Caltrain Ridership and
Demographics
6
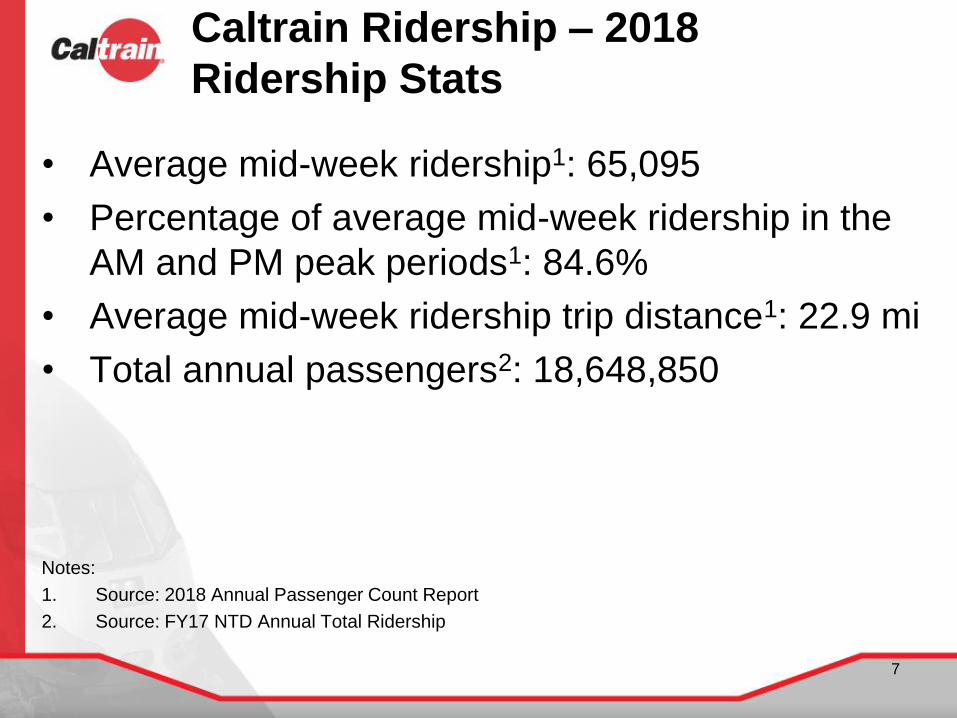
Caltrain Ridership – 2018
Ridership Stats
• Average mid-week ridership1: 65,095
• Percentage of average mid-week ridership in the
AM and PM peak periods1: 84.6%
• Average mid-week ridership trip distance1: 22.9 mi
• Total annual passengers2: 18,648,850
Notes:
1. Source: 2018 Annual Passenger Count Report
2. Source: FY17 NTD Annual Total Ridership
7

Caltrain Ridership – 2016
Annual Household Income
8
2016 Annual Household Income
$0 - $49,999 15%
$0 - $29,999 8%
$30,000 - $39,999 3%
$40,000 - $49,999 4%
$50,000 - $99,999 24%
$100,000 - $150,000 22%
$150,000 - $200,000 16%
$200,000+ 23%
Total 100% Source: 2016 Triennial Survey.
Numbers may not add up due to rounding.
• Over 60% of Caltrain riders earn more than
$100,000 each year.

Caltrain Fare Policy Goal
9
• “Advocate for and participate in State and regional
programs that make it more affordable for low-
income customers to use transit.”
10
Caltrain Fare Policy – Equity Goal

Potential Effects of Caltrain’s
Participation in Regional Means-
Based Fare Pilot Program
11
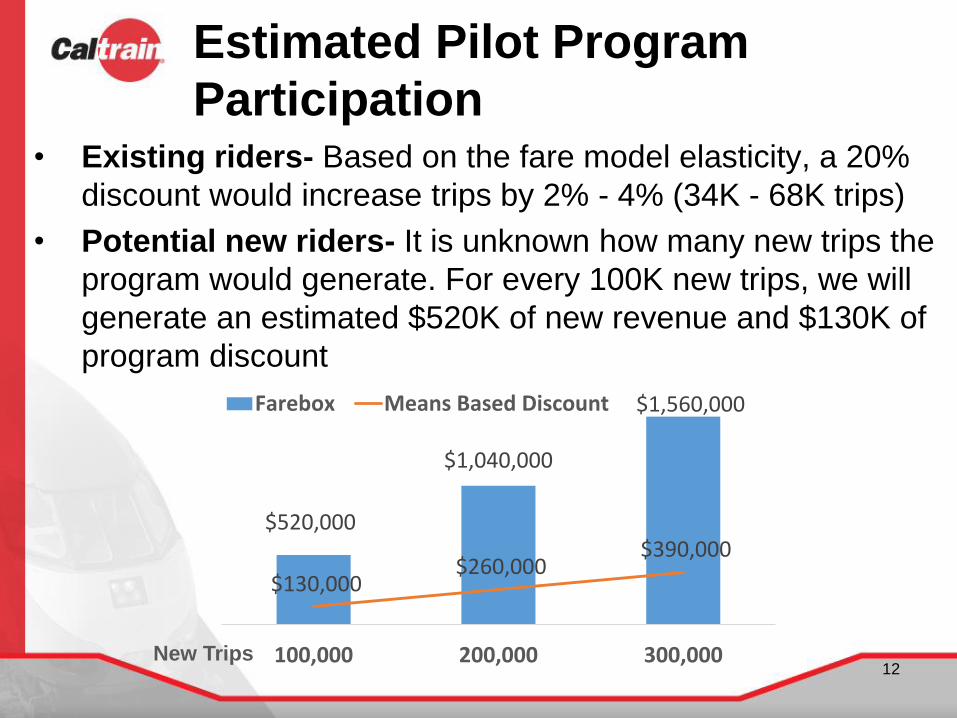
Estimated Pilot Program
Participation • Existing riders- Based on the fare model elasticity, a 20%
discount would increase trips by 2% - 4% (34K - 68K trips)
• Potential new riders- It is unknown how many new trips the
program would generate. For every 100K new trips, we will
generate an estimated $520K of new revenue and $130K of
program discount
12
$520,000
$1,040,000
$1,560,000
$130,000 $260,000
$390,000
100,000 200,000 300,000
Farebox Means Based Discount
New Trips

Program Impact Estimates
13
• Working with MTC, a potential program revenue loss of $0.4M -
$1.8M was estimated for existing riders
• New trips generated by the program will generate additional
offsetting revenue
• Participation in the program is estimated to be revenue
accretive if new trips are generated
New Fares Discounted
Fares MTC
Subsidy Net Fares
Existing Rider Trips - $(1.10)M $0.55M $(0.55)M
Existing Rider New
Trips (+3%) $0.27M $(0.07)M $0.03M $0.23M
New Rider Trips
(200K) $1.04M $(0.26)M $0.13M $0.91M
Total $1.3M $(1.4)M $0.7M $0.6M
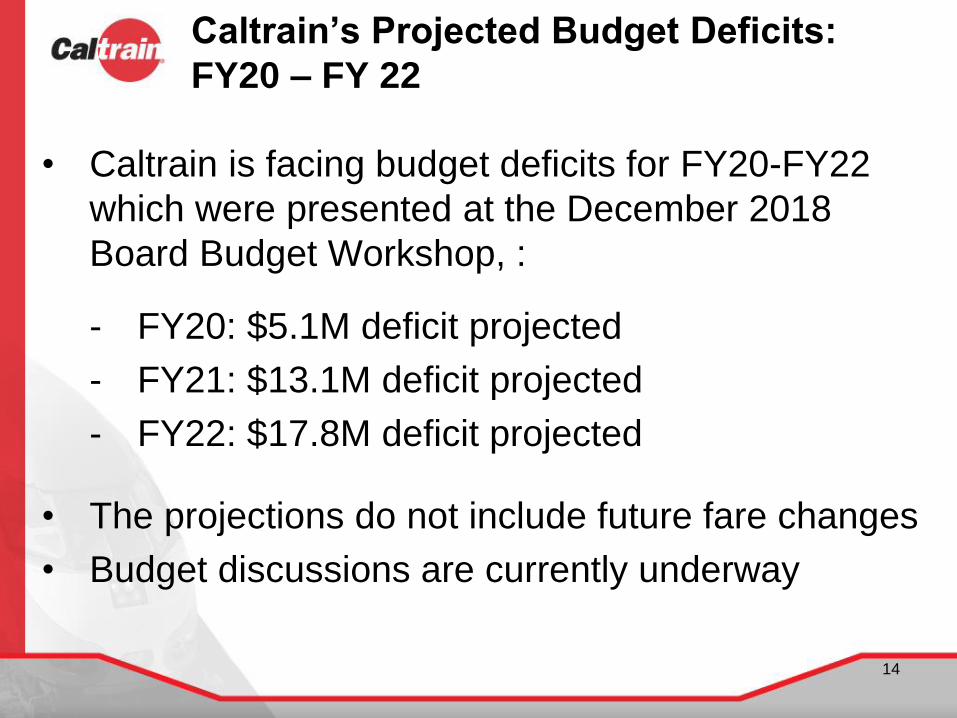
Caltrain’s Projected Budget Deficits:
FY20 – FY 22
• Caltrain is facing budget deficits for FY20-FY22
which were presented at the December 2018
Board Budget Workshop, :
- FY20: $5.1M deficit projected
- FY21: $13.1M deficit projected
- FY22: $17.8M deficit projected
• The projections do not include future fare changes
• Budget discussions are currently underway
14

Closing the Gap - Fares
• All of the scenarios tested are estimated to have relatively
modest negative impacts on ridership
• Each of the scenarios tested are estimated to generate
incremental annual revenue:
1. Increasing Base Fare by $0.25 - $1.4M - $1.9M
2. Increasing Zone Fare by $0.25 - $2.7M - $4.0M
3. Reducing Clipper Card discount to $0.20 off Base Fare - $1.7M - $2.4M
4. Removing Clipper Card discount of $0.55 off Base Fare - $2.7M - $3.9M
5. Increasing Go Pass by 15% - $1.5M in FY20, $3M in FY21
6. Participating in Regional Means-based Fare Pilot Program – ($0.3M) -
$0.6M
15

Cost of Running a Similar Program
• OrcaLift (Seattle) Low-Income Fare Program: $1.50
flat fare on participating transit agencies
- Total administration cost per year: $3.2M
- Launched 2015; 69,000 enrollees so far
- Survey results indicate users are riding transit more,
likely reducing revenue loss
• Tri-Met’s (Portland) Low-Income Fare Program:
50% discount off of adult single-ride fares; 72%
discount off of monthly pass
- Total cost per year: $12M (including administration and
revenue loss)
- Launched fall 2018; aiming for 15,000 enrollees in first
year
16

Pilot Program Conclusion
17
MTC Evaluation Process
• MTC will complete an evaluation of the program
beginning at 12 months and concluding at 18
months (the Pilot Program’s duration).
• Creation of a long-term, permanent program will be
assessed during/after the evaluation
- MTC has set aside LCTOP and SB-1 funds not only for
the Pilot Program but an ongoing, long-term program if
the program continues – totaling ~$11M each year
- Operators will assess at that time whether or not to
continue participating in permanent program. New
operators may opt to join the program then as well.
18

Caltrain Evaluation Process
• Caltrain staff plan to complete an evaluation of the
pilot program at its conclusion, using Clipper data
and any participant survey data available
• Potential metrics to use (TBD in spring 2019):
- Total number of trips from participants
- Average weekday ridership from participants
- Participants’ frequency of Caltrain use
- Number of new Caltrain riders from program
- Participants’ trip time distribution (peak vs. off-peak)
- Revenue impact: Gross revenue loss; subsidy provided
by MTC; estimated financial gains from new ridership;
net revenue loss
19

Recommended Next Steps
20

Recommended Next Steps
• Adopt resolution of support for Caltrain’s
participation in pilot program
• Staff to proceed with the following tasks in
winter/spring 2018:
- Continue to participate in pilot program development
- Update the Codified Tariff to include means-based fare
pilot program
- Develop a pilot program agreement with MTC
• Report back to Board in spring 2019 with pilot
program update
21