Embed Size (px)
Citation preview
Deepening Regional Integration in Africa:
A Computable General Equilibrium Assessment of the
Establishment of a Continental Free Trade Area followed by a
Continental Customs Union
Selected paper for Presentation at the 7th African Economic Conference
Kigali, Rwanda, 30 October - 2 November, 2012
4 October 2012
Simon Mevel and Stephen Karingi1
1 Simon Mevel is an Economic Affairs Officer in the Regional Integration, Infrastructure and Trade Division (RITD) at the United Nations Economic Commission for Africa (UNECA); Stephen Karingi is the Director of RITD at the UNECA. Person contact: Mr. Simon Mevel, Economic Affairs Officer in the Regional Integration, Infrastructure and Trade Division (RITD), UN Economic Commission for Africa, P.O. BOX 3001, Addis Ababa, Ethiopia, Tel: +251-11-544 3695, Fax: +251-11-515 3005. The views expressed in this paper are the authors’ own and may not necessarily reflect the position of the United Nations Economic Commission for Africa. Any mistakes or omissions are the sole responsibility of the authors.
2
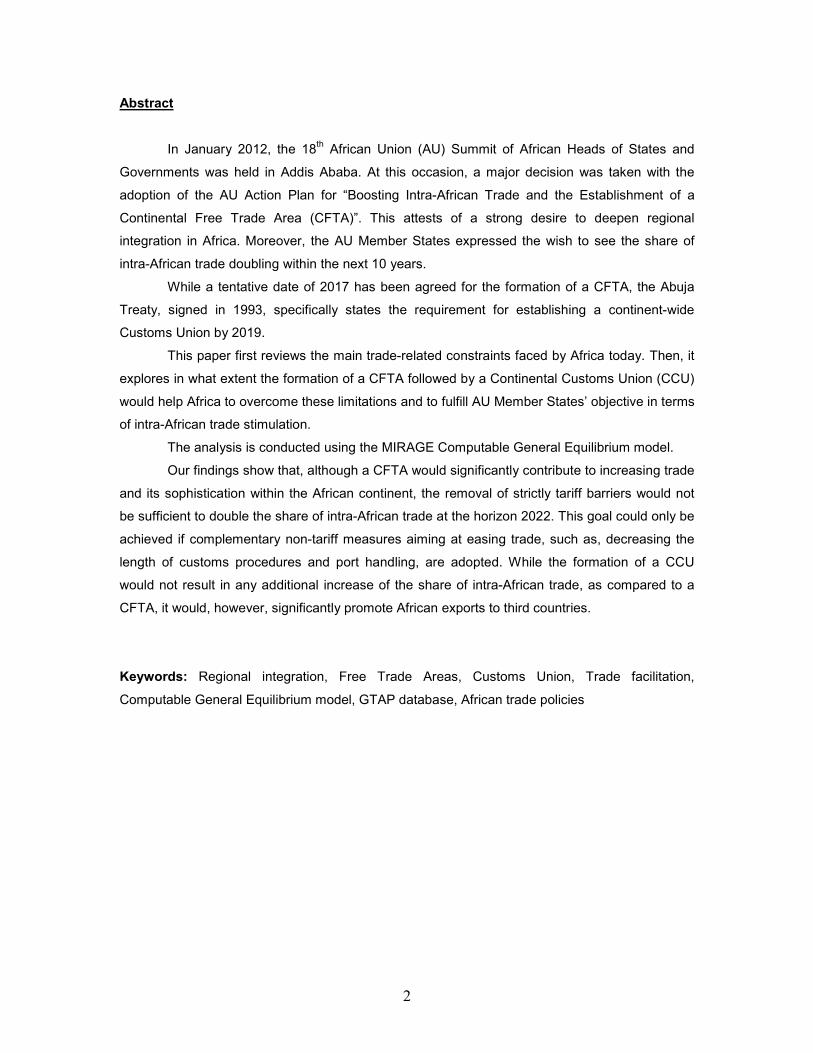
Abstract
In January 2012, the 18th African Union (AU) Summit of African Heads of States and
Governments was held in Addis Ababa. At this occasion, a major decision was taken with the
adoption of the AU Action Plan for “Boosting Intra-African Trade and the Establishment of a
Continental Free Trade Area (CFTA)”. This attests of a strong desire to deepen regional
integration in Africa. Moreover, the AU Member States expressed the wish to see the share of
intra-African trade doubling within the next 10 years.
While a tentative date of 2017 has been agreed for the formation of a CFTA, the Abuja
Treaty, signed in 1993, specifically states the requirement for establishing a continent-wide
Customs Union by 2019.
This paper first reviews the main trade-related constraints faced by Africa today. Then, it
explores in what extent the formation of a CFTA followed by a Continental Customs Union (CCU)
would help Africa to overcome these limitations and to fulfill AU Member States’ objective in terms
of intra-African trade stimulation.
The analysis is conducted using the MIRAGE Computable General Equilibrium model.
Our findings show that, although a CFTA would significantly contribute to increasing trade
and its sophistication within the African continent, the removal of strictly tariff barriers would not
be sufficient to double the share of intra-African trade at the horizon 2022. This goal could only be
achieved if complementary non-tariff measures aiming at easing trade, such as, decreasing the
length of customs procedures and port handling, are adopted. While the formation of a CCU
would not result in any additional increase of the share of intra-African trade, as compared to a
CFTA, it would, however, significantly promote African exports to third countries.
Keywords: Regional integration, Free Trade Areas, Customs Union, Trade facilitation,
Computable General Equilibrium model, GTAP database, African trade policies
3
Acknowledgments
The authors are grateful to colleagues of the Regional Integration, Infrastructure and
Trade Division of the United Nations Economic Commission for Africa for their helpful comments
and suggestions. Special thanks to David Laborde for his technical advice and assistance.
4
I. Introduction
The Abuja Treaty, signed on 3 June 1991 in Nigeria, shapes the road towards the African
Economic Community (AEC), to be established by 20282. However, the regional integration
process is not necessarily smooth and linear. For example, progresses have been uneven, so far,
among the eight Regional Economic Communities (RECs) recognized by the African Union
Commission (AUC)3 and supposed to be the building block of regional integration in Africa.
Nevertheless, there have also been significant commitments taken lately aiming at accelerating
the integration of African economies within the continent. In that respect, three RECs, namely, the
Common Market for Eastern and Southern Africa (COMESA), the East African Community (EAC)
and the Southern African Development Community (SADC), have decided to join efforts for
setting up a “Tripartite” Free Trade Area (TFTA). Moreover, in 2010, in Kigali, the African
Ministers of Trade recommended to fast-track the regional integration agenda. In that sense, they
proposed to establish a Continental Free Trade Area (CFTA) by 2017. This was recently
reaffirmed at the 18th African Union Summit held in Addis Ababa last January, as the Heads of
States and Governments have endorsed a declaration on “Boosting Intra-African Trade and the
Establishment of a Continental Free Trade Area”. At this occasion, the AU member States also
expressed the desire to see the share of intra-African trade doubling within the next 10 years.
African economies face noteworthy trade constraints today. Both tariff and non-tariff
barriers to exchanges of goods and services hinder economic and social development. Indeed,
the relatively poor trade performances of Africa, and especially its very low intra-trade as
compared to that of other regions of the world, may partly be explained by such obstacles limiting
spillovers associated to exchanges within the continent. In this context, opening African
economies within themselves is expected to generate great benefits to Africa. Therefore, the
creation of a CFTA could be seen has a step towards helping African economies overcoming at
least part of their weaknesses. Consequently, there is an urgent need for evaluating to what
extent these expectations from accrued regional integration are justified.
For this purpose, the analysis relies on a Computable General Equilibrium (CGE) model,
MIRAGE, which is especially well-built for assessing trade policies. This paper not only attempts
to assess the economic impacts of the establishment of an African FTA but it also goes beyond
looking at the economic effects associated with the formation of a Continental Customs Union
2 From the date the Abuja Treaty entered into force, on 12 May 1994, African countries were expected to complete six consecutive regional integration steps, in not more than a 34 years period. Article 6 of the treaty provides a clear agenda of the different steps leading to a fully integrated market at the continent level. 3 The eight RECs recognized by the African Union are: the Common Market for Eastern and Southern Africa (COMESA), the East African Community (EAC), the Southern African Development Community (SADC), the Intergovernmental Authority on Development (IGAD), the Economic Community Of West African States (ECOWAS), the Community of Sahel-Saharan States (CEN-SAD), the Economic Community of Central African States (ECCAS), and the Arab Maghreb Union (AMU).

5
(CCU). Indeed, the Abuja Treaty indicates that a CCU should be established by 2019 which is
supposed to be shortly after CFTA as African leaders have tentatively set its creation to 2017.
Moreover, the impacts of complementary measures, such as trade facilitation, are considered in
addition to tariff reforms.
The second and next section gives an overview of the main trade-related constraints
faced by Africa today; the third section describes the methodology used for conducting the
analysis as well as the implemented trade reforms; the fourth section indicates the results from
the simulations; the fifth and last section concludes by providing a summary of the main findings
and policy recommendations.
II. Main trade constraints in Africa today
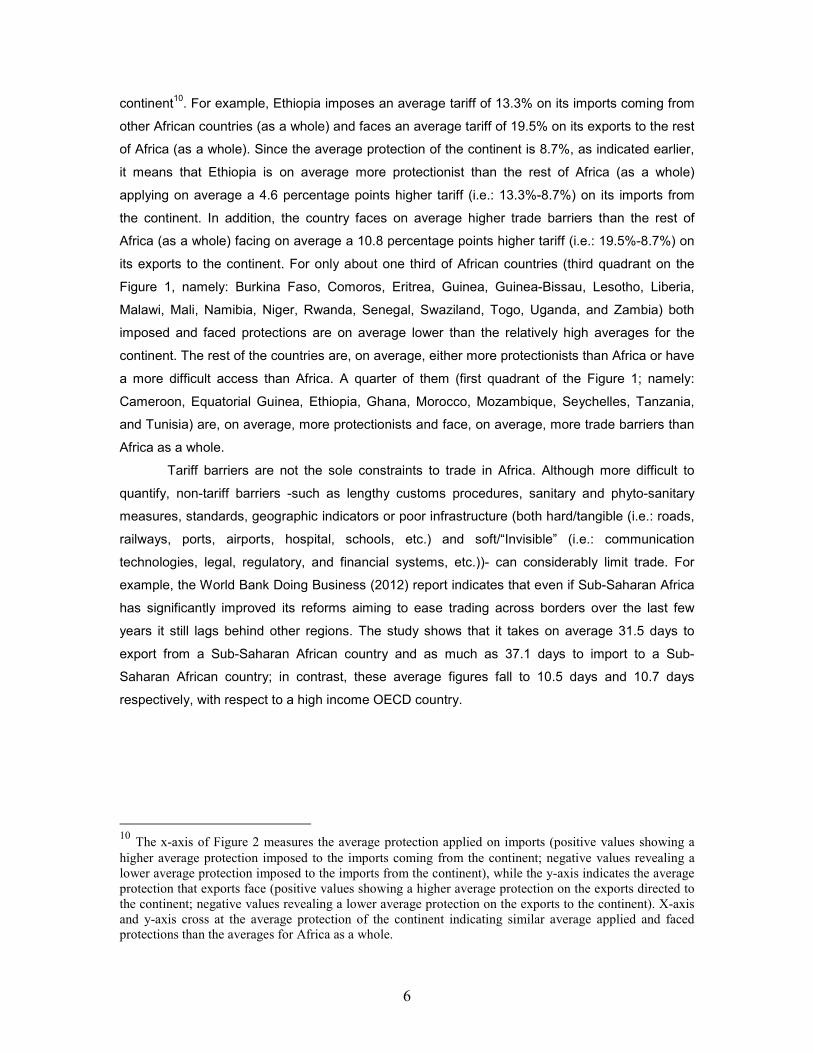
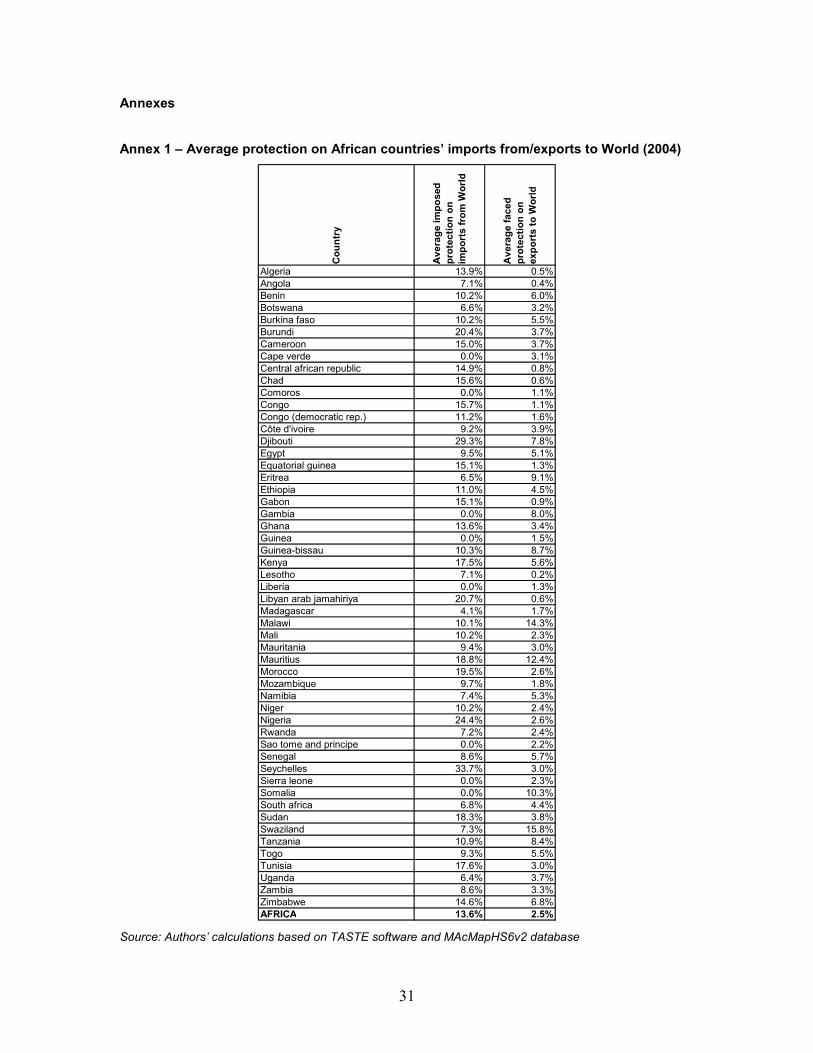
Africa as a whole imposes relatively high tariffs to imports from the rest of the world (with
an average applied protection of 13.6%4). However, the continent benefits from a relatively good
access when exporting to its partners from outside the continent (facing an average protection
equivalent to 2.5%); thanks to preferential agreements such as: the various Generalized System
of Preferences (GSP)5, the Everything But Arms (EBA) initiative6, and the African Growth and
Opportunity Act (AGOA)7. This statement remains generally true at the country level with a few
exceptions: Madagascar imposes an average tariff inferior to 5% on its imports from the rest of
the world; Malawi, Mauritius, Somalia and Swaziland face average tariffs superior to 10% when
exporting to the rest of the world (see Map 18).
Despite these export opportunities with economies located outside the continent, Africa’s
trade performances are relatively poor; Africa’s share in total world trade being only about 4% in
20109. In fact, Africa’s trade potential is strongly limited by relatively high tariff barriers within the
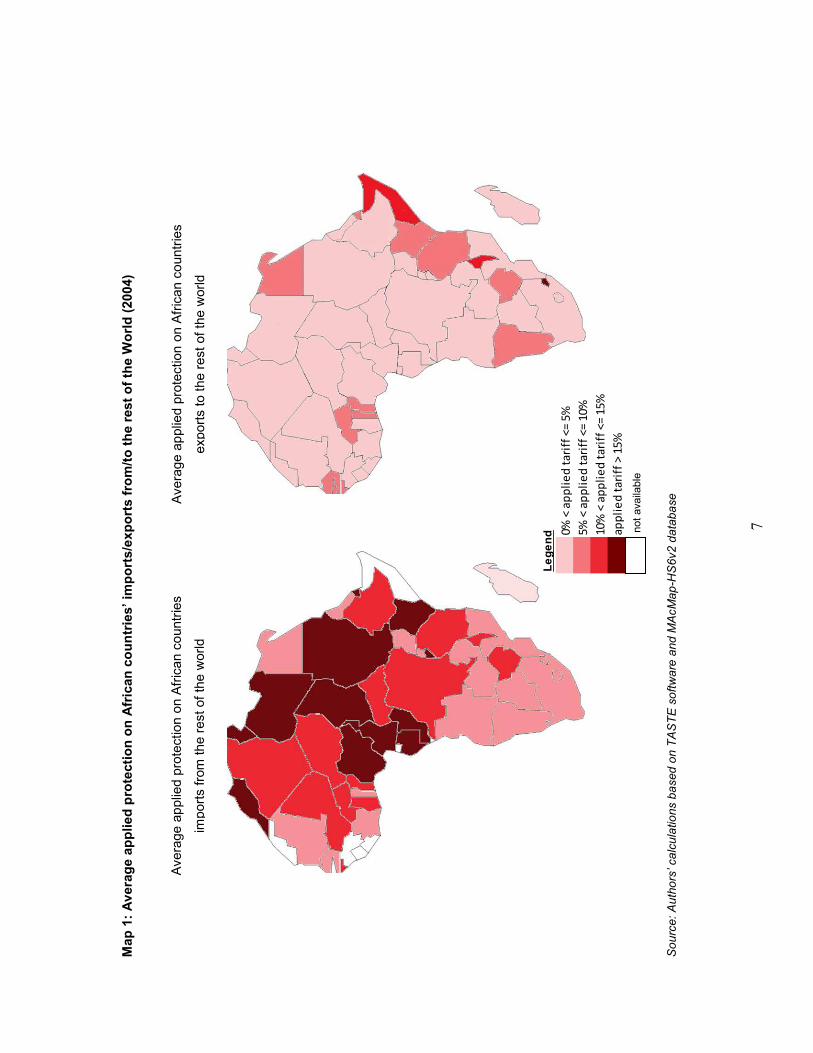
continent, with an average applied protection of 8.7%. Nevertheless, African economies are
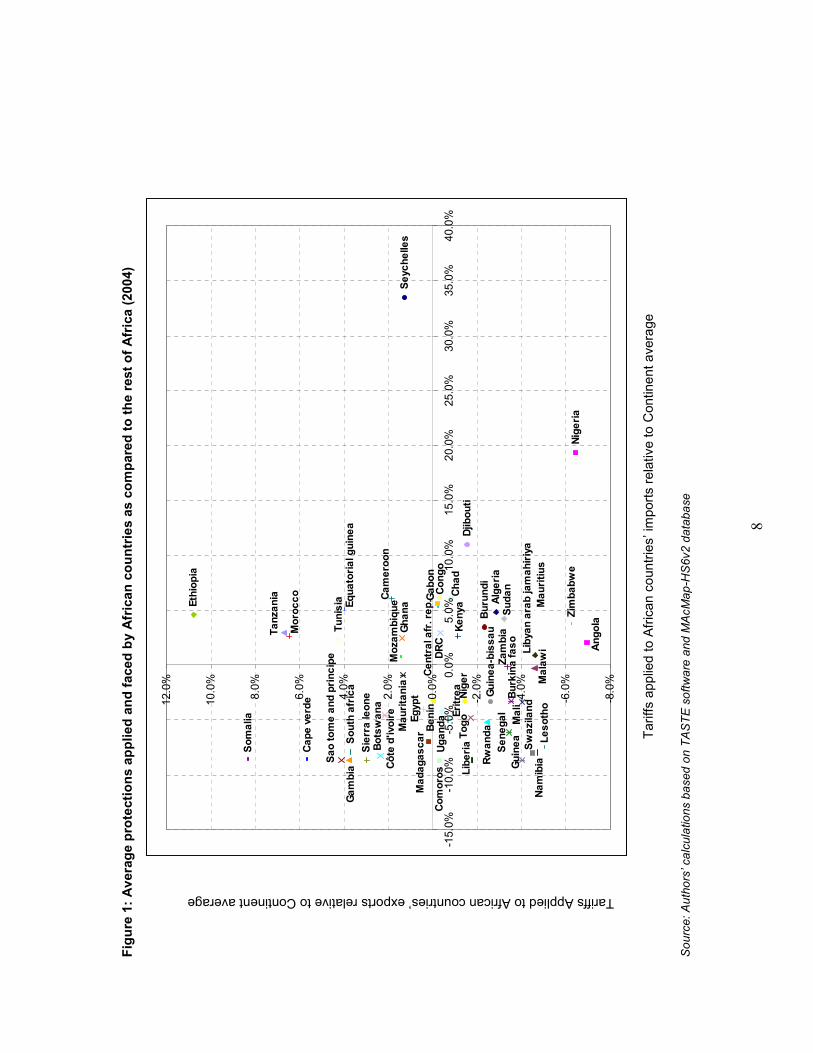
extremely heterogeneous in terms of protection structures. Figure 1 compares the average
applied and faced protections for each African country with the average protection of the
4 Unless otherwise stated, the average protection information has been computed by the authors based on MAcMap-HS6v2 database (more details about the database are given in the Section III of this paper). 5 This agreement allows developing countries to export selected products to certain markets (mainly developed countries) at lower tariff rates than the most-favored nation rates. Any member of the World Trade Organization (WTO) must not discriminate in terms of access granted to its market: a tariff rate given to one WTO member partner must be extended to all other WTO members’ partners. This tariff rate is called the most-favored nation (MFN) rate. It is important to note that there are a few exceptions:, namely: allowed preferential treatments or regional agreements. 6 The EBA initiative provides Duty-Free Quota-Free access to Least Developed Countries (LDCs) when exporting to the European Union. 7 This Act gives preferential access to African exports towards the U.S. market. 8 See Annex 1 for detailed protection by country. 9 Authors’ calculations based on the MIRAGE model.
6
continent10. For example, Ethiopia imposes an average tariff of 13.3% on its imports coming from
other African countries (as a whole) and faces an average tariff of 19.5% on its exports to the rest
of Africa (as a whole). Since the average protection of the continent is 8.7%, as indicated earlier,
it means that Ethiopia is on average more protectionist than the rest of Africa (as a whole)
applying on average a 4.6 percentage points higher tariff (i.e.: 13.3%-8.7%) on its imports from
the continent. In addition, the country faces on average higher trade barriers than the rest of
Africa (as a whole) facing on average a 10.8 percentage points higher tariff (i.e.: 19.5%-8.7%) on
its exports to the continent. For only about one third of African countries (third quadrant on the
Figure 1, namely: Burkina Faso, Comoros, Eritrea, Guinea, Guinea-Bissau, Lesotho, Liberia,
Malawi, Mali, Namibia, Niger, Rwanda, Senegal, Swaziland, Togo, Uganda, and Zambia) both
imposed and faced protections are on average lower than the relatively high averages for the
continent. The rest of the countries are, on average, either more protectionists than Africa or have
a more difficult access than Africa. A quarter of them (first quadrant of the Figure 1; namely:
Cameroon, Equatorial Guinea, Ethiopia, Ghana, Morocco, Mozambique, Seychelles, Tanzania,
and Tunisia) are, on average, more protectionists and face, on average, more trade barriers than
Africa as a whole.
Tariff barriers are not the sole constraints to trade in Africa. Although more difficult to
quantify, non-tariff barriers -such as lengthy customs procedures, sanitary and phyto-sanitary
measures, standards, geographic indicators or poor infrastructure (both hard/tangible (i.e.: roads,
railways, ports, airports, hospital, schools, etc.) and soft/“Invisible” (i.e.: communication
technologies, legal, regulatory, and financial systems, etc.))- can considerably limit trade. For
example, the World Bank Doing Business (2012) report indicates that even if Sub-Saharan Africa
has significantly improved its reforms aiming to ease trading across borders over the last few
years it still lags behind other regions. The study shows that it takes on average 31.5 days to
export from a Sub-Saharan African country and as much as 37.1 days to import to a Sub-
Saharan African country; in contrast, these average figures fall to 10.5 days and 10.7 days
respectively, with respect to a high income OECD country.
10 The x-axis of Figure 2 measures the average protection applied on imports (positive values showing a higher average protection imposed to the imports coming from the continent; negative values revealing a lower average protection imposed to the imports from the continent), while the y-axis indicates the average protection that exports face (positive values showing a higher average protection on the exports directed to the continent; negative values revealing a lower average protection on the exports to the continent). X-axis and y-axis cross at the average protection of the continent indicating similar average applied and faced protections than the averages for Africa as a whole.
7
Map
1: Ave
rage ap
plied protection on African
countries’ im
ports/ex
ports from/to the rest of the World (2004)
atabase
0% <
app
lied
tari
ff <
= 5%
5% <
app
lied
tari
ff <
= 10
%10
% <
app
lied
tari
ff <
= 15
%ap
plie
d ta
riff
> 1
5%no
t ava
ilabl
e
Ave
rage
app
lied
prot
ectio
n on
Afric
an c
ount
ries
expo
rts
to th
e re
st o
f the
wor
ld
uthors’ calculations based on TASTE software and MAcMap-HS6v2 d
Legend
Ave
rage
app
lied
prot
ectio
n on
Afric
an c
ount
ries
impo
rts
from
the
rest
of t
he w
orld
Source: A
8
Figure 1: Ave
rage protections ap
plied and faced
by African
countries as
compared
to the rest of Africa (2004)
Algeria
Burun
di
Cap
e verde
Djibou
ti
Ethiop
ia
Nigeria
Seych
elles
Sierra leon
e
Som
alia
Tunisia
Zimba
bwe
Ang
ola
Ben
in
Botsw
ana
Burkina
faso
Cam
eroo
n
Cen
tral afr. rep
. Cha
d
Com
oros
Con
goDRC
Côte d'ivoire Egypt
Equa
torial guine
a
Eritrea
Gab
on
Gam
bia
Gha
na
Guine
a
Guinea
-bissa
uKen
ya
Leso
tho
Libe
ria
Libyan
arab jamah
iriya
Mad
agas
car
Malaw
i
Mali
Mau
ritania
Mau
ritiu
s
Moroc
co
Mozam
biqu
e
Nam
ibia
Niger
Rwan
da
Sao
tome an
d principe
Sen
egal
Sou
th africa
Sud
an
Swaziland
Tanzan
ia
Togo
Uga
nda
Zambia
-8.0
%
-6.0
%
-4.0
%
-2.0
%
0.0%
2.0%
4.0%
6.0%
8.0%
10.0
%
12.0
%
-15.
0%-1
0.0%
-5.0
%0.
0%5.
0%10
.0%
15.0
%20
.0%
25.0
%30
.0%
35.0
%40
.0%
Tar
iffs
appl
ied
to A
fric
an c
ount
ries’
impo
rts
rela
tive
to C
ontin
ent a
vera
ge
Source: Authors’ calculations based on TASTE software and MAcMap-HS6v2 database
Tariffs Applied to African countries’ exports relative to Continent average

9
Moreover, African economies are often little diversified, exporting to only a few partners
and with a strong concentration of exports in primary products. Figure 2 confirms these
characteristics. Oil exporting countries such as Angola, Nigeria, and Libya are amongst the least
diversified countries in Africa in terms of exported products. Nonetheless, there are a few
exceptions. For instance, Morocco and South Africa are nearly as diversified as developed
countries in terms of the products they export and Benin is the African country exporting to the
widest range of partners. However, in terms of solely intra-African trade, the picture is
considerably different as trade of industrial as well as agriculture and food products largely
surpasses that of primary products (see Table 1). These elements suggest that trade within
African economies is made up more elaborated products than trade with economies located
outside the continent.
Table 1: Africa’s export structures by main sectors and according to their destination -
2010
TotalAgricultural and food products
Primary products
Other industrial products
Services
Africa 100.0% 18.4% 8.8% 68.6% 4.2%Rest of the World 100.0% 8.4% 39.4% 31.7% 20.6%Africa+ Rest of the World 100.0% 9.4% 36.3% 35.4% 18.9% Source: Authors’ calculations based on MIRAGE model
Other reasons can be advanced to explain Africa’s limited potential in exploiting trade
opportunities, such as, constrained production capacities or not enough efficient financing
systems.
In these conditions, it is not totally surprising to note that trade flows within African
economies remain at low levels with nearly 11% of total Africa’s trade being intra-trade in 201011.
Therefore, a progressive elimination of tariff barriers within Africa, as envisaged by the
different steps of regional integration, is expected to bring substantial benefits to the continent. It
may help African countries grabbing significant trade opportunities, diversifying their economies
and therefore improving their competitiveness outside of the continent. Nevertheless, as African
economies are extremely heterogeneous, a strict elimination of tariff barriers will certainly not be
sufficient. It must be accompanied by complimentary policies aiming at reducing trade costs (i.e.
administrative and customs formalities among others), enhancing mobility of factors within the
continent or improving financing systems.
Using a Computable General Equilibrium model, this analysis assesses the economic
impacts, from accrued regional integration, on African economies.
11 Authors’ calculations based on the MIRAGE model.

10
Figure 2: Market an
d product diversifications of African
countries (2004)
Ang
olaBen
in
Liby
a
Mor
occo
Nig
eria
Sou
th A
frica
AfricaO
ther Dev
eloping
countries
Dev
eloped
countries
02468101214
010
2030
4050
6070
8090
Pro
duct
div
ersi
ficat
ion
Source: Authors’ calculations based on MAcMap-HS6v2 database
Market diversification
11
III. Methodology and description of trade reforms
a. Main model assumptions and data requirements
Computable General Equilibrium models allow for capturing the complex interactions
taking place within the different agents of an economy. For the purpose of our analysis, we use
MIRAGE (Modeling International Relationships in Applied General Equilibrium) –a multi-country
and multi-sector CGE model– particularly well designed for capturing trade policy effects. In order
to better assess the different steps -timely planned- of the regional integration in Africa, we utilize
a dynamic version of the model. The dynamic is recursive implying a succession of equilibriums
being solved sequentially from one year to another. See Annex 2 for a more detailed description
of the model and its main assumptions and see Decreux and Valin (2007) for full description.
As other CGE models, MIRAGE requires an extremely large amount of very detailed data
for describing all economic relationships, in a particular year. Based in Purdue University
(Indiana, USA) the Global Trade Analysis Project (GTAP) maintains a well-known database
especially designed for CGE models. The version 7 of the GTAP database is used as a global
Social Accounting Matrix (SAM) for the MIRAGE model; providing data on international trade
(bilateral flows as well as trade barriers), production, consumption of intermediate and final goods
and services, for 113 countries/regions and 57 sectors, and for the year 200412.
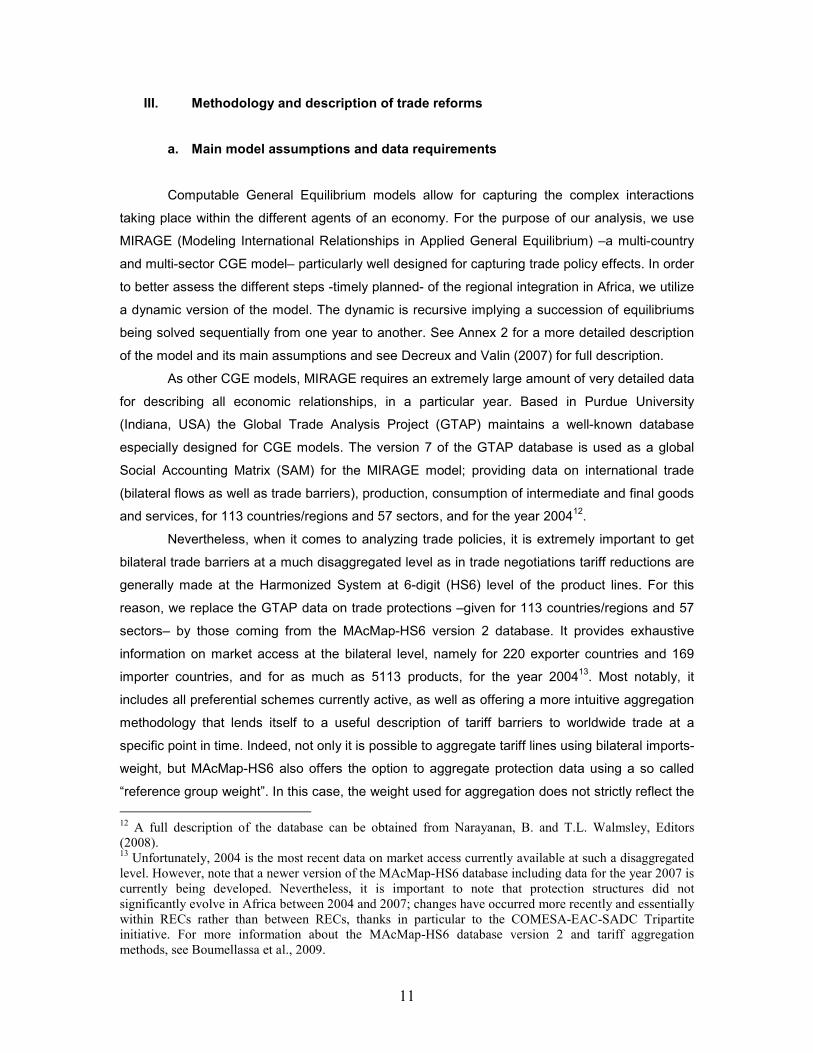
Nevertheless, when it comes to analyzing trade policies, it is extremely important to get
bilateral trade barriers at a much disaggregated level as in trade negotiations tariff reductions are
generally made at the Harmonized System at 6-digit (HS6) level of the product lines. For this
reason, we replace the GTAP data on trade protections –given for 113 countries/regions and 57
sectors– by those coming from the MAcMap-HS6 version 2 database. It provides exhaustive
information on market access at the bilateral level, namely for 220 exporter countries and 169
importer countries, and for as much as 5113 products, for the year 200413. Most notably, it
includes all preferential schemes currently active, as well as offering a more intuitive aggregation
methodology that lends itself to a useful description of tariff barriers to worldwide trade at a
specific point in time. Indeed, not only it is possible to aggregate tariff lines using bilateral imports-
weight, but MAcMap-HS6 also offers the option to aggregate protection data using a so called
“reference group weight”. In this case, the weight used for aggregation does not strictly reflect the
12 A full description of the database can be obtained from Narayanan, B. and T.L. Walmsley, Editors (2008). 13 Unfortunately, 2004 is the most recent data on market access currently available at such a disaggregated level. However, note that a newer version of the MAcMap-HS6 database including data for the year 2007 is currently being developed. Nevertheless, it is important to note that protection structures did not significantly evolve in Africa between 2004 and 2007; changes have occurred more recently and essentially within RECs rather than between RECs, thanks in particular to the COMESA-EAC-SADC Tripartite initiative. For more information about the MAcMap-HS6 database version 2 and tariff aggregation methods, see Boumellassa et al., 2009.

12
trade for the country considered, but rather that of a group of countries (group of reference) to
which a country belongs to according to its income level. As a consequence, the “reference group
weight” limits possible endogeneity bias between trade and protection14. Finally, the MAcMap-
HS6 database version 2 has an integrated “GTAP scaling” module such that trade flows
associated to tariff lines are kept consistent with the trade information from the GTAP database
used in the CGE model. Note that for the analysis in question, tariff barriers are first aggregated
at the level of sectors and countries/regions of the GTAP database, using the “reference group
weight”, before being aggregated at the level of sectors and countries/regions selected for the
model following the same aggregation method.
b. Geographic and sectoral decomposition
Considering the numerous equations -inevitably increasing with the number of sectors
and regions- of the MIRAGE model, and in order to avoid resolution issues due to software
limitations, it is generally recommended to run the model with no more than 30 countries/regions
and 30 sectors15.
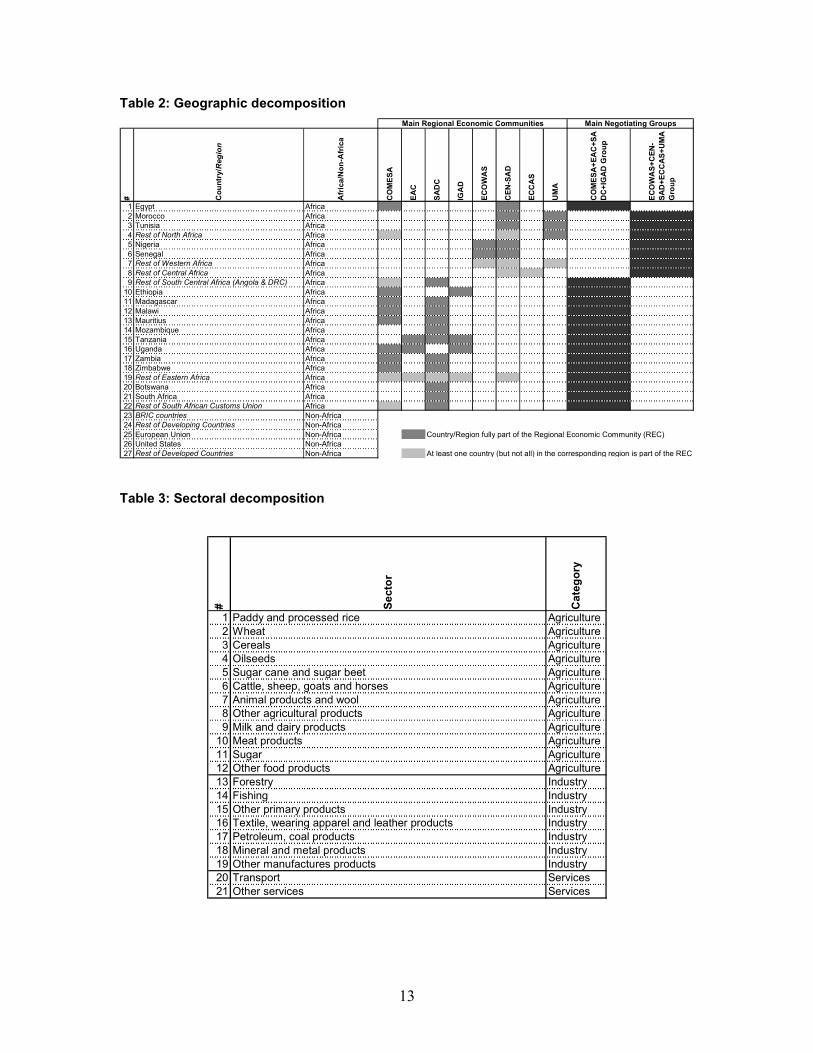
In that sense, 27 countries/regions, were determined focusing on Africa. All the available
African countries and regions (i.e. 16 African countries and the 6 African regions) from the GTAP
database were selected, as were the main partners, namely: the European Union, the United
States, and a group made up the BRIC countries; the rest of the countries were aggregated into
Rest of Developed Countries and Rest of Developing Countries16 (see Table 2).
When it comes to the sectoral decomposition, priority was given to sectors which are
keys for African economies. In other words, as much details as possible were kept for agriculture
and for the main industrial products, namely: primary products, petroleum and coal products,
mineral and metal products, or textiles, wearing apparel and leather products. In total, 21 sectors
were considered which can be decomposed into 12 agricultural, 7 industrial and 2 services’
sectors17 (see Table 3).
14 If trade (or import) weight is satisfactory to reflect the quality of specialization for a bilateral relationship (as long as there are no significant mistakes on reported trade values) it can, however, leads to a serious endogeneity bias. Indeed, for a specific line the higher the tariff, the lower the import flow, and therefore the lower the aggregated tariff. In that sense, the trade weight tends to underestimate protection. Therefore, using the “reference group weight” can limit endogeneity bias and measurement errors. 15 The General Algebraic Modeling System (GAMS) software is used to run the MIRAGE model. 16 See Annex 3 for detailed correspondences between GTAP countries/regions and those determined for the study. 17 See Annex 4 for detailed correspondences between GTAP sectors and those determined for the study.
13
Table 2: Geographic decomposition
# Country/Region
Africa/Non-Africa
COMESA
EAC
SADC
IGAD
ECOWAS
CEN-SAD
ECCAS
UMA
COMESA+EAC+S
ADC+IGAD Group
ECOWAS+C
EN-
SAD+E
CCAS+U
MA
Group
1 Egypt Africa2 Morocco Africa3 Tunisia Africa4 Rest of North Africa Africa5 Nigeria Africa6 Senegal Africa7 Rest of Western Africa Africa8 Rest of Central Africa Africa9 Rest of South Central Africa (Angola & DRC) Africa
10 Ethiopia Africa11 Madagascar Africa12 Malawi Africa13 Mauritius Africa14 Mozambique Africa15 Tanzania Africa16 Uganda Africa17 Zambia Africa18 Zimbabwe Africa19 Rest of Eastern Africa Africa20 Botswana Africa21 South Africa Africa22 Rest of South African Customs Union Africa23 BRIC countries Non-Africa24 Rest of Developing Countries Non-Africa25 European Union Non-Africa Country/Region fully part of the Regional Economic Community (REC)26 United States Non-Africa27 Rest of Developed Countries Non-Africa At least one country (but not all) in the corresponding region is part of the REC
Main Regional Economic Communities Main Negotiating Groups
Table 3: Sectoral decomposition
# Sec
tor
Categ
ory
1 Paddy and processed rice Agriculture2 Wheat Agriculture3 Cereals Agriculture4 Oilseeds Agriculture5 Sugar cane and sugar beet Agriculture6 Cattle, sheep, goats and horses Agriculture7 Animal products and wool Agriculture8 Other agricultural products Agriculture9 Milk and dairy products Agriculture
10 Meat products Agriculture11 Sugar Agriculture12 Other food products Agriculture13 Forestry Industry14 Fishing Industry15 Other primary products Industry16 Textile, wearing apparel and leather products Industry17 Petroleum, coal products Industry18 Mineral and metal products Industry19 Other manufactures products Industry20 Transport Services21 Other services Services
14
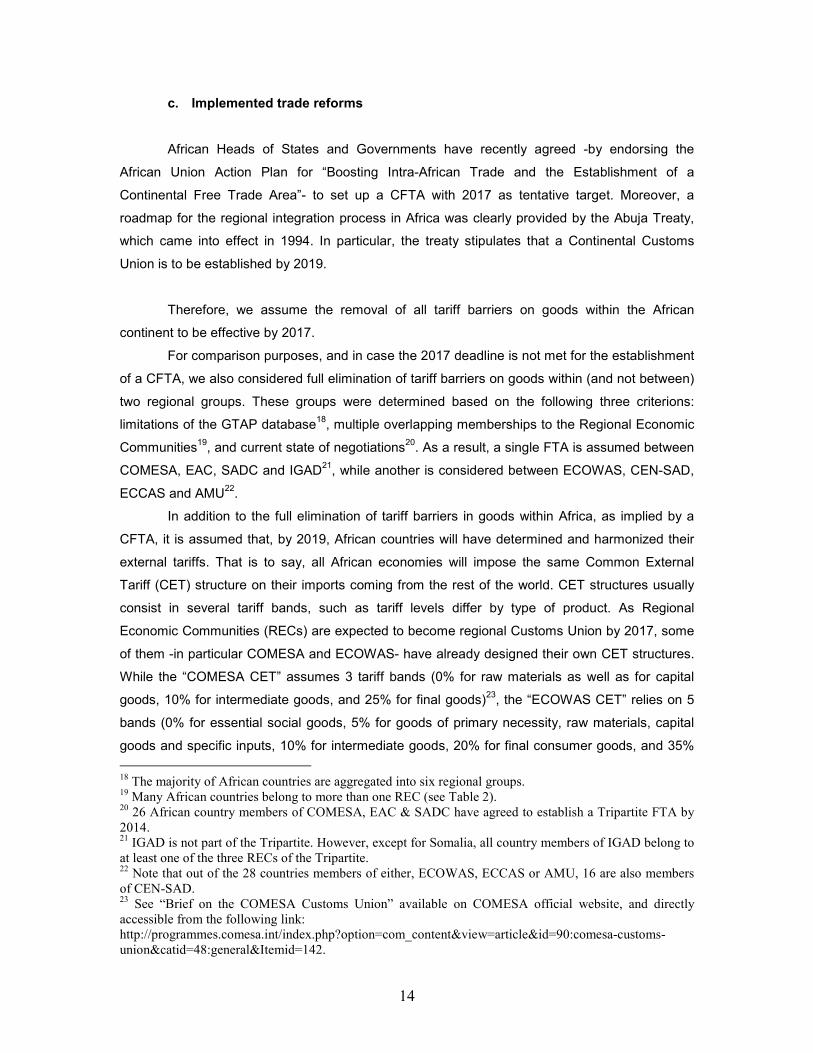
c. Implemented trade reforms
African Heads of States and Governments have recently agreed -by endorsing the
African Union Action Plan for “Boosting Intra-African Trade and the Establishment of a
Continental Free Trade Area”- to set up a CFTA with 2017 as tentative target. Moreover, a
roadmap for the regional integration process in Africa was clearly provided by the Abuja Treaty,
which came into effect in 1994. In particular, the treaty stipulates that a Continental Customs
Union is to be established by 2019.
Therefore, we assume the removal of all tariff barriers on goods within the African
continent to be effective by 2017.
For comparison purposes, and in case the 2017 deadline is not met for the establishment
of a CFTA, we also considered full elimination of tariff barriers on goods within (and not between)
two regional groups. These groups were determined based on the following three criterions:
limitations of the GTAP database18, multiple overlapping memberships to the Regional Economic
Communities19, and current state of negotiations20. As a result, a single FTA is assumed between
COMESA, EAC, SADC and IGAD21, while another is considered between ECOWAS, CEN-SAD,
ECCAS and AMU22.
In addition to the full elimination of tariff barriers in goods within Africa, as implied by a
CFTA, it is assumed that, by 2019, African countries will have determined and harmonized their
external tariffs. That is to say, all African economies will impose the same Common External
Tariff (CET) structure on their imports coming from the rest of the world. CET structures usually
consist in several tariff bands, such as tariff levels differ by type of product. As Regional
Economic Communities (RECs) are expected to become regional Customs Union by 2017, some
of them -in particular COMESA and ECOWAS- have already designed their own CET structures.
While the “COMESA CET” assumes 3 tariff bands (0% for raw materials as well as for capital
goods, 10% for intermediate goods, and 25% for final goods)23, the “ECOWAS CET” relies on 5
bands (0% for essential social goods, 5% for goods of primary necessity, raw materials, capital
goods and specific inputs, 10% for intermediate goods, 20% for final consumer goods, and 35% 18 The majority of African countries are aggregated into six regional groups. 19 Many African countries belong to more than one REC (see Table 2). 20 26 African country members of COMESA, EAC & SADC have agreed to establish a Tripartite FTA by 2014. 21 IGAD is not part of the Tripartite. However, except for Somalia, all country members of IGAD belong to at least one of the three RECs of the Tripartite. 22 Note that out of the 28 countries members of either, ECOWAS, ECCAS or AMU, 16 are also members of CEN-SAD. 23 See “Brief on the COMESA Customs Union” available on COMESA official website, and directly accessible from the following link: http://programmes.comesa.int/index.php?option=com_content&view=article&id=90:comesa-customs-union&catid=48:general&Itemid=142.
15
for “Specific goods for economic development”)24. Moreover, and in order to protect domestic
markets in specific sensitive sectors, African countries are allowed to individually select a limited
number of products which will be either exempted from CET adoption or that will have protection
rates higher than the rate of the higher band of the CET structure. Note that although some
countries have already determined and submitted their sensitive product lists, information
available remains limited25. For these reasons, our analysis proposes two sets of scenarios to
assess the CCU: one with adoption of COMESA CET and another one considering ECOWAS
CET. Furthermore, for each set of scenarios, sensitive products are allowed and determined by
computing an index proposed by Jean et al. (2008)26. To be precise, we consider two options
following Dimaranan and Mevel (2008): 2 per cent and 5 per cent of the 5113 product lines
defined at the Harmonized System (HS) 6-digit level for which the computed index is the highest
are assumed to be sensitive products and fully exempted from CET adoption.
Finally, for each of the above scenarios options with and without trade facilitation
measures are envisaged and compared. These are modeled using a database on trade costs
associated to time from Minor and Tsigas (2008). The authors estimated the percentage of
exports and imports lost due to a delay of one day in customs processing and port handling, by
country and sector. Decreux and Fontagne (2009) aggregated, at the GTAP level, data of costs at
the barrier from Minor and Tsigas. Applying the same methodology, trade costs were aggregated
for the regions and sectors determined in the study allowing for calibration of these costs into the
model. Reductions of these trade costs or “iceberg costs” were then applied, such as customs
procedures and port handling in import and export processes within African countries are
assumed to become twice more efficient by 2017, as compared to that in the base year.
Unless otherwise stated, all the results from the CGE analysis are obtained by
comparison between the different above described scenarios and the reference (also know as
baseline scenario which corresponds to the situation without implementation of any trade
reform27) in the year 202228, and are given in percentage or absolute change between the two
24 See the “ECOWAS Common External Tariff (CET) available on ECOWAS official website, and accessible from the following link: http://www.aidfortrade.ecowas.int/programmes/ecowas-common-external-tariff-cet. 25 For example: only Burundi, Republic Democratic of Congo, Comoros, Kenya, Madagascar, Malawi, Mauritius, Rwanda, Sudan, Swaziland, and Uganda recently submitted their sensitive product lists to COMESA. 26 From a policy maker point of view, considering both benefits and costs of sector protections, the authors show that a product can be qualified as sensitive if it combines the following three characteristics: representing a high value of total imports, being initially highly protected, and being subject to a large tariff reduction from trade reforms. 27 Note that the Multi-Fiber Agreement (MFA) which imposes quotas on exports of textile and garments from developing countries to developed countries expired on 1 January 2005. Therefore, this constraint has been removed in both the reference and the different scenarios simulated and presented in this paper.

16
compared situations. In other words, these correspond to annual changes for the year 2022.
These are not cumulative changes overtime or changes as compared to the base year (2004).
IV. Economic impacts of implemented reforms
African countries impose and face relatively high tariff barriers when trading within the
continent, with an 8.7% average protection, as already indicated in section II. A reduction of tariff
barriers on goods, as assumed with the establishment of free trade areas within the continent,
should considerably improve market access between African economies and would be expected
to bring significant increases in intra-trade flows. Nevertheless, the reduction of tariff barriers will
inevitably reduce tariff revenues for African government. Therefore, such liberalization reforms
will only be considered fully beneficial for African countries if potential losses are to be more than
compensated by other gains.
a. Expected outcomes from the establishment of Free Trade Areas (FTAs):
Regional FTAs (RFTAs) vs. Continental FTA (CFTA)
Trade flows would be significantly enhanced with the establishment of vast Free Trade
Areas in Africa. While the formation of RFTAs would result in a 2.8% (or $17.6 billion) increase in
Africa’s exports to the world, as compared to the baseline scenario in 2022, the creation of a
CFTA would stimulate African exports by 4.0% (or $25.3 billion); other regions not implementing
any trade reforms would register a slight reduction in their total exports.
At the sector level, it is in agriculture and food that African exports would rise the most
with the adoption of RFTAs and CFTA reforms with +7.2% (or $3.8 billion) and +9.4% (or $5.0
billion), as compared to the reference scenario in 2022, respectively. Exports of Africa would
increase in all agricultural and food sectors without exception, whatever the FTA reform
implemented; exports of wheat, cereals, sugar, meat, raw milk and dairy products and other food
products would be the most stimulated. African exports of industrial products would also increase
with +4.7% (or $21.1 billion), as compared to the baseline in 2022, when a CFTA is established.
However, services -which are not subject to any tariff cuts-, would see their exports reducing as
they would face severe competition from the other sectors in which tariff reductions were
applied29.
Thanks to the positive and substantial above mentioned export variations, FTA reforms
would be net trade creative for Africa as trade diversion effects will be largely compensated by
28 Results are observed in 2022 and not 2017 (date of full implementation of scenarios) in order to let enough time for variables in the model to adjust from implemented shocks. 29 See Annex 10 for detailed variations by sector.
17
the creation of new trade flows. Indeed, the rise in African exports within the continent would
strongly offset reductions of African exports to non-African developing and developed countries.
The net trade creation effect for Africa would be observed in agriculture and food sectors as well
as in industrial ones. Nevertheless, the reduction in African exports of services directed towards
outside the continent would be larger than the increase of services’ exports within the African
continent (see Figure 3).
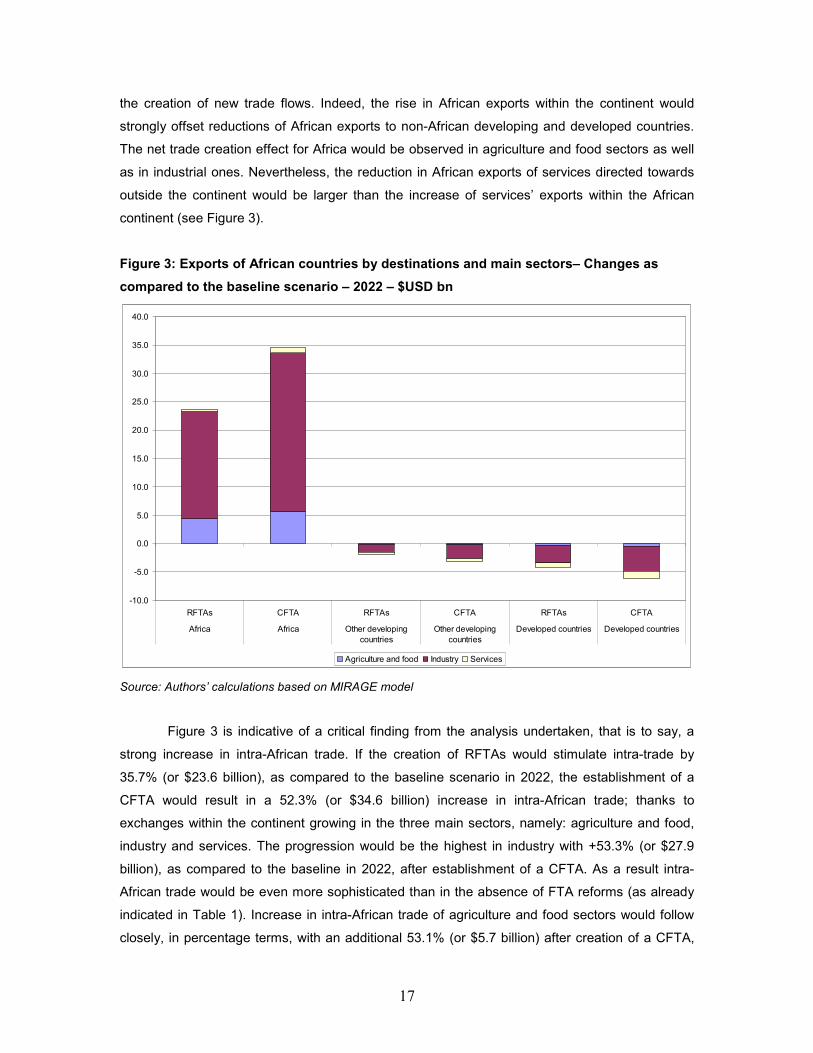
Figure 3: Exports of African countries by destinations and main sectors– Changes as
compared to the baseline scenario – 2022 – $USD bn
-10.0
-5.0
0.0
5.0
10.0
15.0
20.0
25.0
30.0
35.0
40.0
RFTAs CFTA RFTAs CFTA RFTAs CFTA
Africa Africa Other developingcountries
Other developingcountries
Developed countries Developed countries
Agriculture and food Industry Services Source: Authors’ calculations based on MIRAGE model
Figure 3 is indicative of a critical finding from the analysis undertaken, that is to say, a
strong increase in intra-African trade. If the creation of RFTAs would stimulate intra-trade by
35.7% (or $23.6 billion), as compared to the baseline scenario in 2022, the establishment of a
CFTA would result in a 52.3% (or $34.6 billion) increase in intra-African trade; thanks to
exchanges within the continent growing in the three main sectors, namely: agriculture and food,
industry and services. The progression would be the highest in industry with +53.3% (or $27.9
billion), as compared to the baseline in 2022, after establishment of a CFTA. As a result intra-
African trade would be even more sophisticated than in the absence of FTA reforms (as already
indicated in Table 1). Increase in intra-African trade of agriculture and food sectors would follow
closely, in percentage terms, with an additional 53.1% (or $5.7 billion) after creation of a CFTA,
18
relative to the reference case in 2022. Intra-trade within the continent would also rise significantly
in services with a 31.9% (or $1.0 billion) augmentation from the baseline at the same horizon.
Expressed differently, the establishment of a fully effective CFTA by 2017 would enhance intra-
African trade by 51.7% over a twelve year period, the share of intra-African trade passing from
10.2% in 2010 to 15.5 % in 2022. Although quite considerable, this increase is well below the
target set by AU member states who wish to see the share of intra-African trade doubling over the
next 10 years. This is suggestive of the need for complementary measures to reach the
announced objective which cannot be achieved by the strict establishment of a CFTA.
Before looking at additional measures that could potentially help increasing the share of
intra-African trade, it is important to observe the impact of the sole FTA reforms on real income
(or welfare) at both, global and country levels.
Despite losses of tariff revenues for government, implied by the liberalization reforms, the
real income for Africa as a whole would be accrued with the implemented trade policies, thanks to
the strong stimulation of exports. Establishing a CFTA would have a positive impact on Africa’s
real income with +0.20% (or $296.7 million), as compared to the baseline scenario in 2022. The
creation of RFTAs would also produce real income gains of 0.14% (or $203.4 million), relative to
the reference in 2022, for the continent. It is clear that these welfare gains would be rather limited,
however, their positive signs do not plead against deepened regional integration in Africa. It can
be noted that real income would decrease for non-African countries not implementing the FTA
reforms.
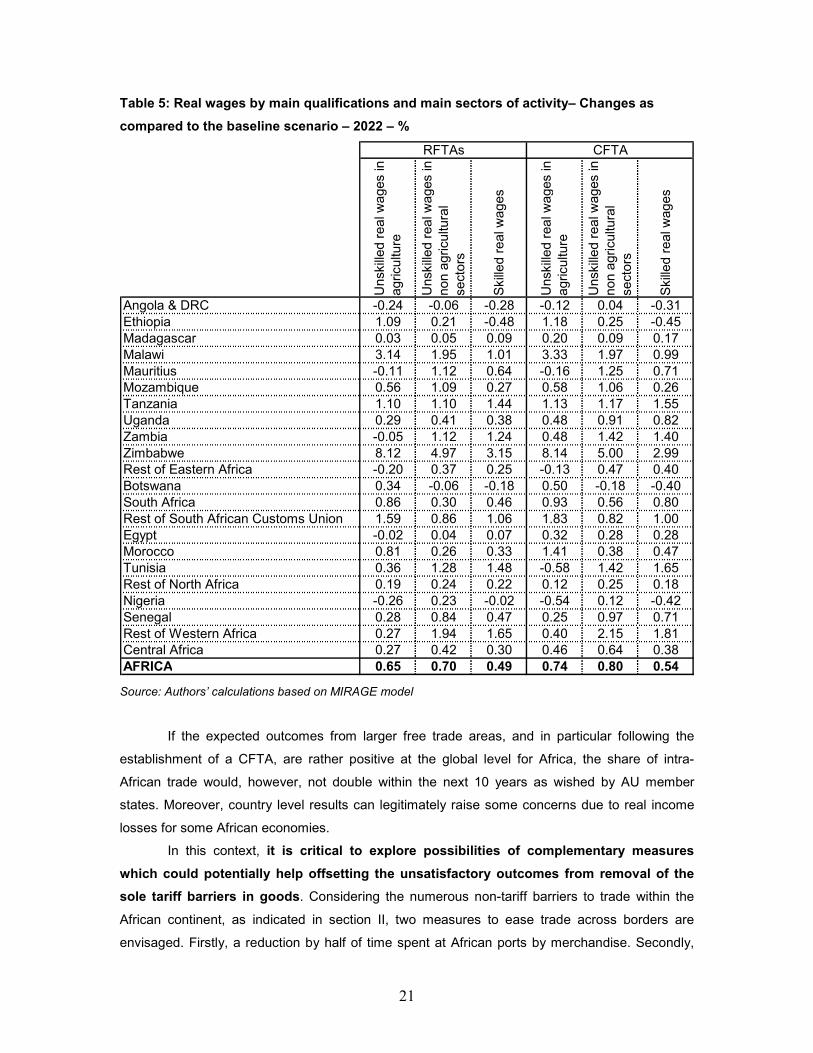
Real wages for all categories of African workers would also be positively affected by the
formation of large free trade areas. For example, following the implementation of a CFTA,
unskilled workers employed in non-agricultural sectors would obtain the highest real wages
increase with +0.80%; their unskilled counterparts engaged in the agricultural sector would see
their income raise by +0.74%, on top of the baseline for the year 2022. To a lesser extent, skilled
workers would also get positive real wage variations (see Table 5). These results are consistent
with the intra-African trade variations showed in Figure 3 and indicative of higher export growth,
within the continent, for industrial sectors than for agricultural ones.
Turning to the country analysis of the results, these are somewhat more ambiguous than
at the global level. Indeed, if all African countries would benefit from larger exports30 than without
30 Note, however, that Botswana’s exports would be unchanged with the FTA reforms. Moreover, only three countries/regions - Botswana, Mozambique, and the Rest of SACU would not benefit more with the implementation of a Continental FTA as compared to Regional FTAs. One reason for such observations is the fact that these countries are initially among the least diversified economies in terms of products and market of imports and exports. In terms of imports, these economies depend heavily on South Africa: 34%, 65% and 71% of Mozambique, Rest of SACU and Botswana’s imports, respectively, come from South Africa. 33% of Rest of SACU products are exported to South Africa, while 67% and 76% of

19
the trade reforms (see Figure 4), the same cannot be said about real income (see Table 4). Even
if real income variations are limited, almost half of African countries/regions considered in the
study would be worst off in terms of real income after the formation of free trade areas. Three
main justifications can be advanced. Firstly, while African countries liberalize, governments have
to renounce to a non-negligible source of income namely, tariff revenues. Secondly, as African
economies open up, competition is increasing on the continental market. As a results trade flows
are reoriented such as African imports from partners located either on the continent or outside of
the continent are being replaced by imports from African partners benefiting from better market
access, thanks to tariff cuts, and potentially leading to terms of trade reductions (see Table 4).
Thirdly, as world prices of food products slightly increase with the liberalization reforms, net-food
importing countries such as Angola & DRC, Mozambique, Botswana, Rest of North Africa, Nigeria
and Central Africa are hurt and their real income reduced.
Figure 4: Total export volumes by country – Changes as compared to the baseline
scenario – 2022 – %
-5.0 0.0 5.0 10.0 15.0 20.0
Angola & DRC
Ethiopia
Madagascar
Malawi
Mauritius
Mozambique
Tanzania
Uganda
Zambia
Zimbabwe
Rest of Eastern Africa
Botswana
South Africa
Rest of South African Customs Union
Egypt
Morocco
Tunisia
Rest of North Africa
Nigeria
Senegal
Rest of Western Africa
Central Africa
RFTAs CFTA Source: Authors’ calculations based on MIRAGE model
Mozambique’s and Botswana’s exports, respectively, are oriented towards the European Union. In addition, mineral and metal products constitute 54% of Mozambique exports, while 71% of Botswana’s exports are primary products.

20
Table 4: Real income, Tariff Revenues and Terms of Trade by African country/region –
Changes as compared to the baseline scenario – 2022
RFTAs
CFTA
RFTAs
CFTA
RFTAs
CFTA
Angola & DRC -0.3 -0.3 -12.5 -15.2 -0.2 -0.2Ethiopia 0.2 0.3 -11.1 -10.8 0.5 0.6Madagascar 0.0 0.1 -7.8 -7.5 0.0 0.1Malawi -0.6 -0.6 -60.7 -60.0 -1.6 -1.5Mauritius -0.9 -0.8 -19.1 -18.6 -0.7 -0.6Mozambique -0.5 -0.5 -54.1 -54.0 -1.2 -1.3Tanzania 0.2 0.3 -36.7 -36.2 0.0 0.2Uganda 0.1 0.4 -15.1 -13.1 0.1 0.7Zambia -0.5 -0.2 -60.0 -59.1 -1.9 -1.4Zimbabwe -1.5 -1.4 -70.8 -70.5 -2.4 -2.4Rest of Eastern Africa -0.3 -0.2 -14.9 -14.7 -0.6 -0.5Botswana -0.2 -0.4 -0.7 1.7 -0.3 -0.6South Africa 0.4 0.7 3.0 5.9 0.6 1.2Rest of South African Customs Union 1.1 1.1 1.4 1.8 0.7 0.7Egypt 0.0 0.3 -0.5 0.1 0.0 0.5Morocco 0.2 0.0 -1.4 -5.9 0.2 0.0Tunisia 0.6 0.6 -3.6 -6.4 0.5 0.4Rest of North Africa 0.0 -0.1 -4.4 -7.8 0.0 0.0Nigeria -0.1 -0.4 -8.6 -16.7 0.0 -0.2Senegal 0.3 0.3 -5.8 -10.2 0.6 0.4Rest of Western Africa 0.6 0.6 -5.8 -11.7 0.8 0.7Central Africa 0.1 -0.1 -9.0 -23.8 0.0 -0.3
Real income - %Tariff Revenues -
%Terms of Trade -
%
Source: Authors’ calculations based on MIRAGE model
In terms of real wages, as found at the global level, these generally increase for all
categories of workers in nearly all African countries/regions once FTA reforms have been
implemented; thanks to higher production and exports. However, workers employed in countries
strongly specialized in exports of primary products, such as oil exporting countries: Angola,
Egypt, Nigeria, Rest of Eastern Africa (inclusive of Kenya), Rest of North Africa); as well as
Zambia (69% of Zambia’s exports are mineral and metal products) register a decrease in real
wages (see Table 5 and Annex 9). Note that primary products are initially relatively lowly
protected limiting market access improvement and thus real wage increase associated with
liberalization reforms.
21
Table 5: Real wages by main qualifications and main sectors of activity– Changes as
compared to the baseline scenario – 2022 – %
Uns
kille
d re
al w
ages
in
agric
ultu
re
Uns
kille
d re
al w
ages
in
non
agric
ultu
ral
sect
ors
Ski
lled
real
wag
es
Uns
kille
d re
al w
ages
in
agric
ultu
re
Uns
kille
d re
al w
ages
in
non
agric
ultu
ral
sect
ors
Ski
lled
real
wag
es
Angola & DRC -0.24 -0.06 -0.28 -0.12 0.04 -0.31Ethiopia 1.09 0.21 -0.48 1.18 0.25 -0.45Madagascar 0.03 0.05 0.09 0.20 0.09 0.17Malawi 3.14 1.95 1.01 3.33 1.97 0.99Mauritius -0.11 1.12 0.64 -0.16 1.25 0.71Mozambique 0.56 1.09 0.27 0.58 1.06 0.26Tanzania 1.10 1.10 1.44 1.13 1.17 1.55Uganda 0.29 0.41 0.38 0.48 0.91 0.82Zambia -0.05 1.12 1.24 0.48 1.42 1.40Zimbabwe 8.12 4.97 3.15 8.14 5.00 2.99Rest of Eastern Africa -0.20 0.37 0.25 -0.13 0.47 0.40Botswana 0.34 -0.06 -0.18 0.50 -0.18 -0.40South Africa 0.86 0.30 0.46 0.93 0.56 0.80Rest of South African Customs Union 1.59 0.86 1.06 1.83 0.82 1.00Egypt -0.02 0.04 0.07 0.32 0.28 0.28Morocco 0.81 0.26 0.33 1.41 0.38 0.47Tunisia 0.36 1.28 1.48 -0.58 1.42 1.65Rest of North Africa 0.19 0.24 0.22 0.12 0.25 0.18Nigeria -0.26 0.23 -0.02 -0.54 0.12 -0.42Senegal 0.28 0.84 0.47 0.25 0.97 0.71Rest of Western Africa 0.27 1.94 1.65 0.40 2.15 1.81Central Africa 0.27 0.42 0.30 0.46 0.64 0.38AFRICA 0.65 0.70 0.49 0.74 0.80 0.54
RFTAs CFTA
Source: Authors’ calculations based on MIRAGE model
If the expected outcomes from larger free trade areas, and in particular following the
establishment of a CFTA, are rather positive at the global level for Africa, the share of intra-
African trade would, however, not double within the next 10 years as wished by AU member
states. Moreover, country level results can legitimately raise some concerns due to real income
losses for some African economies.
In this context, it is critical to explore possibilities of complementary measures
which could potentially help offsetting the unsatisfactory outcomes from removal of the
sole tariff barriers in goods. Considering the numerous non-tariff barriers to trade within the
African continent, as indicated in section II, two measures to ease trade across borders are
envisaged. Firstly, a reduction by half of time spent at African ports by merchandise. Secondly,

22
customs procedures in African countries are assumed to become twice more efficient than they
are today. Both measures are fully and simultaneously implemented, along with FTA reforms, by
2017.
The outcomes of the simulations considering trade facilitation measures on top of FTA
reforms are extremely interesting. These additional policies not only would boost further exports
at both the global and country levels, but also all African countries would then register real
income and real wage gains (see Annex 12). In terms of exports, both industrial and agriculture
and food sectors would benefit strongly from the reforms. While, in percentage terms, exports of
agriculture and food were increased more than those of industrial products with the sole
establishment of free trade areas, the contrary is found when trade facilitation measures are also
taken into account (see Annex 11). As a result, the sophistication of African trade would be
further enhanced if FTAs would be complemented with non-tariff measures to ease trade across
borders.
Intra-African trade would also be strongly impacted with the adoption of trade facilitation
measures. Indeed, the creation of a CFTA accompanied by more efficient customs procedures
and reduction in delays that merchandise spend at African ports, would lead to a 128.4% (or
$85.0 billion) increase in intra-African trade, as compared to the baseline in 2022. Consequently,
the share of intra-African trade would in fact more than double over the next decade passing from
10.2% in 2010 to 21.9% in 2022. Sophistication of intra-African trade would also be significantly
expended as intra-continental trade in industry would grow the fastest with the reforms (see
Annex 13). This would positively and substantially impact wages of both skilled and unskilled
worked employed in non-agricultural activities (see Annex 12). Real wages for workers engaged
in agriculture would also be positively affected but to a lesser extent. It is worth mentioning that
while wages of skilled workers would increase the least with the sole FTA reforms, they augment
the most when such reforms are accompanied by trade facilitation measures.
b. Expected outcomes from the formation of a Continental Customs Union (CCU)
A CCU builds on the acquis of a CFTA as it also requires full liberalization of goods within
the African continent. Moreover, it necessitates the adoption of a common external tariff (CET)
structure imposed on imports from all non-African economies. As already indicated in section III,
two CET structures are currently on the table in Africa: the “COMESA-CET” and the “ECOWAS-
CET”. In addition, each African country is allowed to exclude a certain number of products31,
31 Here we allow for 2% to 5% of tariff lines defined at the Harmonized System 6-digit level (HS6) to be defined as sensitive products by each African country (2% corresponds to 102 product lines, while 5% is equal to 255 products lines). See section III for details about the methodology used for selection of these products. See Annex 15 for the 30 most common sensitive products for African countries depending on the
23
designed as sensitive, from the CET structure. In other words, the tariff barriers imposed on
products determined as sensitive are not modified with the CCU reform.
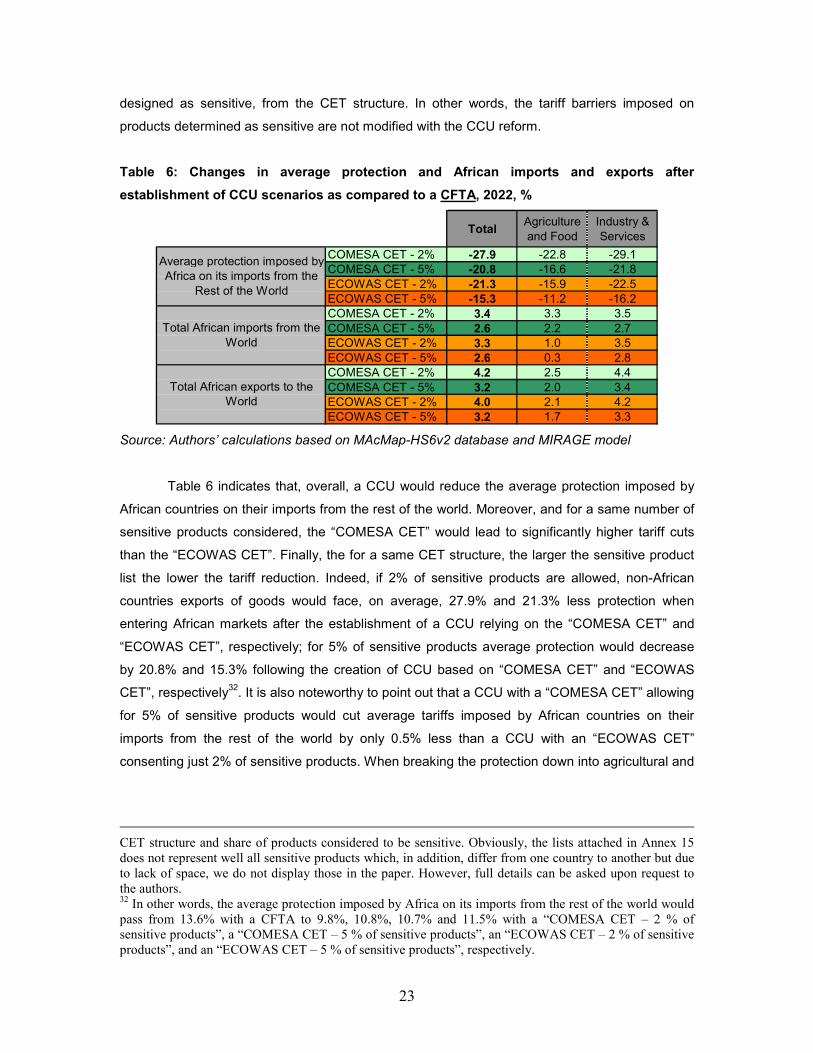
Table 6: Changes in average protection and African imports and exports after
establishment of CCU scenarios as compared to a CFTA, 2022, %
TotalAgriculture and Food
Industry & Services
COMESA CET - 2% -27.9 -22.8 -29.1COMESA CET - 5% -20.8 -16.6 -21.8ECOWAS CET - 2% -21.3 -15.9 -22.5ECOWAS CET - 5% -15.3 -11.2 -16.2COMESA CET - 2% 3.4 3.3 3.5COMESA CET - 5% 2.6 2.2 2.7ECOWAS CET - 2% 3.3 1.0 3.5ECOWAS CET - 5% 2.6 0.3 2.8COMESA CET - 2% 4.2 2.5 4.4COMESA CET - 5% 3.2 2.0 3.4ECOWAS CET - 2% 4.0 2.1 4.2ECOWAS CET - 5% 3.2 1.7 3.3
Average protection imposed by Africa on its imports from the
Rest of the World
Total African imports from the World
Total African exports to the World
Source: Authors’ calculations based on MAcMap-HS6v2 database and MIRAGE model
Table 6 indicates that, overall, a CCU would reduce the average protection imposed by
African countries on their imports from the rest of the world. Moreover, and for a same number of
sensitive products considered, the “COMESA CET” would lead to significantly higher tariff cuts
than the “ECOWAS CET”. Finally, the for a same CET structure, the larger the sensitive product
list the lower the tariff reduction. Indeed, if 2% of sensitive products are allowed, non-African
countries exports of goods would face, on average, 27.9% and 21.3% less protection when
entering African markets after the establishment of a CCU relying on the “COMESA CET” and
“ECOWAS CET”, respectively; for 5% of sensitive products average protection would decrease
by 20.8% and 15.3% following the creation of CCU based on “COMESA CET” and “ECOWAS
CET”, respectively32. It is also noteworthy to point out that a CCU with a “COMESA CET” allowing
for 5% of sensitive products would cut average tariffs imposed by African countries on their
imports from the rest of the world by only 0.5% less than a CCU with an “ECOWAS CET”
consenting just 2% of sensitive products. When breaking the protection down into agricultural and
CET structure and share of products considered to be sensitive. Obviously, the lists attached in Annex 15 does not represent well all sensitive products which, in addition, differ from one country to another but due to lack of space, we do not display those in the paper. However, full details can be asked upon request to the authors. 32 In other words, the average protection imposed by Africa on its imports from the rest of the world would pass from 13.6% with a CFTA to 9.8%, 10.8%, 10.7% and 11.5% with a “COMESA CET – 2 % of sensitive products”, a “COMESA CET – 5 % of sensitive products”, an “ECOWAS CET – 2 % of sensitive products”, and an “ECOWAS CET – 5 % of sensitive products”, respectively.
24
food products versus industrial products33, tariff cuts implied by the “COMESA CET” with 5% of
sensitive products for agricultural and food products are even higher than tariff reductions with
“ECOWAS CET” considering 2% of products as sensitive. This confirms the more ambitious CET
bands associated with the COMESA proposed structure than those attached to the ECOWAS
structure, in particular for agricultural and food products.
Considering the better access given by Africa, on average, to non-African countries when
they exports towards African markets, it is logical to see African imports increasing following the
establishment of a CCU whatever its CET structure and the number of sensitive products
permitted. In other words, African imports would progress between +2.7% (or $16.2 billion) and
+3.5% (or $21.6 billion) depending on the CCU scenarios, as compared to a CFTA for the year
2022; increases would be larger in industry and services than in agriculture and food, thanks to
higher tariff cuts in industrial sectors implied by the CCU reforms (see Table 6).
However, and whatever the scenario considered for a CCU, African exports would
increase in greater magnitude than African imports. Indeed, exports originating from African
economies would be stimulated between +3.2% (or $20.6 billion) and +4.2% (or $27.6 billion)
according to the CCU scenarios implemented, relative to a CFTA in 2022; exports of industrial
products and services would be more stimulated than exports of agriculture and food products
(see Table 6). Moreover, it has to be noted that these additional positive variations in African
exports would be essentially directed towards outside the continent (see Table 7).
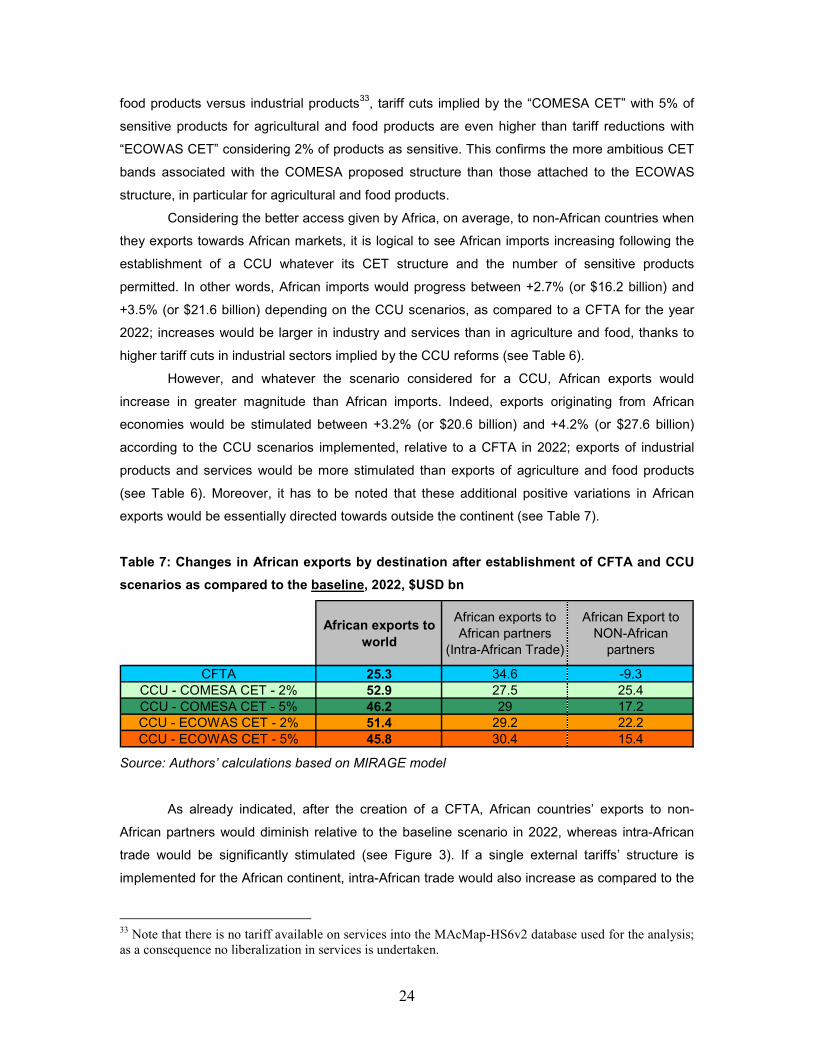
Table 7: Changes in African exports by destination after establishment of CFTA and CCU
scenarios as compared to the baseline, 2022, $USD bn
African exports to world
African exports to African partners
(Intra-African Trade)
African Export to NON-African
partners
CFTA 25.3 34.6 -9.3CCU - COMESA CET - 2% 52.9 27.5 25.4CCU - COMESA CET - 5% 46.2 29 17.2CCU - ECOWAS CET - 2% 51.4 29.2 22.2CCU - ECOWAS CET - 5% 45.8 30.4 15.4
Source: Authors’ calculations based on MIRAGE model
As already indicated, after the creation of a CFTA, African countries’ exports to non-
African partners would diminish relative to the baseline scenario in 2022, whereas intra-African
trade would be significantly stimulated (see Figure 3). If a single external tariffs’ structure is
implemented for the African continent, intra-African trade would also increase as compared to the
33 Note that there is no tariff available on services into the MAcMap-HS6v2 database used for the analysis; as a consequence no liberalization in services is undertaken.
25
baseline but in a lesser extent than with a CFTA, due to some exports that would be redirected to
non-African partners. Indeed, and as summarized in Table 7, African exports would progress by
$25.3 billion with a CFTA, as compared to the reference case for the year 2022; resulting from of
a $34.6 billion increase in intra-African trade combined with a $9.3 billion reduction in African
exports to the rest of the world (see Figure 3 and Table 7). African exports would progress twice
as much with the establishment of a CCU ranging between +$45.8 billion and +$52.9 billion,
depending on the CCU scenarios considered, relative to the baseline scenario in 2022; explained
by an increase in intra-African trade amounting between +$30.4 billion and +$27.5 billion as well
as an augmentation of African exports to non-African partners comprised between +$15.4 billion
and +$25.4 billion (see Table 7 and Figure 5). It is worth mentioning that more ambitious CET
structures with lower number of sensitive products (i.e. “COMESA CET “ with 2% of sensitive
products) stimulate less intra-African trade and more African exports to the rest of the world than
less ambitious CET structures with higher number of sensitive products (i.e. “ECOWAS CET” with
5% of sensitive products). However, in net, CET structures implying higher tariff cuts and/or with
limited amount of sensitive products are more trade creative for African economies than CET
structures leading to less reduction in tariff barriers and/or associated with higher number of
sensitive products (see Table 7).
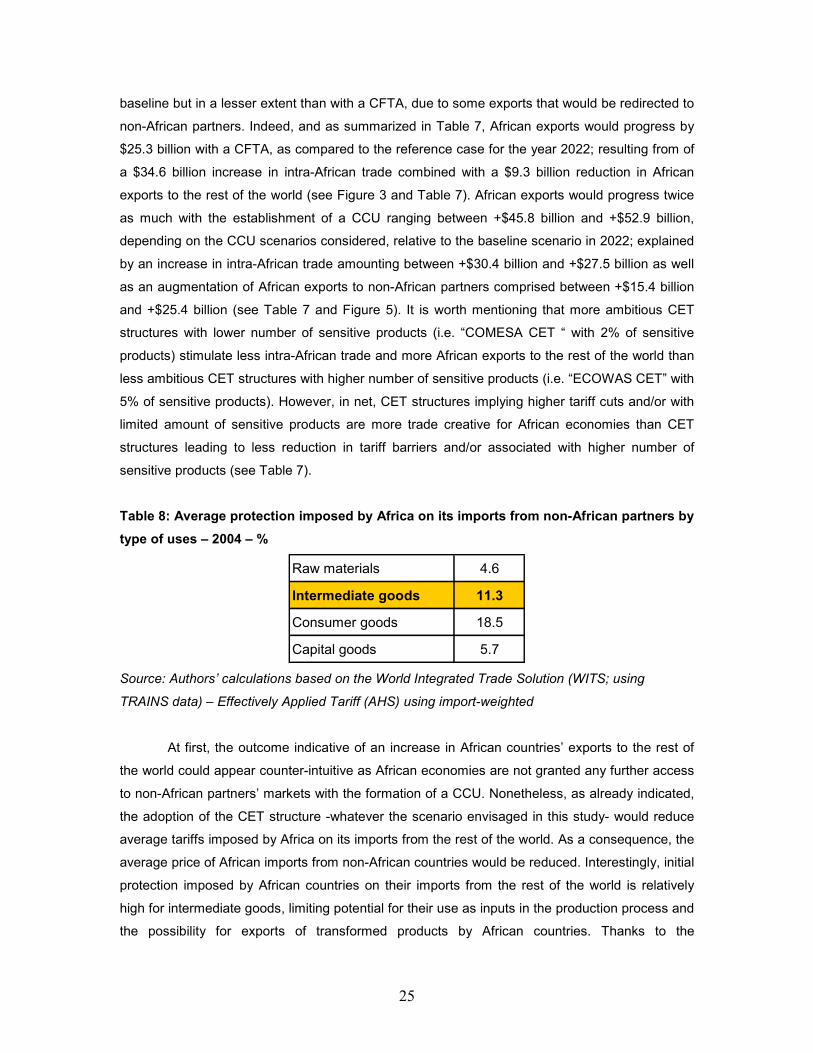
Table 8: Average protection imposed by Africa on its imports from non-African partners by
type of uses – 2004 – %
Raw materials 4.6
Intermediate goods 11.3
Consumer goods 18.5
Capital goods 5.7
Source: Authors’ calculations based on the World Integrated Trade Solution (WITS; using
TRAINS data) – Effectively Applied Tariff (AHS) using import-weighted
At first, the outcome indicative of an increase in African countries’ exports to the rest of
the world could appear counter-intuitive as African economies are not granted any further access
to non-African partners’ markets with the formation of a CCU. Nonetheless, as already indicated,
the adoption of the CET structure -whatever the scenario envisaged in this study- would reduce
average tariffs imposed by Africa on its imports from the rest of the world. As a consequence, the
average price of African imports from non-African countries would be reduced. Interestingly, initial
protection imposed by African countries on their imports from the rest of the world is relatively
high for intermediate goods, limiting potential for their use as inputs in the production process and
the possibility for exports of transformed products by African countries. Thanks to the

26
establishment of a CCU, the reduction of average tariffs imposed by African countries on their
imports of intermediate goods from the rest of the world would make imports of inputs -to be used
in the production process of African economies- cheaper. Thus, production costs would be
lowered leading to an increase production. African economies would become more competitive
on the world market and would be able to exploit new market opportunities outside the
continent34.
Figure 5: Change in African exports by destination for CFTA and CCU based on the most
ambitious CET structure (“COMESA CET”) and the lowest share of sensitive products (2%)
with and without trade facilitation (TF) measures, relative to the baseline, 2022 – $USD bn
-20.0
0.0
20.0
40.0
60.0
80.0
100.0
CFTA CCU -COMESACET - 2%
CFTA+TF CCU -COMESACET - 2%
+ TF
CFTA CCU -COMESACET - 2%
CFTA+TF CCU -COMESACET - 2%
+ TF
CFTA CCU -COMESACET - 2%
CFTA+TF CCU -COMESACET - 2%
+ TF
Africa Other developing countries Developed countries
Agriculture and food Industry Services
Source: Authors’ calculations based on MIRAGE model
Similarly to what was observed with a CFTA, the adoption of trade facilitation measures
within African economies would considerably boost intra-African trade in the context of a CCU as
well, and with industrial sectors grabbing most of the increase in both absolute and per cent terms
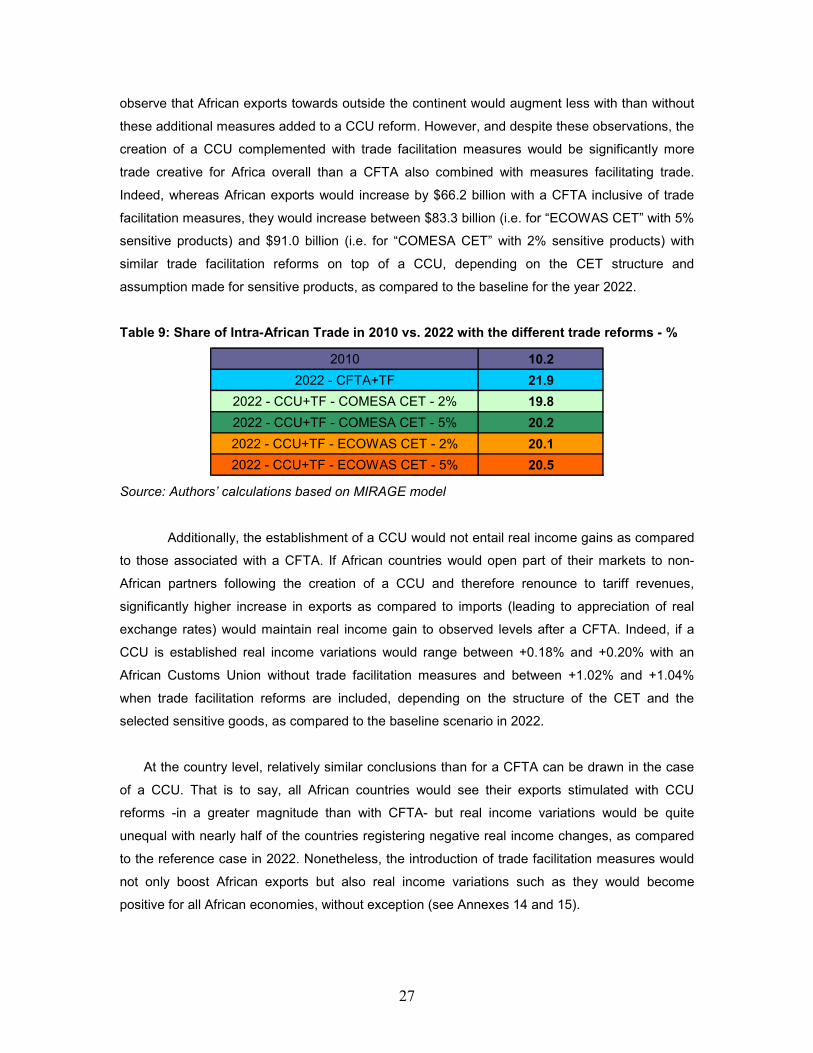
(see Figure 5). Indeed, even if the share of intra-African trade would be slightly inferior to that of
the case of a CFTA inclusive of trade facilitation measures, it would still nearly double in 2022,
whatever the scenarios considered for the CCU accompanied with non-tariff measures to ease
trade across borders, as compared to 2010 (see Table 9). Moreover, as trade facilitation
measures are only assumed to be improved within the African continent, it is not surprising to 34 Note that the model closure assumes fixed trade balance.
27
observe that African exports towards outside the continent would augment less with than without
these additional measures added to a CCU reform. However, and despite these observations, the
creation of a CCU complemented with trade facilitation measures would be significantly more
trade creative for Africa overall than a CFTA also combined with measures facilitating trade.
Indeed, whereas African exports would increase by $66.2 billion with a CFTA inclusive of trade
facilitation measures, they would increase between $83.3 billion (i.e. for “ECOWAS CET” with 5%
sensitive products) and $91.0 billion (i.e. for “COMESA CET” with 2% sensitive products) with
similar trade facilitation reforms on top of a CCU, depending on the CET structure and
assumption made for sensitive products, as compared to the baseline for the year 2022.
Table 9: Share of Intra-African Trade in 2010 vs. 2022 with the different trade reforms - %
2010 10.2
2022 - CFTA+TF 21.9
2022 - CCU+TF - COMESA CET - 2% 19.8
2022 - CCU+TF - COMESA CET - 5% 20.2
2022 - CCU+TF - ECOWAS CET - 2% 20.1
2022 - CCU+TF - ECOWAS CET - 5% 20.5
Source: Authors’ calculations based on MIRAGE model
Additionally, the establishment of a CCU would not entail real income gains as compared
to those associated with a CFTA. If African countries would open part of their markets to non-
African partners following the creation of a CCU and therefore renounce to tariff revenues,
significantly higher increase in exports as compared to imports (leading to appreciation of real
exchange rates) would maintain real income gain to observed levels after a CFTA. Indeed, if a
CCU is established real income variations would range between +0.18% and +0.20% with an
African Customs Union without trade facilitation measures and between +1.02% and +1.04%
when trade facilitation reforms are included, depending on the structure of the CET and the
selected sensitive goods, as compared to the baseline scenario in 2022.
At the country level, relatively similar conclusions than for a CFTA can be drawn in the case
of a CCU. That is to say, all African countries would see their exports stimulated with CCU
reforms -in a greater magnitude than with CFTA- but real income variations would be quite
unequal with nearly half of the countries registering negative real income changes, as compared
to the reference case in 2022. Nonetheless, the introduction of trade facilitation measures would
not only boost African exports but also real income variations such as they would become
positive for all African economies, without exception (see Annexes 14 and 15).

28
V. Conclusion and policy recommendations
African Heads of States and Governments recently agreed to establish a Continental
Free Trade Area with 2017 as indicative date for its effectiveness.
Results from a Computable General Equilibrium model analysis, indicate that deepened
regional integration in Africa through establishment of wider Free Trade Areas would benefit to
the continent. Such reforms would increase exports, real income as well as real wages for all
categories of workers for Africa as a whole. Moreover, the analysis suggests that the larger the
reform the greater the associated gains.
However, the implementation of the sole removal of tariff barriers on goods within the
African continent would not be sufficient to achieve the target announced by the African Union’s
Member States who wish to see the share of intra-African trade doubling over the next decade.
The increase in the share of intra-African trade would, nevertheless, be quite substantial as it
would pass from 10.2% in 2010 to 15.5% in 2022. To add to the relative insufficiencies from the
strict creation of a CFTA, results at the country level would be ambiguous. Indeed, although most
African economies would benefit from the formation of a CFTA, some countries would actually
register a decrease in their real income due to tariff revenue losses and/or diminished terms of
trade and/or negative net food trade balances. Also, certain categories of workers, in some
regions, would see their real wages declining with the reform.
For these reasons, it is critical to explore ways that could help brightening outcomes from
the establishment of a CFTA. In that sense, an improvement of trade facilitation measures,
namely making customs procedures twice more efficient as well as reducing by half the time
merchandise are retained at African ports, is envisaged. Not only this would lead to positive
exports, real income and real wage variations in all African countries but the share of intra-African
trade would more than double between 2010 and 2022, jumping from 10.2% to 21.9%,
respectively. Furthermore, introducing non-tariff measures to ease trading across borders on top
of a CFTA would considerably reinforce the sophistication of intra-African trade, expanding
substantially exchanges of manufactured products.
Finally, if the establishment of a Continental Customs Union, to be effective two years
after a Continental Free Trade Area –that is to say in 2019, according to the Abuja Treaty- would
not enhance further intra-African trade, it would help creating new trade opportunities for African
economies. The higher the tariff cuts involved by the Common External Tariff of the CCU and the
lower the number of sensitive products allowed, the higher the export increase for Africa towards
non-African partners35. Indeed, by opening up part of their markets to the rest of the world,
35 Note, however, that extremely aggressive cuts (implied by very low CET structures) may not be advisable as it may tend to limit intra-African trade and it may also entail real income gains due to higher
29
African countries would be able to import cheaper the necessary inputs to be used in the
production process and thus increase export opportunities. This would also give perspective for
export diversification and more sophisticated trade not only within Africa but when exporting to
the rest of the world as well.
Nevertheless, it should be clearly stated that the findings of this study assume full
implementation of the envisaged reforms knowing that implementation is a challenging and costly
task. Furthermore, several limitations associated with the methodology used should be kept in
mind when it comes to analyzing trade policies in the African context. Firstly, not all African
countries are available into the GTAP database used as social global accounting matrix for the
Computable General Equilibrium model. This does not allow for capturing detailed economic
impacts of trade reforms for every single African economy. Second, CGE models are based on
numerous assumptions which do not necessarily reflect well reality. In particular, the modeling
aspect of the labor market, and the possibility of unemployment –often relatively high in African
countries-, may appear unsatisfactory. Although an attempt was made to account for
unemployment in this study (see Annex 2), the lack of data available and its sometimes poor
reliability for African economies did not allow for adequate modeling. The significance of the
informal trade in Africa as well as the importance of tariff barriers on trade in services and the
difficulty to account for these elements can also be added as limitations. Nevertheless, and
despite the above mentioned modeling constraints, CGE models are probably the sole tools
capable of capturing multiple interactions taking place in the world economy and to interpret the
effects of complex trade policies in this context. Therefore, the outcomes from the establishment
of a Continental Free Trade area followed by a Continental Customs Union in Africa presented in
this paper should not be undermined.
tariff revenue losses even though this may well be compensated by export increases to outside the continent.
30
References
African Union Commission (1991), “Treaty Establishing the African Economic Community”.
Ben Hammouda, H. and P.N. Osakwe (2006), “Global Trade Models and Economic Policy Analyses: Relevance, Risks, and Repercussions for Africa”, ATPC Work in Progress No.47, UNECA
Blanchflower, D.G. and A.J. Oswald (2005), “The Wage Curve Reloaded”, Discussion Paper Series, IZA DP No. 1665.
Bouët, A., B. Dimaranan, H. Valin (2010), “Modeling the Global Trade and Environment Impacts of Biofuel Policies”, IPFRI Discussion Paper No. 01018.
Boumellassa, H., D. Laborde, C. Mitaritonna (2009), “A Picture of Tariff Protection Across the World in 2004: MAcMap-HS6, Version 2”, IFPRI Discussion Paper No. 00903.
Decreux, Y., H. Valin (2007), “MIRAGE, Updated Version of the Model for Trade Policy Analysis: Focus on Agricultural and Dynamics”, CEPII, Working paper No 2007-15.
Decreux, Y., L. Fontagne (2009), “Economic Impact of Potential outcome of the DDA”, CEPII, Working paper No 2009-01.
Dimaranan, B., S. Mevel (2008), “The COMESA Customs Union: A Quantitative Assessment”, CEPII, Research Report submitted to GTAP 11th Annual Conference, Helsinki, Finland.
Horridge, J.M. and D. Laborde, (2008), “TASTE: a program to adapt detailed trade and tariff data to GTAP-related purposes”, GTAP Technical Paper, Centre for Global Trade Analysis, Purdue University.
Hummels, D. (2001), “Time as a Trade Barrier”, Mimeo, Purdue University.
Jean, S., D. Laborde, W. Martin (2008), “Choosing Sensitive Agricultural Products in Trade Negotiations”, IFPRI Discussion Paper No. 00788.
Minor, P. and M. Tsigas (2008). “Impact of Better Trade Facilitation in Developing Countries: Analysis with a New GTAP Database for the Value of Time in Trade”, Research Report submitted to GTAP 11th Annual Conference, Helsinki, Finland.
Narayanan, B. and T.L. Walmsley, Editors (2008). “Global Trade, Assistance, and Production: The GTAP 7 Data Base”, Center for Global Trade Analysis, Purdue University.
Park, S-C. (2002). “Measuring tariff equivalents in cross border trade in services”, KIEP Working Paper 02-15.
United Nations Economic Commission for Africa, African Union Commission, and African Development Bank (2010), “Assessing Regional Integration in Africa IV: Enhancing Intra-African Trade”, United Nations Publication.
United States Agency for International Development (2007), “Calculating Tariff Equivalents for Time in Trade”.
Warren, T. (2000). “The identification of impediments to trade and investment in telecommunications services”, in Findlay, C. and Warren, T. (eds) 2000, Impediments to Trade in Services: Measurement and Policy Implications, Routledge, London and New York, pp. 71-84.
World Bank (2005). “Global Economic Prospects 2005: Trade, Regionalism and Development”.
World Bank (2012). “Doing Business 2012: Doing Business in a More Transparent World”.
31
Annexes
Annex 1 – Average protection on African countries’ imports from/exports to World (2004)
Country
Average im
posed
protection on
imports from W
orld
Average faced
protection on
exports to W
orld
Algeria 13.9% 0.5%Angola 7.1% 0.4%Benin 10.2% 6.0%Botswana 6.6% 3.2%Burkina faso 10.2% 5.5%Burundi 20.4% 3.7%Cameroon 15.0% 3.7%Cape verde 0.0% 3.1%Central african republic 14.9% 0.8%Chad 15.6% 0.6%Comoros 0.0% 1.1%Congo 15.7% 1.1%Congo (democratic rep.) 11.2% 1.6%Côte d'ivoire 9.2% 3.9%Djibouti 29.3% 7.8%Egypt 9.5% 5.1%Equatorial guinea 15.1% 1.3%Eritrea 6.5% 9.1%Ethiopia 11.0% 4.5%Gabon 15.1% 0.9%Gambia 0.0% 8.0%Ghana 13.6% 3.4%Guinea 0.0% 1.5%Guinea-bissau 10.3% 8.7%Kenya 17.5% 5.6%Lesotho 7.1% 0.2%Liberia 0.0% 1.3%Libyan arab jamahiriya 20.7% 0.6%Madagascar 4.1% 1.7%Malawi 10.1% 14.3%Mali 10.2% 2.3%Mauritania 9.4% 3.0%Mauritius 18.8% 12.4%Morocco 19.5% 2.6%Mozambique 9.7% 1.8%Namibia 7.4% 5.3%Niger 10.2% 2.4%Nigeria 24.4% 2.6%Rwanda 7.2% 2.4%Sao tome and principe 0.0% 2.2%Senegal 8.6% 5.7%Seychelles 33.7% 3.0%Sierra leone 0.0% 2.3%Somalia 0.0% 10.3%South africa 6.8% 4.4%Sudan 18.3% 3.8%Swaziland 7.3% 15.8%Tanzania 10.9% 8.4%Togo 9.3% 5.5%Tunisia 17.6% 3.0%Uganda 6.4% 3.7%Zambia 8.6% 3.3%Zimbabwe 14.6% 6.8%AFRICA 13.6% 2.5%
Source: Authors’ calculations based on TASTE software and MAcMapHS6v2 database
32
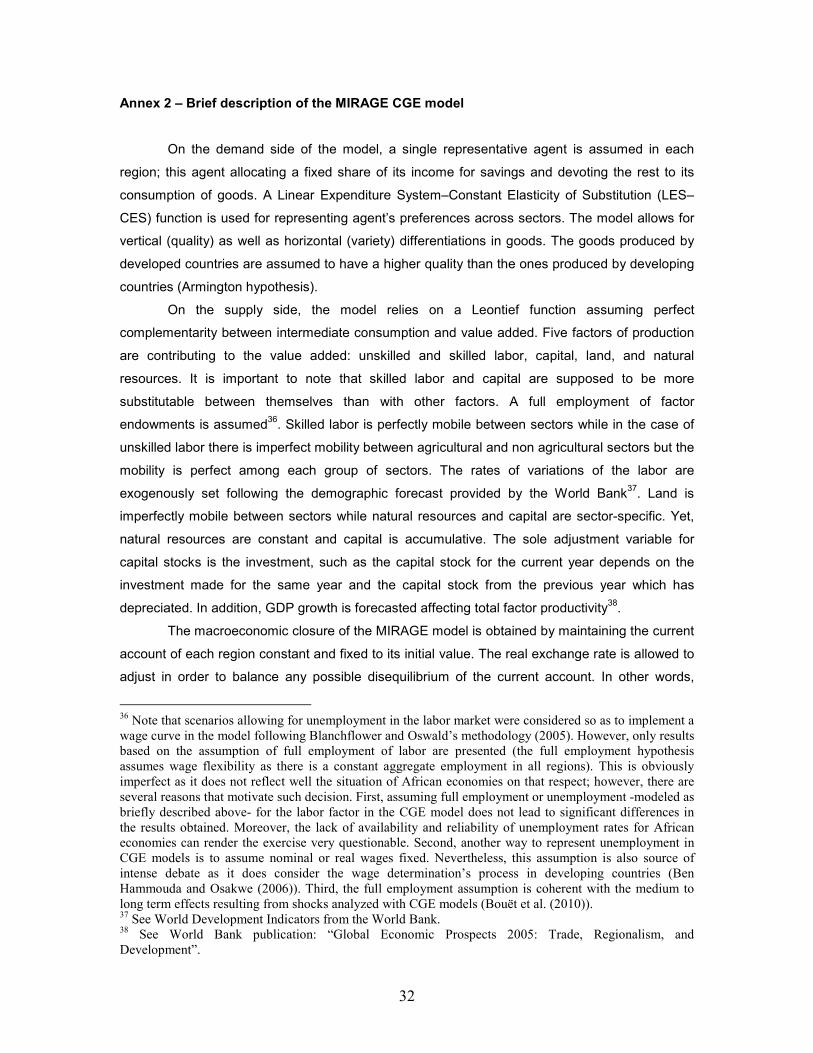
Annex 2 – Brief description of the MIRAGE CGE model
On the demand side of the model, a single representative agent is assumed in each
region; this agent allocating a fixed share of its income for savings and devoting the rest to its
consumption of goods. A Linear Expenditure System–Constant Elasticity of Substitution (LES–
CES) function is used for representing agent’s preferences across sectors. The model allows for
vertical (quality) as well as horizontal (variety) differentiations in goods. The goods produced by
developed countries are assumed to have a higher quality than the ones produced by developing
countries (Armington hypothesis).
On the supply side, the model relies on a Leontief function assuming perfect
complementarity between intermediate consumption and value added. Five factors of production
are contributing to the value added: unskilled and skilled labor, capital, land, and natural
resources. It is important to note that skilled labor and capital are supposed to be more
substitutable between themselves than with other factors. A full employment of factor
endowments is assumed36. Skilled labor is perfectly mobile between sectors while in the case of
unskilled labor there is imperfect mobility between agricultural and non agricultural sectors but the
mobility is perfect among each group of sectors. The rates of variations of the labor are
exogenously set following the demographic forecast provided by the World Bank37. Land is
imperfectly mobile between sectors while natural resources and capital are sector-specific. Yet,
natural resources are constant and capital is accumulative. The sole adjustment variable for
capital stocks is the investment, such as the capital stock for the current year depends on the
investment made for the same year and the capital stock from the previous year which has
depreciated. In addition, GDP growth is forecasted affecting total factor productivity38.
The macroeconomic closure of the MIRAGE model is obtained by maintaining the current
account of each region constant and fixed to its initial value. The real exchange rate is allowed to
adjust in order to balance any possible disequilibrium of the current account. In other words,
36 Note that scenarios allowing for unemployment in the labor market were considered so as to implement a wage curve in the model following Blanchflower and Oswald’s methodology (2005). However, only results based on the assumption of full employment of labor are presented (the full employment hypothesis assumes wage flexibility as there is a constant aggregate employment in all regions). This is obviously imperfect as it does not reflect well the situation of African economies on that respect; however, there are several reasons that motivate such decision. First, assuming full employment or unemployment -modeled as briefly described above- for the labor factor in the CGE model does not lead to significant differences in the results obtained. Moreover, the lack of availability and reliability of unemployment rates for African economies can render the exercise very questionable. Second, another way to represent unemployment in CGE models is to assume nominal or real wages fixed. Nevertheless, this assumption is also source of intense debate as it does consider the wage determination’s process in developing countries (Ben Hammouda and Osakwe (2006)). Third, the full employment assumption is coherent with the medium to long term effects resulting from shocks analyzed with CGE models (Bouët et al. (2010)). 37 See World Development Indicators from the World Bank. 38 See World Bank publication: “Global Economic Prospects 2005: Trade, Regionalism, and Development”.
33
when a trade reform stimulates trade, such as reduction of tariff barriers, the real exchange rates
appreciate if exports increase more than the imports or depreciate when the exports increase less
than the imports.
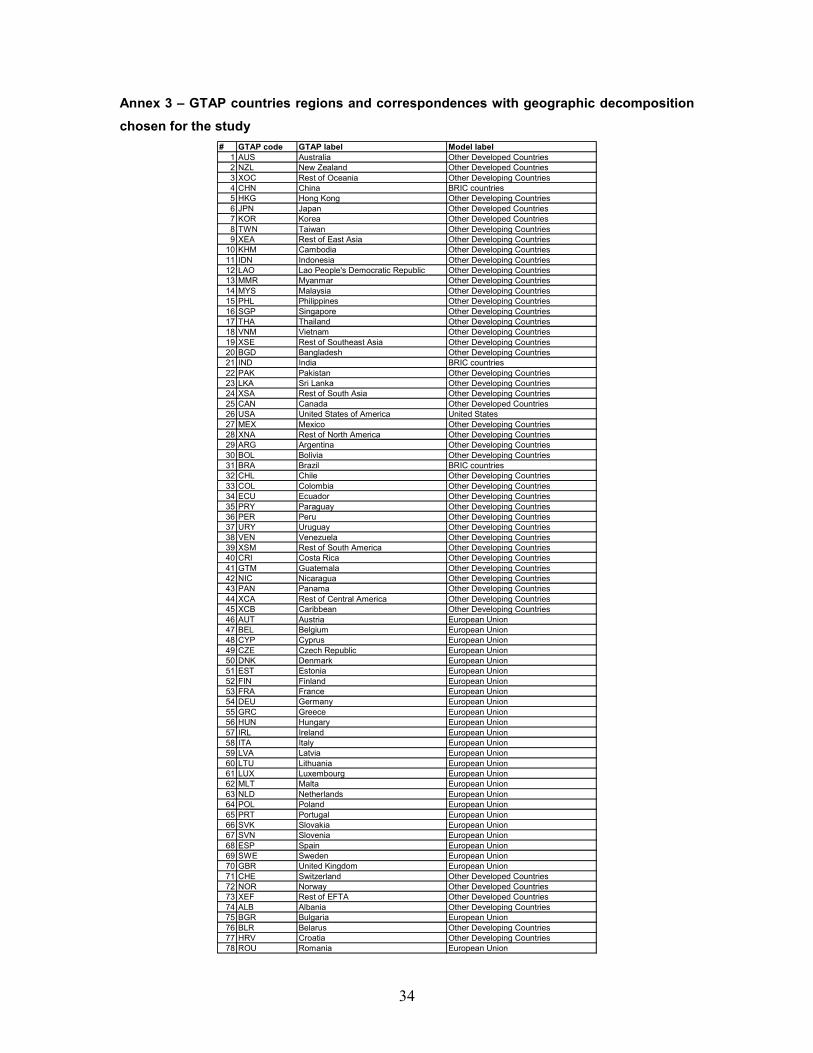
34
Annex 3 – GTAP countries regions and correspondences with geographic decomposition
chosen for the study # GTAP code GTAP label Model label
1 AUS Australia Other Developed Countries2 NZL New Zealand Other Developed Countries3 XOC Rest of Oceania Other Developing Countries4 CHN China BRIC countries5 HKG Hong Kong Other Developing Countries6 JPN Japan Other Developed Countries7 KOR Korea Other Developed Countries8 TWN Taiwan Other Developing Countries9 XEA Rest of East Asia Other Developing Countries
10 KHM Cambodia Other Developing Countries11 IDN Indonesia Other Developing Countries12 LAO Lao People's Democratic Republic Other Developing Countries13 MMR Myanmar Other Developing Countries14 MYS Malaysia Other Developing Countries15 PHL Philippines Other Developing Countries16 SGP Singapore Other Developing Countries17 THA Thailand Other Developing Countries18 VNM Vietnam Other Developing Countries19 XSE Rest of Southeast Asia Other Developing Countries20 BGD Bangladesh Other Developing Countries21 IND India BRIC countries22 PAK Pakistan Other Developing Countries23 LKA Sri Lanka Other Developing Countries24 XSA Rest of South Asia Other Developing Countries25 CAN Canada Other Developed Countries26 USA United States of America United States27 MEX Mexico Other Developing Countries28 XNA Rest of North America Other Developing Countries29 ARG Argentina Other Developing Countries30 BOL Bolivia Other Developing Countries31 BRA Brazil BRIC countries32 CHL Chile Other Developing Countries33 COL Colombia Other Developing Countries34 ECU Ecuador Other Developing Countries35 PRY Paraguay Other Developing Countries36 PER Peru Other Developing Countries37 URY Uruguay Other Developing Countries38 VEN Venezuela Other Developing Countries39 XSM Rest of South America Other Developing Countries40 CRI Costa Rica Other Developing Countries41 GTM Guatemala Other Developing Countries42 NIC Nicaragua Other Developing Countries43 PAN Panama Other Developing Countries44 XCA Rest of Central America Other Developing Countries45 XCB Caribbean Other Developing Countries46 AUT Austria European Union47 BEL Belgium European Union48 CYP Cyprus European Union49 CZE Czech Republic European Union50 DNK Denmark European Union51 EST Estonia European Union52 FIN Finland European Union53 FRA France European Union54 DEU Germany European Union55 GRC Greece European Union56 HUN Hungary European Union57 IRL Ireland European Union58 ITA Italy European Union59 LVA Latvia European Union60 LTU Lithuania European Union61 LUX Luxembourg European Union62 MLT Malta European Union63 NLD Netherlands European Union64 POL Poland European Union65 PRT Portugal European Union66 SVK Slovakia European Union67 SVN Slovenia European Union68 ESP Spain European Union69 SWE Sweden European Union70 GBR United Kingdom European Union71 CHE Switzerland Other Developed Countries72 NOR Norway Other Developed Countries73 XEF Rest of EFTA Other Developed Countries74 ALB Albania Other Developing Countries75 BGR Bulgaria European Union76 BLR Belarus Other Developing Countries77 HRV Croatia Other Developing Countries78 ROU Romania European Union

35
# GTAP code GTAP label Model label79 RUS Russian Federation BRIC countries80 UKR Ukraine Other Developing Countries81 XEE Rest of Eastern Europe Other Developing Countries82 XER Rest of Europe Other Developing Countries83 KAZ Kazakhstan Other Developing Countries84 KGZ Kyrgyzstan Other Developing Countries85 XSU Rest of Former Soviet Union Other Developing Countries86 ARM Armenia Other Developing Countries87 AZE Azerbaijan Other Developing Countries88 GEO Georgia Other Developing Countries89 IRN Iran, Islamic Republic of Other Developing Countries90 TUR Turkey Other Developing Countries91 XWS Rest of Western Asia Other Developing Countries92 EGY Egypt Egypt93 MAR Morocco Morocco94 TUN Tunisia Tunisia95 XNF Rest of North Africa Rest of North Africa
- Algeria- Libyan Arab Jamahiriya
96 NGA Nigeria Nigeria97 SEN Senegal Senegal98 XWF Rest of Western Africa Rest of Western Africa
- Benin- Burkina Faso- Cape Verde- Cote d'Ivoire- Gambia- Ghana- Guinea- Guinea-Bissau- Liberia- Mali- Mauritania- Niger- Saint Helena- Sierra Leone- Togo
99 XCF Rest of Central Africa Rest of Central Africa- Cameroon- Central African Republic- Chad- Congo- Equatorial Guinea- Gabon- Sao Tome and Principe
100 XAC Rest of South Central Africa Rest of South Central Africa- Angola- Congo, Democratic Republic of the
101 ETH Ethiopia Ethiopia102 MDG Madagascar Madagascar103 MWI Malawi Malawi104 MUS Mauritius Mauritius105 MOZ Mozambique Mozambique106 TZA Tanzania Tanzania107 UGA Uganda Uganda108 ZMB Zambia Zambia109 ZWE Zimbabwe Zimbabwe110 XEC Rest of Eastern Africa Rest of Eastern Africa
- Burundi- Comoros- Djibouti- Eritrea- Kenya- Mayotte- Reunion- Rwanda- Seychelles- Somalia- Sudan
111 BWA Botswana Botswana112 ZAF South Africa South Africa113 XSC Rest of South African Customs Union Rest of South African Customs Union
- Lesotho- Namibia- Swaziland
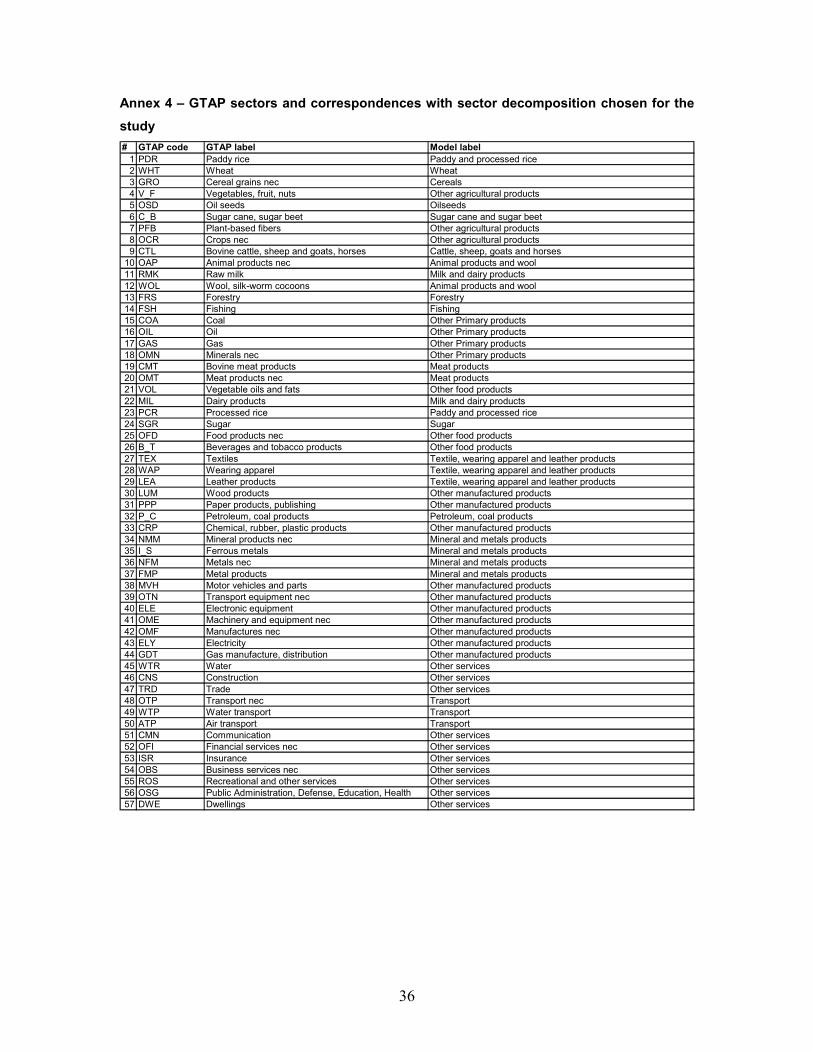
36
Annex 4 – GTAP sectors and correspondences with sector decomposition chosen for the
study
# GTAP code GTAP label Model label1 PDR Paddy rice Paddy and processed rice2 WHT Wheat Wheat3 GRO Cereal grains nec Cereals4 V_F Vegetables, fruit, nuts Other agricultural products5 OSD Oil seeds Oilseeds6 C_B Sugar cane, sugar beet Sugar cane and sugar beet7 PFB Plant-based fibers Other agricultural products8 OCR Crops nec Other agricultural products9 CTL Bovine cattle, sheep and goats, horses Cattle, sheep, goats and horses
10 OAP Animal products nec Animal products and wool11 RMK Raw milk Milk and dairy products12 WOL Wool, silk-worm cocoons Animal products and wool13 FRS Forestry Forestry14 FSH Fishing Fishing15 COA Coal Other Primary products16 OIL Oil Other Primary products17 GAS Gas Other Primary products18 OMN Minerals nec Other Primary products19 CMT Bovine meat products Meat products20 OMT Meat products nec Meat products21 VOL Vegetable oils and fats Other food products22 MIL Dairy products Milk and dairy products23 PCR Processed rice Paddy and processed rice24 SGR Sugar Sugar25 OFD Food products nec Other food products26 B_T Beverages and tobacco products Other food products27 TEX Textiles Textile, wearing apparel and leather products28 WAP Wearing apparel Textile, wearing apparel and leather products29 LEA Leather products Textile, wearing apparel and leather products30 LUM Wood products Other manufactured products31 PPP Paper products, publishing Other manufactured products32 P_C Petroleum, coal products Petroleum, coal products33 CRP Chemical, rubber, plastic products Other manufactured products34 NMM Mineral products nec Mineral and metals products35 I_S Ferrous metals Mineral and metals products36 NFM Metals nec Mineral and metals products37 FMP Metal products Mineral and metals products38 MVH Motor vehicles and parts Other manufactured products39 OTN Transport equipment nec Other manufactured products40 ELE Electronic equipment Other manufactured products41 OME Machinery and equipment nec Other manufactured products42 OMF Manufactures nec Other manufactured products43 ELY Electricity Other manufactured products44 GDT Gas manufacture, distribution Other manufactured products45 WTR Water Other services46 CNS Construction Other services47 TRD Trade Other services48 OTP Transport nec Transport49 WTP Water transport Transport50 ATP Air transport Transport51 CMN Communication Other services52 OFI Financial services nec Other services53 ISR Insurance Other services54 OBS Business services nec Other services55 ROS Recreational and other services Other services56 OSG Public Administration, Defense, Education, Health Other services57 DWE Dwellings Other services
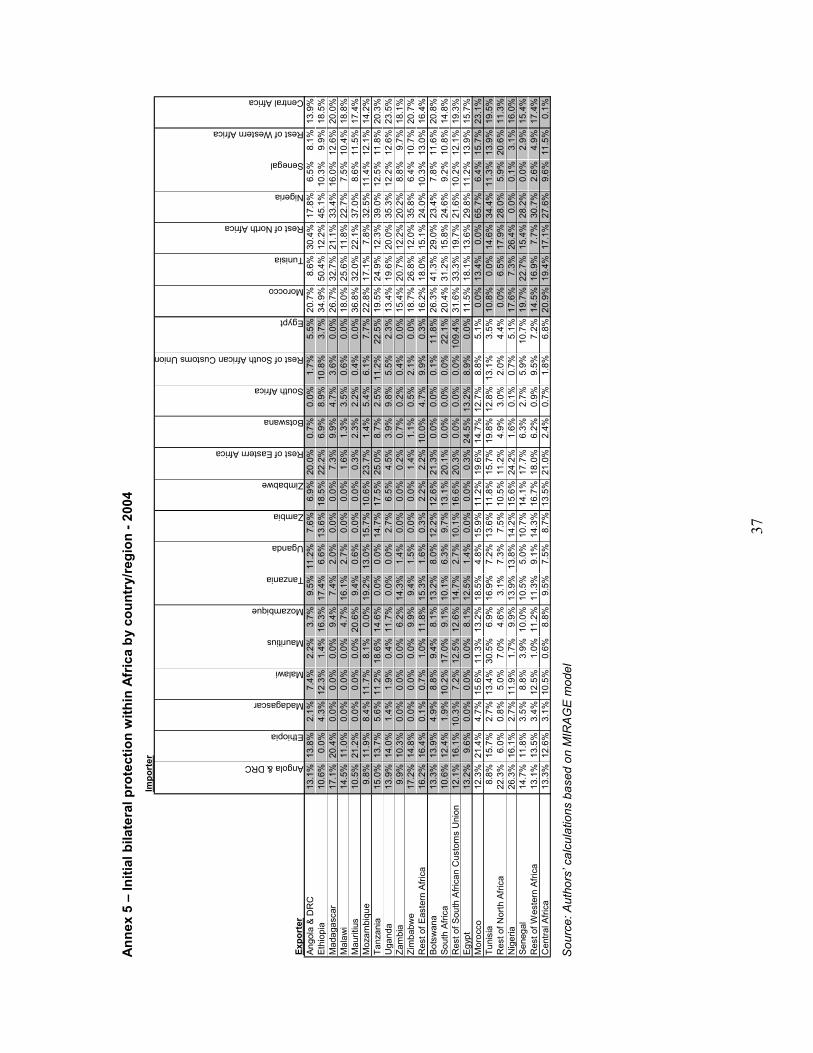
37
Annex
5 – In
itial b
ilateral p
rotection within Africa by co
untry/region - 2004
Exp
orter
Angola & DRC
Ethiopia
Madagascar
Malawi
Mauritius
Mozambique
Tanzania
Uganda
Zambia
Zimbabwe
Rest of Eastern Africa
Botswana
South Africa
Rest of South African Customs Union
Egypt
Morocco
Tunisia
Rest of North Africa
Nigeria
Senegal
Rest of Western Africa
Central Africa
Ang
ola
& D
RC
13.1
%13
.8%
2.1%
7.4%
2.2%
3.7%
9.5%
11.2
%7.
6%6.
9%20
.0%
0.7%
0.0%
1.7%
5.5%
20.7
%8.
6%30
.4%
17.8
%6.
5%8.
1%13
.9%
Eth
iopi
a10
.6%
0.0%
4.3%
12.3
%1.
4%16
.3%
17.4
%6.
6%13
.6%
18.5
%22
.2%
6.9%
8.9%
10.8
%3.
7%34
.9%
50.4
%12
.2%
45.1
%10
.3%
9.9%
18.5
%M
adag
asca
r17
.1%
20.4
%0.
0%0.
0%0.
0%9.
4%7.
4%2.
0%0.
0%0.
0%7.
3%9.
9%4.
7%3.
6%0.
0%26
.7%
32.7
%21
.1%
33.4
%16
.0%
12.6
%20
.0%
Mal
awi
14.5
%11
.0%
0.0%
0.0%
0.0%
4.7%
16.1
%2.
7%0.
0%0.
0%1.
6%1.
3%3.
5%0.
6%0.
0%18
.0%
25.6
%11
.8%
22.7
%7.
5%10
.4%
18.8
%M
aurit
ius
10.5
%21
.2%
0.0%
0.0%
0.0%
20.6
%9.
4%0.
6%0.
0%0.
0%0.
3%2.
3%2.
2%0.
4%0.
0%36
.8%
32.0
%22
.1%
37.0
%8.
6%11
.5%
17.4
%M
ozam
biqu
e9.
8%11
.9%
8.4%
11.7
%8.
1%0.
0%19
.2%
13.0
%15
.7%
10.6
%23
.7%
1.4%
5.4%
6.1%
7.7%
22.8
%17
.1%
7.8%
32.5
%11
.4%
12.1
%14
.2%
Tan
zani
a15
.0%
13.7
%5.
6%11
.2%
18.6
%14
.6%
0.0%
0.0%
14.7
%17
.5%
25.0
%8.
7%2.
5%11
.2%
22.5
%19
.5%
24.9
%12
.3%
39.0
%12
.5%
11.8
%20
.3%
Uga
nda
13.9
%14
.0%
1.4%
1.9%
0.4%
11.7
%0.
0%0.
0%2.
7%6.
5%4.
5%3.
9%9.
8%5.
5%2.
3%13
.4%
19.6
%20
.0%
35.3
%12
.2%
12.6
%23
.5%
Zam
bia
9.9%
10.3
%0.
0%0.
0%0.
0%6.
2%14
.3%
1.4%
0.0%
0.0%
0.2%
0.7%
0.2%
0.4%
0.0%
15.4
%20
.7%
12.2
%20
.2%
8.8%
9.7%
18.1
%Zim
babw
e17
.2%
14.8
%0.
0%0.
0%0.
0%9.
9%9.
4%1.
5%0.
0%0.
0%1.
4%1.
1%0.
5%2.
1%0.
0%18
.7%
26.8
%12
.0%
35.8
%6.
4%10
.7%
20.7
%R
est o
f Eas
tern
Afric
a16
.2%
16.4
%0.
1%0.
7%1.
0%11
.8%
15.3
%1.
6%0.
3%2.
2%2.
2%10
.0%
4.7%
9.9%
0.3%
16.2
%18
.0%
15.1
%24
.0%
10.3
%13
.0%
16.4
%Bot
swan
a13
.3%
13.9
%4.
9%8.
8%9.
4%8.
1%13
.2%
8.0%
12.2
%12
.6%
21.3
%0.
0%0.
0%0.
1%11
.8%
26.3
%41
.3%
29.0
%23
.4%
7.8%
11.6
%20
.8%
Sou
th A
fric
a10
.6%
12.4
%1.
9%10
.2%
17.0
%9.
1%10
.1%
6.3%
9.7%
13.1
%20
.1%
0.0%
0.0%
0.0%
22.1
%20
.4%
31.2
%15
.8%
24.6
%9.
2%10
.8%
14.8
%R
est o
f Sou
th A
fric
an C
usto
ms
Uni
on12
.1%
16.1
%10
.3%
7.2%
12.5
%12
.6%
14.7
%2.
7%10
.1%
16.6
%20
.3%
0.0%
0.0%
0.0%
109.
4%31
.6%
33.3
%19
.7%
21.6
%10
.2%
12.1
%19
.3%
Egy
pt13
.2%
9.6%
0.0%
0.0%
0.0%
8.1%
12.5
%1.
4%0.
0%0.
0%0.
3%24
.5%
13.2
%8.
9%0.
0%11
.5%
18.1
%13
.6%
29.8
%11
.2%
13.9
%15
.7%
Mor
occo
12.3
%21
.4%
4.7%
15.6
%11
.3%
13.2
%18
.5%
4.8%
15.9
%11
.2%
19.6
%14
.7%
12.7
%8.
8%5.
1%0.
0%13
.4%
0.0%
65.7
%6.
4%15
.7%
23.1
%Tun
isia
8.8%
15.7
%2.
7%13
.4%
30.5
%6.
9%16
.9%
7.2%
13.6
%11
.8%
15.7
%19
.8%
12.8
%13
.1%
3.5%
10.8
%0.
0%14
.6%
34.4
%11
.3%
13.9
%19
.5%
Res
t of N
orth
Afric
a22
.3%
6.0%
0.8%
5.0%
7.0%
4.6%
3.1%
7.3%
7.5%
10.5
%11
.2%
4.9%
3.0%
2.0%
4.4%
0.0%
6.5%
17.9
%28
.0%
5.9%
20.6
%11
.3%
Nig
eria
26.3
%16
.1%
2.7%
11.9
%1.
7%9.
9%13
.9%
13.8
%14
.2%
15.6
%24
.2%
1.6%
0.1%
0.7%
5.1%
17.6
%7.
3%26
.4%
0.0%
0.1%
3.1%
16.0
%Sen
egal
14.7
%11
.8%
3.5%
8.8%
3.9%
10.0
%10
.5%
5.0%
10.7
%14
.1%
17.7
%6.
3%2.
7%5.
9%10
.7%
19.7
%22
.7%
15.4
%28
.2%
0.0%
2.9%
15.4
%R
est o
f Wes
tern
Afric
a13
.1%
13.5
%3.
4%12
.5%
1.0%
11.2
%11
.3%
9.1%
14.3
%16
.7%
18.0
%6.
2%0.
9%9.
5%7.
2%14
.5%
16.9
%7.
7%30
.7%
2.6%
4.9%
17.4
%C
entral
Afric
a13
.3%
12.6
%3.
1%10
.5%
0.6%
8.8%
9.5%
7.5%
8.7%
13.5
%21
.0%
2.4%
0.7%
1.8%
6.8%
20.9
%19
.4%
17.1
%27
.6%
9.6%
11.5
%0.
1%
Importer
Source: Authors’ calculations based on MIRAGE model

38
Annex
6 – In
itial p
rotection im
posed by African
countries/regions on their im
ports from other African
countries/regions - 2004
Paddy and processed rice
Wheat
Cereals
Oilseeds
Sugar cane and Sugar beet
Cattle sheep goats and horses
Animal products and wool
Other agricultural products
Milk and dairy products
Meat products
Sugar
Other food products
Forestry
Fishing
Other primary products
Textile wearing apparel and leather products
Petroleum coal products
Mineral and metal products
Other manufactured products
Ang
ola
& D
RC
8.0%
4.8%
8.2%
7.4%
10.0
%7.
1%9.
7%10
.2%
11.7
%10
.9%
16.5
%17
.5%
29.6
%28
.4%
20.2
%15
.5%
11.2
%11
.0%
9.3%
Eth
iopi
a4.
8%4.
8%4.
9%4.
9%4.
8%8.
7%16
.7%
24.5
%27
.7%
22.8
%4.
8%27
.6%
9.0%
31.8
%6.
1%32
.8%
1.0%
10.7
%12
.8%
Mad
agas
car
0.0%
0.0%
2.4%
1.0%
0.0%
0.0%
0.1%
1.8%
3.4%
4.0%
11.5
%1.
9%0.
9%0.
6%0.
2%2.
2%0.
0%2.
5%2.
7%M
alaw
i7.
5%0.
0%0.
1%0.
0%0.
0%7.
3%1.
3%9.
4%15
.1%
7.4%
5.9%
10.9
%5.
7%5.
0%1.
0%11
.3%
7.9%
8.4%
8.0%
Mau
ritiu
s2.
5%0.
0%0.
1%0.
0%0.
7%0.
3%7.
3%5.
2%3.
3%6.
2%79
.6%
22.3
%3.
1%5.
5%3.
1%16
.0%
0.7%
9.6%
15.2
%M
ozam
biqu
e5.
4%2.
0%2.
8%4.
6%1.
3%6.
5%7.
9%16
.4%
15.1
%22
.0%
7.5%
18.9
%4.
3%11
.7%
3.9%
19.5
%6.
5%7.
0%7.
9%Tan
zani
a24
.2%
5.0%
13.8
%24
.8%
24.9
%17
.9%
10.4
%22
.2%
10.8
%19
.8%
25.0
%21
.6%
6.8%
21.0
%8.
4%19
.4%
1.5%
13.0
%9.
7%U
gand
a3.
8%0.
0%1.
5%3.
1%7.
0%6.
5%2.
8%12
.9%
2.6%
10.2
%11
.9%
8.1%
5.6%
12.5
%8.
6%5.
6%2.
8%6.
3%3.
6%Zam
bia
4.5%
5.0%
4.8%
4.4%
10.2
%5.
9%8.
9%13
.2%
9.2%
20.8
%16
.2%
13.2
%20
.3%
24.0
%5.
6%14
.9%
16.9
%6.
1%7.
9%Zim
babw
e12
.1%
5.0%
19.7
%6.
2%15
.0%
15.5
%10
.7%
29.8
%18
.9%
31.6
%22
.5%
24.9
%5.
0%17
.7%
8.2%
21.6
%10
.3%
8.6%
13.0
%R
est o
f Eas
tern
Afric
a0.
8%21
.6%
22.3
%12
.4%
5.8%
12.5
%4.
5%12
.0%
9.7%
21.4
%18
.6%
15.2
%18
.6%
29.0
%9.
6%15
.2%
5.7%
12.2
%10
.2%
Bot
swan
a0.
0%0.
0%0.
1%0.
4%18
.8%
0.0%
0.0%
1.3%
0.4%
0.7%
3.3%
0.7%
0.2%
0.5%
0.0%
2.5%
0.1%
0.1%
0.2%
Sou
th A
fric
a0.
0%0.
0%1.
0%3.
0%18
.3%
0.0%
0.1%
29.2
%2.
1%0.
6%3.
2%2.
2%0.
1%0.
3%0.
0%4.
2%1.
3%0.
4%0.
8%R
est o
f Sou
th A
fric
an C
usto
ms
Uni
on0.
0%0.
0%0.
0%1.
7%6.
3%0.
0%0.
0%1.
5%8.
0%0.
2%2.
5%0.
7%0.
0%0.
3%0.
0%1.
9%0.
8%0.
1%0.
2%Egy
pt1.
0%1.
4%1.
9%0.
2%2.
0%4.
2%0.
4%8.
1%2.
6%26
.9%
2.2%
15.8
%1.
5%2.
1%3.
8%16
.3%
4.4%
1.4%
5.8%
Mor
occo
61.3
%42
.8%
65.0
%19
.5%
20.8
%13
4.3%
14.4
%40
.3%
8.7%
81.1
%9.
6%22
.6%
22.8
%36
.0%
16.4
%18
.2%
2.0%
5.9%
11.7
%Tun
isia
12.1
%48
.9%
15.7
%19
.2%
74.8
%10
1.5%
15.6
%16
1.4%
24.0
%97
.5%
11.7
%32
.8%
24.0
%26
.1%
3.6%
15.7
%2.
0%15
.5%
15.7
%R
est o
f Nor
th A
fric
a5.
6%5.
1%4.
1%9.
6%21
.5%
10.5
%13
.5%
11.4
%10
.3%
26.3
%11
.7%
16.1
%4.
4%19
.5%
16.6
%14
.6%
12.8
%12
.0%
12.1
%N
iger
ia75
.0%
5.0%
69.4
%19
.8%
15.0
%17
.5%
43.8
%34
.3%
23.4
%45
.4%
15.1
%63
.6%
15.8
%14
.4%
13.5
%54
.2%
29.7
%24
.5%
20.8
%Sen
egal
10.0
%4.
6%3.
5%1.
7%5.
0%0.
9%11
.1%
6.2%
2.6%
7.2%
19.0
%7.
6%4.
8%4.
9%0.
1%4.
2%5.
0%8.
7%5.
6%R
est o
f Wes
tern
Afric
a4.
4%6.
0%3.
3%3.
5%7.
0%3.
1%7.
9%10
.7%
6.2%
10.2
%14
.5%
9.3%
9.9%
12.1
%1.
0%7.
9%8.
1%8.
0%6.
5%C
entral
Afric
a19
.4%
9.6%
21.3
%12
.1%
10.0
%17
.9%
19.8
%20
.5%
22.4
%20
.1%
24.4
%23
.1%
1.0%
21.5
%12
.3%
22.5
%8.
1%15
.1%
12.6
%AFRICA
6.2%
5.9%
16.0%
7.6%
12.6%
3.2%
7.6%
13.9%
8.1%
11.6%
14.9%
15.4%
11.9%
11.7%
2.3%
11.8%
9.2%
9.1%
8.5%
Source: Authors’ calculations based on MIRAGE model
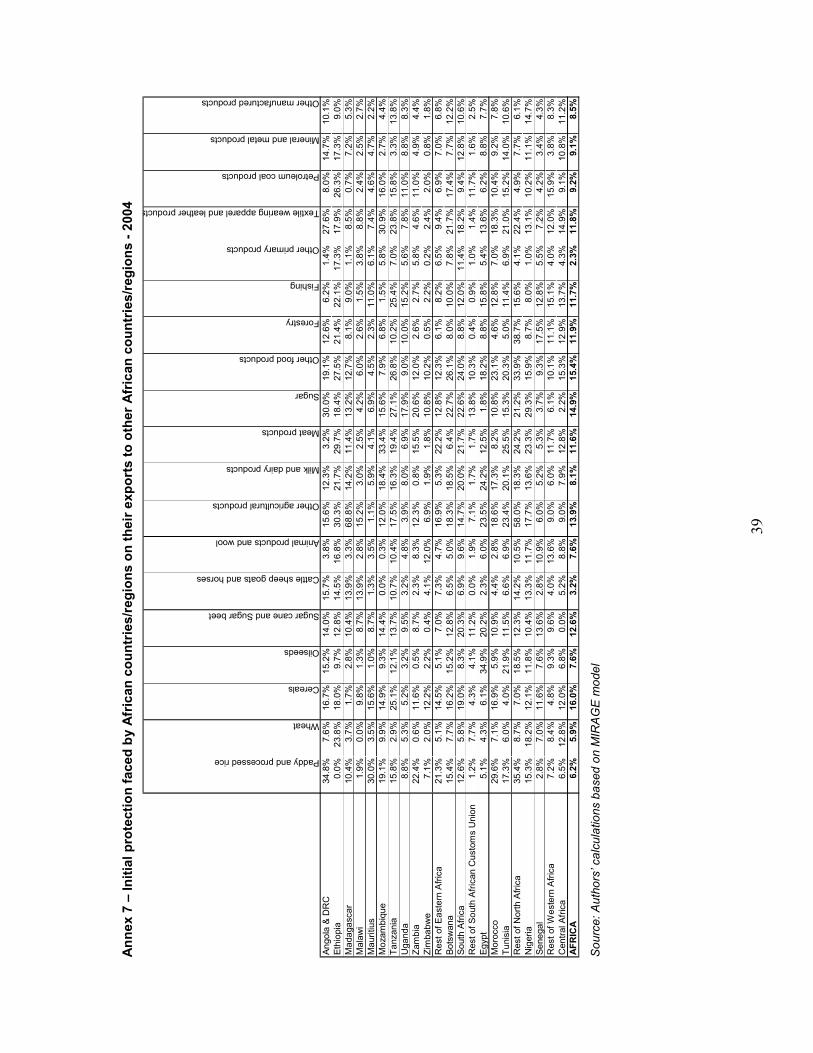
39
Annex
7 – In
itial p
rotection faced
by African
countries/regions on their ex
ports to other African
countries/regions - 20
04
Paddy and processed rice
Wheat
Cereals
Oilseeds
Sugar cane and Sugar beet
Cattle sheep goats and horses
Animal products and wool
Other agricultural products
Milk and dairy products
Meat products
Sugar
Other food products
Forestry
Fishing
Other primary products
Textile wearing apparel and leather products
Petroleum coal products
Mineral and metal products
Other manufactured products
Ang
ola
& D
RC
34.8
%7.
6%16
.7%
15.2
%14
.0%
15.7
%3.
8%15
.6%
12.3
%3.
2%30
.0%
19.1
%12
.6%
6.2%
1.4%
27.6
%8.
0%14
.7%
10.1
%Eth
iopi
a0.
0%23
.8%
18.0
%9.
7%12
.8%
14.5
%16
.8%
30.3
%21
.7%
29.7
%18
.4%
27.5
%21
.4%
22.1
%17
.3%
17.9
%26
.3%
17.3
%9.
0%M
adag
asca
r10
.4%
3.7%
1.7%
2.8%
10.4
%13
.9%
3.3%
68.8
%14
.2%
11.4
%13
.2%
12.7
%8.
1%9.
0%1.
1%8.
5%0.
7%7.
2%5.
3%M
alaw
i1.
9%0.
0%9.
8%1.
3%8.
7%13
.9%
2.8%
15.2
%3.
0%2.
5%4.
2%6.
0%2.
6%1.
5%3.
8%8.
8%2.
4%2.
5%2.
7%M
aurit
ius
30.0
%3.
5%15
.6%
1.0%
8.7%
1.3%
3.5%
1.1%
5.9%
4.1%
6.9%
4.5%
2.3%
11.0
%6.
1%7.
4%4.
6%4.
7%2.
2%M
ozam
biqu
e19
.1%
9.9%
14.9
%9.
3%14
.4%
0.0%
0.3%
12.0
%18
.4%
33.4
%15
.6%
7.9%
6.8%
1.5%
5.8%
30.9
%16
.0%
2.7%
4.4%
Tan
zani
a15
.8%
2.9%
25.1
%12
.1%
13.7
%10
.7%
10.4
%17
.5%
16.3
%19
.4%
27.1
%26
.8%
10.2
%25
.4%
7.0%
23.8
%15
.8%
3.3%
13.8
%U
gand
a8.
8%5.
3%5.
2%3.
2%9.
5%3.
2%4.
8%3.
9%8.
0%6.
9%17
.9%
9.0%
10.0
%15
.2%
5.6%
7.8%
11.0
%8.
8%8.
3%Zam
bia
22.4
%0.
6%11
.6%
0.5%
8.7%
2.3%
8.3%
12.3
%0.
8%15
.5%
20.6
%12
.0%
2.6%
2.7%
5.8%
4.6%
11.0
%4.
9%4.
4%Zim
babw
e7.
1%2.
0%12
.2%
2.2%
0.4%
4.1%
12.0
%6.
9%1.
9%1.
8%10
.8%
10.2
%0.
5%2.
2%0.
2%2.
4%2.
0%0.
8%1.
8%R
est o
f Eas
tern
Afric
a21
.3%
5.1%
14.5
%5.
1%7.
0%7.
3%4.
7%16
.9%
5.3%
22.2
%12
.8%
12.3
%6.
1%8.
2%6.
5%9.
4%6.
9%7.
0%6.
8%Bot
swan
a15
.4%
7.7%
16.2
%15
.2%
12.8
%6.
5%5.
0%18
.3%
18.5
%6.
4%22
.7%
26.1
%8.
0%10
.0%
7.8%
21.7
%17
.4%
7.7%
12.2
%Sou
th A
fric
a12
.6%
5.8%
19.0
%8.
3%20
.3%
6.9%
9.6%
14.7
%20
.0%
21.7
%22
.6%
24.0
%8.
8%12
.0%
11.4
%18
.2%
9.4%
12.8
%10
.6%
Res
t of S
outh
Afric
an C
usto
ms
Uni
on1.
2%7.
7%4.
3%4.
1%11
.2%
0.0%
1.9%
7.1%
1.7%
1.7%
13.8
%10
.3%
0.4%
0.9%
1.0%
1.4%
11.7
%1.
6%2.
5%Egy
pt5.
1%4.
3%6.
1%34
.9%
20.2
%2.
3%6.
0%23
.5%
24.2
%12
.5%
1.8%
18.2
%8.
8%15
.8%
5.4%
13.6
%6.
2%8.
8%7.
7%M
oroc
co29
.6%
7.1%
16.9
%5.
9%10
.9%
4.4%
2.8%
18.6
%17
.3%
8.2%
10.8
%23
.1%
4.6%
12.8
%7.
0%18
.3%
10.4
%9.
2%7.
8%Tun
isia
17.3
%6.
0%4.
0%21
.9%
11.5
%6.
6%6.
9%23
.4%
20.1
%25
.5%
15.3
%20
.3%
5.0%
11.4
%6.
9%21
.0%
15.2
%14
.0%
10.6
%R
est o
f Nor
th A
fric
a35
.4%
8.7%
7.0%
18.5
%12
.3%
14.2
%10
.5%
58.0
%18
.3%
24.2
%21
.2%
33.9
%38
.7%
15.6
%4.
1%22
.4%
4.9%
7.7%
6.1%
Nig
eria
15.3
%18
.2%
12.1
%11
.8%
10.4
%13
.3%
11.7
%17
.7%
13.6
%23
.3%
29.3
%15
.9%
8.7%
8.0%
1.0%
13.1
%10
.2%
11.1
%14
.7%
Sen
egal
2.8%
7.0%
11.6
%7.
6%13
.6%
2.8%
10.9
%6.
0%5.
2%5.
3%3.
7%9.
3%17
.5%
12.8
%5.
5%7.
2%4.
2%3.
4%4.
3%R
est o
f Wes
tern
Afric
a7.
2%8.
4%4.
8%9.
3%9.
6%4.
0%13
.6%
9.0%
6.0%
11.7
%6.
1%10
.1%
11.1
%15
.1%
4.0%
12.0
%15
.9%
3.8%
8.3%
Cen
tral
Afric
a6.
5%12
.8%
12.0
%6.
8%0.
0%5.
2%8.
8%9.
0%7.
9%12
.8%
2.2%
15.3
%12
.9%
13.7
%4.
3%14
.9%
9.1%
10.8
%11
.2%
AFRICA
6.2%
5.9%
16.0%
7.6%
12.6%
3.2%
7.6%
13.9%
8.1%
11.6%
14.9%
15.4%
11.9%
11.7%
2.3%
11.8%
9.2%
9.1%
8.5%
Source: Authors’ calculations based on MIRAGE model
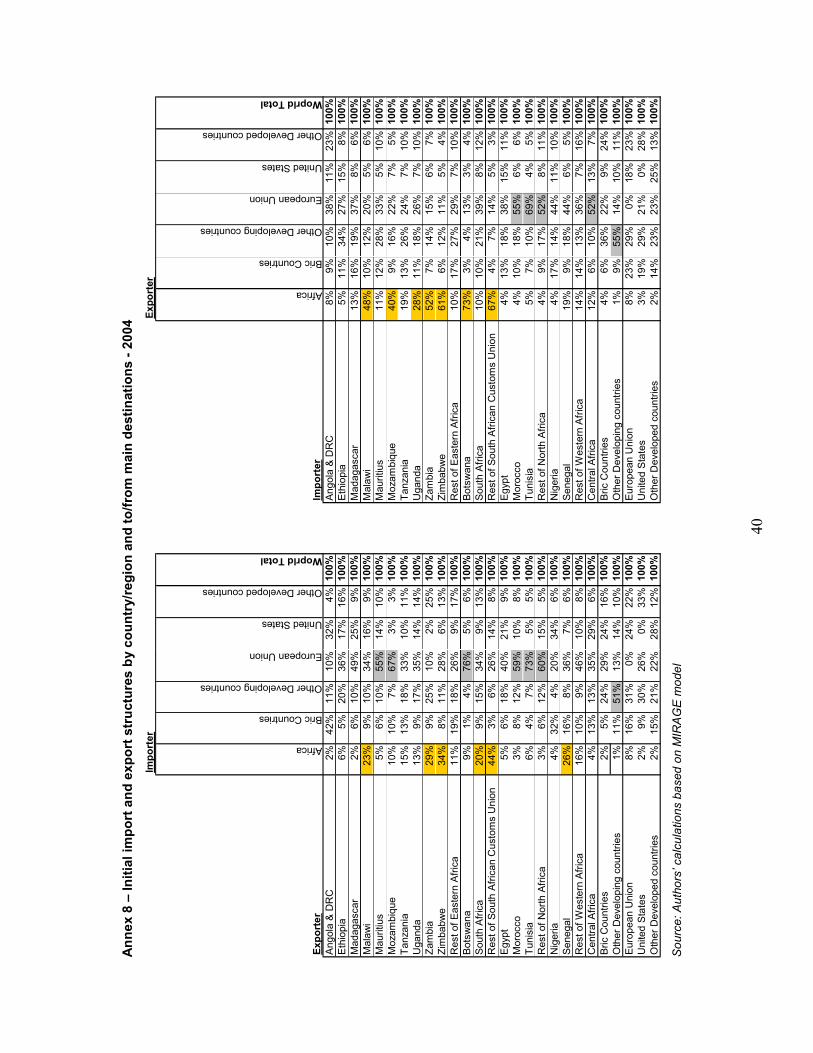
40
Annex
8 – In
itial import and exp
ort structures by co
untry/region and to/from m
ain destinations - 20
04
Exp
orter
Africa
Bric Countries
Other Developing countries
European Union
United States
Other Developed countries
Woprld Total
Importer
Africa
Bric Countries
Other Developing countries
European Union
United States
Other Developed countries
Woprld Total
Ang
ola
& D
RC
2%42
%11
%10
%32
%4%
100%
Ang
ola
& D
RC
8%9%
10%
38%
11%
23%
100%
Eth
iopi
a6%
5%20
%36
%17
%16
%100%
Eth
iopi
a5%
11%
34%
27%
15%
8%100%
Mad
agas
car
2%6%
10%
49%
25%
9%100%
Mad
agas
car
13%
16%
19%
37%
8%6%
100%
Mal
awi
23%
9%10
%34
%16
%9%
100%
Mal
awi
48%
10%
12%
20%
5%6%
100%
Mau
ritiu
s5%
6%10
%55
%14
%10
%100%
Mau
ritiu
s11
%12
%28
%33
%5%
10%
100%
Moz
ambi
que
10%
10%
7%67
%3%
3%100%
Moz
ambi
que
40%
9%16
%22
%7%
5%100%
Tan
zani
a15
%13
%18
%33
%10
%11
%100%
Tan
zani
a19
%13
%26
%24
%7%
10%
100%
Uga
nda
13%
9%17
%35
%14
%14
%100%
Uga
nda
28%
11%
18%
26%
7%10
%100%
Zam
bia
29%
9%25
%10
%2%
25%
100%
Zam
bia
52%
7%14
%15
%6%
7%100%
Zim
babw
e34
%8%
11%
28%
6%13
%100%
Zim
babw
e61
%6%
12%
11%
5%4%
100%
Res
t of E
aste
rn A
fric
a11
%19
%18
%26
%9%
17%
100%
Res
t of E
aste
rn A
fric
a10
%17
%27
%29
%7%
10%
100%
Bot
swan
a9%
1%4%
76%
5%6%
100%
Bot
swan
a73
%3%
4%13
%3%
4%100%
Sou
th A
fric
a20
%9%
15%
34%
9%13
%100%
Sou
th A
fric
a10
%10
%21
%39
%8%
12%
100%
Res
t of S
outh
Afric
an C
usto
ms
Uni
on44
%3%
6%26
%14
%8%
100%
Res
t of S
outh
Afric
an C
usto
ms
Uni
on67
%4%
7%14
%5%
3%100%
Egy
pt5%
6%18
%40
%21
%9%
100%
Egy
pt4%
13%
18%
38%
15%
11%
100%
Mor
occo
3%8%
12%
59%
10%
8%100%
Mor
occo
4%10
%18
%55
%6%
6%100%
Tun
isia
6%4%
7%73
%5%
5%100%
Tun
isia
5%7%
10%
69%
4%5%
100%
Res
t of N
orth
Afric
a3%
6%12
%60
%15
%5%
100%
Res
t of N
orth
Afric
a4%
9%17
%52
%8%
11%
100%
Nig
eria
4%32
%4%
20%
34%
6%100%
Nig
eria
4%17
%14
%44
%11
%10
%100%
Sen
egal
26%
16%
8%36
%7%
6%100%
Sen
egal
19%
9%18
%44
%6%
5%100%
Res
t of W
este
rn A
fric
a16
%10
%9%
46%
10%
8%100%
Res
t of W
este
rn A
fric
a14
%14
%13
%36
%7%
16%
100%
Cen
tral
Afric
a4%
13%
13%
35%
29%
6%100%
Cen
tral
Afric
a12
%6%
10%
52%
13%
7%100%
Bric
Cou
ntrie
s2%
5%24
%29
%24
%16
%100%
Bric
Cou
ntrie
s4%
6%36
%22
%9%
24%
100%
Oth
er D
evel
opin
g co
untrie
s1%
11%
51%
13%
14%
10%
100%
Oth
er D
evel
opin
g co
untrie
s1%
9%55
%14
%10
%11
%100%
Eur
opea
n U
nion
8%16
%31
%0%
24%
22%
100%
Eur
opea
n U
nion
8%23
%29
%0%
18%
23%
100%
Uni
ted
Sta
tes
2%9%
30%
26%
0%33
%100%
Uni
ted
Sta
tes
3%19
%29
%21
%0%
28%
100%
Oth
er D
evel
oped
cou
ntrie
s2%
15%
21%
22%
28%
12%
100%
Oth
er D
evel
oped
cou
ntrie
s2%
14%
23%
23%
25%
13%
100%
Importer
Exp
orter
Source: Authors’ calculations based on MIRAGE model

41
Annex
9 – In
itial e
xport structures by co
untry/region and sector - 20
04
Paddy and processed rice
Wheat
Cereals
Oilseeds
Sugar cane and Sugar beet
Cattle sheep goats and horses
Animal products and wool
Other agricultural products
Milk and dairy products
Meat products
Sugar
Other food products
Agriculture and food products
Forestry
Fishing
Other primary products
Textile wearing apparel and leather products
Petroleum coal products
Mineral and metal products
Other manufactured products
Industrial products
Transport
Other services
Services
Ang
ola
& D
RC
0%0%
0%0%
0%0%
0%0%
0%0%
0%0%
0%2%
0%93
%0%
0%0%
1%97%
1%2%
3%Eth
iopi
a0%
0%0%
5%0%
0%2%
18%
0%1%
1%2%
30%
2%0%
0%4%
0%7%
2%14%
21%
34%
56%
Mad
agas
car
0%0%
0%0%
0%0%
0%13
%0%
0%1%
12%
27%
0%0%
23%
21%
0%1%
6%51%
10%
12%
22%
Mal
awi
0%0%
0%1%
0%0%
0%45
%0%
0%9%
1%56%
0%0%
25%
6%0%
0%5%
37%
4%4%
7%M
aurit
ius
0%0%
0%0%
0%0%
1%0%
0%0%
9%4%
14%
0%0%
15%
24%
0%1%
10%
50%
20%
16%
36%
Moz
ambi
que
0%0%
0%1%
0%0%
0%6%
0%0%
1%5%
14%
1%0%
1%0%
0%54
%19
%76%
4%6%
10%
Tan
zani
a0%
0%0%
1%0%
0%1%
17%
0%0%
1%9%
30%
1%0%
5%4%
0%12
%4%
26%
13%
32%
44%
Uga
nda
0%0%
1%0%
0%0%
1%17
%0%
0%0%
10%
29%
0%0%
40%
2%0%
7%4%
53%
7%12
%19%
Zam
bia
0%0%
1%2%
0%0%
0%11
%0%
0%2%
1%17%
0%0%
4%2%
0%69
%5%
79%
2%3%
4%Zim
babw
e0%
0%0%
0%0%
0%1%
29%
0%0%
3%4%
38%
0%0%
11%
3%0%
26%
11%
51%
3%8%
11%
Res
t of E
aste
rn A
fric
a0%
0%0%
1%0%
2%1%
12%
0%1%
0%6%
24%
1%0%
30%
3%1%
4%7%
45%
9%22
%31%
Bot
swan
a0%
0%0%
0%0%
0%0%
0%0%
1%0%
1%2%
0%0%
71%
2%0%
5%5%
83%
5%10
%15%
Sou
th A
fric
a0%
0%0%
0%0%
0%0%
3%0%
0%0%
4%9%
0%0%
14%
2%2%
28%
31%
77%
5%10
%14%
Res
t of S
outh
Afric
an C
usto
ms
Uni
on0%
0%0%
0%0%
1%0%
1%0%
2%4%
11%
19%
0%1%
17%
12%
0%7%
31%
68%
2%11
%13%
Egy
pt1%
0%0%
0%0%
0%0%
3%0%
0%0%
2%7%
0%0%
3%6%
6%10
%8%
34%
27%
32%
59%
Mor
occo
0%0%
0%0%
0%0%
0%5%
0%0%
0%7%
12%
0%1%
4%19
%1%
3%23
%52%
13%
23%
36%
Tun
isia
0%0%
0%0%
0%0%
0%1%
0%0%
0%6%
8%0%
0%5%
31%
0%4%
26%
66%
12%
15%
26%
Res
t of N
orth
Afric
a0%
0%0%
0%0%
0%0%
0%0%
0%0%
0%0%
0%0%
74%
0%10
%2%
3%89%
3%8%
11%
Nig
eria
0%0%
0%0%
0%0%
0%1%
0%0%
0%0%
1%0%
0%88
%1%
0%0%
1%90%
2%7%
9%Sen
egal
1%0%
0%0%
0%0%
1%4%
0%0%
0%18
%23%
0%3%
2%1%
2%5%
27%
40%
11%
26%
37%
Res
t of W
este
rn A
fric
a0%
0%0%
0%0%
0%0%
27%
0%0%
0%10
%38%
1%0%
15%
1%2%
7%21
%47%
5%9%
14%
Cen
tral
Afric
a0%
0%0%
0%0%
0%0%
6%0%
0%0%
1%7%
5%0%
62%
0%2%
2%9%
79%
3%10
%14%
Bric
cou
ntrie
s0%
0%0%
1%0%
0%0%
1%0%
1%0%
2%5%
0%0%
9%17
%2%
11%
47%
87%
2%6%
8%O
ther
dev
elop
ing
coun
trie
s0%
0%0%
0%0%
0%0%
1%0%
0%0%
3%6%
0%0%
15%
9%3%
8%41
%76%
4%14
%18%
Eur
opea
n U
nion
0%0%
0%0%
0%0%
0%0%
0%0%
0%3%
4%0%
0%1%
3%1%
6%55
%68%
6%21
%28%
Uni
ted
Sta
tes
0%1%
1%1%
0%0%
0%1%
0%1%
0%2%
6%0%
0%1%
2%2%
5%60
%69%
5%20
%25%
Oth
er d
evel
oped
cou
ntrie
s0%
0%0%
0%0%
0%0%
0%0%
1%0%
1%4%
0%0%
6%2%
1%9%
58%
76%
3%17
%21%
Source: Authors’ calculations based on MIRAGE model
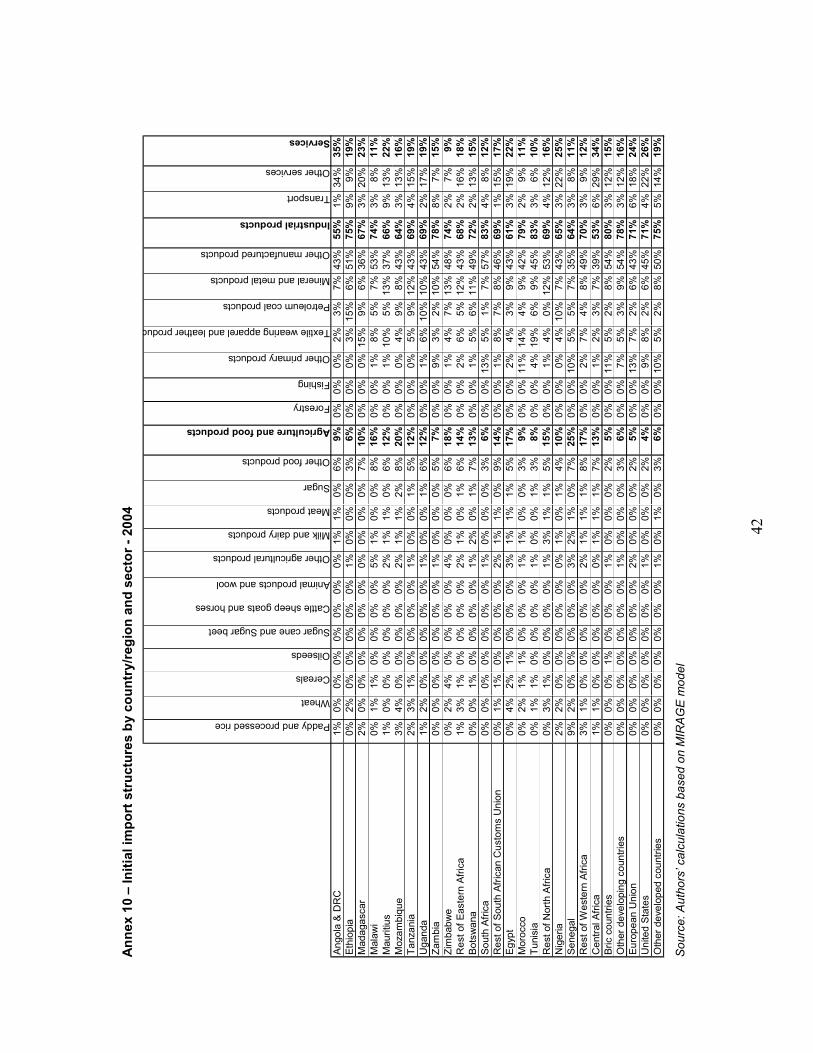
42
Annex
10 – Initial import structures by co
untry/region and sector - 20
04
Paddy and processed rice
Wheat
Cereals
Oilseeds
Sugar cane and Sugar beet
Cattle sheep goats and horses
Animal products and wool
Other agricultural products
Milk and dairy products
Meat products
Sugar
Other food products
Agriculture and food products
Forestry
Fishing
Other primary products
Textile wearing apparel and leather products
Petroleum coal products
Mineral and metal products
Other manufactured products
Industrial products
Transport
Other services
Services
Ang
ola
& D
RC
1%0%
0%0%
0%0%
0%0%
1%1%
0%6%
9%0%
0%0%
2%3%
7%43
%55%
1%34
%35%
Eth
iopi
a0%
2%0%
0%0%
0%0%
1%0%
0%0%
3%6%
0%0%
0%3%
15%
6%51
%75%
9%9%
19%
Mad
agas
car
2%0%
0%0%
0%0%
0%0%
0%0%
0%7%
10%
0%0%
0%15
%9%
6%36
%67%
3%20
%23%
Mal
awi
0%1%
1%0%
0%0%
0%5%
1%0%
0%8%
16%
0%0%
1%8%
5%7%
53%
74%
3%8%
11%
Mau
ritiu
s1%
0%0%
0%0%
0%0%
2%1%
1%0%
6%12%
0%0%
1%10
%5%
13%
37%
66%
9%13
%22%
Moz
ambi
que
3%4%
0%0%
0%0%
0%2%
1%1%
2%8%
20%
0%0%
0%4%
9%8%
43%
64%
3%13
%16%
Tan
zani
a2%
3%1%
0%0%
0%0%
1%0%
0%1%
5%12%
0%0%
0%5%
9%12
%43
%69%
4%15
%19%
Uga
nda
1%2%
0%0%
0%0%
0%1%
0%0%
1%6%
12%
0%0%
1%6%
10%
10%
43%
69%
2%17
%19%
Zam
bia
0%0%
0%0%
0%0%
0%1%
0%0%
0%5%
7%0%
0%9%
3%2%
10%
54%
78%
8%7%
15%
Zim
babw
e0%
2%4%
0%0%
0%0%
4%0%
0%0%
6%18%
0%0%
1%4%
7%13
%48
%74%
2%7%
9%R
est o
f Eas
tern
Afric
a1%
3%1%
0%0%
0%0%
2%1%
0%1%
6%14%
0%0%
2%6%
5%12
%43
%68%
2%16
%18%
Bot
swan
a0%
0%1%
0%0%
0%0%
1%2%
0%1%
7%13%
0%0%
1%5%
6%11
%49
%72%
2%13
%15%
Sou
th A
fric
a0%
0%0%
0%0%
0%0%
1%0%
0%0%
3%6%
0%0%
13%
5%1%
7%57
%83%
4%8%
12%
Res
t of S
outh
Afric
an C
usto
ms
Uni
on0%
1%1%
0%0%
0%0%
2%1%
1%0%
9%14%
0%0%
1%8%
7%8%
46%
69%
1%15
%17%
Egy
pt0%
4%2%
1%0%
0%0%
3%1%
1%1%
5%17%
0%0%
2%4%
3%9%
43%
61%
3%19
%22%
Mor
occo
0%2%
1%1%
0%0%
0%1%
1%0%
0%3%
9%0%
0%11
%14
%4%
9%42
%79%
2%9%
11%
Tun
isia
0%1%
1%0%
0%0%
0%1%
0%0%
1%3%
8%0%
0%4%
19%
6%9%
45%
83%
3%6%
10%
Res
t of N
orth
Afric
a0%
3%1%
0%0%
0%0%
1%3%
1%1%
5%15%
0%0%
1%4%
0%12
%53
%69%
4%12
%16%
Nig
eria
2%2%
0%0%
0%0%
0%0%
1%0%
1%4%
10%
0%0%
0%4%
10%
7%43
%65%
3%22
%25%
Sen
egal
9%2%
0%0%
0%0%
0%3%
2%1%
0%7%
25%
0%0%
10%
5%5%
7%35
%64%
3%8%
11%
Res
t of W
este
rn A
fric
a3%
1%0%
0%0%
0%0%
2%1%
1%1%
8%17%
0%0%
2%7%
4%8%
49%
70%
3%9%
12%
Cen
tral
Afric
a1%
1%0%
0%0%
0%0%
0%1%
1%1%
7%13%
0%0%
1%2%
3%7%
39%
53%
6%29
%34%
Bric
cou
ntrie
s0%
0%0%
1%0%
0%0%
1%0%
0%0%
2%5%
0%0%
11%
5%2%
8%54
%80%
3%12
%15%
Oth
er d
evel
opin
g co
untrie
s0%
0%0%
0%0%
0%0%
1%0%
0%0%
3%6%
0%0%
7%5%
3%9%
54%
78%
3%12
%16%
Eur
opea
n U
nion
0%0%
0%0%
0%0%
0%2%
0%0%
0%2%
5%0%
0%13
%7%
2%6%
43%
71%
6%18
%24%
Uni
ted
Sta
tes
0%0%
0%0%
0%0%
0%1%
0%0%
0%2%
4%0%
0%9%
8%2%
6%45
%71%
4%22
%26%
Oth
er d
evel
oped
cou
ntrie
s0%
0%0%
0%0%
0%0%
1%0%
1%0%
3%6%
0%0%
10%
5%2%
8%50
%75%
5%14
%19%
Source: Authors’ calculations based on MIRAGE model
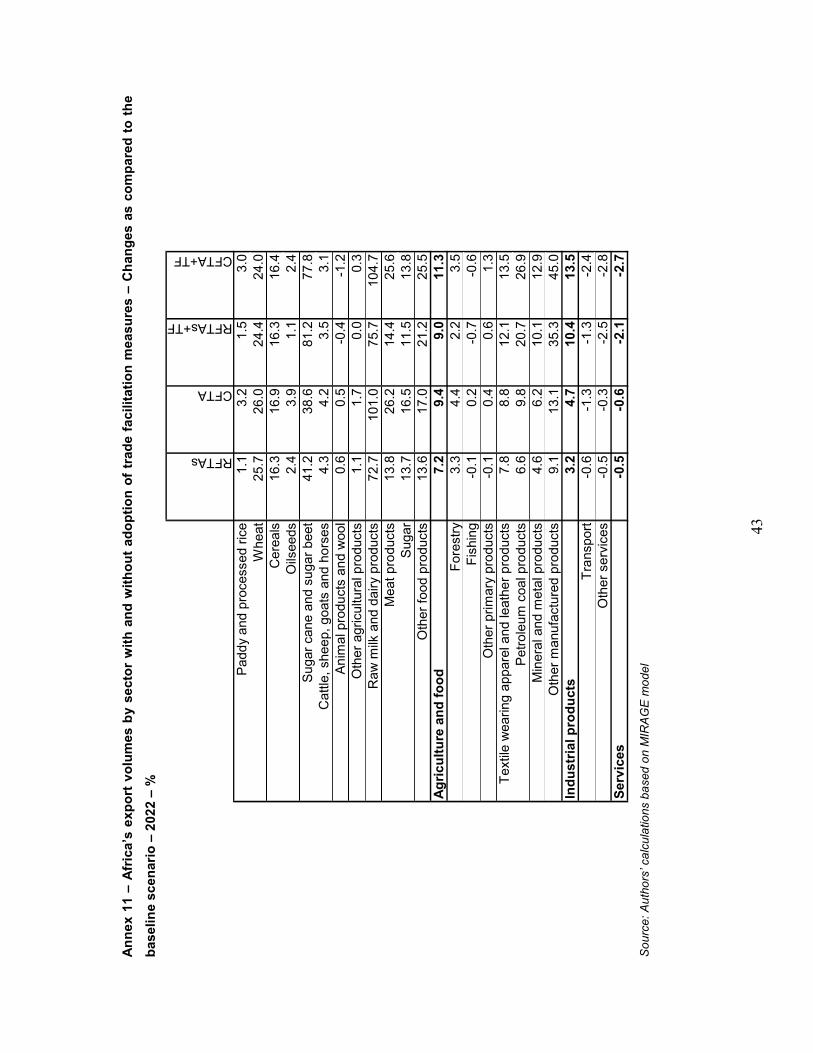
43
Annex
11 – Africa’s ex
port volumes by se
ctor with and w
ithout ad
option of trad
e facilitation m
easu
res – Chan
ges
as co
mpared
to the
baseline sc
enario – 202
2 – %
RFTAs
CFTA
RFTAs+TF
CFTA+TF
Pad
dy a
nd p
roce
ssed
ric
e1.
13.
21.
53.
0W
heat
25.7
26.0
24.4
24.0
Cer
eals
16.3
16.9
16.3
16.4
Oils
eeds
2.4
3.9
1.1
2.4
Sug
ar c
ane
and
suga
r be
et41
.238
.681
.277
.8C
attle
, she
ep, g
oats
and
hor
ses
4.3
4.2
3.5
3.1
Ani
mal
pro
duct
s an
d w
ool
0.6
0.5
-0.4
-1.2
Oth
er a
gric
ultu
ral p
rodu
cts
1.1
1.7
0.0
0.3
Raw
milk
and
dai
ry p
rodu
cts
72.7
101.
075
.710
4.7
Mea
t pro
duct
s13
.826
.214
.425
.6Sug
ar13
.716
.511
.513
.8O
ther
food
pro
duct
s13
.617
.021
.225
.5Agricu
lture and food
7.2
9.4
9.0
11.3
For
estry
3.3
4.4
2.2
3.5
Fis
hing
-0.1
0.2
-0.7
-0.6
Oth
er p
rimar
y pr
oduc
ts-0
.10.
40.
61.
3Tex
tile
wea
ring
appa
rel a
nd le
athe
r pr
oduc
ts7.
88.
812
.113
.5Pet
role
um c
oal p
rodu
cts
6.6
9.8
20.7
26.9
Min
eral
and
met
al p
rodu
cts
4.6
6.2
10.1
12.9
Oth
er m
anuf
actu
red
prod
ucts
9.1
13.1
35.3
45.0
Industrial products
3.2
4.7
10.4
13.5
Tra
nspo
rt-0
.6-1
.3-1
.3-2
.4O
ther
ser
vice
s-0
.5-0
.3-2
.5-2
.8Services
-0.5
-0.6
-2.1
-2.7
Source: Authors’ calculations based on MIRAGE model

44
Annex
12 – Africa’s exports, real inco
me, w
ages
with adoption of trad
e facilitations mea
sures– Chan
ges as co
mpared
to the bas
eline
scen
ario – 202
2 – %
RFTAs+TF
CFTA+TF
RFTAs+TF
CFTA+TF
RFTAs+TF
CFTA+TF
RFTAs+TF
CFTA+TF
RFTAs+TF
CFTA+TF
Ang
ola
& D
RC
3.7
4.8
0.6
0.8
0.84
1.12
1.05
1.46
1.56
1.92
Eth
iopi
a12
.212
.70.
91.
01.
441.
531.
791.
830.
340.
36M
adag
asca
r1.
81.
90.
60.
70.
440.
600.
770.
791.
201.
26M
alaw
i24
.424
.42.
92.
88.
458.
456.
826.
757.
377.
17M
aurit
ius
7.5
7.9
-0.3
-0.1
0.70
0.60
2.35
2.49
1.81
1.80
Moz
ambi
que
17.0
16.4
1.5
1.4
1.76
1.78
3.24
3.14
2.46
2.40
Tan
zani
a32
.634
.51.
41.
52.
312.
332.
402.
703.
844.
17U
gand
a13
.017
.61.
82.
31.
121.
253.
214.
264.
225.
12Zam
bia
41.0
42.4
2.3
2.6
2.64
3.18
4.99
5.29
7.92
7.97
Zim
babw
e29
.129
.34.
24.
215
.95
15.6
012
.10
11.9
711
.53
11.0
7R
est o
f Eas
tern
Afric
a16
.818
.20.
30.
40.
330.
401.
291.
451.
441.
65B
otsw
ana
7.3
7.3
4.4
4.0
3.20
3.56
5.07
4.80
7.69
7.21
Sou
th A
fric
a9.
814
.31.
01.
71.
241.
220.
931.
421.
392.
09R
est o
f Sou
th A
fric
an C
usto
ms
Uni
on32
.432
.110
.910
.94.
254.
619.
989.
9213
.61
13.3
9E
gypt
1.1
4.9
0.1
0.5
-0.0
80.
170.
090.
410.
130.
39M
oroc
co4.
46.
70.
30.
20.
991.
670.
410.
570.
550.
73Tun
isia
10.1
11.2
1.3
1.2
0.79
-0.1
72.
072.
232.
572.
76R
est o
f Nor
th A
fric
a2.
12.
80.
10.
00.
300.
270.
390.
450.
410.
42N
iger
ia2.
64.
50.
20.
10.
190.
150.
760.
930.
510.
42S
eneg
al20
.821
.51.
61.
60.
060.
212.
382.
611.
271.
74R
est o
f Wes
tern
Afric
a18
.220
.22.
02.
20.
150.
514.
625.
264.
475.
23C
entral
Afric
a6.
111
.50.
50.
60.
611.
331.
011.
661.
041.
80AFRICA
7.9
10.2
0.8
1.0
1.81
1.94
2.73
2.93
3.07
3.23
Ski
lled
real
wag
esE
xpor
tsR
eal I
ncom
eU
nski
lled
real
wag
es
in a
gric
ultu
re
Uns
kille
d re
al w
ages
in
non
agr
icul
tura
l se
ctor
s
Source: Authors’ calculations based on MIRAGE model
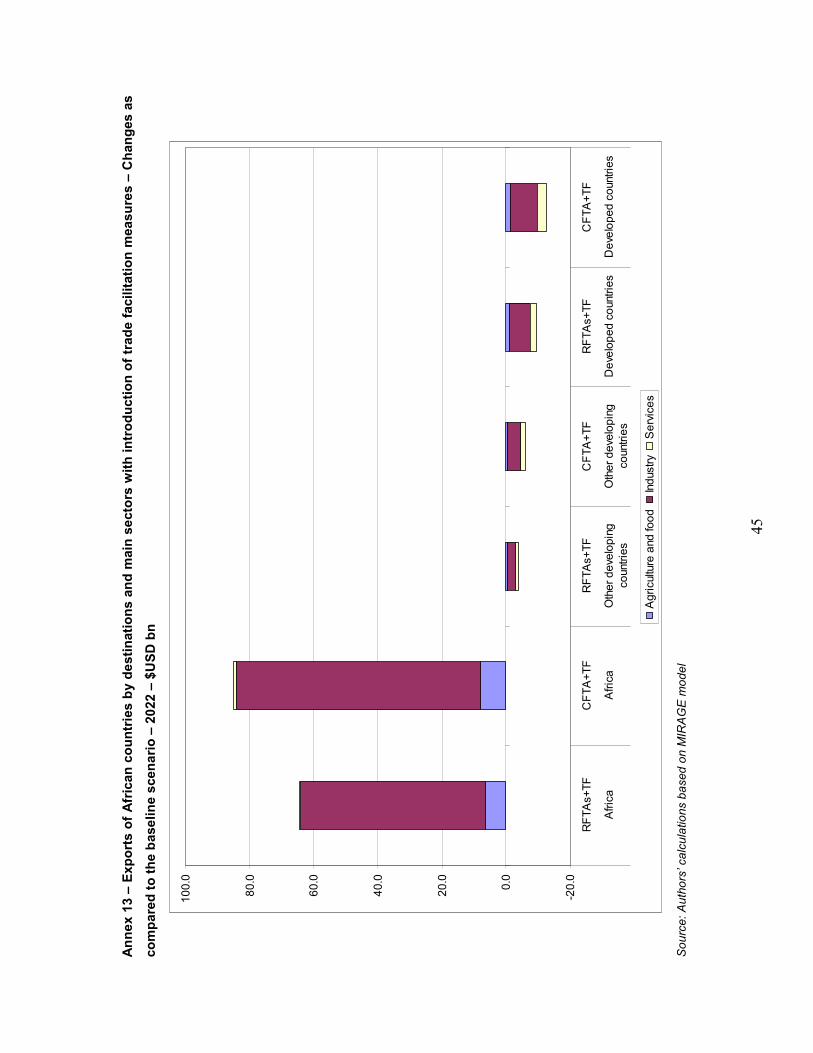
45
Annex
13 – Exp
orts of African
countries by des
tinations an
d m
ain sec
tors with in
troduction of trad
e facilitation m
easu
res – Chan
ges as
compared
to the baseline scen
ario – 202
2 – $U
SD bn
-20.
0
0.0
20.0
40.0
60.0
80.0
100.
0
RFTA
s+TF
CFTA
+TF
RFTA
s+TF
CFTA
+TF
RFTA
s+TF
CFTA
+TF
Afri
caA
frica
Oth
er d
evel
opin
gco
untri
esO
ther
dev
elop
ing
coun
tries
Dev
elop
ed c
ount
ries
Dev
elop
ed c
ount
ries
Agr
icul
ture
and
food
Indu
stry
Ser
vice
s
Source: Authors’ calculations based on MIRAGE model

46
Annex
14 – Africa’s exports with and w
ithout ad
option of trad
e facilitations (TF) measu
res in addition to C
CU reform
s – Chan
ges as
compared
to the baseline scen
ario – 202
2 – %
COMESA CET - 2%
COMESA CET - 2% + TF
COMESA CET - 5%
COMESA CET - 5% + TF
ECOWAS CET - 2%
ECOWAS CET - 2% + TF
ECOWAS CET - 5%
ECOWAS CET - 5% + TF
Ang
ola
& D
RC
4.2
7.4
4.0
7.2
4.6
7.9
4.5
7.9
Eth
iopi
a10
.317
.19.
016
.28.
815
.77.
815
.2M
adag
asca
r1.
32.
61.
12.
30.
82.
10.
72.
0M
alaw
i13
.224
.613
.124
.713
.124
.613
.024
.8M
aurit
ius
14.8
17.7
12.3
15.3
16.6
19.5
13.1
16.3
Moz
ambi
que
11.6
18.4
11.0
17.9
10.5
17.6
10.2
17.3
Tan
zani
a18
.935
.517
.934
.818
.235
.017
.834
.8U
gand
a6.
718
.96.
719
.08.
321
.08.
421
.1Zam
bia
20.4
44.4
20.1
44.1
21.1
45.3
20.9
45.1
Zim
babw
e18
.332
.418
.032
.218
.633
.018
.432
.8R
est o
f Eas
tern
Afric
a19
.930
.016
.827
.420
.030
.417
.127
.9Bot
swan
a0.
07.
20.
07.
20.
07.
20.
07.
2Sou
th A
fric
a4.
413
.94.
113
.74.
213
.83.
913
.7R
est o
f Sou
th A
fric
an C
usto
ms
Uni
on2.
031
.91.
931
.91.
831
.81.
831
.8Egy
pt6.
48.
45.
67.
76.
99.
06.
38.
4M
oroc
co22
.224
.018
.420
.321
.523
.417
.619
.5Tun
isia
21.9
25.8
18.1
22.1
20.2
24.3
17.4
21.6
Res
t of N
orth
Afric
a5.
46.
24.
55.
44.
65.
53.
94.
8N
iger
ia6.
18.
15.
27.
36.
78.
85.
88.
0Sen
egal
8.3
22.7
7.9
22.4
5.9
20.5
6.0
20.7
Res
t of W
este
rn A
fric
a10
.021
.59.
721
.48.
219
.98.
220
.1C
entral
Afric
a8.
413
.77.
813
.29.
114
.68.
714
.3AFRICA
8.5
14.2
7.4
13.3
8.2
14.1
7.3
13.3
Source: Authors’ calculations based on MIRAGE model
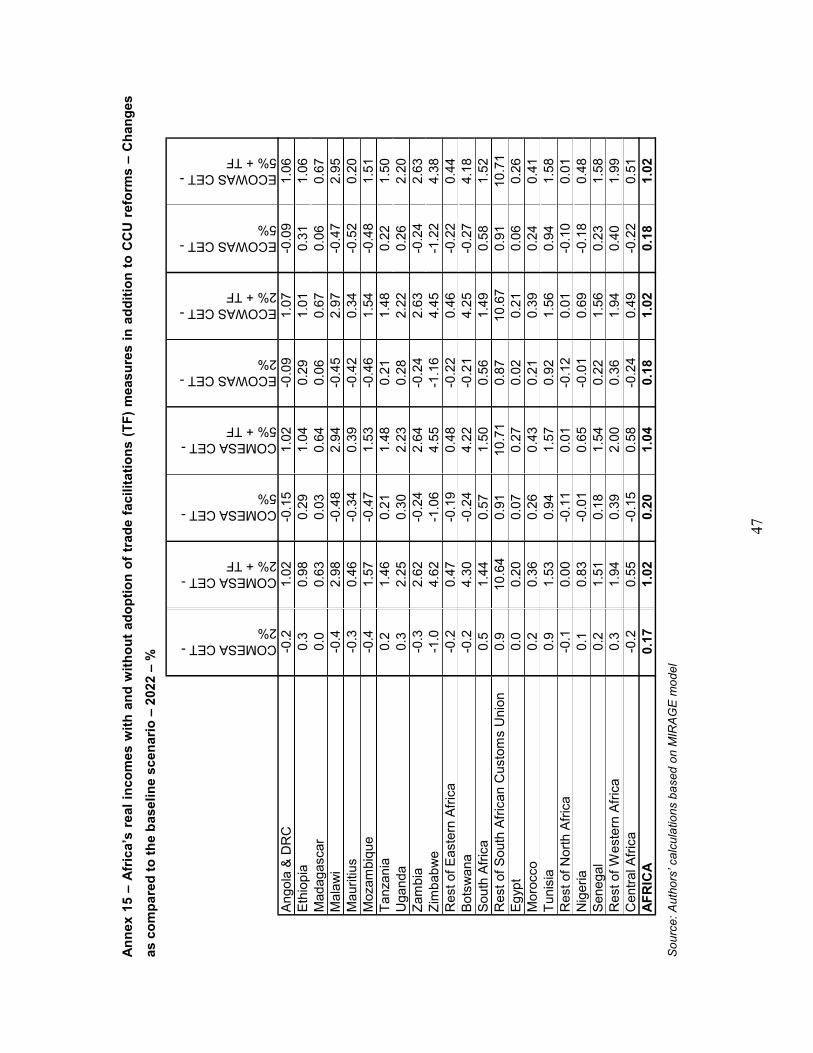
47
Annex
15 – Africa’s real inco
mes w
ith and w
ithout ad
option of trad
e facilitations (TF) measu
res in addition to CCU reform
s – Chan
ges
as compared
to the baseline sc
enario – 2022 – % COMESA CET -
2%
COMESA CET - 2% + TF
COMESA CET - 5%
COMESA CET - 5% + TF
ECOWAS CET - 2%
ECOWAS CET - 2% + TF
ECOWAS CET - 5%
ECOWAS CET - 5% + TF
Ang
ola
& D
RC
-0.2
1.02
-0.1
51.
02-0
.09
1.07
-0.0
91.
06Eth
iopi
a0.
30.
980.
291.
040.
291.
010.
311.
06M
adag
asca
r0.
00.
630.
030.
640.
060.
670.
060.
67M
alaw
i-0
.42.
98-0
.48
2.94
-0.4
52.
97-0
.47
2.95
Mau
ritiu
s-0
.30.
46-0
.34
0.39
-0.4
20.
34-0
.52
0.20
Moz
ambi
que
-0.4
1.57
-0.4
71.
53-0
.46
1.54
-0.4
81.
51Tan
zani
a0.
21.
460.
211.
480.
211.
480.
221.
50U
gand
a0.
32.
250.
302.
230.
282.
220.
262.
20Zam
bia
-0.3
2.62
-0.2
42.
64-0
.24
2.63
-0.2
42.
63Zim
babw
e-1
.04.
62-1
.06
4.55
-1.1
64.
45-1
.22
4.38
Res
t of E
aste
rn A
fric
a-0
.20.
47-0
.19
0.48
-0.2
20.
46-0
.22
0.44
Bot
swan
a-0
.24.
30-0
.24
4.22
-0.2
14.
25-0
.27
4.18
Sou
th A
fric
a0.
51.
440.
571.
500.
561.
490.
581.
52R
est o
f Sou
th A
fric
an C
usto
ms
Uni
on0.
910
.64
0.91
10.7
10.
8710
.67
0.91
10.7
1Egy
pt0.
00.
200.
070.
270.
020.
210.
060.
26M
oroc
co0.
20.
360.
260.
430.
210.
390.
240.
41Tun
isia
0.9
1.53
0.94
1.57
0.92
1.56
0.94
1.58
Res
t of N
orth
Afric
a-0
.10.
00-0
.11
0.01
-0.1
20.
01-0
.10
0.01
Nig
eria
0.1
0.83
-0.0
10.
65-0
.01
0.69
-0.1
80.
48Sen
egal
0.2
1.51
0.18
1.54
0.22
1.56
0.23
1.58
Res
t of W
este
rn A
fric
a0.
31.
940.
392.
000.
361.
940.
401.
99C
entral
Afric
a-0
.20.
55-0
.15
0.58
-0.2
40.
49-0
.22
0.51
AFRICA
0.17
1.02
0.20
1.04
0.18
1.02
0.18
1.02
Source: Authors’ calculations based on MIRAGE model

48
Annex 16 – 30 most common sensitive products for African countries, depending on CET
structure and share of products designed as sensitive
HS6 Code HS6 Label
Share of African countries for which the product line is considered as
sensitive
852520TRANSMISSION APPARATUS INCORPORATING RECEPTION APPARATUS, FOR RADIO-TELEPHONY, RADIO-TELEGRAPHY, RADIO-BROADCASTING OR TELEVISION
75.6%
271000
PETROLEUM OILS AND OILS OBTAINED FROM BITUMINOUS MINERALS (EXCL, CRUDE); PREPARATIONS CONTAINING >= 70 % BY WEIGHT OF PETROLEUM OILS OR OF OILS OBTAINED FROM BITUMINOUS MINERALS, THESE OILS BEING THE BASIC CONSTITUENTS OF THE PREPARATIONS N,E,S,
66.7%
690890
GLAZED CERAMIC FLAGS AND PAVING, HEARTH OR WALL TILES (EXCL. OF SILICEOUS FOSSIL MEALS OR SIMILAR SILICEOUS EARTHS, REFRACTORY CERAMIC GOODS, TILES MADE INTO STANDS, ORNAMENTAL ARTICLES AND TILES SPECIFICALLY MANUFACTURED FOR STOVES)
66.7%
840999PARTS SUITABLE FOR USE SOLELY OR PRINCIPALLY WITH COMPRESSION-IGNITION INTERNAL COMBUSTION PISTON ENGINE, N.E.S.
66.7%
853690
ELECTRICAL APPARATUS FOR SWITCHING ELECTRICAL CIRCUITS, OR FOR MAKING CONNECTIONS TO OR IN ELECTRICAL CIRCUITS, FOR A VOLTAGE <= 1.000 V (EXCL. FUSES, AUTOMATIC CIRCUIT BREAKERS AND OTHER APPARATUS FOR PROTECTING ELECTRICAL CIRCUITS, RELAYS AND OTHER SWIT
66.7%
100190 WHEAT AND MESLIN (EXCL. DURUM WHEAT) 60.0%
170199CANE OR BEET SUGAR AND CHEMICALLY PURE SUCROSE, IN SOLID FORM (EXCL. CANE AND BEET SUGAR CONTAINING ADDED FLAVOURING OR COLOURING AND RAW SUGAR)
60.0%
847330PARTS AND ACCESSORIES OF AUTOMATIC DATA PROCESSING MACHINES OR FOR OTHER MACHINES OF HEADING 8471, N.E.S.
57.8%
870423
MOTOR VEHICLES FOR THE TRANSPORT OF GOODS, WITH COMPRESSION-IGNITION INTERNAL COMBUSTION PISTON ENGINE 'DIESEL OR SEMI-DIESEL' OF A GROSS VEHICLE WEIGHT > 20 TONNES (EXCL. DUMPERS FOR OFF-HIGHWAY USE OF SUBHEADING 8704.10 AND SPECIAL PURPOSE MOTOR VEHICLE
57.8%
151190PALM OIL AND ITS FRACTIONS, WHETHER OR NOT REFINED (EXCL. CHEMICALLY MODIFIED AND CRUDE)
55.6%
401120NEW PNEUMATIC TYRES, OF RUBBER, OF A KIND USED FOR BUSES AND LORRIES (EXCL. TYPRES WITH LUG, CORNER OR SIMILAR TREADS)
53.3%
870120 ROAD TRACTORS FOR SEMI-TRAILERS 53.3%
520852PLAIN WOVEN FABRICS OF COTTON, CONTAINING >= 85% COTTON BY WEIGHT AND WEIGHING > 100 G TO 200 G/Mª, PRINTED
51.1%
870899
PARTS AND ACCESSORIES, FOR TRACTORS, MOTOR VEHICLES FOR THE TRANSPORT OF TEN OR MORE PERSONS, MOTOR CARS AND OTHER MOTOR VEHICLES PRINCIPALLY DESIGNED FOR THE TRANSPORT OF PERSONS, MOTOR VEHICLES FOR THE TRANSPORT OF GOODS AND SPECIAL PURPOSE MOTOR VEHICL
51.1%
110100 WHEAT OR MESLIN FLOUR 48.9%240220 CIGARETTES, CONTAINING TOBACCO 48.9%
721420BARS AND RODS, OF IRON OR NON-ALLOY STEEL, WITH INDENTATIONS, RIBS, GROVES OR OTHER DEFORMATIONS PRODUCED DURING THE ROLLING PROCESS
48.9%
730890
STRUCTURES AND PARTS OF STRUCTURES, OF IRON OR STEEL, N.E.S. (EXCL. BRIDGES AND BRIDGE-SECTIONS, TOWERS AND LATTICE MASTS, DOORS AND WINDOWS AND THEIR FRAMES, THRESHOLDS FOR DOORS, PROPS AND SIMILAR EQUIPMENT FOR SCAFFOLDING, SHUTTERING, PROPPING OR PIT-P
48.9%
150790SOYA-BEAN OIL AND ITS FRACTIONS, WHETHER OR NOT REFINED (EXCL. CHEMICALLY MODIFIED AND CRUDE)
46.7%
252329 PORTLAND CEMENT (EXCL. WHITE, WHETHER OR NOT ARTIFICIALLY COLOURED) 46.7%
854459ELECTRIC CONDUCTORS, FOR A VOLTAGE > 80 V BUT <= 1.000 V, INSULATED, NOT FITTED WITH CONNECTORS, N.E.S.
46.7%
870323
MOTOR CARS AND OTHER MOTOR VEHICLES PRINCIPALLY DESIGNED FOR THE TRANSPORT OF PERSONS, INCL. STATION WAGONS AND RACING CARS, WITH SPARK-IGNITION INTERNAL COMBUSTION RECIPROCATING PISTON ENGINE OF A CYLINDER CAPACITY > 1.500 CMª BUT <= 3.000 CMª (EXCL. VEH
46.7%
240120 TOBACCO, PARTLY OR WHOLLY STEMMED/STRIPPED, OTHERWISE UNMANUFACTURED 44.4%
853890
PARTS SUITABLE FOR USE SOLELY OR PRINCIPALLY WITH THE APPARATUS OF HEADING 8535, 8536 OR 8537, N.E.S. (EXCL. BOARDS, PANELS, CONSOLES, DESKS, CABINETS AND OTHER BASES FOR THE GOODS OF HEADING 8537, NOT EQUIPPED WITH THEIR APPARATUS)
44.4%
080810 FRESH APPLES 42.2%
160413PREPARED OR PRESERVED SARDINES, SARDINELLA AND BRISLING OR SPRATS, WHOLE OR IN PIECES (EXCL. MINCED)
42.2%
841480
AIR PUMPS, AIR OR OTHER GAS COMPRESSORS AND VENTILATING OR RECYCLING HOODS INCORPORATING A FAN, WHETHER OR NOT FITTED WITH FILTERS, HAVING A MAXIMUM HORIZONTAL SIDE > 120 CM (EXCL. VACUUM PUMPS, HAND- OR FOOT-OPERATED AIR PUMPS, COMPRESSORS FOR REFRIGERAT
42.2%
870410 DUMPERS FOR OFF-HIGHWAY USE 42.2%020230 FROZEN, BONELESS MEAT OF BOVINE ANIMALS 40.0%071310 DRIED, SHELLED PEAS 'PISUM SATIVUM', WHETHER OR NOT SKINNED OR SPLIT 40.0%
COMESA CET - 2 % of sensitive product lines

49
HS6 Code HS6 Label
Share of African countries for which the product line is considered as
sensitive
853690
ELECTRICAL APPARATUS FOR SWITCHING ELECTRICAL CIRCUITS, OR FOR MAKING CONNECTIONS TO OR IN ELECTRICAL CIRCUITS, FOR A VOLTAGE <= 1.000 V (EXCL. FUSES, AUTOMATIC CIRCUIT BREAKERS AND OTHER APPARATUS FOR PROTECTING ELECTRICAL CIRCUITS, RELAYS AND OTHER SWIT
88.9%
690890
GLAZED CERAMIC FLAGS AND PAVING, HEARTH OR WALL TILES (EXCL. OF SILICEOUS FOSSIL MEALS OR SIMILAR SILICEOUS EARTHS, REFRACTORY CERAMIC GOODS, TILES MADE INTO STANDS, ORNAMENTAL ARTICLES AND TILES SPECIFICALLY MANUFACTURED FOR STOVES)
82.2%
870423
MOTOR VEHICLES FOR THE TRANSPORT OF GOODS, WITH COMPRESSION-IGNITION INTERNAL COMBUSTION PISTON ENGINE 'DIESEL OR SEMI-DIESEL' OF A GROSS VEHICLE WEIGHT > 20 TONNES (EXCL. DUMPERS FOR OFF-HIGHWAY USE OF SUBHEADING 8704.10 AND SPECIAL PURPOSE MOTOR VEHICLE
82.2%
852520TRANSMISSION APPARATUS INCORPORATING RECEPTION APPARATUS, FOR RADIO-TELEPHONY, RADIO-TELEGRAPHY, RADIO-BROADCASTING OR TELEVISION
80.0%
870120 ROAD TRACTORS FOR SEMI-TRAILERS 80.0%
401120NEW PNEUMATIC TYRES, OF RUBBER, OF A KIND USED FOR BUSES AND LORRIES (EXCL. TYPRES WITH LUG, CORNER OR SIMILAR TREADS)
77.8%
840999PARTS SUITABLE FOR USE SOLELY OR PRINCIPALLY WITH COMPRESSION-IGNITION INTERNAL COMBUSTION PISTON ENGINE, N.E.S.
77.8%
100190 WHEAT AND MESLIN (EXCL. DURUM WHEAT) 73.3%
170199CANE OR BEET SUGAR AND CHEMICALLY PURE SUCROSE, IN SOLID FORM (EXCL. CANE AND BEET SUGAR CONTAINING ADDED FLAVOURING OR COLOURING AND RAW SUGAR)
73.3%
721420BARS AND RODS, OF IRON OR NON-ALLOY STEEL, WITH INDENTATIONS, RIBS, GROVES OR OTHER DEFORMATIONS PRODUCED DURING THE ROLLING PROCESS
73.3%
870323
MOTOR CARS AND OTHER MOTOR VEHICLES PRINCIPALLY DESIGNED FOR THE TRANSPORT OF PERSONS, INCL. STATION WAGONS AND RACING CARS, WITH SPARK-IGNITION INTERNAL COMBUSTION RECIPROCATING PISTON ENGINE OF A CYLINDER CAPACITY > 1.500 CMª BUT <= 3.000 CMª (EXCL. VEH
73.3%
271000
PETROLEUM OILS AND OILS OBTAINED FROM BITUMINOUS MINERALS (EXCL, CRUDE); PREPARATIONS CONTAINING >= 70 % BY WEIGHT OF PETROLEUM OILS OR OF OILS OBTAINED FROM BITUMINOUS MINERALS, THESE OILS BEING THE BASIC CONSTITUENTS OF THE PREPARATIONS N,E,S,
71.1%
071310 DRIED, SHELLED PEAS 'PISUM SATIVUM', WHETHER OR NOT SKINNED OR SPLIT 68.9%
170490SUGAR CONFECTIONERY NOT CONTAINING COCOA, INCL. WHITE CHOCOLATE (EXCL. CHEWING GUM)
68.9%
630900
WORN CLOTHING AND CLOTHING ACCESSORIES, BLANKETS AND TRAVELLING RUGS, HOUSEHOLD LINEN AND ARTICLES FOR INTERIOR FURNISHING, OF ALL TYPES OF TEXTILE MATERIALS, INCL. ALL TYPES OF FOOTWEAR AND HEADGEAR, SHOWING SIGNS OF APPRECIABLE WEAR AND PRESENTED IN BUL
68.9%
150790SOYA-BEAN OIL AND ITS FRACTIONS, WHETHER OR NOT REFINED (EXCL. CHEMICALLY MODIFIED AND CRUDE)
66.7%
240220 CIGARETTES, CONTAINING TOBACCO 66.7%
853890
PARTS SUITABLE FOR USE SOLELY OR PRINCIPALLY WITH THE APPARATUS OF HEADING 8535, 8536 OR 8537, N.E.S. (EXCL. BOARDS, PANELS, CONSOLES, DESKS, CABINETS AND OTHER BASES FOR THE GOODS OF HEADING 8537, NOT EQUIPPED WITH THEIR APPARATUS)
66.7%
854459ELECTRIC CONDUCTORS, FOR A VOLTAGE > 80 V BUT <= 1.000 V, INSULATED, NOT FITTED WITH CONNECTORS, N.E.S.
66.7%
870333
MOTOR CARS AND OTHER MOTOR VEHICLES PRINCIPALLY DESIGNED FOR THE TRANSPORT OF PERSONS, INCL. STATION WAGONS AND RACING CARS, WITH COMPRESSION-IGNITION INTERNAL COMBUSTION PISTON ENGINE 'DIESEL OR SEMI-DIESEL' OF A CYLINDER CAPACITY > 2.500 CMª (EXCL. VEHI
66.7%
080810 FRESH APPLES 64.4%110100 WHEAT OR MESLIN FLOUR 64.4%
401110NEW PNEUMATIC TYRES, OF RUBBER, OF A KIND USED FOR MOTOR CARS, INCL. STATION WAGONS AND RACING CARS
64.4%
840991PARTS SUITABLE FOR USE SOLELY OR PRINCIPALLY WITH SPARK-IGNITION INTERNAL COMBUSTION PISTON ENGINE, N.E.S.
64.4%
841480
AIR PUMPS, AIR OR OTHER GAS COMPRESSORS AND VENTILATING OR RECYCLING HOODS INCORPORATING A FAN, WHETHER OR NOT FITTED WITH FILTERS, HAVING A MAXIMUM HORIZONTAL SIDE > 120 CM (EXCL. VACUUM PUMPS, HAND- OR FOOT-OPERATED AIR PUMPS, COMPRESSORS FOR REFRIGERAT
64.4%
843149 PARTS OF MACHINERY OF HEADING 8426, 8429 AND 8430, N.E.S. 64.4%
847330PARTS AND ACCESSORIES OF AUTOMATIC DATA PROCESSING MACHINES OR FOR OTHER MACHINES OF HEADING 8471, N.E.S.
64.4%
852439DISCS, RECORDED, FOR LASER READING SYSTEMS, FOR REPRODUCING SOUND AND IMAGE OR IMAGE ONLY
64.4%
853669 PLUGS AND SOCKETS FOR A VOLTAGE <= 1.000 V (EXCL. LAMP-HOLDERS) 64.4%
151190PALM OIL AND ITS FRACTIONS, WHETHER OR NOT REFINED (EXCL. CHEMICALLY MODIFIED AND CRUDE)
62.2%
COMESA CET - 5 % of sensitive product lines

50
HS6 Code HS6 Label
Share of African countries for which the product line is considered as
sensitive
340111
SOAP AND ORGANIC SURFACE-ACTIVE PRODUCTS AND PREPARATIONS, IN THE FORM OF BARS, CAKES, MOULDED PIECES OR SHAPES, AND PAPER, WADDING, FELT AND NONWOVENS, IMPREGNATED, COATED OR COVERED WITH SOAP OR DETERGENT, FOR TOILET USE, INCL. MEDICATED PRODUCTS
84.4%
392490HOUSEHOLD ARTICLES AND TOILET ARTICLES, OF PLASTICS (EXCL. TABLEWARE, KITCHENWARE, BATHS, SHOWER-BATHS, WASH-BASINS, BIDETS, LAVATORY PANS, SEATS AND COVERS, FLUSHING CISTERNS AND SIMILAR SANITARY WARE)
77.8%
852812TELEVISION RECEIVERS, COLOUR, WHETHER OR NOT INCORPORATING RADIO-BROADCAST RECEIVERS OR SOUND OR VIDEO RECORDING OR REPRODUCING APPARATUS
77.8%
730890
STRUCTURES AND PARTS OF STRUCTURES, OF IRON OR STEEL, N.E.S. (EXCL. BRIDGES AND BRIDGE-SECTIONS, TOWERS AND LATTICE MASTS, DOORS AND WINDOWS AND THEIR FRAMES, THRESHOLDS FOR DOORS, PROPS AND SIMILAR EQUIPMENT FOR SCAFFOLDING, SHUTTERING, PROPPING OR PIT-P
73.3%
210690 FOOD PREPARATIONS, N.E.S. 66.7%
271000
PETROLEUM OILS AND OILS OBTAINED FROM BITUMINOUS MINERALS (EXCL, CRUDE); PREPARATIONS CONTAINING >= 70 % BY WEIGHT OF PETROLEUM OILS OR OF OILS OBTAINED FROM BITUMINOUS MINERALS, THESE OILS BEING THE BASIC CONSTITUENTS OF THE PREPARATIONS N,E,S,
66.7%
401120NEW PNEUMATIC TYRES, OF RUBBER, OF A KIND USED FOR BUSES AND LORRIES (EXCL. TYPRES WITH LUG, CORNER OR SIMILAR TREADS)
66.7%
870333
MOTOR CARS AND OTHER MOTOR VEHICLES PRINCIPALLY DESIGNED FOR THE TRANSPORT OF PERSONS, INCL. STATION WAGONS AND RACING CARS, WITH COMPRESSION-IGNITION INTERNAL COMBUSTION PISTON ENGINE 'DIESEL OR SEMI-DIESEL' OF A CYLINDER CAPACITY > 2.500 CMª (EXCL. VEHI
66.7%
870421
MOTOR VEHICLES FOR THE TRANSPORT OF GOODS, WITH COMPRESSION-IGNITION INTERNAL COMBUSTION PISTON ENGINE 'DIESEL OR SEMI-DIESEL' OF A GROSS VEHICLE WEIGHT <= 5 TONNES (EXCL. DUMPERS FOR OFF-HIGHWAY USE OF SUBHEADING 8704.10 AND SPECIAL PURPOSE MOTOR VEHICLE
66.7%
630900
WORN CLOTHING AND CLOTHING ACCESSORIES, BLANKETS AND TRAVELLING RUGS, HOUSEHOLD LINEN AND ARTICLES FOR INTERIOR FURNISHING, OF ALL TYPES OF TEXTILE MATERIALS, INCL. ALL TYPES OF FOOTWEAR AND HEADGEAR, SHOWING SIGNS OF APPRECIABLE WEAR AND PRESENTED IN BUL
64.4%
871120MOTOR-CYCLES, INCL. MOPEDS, WITH RECIPROCATING INTERNAL COMBUSTION PISTON ENGINE OF A CYLINDER CAPACITY > 50 CMª BUT <= 250 CMª
60.0%
940360 WOODEN FURNITURE (EXCL. FOR OFFICES, KITCHENS AND BEDROOMS, AND SEATS) 60.0%
870323
MOTOR CARS AND OTHER MOTOR VEHICLES PRINCIPALLY DESIGNED FOR THE TRANSPORT OF PERSONS, INCL. STATION WAGONS AND RACING CARS, WITH SPARK-IGNITION INTERNAL COMBUSTION RECIPROCATING PISTON ENGINE OF A CYLINDER CAPACITY > 1.500 CMª BUT <= 3.000 CMª (EXCL. VEH
57.8%
870899
PARTS AND ACCESSORIES, FOR TRACTORS, MOTOR VEHICLES FOR THE TRANSPORT OF TEN OR MORE PERSONS, MOTOR CARS AND OTHER MOTOR VEHICLES PRINCIPALLY DESIGNED FOR THE TRANSPORT OF PERSONS, MOTOR VEHICLES FOR THE TRANSPORT OF GOODS AND SPECIAL PURPOSE MOTOR VEHICL
57.8%
240220 CIGARETTES, CONTAINING TOBACCO 55.6%
170490SUGAR CONFECTIONERY NOT CONTAINING COCOA, INCL. WHITE CHOCOLATE (EXCL. CHEWING GUM)
53.3%
392390
ARTICLES FOR THE CONVEYANCE OR PACKAGING OF GOODS, OF PLASTICS (EXCL. BOXES, CASES, CRATES AND SIMILAR ARTICLES; SACKS AND BAGS, INCL. CONES; CARBOYS, BOTTLES, FLASKS AND SIMILAR ARTICLES; SPPOLS, SPINDLES, BOBBINS AND SIMILAR SUPPORTS; STOPPERS, LIDS, CA
53.3%
854459ELECTRIC CONDUCTORS, FOR A VOLTAGE > 80 V BUT <= 1.000 V, INSULATED, NOT FITTED WITH CONNECTORS, N.E.S.
53.3%
870210MOTOR VEHICLES FOR THE TRANSPORT OF >= 10 PERSONS, INCL. DRIVER, WITH COMPRESSION-IGNITION INTERNAL COMBUSTION PISTON ENGINE 'DIESEL OR SEMI-DIESEL'
53.3%
330499
BEAUTY OR MAKE-UP PREPARATIONS AND PREPARATIONS FOR THE CARE OF THE SKIN (OTHER THAN MEDICAMENTS), INCL. SUNSCREEN OR SUNTAN PREPARATIONS (EXCL. MEDICAMENTS, LIP AND EYE MAKE-UP PREPARATIONS, MANICURE OR PEDICURE PREPARATIONS AND MAKE-UP OR SKIN CARE POWD
51.1%
392690ARTICLES OF PLASTICS AND ARTICLES OF OTHER MATERIALS OF HEADING 3901 TO 3914, N.E.S
51.1%
190190
MALT EXTRACT; FOOD PREPARATIONS OF FLOUR, GROATS, MEAL, STARCH OR MALT EXTRACT, NOT CONTAINING COCOA OR CONTAINING < 40% BY WEIGHT OF COCOA CALCULATED ON A TOTALLY DEFATTED BASIS, N.E.S. AND FOOD PREPARATIONS OF MILK, CREAM, BUTTER MILK, SOUR MILK, SOUR C
48.9%
200290TOMATOES, PREPARED OR PRESERVED OTHERWISE THAN BY VINEGAR OR ACETIC ACID (EXCL. WHOLE OR IN PIECES)
48.9%
690890
GLAZED CERAMIC FLAGS AND PAVING, HEARTH OR WALL TILES (EXCL. OF SILICEOUS FOSSIL MEALS OR SIMILAR SILICEOUS EARTHS, REFRACTORY CERAMIC GOODS, TILES MADE INTO STANDS, ORNAMENTAL ARTICLES AND TILES SPECIFICALLY MANUFACTURED FOR STOVES)
48.9%
220421WINE OF FRESH GRAPES, INCL. FORTIFIED WINES, AND GRAPE MUST WHOSE FERMENTATION HAS BEEN ARRESTED BY THE ADDITION OF ALCOHOL, IN CONTAINERS OF <= 2 L (EXCL. SPARKLING WINE)
46.7%
151620VEGETABLE FATS AND OILS AND THEIR FRACTIONS, PARTLY OR WHOLLY HYDROGENATED, INTER-ESTERIFIED, RE-ESTERIFIED OR ELAIDINISED, WHETHER OR NOT REFINED, BUT NOT FURTHER PREPARED
44.4%
160413PREPARED OR PRESERVED SARDINES, SARDINELLA AND BRISLING OR SPRATS, WHOLE OR IN PIECES (EXCL. MINCED)
44.4%
170111 RAW CANE SUGAR (EXCL. ADDED FLAVOURING OR COLOURING) 44.4%220290 NON-ALCOHOLIC BEVERAGES (EXCL. WATER, FRUIT OR VEGETABLE JUICES AND MILK) 44.4%252329 PORTLAND CEMENT (EXCL. WHITE, WHETHER OR NOT ARTIFICIALLY COLOURED) 44.4%
ECOWAS CET - 2 % of sensitive product lines

51
HS6 Code HS6 Label
Share of African countries for which the product line is considered as
sensitive
392490HOUSEHOLD ARTICLES AND TOILET ARTICLES, OF PLASTICS (EXCL. TABLEWARE, KITCHENWARE, BATHS, SHOWER-BATHS, WASH-BASINS, BIDETS, LAVATORY PANS, SEATS AND COVERS, FLUSHING CISTERNS AND SIMILAR SANITARY WARE)
97.8%
340111
SOAP AND ORGANIC SURFACE-ACTIVE PRODUCTS AND PREPARATIONS, IN THE FORM OF BARS, CAKES, MOULDED PIECES OR SHAPES, AND PAPER, WADDING, FELT AND NONWOVENS, IMPREGNATED, COATED OR COVERED WITH SOAP OR DETERGENT, FOR TOILET USE, INCL. MEDICATED PRODUCTS
88.9%
630900
WORN CLOTHING AND CLOTHING ACCESSORIES, BLANKETS AND TRAVELLING RUGS, HOUSEHOLD LINEN AND ARTICLES FOR INTERIOR FURNISHING, OF ALL TYPES OF TEXTILE MATERIALS, INCL. ALL TYPES OF FOOTWEAR AND HEADGEAR, SHOWING SIGNS OF APPRECIABLE WEAR AND PRESENTED IN BUL
88.9%
170490SUGAR CONFECTIONERY NOT CONTAINING COCOA, INCL. WHITE CHOCOLATE (EXCL. CHEWING GUM)
86.7%
392390
ARTICLES FOR THE CONVEYANCE OR PACKAGING OF GOODS, OF PLASTICS (EXCL. BOXES, CASES, CRATES AND SIMILAR ARTICLES; SACKS AND BAGS, INCL. CONES; CARBOYS, BOTTLES, FLASKS AND SIMILAR ARTICLES; SPPOLS, SPINDLES, BOBBINS AND SIMILAR SUPPORTS; STOPPERS, LIDS, CA
86.7%
852812TELEVISION RECEIVERS, COLOUR, WHETHER OR NOT INCORPORATING RADIO-BROADCAST RECEIVERS OR SOUND OR VIDEO RECORDING OR REPRODUCING APPARATUS
86.7%
330499
BEAUTY OR MAKE-UP PREPARATIONS AND PREPARATIONS FOR THE CARE OF THE SKIN (OTHER THAN MEDICAMENTS), INCL. SUNSCREEN OR SUNTAN PREPARATIONS (EXCL. MEDICAMENTS, LIP AND EYE MAKE-UP PREPARATIONS, MANICURE OR PEDICURE PREPARATIONS AND MAKE-UP OR SKIN CARE POWD
84.4%
870421
MOTOR VEHICLES FOR THE TRANSPORT OF GOODS, WITH COMPRESSION-IGNITION INTERNAL COMBUSTION PISTON ENGINE 'DIESEL OR SEMI-DIESEL' OF A GROSS VEHICLE WEIGHT <= 5 TONNES (EXCL. DUMPERS FOR OFF-HIGHWAY USE OF SUBHEADING 8704.10 AND SPECIAL PURPOSE MOTOR VEHICLE
84.4%
940360 WOODEN FURNITURE (EXCL. FOR OFFICES, KITCHENS AND BEDROOMS, AND SEATS) 84.4%210690 FOOD PREPARATIONS, N.E.S. 82.2%
401120NEW PNEUMATIC TYRES, OF RUBBER, OF A KIND USED FOR BUSES AND LORRIES (EXCL. TYPRES WITH LUG, CORNER OR SIMILAR TREADS)
82.2%
730890
STRUCTURES AND PARTS OF STRUCTURES, OF IRON OR STEEL, N.E.S. (EXCL. BRIDGES AND BRIDGE-SECTIONS, TOWERS AND LATTICE MASTS, DOORS AND WINDOWS AND THEIR FRAMES, THRESHOLDS FOR DOORS, PROPS AND SIMILAR EQUIPMENT FOR SCAFFOLDING, SHUTTERING, PROPPING OR PIT-P
82.2%
870333
MOTOR CARS AND OTHER MOTOR VEHICLES PRINCIPALLY DESIGNED FOR THE TRANSPORT OF PERSONS, INCL. STATION WAGONS AND RACING CARS, WITH COMPRESSION-IGNITION INTERNAL COMBUSTION PISTON ENGINE 'DIESEL OR SEMI-DIESEL' OF A CYLINDER CAPACITY > 2.500 CMª (EXCL. VEHI
82.2%
640299
FOOTWEAR WITH OUTER SOLES AND UPPERS OF RUBBER OR PLASTICS (EXCL. COVERING THE ANKLE OR WITH UPPER STRAPS OR THONGS ASSEMBLED TO THE SOLE BY MEANS OF PLUGS, WATERPROOF FOOTWEAR OF HEADING 6401, SPORTS FOOTWEAR, ORTHOPAEDIC FOOTWEAR AND TOY FOOTWEAR)
80.0%
854459ELECTRIC CONDUCTORS, FOR A VOLTAGE > 80 V BUT <= 1.000 V, INSULATED, NOT FITTED WITH CONNECTORS, N.E.S.
80.0%
271000
PETROLEUM OILS AND OILS OBTAINED FROM BITUMINOUS MINERALS (EXCL, CRUDE); PREPARATIONS CONTAINING >= 70 % BY WEIGHT OF PETROLEUM OILS OR OF OILS OBTAINED FROM BITUMINOUS MINERALS, THESE OILS BEING THE BASIC CONSTITUENTS OF THE PREPARATIONS N,E,S,
77.8%
870323
MOTOR CARS AND OTHER MOTOR VEHICLES PRINCIPALLY DESIGNED FOR THE TRANSPORT OF PERSONS, INCL. STATION WAGONS AND RACING CARS, WITH SPARK-IGNITION INTERNAL COMBUSTION RECIPROCATING PISTON ENGINE OF A CYLINDER CAPACITY > 1.500 CMª BUT <= 3.000 CMª (EXCL. VEH
77.8%
190530SWEET BISCUITS, WAFFLES AND WAFERS, WHETHER OR NOT CONTAINING COCOA (EXCL, WITH WATER CONTENT OF > 10 %)
75.6%
240220 CIGARETTES, CONTAINING TOBACCO 75.6%
870899
PARTS AND ACCESSORIES, FOR TRACTORS, MOTOR VEHICLES FOR THE TRANSPORT OF TEN OR MORE PERSONS, MOTOR CARS AND OTHER MOTOR VEHICLES PRINCIPALLY DESIGNED FOR THE TRANSPORT OF PERSONS, MOTOR VEHICLES FOR THE TRANSPORT OF GOODS AND SPECIAL PURPOSE MOTOR VEHICL
73.3%
871120MOTOR-CYCLES, INCL. MOPEDS, WITH RECIPROCATING INTERNAL COMBUSTION PISTON ENGINE OF A CYLINDER CAPACITY > 50 CMª BUT <= 250 CMª
73.3%
330300PERFUMES AND TOILET WATERS (EXCL. AFTERSHAVE LOTIONS, PERSONAL DEODORANTS AND HAIR LOTIONS)
71.1%
940390 PARTS OF FURNITURE, N.E.S. (EXCL. SEATS) 71.1%220290 NON-ALCOHOLIC BEVERAGES (EXCL. WATER, FRUIT OR VEGETABLE JUICES AND MILK) 68.9%610910 T-SHIRTS, SINGLETS AND OTHER VESTS OF COTTON, KNITTED OR CROCHETED 68.9%
640220FOOTWEAR WITH OUTER SOLES AND UPPERS OF RUBBER OR PLASTICS, WITH UPPER STRAPS OR THONGS ASSEMBLED TO THE SOLE BY MEANS OF PLUGS (EXCL. TOY FOOTWEAR)
68.9%
852719RADIO-BROADCAST RECEIVERS CAPABLE OF OPERATING WITHOUT AN EXTERNAL SOURCE OF POWER, INCL. APPARATUS CAPABLE OF ALSO RECEIVING RADIO-TELEPHONY OR RADIO-TELEGRAPHY, NOT COMBINED WITH SOUND REPRODUCING APPARATUS
68.9%
870210MOTOR VEHICLES FOR THE TRANSPORT OF >= 10 PERSONS, INCL. DRIVER, WITH COMPRESSION-IGNITION INTERNAL COMBUSTION PISTON ENGINE 'DIESEL OR SEMI-DIESEL'
68.9%
220421WINE OF FRESH GRAPES, INCL. FORTIFIED WINES, AND GRAPE MUST WHOSE FERMENTATION HAS BEEN ARRESTED BY THE ADDITION OF ALCOHOL, IN CONTAINERS OF <= 2 L (EXCL. SPARKLING WINE)
66.7%
330590PREPARATIONS FOR USE ON THE HAIR (EXCL. SHAMPOOS, PREPARATIONS FOR PERMANENT WAVING OR STRAIGHTENING AND HAIR LACQUERS)
66.7%
ECOWAS CET - 5 % of sensitive product lines
Source: Authors’ calculations based on MAcMap-HS6v2 database