Embed Size (px)
Citation preview

The Central American–Dominican Republic FreeTrade Agreement (CAFTA-DR) with the
United States, combined with increasing integrationamong the Central American countries, provides anopportunity to reflect on the long-run options for ex-change rate regimes in Central America.1 Althoughthe macroeconomic conditions of the Central Ameri-can countries present similarities and have improvedsignificantly in recent years, their exchange rateregimes cover the whole spectrum: floating regimesin the Dominican Republic and Guatemala, andcrawling pegs in Costa Rica, Honduras, andNicaragua, and full dollarization in the cases ofPanama and El Salvador. Looking forward, CAFTA-DR, together with other regional integration mecha-nisms such as the customs union, is expected toboost trade and financial flows with the UnitedStates and also within the region and increase thesynchronization of business cycles.2 These develop-ments could affect some important factors in thechoice of exchange rate arrangements.
This section examines the long-run options ofexchange rate regimes available to the CentralAmerican countries. It does not address specificshort-run considerations that affect the choice ofexchange rate regimes in the near future, but fo-cuses on evaluating the exchange rate arrangementoptions in the long run—that is, over a period of,say, a decade or longer. The analysis employs a uni-form methodology across countries and offers a re-gional perspective. It takes a long-run view byusing an approach derived from the literature onoptimum currency areas to evaluate the relativesuitability of these countries for different exchangerate arrangements. As a measure of comparison, thesuitability of the Central American countries for acommon currency (pegged to the U.S. dollar, or fulldollarization) is compared to that of the European
countries participating in the European MonetaryUnion (EMU).3
The key conclusions are that even after taking intoaccount the expected impact of further CAFTA-DR-related integration with the United States, CentralAmerica would still be less suitable for a commoncurrency (independently floating or dollar-peg/offi-cially dollarized) than Western Europe was in the1970s. While increased synchronization of businesscycles, reduced inflation differentials, and rising tradeflows with the United States have made the region rel-atively more suitable for dollarization/a dollar pegduring the decade ending in 2003, there is still a largedistance before a common currency would be a realis-tic option for the region. To ensure that policymakershave, in the long run, the option to choose among thefull range of possible exchange rates regimes, it is im-portant to maintain strong macroeconomic frame-works and continue progress with structural reformsand institution building, especially in the financialsector. For countries that are officially dollarized, thefocus should be on policies to ensure the sustainabilityof dollarization regimes, including through soundmacroeconomic frameworks, appropriate wage policy,and structural reforms to maintain competitiveness.
Issues Concerning Exchange RateRegimes in Developing Countries
Despite intense debate over several decades, noconsensus has been reached on the most desirable ex-change rate regime. Though pegged regimes and cer-tain intermediate regimes, such as crawling pegs andbands, were preferred in the 1980s and early 1990sfor their anti-inflation credentials, they fell out offavor following the emerging market crises of the1990s. This led to the emergence of the “bipolarview,” which favors either hard pegs or freely floatingarrangements and considers intermediate regimes
V Regional Integration and Exchange Rate Arrangements
Jun Il Kim and Laura Papi
69
1The countries considered are Costa Rica, the Dominican Re-public, El Salvador, Guatemala, Honduras, Nicaragua, andPanama. These countries are henceforth referred to as the CentralAmerican countries.
2See Section II on the macroeconomic implications ofCAFTA-DR.
3This comparison should be interpreted with caution, as strongpolitical will toward greater integration was one of the key ingre-dients behind the success of EMU, which might not be present inCentral America.

V REGIONAL INTEGRATION AND EXCHANGE RATE ARRANGEMENTS
difficult to sustain. This approach was partly basedon the concept of the “impossible trinity” (Fischer,2001; IMF, 2003; and Obstfeld and Rogoff, 1995).The bipolar view, in turn, came into question follow-ing the collapse of Argentina’s currency board. Also,some have argued that the impossible trinity doesnot prevent a country from choosing an intermediatesolution between floating and monetary union(Frankel, 1999, 2004). In this vein, Reinhart andReinhart (2003), among others, have noted that in-termediate regimes are not at all dead, with many de-veloping countries suffering from “fear of floating”(Calvo and Reinhart, 2002).
Empirical studies that compare alternative ex-change rate regimes’ macroeconomic performanceand crisis vulnerability have also failed to reach con-sensus. For example, while Ghosh, Gulde, and Wolf(2003) find that countries with pegged regimes experi-ence lower inflation with a growth performance that isno worse than that of countries with floating regimes,Levy-Yeyati and Sturzenegger (2001) argue that thislower inflation comes at the cost of lower growth.
The classification of exchange rate regimes is alsosubject to controversy. Although it is now generallyrecognized that de facto classifications are preferableto de jure ones, there are competing methodologiesfor classifying de facto exchange rate regimes. TheIMF, in its Annual Report on Exchange Arrangementsand Exchange Restrictions (AREAER), has since 1999employed a de facto classification based on quantita-tive and qualitative information, which also includesthe authorities’ stated policy intentions (see IMF,2003). Other de facto classifications can be found inReinhart and Rogoff (2004) and Levy-Yeyati andSturzenegger (2005). Differences in the methodologyemployed to classify regimes may account for the dif-ferent findings of various empirical studies.
Rogoff and others (2004) move away from advo-cating an exchange rate regime that is best for allcountries and instead group countries according to thedegree of integration with global financial markets.They view the degree of capital markets integration asthe key factor on the basis of which exchange rateregimes can be recommended. They conclude that thebenefits of flexible exchange rate regimes increase ascountries become more integrated with global capitalmarkets and develop sound financial systems. In de-veloping economies, however, pegs are found to yieldlower inflation without an apparent cost in terms ofgrowth, suggesting the presence of a credibility effect.In emerging markets, fixed or limited-flexibility ex-change rate regimes incur crises more frequently, butdo not have better inflation or growth performance.
Authors that argue that no single exchange rateregime is right for all countries or at all times focuson the relative suitability of countries for differentregimes (Frankel, 1999). The criteria used in the
choice of the exchange rate regime result both fromthe theoretical models that compare fixed versusfloating arrangements and the literature on optimumcurrency areas (e.g., Mundell, 1961, and Alesina andBarro, 2002).
The relative suitability of each country for a givenexchange rate regime has been linked to macroeco-nomic and structural variables, such as internationaltrade and the synchronization of business cycles.Countries that trade more among each other, aresmaller in size, experience similar shocks, have morehighly correlated business cycles and prices, andenjoy higher factor mobility and fiscal flexibility aremore likely to benefit from a pegged exchange rateregime, including a currency union. This is becausethe main advantages of fixed exchange rate regimesand currency unions are the promotion of trade and fi-nancial flows, whereas the drawbacks are related tothe inability to use the exchange rate as a tool to offsetshocks. An additional benefit of pegging the exchangerate is that some countries could “import” policy cred-ibility (Alesina and Barro, 2002). Hence, countriesthat lack policy discipline (manifested, for example, inhigh inflation) could benefit most from pegging theirexchange rate or joining a currency union where theanchor country has an established record of low infla-tion and stability. This would result in lower risk pre-miums and interest rates, while forgoing seignorage.4
In addition, a body of the literature has found thatcurrency unions increase trade beyond the levels as-sociated with fixed exchange rate regimes (Frankeland Rose, 2002; Rose, 2000; and Tenreyro andBarro, 2003). Alesina, Barro, and Tenreyro (2002)find that currency unions also increase the co-movement of prices. If this is so, currency unionsmay create virtuous circles, in that participation inthe currency union actually increases the participat-ing countries’ suitability for such a union. Conflict-ing results, however, have been obtained as towhether currency unions promote trade specializa-tion and increase co-movements in output.
Besides these long-term factors, short-term and op-erational considerations affect the feasibility of adopt-ing a certain exchange rate arrangement. A low levelof reserves, low tolerance for high interest rates, fiscaldominance, or a weak banking system would make apegged exchange rate regime highly vulnerable. Moregenerally, a crisis situation might make a floatingarrangement the only viable option. On the otherhand, an underdeveloped financial system, the diffi-culty of adopting an alternative nominal anchor, orlarge currency mismatches might cause “fear of float-ing” and make moving toward flexibility inadvisablein the short run, because the conditions for the devel-
70
4Seignorage would still accrue in the case of a peg or a cur-rency board, but not under full dollarization.

Current Exchange Rate Arrangements
opment of a reasonably deep and competitive foreignexchange market would be absent or macroeconomicstability might be compromised. Short-term macro-economic objectives might also argue for the adoptionof a regime that is not appropriate from a longer-runperspective; for example, exchange-rate-based stabi-lizations to reduce high inflation have been adoptedby countries better suited for a floating regime. If anexchange rate regime is adopted on the basis of short-term considerations, issues of exiting to a more appro-priate long-term choice arise.
Finally, some have de-emphasized the importanceof choosing the optimal exchange rate regime andfocused instead on the underlying institutions andpolicies needed to ensure a country’s satisfactorymacroeconomic performance. Calvo and Mishkin(2003) have questioned the applicability of the stan-dard theory of exchange rate regimes to emergingmarkets. They underscore that some characteristicsof emerging markets, such as weak fiscal and mone-tary discipline, high currency substitution, and vul-nerability to sudden stops in capital flows, make theapplication of standard theory problematic in emerg-ing economies. They also question the ability of ex-change rate regimes to generate desirable institu-tional traits, and hence conclude that focusing ondeveloping solid institutions is more important thanthe choice of exchange rate regime in ensuring suc-cessful macroeconomic performance.
The literature on exchange rate regimes in CentralAmerica reflects the divided debate on exchange ratearrangements. Although Corbo (2002) and Dornbusch(2001) favor dollarization, others emphasize its risks(including political costs) and the costly requirementsof such a strategy (Collins, 1996; Palerm, 2002; andRodlauer, 2004). Garcia-Lopez, Larrain, and Tavares
(2001) favor a currency union among Central Ameri-can countries, but not full dollarization. Rennhack,Offerdal, and Mercer-Blackman (2004) conclude thatfor Honduras, Nicaragua, and Costa Rica, a flexibleexchange rate regime would be more consistent withtheir structural characteristics; however, in generalthey find that the relative suitability for a peg corre-sponds to the actual regimes of Central Americancountries. Finally, Papaioannou (2003) finds that al-though structural characteristics of the Central Ameri-can countries can partly explain their choice ofregime, specific institutional and political conditionsare more important determinants.
Current Exchange Rate Arrangements
The classification of Central American countries’exchange rate arrangements is sensitive to the mea-sure used. The IMF classification suggests a range ofarrangements.5 These range from dollarization in ElSalvador and Panama to the floating regimes of theDominican Republic and Guatemala. Costa Rica andNicaragua have a crawling peg, and Honduras has acrawling band (Table 5.1). In recent years, the salientchanges in regimes have been El Salvador’s dollariza-tion in 2001 and Guatemala’s shift from managed to independently floating in 2003; the Dominican
71
Table 5.1. Exchange Rate Regimes(End of year)
1990 1995 2000 2001 2002 2003
Costa Rica 5 5 5 5 5 5Dominican Republic 3 7 7 7 7 81
El Salvador 7 3 3 1 1 1Guatemala 7 7 7 7 7 8Honduras 3 5 6 6 6 6Nicaragua 5 5 5 5 5 5Panama 1 1 1 1 1 1
Sources: Bubula and Ötker Robe, 2002; and IMF, Annual Report on Exchange Arrangements and Exchange Restrictions.Note: 1 = No separate legal tender; 2 = currency board; 3 = conventional fixed peg; 4 = pegged within a hori-
zontal band; 5 = crawling peg; 6 = crawling band; 7 = managed floating; 8 = independently floating.1The Dominican Republic was classified as freely floating starting on January 31, 2004.
5The IMF uses a de facto classification that combines quanti-tative and qualitative information, including the authorities’stated exchange rate policy (IMF, Annual Report on ExchangeArrangements and Exchange Restrictions, various years). Al-though the IMF changed from a de jure to a de facto classifica-tion in 1999, the data for previous years were obtained fromBubula and Ötker-Robe (2002), who constructed the back seriesusing the same de facto methodology used since 1999.

V REGIONAL INTEGRATION AND EXCHANGE RATE ARRANGEMENTS
Republic’s exchange rate system was reclassifiedfrom a managed to an independent float in January2004 (see Box 5.1 for a history of exchange rateregimes in Central America).
The natural classification of Reinhart and Rogoff(2004)6 generates a less diverse result. According tothis classification, the Dominican Republic andGuatemala also had a de facto crawling band and a defacto crawling peg, respectively, in 2001, the last yearfor which these data are available (Table 5.2). Thiscontrasts with the IMF classification, which catego-rized both countries as managed floaters in that year.
Updating the Reinhart and Rogoff classification forthe countries under consideration for 2002 and 2003reveals that the Dominican Republic would haveshifted to the freely falling category in 2003, afterhaving experienced a deep currency crisis and annualinflation of over 40 percent. Another remaining im-portant difference between the IMF and the naturalclassification concerns Guatemala, which has a freefloat under the IMF categorization but a de factocrawling peg under Reinhart and Rogoff’s category.7
Long-Run Options for Exchange RateRegimes in Central America
With increased integration, stronger institutions,and sustained robust macroeconomic frameworks,Central American countries may want to reevaluate
72
Box 5.1. History of Exchange Rate Regimes in Central America
The exchange rate regimes of all the Central Americancountries were dollar pegs before diverging in the 1980s,when most of the pegs had to be abandoned for differentreasons, including external shocks, civil conflict, and in-consistent domestic policies. The notable exception isPanama, which has been fully dollarized since 1904.
All the countries, with the exception of El Salvadorand Panama, then had “freely falling” exchange rateregimes according to Reinhart and Rogoff (2004). Ac-cording to their classification, Costa Rica abandonedthe peg in 1981, El Salvador in 1983, Guatemala in1984, Honduras in 1990, and Nicaragua in 1979. TheDominican Republic had a very narrow de facto crawl-ing band until 1982. Some of the countries then wentthrough several different regimes, at times involvingmultiple currency practices, before converging to theircurrent arrangements.
After the freely falling exchange rate period, CostaRica followed a real exchange rate rule based on the in-flation differential with the United States. The rule wasmodified to take into account targeted rather than ac-tual inflation in 1996. Today the rate of crawl of thecolón is adjusted on the basis of the inflation differen-tial between Costa Rica and its main trading partners.
The Dominican Republic adopted a managed float-ing exchange rate regime in 1992, after a period with afreely falling exchange rate, but then moved to a defacto crawling band, which lasted until 2003. At thattime, a severe currency crisis brought the country backto a freely falling regime according to the natural clas-sification, which would still apply today given the highinflation rate. According to the IMF classification, theDominican Republic had a managed floating regime
from 1991 to 2003 before moving to an independentlyfloating arrangement in January 2004.
After abandoning the peg in 1983, El Salvador had amanaged floating regime until 1990, when it moved to ade facto peg. However, in the early 1990s after the ces-sation of civil conflict, the exchange rate came underappreciating pressures which were resisted using steril-ized intervention. Dollarization was adopted in 2001.
Guatemala oscillated between freely falling andmanaged floats in the years following the abandonmentof the crawling band (1984). In 1991, the system con-verged to a de facto crawling peg, which is still the pre-sent regime according to the natural classification. Inthe IMF classification, however, Guatemala had a man-aged float in the 1990s and early 2000s, until it movedto an independent float in 2003.
After a brief spell in the freely falling category, Hon-duras had a de facto crawling band from 1991 to 1998before converging to a de facto crawling peg accordingto the natural classification. In the IMF classification,however, Honduras adopted a float in 1992–94. It thenmoved to a crawling peg and finally a crawling band in1996. The rate of crawl is determined by the projectedinflation differential with its main trading partners andthe exchange rate of its main trading partners vis-à-visthe U.S. dollar. The band was widened from 1 to 7 per-cent in 1998, but movement within the band has beenlimited.
Nicaragua spent a long period with a freely fallingregime owing to hyperinflation. In 1991 the exchangerate was pegged and since 1993 it has been a crawlingpeg. The rate of depreciation is now preannounced bythe central bank.
7Honduras is classified as a crawling band under the IMF’sclassification and a de facto crawling peg under Reinhart andRogoff’s.
6Reinhart and Rogoff (2004) use a purely de facto classifica-tion, which is based mainly on time-series data on exchange ratevariability. The exchange rate data from the parallel market areused whenever there is a discrepancy with the official exchangerate. A new category that is identified in this study is that of freelyfalling, which is characterized either by annual inflation exceed-ing 40 percent or, in the six months following a currency crisis,by a shift from a pegged to a floating regime (the crises are them-selves identified on the basis of whether the depreciation exceedsa certain threshold).

Long-Run Options for Exchange Rate Regimes in Central America
their options for long-run exchange rate regimes. Al-though operational considerations, institutional con-straints, or short-term objectives might, as noted,dictate a different exchange rate regime choice in theshort term, it is useful to know what the most suit-able long-term regime would be in order to considerfuture plans.
Several long-run options for the exchange rateregimes of Central America can be considered. Be-sides the status quo, these options are increased flex-ibility, possibly with inflation targeting; a commoncurrency area among the Central American coun-tries, either pegged to the U.S. dollar or freely float-ing versus the U.S. dollar; or full dollarization.
Increased Flexibility
Adjustment to shocks would be one of the mainbenefits of increased exchange rate flexibility forCentral America.8 Exchange rate flexibility can helpcounter shocks to the current account (such as terms-of-trade shocks) as well as reduce the vulnerabilityto capital flow reversals. Improving short-term com-petitiveness could be another argument in favor offlexible regimes, but this objective might also beachieved with a one-time devaluation in cases wherethis is feasible. The more integrated the country iswith international capital markets, the more difficult
it is to sustain a pegged regime after a step devalua-tion, because expectations that it might be followedby additional devaluations would typically heightenthe risk of large capital outflows.
A flexible exchange rate regime should increasemonetary policy independence. The degree of mone-tary independence is likely to be greater the less in-tegrated the country is with international capitalmarkets; furthermore, monetary independence islikely to be strengthened over time, as policy credi-bility becomes established.
Increased exchange rate flexibility requires an al-ternative nominal anchor. The possible choices wouldbe either monetary targeting or inflation targeting.The latter has been the preferred choice of severalemerging markets recently that are moving towardgreater exchange rate flexibility, given the frequent in-stability of monetary aggregates. Because adopting afully fledged inflation targeting requires time,9 imme-diately after the abandonment of a peg, countries haveadopted monetary targets as interim arrangements.10
Freely Floating Currency Area
A currency area that is freely floating against thedollar would have the ability to use exchange ratemovements to adjust to real shocks affecting Cen-tral America; however, it would lack the credibilitybenefits stemming from anchoring to the UnitedStates. The choice of floating freely would be more
73
Table 5.2. Exchange Rate Regimes, Natural Classification(End of year)
1990 1995 2000 2001 20021 20031
Costa Rica 10 8 8 8 8 8Dominican Republic 14 8 8 8 8 14El Salvador 4 4 4 2 1 1Guatemala 14 7 7 7 7 7Honduras 14 10 7 7 7 7Nicaragua 14 7 7 7 7 7Panama 1 1 1 1 1 1
Sources: Reinhart and Rogoff (2004); and IMF staff estimates.Note: 1 = No separate legal tender; 2 = pre-announced peg or currency board; 3 = pre-announced horizontal
band < 2 percent; 4 = de facto peg; 5 = pre-announced crawling peg; 6 = pre-announced crawling band < 2 percent; 7= de facto crawling peg; 8 = de facto crawling band < 2 percent; 9 = pre-announced crawling band > 2 percent; 10 =de facto crawling band < 5 percent; 11 = moving band < 2 percent; 12 = managed floating; 13 = freely floating; 14 =freely falling.
1The classification for 2002 and 2003 has been updated by IMF staff using the Reinhart and Rogoff (2003)methodology.
8Broda (2001) finds empirical support for the argument thatflexible exchange rates can insulate economies better againstterms-of-trade shocks. For a comprehensive analysis of the opera-tional issues involved in moving from a pegged to a floating ex-change rate regime, see IMF (2004).
9See, for example, Truman (2003) and Schaechter, Stone, andZelmer (2000).
10This paragraph draws from IMF (2004).

V REGIONAL INTEGRATION AND EXCHANGE RATE ARRANGEMENTS
appropriate the stronger the co-movements in outputamong the Central American countries and theweaker the region’s co-movements in output with theUnited States. The credibility benefits of a CentralAmerican currency area are likely to be limited, as noCentral American country is sufficiently dominanteconomically to act as an anchor country.11 Further-more, the credibility of a common Central Americancurrency independently floating against the dollarwould depend on the standards that are set by the Central American countries, such as their anti-inflation credentials, the fiscal discipline pursued inthe region, and their record in maintaining them.
Common Currency Area Pegged to the U.S. Dollar
The benefits and costs of a Central American cur-rency pegged to the U.S. dollar would be the mirrorimage of the option of a common currency that floatsfreely versus the dollar. A Central American currencypegged to the dollar would have the benefit of import-ing monetary credibility—which should entail lowerinflation and interest rates—and reducing transactioncosts, but at the cost of forgoing an instrument to dealwith external shocks that affect Central America dif-ferently from the United States. Furthermore, a peg tothe dollar would require a strong fiscal policy, whichrenounces monetary financing of the fiscal deficit andmaintains fiscal discipline to stem expectations of afuture devaluation. Similarly, the central bank’s func-tion is more constrained, particularly under a currencyboard arrangement (or, of course, under full dollariza-tion), calling for a healthy banking system and alter-native arrangements to deal with banks’ liquidityproblems. With a pegged exchange rate regime, poli-cies aimed at increasing the flexibility of factor mar-kets—in particular, labor markets—would be impor-tant as alternative ways to counter real shocks.
Pegged exchange rate regimes can also take inter-mediate forms, such as crawling pegs or bands. Be-yond the general considerations that apply to peggedregimes, as reviewed above, the advantage of acrawling peg is the prevention of large misalign-ments in competitiveness due to the adjustments ofthe nominal exchange rate with inflation differen-tials.12 However, this might have the cost of reducingthe anti-inflation properties of the pegged regime. Aband (or crawling band) would have the advantageof introducing some exchange rate flexibility and
some degree of monetary policy independence; thischoice has been made by some countries exitingpegged regimes. However, the authorities might facetensions between the exchange rate and inflation ob-jectives at the edges of the band.
Full Dollarization
Full dollarization13 would have benefits and costssimilar to pegging a common Central American cur-rency to the U.S. dollar, but it would be perceived as amore irrevocable commitment. Additional benefits interms of increased trade with the United States mightaccrue with dollarization, although the evidence forthis is not clear.14 The lack of seigniorage would rep-resent the main cost of dollarization compared with aregional currency union pegged to the dollar.15
The choice of exchange rate regimes for the CentralAmerican countries is likely to be interdependent. Ex-change rate movements of one country have spillovereffects on other countries in the region, both becauseof their effect on bilateral trade (and hence output andinflation) and because some of them compete in thirdmarkets. For example, the costs of dollarization arelikely to be reduced with an increase in the number ofcountries that have already dollarized.
In the following subsection, the analysis of thevarious options proceeds first by considering the in-dividual factors for the exchange rate regime choice,and then by aggregating these determinants into asummary measure, an index.
Choosing Among the Long-RunOptions: Key Factors
This subsection evaluates the relative suitability ofCentral American countries for different exchangerate arrangements. It adopts a long-term perspective,applying a consistent methodology across countriesand using a common database. The analysis exam-ines the recent and likely future developments insome of the key variables that affect the choice ofthe exchange rate regime. In addition, Central Amer-ica is compared with the European countries partici-
74
11Alesina, Barro, and Tenreyro (2002) point out that anchorcountries tend to be large relative to their clients.
12The rate of crawl is determined differently in each country.Some countries preannounce the rate of crawl and determine it ina forward-looking way with projected inflation; others accommo-date inflation differentials.
13In the rest of the paper, dollarization refers to full dollariza-tion unless otherwise noted.
14Empirical studies of this issue (for example, Rose, 2000)have focused on the impact of currency unions, supporting thatcurrency unions promote trade well beyond fixed exchange ratearrangements. However, it should be noted that these studies dealmainly with advanced economies, and in the East Caribbean Cur-rency Area convergence and trade have not increased homoge-nously either among the participating countries or with the UnitedStates in recent years.
15Dollarization might also reduce the need for open market op-erations aimed at sterilizing foreign inflows.

Choosing Among the Long-Run Options: Key Factors
pating in EMU to assess the region’s absolute suit-ability for dollarization.
The factors that are examined in this subsectionhave been identified mainly by the optimum currencyarea and fixed versus floating exchange rate regimeliterature. These factors include international tradeand other cross-border flows, size of the economy,synchronization of business cycles, terms-of-tradeshocks, degree of informal dollarization, inflation,factor mobility, fiscal flexibility, and seigniorage.These variables are examined in turn below.
Openness of the Economy
The effect of the extent of bilateral trade on the de-sirability of a currency union is ambiguous.16 On theone hand, the more countries trade with each other,the greater the benefits of a currency union, becausethe larger the reduction in transaction costs. Similarly,the deeper the financial interaction between countries,the greater the benefits of a currency union. On theother hand, in more open economies, external shockshave a larger impact on output and consumption, andhence the exchange rate is more useful as an adjust-ment tool (see, for example, Ricci, 1997). Thus, theeffect of trade on the desirability of a currency area isambiguous.17 Which effect will prevail will dependpartly on the extent to which nominal exchange ratechanges translate into real exchange rate changes. Ifprices and wages adjust quickly with the exchangerate, the exchange rate is not an effective adjustmenttool and the first effect (reduced transaction costs)might dominate. Typically, the literature on optimumcurrency areas emphasizes the first effect.
The United States is the dominant trading partnerfor the Central American countries and trade with theUnited States is more important than intraregionaltrade. On average, the United States received 60 per-cent of Central American exports and supplied 42 per-cent of imports over the past five years (Table 5.3).18
On the other hand, other countries in the region re-ceived an average of 17 percent of exports and sup-plied 11 percent of imports over the same period. Inaddition, the extent to which these countries tradewith the other Central American countries variesgreatly, from less than 5 percent of trade for the Do-minican Republic to about 30 percent for Nicaragua.19
In most cases, the share of trade with the UnitedStates rose over the past decade and, as shown in Sec-tion II, this trend is projected to intensify as a result ofCAFTA-DR.20 Trade among the seven Central Ameri-can countries did not show a clearly rising trend.
On average, the Central American countries areabout as open as the European economies were inthe 1980s, but they trade less among themselves. If,however, the percentage of trade with the UnitedStates is added to the trade among the Central Amer-ican countries, the Central American countries havemore internal trade than the European countries didin the 1970s and 1980s.
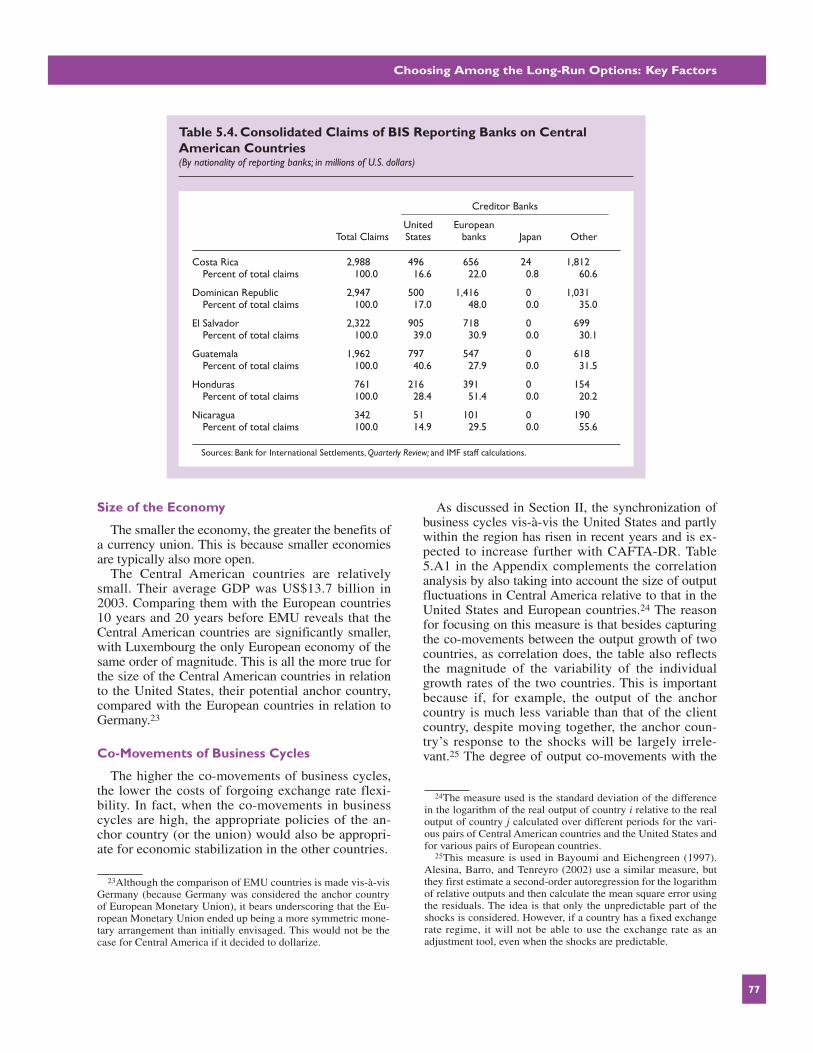
The United States is the main creditor of most ofthe Central American countries. Bank for Interna-tional Settlements (BIS) data were used to gauge theextent of financial transactions of the Central Ameri-can countries with the United States and among them-selves (Table 5.4).21 These data indicate that, with theexception of the Dominican Republic and Nicaragua,the United States is the single largest creditor countryof Central America.22 When taken as a group, Euro-pean banks also have large exposures, in some caseslarger than American banks. For most Central Ameri-can countries, except Nicaragua and Costa Rica,American, European, and Japanese banks account forover two-thirds of BIS reporting banks, leaving a rela-tively small residual share to be explained. The shareof financial transactions among Central Americancountries is not very high.
75
16Other current account transactions, for example remittances,would also be relevant in this discussion. However, consistentdata on the geographical composition of these flows are not avail-able, and hence the analysis focuses on trade flows, implicitly assuming that the geographical composition of other current account transactions broadly reflects that of trade flows.
17The trade channel could be less relevant for large countries.For example, Mexico, Canada, and the United Kingdom havejoined free trade agreements but chosen not to fix their exchangerates. Transaction costs may have been relatively low for thesecountries, with their relatively well-developed financial marketsin which exchange rate risk can be hedged more easily. Indeed,Frankel and Rose (2002) present evidence of a positive and largeimpact of a currency union on bilateral trade, but with the qualifi-cation that their result may not be applicable to large countries.
18See Section II for a detailed analysis of trade flows of the Cen-tral American countries. Trade data suffer from breaks in the seriesand other data problems. In spite of this, the overall qualitative re-sults showing that the United States is the main trading partner and
trade with the United States is significantly more important than re-gional trade with the rest of Central America are deemed robust.
19Although trade among the Central American countries is nothomogenously high, the countries that export similar commodities may compete in the U.S. market. COMTRADE data confirm thatthe United States is the leading market for most of the CentralAmerican exports, especially for the traditional ones.
20Other free trade agreements and other world trade develop-ments might take place—such as competition from other emerg-ing markets and developing economies—that would affect the ge-ographical composition of Central America’s trade. Were suchchanges to lead to a significantly different geographical composi-tion of the region’s trade, they would affect the conclusions re-garding exchange rate arrangements.
21Of course, these are partial data and capture only financialexposures of BIS reporting banks, not those of nonbank corpora-tions or official creditors. Furthermore, they do not include for-eign direct investment. Nevertheless, they do provide an indica-tion of the geographic distribution of international financialtransactions.
22For the Dominican Republic and Nicaragua, Spanish andGerman banks, respectively, are the largest creditors.

V REGIONAL INTEGRATION AND EXCHANGE RATE ARRANGEMENTS
76
Tabl
e 5.
3.T
rade
Str
uctu
re a
nd O
penn
ess
(In p
erce
nt o
f tot
als,
perio
d av
erag
es u
nles
s ot
herw
ise in
dica
ted)
Cos
ta R
ica
Dom
inic
an R
epub
licEl
Sal
vado
rG
uate
mal
a__
____
____
____
____
____
____
____
____
____
____
____
____
____
____
____
____
____
____
____
____
____
____
____
____
____
__19
90–9
419
95–9
919
99–2
003
1990
–94
1995
–99
1999
–200
319
90–9
419
95–9
919
99–2
003
1990
–94
1995
–99
1999
–200
3
Reg
iona
l dis
trib
utio
n o
f exp
ort
sU
nite
d St
ates
76.1
64.7
61.8
59.9
80.2
86.2
57.4
49.6
65.2
61.5
61.5
62.9
Oth
er C
entr
al A
mer
ican
cou
ntri
es1
14.8
13.4
12.1
0.4
0.6
0.9
37.3
49.6
33.1
31.6
24.3
17.1
Res
t of
the
wor
ld
9.1
21.8
26.1
39.6
19.2
12.9
5.3
0.8
1.7
7.0
14.2
20.0
Reg
iona
l dis
trib
utio
n o
f im
port
sU
nite
d St
ates
52.8
44.0
40.3
41.7
59.8
57.6
43.0
40.3
47.4
43.3
40.9
34.7
Oth
er C
entr
al A
mer
ican
cou
ntri
es1
9.4
8.1
5.9
1.3
1.8
2.3
18.3
22.9
19.6
10.5
10.8
11.0
Res
t of
the
wor
ld
37.8
47.9
53.8
57.1
38.4
40.2
38.6
36.8
33.0
46.1
48.3
54.4
Ope
nnes
s2G
oods
59
.171
.673
.061
.774
.872
.327
.452
.258
.235
.737
.540
.3G
oods
and
ser
vice
s76
.688
.991
.885
.499
.495
.137
.060
.873
.343
.343
.346
.6
Hon
dura
sN
icar
agua
Pana
ma
____
____
____
____
____
____
____
____
____
____
____
____
____
____
____
____
____
____
____
____
____
____
____
____
____
__19
90–9
419
95–9
919
99–2
003
1990
–94
1995
–99
1999
–200
319
90–9
419
95–9
919
99–2
003
Reg
iona
l dis
trib
utio
n o
f exp
ort
sU
nite
d St
ates
55.8
65.1
68.5
27.9
39.2
37.6
39.1
32.2
39.9
Oth
er C
entr
al A
mer
ican
cou
ntri
es1
8.0
13.6
6.5
20.6
23.6
32.4
13.3
15.1
15.8
Res
t of
the
wor
ld
36.2
21.4
25.0
51.5
37.1
30.0
47.6
52.7
44.2
Reg
iona
l dis
trib
utio
n o
f im
port
sU
nite
d St
ates
42.5
48.3
54.9
22.2
32.8
27.7
36.7
39.5
28.7
Oth
er C
entr
al A
mer
ican
cou
ntri
es1
11.7
14.4
8.4
26.0
33.8
26.9
5.0
6.0
5.8
Res
t of
the
wor
ld45
.837
.336
.751
.833
.445
.358
.454
.565
.5
Ope
nnes
s2G
oods
61
.473
.465
.848
.344
.856
.832
.032
.529
.1G
oods
and
ser
vice
s76
.497
.383
.552
.058
.873
.775
.062
.856
.8
Sour
ces:
IMF,
Wor
ld E
cono
mic
Out
look
;Dire
ctio
n of
Trad
e St
atist
ics;a
nd IM
F st
aff e
stim
ates
.N
ote:
In s
ome
case
s,pa
rtne
r co
untr
ies’
dat
a w
ere
used
and
adj
ustm
ents
mad
e to
obv
iate
som
e da
ta p
robl
ems
in t
he o
rigi
nal s
erie
s.Be
caus
e of
the
se p
robl
ems,
the
data
sho
uld
be in
terp
rete
d w
ith c
autio
n.1 T
he C
entr
al A
mer
ican
cou
ntri
es a
re C
osta
Ric
a,D
omin
ican
Rep
ublic
,El S
alva
dor,
Gua
tem
ala,
Hon
dura
s,N
icar
agua
,and
Pan
ama.
2 Sum
of e
xpor
ts a
nd im
port
s in
per
cent
of G
DP.
Choosing Among the Long-Run Options: Key Factors
Size of the Economy
The smaller the economy, the greater the benefits ofa currency union. This is because smaller economiesare typically also more open.
The Central American countries are relativelysmall. Their average GDP was US$13.7 billion in2003. Comparing them with the European countries10 years and 20 years before EMU reveals that theCentral American countries are significantly smaller,with Luxembourg the only European economy of thesame order of magnitude. This is all the more true forthe size of the Central American countries in relationto the United States, their potential anchor country,compared with the European countries in relation toGermany.23
Co-Movements of Business Cycles
The higher the co-movements of business cycles,the lower the costs of forgoing exchange rate flexi-bility. In fact, when the co-movements in businesscycles are high, the appropriate policies of the an-chor country (or the union) would also be appropri-ate for economic stabilization in the other countries.
As discussed in Section II, the synchronization ofbusiness cycles vis-à-vis the United States and partlywithin the region has risen in recent years and is ex-pected to increase further with CAFTA-DR. Table5.A1 in the Appendix complements the correlationanalysis by also taking into account the size of outputfluctuations in Central America relative to that in theUnited States and European countries.24 The reasonfor focusing on this measure is that besides capturingthe co-movements between the output growth of twocountries, as correlation does, the table also reflectsthe magnitude of the variability of the individualgrowth rates of the two countries. This is importantbecause if, for example, the output of the anchorcountry is much less variable than that of the clientcountry, despite moving together, the anchor coun-try’s response to the shocks will be largely irrele-vant.25 The degree of output co-movements with the
77
Table 5.4. Consolidated Claims of BIS Reporting Banks on CentralAmerican Countries(By nationality of reporting banks; in millions of U.S. dollars)
Creditor Banks_______________________________________United European
Total Claims States banks Japan Other
Costa Rica 2,988 496 656 24 1,812Percent of total claims 100.0 16.6 22.0 0.8 60.6
Dominican Republic 2,947 500 1,416 0 1,031Percent of total claims 100.0 17.0 48.0 0.0 35.0
El Salvador 2,322 905 718 0 699Percent of total claims 100.0 39.0 30.9 0.0 30.1
Guatemala 1,962 797 547 0 618Percent of total claims 100.0 40.6 27.9 0.0 31.5
Honduras 761 216 391 0 154Percent of total claims 100.0 28.4 51.4 0.0 20.2
Nicaragua 342 51 101 0 190Percent of total claims 100.0 14.9 29.5 0.0 55.6
Sources: Bank for International Settlements, Quarterly Review; and IMF staff calculations.
23Although the comparison of EMU countries is made vis-à-visGermany (because Germany was considered the anchor countryof European Monetary Union), it bears underscoring that the Eu-ropean Monetary Union ended up being a more symmetric mone-tary arrangement than initially envisaged. This would not be thecase for Central America if it decided to dollarize.
24The measure used is the standard deviation of the differencein the logarithm of the real output of country i relative to the realoutput of country j calculated over different periods for the vari-ous pairs of Central American countries and the United States andfor various pairs of European countries.
25This measure is used in Bayoumi and Eichengreen (1997).Alesina, Barro, and Tenreyro (2002) use a similar measure, butthey first estimate a second-order autoregression for the logarithmof relative outputs and then calculate the mean square error usingthe residuals. The idea is that only the unpredictable part of theshocks is considered. However, if a country has a fixed exchangerate regime, it will not be able to use the exchange rate as an adjustment tool, even when the shocks are predictable.

V REGIONAL INTEGRATION AND EXCHANGE RATE ARRANGEMENTS
United States increased in the past decade (1994–2003) compared with the previous one (1984–93) forall the Central American countries except Honduras.On average, co-movement in output increased withinthe region as well over the same period. The degree ofoutput co-movement of the Central American coun-tries among themselves is on average less pronouncedthan co-movement between individual Central Ameri-can countries and the United States.
A comparison between Europe 10 and 20 yearsbefore EMU and Central America reveals a similardegree of output co-movement. In fact, the averageof all output co-movement measures among the 12European countries that formed EMU was 0.028 and0.022 in the decades ending in 1979 and 1989, re-spectively, compared with 0.025 in Central Americain the decade ending in 2003.
The co-movement of output of the Central Ameri-can countries, as measured by pair-wise correlation,is strongest with the United States, suggesting theimportance of the common link with the UnitedStates. The average correlation of the Central Ameri-can countries’ output growth with the United Stateswas 0.44 in the decade ending in 2003, while the av-erage pair-wise correlation between Central Ameri-can countries was only 0.22.26 Furthermore, the pair-wise correlations in output growth between theCentral American countries, after removing the in-fluence of the United States, revealed a significantlylower degree of co-movement, with the average cor-relation falling to 0.16 (Table 5.A2).27
Terms-of-Trade Shocks
The smaller the size of terms-of-trade shocks andthe higher the co-movements in the terms of trade,the greater the benefits of a currency union. The cor-relation of terms-of-trade shocks depends in part onthe product composition of trade.
Terms-of-trade shocks are sizable in Central Amer-ica and much more important than they were for Eu-rope before EMU (Table 5.A3). In fact, at 9.9 percent,the average absolute annual change in the CentralAmerican countries’ terms of trade over the pastdecade was more than double that for Europe in thedecade ending in 1989 (3.9 percent). The United
States has much smaller terms-of-trade shocks, withan average annual change of 1.5 percent over the pastdecade. The importance of terms-of-trade shocks forCentral America results in part from the fact that thesecountries still rely heavily on traditional exports, withfood being the main export for most of them, followedby manufactured goods.28 Indeed, over the pastdecade, the importance of terms-of-trade shocks de-clined more for those countries that diversified theirexport base the most: Costa Rica, the Dominican Re-public, and El Salvador.29 On the other hand, the vari-ability of the terms of trade of Guatemala, Honduras,and Nicaragua increased over the same period.
The co-movements in the terms of trade of theCentral American countries fell in the past decade,are stronger with the United States than within theregion, and are much weaker than in Europe (Tables5.A4 and 5.A5 in the Appendix).30 The average cor-relation among the terms of trade of all CentralAmerican countries and the United States fell from0.2 in 1984–93 to 0.02 in 1994–2003. Furthermore,though the average correlation of the terms of tradeof the Central American countries with the UnitedStates was 0.12 in the last decade, the average corre-lation of the terms of trade within the region becamevery small and negative (–0.01). Nicaragua has allnegative correlations; Costa Rica has all negativecorrelations with Central America, but a very smallpositive correlation with the United States; Hon-duras also has several negative correlations. Finally,the correlation in the terms of trade of Europeancountries was significantly stronger than among theCentral American countries and the United States.
Currency Substitution in the Economy
The higher the degree of currency substitution ofthe economy, the smaller the costs of moving to a cur-rency union. This relationship exists because thehigher the degree of currency substitution is, the morelimited are the effects of nominal exchange ratechanges on the real exchange rate. This will happen
78
26The exception is Honduras, for which the correlation with theUnited States was negative in the last decade. Excluding Hon-duras, the average correlation with the United States is 0.55.
27The influence of the United States’ business cycle is removedby first regressing the individual countries’ output growth on theUnited States’ output growth, and then calculating pair-wise cor-relations between the residuals of these regressions. Correlation isexamined instead of the standard deviation of the country differ-ences in output growth, as was done above, because the latter isby construction always smaller for residuals than the original dif-ferences in output growth.
28Within the food category, coffee, bananas, and fish/shellfish arethe main exports, whereas the countries that have diversified theirexport base export larger shares of various manufactured goods.
29The variability of terms-of-trade shocks also diminished forPanama, even though Panama’s exports consist mainly of food.
30Although this result may appear at odds with the earlier find-ing of increased synchronization in business cycles with theUnited States, it might be because the main transmission channelsfor the increased synchronization in business cycles do not in-volve terms-of-trade movements. Possible candidates are finan-cial flows, as well as other current flows such as remittances,which for some Central American countries are as large as ex-ports. Furthermore, increasing trade with the United States can beconsistent with both higher synchronization in business cyclesand decreasing correlation in the terms of trade if trade is largelyat the interindustry level.

Choosing Among the Long-Run Options: Key Factors
not only because the exchange rate will not affect thedomestic price of goods whose prices are set in dol-lars, but also because, in economies with high cur-rency substitution, the pass-through of exchange ratechanges to domestically set prices is typically high.
As detailed in Section VI, the degree of currencysubstitution of the Central American economies ishigh (although it varies considerably across coun-tries). Excluding the countries that have fully dollar-ized, financial dollarization amounts to almost 40percent of total banking system assets, much greaterthan in Europe in 1979 and 1989.
Inflation Rates and Co-Movements of Prices
The higher and more variable the inflation rateand the higher the degree of co-movements in prices,the greater the benefits of a currency union. That isbecause the higher the inflation, the greater the bene-fits of “buying monetary credibility.” Also, the largerthe co-movements in prices, the smaller the chancesof misalignments in competitiveness when the ex-change rate is fixed.
Inflation rates and inflation variability have fallenin recent years (Table 5.A6). Inflation rates have de-clined for all the Central American countries, and forsome, rates have converged close to advanced coun-try levels. At the same time, the variability of infla-tion in individual countries, as well as the cross-country dispersion across Central America, hasdiminished. Co-movements in prices have increasedin Central America in the past decade: they are, how-ever, somewhat less strong than in Europe, as mea-sured both with the anchor country and among allpairs of countries excluding the anchor country(Table 5.A7).
The average inflation rate in Central America inthe past decade was 9.5 percent, somewhat higherthan the 7.8 percent in Europe in the decade endingin 1989. Similarly, the difference between the aver-age excluding the anchor country (that is, the UnitedStates for Central America and Germany for Europe)was greater in the case of Central America.
Factor Mobility
The greater factor mobility, the lower the costs offorgoing exchange rate flexibility. This is becausegreater factor mobility can lead to resource realloca-tion that can bring about the necessary adjustment,even in the absence of exchange rate flexibility.
Quantitative information on factor mobility isscarce. An analysis of labor market flexibility is be-yond the scope of this section; therefore, only somevery crude indicators of labor market flexibility areconsidered here. The average unemployment rate forthe Central American countries was about 8 percent
in the five years up to 2002, somewhat lower thanthat of European countries in the five years up to1989 (9.6 percent).31 Also, according to anothermeasure based on the variability of employmentshares in the main sectors of the economy, the Cen-tral American countries appear to have greater vari-ability of sectoral employment, perhaps suggestinggreater labor market flexibility.32 Furthermore, emi-gration from the Central American countries alsofunctions as a shock absorber to a larger extent thanin Europe.
Regarding capital mobility, the IMF’s Annual Re-port on Exchange Arrangements and Exchange Re-strictions suggests that the Central American coun-tries have fairly liberal regimes compared with otheremerging markets. Although the same classificationis not available for the European countries in 1979and 1989,33 it is likely that the Central Americancountries now have on average a more liberal regimethan the European countries had in 1979, but lessliberal than the European countries in 1990, the yearin which all capital account restrictions among theprospective EMU participants were removed.
Fiscal Flexibility
The greater the fiscal flexibility, the lower thecosts of forgoing exchange rate flexibility. Fiscalflexibility is also difficult to measure. Internationalfiscal transfers are very rare; hence, what is morerelevant is the extent to which fiscal policy in indi-vidual countries can respond flexibly to shocks.Though an in-depth analysis of fiscal flexibility isbeyond the scope of this section, a rough measure isthe debt-to-GDP ratio, because the higher the debtlevel is, the less room there is for maneuvering usingfiscal policy countercyclically. Nevertheless, com-parisons with the European countries based on thedebt-to-GDP ratio are not appropriate, as the abilityto absorb the debt is much more limited in CentralAmerica because of their less advanced domestic fi-nancial markets and their intermittent access to in-ternational capital markets. The level of debt of mostCentral American countries suggests little scope forusing fiscal policy countercyclically. Even countrieswhose debt is not high could be constrained by theavailability of financing (see Section IV).
79
31A higher unemployment rate is considered an indication of aless flexible labor market. Because of data availability problems,these data are only indicative.
32Higher variability in the shares of sectoral employment intotal employment might indicate greater flexibility of the labormarket. For the European countries, the comparison excludesPortugal, as it has a very extreme value, indicating very high vari-ability in sectoral employment.
33The Central American countries currently have more restric-tive regimes than do the European countries.
V REGIONAL INTEGRATION AND EXCHANGE RATE ARRANGEMENTS
Seigniorage
The lower the seigniorage, the smaller the cost ofgiving up the national currency. Simple calculationsindicate that seigniorage in Central American coun-tries is in the range of 1 to 2 percent of GDP on aver-age.34 Seigniorage has been falling over the years
with inflation and is likely to fall further as inflationis reduced.35 Hence, this measure of seigniorage islikely to overestimate the costs of dollarization. Fur-thermore, in comparing a Central American currencyunion whose currency is pegged to the dollar, theforgone seigniorage is likely to be less, because with
80
34This figure represents the average annual increase in basemoney as a percentage of GDP in 2001–02. The reason for notusing a more recent year was that the Dominican Republic had alarge increase in seigniorage in 2003, at the same time as inflationspiked as a consequence of the currency and banking crisis. Costa
Rica, the Dominican Republic, Guatemala, Honduras, andNicaragua are used in the calculations, as El Salvador andPanama are already dollarized.
35Estimates of seigniorage losses due to dollarization woulddecrease further if reserve requirements included in base moneywere remunerated.
0
0.05
0.10
0.15
0.20
0.25
0.30
0.35
0.40
0.45Nominal Exchange Rate Variability vis- a-vis the United States
0
45 degree line
Dominican Republic(DOM)
Honduras (HND)Panama (PAN)
Costa Rica (CRI)El Salvador (SLV)
Nicaragua (NIC)Guatemala (GTM)1984–93
0.05 0.10 0.15 0.20 0.25 0.30 0.35 0.40 0.45
0
0.05
0.10
0.15
0.20
0.25
0.30
0.35
0.40
0.50
0.45Exchange Rate Variability between Central American Countries
0
45 degree line
DOM vs HNDDOM vs GTMDOM vs NIC
DOM vs SLV
HND vs NIC
SLV vs NIC
SLV vs HNDGTM vs NIC
GTM vs HND
CRI vs NICCRI vs GTMSLV vs GTM
CRI vs HND
CRI vs SLV
CRI vs DOM
1984–93
0.05 0.10 0.15 0.20 0.25 0.30 0.35 0.40 0.500.45
1994
–03
1994
–03
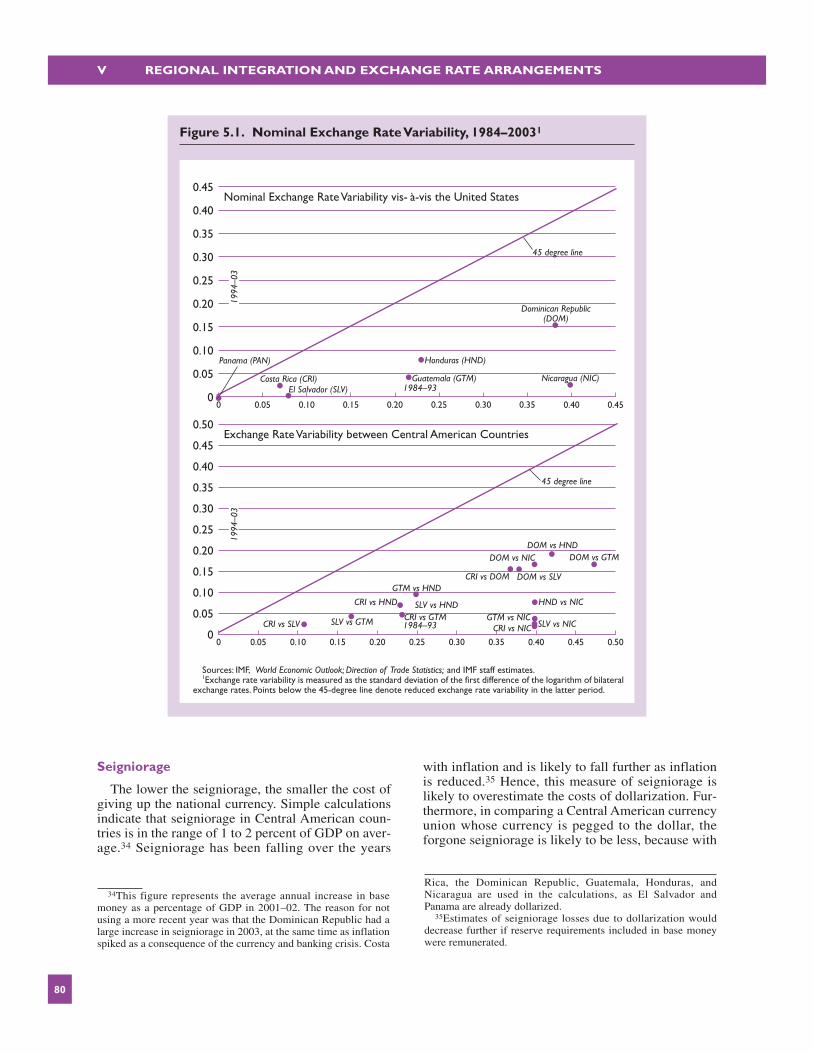
Sources: IMF, World Economic Outlook; Direction of Trade Statistics; and IMF staff estimates.1Exchange rate variability is measured as the standard deviation of the first difference of the logarithm of bilateral
exchange rates. Points below the 45-degree line denote reduced exchange rate variability in the latter period.
Figure 5.1. Nominal Exchange Rate Variability, 1984–20031

Choosing Among the Long-Run Options: An Index Approach
a peg to the dollar, Central America’s inflation islikely to be even lower than it would be with a freelyfloating Central American currency.
Finally, the bilateral exchange rates of the CentralAmerican countries reveal reduced variability, whichcan be interpreted as a summary indicator of the de-gree of integration. As Figure 5.1 shows, bilateralexchange rate variability of the Central Americancountries vis-à-vis the United States declined with-out exception between the periods 1984–93 and1994–2003.36 The same is true for all of the possiblepairs of Central American countries. This could beinterpreted as prima facie evidence of increased syn-chronization of these economies.
The analysis of this subsection suggests that if theregion were to consider a common currency area, itwould be more sensible to peg it against the U.S.dollar (or dollarize) rather than float it against thedollar. This is suggested because the Central Ameri-can countries trade more and are more synchronizedwith the United States than among themselves. Im-portantly, CAFTA-DR is expected to boost integra-tion with the United States more than within the re-gion. However, the analysis of the individual factorsin this section does not allow conclusions to bereached on Central America’s suitability for peggingtheir exchange rate versus the U.S. dollar or dollariz-ing. This task is tackled in the next subsection.
Choosing Among the Long-RunOptions: An Index Approach
This subsection uses an index approach to formallyanalyze the suitability of the Central American coun-tries for different exchange rate regimes. The indexwill provide a summary measure of relative suitabil-ity, taking into account most of the factors highlightedabove. As underscored in the analysis of the previoussubsection, because the Central American countriescurrently trade more and are more synchronized withthe United States than regionally, and because of thepotential benefits of anchoring to the United States,this subsection focuses on assessing the relative suit-ability for dollarization37 rather than for a CentralAmerican currency area with a freely floating cur-rency versus the dollar. In addition, for each CentralAmerican country the index will provide informationon the choice between dollarization (or a peg to theU.S. dollar) versus a freely floating domestic currency
vis-à-vis the dollar. A low value of the index woulddenote high suitability for dollarization, while a highvalue of the index would denote low suitability fordollarization and hence high suitability for a freelyfloating currency versus the dollar.
An index is constructed to aggregate all the factorsrelevant to evaluating the long-run suitability for dif-ferent types of exchange rate regimes. Although theanalysis above has analyzed specific factors relevantto the exchange rate regime choice, an index has theadvantage of summarizing all the information oncethe relative weight of the individual factors is esti-mated from a large cross-section of country data. Theindex used here adopts an optimum currency area ap-proach and provides a way of formalizing the relativesuitability of Central American countries for differentexchange rate regimes.38 Initially, a comparison willbe made between these countries’ suitability in 1993and 2003. Projections will then be formulated toevaluate how the Central American countries’ suit-ability might evolve in the future once the macroeco-nomic effects of CAFTA-DR have fully occurred. Fi-nally, a comparison with EMU member countriesbefore the monetary union will provide a benchmarkagainst which to compare the absolute suitability ofCentral America for dollarization.
The approach follows Bayoumi and Eichengreen(1997). As detailed in the Appendix, the first step isto estimate an equation that can explain the variabil-ity in bilateral exchange rates using variables that aredeemed to determine the suitability for an optimumcurrency area, such as the synchronization of busi-ness cycles, the amount of trade, the similarity in thecomposition of trade, and the size of the countries.The specification of the equations is modified to bet-ter fit emerging markets and developing countries(Box 5.2). The regressions use a sample of 53 coun-tries, including the G-7, all Latin American coun-tries, all the European countries that are members ofEMU, Australia, and New Zealand. The equationsuse two different specifications: one with nominalexchange rate variability as the dependent variableand one with the variability of an indicator of ex-change market pressure. The latter is defined as anaverage of the variability of changes in bilateralnominal exchange rates and official reserves. The ra-tionale for this is that some of the countries in thesample maintained a fixed exchange rate regimeover the sample period, and hence an indicator ofpressure in the foreign exchange market appearsmore appropriate as a dependent variable.
81
36Panama has a variability of zero in both periods because itwas dollarized over the entire period.
37In the remainder of this subsection, we refer to “dollariza-tion” as the regime choice for anchoring to the United States(which also includes a dollar-peg/currency).
38Although the index is an optimum currency area index, thisshould not be construed as an argument in favor of dollarization;rather, it is a common tool to assess relative suitability of ex-change rate regimes.

V REGIONAL INTEGRATION AND EXCHANGE RATE ARRANGEMENTS
A monetary variable, the variability of inflation dif-ferentials, is added to the explanatory variables. Thisis because the variability of bilateral exchange rates ofdeveloping countries (and relative reserve move-ments) is determined to a large extent by monetaryphenomena. Alesina, Barro, and Tenreyro (2002) alsostress the importance of co-movements in prices aswell as output in determining the suitability of a coun-try for an optimum currency area. Instead of the dis-similarity variable used by Bayoumi and Eichen-green, a variable that captured the variability in theterms of trade was used. Finally, other variables thatare discussed in the previous sections, such as indica-tors of labor market mobility and fiscal flexibility, ei-ther did not turn out to be statistically significant (forexample, unemployment) or could not be included be-cause of data availability constraints.
As shown in the estimated indices, the CentralAmerican countries became more suitable for dollar-ization between 1993 and 2003. In fact, the indicesfor all countries became smaller in 1994–2003 thanin 1984–93, indicating lower exchange rate variabil-ity versus the U.S. dollar and hence greater suitabil-ity for dollarization (Figure 5.2 and Table 5.A8 inthe Appendix). The index for 1984–93 (1994–2003)was calculated with the values of the explanatoryvariables over that decade. The greater suitability in
2003 compared with 1993 is explained by the clearincrease in the synchronization of business cyclesand inflation differentials in the past decade. This re-sult holds when using any of the regressions pre-sented in Table 5.A9 in the Appendix, as well as forall pairs of Central American countries, suggestingalso increased suitability for a currency area withinthe region.39
Although all Central American countries becamemore suitable for dollarization, the degree of changein the index varied among the countries. Nicaraguahad by far the largest increase in relative suitabilitybecause of its macroeconomic stabilization, fol-lowed by Guatemala and the Dominican Republic,and the remaining Central American countries hadmore modest changes in the indices.
The range of suitability for dollarization does notalways reflect the existing exchange rate regimes of the Central American countries. Panama is the country most suited for dollarization, andGuatemala follows (Figure 5.3). Costa Rica and ElSalvador are next. The Dominican Republic, Hon-duras, and Nicaragua are the least suited for dollar-
82
39Nevertheless, it is not possible to ascertain whether thegreater integration within the region is due to the common greaterintegration with the United States.
Box 5.2. Regression Results
The estimated equation is specified as follows:
y = �0 + �1SD(Y) + �2SD(P) + �3SD(TOT) + �4TRADE + �5SIZE, (1)
where y is either the exchange market pressure (EMP)indicator—defined as the average of the variability inbilateral exchange rates and official international re-serves—or the variability of bilateral exchange rates,denoted by SD(EXR). SD(Y) captures the variability inrelative output changes, SD(P) the variability in relativeinflation differentials, SD(TOT) the variability in rela-tive changes in the terms of trade, TRADE the extent ofbilateral trade, and SIZE country size measured by thearithmetic average of the log of real GDP in U.S. dol-lars of the two countries. All variability variables aremeasured by standard deviations of the underlyingvariables as described in the Appendix. TRADE andSIZE represent period averages.
The standard deviations and the means are calculatedfor a panel of 53 countries over three different sampleperiods: 1970–2003, 1980–2003, and 1990–2003. With53 countries, there are 1,378 pairs of countries andhence potentially 1,378 observations in the regressions.In practice, the regressions include 1,308 observationsas a result of missing values in the data.
The fact that many countries included in the sample—particularly Central and South American countries—ex-perienced economic turbulence during the sample periodsuggests that both dependent and independent variablesof the regression may be dominated by several outliers.To reduce the influence of outliers, the underlying vari-ables of volatility measures were transformed before cal-culating their standard deviations.1
Table 5.A8 in the Appendix reports the results of re-gressions estimated for EMP and SD(EXR) over threedifferent sample periods.
Most of the estimated coefficients have the expectedsign and are highly significant. The few coefficientswith the wrong sign are generally statistically insignifi-cant. The results also indicate that the goodness of fit ofthe regressions is highly satisfactory, accounting for 70to 90 percent of variation in EMP and SD(EXR), re-spectively, when the full sample (1970–2003) wasused. Furthermore, the estimated coefficients are rela-tively stable across different sample periods, support-ing their use for forecasting purposes.
1A monotonic transformation given by z = x / (1 + x) for x >0 and z = x /(1 - x) for x < 0 was carried out. This transforma-tion maps the underlying variable x into an interval (–1, 1).

Choosing Among the Long-Run Options: An Index Approach
ization and hence the most suited to maintain a flexi-ble exchange rate versus the U.S. dollar).
A comparison of Central America with Europeancountries before EMU reveals that Central America isless suited for dollarization than was Europe for a cur-rency area pegged to the Deutsche mark. To assess theabsolute suitability of the Central American countriesfor dollarization, the indices for Central America vis-à-vis the United States calculated over the period1994–2003 were compared with the indices for mem-bers of EMU vis-à-vis Germany in the 1970s, 1980s,
and 1990s.40 On average, the estimated indices forCentral America in 1994–2003 are higher than thoseestimated for European countries in all three decades,indicating that the European countries were more suit-able for a currency area with Germany than the Cen-tral American countries were for dollarization in 2003(see Figure 5.4 and Table 5.A9 in the Appendix).
83
40The indices for Europe did not show a monotonic conver-gence over the three periods considered.
0
0.05
0.10
0.15
0.20
0.25
0.30Central America: OCA Indices versus the United States
0
45-degree line
1984–1993
0.05 0.10 0.15 0.20 0.25 0.30
DOM vs HND
DOM vs GTM
DOM vs NICDOM vs SLV
HND vs NIC
SLV vs NICSLV vs HND
GTM vs NICGTM vs HND CRI vs NIC
CRI vs GTM
SLV vs GTM
CRI vs HND
CRI vs SLV
CRI vs DOM
Dominican Republic (DOM)
Costa Rica (CRI)El Salvador (SLV)
Nicaragua (NIC)
Guatemala (GTM)
0
0.05
0.10
0.15
0.20
0.25
0.30OCA Indices between Central American Countries
0
45-degree line
1984–1993
0.05 0.10 0.15 0.20 0.25 0.30
Honduras (HND)
1994
–200
319
94–2
003
Sources: IMF, World Economic Outlook; Direction of Trade Statistics; and IMF staff estimates.1Based on the estimated indices from regression (5) in Table A.1.9. Lower values indicate greater suitability for
dollarization in the first panel and fixity in bilateral exchange rates in the second. Points below the 45-degree line denote increased suitability for such exchange rate arrangements in the latter period.
Figure 5.2. Optimum Currency Area Indices, 1984–20031

V REGIONAL INTEGRATION AND EXCHANGE RATE ARRANGEMENTS
None of the Central American countries has in-dices comparable to the European countries mostsuited for a currency union with Germany, such asthe Netherlands, Austria, and France. However,some Central American countries have levels of theindices that are comparable to those of the Europeancountries that appeared less suited for EMU, such asGreece, Ireland, Portugal, and Spain, in the 1980sand the 1990s. Considering the average of the in-dices among Central American countries and com-paring them with the average of the indices amongWestern European countries, excluding Germany,the analysis shows that Central America is lesssuited to forming a currency union than Europe wasin the 1990s. However, depending on the regressionused to calculate the indices, the comparison withEurope in the 1980s provides mixed results.
CAFTA-DR and other regional initiatives are likelyto make Central America relatively better suited fordollarization. The macroeconomic impact of CAFTA-DR was analyzed in Section II. The results presentedin that section projected that trade and synchronicityin business cycles with the United States would in-crease significantly, thus potentially making the re-
gion more suitable for dollarization.41 On the basis ofSection II’s analysis and other assumptions (describedin Box 5.3), the indices of the Central American coun-tries are projected to decline, thus making these coun-tries more suitable for dollarization (Table 5.A10).Nevertheless, on average, Central America would stillremain less suitable for dollarization than the Euro-pean countries were for a currency union with Ger-many in the 1970s, 1980s, and 1990s.42
The results presented here should be interpretedwith caution. The approach used can provide insightsfrom a long-term perspective but might have somelimitations in its application to developing countries.This exercise assumes that the determinants of ex-change market pressure and exchange rate variabilityare the economic variables that have been considered
84
41Also, the variability of output in Central America is projectedto decline, increasing the degree of co-movement with the UnitedStates. Dynamic effects of currency unions could also be consid-ered, but given the uncertainty in the applicability of the empiri-cal studies conducted so far for advanced economies to develop-ing countries, this is not done here.
42The averages presented in Table 5.A10 exclude Panama, asthis country does not participate in CAFTA-DR.
0
1
2
3
4
5
6
Pana
ma
Pana
ma
Nica
ragu
a
Nica
ragu
a
Nica
ragu
a
Hon
dura
s
Hon
dura
s
Gua
tem
ala
Gua
tem
ala
El S
alva
dor
El S
alva
dor
Dom
inica
n Re
publ
ic
Dom
inica
n Re
publ
ic
Cost
a Ri
ca
Cost
a Ri
ca
7654321
Freq
uenc
y
Rankings1
Sources: IMF, World Economic Outlook; Direction of Trade Statistics; and IMF staff estimates.1 The vertical axis shows the number of times a given country appeared in a given ranking in terms of suitability
for dollarization compared with the Central American countries considered according to the six regressions used in the calculation of the indices. Thus, the rankings vary from I (most suitable for dollarization) to 6 (least suitable).
Figure 5.3. Comparison of OCA Indices vis-à-vis the United States,1994–2003

Conclusions
here as explanatory factors, that is, long-term struc-tural factors. Although in the long run this is a sensi-ble assumption, in the sample period under considera-tion several other factors (for example politicaldevelopments and various obstacles to capital flows)could have contributed to exchange rate and exchangemarket pressure developments and might have per-sisted long enough to affect the results.
Conclusions
This section analyzed the relative suitability of theCentral American countries for various types of ex-change rate regimes by adopting a uniform methodol-ogy and a regional perspective. It does not recom-mend or endorse any change of regime; the goal is to
provide analytical background to countries’ long-termconsiderations of their exchange rate regimes as theycontinue to integrate as a region and globally. CentralAmerica has made substantial strides in improvingmacroeconomic stability and economic integrationover the past decade. CAFTA-DR and other regionalinitiatives are expected to further integration with theUnited States, and also within the region. These de-velopments need to be taken into account in assessingthe long-run exchange rate regime options available tothe Central American countries.
The analysis suggests that if Central Americawere to choose to form a currency area, it would ap-pear more desirable to peg the currency to the U.S.dollar or dollarize rather than adopt a common Cen-tral American currency that floats versus the U.S.dollar. This is because the economic links and
85
Box 5.3. Projections for Indices of Central American Countries
An exercise was conducted to project the indices ofthe Central American countries for the period 2004–13,taking into account the possible impact of CAFTA-DR.This box describes how the projections for the indepen-dent variables were carried out.
As noted by Bayoumi and Eichengreen (1997), pro-jecting optimum currency area indices from the esti-mated equations is difficult, given that the explanatoryvariables are standard deviations or averages taken overa decade. In fact, there are at most three nonoverlappingobservations for each explanatory variable that can beobtained from the full sample used in this study. As a re-sult of such data limitations and because of the structuralbreaks observed in many countries in the sample, a sim-ple extrapolation using a deterministic time trend couldbe misleading in many cases. An exception is the SIZEvariable, which has exhibited a relatively stable trendover the sample period, and hence was extrapolatedusing a linear time trend in the projections.
Given these limitations, a less ambitious approachwas taken in this study with regard to the projections ofthe indices for Central America vis-à-vis the UnitedStates.
• First, for those explanatory variables for which lit-tle empirical or theoretical guidance is available forprojections, their actual values over the period of1994–2003 (the final 10-year period in the sample)were used as projected values. The variability of in-flation and the terms of trade fall in this category.
• Second, the variability of relative output was pro-jected by assuming the inception of CAFTA-DR in2005 and using information taken from Mexico’spost-NAFTA experience (see Section II). The stan-dard deviation of each country’s real GDP growthwas scaled down by the same proportion as the per-centage reduction in Mexico’s output variabilityfollowing the inception of NAFTA. Regarding co-
movements in output vis-à-vis the United States,two alternatives were considered for comparison byassuming either no change in output correlationafter the inception of CAFTA-DR or an increase toa level comparable to that of post-NAFTA Mexico.1
• Finally, the average trade ratio was projected usinginformation taken from Hilaire and Yang (2003),whose simulation results indicate that trade volumesbetween CAFTA-DR countries and the United Statescould more than triple after the inception of CAFTA-DR. It is assumed that the trade-promoting impact ofCAFTA-DR will occur at an equal and constant rateacross all Central American countries, reaching itsfull effect in five years’ time, and each country’sGDP is assumed to grow at the same rate as its 10-year historical average. For comparison, an alterna-tive was also considered under which the trade effectof CAFTA-DR progresses more slowly to reach itsfull effect after only 10 years.
Four sets of projections were carried out and for eachof these all six regressions were used; the results are re-ported in Table 5.A10. The first set of projections as-sumes that the full effect on trade takes 10 years to mate-rialize and assumes only a reduction in output volatility,with no increase in output correlations. The second sethas the same assumptions as the first, but also assumesthat output correlations with the United States becomethe same as Mexico’s after NAFTA. The third and fourthsets are the same as the first and the second, respectively,but with the assumption that the full trade effect ofCAFTA-DR materializes after five years.
1The method used for the output variability of individualcountries could not be applied to the correlation with theUnited States because of the initial correlation, which in somecases was negative, as well as the constraint of keeping thecorrelation in the interval [–1, 1].

V REGIONAL INTEGRATION AND EXCHANGE RATE ARRANGEMENTS
synchronization in business cycles existing at presentand expected to result from CAFTA-DR are greaterwith the United States than within the region.
The suitability of Central America for dollarizationhas increased in the past decade but still falls short ofthat of European countries for a currency area withGermany. Given the increased synchronization in eco-nomic cycles, reduced inflation differentials, and ris-ing trade flows, the Central American countries havebecome more suitable for dollar peg or dollarizationbetween 1993 and 2003.43 Despite these develop-
ments, the region still appears less suitable for a cur-rency union than member countries of EMU were inthe 1970s, 1980s, and 1990s, even taking into accountthe predicted effects of CAFTA-DR.
The relative suitability of the Central Americancountries for dollarization does not always reflectexisting exchange rate arrangements. Panama is themost suited country for dollarization, andGuatemala follows. Costa Rica and El Salvador arenext. The Dominican Republic, Honduras, andNicaragua are the least suited for dollarization andhence the most suited for a flexible exchange rateversus the U.S. dollar.
If the Central American countries were to choosedollarization as their long-term objective, the prereq-uisites and convergence criteria should be consideredcarefully. This is particularly important in light of the
86
43The relative suitability for dollarization of different countriesdoes not always reflect these countries’ present exchange rate regimes. For example, Guatemala, which has one of the most flexible regimes, appears to be one of the candidates most suitedfor dollarization. The countries that are relatively less suited for acurrency area are Honduras and Nicaragua.
0
0.04
0.02
0.06
0.08
0.10
0.12
0.14
0.16
0.18
0.20
0
45 degree line
Dominican RepublicHonduras
GreecePortugal
Ireland
Spain
Italy
AustriaFrance
Netherlands
Costa RicaEl Salvador
Nicaragua
Guatemala
Period 1*
Perio
d 2*
*
0.02 0.04 0.06 0.08 0.10 0.12 0.14 0.16 0.18 0.20
Sources: IMF, World Economic Outlook; Direction of Trade Statistics; and IMF staff estimates.*Period 1: 1984–93 for Central American countries; 1970–79 for Europe.**Period 2: 1994–03 for Central American countries; 1980–89 for Europe.Lower values of the index denote greater suitability for exchange rate fixity with Germany for European
countries, and for dollarization for Central America. Points below the 45-degree line indicate greater suitability for these exchange rate arrangements in the latter period.
Figure 5.4. Central America and Europe: Optimum Currency Area Indices

Appendix
fact that fiscal discipline is key when adopting an in-flexible exchange rate regime. Indeed, the Maastrichtfiscal convergence criteria have been important mile-stones for EMU. In addition to fiscal discipline, sev-eral other structural and institutional reforms are alsoprerequisites for dollarization, in particular, reformsthat increase the flexibility of factor markets andstrengthen the financial sector. For economies alreadydollarized, the focus should be on policies that ensureadequate competitiveness and the sustainability ofregimes, including through appropriate wage policies.
Shorter-term considerations regarding the choice ofexchange rate regimes and country-specific circum-stances may lead to conclusions that differ from thosesuggested in this section. Existing constraints maylimit the choices of exchange rate regimes in the shortrun or simply make a different choice more desirable.Whatever the exchange rate regime chosen in the shortrun, consolidating prudent economic management, in-troducing the necessary structural reforms, and build-ing institutions would ensure that policymakers have,in the longer run, the option to choose among the fullrange of possible exchange rate regimes.
Appendix. Technical Appendix
The Bayoumi and Eichengreen OptimumCurrency Area Index
Bayoumi and Eichengreen developed a procedureto operationalize the optimum currency area theory.They have applied this approach to several parts ofthe world, but the paper taken as a specific referencein this section is the one that applies it to WesternEurope (Bayoumi and Eichengreen, 1997).
Bayoumi and Eichengreen first estimated an equa-tion that relates exchange rate variability to variablesthat are deemed to determine a country’s suitabilityfor participating in a currency area. They focused onthe variability of nominal bilateral exchange rates, be-cause a currency union would be equivalent to fixingthe nominal exchange rates. The explanatory vari-ables are a proxy for the synchronization of outputmovements, the extent of bilateral trade, the dissimi-larity in the commodity composition of exports, andthe size of the economies. Other variables that the op-timum currency area literature has identified, such asfactor mobility and automatic stabilizers, have notplayed an important role across national borders, andhence were not included in this specification.
The exact definitions of the variables employed byBayoumi and Eichengreen are as follows. The de-pendent variable, SD(E), is the standard deviation ofthe difference in the logs of the bilateral exchangerates over a given sample period. Hence, the higherthis variable, the higher the exchange rate variability
between the currencies of the two countries and theless suitable they are for a currency union. The inde-pendent variables are the following:
SD(Y), the standard deviation of the differences ofthe relative output of the two countries over agiven sample period—the higher this variable, theless synchronized business cycles are.
TRADE, the mean of the bilateral exports to GDPover the given sample period—the higher thisvariable, the larger the extent of bilateral trade.
DIS, the sum of the absolute differences betweenthe shares of five categories of export commodi-ties in total exports in the two countries over agiven sample period—the higher this variable, thelarger the dissimilarity in the export composition.
SIZE, the mean of the logs of the GDP of the twocountries in dollars, reflecting the countries’ size.
This is a cross-section equation with as many ob-servations as there are pairs of countries. The sampleperiod determines over which time horizon the stan-dard deviations and means are calculated.
The expected signs are all positive, except for thaton bilateral trade. The higher the standard deviation ofrelative output movements, the greater the dissimilar-ity in the composition of trade; and the larger the sizeof the countries, the greater the expected exchangerate variability, and hence the less suited these coun-tries are to forming a currency union. On the otherhand, the trade variable is expected to have a negativesign, as the more countries trade with each other, thesmaller the expected exchange rate variability.
The equation estimated by Bayoumi and Eichen-green is
SD(Eij) = –0.09 + 1.46 SD(Yij) + 0.022 DISij(0.02) (0.21) (0.006)
– 0.054 TRADEij + 0.012 SIZEij,(0.006) (0.001)
R2 = 0.51, number of observations = 210
where the subscripts ij denote the pair formed of coun-tries i and j. Standard errors are reported in brackets.
Bayoumi and Eichengreen then used the estimatedequation to predict the optimum currency area in-dices. The latter are the predicted value of the depen-dent variable (the standard deviation of the differ-ence in the logs of the bilateral exchange rates)obtained by using a projected value of the explana-tory variables, which are projected by extrapolatingthe trend. They calculated optimum currency area in-dices for 1987, 1991, and 1995, and reported thoseagainst Germany for 15 western European countries.Smaller values for this index denote greater suitabil-ity for a currency area.
87

V REGIONAL INTEGRATION AND EXCHANGE RATE ARRANGEMENTS
88
Tabl
e 5.
A1.
Co
-Mov
emen
ts in
Out
put1
Cen
tral
Am
eric
a an
d th
e U
nite
d St
ates
2__
____
____
____
____
____
____
____
____
____
____
____
____
____
____
____
____
____
____
____
____
____
____
____
____
____
____
____
____
____
____
____
____
___
Uni
ted
Cos
ta
Dom
inic
an
Stat
esR
ica
Rep
ublic
El S
alva
dor
Gua
tem
ala
Hon
dura
sN
icar
agua
Pana
ma
Uni
ted
Stat
es0.
026
0.04
50.
021
0.03
10.
023
0.04
90.
077
Cos
ta R
ica
0.02
10.
032
0.02
40.
023
0.02
40.
039
0.07
0D
omin
ican
R
epub
lic0.
022
0.03
50.
050
0.04
00.
035
0.05
60.
089
El S
alva
dor
0.01
70.
024
0.02
80.
025
0.02
70.
045
0.07
1G
uate
mal
a 0.
010
0.02
20.
022
0.01
00.
022
0.04
50.
073
Hon
dura
s 0.
029
0.04
30.
035
0.03
20.
027
0.04
70.
076
Nic
arag
ua
0.01
50.
029
0.02
30.
018
0.01
50.
035
0.03
7Pa
nam
a 0.
017
0.02
70.
026
0.02
90.
022
0.03
10.
025
Euro
pe3
____
____
____
____
____
____
____
____
____
____
____
____
____
____
____
____
____
____
____
____
____
____
____
____
____
____
____
____
____
____
____
____
____
_U
nite
dG
erm
any
Fran
ceIt
aly
Spai
nPo
rtug
alBe
lgiu
mLu
xem
bour
gIr
elan
dN
ethe
rlan
dsA
ustr
iaFi
nlan
dG
reec
eD
enm
ark
Swed
enK
ingd
om
Ger
man
y0.
011
0.02
00.
029
0.02
50.
018
0.01
70.
031
0.01
50.
019
0.02
70.
030
0.01
20.
029
0.01
6Fr
ance
0.03
50.
020
0.02
10.
028
0.01
30.
016
0.02
90.
007
0.01
60.
025
0.03
40.
019
0.02
50.
019
Ital
y0.
042
0.01
40.
033
0.03
00.
020
0.01
90.
033
0.02
00.
025
0.03
30.
049
0.02
70.
032
0.02
7Sp
ain
0.03
10.
013
0.01
70.
037
0.02
20.
030
0.03
50.
022
0.02
60.
031
0.04
10.
030
0.03
30.
028
Port
ugal
0.05
20.
023
0.02
40.
023
0.02
80.
030
0.03
20.
032
0.02
80.
036
0.04
30.
031
0.04
50.
028
Belg
ium
0.04
20.
011
0.00
70.
016
0.02
10.
011
0.03
50.
011
0.02
10.
027
0.03
90.
022
0.02
70.
025
Luxe
mbo
urg
0.03
70.
024
0.02
60.
022
0.03
30.
024
0.03
50.
016
0.02
50.
025
0.04
00.
024
0.02
50.
026
Irel
and
0.03
80.
015
0.01
70.
019
0.02
50.
016
0.02
70.
034
0.03
60.
042
0.05
00.
038
0.04
80.
031
Net
herl
ands
0.03
00.
016
0.01
50.
015
0.03
10.
017
0.02
10.
018
0.01
80.
028
0.03
70.
021
0.02
40.
023
Aus
tria
0.03
90.
011
0.01
60.
017
0.02
50.
015
0.02
90.
020
0.01
60.
026
0.04
10.
023
0.03
00.
029
Finl
and
0.04
20.
009
0.01
00.
016
0.02
10.
008
0.02
90.
015
0.01
80.
012
0.03
90.
032
0.01
80.
029
Gre
ece
0.04
00.
019
0.01
70.
025
0.03
40.
015
0.02
20.
021
0.01
80.
022
0.01
90.
029
0.04
00.
028
Den
mar
k0.
035
0.02
50.
025
0.02
80.
044
0.02
80.
038
0.03
20.
024
0.02
30.
026
0.02
80.
034
0.01
9Sw
eden
0.03
80.
014
0.01
00.
016
0.02
90.
013
0.02
90.
019
0.01
40.
015
0.01
20.
021
0.01
90.
032
Uni
ted
Kin
gdom
0.02
50.
022
0.02
50.
016
0.03
70.
027
0.03
00.
031
0.02
00.
024
0.02
60.
031
0.02
10.
022
Sour
ces:
IMF,
Wor
ld E
cono
mic
Out
look
;and
IMF
staf
f est
imat
es.
1 The
co-
mov
emen
ts in
out
put
are
mea
sure
d as
the
sta
ndar
d de
viat
ion
of t
he d
iffer
ence
in t
he lo
gari
thm
of t
he r
eal o
utpu
t of
tw
o co
untr
ies.
Low
er v
alue
s in
dica
te g
reat
er c
o-m
ovem
ent.
2 In
the
uppe
r pa
rt o
f the
mat
rix
the
peri
od is
198
4–93
;in
the
low
er p
art
1994
–200
3.Bo
ld in
dica
tes
that
out
put
co-m
ovem
ents
incr
ease
d in
late
r pe
riod
.3 I
n th
e up
per
part
of t
he m
atri
x th
e pe
riod
is 1
970–
79;i
n th
e lo
wer
par
t 19
80–8
9.Bo
ld in
dica
tes
that
out
put
co-m
ovem
ents
incr
ease
d in
late
r pe
riod
.

Appendix
89
Table 5.A2. Source of Output Co-Movements
Correlations of Output Growth____________________________________________________________________________________United DominicanStates Costa Rica Republic El Salvador Guatemala Honduras Nicaragua Panama
United States 0.230 0.125 0.327 –0.463 0.246 –0.284 –0.387Costa Rica 0.599 0.699 0.363 0.425 0.405 0.380 0.069Dominican Republic 0.533 0.114 –0.147 0.399 0.641 0.120 –0.224El Salvador 0.311 0.409 0.154 0.104 0.048 0.015 –0.040Guatemala 0.592 0.524 0.550 0.809 0.383 0.022 –0.106Honduras –0.184 –0.436 0.058 –0.226 –0.012 –0.103 –0.249Nicaragua 0.523 0.153 0.522 0.429 0.547 –0.324 0.881Panama 0.719 0.388 0.428 –0.067 0.327 0.132 0.244
Correlations of Output Growth After Eliminating the United States’ Influence1____________________________________________________________________________________
DominicanCosta Rica Republic El Salvador Guatemala Honduras Nicaragua Panama
Costa Rica 0.694 0.307 0.645 0.311 0.498 0.225Dominican Republic –0.149 –0.198 0.522 0.606 0.177 –0.162El Salvador 0.292 0.003 0.294 –0.037 0.119 0.099Guatemala 0.433 0.456 0.616 0.490 –0.067 –0.248Honduras –0.458 0.102 –0.188 –0.075 –0.064 –0.205Nicaragua 0.066 0.449 0.289 0.637 –0.348 0.876Panama 0.266 0.305 –0.200 0.517 0.023 0.431
Sources: IMF, World Economic Outlook; and IMF staff estimates.Note:The upper part of each matrix reports correlations over the period 1984–93, while the lower part refers to the period 1994–2003.1To eliminate the United States’ influence, the output growth series were first regressed over U.S. growth and the correlations taken on the residuals.
Table 5.A3. Terms of Trade1
1984–93 1994–2003 1970–79 1980–89
Central America 8.18 9.94 Europe 4.43 3.95Costa Rica 7.37 0.32 Austria 1.67 2.35Dominican Republic 14.29 2.72 Belgium 1.92 1.82El Salvador 14.03 12.46 Finland . . . . . .Guatemala 6.57 7.71 France 3.53 3.20Honduras 4.86 8.25 Germany 3.11 4.13Nicaragua 5.35 35.21 Greece 13.37 7.24Panama 4.77 2.93 Ireland 6.14 2.41
Italy 3.82 3.97United States 1.83 1.48 Luxembourg . . . . . .
Netherlands 1.53 1.66Portugal 4.14 7.72Spain 5.07 5.03
Sources: IMF, World Economic Outlook; and IMF staff estimates.1Averages of absolute annual percentage changes in the terms of trade.

V REGIONAL INTEGRATION AND EXCHANGE RATE ARRANGEMENTS
90
Tabl
e 5.
A4.
Co
-Mov
emen
ts in
the
Ter
ms
of
Tra
de1
Cen
tral
Am
eric
a an
d th
e U
nite
d St
ates
2__
____
____
____
____
____
____
____
____
____
____
____
____
____
____
____
____
____
____
____
____
____
____
____
____
____
____
____
____
____
____
___
Uni
ted
Cos
ta
Dom
inic
an
Stat
esR
ica
Rep
ublic
El S
alva
dor
Gua
tem
ala
Hon
dura
sN
icar
agua
Pana
ma
Uni
ted
Stat
es0.
026
0.04
50.
021
0.03
10.
023
0.04
90.
077
Uni
ted
Stat
es0.
090
0.17
90.
172
0.07
40.
096
0.06
70.
058
Cos
ta R
ica
0.01
90.
199
0.12
80.
053
0.13
00.
125
0.08
4D
omin
ican
Rep
ublic
0.02
80.
037
0.19
00.
189
0.25
50.
213
0.19
3El
Sal
vado
r 0.
176
0.18
20.
168
0.11
70.
219
0.20
40.
151
Gua
tem
ala
0.08
70.
091
0.07
70.
183
0.12
80.
114
0.05
7H
ondu
ras
0.09
10.
096
0.08
60.
197
0.03
10.
088
0.11
1N
icar
agua
0.
413
0.40
20.
421
0.49
20.
435
0.44
00.
085
Pana
ma
0.03
90.
036
0.04
60.
191
0.08
60.
085
0.40
6
Euro
pe3
____
____
____
____
____
____
____
____
____
____
____
____
____
____
____
____
____
____
____
____
____
____
____
____
____
____
____
____
____
____
____
__G
erm
any
Fran
ceIt
aly
Spai
nPo
rtug
alBe
lgiu
mLu
xem
bour
gIr
elan
dN
ethe
rlan
dsA
ustr
iaFi
nlan
dG
reec
e
Ger
man
y0.
033
0.03
20.
062
0.07
20.
048
...
0.07
80.
036
0.03
5..
.0.
188
Fran
ce0.
030
0.04
70.
055
0.06
90.
050
...
0.07
00.
046
0.04
7..
.0.
196
Ital
y0.
031
0.03
10.
053
0.08
10.
056
...
0.08
00.
045
0.05
3..
.0.
186
Spai
n0.
038
0.04
00.
036
0.08
30.
070
...
0.07
10.
064
0.07
5..
.0.
182
Port
ugal
0.10
70.
125
0.12
60.
117
0.04
1..
.0.
109
0.05
80.
053
...
0.21
1Be
lgiu
m0.
049
0.04
70.
052
0.06
50.
101
...
0.08
90.
022
0.02
4..
.0.
195
Luxe
mbo
urg
...
...
...
...
...
...
...
...
...
...
...
Irel
and
0.04
40.
034
0.05
10.
056
0.11
90.
039
...
0.08
10.
088
...
0.17
8N
ethe
rlan
ds0.
058
0.04
40.
058
0.07
20.
122
0.02
8..
.0.
035
0.02
4..
.0.
185
Aus
tria
0.05
70.
046
0.05
30.
064
0.12
60.
038
...
0.03
50.
031
...
0.18
7Fi
nlan
d0.
152
0.13
50.
147
0.16
30.
220
0.14
0..
.0.
135
0.11
70.
128
...
Gre
ece
0.09
10.
100
0.09
50.
109
0.10
00.
076
...
0.10
70.
097
0.10
80.
185
Sour
ces:
IMF,
Wor
ld E
cono
mic
Out
look
;and
IMF
staf
f est
imat
es.
1 The
co-
mov
emen
ts in
ter
ms
of t
rade
are
mea
sure
d as
the
sta
ndar
d de
viat
ion
of t
he d
iffer
ence
in t
he lo
gari
thm
of t
he t
erm
s of
tra
de o
f tw
o co
untr
ies.
A lo
wer
num
ber
indi
cate
s gr
eate
r co
-mov
emen
t.2 I
n th
e up
per
part
of t
he m
atri
x th
e pe
riod
is 1
984–
93;i
n th
e lo
wer
par
t 19
94–2
003.
Bold
indi
cate
s th
at t
erm
s of
tra
de c
o-m
ovem
ents
incr
ease
d in
late
r pe
riod
.

Appendix
91
Tabl
e 5.
A5.
Co
rrel
atio
ns o
fTer
ms
ofT
rade
Cen
tral
Am
eric
a an
d th
e U
nite
d St
ates
1__
____
____
____
____
____
____
____
____
____
____
____
____
____
____
____
____
____
____
____
____
____
____
____
____
____
____
____
____
____
____
___
Uni
ted
Cos
ta
Dom
inic
an
Stat
esR
ica
Rep
ublic
El S
alva
dor
Gua
tem
ala
Hon
dura
sN
icar
agua
Pana
ma
Uni
ted
Stat
es0.
532
0.41
10.
635
0.60
2–0
.464
–0.0
890.
307
Cos
ta R
ica
0.03
30.
144
0.76
00.
848
0.00
3–0
.157
0.54
9D
omin
ican
Rep
ublic
0.61
5–0
.265
0.48
10.
210
–0.7
50–0
.287
0.05
9El
Sal
vado
r 0.
238
–0.5
700.
406
0.88
7–0
.209
–0.1
430.
692
Gua
tem
ala
0.25
3–0
.314
0.53
60.
207
–0.1
54–0
.176
0.75
3H
ondu
ras
0.31
2–0
.305
0.41
60.
075
0.94
70.
285
–0.1
74N
icar
agua
–0
.590
–0.0
92–0
.512
–0.3
37–0
.278
–0.3
090.
012
Pana
ma
–0.0
14–0
.375
0.11
5–0
.269
0.28
70.
450
–0.0
91
Euro
pe2
____
____
____
____
____
____
____
____
____
____
____
____
____
____
____
____
____
____
____
____
____
____
____
____
____
____
____
____
____
____
____
__G
erm
any
Fran
ceIt
aly
Spai
nPo
rtug
alBe
lgiu
mLu
xem
bour
gIr
elan
dN
ethe
rlan
dsA
ustr
iaFi
nlan
dG
reec
e
Ger
man
y0.
816
0.82
00.
669
–0.0
780.
097
...
0.61
70.
506
0.57
6..
.0.
205
Fran
ce0.
871
0.65
00.
744
0.22
40.
458
...
0.70
60.
658
0.58
7..
.0.
074
Ital
y0.
872
0.86
00.
766
–0.0
530.
248
...
0.56
20.
651
0.32
7..
.0.
254
Spai
n0.
873
0.88
20.
890
0.30
80.
572
...
0.69
30.
881
0.41
9..
.0.
331
Port
ugal
0.48
60.
163
0.19
40.
388
0.70
4..
.0.
052
0.04
70.
267
...
–0.2
25Be
lgiu
m0.
645
0.42
20.
544
0.60
20.
867
...
0.42
30.
562
0.52
5..
.–0
.059
Luxe
mbo
urg
...
...
...
...
...
...
...
...
...
...
...
Irel
and
0.70
60.
760
0.53
70.
753
0.23
50.
220
...
0.81
50.
507
...
0.38
8N
ethe
rlan
ds0.
296
0.56
10.
313
0.39
80.
115
0.27
1..
.0.
341
0.34
2..
.0.
395
Aus
tria
0.37
60.
480
0.47
60.
603
0.00
60.
070
...
0.44
20.
255
...
0.28
2Fi
nlan
d–0
.258
–0.0
76–0
.157
–0.4
13–0
.522
–0.4
93..
.–0
.348
0.48
2–0
.028
...
Gre
ece
0.37
80.
155
0.30
40.
197
0.60
20.
770
...
–0.2
14–0
.050
–0.3
56–0
.554
Sour
ces:
IMF,
Wor
ld E
cono
mic
Out
look
;and
IMF
staf
f est
imat
es.
1 In
the
uppe
r pa
rt o
f the
mat
rix
the
peri
od is
198
4–93
;in
the
low
er p
art,
1994
–200
3.Bo
ld in
dica
tes
that
ter
ms
of t
rade
cor
rela
tion
incr
ease
d in
late
r pe
riod
.2 I
n th
e up
per
part
of t
he m
atri
x th
e pe
riod
is 1
970–
79;i
n th
e lo
wer
par
t,19
80–8
9.Bo
ld in
dica
tes
that
ter
ms
of t
rade
cor
rela
tion
incr
ease
d in
late
r pe
riod
.

V REGIONAL INTEGRATION AND EXCHANGE RATE ARRANGEMENTS
92
Table 5.A6. Inflation Performance
Average1 Coefficient of Variation_____________________________ _____________________________1984–93 1994–2003 1984–93 1994–2003
Central America 467.90 9.46Costa Rica 17.23 12.99 0.33 0.33Dominican Republic 27.83 9.50 0.69 0.70El Salvador 19.67 4.75 0.33 0.85Guatemala 17.22 7.88 0.94 0.32Honduras 10.79 15.66 0.94 0.48Nicaragua 3,181.73 14.37 1.47 0.69Panama 0.84 1.09 0.74 1.09
United States 3.80 2.45 0.32 0.27
Average1 Coefficient of Variation_____________________________ _____________________________1970–79 1980–89 1970–79 1980–89
Europe 8.76 7.78 . . . . . .Austria 6.10 3.80 0.34 0.54Belgium 7.13 4.90 0.47 0.59Finland 10.41 7.28 0.26 0.45France 8.92 7.34 0.55 0.41Germany 4.88 2.75 0.56 1.59Greece 7.13 12.30 0.21 0.17Ireland 12.75 9.26 0.26 0.63Italy 12.46 11.38 0.37 0.61Luxembourg 7.00 4.72 0.80 1.32Netherlands 7.07 2.84 0.50 1.21Portugal 7.13 16.56 0.33 0.17Spain 14.12 10.25 0.24 0.76
Sources: IMF, World Economic Outlook; and IMF staff estimates.1In percent, period average.

Appendix
93
Tabl
e 5.
A7.
Co
-Mov
emen
ts in
Pri
ces1
Cen
tral
Am
eric
a an
d th
e U
nite
d St
ates
2__
____
____
____
____
____
____
____
____
____
____
____
____
____
____
____
____
____
____
____
____
____
____
____
____
____
____
____
____
____
____
___
Uni
ted
Cos
ta
Dom
inic
an
Stat
esR
ica
Rep
ublic
El S
alva
dor
Gua
tem
ala
Hon
dura
sN
icar
agua
Pana
ma
Uni
ted
Stat
es0.
045
0.14
60.
058
0.13
90.
082
1.78
70.
011
Cos
ta R
ica
0.03
60.
136
0.08
30.
137
0.06
51.
763
0.04
6D
omin
ican
Rep
ublic
0.05
70.
071
0.16
30.
164
0.13
51.
685
0.15
4El
Sal
vado
r0.
036
0.02
50.
071
0.13
50.
113
1.78
20.
058
Gua
tem
ala
0.02
30.
032
0.06
60.
026
0.10
91.
756
0.14
1H
ondu
ras
0.06
30.
033
0.09
40.
039
0.05
21.
754
0.08
5N
icar
agua
0.07
90.
078
0.10
30.
064
0.06
90.
076
1.79
4Pa
nam
a0.
013
0.04
40.
060
0.03
90.
023
0.06
80.
076
Euro
pe3
____
____
____
____
____
____
____
____
____
____
____
____
____
____
____
____
____
____
____
____
____
____
____
____
____
____
____
____
____
____
____
__G
erm
any
Fran
ceIt
aly
Spai
nPo
rtug
alBe
lgiu
mLu
xem
bour
gIr
elan
dN
ethe
rlan
dsA
ustr
iaFi
nlan
dG
reec
e
Ger
man
y0.
026
0.05
10.
055
0.02
50.
025
0.02
60.
038
0.01
40.
011
0.03
90.
025
Fran
ce0.
024
0.03
00.
038
0.02
00.
020
0.02
20.
027
0.02
70.
022
0.02
90.
020
Ital
y0.
039
0.01
70.
027
0.03
60.
036
0.03
70.
030
0.04
70.
045
0.02
70.
036
Spai
n0.
023
0.01
30.
023
0.04
80.
048
0.05
00.
048
0.05
30.
052
0.04
20.
048
Port
ugal
0.06
20.
065
0.07
50.
063
0.00
00.
004
0.01
90.
018
0.01
60.
018
0.00
0Be
lgiu
m0.
015
0.01
80.
033
0.01
60.
053
0.00
40.
020
0.01
80.
016
0.01
80.
000
Luxe
mbo
urg
0.01
70.
019
0.03
20.
019
0.05
30.
008
0.01
80.
018
0.01
70.
019
0.00
4Ir
elan
d0.
045
0.02
40.
015
0.03
20.
078
0.04
10.
039
0.03
00.
030
0.02
00.
019
Net
herl
ands
0.01
20.
016
0.03
00.
014
0.06
30.
013
0.01
60.
037
0.00
90.
030
0.01
8A
ustr
ia0.
011
0.02
40.
038
0.02
00.
061
0.01
50.
021
0.04
50.
010
0.03
10.
016
Finl
and
0.01
20.
017
0.03
00.
019
0.06
60.
016
0.01
70.
037
0.00
90.
014
0.01
8G
reec
e0.
068
0.08
70.
100
0.08
00.
099
0.07
50.
080
0.10
70.
074
0.06
80.
076
Sour
ces:
IMF,
Wor
ld E
cono
mic
Out
look
;and
IMF
staf
f est
imat
es.
1 The
co-
mov
emen
ts in
pri
ces
are
mea
sure
d as
the
sta
ndar
d de
viat
ion
of t
he d
iffer
ence
in t
he lo
gari
thm
of t
he p
rice
leve
ls o
f tw
o co
untr
ies.
A lo
wer
num
ber
indi
cate
s gr
eate
r co
-mov
emen
t.2 I
n th
e up
per
part
of t
he m
atri
x th
e pe
riod
is 1
984–
93;i
n th
e lo
wer
par
t,19
94–2
003.
Bold
indi
cate
s th
at p
rice
co-
mov
emen
ts in
crea
sed
in la
ter
peri
od.
3 In
the
uppe
r pa
rt o
f the
mat
rix
the
peri
od is
197
0–79
;in
the
low
er p
art,
1980
–89.
Bold
indi
cate
s th
at p
rice
co-
mov
emen
ts in
crea
sed
in la
ter
peri
od.

V REGIONAL INTEGRATION AND EXCHANGE RATE ARRANGEMENTS
94
Tabl
e 5.
A8.
Opt
imum
Cur
renc
y A
rea
Inde
x:R
egre
ssio
n R
esul
ts
Reg
ress
or1
____
____
____
____
____
____
____
____
____
____
____
____
____
____
____
____
____
____
___
Dep
ende
nt V
aria
ble
Con
stan
tSD
(Y)
SD(P
)SD
(TOT
)TR
ADE
SIZ
ESa
mpl
e2R2
NO
BS3
1.Ex
chan
ge M
arke
t Pr
essu
re4
(EM
P)
Reg
ress
ion
(1)
0.10
6***
1.07
2***
0.55
8***
0.02
8–1
.699
***
0.00
5***
1970
–200
30.
703
1,30
8R
egre
ssio
n (2
)0.
137*
**0.
635*
**0.
609*
**–0
.008
–1.9
88**
*0.
001
1980
–200
30.
663
1,30
8R
egre
ssio
n (3
)0.
125*
**0.
825*
**0.
552*
**–0
.020
–1.4
83**
*0.
000
1990
–200
30.
536
1,30
8
2.SD
(EX
R)5
Reg
ress
ion
(4)
–0.0
030.
493*
**0.
920*
**0.
081*
**–1
.355
***
0.00
7***
1970
–200
30.
871
1,30
8R
egre
ssio
n (5
)0.
020*
**0.
372*
**0.
914*
**0.
014
–1.8
24**
*0.
006*
**19
80–2
003
0.81
11,
308
Reg
ress
ion
(6)
0.02
4***
0.37
7***
0.89
4***
–0.0
29*
–1.5
86**
*0.
005*
**19
90–2
003
0.80
81,
308
Sour
ces:
IMF,
Wor
ld E
cono
mic
Out
look
,Dire
ctio
n of
Trad
e St
atist
ics;a
nd IM
F st
aff e
stim
ates
.N
ote:
One
,tw
o,an
d th
ree
aste
risk
s in
dica
te s
igni
fican
ce a
t 10
,5,a
nd 1
per
cent
,res
pect
ivel
y.1 F
or t
he d
efin
ition
s of
reg
ress
ors,
see
Box
5.1.
2 All
vari
able
s in
clud
ed in
the
reg
ress
ions
are
cal
cula
ted
over
the
spe
cifie
d sa
mpl
e pe
riod
.3 W
ith 5
3 co
untr
ies
cove
red
by t
he s
ampl
e,th
ere
are
1,37
8 ob
serv
atio
ns in
tot
al,o
ut o
f whi
ch 1
,308
obs
erva
tions
are
use
d in
est
imat
ion
afte
r ex
clud
ing
mis
sing
val
ues.
4 EM
Pis
def
ined
as
the
aver
age
of s
tand
ard
devi
atio
ns o
f per
cent
age
chan
ges
in b
ilate
ral e
xcha
nge
rate
and
fore
ign
rese
rves
.5 S
D(E
XR)
ref
ers
to t
he s
tand
ard
devi
atio
n of
per
cent
age
chan
ges
in b
ilate
ral e
xcha
nge
rate
.

Appendix
95
Tabl
e 5.
A9.
Opt
imum
Cur
renc
y A
rea
Indi
ces
for
Cen
tral
Am
eric
a an
d E
uro
pe v
is-à
-vis
Anc
hor
Co
untr
y
Reg
ress
ion
(1)
Reg
ress
ion
(2)
Reg
ress
ion
(3)
Reg
ress
ion
(4)
Reg
ress
ion
(5)
Reg
ress
ion
(6)
____
____
____
____
____
____
____
____
____
____
____
____
____
____
____
____
____
____
____
____
____
____
____
____
1984
–93
1994
–200
319
84–9
319
94–2
003
1984
–93
1994
–200
319
84–9
319
94–2
003
1984
–93
1994
–200
319
84–9
319
94–2
003
1.C
entr
al A
mer
ica1
Cos
ta R
ica
0.17
60.
169
0.17
40.
169
0.16
20.
157
0.08
30.
075
0.09
20.
088
0.08
80.
086
Dom
inic
an R
epub
lic0.
235
0.18
00.
225
0.17
90.
212
0.16
70.
158
0.09
20.
160
0.10
40.
152
0.10
1El
Sal
vado
r 0.
179
0.17
10.
177
0.16
90.
163
0.15
50.
094
0.08
60.
100
0.09
30.
093
0.08
6G
uate
mal
a 0.
226
0.15
70.
224
0.15
80.
209
0.14
40.
155
0.06
90.
164
0.07
90.
159
0.07
5H
ondu
ras
0.19
10.
189
0.19
10.
185
0.17
70.
173
0.10
90.
099
0.11
80.
107
0.11
30.
102
Nic
arag
ua
0.32
40.
184
0.32
80.
181
0.30
60.
163
0.30
00.
114
0.30
70.
112
0.29
90.
099
Pana
ma
0.21
30.
157
0.19
00.
158
0.18
80.
145
0.08
40.
060
0.08
90.
073
0.08
70.
071
Ave
rage
0.22
10.
173
0.21
60.
171
0.20
30.
158
0.14
00.
085
0.14
70.
094
0.14
20.
089
Ave
rage
of o
wn
indi
ces2
0.22
90.
162
0.23
60.
168
0.22
40.
159
0.16
10.
070
0.16
70.
074
0.16
20.
070
1970
–79
1980
–891
990–
9819
70–7
919
80–8
919
90–9
819
70–7
919
80–8
919
90–9
819
70–7
919
80–8
919
90–9
819
70–7
919
80–8
919
90–9
819
70–7
919
80–8
919
90–9
8
2.EM
U C
ount
ries
1,3
Fran
ce0.
119
0.13
60.
147
0.11
00.
116
0.12
20.
109
0.12
10.
127
0.03
90.
045
0.05
10.
040
0.04
10.
045
0.04
30.
045
0.04
8It
aly
0.14
50.
156
0.15
40.
136
0.13
50.
130
0.13
40.
139
0.13
30.
066
0.06
20.
058
0.06
80.
060
0.05
40.
070
0.06
30.
055
Spai
n0.
183
0.16
70.
171
0.17
60.
157
0.15
20.
166
0.15
00.
149
0.09
40.
068
0.06
80.
102
0.07
60.
070
0.09
80.
074
0.06
9Po
rtug
al0.
166
0.20
80.
186
0.16
40.
194
0.17
40.
153
0.18
70.
167
0.06
90.
107
0.08
60.
079
0.11
10.
093
0.07
60.
107
0.09
0Ir
elan
d0.
177
0.18
60.
199
0.17
40.
180
0.18
00.
164
0.17
10.
177
0.07
90.
086
0.08
10.
088
0.09
50.
087
0.08
50.
093
0.08
5N
ethe
rlan
ds0.
096
0.10
50.
138
0.08
50.
085
0.11
40.
091
0.09
60.
122
0.01
30.
016
0.04
00.
009
0.00
70.
034
0.01
50.
013
0.03
8A
ustr
ia0.
138
0.14
80.
147
0.13
30.
132
0.13
00.
128
0.13
40.
131
0.04
20.
046
0.04
70.
049
0.04
60.
047
0.05
00.
048
0.04
9G
reec
e0.
173
0.20
10.
191
0.16
50.
191
0.17
90.
155
0.18
20.
171
0.07
80.
110
0.09
10.
081
0.11
50.
098
0.07
60.
111
0.09
5A
vera
ge0.
150
0.16
30.
167
0.14
30.
149
0.14
80.
138
0.14
70.
147
0.06
00.
068
0.06
50.
064
0.06
90.
066
0.06
40.
069
0.06
6
Ave
rage
of o
wn
indi
ces2
0.17
00.
167
0.15
00.
166
0.16
70.
150
0.15
70.
156
0.14
00.
070
0.07
90.
057
0.07
80.
088
0.06
80.
075
0.08
50.
067
Sour
ces:
IMF,
Wor
ld E
cono
mic
Out
look
;Dire
ctio
n of
Trad
e St
atist
ics;a
nd IM
F st
aff e
stim
ates
.1 T
he U
nite
d St
ates
is c
onsi
dere
d th
e an
chor
cou
ntry
for
Cen
tral
Am
eric
a,an
d G
erm
any
for
Euro
pe.
2 Ave
rage
of o
ptim
um c
urre
ncy
area
indi
ces
cons
truc
ted
for
pair
s of
cou
ntri
es,e
xclu
ding
Uni
ted
Stat
es fo
r C
entr
al A
mer
ica
and
Ger
man
y fo
r EM
U c
ount
ries
.3 B
elgi
um,F
inla
nd,a
nd L
uxem
bour
g ar
e ex
clud
ed b
ecau
se o
f mis
sing
val
ues
in t
rade
rel
ated
dat
a.

V REGIONAL INTEGRATION AND EXCHANGE RATE ARRANGEMENTS
96
Tabl
e 5.
A10
.Cen
tral
Am
eric
a:P
roje
ctio
ns fo
r th
e O
ptim
um C
urre
ncy
Are
a In
dice
s vi
s-à-
vis
the
Uni
ted
Sta
tes
OC
A In
dex
Diff
eren
ce B
etw
een
Proj
ecte
d In
dex
and
Inde
x in
199
4–20
031
____
____
____
____
____
____
____
____
____
____
____
____
___
____
____
____
____
____
____
____
____
____
____
____
____
___
12
34
56
12
34
56
Sim
ulat
ion
1
Cos
ta R
ica
0.16
40.
164
0.15
20.
074
0.08
70.
085
–0.0
05–0
.005
–0.0
05–0
.001
–0.0
01–0
.001
Dom
inic
an R
epub
lic0.
172
0.17
10.
159
0.08
70.
098
0.09
6–0
.009
–0.0
08–0
.007
–0.0
05–0
.005
–0.0
05El
Sal
vado
r 0.
167
0.16
50.
151
0.08
40.
090
0.08
4–0
.004
–0.0
04–0
.004
–0.0
02–0
.002
–0.0
02G
uate
mal
a 0.
155
0.15
40.
141
0.06
70.
077
0.07
3–0
.003
–0.0
03–0
.003
–0.0
02–0
.002
–0.0
02H
ondu
ras
0.18
00.
177
0.16
60.
093
0.10
10.
097
–0.0
09–0
.008
–0.0
08–0
.005
–0.0
06–0
.006
Nic
arag
ua
0.18
30.
180
0.16
30.
114
0.11
10.
098
–0.0
01–0
.001
–0.0
010.
000
–0.0
01–0
.001
Ave
rage
0.17
00.
169
0.15
50.
087
0.09
40.
089
–0.0
05–0
.005
–0.0
05–0
.002
–0.0
03–0
.003
Sim
ulat
ion
2
Cos
ta R
ica
0.16
10.
162
0.14
90.
072
0.08
50.
083
–0.0
09–0
.007
–0.0
08–0
.003
–0.0
03–0
.003
Dom
inic
an R
epub
lic0.
167
0.16
80.
155
0.08
50.
097
0.09
5–0
.014
–0.0
11–0
.011
–0.0
07–0
.007
–0.0
07El
Sal
vado
r 0.
160
0.16
10.
146
0.08
10.
088
0.08
1–0
.011
–0.0
08–0
.009
–0.0
05–0
.005
–0.0
05G
uate
mal
a 0.
152
0.15
30.
139
0.06
60.
076
0.07
2–0
.005
–0.0
05–0
.005
–0.0
03–0
.003
–0.0
03H
ondu
ras
0.16
70.
169
0.15
50.
087
0.09
60.
092
–0.0
22–0
.016
–0.0
18–0
.011
–0.0
11–0
.010
Nic
arag
ua
0.17
90.
177
0.15
90.
111
0.10
90.
096
–0.0
06–0
.004
–0.0
05–0
.003
–0.0
02–0
.002
Ave
rage
0.16
40.
165
0.15
10.
084
0.09
20.
087
–0.0
11–0
.008
–0.0
09–0
.005
–0.0
05–0
.005
Sim
ulat
ion
3
Cos
ta R
ica
0.16
30.
163
0.15
10.
072
0.08
50.
083
–0.0
07–0
.006
–0.0
06–0
.003
–0.0
03–0
.003
Dom
inic
an R
epub
lic0.
169
0.16
90.
157
0.08
50.
096
0.09
4–0
.011
–0.0
10–0
.009
–0.0
07–0
.008
–0.0
07El
Sal
vado
r 0.
166
0.16
40.
150
0.08
20.
088
0.08
2–0
.005
–0.0
05–0
.005
–0.0
03–0
.004
–0.0
04G
uate
mal
a 0.
153
0.15
30.
140
0.06
60.
075
0.07
1–0
.004
–0.0
05–0
.004
–0.0
03–0
.004
–0.0
04H
ondu
ras
0.17
80.
175
0.16
40.
091
0.09
80.
095
–0.0
11–0
.011
–0.0
10–0
.007
–0.0
09–0
.008
Nic
arag
ua
0.18
30.
180
0.16
30.
113
0.11
00.
098
–0.0
01–0
.001
–0.0
01–0
.001
–0.0
01–0
.001
Ave
rage
0.16
80.
167
0.15
40.
085
0.09
20.
087
–0.0
07–0
.006
–0.0
06–0
.004
–0.0
05–0
.004
Sim
ulat
ion
4
Cos
ta R
ica
0.15
90.
161
0.14
80.
070
0.08
30.
082
–0.0
11–0
.008
–0.0
09–0
.005
–0.0
05–0
.004
Dom
inic
an R
epub
lic0.
164
0.16
60.
153
0.08
20.
094
0.09
2–0
.016
–0.0
13–0
.013
–0.0
09–0
.010
–0.0
09El
Sal
vado
r 0.
159
0.16
00.
145
0.07
90.
086
0.08
0–0
.012
–0.0
10–0
.010
–0.0
07–0
.007
–0.0
06G
uate
mal
a 0.
150
0.15
10.
138
0.06
50.
074
0.07
0–0
.007
–0.0
07–0
.006
–0.0
04–0
.005
–0.0
05H
ondu
ras
0.16
40.
167
0.15
40.
085
0.09
40.
090
–0.0
25–0
.019
–0.0
20–0
.013
–0.0
13–0
.012
Nic
arag
ua
0.17
80.
177
0.15
90.
111
0.10
90.
096
–0.0
06–0
.004
–0.0
05–0
.003
–0.0
03–0
.003
Ave
rage
0.16
20.
164
0.14
90.
082
0.09
00.
085
–0.0
13–0
.010
–0.0
10–0
.007
–0.0
07–0
.007
Sour
ces:
IMF,
Wor
ld E
cono
mic
Out
look
;Dire
ctio
n of
Trad
e St
atist
ics;a
nd IM
F st
aff e
stim
ates
.N
ote:
See
Box
5.3
for
a de
scri
ptio
n of
how
the
pro
ject
ions
are
cal
cula
ted.
1–5
indi
cate
reg
ress
ion
num
bers
.1 N
egat
ive
valu
es d
enot
e gr
eate
r su
itabi
lity
for
dolla
riza
tion
in p
roje
ctio
ns t
han
in in
dice
s fo
r 19
94–2
003.
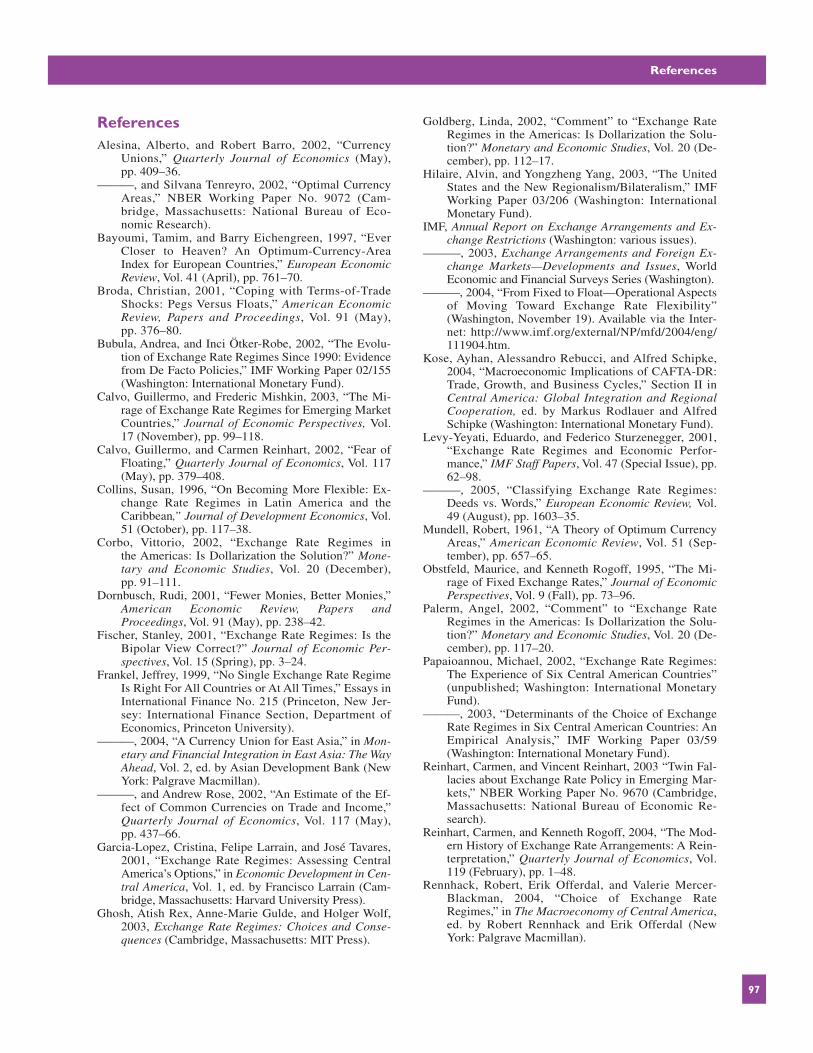
References
ReferencesAlesina, Alberto, and Robert Barro, 2002, “Currency
Unions,” Quarterly Journal of Economics (May),pp. 409–36.
———, and Silvana Tenreyro, 2002, “Optimal CurrencyAreas,” NBER Working Paper No. 9072 (Cam-bridge, Massachusetts: National Bureau of Eco-nomic Research).
Bayoumi, Tamim, and Barry Eichengreen, 1997, “EverCloser to Heaven? An Optimum-Currency-AreaIndex for European Countries,” European EconomicReview, Vol. 41 (April), pp. 761–70.
Broda, Christian, 2001, “Coping with Terms-of-TradeShocks: Pegs Versus Floats,” American EconomicReview, Papers and Proceedings, Vol. 91 (May),pp. 376–80.
Bubula, Andrea, and Inci Ötker-Robe, 2002, “The Evolu-tion of Exchange Rate Regimes Since 1990: Evidencefrom De Facto Policies,” IMF Working Paper 02/155(Washington: International Monetary Fund).
Calvo, Guillermo, and Frederic Mishkin, 2003, “The Mi-rage of Exchange Rate Regimes for Emerging MarketCountries,” Journal of Economic Perspectives, Vol.17 (November), pp. 99–118.
Calvo, Guillermo, and Carmen Reinhart, 2002, “Fear ofFloating,” Quarterly Journal of Economics, Vol. 117(May), pp. 379–408.
Collins, Susan, 1996, “On Becoming More Flexible: Ex-change Rate Regimes in Latin America and theCaribbean,” Journal of Development Economics, Vol.51 (October), pp. 117–38.
Corbo, Vittorio, 2002, “Exchange Rate Regimes in the Americas: Is Dollarization the Solution?” Mone-tary and Economic Studies, Vol. 20 (December),pp. 91–111.
Dornbusch, Rudi, 2001, “Fewer Monies, Better Monies,”American Economic Review, Papers andProceedings, Vol. 91 (May), pp. 238–42.
Fischer, Stanley, 2001, “Exchange Rate Regimes: Is theBipolar View Correct?” Journal of Economic Per-spectives, Vol. 15 (Spring), pp. 3–24.
Frankel, Jeffrey, 1999, “No Single Exchange Rate RegimeIs Right For All Countries or At All Times,” Essays inInternational Finance No. 215 (Princeton, New Jer-sey: International Finance Section, Department ofEconomics, Princeton University).
———, 2004, “A Currency Union for East Asia,” in Mon-etary and Financial Integration in East Asia: The WayAhead, Vol. 2, ed. by Asian Development Bank (NewYork: Palgrave Macmillan).
———, and Andrew Rose, 2002, “An Estimate of the Ef-fect of Common Currencies on Trade and Income,”Quarterly Journal of Economics, Vol. 117 (May),pp. 437–66.
Garcia-Lopez, Cristina, Felipe Larrain, and José Tavares,2001, “Exchange Rate Regimes: Assessing CentralAmerica’s Options,” in Economic Development in Cen-tral America, Vol. 1, ed. by Francisco Larrain (Cam-bridge, Massachusetts: Harvard University Press).
Ghosh, Atish Rex, Anne-Marie Gulde, and Holger Wolf,2003, Exchange Rate Regimes: Choices and Conse-quences (Cambridge, Massachusetts: MIT Press).
Goldberg, Linda, 2002, “Comment” to “Exchange RateRegimes in the Americas: Is Dollarization the Solu-tion?” Monetary and Economic Studies, Vol. 20 (De-cember), pp. 112–17.
Hilaire, Alvin, and Yongzheng Yang, 2003, “The UnitedStates and the New Regionalism/Bilateralism,” IMFWorking Paper 03/206 (Washington: InternationalMonetary Fund).
IMF, Annual Report on Exchange Arrangements and Ex-change Restrictions (Washington: various issues).
———, 2003, Exchange Arrangements and Foreign Ex-change Markets—Developments and Issues, WorldEconomic and Financial Surveys Series (Washington).
———, 2004, “From Fixed to Float—Operational Aspectsof Moving Toward Exchange Rate Flexibility”(Washington, November 19). Available via the Inter-net: http://www.imf.org/external/NP/mfd/2004/eng/111904.htm.
Kose, Ayhan, Alessandro Rebucci, and Alfred Schipke,2004, “Macroeconomic Implications of CAFTA-DR:Trade, Growth, and Business Cycles,” Section II inCentral America: Global Integration and RegionalCooperation, ed. by Markus Rodlauer and AlfredSchipke (Washington: International Monetary Fund).
Levy-Yeyati, Eduardo, and Federico Sturzenegger, 2001,“Exchange Rate Regimes and Economic Perfor-mance,” IMF Staff Papers, Vol. 47 (Special Issue), pp.62–98.
———, 2005, “Classifying Exchange Rate Regimes:Deeds vs. Words,” European Economic Review, Vol.49 (August), pp. 1603–35.
Mundell, Robert, 1961, “A Theory of Optimum CurrencyAreas,” American Economic Review, Vol. 51 (Sep-tember), pp. 657–65.
Obstfeld, Maurice, and Kenneth Rogoff, 1995, “The Mi-rage of Fixed Exchange Rates,” Journal of EconomicPerspectives, Vol. 9 (Fall), pp. 73–96.
Palerm, Angel, 2002, “Comment” to “Exchange RateRegimes in the Americas: Is Dollarization the Solu-tion?” Monetary and Economic Studies, Vol. 20 (De-cember), pp. 117–20.
Papaioannou, Michael, 2002, “Exchange Rate Regimes:The Experience of Six Central American Countries”(unpublished; Washington: International MonetaryFund).
———, 2003, “Determinants of the Choice of ExchangeRate Regimes in Six Central American Countries: AnEmpirical Analysis,” IMF Working Paper 03/59(Washington: International Monetary Fund).
Reinhart, Carmen, and Vincent Reinhart, 2003 “Twin Fal-lacies about Exchange Rate Policy in Emerging Mar-kets,” NBER Working Paper No. 9670 (Cambridge,Massachusetts: National Bureau of Economic Re-search).
Reinhart, Carmen, and Kenneth Rogoff, 2004, “The Mod-ern History of Exchange Rate Arrangements: A Rein-terpretation,” Quarterly Journal of Economics, Vol.119 (February), pp. 1–48.
Rennhack, Robert, Erik Offerdal, and Valerie Mercer-Blackman, 2004, “Choice of Exchange RateRegimes,” in The Macroeconomy of Central America,ed. by Robert Rennhack and Erik Offerdal (NewYork: Palgrave Macmillan).
97

V REGIONAL INTEGRATION AND EXCHANGE RATE ARRANGEMENTS
Ricci, Luca, 1997, “A Model of an Optimum CurrencyArea,” IMF Working Paper 97/76 (Washington: Inter-national Monetary Fund).
Rodlauer, Markus, 2004, “Perspectives for Economic Inte-gration in Central America,” Remarks made at the 40thAnniversary of the Central American Monetary Coun-cil, Tegucigalpa, Honduras, February 27. Available viathe Internet: www.imf.org/external/np/speeches/2004/022704a.htm.
Rogoff, Kenneth, Aasim Husain, Ashoka Mody, RayBrooks, and Nienke Oomes, 2004, Evolution and Per-formance of Exchange Rate Regimes, IMF OccasionalPaper No. 229 (Washington: International MonetaryFund).
Rose, Andrew, 2000, “One Money, One Market: The Ef-fect of Common Currencies on Trade,” EconomicPolicy, Vol. 15 (April), pp. 9–45.
Schaechter, Andrea, Mark Stone, and Mark Zelmer, 2000,“Adopting Inflation Targeting: Practical Issues forEmerging Market Countries,” IMF Occasional PaperNo. 202 (Washington: International Monetary Fund).
Tenreyro, Silvana, and Robert Barro, 2003, “Economic Ef-fects of Currency Unions,” NBER Working Paper No.9435 (Cambridge, Massachusetts: National Bureau ofEconomic Research).
Truman, Edwin, 2003, Inflation Targeting in the WorldEconomy (Washington: Institute for InternationalEconomics).
98