Embed Size (px)
Citation preview
Regional Economy: The Case of Decentralization
Tri Widodo
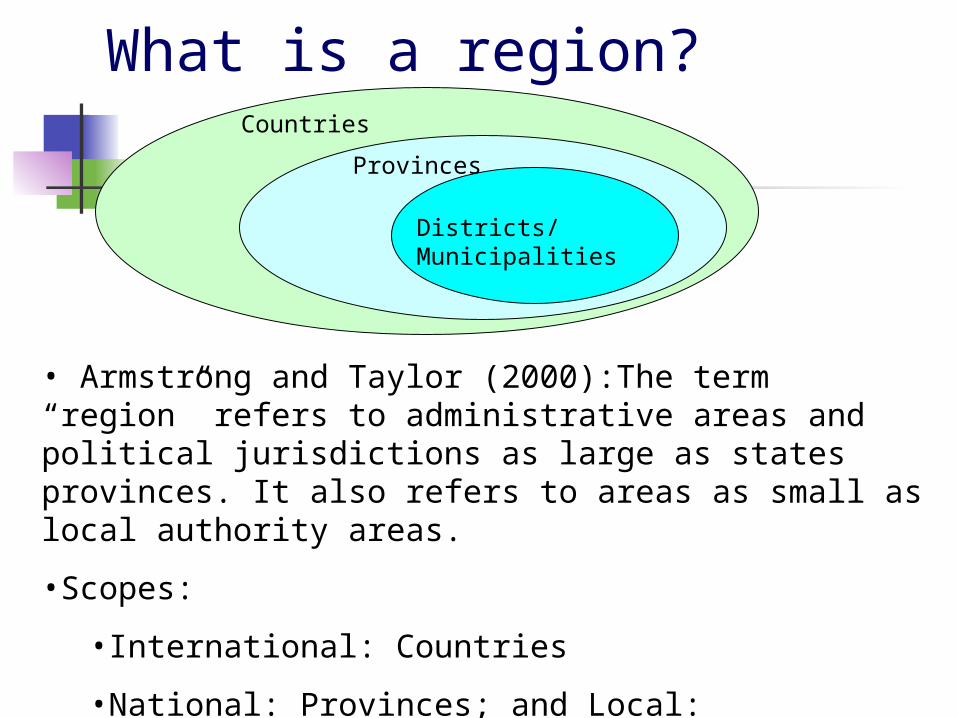
What is a region?
Districts/Municipalities
Provinces
Countries
• Armstrong and Taylor (2000):The term “region” refers to administrative areas and political jurisdictions as large as states provinces. It also refers to areas as small as local authority areas.
•Scopes:
•International: Countries
•National: Provinces; and Local: Districts/Municipalities

International
International: East Asian Region
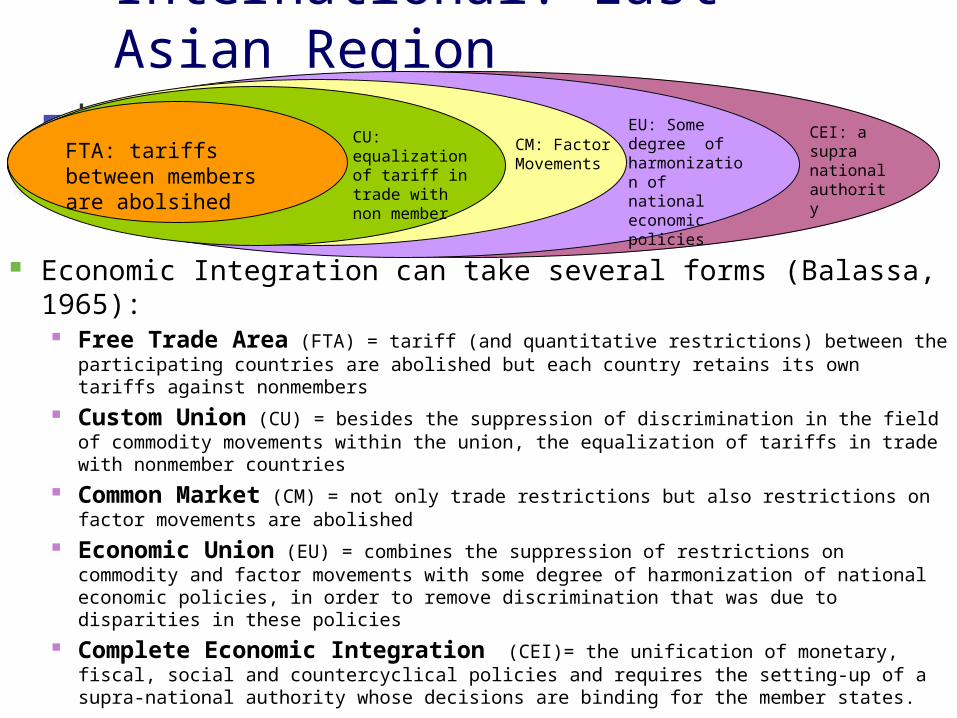
Economic Integration can take several forms (Balassa, 1965):
Free Trade Area (FTA) = tariff (and quantitative restrictions) between the participating countries are abolished but each country retains its own tariffs against nonmembers
Custom Union (CU) = besides the suppression of discrimination in the field of commodity movements within the union, the equalization of tariffs in trade with nonmember countries
Common Market (CM) = not only trade restrictions but also restrictions on factor movements are abolished
Economic Union (EU) = combines the suppression of restrictions on commodity and factor movements with some degree of harmonization of national economic policies, in order to remove discrimination that was due to disparities in these policies
Complete Economic Integration (CEI)= the unification of monetary, fiscal, social and countercyclical policies and requires the setting-up of a supra-national authority whose decisions are binding for the member states.
CEI: a supra national authority
EU: Some degree of harmonization of national economic policies
CM: Factor Movements
CU: equalization of tariff in trade with non member
FTA: tariffs between members are abolsihed
East Asian (EA) Economic integration is an undeniable reality.
Looking around the world to day, there are about 60 unions or grouping (Barro, 2003).
The European Union (EU) is the most substantive and concrete experience from which EA may draw comparison.
The EA: more heterogeneous, marked differences in the political, demographic and economic conditions --> “de facto” versus “de jure” economic integration (Hiratsuka, 2006).
East Asia (EA) vs European Union (EU)
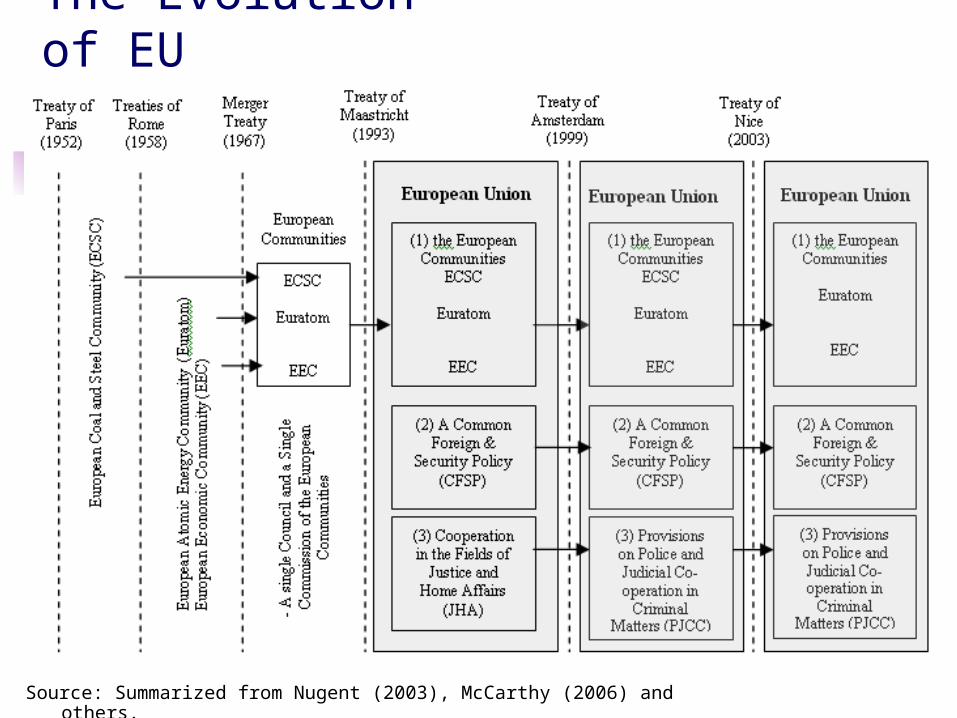
The Evolution of EU
Source: Summarized from Nugent (2003), McCarthy (2006) and others.
Comparisons between EA (future EAU) and EU
The EU is a product of centuries of pre- and post-world war common history and struggle (Akhtar, 2006).
The formation of the EU was driven by a desire to reconstruct and shape Europe as an unified force with a “distinct identity and say” in world economics and politics.
It was culminated in the establishment of legally recognized and empowered frameworks and bodies such as: the European Parliament, European Commission, and the European Court of Justice (Nugent, 2003; McCarthy, 2006)
EA’s economic integration has been largely market driven and characterized by weak and uncoordinated grouping and alliances --> “Noodle bowl syndrome” (Baldwin, 2006)
Impetus for integration come from: 1997 Asian financial crisis. Increasing regional exposure to globalization and
technological advancements --> “Flying Geese” (Kojima, 2000; Ozawa, 2006; Widodo, 2008)
The need for effective mechanisms to counter money laundering and terrorism.
The continued growth and competitiveness of the People’s Republic of China whose increasing economic power is perceived to bring both a mix of prosperity and worries to smaller EA nations --> “Product Sharing” (Athukorala and Yamasita, 2009)
Comparisons between EA (future EAU) and EU
9
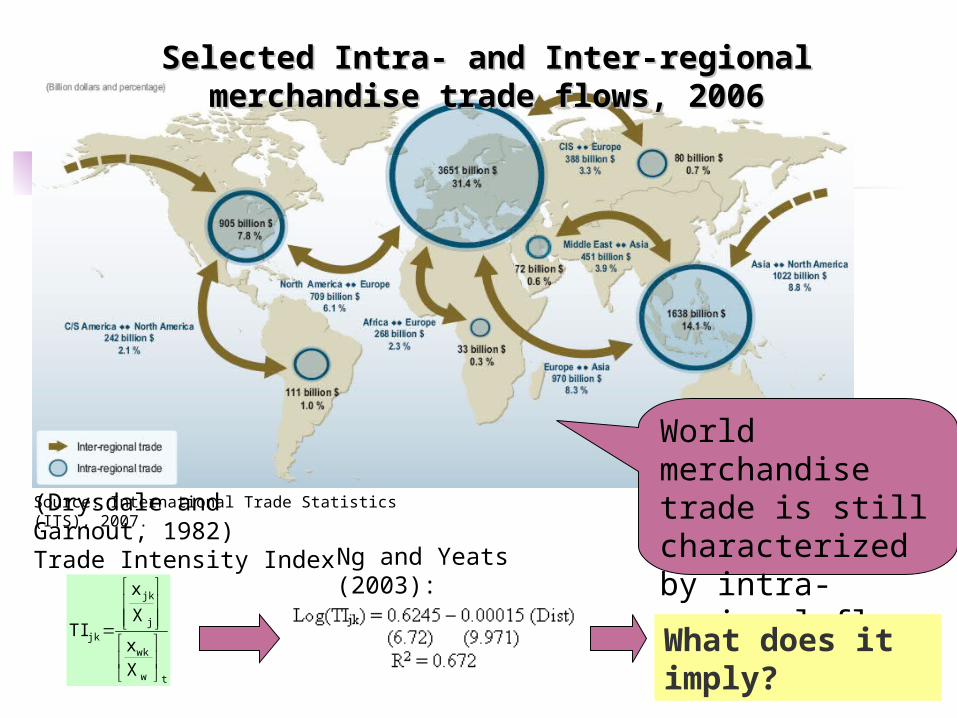
Selected Intra- and Inter-regional merchandise Selected Intra- and Inter-regional merchandise trade flows, 2006trade flows, 2006
Source: International Trade Statistics (ITS), 2007.
World merchandise trade is still characterized by intra-regional flows
(Drysdale and Garnout, 1982)Trade Intensity Index
tw
wk
j
jk
jk
Xx
X
x
TI
Ng and Yeats (2003):
What does it imply?
Trade
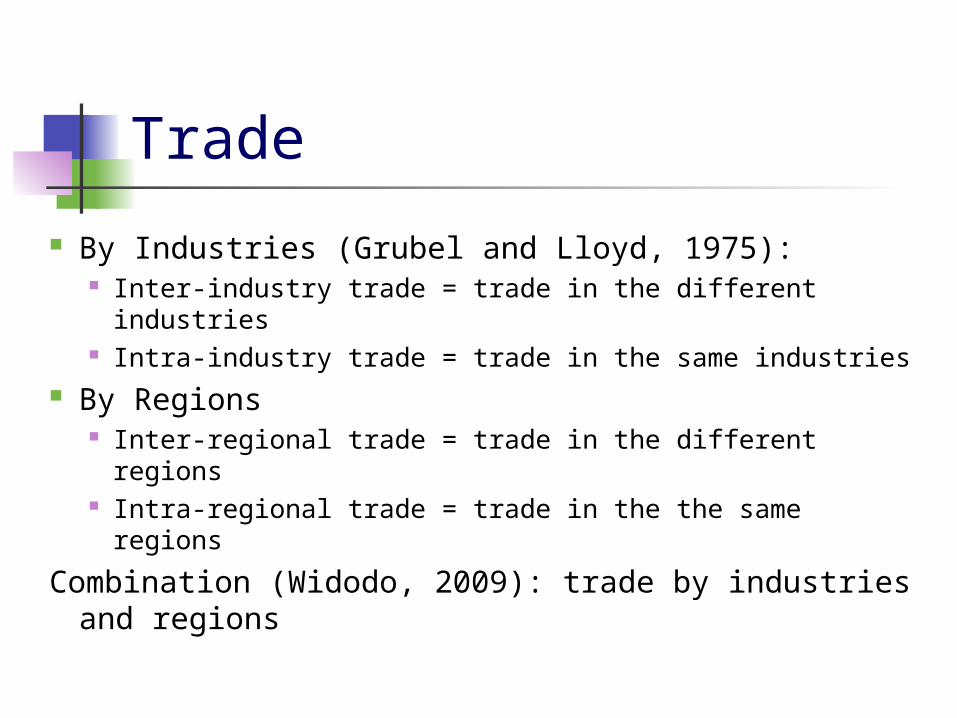
By Industries (Grubel and Lloyd, 1975): Inter-industry trade = trade in the different industries Intra-industry trade = trade in the same industries
By Regions Inter-regional trade = trade in the different regions Intra-regional trade = trade in the the same regions
Combination (Widodo, 2009): trade by industries and regions
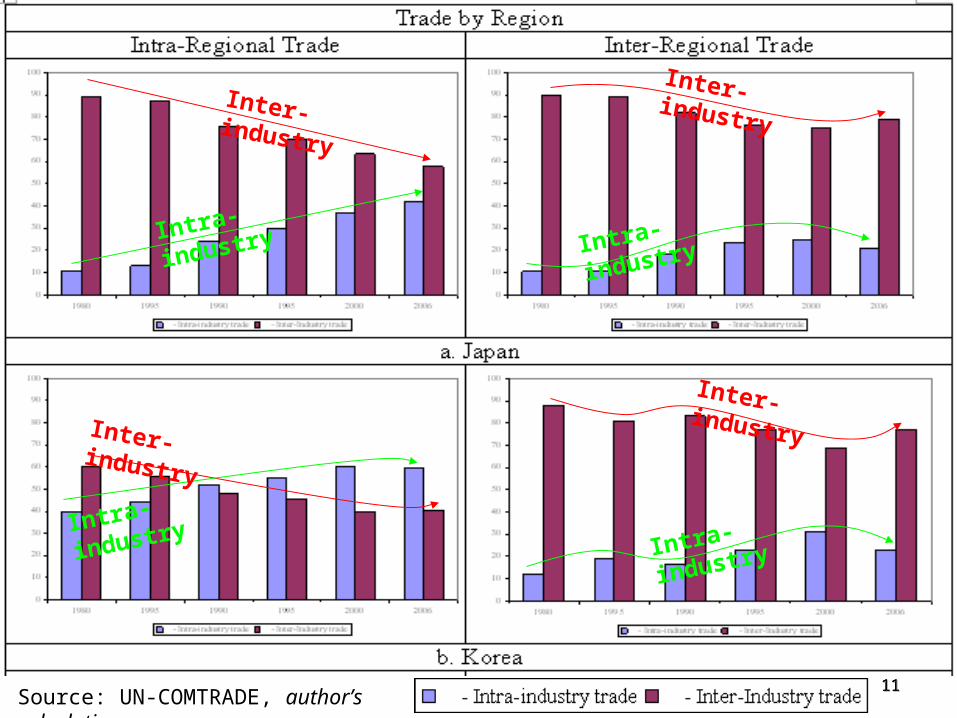
111111111111Source: UN-COMTRADE, author’s calculation
Inter-industry
Intra-industry
Inter-industry
Inter-industry
Inter-industry
Intra-industry
Intra-industry
Intra-industry
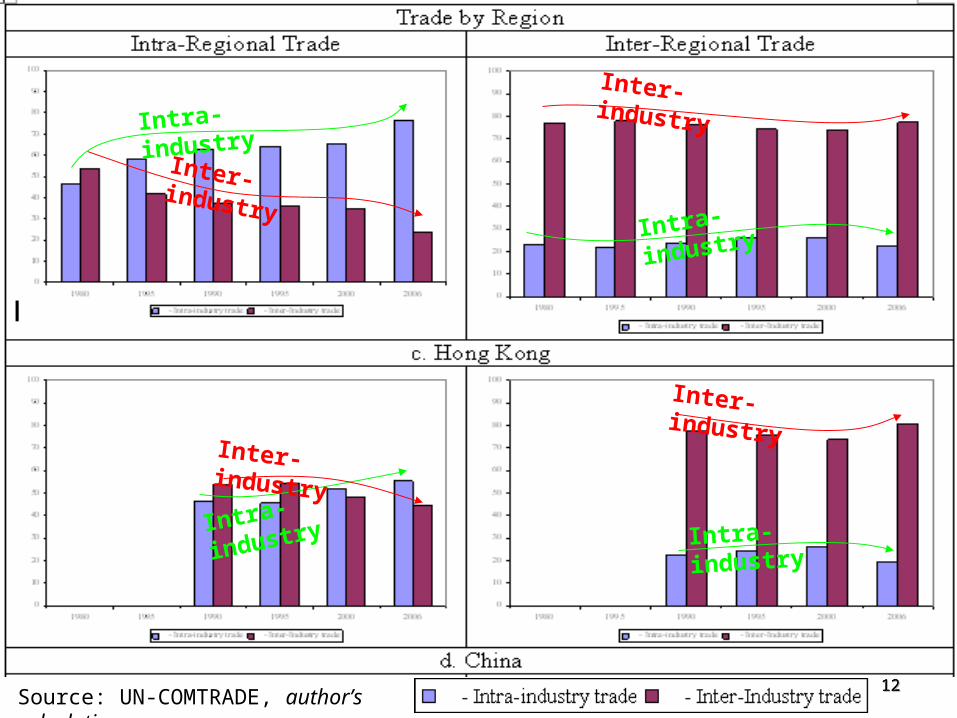
121212121212Source: UN-COMTRADE, author’s calculation
Inter-industry
Inter-industry
Inter-industry
Inter-industry
Intra-industry
Intra-industry
Intra-industry
Intra-industry
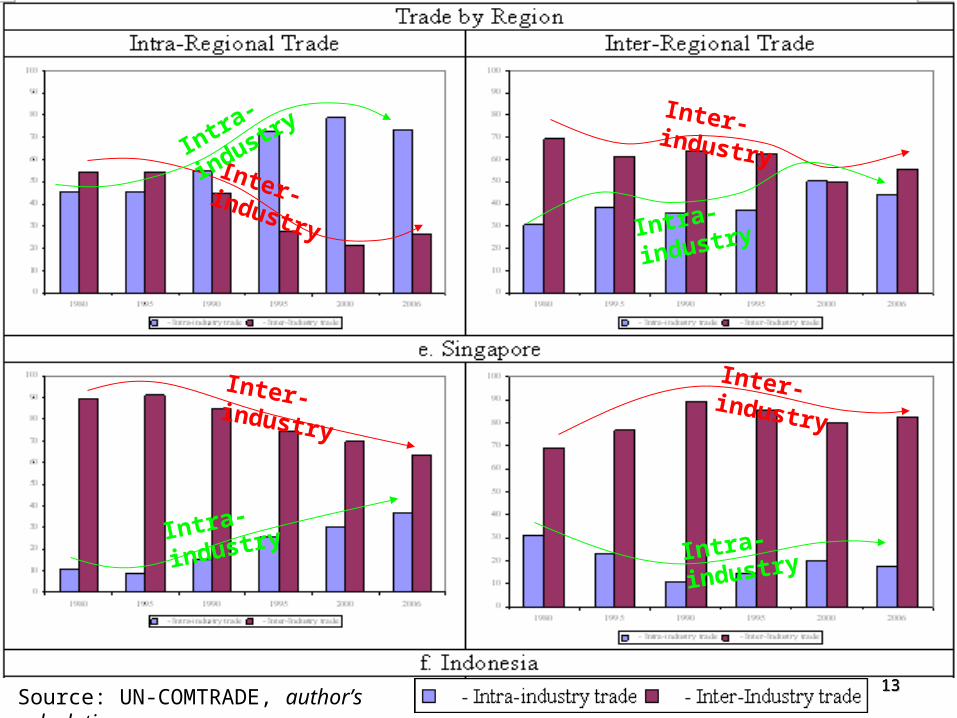
131313131313Source: UN-COMTRADE, author’s calculation
Inter-industry
Inter-industry
Inter-industry
Inter-industry
Intra-in
dustry
Intra-industry
Intra-industry
Intra-industry
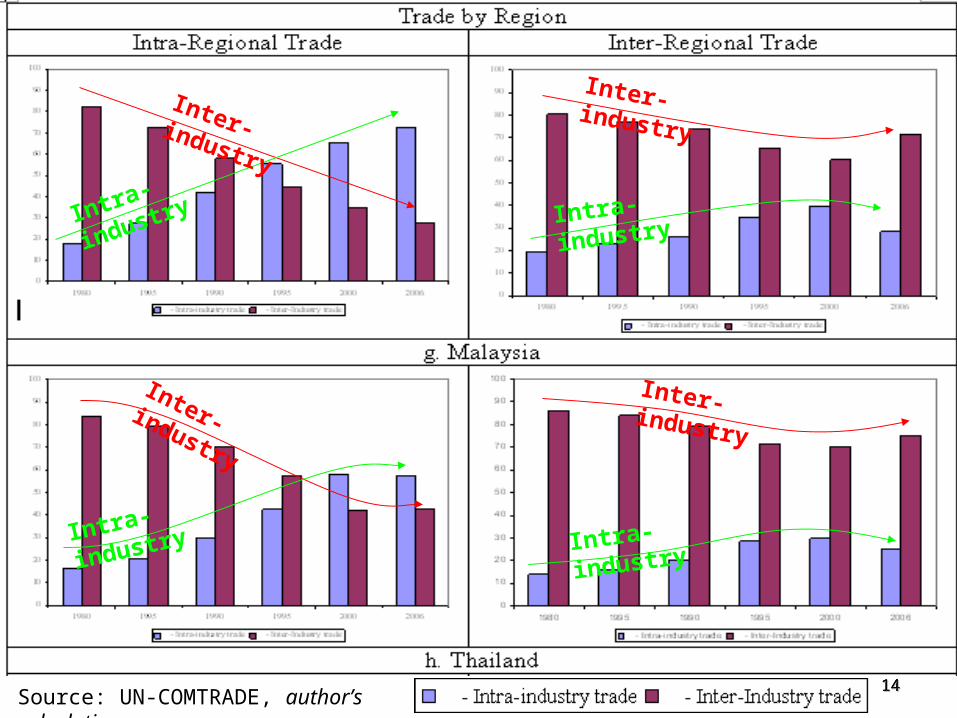
141414141414Source: UN-COMTRADE, author’s calculation
Inter-industry
Inter-industry
Inter-industry
Inter-industry
Intra-industry
Intra-industry
Intra-industry
Intra-industry
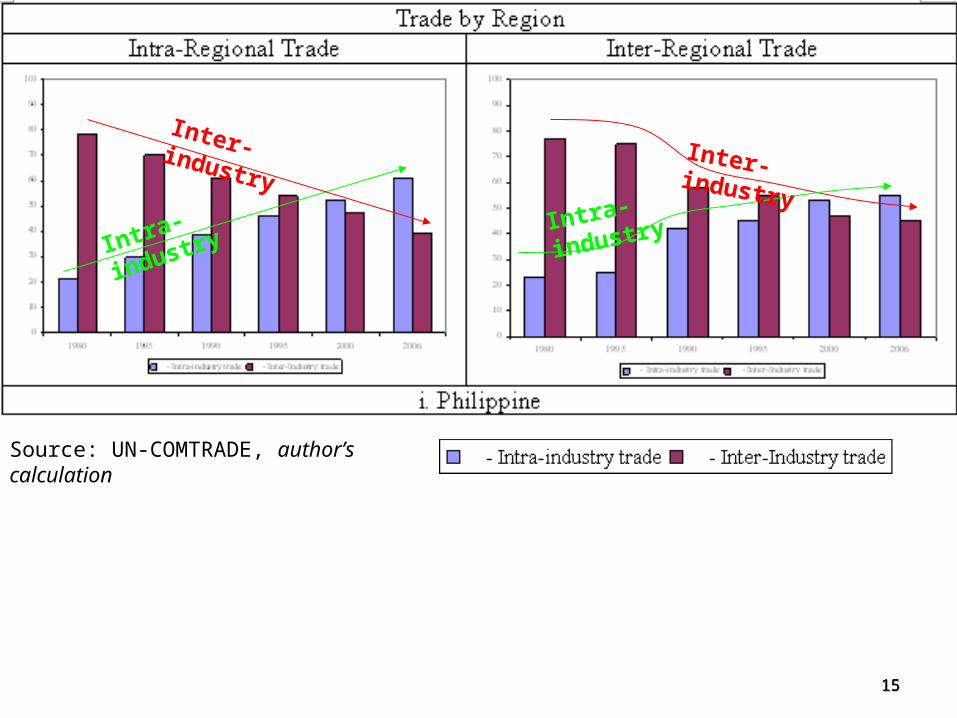
151515151515
Source: UN-COMTRADE, author’s calculation
Inter-industry Inter-industry
Intra-industryIntra-industry

National and Local
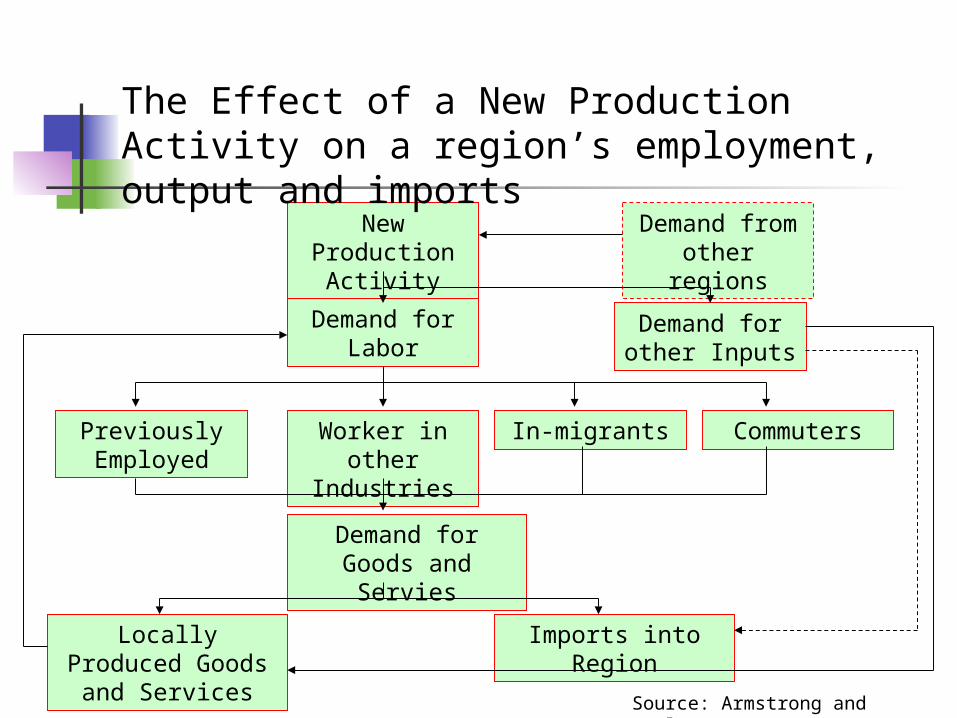
New Production
Activity
Demand from other regions
Demand for Labor
Previously Employed
Worker in other
Industries
In-migrants Commuters
Demand for Goods and
Servies
Demand for other Inputs
Locally Produced Goods and Services
Imports into Region
The Effect of a New Production Activity on a region’s employment, output and imports
Source: Armstrong and Taylor, 2000:7
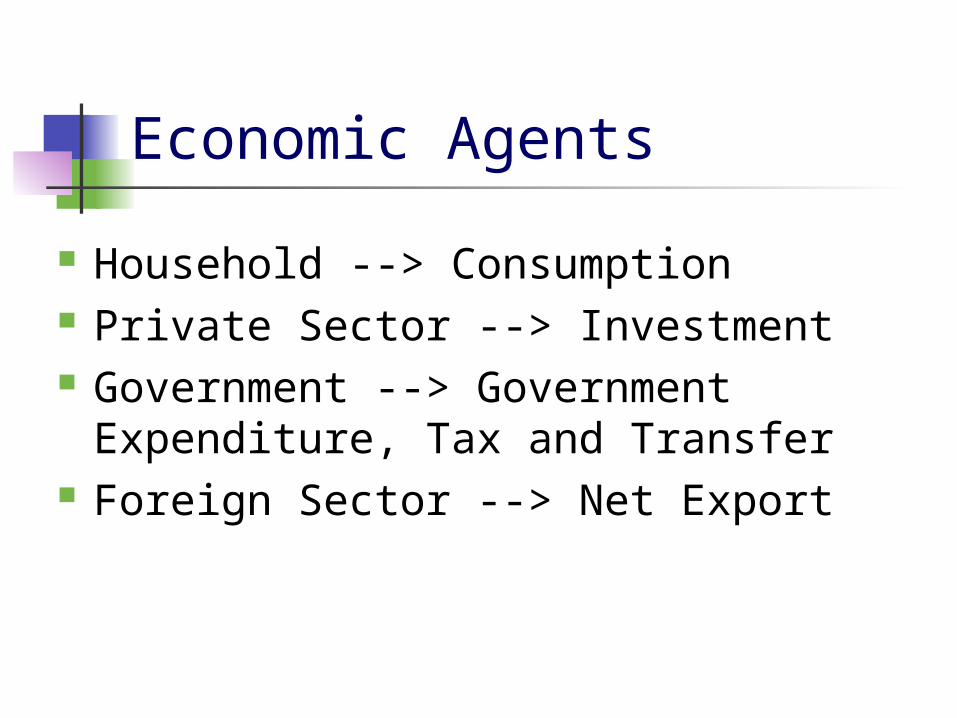
Economic Agents
Household --> Consumption Private Sector --> Investment Government --> Government
Expenditure, Tax and Transfer Foreign Sector --> Net Export
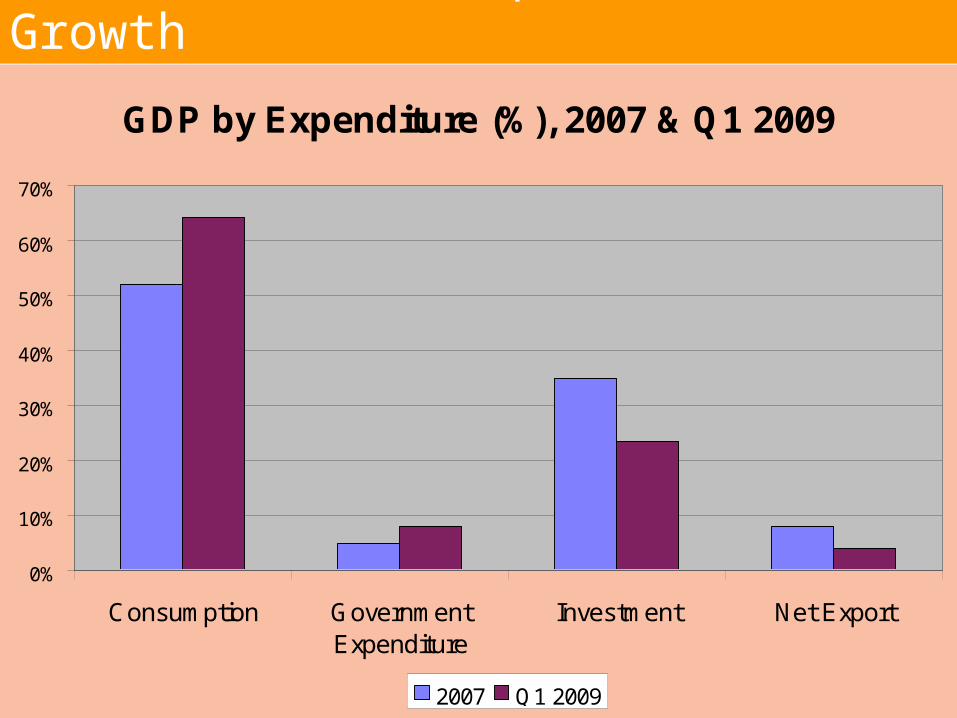
Indonesia: Consumption driven Growth
19
GDP by Expenditure (%), 2007 & Q1 2009
0%
10%
20%
30%
40%
50%
60%
70%
Consumption GovernmentExpenditure
Investment Net Export
2007 Q1 2009
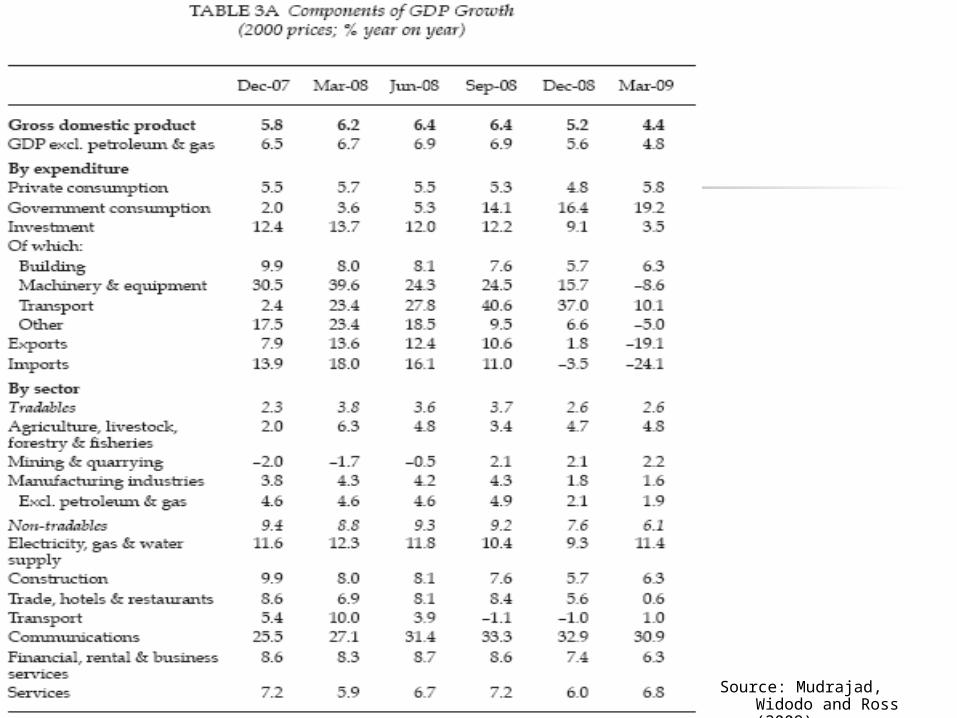
Source: Mudrajad, Widodo and Ross (2009)
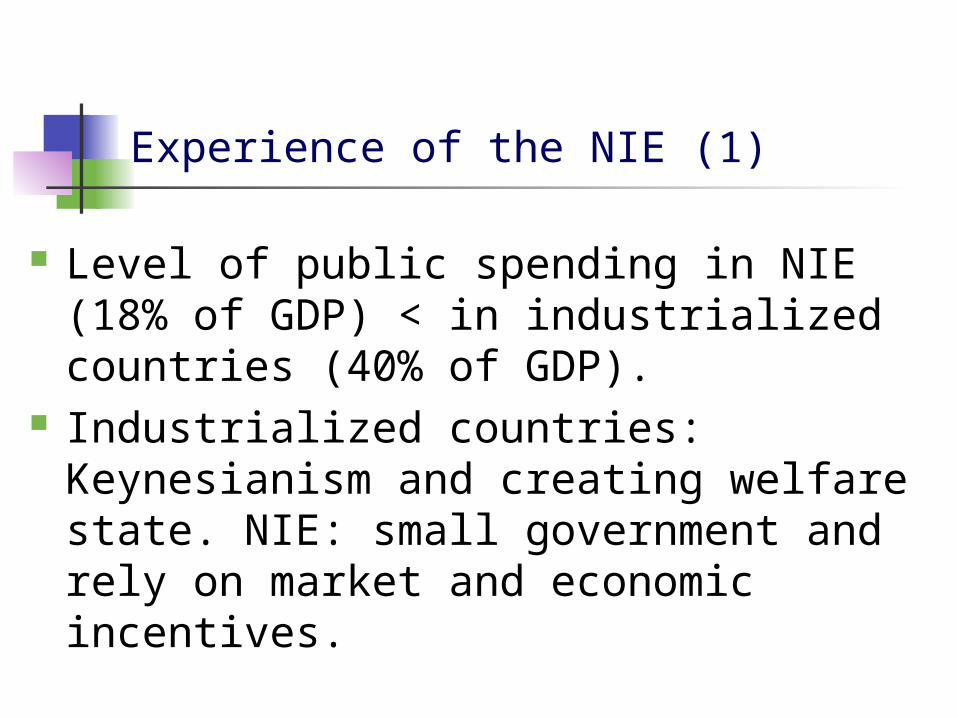
Experience of the NIE (1)
Level of public spending in NIE (18% of GDP) < in industrialized countries (40% of GDP).
Industrialized countries: Keynesianism and creating welfare state. NIE: small government and rely on market and economic incentives.
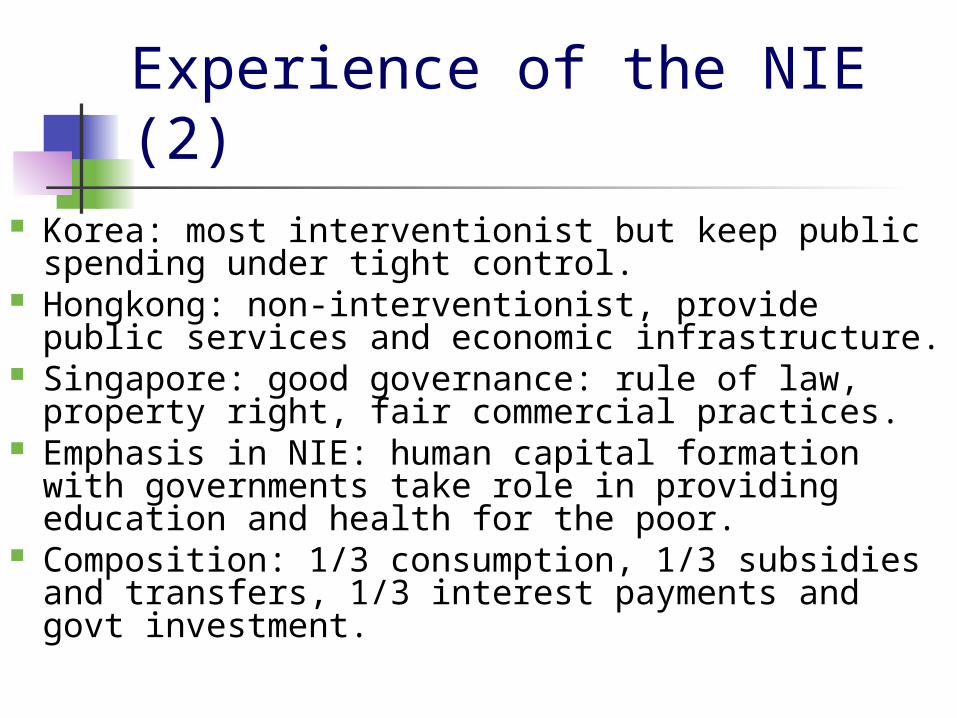
Experience of the NIE (2) Korea: most interventionist but keep public
spending under tight control. Hongkong: non-interventionist, provide public
services and economic infrastructure. Singapore: good governance: rule of law,
property right, fair commercial practices. Emphasis in NIE: human capital formation with
governments take role in providing education and health for the poor.
Composition: 1/3 consumption, 1/3 subsidies and transfers, 1/3 interest payments and govt investment.
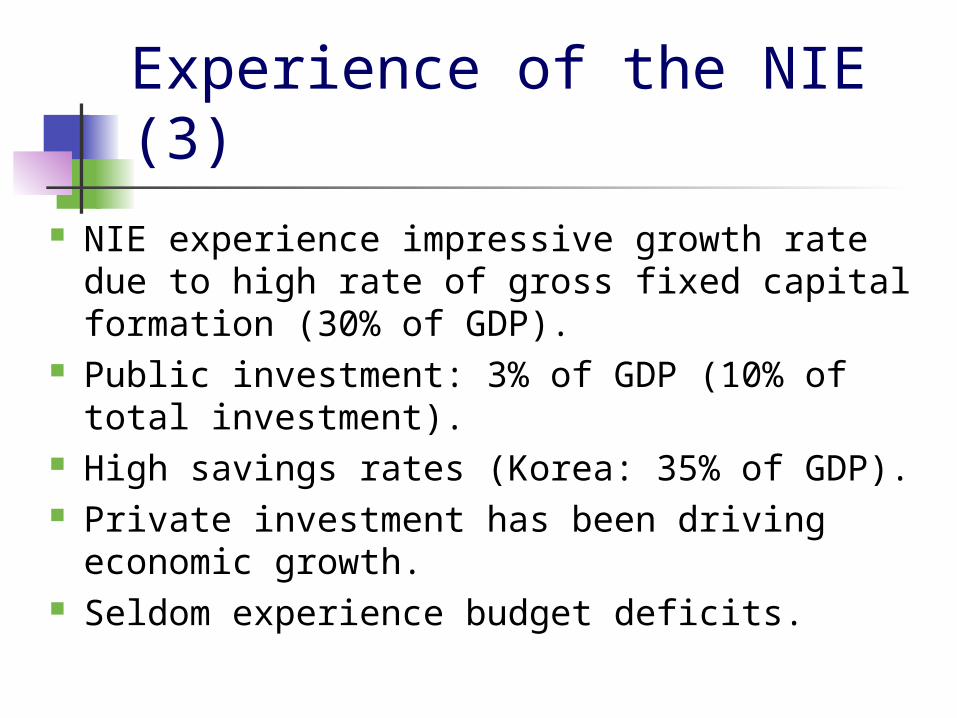
Experience of the NIE (3) NIE experience impressive growth rate due
to high rate of gross fixed capital formation (30% of GDP).
Public investment: 3% of GDP (10% of total investment).
High savings rates (Korea: 35% of GDP). Private investment has been driving
economic growth. Seldom experience budget deficits.
Indonesia (1)
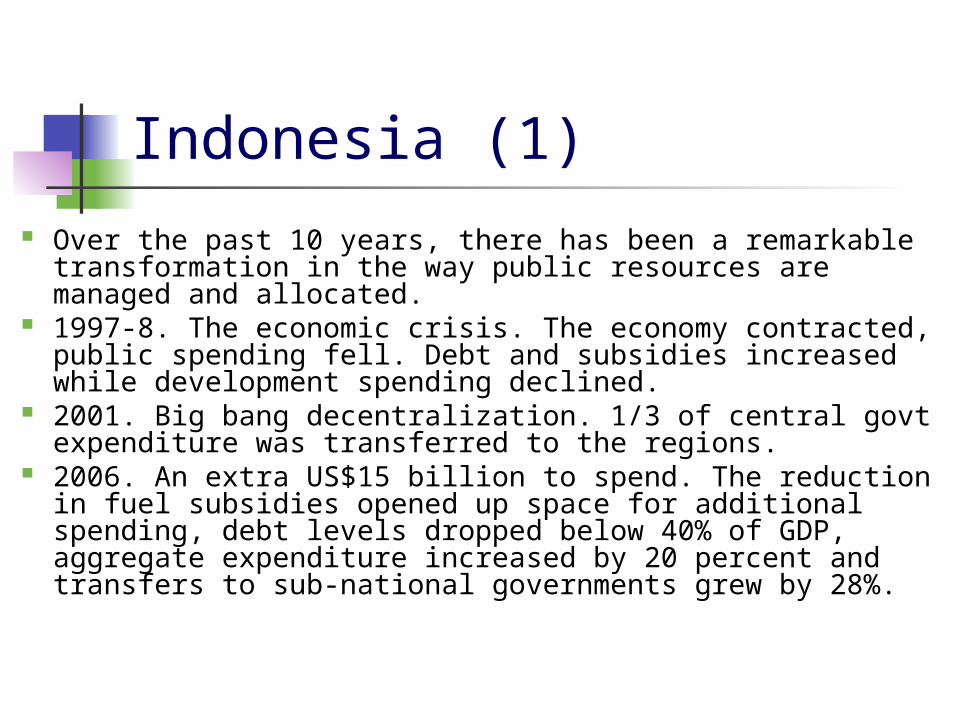
Over the past 10 years, there has been a remarkable transformation in the way public resources are managed and allocated.
1997-8. The economic crisis. The economy contracted, public spending fell. Debt and subsidies increased while development spending declined.
2001. Big bang decentralization. 1/3 of central govt expenditure was transferred to the regions.
2006. An extra US$15 billion to spend. The reduction in fuel subsidies opened up space for additional spending, debt levels dropped below 40% of GDP, aggregate expenditure increased by 20 percent and transfers to sub-national governments grew by 28%.
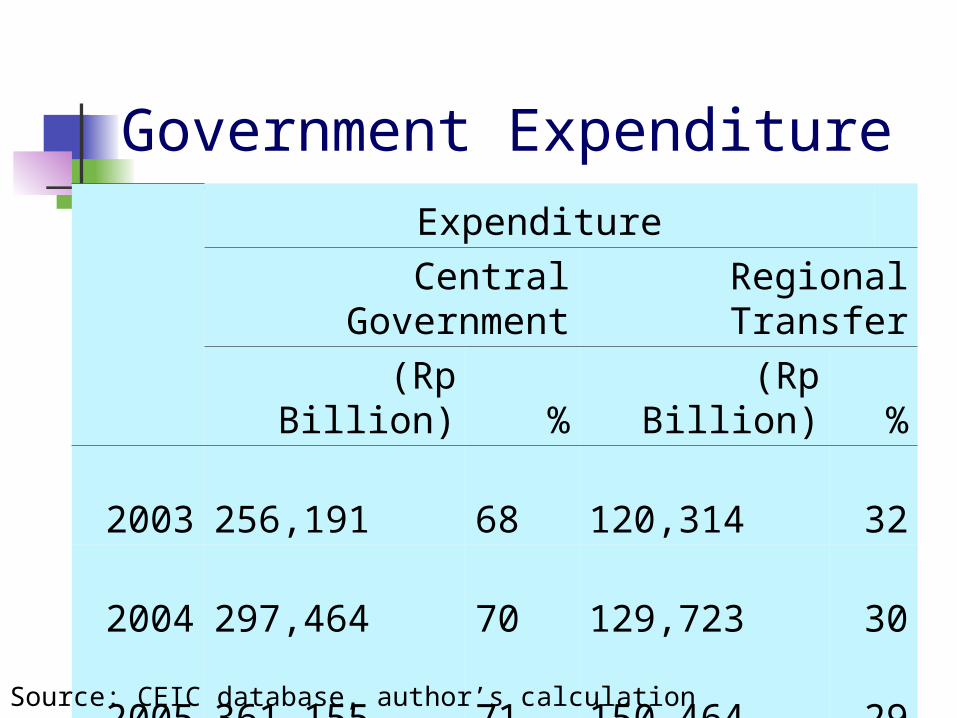
Government Expenditure
Expenditure
Central Government Regional Transfer
(Rp Billion) % (Rp Billion) %
2003 256,191 68 120,314 32
2004 297,464 70 129,723 30
2005 361,155 71 150,464 29
2006 440,032 66 226,180 34
2007 504,623 67 253,263 33
Source: CEIC database, author’s calculation
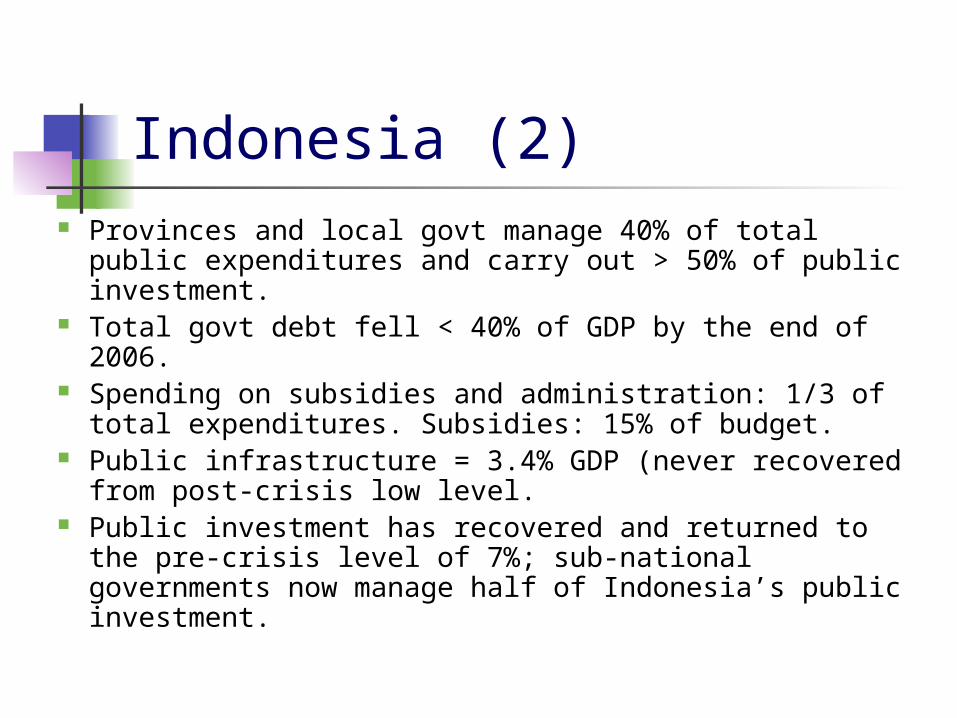
Indonesia (2) Provinces and local govt manage 40% of total public
expenditures and carry out > 50% of public investment.
Total govt debt fell < 40% of GDP by the end of 2006.
Spending on subsidies and administration: 1/3 of total expenditures. Subsidies: 15% of budget.
Public infrastructure = 3.4% GDP (never recovered from post-crisis low level.
Public investment has recovered and returned to the pre-crisis level of 7%; sub-national governments now manage half of Indonesia’s public investment.
Source: Mudrajad, Widodo and Ross (2009)
Four Pillars of Decentralization
Tax Assignment Expenditure Assignment Intergovernmental Transfers Regional Borrowings
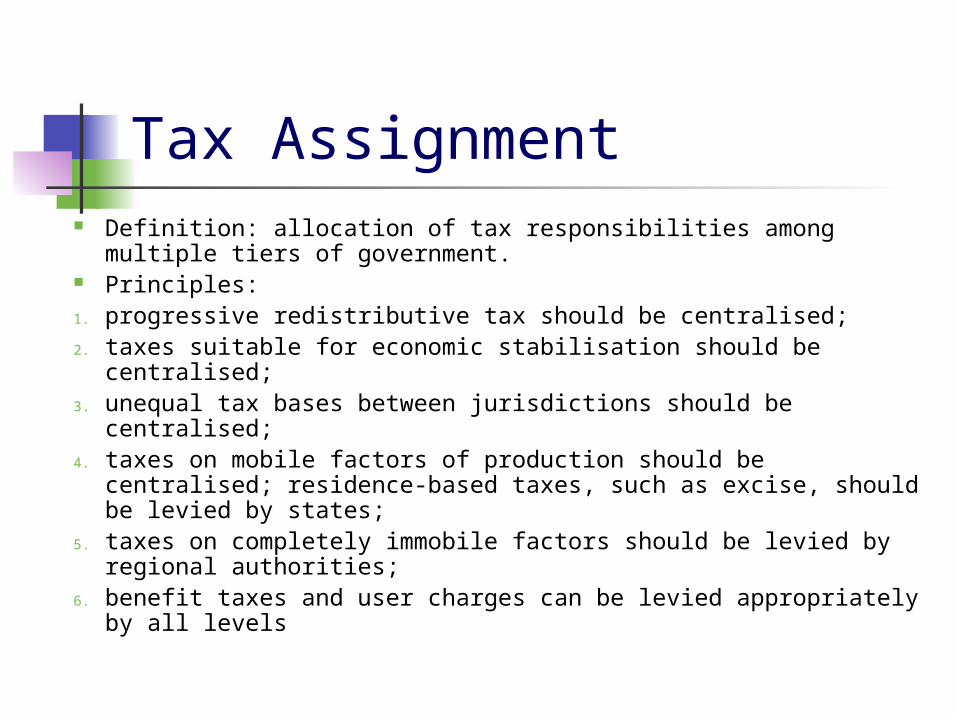
Tax Assignment Definition: allocation of tax responsibilities among multiple
tiers of government. Principles: 1. progressive redistributive tax should be centralised; 2. taxes suitable for economic stabilisation should be centralised; 3. unequal tax bases between jurisdictions should be centralised; 4. taxes on mobile factors of production should be centralised;
residence-based taxes, such as excise, should be levied by states;
5. taxes on completely immobile factors should be levied by regional authorities;
6. benefit taxes and user charges can be levied appropriately by all levels
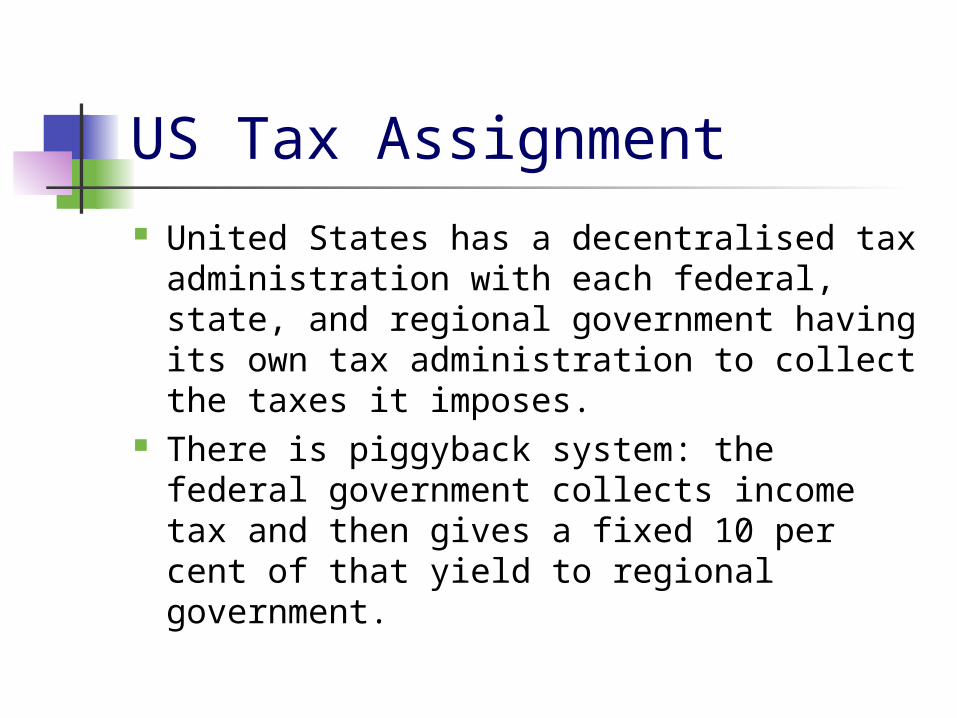
US Tax Assignment United States has a decentralised tax
administration with each federal, state, and regional government having its own tax administration to collect the taxes it imposes.
There is piggyback system: the federal government collects income tax and then gives a fixed 10 per cent of that yield to regional government.
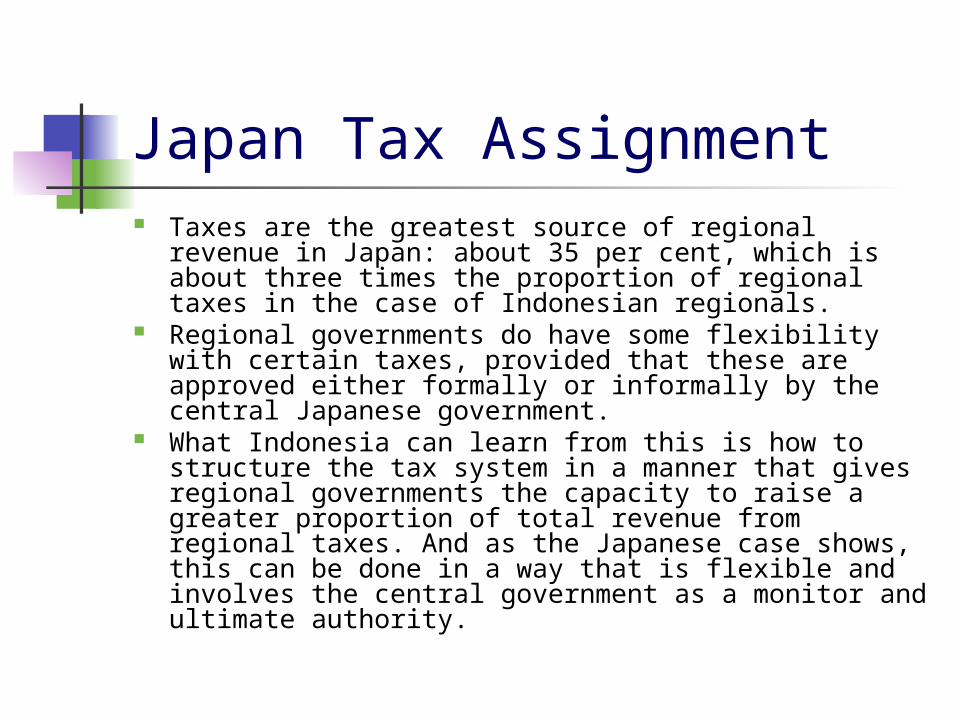
Japan Tax Assignment Taxes are the greatest source of regional revenue in
Japan: about 35 per cent, which is about three times the proportion of regional taxes in the case of Indonesian regionals.
Regional governments do have some flexibility with certain taxes, provided that these are approved either formally or informally by the central Japanese government.
What Indonesia can learn from this is how to structure the tax system in a manner that gives regional governments the capacity to raise a greater proportion of total revenue from regional taxes. And as the Japanese case shows, this can be done in a way that is flexible and involves the central government as a monitor and ultimate authority.
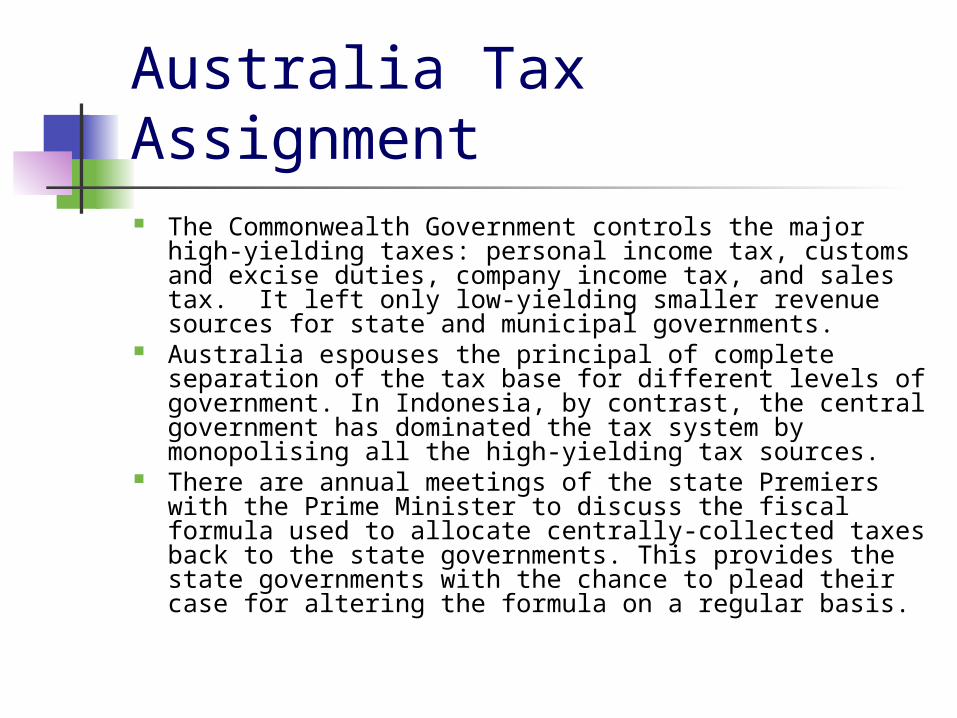
Australia Tax Assignment The Commonwealth Government controls the major
high-yielding taxes: personal income tax, customs and excise duties, company income tax, and sales tax. It left only low-yielding smaller revenue sources for state and municipal governments.
Australia espouses the principal of complete separation of the tax base for different levels of government. In Indonesia, by contrast, the central government has dominated the tax system by monopolising all the high-yielding tax sources.
There are annual meetings of the state Premiers with the Prime Minister to discuss the fiscal formula used to allocate centrally-collected taxes back to the state governments. This provides the state governments with the chance to plead their case for altering the formula on a regular basis.
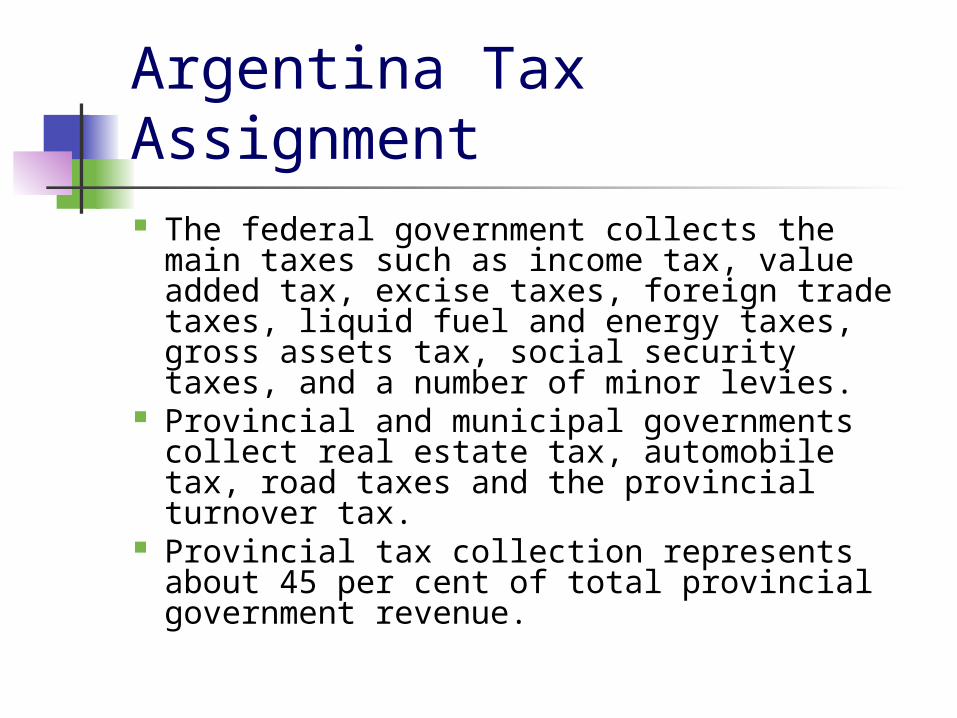
Argentina Tax Assignment The federal government collects the main
taxes such as income tax, value added tax, excise taxes, foreign trade taxes, liquid fuel and energy taxes, gross assets tax, social security taxes, and a number of minor levies.
Provincial and municipal governments collect real estate tax, automobile tax, road taxes and the provincial turnover tax.
Provincial tax collection represents about 45 per cent of total provincial government revenue.
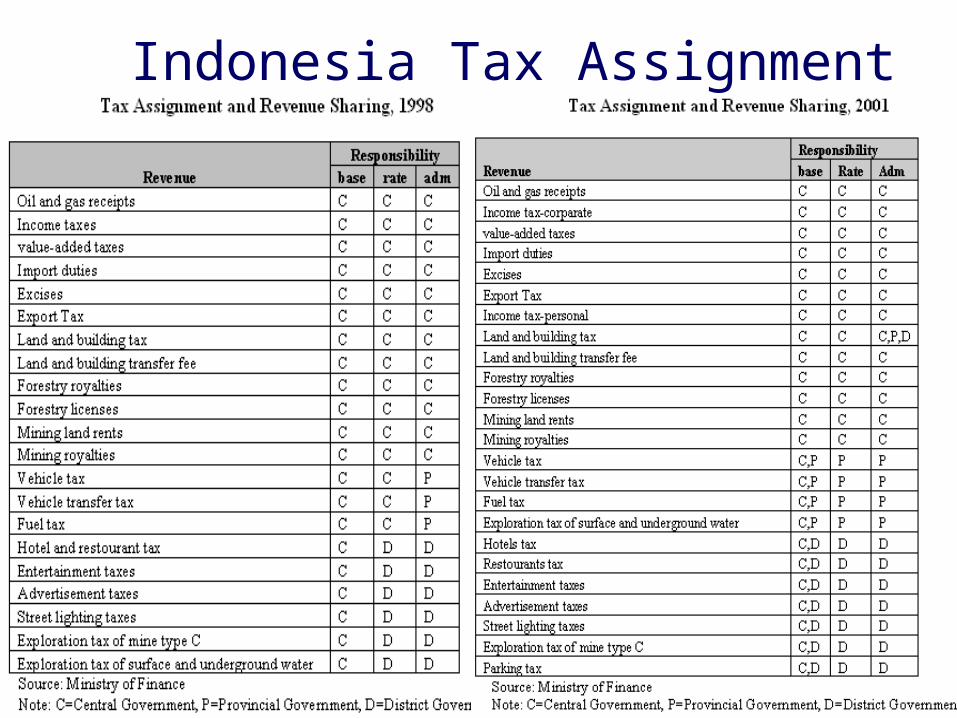
Indonesia Tax Assignment
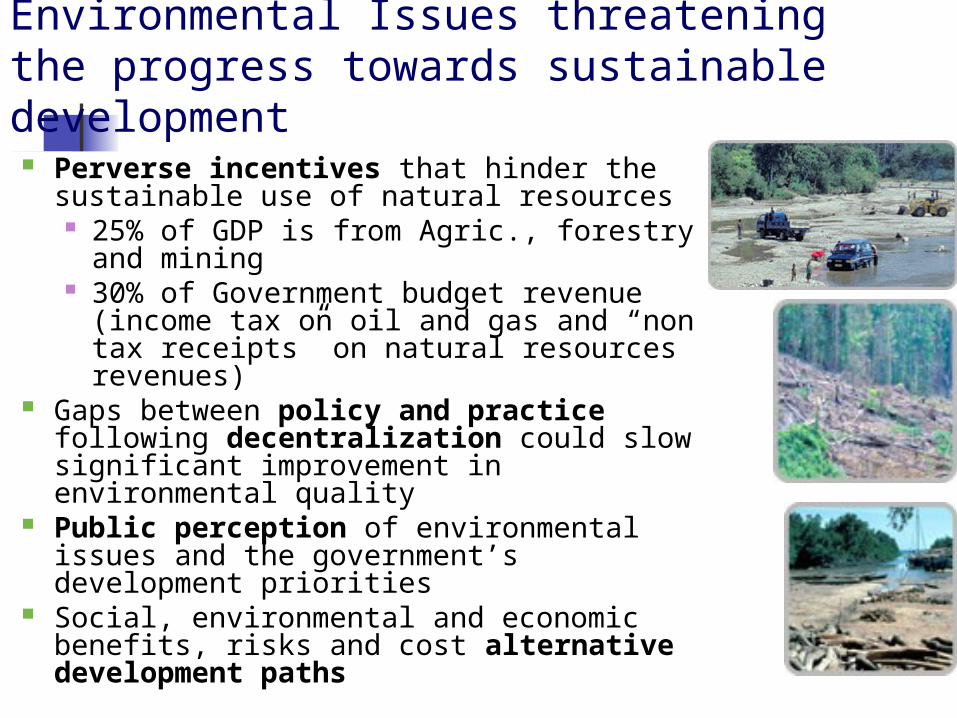
Perverse incentives that hinder the sustainable use of natural resources 25% of GDP is from Agric., forestry and
mining 30% of Government budget revenue
(income tax on oil and gas and “non tax receipts” on natural resources revenues)
Gaps between policy and practice following decentralization could slow significant improvement in environmental quality
Public perception of environmental issues and the government’s development priorities
Social, environmental and economic benefits, risks and cost alternative development paths
Environmental Issues threatening the progress towards sustainable development
Expenditure Assignment
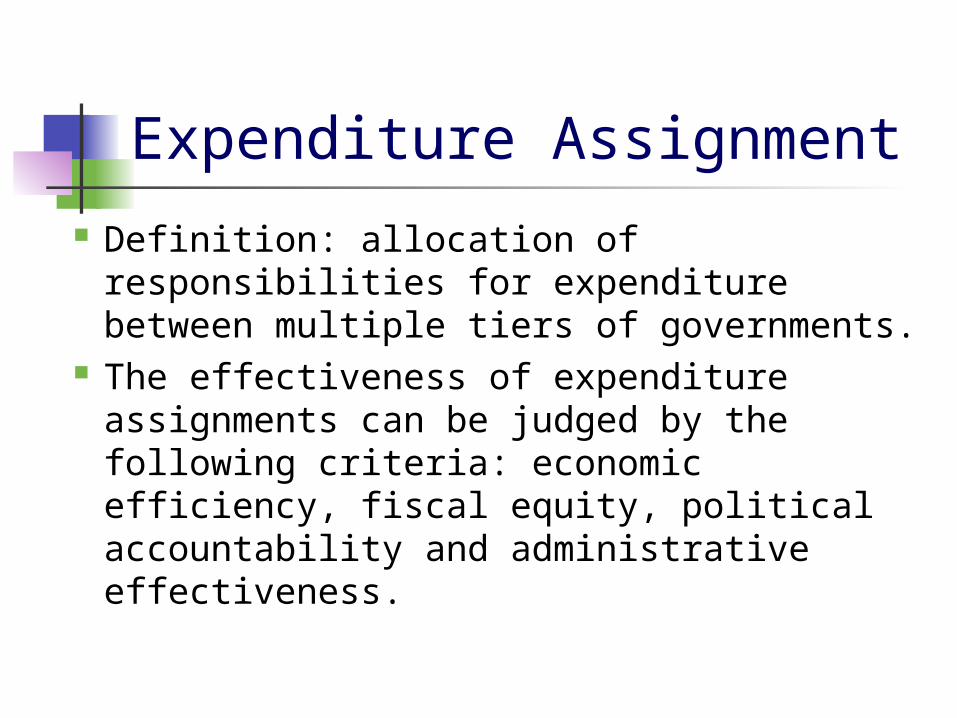
Definition: allocation of responsibilities for expenditure between multiple tiers of governments.
The effectiveness of expenditure assignments can be judged by the following criteria: economic efficiency, fiscal equity, political accountability and administrative effectiveness.
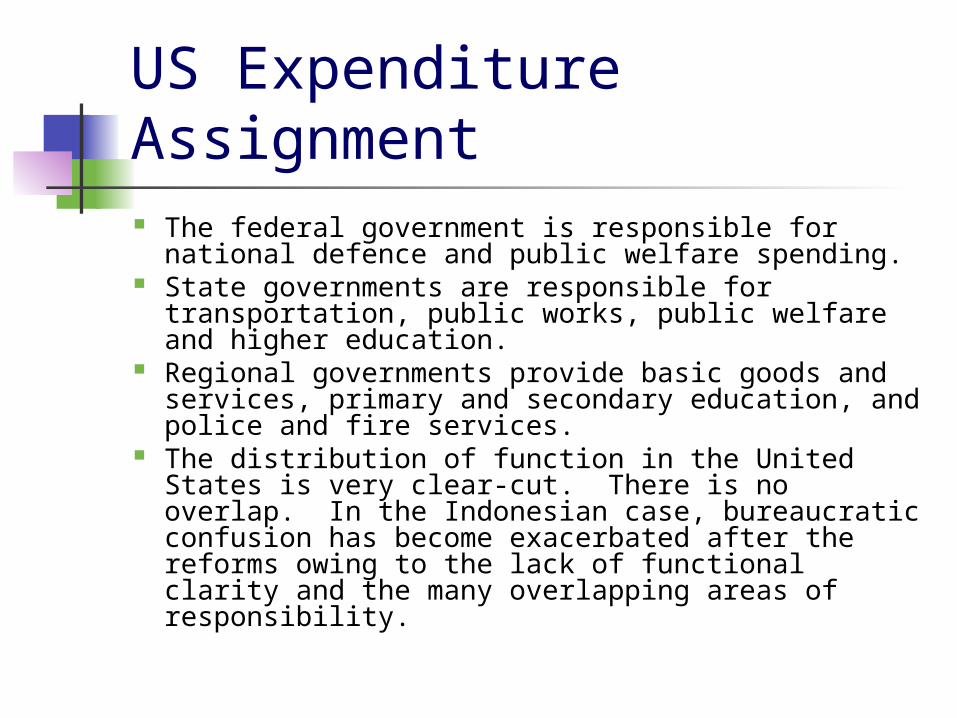
US Expenditure Assignment The federal government is responsible for
national defence and public welfare spending. State governments are responsible for
transportation, public works, public welfare and higher education.
Regional governments provide basic goods and services, primary and secondary education, and police and fire services.
The distribution of function in the United States is very clear-cut. There is no overlap. In the Indonesian case, bureaucratic confusion has become exacerbated after the reforms owing to the lack of functional clarity and the many overlapping areas of responsibility.
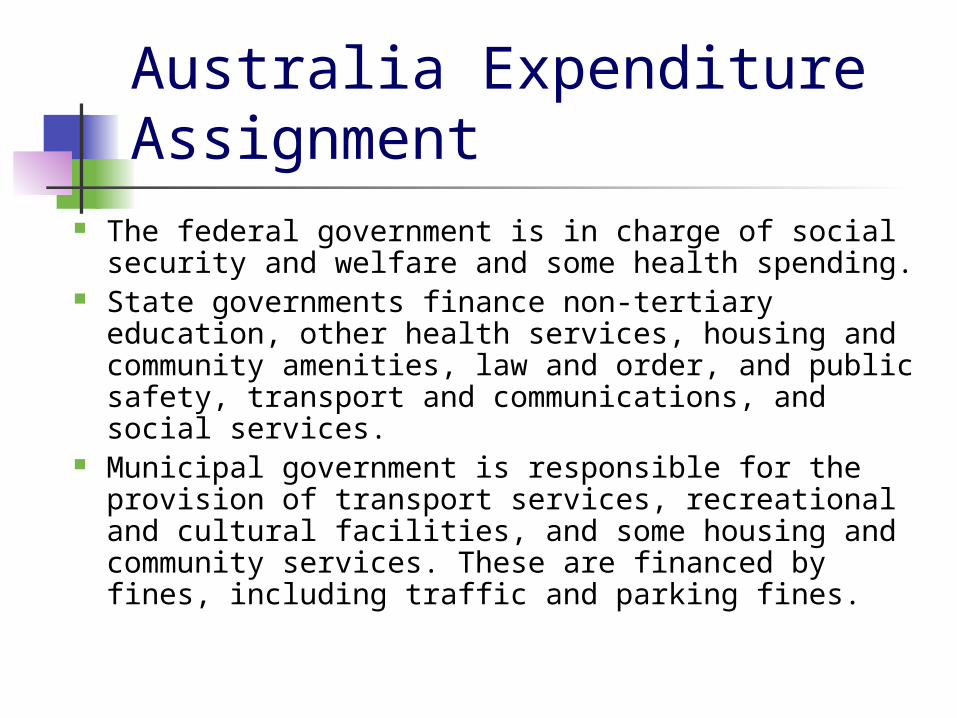
Australia Expenditure Assignment
The federal government is in charge of social security and welfare and some health spending.
State governments finance non-tertiary education, other health services, housing and community amenities, law and order, and public safety, transport and communications, and social services.
Municipal government is responsible for the provision of transport services, recreational and cultural facilities, and some housing and community services. These are financed by fines, including traffic and parking fines.
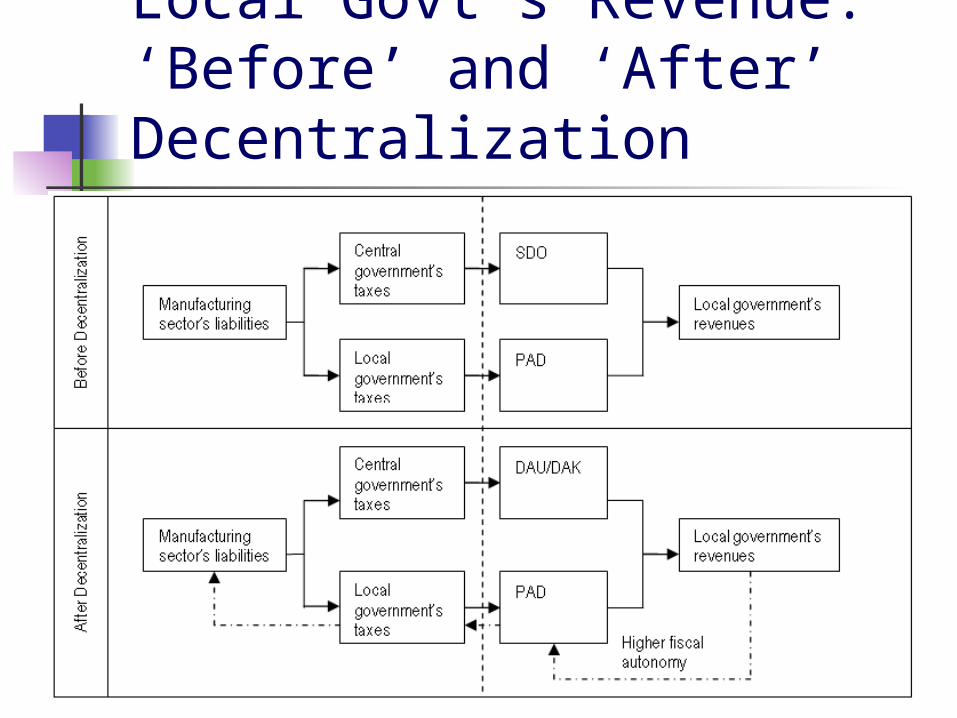
Local Govt’s Revenue: ‘Before’ and ‘After’ Decentralization
Intergovernmental Transfer
Fiscal Capacity Fiscal Needs Fiscal Gap --> DAU
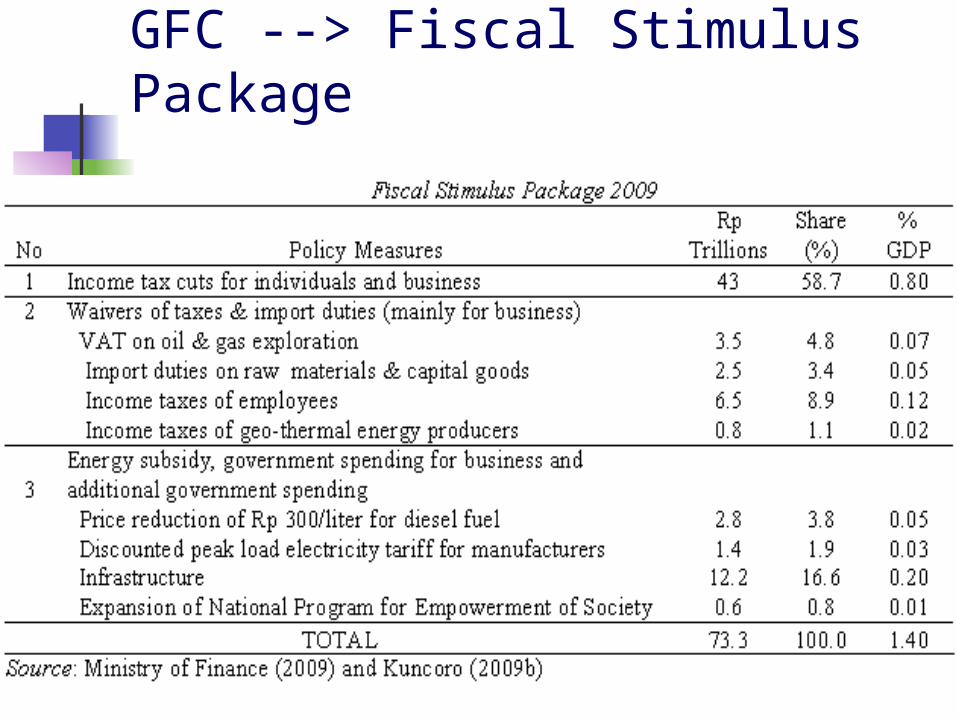
GFC --> Fiscal Stimulus Package
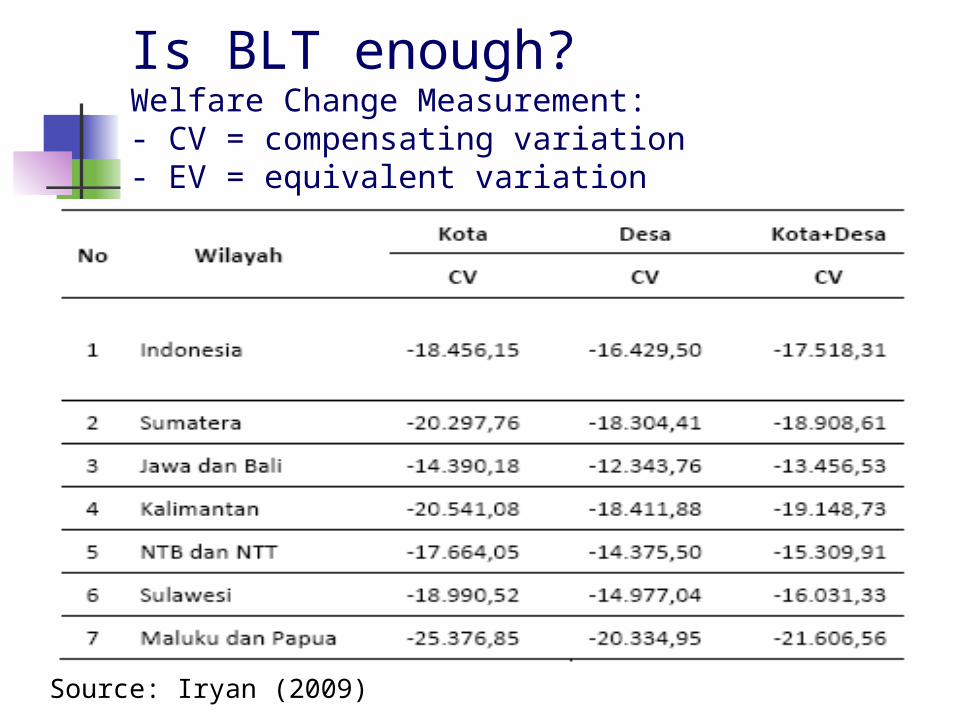
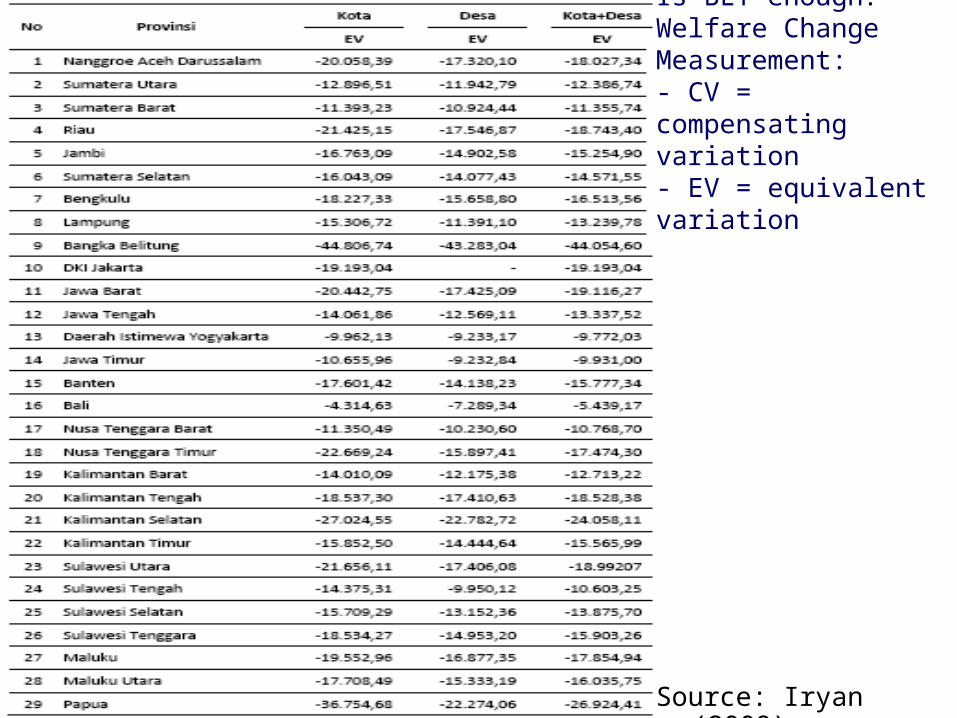
Is BLT enough?Welfare Change Measurement:- CV = compensating variation- EV = equivalent variation
Source: Iryan (2009)
Source: Iryan (2009)
Is BLT enough?Welfare Change Measurement:- CV = compensating variation- EV = equivalent variation