Embed Size (px)
Citation preview

REGIONAL DEVELOPMENT PROFILE FOR THE
KAVANGO EAST REGION
DECEMBER 2015
Final Report

i
FOREWORD BY THE HONOURABLE GOVERNOR
The need to understand the current status of Development in the Kavango East Region
has prompted us to formulate a Regional Development Profile to provide factual
information on the state of development in the region across all sectors. The division of the
former Kavango Region into East and West further enhanced the need for a Regional
Development Profile specifically targeting the Kavango East Region.
The profile serves as lead on potential programmes and projects that need to be
implemented in the region. It is a tool that the public and private sectors should use as a
guide towards achieving regional development and socio-economic growth. It should be
used in conjunction with the Local Economic Development Strategy for the Kavango
Region as well as with the Kavango Integrated Regional Land Use Plan.
Information contained in the Kavango East Regional Development Profile is up-to-date
and has been sourced from existing publications and from the regional stakeholders. As a
result, it provides a clear reflection of the state of development in the region as well as
outlining the regional strengths, weaknesses, opportunities and threats. It is imperative that
both the public and private sectors acquaint themselves with the regional comparative
advantages to determine how they can contribute towards the social and economic
development of the Kavango East Region.
The regional development profile fully documents regional socio-economic development
challenges which provide factual information to political and public office bearers to
present their cases to the central government for budget allocation. It also provides
information to the private sector, NGOs, development partners and religious organisations
to determine how they could best contribute to achieve a higher rate of economic
growth and improved standard of living, economic self-reliance, social justice and
modernisation of the regional economy.
The Kavango East Regional Development Profile serves as an interface and creates inter-
linkage between the national policies and regional development. Therefore, I would like
to emphasise that the Kavango East Regional Development Profile serves as a guide to
support different sectors in identifying programmes and projects as per the needs of the
region.

ii
The Kavango East Region has numerous potentials, mainly in agriculture, manufacturing,
tourism services and the construction sector. By immediately focusing on these sectors, the
socio-economic wellbeing of the region and its people could be changed for the better.
It is then against this background that I would like to say that the Kavango East Regional
Development Profile should serve as both a reference and source document when it
comes to spatial planning, development planning and implementation of developmental
projects in various sectors so as to improve the well-being of all inhabitants and
subsequently, contribute to the national development for a prosperous Namibia.
___________________________________________
Dr. Samuel Mbambo
Honourable Governor: Kavango East Region

iii
TABLE OF CONTENT
LIST OF FIGURES viii
LIST OF TABLES x
EXECUTIVE SUMMARY xii
ACKNOWLEDGEMENTS xxvii
LIST OF ABBREVIATIONS xxviii
1 INTRODUCTION TO THE REGION 1
1.1 BACKGROUND 1
1.1.1 LOCALITY AND SIZE 3
1.1.2 POPULATION 4
1.2 PHYSICAL CHARACTERISTICS 5
1.2.1 RAINFALL AND CLIMATE 6
1.2.2 SOIL TYPES 7
1.2.3 VEGETATION 10
1.2.4 TERRESTRIAL DIVERSITY 11
1.2.5 SURFACE AND GROUND WATER RESOURCES 13
1.3 GOVERNANCE AND PLANNING STRUCTURE 15
1.3.1 MANDATE OF THE REGIONAL COUNCIL 15
1.3.2 REGIONAL COUNCILLORS 15
1.3.3 REGIONAL MANAGEMENT 15
1.3.4 PLANNING STRUCTURE 16
1.4 VISION OF THE REGION 18
1.5 METHODOLOGY 18
2 KEY STATISTICS 20
2.1 POPULATION 20
2.1.1 POPULATION GROWTH 20
2.1.2 POPULATION SIZE AND DENSITY 21
2.1.3 AGE AND SEX DISTRIBUTION 22
2.1.4 HOUSEHOLD SIZE AND SEX OF HOUSEHOLD HEAD 24

iv
2.2 EMPLOYMENT, INCOME AND POVERTY 25
2.2.1 LABOUR FORCE PARTICIPATION 25
2.2.2 EMPLOYMENT RATES 26
2.2.3 STATUS IN EMPLOYMENT 27
2.2.4 HOUSEHOLD INCOME 28
2.3 HOUSING CONDITIONS 30
2.4 ACCESS TO EDUCATION 32
2.4.1 EDUCATION FACILITIES 32
2.4.2 LITERACY 33
2.4.3 EARLY CHILDHOOD DEVELOPMENT 35
2.4.4 SCHOOL ENROLMENT 35
2.4.5 EDUCATIONAL ATTAINMENT 36
2.5 PROTECTED AREAS: NATIONAL PARKS, COMMUNAL CONSERVANCIES AND COMMUNITY FORESTS 37
2.5.1 NATIONAL PARKS 38
2.5.1.1 Bwabwata National Park 38
2.5.1.2 Khaudum National Park 39
2.5.1.3 Popa Game Park 39
2.5.2 COMMUNAL CONSERVANCIES 39
2.5.3 COMMUNITY FORESTS 41
2.6 STATE OF THE ENVIRONMENT 42
2.6.1 CHARACTERISTICS OF THE NATURAL ENVIRONMENT 42
2.6.2 ISSUES OF ENVIRONMENTAL CONCERN 43
3 REGIONAL DEVELOPMENTAL AREAS 45
3.1 ECONOMIC SECTOR 45
3.1.1 AGRICULTURE 46
3.1.1.1 Green Schemes 46
3.1.1.2 Small Scale Commercial Farms and Subsistence Farming 48
3.1.1.3 Horticulture 49
3.1.1.4 Livestock Farming 50
3.1.1.5 Indigenous Fruit and Vegetables 50
3.1.2 TOURISM AND WILDLIFE 51
3.1.2.1 Business and Trade Tourists 51
3.1.2.2 Leisure Tourists 54
3.1.2.3 Bwabwata National Park 54

v
3.1.2.4 Khaudum National Park 55
3.1.2.5 Popa Falls Game Park 55
3.1.2.6 Kavango Zambezi Transfrontier Conservation Area (KAZA TFCA) 56
3.1.2.7 Khaudum North Complex 56
3.1.2.8 Bwabwata-Okavango Ramsar Site. 56
3.1.3 TRADE AND INDUSTRIAL DEVELOPMENT 57
3.1.4 FORESTRY 58
3.1.5 MINING 60
3.1.6 FISHERIES AND MARINE RESOURCES 62
3.1.7 MANUFACTURING 63
3.2 SOCIAL SECTOR DEVELOPMENT 64
3.2.1 HOUSING 64
3.2.2 HEALTH 65
3.2.2.1 Health Facilities 65
3.2.2.2 HIV Prevalence Rates 67
3.2.3 WATER AND SANITATION 69
3.2.4 RURAL DEVELOPMENT 71
3.2.4.1 Cash/Food for Work Projects 71
3.2.4.2 Income Generating Projects 72
3.2.4.3 Rural Employment Scheme 72
3.2.4.4 Food Security and Nutrition 73
3.2.4.5 One Region One Initiative 73
3.2.5 LAND AND RESETTLEMENT 75
3.2.6 SOCIAL WELFARE/POVERTY 75
3.2.7 COMMUNITY DEVELOPMENT 78
3.2.7.1 Small Grant Fund 79
3.2.7.2 Woman and Youth Cleaning Programme 79
3.2.8 EDUCATION AND TRAINING 79
3.2.9 LAW AND JUSTICE 80
3.3 INFRASTRUCTURE 81
3.3.1 TRANSPORT 81
3.3.1.1 Road Network 81
External Transport Links 82
Regional Transport 83
Urban Transport 83
Future Road Infrastructure 83
3.3.1.2 Air 83

vi
3.3.1.3 Rail 84
3.3.1.4 Water 84
3.3.2 ENERGY 84
3.3.3 WATER, SANITATION AND SOLID WASTE 86
3.3.4 TELECOMMUNICATION 91
3.4 INSTITUTIONAL SERVICES SECTOR 93
3.4.1 FINANCIAL SERVICES 93
3.4.2 SOCIAL SUPPORT ORGANISATIONS 93
4 REGIONAL AND LOCAL GOVERNMENT 95
4.1 THE CONSTITUENCIES 95
4.2 Rundu Urban 95
4.2.1 INTRODUCTION 95
4.2.2 SIZE, LOCATION AND POPULATION 96
4.2.3 ECONOMIC ACTIVITIES 96
4.2.4 INFRASTRUCTURE AND SOCIAL SERVICES 97
4.2.5 POTENTIAL AREAS OF INVESTMENT 98
4.3 Rundu Rural 98
4.3.1 INTRODUCTION 98
4.3.2 SIZE, LOCATION AND POPULATION 98
4.3.3 ECONOMIC ACTIVITIES 99
4.3.4 INFRASTRUCTURE AND SOCIAL SERVICES 99
4.3.5 POTENTIAL AREAS OF INVESTMENT 100
4.4 Mashare 100
4.4.1 INTRODUCTION 100
4.4.2 SIZE, LOCATION AND POPULATION 100
4.4.3 ECONOMIC ACTIVITIES 100
4.4.4 INFRASTRUCTURE AND SOCIAL SERVICES 101
4.4.5 POTENTIAL AREAS OF INVESTMENT 102
4.5 Ndonga Linena 103
4.5.1 INTRODUCTION 103
4.5.2 SIZE, LOCATION AND POPULATION 103
4.5.3 ECONOMIC ACTIVITIES 103
4.5.4 INFRASTRUCTURE AND SOCIAL SERVICES 103

vii
4.5.5 POTENTIAL AREAS OF INVESTMENT 104
4.6 Ndiyona 105
4.6.1 INTRODUCTION 105
4.6.2 SIZE, LOCATION AND POPULATION 105
4.6.3 ECONOMIC ACTIVITIES 105
4.6.4 INFRASTRUCTURE AND SOCIAL SERVICES 105
4.6.5 POTENTIAL AREAS OF INVESTMENT 107
4.7 Mukwe 108
4.7.1 INTRODUCTION 108
4.7.2 SIZE, LOCATION AND POPULATION 108
4.7.3 ECONOMIC ACTIVITIES 108
4.7.4 INFRASTRUCTURE AND SOCIAL SERVICES 109
4.7.5 POTENTIAL AREAS OF INVESTMENT 110
5 CHALLENGES AND OPPORTUNITIES 111
5.1 AGRICULTURAL POTENTIAL AND CHALLENGES 111
5.2 MINING POTENTIAL AND CHALLENGES 113
5.3 MANUFACTURING POTENTIAL AND CHALLENGES 113
5.4 RETAIL AND WHOLESALE POTENTIAL AND CHALLENGES 113
5.5 SERVICES SECTOR POTENTIAL AND CHALLENGES 114
5.6 TOURISM POTENTIAL AND CHALLENGES 114
5.7 HUMAN RESOURCE POTENTIAL AND CHALLENGES 115
5.8 PHYSICAL INFRASTRUCTURE 115
5.9 RUNDU 116
5.10 SOCIAL DEVELOPMENT PROJECTS 116
5.11 CONCLUSION 117
WORKS CITED 119

viii
LIST OF FIGURES
Figure 1: Locality of Kavango East Region ..................................................................................... 3
Figure 2: Kavango East Population Distribution, 2014 ................................................................... 4
Figure 3: Mean Annual Rainfall ........................................................................................................ 6
Figure 4: Kavango East Minimum and Maximum Temperatures ................................................ 7
Figure 5: Kavango East Soil Types .................................................................................................... 8
Figure 6: Kavango East Areas of Agricultural Potential ................................................................ 9
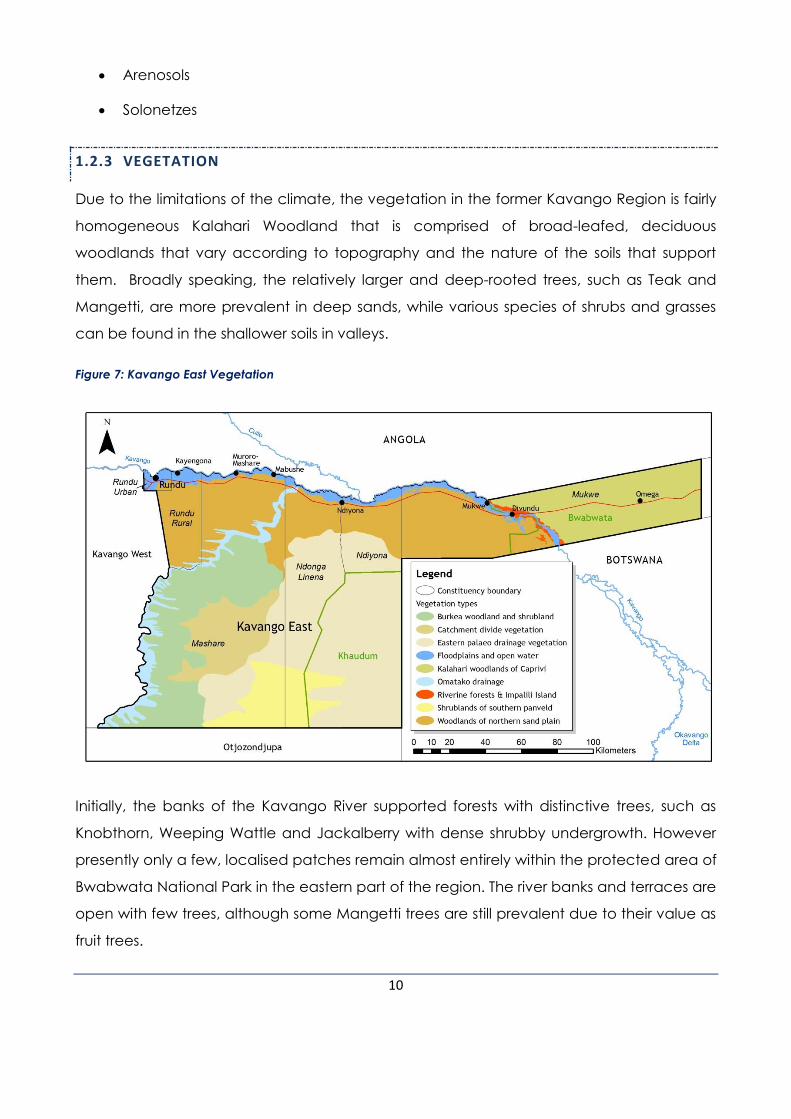
Figure 7: Kavango East Vegetation .............................................................................................. 10
Figure 8: Kavango East Terrestrial Diversity ................................................................................... 12
Figure 9: Flow Diagram of the National Development Planning Process ................................ 17
Figure 10: Approximate Kavango East Region Population Growth 2001-2011 (Old
delineation) ...................................................................................................................................... 21
Figure 11: Kavango East Population Pyramid, 2011 .................................................................... 22
Figure 12: Kavango East Percent of Female-headed Households, 2001-2011 ....................... 24
Figure 13: Kavango East Average Household Sizes, 2001-2011 ................................................ 25
Figure 14: Kavango East Percent of Population Aged 15+ Participating in the Labour
Force, 2011 ....................................................................................................................................... 25
Figure 15: Kavango East Percent of Unemployed Population aged 15+, 2001-2011 ............ 27
Figure 16: Kavango East Percent Distribution of Households by Main source of income,
2011.................................................................................................................................................... 29
Figure 17: Kavango East Access to Schools ................................................................................. 32
Figure 18: Kavango East Literacy Rates, 2011 ............................................................................. 34
Figure 19: Kavango East Percent Change in Literacy Rates, 2001-2011 ................................. 34

ix
Figure 20: Kavango East Protected Areas, Communal Conservancies and Community
Forests ................................................................................................................................................ 38
Figure 21: Kavango East Community Conservancies ................................................................ 40
Figure 22: Kavango East Community Forests ............................................................................... 42
Figure 23: Kavango East Percent Employed Population by Main Sector, 2011...................... 45
Figure 24: Kavango East Green Schemes .................................................................................... 48
Figure 25: Kavango East Small-Scale Commercial Farms .......................................................... 49
Figure 26: Kavango East Tourism Facilities .................................................................................... 53
Figure 27: Kavango East Mining Exploration Licences ............................................................... 62
Figure 28: Kavango East Region Access to Health Facilities ..................................................... 68
Figure 29: Kavango East Percent Changes in HIV Prevalence Rates: 1994-2012 ................... 69
Figure 30: Kavango East Percent Household Access to Services, 2011 ................................... 70
Figure 31: Kavango East Police Stations ....................................................................................... 81
Figure 32: Kavango East Road Network ....................................................................................... 82
Figure 33: Kavango East Electricity Network and Proposed Electrification Localities ........... 85
Figure 34: Kavango East Water Provision ..................................................................................... 89
Figure 35: Kavango East MTC Coverage ..................................................................................... 92
Figure 36: Locality of Constituencies ............................................................................................. 95
LIST OF TABLES
Table 1: Kavango East Region Demographic Statistics, 2011 ................................................... 22
Table 2: Kavango Region Distribution of Age Groups, 2001 and 2011 (Old delineation) ..... 23

x
Table 3: Kavango East Percent of Population Aged 15+ Participating in the Labour Force,
2001-2011 (Old delineation) ........................................................................................................... 26
Table 4: Kavango East Percent of Unemployed Population aged 15+, 2001-2011 (Old
delineation) ...................................................................................................................................... 27
Table 5: Kavango East Percent of Population aged 15+ by Employment Status, 2011 ........ 28
Table 6: Kavango East Percent Distribution of Household Income, 2001 and 2011 (Old
delineation) ...................................................................................................................................... 30
Table 7: Kavango East Percent Distribution of Households by Type of Housing Unit, 2011 ... 31
Table 8: Kavango East Percent Distribution of Households by Main Material Used for Walls,
2011.................................................................................................................................................... 31
Table 9: Education Indicators and Trends .................................................................................... 33
Table 10: Kavango East Percent of Population Aged 0-4 by Early Childhood Development
Attendance, 2011 ............................................................................................................................ 35
Table 11: Kavango East Percent of Population Aged 5-24 by School Enrolment, 2011 ........ 36
Table 12: Kavango East Percent of Population by Change in School Enrolment Rates, 2001-
2011.................................................................................................................................................... 36
Table 13 : Kavango Region Percent of Population aged 15+ who left school by Highest
Level of Educational Attainment, 2001 and 2011 ....................................................................... 37
Table 14: Kavango East Community Forests ................................................................................ 58
Table 15: Kavango East Percent Household Access to Services, 2001-2011 (Old delineation)
............................................................................................................................................................ 71
Table 16: Kavango East Cash/Work for Food Projects, 2010-2014 ............................................ 71
Table 17: Kavango East Income Generating Projects, 2009-2014 ............................................ 72
Table 18: Kavango East Rural Employment Schemes, 2012-2014 ............................................. 73
Table 19: Kavango East Food Security Projects, 2012-2014 ....................................................... 73

xi
Table 20: Kavango East One Region One Initiative Projects, 2012-2014 ................................. 73
Table 21: Changes in Poverty and Extreme Poverty in Namibia and the Kavango Region,
1993/4-2009/10 ................................................................................................................................. 77
Table 22: NHIES Poverty lines, 2003/4 and 2009/10 ..................................................................... 77
Table 23: Gini Coefficients for Namibia and the Kavango Region, 1993-2004 ...................... 78
Table 24: Education Indicators and Trends .................................................................................. 79
Table 25: Kavango East - Households by Main Source of Energy, 2011 .................................. 85
Table 26: Kavango East Electrification Priorities .......................................................................... 86
Table 27: Kavango East Percent Households by Access to Safe Drinking Water, 2011 ........ 87
Table 28: Kavango East Percent Households by Type of Toilet Facility, 2011 ......................... 90
Table 29: Kavango East Percent Households by Type of Garbage Disposal, 2011 ............... 91
Table 30: Kavango Region (old delineation) Percent Population with Access to ICT, 2011 92
Table 31: Kavango East HIV/AIDS Support Organisations .......................................................... 94

xii
EXECUTIVE SUMMARY
INTRODUCTION
The objectives of the Kavango East Regional Development Profile are to comprehensively
describe the social, economic, infrastructural and institutional environments prevailing in
the Region, to highlight the competitive advantages, to identify challenges and limitations
and highlight opportunities to guide development in the Region.
In preparing the Regional Development Profile, existing information was used and it made
extensive use of the information contained in the national and regional census
documents, the Kavango Integrated Regional Land Use Plan and the Local Economic
Development Strategy for the former Kavango Region.
The Kavango East Region stretches from just west of Rundu up to the eastern boundary of
the former Kavango Region. The Region covers an area of 23 983.2 km2 and constitutes
about 2.9% of Namibia’s extent. The region is bordered by the Kavango River and Angola
to the north, the Zambezi Region and Botswana to the east, the Kavango West Region to
the west and the Otjozondjupa Region to the south. There are 6 Constituencies in the
Kavango East Region: Rundu Urban, Rundu Rural, Mashare, Ndonga Linena, Ndiyona and
Mukwe. Rundu is the capital of the Region.
PHYSICAL CHARACTERISTICS
The Kavango East Region generally receives more rainfall than the rest of the country,
except for Zambezi. The highest rainfall usually occurs in the summer months with the
periods of highest rainfall normally in January and February. Temperatures are mild but
some frost occurs close to the Kavango River. Soils are generally sandy with low nutrient
levels with more fertile soils occurring along a thin strip next to the Kavango River.
Agricultural potential in the region is therefore generally low except for the floodplains and
soils close to the river.
Vegetation in the region is fairly homogenous Kalahari Woodland comprising broad-
leafed deciduous forests that vary according to topography and soil quality. Another
important plant area is the Kavango River Valley, which is important wetland system with
some endemic and near endemic plant species as well as a number of critically

xiii
endangered species of ground orchids. Deforestation in the woodlands as well as on the
banks of the river is a challenge.
Terrestrial diversity is high with a number of core wildlife areas, national parks and the river
accommodating an impressive range of fish and wildlife. The most conspicuous and
important feature in the region is the perennial Kavango River which is the main source of
life in the region.
THE POPULATION AND ITS RESOURCES.
The table below provides a summary of key statistics at a glance.
Indicator Kavango East Namibia
Population
Population size
Total 136,823
Females 72,936
Males 63,887
Total 2,113,077
Females 1,091,165
Males 1,021,912
Pop. Size as a % of National Pop. 6.47%
Annual Growth Rate 0.7% 1.4%
Urban n/a 43.0%
Rural n/a 57.0%
Sex Ratio: Males per 100 Females 87.6 94.0
Area in sq. km 23,983 824,116
Pop. Density (persons / km2) 5.7 2.1
Area of region as % of Namibia 2.9%
Age Composition
<5 Years 15% 14%
5 - 14 Years 26% 23%
15 - 59 Years 52% 57%
60 Years & Above 7% 7%
Main language spoken at home Kavango languages
91%
Climate & Rainfall
Mean max temp in summer 32°-36°C
Mean minimum in winter 4o-6°C
Mean annual rainfall 450- 600mm

xiv
Rainfall in Nov-April 80%
Average Growing Period 61-90 days
Household and Housing Characteristics
Total No. of Private Households 30,467 464,839
Average Household size 5.8 persons 4.4 persons
Household Headship
Female 44.6% 44%
Male 55.4% 56%
Literacy and Education
Literacy Rate 81% 85%
Enrolment rates among 5 - 24 year olds
Boys
64.6
Girls
59.7
Boys
62.4
Girls
64
Learner-teacher ratio 27.2 24.8
Labour Force & Economic Conditions
Labour force participation rate (2011) Male:
63%
Female:
65%
Male:
67%
Female:
61%
Unemployed (2011) Male:
47%
Female:
59%
Male:
30%
Female:
43%
Main Sources of Income:
Farming 33% 16%
Wages & Salaries 29% 48%
Cash Remittance 7% 5%
Business, non-farming 14% 12%
Pensions 12% 15%
Poverty Indicators (Former Kavango Region)
Severely poor (2009/2010) 24 % of h/h 9.6% of h/h
Poor 43.4 % of h/h 19.5% of h/h
Ave. annual income per capita N$5,682 N$14,559
Poverty Share of total national poverty 22.4%
Access to services (Former Kavango Region)
Households with access to health
service within 10 km (2009/10) 82.6% 78.9%
Proportion of households walking ›1km
to safe water source (2009/10) 24% 10.9%
Proportion of households without a
safe toilet facility 75% 49%

xv
The Kavango East Region has three National Parks that fall under the jurisdiction of the
Ministry of Environment and Tourism (MET): the Bwabwata National Park (including the
Ramsar Site), the Khaudum National Park and the Popa Game Park. The parks are a
major focal point for tourism in the region.
There are currently four registered Communal Conservancies in the Region and two
emerging conservancies that are in the process of being registered. There are also seven
gazetted and one emerging community forest.
Kavango East is well endowed with natural resources and its scenic beauty related to the
river, the woodlands and its wildlife linked with higher than average rainfall makes it a very
attractive region. The key challenges related to the state of the natural environment
relates to the risk of over abstraction of water from the Kavango River, the impact of
mixed subsistence farming practices, especially overstocking and deforestation, the
adequate provision of services where concentrations of people are found, obviously in
the urban areas of the region and then specifically related to sewage treatment and solid
waste management and the uncontrolled utilisation of resources such as sand and wood.
THE ECONOMY
The economy of Kavango East is vested in the agricultural, manufacturing, trade, and
services sectors (which includes government services), and tourism. These are noted as the
key economic sectors.
The statistical figures illustrate that the agricultural sector is the most important sector in
Kavango East, with 47% of the employed population being active in this sector.
The agricultural sector in Kavango East is vested in the subsectors of large scale crop
farming, small scale commercial farming and mixed communal farming. Forestry and
Fishing also plays a significant role.
The Green Scheme is a government scheme set up by the Ministry of Agriculture, Water
and Forestry which aims to encourage the development of irrigation based agronomic
production in order to increase the GDP contribution of agriculture, and to uplift local
communities in the proximity of these schemes. Five of the twelve Green Schemes
operational in Namibia are currently located in Kavango East.

xvi
The Green Schemes are considered somewhat successful in that they have created
employment opportunities, and they have contributed towards food security for Namibia.
Despite the employment opportunities created, jobs generated have been lower than
expected.
Communal farms are typically an average of 1.9 ha in size, and the main crops grown
include mahangu, sorghum and maize, as well as a limited amount of vegetables.
Vegetables are mostly produced for domestic consumption. These farmers also keep
livestock such as goats and cattle.
Small-scale commercial farms (SSCF) mostly consist of dry farming activities. These farms
are located further inland (further away from the Kavango River) and suffer from various
problems such as lack of farm infrastructure, poor accessibility and low access to markets.
Horticulture products are grown as part of the Green Scheme projects, on some of the
small-scale irrigation farms, as well as a part of community gardens. These crops are
therefore exclusively grown along the Kavango River and in the back yards of
homesteads.
Livestock is farmed for both commercial gain and through the SSCF units. However, most
livestock farming is not used for commercial purposes (cattle and goats), but rather as a
measure of wellbeing. Therefore, cattle are only slaughtered on special events and to
cover specific expenses.
A large variety of indigenous fruit and vegetables are found and these are collected
throughout the year and used for food and for traditional healing. Although not currently
used commercially, a number of products have the potential for commercial uses such as
cosmetics and as medicines.
The forestry sector holds potential for economic development, however currently there is
a ban on the harvesting of all forestry products. This is due to over-utilisation which has
hindered growth in this sub sector as well as having negative spin-off effects on other
sectors such as the craft industry
Fish is the preferred diet of the local inhabitants of the Kavango East Region, and thus
fishing plays an important role in terms of food security. However, it has less value from an
economic perspective. There are two types of fishing currently occurring in the region.

xvii
Freshwater fishing currently occurs along the Kavango River and is mostly associated with
subsistence fishing. There is also currently one commercial aquaculture facility operating in
Kavango East, namely Karovo which is located close to Mukwe and is a community–
based fish farm which produces tilapia and catfish. This farm however has a low yield and
productivity.
Currently mining in Kavango East plays a relatively unimportant role in the economy and
there are no mining licences or mines within the region. Although some Exclusive
Prospecting Licences (EPLs) have been given out within the region; the majority of these
are for precious stones, base and rare metals; industrial metals; industrial minerals and non-
nuclear fuel minerals. Some sand mining activities were taken note of in the region and
this activity has the greatest potential.
The manufacturing sector in the Kavango East Region is not well developed and only
accounts for 2% of the jobs created in 2011. Most of the industries can be classified as
micro and small scale enterprises, which implies that very few businesses have employees
and many of the businesses only operate part time. Most of the businesses are located in
the major settlements and in particular in Rundu and Divundu.
The retail sector and the financial and business sector each contribute 8% towards
employment in the Kavango East Region. The majority of retail and commercial activities
take place in Rundu in the form of specialised retailers, which illustrates its importance as a
trading centre for the surrounding agricultural areas.
The Kavango East Region also has a strategic location and the Trans Caprivi Highway links
this region with Walvis Bay on the coast with the neighbouring countries of Botswana as
well as further inland to Zambia, the DRC and Zimbabwe. This creates opportunities for a
logistical hub to be developed in towns such as Rundu as well as to promote additional
specialised retailers focusing on agricultural implements and equipment.
The services sector in the Kavango East Region is fairly well diversified and accounts for
24% of employment opportunities. It is however important to note that a large number of
these jobs are created in the government sector.
Most of the services are located in Rundu. However, most of these businesses are small
and 82% of identified activities have been reported by the RTC as falling into the non-
formal sector with 80% trading as sole proprietors.

xviii
Tourism in the Kavango East Region is an important activity. The region has diverse
biodiversity and wildlife, a number of natural attractions (Kavango River, scenic areas)
three national parks, cultural heritage, and has been experiencing increased trade from
neighbouring areas.
Currently there are three National Parks, three communal conservancies, two emerging
conservancies and larger consolidated areas such as the Transfrontier Conservation Area,
Khaudum North Complex and the Proposed Ramsar site.
Currently, an estimated 73 000 leisure tourists visit the former Kavango Region however, it is
estimated that due to the fact that Kavango East has more tourism attractions, better
tourism infrastructure as well as more accommodation facilities; most of those tourists visit
the Kavango East Region.
It is estimated that there are currently about 120 000 shopping tourists who visit the former
Kavango Region to shop for goods that are either not available in their countries of origin
or are cheaper from the surrounding countries of Angola, Botswana, Zambia and
Zimbabwe. However given the function of Rundu as a regional centre, it can be assumed
that the majority of these tourists visit the Kavango East Region. Despite this number, it is
estimated that these numbers (especially with tourists from Angola) could be significantly
increased with new infrastructure development.
There are 32 existing tourism accommodation facilities in Kavango East. Most of the
accommodation facilities are located around Divundu (which has good access to the
more scenic parts of the region), the existing national parks and conservancies as well as
in and around Rundu.
INFRASTRUCTURE PROVISION
The international and interregional road network in the Kavango East Region is well
developed. Especially the Trans Caprivi Highway is of great benefit for the Kavango East
Region with regards to access to local and foreign markets, as well as for tourism.
However, the local and urban road infrastructure is poorly developed and the condition
of these roads is often poor. An airstrip in Rundu handles medium-sized airplanes and the
Bagani Airstrip light aircraft.

xix
The electricity network in the Kavango East Region is limited to areas adjacent to the river
and the main roads. With the exception of the Rundu Urban Constituency, the majority of
residents in the region do not have access to power from the grid and make use of
traditional sources of energy or gas.
The Kavango River is the main source of water for people living along the river, while
people in the rest of the region are dependent on wells or boreholes as a source of water.
Access to water for grazing and crop cultivation is one of the most important constraints
for development further inland removed from the river.
Access to toilet facilities in the Kavango East Region is poor, but improving. Efforts have
been made to improve access to toilets in Divundu and in the rural areas by the provision
of VIP toilets.
In order to stimulate development within the region, especially the rural areas, the
provision of rural water supply, improved road network, telecommunications and
electricity are urgently required.
SOCIAL SERVICES
The KRC and RTC have overseen the construction of 297 houses in the Kavango East
Region from 2007-2011 and 298 are currently being constructed. A further 129 building
plans for private investors have been approved by the RTC.
The MURD undertook various rural development programmes since 2009, including
cash/food for work projects, income-generating projects, rural employment schemes,
food security and nutrition programmes and the One Region One Initiative. However,
these projects have not been monitored and therefore cannot be assessed for
effectiveness and likely suffer from similar constraints as the gender empowerment
projects.
Land resettlement efforts in the Kavango East Region have been focused on the
establishment and support of 363 Small Scale Commercial Farms. The objective of land
resettlement efforts is to provide land for the landless and destitute, but the majority of
land owners live elsewhere, therefore the success of resettlement efforts is limited if
measured against resettlement objectives. The roads and water infrastructure is also poor,
impacting the productivity of the farms.

xx
Poverty can be defined in economic terms, as well as ownership and access. However,
according to all the measures, the former Kavango Region performs below average.
According to both the 2003/4 and 2009/2010 Namibia Household Income and
Expenditure Surveys, the former Kavango Region had the highest levels of poverty in the
country and, in 2009/2010 had the second highest level of extreme poverty. A positive
development is that the income inequality in the region is decreasing.
Community Development programmes in the town of Rundu include a small grant fund
and the women and youth cleaning programme. The Small grants fund includes
gardening projects, centres for orphans.
INSTITUTIONAL SERVICES SECTOR
Various financial institutions have branches in Rundu, while the rest of the Kavango East
Region has banking access via ATMs or from NamPost.
The Rundu Magistrate Court is the main legal authority in both the Kavango East and
Kavango West Region. In the Kavango East Region a Control Magistrate administers Court
in Rundu, while two Magistrates operate at the district level at periodic courts in Mukwe
and Ndiyona. However, most rural citizens make use of traditional courts proceeded over
by the four Traditional Authorities since they are more easily accessible.
The distribution of police stations is concentrated along the Trans Caprivi Highway and at
the border posts to Angola and Botswana.
Churches, Constituency Councillors and Social Support Organisations provide valuable
moral and social support to residents in the Kavango East Region. The support
organisations mostly focus on HIV/AIDS awareness and support.
CHALLENGES AND OPPORTUNITIES FOR REGIONAL DEVELOPMENT
The Kavango East Region has always been the part of the former Kavango Region where
the most development took place and to where the most money for development was
allocated by both the private and the public sector. However, with a large rural
population spread over a large area, it is difficult and costly to provide services to people
in the rural areas who live far apart in individual homesteads or in small villages.

xxi
Development challenges (which mostly need to be attended to by the government
through the regional council) as well as opportunities and advantages which can be
exploited by both the public and the private sector to create employment and bring
much needed development to the region were identified.
Development generally follows infrastructure, be it roads or water or electricity or even
other large scale projects such as the Green Scheme. Government has, since
independence, already achieved much to provide infrastructure which is required to
stimulate and motivate people and investors to identify and make use of development
opportunities available in the region.
The agricultural sector in Kavango East is one of the most important sectors both in terms
of food security as well as job creation and latent opportunity. The Green Scheme is an
important factor in this regard and can be further expanded to increase this potential.
Opportunities in this sector include the extensive biodiversity of the region, which allows for
a wide range of different agricultural products to be cultivated and processed for value
addition and expansion of the manufacturing sector and the Kavango River, which
creates the opportunity to expand the Green Scheme / Irrigation along the river. This is
especially true if high value crops are cultivated rather than staple foods. It further include
the Fresh Produce Hub at Rundu, which improves access for farmers to training, cold
storage and marketing infrastructure, indigenous products, which can be utilised for value
addition and commercialisation, forest resources which can be processed to expand the
manufacturing sector and the opportunity to transform rural farming in the area to market
orientated businesses. The imminent development of an abattoir in Rundu is likely to be
another important opportunity to transform current farming practices.
Challenges within this sector which need to be addressed include the “Red Line” and the
restriction this places on the trade of livestock with the rest of Namibia. Traditional livestock
ownership patterns, which often result in farmers unwilling to sell or trade in livestock; the
difficulty in gaining ownership of land for communal farmers which in turn results in the
difficulties for farmers to access financial assistance and loans; the lack of infrastructure on
SSCFs, conflicts over land uses between conservation activities and traditional farming
(human wildlife conflict); poor soil, lack of access to markets; the over utilised fishing sector
and the timber ban all add to this.

xxii
With respect to Manufacturing, there are opportunities to add value, particularly to the
primary sector with regards to agricultural products that are produced in the region. The
wood harvesting ban also needs to be eliminated so that the timber industry, which holds
a lot of potential, can be developed.
In terms of retail and wholesale trade, The Kavango East Region is strategically located
and these opportunities need to be expanded, particularly links to countries such as
Botswana, Zambia and Angola. There is also the opportunity to develop more specialised
retailers, particularly within sectors of opportunity such as agricultural implements and
equipment. The main urban areas in the region are likely to grow substantially and at a
reasonably fast rate, which should further increase opportunities for trade.
Despite these opportunities, challenges are that the entrepreneurial spirit is lacking to a
large extent in businesses and therefore changing market conditions are not optimised.
Improvement of the organisation and cooperation between businesses is required as well
as with public institutions. Further training and mentorship of businesses is also required.
There are a number of opportunities pertaining to services in Rundu (regional support)
which can be expanded on and the proposed increase in growth in Divundu will also
make it an increasingly important node in terms of service delivery, especially to the
various tourism establishments in the area. Despite these opportunities, challenges are
that the services sector lacks specialisation which has resulted in limited employment
opportunities.
In terms of Tourism, the diversity of the region creates the opportunity to create unique
products for local and international tourists. The bridge connection proposed to link
Rundu with Angola should increase opportunities for shopping tourists. The temporary
floating bridge that has recently been constructed already caused an increase in visitors
from Angola. Other opportunities include increasing communal conservancies and wildlife
corridors in the eastern part of Kavango East especially around the Cuito to Divundu
tourism node, the expansion of farming activities by SSCF farmers in the Khaudum –SSCF
node into tourism activities such as lodges, rest camps, hunting lodges and trophy hunting.
There is also opportunity to expand tourism activities at the Bwabwata and Khaudum
National Parks, with a focus on cultural tourism, 4X4 off road adventures, trophy hunting,
scenic landscapes and wildlife viewing. The Ramsar site has a lot of tourism potential and

xxiii
the expansion of this site up to Mukwe (in phases) will increase this tourism potential for the
general region.
There is further opportunity to create craft markets on the main tourism routes of Divundu
and Rundu and to create and promote restaurants and accommodation establishments
along the Kavango River and in Rundu. These however should be of an international
standard.
Despite the opportunities for the tourism sector, there are challenges around infrastructure
and improved signage is required as well as a tourist information centre in either Rundu or
Divundu.
Skill levels are generally low and this makes meaningful employment creation difficult. If
manufacturing and processing should become one of the key drivers in the economy, it
will need to be augmented with substantial improvements of skills in the region. While skill
levels in the region are improving, it does unfortunately take time for a population to
improve skill levels to a point where it will support the manufacturing and value addition
sectors. Education and vocational training is therefore a major opportunity and a
challenge at the same time.
In terms of Infrastructure, the Trans Caprivi Highway, water and electricity provision next to
the river, ICT connectivity close to the main infrastructure areas, and urban infrastructure
provides opportunities. However, local and urban road infrastructure on the other hand is
poorly developed and this is a challenge to development and service provision in outlying
areas. Off-grid solar systems could be investigated to supply electricity for lighting in the
deep rural area and especially at schools, hostels and clinics. However this should always
be coordinated with the existing rural electrification programme.
Rundu is a primate urban area in the Kavango East Region and the second largest urban
area in Namibia (in terms of population size). Rundu is well established as a regional centre
and already attracts business and traders from all over the region, as well as from other
regions such as Kavango West and even further afield such as Angola, Zambezi and
Zambia. However, Rundu is still struggling to transform from a small formal town with large
informal settlements without services around it. The provision of affordable housing and
services is now one of the key challenges. At the same time it is also an opportunity for

xxiv
investors and developers to take on property development projects, even in partnership
with the Rundu Town Council.
Rundu is also the place where one finds most of the government ministries and it therefore
has the most salaried positions in the region. Growing and developing Rundu and creating
an investor friendly environment is probably the best opportunity to draw manufacturing,
retail, wholesale and agro processing enterprises into the region. The key to all of this from
an institutional perspective is to ensure that serviced land is available for both residential
and business purposes to attract investors. This should create substantial competitive
advantage over other towns and cities in Namibia, all of which face similar challenges.

xxv
ACKNOWLEDGEMENTS
The contributions of the following people who made this profile possible and their inputs
are herewith acknowledged with thanks.
Honourable Governor, Dr. S Mbambo
The Chief Regional Officer of the Kavango Region, Mr S H Kantema
The Director of Planning and Development Services of the Kavango Regional
Council, Mr. A T Makongwa
The Town and Regional Planner of the Kavango Regional Council, Mr. J T Heita
Hon Councillor B Wakudumo of the Mashare Constituency
Hon Councillor N M Muremi of the Rundu Urban Constituency
Hon Councillor H K Mangundu of the Ndiyona Constituency
Hon Councillor M C Kalyangu of the Mukwe Constituency
Hon Councillor M M Shikongo of the Rundu Rural East Constituency
All the Regional and National stakeholders for the valuable inputs they made to the
Regional Development Profile
Urban Dynamics Africa (Pty) Ltd who led the consultant team
Knight Piesold Consulting Engineers for the infrastructure evaluations
Urban Econ for the economic assessment and inputs
Maproom for compiling the GIS maps of the various themes

xxvi
LIST OF ABBREVIATIONS
AIDS Acquired Immunodeficiency Syndrome
ATM Automatic Teller Machine
CBO Community Based Organisation
CF Community Forest
ECB Electricity Control Board
ECD Early Childhood Development
EMIS Education Management Information Systems
EPL Exclusive Prospective License
GDP Gross Domestic Product
GRN Government of the Republic of Namibia
HIV Human Immunodeficiency Virus
ICT Information and Communication Technology
IPA Important Plant Areas
IRLUP Integrated Regional Land Use Plan
KRMP Kavango Roads Master Plan
Km2 Square Kilometres
KRC Kavango Regional Council
LED Local Economic Development Plan
MAWF Ministry of Agriculture, Water and Forestry
MET Ministry of Environment and Tourism
MLR Ministry of Land Reform

xxvii
MME Ministry of Mines and Energy
MOE Ministry of Education
MURD Ministry of Urban and Rural Development
MTC Mobile Telecommunications Company
MWT Ministry of Works and Transport
NAMCOL Namibian College for Open Learning
NANGOF Namibia NGO Forum
NDC Namibia Development Cooperation
NDP National Development Plan
NGO Non-Governmental Organisation
NHIES Namibia Household Income and Expenditure Surveys
NPC National Planning Commission
NSA Namibia Statistics Agency
PPP Public-Private Partnership
RED Regional Electricity Distributor
RDCC Regional Development Co-ordinating Committee
RDP Regional Development Plan
REMP Rural Electrification Master Plan
RTC Rundu Town Council
RVTC Rundu Vocational Training Centre
RWSDP Rural Water Supply Development Plan
SADC Southern African Development Community

xxviii
SME Small and Medium Enterprise
SSCFs Small Scale Commercial Farms
TIPEEG Targeted Intervention Programme for Employment and Economic Growth
UNAM University of Namibia
VIP Ventilated Improved Pit Latrine

1
1 INTRODUCTION TO THE REGION
1.1 BACKGROUND
First demarcated after independence, the former Kavango Region initially covered 42 771
km2. A section of the Zambezi Region was later added, increasing it to 48 463km2. The
Kavango River is the lifeline of the Kavango East Region and its most important feature.
According to archaeological records, there is a
long history of settlement along the river,
which has been home to people for tens and
perhaps hundreds of thousands of years and
many modern Kavango people likely are the
descendants of those early farmers. Life was
probably rather easy in many respects
because abundant water, fish, relatively fertile
soils, grazing, wildlife and useful plant products
were available to the small population.
However, nowadays the Region is home to 136 823 residents with the majority residing
within an approximately 10km wide ribbon along the river. The lack of open, arable land
and grazing along the river has led to settlement further away from the river where
conditions are less favourable (Mendelsohn & el Obeid, A digest of information on key aspects of Kavango’s
geography and sustainable development prospects, 2006).
However, the sheer size of the region and its elongated form made it difficult to be
managed and developed as a single region. Therefore, the government of Namibia
changed the boundaries of the former Kavango Region in 2013 effectively splitting it into
two regions namely the Kavango East and Kavango West regions.
Due to the creation of two new Kavango Regions, the Kavango Regional Council (KRC)
has identified the need to formulate up-to-date separate Regional Development Profiles
for each region with the objective of providing guidance on potential programmes and
projects that need to be implemented. The comparative advantages of the two new
regions for social and economic development are not fully exploited by either public or
private sectors because current information on each region is not available.

2
Therefore the KRC commissioned the formulation of regional development profiles to
encourage the exploitation of the regional economic potential and the satisfaction of the
needs of its people.
The former Kavango Region has been the subject of a variety of plans since
independence. The first Regional Development Profiles for all regions in Namibia were
prepared just after independence and basically consisted of a set of status quo
information on the economic, social, infrastructural and institutional sectors. The Regional
Development Profiles were followed by Regional Development Plans. These plans were
also formulated for all the regions and went a little further to define the development
needs and potentials within each region and to identify development projects required to
reach specific sectoral development objectives set out by the plan. However, the actual
implementation of these development plans was problematic in all regions, perhaps
because the institutional framework for its successful implementation was not in place.
Subsequent to the Regional Development Plans, a number of sectoral master plans such
as the Kavango Roads Master Plan (KRMP), Rural Water Supply Development Plan
(RWSDP), Rural Electrification Master Plan (REMP), Local Economic Development (LED)
Plan and Integrated Regional Land Use Plan (IRLUP) were prepared for the region.
Especially the LED Report and the IRLUP Reports (Volumes I and II) are considered to be
detailed and comprehensive, although the data refers to the former Kavango Region in its
entirety and not the newly created Kavango East and Kavango West Regions. These
reports will thus be extensively referred to and, as far is possible, care was taken to
disaggregate the data into the East and West Regions.
The objectives of the Kavango East Regional Development Profile are to comprehensively
describe the social, economic, infrastructural and institutional environments prevailing in
the Region, to highlight the competitive advantages, to identify challenges and limitations
and highlight opportunities to guide development in the Region.

3
1.1.1 LOCALITY AND SIZE
The Kavango East Region stretches from just west of Rundu up to the eastern boundary of
the former Kavango Region. The Region covers an area of 23 983.2 km2 and constitutes
about 2.9% of Namibia’s extent. The region is bordered by the Kavango River and Angola
to the north, the Zambezi Region and Botswana to the east, the Kavango West Region to
the west and the Otjozondjupa Region to the south. There are 6 Constituencies in the
Kavango East Region: Rundu Urban, Rundu Rural, Mashare, Ndonga Linena, Ndiyona and
Mukwe. Rundu is the capital of the Region. In extent, Mashare is the largest of the
constituencies, while Rundu Urban is the smallest.
Figure 1: Locality of Kavango East Region

4
The distribution of people speaking different languages broadly follows the tribal areas of
the region. Some 46% of the population in the former Kavango Region speak Rukwangali
as their mother tongue, a language that is spoken by the Vakwangali and Mbunza tribes;
21% speak languages of Angolan origin (mainly Nyemba), while 18% speak Rumanyo, a
language spoken by the Vagciriku and Shambyu tribes. Eight percent speak the
Thimbukushu language of the Mbukushu tribe, while 5% speak other Namibian languages
(mainly Oshiwambo) and 2% use European languages (NPC, Regional Poverty Profile for Kavango
Region, 2006, p. 6).
1.1.2 POPULATION
While 43% of Namibians reside in urban areas, the Kavango East Region is 47% urbanised
with people residing mostly in and around the town of Rundu. Historically, people settle
where water and soils permit farming, creating a pattern of unevenly distributed
settlements within the region with nearly three-quarters of the population living near the
Kavango River.
Figure 2: Kavango East Population Distribution

5
More settlements away from the river developed due to a lack of open, arable land and
grazing along the river on which they can farm. The provision of water from boreholes
and the opening of roads also allowed people easier access to unsettled areas. The
establishment of cattle posts by wealthier farmers with large cattle herds furthermore
expanded into small villages. However, living conditions in small, remote villages away
from the river and main roads are difficult with little access to services and limited chance
of participating in the retail and cash economy. Land available for crop cultivation is also
increasingly limited. As a result, many of the villages have shrunk, often causing local
public services such as schools to become redundant or uneconomical. (Mendelsohn & el
Obeid, A digest of information on key aspects of Kavango’s geography and sustainable development prospects, 2006, p.
6).
1.2 PHYSICAL CHARACTERISTICS
The Kavango East Region lies in the middle of the Kavango Basin, bordering both Angola
and Botswana. The two main Angolan rivers, the Cubango and Cuito rivers, carry water
from the Angolan highlands into the Kavango River, which runs through both the Kavango
Regions into Botswana's Okavango Delta where rainfall is lower than anywhere else in the
Basin. Drainage lines that are now dry, such as the Omatako Omuramba, used to carry
water into the Okavango during much wetter times long ago. (Mendelsohn & el Obeid, Sand and
Water. A Profile of the Kavango Region, 2003).
The flow of the Kavango River is the main
artery of the Region and is impacted by and
impacts on all its physical characteristics
from rainfall to the soil structure and carrying
capacity, which again impacts on the
vegetation and animal life that is found in
the Region. This, in turn, impacts on the
economic activities and livelihoods of the
residents of the Region, which is heavily dependent on agriculture and tourism. As such,
the Kavango River is the very lifeline of the Region and its most important feature.

6
1.2.1 RAINFALL AND CLIMATE
The former Kavango Region generally receives more rain than the rest of the country
(except Zambezi) with an annual average rainfall that varies between about 450 and 600
mm with the highest rainfall in the most northern areas.
As with most of Namibia, the Kavango East Region receives summer rainfall with the first
early rains coming to the region in October and November. The highest rainfall usually
occurs in January and February and the months from May to September tend to be dry.
(Mendelsohn, Jarvis, Roberts, & Robertson, 2002)
Figure 3: Mean Annual Rainfall
While about 80% of all rain falls between December and April, the amount, timing and
effectiveness of rainfall varies greatly from year to year and also from place to place,
making rain-fed crop production very risky. For instance, a period of about four weeks
with dry, hot weather can cause failure of mahangu fields, the staple and favourite crop
for most smallholder farmers (MLR, Draft Integrated Kavango Regional Land Use Plan. Volume I., 2013 (a)).
Furthermore, as in the rest of the country, the evaporation rate is high.

7
The potential for solar power is good, as solar radiation levels are generally high
throughout the year. (Mendelsohn, Jarvis, Roberts, & Robertson, 2002). The Kavango East Region
experiences average maximum temperatures of over 30°C for nine months of the year
and average minimums of 4-6°c during the winter months of June, July and August. While
temperatures below freezing point are only rarely recorded and mostly occur in the low-
lying valleys, such as those of the Kavango River, they nonetheless rule out the option of
growing any frost-sensitive tropical fruits (e.g. litchis, macadamia nuts) in the irrigable
areas close to the river. On the other hand, in summer the very hot and dry conditions can
prevent fruit ‘setting’, which is why most citrus varieties do not do well in Former Kavango
(MLR, Draft Integrated Kavango Regional Land Use Plan. Volume I., 2013 (a)).
Figure 4: Kavango East Minimum and Maximum Temperatures
Wind speeds in the former Kavango Region are generally very low, and in most months it is
completely calm for over half the time (Mendelsohn, Jarvis, Roberts, & Robertson, 2002). Therefore,
there is little potential for wind power, and wind-driven water pumps (MLR, Draft Integrated
Kavango Regional Land Use Plan. Volume I., 2013 (a)).
1.2.2 SOIL TYPES
In terms of soils, the former Kavango Region is an undulating plain of unconsolidated
sands that gradually slope down northwards to the Kavango River and eastwards to the
lowest areas along the river before it enters Botswana. The plains undulate from sculpting
of the sand into long, low east-west oriented dunes that are covered in vegetation and
not generally visible. The plains are traversed by small ephemeral river channels, the most
prominent one being the Omuramba Omatako that meets the Kavango River east of
Rundu.

8
Soil is often taken for granted as the substance that soaks up rainwater and in which
grasses, trees and crops grow. With the exception of farmers, most people lack the
understanding of how soils vary and how their qualities affect its suitability for crop
production. Different types of soils impact on the quantity of water that is retained, the
depth to which a plant’s roots may extend, and what nutrients the soil contains for plant
growth. Furthermore, the combination of these qualities dictates important features like
which plant species can grow and the structure of plant communities (Mendelsohn & el Obeid,
2003, p. 62).
Figure 5: Kavango East Soil Types
In general, the soils of the Kavango East Region are not well suited for agriculture. The
predominant soil type, arenosol, has a sandy and porous texture that drains rapidly
leaving little moisture in the soil and holding few nutrients. However, as can be seen in
Figure 5, along the Kavango River nutrient-rich fluvisols are deposited during floods, which
are more suited for crops. Still, due to periodic flooding, these areas are only suitable for
small-scale cultivation, which utilises areas as floodwaters recede, and not for large scale
irrigation faming. Furthermore, over time the soil becomes modified by repeated
ploughing and crop growth, referred to as anthrosols, which is a mixture of fluvisols and
arenosols that progressively decrease soil fertility.

9
Calcisols contain slightly higher proportions of clay and silt that improve the water
retention of the soils and therefore have a slightly improved potential for crops. Calcisols
are found in the inter-dune valleys and dry river beds to the south and north-central parts
of the Kavango East Region. However, the soils remain fairly infertile to low levels of
organic matter and the predominance of sand. Finally, a block west of Khaudum
contains solonetz soils with high levels of sodium (salt) and low soil fertility. (MLR, Draft Integrated
Kavango Regional Land Use Plan. Volume I., 2013 (a)) These soils typically form where salts are abundant
and evaporation rates are particularly high. Only a few specialised plants are able to
grow in these areas (Mendelsohn, Jarvis, Roberts, & Robertson, 2002, p. 59).
Figure 6: Kavango East Areas of Agricultural Potential
For the intent of mapping the suitability of areas for irrigation and dry land crop farming, a
working hierarchy of soil suitability (from best to worst) was listed in the Kavango
Integrated Regional Land Use Plan and is illustrated in Figure 6 above (MLR, Draft Integrated
Kavango Regional Land Use Plan. Volume I., 2013 (a)):
Fluvisols
Calcisols
Anthrosols
10
Arenosols
Solonetzes
1.2.3 VEGETATION
Due to the limitations of the climate, the vegetation in the former Kavango Region is fairly
homogeneous Kalahari Woodland that is comprised of broad-leafed, deciduous
woodlands that vary according to topography and the nature of the soils that support
them. Broadly speaking, the relatively larger and deep-rooted trees, such as Teak and
Mangetti, are more prevalent in deep sands, while various species of shrubs and grasses
can be found in the shallower soils in valleys.
Figure 7: Kavango East Vegetation
Initially, the banks of the Kavango River supported forests with distinctive trees, such as
Knobthorn, Weeping Wattle and Jackalberry with dense shrubby undergrowth. However
presently only a few, localised patches remain almost entirely within the protected area of
Bwabwata National Park in the eastern part of the region. The river banks and terraces are
open with few trees, although some Mangetti trees are still prevalent due to their value as
fruit trees.

11
Large areas of reeds grow in the river margins in the floodplains of the Kavango River.
There are also permanently swamped areas (e.g. in the vicinity of the Cuito confluence)
with meanders, oxbow lakes and waterlogged floodplains, fringed with papyrus and other
reeds and swamp vegetation (MLR, Draft Integrated Kavango Regional Land Use Plan. Volume I., 2013 (a)).
According to Hofmeyer (cited in MLR, 2013(a)), two Important Plant Areas (IPAs) are recognised
in Kavango East: the Kavango woodlands and the Kavango River valley, which recognises
sites with exceptional botanical richness and/or outstandingly rare, threatened and/or
endemic species, and/or vegetation of high botanic value. However, an IPA status does
not confer conservation protection to an identified area.
The Kavango woodlands are unique in Namibia, although they do not contain endemic
species. Fires and timber collection operations that are currently banned in the Region
pose threats to this resource. Tree diversity in the woodlands is high and there are several
special interest species.
The Kavango River Valley, which is a small strip that runs along the Kavango River in the
north-central part of the Kavango East Region, is an important wetland system with some
near-endemic plant species as well as a few Endangered and Critically Endangered
species of ground orchids (Bethune cited in MLR, 2013 (a)). Over 95% of the Riverine forests that
used to line the banks have been cleared with only a few isolated patches remaining, e.g.
around Popa Falls and on rocky islands in the river near Mukwe. The main threat to the
riverine forest is the slash-and-burn cultivation system. As fields become unproductive after
a few years, new land is “slashed and burned” constantly claiming new land.
1.2.4 TERRESTRIAL DIVERSITY
Due to the clearing of land and hunting, much
of the wildlife that used to occur along the
Kavango River has now disappeared and
most of the remaining wildlife is now
concentrated in the Bwabwata and Khaudum
National Parks. The Mahango area of
Bwabwata, specifically, has the highest
concentration of large mammals as well as

12
the greatest diversity of birds in Namibia. This led to it being registered as a Ramsar
Wetland of International Importance (MET, Bwabwata National Park Profile, 2014 (a)). Other species of
conservation priority in Bwabwata include pangolin, African Clawless Otter, Sitatunga,
reedbuck and bushbuck. Large species, such as hippo and crocodile, also occasionally
move from the park into upstream, inhabited parts of the river. Elephants move between
Khaudum and Bwabwata, some taking a short cut through Botswana, and mainly
breeding herds following routes north of Khaudum and west of Bwabwata in Namibian
territory (MLR, 2013 (a)).
Figure 8: Kavango East Terrestrial Diversity
In the Kavango River fish are very diverse and abundant due to the wide habitat diversity
provided by the rapids (MLR, Draft Integrated Kavango Regional Land Use Plan. Volume I., 2013 (a)). Khaudum
National Park is one of the few refuges in Namibia where the rare and endangered roan
antelope, Tsessebe and African wild dog occur. The park is a stronghold for African wild
dog, which also tend to move westwards (over farmlands) towards Mangetti National
Park. Khaudum is not fenced on its northern, western and southern borders, but the
eastern border, being the international border with Botswana is fenced (MET, 2014 (b)). The
unfenced park allows for the wildlife to move freely across the communal areas to the
north, west and south, thereby establishing important wildlife movement corridors. This

13
emphasises the importance of the park as a core conservation area from where animals
may populate the neighbouring conservancies. (MLR, Draft Integrated Kavango Regional Land Use Plan.
Volume I., 2013 (a)) The park also has about 2,500 elephant and there is seasonal movement
of elephant to and from the Nyae-Nyae Conservancy immediately south of the park.
Elephants also move northwards into the George Mukoya and Muduva Nyangana
Conservancies, and westwards along the omuramba that extend about 20 km beyond
the park boundary.
1.2.5 SURFACE AND GROUND WATER RESOURCES
The most conspicuous and important feature in the region is the perennial Kavango River,
making up 350 km of Namibia’s northern border before crossing the region and flowing
into Botswana. Almost the entire runoff of the Okavango basin is generated in the
Angolan highlands with the main Rio Cubango providing over half the total runoff. The Rio
Cuito joins the Kavango River about 100 km downstream of Rundu, and has a more even
flow rate and later flood peak. (MLR, Draft Integrated Kavango Regional Land Use Plan. Volume I., 2013 (a))
The average total runoff in the river as it leaves Namibia is about 9,800 Mm3 (Mendelsohn, Jarvis,
Roberts, & Robertson, 2002), although flows are quite variable from season to season and year to
year, depending on rainfall.
Where the Kavango River runs along the Namibia-Angolan border it is a large, sluggish,
low-gradient river until the summer floods. Summer floods in Angola start from about
September and usually reach Namibia in January or February, continues to rise until April,
and take several months to recede. During this period, the valley becomes inundated
with water three to four times higher than the lowest levels in November. During low flow
periods the water is confined to the main channel which is seldom more than 100 m wide
and less than one metre deep in places. (MLR, Draft Integrated Kavango Regional Land Use Plan. Volume I.,
2013 (a)) In the north-eastern arm of Kavango the river cuts through the former Caprivi Strip
on the western edge of the Babwata National Park and enters Botswana where it empties
into the Okavango Delta.
The flat landscape and high permeability of the sandy soil produce very little surface
runoff. Occasionally, water collects and flows in some of the shallow omurambas, or the
pans in shallow depressions, but these events are short-lived.

14
Considering the physical characteristics of the region discussed above, one can surmise
that due to the abundance of natural resources close to the Kavango River, life is
comparatively easy and vegetation and animals can be easily supported. However,
living conditions in small, remote villages away from the river and main roads are difficult
with little access to services and limited economic opportunity. Furthermore, land
available for settlement, grazing and crop cultivation is also increasingly limited close to
the river.
With reference to the climate, the variability in rainfall limits the cultivation of certain fruit
crops. Solar radiation levels are generally high throughout the year and solar power holds
potential.
Due to the clearing of land and hunting, also before independence, much of the wildlife
has now disappeared and is concentrated in the national parks. Still, the parks have the
highest concentration of large mammals as well as the greatest diversity of birds in
Namibia. This provides great wildlife based tourism potential. The natural beauty of the
region as well as the river floodplain scenery (image below) further contributes to the
tourism potential.
15
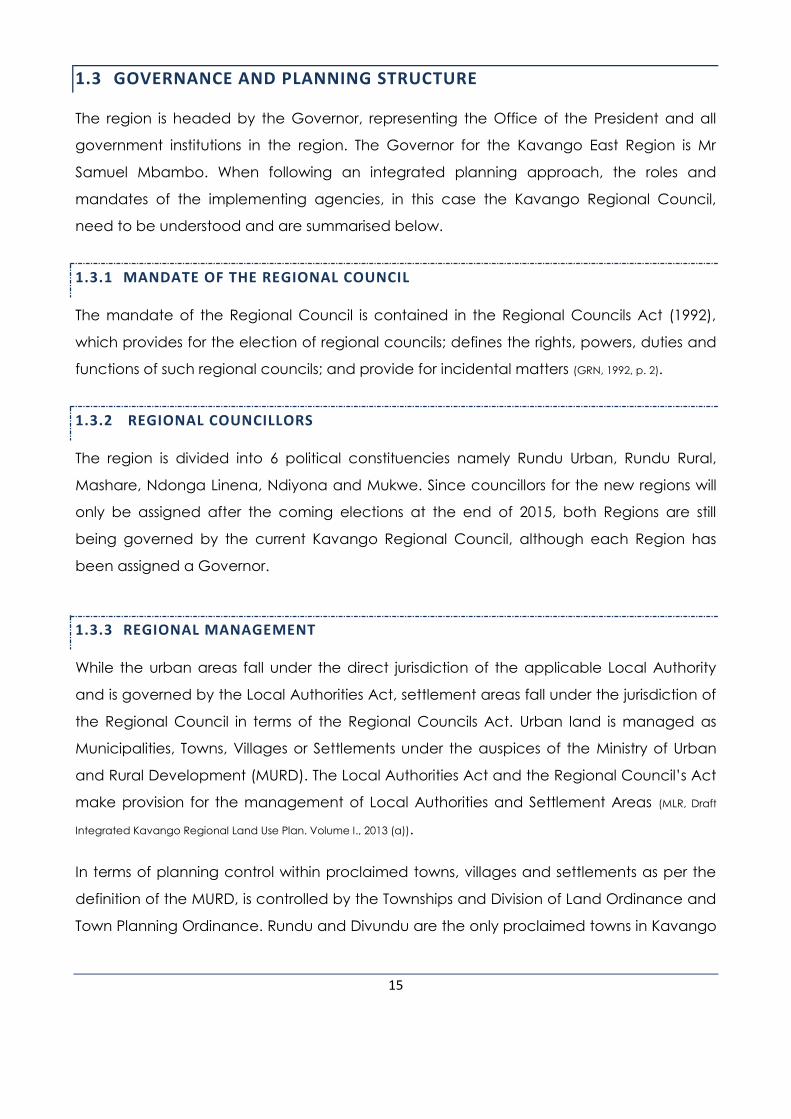
1.3 GOVERNANCE AND PLANNING STRUCTURE
The region is headed by the Governor, representing the Office of the President and all
government institutions in the region. The Governor for the Kavango East Region is Mr
Samuel Mbambo. When following an integrated planning approach, the roles and
mandates of the implementing agencies, in this case the Kavango Regional Council,
need to be understood and are summarised below.
1.3.1 MANDATE OF THE REGIONAL COUNCIL
The mandate of the Regional Council is contained in the Regional Councils Act (1992),
which provides for the election of regional councils; defines the rights, powers, duties and
functions of such regional councils; and provide for incidental matters (GRN, 1992, p. 2).
1.3.2 REGIONAL COUNCILLORS
The region is divided into 6 political constituencies namely Rundu Urban, Rundu Rural,
Mashare, Ndonga Linena, Ndiyona and Mukwe. Since councillors for the new regions will
only be assigned after the coming elections at the end of 2015, both Regions are still
being governed by the current Kavango Regional Council, although each Region has
been assigned a Governor.
1.3.3 REGIONAL MANAGEMENT
While the urban areas fall under the direct jurisdiction of the applicable Local Authority
and is governed by the Local Authorities Act, settlement areas fall under the jurisdiction of
the Regional Council in terms of the Regional Councils Act. Urban land is managed as
Municipalities, Towns, Villages or Settlements under the auspices of the Ministry of Urban
and Rural Development (MURD). The Local Authorities Act and the Regional Council’s Act
make provision for the management of Local Authorities and Settlement Areas (MLR, Draft
Integrated Kavango Regional Land Use Plan. Volume I., 2013 (a)).
In terms of planning control within proclaimed towns, villages and settlements as per the
definition of the MURD, is controlled by the Townships and Division of Land Ordinance and
Town Planning Ordinance. Rundu and Divundu are the only proclaimed towns in Kavango

16
East while there is one settlement namely Ndiyona. Currently, in the Kavango East Region
only the town of Rundu has a Town Planning Scheme and Structure Plan (MLR, Draft Integrated
Kavango Regional Land Use Plan. Volume I., 2013 (a)).
In terms of regional/rural management, the regional council together with the line
ministries are responsible for sectoral development and management utilising grass roots
communication and planning structures such a constituency development committees
(CDCs) and the Regional Development Coordinating Committee (RDCC).
1.3.4 PLANNING STRUCTURE
The Medium Term planning framework currently focuses on macro-economic
development and the compilation of the 5 yearly National Development Plans (NDP’s),
which primarily consists of centrally administered planning activities revolving around
formulating the macro-economic framework, specifying the national development
strategy, sectoral and cross-sectoral development goals and objectives, devising sector
policies and developing the Public Sector Investment Programme. Filtering down to a
regional level, the formulated NDP should reflect the national representation of the
consolidated 14 Regional Development Plans (RDP’s)
Regional development planning is facilitated at both regional and central levels. It is
governed by the Regional Planning and Development Policy as well as the National
Decentralisation Policy, which aim to anchor the national planning system on
fundamental democratic principles with emphasis on a comprehensive participatory
approach intended to be supported and sustained by a decentralised institutional
framework. The key institutions involved within the regional planning process include the
National Planning Commission (NPC), the MURD, the Sector/Line Ministries as well as the
Regional Authorities and communities. The fundamental institutional framework related
thereto is depicted below:

17
Figure 9: Flow Diagram of the National Development Planning Process
Th
e
co-
ord
ina
tio
n
of
reg
ion
al
pla
nni
ng
ac
tivit
ies
by the Regional Council is facilitated through the Regional Development Co-ordinating
Committee (RDCC), which is composed of representatives from line ministries, Local
Authorities, Traditional Authorities, NGO’s and CBO’s. The views and inputs of the Village
and Constituency Development Committees should be noted and reflected within the
interventions of the RDCC. The RDCCis chaired by the Chief Regional Officer and must
consider the development plans for all the line ministries against the background of
National Planning Commission
Department of Regional and Sectoral Planning
Ministry of Urban and Rural
Development Sector Ministries
Directorate of Development Planning
Regional Planning Division
Ministerial Planning Units
Regional Council
Regional Ministerial Offices
Regional Council: Directorate Planning
and Development Services
Regional Developme
nt Coordinatin
g
Locality Developme
nt Committee
Village Developme
nt Committee
Constituency
Development
Committee
Central Level
Regional Level

18
community needs, the interests of the line ministries and the planning standards which
guide development decision making.
This development planning process has been used since the late 1990’s. When it
commenced, many problems related to the creation of the institutional framework,
capacity building within these frameworks, the availability of planning information and the
building of technical skills within the regional councils were experienced. The coordination
between the regional councils and the line ministries were also problematic and the
RDCC’s struggled to function effectively. Over the years significant capacity increases
within the regional councils, improved understanding of the development planning
process, improvements in the institutional structures to ensure grass roots participation,
improved availability of information and better technical skills led to marked
improvements in the planning process gauged from the regional perspective. However,
much still remains to be done to obtain optimal performance from the overall process.
1.4 VISION OF THE REGION
While a Vision statement for the former Kavango Region existed, it was proposed that a
new vision be created for the Kavango East Region, which specifically describes the
region as unique compared to the other Regions in Namibia. Collectively, the
Stakeholders decided on:
Vision: Kavango East Region is prosperous, enjoys socio-economic benefits and is a
preferred destination for all.
1.5 METHODOLOGY
This Regional Development Profile is based on existing information, interpreted and re-
formulated by a multi-disciplinary team of planners (Urban Dynamics Africa), economists
(Urban Econ), engineers (Knight Piesold Consulting Engineers) and social scientists (Urban
Dynamics). Firstly, a wide variety of data and statistics were collected from various sectors.
Sources of information were mostly published documents and reports such as the 1991,
2001 and 2011 Population and Housing Censuses, the various Household Income and
Expenditure Surveys, the Education Management Information System Reports, Sentinel
Surveys, Labour Force Surveys and a number of reports and publications dealing with the
former Kavango Region. Various laws and policies were also consulted to determine

19
institutional mandates, while a number of master plans provided insight into the planned
future interventions in the region.
Based on this data, a draft profile was then compiled. This was followed by a regional
workshop attended by a wide variety of regional stakeholders where the key statistics
were presented to regional stakeholders and consultation was done on the economic
opportunities located through-out the Region. A new vision statement for the region was
formulated to guide the process of profile formulation. The Stakeholders Workshop in the
Kavango East Region was held at the premises of the University of Namibia (UNAM) in
Rundu on Tuesday the 18th of November, 2014.
A draft Regional Development Profile was then finalised and submitted to the KRC for
comments and submission to the NPC for comments. Once the final comments were
received, they were incorporated into the final report, which was presented to the
regional stakeholders at a regional feedback meeting. Comments received during the
stakeholders meeting were discussed and included in the report if so resolved by the
meeting.

20
2 KEY STATISTICS
This section focuses on key socio-economic indicators to reflect the prevailing conditions
in the Kavango East Region. The current status quo data was sourced from the 2011
Population and Housing Census for Kavango East Region and includes descriptions on
both the regional and the constituency level. The Kavango East Region is comprised of six
constituencies: Mashare, Mukwe, Ndiyona, Ndonga Linena, Rundu Rural and Rundu
Urban. (NSA, 2011 Population and Housing Census. Kavango East Regional Tables based on 4th Delimitation, 2014 (b))
However, as discussed under the Methodology, trend data is vital for identifying changes
in the population. This is complicated by the fact that the boundaries of the previous and
new constituencies have changed. The trend data was therefore calculated using the
2001 Census data and the 2011 Census data for the former Kavango Region and its
Constituencies that best correspond to the new Kavango East Region. These are the
Mukwe, Ndiyona, Mashare, Rundu Rural East and Rundu Urban Constituencies. The trend
data will thus only be an approximation, but does allow for the description of key trends.
The constituencies used for the trend data are referred to as the “old delineation”, while
constituencies used to describe the status quo for the new constituencies are referred to
as the “new delineation”.
Where data is not yet available for the partitioned Kavango East and West Regions, for
example with the Namibia Household Income and Expenditure Surveys (NHIES), it is
reported for the combined regions.
2.1 POPULATION
2.1.1 POPULATION GROWTH
The current population residing in the Kavango East Region was enumerated at 136 823 in
2011 (NSA, 2011 Population and Housing Census. Kavango East Regional Tables based on 4th Delimitation, 2014 (b)) at
an approximate growth rate calculated at 0.7% by using the total population of the five
constituencies (Mukwe, Ndiyona, Mashare, Rundu Rural East and Rundu Urban) that
approximate the new region. The growth rates for these constituencies are illustrated in
Figure 10. The Mashare Constituency experienced a negative growth rate of -0.2%, while
the Mukwe and Ndiyona Constituencies also grew very slowly from 2001 to 2011. The

21
growth rates in the Rundu Rural East and Rundu Urban Constituencies are the highest, so
growth appears to be centred in and around the town of Rundu.
Figure 10: Approximate Kavango East Region Population Growth 2001-2011 (Old delineation)
(NSA, 2011 Census: Kavango Regional Profile, 2014 (a))
With a population of 63 431, growing at a rate of 3.6% from 44 413 in 2001 and at 8.7% from
19 366 in 1991, the rapidly growing town of Rundu is now the main administrative and
economic centre of the Kavango East Region. Due to its strategic location, Rundu has
become the hub of trade and development in the north, especially with rebuilding efforts
in Angola and the Trans Caprivi Highway that links the country and its main port in Walvis
Bay to the rest of Africa (RTC, 2006).
2.1.2 POPULATION SIZE AND DENSITY
As is also the norm in urban areas, the highest population density by far in the Kavango
East Region is found in the Rundu Urban Constituency (407 people per km2) followed by
the Rundu Rural Constituency. Outside of Rundu, the Mashare (15 688) and Mukwe (27
690) Constituencies have the most constituents, although due to its large size, the Mashare
Constituency is the least densely populated area in the region, as can be seen in Table 1
overleaf. Combined with its negative population growth, it is likely to become even less
dense, unless opportunities that attract residents to the area are created.
3.6%
-0.2%
1.4%
0.2%
0.6%
0
5000
10000
15000
20000
25000
30000
20
01
20
02
20
03
20
04
20
05
20
06
20
07
20
08
20
09
20
10
20
11
Po
pu
lati
on
Kavango East Population Growth, 2001-2011 (Old delineation)
Mashare
Mukwe
Ndiyona
Rundu RuralEast
Rundu Urban

22
Table 1: Kavango East Region Demographic Statistics, 2011
(NSA, 2011 Population and Housing Census. Kavango East Regional Tables based on 4th Delimitation, 2014 (b))
2.1.3 AGE AND SEX DISTRIBUTION
Table 1 indicates that the sex ratio in the Kavango East Region of 88 men per 100 women
is considerably below the national average of 94, suggesting that men leave the region to
find employment in other parts of the country. The highest ratios of men in the region
reside in the Mukwe and Mashare Constituencies.
Figure 11: Kavango East Population Pyramid, 2011
(NSA, 2011 Population and Housing Census. Kavango East Regional Tables based on 4th Delimitation, 2014 (b))
The gender distribution in the region, as illustrated by the population pyramid in Figure 11,
further demonstrates how the sex ratio varies between age groups. The sex ratio remains
fairly equal for younger age groups, until about age 15, after which women are the
10 8 6 4 2 0 2 4 6 8 10
0-45-9
10-1415-1920-2425-2930-3435-3940-4445-4950-5455-5960-6465-6970-7475-7980-8485-8990-94
>95
Percent
Age
Cat
ego
rie
s
2011: Kavango East Region Population by Age and Sex (New delineation)
%female
%male
Kavango East
Region
Mashare Mukwe Ndiyona Ndonga
Linena
Rundu
Rural
Rundu
Urban
Population size
136 823 15 688 27 690 9 551 11 082 9 381 63 431
Area (km2)
23 983.2 9 140.2 5 537.0 5 231.0 2 850.6 1 068.7 155.8
Density (ppl per
km2) 5.7 1.7 5.0 1.8 3.9 8.8 407.1
Men per 100
women 88.0 91.0 93.0 87.0 84.3 89.0 85.0

23
predominant gender. This indicates an out-migration pattern of men, when they become
of working age.
Furthermore, despite an above average urbanisation rate of 47%, the Population pyramid
is akin to a growing rural population with the percentage of the population under the age
of 15 decreasing and the population aged 15 and older increasing. This can be clearly
seen in the changes in the age group distribution as shown in Table 2 below for the former
Kavango Region.
Table 2: Former Kavango Region: Distribution of Age Groups, 2001 and 2011
Age groups % 2001 2011
Under 5 15 16
14-May 29 27
15-59 48 50
60+ 6 7
(NPC, 2001 Population and Housing Census. Kavango Region Basic Analysis with Highlights, 2004), (NSA, 2011 Census:
Kavango Regional Profile, 2014 (a))
This change in the age group distribution suggests decreasing fertility and mortality levels.
Fertility levels for 2011 are also only available, for the old delineation and shows a steady
decrease in fertility from 7.1 children per woman in 1991 to 5.5 in 2001 and 4.5 in 2011. The
fertility levels were still high in comparison to the national average, which decreased from
6.1 children per women in 1991 to 4.1 in 2001 and 3.6 in 2011.
Mortality rates and life expectancy for 2011 are not yet available for the former Kavango
Region and are thus reported for 1991 and 2001. The life expectancy decreased from 59
years in 1991 to 41 years in 2001 for women and from 55 years in 1991 to 42 years in 2001
for men in the former Kavango Region. Nationally, the life expectancy decreased for
women from 63 years in 1991 to 50 years in 2001 and for men from 59 years to 48 years.
Infant mortality also decreased from 84 infant deaths per 1000 live births in 1991 to 70
infant deaths per 1000 live births in 2001, although it was high in comparison to the
national average of 52 infant deaths per live births in 2001.

24
44 44.6 43.7 42.246.4 46.2 44.6 45.3
0
10
20
30
40
50
Nam
ibia
Kav
ango
Eas
t
Mas
har
e
Mu
kwe
Nd
iyo
na
Nd
on
ga L
inen
a
Ru
nd
u R
ura
l
Ru
nd
u U
rban
Pe
rce
nt
Kavango East Female-headed Households, 2011 (New delineation)
3032343638404244464850
Mas
har
e
Mu
kwe
Nd
iyo
na
Ru
nd
u R
ura
l Eas
t
Ru
nd
u U
rban
Pe
rce
nt
Kavango East Female-headed households, 2001-2011 (Old delineation)
2001
2011
2.1.4 HOUSEHOLD SIZE AND SEX OF HOUSEHOLD HEAD
Female-headed households, on average, tend to have smaller household incomes and
therefore serve as an indicator of standard of living. Overall, the percentage female-
headed households in the Kavango East Region (44.6%) is comparable to the national
average (44%), although it is high compared to the most urbanised region, the Khomas
Region, where only 39% of households are headed by females.
Considering the trends in the four Constituencies that approximate the Kavango East
Region, the proportion of female-headed households also increased in all the
Constituencies with the exception of Ndiyona. Nationally, the proportion female-headed
households decreased to some extent from 45% in 2001 to 44% in 2011.
Figure 12: Kavango East Percent of Female-headed Households, 2001-2011
(NSA, 2011 Population and Housing Census Main Report, 2013 (b)), (NSA, 2011 Population and Housing Census. Kavango
East Regional Tables based on 4th Delimitation, 2014 (b))
As Figure 13 shows, household sizes in the region are notably large with the largest
households found in the Rundu Rural and Mashare Constituencies, which can add
additional strain on the household income. However a positive trend can be seen with
households decreasing in size in all the Constituencies that approximate the Kavango East
Region.

25
012345678
Mas
har
e
Mu
kwe
Nd
iyo
na
Ru
nd
u R
ura
l Eas
t
Ru
nd
u U
rban
Nam
ibia
Nu
mb
er
of
pe
op
le
Kavango East Average Household Size, 2001-2011
(Old delineation)
2001
2011
4.4
5.8 6.1 5.9 5.9 6.0 6.45.6
0
1
2
3
4
5
6
7N
amib
ia
Kav
ango
Eas
t
Mas
har
e
Mu
kwe
Nd
iyo
na
Nd
on
ga L
inen
a
Ru
nd
u R
ura
l
Ru
nd
u U
rban
Nu
mb
er
of
Pe
op
leKavango East Average Household size, 2011
(New delineation)
Figure 13: Kavango East Average Household Sizes, 2001-2011
(NSA, 2011 Population and Housing Census Main Report, 2013 (b)), (NSA, 2011 Population and Housing Census. Kavango
East Regional Tables based on 4th Delimitation, 2014 (b))
2.2 EMPLOYMENT, INCOME AND POVERTY
2.2.1 LABOUR FORCE PARTICIPATION
The labour force refers to the proportion of the economically active population in a
given population group within the working age group of 15 years and above, which
excludes all persons who are not available for work, including full-time learners or
students, homemakers (people involved only in unpaid household duties), ill, disabled
or on early retirement (NSA, 2013 (a)). The proportion of the labour force that participates
in the labour force is the labour force participation rate and is illustrated in Figure 14.
Figure 14: Kavango East Percent of Population Aged 15+ Participating in the Labour Force, 2011
(NSA, 2013 (b)), (NSA, 2014 (b))
6763 57 57
61 6459
6861 65
5562 59 63 64
69
0
20
40
60
80
Nam
ibia
Kav
ango
East
Reg
ion
Mas
har
e
Mu
kwe
Nd
iyo
na
Nd
on
gaLi
ne
na
Ru
nd
uR
ura
l
Ru
nd
uU
rban
Pe
rce
nt
Kavango East Labour Force Participation Rates, 2011 (New delineation)
Labour ForceParticipation % Male
Labour ForceParticipation % Female

26
The Labour Force Participation rates amongst women in the Kavango East Region (65%)
are slightly higher than the Namibian average with (61%), however a smaller percentage
of men participate regionally (63%) than nationally (67%). The highest proportion of both
men and women participating in the labour force is in the Rundu Urban Constituency,
while Mashare and Mukwe had the smallest proportions. Looking at the trends in Table 3,
the labour force participation rate has also increased considerably in the decade
between the 2001 and 2011 Censuses, notably so in the Ndiyona Constituency.
Table 3: Kavango East Percent of Population Aged 15+ Participating in the Labour Force, 2001-2011 (Old
delineation)
% Population Aged 15+ 2001 2011
Male Female Male Female
Mashare 42.4 38 57.1 54.8
Mukwe 43.4 35.6 57.2 61.8
Ndiyona 35.2 28.7 62.5 61.1
Rundu Rural East 55 48 62.5 66.5
Rundu Urban 59.2 49.4 65.6 66.5
(NPC, 2001 Population and Housing Census. Kavango Region Basic Analysis with Highlights, 2004), (NSA, 2011 Census:
Kavango Regional Profile, 2014 (a))
2.2.2 EMPLOYMENT RATES
The tendency to migrate to urban areas due to the (often incorrect) perception of more
employment opportunities can also be seen in the Rundu Urban Constituency that has
both the highest proportion of its men and women participating in the labour force, as
well as the highest proportion of its men and women unable to find employment, as seen
in Figure 15.
Overall, the unemployment rates for both men and women in all the Constituencies were
above average. Except for the Ndonga Linena Constituency, unemployment levels were
higher for women than for men across the region. Unemployment, overall, was the lowest
in the Mukwe Constituency.

27
Figure 15: Kavango East Percent of Unemployed Population aged 15+, 2001-2011
(NSA, 2011 Population and Housing Census Main Report, 2013 (b)), (NSA, 2011 Population and Housing Census. Kavango East
Regional Tables based on 4th Delimitation, 2014 (b))
In the Constituencies that approximate the Kavango East Region, unemployment levels
increased for both men and women in the Rundu Urban, Rundu Rural east and Mashare
Constituencies from 2001 to 2011, although a greater proportion of people were
employed in 2011 in the Mukwe and Ndiyona Constituencies than in 2001.
Table 4: Kavango East Percent of Unemployed Population aged 15+, 2001-2011 (Old delineation)
% Population Aged 15+ 2001 2011
Male Female Male Female
Mashare 24.2 20.1 29 30.9
Mukwe 31 36.6 19.4 23.6
Ndiyona 40.1 38.4 27.4 26.9
Rundu Rural East 29.6 33.7 40.1 50.5
Rundu Urban 26.5 32.5 30.5 40.8
(NPC, 2001 Population and Housing Census. Kavango Region Basic Analysis with Highlights, 2004), (NSA, 2011 Census:
Kavango Regional Profile, 2014 (a))
2.2.3 STATUS IN EMPLOYMENT
Table 5 shows that the private sector provided jobs for the largest proportion of employees
(39.8%) in Namibia, followed by subsistence/communal farmers (without paid employees)
(21.3%) and government (16.7%). In contrast, the vast majority of workers in the Kavango
East Region and all its Constituencies, except Rundu Urban, are subsistence farmers
without employees. These farmers mostly produce food for their own survival with little
surplus left to sell and earn a significant income. In addition, as these farmers have no
paid employees, there is no benefit of job-creation to address the high levels of
unemployment in the region.
30
47 51
3444 44 51 52
43
59 56
3845 44
55
72
0
20
40
60
80
Nam
ibia
Kav
ango
Eas
tR
egio
n
Mas
har
e
Mu
kwe
Nd
iyo
na
Nd
on
gaLi
ne
na
Ru
nd
u R
ura
l
Ru
nd
uU
rban
Pe
rce
nt
Kavango East Unemployment Rates, 2011 (New delineation)
Male
Female

28
In the Rundu Urban Constituency, most workers are employed by the government, which
is also the second largest employer in the rest of the Constituencies (after subsistence
farming). The majority of the remaining workers are employed in the private sector.
Considering gender, overall, men tend to be employed by the private sector, while
subsistence farming (without paid employees) is dominated by women.
Table 5: Kavango East Percent of Population aged 15+ by Employment Status, 2011
% Population Aged 15+ Namibia Kavango
East
Mashare Mukwe Ndiyona Ndonga
Linena
Rundu
Rural
Rundu
Urban
Subsistence/Communal
Farmer (With Paid
Employees)
1.8 1.7 2.7 0.9 8.1 0.5 1.1 1.1
Subsistence/Communal
Farmer (Without Paid
Employees)
21.3 43.6 65 71.6 74.1 74.8 85.3 1.4
Commercial Farmer (With
paid employees) 1.2 0.3 0.7 0.1 0.3 0.9 0.3 0.2
Other Employer 2.3 2.3 1.7 0.4 0.3 0.7 0.3 4.8
Own Account Worker 3.2 3.1 1.2 1.1 0.5 0.8 1 6.3
Employee (Communal
Farms) 1.6 0.3 1.7 0.1 0.1 0.2 0.4 0.1
Employee(Commercial
Farms) 4 0.4 0.9 0.3 0.1 0.5 0.9 0.2
Employee (Government) 16.7 24.6 12.3 13.4 8 10.6 5.2 44.2
Employee (Parastatal) 5.7 2.5 0.6 1.4 1.3 2.6 0.8 4.1
Employee (Private) 39.8 18.5 10.1 7.4 3 5.9 4.5 35.5
Unpaid Family Worker
(Subsistence/Communal) 1.2 1.3 0.9 2.1 3.6 1.1 0.3 0.7
Other Unpaid Family
Worker 0.7 0.7 2.3 0.8 0.6 0.8 0 0.5
Other 0.4 0.4 0.3 0.1 0 0.5 0 0.7
(NSA, 2011 Population and Housing Census Main Report, 2013 (b)), (NSA, 2011 Population and Housing Census. Kavango East
Regional Tables based on 4th Delimitation, 2014 (b))
2.2.4 HOUSEHOLD INCOME
The greater source of household income in the Kavango East Region remains farming.
However, as this is mostly subsistence farming, it helps with food security without truly
generating much income for the family. Wages and salaries are also an important source
of household income, especially in the Rundu Urban Constituency.
There is an above-average reliance on cash remittance, with the exception of the Mukwe
and Mashare Constituencies. On average, reliance on pensions is lower in the Kavango
East Region than nationally, although there is great variance among the Constituencies.
In fact, pension is the second most important source of household income in most of the

29
16
33
53
60
57
40
55
10
12
14
7
6
6
6
7
23
48
29
13
16
7
20
7
46
15
12
17
13
18
21
16
7
5
7
3
3
7
10
10
9
4
5
8
3
4
5
5
6
0 20 40 60 80 100
Namibia
Kavango East Region
Mashare
Mukwe
Ndiyona
Ndonga Linena
Rundu Rural
Rundu Urban
2011 Kavango East Main source of Household Income (New delineation)
Farming
Business, non-farming
Wages andsalaries
Pension
Cash remittance
Other
Percent
constituencies, except Rundu Urban and Mukwe. If you consider that most people only
receive a government Pension of N$1000 per month, it is hardly sufficient to sustain
households that average 5.8 members (Ministry of Labour and Social Welfare personal communication on 2
December, 2014).
Figure 16: Kavango East Percent Distribution of Households by Main source of income, 2011
(NSA, 2011 Population and Housing Census Main Report, 2013 (b)), (NSA, 2011 Population and Housing Census. Kavango East
Regional Tables based on 4th Delimitation, 2014 (b))
In the 2011, new categories have been included in the main sources of household
income, including retirement fund, orphan’s grants and disability grants. In order to be
able to compare the data to the categories used in the 2001 Census, the retirement fund
has been added to pensions and the orphan’s grants and disability grants have been
added to the category of others. The trends have been listed in Table 6.
Although it remains the predominant source of income for most households, household
reliance on income from farming has decreased from 2001 to 2011 in most of the
constituencies, with the exception of the Mukwe Constituency. Household reliance on
income from business (non-farming) also decreased, except for the Rundu Rural East
Constituency where it increased from 16% in 2001 to 18% in 2011. Wages and salaries also
mostly decreased as the main source of household income, although it increased in the
Mashare Constituency by 2% for the same period. Pension and cash remittance have
thus increasingly become the main source of household incomes for most of the
constituencies that approximate the current Kavango East Region.

30
Table 6: Kavango East Percent Distribution of Household Income, 2001 and 2011 (Old delineation)
% Population
Aged 15+ Year Farming
Business,
non-
farming
Wages and
salaries Pension
Cash
remittance Other
Mashare 2001 63 10 11 9 3 4
2011 53 10 13 18 3 4
Mukwe 2001 58 9 17 8 5 3
2011 60 6 16 14 3 2
Ndiyona 2001 58 9 17 8 5 3
2011 48 6 13 21 9 4
Rundu Rural East 2001 39 16 26 6 6 7
2011 32 18 20 14 10 6
Rundu Urban 2001 4 27 57 3 4 5
2011 4 24 55 4 9 5
(NPC, 2001 Population and Housing Census. Kavango Region Basic Analysis with Highlights, 2004), (NPC, 2001 Population and
Housing Census. Kavango Region Basic Analysis with Highlights, 2004)
2.3 HOUSING CONDITIONS
Table 7 indicates that traditional dwellings are the norm nationally, making up 37.7% of all
households in Namibia, as well as in the Kavango East Region at 64%. On the Constituency
level 4 out of every 5 households reside in traditional dwellings, except in the Rundu Urban
Constituency where most households reside in detached or semi-detached houses.
Detached or semi-detached housing is the second most prevalent type of housing unit in
all other Constituencies. Improvised housing units (shacks) are found largely in urban areas
where they constitute 11% of the housing units in the Rundu Urban Constituency, although
5.2% of households in Ndiyona and 4.1% in Ndonga Linena also reside in shacks.

31
Table 7: Kavango East Percent Distribution of Households by Type of Housing Unit, 2011
% Households
Detached/
Semi-
detached
house
Flat Traditional
Dwelling
Improvised
Housing Other
Namibia 37.8 5.6 37.7 16 2.9
Kavango East 26.1 1.5 64 6.4 2
Mashare 5.4 0.2 92.1 1.1 1.2
Mukwe 10.5 0.4 86 1 2.1
Ndiyona 9.4 0.1 83.2 5.2 2.1
Ndonga Linena 13.4 1.2 80.9 4.1 0.4
Rundu Rural 12.9 0.7 85 0.5 0.9
Rundu Urban 43.5 2.7 40.4 11.1 2.3
(NSA, 2011 Population and Housing Census. Kavango East Regional Tables based on 4th Delimitation, 2014 (b))
While the majority of Namibians reside in housing units that have walls constructed of
cement bricks, most households in the Kavango East Region construct their housing using
sticks with mud, clay or cow dung (28.9%) or from wood poles or sticks or grass or reeds
(22.3%), although bricks made from mud or clay (14.9%) are also frequently used. Cement
bricks are only used in the construction of 20.1% of housing units in the Kavango East
Region and, on the constituency level, are the most used material only in the Rundu Urban
Constituency. In the other constituencies, housing units are predominantly constructed
from sticks with mud, clay or cow dung, or from wood poles or sticks or grass or reeds, or
from bricks made from mud or clay. Shacks, which are mostly an urban occurrence, tend
to be constructed from corrugated iron and is used mainly by households in the Rundu
Urban Constituency (18.5%) and with a much lesser frequency elsewhere.
Table 8: Kavango East Percent Distribution of Households by Main Material Used for Walls, 2011
% Households Namibia Kavango
East Mashare Mukwe Ndiyona
Ndonga
Linena
Rundu
Rural
Rundu
Urban
Cement bricks 41.1 20.1 6.6 10 3.4 10.4 4 34.8
Burnt bricks 0.8 0.6 0.2 0.4 0.7 0.6 0.1 0.9
Mud/Clay bricks 7.7 14.9 16.6 22.1 19.9 18.8 19.7 9.7
Corrugated
iron/zinc 20.5 9.7 1.3 1.8 0.5 1.4 2.6 18.5
Prefabricated
materials 3.1 2.16 0.5 1.2 0.9 3.5 1.4 3
Wood poles/sticks
or grass/reeds 16.8 22.3 25.7 33.3 50.8 43.3 22.2 9.4
Sticks with
mud/clay/ dung 8.4 28.9 48.6 30.1 23.3 21.1 48.9 23
Tin 0.7 0.2 0.2 0 0.2 0.3 0.1 0.2
Other 0.9 0.5 0.3 0.3 0.2 0.6 1 0.5
(NSA, 2011 Population and Housing Census Main Report, 2013 (b)), (NSA, 2011 Population and Housing Census. Kavango East
Regional Tables based on 4th Delimitation, 2014 (b))

32
2.4 ACCESS TO EDUCATION
2.4.1 EDUCATION FACILITIES
Education statistics available include the literacy rate, early childhood development
(ECD), school enrolment rates and educational attainment. As far as possible, trends
have been reported, although the age categories between Census periods sometimes
differ, which makes comparison challenging. In 2012, there were 116 Primary Schools, 24
Combined Schools and 13 Secondary Schools in the Constituencies that approximate the
current Kavango East Region. However, if you consider the distribution in Figure 17,
students in the central, southern and eastern parts of the region have no access to
schools, which are all concentrated towards the north and along the Trans Caprivi
Highway to the west.
Figure 17: Kavango East Access to Schools
It was also noted in the Kavango Poverty Profile that not all communities had schools or
children had to walk long distances and, as a result, small children would often not attend
school and it was generally accepted that small kids couldn’t enrol as the school is simply

33
too far from them. Schools were also described as too small, ill equipped and in some
cases understaffed (NPC, Regional Poverty Profile for Kavango Region, 2006, p. 9).
Table 9: Education Indicators and Trends
Namibia
Former Kavango
Region Namibia
Indicator 2008 2008 2009 2010 2011 2011
Total Number of classrooms 19,460 2,287 2,274 2,295 2,326 20,740
Traditional structures as % of all classrooms 7.0% 8.8% 8.6% 8.9% 8.9% 6.5%
Learner/Teacher Ratio 27.7 21.7 27.8 27.6 27.2 24.8
% of Primary Teachers qualified to teach 71.1% 61.5% 64.2% 66.8% 68.6% 78.7%
% of Secondary Teachers qualified to teach 90.1% 87.7% 88.7% 90.5% 91.8% 93.7%
(Ministry of Education, 2011)
The indicators in table 9 shows that the former Kavango Region lagged behind in the
sense that it had a higher percentage of traditional structures serving as classrooms than
nationally, and also that there are about 2.4 students more per teacher than in Namibia
as a whole. Also, a smaller percentage of teachers in both primary and secondary school
are qualified to teach than is the situation nationally. In terms of trends, the number of
classrooms are increasing, yet the percentage of traditional structures serving as
classrooms remained more or less the same between 2008 and 2011. Learner/teacher
ratios and teachers qualifications are, however, on the increase and this point to an
improving situation.
Higher education institutes in the Kavango East Region include the Rundu Vocational
Training Centre (RVTC), Community Skills Development Centre (COSDEC), the Triumphant
College, the Institute for Open Learning, the Namibian College for Open Learning
(NAMCOL) the University of Namibia and the Mashare Agricultural Development Institute.
2.4.2 LITERACY
Literacy refers to the ability to both read and write in a language. Considering the
regional literacy rates, men (86%) in the Kavango East Region are slightly more literate
than the national average (85%), while women (77%) performed below average. At the
constituency level, all the constituencies had below-average literacy rates for both men
and women, with the exception of women in Ndiyona (85%) and both men and women in
the Rundu Urban Constituency.

34
66 66 69 70
90
61 58 63 63
8773 75 76 80
93
0
50
100
Mashare Mukwe Ndiyona Rundu Rural East Rundu Urban
Pe
rce
nt
Kavango East Literacy Rates, 2001: Ages 15+ (Old delineation)
Total
Female
Male
72 75 78 77
94
67 70 73 72
9378 80 84 83
96
0.0
20.0
40.0
60.0
80.0
100.0
Mashare Mukwe Ndiyona Rundu Rural East Rundu Urban
Pe
rce
nt
Kavango East Literacy Rates, 2011: Ages 15+ (Old delineation)
Total
Female
Male
Figure 18: Kavango East Literacy Rates, 2011
(NSA, 2011 Population and Housing Census Main Report, 2013 (b)), (NSA, 2011 Population and Housing Census. Kavango East
Regional Tables based on 4th Delimitation, 2014 (b))
Still, the trend data in Figure 19 does show an increase in the literacy rates across all the
constituencies that approximately comprise the current Kavango East Region, so there is
an overall improvement from 2001 to 2011. Especially the Mukwe and Ndiyona
Constituencies experienced an overall increase in literacy of almost 10% each. In
Namibia, the literacy rate improved from 81% in 2001 to 89% in 2011, so the rate of
improvement in most of the Constituencies is comparable.
Figure 19: Kavango East Percent Change in Literacy Rates, 2001-2011
(NSA, 2011 Population and Housing Census Main Report, 2013 (b)), (NSA, 2011 Population and Housing Census. Kavango East
Regional Tables based on 4th Delimitation, 2014 (b))
85 8173 75 79 78
73
8885 8678 80
74 7367
858577
67 70
85 83 79
91
0102030405060708090
100
Nam
ibia
Kav
ango
East
Reg
ion
Mas
har
e
Mu
kwe
Nd
iyo
na
Nd
on
gaLi
ne
na
Ru
nd
uR
ura
l
Ru
nd
uU
rban
Pe
rce
nt
Kavango East Literacy Rates, 2011: Ages 15+ (New delineation)
Total
Male
Female

35
2.4.3 EARLY CHILDHOOD DEVELOPMENT
A child’s developing years lays the foundation for future performance and attendance of
Early Childhood Development (ECD) programmes play an important role in improving
children’s school readiness. ECD refers to both Edu-care programmes, like day-care,
crèches and kindergartens) and Pre-primary school attendance.
As listed in Table 10, attendance of ECD programmes in the Kavango East Region is below
average for both boys and girls (ages 0-4). On the constituency level, the lowest levels of
ECD attendance were in the Rundu Rural and Mashare Constituencies and the highest in
the Ndonga Linena and Ndiyona Constituencies. According to the 2001 Population and
Housing Census, the average ECD attendance of girls (15.3%) and boys (14.7%) was higher
than in 2011, although as it was measured for the 3-6 age group of the former Kavango
Region and the data is therefore not truly comparable to the 2011 data.
Table 10: Kavango East Percent of Population Aged 0-4 by Early Childhood Development Attendance, 2011
% Population Aged 0-4 Boys Girls
Namibia 13 13.8
Kavango East 10.7 11.1
Mashare 9.6 10.7
Mukwe 11.1 10.8
Ndiyona 12.9 10.5
Ndonga Linena 11.1 13.1
Rundu Rural 8.5 7.3
Rundu Urban 10.6 11.7
(NSA, 2011 Population and Housing Census. Kavango East Regional Tables based on 4th Delimitation, 2014 (b))
2.4.4 SCHOOL ENROLMENT
School enrolment among 5-24 year olds was higher for boys than girls in all constituencies,
especially the Rundu Urban, Ndonga Linena and Rundu Rural Constituencies.
Attendance by girls was below average for all the Constituencies. Only the Rundu Urban
Constituency had a higher ratio of girls enrolled in school than boys. The lack of school
enrolment by girls in the region is certainly a matter to be considered under the future
gender development programmes undertaken in the region.

36
Table 11: Kavango East Percent of Population Aged 5-24 by School Enrolment, 2011
% Population Aged 5-24 Female Male
Namibia 64.0 62.4
Kavango East 59.7 64.6
Mashare 57.3 60.0
Mukwe 57.4 61.4
Ndiyona 54.4 56.7
Ndonga Linena 55.1 61.3
Rundu Rural 58.4 65.7
Rundu Urban 62.9 68.9
(NSA, Personal Communication, November 2014)
Table 12 shows that school enrolment decreased both nationally and in all the
Constituencies that comprise the approximate Kavango East Region, with the exception
of the Rundu Urban Constituency. The sex ratio of boys to girls has decreased in all the
Constituencies, except Rundu Rural East, although it remains notably higher than the
national ratio.
Table 12: Kavango East Percent of Population by Change in School Enrolment Rates, 2001-2011
% Population 2001 School Enrolment(% ) ages 6-24 2011 School Enrolment ages 5-24
Male Female Male Female
Namibia 64 65 62.4 64
Mashare 64 59 60 57.3
Mukwe 67 59 61.4 57.4
Ndiyona 65 58 59.1 54.8
Rundu Rural East 68 60 66.3 59.6
Rundu Urban 66 62 70 65
(NPC, 2001 Population and Housing Census. National report with Highlights, 2003) (NPC, 2001 Population and Housing
Census. Kavango Region Basic Analysis with Highlights, 2004), (NSA, 2011 Census: Kavango Regional Profile, 2014 (a))
2.4.5 EDUCATIONAL ATTAINMENT
Another measure of education is educational attainment, or the highest level of
education that was achieved by the population that has already left school. Educational
attainment for 2011 is currently only available for the former Kavango Region and has not
been reported on the constituency level. Educational attainment on the national level
has only been reported for the employed population and not for the entire population
older than 15 that have left school. Considering the trend data for the former Kavango
Region, there has been an overall increase in the highest level of educational attainment
for both men and women from 2001 to 2011 with the majority of the population having

37
completed at least primary school. A greater percentage of both men and women
attained a tertiary education in 2011 than in 2001
Table 13 : Former Kavango Region Percent of Population aged 15+ who left school by Highest Level of
Educational Attainment, 2001 and 2011
% Population Aged 15+
Namibia Former Kavango Region
2001 2011 2001 2011
Male Female Male Female Male Female Male Female
No formal education/not stated 4.6 3.3 1.5 1.5 1.5 2 3.4 2.7
Incomplete primary 34.7 32.4 25.1 22.5 32.9 36.4 47.6 57.3
Primary education 38.8 43.8 46.6 50.1 47.4 49.1 33 35.5
Secondary education 15.9 15.2 20.8 20.3 14.5 10.1 9.7 5
Tertiary education 5.3 6 6 5.7 3.7 2.4 3.8 1.9
(NSA, 2011 Census: Kavango Regional Profile, 2014 (a))
2.5 PROTECTED AREAS: NATIONAL PARKS, COMMUNAL CONSERVANCIES
AND COMMUNITY FORESTS
With the exception of the National Parks, the Kavango East Region is state land and once
was under the jurisdiction of the four recognised Traditional Authorities, these being the
Mbunza; Shambyu; Gciriku and Mbukushu Traditional Authorities. Communal land is
owned by the state and provision is made under the Communal Land Reform Act for
Traditional Authorities to have a certain degree of control over the communal land within
their jurisdiction by providing the initial approval for leaseholds and for allocation of land
after which the final approvals rests with the Communal Land Board or the Minister,
depending on the size and lease years (MLR, Draft Integrated Kavango Regional Land Use Plan. Volume I.,
2013 (a), p. 24).

38
Figure 20: Kavango East Protected Areas, Communal Conservancies and Community Forests
2.5.1 NATIONAL PARKS
Nationals Parks are under the jurisdiction of the Ministry of Environment and Tourism (MET),
which is currently compiling Management Plans with zonings for each of the National
Parks (MLR, 2013 (a)). The Kavango East Region has three National Parks: the Bwabwata
National Park (including the Ramsar Site), the Khaudum National Park and the Popa
Game Park. The parks are a major focal point for tourism in the Region and will be
discussed in terms of tourism in Section C, while a description of the physical and social
environments for each park follows below.
2.5.1.1 Bwabwata National Park
The Bwabwata National park has a long history from being a declared military area by the
SADF until after Independence in 1990. It consists of the former Caprivi Game Park,
(proclaimed in 1966), as well as the Mahango Game Park and the “Kwando Triangle”
(previously State land without conservation status), which jointly became proclaimed in
2007 as the Bwabwata National Park. The Bwabwata National Park covers 627,412 ha
and, according to the Tourism Development Plan, is the most visited park in the north

39
eastern Namibia. This is likely due to its strategic location as it is traversed by the Trans
Caprivi Highway and therefore easily accessible. There are approximately 5,500 residents
living in this multiple use area of which about 80% are from the minority San group – the
Kwe. (MET, Bwabwata Mamili Mudumu Tourism Development Plan, 2009)
2.5.1.2 Khaudum National Park
The Khaudum National Park covers 3,842 km², was proclaimed as a national park in 1989
and forms part of the Kavango Zambezi Transfrontier Conservancy Area (KAZA TFCA). To
the west of the park there are a number of newly proclaimed Small Scale Commercial
Farming (SSCF) units and to the south of the park the well-known Nyae-Nyae
Conservancy. The Khaudum National Park also forms part of the Khaudum North Complex
together with the conservancies of George Mukoya and Muduva Nyangana situated
adjacent to and north of the park. The livelihood activities within the complex is still mainly
based on livestock herding and crop cultivation with the exception of the Khaudum
National Park where only wildlife conservation takes place. However with the forming of
the complex a diversification of livelihoods is possible, such as trophy hunting and tourism
related activities, although accessibility remains a challenge as the park is only accessible
via single tracks through thick sand.
2.5.1.3 Popa Game Park
Popa Game Park is located on the eastern part of the Kavango East Region in proximity of
the Bwabwata National Park and was proclaimed in 1989. It is Namibia’s smallest game
park at a mere 0.25 km2, but boasts the Popa rapids and a high diversity of birds.
2.5.2 COMMUNAL CONSERVANCIES
As a result of uncontrolled human activities that has taken place, the wildlife in the
Kavango East Region has increasingly diminished over the years to only a few areas where
intensive conservation is taking place, such as the national parks. The establishment of
communal conservancies in proximity to the National Parks are excellent ways to ensure
the sustainable growth of the wildlife, as well as providing income opportunities for the
communities.

40
The Nature Conservation Amendment Act of 1996 made provision for the devolution of
management of wildlife and of related tourism and hunting activities, to communal area
residents through the establishment of conservancies. Communities could register
resource areas with approved boundaries with the MET. Registration requirements include
a legal constitution providing for the sustainable use of game, a defined membership and
a committee representative of all members. All adult residents may become members of
the conservancy. Conservancies must operate according to a wildlife management plan,
as well as a plan for the equitable distribution of returns. The MET provides support to a
variety of activities and must ensure that conservancies remain compliant with legislation
(NACSO, 2013 ). The main aims of establishing conservancies are to:
Improve natural resource management within the conservancy
Generate income for the community through activities such as tourism, craft sales,
trophy hunting and so forth
Figure 21: Kavango East Community Conservancies

41
There are currently four (4) registered Communal Conservancies in the Kavango East
Region:
Joseph Mbambangandu
Shamungwa
Muduva Nyangana
George Mukoya
There are also two emerging conservancies of Kapinga Kamwalye Conservancy and
Kamutjonga Conservancy (Fishery) that is in the process of being registered.
2.5.3 COMMUNITY FORESTS
Community Forestry is one of the core programmes of the Directorate of Forestry under
Ministry of Agriculture, Water and Forestry and the programme aims to establish
community forests and the transfer of forest resource management rights to local
communities. The use of all indigenous plant resources is regulated by the Directorate of
Forestry within the Ministry of Agriculture, Water and Forestry. The Forestry Act of 2001 and
the Forestry Amendment Act of 2005 enable the registration of community forests through
a written agreement between the Directorate and a committee elected by a community
with traditional rights over a defined area of land. The agreement is based on an
approved management plan that outlines the use of resources. All residents of community
forests have equal access to the forest and the use of its produce (NACSO, 2013 ).
As shown in Figure 22 there are 8 registered (gazetted) and emerging community forests in
the Kavango East Region, although the Ncaute community forest stretches across both
the Kavango East and West Regions. Only the Shamungwa community forest is still
emerging.

42
Figure 22: Kavango East Community Forests
2.6 STATE OF THE ENVIRONMENT
As part of the preparation of the Kavango Integrated Regional Land Use Plan, the
Southern African Institute for Environmental Assessment prepared a Strategic
Environmental Assessment to ensure that due consideration is given to environmental
considerations (Southern Africa Institute for Environmental Management, 2014).
2.6.1 CHARACTERISTICS OF THE NATURAL ENVIRONMENT
Kavango East’s scenic beauty and its rich diversity in woodland and wildlife are part of the
region’s assets that characterises the state of the region’s natural environment. In
addition, the perennial Okavango River is very valuable because of its near pristine
condition with high values for water quality and ecological integrity. Other important
features of the natural environment are:
High average rainfall, compared to the rest of Namibia.
Mainly sandy soils of low fertility with a thin strip of more fertile alluvial soils along the
Kavango River.

43
Substantial areas in the Kavango East Region are designated protected areas.
These are Khaudum National Park, Bwabwata National Park, Popa Game Park and
the Bwabwata – Okavango Ramsar Site which forms part of the Kavango –
Zambezi Transfrontier Conservation Area (KAZA). There are also 4 registered and 2
emerging communal conservancies while 7 registered and one emerging
community forest complete the picture.
Natural Resources are important for livelihoods in the region. These include crops,
grazing, fishing, harvesting of hardwood trees, harvesting of reeds and grass and
wildlife related tourism including consumptive use.
Rundu is a fast growing trade hub seeing high levels of urbanisation and population
growth. This provides settlement options to a growing population and relieves
pressure from the land being farmed communally.
2.6.2 ISSUES OF ENVIRONMENTAL CONCERN
Water abstraction from the Kavango River is currently sustainable and stands at about 5%
of the mean annual runoff of the river. However, declared plans for future large scale
irrigation works in Angola, Namibia and Botswana will increase the takeoff rate to beyond
safe limits and could potentially destroy the system. It is therefore necessary that Green
Scheme Projects need to be reconsidered in terms of irrigation method and crop types to
get to a point where water efficient irrigation methods are used to produce high value
crops or a suitable staple/high value crop mix.
Ecosystem Services. About 46% of the total land area of the Kavango East Region is used
for mixed communal farming. This is characterised by growing the staple crop of
Mahangu, planting some vegetables and keeping livestock. Communal farming practice
has a substantial influence on the state of the natural environment. With cattle and goats
grazing the commonage in an uncontrolled and uncoordinated manner, it leads to
overstocking and land degradation, especially close to water points and the river. The
most severe overgrazing occurs in a strip within about 10km from the river.
Slash and burn tactics to open up new fields once the “old” fields are not yielding enough
anymore further leads to environmental degradation and deforestation. Burning the
grazing fields to improve grazing also has a negative impact on the environment. The
harvesting of hardwood trees is regulated by the Ministry of Agriculture, Water and

44
Forestry. However, this is often misused by community members and outside parties who
conspire to harvest illegal quantities and thereby bedevilling the sustainability of utilising
this resource to the benefit of the local communities.
Tourism Potential based on the scenic qualities, the Okavango River, Woodlands and
wildlife is a positive aspect of the current state of the natural environment, especially since
a lot of effort is put into further developing tourism and conservation products in the
region.
Towns and Infrastructure development, or sometimes the lack thereof, also influences the
state of the environment. With a growing population, urbanisation offers another option to
communal farming. If this was not the case, more and more people would be dependent
on a finite land area and resources to plant crops and graze livestock, with obvious
implications for the natural environment. However, a concentration of people in urban
areas poses challenges with respect to the provision of urban services and the ability to
afford services such as sewage collection and treatment and solid waste collection and
treatment.
Currently solid waste removal and littering seems to be a major problem in Rundu as well
as along the formal roads in the region. This is based on direct observation at the town
and in the region as well as on the latest census statistics. In addition, un-serviced informal
areas mean that a concentration of people uses the bush as a toilet with the resultant risk
to pollute the Kavango River as well as groundwater resources.
Sand Mining close to the larger urban areas is a further problem. This is largely small scale
but unregulated and requires closer management by local authorities and the Regional
Council so that river bank degradation can be limited.

45
47%
1% 2% 0%4%
8%
3%
8%
24%
3%
0%5%
10%15%20%25%30%35%40%45%50%
Agr
icu
ltu
re
Min
ing
Man
ufa
ctu
rin
g
Uti
litie
s
Co
nst
ruct
ion
Ret
ail
Tran
spo
rt a
nd
Co
mm
un
icat
ion
Fin
ance
an
d B
usi
nes
s
Serv
ices
Pri
vate
Ho
use
ho
lder
Pe
rce
nt
Kavango East Main Employment per Sector
3 REGIONAL DEVELOPMENTAL AREAS
This section contains an overview of the Economic, Social, Infrastructural and Institutional
Sectors in the Kavango East Region, including a situational analysis per sector and a
discussion on current strategies and potential areas of investment.
3.1 ECONOMIC SECTOR
The economy of Kavango East is vested in the agricultural, manufacturing, trade, and
services sectors (which includes government services), and tourism. These are noted as the
key economic sectors. Although Tourism is not typically classified as a sector on its own
because it spans across multiple economic sectors, due to its relative importance - both in
terms of job creation and the economy, it is discussed separately in this profile. The
sector’s across which tourism spans includes accommodation and catering, retail and
wholesale, manufacturing and services.
The importance of the above main economic sectors for the labour force is emphasised
by the number of employment opportunities created in these sectors, illustrated in Figure
23.
Figure 23: Kavango East Percent Employed Population by Main Sector, 2011
(NSA, 2014 (b))
46
Figure 23 illustrates that the majority of employment opportunities are created by the
agricultural sector (47%), followed by the services sector (24%) (This includes both private
and government services). The retail and accommodation, and finance and business
sectors follow with both employing 8% of the labour force). It is however important to note
that although the majority of jobs are in the agricultural sector, almost 45% of these jobs
are in subsistence farming which implies a low wage level. The most important sectors for
the region are discussed in more detail in the sub sections below.
3.1.1 AGRICULTURE
The statistical figures illustrate that the agricultural sector is the most important sector in
Kavango East, with 47% of the employed population being active in this sector.
The agricultural sector in Kavango East is vested in the subsectors of:
Farming (large scale crop farms, small scale commercial farms and livestock
farming)
Forestry
Fishing
Crop and livestock farming can be categorised according to the following:
Large-scale irrigated farming (Green Scheme Farming)
Small-scale dry land farming (mainly cereals for commercialisation)
Subsistence farming (mostly mahangu, maize and cowpeas)
Horticulture
Livestock farming
Each of these sub-sectors is discussed further in the following sectors.
3.1.1.1 Green Schemes
The large-scale crop farms are economically the most important for the Kavango East
Region, and of these, the Green Schemes are the most significant. The Green Scheme is a
government scheme set up by the Ministry of Agriculture, Water and Forestry which aims
to encourage the development of irrigation based agronomic production in order to

47
increase the GDP contribution of agriculture, and to uplift local communities in the
proximity of these schemes (MLR, Draft Integrated Kavango Regional Land Use Plan. Volume II., 2013 (b)).
The Green Scheme projects consist of a core commercial farmer (service provider), with a
number of out-growers (local community farmers) on the surrounding land. The intention is
for the out-growers to gain training, mentoring, input materials and services from the
commercial farmers. The system works on a loan basis, where the service provider
purchases goods in bulk and deducts it from the harvest income. The overall objective of
the Green Schemes is to generate employment and to contribute to national food
security.
Five of the twelve Green Schemes operational in Namibia are located in Kavango East.
These are illustrated in and include:
Shadikongoro Irrigation Project, which is 600 ha. This scheme currently has 47
permanent employees and 13 out-growers. Current crops produced include
maize, wheat and sunflowers.
Ndonga Linena Irrigation Project, which is 800 ha. The scheme currently has 57
permanent employees and 29 out-growers. Current crops include maize, onions,
watermelons, butternuts, gem squash, potatoes, sweet potatoes and wheat.
Shitemo Irrigation Project, which is 900 ha. This scheme currently has 18 permanent
employees and 10 out-growers. Current crops include maize, peanuts, butternuts,
squash and pumpkins.
Mashare Irrigation Project, which is 200 ha. This scheme currently has 7 permanent
employees, however it has no out-growers. Current crops include maize and
wheat.
Uhvungu Vhungu Irrigation Project, which is 600 ha. The scheme currently has 35
permanent employees and 10 out-growers. Current crops include maize, wheat
and vegetables (DECOSA, 2013).

48
Figure 24: Kavango East Green Schemes
The Green Schemes are considered somewhat successful in that they have created
employment opportunities, and they have contributed towards food security for Namibia.
Despite the employment opportunities created, jobs generated have been lower than
expected, the number of out-growers utilised in the scheme have been low (only 60% of
the total farm land in the Green Schemes for both Kavango West and East has been
utilised), and the types of crops produced is aimed towards volume in production rather
than higher yield crops with high employment potential (DECOSA, 2013).
3.1.1.2 Small Scale Commercial Farms and Subsistence Farming
Small-scale commercial farms (SSCF) mostly consist of dry farming activities, and as is
illustrated in Figure 25, these farms are located further inland (further away from the
Kavango River). Communal farms are typically an average of 1.9 ha in size, and the main
crops grown include mahangu, sorghum and maize, as well as a limited amount of
vegetables. Vegetables are mostly produced for domestic consumption (MLR, 2013 (b)) (MLR,
2013 (b)). There are many constraints to this type of farming. These include for example
access to existing markets, the lack of infrastructure the further inland farms are located,
poorer soil qualities, as well as erratic rainfall patterns. This results in crops with low yields,

49
limited labour numbers and where surplus harvests are rare. Therefore, although this type
of farming practice provides some food security, there is little economic value in SSCFs
(Mendelsohn & el Obeid, 2006).
Figure 25: Kavango East Small-Scale Commercial Farms
More than 45% of jobs created in Kavango East are within subsistence farming (NSA, Namibia
Labour Force Survey (LFS) 2012 Report, 2013 (a)) where mahangu and other dry land crops are
generally grown on small portions of land mostly along the Kavango River and in the
vicinity of rural villages. Most of the farming is done manually or by ox-drawn ploughing.
Yields are generally low with very little surplus harvested (DECOSA, 2013).
3.1.1.3 Horticulture
Horticulture products are grown as part of the Green Scheme projects, on some of the
small-scale irrigation farms, as well as a part of community gardens. These crops are
therefore exclusively grown along the Kavango River and in the back yards of
homesteads. Crops grown include cow peas, beans, pumpkins and peanuts (dry yield
crops); as well as carrots, onions, butternuts, sweet potatoes, traditional spinach, pepper,
garlic and chilli (irrigated crops).

50
3.1.1.4 Livestock Farming
In the former Kavango Region, 45% of livestock is cattle, 32% is poultry and 16% goats (The
Meat Board, Namibian Livestock Census 2012) Livestock is farmed for both commercial gain and
through the SSCF units. However, most livestock farming is not used for commercial
purposes (cattle and goats), but rather as a measure of wellbeing. Therefore, cattle are
only slaughtered on special events and to cover specific expenses. Notably, traditional
sour milk is used from the cattle and is currently undersupplied, indicating the potential in
this market. There is currently no abattoir in the region and animals have to be
slaughtered in Oshakati, although one is currently under construction (Stakeholders Workshop, 18
November 2014). Chickens are also not often slaughtered and are mainly utilised for their
source of eggs (DECOSA, 2013).
Other issues hampering the
commercialisation of livestock farming is
the location of the “Red Line” or Veterinary
fence, which lies south of Kavango East
and which restricts the movement of
livestock across this line. All livestock are
placed under three week quarantine
before they can be slaughtered due to
the risk of foot and mouth disease
(MLR, 2013 (a)).
3.1.1.5 Indigenous Fruit and Vegetables
In terms of vegetation, the Kavango East Region is a very diverse region and has a large
variety of indigenous fruit and vegetables. These are collected throughout the year and
used for food and for traditional healing. Although not currently used commercially, a
number of products also have the potential for commercial uses (such as cosmetics and
as medicines). Examples of some of the local products that are available include:
Fruit: Bird Plum, Magic Quarry, Manketti, Waterberry, African Mangosteen, Mobola,
Corky Monkey Oranges, Small and Large Sour Plums, Jackalberry, Kalahari

51
Podberry, Baobab, Dwarf Jackalberry, Raisin Bush, Velvet Wildmedlar, False
Mopane and Wild Melon
Vegetables: Zebra Aloe, Wild Okra, Wild Spinach, Hibiscus and Kalahari Truffel
Medicinal Plants: Devil’s Claw, Marula, Zimenia and Commiphora
Fibrous Plants: Grass, reeds and Makalani palms
3.1.2 TOURISM AND WILDLIFE
Tourism in the Kavango East Region is an important activity. The region has diverse
biodiversity and wildlife, a number of natural attractions (Kavango River, scenic areas)
three national parks, cultural heritage, and has been experiencing increased trade from
neighbouring areas.
There are two main types of tourists who visit the region, namely leisure tourists (who visit
the region due to the scenic area and biodiversity opportunities) and business tourists
(who visit the region to undertake business related activities and trade).
3.1.2.1 Business and Trade Tourists
It is estimated that there are currently about 120 000 shopping tourists who visit the former
Kavango Region to shop for goods that are either not available or is cheaper than in their
countries of origin such as Angola, Botswana, Zambia and Zimbabwe. However given the
function of Rundu as a regional centre, it can be assumed that the majority of these
tourists visit the Kavango East Region. Despite this number, it is estimated that these
numbers (especially with tourists from Angola) could be significantly increased with new
infrastructure development (DECOSA, 2013).
Currently there are 32 existing tourism accommodation facilities in Kavango East. Most of
the accommodation facilities are located around Divundu (which has good access to the
more scenic parts of the region), the existing national parks and conservancies as well as
in and around Rundu. The location of these is illustrated in

52
Figure 26.

53
Figure 26: Kavango East Tourism Facilities
The above information illustrates that the Kavango East has the following opportunities:
Good tourism infrastructure (accommodation);
It is strategically located (both in terms of shopping tourists from neighbouring
countries); as well as leisure tourism as it is on the route from/to Etosha National
park-Okavango Delta- Victoria Falls;
It has the natural beauty and diversity of wildlife;
Cultural interest (San, crafts and woodcarvers).
This creates an opportunity for the tourism; however despite these opportunities, the
region faces issues such as underdeveloped marketing of the region as a whole,
insufficient supporting tourism infrastructure (signage and tourism information centres),
limited activities within towns to attract tourists, as well as competition with more
established and well know tourism locations such as the Okavango Delta in Botswana.
These need to be addressed in order to grow the market.

54
3.1.2.2 Leisure Tourists
Currently, an estimated 73 000 leisure tourists visit the former Kavango Region. However it
estimated that due to the fact that Kavango East has more tourism attractions, better
tourism infrastructure as well as more accommodation facilities; most of those tourists visit
the Kavango East Region. Despite this, most of the visits are overnight stays (on route to
other destinations, particularly the Okavango Delta), except for some lodges where guests
stay on average two nights. The tourism season is also very seasonal, with peak season
being experienced between July and September (DECOSA, 2013).
Currently there are three National Parks, three communal conservancies, two emerging
conservancies and larger consolidated areas such as the Transfrontier Conservation Area,
Khaudum North Complex and the Proposed Ramsar site. The conservation areas are as
follows:
3.1.2.3 Bwabwata National Park
According to the Tourism Development Plan, the Bwabwata National Park is the most
visited park in the north eastern Namibia, due to its strategic location (MET, Bwabwata Mamili
Mudumu Tourism Development Plan, 2009). The Bwabwata National Park is zoned into three “Core
Conservancy areas”, Mahango, Buffalo and Kwando, as well as a large multiple use area
zoned for community based tourism, trophy hunting, human settlement and development
by the community. Furthermore, the pans of Central Bwabwata offer seasonal game
viewing when they hold surface water after the rains. The park supports both wildlife and
humans and the park has about 35 large and numerous small game species as well as 339
bird species. The most popular Core Area in 2008 was Mahango with 17,067 visitors,
followed by Kwando with 5,971 and finally Buffalo with 2,440. Mahango is very easily
accessed via the C48 road between Divundu and Mohembo border post with Botswana.
There are two game drive routes in Mahango, of which one is a surfaced track capable of
carrying 2x4 traffic, while the other is only suitable for normal width 4x4 vehicles. Buffalo
Core Area on the other hand is only accessible by 2x4 vehicles as far as the old Military
base at Pica Pau. Kwando is only accessible to 4x4 vehicles. The Multiple-use Area is
mostly only passable by 4x4 vehicles, although the main settlements and government
facilities have 2x4 accessibility (MET, Bwabwata Mamili Mudumu Tourism Development Plan, 2009). Most of
the tourism infrastructure is situated on the periphery of the park, with only one being
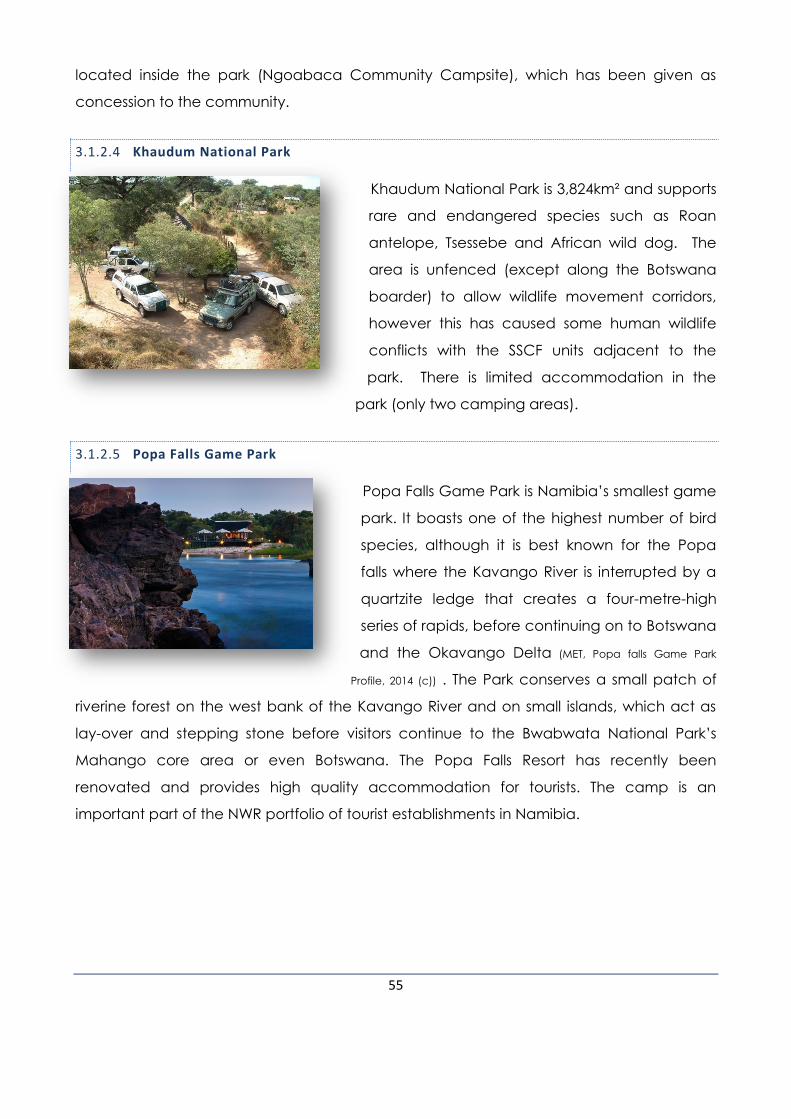
55
located inside the park (Ngoabaca Community Campsite), which has been given as
concession to the community.
3.1.2.4 Khaudum National Park
Khaudum National Park is 3,824km² and supports
rare and endangered species such as Roan
antelope, Tsessebe and African wild dog. The
area is unfenced (except along the Botswana
boarder) to allow wildlife movement corridors,
however this has caused some human wildlife
conflicts with the SSCF units adjacent to the
park. There is limited accommodation in the
park (only two camping areas).
3.1.2.5 Popa Falls Game Park
Popa Falls Game Park is Namibia’s smallest game
park. It boasts one of the highest number of bird
species, although it is best known for the Popa
falls where the Kavango River is interrupted by a
quartzite ledge that creates a four-metre-high
series of rapids, before continuing on to Botswana
and the Okavango Delta (MET, Popa falls Game Park
Profile, 2014 (c)) . The Park conserves a small patch of
riverine forest on the west bank of the Kavango River and on small islands, which act as
lay-over and stepping stone before visitors continue to the Bwabwata National Park’s
Mahango core area or even Botswana. The Popa Falls Resort has recently been
renovated and provides high quality accommodation for tourists. The camp is an
important part of the NWR portfolio of tourist establishments in Namibia.

56
3.1.2.6 Kavango Zambezi Transfrontier Conservation Area (KAZA TFCA)
It has been agreed that land belonging to Angola,
Botswana, Namibia, Zambia and Zimbabwe is
consolidated under formal control for protection and a
MoU was signed in December 2006 between the
countries. This is potentially the world’s largest
conservation area (expected to span an area of
287,132 km²). Its goal is “to sustainably manage the
Kavango Zambezi ecosystem, its heritage and cultural
resources based on best conservation and tourism
models for the socio-economic wellbeing of the communities and other stakeholders in
and around the eco-region through the harmonization of policies, strategies and
practices”. The Namibian portion of the Transfrontier park includes the Khaudum National
Park and Bwabwata National Park (Kavango East) as well as the Nyae-Nyae Conservancy
(Otjozondjupa Region) (African Conservation Foundation, 2015).
3.1.2.7 Khaudum North Complex
The Khaudum North Complex is a joint management area (between state and
community) that aims to cluster resource management units together to increase
development opportunities and create wildlife corridors between conservancies. It
consists of the George Mukoya, Muduva Nyangana and the Khaudum National Park.
3.1.2.8 Bwabwata-Okavango Ramsar Site.
The Bwabwata-Okavango Ramsar Site is located within the Bwabwata National Park and
is surrounded by communal conservancies. The site covers the lower Kavango River, part
of the Okavango Delta and permanently or temporarily flooded marshes and floodplains
bordered by riparian forest and open woodland. The site supports one of the highest
diversities of species with over 400 species of birds, the highest number of any site in
Namibia. It was designated in December 2013 and its management plan aims to secure
and protect the ecological processes and wetlands, as well as optimising economic
growth (MLR, Draft Integrated Kavango Regional Land Use Plan. Volume II., 2013 (b)).

57
Given the above tourism resources, there is
potential to increase tourism in this region based
on the biodiversity, natural attractions and culture
of the region. However, marketing of the region
needs to be increased as well as the uncertainty
of tenure (especially with regard to the lodges
located within the community conservancies and
along the river).
3.1.3 TRADE AND INDUSTRIAL DEVELOPMENT
The retail sector and the financial and business sectors each contribute 8% towards
employment in the Kavango East Region. The majority of retail and commercial activities
take place in Rundu in the form of specialist retailers, which illustrates its importance as a
trading centre for the surrounding agricultural areas (including Kavango West), as well as
Angolans who access the town via boats on the river(DECOSA, 2013). The Rundu Town
Council has listed 714 businesses; as well as three open markets (with an estimated 850 to
900 vendors). There is however a lack of specialised retailers focusing on agriculture and
long distance transport.
A new Fresh Produce Business Hub was opened in May 2013 in Rundu which aims to serve
primarily as a service centre, although it will also include processing activities. The hub will
provide services such as cold storage, ripening, grading, marketing, processing and
logistical facilities to support producers and traders. The facility is to be managed by the
Agricultural Marketing and Trade Agency (AMTA); however it will function as a PPP with
the cold storage and marketing facility to be operated by wholesalers and agents. The
Hub will also provide serviced land for agri processing by private investors, research and
product development facilities, a retail centre, and open market for small traders and
serviced land for fuel stations and a truck port (DECOSA, 2013).
The Kavango East Region also has a strategic location and the Trans-Caprivi Highway links
this region with Walvis Bay on the coast with the neighbouring countries of Botswana as
well as further inland to Zambia, the DRC and Zimbabwe. This creates opportunities for a

58
logistical hub to be developed in towns such as Rundu as well as to promote additional
specialised retailers focusing on agricultural implements and equipment.
The services sector in the Kavango East Region is fairly well diversified and accounts for
24% of employment opportunities. It is however important to note that a large number of
these jobs are created in the government sector (administration, regional and local
councils, education, health, the armed forces, etc.).
Most of the services are located in Rundu, however most of these businesses are small and
82% of identified activities have been reported by the RTC as falling into the non-formal
sector with 80% trading as sole proprietors. This is with the exception of security services,
refuse removal and some construction companies; although most of this labour force is
only part time employers when contracts have been secured. The sector also lacks
diversification, with businesses offering a range of services rather than focusing on core
services (DECOSA, 2013). Thus, there exists the opportunity to develop a truck related cluster
(which has been planned), which could focus on the long distance needs and
requirements of the transport industry given the strategic location of the region in terms of
the Trans-Caprivi Highway.
3.1.4 FORESTRY
There are seven registered and one emerging community forests in the Kavango East
Region, of which Ncaute spreads over both Kavango Regions. The community forests are
listed in Table 14 and shown in Figure 22 under Section 2.5.3.
Table 14: Kavango East Community Forests
Location Community Forest Name Status of Conservancy Community Forest
Kavango East
Muduva Nyangana Gazetted CF
George Mukoya Gazetted CF
Likwaterera Gazetted CF
Hans Kanyinga Gazetted CF
Shamungwa Emerging CF
Cuma Gazetted CF
Gcwatjinga Gazetted CF
Kavango East and West Ncaute Gazetted CF

59
The forestry sector holds potential for economic development, however currently there is a
ban on the harvesting of all forestry products. This is due to over-utilisation which has
hindered growth in this sub sector as well as having negative spin-off effects on other
sectors such as the craft industry (lack of raw materials). Community Forests (CF)
(illustrated in

60
Figure 22: Kavango East Community Forests on page 42) have been set up by the
Directorate of Forestry under the Ministry of Agriculture, Water and Forestry. These are
areas within communal lands which have been given over for local communities to
manage. The principal is that of “sustainable management” to ensure that the resource
base is shared amongst all locals.
Products produced from this sector include indigenous fruits, fibres and larger indigenous
trees (Zambezi Teak, Syringa, Mopane, Rosewood, Kiaat, Silver Terminalia, Pod Mahogany,
Poison-pod and Leadwood) (DECOSA, 2013). These are demanded both locally as well as
internationally which in turn has increased the demand for these resources and
subsequent over-utilisation.
In addition to the ban on forestry, which has limited the growth of this sector, there are
other issues that include:
overlapping land uses (e.g. SSCF are created over the Community Forests),
conflicts where tribal authorities do not follow management plans,
allowing outside parties to harvest the forest resources,
lack of value addition to raw product (wood is cut into rough planks and then sold
to manufacturers), and
illegal harvesting, (MLR, Draft Integrated Kavango Regional Land Use Plan. Volume II., 2013 (b)).
These issues have led to this resource adding very little economic value to this economic
sub-sector. There is however a latent potential for this sector in terms of the craft market,
harvesting and value add of indigenous forestry projects, as well as value add in terms of
further processing of timber and timber products such as furniture and charcoal.
3.1.5 MINING
Currently mining in Kavango East plays a relatively unimportant role in the economy and
there are no mining licences or mines within the region. Although some Exclusive
Prospecting Licences (EPLs) have been given out within the region; the majority of these
are for precious stones, base and rare metals; industrial metals; industrial minerals and non-
nuclear fuel minerals (MLR, Draft Integrated Kavango Regional Land Use Plan. Volume II., 2013 (b)). Most of

61
these are however for small-scale mining. Figure 27 illustrates the location where
exploration licences have been granted, both active and pending.

62
Figure 27: Kavango East Mining Exploration Licences
Some sand mining activities were taken
note of in the region (these are mostly
unregulated activities) and this activity
has the greatest potential (especially
given the anticipated demand for
housing materials) for development in the
region. However, illegal activities often
lead to large scale erosion, create large
“holes that fill with water during the rainy
season and create unattractive areas of
activity” (DECOSA, 2013).
3.1.6 FISHERIES AND MARINE RESOURCES
Fish is the preferred diet of the local inhabitants of the Kavango East Region, and thus
fishing plays an important role in terms of food security. However, it has less value from an
economic perspective. There are two types of fishing currently occurring in the region
and this includes:

63
Freshwater Fishing
Commercial Aquaculture
Freshwater Fishing currently occurs along the Kavango River and is mostly associated with
subsistence fishing. Traditional fishing methods using dugout canoes with nets are used, or
fishing occurs in shallows with baskets and fine mesh nets or hooks and lines. Currently the
area is overfished (due to a rising population), and fish levels have been dropping.
Importantly the Ministry of Fisheries and Marine Resources has indicated that it is difficult to
determine the fishing resources in the Kavango River and as a result it is also difficult to
estimate the value of the fishing industry. The river is traditionally very shallow and is low in
nutrients. As a result fishing is regulated by the Inland Fisheries Act (Act no 1 of 2003) which
requires fishermen to have a fishing licence when using a net, rod and reel or chartered
boat; but not if traditional fishing methods are utilised (DECOSA, 2013).
There is currently one commercial aquaculture facility operating in Kavango East, namely
Karovo which is located close to Mukwe and is a community–based fish farm which
produces tilapia and catfish. This farm however has a low yield and productivity whereby
it only produced 1,000 kg of fish in 2013 through six production ponds for eight months of
production. This farm is financially intensive (capital intensive to set up), and it requires
additional technologies and knowledge to be injected into the project. There is also a
training and research facility in the Kavango East Region at Kamutjonga Inland Fisheries
Institute (KIFI) where research is undertaken on the Kavango River (MLR, Draft Integrated Kavango
Regional Land Use Plan. Volume II., 2013 (b)). This facility also produces fingerlings and fish for sale.
Despite current low fish yields from this sub sector, there is potential for this sub sector to
increase its contribution to the Kavango East economy if production is increased
considerably at the existing fish farm and combined with micro fish farming in the local
communities (DECOSA, 2013).
3.1.7 MANUFACTURING
The manufacturing sector in the Kavango East Region is not well developed and only
accounts for 2% of the jobs created. Most of the industries can be classified as micro and

64
small scale enterprises, which implies that very few businesses have employees and many
of the businesses only operate part time.
Most of the businesses are located in the major settlements and in particular in Rundu and
Divundu. Other more informal industries located in smaller villages in the region focus on
tailoring, bakeries, crafts (woodwork and carving has however been impacted by the ban
of forestry operations) and butcheries (DECOSA, 2013).
Most goods are imported into the region and there is therefore potential to add value to
existing primary products including agri processing (abattoir in Rundu to add value to
livestock farming as well as producing goods such as jams, juices and pickles from
indigenous fruit and high value horticultural products), furniture making, brick making,
leather products and milk. In addition, due to the high incidence of migration from the
rural areas to the urban areas, there is increased pressure for housing and therefore
manufacturing of construction products such as grasses and reeds for thatching as well as
brick making factories will be demanded in the future; particularly around existing towns
such as Rundu and Divundu. Rundu also has a SME park (800 m²), the aim of which is to
promote manufacturing activities in the region.
3.2 SOCIAL SECTOR DEVELOPMENT
The Social sector refers to the part of social and economic activity done for the purposes
of benefitting society and which is funded, including: Housing, Development Projects and
Social Support, as well as Land and Resettlement.
3.2.1 HOUSING
As the Regional Authority, housing falls under the responsibility of the KRC in the town of
Divundu and the settlements. The Rundu Town Council as local authority in the town of
Rundu is responsible for the provision of housing to their residents, while the Traditional
Authorities are responsible for the rural areas (DECOSA, 2013). However, Divundu was recently
proclaimed as a village and will soon be managed by a village council.
Through the Build Together Programme, the KRC oversaw the construction of the following
housing projects:

65
Divundu
- 2007/8: 20 houses under construction
- 2010/11: 18 houses under construction
Ndiyona
- 2010/11: 18 houses under construction
The following Housing projects have been undertaken in Rundu:
1999-2008: 241 houses within the Build Together Programme
Thereafter the programme was interrupted but in 2012 the RTC requested N$1.63 million for
32 houses.
- 2012: The RTC approved 129 building plans of private investors with a total value of
N$30.1 million.
- Currently: 250 residential buildings are in a final construction phase in the “Rainbow
Village” and 48 houses were constructed by the National Housing Enterprise (NHE)
next to the Rundu – Sauyemwa road.
Still, despite the above service delivery, the demand for residential plots still exceeds by far
the offer of serviced land in Rundu (DECOSA, 2013).
3.2.2 HEALTH
Health and social well-being are fundamental human rights. Consequently, the ultimate
goal of the Namibian government and of the Ministry of Health and Social Services
(MoHSS) in particular is to attain a level of health and social well-being for all Namibians
that will enable them to lead economically and socially productive lives. In this section,
the distribution of health facilities is discussed. Typical health indicators like life expectancy
and infant- and maternal mortality are not yet available from the 2011 Census and will be
described using data from the 2001 Census. Finally, the HIV prevalence rates are
discussed based on the Sentinel Survey completed in 2012.
3.2.2.1 Health Facilities

66
There are 3 hospitals, 30 clinics, 1 health centre and 2 medical outreach posts in the
Kavango East Region and mobile clinics are also used to reach residents in the rural areas.
As Figure 28 illustrates, access to health facilities in the region are mostly concentrated
along the main Trans Caprivi Highway and the town of Rundu.

67
3.2.2.2 HIV Prevalence Rates
The Sentinel sites used to monitor the HIV prevalence rates that correspond to the
Kavango East Region includes Andara, Nyangana and Rundu and has been compared
with the average Namibian prevalence rate in

68
Figure 29 below. When considering the national average, the prevalence peaked in 2002
at 22% after which it slowly decreases, albeit with fluctuations to 18.2% in 2012. The trend in
HIV prevalence at two of the three sites is an increasing one, albeit with wild fluctuations.
At the time of the last Sentinel Survey of 2012 the HIV prevalence rates were higher than
the national average for all three sites.
Figure 28: Kavango East Region Access to Health Facilities

69
Figure 29: Kavango East Percent Changes in HIV Prevalence Rates: 1994-2012
(MOHSS, 2012)
3.2.3 WATER AND SANITATION
Access to services, such as potable water, toilet facilities and electricity are important
indicators of standard of living and the well-being of residents in a population. As Figure 30
shows, with the exception of access to safe water in the Rundu Urban Constituency,
service delivery is poorer than the national average, with the single exception of water
delivery in the Rundu Urban Constituency. Service provision is hindered by the great
dispersion of people in rural areas, although the service provision in the Urban areas of the
Kavango East Region is also poorer than in the rest of the country.
0
2
4
6
8
10
12
14
16
18
20
22
24
1994 1996 1998 2000 2002 2004 2006 2008 2010 2012
Pe
rce
nt
HIV Prevalence Rates, Namibia and Kavango East Sentinel Sites: 1994-2012
Namibia
Andara
Nyangana
Rundu

70
Figure 30: Kavango East Percent Household Access to Services, 2011
(NSA, 2011 Population and Housing Census Main Report, 2013 (b)), (NSA, 2011 Population and Housing Census. Kavango
East Regional Tables based on 4th Delimitation, 2014 (b))
Despite the comparatively poor access to services, the trends shown in Table 15 indicate
that access improved from 2001 to 2011. With the exception of a slight decrease in
access to safe water in the Ndiyona and Rundu Rural Constituencies, more households
had access to safe drinking water from piped water inside or outside their place of
residence, public pipes, boreholes with their tanks covered or from protected wells. The
proportion of households who did not have access to a toilet facility decreased in the
Mashare, Mukwe and Ndiyona Constituencies, decreased slightly in Rundu Rural East and
remained unchanged in the Rundu Urban Constituency. The use of electricity for lighting
has increased throughout the region, albeit slower in the Mashare Constituency.
45
78.695 91 95 91 97
63
020406080
100120
Nam
ibia
Kav
ango
Eas
tR
egio
n
Mas
har
e
Mu
kwe
Nd
iyo
na
Nd
on
ga L
inen
a
Ru
nd
u R
ura
l
Ru
nd
u U
rban
Pe
rce
nt
Kavango East Wood for cooking, 2011(New delineation) 66
32
816
817
7
53
010203040506070
Nam
ibia
Kav
ango
Eas
tR
egio
n
Mas
har
e
Mu
kwe
Nd
iyo
na
Nd
on
ga L
inen
a
Ru
nd
u R
ura
l
Ru
nd
u U
rban
Pe
rce
nt
Kavango East Electricity for Lighting, 2011(New delineation)
9371.9
59.440.7 42.3 44.3
64.6
97.3
020406080
100120
Nam
ibia
Kav
ango
Eas
tR
egio
n
Mas
har
e
Mu
kwe
Nd
iyo
na
Nd
on
ga L
inen
a
Ru
nd
u R
ura
l
Ru
nd
u U
rban
Pe
rce
nt
Kavango East Access to Safe Water, 2011 (New delineation)
35
67
87.5 86.978.7 81.4 88.2
47.4
020406080
100
Nam
ibia
Kav
ango
Eas
tR
egio
n
Mas
har
e
Mu
kwe
Nd
iyo
na
Nd
on
ga L
inen
a
Ru
nd
u R
ura
l
Ru
nd
u U
rban
Pe
rce
nt
Kavango East No Access to Toilet, 2011(New delineation)

71
Table 15: Kavango East Percent Household Access to Services, 2001-2011 (Old delineation)
% Households Safe Water No Toilet Facility Electricity for Lighting
2001 2011 2001 2011 2001 2011
Mashare 45 60 95 89 2 7
Mukwe 34 41 92 87 8 15
Ndiyona 45 43 92 80 3 13
Rundu Rural East 76 85 75 74 4 20
Rundu Urban 99 97 18 18 57 81
(NPC, 2001 Population and Housing Census. Kavango Region Basic Analysis with Highlights, 2004), (NSA, 2011 Census:
Kavango Regional Profile, 2014 (a))
3.2.4 RURAL DEVELOPMENT
According to Mendelsohn and Obeid (2006), most plans for development in Kavango
concentrate on rural development, including improving services to support people in rural
areas or attempts at improving household economies, most often by trying to raise
production on small farms to provide greater food security and increase sales of farm
produce. The following rural development projects were undertaken by the KRC in the
Kavango East Region. These appear to mostly focus on temporary job creation and skills
development and include cash/food for work projects, income generating projects, the
rural employment scheme, food security and nutrition and the One Region One Initiative
project. As most of these projects were undertaken before the region was divided, any
reference to constituencies will refer to the previous delineations.
3.2.4.1 Cash/Food for Work Projects
The following cash/food for work projects have been undertaken since 2010:
Table 16: Kavango East Cash/Work for Food Projects, 2010-2014
Project Location Project Name
2010/2011
Mashare Shinunga Primary School Renovations
Kandjara Village, Ndiyona Thomas Shiyave Quarantine Road debushing
Kandjara Village, Ndiyona Water Pipeline Project
2011/2012
Mukwe Mayara Village Teachers Residence
Ndiyona Arevashweneka Village Water Pipeline
Mashare Tara-tara Village Classroom Construction
Gonwa Village, Rundu Rural East
Madjwa-Gonwa Road Clearance

72
2012/2013
Muthinduko Village, Mukwe Constituency Muthinduko Community Hostel Semi-Renovation
Ndiyona Constituency Shikenge/Kanyumara Village Water
Muroro Village, Mashare Ghukushuki Water Pipeline
Ngcangcana Village, Rundu Rural East Ngcangcana Classroom Semi-Renovation
2013/2014
Mashi Village, Mukwe Road Debushing
Dosa Village, Ndiyona Stephanus Kamonga (Dosa) Community Hostel Project
Muroro Village in the Mashare Constituency Ghukushuki Water Pipeline
Kambowo Village, Rundu Rural East Road Clearance
3.2.4.2 Income Generating Projects
The following income generating projects have been undertaken since 2009:
Table 17: Kavango East Income Generating Projects, 2009-2014
Project Location Project Name
2009/2010
Kaisosi Village, Rundu Rural East Ninka Yoge Sewing Project
Ndiyona Tukugomenene Gardening Project
2010/2011
Popa Village, Mukwe Popa Brick Making Project
Muroro Village, Mashare Greenhouse Paradise Gardening Project
2011/2012
Ndiyona Village, Ndiyona Liyerenge Photo Studio & Computer Centre
Ndiyona Village, Ndiyona Fabra Catering Services
Muroro Village, Mashare Nove Name Butchery
Muroro Village, Mashare VaKadona Vanayimbondi Poultry Farm
2012/2013
Popa Village, Mukwe Popa Brick Making
Ndiyona Nkagi Dee Sewing Project
Mashare Nkenda Tent Hiring
Rundu Rural East Ngombe Farming Project (Cattle rearing
2013/2014
Rundu Rural East Vaterenu Tent Hiring
Mashare Mashare Brick Making
Ndiyona Vyapalivhu Coffin Making
Mukwe Mukwe Creative Salon and Computer Centre
Mukwe Ghupithe Salon and Computer Centre
3.2.4.3 Rural Employment Scheme
The following rural employment schemes were undertaken from 2012-2014:

73
Table 18: Kavango East Rural Employment Schemes, 2012-2014
Project Location Project Name
2012/2013
Mukwe Rughongoro Garden and Kehembuto Vegetable Garden
Ndiyona Rumwemwe Open Market
Mashare Muroro Welding
Rundu Rural East Project unspecified
2013/2014
Mashare Rundanda Chicken Farming Project
Ndiyona Tuvatjirere Wood Work Project
Mukwe Tukondjere tate Gardening Project
Mukwe Ngungwe Gardening Project
3.2.4.4 Food Security and Nutrition
The following eight food security projects were undertaken from 2012-2014:
Table 19: Kavango East Food Security Projects, 2012-2014
Project Location Project Name
2012/2013
Mukwe Project unspecified
Ndiyona Shepenu Tupu Mberema Gardening
Mashare Shetekera Gardening
Rundu Rural East Project Unspecified
2013/2014
Rundu Rural East Fish Sales at Chipululu Kusuka Kwahi
Mashare Mashare Devil’s Claw Trading
Ndiyona Shikoro Bakery Bread Making
Mukwe Kamberema Gardening
3.2.4.5 One Region One Initiative
Only one project was undertaken by the One Region One Initiative from 2012-2014:
Table 20: Kavango East One Region One Initiative Projects, 2012-2014
Project Location Project Name 2012-2014
Mukwe Bushmen Honey
Irrespective of the particular focus, all the efforts are based on a central assumption that
livelihoods on communal land can really be improved. However, Mendelsohn and Obeid
further argue that true rural development will be hard to achieve since the environment is
hard and insecure because of the poor soils, low and unreliable rainfall, and prevalence

74
of disease. The natural vegetation has also been destroyed in many areas, so wood and
grazing is only available after a long walk.
Water, too, is often far away and often not safe to drink and other services are
inadequate or non-existent. The most attractive areas tend to already be densely
occupied, leaving little land for living or for effective agricultural practices. Much more
than the few hectares most people are expected to occupy on communal land is
needed for profitable farming and small plots are only commercially viable for farmers
that can sell their produce at Rundu.
The market, a lack of capital for investment and the absence of a reliable supply of labour
further hampers farming practices and businesses, in general. Finally, capital is required
for farming activities to develop to a point that they become lucrative and beyond the
level of subsistence. These are all reasons that make rural development difficult,
especially for subsistence farmers who face high risks and low rewards, and have better
options elsewhere. Since formal jobs provide incomes many times greater than those from
small-scale farming it is not surprising that most people have little interest in investing in
farming and less and less attachment to rural life.
They thus assert that the rural areas of the Kavango Regions are not places to live
comfortably and in-migration to town reflect clear intentions to find better lifestyles, and so
the promotion of rural, subsistence livelihoods simply runs against the aspirations of many
people. For the time being, however, many rural people have little immediate hope of
moving up the ladder, remaining stuck on the bottom rung where they make out a living
from farming, fishing and gathering.
Still, many people will also choose to remain in the countryside, despite having
opportunities, and they should not be abandoned. But efforts to support them will be
more effective if they are appropriately cast in terms of poverty alleviation rather than as
rural development. Mendelsohn and Obeid thus conclude that effective development
must be concentrated in urban areas and those options that recognize and capitalize on
real benefits to be gained from rural environments, for example large-scale farming,
tourism and the economic use of wildlife (Mendelsohn & el Obeid, 2003).

75
3.2.5 LAND AND RESETTLEMENT
Government’s Resettlement Policy aims to resettle eligible persons on agricultural land in
ways that are institutionally, sociologically, economically and environmentally sustainable
and allow for the beneficiaries to become self supporting. To enable the process, the MLR
purchases and allocates land to settlers. However, to ensure the sustainability of
resettlement efforts, the Ministry also provides support, such as infrastructure, shelter, and
skills training. In the Kavango East Region, land resettlement efforts have been focused on
the creation of the Small Scale Commercial Farms (MLR, Draft Integrated Kavango Regional Land Use
Plan. Volume II., 2013 (b)).
According to Mendelsohn, about 622 SSCFs have been allocated by Traditional
Authorities in the former Kavango Region covering approximately 45% of the communal
land in the region and 470 of these allocated farms are within designated agriculture
areas. Of these 622 SSCFs, 302 gazetted and 61 un-gazetted SSCFS fall within the Kavango
East Region, specifically.
According to Mendelsohn, 20% of the SSCFs within designated agricultural areas (both
Kavango Regions) do not have leaseholds, while 72% of farms outside the designated
agriculture areas do not have leaseholds (Mendelsohn J. , Rapid Survey of Farms in Kavango, 2013).
According to the Rapid Survey on Farms, the majority of the SSCF owners live in Rundu or
elsewhere in Namibia and very few actually live on the farms with a total of 1,786 people
living on the farms.
According to the MLR, the SSCFs receive a variety of support, including capital,
infrastructure, equipment and skills training (MLR personal communication, 2015). However, both the
IRLUP and the Rapid Survey of Farms list mention that the road infrastructure is limited and
that there is limited fencing and water availability to the SSCFs, which all impact on the
productivity of these farms.
3.2.6 SOCIAL WELFARE/POVERTY
In this section the changes in poverty and inequality is discussed as key indicators of
economic progress and social inclusion. However, poverty is perceived and understood in
different ways by different communities based on locality specific contexts and reference

76
points or benchmarks (NPC, Regional Poverty Profile for Kavango Region, 2006). This was also stressed in
both Stakeholders Workshops. In both the Kavango Poverty Profile and the NSA report on
Poverty Dynamics in Namibia, many definitions of poverty were given, including: a lack of
possessions, like cattle, ploughs or crop fields; a lack of access to education, services and
markets and a lack of social support structures. As the data used in this section were
released before the regional split, the data will be reported for the former Kavango
Region.
Mendelsohn and el Obeid agree that the welfare of households depends both on income
and access to resources such as oxen, ploughs, livestock, grazing, fields and fish, for
example, but that there is great variation in ownership of assets. For example, about 59%
of households have cattle and some 51% have goats, leaving 41% and 49% without these
livestock. Approximately 6% of all farmers own about half the cattle in the region, and
about 270 people effectively own almost one quarter of all land in former Kavango and
only half of all farmers have their own ploughs (Mendelsohn & el Obeid, 2003). As such, in terms of
possessions, there is great disparity in the region.
Another common assumption is that most people are heavily dependent on subsistence
farming for their food and income. While this is correct for some households, especially the
very poor, the majority of households still buy much of their food using money earned from
sources other than farming (Mendelsohn & el Obeid, 2003, p. 107).

77
Table 21: Changes in Poverty and Extreme Poverty in Namibia and the former Kavango Region, 1993/4-
2009/10
Poor
Rate of Reduction Rate of Reduction
1993/4 2003/04 2009/10 1993/4-2003/4 2003/04-2009/10
Kavango 76.3 64.1 55.2 ‐12.2 ‐8.9
Namibia 69.3 37.7 28.7 ‐31.5 ‐9.0
Extremely Poor
Kavango 61.6 47.1 34.6 ‐33.5 ‐16.2
Namibia 58.9 21.9 15.3 -37.0 ‐6.6
(NSA, Poverty Dynamics in Namibia. A Comparative Study Using the 1993/4, 2003/4 and 2009/10 NHIES Surveys, 2012)
Another measure used in the Namibia Housing Income and Expenditure Survey (NHIES) is
the proportion of household income that is spent on basic needs compared to the
poverty line, which is a specified minimum level of income defined below for 2003/4 and
2009/10 in Table 21. The upper bound poverty line identifies those households that are
considered to be poor; while the lower bound poverty line identifies those households that
are extremely poor, or food poor since their total consumption expenditures are
insufficient to meet their daily calorific requirement.
Table 22: NHIES Poverty lines, 2003/4 and 2009/10
Poverty line 2003/2004 2009/2010
Lower bound poverty line: “severely poor 184.56 277.54
Upper bound poverty line: “poor” 262.45 377.96
(NSA, Poverty Dynamics in Namibia. A Comparative Study Using the 1993/4, 2003/4 and 2009/10 NHIES Surveys, 2012)
According to the 2003/4 NHIES, the former Kavango Region was rated the poorest in the
country with 64.1% of households living below the upper boundary poverty line. While the
poverty levels decreased according to the 2009/10 Household Income and Expenditure
Survey, the region remained in last place with more than half (55.2%) of the population
living in poverty. There was also a reduction the proportion of households living in extreme
poverty from 47.1% in 2003/4 to 34.6% in 2009/10. While the former Kavango Region is thus
the poorest region overall, in 2009/10 it had the second lowest incidence of extreme
poverty behind the Zambezi Region (35.2%). Overall, from the 1993/4 to the 2009/10
National Housing Income and Expenditure Surveys poverty has been reduced in the

78
former Kavango Region by 21.2%, which is the second slowest rate of poverty reduction
after the Khomas Region (16.1%).
According to Namibia Poverty Mapping the former Kavango Region had the highest
incidence of poverty by 2011 (based on the poverty headcount) of all regions at 53%,
representing a decline of 5% between 2001 and 2011. All constituencies except Rundu
Urban had a poverty incidence higher than the national average of 27%.(National Planning
Commission, n/d)
A measure which describes the income inequality in populations is the Gini Coefficient,
which expresses income as it deviates from a normal distribution on a scale from 0-1 and is
listed for Namibia and the former Kavango Region in Table 23.
Table 23: Gini Coefficients for Namibia and the former Kavango Region, 1993-2004
Gini Coefficient 1993/1994 2003/2004 2009/2010
Namibia 0.646 0.600 0.597
Former Kavango Region 0.616 0.494 0.456
(NSA, Poverty Dynamics in Namibia. A Comparative Study Using the 1993/4, 2003/4 and 2009/10 NHIES Surveys, 2012)
However, it must be mentioned that the Gini Coefficient is not a measure of poverty or
development, but of the distribution of income and wealth in a population. Thus, while
great improvements can be seen in the overall reduction of poverty in both Namibia and
the former Kavango Region, the redistribution of wealth has been slower. Considering
Table 21, there has been a reduction in the income inequality of both Namibia and the
former Kavango Region, although the rate of the reduction was more noteworthy in th
former Kavango Region. In fact, the Region was one of the six regions that experienced a
reduction in income inequality. Both the Khomas and the Zambezi Regions experienced
quite significant increases in income inequality.
3.2.7 COMMUNITY DEVELOPMENT
While rural development is the responsibility of the Kavango East Regional Council as the
regional authority in the region, community development in the urban areas is the
responsibility of the local authorities, which is the Rundu Town Council in the Kavango East
Region. The community development projects are discussed below.

79
3.2.7.1 Small Grant Fund
The Town Council, in partnership with its twin city of Nieuwrgein in the Netherlands,
established a small grant fund to support small community based projects and programs
involved in the fight against HIV/Aids. The small community projects/programs were
supported with grants of up to N$10000 and include gardening projects, centres for
orphans and vulnerable children and soup kitchens (RTC Personal Communication, December 2014).
3.2.7.2 Woman and Youth Cleaning Programme
The dumping of litter was mentioned as a significant problem in the former Kavango
Region in the LED Report. The Town Council initiated a litter cleaning program benefitting
women and the youth. The group clears litter from streets and other public places in the
town and are paid monthly by the Council for their services (RTC Personal Communication,
December 2014).
3.2.8 EDUCATION AND TRAINING
There are 116 Primary Schools, 24 Combined Schools and 13 Secondary Schools in the
Constituencies that approximate the current Kavango East Region. However, if you
consider the distribution of schools, students in the central, southern and eastern parts of
the region have no access to schools, which are all concentrated towards the north and
along the Trans-Caprivi Highway to the west.
Table 24: Education Indicators and Trends
Namibia
Former Kavango
Region Namibia
Indicator 2008 2008 2009 2010 2011 2011
Total Number of classrooms 19,460 2,287 2,274 2,295 2,326 20,740
Traditional structures as % of all classrooms 7.0% 8.8% 8.6% 8.9% 8.9% 6.5%
Learner/Teacher Ratio 27.7 21.7 27.8 27.6 27.2 24.8
% of Primary Teachers qualified to teach 71.1% 61.5% 64.2% 66.8% 68.6% 78.7%
% of Secondary Teachers qualified to teach 90.1% 87.7% 88.7% 90.5% 91.8% 93.7%
(Ministry of Education, 2011)
The indicators in table 24 shows that the former Kavango Region lagged behind in the
sense that it had a higher percentage of traditional structures serving as classrooms than
nationally, and also that there are about 2.4 students more per teacher than in Namibia

80
as a whole. Also, a smaller percentage of teachers in both primary and secondary school
are qualified to teach than is the situation nationally. In terms of trends, the number of
classrooms are increasing, yet the percentage of traditional structures serving as
classrooms remained more or less the same between 2008 and 2011. Learner/teacher
ratios and teachers qualifications are, however, on the increase and this point to an
improving situation.
Higher education institutes in the Kavango East Region include the Rundu Vocational
Training Centre (RVTC), Community Skills Development Centre (COSDEC), the Triumphant
College, the Institute for Open Learning, the Namibian College for Open Learning
(NAMCOL) the University of Namibia and the Mashare Agricultural Development Institute.
3.2.9 LAW AND JUSTICE
The distribution of courts in Namibia is not geographically balanced, leading to limited
physical access to justice depending on which part of the country one resides in. Courts
are mainly found in areas with high concentrations of economic activity (Nakuta & Chipepera,
2011). In the both the Kavango East and West Regions, as well as the Zambezi Region, the
Rundu Magistrate Court is charged with upholding justice. Furthermore, there are three
Magistrates operating at the District level at Periodic Courts held in the Mukwe, and
Ndiyona Constituencies. Finally, a Control Magistrate is responsible for the administration
of the Court in Rundu.
Community Courts are a creation of the Community Courts Act, 10 of 2003, which was
drafted to formalise and give legislative recognition to the jurisdiction of the traditional
courts that render essential judicial services to members of traditional communities (Nakuta &
Chipepera, 2011). Since Community Courts are more easily accessible to local people in rural
settings, most rural citizens first encounter the legal system through the traditional courts,
which represent the Shambyu Traditional Authority, the Mbunza Traditional Authority, the
Gciriku Traditional Authority and the Mbukushu Traditional Authority (Personal Communication with
Rundu Magistrate Court, 1 December, 2014).
The Traditional Authorities Act delineates which offences may be dealt with under the
traditional system, as well as the role, duties and powers of traditional leaders and
provides that customary law is invalid if it is inconsistent with provisions of the Constitution

81
or legislation. As with the distribution of educational and health facilities in the Kavango
East Region, the distribution of police stations are also concentrated along the Trans
Caprivi Highway, as well as at the border posts to Angola in the north and Botswana to
the south.
Figure 31: Kavango East Police Stations
3.3 INFRASTRUCTURE
The Kavango East Region has a serious need for many services and basic infrastructure. In
order to stimulate development within the rural areas the provision of rural water supply,
improved road network, telecommunications and electricity are urgently required. This
section will investigate the developmental infrastructure available in the region and
challenges, current strategies and potential areas of investment will be examined.
3.3.1 TRANSPORT
3.3.1.1 Road Network
The Trans Caprivi Highway, which runs throughout both the Kavango East and Kavango
West Regions, links Central Namibia to the Zambezi Region as well as to Botswana, Zambia

82
and Zimbabwe with famous tourist destinations like the Chobe Game Reserve and Victoria
Falls en-route. The Trans Caprivi Highway also connect to other regions of Namibia and
constituencies in the Kavango East Region (DECOSA, 2013). The road infrastructure in the
Kavango East Region consists of external transport links, regional transport and urban
transportation, which are illustrated in the Figure 32. The main proposed roads have also
been included. Kavango East has a total of 1157 km of proclaimed roads. Of this, a total
of 350km is bitumen surfaced and 302 km gravel surfaced. The remaining 505km is
proclaimed but not yet constructed.
Figure 32: Kavango East Road Network
External Transport Links
The Trans Caprivi Highway (B8) is of central importance for trade and tourism in the
Kavango East Region. The Trans Caprivi Highway directly links the Kavango East Region
with the central parts of Namibia from Rundu to Otavi and from there on the B1 to
Windhoek and the B2 to the port of Walvis Bay. The highway also connects the Kavango
East Region to the Zambezi Region which connects with Angola via the Tsheto border post
close to Divundu as well as via Katima Mulilo with other neighbouring countries. Most

83
traffic from or to eastern Angola, Zambia (and Malawi), Zimbabwe and Northern
Botswana uses this highway and even includes traffic from the DRC.
The Kavango East Region is also connected to the North Central Regions from Rundu on
the T0804 hrough the Kavango West Region using the T1501 via Nkurenkuru and on the
same road via Katwitwi with Angola.
The road links and strategic locations of Rundu is certainly a benefit for the Kavango East
Region. A constraint is the current low level of road connections to Angola.
Regional Transport
With the exception of the main roads mentioned above the road infrastructure in the
Kavango East Region is poorly developed. Very few roads exist and the condition of these
roads is often poor.
Urban Transport
With the exception of the B8, the road network in the town of Rundu needs upgrading
and the maintenance of the gravel streets needs to be improved. Furthermore, street
lighting and pavements requires improvement to include pedestrian walkways as they
exist even in towns which are much lesser developed than Rundu.
Future Road Infrastructure
Figure 32 indicates that a total of 10 new roads have been planned for the Kavango East
Region, based on the utility and economic analysis for determining comparative social
and economic benefits on each project. All of the new roads identified are to connect
schools and in some cases schools and clinics. The total length of the proposed new
roads is 296 km (BiCon, 2008). In addition, there are also plans to build bridges between Rundu
and Calais and also across the Kavango River at Kayova in the Ndiyona constituency.
3.3.1.2 Air Transport
The airstrip at Rundu is able to handle medium-sized airplanes. There is also an airstrip at
Bagani.

84
3.3.1.3 Rail Transport
There is currently no rail network in the Kavango East Region, although a pre-feasibility
study has been completed for the construction of the railway from Cape Fria to Katima
Mulilo via the Omusati, Ohangwena, Kavango West and Kavango East Regions to the
Zambezi Region.
3.3.1.4 Water Transport
There is no formal water transport system in place but the local population use makoros to
cross the river as and when required.
3.3.2 ENERGY
The generation, transmission and bulk supply of electricity is currently the sole responsibility
of NamPower, a parastatal enterprise. However, electricity distribution in Namibia is
decentralised. Regional Electricity Distributors (REDs) are legal entities tasked with the
distribution of electricity in a dedicated area, as a means of improving service delivery
and efficiency in the electricity sector as a whole. The Electricity Control Board (ECB)
exercises control over the Electricity Supply Industry, and regulate the generation,
transmission, distribution, import and export of electricity through the setting of tariffs and
issuance of licenses.
In terms of the bulk supply of electricity, the Kavango East Region is fed by a 132 kV line
from the Oshikoto Transmission Station (T/S) in the Oshikoto Region. From Rundu a 66 kV
network extends to the east and a 22 kV network supplies Vungu Distribution Station (D/S)
(BiCon, 2008). At the time of the release of the Kavango Electricity Master Plan in 2008, only
the areas immediately adjacent to the river and Trunk Road (TR) 8/4 had access to grid
power, as can be seen in Figure 33.

85
Figure 33: Kavango East Electricity Network and Proposed Electrification Localities
Due to the limited electricity network, the majority of residents in the former Kavango
Region do not have access to power from the grid, but make use of other energy sources
for lighting, as shown in Table 25.
Table 25: Kavango East - Households by Main Source of Energy, 2011
% Households Grid Generator Solar Other
Namibia 32.6 0.3 0.1 67
Kavango East Region 31.5 0.5 0.3 67.7
Mashare 7.3 0.4 0.2 92.1
Mukwe 15.4 0.6 0.2 83.8
Ndiyona 7.5 0.1 1.1 91.3
Ndonga Linena 17.1 0.3 0.3 82.3
Rundu Rural 6.7 0.5 0.3 92.5
Rundu Urban 52.7 0.5 0.2 46.5
Only 31.5% of households in the Kavango East Region used energy from the grid.
However, considering the data on the constituency level, half of the households in Rundu
Urban Constituency used electricity from the grid, while all the other constituencies had
fewer than 20% of their households connected to the grid. As such, the provision of
electricity in the region is still far from sufficient and many villages are still without
electricity. The use of generators and solar is also still insignificant.

86
Annually the MME makes a budget available for the electrification of these villages,
however the process is slow, since the annual budget is insufficient to electrify all villages
at once. A policy of prioritisation is therefore followed to electrify only schools and
government institutions within each village. The proposed localities to be electrified are
illustrated in Figure 33, while the 6 schools that have been prioritised for electrification in
2014/2015 are listed in the table below along with their village names and the reticulation
system they will be connected to.
Table 26: Kavango East Electrification Priorities
Village kV Ret System MV Length School
Shaditunda 33kV Mahango 6.5km Shaditunda School
Tushupenu 22kV Rundu - Arendsnes 15.5km Tushupenu JP School
Gcwatjinga 22kV Rundu - Arendsnes 16.9km Gcwatjinga SP School
Ncame 33kV Cuito 16.9km Ncame School
Shamanaru 33kV Mahango 12.7km Shamanaru School
Mukongotji 33kV Mahango 8.8km Mukongotji School
(Personal Communication, ACS)
In order to address the rapidly growing demand for electrical power in the North,
NamPower proposed the potential Popa Falls hydro power project with the preferred site
being located approximately 3.3 km downstream from the Divundu Bridge, which
provides the greatest potential for hydro power generation. However, due to the
ecological and environmental sensitivity of the Kavango swamps and islands with their
unique and rare habitats, it has been recommended that the proposal be further
investigated in a fully detailed feasibility study, both a technical feasibility study and
detailed environmental impacts assessment to better quantify the impacts identified in the
preliminary environmental assessment.
3.3.3 WATER, SANITATION AND SOLID WASTE
The Kavango River is the main source of water in the Kavango East Region. However, only
people living along the river benefit from this resource. In the rest of the region people are
dependent on wells or boreholes as a source of water.
The 2011 Census statistics, listed in Table 27, show that 72% of the households in the
Kavango East Region have access to potable water in the form of piped water (inside

87
their households, outside their households or from a public pipe) or from covered
boreholes or protected wells, which is below the national average of 80%. Nearly all
households in the Rundu Urban Constituency have access to potable water, compared to
only 41% in the Mukwe Constituency, which had the lowest levels of access. However,
considering the trends discussed in Section 10.4, access to safe drinking water has
decreased in the Ndiyona and Rundu Urban Constituencies.
Nearly 23% of households uses rivers, dams or streams as their main source of drinking
water. In the Mukwe Constituency, which is the constituency with the largest stretch of the
Kavango River, 56% of households source their drinking water from the river, dams or
streams.
Table 27: Kavango East Percent Households by Access to Safe Drinking Water.
% Households Namibia Kavango
East Region Mashare Mukwe Ndiyona
Ndonga
Linena
Rundu
Rural
Rundu
Urban
Piped water inside 30.1 16.2 4.5 4.1 6.3 4.9 3.1 28.8
Piped water outside 19.7 21.7 9.4 3.7 12.7 11.3 9.4 36.4
Public Pipe 21.5 23.1 13.7 13.5 11.7 17.6 29.6 30.8
Borehole with Tank
Covered 6.8 10.2 29.4 19.1 7.8 9.7 22.3 1.0
Protected Well 1.9 0.8 2.4 0.3 3.8 0.8 0.1 0.3
Safe water 80.0 71.9 59.4 40.7 42.3 44.3 64.6 97.3
Borehole with Tank
Open 3.3 2.9 2.2 2.6 15.4 8.1 0.8 0.7
River/Dam/Stream 8.3 22.6 36.7 56.2 34.0 36.9 34.4 0.2
Canal 0.8 0.4 0.1 0.1 1.1 3.2 0.1 0.0
Unprotected Well 6.7 1.5 1.4 0.1 7.1 7.5 0.1 0.5
Others 0.8 0.7 0.2 0.3 0.1 0.1 0.0 1.3
Unsafe water 20.0 28.1 40.6 59.3 57.7 55.7 35.4 2.7
(NSA, 2011 Population and Housing Census Main Report, 2013 (b)), (NSA, 2011 Population and Housing Census. Kavango East
Regional Tables based on 4th Delimitation, 2014 (b))
According to the LED Report, of the approximately 22 million cubic meters of water
extracted from the river annually, 15% is used by rural people and their livestock, 11% is
used to supply the town of Rundu, and 74% is used for irrigation on large agricultural
schemes (DECOSA, 2013).
The Directorate of Rural Water Supply within MAWF is responsible for the bulk water supply
in rural areas and anybody (including NamWater) who wishes to take water from any
natural source, like the Kavango River, must apply for a Water Abstraction Permit. With
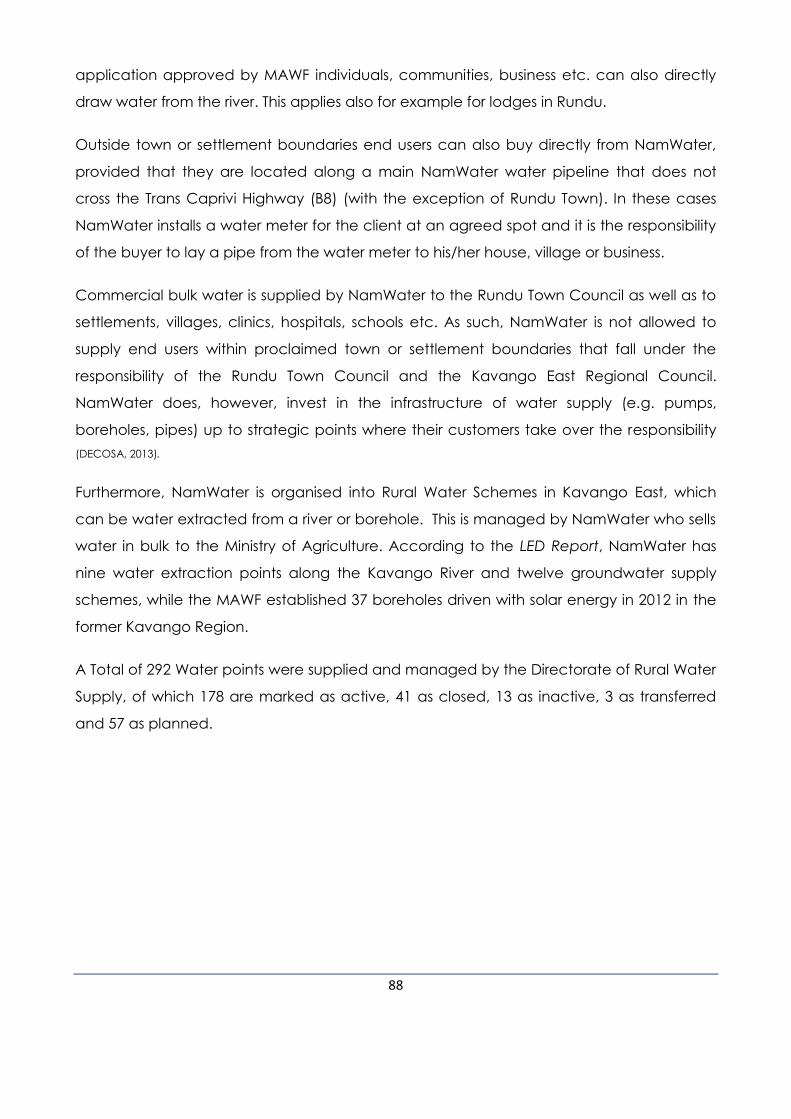
88
application approved by MAWF individuals, communities, business etc. can also directly
draw water from the river. This applies also for example for lodges in Rundu.
Outside town or settlement boundaries end users can also buy directly from NamWater,
provided that they are located along a main NamWater water pipeline that does not
cross the Trans Caprivi Highway (B8) (with the exception of Rundu Town). In these cases
NamWater installs a water meter for the client at an agreed spot and it is the responsibility
of the buyer to lay a pipe from the water meter to his/her house, village or business.
Commercial bulk water is supplied by NamWater to the Rundu Town Council as well as to
settlements, villages, clinics, hospitals, schools etc. As such, NamWater is not allowed to
supply end users within proclaimed town or settlement boundaries that fall under the
responsibility of the Rundu Town Council and the Kavango East Regional Council.
NamWater does, however, invest in the infrastructure of water supply (e.g. pumps,
boreholes, pipes) up to strategic points where their customers take over the responsibility
(DECOSA, 2013).
Furthermore, NamWater is organised into Rural Water Schemes in Kavango East, which
can be water extracted from a river or borehole. This is managed by NamWater who sells
water in bulk to the Ministry of Agriculture. According to the LED Report, NamWater has
nine water extraction points along the Kavango River and twelve groundwater supply
schemes, while the MAWF established 37 boreholes driven with solar energy in 2012 in the
former Kavango Region.
A Total of 292 Water points were supplied and managed by the Directorate of Rural Water
Supply, of which 178 are marked as active, 41 as closed, 13 as inactive, 3 as transferred
and 57 as planned.

89
Figure 34: Kavango East Water Provision
Despite the water resources from the Kavango River, the supply of potable water is not
sufficient, especially for the people living in the inland. Access to water is one of the most
important constraints for these people. Without inland water, grazing and crop growing
will continue to be concentrated along the river leading to greater conflict and land
degradation (DECOSA, 2013).
Poor sanitation and access to safe water can lead to the spread of diseases and are thus
important public health concerns in the Kavango East Region where two-thirds households
do not have access to a toilet facility, as shown in Table 28. Only 17% have access to flush
toilets compared to 40% nationally. The only constituency with flush toilets connected to a
sewer system is the Rundu Urban Constituency (26.4%). Still, the majority of households
(47%) have no access to a toilet facility. The greatest proportion of households without
access to toilets are found in the Rundu Rural Constituency (88.2%), although all the
constituencies had significantly below average levels of access to toilet facilities. Overall,
5.9% of households in the Kavango East Region rely on pit latrines with ventilation pipes.

90
However, according to the LED Report, attempts have been made to improve the
situation and the KRC provided sanitary drainage in Divundu and constructed 1314 VIP
toilets in the rural constituencies.
Table 28: Kavango East Percent Households by Type of Toilet Facility, 2011
% Households Namibia Kavango
East Region Mashare Mukwe Ndiyona
Ndonga
Linena
Rundu
Rural
Rundu
Urban
Private Flush
connected to
sewer
24.8 10.8 1.9 3.3 1.4 4.0 1.0 19.7
Shared Flush
connected to
sewer
11.7 3.8 0.7 1.5 0.6 2.0 0.0 6.7
Private Flush
connected to
Septic
1.6 1.3 1.8 0.4 0.6 0.5 0.5 1.9
Shared Flush
connected to
Septic
1.4 0.6 0.2 0.2 0.1 0.6 0.0 1.1
Flush toilet 39.5 16.6 4.6 5.4 2.7 7.0 1.5 29.4
Pit Latrine with
Ventilation Pipe 4.3 5.9 4.8 3.3 6.0 5.9 6.3 7.1
Covered Pit Latrine
without Ventilation 3.2 3.9 0.8 1.2 3.0 2.2 1.8 6.5
Uncovered Pit
Latrine without
Ventilation Pipe
1.8 4.2 0.6 0.5 7.9 0.9 0.5 7.1
Bucket Toilet 1.8 1.8 0.7 2.4 1.4 2.5 1.4 1.9
No Toilet 48.6 67.0 87.5 86.9 78.7 81.4 88.2 47.4
Other 0.7 0.5 1.0 0.4 0.4 0.2 0.3 0.6
(NSA, 2011 Population and Housing Census Preliminary Results, 2012), (NSA, 2011 Population and Housing Census. Kavango
East Regional Tables based on 4th Delimitation, 2014 (b))
Table 29 indicates that refuse removal is also an area of concern in the Kavango East
Region with the collection of garbage being significantly below average and seems to
only be collected in the Rundu Urban Constituency. The Rundu Urban Constituency (25%)
also has the highest level of households that dispose of the garbage at a rubbish pit. By
far the most used method of garbage disposal is burning (60%), which has both health
and environmental consequences. With the exception of the Rundu Urban Constituency,
more than 70% of households in the remaining Constituencies burn their refuse, with the
highest levels found in the Ndiyona Constituency. While dumping of refuse is less of a
problem in the Ndiyona (1.9%), Mukwe (4.6%) and Ndonga Linena (6.7%) Constituencies,

91
dumping levels are above average (8.9%) in the Mashare (18.2%), Rundu Rural (18.2%)
and Rundu Urban (13.7%) constituencies.
Table 29: Kavango East Percent Households by Type of Garbage Disposal.
% Households Namibia Kavango East
Region Mashare Mukwe Ndiyona
Ndonga
Linena
Rundu
Rural
Rundu
Urban
Regularly
Collected 37.2 10.8 1.6 3.3 1.5 0.2 0.5 20.4
Irregularly
Collected 5.2 2.0 0.2 1.8 0.1 3.2 2.1 2.5
Burning 37.8 60.1 72.9 83.8 90.6 84.6 76.5 37.2
Dumping 8.9 11.3 18.2 4.6 1.9 6.7 18.2 13.7
Rubbish Pit 9.5 14.9 7.0 5.5 5.4 5.7 2.7 25.1
Other 1.4 0.8 0.2 1.1 0.6 0.4 0.0 1.1
(NSA, 2011 Population and Housing Census Main Report, 2013 (b)), (NSA, 2011 Population and Housing Census. Kavango East
Regional Tables based on 4th Delimitation, 2014 (b))
3.3.4 TELECOMMUNICATION
Data regarding the access of the population to different types of information and
communication technology (ICT) is not yet available for the Kavango East Region, but has
been reported for the former Kavango Region and is compared with the national data in
Table 30. The residents in the former Kavango Region had below average access to all
the recorded types of ICT, including radio and newspapers. On both the national and
regional levels, people residing in the rural areas have less access to ICT. Considering the
more modern technologies, only 3.6% of residents in the region had access to a computer,
compared to 10.5% nationally. While more than half of Namibians have cell phones, only
31% of people in the former Kavango Region do. As computers and cell phones are used
to access the internet, internet access in the former Kavango Region was also very low
with less than 3% of residents having daily or weekly access to internet, compared to 8.8%
nationally. While a quarter of Namibians read the newspaper on a daily or weekly basis,
only 8% did so in the former Kavango Region. ICT is, consequently, also not a significant
field of employment with only 0.5% of the employed population listing it as their main
industry of employment.

92
Table 30: Former Kavango Region: Percentage Population with Access to ICT, 2011
% of
Population Radio TV Computer
Cell
phone
Telephone
(fixed)
Newspaper (daily
and weekly)
Internet (daily
and weekly)
Namibia 68.6 36.7 10.5 52.6 6.4 25.1 8.8
Urban 74 67.1 21.2 68.6 12.2 44.7 17
Rural 64.5 13.8 2.5 40.6 2 10.4 2.5
Kavango 56.9 21.9 3.6 31.2 1.6 7.9 2.7
Urban 64 52.7 9.4 50.8 3.2 19.4 6.5
Rural 54.1 9.5 1.3 23.3 0.9 3.3 1.3
(NSA, 2011 Census: Kavango Regional Profile, 2014 (a))
Considering the ICT infrastructure, most of the towns in the Kavango are linked by
telephone, although the majority of rural settlements do not have access to
telecommunication services or support infrastructure. Rural clinics and schools seldom
have telephones, and communication with headquarters is extremely difficult. In recent
years the condition has improved though, with most towns and villages along the major
road axes being linked to an automatic system. MTC (Mobile Telecommunications) is
currently the only mobile network service provider in the Kavango East Region, although
coverage is mainly along the Trans-Caprivi Highway (B8) and limited in the rural areas, as
shown in Figure 35. The telecommunication in the Kavango East Region is supplemented
by NamPost and private courier services like Parcel Force and Formula Courier Services.
Figure 35: Kavango East MTC Coverage

93
3.4 INSTITUTIONAL SERVICES SECTOR
3.4.1 FINANCIAL SERVICES
There are four main banks operating in the town of Rundu: Bank Windhoek, First National
Bank, Standard Bank and NamPost. The rest of the Kavango East Region only has banking
access via the use of ATMs, while NamPost also functions as a bank in some localities (KRC
Personal Communication, 2014).
3.4.2 SOCIAL SUPPORT ORGANISATIONS
Churches play a very important role in the lives of all communities and provide valuable
moral and social support. According to the Kavango Poverty Profile, a number of
institutions are organised around HIV/AIDS support. The Namibia NGO Forum (NANGOF)
listed the support organisations that offer HIV/AIDS support in operating in the Kavango
East Region in Table 31. While all of the organisations are based in the Kavango East they
often operate in both Kavango Regions, as is the case with the Namibia Red Cross Society
and Lifeline/Childline.(NPC, Regional Poverty Profile for Kavango Region, 2006)
Finally, the Constituency Councillors play an important role in community support and the
communication of information. However, according to the Kavango Regional Poverty
Profile, the frequency of Councillor-visits that decreased after election campaigns were
held, was listed as a concern. Another problem mentioned was the lack of feedback
provided regarding problems reported to the Councillor, although this is often the result of
headmen not feeding information through to villagers in general (NPC, Regional Poverty Profile for
Kavango Region, 2006).

94
Table 31: Kavango East HIV/AIDS Support Organisations
Name of Organization Physical address Services provided
Life Line / Child line
Kehemu New start
building
Voluntary Counselling & Testing
Gender division
CAFO
(Church Alliance For
Orphans)
Rundu Urban
Constituency Officer
Orphans and Vulnerable Children, provision of grants to
projects, school fees, kids clubs and psychosocial
support
Project Hope
ERF no: 883 Tutungeni
Location
Rundu
Peer Education and Transactional Sex, BCC, Adherence
& retention
UMYA (United
Methodist Youth
Action)
MCHIP
Rundu Home Based Care, BCC, Spiritual counselling, HIV
awareness
Social for Family
Health Donkerhoek Rundu
HIV/AIDS and Malaria prevention and Behaviour
Change Communication
Youth 2 Youth
Maria Mwengere
environmental & Cultural
Centre
HIV/AIDS prevention, Aids clubs at schools, couple
counselling, PEP, reproductive health & interpersonal
communication
TCE
(Total Control for
Epidemic) DAPP
Tutungeni
Rundu
HIV/AIDS and Malaria Prevention
(condom distribution, training to support groups, male
clubs, WPP, nutritional support to clubs, peer education,
youth festivals)
CAA
( Catholic AIDS
Action)
Ekongoro Road Rundu
Home Based Care and Orphans and Vulnerable
Children, psychosocial, physical, educational support to
clients and caregivers, PMTCT referrals.
Sharonda Mpandi
Support Group Nyangana Drama and group facilitation on HIV/AIDS
Twayapa Shotuyowe
Support Group Andara Stigma and Discrimination for People Living with HIV
MUYODA
(Mukwe Youth
Development
Association)
Divundu,
Mukwe District
Frans Dimbare Youth
Centre
Home Based Care and HIV/AIDS prevention
Namibia Red Cross
Society Rundu
Orphans and Vulnerable Children and Home Based
Care
WAD Community
Voice
(Women Action for
Development)
Kehemu Community hall Condom Promotion and Education, couple counselling,
alcohol and drug abuse, and domestic violence.
Nyangana New Start Nyangana VCT
NAPPA (YAM Group) Rundu HIV Prevention, awareness raising on HIV, Abortion and
reproductive issues
Score Namibia Rundu
Andara New Start Andara VCT etc.

95
4 REGIONAL AND LOCAL GOVERNMENT
4.1 THE CONSTITUENCIES
The Kavango East Region covers an area of 23 983.2 km2 and constitutes about 2.9% of
Namibia’s extent. There are 6 Constituencies in the Kavango East Region; Rundu Urban,
Rundu Rural, Mashare, Ndonga Linena, Ndiyona and Mukwe. Rundu is the capital of the
Region. This section provides a brief profile of each of the six constituencies.
Figure 36: Locality of Constituencies
4.2 Rundu Urban
4.2.1 INTRODUCTION
The Rundu Urban Constituency is located in the extreme north-western corner of the
Region and basically consists of the town of Rundu. Rundu is the second largest urban
area in Namibia if defined in terms of its population.

96
4.2.2 SIZE, LOCATION AND POPULATION
The constituency is 155.8 km2 in extent and had a population of 63,431 in 2011 at a mean
density of 407 persons per km2. It is estimated that the population in the constituency grew
at a rate of 3.6% between 2001 and 2011.
4.2.3 ECONOMIC ACTIVITIES
Rundu is the economic mainstay of the region and approximately 80% of all non-
agricultural economic activity takes place in Rundu. There are three open markets in the
constituency namely the Rundu, Kehemu and Sauyemwa Open Markets. There is also an
SME park, the enormous Fresh Produce Business Hub and the new Community Convention
Centre. There are about 200 formal business units covering about 47 000m2 of floor space
in the town. There are four commercial banks, public and private medical services and
several accommodation and conference facilities.
Being the capital of the region, one also finds a number of regional ministerial offices and
other agencies in the constituency while there are also 5 filling stations and the Rundu
Airport. In total there are about 550 service industry entrepreneurs in Rundu. Of the 131
manufacturing entities in the former Kavango Region, most are found in Rundu.
Although the constituency is dominated by Rundu, there are some agricultural activity
taking place and the Vungu-Vungu Agricultural Project is located within the constituency.
This project is mainly related to dairy farming as well as irrigated crop production.
Tourism plays an important role in the economy and there are 12 tourist establishments in
and around the town. These are Tambuti Lodge, Kavango River Lodge, Omashare Lodge,
Ngandu Lodge, Sarasungu, 4 Seasons Valley lodge, Bavaria House, Greenhouse, Sisindi,
Dala Darlings Cottage, Agro Guest House and Frank Stone Guest House. Tourism activities
relate to shopping (for the large number of shopping tourists visiting Rundu) to bird
watching, game viewing, fishing and general scenes and vistas of the Kavango River.
Rundu has substantial potential for further development and it is important that suitably
serviced and zoned land is always available for investors if and when it is required. The
Town is also strategically located on the Trans Caprivi Highway and could be developed
as a logistics hub which could potentially attract more business to the constituency.

97
4.2.4 INFRASTRUCTURE AND SOCIAL SERVICES
Being largely an urban area, Rundu is well provided with access from east, west and south
via well constructed and maintained main roads. Internally accessibility is also good with
the required urban roads in place to ensure adequate access to individual lots. The
constituency is also well provided with water and electrical power with most inhabitants
able to receive power and water connections if they so wish. A high 97% of the population
in the constituency has safe water but sanitation is more of a challenge with a high 47.4%
of households being without a toilet facility. This is perhaps mostly due to the informal
areas in Rundu that are not yet connected to the utility services of the town.
The entire constituency is covered with telecommunication and mobile telecom services
while the police headquarters for the region and the magistrate court is also located in
the constituency.
There are 3 hospitals, 30 clinics and one health centre in the Kavango East Region. Of
these, one hospital and six clinics are found in the Rundu Urban Constituency. In terms of
education facilities, Kavango East Region has 116 primary schools, 24 combined schools
and 13 secondary schools. It is not known how many of these are found in the Rundu
Urban Constituency.
Higher education institutions in the Rundu Urban Constituency include the Rundu
Vocational Training Centre, Community Skills Development Centre, the Triumphant
College, the Institute for Open Learning, the Namibian College for Open Learning and the
University of Namibia.

98
4.2.5 POTENTIAL AREAS OF INVESTMENT
Sector Areas of Investment
Agriculture and Agro
Processing
Abattoir
Dairy Farming
Leather and Tannery
Manufacturing Food products
Textiles
Construction
Furniture
Trade Increased variety of retail offerings
Serving the farming industry
Serving the construction industry
Services Truck port
Technical services (car maintenance, cooling,
plumbing etc.)
Property development
Tourism Rundu Waterfront
Tourism Information Centre
High Standard Restaurant
High Standard Tourist Accommodation
4.3 Rundu Rural
4.3.1 INTRODUCTION
The Rundu Rural Constituency is located in the extreme north-western corner of the Region
just to the south and east of the Rundu Urban constituency.
4.3.2 SIZE, LOCATION AND POPULATION
The constituency is 1,068.7 km2 in extent and had a population of 9,381 in 2011 at a mean
density of 8.78 persons per km2. It is estimated that the population in the constituency
grew at a rate of 1.4% between 2001 and 2011.

99
4.3.3 ECONOMIC ACTIVITIES
The Rundu Rural Constituency has little economic activity. It is overshadowed by Rundu,
yet offers substantial development opportunities related to the main road and the river.
The economy of the constituency is mostly built on subsistence farming consisting of crop
production and livestock rearing. Forest products also seem important and there are three
registered community forests namely Likwaterera, Cuma and Ncaute community forests.
Part of the emerging Kapinga Kamwalye also falls within the boundaries of the
constituency. In terms of wildlife and tourism, the Kavango River offers some opportunities
but there is only one tourist establishment namely Kaisosi Lodge in the constituency.
4.3.4 INFRASTRUCTURE AND SOCIAL SERVICES
The constituency is reasonable accessible with the Trans Caprivi Highway and district
roads D3447, D3448, D3424 and D3401 traverse the constituency and provide reasonable
access.
Electricity distribution, like in the rest of the region is poor and mainly found along the river
and the Trans Caprivi Highway. In the Rundu Rural constituency, electricity provision is
limited to the north of the Trans Caprivi Highway with no distribution to the south of that
road.
There is a NamWater bulk water supply scheme at Kayengona which provides water
along the river and main road and a number of rural water supply points in the southern
part of the region. As an indicator of water supply, only 64.6% of households were found to
have safe water in 2011.
Sanitation in Namibia in general is a challenge and the same is true for this constituency
where 88.2% of households do not have access to a toilet.
With respect to telecommunication services, the constituency is well covered in the north
but there is no coverage in some of the southern parts of the constituency.
The provision of schools, like in the rest of the region follows the population distribution with
high densities close to the river and road and very little in the rural areas. There are 2 clinics

100
and a medical outreach post in the constituency but some parts are not covered
adequately.
4.3.5 POTENTIAL AREAS OF INVESTMENT
Sector Areas of Investment
Agriculture and Agro
Processing
Dairy Farming
Intensive small scale Irrigated Horticulture
Crop production
Exotic cultivated products
Forestry Timber harvesting and partial processing
Thatching Grass
Services Technical services (car maintenance, cooling,
plumbing etc.)
Tourism High end Lodge or two
4.4 Mashare
4.4.1 INTRODUCTION
The Mashare Constituency is located in the west of the Region and covers virtually the
entire western part of the region with the exception of the small Rundu Urban and Rundu
Rural Constituencies.
4.4.2 SIZE, LOCATION AND POPULATION
The constituency is 9,140.2 km2 in extent and had a population of 15,688 in 2011 at a mean
density of 1.7 persons per km2. It is estimated that the population in the constituency
declined at a rate of 0.2% per annum between 2001 and 2011.
4.4.3 ECONOMIC ACTIVITIES
The economy of the Mashare Constituency is mostly built on subsistence farming consisting
of crop production and livestock rearing. In terms of conservation and community based

101
natural resource management, the constituency has the Joseph Mbanbangandu
communal conservancy, the Hans Kanyinga community forest and the Kapinga
Kamwalye emerging conservancy.
The Mashare Green Scheme project as well as the Mashare Agricultural Development
Institute are located in the constituency and provide practical training to small scale
irrigation farmers.
The constituency is also characterised by a large number of SSCFs, most of which are
gazetted but with some that remains to be gazetted. These SSCFs are located in the
southern part of the constituency and suffers from poor accessibility and lack of services.
The process of developing these into more viable entities should commence soon.
There are only two tourist establishments in the constituency namely N’Kwasi Lodge and
Mbamba Community Camp.
4.4.4 INFRASTRUCTURE AND SOCIAL SERVICES
The northern part of the constituency is reasonably accessible with the Trans Caprivi
Highway and district roads D3447 and D3400 traverse the northern part of the
constituency and provide reasonable access. However, the southern part of the
constituency has very little access and it is also here that the SSCFs are located.
Electricity distribution, like in the rest of the region is poor and mainly found along the river
and the Trans Caprivi Highway. In the Mashare constituency, electricity provision is limited
to the north of the Trans Caprivi Highway with no distribution to the south of that road.
There are three NamWater bulk water supply scheme at and around Mashare which
provides water to the irrigation scheme and a pipeline along the river and main road. A
number of rural water supply points are found in the southern part of the region but the
densities are low. As an indicator of water supply, only 59.4% of households were found to
have safe water in 2011.
Sanitation in Namibia in general is a challenge and the same is true for this constituency
where 87.5% of households do not have access to a toilet.

102
With respect to telecommunication services, the constituency is poorly served with signal
only found in the northern parts while there is no coverage in the central and southern
parts of the constituency.
The provision of schools, like in the rest of the region follows the population distribution with
high densities close to the river and road and very little in the southern rural areas. There
are 5 clinics and a health centre in the constituency but large parts of the constituency (in
the central and south) has no health services in close proximity.
4.4.5 POTENTIAL AREAS OF INVESTMENT
Sector Areas of Investment
Agriculture and Agro
Processing
Dairy at Mashare
Intensive small scale Irrigated Horticulture
Exotic cultivated products
Cultivated fruits
Processing agricultural produce
Urban Development Consider the development of a rural service centre at
Mashare
Manufacturing Food
Trade Development of retail shops for local demand
Agriculture related retail products
Services Transport
Technical services (car maintenance, cooling,
plumbing etc.)
Tourism High Standard Lodges utilising the biodiversity of the
area
Cultural tourism experience

103
4.5 Ndonga Linena
4.5.1 INTRODUCTION
The Ndonga Linena Constituency is located in the central part of the Region in a long strip
traversing the region from north to south. The constituency was sub-divided from the
previous Ndiyona Constituency during the 2013 delineation.
4.5.2 SIZE, LOCATION AND POPULATION
The constituency is 2,850.6 km2 in extent and had a population of 11,082 in 2011 at a mean
density of 3.89 persons per km2. Being divided from the Ndiyona Constituency, specific
figures for this area is not available but it is estimated that the population in the
constituency grew at a rate of 0.6% per annum between 2001 and 2011.
4.5.3 ECONOMIC ACTIVITIES
The economy of the Ndonga Linena Constituency is mostly built on the Ndonga Linena
and Shitemo irrigation projects close to the river and subsistence farming consisting of
crop production and livestock rearing in the reminder of the constituency. In terms of
conservation and community based natural resource management, the constituency
shares the Hans Kanyinga community forest with the Mashare Constituency but has no
other conservancies of community managed natural resource areas.
The constituency is also characterised by some SSCFs, most of which are gazetted but with
some that remains to be gazetted. These SSCFs are located in the central and southern
part of the constituency and suffers from poor accessibility and lack of services.
Shankara Rest Camp is the only tourist establishments in the constituency.
4.5.4 INFRASTRUCTURE AND SOCIAL SERVICES
The northern part of this constituency is also reasonably accessible with the Trans Caprivi
Highway but the southern part of the constituency has only one access road and it is also
here that the SSCFs are located.

104
Electricity distribution, like in the rest of the region is poor and mainly found along the river
and the Trans Caprivi Highway. In the Ndonga Linena constituency, electricity provision is
limited to the north of the Trans Caprivi Highway with no distribution to the south of that
road.
There is one NamWater bulk water supply scheme close to Ndiyona. A number of rural
water supply points are found in the southern part of the region but the densities are low.
As an indicator of water supply, only 44.3% of households were found to have safe water
in 2011.
Sanitation in Namibia in general is a challenge and the same is true for this constituency
where 81.4% of households do not have access to a toilet.
With respect to telecommunication services, the constituency is poorly served with signal
only found in the northern parts while there is no coverage in the central and southern
parts of the constituency.
The provision of schools, like in the rest of the region follows the population distribution with
high densities close to the river and road and very little in the southern rural areas. The
constituency is served with a hospital close to Ndiyona and three clinics. All of these are
found next to the river and there are none in the remainder of the constituency.
4.5.5 POTENTIAL AREAS OF INVESTMENT
Sector Areas of Investment
Agriculture and Agro
Processing
Green Scheme Expansion
Intensive small scale Irrigated Horticulture
Cultivated fruits
Processing agricultural produce
Manufacturing Food
Services Transport
Technical services related to the irrigation sector
Tourism High Standard Lodges utilising the biodiversity of the
area
105
4.6 Ndiyona
4.6.1 INTRODUCTION
The Ndiyona Constituency is located in the central eastern part of the Region in a long
strip traversing the region from north to south. The constituency was divided from the
previous Ndiyona Constituency during the 2012 delineation and consists of the eastern
part of the former Ndiyona Constituency.
4.6.2 SIZE, LOCATION AND POPULATION
The constituency is 5,230.95 km2 in extent and had a population of 9,551 in 2011 at a mean
density of 1.82 persons per km2. Being divided from the Ndiyona Constituency, specific
figures for this area is not available but it is estimated that the population in the
constituency grew at a rate of 0.6% per annum between 2001 and 2011.
4.6.3 ECONOMIC ACTIVITIES
The economy of the Ndiyona Constituency is mostly related to tourism and conservation
as well as subsistence farming consisting of crop production and livestock rearing. In terms
of conservation and community based natural resource management, the constituency
accommodates the Khaudum National Park, the George Mukoya Conservancy and
Community Forest and the Muduva Nyangana Conservancy and Community Forest.
There are five tourist establishments in the constituency namely the Kavango Busch Camp,
Shamvura Camp, Camp Ndurukoro and Nhuma Safari Camp.
The constituency has only two non-gazetted SSCFs located in the northern part of the
constituency.
The Ndiyona settlement provides basic services to people in the constituency and should
be considered to be developed as a local service centre.
4.6.4 INFRASTRUCTURE AND SOCIAL SERVICES
Like its neighbours, the northern part of this constituency is also reasonably accessible with
the Trans Caprivi Highway traversing it, but the southern part of the constituency has poor
access with only one road going down to the Khaudum. However, some new roads are

106
planned which will improve access in the area to the south of the Trans Caprivi Highway
and north of the Khaudum National Park.
Electricity distribution in the constituency is better than in the neighbouring Ndonga Linena
with the main distribution lines found along the river and the Trans Caprivi Highway, but
with more distribution lines to the south of that road linking some villages and terminating
at Ncame.
There are two NamWater bulk water supply schemes, one at Ndiyona and the other to the
east of Ndiyona settlement. A number of rural water supply points are found in the part of
the region between the Khaudum National Park and the main road but the densities are
low. As an indicator of water supply, only 42.3% of households were found to have safe
water in 2011.
Sanitation in Namibia in general is a challenge and the same is true for this constituency
where 78.7% of households do not have access to a toilet.
With respect to telecommunication services, the constituency is fairly well served with
signal found in the northern parts while there is no coverage in Khaudum National Park.
The provision of schools, like in the rest of the region follows the population distribution with
high densities close to the river and road and very little in the southern rural areas. The
constituency is served with a hospital close to Ndiyona and three clinics. Two of these
clinics are found next to the river and the other close to Ncame, halfway to the Khaudum
National Park.

107
4.6.5 POTENTIAL AREAS OF INVESTMENT
Sector Areas of Investment
Agriculture and Agro
Processing
Intensive small scale Irrigated Horticulture
Exotic cultivated products
Cultivated fruits
Processing agricultural produce
Forestry Timber harvesting and partial processing
Thatching Grass
Urban Development Development of Ndiyona as local service centre
Manufacturing Food
Furniture
Trade Development of retail shops for local demand at
Ndiyona
Agriculture related retail products at Ndiyona
Services Transport
Technical services (car maintenance, cooling,
plumbing etc.)
Services for the tourism industry
Tourism High Standard Lodges utilising the biodiversity of the
area
Cultural tourism

108
4.7 Mukwe
4.7.1 INTRODUCTION
The Mukwe Constituency is located in the eastern part of the Region in the form of a long
east to west strip.
4.7.2 SIZE, LOCATION AND POPULATION
The constituency is 5,537.02 km2 in extent and had a population of 27,690 in 2011 at a
mean density of 5 persons per km2. It is estimated that the population in the constituency
grew at a rate of 0.2% per annum between 2001 and 2011.
4.7.3 ECONOMIC ACTIVITIES
The economy of the Mukwe Constituency is mostly built on Tourism and subsistence
farming consisting of crop production and livestock rearing. In terms of conservation and
community based natural resource management, the constituency has the Popa Falls
Game Park, Bwabwata National Park, Bwabwata-Okavango Ramsar Site, part of the
Muduva Nyangana Conservancy, Shamungwa Conservancy, the emerging Shamungwa
Community Forest and the Kamutjonga emerging conservancy.
The Shadikongoro Green Scheme project as well as the Korova Fish Farm and a Prison
Agricultural project are located in the constituency. The Kamutjonga Inland Fisheries
Institute is further found in the constituency as well as the private Kangango Stone Quarry.
The constituency is also characterised by some 21 SSCFs, most of which are gazetted but
with a few that remains to be gazetted. These SSCFs are also located deep in the bush
and suffers from poor accessibility and lack of services.
Tourism plays a substantial role in the constituency and there are 12 tourist establishments
within its boundaries. These are Mobola Lodge, Riverdance Lodge, Divundu Guest House,
Popa Camp, Shamvetu Lodge, Divava Lodge, Rainbow Lodge, Nunda Lodge, Ndhovu
Lodge, Mahangu Lodge, Ngepi Camp and N/Goabaca Community Camp Site.

109
4.7.4 INFRASTRUCTURE AND SOCIAL SERVICES
Being a narrow strip of about 30 – 35km wide and with the Trans Caprivi Highway splitting it
in the middle, the constituency generally has better access that the neighbouring
constituencies. In the western part of the constituency to the south of the main road, some
new roads are planned which will improve access in the area to the south of the Trans
Caprivi Highway.
Electricity distribution in the constituency is poor with the main distribution lines found
along the river and the Trans Caprivi Highway.
There are four NamWater bulk water supply schemes, one at Mukwe, one to the west of
Mukwe, one at Divundu and one at Omega. A number of rural water supply points are
found in the western part of the constituency while the density of rural water supply points
to the east of Divundu is very low. As an indicator of water supply, only 40.7% of
households were found to have safe water in 2011. In the Mukwe Constituency, 86.9% of
households do not have access to a toilet and this provides an indication of the need in
this sector.
With respect to telecommunication services, the constituency is well served with mobile
2G signal found in the entire constituency.
The provision of schools in the constituency is fairly good with schools distributed in such a
way that no part to the west of Divundu is further than 10km from a school. The
constituency is further served with a hospital at Mukwe and ten clinics. Eight of these
clinics are found next to the river, one at Omega and the other to the south of Mukwe.

110
4.7.5 POTENTIAL AREAS OF INVESTMENT
Sector Areas of Investment
Agriculture and Agro
Processing
Intensive small scale Irrigated Horticulture
Exotic cultivated products
Cultivated fruits
Processing agricultural produce
Forestry Timber harvesting and partial processing
Thatching Grass
Urban Development Development of Divundu as regional service centre
Manufacturing Food
Furniture
Trade Development of retail shops for local demand
Agriculture related retail products
Arts and crafts
Services Transport
Technical services (car maintenance, cooling,
plumbing etc.)
Services for the tourism industry
Tourism High Standard Lodges utilising the biodiversity of the
area
Cultural tourism, especially with the San people.

111
5 CHALLENGES AND OPPORTUNITIES
The Kavango East Region has always been the part of the former Kavango Region where
the most development took place and to where the most money for development was
allocated by both the private and the public sector. However, with a large rural
population spread over a large area, it will always be difficult and costly to provide
services to people in the rural areas who live far apart in individual homesteads or in small
villages. The unit costs for example, to take electricity to 50 houses located some 40km
from the nearest power line will invariably be substantially higher per unit than it will be to
electrify 50 households in Rundu. The same holds true for water, roads, sanitation and
other social services such as schools and clinics. However, the provision of these kinds of
services is the responsibility of the Government and it can be expected that it will continue
to be supplied at a steady albeit slow pace.
Development generally follows infrastructure, be it roads or water or electricity or even
other large scale projects such as the Green Scheme. Government has, since
independence, already achieved much to provide infrastructure which is required to
stimulate and motivate people and investors to identify and make use of development
opportunities available in the region.
This section is aimed at providing a summary of the development challenges (which
mostly need to be attended to by the government through the regional council) as well
as the opportunities and advantages which can be exploited by both the public and the
private sector to create employment and bring much needed development to the
region.
5.1 AGRICULTURAL POTENTIAL AND CHALLENGES
The agricultural sector in Kavango East is one of the most important sectors both in terms
of food security as well as job creation and latent opportunity. The Green Scheme is an
important factor in this regard and can be further expanded to increase this potential.

112
Opportunities in this sector include:
The varied and extensive biodiversity of the region which allows for a wide range of
different agricultural products to be cultivated and processed for value addition
and expansion of the manufacturing sector.
The existence of the Kavango River which creates the opportunity to expand the
Green Scheme or irrigation projects along the river, especially if high value crops
are cultivated rather than staple foods. The river also provides opportunities for
freshwater fishing and aquaculture.
The creation of the Fresh Produce Hub at Rundu, which will create access for
farmers to training, cold storage and marketing infrastructure.
The existence of a number of species of indigenous products, which can be utilised
for value addition and commercialisation.
The existence of forests and emerging conservancies, which can be processed to
expand the manufacturing sector.
There is the opportunity to transform rural farming in the area to market orientated
businesses, however this requires longer term actions including training and
mentoring to increase competitive business.
Developing an abattoir in Rundu (plans currently exist for this activity for Rundu
town).
Despite these opportunities, challenges within this sector exist which need to be addressed
so that opportunities can be unlocked. These include the challenges of the “Red Line”
and the restriction this places on the trade of livestock with the rest of Namibia, the
traditional livestock ownership patterns, which often results in farmers unwilling to sell or
trade in livestock, the difficulty in gaining ownership of land for communal farmers which in
turn results in the difficulties in farmers accessing financial assistance and loans, the lack of
infrastructure on SSCFs, particularly those further inland from the Kavango River, conflicts
over land uses, particularly between conservation activities and traditional farming
(human wildlife conflict), poor soils and lack of access to markets, the over utilised fishing
sector and the timber ban.

113
5.2 MINING POTENTIAL AND CHALLENGES
There is very little potential for mining in the Kavango East region, with the greatest
opportunity being for sand mining. This activity however is largely unregulated. The only
commercial utilisation of minerals in the region is a private stone quarry in the Mukwe
Constituency. There is also limited potential around clay deposits which exist and which
could be utilised for manufacturing into sundried and burnt bricks and thus the potential
for a clay brick factory could be investigated for the region.
5.3 MANUFACTURING POTENTIAL AND CHALLENGES
Although manufacturing is not very well diversified in the Kavango East region, there are
opportunities to add value, particularly to the primary sector with regards to agricultural
products that are produced in the region. This could increase job creation within the
region. The SME Park at Rundu promotes manufacturing but this needs to be expanded to
replace manufactured goods that are imported from other parts of Namibia and
overseas. The wood harvesting ban also needs to be eliminated so that the timber
industry, which holds a lot of potential, can be developed.
5.4 RETAIL AND WHOLESALE POTENTIAL AND CHALLENGES
The Kavango East Region is strategic located in terms of interregional trade and these
opportunities need to be expanded, particularly links to countries such as Botswana,
Zambia and Angola. There is also the opportunity to develop more specialised retailers,
particularly within sectors of opportunity such as agricultural implements and equipment.
Divundu (upgraded to Town status) and Ndiyona (upgraded to village status) have been
earmarked for upgrading of settlement status which will create opportunities for trade
growth and development in these areas. It is expected that Rundu will continue to grow,
particularly in light of the new proposed bridge (linking the town to Angola) as well as the
Trans-Zambezi Railway link, which should further increase opportunities for trade.
Despite these opportunities, the entrepreneurial spirit is lacking to a large extent in
businesses and therefore changing market conditions are not optimised. Improvement of
the organisation and cooperation between businesses is required as well as with public
institutions. Further training and mentorship of businesses is also required.

114
5.5 SERVICES SECTOR POTENTIAL AND CHALLENGES
There are a number of opportunities pertaining to services in Rundu (regional support)
which can be expanded on and the proposed increase in growth in Divundu will also
make it an increasingly important node in terms of service delivery, especially to the
various tourism establishments in the area. Despite these opportunities, the services sector
lacks specialisation, which has resulted in limited employment opportunities. Although the
Fresh Produce Business Hub which has been developed in Rundu will include processing, it
will mainly function as a service centre, which will create opportunities for the region.
5.6 TOURISM POTENTIAL AND CHALLENGES
Tourism has high potential to increase economic opportunities for Kavango East. The
diversity of the region creates the opportunity to create unique opportunities for local and
international tourists. The bridge connection proposed to link Rundu with Angola should
increase opportunities for shopping tourists. Opportunities to expand shopping facilities in
Divundu also exist.
The opportunity to increase communal conservancies and wildlife corridors in the eastern
part of Kavango East will in turn increase the tourism potential of this region, especially
around the Cuito to Divundu tourism node. There is also the opportunity for SSCF farmers in
the Khaudum –SSCF node to expand into tourism activities (lodges, rest camps, hunting
lodges and trophy hunting). There is also opportunity to expand tourism activities at the
Bwabwata and Khaudum National Parks, with a focus on cultural tourism, 4X4 off road
adventures, trophy hunting, scenic landscapes and wildlife viewing.
The Ramsar site has a lot of tourism potential and the expansion of this site up to Mukwe (in
phases) will increase this tourism potential for the general region.
There is the opportunity to create craft markets on the main tourism routes of Divundu and
Rundu. There is also the opportunity to create and promote restaurants and
accommodation establishments along the Kavango River and in Rundu. These however
should be of an international standard.

115
Despite the opportunities for the tourism sector, there are challenges around infrastructure
and improved signage is required as well as a tourist information centre in either Rundu or
Divundu.
5.7 HUMAN RESOURCE POTENTIAL AND CHALLENGES
Between 65% and 85% of the rural population in the region lives off the land, either
through subsistence farming or working on subsistence farms. This comprises 43% of the
total population! Only in Towns and Settlements and at Green Schemes does one find
substantial employment. Skill levels are generally low and this makes meaningful
employment creation difficult. If manufacturing and processing should become one of
the key drivers in the economy, it will need to be augmented with substantial
improvements of skills in the region. However, skill levels in the region are improving, but it
does unfortunately take time for a population to improve skill levels to a point where it will
support the manufacturing and value addition sectors. Education and vocational training
is therefore a major challenge in the region.
5.8 PHYSICAL INFRASTRUCTURE
The Trans Caprivi Highway is of great benefit for the Kavango East Region with regard to
access to local and foreign markets and for tourism. Local and urban road infrastructure
on the other hand is poorly developed and this hampers development and service
provision in outlying areas. All the other types of infrastructure such as water and electricity
is well provided next to the river but poorly provided in the rest of the region. There are,
however, master plans in place that prioritised the development of electricity, water and
roads in the region and these must be religiously implemented.
ICT connectivity and electricity normally plays a huge role in human development and
skills development through the effective transfer of information and the ability to provide
conducive conditions for children to study. In the case of the Kavango East Region, this
should be made a priority.
Solar Power projects and small off-grid solar systems could be investigated to supply
electricity for lighting in the deep rural area and especially at schools, hostels and clinics.
However this should always be coordinated with the existing rural electrification
programme.

116
Coordination between service provision and other development projects is also important
and it is imperative that all the various stakeholders work together when planning is done
to combine various needs and objectives into one project. For example, access to the
Khaudum National Park can also provide access to some rural villages and schools
without the need to build separate roads.
5.9 RUNDU
Rundu is a primate urban area in the Kavango East Region and the second largest urban
area in Namibia (in terms of population size). Rundu is well established as a regional centre
and already attracts business and traders from all over the region as well as from other
regions such as Kavango West and even further afield such as Angola, Zambezi and
Zambia. However, Rundu is still struggling to transform from a small formal town with large
informal settlements without services around it but substantial progress has been made
over the past few years and the provision of affordable housing and services is now one of
the key challenges. At the same time it is also an opportunity for investors and developers
to take on property development projects, even in partnership with the Rundu Town
Council.
Rundu is also the place where one finds most of the government ministries and it therefore
has the most salaried positions in the region. Growing and developing Rundu and creating
an investor friendly environment is probably the best opportunity to draw manufacturing,
retail, wholesale and agro processing enterprises into the region. The key to all of this from
an institutional perspective is to ensure that serviced land is available for both residential
and business purposes to attract investors. This should create substantial competitive
advantage over other towns and cities in Namibia, all of which face similar challenges.
5.10 SOCIAL DEVELOPMENT PROJECTS
Many Rural and Gender Development projects have already been implemented in the
Region, but their efficiency is impeded by challenges, like the lack of markets, skills and
commitment. However, these projects are mainly aimed at poverty alleviation and as
such they play an important role. It can even be expected that a few of these initiatives
may grow even further to become viable business entities and contribute to regional
employment. The MURD undertook various rural development programmes between 2009
117
and 2014, including cash/food for work projects, income-generating projects, rural
employment schemes, food security and nutrition programmes and the One Region One
Initiative.
5.11 CONCLUSION
Existing resources such as land, water and good weather, which despite some limited
land use conflicts, can create the opportunity for growth in the agricultural sector as well
as economic activities within the larger towns (such as Rundu and Divundu). The further
development and growth of the agricultural sector presents further opportunities in terms
of high value agri-processing of locally produced products. There are also opportunities
for further tourism development along the river as well as recreational fishing and
commercial aquaculture through increased productivity of fish farms. Conservancy
formation further helps to ensure sustainability of land use for agriculture, wildlife and
tourism alike. There are currently four registered Communal Conservancies in the Kavango
East Region (Joseph Mbambangandu, Shamungwa, Muduva Nyangana, George
Mukoya) and two emerging conservancies (Kapinga Kamwalye Conservancy and
Kamutjonga Conservancy (Fishery))
The high level of Biodiversity in the region creates opportunities for tourism activities
(photography and hunting) as well as for development of Indigenous Natural Products.
The sustainable utilisation of the forestry resource linked with processing of wood and
furniture making provides particular opportunities. There are 8 registered (gazetted) and
emerging community forests in the Kavango East Region, although the Ncaute
community forest stretches across both the Kavango East and West Regions. Only the
Shamungwa community forest is still emerging.
The strategic location of the region on the Trans Caprivi Highway which links Walvis Bay to
the Region and countries beyond create opportunities for increased tourism, trade and
trade-related activities such as a logics hub.
Infrastructure along the river is well developed, linking the region intra-regionally. However,
the further inland one travels, the fewer infrastructure is provided and this will hamper
effective economic development in the more rural areas. A total of 10 new roads have

118
been planned for the Kavango East Region to connect schools and, in some cases,
clinics. The total length of the proposed new roads is 296km.
A policy of prioritisation is followed according to which 6 schools will be electrified in
2014/2015. A Total of 178 active water points were supplied and managed by the
Directorate of Rural Water Supply with another 57 new points being planned.
The conservation areas include the Popa, Bwabwata and Khaudum National Parks. The
Mahango area of Bwabwata, specifically, has the highest concentration of large
mammals as well as the greatest diversity of birds in Namibia and was declared as a
Ramsar Wetland of International Importance. These national parks provide opportunity for
development and employment creation through formal tourism. While tourist numbers are
still relatively low, the new four rivers route and other marketing programmes should be
used to avail information about the many attractions of the region and thereby increasing
the number of tourists visiting the region.
The Kavango East Region is highly urbanised with 47% of the population living in and
around the town of Rundu. There is also a high concentration of the population along the
Kavango River. Having the population concentrated in certain areas facilitates the
provision of services.

119
WORKS CITED
African Conservation Foundation. (2015). Kavango Zambezi Transfrontier Conservation
Area (KAZA TFCA). Retrieved December 2014, from African Conservation Foundation:
http://www.africanconservation.org/explorer/kavango-zambezi-transfrontier-
conservation-area-kaza-tfca
BiCon. (2008). The Oshhikoto, Oshana, Omusati, Ohangwena and Kavango Roads
Masterplan Revision, Volume 1, Final Report: . 2008: BiCon.
DECOSA. (2013). Preparation of the Local Economic Development Strategy for the
Kavango Region. Windhoek: KRC.
EmCon. (2010). Rural Electricity Distribution Master Plan for Namibia 2010. Kavango
Regional report. Windhoek: Emcon Group.
GRN. (2000, December 2000). No. 2456. Government Gazette , p. 4.
GRN. (1992, August 31). No. 469. GOVERNMENT GAZETTE , p. 2.
GRN. (1992, August 31). No. 470. Government Gazette , p. 43.
Hinz, M. (2008). Traditional courts in Namibia – part of the judiciary? In N. Horn, & A. (. Bösl,
The Independence of the Judiciary in Namibia. Windhoek: Macmillan.
KRC. (2014 ). Kavango Regional Council. Retrieved October 2014, from
http://www.kavangorc.com.na/
Mendelsohn, J. (2009). Land Use in Kavango: Past, Present and Future. Windhoek:
Research and Information Services of Namibia).
Mendelsohn, J. (2013). Rapid Survey of Farms in Kavango. Windhoek: MLR.
Mendelsohn, J., & el Obeid, S. (2006). A digest of information on key aspects of Kavango’s
geography and sustainable development prospects. Windhoek: Research and
Information Services of Namibia.

120
Mendelsohn, J., & el Obeid, S. (2003). Sand and Water. A Profile of the Kavango Region.
Windhoek: Research and Information Services of Namibia.
Mendelsohn, J., Jarvis, A., Roberts, C., & Robertson, T. (2002). Atlas of Namibia. A Portrait of
the Land and its People. Cape Town: David Philip Publishers.
MET. (2009). Bwabwata Mamili Mudumu Tourism Development Plan. Windhoek: Caprivi
Parks Consultants.
MET. (2014 (a)). Bwabwata National Park Profile. Retrieved November 2014, from
http://www.met.gov.na/Pages/Documents.aspx
MET. (2014 (b)). Khaudum National Park Profile. Retrieved November 2014, from Ministry of
Environment and Tourism: http://www.met.gov.na/Pages/Documents.aspx
MET. (2014 (c)). Popa falls Game Park Profile. Retrieved November 2014, from Ministry of
Environment and Tourism: http://www.met.gov.na/Pages/Documents.aspx
Ministry of Education. (2011). Education Management Information System (EMIS).
Windhoek: Ministry of Education, Namibia.
MLR. (2013 (a)). Draft Integrated Kavango Regional Land Use Plan. Volume I. Windhoek:
SPC, AHT, GEOCARTA & SAIEA.
MLR. (2013 (b)). Draft Integrated Kavango Regional Land Use Plan. Volume II. Windhoek:
SPC, AHT, GEOCARTA & SAIEA.
MLR. (2001). National Resettlement Policy. Windhoek: Ministry of Lands and Resettlement.
MME. (2010). Rural Electricity Distribution Master Plan for Namibia 2010. Kavango Regional
Report. Windhoek: Ministry of Mines and Energy.
MoHSS. (2011). Health Facility Census (HFC) 2009. Windhoek: MoHSS and ICF Macro.
MOHSS. (2012). Report on the 2012 National HIV Sentinel Survey. Windhoek: Directorate of
Special Programmes.

121
NACSO. (2011). Namibia's Communal Conservancies. A Review of Progess 2010.
Windhoek: Namibian Association of CBNRM Support Organisations).
NACSO. (2013 ). The State of Community Conservation in Namibia. A Review of
Community Conservancies, Community Forests and CBNRM Initiatives. Windhoek: NACSO.
Nakuta, J., & Chipepera, F. (2011). The Justice Sector and the Rule of Law in Namibia.
Management, Personnel and Access. Windhoek: John Meinert Printing.
National Planning Commission. (n/d). Namibia Poverty Mapping. Windhoek: National
Planning Commission.
NPC. (2004). 2001 Population and Housing Census. Kavango Region Basic Analysis with
Highlights. Windhoek: National Planning Commission.
NPC. (2003). 2001 Population and Housing Census. National report with Highlights.
Windhoek: NPC.
NPC. (2006). Regional Poverty Profile for Kavango Region. Windhoek: NPC.
NSA. (2014 (a)). 2011 Census: Kavango Regional Profile. Windhoek: National Statistics
Agency.
NSA. (2013 (b)). 2011 Population and Housing Census Main Report. National Planning
Commission.
NSA. (2012). 2011 Population and Housing Census Preliminary Results. National Planning
Commission.
NSA. (2014 (b)). 2011 Population and Housing Census. Kavango East Regional Tables
based on 4th Delimitation. Windhoek: Namibia Statistics Agency.
NSA. (2013 (a)). Namibia Labour Force Survey (LFS) 2012 Report. Windhoek: NSA.
NSA. (2013 (b)). Poverty Dynamics in Namibia. Windhoek.
NSA. (2012). Poverty Dynamics in Namibia. A Comparative Study Using the 1993/4, 2003/4
and 2009/10 NHIES Surveys. Windhoek: NSA.

122
RTC. (2006). Rundu Town Council. Retrieved October 2014, from
http://www.runducity.iway.na/
Southern Africa Institute for Environmental Management. (2014). Strategic Environmental
Assessment of the Kavango Integrated Regional Land Use Plan. Windhoek: Ministry of
Lands and Resettlement.
Tatem, A., Hemelaar, J., Gray, R., & Salemi, M. (2012, November 28). Spatial accessibility
and the spread of HIV-1 subtypes and recombinants. AIDS , pp. Volume 26 - Issue 18 - p
2351–2360.
The Meat Board. (Namibian Livestock Census 2012). 2013. Windhoek.
The Namibian. (2014, June 25). Nam not an upper middle income country - Pohamba.
Retrieved December 4, 2015, from The Namibian:
http://www.namibian.com.na/indexx.php?archive_id=124926&page_type=archive_story_
detail&page=1