Embed Size (px)
Citation preview
Molecular Ecology (2010) 19, 5009–5021 doi: 10.1111/j.1365-294X.2010.04859.x
Refugial persistence and postglacial recolonization ofNorth America by the cold-tolerant herbaceous plantOrthilia secunda
GEMMA E. BEATTY and JIM PROVAN
School of Biological Sciences, Queen’s University Belfast, 97 Lisburn Road, Belfast BT9 7BL, Northern Ireland
Corresponde
E-mail: J.Prov
� 2010 Black
Abstract
Previous phylogeographical and palaeontological studies on the biota of northern North
America have revealed a complex scenario of glacial survival in multiple refugia and
differing patterns of postglacial recolonization. Many putative refugial regions have
been proposed both north and south of the ice sheets for species during the Last Glacial
Maximum, but the locations of many of these refugia remain a topic of great debate. In
this study, we used a phylogeographical approach to elucidate the refugial and
recolonization history of the herbaceous plant species Orthilia secunda in North
America, which is found in disjunct areas in the west and east of the continent, most
of which were either glaciated or lay close to the limits of the ice sheets. Analysis of
596 bp of the chloroplast trnS-trnG intergenic spacer and five microsatellite loci in 84
populations spanning the species’ range in North America suggests that O. secundapersisted through the Last Glacial Maximum (LGM) in western refugia, even though
palaeodistribution modelling indicated a suitable climate envelope across the entire
south of the continent. The present distribution of the species has resulted from
recolonization from refugia north and south of the ice sheets, most likely in Beringia or
coastal regions of Alaska and British Columbia, the Washington ⁄ Oregon region in the
northwest USA, and possibly from the region associated with the putative ‘ice-free
corridor’ between the Laurentide and Cordilleran ice sheets. Our findings also highlight
the importance of the Pacific Northwest as an important centre of intraspecific genetic
diversity, owing to a combination of refugial persistence in the area and recolonization
from other refugia.
Keywords: climate change, glaciations, last glacial maximum, Laurentide ⁄ Cordilleran ice sheets,
phylogeography
Received 5 February 2010; revision received 20 August 2010; accepted 30 August 2010
Introduction
Climate change has occurred throughout the history
of the Earth. The Pleistocene epoch (1.8—0.01 MYA)
in particular was an age of constant change, when
numerous climatic fluctuations between glacial and
interglacial periods continuously altered the land-
scape. During the Last Glacial Maximum (LGM; ca.
18—21 kya), large parts of northern Europe and
northern North America were covered by ice sheets
nce: Jim Provan, Fax: +44 (0)28 90975877;
well Publishing Ltd
and sea levels dropped by as much as 120 m, exposing
extended coastline in certain areas (Clark & Mix 2002).
The LGM was the last major force to shape the distri-
bution ranges of species before the current period of
anthropogenically induced climate change, which has
also resulted in observed range shifts in various plants
and animals (Parmesan & Yohe 2003; Root et al. 2003;
Perry et al. 2005; Hickling et al. 2006; Parmesan 2006;
Kelly & Goulden 2008). Consequently, knowledge of
how organisms have responded to previous periods of
climate change may allow insights into the possible
impacts of present day global warming on species’
ranges.
5010 G. E. BEATTY and J . PROVAN
Over the last two decades, phylogeographical studies
have shown that the majority of species persisted
through the LGM and previous glacial maxima in cli-
matically suitable refugial areas, usually south of the ice
sheets and permafrost. The original phylogeographical
studies on the biota of Europe identified the three main
southern peninsulas of Iberia, Italy and the Balkans as
key refugia for temperate species (reviewed in Taberlet
et al. 1998; Hewitt 1999; Schmitt 2007), with extant pop-
ulations outside these regions being founded by north-
wards recolonization during the current interglacial. A
growing number of studies, however, have highlighted
the existence of ‘cryptic’ refugia at higher latitudes, par-
ticularly for cold-adapted species (reviewed in Provan
& Bennett 2008; Bennett & Provan 2008; Stewart et al.
2010). The main implications of these cryptic refugia for
species’ distributions are that recolonization patterns
may involve more than a simple range expansion from
low to high latitudes, with a subsequent uncertainty
surrounding the rate of migration during postglacial
warming periods.
Phylogeographical studies in North America have
produced an even more complex picture of postglacial
recolonization, with a growing body of evidence for the
existence of a number of putative refugia across the
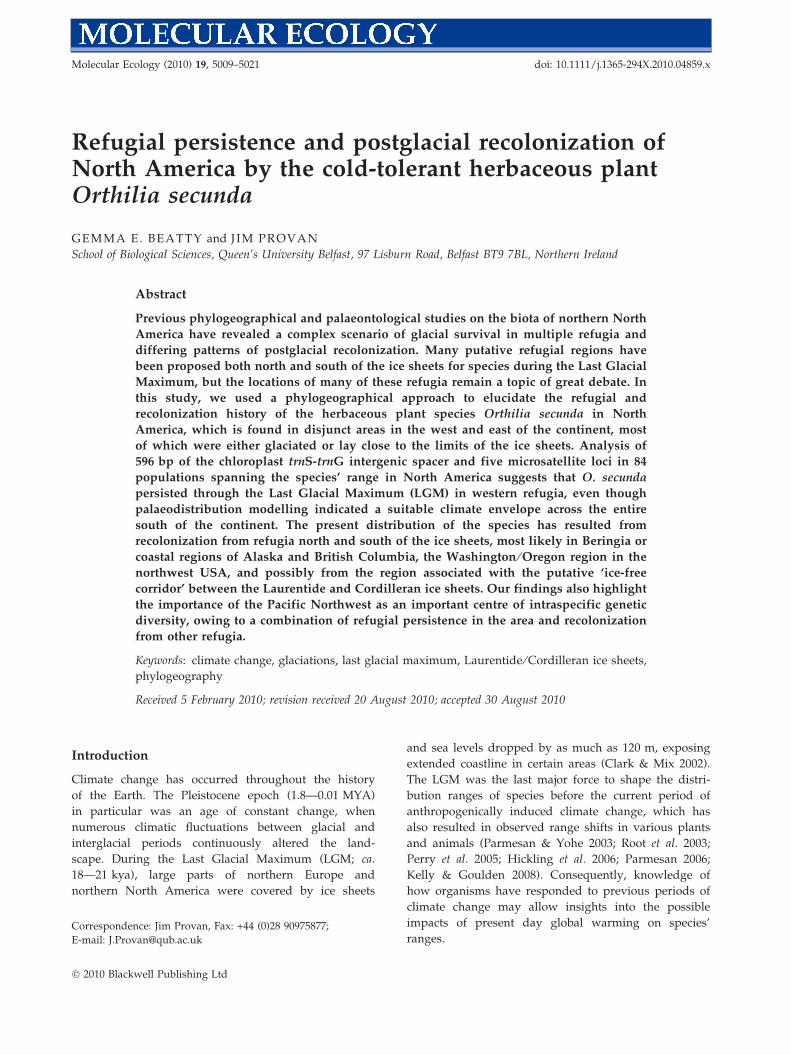
continent (summarised in Fig. 1; also Pielou 1991). Dif-
ficulties in identifying the locations of these refugia and
1
2
7
8
10
9
Fig. 1 Locations of proposed glacial refugia for terrestrial plants an
previous phylogeographical studies. Clockwise from top left: 1—Ber
Stenseth 2002; Fleming & Cook 2002; Anderson et al. 2006; Loehr et a
2008; Marr et al. 2008; Aubry et al. 2009); 2—Canadian High Arctic (H
2002; Eidesen et al. 2007a); 3—Eastern Arctic Canada (Tremblay &
4—Grand Banks (Holder et al. 1999); 5—Northeastern USA (Tremblay
Godbout et al. 2005; Eidesen et al. 2007a,b; Lee-Yaw et al. 2008); 6—
Godbout et al. 2005; Lee-Yaw et al. 2008); 7— ‘Ice-free Corridor’ (dash
free corridor at the Last Glacial Maximum (LGM)—Golden & Bain 2
Sullivan 2005; Brunsfield et al. 2007); 9—Northwestern USA (Jaramill
out et al. 2008; Aubry et al. 2009; Latch et al. 2009; Tomomatsu et al.
1999; Soltis et al. 1997; Conroy & Cook 2000; Clarke et al. 2001; Coo
heavy dashed line shows the approximate extent of the ice sheets at t
patterns of recolonization have been exacerbated by
uncertainties about the exact extents of the Laurentide
and the Cordilleran ice sheets during the LGM. Model-
ling approaches and geological and palaeontological
analyses have often provided inconsistent information
concerning the limits of the ice sheets and even whether
the two coalesced at the LGM (Pielou 1991; Dyke et al.
2002; Charbit et al. 2007).
Cold-tolerant plant species with limited dispersal
capabilities represent potentially good candidates to
gain phylogeographical insights into the extent of ice
sheets at the LGM, as they are generally more likely to
have persisted in northern refugia than temperate
species. Orthilia secunda (syn. Pyrola secunda—one-sided
or serrated wintergreen) is a perennial, herbaceous
plant with hermaphroditic flowers belonging to the
Pyrolaceae (in some taxonomic treatments this family is
subsumed into the Ericaceae) which exhibits a circum-
boreal distribution in Eurasia and North America. The
main areas of the species’ current range in North Amer-
ica correspond to largely disjunct areas in the west and
east of the continent that were either glaciated or which
lay close to the limits of the ice sheets, although it is
sporadically found further south, usually in mountain-
ous areas in the west. Because the species is mostly
restricted to dry to mesic forest habitats, it is rare or
absent from central northern US states such as North
3
4
5
6
d animals in northern North America based on evidence from
ingia (Holder et al. 1999; Tremblay & Schoen 1999; Fedorov &
l. 2006; Eidesen et al. 2007a,b; Maroja et al. 2007; Godbout et al.
older et al. 1999; Tremblay & Schoen 1999; Fedorov & Stenseth
Schoen 1999; Jaramillo-Correa et al. 2004; Godbout et al. 2005);
& Schoen 1999; Austin et al. 2002; Jaramillo-Correa et al. 2004;
‘Driftless Area’ (Jaramillo-Correa et al. 2004; Rowe et al. 2004;
ed arrow indicates uncertainty concerning the extent of the ice-
000; Loehr et al. 2006); 8—Clearwater Refugium (Brunsfield &
o-Correa et al. 2004; Loehr et al. 2006; Maroja et al. 2007; Godb-
2009); 10—Coastal Pacific Northwest ⁄ Haida Gwai (Holder et al.
k et al. 2001; Fleming & Cook 2002; Godbout et al. 2008). The
he Last Glacial Maximum (after Dyke et al. 2002).
� 2010 Blackwell Publishing Ltd
RE FUGIAL PERSISTENCE OF A COLD-TOLERANT PLANT 5011
and South Dakota and eastern Montana, and eastern
Alberta and western Saskatchewan in Canada. In this
study, we used a phylogeographical approach to eluci-
date the refugial and recolonization history of O. secun-
da in North America, and in particular to determine (i)
whether this cold-adapted species may have persisted
in northern refugia during the LGM, and (ii) whether
its current disjunct distribution is because of survival in
separate western and eastern refugia.
Materials and Methods
Sampling and DNA extraction
Samples, including material from herbarium specimens,
were obtained from 84 locations spanning the entire
range of O. secunda in North America plus one popula-
tion from Greenland and three individuals from a pop-
ulation from Siberia (Appendix 1). Two of the North
American populations (ALDM and ALSP) had been
identified in herbarium records as ‘O. secunda subsp.
obtusata’. As there is some uncertainty surrounding the
taxonomic status of subsp. obtusata (Dorr & Barrie
1993), these populations were included in this study.
DNA was extracted using the Qiagen DNeasy kit. In
total, 458 individuals were sequenced for the chloro-
plast trnS-trnG intergenic spacer and 553 individuals
were genotyped for five nuclear microsatellite loci.
Palaeodistribution modelling
Ecological niche modelling (ENM) was carried out to
determine suitable climate envelopes for O. secunda in
North America for the current period and at the last
glacial maximum (LGM, ca. 18 kya) using the maxi-
mum entropy approach implemented in the MAXENT
software package (V3.2.1; Phillips et al. 2006). Present-
day species occurrence data were downloaded from the
Global Biodiversity Information Facility data portal
(http://www.gbif.org). A distribution model based on
the 19 BIOCLIM variables in the WorldClim data set (Hij-
mans et al. 2005) was generated at 2.5 min resolution
using MAXENT with the default parameters for conver-
gence threshold (10)5) and number of iterations (500),
and projected onto reconstructed LGM data [Commu-
nity Climate System Model (CCSM); Palaeoclimate
Modelling Intercomparison Project Phase II: http://
pmip2.lsce.ipsl.fr] to identify potential refugial areas.
Duplicate records from the same locality were removed
to reduce the effects of spatial autocorrelation. A pres-
ence threshold was determined using the sensitivity-
specificity sum maximization approach (Cantor et al.
1999), and the performance of the model was tested
using 25% of the occurrence data points to determine
� 2010 Blackwell Publishing Ltd
the area under the receiver operating characteristic
(ROC) curve (AUC).
Chloroplast trnS-trnG sequencing
Four hundred and fifty-eight samples were sequenced
for the chloroplast trnS-trnG intergenic spacer. A prod-
uct was initially amplified using the trnS-trnG primers
of Zhang et al. (2005) and sequenced, and the resulting
sequence was used to design species-specific primers
OS-trnS 5¢-AGATATGACTATCGTTACATTTCATG-3¢and OS-trnG 5¢-GTATAGTAATGGATCTTTTGTCAA-
AC-3¢. PCR was carried out on a MWG Primus thermal
cycler using the following parameters: initial denatur-
ation at 94 �C for 3 min followed by 35 cycles of dena-
turation at 94 �C for 1 min, annealing at 58 �C for
1 min, extension at 72 �C for 2 min and a final exten-
sion at 72 �C for 5 min. PCR was carried out in a total
volume of 20 lL containing 200 ng genomic DNA,
20 pmol of each primer, 1· PCR reaction buffer, 200 lM
each dNTP, 2.5 mM MgCl2 and 0.5 U GoTaq Flexi DNA
polymerase (Promega). Five-microlitre PCR product
were resolved on 1.5% agarose gels and visualised by
ethidium bromide staining, and the remaining 15 lL
was sequenced commercially (Macrogen, Korea).
Microsatellite genotyping
Five hundred and fifty-three individuals were geno-
typed for five O. secunda microsatellite loci previously
described in Beatty et al. (2008). Forward primers were
modified by the addition of a 19-bp M13 tail (5¢-CAC-
GACGTTGTAAAACGAC-3¢), and reverse primers were
modified by the addition of a 7 bp tail (5¢-GTGTCTT-
3¢). PCR was carried out in a total volume of 10 lL con-
taining 100 ng genomic DNA, 10 pmol of dye-labelled
M13 primer (6-FAM or HEX), 1 pmol of tailed forward
primer, 10 pmol reverse primer, 1· PCR reaction buffer,
200 lM each dNTP, 2.5 mM MgCl2 and 0.25 U GoTaq
Flexi DNA polymerase (Promega). PCR was carried out
on a MWG Primus thermal cycler using the conditions
described in Beatty et al. (2008), and genotyping was
carried out on an AB3730xl capillary genotyping sys-
tem. Allele sizes were scored in GENEMAPPER V4.1 using
ROX-500 size standards and were checked by compari-
son with previously sized control samples.
Data analysis
DNA sequences for the trnS-trnG intergenic spacer were
aligned in BIOEDIT (V7.0.9.0; Hall 1999). Three mononu-
cleotide repeat regions were removed from the align-
ment, as well as four indels that appeared to have
arisen via duplication. Given that the mechanisms that
5012 G. E. BEATTY and J . PROVAN
generate such duplications may be similar to those that
generate microsatellite length variation, it was decided
to remove them from the alignment prior to further
analysis. The trnS-trnG sequence alignment was used to
construct a median-joining network using the Network
software package (V4.5.1.6; http://www.fluxus-engi-
neering.com).
Tests for linkage disequilibrium between pairs of mi-
crosatellite loci in each population were carried out in
the program FSTAT (Goudet 2001). Levels of genetic
diversity and FIS were calculated for populations with a
sample size of N ‡ 5. Gene diversity (H) based on chlo-
roplast trnS-trnG haplotype frequencies and observed
and expected heterozygosity (HO and HE) based on
nuclear microsatellite allele frequencies were calculated
using the ARLEQUIN software package (V3.01; Excoffier
et al. 2005). To visualise range-wide gradients in genetic
diversity for both chloroplast and nuclear markers
based on H and HE, respectively, data interpolation was
carried out using kriging in ArcGIS (V3.2; ESRI, Red-
lands, CA, USA). Levels of allelic richness (AR) and FIS
were calculated using FSTAT.
The software package BAPS (V3.2; Corander et al.
2003) was used to identify clusters of genetically similar
populations from the nuclear microsatellite data using a
Bayesian approach. Ten replicates were run for all pos-
sible values of the maximum number of clusters (K) up
to K = 40, with a burn-in period of 10 000 iterations fol-
lowed by 50 000 iterations. As the program identified
K = 40 as the most likely number of clusters, the analy-
sis was re-run multiple times for values up to K = 10,
K = 20 and K = 30. In each case, the program identified
the maximum value of K as the most likely. It has been
highlighted previously that BAPS tends to overestimate
the true number of clusters (Latch et al. 2006) so
because of this, and because we primarily wanted to
test for congruence between the chloroplast sequence
data and the nuclear microsatellite data, we ran the
final analysis for K = 3, the number of groups identified
by the chloroplast data, although the analysis was also
carried out for K = 2 and K = 4 for comparison. An
analysis of molecular variance (AMOVA) was carried out
for both the chloroplast trns-trnG data and the nuclear
microsatellite data based on the three clusters identified
by the BAPS analysis using ARLEQUIN.
Results
Palaeodistribution modelling of O. secunda at theLGM
The ENM based on current climate data was a largely
accurate description of the present-day distribution of
O. secunda in North America (Fig. 2). Modelling based
on reconstructed climate at the LGM identified suitable
regions for the persistence of O. secunda both south and
north of the limits of the ice sheets. South of the ice
sheets, the suitable climate envelope encompassed areas
such as western Washington and Oregon, where the
species is currently common, as well as southern US
states such as California, Arizona and New Mexico,
where the species is now rare, and extensive areas in the
southeast well beyond the current range of O. secunda.
To the north, suitable areas corresponded to unglaciated
regions in Alaska and Yukon, as well as large parts of
the Pacific coast of British Columbia that may also have
remained unglaciated at the LGM.
Chloroplast trnS-trnG sequencing
Removal of mononucleotide repeats and duplicated in-
dels from the trnS-trnG alignment of the 458 samples
resulted in an overall alignment length of 596 bp, These
chloroplast microsatellite regions and indels did contain
some degree of phylogenetic information, as they were
usually correlated with other synapomorphies in the
alignment, but were removed from the final analysis as
they introduced homoplasious reticulations into the net-
work, most likely due to their high levels of bidirec-
tional mutation (Provan et al. 2001). The network
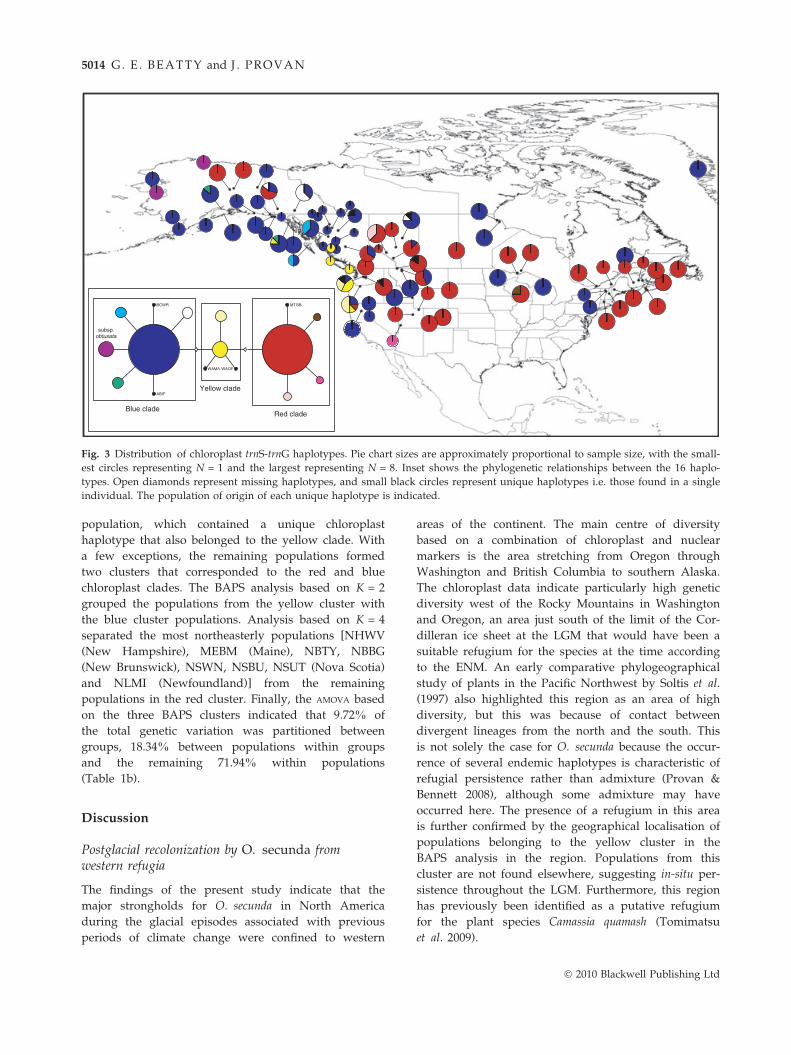
constructed from the alignment revealed a total of 16
haplotypes (GenBank accession numbers HQ162684—
HQ162699; Fig. 3). Two major groups of haplotypes
exhibited a primarily northwestern vs. southern ⁄ eastern
distribution, but with some occurrences of haplotypes
from one group in the region occupied primarily by the
other group as well. Haplotypes related to and includ-
ing the common blue haplotype, hereafter referred to as
the ‘blue clade’, were by far the most frequent in popu-
lations from Alaska, Yukon and British Columbia. One
of the haplotypes in this group was found in the two
populations from Alaska originally designated as
‘O. secunda subsp. obtusata’ and the three Siberian sam-
ples. Conversely, the group of haplotypes related to the
common red haplotype (the ‘red clade’) were relatively
rare in these areas but common in southern and eastern
populations. Haplotypes from a third group (the ‘yel-
low clade’) were found only in populations from Ore-
gon, Washington and western British Columbia.
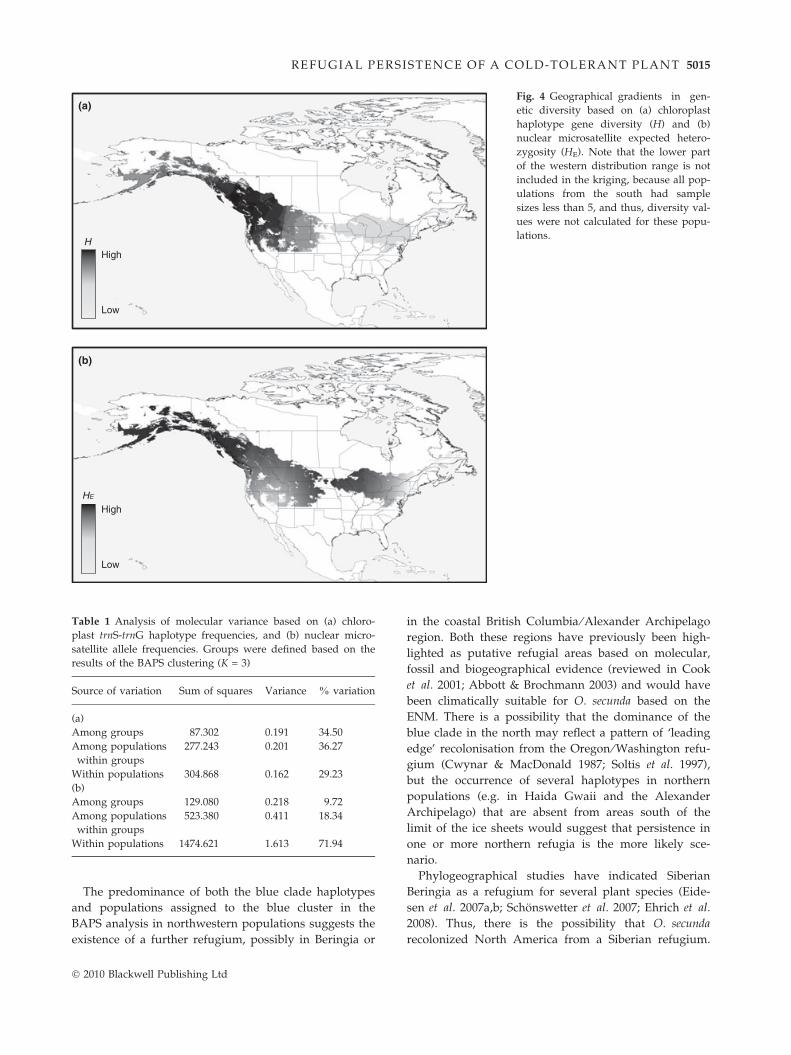
Gene diversity (H) values calculated for populations
with a sample size of N ‡ 5 ranged from 0.000 (many
populations) to 0.788 [WAOF (Washington); Table S1
Supplementary Information]. Interpolation of gene
diversity values across the range of O. secunda identi-
fied the area spanning Washington, Oregon and north-
ern Idaho, through southwestern Alberta and southern
British Columbia to the Alexander Archipelago as the
main centre of diversity (Fig. 4a). Gene diversity
� 2010 Blackwell Publishing Ltd
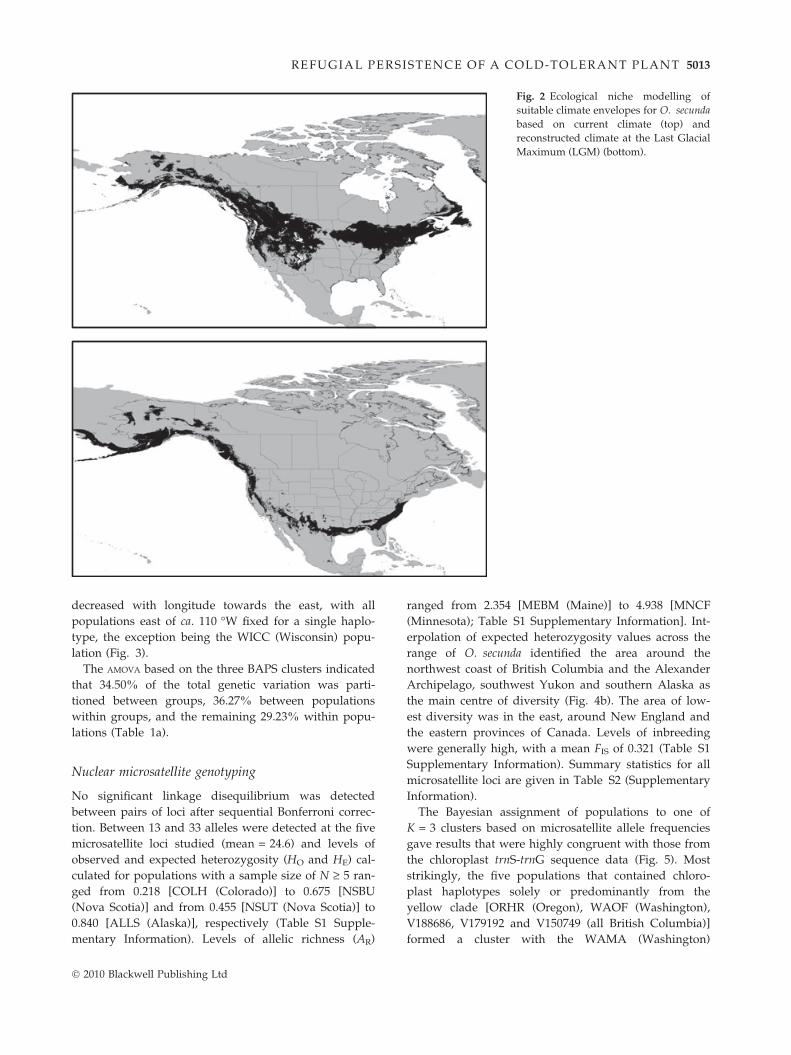
Fig. 2 Ecological niche modelling of
suitable climate envelopes for O. secunda
based on current climate (top) and
reconstructed climate at the Last Glacial
Maximum (LGM) (bottom).
RE FUGIAL PERSISTENCE OF A COLD-TOLERANT PLANT 5013
decreased with longitude towards the east, with all
populations east of ca. 110 �W fixed for a single haplo-
type, the exception being the WICC (Wisconsin) popu-
lation (Fig. 3).
The AMOVA based on the three BAPS clusters indicated
that 34.50% of the total genetic variation was parti-
tioned between groups, 36.27% between populations
within groups, and the remaining 29.23% within popu-
lations (Table 1a).
Nuclear microsatellite genotyping
No significant linkage disequilibrium was detected
between pairs of loci after sequential Bonferroni correc-
tion. Between 13 and 33 alleles were detected at the five
microsatellite loci studied (mean = 24.6) and levels of
observed and expected heterozygosity (HO and HE) cal-
culated for populations with a sample size of N ‡ 5 ran-
ged from 0.218 [COLH (Colorado)] to 0.675 [NSBU
(Nova Scotia)] and from 0.455 [NSUT (Nova Scotia)] to
0.840 [ALLS (Alaska)], respectively (Table S1 Supple-
mentary Information). Levels of allelic richness (AR)
� 2010 Blackwell Publishing Ltd
ranged from 2.354 [MEBM (Maine)] to 4.938 [MNCF
(Minnesota); Table S1 Supplementary Information]. Int-
erpolation of expected heterozygosity values across the
range of O. secunda identified the area around the
northwest coast of British Columbia and the Alexander
Archipelago, southwest Yukon and southern Alaska as
the main centre of diversity (Fig. 4b). The area of low-
est diversity was in the east, around New England and
the eastern provinces of Canada. Levels of inbreeding
were generally high, with a mean FIS of 0.321 (Table S1
Supplementary Information). Summary statistics for all
microsatellite loci are given in Table S2 (Supplementary
Information).
The Bayesian assignment of populations to one of
K = 3 clusters based on microsatellite allele frequencies
gave results that were highly congruent with those from
the chloroplast trnS-trnG sequence data (Fig. 5). Most
strikingly, the five populations that contained chloro-
plast haplotypes solely or predominantly from the
yellow clade [ORHR (Oregon), WAOF (Washington),
V188686, V179192 and V150749 (all British Columbia)]
formed a cluster with the WAMA (Washington)
subsp. obtusata
Blue clade
Yellow clade
Red clade
Fig. 3 Distribution of chloroplast trnS-trnG haplotypes. Pie chart sizes are approximately proportional to sample size, with the small-
est circles representing N = 1 and the largest representing N = 8. Inset shows the phylogenetic relationships between the 16 haplo-
types. Open diamonds represent missing haplotypes, and small black circles represent unique haplotypes i.e. those found in a single
individual. The population of origin of each unique haplotype is indicated.
5014 G. E. BEATTY and J . PROVAN
population, which contained a unique chloroplast
haplotype that also belonged to the yellow clade. With
a few exceptions, the remaining populations formed
two clusters that corresponded to the red and blue
chloroplast clades. The BAPS analysis based on K = 2
grouped the populations from the yellow cluster with
the blue cluster populations. Analysis based on K = 4
separated the most northeasterly populations [NHWV
(New Hampshire), MEBM (Maine), NBTY, NBBG
(New Brunswick), NSWN, NSBU, NSUT (Nova Scotia)
and NLMI (Newfoundland)] from the remaining
populations in the red cluster. Finally, the AMOVA based
on the three BAPS clusters indicated that 9.72% of
the total genetic variation was partitioned between
groups, 18.34% between populations within groups
and the remaining 71.94% within populations
(Table 1b).
Discussion
Postglacial recolonization by O. secunda fromwestern refugia
The findings of the present study indicate that the
major strongholds for O. secunda in North America
during the glacial episodes associated with previous
periods of climate change were confined to western
areas of the continent. The main centre of diversity
based on a combination of chloroplast and nuclear
markers is the area stretching from Oregon through
Washington and British Columbia to southern Alaska.
The chloroplast data indicate particularly high genetic
diversity west of the Rocky Mountains in Washington
and Oregon, an area just south of the limit of the Cor-
dilleran ice sheet at the LGM that would have been a
suitable refugium for the species at the time according
to the ENM. An early comparative phylogeographical
study of plants in the Pacific Northwest by Soltis et al.
(1997) also highlighted this region as an area of high
diversity, but this was because of contact between
divergent lineages from the north and the south. This
is not solely the case for O. secunda because the occur-
rence of several endemic haplotypes is characteristic of
refugial persistence rather than admixture (Provan &
Bennett 2008), although some admixture may have
occurred here. The presence of a refugium in this area
is further confirmed by the geographical localisation of
populations belonging to the yellow cluster in the
BAPS analysis in the region. Populations from this
cluster are not found elsewhere, suggesting in-situ per-
sistence throughout the LGM. Furthermore, this region
has previously been identified as a putative refugium
for the plant species Camassia quamash (Tomimatsu
et al. 2009).
� 2010 Blackwell Publishing Ltd
HHigh
Low
High
Low
HE
(a)
(b)
Fig. 4 Geographical gradients in gen-
etic diversity based on (a) chloroplast
haplotype gene diversity (H) and (b)
nuclear microsatellite expected hetero-
zygosity (HE). Note that the lower part
of the western distribution range is not
included in the kriging, because all pop-
ulations from the south had sample
sizes less than 5, and thus, diversity val-
ues were not calculated for these popu-
lations.
Table 1 Analysis of molecular variance based on (a) chloro-
plast trnS-trnG haplotype frequencies, and (b) nuclear micro-
satellite allele frequencies. Groups were defined based on the
results of the BAPS clustering (K = 3)
Source of variation Sum of squares Variance % variation
(a)
Among groups 87.302 0.191 34.50
Among populations
within groups
277.243 0.201 36.27
Within populations 304.868 0.162 29.23
(b)
Among groups 129.080 0.218 9.72
Among populations
within groups
523.380 0.411 18.34
Within populations 1474.621 1.613 71.94
RE FUGIAL PERSISTENCE OF A COLD-TOLERANT PLANT 5015
The predominance of both the blue clade haplotypes
and populations assigned to the blue cluster in the
BAPS analysis in northwestern populations suggests the
existence of a further refugium, possibly in Beringia or
� 2010 Blackwell Publishing Ltd
in the coastal British Columbia ⁄ Alexander Archipelago
region. Both these regions have previously been high-
lighted as putative refugial areas based on molecular,
fossil and biogeographical evidence (reviewed in Cook
et al. 2001; Abbott & Brochmann 2003) and would have
been climatically suitable for O. secunda based on the
ENM. There is a possibility that the dominance of the
blue clade in the north may reflect a pattern of ‘leading
edge’ recolonisation from the Oregon ⁄ Washington refu-
gium (Cwynar & MacDonald 1987; Soltis et al. 1997),
but the occurrence of several haplotypes in northern
populations (e.g. in Haida Gwaii and the Alexander
Archipelago) that are absent from areas south of the
limit of the ice sheets would suggest that persistence in
one or more northern refugia is the more likely sce-
nario.
Phylogeographical studies have indicated Siberian
Beringia as a refugium for several plant species (Eide-
sen et al. 2007a,b; Schonswetter et al. 2007; Ehrich et al.
2008). Thus, there is the possibility that O. secunda
recolonized North America from a Siberian refugium.
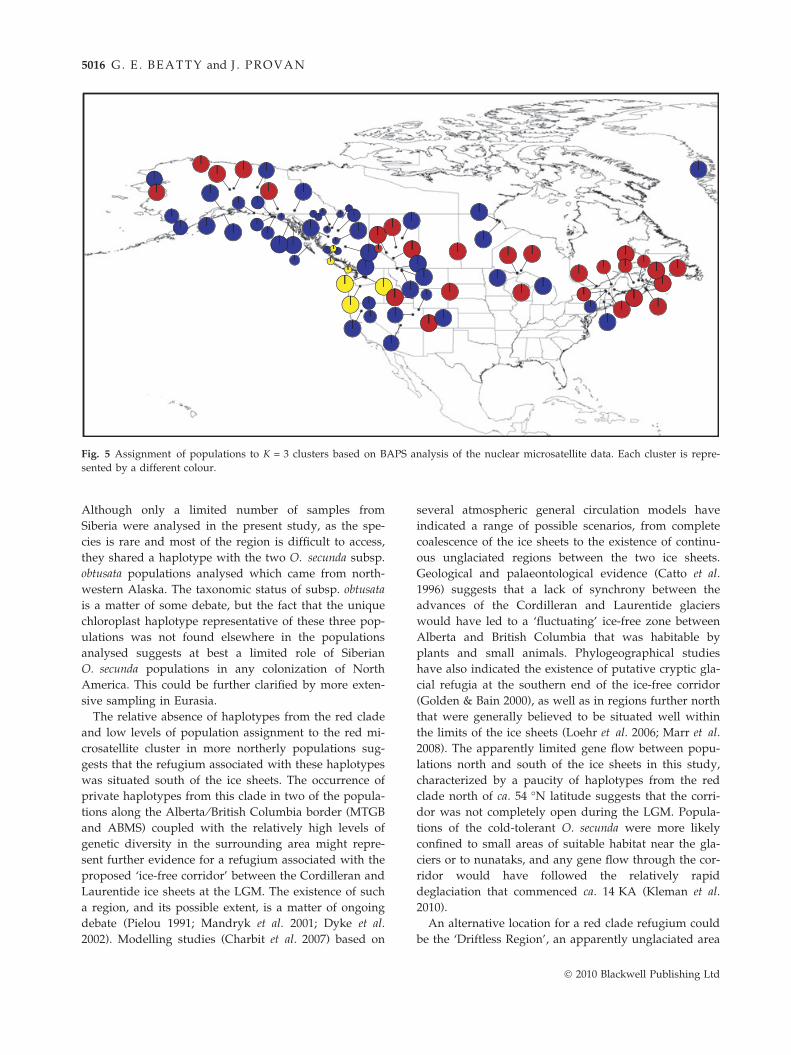
Fig. 5 Assignment of populations to K = 3 clusters based on BAPS analysis of the nuclear microsatellite data. Each cluster is repre-
sented by a different colour.
5016 G. E. BEATTY and J . PROVAN
Although only a limited number of samples from
Siberia were analysed in the present study, as the spe-
cies is rare and most of the region is difficult to access,
they shared a haplotype with the two O. secunda subsp.
obtusata populations analysed which came from north-
western Alaska. The taxonomic status of subsp. obtusata
is a matter of some debate, but the fact that the unique
chloroplast haplotype representative of these three pop-
ulations was not found elsewhere in the populations
analysed suggests at best a limited role of Siberian
O. secunda populations in any colonization of North
America. This could be further clarified by more exten-
sive sampling in Eurasia.
The relative absence of haplotypes from the red clade
and low levels of population assignment to the red mi-
crosatellite cluster in more northerly populations sug-
gests that the refugium associated with these haplotypes
was situated south of the ice sheets. The occurrence of
private haplotypes from this clade in two of the popula-
tions along the Alberta ⁄ British Columbia border (MTGB
and ABMS) coupled with the relatively high levels of
genetic diversity in the surrounding area might repre-
sent further evidence for a refugium associated with the
proposed ‘ice-free corridor’ between the Cordilleran and
Laurentide ice sheets at the LGM. The existence of such
a region, and its possible extent, is a matter of ongoing
debate (Pielou 1991; Mandryk et al. 2001; Dyke et al.
2002). Modelling studies (Charbit et al. 2007) based on
several atmospheric general circulation models have
indicated a range of possible scenarios, from complete
coalescence of the ice sheets to the existence of continu-
ous unglaciated regions between the two ice sheets.
Geological and palaeontological evidence (Catto et al.
1996) suggests that a lack of synchrony between the
advances of the Cordilleran and Laurentide glaciers
would have led to a ‘fluctuating’ ice-free zone between
Alberta and British Columbia that was habitable by
plants and small animals. Phylogeographical studies
have also indicated the existence of putative cryptic gla-
cial refugia at the southern end of the ice-free corridor
(Golden & Bain 2000), as well as in regions further north
that were generally believed to be situated well within
the limits of the ice sheets (Loehr et al. 2006; Marr et al.
2008). The apparently limited gene flow between popu-
lations north and south of the ice sheets in this study,
characterized by a paucity of haplotypes from the red
clade north of ca. 54 �N latitude suggests that the corri-
dor was not completely open during the LGM. Popula-
tions of the cold-tolerant O. secunda were more likely
confined to small areas of suitable habitat near the gla-
ciers or to nunataks, and any gene flow through the cor-
ridor would have followed the relatively rapid
deglaciation that commenced ca. 14 KA (Kleman et al.
2010).
An alternative location for a red clade refugium could
be the ‘Driftless Region’, an apparently unglaciated area
� 2010 Blackwell Publishing Ltd
RE FUGIAL PERSISTENCE OF A COLD-TOLERANT PLANT 5017
around southwestern Wisconsin, southeastern Minne-
sota and northeastern Iowa. Phylogoeographical
(Jaramillo-Correa et al. 2004; Rowe et al. 2004; Godbout
et al. 2005; Lee-Yaw et al. 2008) and palaeontological
(Jackson et al. 2000) evidence suggest that this area
was a refugium for several plant and animal species
during the LGM. The occurrence of a unique haplotype
in the WICC (Wisconsin) population and the fact
that this area possessed the highest levels of nuclear
genetic diversity in the eastern part of the range of
O. secunda also indicate a possible refugium. Alterna-
tively, it may be that O. secunda is now absent from
the area that was the source of the red clade and
cluster, after the change from forest to grassland since
the LGM.
Although O. secunda is also relatively common in
northeastern North America, we found no evidence for
an eastern refugium. Phylogeographical signatures of
refugial areas include high levels of genetic diversity
and the presence of endemic haplotypes (reviewed in
Provan & Bennett 2008), but levels of genetic diversity
for both the chloroplast and nuclear markers were low-
est in the east. This is somewhat surprising, given that
previous rangewide phylogeographical studies of plant
species with a largely continental distribution in
northern North America have generally indicated the
occurrence of separate western and eastern refugia
(Jaramillo-Correa et al. 2004; Alsos et al. 2005; Godbout
et al. 2005; Keller et al. 2010; de Lafontaine et al. 2010).
A comparison of the current and past modelled distri-
butions of O. secunda shows that whilst there are areas
of overlap in the west, which correspond to the putative
refugial regions described previously, this is not the
case in the east, where possible refugial areas lie well
south of the current distribution of the species. This
would suggest that O. secunda did not track changes in
available habitat during the last glacial period to any
great degree, and that populations in climatically
unsuitable areas were extirpated. Subsequent recolon-
ization from separate western refugia would have
given rise to the pattern of chloroplast haplotype
diversity observed today, with central and eastern
populations comprised solely of either the most com-
mon red or blue haplotypes. Although O. secunda
currently exhibits a disjunct distribution in North
America, pollen and macrofossil evidence indicates
the existence of transcontinental boreal forests imme-
diately south of the Laurentide ice sheet at both the
LGM and throughout the deglaciation (Strong & Hills
2005; Yansa 2006). The presence of extensive suitable
habitat would have facilitated the eastward spread of
O. secunda from a southern refugium (red haplotype)
followed by recolonization from the northern refugium
(blue haplotype).
� 2010 Blackwell Publishing Ltd
The importance of the Pacific Northwest: a hotspot anda melting pot
The Pacific Northwest has previously been identified in
phylogeographical and biogeographical studies as a key
centre of diversity and endemism for a range of plant
and animal species (Hulten 1968; Rogers et al. 1991;
Soltis et al. 1997; Brunsfield et al. 2001; Cook et al.
2001). Phylogeographical studies on various plant
(Godbout et al. 2008; Tomomatsu et al. 2009) and ani-
mal (Fleming & Cook 2002; Stone et al. 2002; Burg et al.
2005; Latch et al. 2009) species have indicated high
levels of genetic variation and unique genotypes in the
area, the ‘classic’ signatures of glacial refugia (Provan &
Bennett 2008). This is also the case for the distribution
of intraspecific genetic diversity in O. secunda. A previ-
ous comparative phylogeographical study on European
tree and shrub species (Petit et al. 2003) demonstrated
that whilst refugial areas contained unique genetic vari-
ation (‘hotspots’), the areas with the highest levels of
genetic diversity were those further north, where haplo-
types from distinct refugial lineages had become
admixed (‘melting pots’). The high diversity observed
in the Washington and Oregon populations in the
present study would appear to be the result of both of
these processes. In addition to being the likely refugium
for the yellow clade, based on both chloroplast and
nuclear data, these areas were also probably recolonized
from the northern (blue) refugium and the refugium for
the red clade to the east. Thus, the area is both a
‘hotspot’ and a ‘melting pot’ for genetic diversity in
O. secunda, a factor that should be borne in mind should
the necessity to formulate conservation strategies for the
species arise.
Acknowledgements
We are extremely grateful to everybody who provided samples
for this project (listed in Appendix 1). Ken Marr (Royal British
Columbia Museum Herbarium), Jordan Metzgar (University of
Alaska Fairbanks Herbarium) and Thomas Zanoni (New York
Botanic Garden) provided valuable herbarium specimens. We
thank Bruce Bennett, Richard Hebda, Ken Marr, Niall McKe-
own and four anonymous referees for comments on a previous
version of the manuscript. We are also grateful to Stephen Kel-
ler for advice on GIS. Gemma Beatty’s PhD research is funded
by the Department of Agriculture and Rural Development,
Northern Ireland.
References
Abbott RJ, Brochmann C (2003) History and evolution of the
Arctic flora: in the footsteps of Eric Hulten. Molecular
Ecology, 12, 299–313.
Alsos IG, Engelskjøn T, Gielly L, Taberlet P, Brochmann C
(2005) Impact of ice ages on circumpolar molecular diversity:
5018 G. E. BEATTY and J . PROVAN
insights from an ecological key species. Molecular Ecology, 14,
2739–2753.
Anderson LL, Hu FS, Nelson DM, Petit RJ, Paige KN (2006)
Ice-age endurance: DNA evidence of a white spruce
refugium in Alaska. Proceedings of the National Academy of
Sciences USA, 103, 12447–12450.
Aubry KB, Statham MJ, Sacks BN, Perrine JD, Wisely SM
(2009) Phylogeography of the North American red fox:
vicariance in Pleistocene forest refugia. Molecular Ecology, 18,
2668–2686.
Austin JD, Lougheed SC, Neidrauer L, Chek AA, Boag PT
(2002) Cryptic lineages in a small frog: post-glacial history of
the spring peeper, Pseudacris crucifer (Anura: Hylidae).
Molecular Phylogenetics and Evolution, 25, 316–329.
Beatty GE, McEvoy PM, Sweeney O, Provan J (2008) Range-edge
effects promote clonal growth in peripheral populations of the
one-sided wintergreen (Orthilia secunda). Diversity and
Distributions, 14, 546–555.
Bennett KD, Provan J (2008) What do we mean by ‘refugia’?
Quaternary Science Reviews, 27, 2449–2455.
Brunsfield SJ, Sullivan J (2005) A multi-compartmented glacial
refugium in the northern Rocky Mountains: evidence from
the phylogeography of Cardamine constancei (Brassicaceae).
Conservation Genetics, 6, 895–904.
Brunsfield SJ, Sullivan J, Soltis DE, Soltis PS (2001) Comparative
phylogeography of northwestern North America: a synthesis.
In:Integrating Ecology and Evolution in a Spatial Context (eds
Silvertown J, Antonovics J). pp. 319–339, Blackwell Science,
Oxford, UK.
Brunsfield SJ, Miller TR, Carstens BC (2007) Insights into the
biogeography of the Pacific Northwest of North America:
evidence from the phylogeography of Salix melanopsis.
Systematic Botany, 32, 129–139.
Burg TM, Gaston AJ, Winker K, Friesen VL (2005) Rapid
divergence and postglacial recolonization in western North
American Steller’s jays (Cyanocitta stelleri). Molecular Ecology,
14, 3745–3755.
Cantor SB, Sun CC, Tortolero-Luna G, Richards-Kortum R,
Follen M (1999) A comparison of C ⁄ B ratios from studies
using receiver operating characteristic curve analysis. Journal
of Clinical Epidemiology, 52, 885–892.
Catto N, Liverman DGE, Bobrowsky PT, Rutter N (1996)
Laurentide, Cordilleran and montane glaciations in the
Western Peace River – Grande Prairie region, Alberta and
British Columbia, Canada. Quaternary International, 32, 21–
32.
Charbit S, Ritz C, Philippon G, Peyaud V, Kageyama M (2007)
Numerical reconstruction of the Northern hemisphere ice
sheets through the last glacial-interglacial cycle. Climate of the
Past, 3, 15–37.
Clark PU, Mix AC (2002) Ice sheets and sea level of the Last
Glacial Maximum. Quaternary Science Reviews, 21, 1–7.
Clarke TE, Levin DB, Kavanaugh DH, Reimchen TE (2001)
Rapid evolution in the Nebria gregaria group (Coleoptera:
Carabidae) and the palaeogeography of the Queen Charlotte
Islands. Evolution, 55, 1408–1418.
Conroy CJ, Cook A (2000) Phylogeography of a post-glacial
colonizer: Microtus longicaudus (Rodentia: Muridae).
Molecular Ecology, 9, 165–175.
Cook JA, Bidlack AL, Conroy CJ et al. (2001) A phylo-
geographic perspective on endemism in the Alexander
Archipelago of southeast Alaska. Biological Conservation, 97,
215–227.
Corander J, Waldmann P, Sillanpaa MJ (2003) Bayesian
analysis of genetic differentiation between populations.
Genetics, 163, 367–374.
Cwynar LC, MacDonald GM (1987) Geographical variation of
lodgepole pine in relation to population history. American
Naturalist, 126, 463–469.
Dorr LJ, Barrie FR (1993) Typification of the Linnean names in
Pyrola (Ericaceae, Pyroloideae). Brittonia, 45, 177–180.
Dyke AS, Andrews JT, Clark PU et al. (2002) The Laurentide
and Innuitian ice sheets during the Last Glacial Maximum.
Quaternary Science Reviews, 21, 9–31.
Ehrich D, Alsos IG, Brochmann C (2008) Where did the
northern peatland species survive the dry glacials:
cloudberry (Rubus chamaemorus) as an example. Journal of
Biogeography, 35, 801–814.
Eidesen PB, Carlsen T, Molau U, Brochmann C (2007a)
Repeatedly out of Beringia: Cassiope tetragona embrace the
Arctic. Journal of Biogeography, 34, 1559–1574.
Eidesen PB, Alsos IG, Popp M et al. (2007b) Nuclear vs. plastid
data: complex Pleistocene history of a circumpolar key
species. Molecular Ecology, 16, 3902–3925.
Excoffier L, Laval LG, Schneider S (2005) ARLEQUIN,
Version 3.0: An integrated software package for population
genetic data analysis. Evolutionary Bioinformatics Online, 1,
47–50.
Fedorov VB, Stenseth NC (2002) Multiple glacial refugia in the
North American Arctic: inference from phylogeography of
the collared lemming (Dicrostonyx groenlandicus). Proceedings
of the Royal Society of London Series B, 269, 2071–2077.
Fleming MA, Cook JA (2002) Phylogeography of endemic
ermine (Mustela ermine) in southeast Alaska. Molecular
Ecology, 11, 795–807.
Godbout J, Jaramillo-Correa JP, Beaulieu J, Bosquet J (2005) A
mitochondrial DNA minisatellite reveals the postglacial
history of jack pine (Pinus banksiana), a broad-range North
American conifer. Molecular Ecology, 14, 3497–3512.
Godbout J, Fazekas A, Newton CH, Yeh FC, Bosquet J (2008)
Glacial vicariance in the Pacific Northwest: evidence from a
lodgepole pine mitochondrial DNA minisatellite for multiple
genetically distinct and widely separated refugia. Molecular
Ecology, 17, 2463–2475.
Golden JL, Bain JF (2000) Phylogeographic patterns and high
levels of chloroplast DNA diversity in four Packera
(Asteraceae) species in southwestern Alberta. Evolution, 54,
1566–1579.
Goudet J(2001) FSTAT, version 2.9.3, A program to estimate
and test gene diversities and fixation indices. Available from
http://www2.unil.ch/popgen/softwares/fstat.htm.
Hall TA (1999) BIOEDIT: a user-friendly biological sequence
alignment editor and analysis program for Windows
95 ⁄ 98 ⁄ NT. Nucleic Acids Symposium Series, 41, 95–98.
Hewitt GM (1999) Post-glacial recolonisation of European
biota. Biological Journal of the Linnean Society, 68, 87–112.
Hickling R, Roy DB, Hill JK, Fox R, Thomas CD (2006) The
distributions of a wide range of taxonomic groups are
expanding polewards. Global Change Biology, 12, 450–455.
Hijmans RJ, Cameron SE, Parra JL, Jones PG, Jarvis A (2005)
Very high resolution interpolated climate surfaces for global
land areas. Journal of Climatology, 25, 1965–1978.
� 2010 Blackwell Publishing Ltd
RE FUGIAL PERSISTENCE OF A COLD-TOLERANT PLANT 5019
Holder K, Montgomerie R, Friesen VL (1999) A test of the
glacial refugium hypothesis using patterns of mitochondrial
and nuclear DNA sequence variation in rock ptarmigan
(Lagopus mutus). Evolution, 53, 1936–1950.
Hulten E (1968) Flora of Alaska and Neighbouring Territories.
Stanford University Press, Stanford, California, USA.
Jackson ST, Webb RS, Anderson KH et al. (2000) Vegetation
and environment in Eastern North America during the Last
Glacial Maximum. Quaternary Science Reviews, 19, 489–508.
Jaramillo-Correa JP, Beaulieu J, Bosquet J (2004) Variation in
mitochondrial DNA reveals multiple distant glacial refugia
in black spruce (Picea mariana), a transcontinental North
American conifer. Molecular Ecology, 13, 2735–2747.
Keller SR, Olson MS, Silim S, Schroeder W, Tiffin P (2010)
Genomic diversity, population structure, and migration
following rapid range expansion in the Balsam Poplar,
Populus balsamifera. Molecular Ecology, 19, 1212–1226.
Kelly AE, Goulden ML (2008) Rapid shifts in plant distribution
with recent climate change. Proceedings of the National
Academy of Sciences USA, 105, 11823–11826.
Kleman J, Jansson K, de Angelis H et al. (2010) North
American Ice Sheet build up during the last glacial cycle,
115 – 21 kyr. Quaternary Science Reviews, 29, 2036–2051.
de Lafontaine G, Turgeon J, Payette S (2010) Phylogeography of
white spruce (Picea glauca) in eastern North America reveals
contrasting ecological trajectories. Journal of Biogeography, 37,
741–751.
Latch EK, Dharmarajan G, Glaubitz JC, Rhodes OE (2006)
Relative performance of Bayesian clustering software for
inferring population substructure and individual assignment
at low levels of population differentiation. Conservation
Genetics, 7, 295–302.
Latch EK, Heffelfinger JR, Fike JA, Rhodes OE (2009)
Species-wide phylogeography of North American mule deer
(Odocoileus hemionus): cryptic glacial refugia and postglacial
recolonization. Molecular Ecology, 18, 173–1745.
Lee-Yaw JA, Irwin JT, Green DM (2008) Postglacial range
expansion from northern refugia by the wood frog, Rana
sylvatica. Molecular Ecology, 17, 867–884.
Loehr J, Worley K, Grapputo A, Carey J, Vetch A, Coltman
DW (2006) Evidence for cryptic glacial refugia from North
American mountain sheep mitochondrial DNA. Journal of
Evolutionary Biology, 19, 419–430.
Mandryk CAS, Josenhans H, Fedje DW, Mathewes RW (2001)
Late Quaternary palaeoenvironments of Northwestern North
America: implications for inland versus coastal migration
routes. Quaternary Science Reviews, 20, 301–314.
Maroja LS, Bogdanowicz SM, Wallin KF, Raffa KF, Harrison
RG (2007) Phylogeography of spruce beetles (Dendro-
ctonus rufipennis Kirby)(Curculionidae: Scolytinae) in North
America. Molecular Ecology, 16, 2560–2573.
Marr KL, Allen GA, Hebda RJ (2008) Refugia in the Cordil-
leran ice sheet of western North America: chloroplast DNA
diversity in the Arctic-alpine plant Oxyria digyna. Journal of
Biogeography, 35, 1323–1334.
Parmesan C (2006) Ecological and evolutionary response to
recent climate change. Annual Review of Ecology, Evolution
and Systematics, 37, 637–669.
Parmesan C, Yohe G (2003) A globally coherent fingerprint of
climate change impacts across natural systems. Nature, 421,
37–42.
� 2010 Blackwell Publishing Ltd
Perry AL, Low PJ, Ellis JR, Reynolds JD (2005) Climate change
and distribution shifts in marine fishes. Science, 308, 1912–
1915.
Petit RJ, Aguinagalde I, de Beaulieu J-L et al. (2003) Glacial
refugia: hotspots but not melting pots of genetic diversity.
Science, 308, 1912–1915.
Phillips SJ, Anderson RP, Schapire RE (2006) Maximum
entropy modeling of species geographic distributions.
Ecological Modelling, 190, 231–259.
Pielou EC (1991) After the Ice Age: the return of life to glaciated
North America. University of Chicago Press, Chicago.
Provan J, Bennett KD (2008) Phylogeographic insights into
cryptic glacial refugia. Trends in Ecology and Evolution, 23,
564–571.
Provan J, Powell W, Hollingsworth PM (2001) Chloroplast
microsatellites: new tools for studies in plant ecology and
systematics. Trends in Ecology and Evolution, 16, 142–147.
Rogers RA, Rogers LA, Hoffmann RS, Martin LD (1991) Native
American biological diversity and the biogeographic influence
of ice age refugia. Journal of Biogeography, 18, 623–630.
Root TL, Price JT, Hall KR, Schneider SH, Rosenzweig C,
Pounds JA (2003) Fingerprints of global warming on wild
animals and plants. Nature, 421, 57–60.
Rowe KC, Heske EJ, Brown PW, Paige KN (2004) Surviving
the ice: Northern refugia and postglacial recolonization.
Proceedings of the National Academy of Sciences USA, 101,
10355–10359.
Schmitt T (2007) Molecular biogeography of Europe: Pleistocene
cycles and postglacial trends. Frontiers in Zoology, 4, 11.
Schonswetter P, Suda J, Popp M, Weiss-Schneeweiss H,
Brochmann C (2007) Circumpolar phylogeography of Juncus
biglumus (Juncaceae) inferred from AFLP fingerprints,
cpDNA sequences, nuclear DNA content and chromosome
numbers. Molecular Phylogenetics and Evolution, 42, 92–103.
Soltis DE, Gitzendanner MA, Strenge DD, Soltis PS (1997)
Chloroplast DNA intraspecific phylogeography of plants
from the Pacific Northwest of North America. Plant
Systematics and Evolution, 206, 353–373.
Stewart JR, Lister AM, Barnes I, Dalen L (2010) Refugia
revisited: individualistic responses of species in space and
time. Proceedings of the Royal Society of London Series B, 277,
661–671.
Stone KD, Flynn RW, Cook JA (2002) Post-glacial colonization
of northwestern North America by the forest-associated
American marten (Martes Americana, Mammalia: Carnivora:
Mustelidae). Molecular Ecology, 11, 2049–2063.
Strong WL, Hills LV (2005) Late-glacial and Holocene
palaeovegetation zonal reconstruction for central and north-
central North America. Journal of Biogrography, 32, 1043–1062.
Taberlet P, Fumagalli L, Wust-Saucy AG, Cosson JF (1998)
Comparative phylogeography and postglacial recolonization
routes in Europe. Molecular Ecology, 7, 453–464.
Tomomatsu H, Kephart SR, Vellend M (2009) Phylogeography
of Camassia quamash in western North America: postglacial
colonization and transport by indigenous peoples. Molecular
Ecology, 18, 3918–3928.
Tremblay NO, Schoen DJ (1999) Molecular phylogeography of
Dryas integrifolia: glacial refugia and postglacial recol-
onization. Molecular Ecology, 8, 1187–1198.
Yansa CH (2006) The timing and nature of Late Quaternary
vegetation changes in the northern Great Plains, USA and
5020 G. E. BEATTY and J . PROVAN
Canada: a re-assessment of the spruce phase. Quaternary
Science Reviews, 25, 263–281.
Zhang Q, Chiang TY, George M, Liu JQ, Abbott RJ (2005)
Phylogeography of the Qinghai-Tibetan Plateau endemic
Juniperus przewalskii (Cupressaceae) inferred from chloroplast
DNA sequence variation. Molecular Ecology, 14, 3513–3524.
Gemma Beatty is studying for a PhD under the supervision of
Jim Provan, comparing how postglacial recolonization and
range-edge effects have shaped the genetic diversity of several
northern hemisphere Monotropoideae species. This PhD repre-
sents a continuation of her Masters research into range-edge
effects in Orthilia secunda. Jim Provan is a Senior Lecturer in
Evolutionary Genetics at Queen’s University Belfast. His
research interests focus on examining the effects of threats to
biodiversity such as climate change and habitat loss on popula-
tions at the genetic level.
Supporting information
Additional supporting information may be found in the online
version of this article:
Table S1 Summary statistics by population. (NC—not calcu-
lated owing to small sample size). H—gene diversity; HO—ob-
served heterozygosity; HE—expected heterozygosity; AR—
allelic richness standardised to N = 5; FIS—inbreeding coeffi-
cient
Table S2 Summary statistics by locus averaged over popula-
tions (calculated for populations with N ‡ 5). A—number of
alleles; HO—observed heterozygosity; HE—expected heterozy-
gosity; FIT, FST, FIS—Weir and Cockerham’s F-statistics
Please note: Wiley-Blackwell are not responsible for the content
or functionality of any supporting information supplied by the
authors. Any queries (other than missing material) should be
directed to the corresponding author for the article.
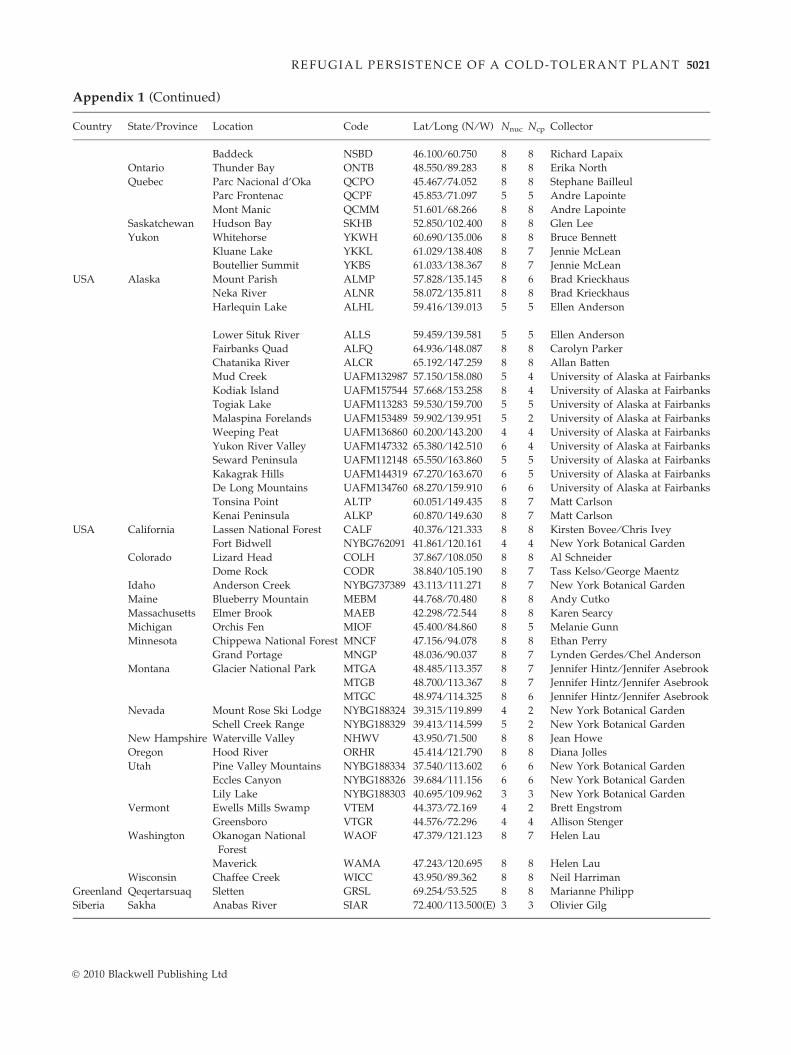
Appendix 1
Samples analysed in the present study. Nnuc—number of samples analysed for nuclear microsatellites; Ncp—number of samples
sequenced for the chloroplast trns-trnG intergenic spacer
Country
State ⁄ Province Location Code Lat ⁄ Long (N ⁄ W) Nnuc Ncp�
Collector
Canada
Alberta Mount Stelfox ABMS 52.174 ⁄ 116.491 8 8 Dorothy FabijanCoyote Lake
ABCL 53.272 ⁄ 114.543 8 6 Dorothy FabijanIlka Fen
ABIF 55.097 ⁄ 113.260 8 6 Dorothy FabijanCalgary
ABCA 51.033 ⁄ 115.050 8 8 Lawrence HarderBritish Columbia
Manning Park BCMP 49.064 ⁄ 120.782 8 8 Ron LongWrede Range
BCWR 56.632 ⁄ 126.206 5 4 Ken MarrBrothers Lake
BCBR 57.200 ⁄ 127.417 4 3 Ken MarrAnemine Mountain
BCAM 57.867 ⁄ 127.967 3 1 Ken MarrPrince George
BCPG 53.400 ⁄ 124.750 8 6 Bruce RogersBabine Lake Road
BCBL 54.771 ⁄ 126.843 4 4 Karen McKeownBabine Mountains
BCBM 54.854 ⁄ 125.991 8 8 Karen McKeownChapman Lake Road
BCCL 54.865 ⁄ 126.646 4 4 Karen McKeownKitwanga
BCKI 55.407 ⁄ 128.214 8 8 Karen McKeownVancouver Island
V179192 48.733 ⁄ 124.283 1 1 Royal BC Museum HerbariumVancouver Island
V188686 50.466 ⁄ 127.800 1 1 Royal BC Museum HerbariumMount Robson Park
V080791 52.833 ⁄ 118.500 1 1 Royal BC Museum HerbariumKimsquit River
V167706 52.950 ⁄ 127.133 1 1 Royal BC Museum HerbariumKitlope River
V150749 53.217 ⁄ 127.850 1 1 Royal BC Museum HerbariumQueen Charlotte Islands
V171416 53.267 ⁄ 132.233 1 1 Royal BC Museum HerbariumPrincess Royal Island
V193787 53.275 ⁄ 129.057 1 1 Royal BC Museum HerbariumQueen Charlotte Islands
V189596 53.559 ⁄ 132.344 1 1 Royal BC Museum HerbariumN ⁄ A
V194659 56.952 ⁄ 128.594 1 1 Royal BC Museum HerbariumMuncho Lake Park
V200496 58.829 ⁄ 125.519 1 1 Royal BC Museum HerbariumN ⁄ A
V192022 59.437 ⁄ 130.247 1 1 Royal BC Museum HerbariumTatshenshini River
V079085 59.483 ⁄ 137.733 1 1 Royal BC Museum HerbariumN ⁄ A
V079476 59.917 ⁄ 131.300 1 1 Royal BC Museum HerbariumManitoba
Wapusk National Park MBWP 58.433 ⁄ 93.644 8 6 Bruce BennettChurchill
MBCH 58.745 ⁄ 94.115 8 7 Peter KevanNewfoundl and
Mount Ignoble NLMI 48.999 ⁄ 57.752 8 7 Maria VoitkCanada
New Brunswick Taymouth NBTY 46.183 ⁄ 66.600 6 6 Mike MacDonaldRogersville
NBRG 46.639 ⁄ 65.564 4 4 Mike MacDonaldNova Scotia
Upper Tantallon NSUT 44 ⁄ 700 ⁄ 63.883 8 8 Richard LapaixWindsor
NSWN 44.983 ⁄ 64.133 8 8 Richard Lapaix2010 Blackwell Publishing Ltd
RE FUGIAL PERSISTENCE OF A COLD-TOLERANT PLANT 5021
A
C
U
U
G
S
ppendix 1 (Continued)
ountry
� 2010 Blac
State ⁄ Province
kwell Publishing
Location
Ltd
Code
Lat ⁄ Long (N ⁄ W) Nnuc Ncp CollectorBaddeck
NSBD 46.100 ⁄ 60.750 8 8 Richard LapaixOntario
Thunder Bay ONTB 48.550 ⁄ 89.283 8 8 Erika NorthQuebec
Parc Nacional d’Oka QCPO 45.467 ⁄ 74.052 8 8 Stephane BailleulParc Frontenac
QCPF 45.853 ⁄ 71.097 5 5 Andre LapointeMont Manic
QCMM 51.601 ⁄ 68.266 8 8 Andre LapointeSaskatchewan
Hudson Bay SKHB 52.850 ⁄ 102.400 8 8 Glen LeeYukon
Whitehorse YKWH 60.690 ⁄ 135.006 8 8 Bruce BennettKluane Lake
YKKL 61.029 ⁄ 138.408 8 7 Jennie McLeanBoutellier Summit
YKBS 61.033 ⁄ 138.367 8 7 Jennie McLeanSA
Alaska Mount Parish ALMP 57.828 ⁄ 135.145 8 6 Brad KrieckhausNeka River
ALNR 58.072 ⁄ 135.811 8 8 Brad KrieckhausHarlequin Lake
ALHL 59.416 ⁄ 139.013 5 5 Ellen AndersonLower Situk River
ALLS 59.459 ⁄ 139.581 5 5 Ellen AndersonFairbanks Quad
ALFQ 64.936 ⁄ 148.087 8 8 Carolyn ParkerChatanika River
ALCR 65.192 ⁄ 147.259 8 8 Allan BattenMud Creek
UAFM132987 57.150 ⁄ 158.080 5 4 University of Alaska at FairbanksKodiak Island
UAFM157544 57.668 ⁄ 153.258 8 4 University of Alaska at FairbanksTogiak Lake
UAFM113283 59.530 ⁄ 159.700 5 5 University of Alaska at FairbanksMalaspina Forelands
UAFM153489 59.902 ⁄ 139.951 5 2 University of Alaska at FairbanksWeeping Peat
UAFM136860 60.200 ⁄ 143.200 4 4 University of Alaska at FairbanksYukon River Valley
UAFM147332 65.380 ⁄ 142.510 6 4 University of Alaska at FairbanksSeward Peninsula
UAFM112148 65.550 ⁄ 163.860 5 5 University of Alaska at FairbanksKakagrak Hills
UAFM144319 67.270 ⁄ 163.670 6 5 University of Alaska at FairbanksDe Long Mountains
UAFM134760 68.270 ⁄ 159.910 6 6 University of Alaska at FairbanksTonsina Point
ALTP 60.051 ⁄ 149.435 8 7 Matt CarlsonKenai Peninsula
ALKP 60.870 ⁄ 149.630 8 7 Matt CarlsonSA
California Lassen National Forest CALF 40.376 ⁄ 121.333 8 8 Kirsten Bovee ⁄ Chris IveyFort Bidwell
NYBG762091 41.861 ⁄ 120.161 4 4 New York Botanical GardenColorado
Lizard Head COLH 37.867 ⁄ 108.050 8 8 Al SchneiderDome Rock
CODR 38.840 ⁄ 105.190 8 7 Tass Kelso ⁄ George MaentzIdaho
Anderson Creek NYBG737389 43.113 ⁄ 111.271 8 7 New York Botanical GardenMaine
Blueberry Mountain MEBM 44.768 ⁄ 70.480 8 8 Andy CutkoMassachusetts
Elmer Brook MAEB 42.298 ⁄ 72.544 8 8 Karen SearcyMichigan
Orchis Fen MIOF 45.400 ⁄ 84.860 8 5 Melanie GunnMinnesota
Chippewa National Forest MNCF 47.156 ⁄ 94.078 8 8 Ethan PerryGrand Portage
MNGP 48.036 ⁄ 90.037 8 7 Lynden Gerdes ⁄ Chel AndersonMontana
Glacier National Park MTGA 48.485 ⁄ 113.357 8 7 Jennifer Hintz ⁄ Jennifer AsebrookMTGB
48.700 ⁄ 113.367 8 7 Jennifer Hintz ⁄ Jennifer AsebrookMTGC
48.974 ⁄ 114.325 8 6 Jennifer Hintz ⁄ Jennifer AsebrookNevada
Mount Rose Ski Lodge NYBG188324 39.315 ⁄ 119.899 4 2 New York Botanical GardenSchell Creek Range
NYBG188329 39.413 ⁄ 114.599 5 2 New York Botanical GardenNew Hampshire
Waterville Valley NHWV 43.950 ⁄ 71.500 8 8 Jean HoweOregon
Hood River ORHR 45.414 ⁄ 121.790 8 8 Diana JollesUtah
Pine Valley Mountains NYBG188334 37.540 ⁄ 113.602 6 6 New York Botanical GardenEccles Canyon
NYBG188326 39.684 ⁄ 111.156 6 6 New York Botanical GardenLily Lake
NYBG188303 40.695 ⁄ 109.962 3 3 New York Botanical GardenVermont
Ewells Mills Swamp VTEM 44.373 ⁄ 72.169 4 2 Brett EngstromGreensboro
VTGR 44.576 ⁄ 72.296 4 4 Allison StengerWashington
Okanogan NationalForest
WAOF
47.379 ⁄ 121.123 8 7 Helen LauMaverick
WAMA 47.243 ⁄ 120.695 8 8 Helen LauWisconsin
Chaffee Creek WICC 43.950 ⁄ 89.362 8 8 Neil Harrimanreenland
Qeqertarsuaq Sletten GRSL 69.254 ⁄ 53.525 8 8 Marianne Philippiberia
Sakha Anabas River SIAR 72.400 ⁄ 113.500(E) 3 3 Olivier Gilg


![The influence of refugial population on Lateglacial and ...people.geo.su.se/barbara/pdf/Feurdean_et_al_2007_RPP_f[1].pdf · The influence of refugial population on Lateglacial and](https://img.pdfslide.us/doc/110x75/5e0a4f17dfca9e635f10a958/the-influence-of-refugial-population-on-lateglacial-and-1pdf-the-influence.jpg)