Embed Size (px)
Citation preview
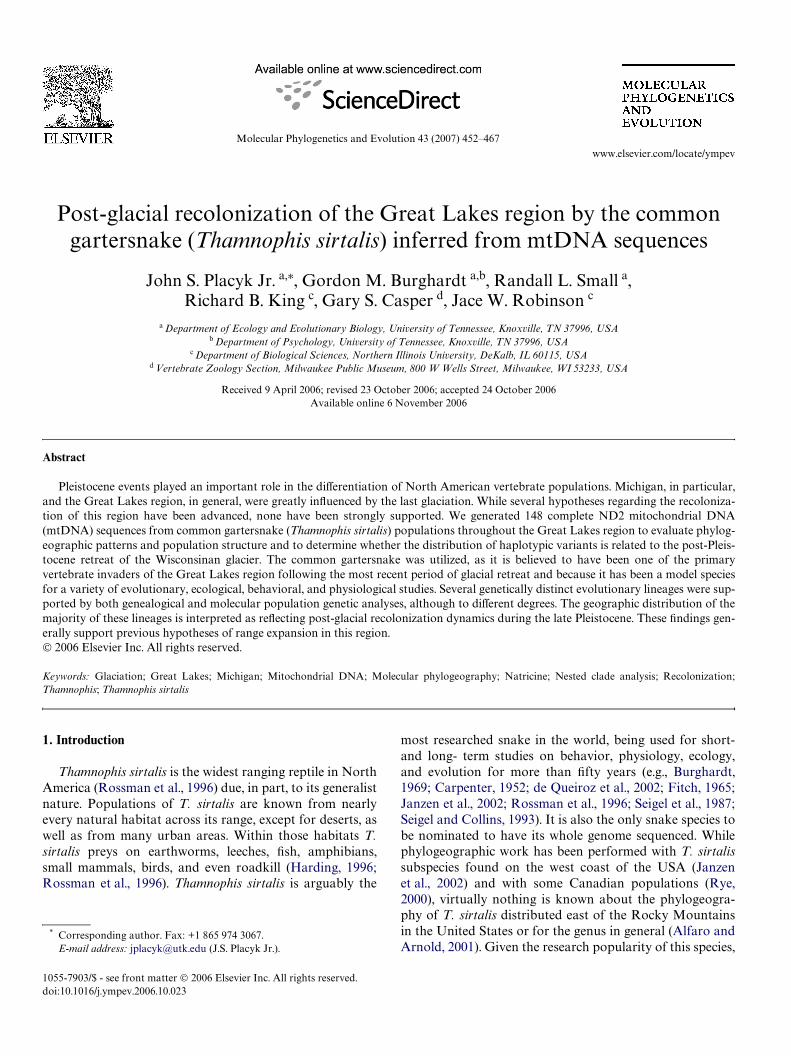
Molecular Phylogenetics and Evolution 43 (2007) 452–467www.elsevier.com/locate/ympev
Post-glacial recolonization of the Great Lakes region by the common gartersnake (Thamnophis sirtalis) inferred from mtDNA sequences
John S. Placyk Jr. a,¤, Gordon M. Burghardt a,b, Randall L. Small a, Richard B. King c, Gary S. Casper d, Jace W. Robinson c
a Department of Ecology and Evolutionary Biology, University of Tennessee, Knoxville, TN 37996, USAb Department of Psychology, University of Tennessee, Knoxville, TN 37996, USA
c Department of Biological Sciences, Northern Illinois University, DeKalb, IL 60115, USAd Vertebrate Zoology Section, Milwaukee Public Museum, 800 W Wells Street, Milwaukee, WI 53233, USA
Received 9 April 2006; revised 23 October 2006; accepted 24 October 2006Available online 6 November 2006
Abstract
Pleistocene events played an important role in the diVerentiation of North American vertebrate populations. Michigan, in particular,and the Great Lakes region, in general, were greatly inXuenced by the last glaciation. While several hypotheses regarding the recoloniza-tion of this region have been advanced, none have been strongly supported. We generated 148 complete ND2 mitochondrial DNA(mtDNA) sequences from common gartersnake (Thamnophis sirtalis) populations throughout the Great Lakes region to evaluate phylog-eographic patterns and population structure and to determine whether the distribution of haplotypic variants is related to the post-Pleis-tocene retreat of the Wisconsinan glacier. The common gartersnake was utilized, as it is believed to have been one of the primaryvertebrate invaders of the Great Lakes region following the most recent period of glacial retreat and because it has been a model speciesfor a variety of evolutionary, ecological, behavioral, and physiological studies. Several genetically distinct evolutionary lineages were sup-ported by both genealogical and molecular population genetic analyses, although to diVerent degrees. The geographic distribution of themajority of these lineages is interpreted as reXecting post-glacial recolonization dynamics during the late Pleistocene. These Wndings gen-erally support previous hypotheses of range expansion in this region.© 2006 Elsevier Inc. All rights reserved.
Keywords: Glaciation; Great Lakes; Michigan; Mitochondrial DNA; Molecular phylogeography; Natricine; Nested clade analysis; Recolonization;Thamnophis; Thamnophis sirtalis
1. Introduction
Thamnophis sirtalis is the widest ranging reptile in NorthAmerica (Rossman et al., 1996) due, in part, to its generalistnature. Populations of T. sirtalis are known from nearlyevery natural habitat across its range, except for deserts, aswell as from many urban areas. Within those habitats T.sirtalis preys on earthworms, leeches, Wsh, amphibians,small mammals, birds, and even roadkill (Harding, 1996;Rossman et al., 1996). Thamnophis sirtalis is arguably the
* Corresponding author. Fax: +1 865 974 3067.E-mail address: [email protected] (J.S. Placyk Jr.).
1055-7903/$ - see front matter © 2006 Elsevier Inc. All rights reserved.doi:10.1016/j.ympev.2006.10.023
most researched snake in the world, being used for short-and long- term studies on behavior, physiology, ecology,and evolution for more than Wfty years (e.g., Burghardt,1969; Carpenter, 1952; de Queiroz et al., 2002; Fitch, 1965;Janzen et al., 2002; Rossman et al., 1996; Seigel et al., 1987;Seigel and Collins, 1993). It is also the only snake species tobe nominated to have its whole genome sequenced. Whilephylogeographic work has been performed with T. sirtalissubspecies found on the west coast of the USA (Janzenet al., 2002) and with some Canadian populations (Rye,2000), virtually nothing is known about the phylogeogra-phy of T. sirtalis distributed east of the Rocky Mountainsin the United States or for the genus in general (Alfaro andArnold, 2001). Given the research popularity of this species,
J.S. Placyk Jr. et al. / Molecular Phylogenetics and Evolution 43 (2007) 452–467 453
it seems timely to examine the phylogeography of T. sirtalisin the more central and eastern parts of its vast range. Wechose to examine the phylogeography of the widest rangingsubspecies of T. sirtalis, the eastern gartersnake, T. s. sir-talis, with an emphasis on the recolonization of Michiganand the Beaver Archipelago of northeastern Lake Michi-gan, following the last glaciation of the Pleistocene.
During the Pleistocene, climatic changes associated withglacial advances and retreats resulted in range reductionsfor a variety of taxa worldwide and most likely inXuencedthe current genetic composition and diversiWcation of thosetaxa (Hewitt, 1996, 2000, 2001). The Great Lakes region ofNorth America, speciWcally, was marked by dramatic cli-mate change, Xuctuating lake levels, and isostatic reboundresulting from a series of glacial and interglacial oscillations(Petty et al., 1996). As recent as 18,000 years before present(ybp), the Wisconsinan glacier covered the majority of thearea occupied by the Midwest region of the United Statesof America, not fully retreating until ca. 10,000 ybp (Ander-son and Lewis, 1992; Larsen, 1987; Webb et al., 1993).These events had a dramatic eVect on the distribution oftaxa in this region, with the current inhabitants recoloniz-ing only relatively recently after the retreat of the glaciers(e.g., Holman, 1992, 1998). Without taking into accountthese historical events, the current distributions and under-lying genetics of taxa in this region and other areas inXu-
enced by the events of the Pleistocene cannot be fullyunderstood. To date, most studies on the phylogeographicimpact of Pleistocene events on North American taxa havebeen conducted on southern or western continental species,with few such studies focusing on taxa that have recolon-ized previously glaciated regions (Austin et al., 2002;Ayoub and Reichert, 2004; Bernatchez and Dodson, 1991;Billington et al., 1992; Fuerst and Austin, 2004; Green et al.,1996; Hewitt, 1999, 2000, 2001; Janzen et al., 2002; Smithand Green, 2004; Zamudio and Savage, 2003). Therefore,our study not only adds to our knowledge of T. sirtalisecology and evolution, but also provides us with one of fewphylogeographic studies on a member of the Midwestfauna.
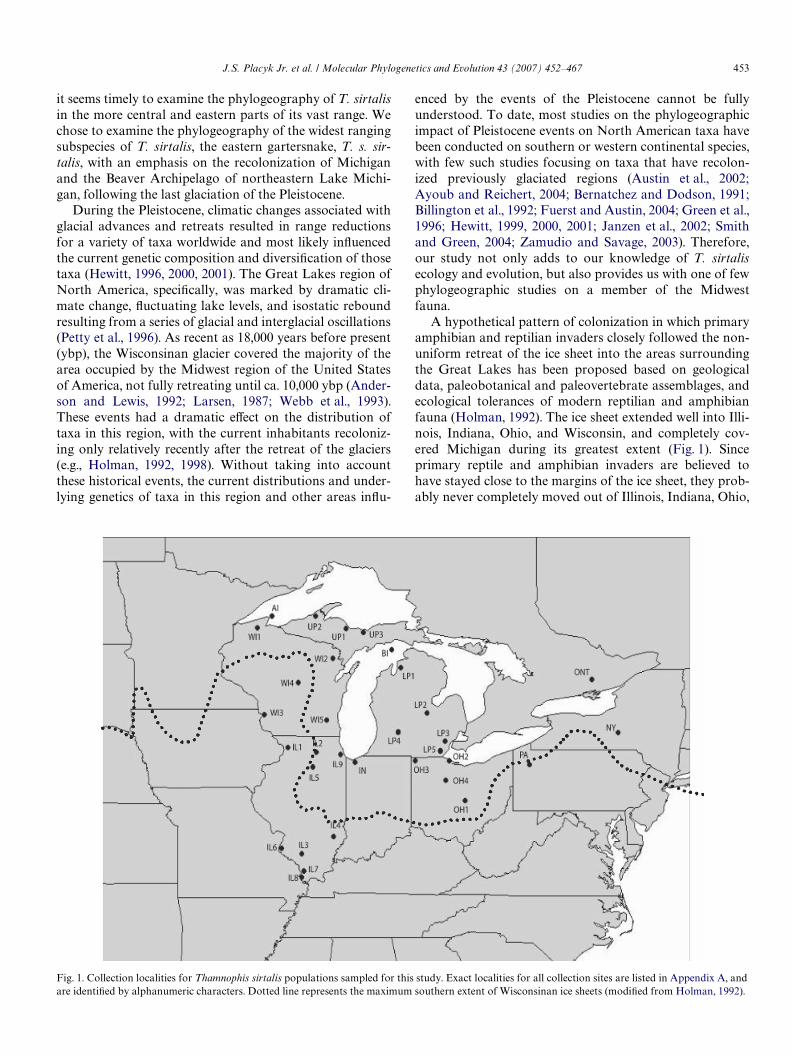
A hypothetical pattern of colonization in which primaryamphibian and reptilian invaders closely followed the non-uniform retreat of the ice sheet into the areas surroundingthe Great Lakes has been proposed based on geologicaldata, paleobotanical and paleovertebrate assemblages, andecological tolerances of modern reptilian and amphibianfauna (Holman, 1992). The ice sheet extended well into Illi-nois, Indiana, Ohio, and Wisconsin, and completely cov-ered Michigan during its greatest extent (Fig. 1). Sinceprimary reptile and amphibian invaders are believed tohave stayed close to the margins of the ice sheet, they prob-ably never completely moved out of Illinois, Indiana, Ohio,
Fig. 1. Collection localities for Thamnophis sirtalis populations sampled for this study. Exact localities for all collection sites are listed in Appendix A, andare identiWed by alphanumeric characters. Dotted line represents the maximum southern extent of Wisconsinan ice sheets (modiWed from Holman, 1992).
454 J.S. Placyk Jr. et al. / Molecular Phylogenetics and Evolution 43 (2007) 452–467
and Wisconsin. However, Michigan populations must haveeither become locally extinct or retreated to more southerlystates not aVected by the ice sheet. As the ice sheet retreatedand Michigan became exposed, invaders are believed tohave entered the lower peninsula of Michigan from Indianaand Ohio, and the upper peninsula of Michigan from Wis-consin. Individuals are also believed to have colonizedsouthern Ontario, Canada through the gap between LakeErie and Lake Huron via Michigan. In addition to thehypothesized patterns of mainland recolonization, hypoth-eses regarding the recolonization of the archipelagos foundin each lake have also been generated and vary from islandsystem to island system. For our study, we not only sam-pled from mainland sites throughout the Great Lakesregion, but also from an archipelago in Lake Michigan thatmay provide further support for the two-front Michiganrecolonization hypothesis.
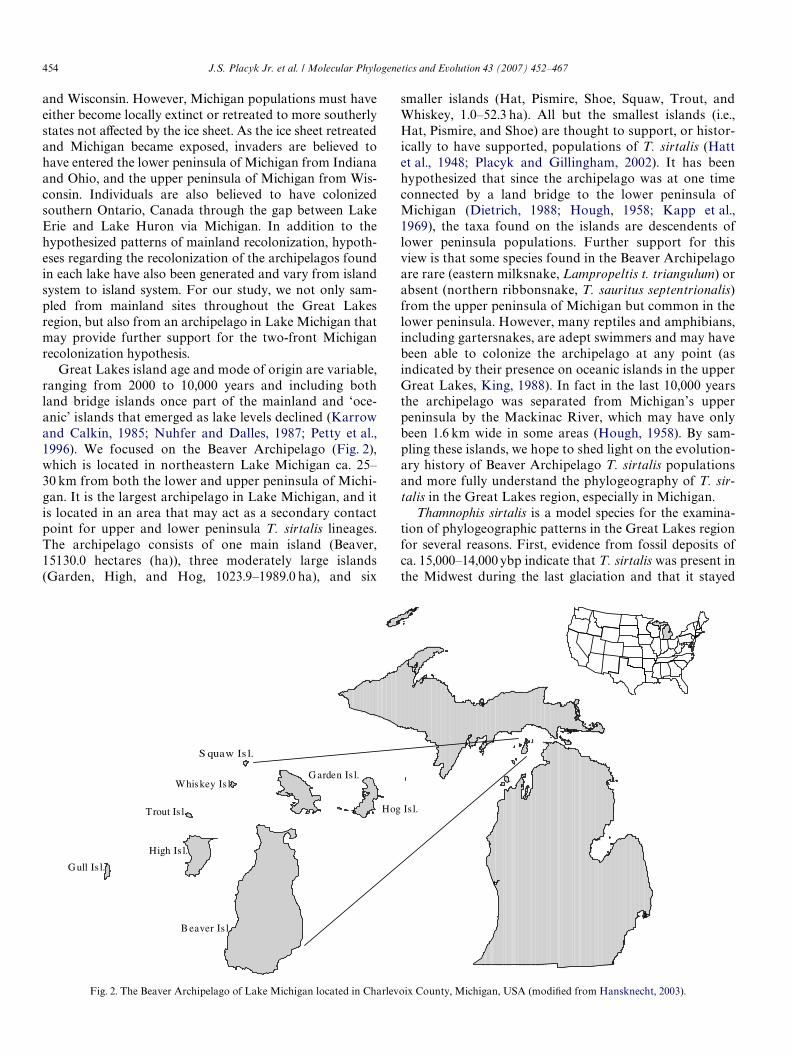
Great Lakes island age and mode of origin are variable,ranging from 2000 to 10,000 years and including bothland bridge islands once part of the mainland and ‘oce-anic’ islands that emerged as lake levels declined (Karrowand Calkin, 1985; Nuhfer and Dalles, 1987; Petty et al.,1996). We focused on the Beaver Archipelago (Fig. 2),which is located in northeastern Lake Michigan ca. 25–30 km from both the lower and upper peninsula of Michi-gan. It is the largest archipelago in Lake Michigan, and itis located in an area that may act as a secondary contactpoint for upper and lower peninsula T. sirtalis lineages.The archipelago consists of one main island (Beaver,15130.0 hectares (ha)), three moderately large islands(Garden, High, and Hog, 1023.9–1989.0 ha), and six
smaller islands (Hat, Pismire, Shoe, Squaw, Trout, andWhiskey, 1.0–52.3 ha). All but the smallest islands (i.e.,Hat, Pismire, and Shoe) are thought to support, or histor-ically to have supported, populations of T. sirtalis (Hattet al., 1948; Placyk and Gillingham, 2002). It has beenhypothesized that since the archipelago was at one timeconnected by a land bridge to the lower peninsula ofMichigan (Dietrich, 1988; Hough, 1958; Kapp et al.,1969), the taxa found on the islands are descendents oflower peninsula populations. Further support for thisview is that some species found in the Beaver Archipelagoare rare (eastern milksnake, Lampropeltis t. triangulum) orabsent (northern ribbonsnake, T. sauritus septentrionalis)from the upper peninsula of Michigan but common in thelower peninsula. However, many reptiles and amphibians,including gartersnakes, are adept swimmers and may havebeen able to colonize the archipelago at any point (asindicated by their presence on oceanic islands in the upperGreat Lakes, King, 1988). In fact in the last 10,000 yearsthe archipelago was separated from Michigan’s upperpeninsula by the Mackinac River, which may have onlybeen 1.6 km wide in some areas (Hough, 1958). By sam-pling these islands, we hope to shed light on the evolution-ary history of Beaver Archipelago T. sirtalis populationsand more fully understand the phylogeography of T. sir-talis in the Great Lakes region, especially in Michigan.
Thamnophis sirtalis is a model species for the examina-tion of phylogeographic patterns in the Great Lakes regionfor several reasons. First, evidence from fossil deposits ofca. 15,000–14,000 ybp indicate that T. sirtalis was present inthe Midwest during the last glaciation and that it stayed
Fig. 2. The Beaver Archipelago of Lake Michigan located in Charlevoix County, Michigan, USA (modiWed from Hansknecht, 2003).
J.S. Placyk Jr. et al. / Molecular Phylogenetics and Evolution 43 (2007) 452–467 455
close to the margins of the retreating glacier (Holman,2000). Holman (1992) considers it to be one of the primaryvertebrate invaders of the postglacial Midwest. Second,T. sirtalis is currently considered the most common reptilespecies in the region, occurring in almost every county andon every Great Lakes archipelago (Harding, 1996) makingthe collection of specimens and tissue samples for our studyrelatively simple. Finally, molecular resources (e.g., mtDNAand microsatellite primers) have been developed for thisspecies and are readily available (e.g., Garner et al., 2002,2004; Garner and Larsen, 2005; Kumazawa et al., 1996;McCracken et al., 1999).
While the hypotheses on the postglacial recolonizationof the Great Lakes region discussed above are based on fos-sil and other geological data, they have not yet been speciW-cally tested with any other type of data with few exceptions(e.g., Smith and Green (2004) used mitochondrial DNAsequences with toad, Bufo fowleri, populations locatedaround Lake Erie). Our goal is to use phylogeographic andpopulation genetic analysis of mtDNA sequence data totest hypotheses regarding the recolonization of the GreatLakes region and speciWcally of Michigan and the BeaverArchipelago following the last glaciation. Michigan servesas the focal point for this work, because this study is part ofa broader project that is examining geographic variation inthe phenotypic traits of Beaver Archipelago T. sirtalis pop-ulations and populations from the surrounding mainland(Placyk, 2006). Using mitochondrial DNA (mtDNA)sequences to reconstruct phylogenetic relationships amongT. sirtalis from the Great Lakes region, we address severalimportant evolutionary issues to help understand recoloni-zation following the last glaciation. In particular, we areinterested in (I) how populations are genetically structuredwithin the Great Lakes region, especially in Michigan, and(II) if this structuring and the pattern of haplotypic varia-tion are consistent with historical geography. In addition,our work will provide the Wrst such study on a reptile fromthis region, as well as much needed data on recolonizationof previously glaciated areas in the Great Lakes region ingeneral.
2. Methods
2.1. Taxon sampling
Mitochondrial haplotypic variation was examined in148 individuals of T. s. sirtalis from 37 locations (Fig. 1,Appendix A). Sampling was concentrated in sites surround-ing and within Lake Michigan to examine Wne scale pat-terns of haplotypic variation with additional sites examinedfrom across much of the eastern Midwest states (i.e., Illi-nois, Indiana, Michigan, Ohio, and Wisconsin), Pennsylva-nia, and Ontario, Canada to begin to resolve largergeographic patterns of haplotype radiation following theWisconsinan glaciation. We also heavily focused samplingeVorts in the Beaver Archipelago of northeastern LakeMichigan as the evolutionary history of taxa on these
islands is a point of some controversy (Hatt et al., 1948)and it may act as a point of secondary contact for two lin-eages. Samples were obtained from numerous sources asfrozen muscle tissue or tail tips from live specimens and aspreviously extracted DNA (see Appendix A for sources).Many times voucher specimens were collected, but a smallfraction of our sources did not have vouchers available(Appendix A). This was deemed appropriate, as themtDNA region we ampliWed (i.e., ND2) is known to diVersigniWcantly between T. sirtalis and the Wve other Thamno-phis species (i.e., T. butleri, T. brachystoma, T. radix,T. sauritus, T. proximus) that may occur sympatrically withT. sirtalis throughout our sampling range (Alfaro andArnold, 2001; Placyk, unpub. data) and as a result, couldeasily be eliminated from our alignment.
2.2. DNA extraction and sequencing
For most individuals, we used tail tips to obtain totalgenomic DNA with the DNeasy® Tissue Kit (Qiagen). Theentire »1020 bases of ND2 were PCR-ampliWed using theforward primer L4437b (5�-CAG CTA AAA AAG CTATCG GGC CCA TAC C-3�; Kumazawa et al., 1996), whichlies in the tRNA-Met upstream of ND2, and the reverseprimer Sn-ND2r (5�-GGC TTT GAA GGC TMC TAGTTT-3�; R. Lawson, pers. comm.), which lies in the tRNA-Trp downstream of ND2. Polymerase chain reactions(PCR) were conducted in 25-�L volumes with 1.0 �L DNA,1£ ExTaq PCR buVer (PanVera/TaKaRa), 1.5 mM MgCl2,0.2 mM dNTPs, 0.2 �g/�L bovine serum albumin, 0.1 mMeach primer, and 1.25 U of ExTaq polymerase (Panvera/TaKaRa). AmpliWcation conditions involved 30 cycles eachconsisting of 1 min of denaturing at 94 °C, 1 min of primerannealing at 55 °C, and 1.5 min of extension at 72 °C. A neg-ative control was included for all PCRs. PCR productswere puriWed prior to sequencing using ExoSAP-IT™(USB Corporation).
Sequencing reactions were carried out using the internalprimers H5382 (5�-GTG TGG GCR ATT CAT GA-3�)and L5238 (5�-ACM TGA CAA AAA ATY GC-3�) (deQueiroz et al., 2002) and Big Dye® Terminator v3.1 CycleSequencing kits (Applied Biosystems), and read on an auto-mated sequencer (Applied Biosystems 3100, University ofTennessee Molecular Biology Resource Facility).Sequences were edited using the program Sequencher 3.1.1(Gene Codes Corporation, Ann Arbor, MI). Alignmentswere performed initially using Clustal X (Thompson et al.,1997) and subsequently manually reWned. The sequencealignment is available either from the corresponding authoror from TreeBase (Study Accession No. S1622; MatrixAccession No. M2922).
2.3. Data analyses
Network analysis to estimate a gene genealogy was car-ried out using TCS 1.13 (Clement et al., 2000) which imple-ments the Templeton et al. (1992) statistical parsimony
456 J.S. Placyk Jr. et al. / Molecular Phylogenetics and Evolution 43 (2007) 452–467
procedure. The haplotype network was then converted intoa series of nested clades (Templeton, 1998) for interpreta-tion and for use in statistical analyses of geographic vs.genetic variation (see below). Ambiguous connections(loops or reticulations) in the haplotype network wereresolved using approaches from coalescent theory (seeCrandall, 1994). In the case of DNA sequence data, this res-olution generally involves a comparison of the probabilitiesof whether a haplotype arose via mutation from either ahigh- or low- frequency haplotype. Coalescent theorywould suggest that, based on these probabilities, the newhaplotype arose from the higher-frequency haplotype. Inaddition to the ND2 sequences generated for this study,one from Carroll County, IL (Janzen et al., 2002; GenBankAccession No. AY136236) and one from Cortland County,NY (Janzen et al., 2002; GenBank Accession No.AY136237) were included in our network analysis.
Statistical analyses of geographic/genealogical associa-tions were conducted using GeoDis ver. 2.0 (Posada et al.,2000). All statistical analyses in GeoDis were performedusing 10,000 (Monte Carlo) replications. Results obtainedfrom GeoDis were then interpreted using the revised infer-ence key of Templeton (1998, 2004).
The population genetic structure elucidated by our net-work analysis was further assessed and supported by per-forming analysis of molecular variance (AMOVA). �statistics (analogous to the F-statistics of Wright, 1965),were calculated using ARLEQUIN ver. 2.000 (ExcoYeret al., 1992; Schneider et al., 2000). Two sets of analyseswere performed by grouping individuals. These groups rep-resent the highest level of genetic apportionment. The Wrstanalysis grouped individuals into clades based on ournested clade analysis (see below), while our second analysisdivided individuals into seven geographic groups (Ohio,Indiana, Illinois, Wisconsin, lower peninsula of Michigan,upper peninsula of Michigan, and the Beaver Archipelagoof Lake Michigan). Michigan was split into three separategeographic groups, as none of the three are currentlydirectly connected to each other. The group apportionmentof variation with respect to all haplotypes is described by�CT, while �SC describes the apportionment within popula-tions of the deWned groups, and �ST refers to the variationin a single population relative to all haplotypes. TheAMOVA assumes that groupings represent populationsand that the populations are in drift-migration equilibrium,conditions that may be unrealistic for combined populationgroupings. Levels of signiWcance of the � statistics weredetermined through 1000 permutation replicates.
In addition to employing a gene genealogy approach, weperformed phylogenetic analyses of the ND2 data under thecriterion of maximum likelihood (ML) as implemented inPAUP¤ (SwoVord, 2002). Gene genealogical approaches areusually used for intraspeciWc analyses because they allowancestral haplotypes to exist at internal nodes, which moreaccurately reXects haplotype relationships. Genealogicalapproaches such as statistical parsimony implemented inTCS (Clement et al., 2000), however, may be unable to
connect all sequences into a single network if divergencebetween sequences is large. Thus we used ML analysis tocomplement the genealogical analysis, assess relationshipsamong major clades, and root the tree. For our ML analysis,we used the hierarchical likelihood ratio test from Modeltest(Posada and Crandall, 1998) to determine the appropriateML model for the analysis. The model we used was the HKY+ G. ML analyses were conducted with 100 randomsequence addition heuristic search replicates with tree-bisec-tion-reconnection (TBR) branch swapping. Bootstrap analy-sis was employed to assess internal support for the inferredphylogeny using 100 bootstrap replicates with simple taxonaddition heuristic searches and TBR branch swapping.
In addition to the sequences used in the network analysiswe included in the ML analysis sequences of T. sirtalis fromwestern N. America reported by Alfaro and Arnold (2001)(nD1), de Queiroz et al. (2002) (nD1), and Janzen et al. (2002)(nD32) to assess the relationship among Midwest/eastern andwestern N. American T. sirtalis populations. To root the MLtree we included sequences of T. elegans (Janzen et al., 2002;GenBank Accession No. AY136238), T. proximus (Alfaroand Arnold, 2001; de Queiroz et al., 2002; GenBank Acces-sion No. AF383847, AF420163) and T. sauritus (de Queirozet al., 2002; GenBank no. AF420179). These taxa were chosenbased on broad-scale phylogenetic analyses of Thamnophisphylogeny (Alfaro and Arnold, 2001; de Queiroz et al., 2002)that show T. proximus and T. sauritus as sister to T. sirtalis,with T. elegans representing a more distant outgroup.
3. Results
3.1. Sequence variation
We obtained complete ND2 sequences for 148 T. sirtalisindividuals from 37 populations. Thirty six unique haplo-types (GenBank Accession No. DQ995362–DQ995397)were detected in these 148 sequences. Of the 1101 bp used inanalyses, 72 were variable, and 56 were phylogeneticallyinformative. With up to 6.5% divergence betweensequences, the populations used in our study express moreintraspeciWc mtDNA sequence divergence than many otherspecies of gartersnake (2.5% in the Mexican gartersnake(T. eques); de Queiroz and Lawson, 1994; 5.5% in the terres-trial gartersnake (T. elegans); de Queiroz and Lawson,1994) including previous estimates for T. sirtalis (2.5%; Jan-zen et al., 2002). No stop codons or indels were detected inany of our sequences indicating the functionality of theND2 gene. Using the program DnaSP (Rozas and Rozas,1999), we found that 19 of the 72 variable sites representednonsynonymous substitutions, which may be under selec-tion (Zink, 2005), and thus may confound our geneaologi-cal and phylogenetic analyses. However, only nine of thesewere phylogenetically informative sites (of 56 total phylo-genetically informative sites) and of those only two weredistributed in populations that were geographically isolatedfrom each other. Removing these two sites from our analy-ses resulted in no diVerence in the structure of either our

J.S. Placyk Jr. et al. / Molecular Phylogenetics and Evolution 43 (2007) 452–467 457
nested cladogram or our maximum likelihood tree; there-fore, they were kept in the data set for all analyses, as it ispossible that they resulted from geographical isolationrather than selection (Zink, 2005). In addition, a Tajima’sTest (Tajima’s DD¡1.07, P > 0.10), Fu and Li’s Tests (Fuand Li’s D¤ test statisticD¡1.22, Fu and Li’s F¤ teststatisticD¡1.40, P > 0.10), and a McDonald and KreitmanTest (Neutrality IndexD1.46, Fisher’s exact test two-tailedP-valueD 0.42), all conducted using DnaSP (Rozas andRozas, 1999), support the neutrality of our data. Therefore,if selection is acting on these sites, it appears to be negligi-bly inXuencing our phylogeographic hypotheses.
3.2. Nested clade analyses
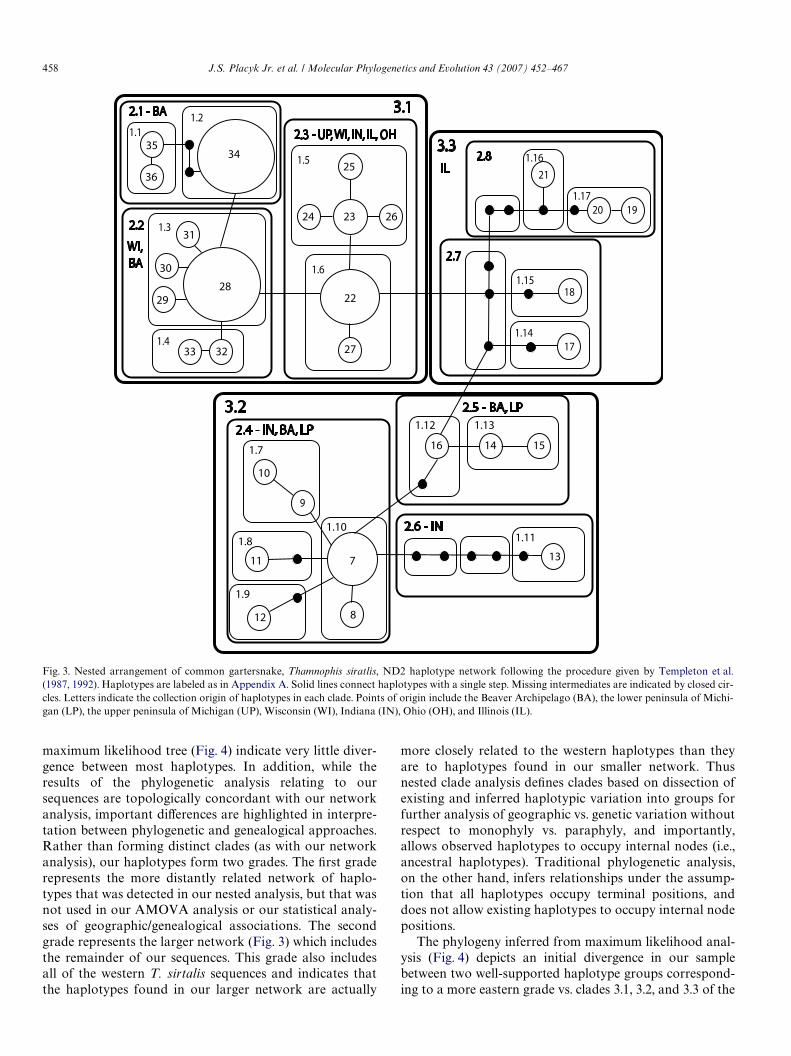
Gene genealogy reconstruction resulted in two indepen-dent networks that could not be connected with 95% conW-dence levels by the statistical parsimony approachimplemented in TCS (Templeton et al., 1987). The smallernetwork, which includes six haplotypes from localities inOhio, Illinois, Pennsylvania, southern Michigan, andOntario, Canada, is far removed from the remaining net-work (over 25 mutational steps) and mostly includes asmall number of sequences from poorly sampled locationsfrom the outskirts of the area of interest for this study. As aresult, it and the haplotypes within it were not used in ourstatistical analyses of geographic/genealogical associationsor our AMOVA analyses. These haplotypes are, however,utilized in our maximum likelihood analysis to help under-stand the more broad-scale implications of our data. Thelarger network includes 30 haplotypes from localitiesthroughout our entire sampling range, except Ontario.Each of the 37 haplotypes from both networks wereassigned a number, 1 to 37, and the localities they representare detailed in the Appendix A. The nested cladogram rep-resenting our second network (Fig. 3), as well as or maxi-mum likelihood tree also utilize these numbers (Fig. 4).
Nesting procedures resulted in three levels of nested clades(Fig. 3). At the highest level of nesting, three clades were rec-ognized (3.1, 3.2, 3.3). The Wrst and largest (3.1, 15 haplotypes,87 individuals with 38 from the Beaver Archipelago) is splitinto three main clades (2.1, 2.2, 2.3). Clade 2.1 is the mostrestricted, including only individuals from the Beaver Archi-pelago; clade 2.2 is comprised of individuals from Wisconsinand the Beaver Archipelago, and clade 2.3, which is basal toclades 2.1 and 2.2, is the most widespread including individu-als from the upper peninsula of Michigan, Wisconsin, theApostle Islands of Lake Superior, Indiana, Illinois, and Ohio.The second largest level three clade (3.2, 10 haplotypes, 28individuals with nine from the Beaver Archipelago) is alsosplit into three smaller clades (2.4, 2.5, 2.6). Clade 2.6 is themost restricted, represented by only one individual fromIndiana, clade 2.5 includes individuals from the BeaverArchipelago and the lower peninsula of Michigan, and clade2.4, which is basal to clades 2.5 and 2.6, is the most wide-spread with individuals from Indiana, the Beaver Archipel-ago, and the lower peninsula of Michigan. The third and
smallest level three clade (3.3, 5 haplotypes, 5 individuals) isfurther broken down into two main clades (2.7, 2.8) both ofwhich include sequences from Illinois individuals only.
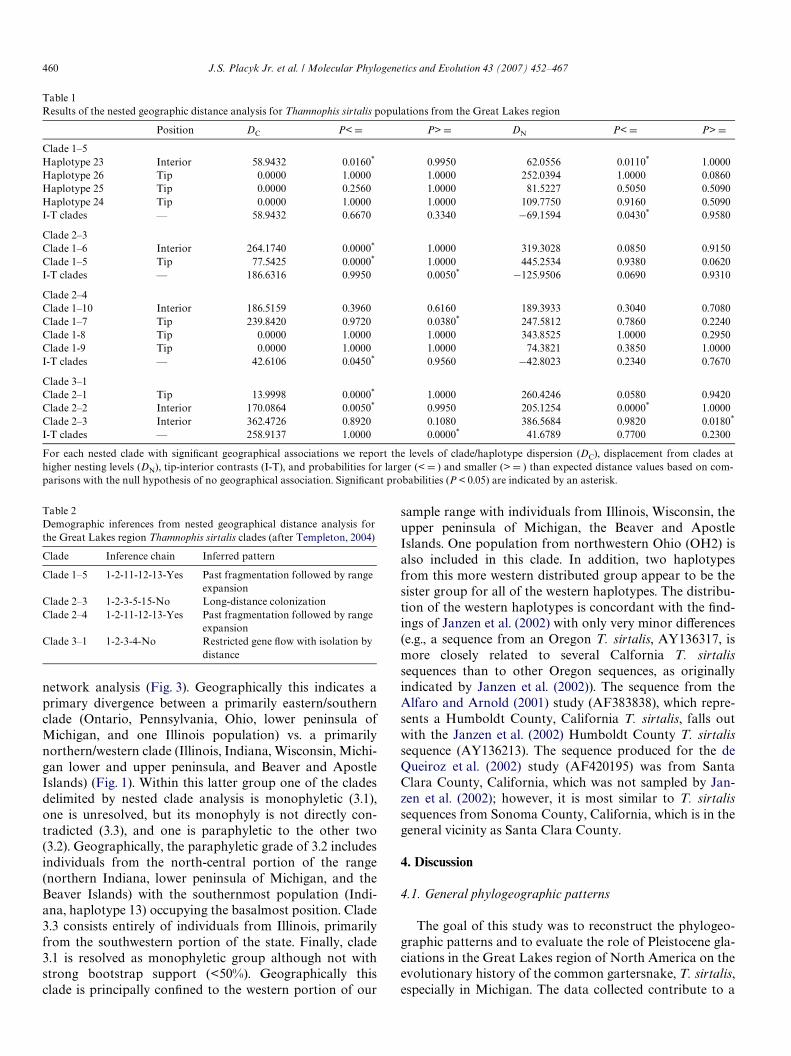
Our haplotype network illustrates that tip haplotypes(nD20) are more widespread geographically than ancestral(internal) haplotypes (nD11), an expectation of rangeexpansion, and this is supported by our nested distanceanalysis of the dispersion of the clades. The analysis suggeststhat four nested groups in the overall nested cladogramshow geographic distributions that are signiWcantly diVerentfrom random expectations (Table 1). We infer from thesepatterns of genetic variation that past fragmentation, fol-lowed by both contiguous range expansion and long dis-tance colonization has occurred throughout the Midwest(Table 2). In addition, patterns of isolation by distance, sug-gesting reduced gene Xow, occur between the Beaver Archi-pelago and mainland populations (Table 2). In particular,clade 1.5 (with individuals from the upper peninsula ofMichigan, Wisconsin, and the Apostle Islands) and clade 2.4(with individuals from Indiana, the Beaver Archipelago, andthe lower peninsula of Michigan) both exhibit patterns ofgenetic diVerentiation that indicate past fragmentation fol-lowed by range expansion. Clade 2.3 (upper peninsula ofMichigan, Wisconsin, Apostle Islands, Indiana, Illinois,Ohio) shows evidence of long-distance colonization. Geneticvariation in clade 3.1, which includes the majority ofsequences from the Beaver Archipelago populations (as wellas Illinois, Wisconsin, Indiana, and Ohio), is characterizedby restricted gene Xow with isolation by distance.
3.3. Analyses of molecular variance
The AMOVA conducted with the nested clade clustersrevealed signiWcant genetic structuring across all hierarchi-cal levels (all P < 0.0001). Overall, 70.53% of the variationwas a result of diVerences among the three clusters (i.e.,clades 3.1–3.3) (�CTD 0.71). 13.51% of the total variationresulted from diVerences among populations within thesegroups (�SCD0.46) and 15.95% was due to variation withinpopulations (�STD0.84). When individuals were groupedinto the seven geographic regions deWned in the methods,signiWcant genetic structuring existed across all hierarchicallevels (all P < 0.05), but only 16.23% of the variation was aresult of diVerences among the groupings (�CTD 0.16). Theremainder of the total variation resulted from diVerencesamong populations of these groups (42.81%, �SCD0.51)and within populations (40.95%, �STD 0.59).
3.4. Phylogenetic analyses
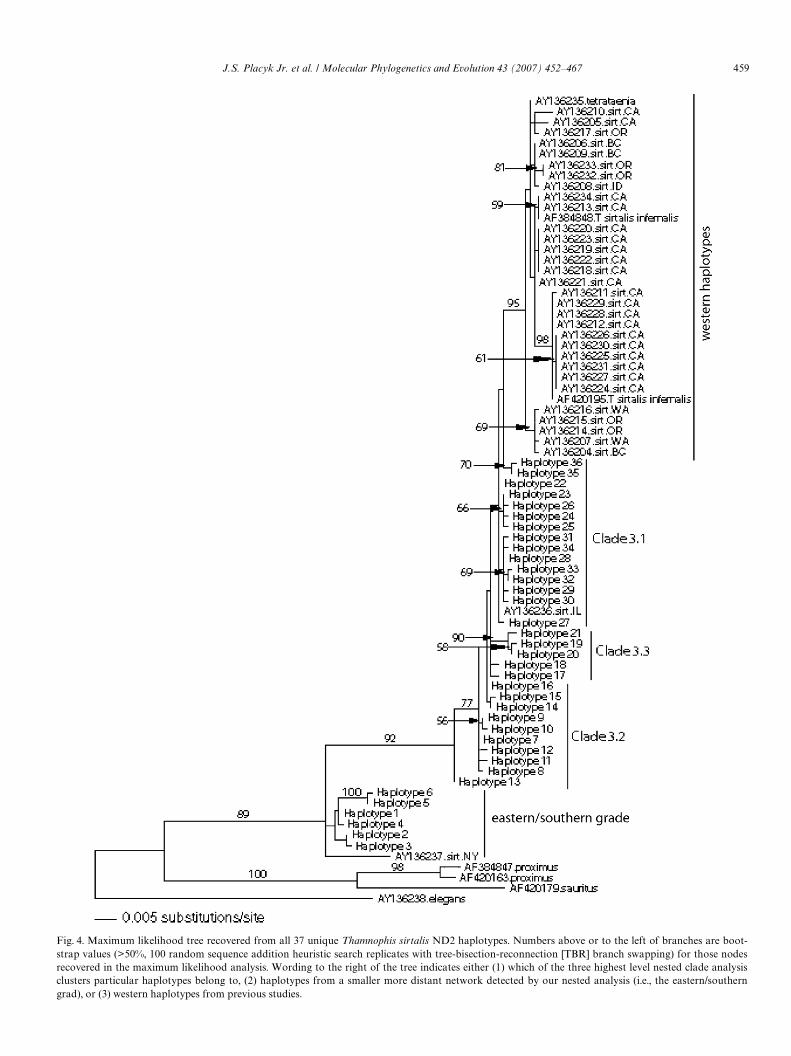
To reduce the computational time, maximum likelihoodanalysis was performed on the 37 unique haplotypes ratherthan on all 148 individual sequences (Fig. 3). In addition,as noted above, all sequences used by Janzen et al. (2002)were also included in this analysis, as well as one sequenceeach from Alfaro and Arnold (2001) and de Queiroz et al.(2002). Note that the very short branch lengths of our
458 J.S. Placyk Jr. et al. / Molecular Phylogenetics and Evolution 43 (2007) 452–467
maximum likelihood tree (Fig. 4) indicate very little diver-gence between most haplotypes. In addition, while theresults of the phylogenetic analysis relating to oursequences are topologically concordant with our networkanalysis, important diVerences are highlighted in interpre-tation between phylogenetic and genealogical approaches.Rather than forming distinct clades (as with our networkanalysis), our haplotypes form two grades. The Wrst graderepresents the more distantly related network of haplo-types that was detected in our nested analysis, but that wasnot used in our AMOVA analysis or our statistical analy-ses of geographic/genealogical associations. The secondgrade represents the larger network (Fig. 3) which includesthe remainder of our sequences. This grade also includesall of the western T. sirtalis sequences and indicates thatthe haplotypes found in our larger network are actually
more closely related to the western haplotypes than theyare to haplotypes found in our smaller network. Thusnested clade analysis deWnes clades based on dissection ofexisting and inferred haplotypic variation into groups forfurther analysis of geographic vs. genetic variation withoutrespect to monophyly vs. paraphyly, and importantly,allows observed haplotypes to occupy internal nodes (i.e.,ancestral haplotypes). Traditional phylogenetic analysis,on the other hand, infers relationships under the assump-tion that all haplotypes occupy terminal positions, anddoes not allow existing haplotypes to occupy internal nodepositions.
The phylogeny inferred from maximum likelihood anal-ysis (Fig. 4) depicts an initial divergence in our samplebetween two well-supported haplotype groups correspond-ing to a more eastern grade vs. clades 3.1, 3.2, and 3.3 of the
Fig. 3. Nested arrangement of common gartersnake, Thamnophis siratlis, ND2 haplotype network following the procedure given by Templeton et al.(1987, 1992). Haplotypes are labeled as in Appendix A. Solid lines connect haplotypes with a single step. Missing intermediates are indicated by closed cir-cles. Letters indicate the collection origin of haplotypes in each clade. Points of origin include the Beaver Archipelago (BA), the lower peninsula of Michi-gan (LP), the upper peninsula of Michigan (UP), Wisconsin (WI), Indiana (IN), Ohio (OH), and Illinois (IL).
J.S. Placyk Jr. et al. / Molecular Phylogenetics and Evolution 43 (2007) 452–467 459
grad), or (3) western haplotypes from previous studies.
Fig. 4. Maximum likelihood tree recovered from all 37 unique Thamnophis sirtalis ND2 haplotypes. Numbers above or to the left of branches are boot-strap values (>50%, 100 random sequence addition heuristic search replicates with tree-bisection-reconnection [TBR] branch swapping) for those nodesrecovered in the maximum likelihood analysis. Wording to the right of the tree indicates either (1) which of the three highest level nested clade analysisclusters particular haplotypes belong to, (2) haplotypes from a smaller more distant network detected by our nested analysis (i.e., the eastern/southern
460 J.S. Placyk Jr. et al. / Molecular Phylogenetics and Evolution 43 (2007) 452–467
network analysis (Fig. 3). Geographically this indicates aprimary divergence between a primarily eastern/southernclade (Ontario, Pennsylvania, Ohio, lower peninsula ofMichigan, and one Illinois population) vs. a primarilynorthern/western clade (Illinois, Indiana, Wisconsin, Michi-gan lower and upper peninsula, and Beaver and ApostleIslands) (Fig. 1). Within this latter group one of the cladesdelimited by nested clade analysis is monophyletic (3.1),one is unresolved, but its monophyly is not directly con-tradicted (3.3), and one is paraphyletic to the other two(3.2). Geographically, the paraphyletic grade of 3.2 includesindividuals from the north-central portion of the range(northern Indiana, lower peninsula of Michigan, and theBeaver Islands) with the southernmost population (Indi-ana, haplotype 13) occupying the basalmost position. Clade3.3 consists entirely of individuals from Illinois, primarilyfrom the southwestern portion of the state. Finally, clade3.1 is resolved as monophyletic group although not withstrong bootstrap support (<50%). Geographically thisclade is principally conWned to the western portion of our
Table 2Demographic inferences from nested geographical distance analysis forthe Great Lakes region Thamnophis sirtalis clades (after Templeton, 2004)
Clade Inference chain Inferred pattern
Clade 1–5 1-2-11-12-13-Yes Past fragmentation followed by range expansion
Clade 2–3 1-2-3-5-15-No Long-distance colonizationClade 2–4 1-2-11-12-13-Yes Past fragmentation followed by range
expansionClade 3–1 1-2-3-4-No Restricted gene Xow with isolation by
distance
sample range with individuals from Illinois, Wisconsin, theupper peninsula of Michigan, the Beaver and ApostleIslands. One population from northwestern Ohio (OH2) isalso included in this clade. In addition, two haplotypesfrom this more western distributed group appear to be thesister group for all of the western haplotypes. The distribu-tion of the western haplotypes is concordant with the Wnd-ings of Janzen et al. (2002) with only very minor diVerences(e.g., a sequence from an Oregon T. sirtalis, AY136317, ismore closely related to several Calfornia T. sirtalissequences than to other Oregon sequences, as originallyindicated by Janzen et al. (2002)). The sequence from theAlfaro and Arnold (2001) study (AF383838), which repre-sents a Humboldt County, California T. sirtalis, falls outwith the Janzen et al. (2002) Humboldt County T. sirtalissequence (AY136213). The sequence produced for the deQueiroz et al. (2002) study (AF420195) was from SantaClara County, California, which was not sampled by Jan-zen et al. (2002); however, it is most similar to T. sirtalissequences from Sonoma County, California, which is in thegeneral vicinity as Santa Clara County.
4. Discussion
4.1. General phylogeographic patterns
The goal of this study was to reconstruct the phylogeo-graphic patterns and to evaluate the role of Pleistocene gla-ciations in the Great Lakes region of North America on theevolutionary history of the common gartersnake, T. sirtalis,especially in Michigan. The data collected contribute to a
Table 1Results of the nested geographic distance analysis for Thamnophis sirtalis populations from the Great Lakes region
For each nested clade with signiWcant geographical associations we report the levels of clade/haplotype dispersion (DC), displacement from clades athigher nesting levels (DN), tip-interior contrasts (I-T), and probabilities for larger (< D ) and smaller (> D ) than expected distance values based on com-parisons with the null hypothesis of no geographical association. SigniWcant probabilities (P < 0.05) are indicated by an asterisk.
Position DC P< D P> D DN P< D P> D
Clade 1–5Haplotype 23 Interior 58.9432 0.0160* 0.9950 62.0556 0.0110* 1.0000Haplotype 26 Tip 0.0000 1.0000 1.0000 252.0394 1.0000 0.0860Haplotype 25 Tip 0.0000 0.2560 1.0000 81.5227 0.5050 0.5090Haplotype 24 Tip 0.0000 1.0000 1.0000 109.7750 0.9160 0.5090I-T clades — 58.9432 0.6670 0.3340 ¡69.1594 0.0430* 0.9580
Clade 2–3Clade 1–6 Interior 264.1740 0.0000* 1.0000 319.3028 0.0850 0.9150Clade 1–5 Tip 77.5425 0.0000* 1.0000 445.2534 0.9380 0.0620I-T clades — 186.6316 0.9950 0.0050* ¡125.9506 0.0690 0.9310
Clade 2–4Clade 1–10 Interior 186.5159 0.3960 0.6160 189.3933 0.3040 0.7080Clade 1–7 Tip 239.8420 0.9720 0.0380* 247.5812 0.7860 0.2240Clade 1-8 Tip 0.0000 1.0000 1.0000 343.8525 1.0000 0.2950Clade 1-9 Tip 0.0000 1.0000 1.0000 74.3821 0.3850 1.0000I-T clades — 42.6106 0.0450* 0.9560 ¡42.8023 0.2340 0.7670
Clade 3–1Clade 2–1 Tip 13.9998 0.0000* 1.0000 260.4246 0.0580 0.9420Clade 2–2 Interior 170.0864 0.0050* 0.9950 205.1254 0.0000* 1.0000Clade 2–3 Interior 362.4726 0.8920 0.1080 386.5684 0.9820 0.0180*
I-T clades — 258.9137 1.0000 0.0000* 41.6789 0.7700 0.2300
J.S. Placyk Jr. et al. / Molecular Phylogenetics and Evolution 43 (2007) 452–467 461
growing body of evidence suggesting that Pleistoceneevents played an important role in the diVerentiation ofNorth American vertebrate populations (e.g., Arbogast,1999; Austin et al., 2002; Burbrink et al., 2000; Brant andOrti, 2003; Byun et al., 1997; Conroy and Cook, 2000;Demboski and Cook, 2001; Hays and Harrison, 1992;Klicka and Zink, 1997; Zamudio and Savage, 2003). Themajority of the results presented herein are in agreementwith earlier hypotheses related to the recolonization of theGreat Lakes region by reptiles and amphibians (e.g., twomain recolonization pathways exist with one followingalong the east coast of Lake Michigan and another alongthe west coast), but at least one earlier hypothesis is rejected(i.e., the Beaver Archipelago was colonized solely by snakesfrom the lower peninsula of Michigan), with an alternatehypothesis suggested (i.e., the Beaver Archipelago was colo-nized by snakes from both the upper and lower peninsulaof Michigan and acts as a secondary contact point for theeast coast/west coast lineages discussed above).
Both our nested clade analysis and a standard phylo-genetic analysis resulted in similar tree topologies, withstrong support for two distinct lineages. Nested cladeanalysis also suggests that one of these lineages is splitinto three main clades, some of which are supported byour phylogenetic analysis. AMOVA results strongly sup-port the genetic distinctiveness of these three clades,which better explain the genetic variation displayed byour data than grouping snakes into their respectivestates. From these analyses, two important patternsemerge. First, Great Lakes populations recolonized areasthat were covered by the glacier via two routes: (1) fromIndiana along the eastern coast of Lake Michigan intothe lower peninsula of Michigan, and (2) from Illinoisand Indiana into Wisconsin and the upper peninsula ofMichigan along the western coast of Lake Michigan.Second, the Beaver Archipelago in northeastern LakeMichigan is an area of secondary contact for the two lin-eages that diverged around either side of Lake Michigan.In addition, although not explicitly examined here, thereis some evidence that the more southern and easternstates we sampled may have acted as refugia for T. sir-talis during the glaciation and that Ontario, Canada wasrecolonized by Ohio and Michigan populations, presum-ably via the gap between Lake Huron and Lake Erie.More sampling along the east coast and states south ofIllinois, Indiana, and Ohio are needed to more fully sup-port such hypotheses.
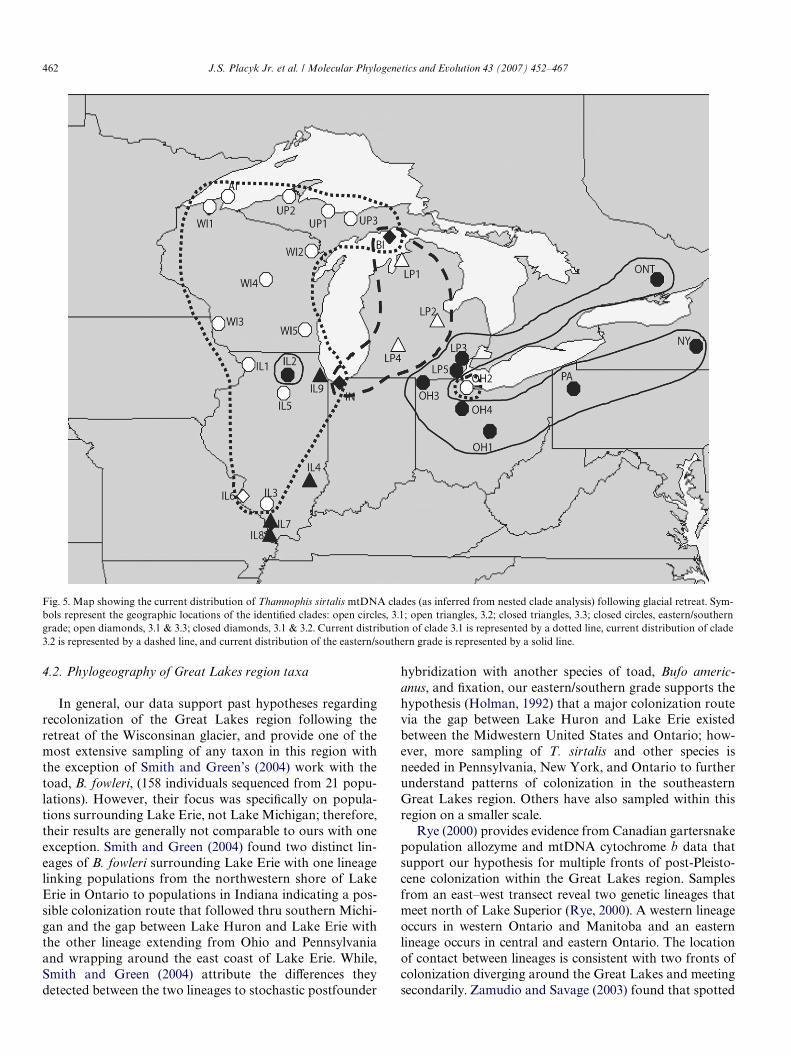
In general, however, our data support hypotheses con-cerning the recolonization of the Great Lakes region fol-lowing the Wisconsinan glaciation (Fig. 5), especially therecolonization of Michigan. Primary reptile and amphibianinvaders of the region are believed to have stayed close tothe margins of the retreating ice sheet and quickly recolon-ized the region via two routes located to the east and westof Lake Michigan. Our data agree with past hypothesesthat the upper peninsula of Michigan was colonized viaWisconsin and a route west of Lake Michigan, while the
lower peninsula of Michigan was recolonized by animalsfrom Indiana and Ohio. In addition, we found an enigmaticgroup of haplotypes that occur only in Illinois populations.Suggestions for the origin of this group are discussed below.We rejected a long standing hypothesis that the BeaverArchipelago in northeastern Lake Michigan was recolon-ized solely by lower peninsula populations. Our data indi-cate that the Beaver Archipelago acts as a secondarycontact point between the east and west coast Lake Michi-gan lineages, although whether the contact was natural dis-persion or human assisted remains unknown. Interestingly,81% of the Beaver Archipelago snakes we sampled arefound in the western group of haplotypes. Most hypothesesregarding the recolonization of the Beaver Archipelagosuggest that island populations most likely originated fromthe lower peninsula of Michigan. If any animals colonizedfrom the west or from the upper peninsula of Michigan,their contribution to the genetic make-up of the island pop-ulations was believed to be minimal at best. Our results sug-gest the opposite. The Beaver Archipelago is alsocharacterized by several unique haplotypes not found onthe mainland (haplotypes 8, 9, 14, 15, 34, 35, and 36) indi-cating that genetic divergence and evolution may be ongo-ing on these islands.
In addition to testing hypotheses regarding the pathsanimals took when recolonizing the Great Lakes region,our data also allow us to infer speciWc patterns of recoloni-zation, as one of the advantages of using nested clade anal-ysis is to discriminate statistically among various biologicalexplanations for signiWcant associations between geogra-phy and genetic data (Templeton et al., 1987). Knowles andMaddison (2002) have criticized the methods used by Tem-pleton et al. (1987) to examine such associations, citing thefrequent failure of nested clade analysis to recover the truehistory of simulated data sets. In response, Templeton(2004) modiWed the nested clade analysis inference tree,resulting in improved performance with simulated data.Further validation comes from analysis of 42 moleculardata sets for which strong a prior phylogeographic expecta-tions could be inferred (Templeton, 2004).
There are three major biological factors that may causespatial or temporal associations of haplotype variation: (1)restricted gene Xow, (2) past fragmentation, and (3) rangeexpansion (Templeton et al., 1995). Our analyses indicatethat all three of these factors are or have been at workamong the sampled populations, but that recurrent geneXow is also common, which may explain the short branchlengths of our maximum likelihood tree. Restricted geneXow (due to isolation by distance) led to the nonrandomgeographic/genealogical associations between the BeaverArchipelago and the surrounding mainland, especially Wis-consin and the upper peninsula of Michigan. Given that theislands are currently separated from the mainland by ca.25–30 km of water, restricted gene Xow between the popula-tions found on these islands and the mainland are to beexpected. Past fragmentation followed by range expansionis seen throughout the data set.
462 J.S. Placyk Jr. et al. / Molecular Phylogenetics and Evolution 43 (2007) 452–467
4.2. Phylogeography of Great Lakes region taxa
In general, our data support past hypotheses regardingrecolonization of the Great Lakes region following theretreat of the Wisconsinan glacier, and provide one of themost extensive sampling of any taxon in this region withthe exception of Smith and Green’s (2004) work with thetoad, B. fowleri, (158 individuals sequenced from 21 popu-lations). However, their focus was speciWcally on popula-tions surrounding Lake Erie, not Lake Michigan; therefore,their results are generally not comparable to ours with oneexception. Smith and Green (2004) found two distinct lin-eages of B. fowleri surrounding Lake Erie with one lineagelinking populations from the northwestern shore of LakeErie in Ontario to populations in Indiana indicating a pos-sible colonization route that followed thru southern Michi-gan and the gap between Lake Huron and Lake Erie withthe other lineage extending from Ohio and Pennsylvaniaand wrapping around the east coast of Lake Erie. While,Smith and Green (2004) attribute the diVerences theydetected between the two lineages to stochastic postfounder
hybridization with another species of toad, Bufo americ-anus, and Wxation, our eastern/southern grade supports thehypothesis (Holman, 1992) that a major colonization routevia the gap between Lake Huron and Lake Erie existedbetween the Midwestern United States and Ontario; how-ever, more sampling of T. sirtalis and other species isneeded in Pennsylvania, New York, and Ontario to furtherunderstand patterns of colonization in the southeasternGreat Lakes region. Others have also sampled within thisregion on a smaller scale.
Rye (2000) provides evidence from Canadian gartersnakepopulation allozyme and mtDNA cytochrome b data thatsupport our hypothesis for multiple fronts of post-Pleisto-cene colonization within the Great Lakes region. Samplesfrom an east–west transect reveal two genetic lineages thatmeet north of Lake Superior (Rye, 2000). A western lineageoccurs in western Ontario and Manitoba and an easternlineage occurs in central and eastern Ontario. The locationof contact between lineages is consistent with two fronts ofcolonization diverging around the Great Lakes and meetingsecondarily. Zamudio and Savage (2003) found that spotted
Fig. 5. Map showing the current distribution of Thamnophis sirtalis mtDNA clades (as inferred from nested clade analysis) following glacial retreat. Sym-bols represent the geographic locations of the identiWed clades: open circles, 3.1; open triangles, 3.2; closed triangles, 3.3; closed circles, eastern/southerngrade; open diamonds, 3.1 & 3.3; closed diamonds, 3.1 & 3.2. Current distribution of clade 3.1 is represented by a dotted line, current distribution of clade3.2 is represented by a dashed line, and current distribution of the eastern/southern grade is represented by a solid line.
J.S. Placyk Jr. et al. / Molecular Phylogenetics and Evolution 43 (2007) 452–467 463
salamander (Ambystoma maculatum) haplotypes from indi-viduals collected in Indiana were basal to two separate Mid-west lineages. One of these lineages extends up the westcoast of Lake Michigan into the upper peninsula of Michi-gan, while the other extends from the southernmost countiesof the lower peninsula of Michigan and gave rise to south-ern Ontario, Canada populations. While these results mirrorours, salamander populations in the central and northernportions of the lower peninsula of Michigan, the BeaverArchipelago, and Ohio were not sampled. Therefore, thecomplete evolutionary history of Ohio and Michigan popu-lations, and the origin of the Beaver Archipelago popula-tions, were not elucidated.
Analysis of mtDNA from the spring peeper, Pseudacriscrucifer, (a small frog) also suggests multiple fronts of colo-nization within the Great Lakes region (Austin et al., 2002).DiVerent lineages occur east and west of Lake Michigan,consistent with the hypothesis that the lake has functionedas a barrier to gene Xow. However, routes of colonizationdiVer from those hypothesized here and in the past. Thesouthern Great Lakes region was apparently colonizedfrom unglaciated areas to the south whereas the northernGreat Lakes region was colonized by a lineage originatingeast of the Appalachian Mountains that expanded counter-clockwise around the Great Lakes into Minnesota andnorthern Wisconsin (Fig. 6 in Austin et al., 2002). Duringthe Xerothermic period (4–6,000 ybp), contact between lin-eages was prevented by the prairie peninsula, whichextended eastward across N Indiana, NW Ohio, and SWOntario. Once this barrier disappeared, secondary contactoccurred in SW Ontario. Even though Holman (1992) con-siders both T. sirtalis and P. crucifer primary invaders, it ispossible that they recolonized the Midwest diVerently,given that diVerences in behavior, ecology, and physiologyexist between them. More sampling of T. sirtalis popula-tions on the east coast of the United States and Canada areneeded to further understand these distinct recolonizationpatterns.
For mammals, Brant and Orti (2003) recently exam-ined the postglacial recolonization of the eastern UnitedStates by the Northern short-tailed shrew (Blarina brevic-auda), and while they did not extensively sample in theGreat Lakes region, they did designate a phylogroup ofeast-central haplotypes that includes populations fromIndiana and Wisconsin, indicating a possible west coast ofLake Michigan migration route. Several other studieshave been conducted in the general vicinity of the GreatLakes region, but they do not focus on the recolonizationof that area speciWcally (e.g., Fuerst and Austin, 2004;Starkey et al., 2003) and are not as detailed as those dis-cussed above. In addition, we have found no other studieson any taxa that have speciWcally examined the molecularphylogeography of Beaver Archipelago populations, soour data on this unique system cannot be compared toany other study.
The Beaver Archipelago was traditionally thought tohave been colonized solely by lower peninsula Michigan
populations. This hypothesis was based on two mainfacts: (1) in the last 10,000 years, the islands of the BeaverArchipelago were connected to the lower peninsula ofMichigan by a land bridge, and (2) at least one speciescurrently found on the islands occurs in the lower penin-sula but not in the upper peninsula of Michigan and sev-eral species that are rare in the upper peninsula ofMichigan are common on the islands and the lower pen-insula. However, while the islands were connected to thelower peninsula, they were only separated from the upperpeninsula by the Mackinac River, which may have beenonly 1.6 km wide in some areas. The common gartersnakeis an excellent swimmer and often can be found in logs;therefore, it could have easily crossed the river via swim-ming or rafting. In addition, Native Americans andEuropean settlers often traveled from the upper penin-sula to the islands carrying with them supplies that gar-tersnakes and other small animals may have had accessto (e.g., straw bales for livestock). As a result, animalsmay have migrated to the islands from the upper penin-sula as stowaways on human vessels at any time in thelast 14,000 years (Tanner, 1986). Our data indicate thatthe islands have been colonized by populations fromboth the lower and upper peninsula of Michigan and thatthe islands act as a secondary contact point for the eastand west coast Lake Michigan lineages. Therefore, anyfuture hypotheses regarding the origin and divergence ofBeaver Archipelago taxa should take into account theunderlying genetics of the populations.
The third distinct clade detected in our analyses is foundonly in Illinois. Based on our phylogenetic analysis thisgroup appears to be an oVshoot of the clade that is foundalong the west coast of Lake Michigan; therefore, it may bea more recently derived lineage arising from that group(e.g., T. s. semifasciatus), or it may be a precursor to thatgroup. In terms of the former hypothesis, the range of T. s.semifasciatus, the Chicago gartersnake, overlaps with thatof T. s. sirtalis in northeastern Illinois. It is possible thatsnakes that were identiWed as T. s. sirtalis were actuallyT. s. semifasciatus, as the two are very similar morphologi-cally (Rossman et al., 1996). However, only one county(Cook County, IL 9 from Fig. 1) in this third clade is foundwithin the known range of T. s. semifasciatus, which leadsus to believe some other phenomenon may be responsiblefor the third clade; however, it may also be that the range ofT. s. semifasciatus is expanding southward or interbreedingbetween the two subspecies may be producing a hybrid thatis found throughout Illinois. A second more likely explana-tion requires further sampling of the states south and westof Illinois, as gartersnake populations from states not sam-pled (e.g., Iowa, Missouri, Arkansas) may be ancestral tolineages found in the Great Lakes region and our enigmaticIllinois group may be related to them. For example, Austinet al. (2002) indicated that southern Illinois spring peeperpopulations may have been colonized by populations fromMissouri, Kansas, and Arkansas, and this may also be thecase for T. sirtalis.
464 J.S. Placyk Jr. et al. / Molecular Phylogenetics and Evolution 43 (2007) 452–467
4.3. Implications for the rangewide phylogeography of Thamnophis sirtalis
By combining the ND2 sequences produced by threeother studies (Alfaro and Arnold, 2001; de Queiroz et al.,2002; Janzen et al., 2002), especially those from the Janzenet al. (2002) study, we provide the most complete T. sirtalisphylogeny published to date. This phylogeny reveals sev-eral important patterns in the evolutionary history of T. sir-talis. First, subspecies classiWcations are not supported bythe underlying genetics of the populations sampled. Whilewe sampled only one subspecies (T. s. sirtalis), Janzen sam-pled four and all Wve appear to be distinguished more basedon the location they were collected from than on morpho-logical and behavioral diVerences. In addition, within thesubspecies we examined, more diVerences exist between thethree clades detected by our nested analysis (clades 3.1, 3.2,and 3.3) and an eastern/southern grade than between all ofthe sequences from the Janzen et al. (2002) study orbetween clades 3.1, 3.2, and 3.3 and the western haplotypescombined.
There are some similarities between our data and thewestern data set that may explain the observed patterns.In particular, the maximum likelihood tree is poorlyresolved and indicates low genetic divergences for bothour haplotypes and the western haplotypes. Janzen et al.(2002) attribute this primarily to historical forces. Sincemost of the locations they sampled would have eitherbeen under ice or inhospitable to T. sirtalis less than10,000 years ago, west coast T. sirtalis are believed to haverecolonized from glacial refugia in only the last 10,000years. While restricted to glacial refugia, the Wxation ofrespective mtDNA variants occurred before T. sirtalisrecolonized following the glaciation. The bulk of our sam-pling locations were also not populated by T. sirtalis untilrelatively recently (i.e., in the last 10,000 years) due to thelast glaciation, which indicate a similar scenario. It is pos-sible that certain variants had a selective advantage undersuch conditions, which may explain the similarities we seebetween clades 3.1, 3.2, and 3.3, and the western haplo-types. Several nonsynonymous substitutions weredetected in among our sequences. Another possibility isthat the western haplotypes and clades 3.1, 3.2, and 3.3share a more recent common ancestor with each otherthan with the eastern/southern grade. The enigmaticsouthern Illinois clade (clade 3.3) may provide evidence ofsuch ancestry. If both the PaciWc coast and Midwest wererecolonized by populations from states such as Utah, Col-orado, Kansas, Missouri, Arizona, New Mexico, Okla-homa, and Arkansas this may be the case. More samplingboth in those states, as well as along the east coast andsoutheast is needed to more fully understand, whatappears to be, a complex evolutionary history. Unfortu-nately, modern T. sirtalis are currently absent or rare inUtah, Colorado, New Mexico, and Arizona due to currentclimatic conditions and habitat availability, so this analy-sis may remain incomplete.
5. Conclusions
We have provided the most conclusive data in supportof the recolonization pathways hypothesized for the verte-brates of the Great Lakes region following the Wisconsinanglaciation. We present novel data on the colonization of theBeaver Archipelago in northeastern Lake Michigan reject-ing previous hypotheses in this regard. In addition, our dataindicate that T. sirtalis populations found in the GreatLakes region and states directly to the east of them exhibita greater level of sequence divergence (up to 6.5%) thanmost species of gartersnakes studied to date. A greater levelof sequence divergence (up to 7.7%) has been detected inthe terrestrial gartersnake, Thamnophis elegans, (Bronikow-ski and arnold, 2001), but three subspecies were sampled inthis study, while we focus on only one subspecies of T. sir-talis. However, when sampling four subspecies of T. sirtalisfrom the west coast of North America, Janzen et al. (2002)found only up to 2.5% sequence divergence. While anec-dotal evidence on Great Lakes region gartersnake popula-tions suggests there is not nearly the level of morphologicalvariation as seen between populations on the west coast ofthe United States, preliminary behavioral and morphologi-cal data (Burghardt and Schwartz, 1999; King unpubl.data) suggest geographic diVerences that may mirror theclades distinguished by our nested clade analyses (i.e.,snakes from the west coast of Lake Michigan displaybehavior and scalation patterns that diVer signiWcantlyfrom snakes from the east coast of Lake Michigan). Moredetailed studies of geographic variation in the behavior andmorphology of the Great Lakes region T. sirtalis popula-tions are in progress and such studies conducted with othertaxa are strongly encouraged (Arbogast and Kenagy, 2001).
We also note that the amount of sequence divergencedetected in our study exceeds the amount (2.83–4.37%) Bur-brink et al. (2000) detected between two clades of ratsnakes,Elaphe obsoleta subspecies, (i.e., the eastern and centralclades), which they suggested be classiWed as two separatespecies. The focus of our study was not to question the tax-onomy of gartersnakes in North America, but given theamount of variation we detected, researchers should con-sider our data along with additional molecular and pheno-typic data when focusing on the taxonomy of this species inthe future. Given the high level of intraspeciWc sequencevariation we detected, we strongly encourage researchersexamining higher level phylogenetic relationships to samplemore than one specimen/sequence per species. For example,the majority of the species examined in the two most recentphylogenetic studies on natricine snakes (Alfaro andArnold, 2001; de Queiroz et al., 2002) relied on sequencedata from single individuals. In addition to the amount ofvariation we detected in T. sirtalis, sequence data from theplains gartersnake (T. radix) and Butler’s gartersnake(T. butleri) indicate that the two share many haplotypes(Burghardt and Placyk; unpubl. data) further indicating theneed to sample more than one individual per species ininterspeciWc molecular phylogenetic studies.
J.S. Placyk Jr. et al. / Molecular Phylogenetics and Evolution 43 (2007) 452–467 465
Acknowledgments
We thank the Reptile Ethology lab at the University ofTennessee and two anonymous reviewers for criticallyreviewing an earlier version of this manuscript. J. Gilling-ham and B. Graves provided laboratory space and otherfacilities and supplies for the collection of tissue samples inMichigan, which were collected under Michigan Depart-ment of Natural Resources ScientiWc Collector’s Permitsissued to J.S.P., G.S.C., and G.M.B. Samples from Illinois,Wisconsin, Indiana, and Ohio were collected under Depart-ment of Natural Resources and National Park Service per-
mits issued to G.S.C., R.B.K., and J.W.R. R. Gratz, S.Ballard, H. Walley, J. Marshall, P. Andreadis, B. Howes, E.Wild, and A. Resetar and the Field Museum of NaturalHistory provided additional tissue samples. Funding forthis research was provided to J.S.P. via a Department ofEcology & Evolutionary Biology at the University of Ten-nessee Summer Research Grant and a National ScienceFoundation Doctoral Dissertation Improvement Grant(IBN 0309339). G.S.C.’s Weld work was funded in part bythe National Park Service Great Lakes Inventory andMonitoring Program, Ottawa National Forest, WisconsinDNR, and the Milwaukee Public Museum.
Appendix A
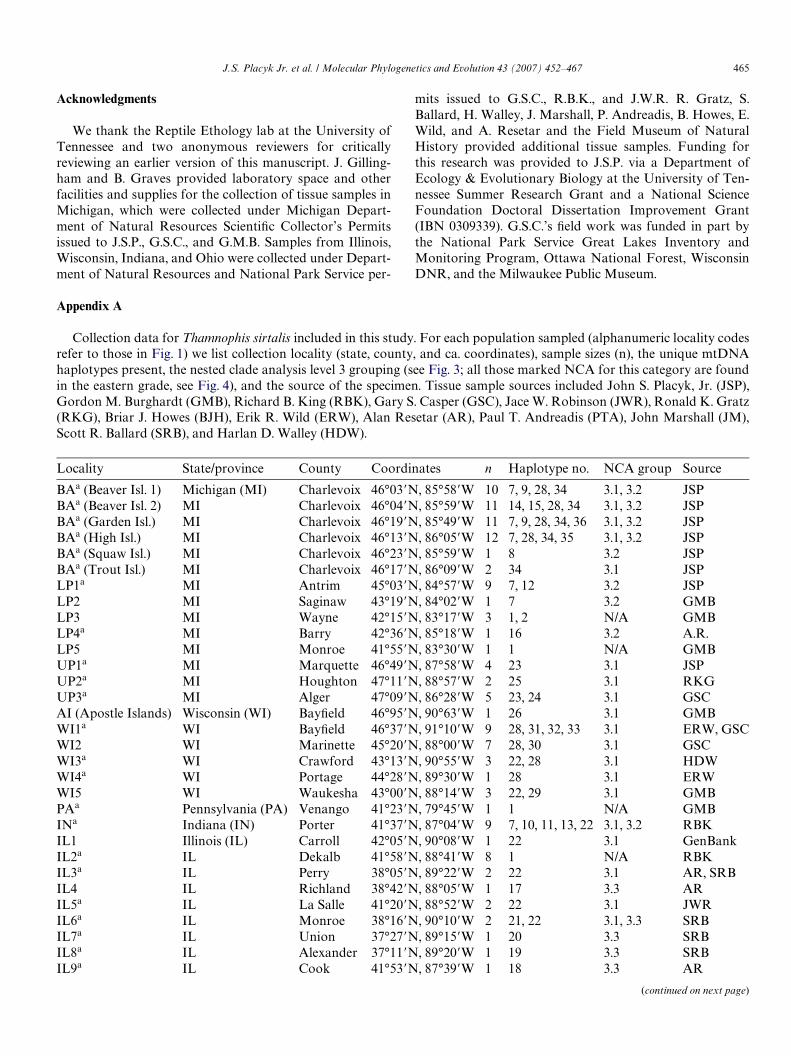
Collection data for Thamnophis sirtalis included in this study. For each population sampled (alphanumeric locality codesrefer to those in Fig. 1) we list collection locality (state, county, and ca. coordinates), sample sizes (n), the unique mtDNAhaplotypes present, the nested clade analysis level 3 grouping (see Fig. 3; all those marked NCA for this category are foundin the eastern grade, see Fig. 4), and the source of the specimen. Tissue sample sources included John S. Placyk, Jr. (JSP),Gordon M. Burghardt (GMB), Richard B. King (RBK), Gary S. Casper (GSC), Jace W. Robinson (JWR), Ronald K. Gratz(RKG), Briar J. Howes (BJH), Erik R. Wild (ERW), Alan Resetar (AR), Paul T. Andreadis (PTA), John Marshall (JM),Scott R. Ballard (SRB), and Harlan D. Walley (HDW).
Locality State/province County Coordinates n Haplotype no. NCA group Source
BAa (Beaver Isl. 1) Michigan (MI) Charlevoix 46°03�N, 85°58�W 10 7, 9, 28, 34 3.1, 3.2 JSPBAa (Beaver Isl. 2) MI Charlevoix 46°04�N, 85°59�W 11 14, 15, 28, 34 3.1, 3.2 JSPBAa (Garden Isl.) MI Charlevoix 46°19�N, 85°49�W 11 7, 9, 28, 34, 36 3.1, 3.2 JSPBAa (High Isl.) MI Charlevoix 46°13�N, 86°05�W 12 7, 28, 34, 35 3.1, 3.2 JSPBAa (Squaw Isl.) MI Charlevoix 46°23�N, 85°59�W 1 8 3.2 JSPBAa (Trout Isl.) MI Charlevoix 46°17�N, 86°09�W 2 34 3.1 JSPLP1a MI Antrim 45°03�N, 84°57�W 9 7, 12 3.2 JSPLP2 MI Saginaw 43°19�N, 84°02�W 1 7 3.2 GMBLP3 MI Wayne 42°15�N, 83°17�W 3 1, 2 N/A GMBLP4a MI Barry 42°36�N, 85°18�W 1 16 3.2 A.R.LP5 MI Monroe 41°55�N, 83°30�W 1 1 N/A GMBUP1a MI Marquette 46°49�N, 87°58�W 4 23 3.1 JSPUP2a MI Houghton 47°11�N, 88°57�W 2 25 3.1 RKGUP3a MI Alger 47°09�N, 86°28�W 5 23, 24 3.1 GSCAI (Apostle Islands) Wisconsin (WI) BayWeld 46°95�N, 90°63�W 1 26 3.1 GMBWI1a WI BayWeld 46°37�N, 91°10�W 9 28, 31, 32, 33 3.1 ERW, GSCWI2 WI Marinette 45°20�N, 88°00�W 7 28, 30 3.1 GSCWI3a WI Crawford 43°13�N, 90°55�W 3 22, 28 3.1 HDWWI4a WI Portage 44°28�N, 89°30�W 1 28 3.1 ERWWI5 WI Waukesha 43°00�N, 88°14�W 3 22, 29 3.1 GMBPAa Pennsylvania (PA) Venango 41°23�N, 79°45�W 1 1 N/A GMBINa Indiana (IN) Porter 41°37�N, 87°04�W 9 7, 10, 11, 13, 22 3.1, 3.2 RBKIL1 Illinois (IL) Carroll 42°05�N, 90°08�W 1 22 3.1 GenBankIL2a IL Dekalb 41°58�N, 88°41�W 8 1 N/A RBKIL3a IL Perry 38°05�N, 89°22�W 2 22 3.1 AR, SRBIL4 IL Richland 38°42�N, 88°05�W 1 17 3.3 ARIL5a IL La Salle 41°20�N, 88°52�W 2 22 3.1 JWRIL6a IL Monroe 38°16�N, 90°10�W 2 21, 22 3.1, 3.3 SRBIL7a IL Union 37°27�N, 89°15�W 1 20 3.3 SRBIL8a IL Alexander 37°11�N, 89°20�W 1 19 3.3 SRBIL9a IL Cook 41°53�N, 87°39�W 1 18 3.3 AR
(continued on next page)
466 J.S. Placyk Jr. et al. / Molecular Phylogenetics and Evolution 43 (2007) 452–467
a Voucher numbers: Beaver Isl. 1 (University of Tennessee Reptile Ethology Lab (UTKREL) 01-MM-0001–0010), Beaver Isl. 2 (UTKREL 01-SM-001–0011), Garden Isl. (UTKREL 01-GI-0001–0011), High Isl. (UTKREL 01-HI-0001–0012), Squaw Isl. (UTKREL 01-SI-0001), Trout Isl. (UTKREL 01-TI-0001–0002), LP1 (UTKREL 01-LP-0001–0009), LP4 (Thsi 505-01), UP1 (UTKREL 01-UP-0001–0004), UP2 (UTKREL 01-UP-0005–0006), UP3 (Mil-waukee Public Museum (MPM) 33436–33440), WI1 (Thsi 204-01–09), WI3 (Thsi 200-05–07), WI4 (Thsi 201-02), PA (UTKREL 86-PA-1684), IN (Thsi300-01–09), IL2 (This 100-02–09), IL3 (Thsi 111-02), IL5 (Thsi 107-01–02), IL6 (Thsi 111-03–04), IL7 (Thsi 111-05), IL8 (Thsi 111-01), IL9 (Thsi 114-01),and OH2 (Thsi 403-01–08). Vouchers beginning with “Thsi” are located at the King Lab at Northern Illinois University. Tissue samples for which vouch-ers are not available were donated as tail tips or extractions.
Appendix A (continued)
Locality State/province County Coordinates n Haplotype no. NCA group SourceOH1 Ohio (OH) Licking 40°04�N, 82°25�W 2 5, 6 N/A PTAOH1 Ohio (OH) Licking 40°04�N, 82°25�W 2 5, 6 N/A PTAOH2a OH Ottawa 41°30�N, 82°56�W 8 22, 27 3.1 RBKOH3 OH Williams 41°40�N, 84°33�W 6 1, 4 N/A RBK, JMOH4 OH Wyandot 40°51�N, 83°17�W 2 1 N/A RBKONT Ontario Addington 45°00�N, 77°17�W 4 2, 3 N/A BJHNY New York Cortland 42°40�, 76°13�W 1 37 N/A GenBank
References
Alfaro, M.E., Arnold, S.J., 2001. Molecular systematics and evolution ofRegina and the thamnophiine snakes. Mol. Phylogenet. Evol. 21,408–423.
Anderson, T.W., Lewis, C.F.M., 1992. Climatic inXuences of deglacialdrainage changes in southern Canada at 10-8 ka suggested by pollenevidence. Geogr. Phys. Quatern. 46, 255–272.
Arbogast, B.S., 1999. Mitochondrial DNA phylogeography of the newworld Xying squirrels (Glaucomys): implications for pleistocene bioge-ography. J. Mamm. 80, 142–155.
Arbogast, B.S., Kenagy, G.J., 2001. Comparative phylogeography as anintegrative approach to historical biogeography. J. Biogeogr. 28,819–825.
Austin, J.D., Lougheed, S.C., Neidrauer, L., Chek, A.A., Boag, P.T., 2002.Cryptic lineages in a small frog: the post-glacial history of the springpeeper, Pseudacris crucifer (Anura: Hylidae). Mol. Phylogenet. Evol.25, 316–329.
Ayoub, N.A., Reichert, S.E., 2004. Molecular evidence for Pleistocene gla-cial cycles driving diversiWcation of a North American desert spider,Agelenopsis aperta. Mol. Ecol. 13, 3453–3465.
Bernatchez, L., Dodson, J.J., 1991. Phylogeographic structure in mitochon-drial DNA of the lake whiteWsh (Coregonus clupeaformis) and its rela-tion to Pleistocene glaciations. Evolution 45, 1016–1035.
Billington, N., Barrette, R.J., Hebert, P.D.N., 1992. Management implica-tions of mitochondrial DNA variation in walleye stocks. N. Am. J.Fish. Manage. 12, 276–284.
Brant, S.V., Orti, G., 2003. Phylogeographic of nothern short -tailed shrew,Blarina brevicauda (Insectivora: Soricidae): past fragmentation andpostglacial recolonization. Mol. Ecol. 12, 1435–1449.
Bronikowski, A.M., Arnold, S.J., 2001. Cytochrome b phylogeny does notmatch subspeciWc classiWcation in the western terrestrial grater snake,Themnophis elegans. Copeia, 508–513.
Burbrink, F.T., Lawson, R., Slowinski, J.B., 2000. Mitochondrial DNA phy-logeography of the polytypic North American rat snake (Elaphe obso-lete): a critique of the subspecies concept. Evolution 54, 2107–2118.
Burghardt, G.M., 1969. Comparative prey-attack studies in newbornsnakes of the genus Thamnophis. Behaviour 33, 77–114.
Burghardt, G.M., Schwartz, J.M., 1999. Geographic variations on method-ological themes in comparative ethology: a natricine snake perspective.In: Foster, S.A., Endler, J.A. (Eds.), Geographic Variation in Behavior:Perspectives on Evolutionary Mechanisms. Oxford University Press,New York.
Byun, S.A., Koop, B.F., Reimchen, T.E., 1997. North American black bearmtDNA phylogeography: implications for morphology and the HaidaGwaii glacial refugium controversy. Evolution 51, 1647–1653.
Carpenter, C.C., 1952. Comparative ecology of the common garter snake(Thamnophis s. sirtalis), the ribbon snake (Thamnophis s. sauritus), and
Butler’s garter snake(Thamnophis butleri) in mixed populations. Ecol.Monogr. 22, 235–258.
Clement, M., Posada, D., Crandall, K.A., 2000. TCS: a computer programto estimate gene genealogies. Mol. Ecol. 9, 1657–1659.
Conroy, C.J., Cook, J.A., 2000. Phylogeography of a post-glacial colonizer:Microtus longicaudus (Muridae: Rodentia). Mol. Ecol. 9, 165–176.
Crandall, K.A., 1994. IntraspeciWc cladogram estimation: accuracy athigher levels of divergence. Syst. Biol. 43, 222–235.
Demboski, J.R., Cook, J.A., 2001. Phylogeography of the dusky shrew,Sorex monticolus (Insectivora, Soricidae): insight into deep and shal-low history in northwestern North America. Mol. Ecol. 10, 1227–1240.
de Queiroz, A., Lawson, R., 1994. Phylogenetic relationships of the gartersnakes based on DNA sequence and allozyme variation. Biol. J. Linn.Soc. 53, 209–229.
de Queiroz, A., Lawson, R., Lemos-Espinal, J.A., 2002. Phylogenetic rela-tionships of North American garter snakes (Thamnophis) based onfour mitochondrial genes: how much DNA sequence is enough? Mol.Phylogenet. Evol. 22, 315–329.
Dietrich, R.V., 1988. The geological history of Beaver Island. J. BeaverIsland Hist. 3, 59–77.
ExcoYer, L., Smouse, P.E., Quattro, J.M., 1992. Analysis of molecularvariance inferred from metric distances among DNA haplotypes:application to human mitochondrial DNA restriction data. Genetics131, 479–491.
Fitch, H.S., 1965. An ecological study of the garter snake, Thamnophis sir-talis. University of Kansas Publications, Museum of Natural History15, 493–564.
Fuerst, G.S., Austin, C.C., 2004. Population genetic structure of the prairieskink (Eumeces septentrionalis): nested clade analysis of post Pleisto-cene populations. J. Herp. 38, 257–268.
Garner, T.W.J., Larsen, K.W., 2005. Multiple paternity in the western ter-restrial garter snake, Thamnophis elegans. Can. J. Zool. 83, 656–663.
Garner, T.W.J., Gregory, P.T., McCracken, G.F., Burghardt, G.M., Koop,B.F., McLain, S.E., Nelson, R.J., 2002. Geographic variation of multi-ple paternity in the common garter snake (Thamnophis sirtalis). Copeia2002, 15–23.
Garner, T.W.J., Pearman, P.B., Gregory, P.T., Tomio, G., Wischniowski,S.G., Hosken, D.J., 2004. Microsatellite markers developed from Tham-nophis elegans and Thamnophis sirtalis and their utility in three speciesof garter snakes. Mol. Ecol. Notes 4, 369–371.
Green, D.M., Sharbell, T.F., Kearsley, J., Kaiser, H., 1996. Postglacialrange Xuctuation, genetic subdivision and speciation in the westernNorth American frog complex, Rana pretiosa. Evolution 50, 374–390.
Hansknecht, K.A., 2003. Thermal and temporal aspects of cold-water for-aging by the northern water snake (Nerodia sipedon sipedon). M.S. the-sis. Central Michigan University, Mount Pleasant, MI.
Harding, J.H., 1996. Amphibians and Reptiles of the Great Lakes Region.The University of Michigan Press, Ann Arbor, MI.
J.S. Placyk Jr. et al. / Molecular Phylogenetics and Evolution 43 (2007) 452–467 467
Hatt, R.T., Tyne, J.V., Stuart, L.C., Pope, C.H., Grobman, A.B., 1948.Island Life: A Study of the Land Vertebrates of the Islands of EasternLake Michigan. Cranbrook Press, BloomWeld Hills, MI.
Hays, J.P., Harrison, R.G., 1992. Variation in mitochondrial DNA and thebiogeographic history of woodrats (Neotoma) of the eastern UnitedStates. Syst. Biol. 41, 331–344.
Hewitt, G.M., 1996. Some genetic consequences of ice ages, and their rolein divergence and speciation. Biol. J. Linn. Soc. 58, 247–276.
Hewitt, G.M., 1999. Post-glacial re-colonization of European biota. Biol. J.Linn. Soc. 68, 87–112.
Hewitt, G.M., 2000. The genetic legacy of the Quaternary ice ages. Nature405, 907–913.
Hewitt, G.M., 2001. Speciation, hybrid zones and phylogeography—orseeing genes in space and time. Mol. Ecol. 10, 537–549.
Holman, J.A., 1992. Late quaternary herpetofauna of the central GreatLakes region, USA: zoogeographical and paleoecological implications.Quat. Sci. Rev. 11, 345–351.
Holman, J.A., 1998. Amphibian recolonization of Midwestern states in thepostglacial Pleistocene. In: Lannoo, M.J. (Ed.), Status and Conserva-tion of Midwestern Amphibians. University of Iowa Press, Iowa City,IA, pp. 9–15.
Holman, J.A., 2000. Fossil Snakes of North America: Origin, Evolution,Distribution, Paleoecology. Indiana University Press, Bloomington,IN.
Hough, J.L., 1958. Geology of the Great Lakes. University of Illinois Press,Urbana, IL.
Janzen, F.J., Krenz, J.G., Haselkorn, T.S., Brodie Jr., E.D., Brodie III, E.D.,2002. Molecular phylogeography of common garter snakes (Thamno-phis sirtalis) in western North America: implications for regional his-torical forces. Mol. Ecol. 11, 1739–1751.
Kapp, R.O., Bushouse, S., Foster, B., 1969. A contribution to the geologyand forest history of Beaver Island. Michigan. Proc. Conf. Great LakesRes. 1969, 225–236.
Karrow, P.F., Calkin, P.E., (Eds.), 1985. Quaternary Evolution of theGreat Lakes. Geological Association of Canada Special Paper, 30.
King, R.B., 1988. Biogeography of reptiles on islands in Lake Erie. In:Downhower, J. (Ed.), The Biogeography of the Island Region of WesternLake Erie. Ohio State University Press, Columbus, OH, pp. 125–133.
Klicka, J., Zink, R.M., 1997. The importance of recent ice ages in specia-tion, a failed paradigm. Science 277, 1666–1669.
Knowles, L.L., Maddison, W.P., 2002. Statistical phylogeography. Mol.Ecol. 11, 2623–2635.
Kumazawa, Y., Ota, H., Nishida, M., Ozawa, T., 1996. Gene rearrange-ments in snake mitochondrial genomes: highly concerted evolution ofcontrol-region-like sequences duplicated and inserted into a tRNAgene cluster. Mol. Biol. Evol. 13, 1242–1254.
Larsen, C.E., 1987. Geological History of Glacial Lake Algonquin and theUpper Great Lakes. U.S. Geological Survey Bulletin, 1801.
McCracken, G.F., Burghardt, G.M., Houts, S.E., 1999. Microsatellitemarkers and multiple paternity in the garter snake Thamnophis sirtalis.Mol. Ecol. 8, 1475–1479.
Nuhfer, E., Dalles, M., 1987. A Guidebook of the Geology of Lake Supe-rior’s Apostle Islands National Lakeshore. W.C. Brown Publishers,Dubuque, IA.
Petty, W.H., Delcourt, P.A., Delcourt, H.R., 1996. Holocene lake-level Xuc-tuations and beach-ridge development along the northern shore ofLake Michigan, USA. J. Paleolimnol. 15, 147–169.
Placyk, J.S. Jr., 2006. Historical processes, evolutionary change, and phe-notypic plasticity: geographic variation in behavior, morphology, andlife-history traits of common gartersnake, Thamnophis sirtalis, popula-tions. Ph.D. dissertation. University of Tennessee, Knoxville, TN.
Placyk Jr., J.S., Gillingham, J.C., 2002. Biogeography of the herpetofaunaof the Beaver Archipelago: a synthesis and reevaluation. Bull. ChicagoHerp. Soc. 37, 210–215.
Posada, D., Crandall, K.A., Templeton, A.R., 2000. GeoDis: a program forthe cladistic nested analysis of the geographical distribution of genetichaplotypes. Mol. Ecol. 9, 487–488.
Rossman, D.A., Ford, N.B., Seigel, R.A., 1996. The Garter Snakes: Evolu-tion and Ecology. University of Oklahoma Press, Norman, Oklahoma.
Rozas, J., Rozas, R., 1999. DnaSP version 3: an integrated program formolecular population genetics and molecular evolution analysis. Bioin-formatics 15, 174–175.
Rye, L., 2000. Analysis of areas of intergradation between described sub-species of the common garter snake, Thamnophis sirtalis, in Canada.Ph.D. dissertation. University of Guelph, Guelph, Ont..
Schneider, S., Roessli, D., ExcoYer, L., 2000. ARLEQUIN, Version 2.000.University of Geneva, Geneva, Switzerland.
Seigel, R.A., Collins, J.T. (Eds.), 1993. Snakes: Ecology and Behavior.McGraw-Hill, New York.
Seigel, R.A., Collins, J.T., Novak, S.S. (Eds.), 1987. Snakes: Ecology andEvolutionary Biology. McGraw-Hill, New York.
Smith, M.A., Green, D.M., 2004. Phylogeography of Bufo fowleri at itsnorthern range limit. Mol. Ecol. 13, 3723–3733.
Starkey, D.E., ShaVer, H.B., Burker, R.L., Forstner, M.R.J., Iverson, J.B.,Janzen, F.J., Rhodin, A.G.J., Ultsch, G.R., 2003. Molecular systematics,phylogeography, and the eVects of Pleistocene glaciation in the paintedturtle (Chrysemys picta) complex. Evolution 57, 119–128.
SwoVord, D., 2002. PAUP¤: Phylogenetic Analysis Using Parsimony (¤
and Other Methods), Version 4.0b10. Sinauer Associates, Sunderland,MA.
Tanner, H.H. (Ed.), 1986. Atlas of Great Lakes Indian History. Universityof Oklahoma Press, Norman, Oklahoma.
Templeton, A.R., 1998. Nested clade analyses of phylogeographic data:testing hypotheses about gene Xow and population history. Mol. Ecol.7, 381–397.
Templeton, A.R., 2004. Statistical phylogeography: methods of evaluatingand minimizing inference errors. Mol. Ecol. 13, 789–809.
Templeton, A.R., Boerwinkle, E., Sing, C.F., 1987. A cladistic analysis ofphenotypic associations with haplotypes inferred from restrictionendonuclease mapping. I. Basic theory and an analysis of alcohol dehy-drogenase activity in Drosophila. Genetics 117, 343–351.
Templeton, A.R., Crandall, K.A., Sing, C.F., 1992. A cladistic analysis ofphenotypic associations with haplotypes inferred from restrictionendonuclease mapping and DNA sequence data. III. Cladogram esti-mation. Genetics 132, 619–633.
Templeton, A.R., Routman, E., Phillips, C.A., 1995. Separating populationstructure from population history: a cladistic analysis of the geograph-ical distribution of mitochondrial DNA haplotypes in the Tiger sala-mander, Ambystoma tigrinum. Genetics 140, 767–782.
Thompson, J.D., Gibson, T.J., Plewnial, F., Jeanmougin, F., Higgins,D.G., 1997. The Clustal X windows interface: Xexible strategies formultiple alignment aided by quality analysis tools. Nucleic AcidsRes. 25, 4876–4882.
Webb III, T., Bartlein, P.J., Harrison, S.P., Anderson, K.H., 1993. Vegeta-tion, lake levels and climate in eastern North America for the past18,000 years. In: Wright, H.E., Kutzbach, J.E., Webb, III, T., Ruddi-man, W.F., Street-Perrott, F.A., Bartlein, P.J. (Eds.), Global ClimatesSince the Last Glacial Maximum. University of Minnesota Press, Min-neapolis, MN, pp. 415–467.
Wright, S., 1965. The interpretation of population structure by F-statisticswith special regard to systems of mating. Evolution 19, 395–420.
Zamudio, K.R., Savage, W.K., 2003. Historical isolation, range expan-sion, and secondary contact of two highly divergent mitochondriallineages in spotted salamanders (Ambystoma maculatum). Evolution57, 1631–1652.
Zink, R.M., 2005. Natural selection on mitochondrial DNA in Parus andits relevance for phylogeographic studies. Proc. R. Soc. Lond. B. Biol.Sci. 272, 71–78.