Embed Size (px)
Citation preview
C O M B U S T I O N A N D F L A M E 94:381-396 (1993) 381
Refractive Indices of Pyrolytic Graphite, Amorphous Carbon, and Flame Soot
in the Temperature Range 25 ° to 600°C
B. J. STAGG* and T. T. CHARALAMPOPOULOS t Mechanical Engineering Department, Louisiana State University, Baton Rouge, LA 70808
A technique was developed that allows the determination of the temperature dependence of the refractive indices of carbonaceous materials from ellipsometric intensity measurements on bulk samples. The refrac- tive indices of the carbonaceous samples pyrolytic graphite, amorphous carbon and flame soot were determined over the temperature range 25-600°C and the spectral region 400-700 nm. For all three samples it was found that the inferred refractive index shows insignificant variation with temperature for this range of temperature and wavelength. These results differ by 30 percent or more from the predictions of the Drude Lorentz dispersion model which has been used extensively to predict the variation of the optical properties of carbonaceous particulates. A new set of dispersion constants is presented that accurately predict the indices in the temperature range 25-600°C and in the wavelength range 400-700 nm.
INTRODUCTION
The complex refractive index (n - i k ) of car- bonaceous particulates such as soot is impor- tant in many areas of combustion research and in practical applications. This property charac- terizes the radiative transport in luminous flames and plays a key role in the interpreta- tion of conventional light scattering measure- ments. Data for the refractive indices of soot in both visible and infrared wavelengths have been obtained by a number of investigators [1-14]. The use of various reasonable values of the index in the analysis of light scattering data can lead to soot number densities that differ by a factor of five or more [15].
Previous measurements of soot refractive indices may be divided into two categories: in situ [1, 4, 7-8, 11-14], where the measure- ments are performed under flame conditions, and ex situ [2, 3, 5, 6, 9-10] were the soot is extracted from the flame prior to the measure- ment. The advantages and disadvantages of
*Present address: Columbia Chemicals Company, Opera- tions and Technology Center, P.O. Box 96, Hwy 139 and Southern Carbon Road, Swartz, LA 71281-0096. tTo whom correspondence should be sent.
Copyright © 1993 by The Combustion Institute Published by Elsevier Science Publishing Co., Inc.
each technique have been assessed in previous studies [9-14, 16-18]. However, the tempera- ture dependence of the refractive index of soot or other carbonaceous materials has not been addressed and is still subject to question [19].
On the other hand, the temperature depen- dence of radiative properties of various types of carbons and graphites has been studied. Plunkett and Kingery [20] measured the emis- sivities of carbon, graphite, and pyrolytic graphite with different surface characteristics over the temperature range 850°-1800°C. Results for graphite show that for a highly polished surface produced by burnishing, the spectral emissivity is almost independent of temperature, while the integrated emissivity value shows a positive temperature depen- dence. Carbon, on the other hand, shows no temperature dependence for emissivity but the emissivity changes with surface treatment. The differences in the temperature dependence appear to be related to the anisotropic optical properties of graphite. Autio and Scala [21] measured the spectral emissivity of pyrolytic and polycrystalline graphite in the temperature range 844°-1174°C and in the wavelength range 2.5-13 /xm. They found no temperature dependence for the emissivity in this range of temperature and wavelength.
0010-2180/93/$6.00
382 B. J. STAGG AND T. T. CHARALAMPOPOULOS
The Drude-Lorentz dispersion model has been utilized by several investigators [8, 22-23] to predict the temperature and wavelength dependence of the refractive indices of soot particles. The Drude-Lorentz model considers the solid to be an assembly of oscillators (elec- trons) that are set into forced vibration by the incident radiation. Each oscillator has an associated damping constant and a resonant frequency, whereas the free (conduction) electrons have a resonant frequency of zero. Soot has been ~ modeled to possess the same optical transitions as those of graphite, mean- ing that its electrons have the same resonant frequencies as graphite. Graphite has three bound electrons and one loosely bound elec- tron. Since the transition band of one of the bound electrons occurs well below the ultravio- let, an account of the optical properties in the visible and infrared can be obtained by consid- ering only two bound electrons, for which opti- cal transitions occur at wavelengths of 0.26 and 1.5 /zm.
Previous investigators have utilized the Drude-Lorentz model to predict the tempera- ture dependence of the refractive index of soot by assuming that the damping constants of the free and bound electrons change with temper- ature. Lee and Tien [8] and Charalampopoulos et al. [22] assumed that the damping constants of the electrons were proportional to the square root of temperature. Calculations of the real part (n) of the refractive index using the dis- persion model [22] in the temperature range 300 K to 1800 K have shown that the real part (n) of the complex refractive index is relatively insensitive to temperature change. Specifically, it was found that the real part (n) changes by less than 5 %, whereas the imaginary part (k) of the refractive index may change by more than 50% when the temperature varies in this range. Howarth et al. [23] assumed that the damping constants of the electrons were directly proportional to temperature and also assumed that the number density of free electrons increased with temperature. The assumption that the damping constants of the electrons are directly proportional to tempera- ture is the extreme case corresponding to a perfect crystal and should therefore predict the maximum effect temperature can have on the
refractive index. In this case, the real part of the refractive index was seen to change by as much as 20% as the temperature was varied from 300 to 2000 K and the imaginary part of the refractive index was seen to vary as much as 300% for the same temperature change. Since most carbonaceous particulates occur- ring in combustion systems are not perfect crystals, Howarth et al. [23] point out that their predicted temperature effects are too large.
As noted, the Drude-Lorentz dispersion model has been used to predict the wavelength and temperature dependence of the complex refractive index of flame soot. However, the accuracy of these predictions can be ques- tioned since the model can only be considered empirical when applied to a material that is not a perfect crystal. Also, the temperature dependence of the dispersion model parame- ters, such as electron damping constants and oscillator strengths, is not precisely known.
Ideally, the temperature dependence of the index of refraction of combustion generated particulates should be evaluated under flame conditions. Nevertheless, since accurate con- trol of particle temperature and chemical com- position under flame conditions is difficult, as a first step, an ex situ study for this type of investigation was carried out.
The purpose of the present study is to deter- mine the temperature dependence of the refractive indices of the carbonaceous samples, pyrolytic graphite, amorphous carbon and flame soot. This is accomplished by measuring the intensity of polarized light reflected from the surface of a bulk sample contained in a high- temperature unit.
Ellipsometric intensity measurements were carried out in the wavelength range 400- 700 nm and as a function of the angular polar- ization state of the incident and reflected light. On the other hand, due to sample oxidation, with the present system [24], the maximum temperature where reliable measurements could be carried out was 600°C [25].
THEORY
The intensity of a light beam through an ellip- someter system may be derived with the aid of Mueller calculus [26, 27]. Mueller calculus is a
REFRACTIVE INDICES OF GRAPHITE, CARBON, AND SOOT 383
mathematical technique that is utilized to describe the change in intensity and polariza- tion of a light beam as it passes through or is redirected by the elements of an optical sys- tem. Using the Mueller calculus, the Mueller matrix of the ellipsometer system shown in Fig. 1 can be expressed as
[M] = [ D ] [ A ] [ S ] [ P ] [ L ] , (1)
where [M] represents the Mueller matrix of the entire ellipsometer system, [D] the detec- tor optics (the elements P2, C2, and the monochromator), [A] the analyzer (analyzing polarizer), [S] the sample of interest, [P] the polarizer, and [L] represents the light source optics (including light source, and the elements P1, and C1). In this study, the matrices [D] and [L] are treated as unknown quantities. These matrices depend upon the coatings of the mir- rors, the angle of reflection from these mirrors, and [D] also depends strongly on the specific design of the monochromator [28]. The polar- izer and analyzer were assumed to have zero leakage, meaning that the second principal transmittances are zero. The intensity of light through the ellipsometer system, expressed as the product of the (1, 1) element of the system Mueller matrix multiplied by a constant, may be written as [25, 28]
I ( P , A ) = C I k A k p R ±
X [ p2 cos 2 p cos 2 A
+ sin 2 P sin 2 A
+ --cos A sin 2 P sin 2 A 2
dl,2 dl 3 . ] + d-~COs2A + ' s ln2A 1 1,1 dl,1
12 1 13 1 ] + -'- cos2P + s in2P
ll, 1 11',1 ' 1 (2)
where k A and k e are the first principal trans- mittances of the analyzer and polarizer, R j_ is the perpendicular component of the reflectiv- ity, p and A the ellipsometric parameters of the sample, P and A the polarizer and ana- lyzer azimuth angles, l~,j and dij are the ele-
ments of the [L] and [D] matrices, and C1 is a constant. It is noted that the parameters p and A are defined as the ratio of the reflectivities in the plane parallel (p) and perpendicular (s) to the plane of incidence, namely [26]:
Yp IYple i~È - - - - p e 'A, (3)
7 s IYsle i~
where
p,s
(4)
with /~r,/~i being the reflected and incident electric field vector components in the plane parallel and perpendicular to the plane of inci- dence. It is also noted that the polarizer azimuths, P and A, are the azimuthaI angles between the transmission axis of the polarizer and the plane of incidence. The direction of positive azimuth is counterclockwise when looking into the oncoming beam. In Eq. 2 the terms including li, j account for the fact that the light source may not possess entirely ran- dom polarization. It should be noted that if only the polarizer, sample, and analyzer are considered (equivalent to assuming that [L] and [D] are equal to the identity matrix), the light intensity through the polarizer, sample, analyzer (PSA) ellipsometer system reduces to
IpsA( P , A ) = C 2 k A k p R ±
)<[p2cos 2 Pcos 2 A
+ sin 2 P sin 2 A
1 + --cos A sin 2P sin 2A (5) 2 '
where C 2 is a constant. Since the monochro- mator usually causes a larger change in polar- ization than the source optics, the analyzer is fixed at a given value of A, and P is varied to obtain the necessary measurements. This allows the term involving di. j in Eq. 2 to be constant and can be grouped with C r Since in this study the [L] matrix involves only reflection from aluminum coated mirrors, the [L] matrix may only slightly alter the polarization of the beam (depending on the angle of reflection from the
384 B. J. STAGG AND T. T. C H A R A L A M P O P O U L O S
mirrors). Therefore, if A is fixed, and the [L] matrix does not affect the polarization of the beam, Eq. 2 is reduced to Eq. 5, disregarding 1 x--'~v
a0 ii, the multiplying constants. = N i~
In order to determine the ellipsometric parameters, p and A, of the sample, it is necessary to take measurements at various set- tings of the polarizer and analyzer. This emphasizes the need for accurate settings and of the polarizer and analyzer. Accurate set- tings can be obtained with the use of a high- precision rotator once the reference positions of the polarizer and analyzer are known with respect to the plane of incidence. A method by which the true position of the polarizer and analyzer with respect to the plane of incidence can be determined was developed recently [28].
It can be shown from Eq. 5 that as the polarizer is rotated, the intensity through a PSA ellipsometer varies sinusoidally [27]. Therefore, Eq. 5 can be rewritten as a trun- cated Fourier series in the form
IpsA(P) = a0[1 + a 2 cosEP + b 2 sin 2P ] ,
(6)
where the normalized Fourier coefficients, a 2 and be, are given as
pE _ tan E A (7) and p2 + tan 2 A a2
and
2 p cos A tan A b2 = .0 2 + tan 2 A (8)
Solving Eqs. 7 and 8 the ellipsometric parame- ters, p and A, are related to the normalized Fourier coefficients a 2 and b 2 by the expres- sions
~ l + a 2 p = tan A ~ aE (9)
and
b2 cos A = (10)
~/1 - a~
The Fourier coefficients may be determined from experimental measurements by a discrete
Fourier transform, given as [26]
(11)
2 N
a2 = -~ i ]~'Ii=1 cos2Pi , (12)
2 N DE = -~ i ~'=11i sin 2P i, (13)
where I i are the measured intensities at equally spaced azimuthal setting s, Pi, N is the num- ber of experimental measurements, and a 2 = ~2/ao, b 2 = bE/a o. In this study intensity mea- surements were performed for a full rotation of the polarizer at 20 ° intervals. Thus the parameters, p and A, may be obtained from intensity measurements. It is noted that if the sample surface is smooth and free of oxide films, the parameters p and A are related to the refractive index by [26, 30]
a 2 + b 2 - 2a sin 0 tan 0 + sin 2 0 tan E 0
/92 = a 2 + b 2 + 2a sin 0 tan 0 + sin 2 0 tan 2 0
(14)
- E b sin 0 tan 0 tan A = a2 + b2 _ sine 0 tan 2 8 ' (15)
where 0 is the angle of incidence and a and b are defined in terms of the real (n) and imagi- nary (k) parts of the refractive index as
2 a 2 = [(n 2 - k 2 - sin 2 8 ) 2 + 4n2k2] 1/z
+ ( n E - k 2 - sin E 8)
and
(16)
2b 2 = r[ (n2 _ k 2 _ sin 2 8 ) 2 + 4n2kE]1/E,
- - ( n 2 -- k 2 - sin 2 8) . (17)
In order to infer the refractive index from values of p and A, it is necessary to solve Eqs. 14-17. The real (n) and imaginary (k) parts of
REFRACTIVE INDICES OF GRAPHITE, CARBON, AND SOOT 385
the complex refractive index are expressed in terms of p and A by the relations [30]
[(a2 - b 2 + sin 2 0 )2+ 4a2b2] 1/2 2n2=
+ ( a : - b 2 + sin 2 0) (18)
and
ab k = - - , (19)
n
where
(1 - p2)sin 0 tan 0
a = l + 2 p c o s A + p 2 (20)
and
2 p sin 0 tan 0 sin A
b = l + 2 o c o s A + p 2 • (21)
Therefore, once p and A are determined, the complex refractive index can be computed from Eqs. 18-21.
Note that although the methodology and equations are not described in this article, the effects of the [L] matrix (Eqs. 1 and 2) and the effects of birefringent windows were accounted for when computing the final results for the refractive indices [25].
E X P E R I M E N T A L SYSTEM
The experimental unit consists of a high- temperature chamber and an optical system. The high-temperature chamber allows moni- toring of the temperature in the range 50°C to 2,300°C. Heat is supplied to the sample by tungsten resistance heating elements. The sealed chamber is a rectangular, water-cooled, double-walled shell with dimensions 20 x 20 × 30 cm and can be operated under vac- uum or inert gas conditions. The inert gas escapes through a small relief valve which can be activated at a pressure greater than or equal to 14 kPa. The sample holder is a circu- lar, flat base 2.54 cm in diameter, supported on the end of a cylindrical rod 13 cm long and 1.3 cm in diameter. The entire assembly is made of fiber-reinforced graphite and is attached to a precision adjustable linear feed-
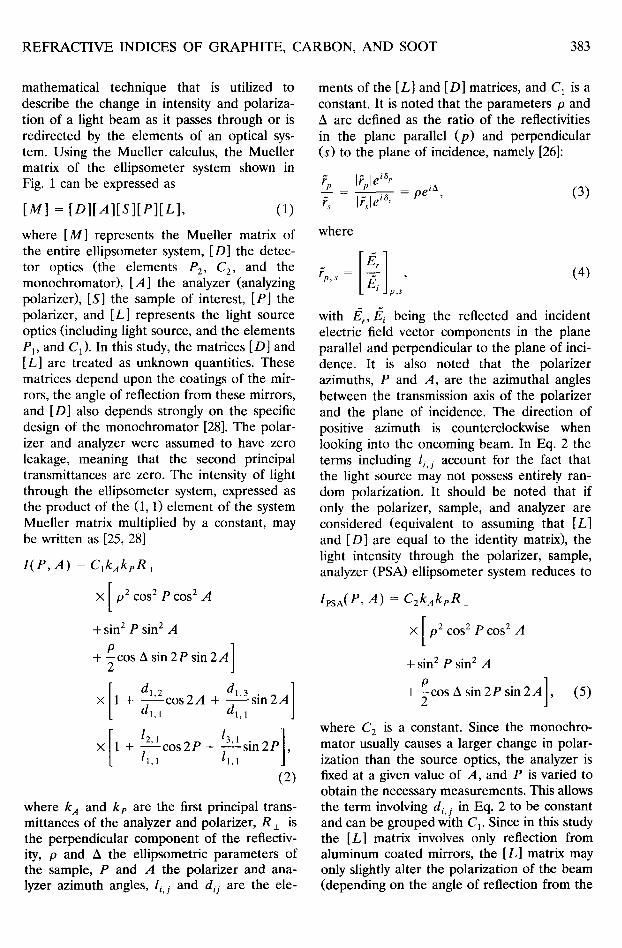
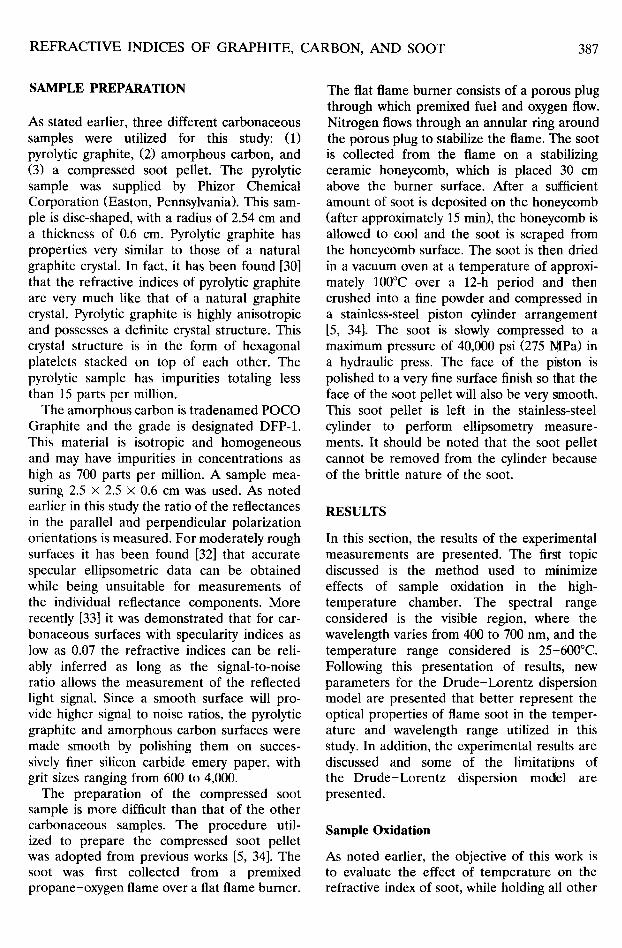
through (MDC, model K150-MLM-2) located on the bottom of the furnace chamber. The mechanism provides adjustment for the verti- cal position of the sample over a 5.1-cm range of motion. The graphite rod of the sample holder gains access to the hot zone through a circular opening 1.5 cm in diameter in the bottom of the thermal radiation shields. Opti- cal access into the furnace chamber for ellip- sometry measurements is provided by fused silica windows, designated as W1 and W2 in Fig. 1 and optical access into the hot zone is provided by rectangular slits (0.6 cm × 2.5 cm) in the radiation shields, shown Fig. 2. The temperature of the sample surface was mea- sured with a retractable type "C" thermocou- pie (Tungsten, 5% Re/Tungsten, 26% Re) 20 cm long in a 0.32-cm molybdenum sheath. More details about the high-temperature chamber and the temperature measurements are presented in earlier work [24].
The optical system consists of: (1) the light source, (2) the detector, and (3) the amplifica- tion unit. The light source is a 150-W xenon arc lamp mounted in an air-cooled monochro- mator illuminator housing, Oriel model 68700. The light beam is focused to a point located 63.5 mm in front of the illuminator housing by a rotary concave mirror located in the illumi- nator housing. A set of iris diaphragms is mounted after the exit port to provide control of the beam width. The beam is directed and focused onto the sample (S) by the plane (P1) and concave (C1) first surface mirrors. The light reflected from the sample is directed and focused onto the detector system by the plane (P2) and concave (C2) first surface mirrors. The concave mirrors (C1 and C2) have a focal length of 200 mm and all the mirrors (P1, C1, P2, and C2) are 50.8 mm in diameter. A 50.8- ms-diameter dichroic sheet polarizer (Oriel model 27340) is located at the entrance (P) and exit (A) of the high-temperature chamber. These polarizing elements have extinction ratios less than 10 -3 for the spectral range 400-700 nm.
The first element of the detector system is the grating monochromator, Oriel model 77250. A holographic grating was utilized which cov- ers the spectral range 180-700 nm. The field of view of the detector and the spectral band-
386 B.J . STAGG AND T. T. CHARALAMPOPOULOS
Fron t View
I C1
wl
S
P2
T o p View
LS t ! UFE2.~ P1
LC
D S
P2
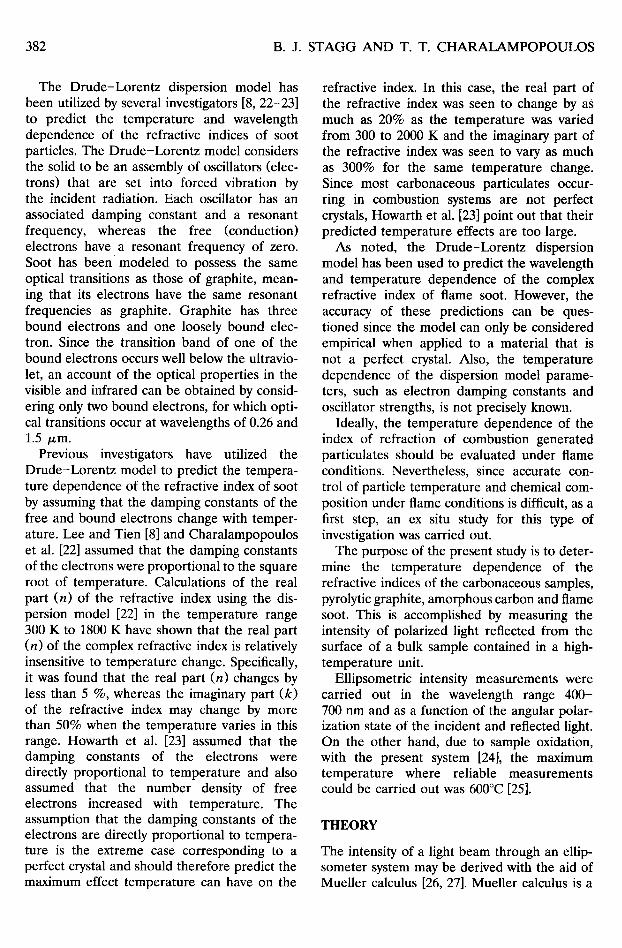
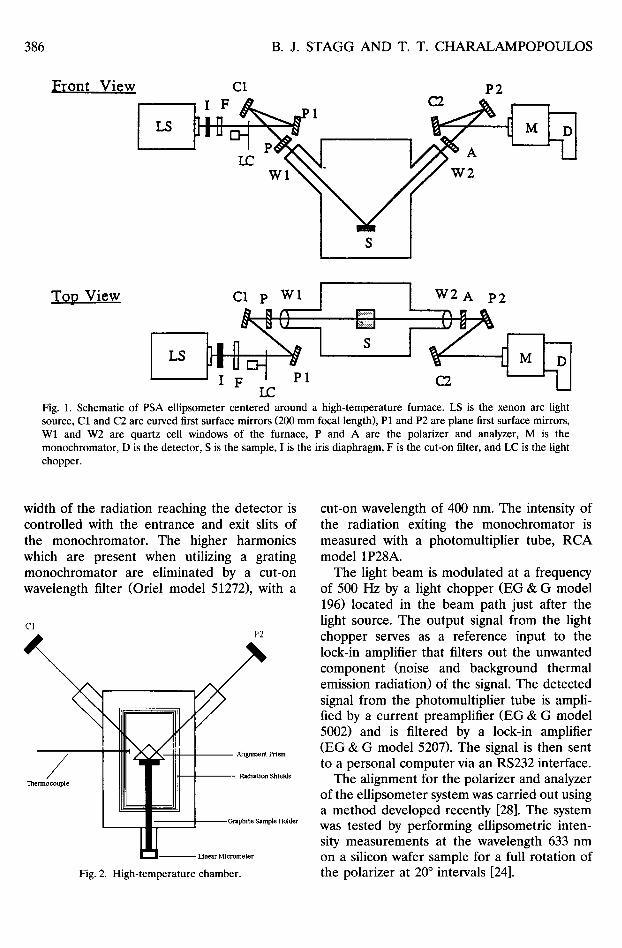
Fig. 1. Schematic of PSA ellipsometer centered around a high-temperature furnace. LS is the xenon arc light source, C1 and C2 are curved first surface mirrors (200 mm focal length), P1 and P2 are plane first surface mirrors, W l and W2 are quartz cell windows of the furnace, P and A are the polarizer and analyzer, M is the monochromator, D is the detector, S is the sample, I is the iris diaphragm, F is the cut-on filter, and LC is the light chopper.
width of the radiation reaching the detector is controlled with the entrance and exit slits of the monochromator. The higher harmonics which are present when utilizing a grating monochromator are eliminated by a cut-on wavelength filter (Oriel model 51272), with a
C1 P2
/ iE_~l
Alignment Prism
Radiation Shields
Graphite Sample Holder
Linear Micrometer
Fig. 2. High-temperature chamber.
cut-on wavelength of 400 nm. The intensity of the radiation exiting the monochromator is measured with a photomultiplier tube, RCA model 1P28A.
The light beam is modulated at a frequency of 500 Hz by a light chopper (EG & G model 196) located in the beam path just after the light source. The output signal from the light chopper serves as a reference input to the lock-in amplifier that filters out the unwanted component (noise and background thermal emission radiation) of the signal. The detected signal from the photomultiplier tube is ampli- fied by a current preamplifier (EG & G model 5002) and is filtered by a lock-in amplifier (EG & G model 5207). The signal is then sent to a personal computer via an RS232 interface.
The alignment for the polarizer and analyzer of the ellipsometer system was carried out using a method developed recently [28]. The system was tested by performing ellipsometric inten- sity measurements at the wavelength 633 nm on a silicon wafer sample for a full rotation of the polarizer at 20 ° intervals [24].
REFRACTIVE INDICES OF GRAPHITE, CARBON, AND SOOT 387
SAMPLE PREPARATION
As stated earlier, three different carbonaceous samples were utilized for this study: (1) pyrolytic graphite, (2) amorphous carbon, and (3) a compressed soot pellet. The pyrolytic sample was supplied by Phizor Chemical Corporation (Easton, Pennsylvania). This sam- ple is disc-shaped, with a radius of 2.54 cm and a thickness of 0.6 cm. Pyrolytic graphite has properties very similar to those of a natural graphite crystal. In fact, it has been found [30] that the refractive indices of pyrolytic graphite are very much like that of a natural graphite crystal. Pyrolytic graphite is highly anisotropic and possesses a definite crystal structure. This crystal structure is in the form of hexagonal platelets stacked on top of each other. The pyrolytic sample has impurities totaling less than 15 parts per million.
The amorphous carbon is tradenamed POCO Graphite and the grade is designated DFP-1. This material is isotropic and homogeneous and may have impurities in concentrations as high as 700 parts per million. A sample mea- suring 2.5 x 2.5 x 0.6 cm was used. As noted earlier in this study the ratio of the reflectances in the parallel and perpendicular polarization orientations is measured. For moderately rough surfaces it has been found [32] that accurate specular ellipsometric data can be obtained while being unsuitable for measurements of the individual reflectance components. More recently [33] it was demonstrated that for car- bonaceous surfaces with specularity indices as low as 0.07 the refractive indices can be reli- ably inferred as long as the signal-to-noise ratio allows the measurement of the reflected light signal. Since a smooth surface will pro- vide higher signal to noise ratios, the pyrolytic graphite and amorphous carbon surfaces were made smooth by polishing them on succes- sively finer silicon carbide emery paper, with grit sizes ranging from 600 to 4,000.
The preparation of the compressed soot sample is more difficult than that of the other carbonaceous samples. The procedure util- ized to prepare the compressed soot pellet was adopted from previous works [5, 34]. The soot was first collected from a premixed propane-oxygen flame over a fiat flame burner.
The fiat flame burner consists of a porous plug through which premixed fuel and oxygen flow. Nitrogen flows through an annular ring around the porous plug to stabilize the flame. The soot is collected from the flame on a stabilizing ceramic honeycomb, which is placed 30 cm above the burner surface. After a sufficient amount of soot is deposited on the honeycomb (after approximately 15 min), the honeycomb is allowed to cool and the soot is scraped from the honeycomb surface. The soot is then dried in a vacuum oven at a temperature of approxi- mately 100°C over a 12-h period and then crushed into a fine powder and compressed in a stainless-steel piston cylinder arrangement [5, 34]. The soot is slowly compressed to a maximum pressure of 40,000 psi (275 MPa) in a hydraulic press. The face of the piston is polished to a very fine surface finish so that the face of the soot pellet will also be very smooth. This soot pellet is left in the stainless-steel cylinder to perform ellipsometry measure- ments. It should be noted that the soot pellet cannot be removed from the cylinder because of the brittle nature of the soot.
RESULTS
In this section, the results of the experimental measurements are presented. The first topic discussed is the method used to minimize effects of sample oxidation in the high- temperature chamber. The spectral range considered is the visible region, where the wavelength varies from 400 to 700 nm, and the temperature range considered is 25-600°C. Following this presentation of results, new parameters for the Drude-Lorentz dispersion model are presented that better represent the optical properties of flame soot in the temper- ature and wavelength range utilized in this study. In addition, the experimental results are discussed and some of the limitations of the Drude-Lorentz dispersion moclel are presented.
Sample Oxidation
As noted earlier, the objective of this work is to evaluate the effect of temperature on the refractive index of soot, while holding all other
388 B . J . STAGG AND T. T. CHARALAMPOPOULOS
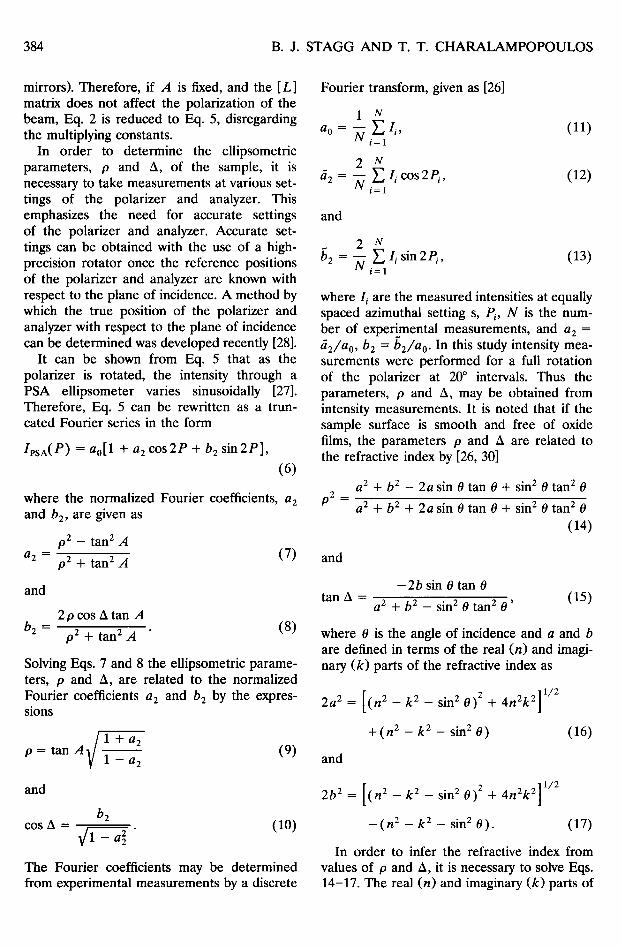
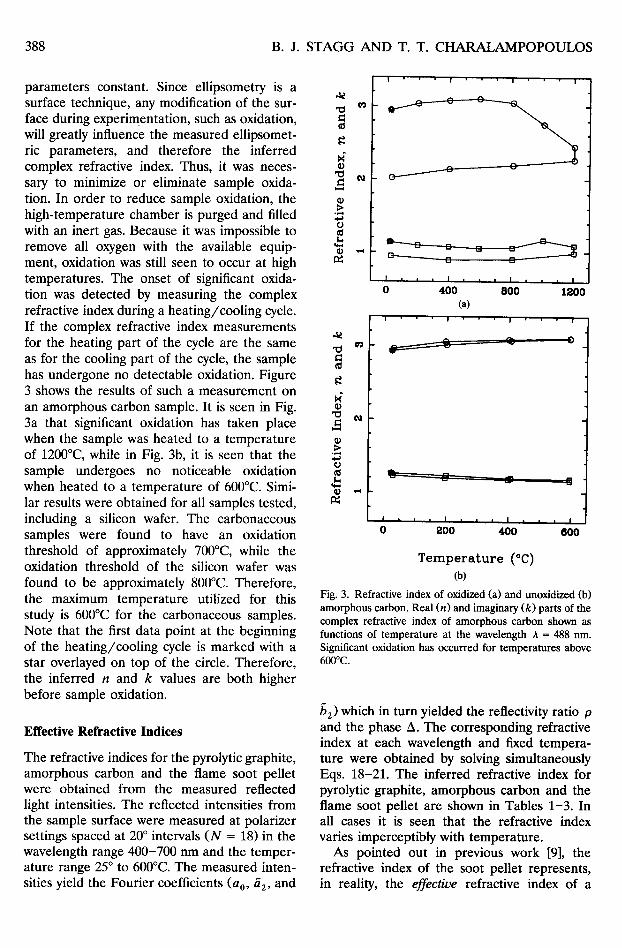
parameters constant. Since ellipsometry is a surface technique, any modification of the sur- face during experimentation, such as oxidation, will greatly influence the measured ellipsomet- ric parameters, and therefore the inferred complex refractive index. Thus, it was neces- sary to minimize or eliminate sample oxida- tion. In order to reduce sample oxidation, the high-temperature chamber is purged and filled with an inert gas. Because it was impossible to remove all oxygen with the available equip- ment, oxidation was still seen to occur at high temperatures. The onset of significant oxida- tion was detected by measuring the complex refractive index during a heating/cooling cycle. If the complex refractive index measurements for the heating part of the cycle are the same as for the cooling part of the cycle, the sample has undergone no detectable oxidation. Figure 3 shows the results of such a measurement on an amorphous carbon sample. It is seen in Fig. 3a that significant oxidation has taken place when the sample was heated to a temperature of 1200°C, while in Fig. 3b, it is seen that the sample undergoes no noticeable oxidation when heated to a temperature of 600°C. Simi- lar results were obtained for all samples tested, including a silicon wafer. The carbonaceous samples were found to have an oxidation threshold of approximately 700°C, while the oxidation threshold of the silicon wafer was found to be approximately 800°C. Therefore, the maximum temperature utilized for this study is 600°C for the carbonaceous samples. Note that the first data point at the beginning of the heating/cooling cycle is marked with a star overlayed on top of the circle. Therefore, the inferred n and k values are both higher before sample oxidation.
Effect ive Refract ive Indices
The refractive indices for the pyrolytic graphite, amorphous carbon and the flame soot pellet were obtained from the measured reflected light intensities. The reflected intensities from the sample surface were measured at polarizer settings spaced at 20 ° intervals (N = 18) in the wavelength range 400-700 nm and the temper- ature range 25 ° to 600°C. The measured inten- sities yield the Fourier coefficients (a0, ti2, and
f f q)
0
¢J
, :e
ff 0
"t:l t ~
¢J
! I
. .e - - - - -o
I I I I I
o ~ 0 (a)
I I
L
I i I i
0 800
I I
, I , , I
BOO 1gO0
I I
t , I
400 600
Temperature (*C)
(b)
Fig. 3. Refractive index of oxidized (a) and unoxidized (b) amorphous carbon. Real (n) and imaginary (k) parts of the complex refractive index of amorphous carbon shown as functions of temperature at the wavelength A = 488 nm. Significant oxidation has occurred for temperatures abovc 600°C.
/~2) which in turn yielded the reflectivity ratio p and the phase A. The corresponding refractive index at each wavelength and fixed tempera- ture were obtained by solving simultaneously Eqs. 18-21. The inferred refractive index for pyrolytic graphite, amorphous carbon and the flame soot pellet are shown in Tables 1-3. In all cases it is seen that the refractive index varies imperceptibly with temperature.
As pointed out in previous work [9], the refractive index of the soot pellet represents, in reality, the effective refractive index of a
REFRACTIVE INDICES OF GRAPHITE, CARBON, AND SOOT 389
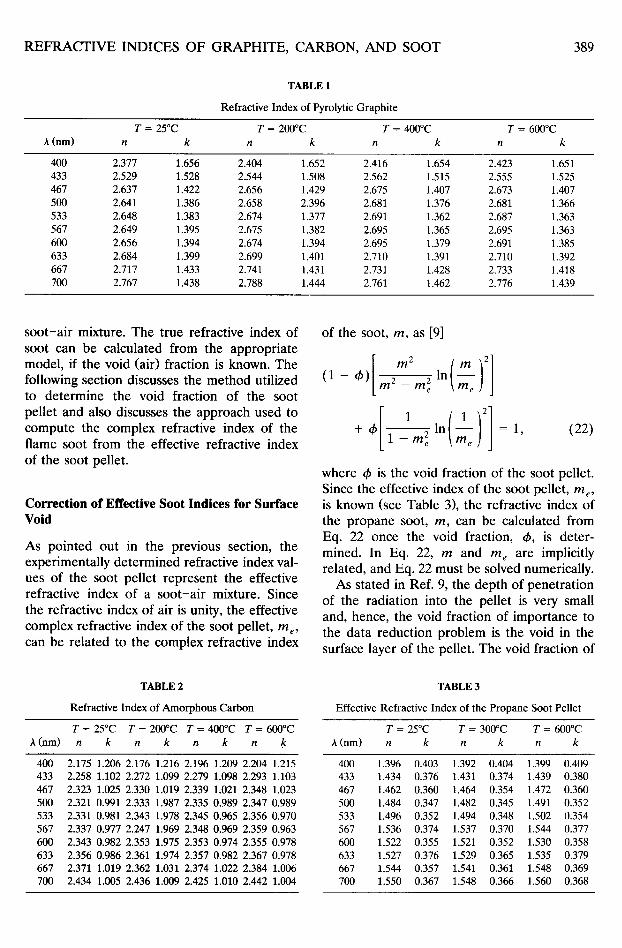
TABLE 1
Refractive Index of Pyrolytic Graphite
T = 25°C T = 200°C T = 400°C T = 600°C A (nm) n k n k n k n k
400 2.377 1.656 2.404 1.652 2.416 1.654 2.423 1.651 433 2.529 1.528 2.544 1.508 2.562 1.515 2.555 1.525 467 2.637 1.422 2.656 1.429 2.675 1.407 2.673 1.407 500 2.641 1.386 2.658 2.396 2.681 1.376 2.681 1.366 533 2.648 1.383 2.674 1.377 2.691 1.362 2.687 1.363 567 2.649 1.395 2.675 1.382 2.695 1.365 2.695 1.363 600 2.656 1.394 2.674 1.394 2.695 1.379 2.691 1.385 633 2.684 1.399 2.699 1.401 2.710 1.391 2.710 1.392 667 2.717 1.433 2.741 1.431 2.731 1.428 2.733 1.418 700 2.767 1.438 2.788 1.444 2.761 1.462 2.776 1.439
soot-air mixture. The true refractive index of soot can be calculated from the appropriate model, if the void (air) fraction is known. The following section discusses the method utilized to determine the void fraction of the soot pellet and also discusses the approach used to compute the complex refractive index of the flame soot from the effective refractive index of the soot pellet.
Correction of Effective Soot Indices for Surface Void
As pointed out in the previous section, the experimentally determined refractive index val- ues of the soot pellet represent the effective refractive index of a soot-air mixture. Since the refractive index of air is unity, the effective complex refractive index of the soot pellet, m e, can be related to the complex refractive index
TABLE 2
Refractive Index of Amorphous Carbon
T = 25°C T = 2 0 0 ° C T = 4 0 0 ° C T = 6 0 0 ° C )t (nm) n k n k n k n .k
400 2.175 1.206 2.176 1.216 2.196 1.209 2.204 1.215 433 2.258 1.102 2.272 1.099 2.279 1.098 2.293 1.103 467 2.323 1.025 2.330 1.019 2.339 1.021 2.348 1.023 500 2.321 0.991 2.333 1.987 2.335 0.989 2.347 0.989 533 2.331 0.981 2.343 1.978 2.345 0.965 2.356 0.970 567 2.337 0.977 2.247 1.969 2.348 0.969 2.359 0.963 600 2.343 0.982 2.353 1.975 2.353 0.974 2.355 0.978 633 2.356 0.986 2.361 1.974 2.357 0.982 2.367 0.978 667 2.371 1.019 2.362 1.031 2.374 1.022 2.384 1.006 700 2.434 1.005 2.436 1.009 2.425 1.010 2.442 1.004
of the soot, m, as [9]
(1 - ~b) m 2 - - m 2 e - In --me
+ 4~ ~ In = 1, (22)
where ~b is the void fraction of the soot pellet. Since the effective index of the soot pellet, m e ,
is known (see Table 3), the refractive index of the propane soot, m, can be calculated from Eq. 22 once the void fraction, ~b, is deter- mined. In Eq. 22, m and m e are implicitly related, and Eq. 22 must be solved numerically.
As stated in Ref. 9, the depth of penetration of the radiation into the pellet is very small and, hence, the void fraction of importance to the data reduction problem is the void in the surface layer of the pellet. The void fraction of
TABLE 3
Effective Refractive Index of the Propane Soot Pellet
T = 25°C T = 300°C T = 600°C h (nm) n k n k n k
400 1.396 0.403 1.392 0.404 1.399 0.409 433 1.434 0.376 1 .431 0.374 1.439 0.380 467 1.462 0.360 1.464 0.354 1.472 0.360 500 1.484 0.347 1.482 0.345 1 .491 0.352 533 1.496 0.352 1.494 0.348 1.502 0.354 567 1.536 0.374 1.537 0.370 1.544 0.377 600 1.522 0.355 1.521 0.352 1.530 0.358 633 1.527 0.376 1.529 0.365 1.535 0.379 667 1.544 0.357 1 .541 0.361 1.548 0.369 700 1.550 0.367 1.548 0.366 1.560 0.368
390 B. J. STAGG AND T. T. CHARALAMPOPOULOS
the surface layers of the soot pellet (~b) is found as
~b = ~b A + ~bv, (23)
where ~b a and ~b v represent the area and volume void fraction, respectively. The volume void fraction is obtained by modeling the aggregate soot structure as a random close packed lattice of fused spheres, namely [9]
~b v = (1 - ~A)~RCP, (24)
where ~bRc P is the volume void fraction of an assembly of random close packed fused spheres. The degree of fusion of the spheres was seen to be approximately 0.8, which yields ~bRC P "~" 0.091.
The area void fraction, thA, is defined as the ratio of the area of the voids to the total area of the surface plane. The area void fraction is determined from image analysis of an SEM micrograph of the pellet surface. The micro- graph was taken utilizing a Philips SEM, Model 505 at a magnification of approximately 30,000 X. The micrograph was then analyzed using the Prizm Image Analysis System implemented on a Quadra 950 Macintosh computer. Each pixel of the digitized image has an associated gray level between 0 and 255. The void fraction was determined to be the percentage of pixels with gray levels ranging from 220 to 255, since the gray level histogram exhibited a valley at this point. Ideally, the gray level histogram will be a pure bimodal distribution, and the thresh- old value (gray level at the histogram valley) is easily determined. The ideal case does not occur in practice. The area void fraction of the soot pellet determined utilizing this method is found to be ~b A = 0.21, Substituting (~RCP =
0.091 and thA = 0.21 into Eqs. 23 and 24 yields a void fraction of the surface layers of ~b = 0.28.
The refractive index of the propane soot, m, was calculated from Eq. 22 utilizing ~b = 0.28 and the effective refractive index values, m e ,
listed in Table 3. The soot refractive index values found utilizing this technique are listed in Table 4.
The percentage change for the real (n) and imaginary (k) part of the index for the soot determined from the present study and those calculated using the T 1/2 dependence of the
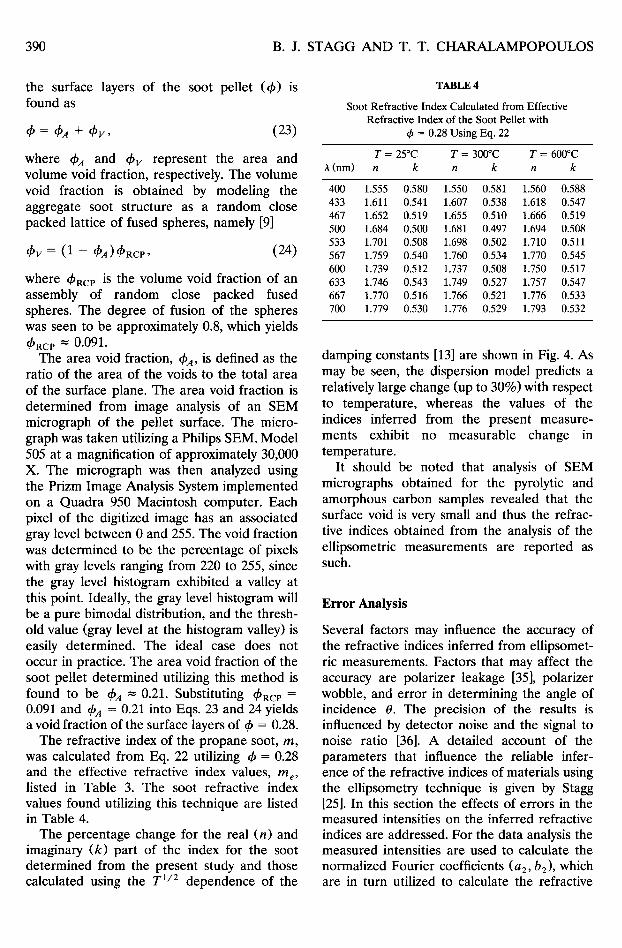
TABLE 4
Soot Refractive Index Calculated from Effective Refractive Index of the Soot Pellet with
~b = 0.28 Using Eq. 22
T = 25°C T = 300°C T= 600°C A (nm) n k n k n k
400 1.555 0.580 1.550 0.581 1.560 0.588 433 1 . 6 1 1 0.541 1.607 0.538 1.618 0.547 467 1.652 0.519 1.655 0.510 1.666 0.519 500 1.684 0.500 1 . 6 8 1 0.497 1.694 0.508 533 1 . 7 0 1 0.508 1.698 0.502 1.710 0.511 567 1.759 0.540 1.760 0.534 1.770 0.545 600 1.739 0.512 1.737 0.508 1.750 0.517 633 1.746 0.543 1.749 0.527 1.757 0.547 667 1.770 0.516 1.766 0.521 1.776 0.533 700 1.779 0.530 1.776 0.529 1.793 0.532
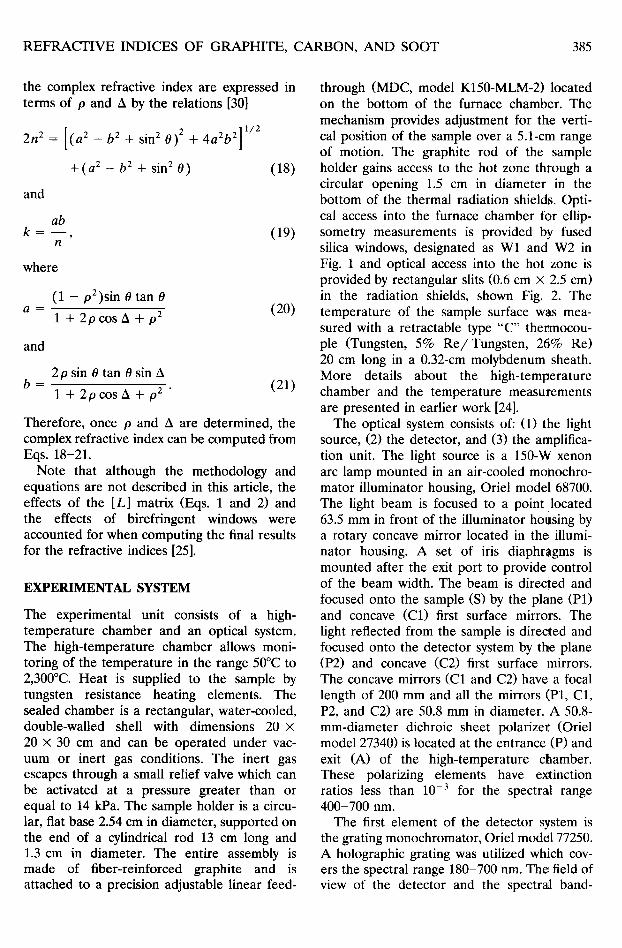
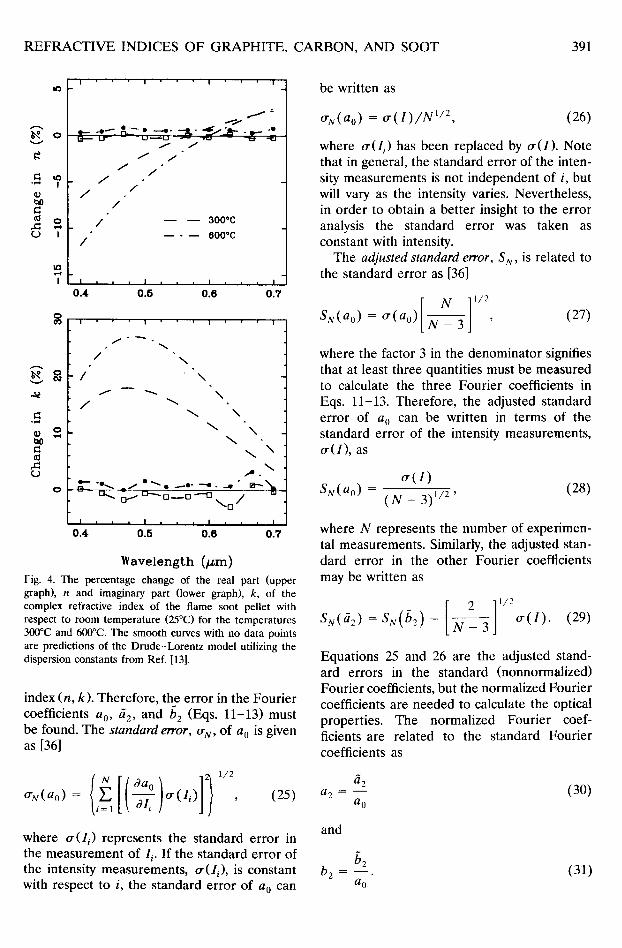
damping constants [13] are shown in Fig. 4. As may be seen, the dispersion model predicts a relatively large change (up to 30%) with respect to temperature, whereas the values of the indices inferred from the present measure- ments exhibit no measurable change in temperature.
It should be noted that analysis of SEM micrographs obtained for the pyrolytic and amorphous carbon samples revealed that the surface void is very small and thus the refrac- tive indices obtained from the analysis of the ellipsometric measurements are reported as such.
Error Analysis
Several factors may influence the accuracy of the refractive indices inferred from ellipsomet- ric measurements. Factors that may affect the accuracy are polarizer leakage [35], polarizer wobble, and error in determining the angle of incidence 0. The precision of the results is influenced by detector noise and the signal to noise ratio [36]. A detailed account of the parameters that influence the reliable infer- ence of the refractive indices of materials using the ellipsometry technique is given by Stagg [25]. In this section the effects of errors in the measured intensities on the inferred refractive indices are addressed. For the data analysis the measured intensities are used to calculate the normalized Fourier coefficients (a 2, b2), which are in turn utilized to calculate the refractive
R E F R A C T I V E I N D I C E S O F G R A P H I T E , C A R B O N , A N D S O O T 391
~, o
.~ ~?
i t ' 3 I - I
I
I I I I
I / . . - - . o ~ ?',._~ ~ ---4. -:~- -,~../_:&- _ _ - -
/ / " / /
/ / /
/ / /
/ - - - - 3 0 0 " C
6 0 0 " C /
I I I i |
0.4 0.5 0.6 0.7
O
o v
o
cO
O
i i
/ \
/ N \
N \ \
\ \ \
.,o \ . . . . .
I l , , , I , , , I
0.4 0.5 0.6 0•7
W a v e l e n g t h ( /zm)
Fig. 4. The percentage change of the real part (upper graph), n and imaginary part (lower graph), k, of the complex refractive index of the flame soot pellet with respect to room temperature (25°C) for the temperatures 300°C and 600°C. The smooth curves with no data points are predictions of the Drude-Lorentz model utilizing the dispersion constants from Ref. [13].
index (n, k). Therefore , the er ror in the Four ier coefficients a0, a2, and /~2 (Eqs. 11-13) must be found. The standard error, o'N, of a 0 is given as [36]
be writ ten as
O'U( ao) = O-( I) /N1/2, (26)
where o-(I i) has been replaced by o-(I) . Note that in general, the s tandard e r ror of the inten- sity measurements is not independent of i, but will vary as the intensity varies. Nevertheless, in order to obtain a bet ter insight to the er ror analysis the s tandard er ror was taken as constant with intensity.
The adjusted standard error, SN, is related to the s tandard er ror as [36]
[ N 11/2 SN(ao) = o - ( a 0 ) | T ; ~ ; # | ,
t l V - 3 J (27)
where the factor 3 in the denomina to r signifies that at least three quantit ies must be measured to calculate the three Four ier coefficients in Eqs. 11-13. Therefore , the adjusted s tandard er ror of a 0 can be written in terms of the s tandard er ror of the intensity measurements , o-(I) , as
o-(I) S N ( a ° ) ( N - 3) 1/2' (28)
where N represents the number of experimen- tal measurements . Similarly, the adjusted stan- dard er ror in the o ther Four ier coefficients may be written as
o - ( l ) . (29)
Equat ions 25 and 26 are the adjusted stand- ard errors in the s tandard (nonnormal ized) Four ier coefficients, but the normal ized Four ier coefficients are needed to calculate the optical properties• The normal ized Four ier coef- ficients are related to the s tandard Four ier coefficients as
11 l j2 O-N(aO) = i=1 ~ ~ - ~ / o - ( I i ) , (25) a2 = --a0
and
(30)
where o-(I i) represents the s tandard er ror in the measu remen t o f / / . I f the s tandard e r ror o f b2 the intensity measurements , o-(Ii) , is constant b 2 = - - . with respect to i, the s tandard e r ror o f a 0 can a0
(31)
392 B . J . STAGG AND T. T. CH A RA LA MP O P O U LO S
The adjusted standard error in the normalized Fourier coefficients is given as
c9a2 ~ 2
Oa2 1/2
Substituting Eqs. 28-31 into Eq. 32 yields
o ' ( I ) [2 + a2] 1/2. (33) SN(a2) = ( N - 3)1/2a 0
Similarly, the adjusted standard error in b 2 is found as
o - ( I ) [2 + b2] 1/2. (34) SN(b2) = ( N - 3)1/2a0
Although Eqs. 33 and 34 were derived with the simplifying assumption that o ' ( I i) = o-(I) for all i, these relations provide valuable informa- tion about the error analysis. The first thing to note is that since a 2 and b e always lie between - 1 and + 1, the magnitudes of these parameters do not play an important role in the determination of error. The parameters that can be adjusted to minimize the error are t r ( I ) , N, and a 0. The quantity o-(I) is a mea- sure of the accuracy of the intensity measure- ments and can be decreased by using more precise detectors and a higher intensity source. The term a 0 represents the average intensity reaching the detector and the adjusted stan- dard error in a 2 and b e can be decreased by increasing a 0. This is also accomplished with a higher power source. As expected, increasing the number of measurements, N, will also decrease the adjusted standard error of the Fourier coefficients, but because the error varies as N -1/e , this may be a costly method of improving the accuracy.
The adjusted standard error in the refractive indices (SN(n) , S N ( k ) ) is given in terms of the adjusted standard error of the Fourier coeffi-
cients (SN(a2) , SN(b2)) as
S N ( n ) = SN(a 2
and
S N ( k ) = S N ( a 2
+ SN(bO (36)
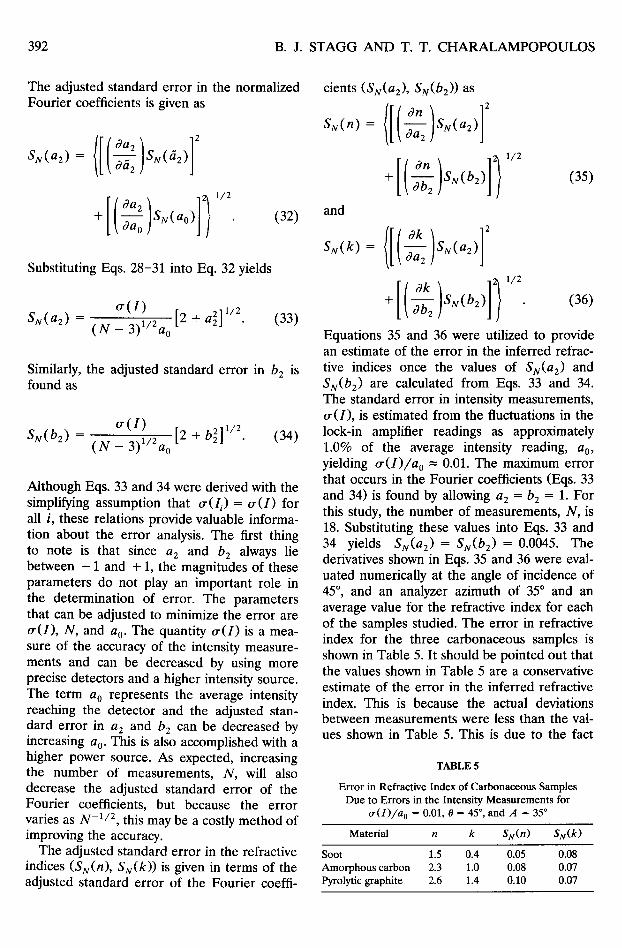
Equations 35 and 36 were utilized to provide an estimate of the error in the inferred refrac- tive indices once the values of SN(a e) and SN(b 2) are calculated from Eqs. 33 and 34. The standard error in intensity measurements, ~r(I), is estimated from the fluctuations in the lock-in amplifier readings as approximately 1.0% of the average intensity reading, a0, yielding t r ( I ) / a o = 0.01. The maximum error that occurs in the Fourier coefficients (Eqs. 33 and 34) is found by allowing a 2 = b 2 = 1. For this study, the number of measurements, N, is 18. Substituting these values into Eqs. 33 and 34 yields SN(a2) = SN(b2) = 0.0045. The derivatives shown in Eqs. 35 and 36 were eval- uated numerically at the angle of incidence of 45 ° , and an analyzer azimuth of 35 ° and an average value for the refractive index for each of the samples studied. The error in refractive index for the three carbonaceous samples is shown in Table 5. It should be pointed out that the values shown in Table 5 are a conservative estimate of the error in the inferred refractive index. This is because the actual deviations between measurements were less than the val- ues shown in Table 5. This is due to the fact
TABLE 5
Error in Refractive Index of Carbonaceous Samples Due to Errors in the Intensity Measurements for
tr(1)/a o = 0.01, 0 = 45 °, and A = 35 °
Material n k Ss(n) SN(k)
Soot 1.5 0.4 0.05 0.08 Amorphous carbon 2.3 1.0 0.08 0.07 Pyrolytic graphite 2.6 1.4 0.10 0.07
REFRACTIVE INDICES OF GRAPHITE, CARBON, AND SOOT 393
that the standard error in intensity measure- ments was actually less than 1% of the average intensity, especially at the higher signal levels.
D R U D E - L O R E N T Z PARAMETERS
The real and imaginary parts of the index (n, k) may be expressed in terms of the num- ber densities of the bound and free electrons (nbi, n f), the natural frequencies of the bound electrons (tobj), and damping constants of the bound and free electrons (gbj, gf) through the dispersion equations [8]
n 2 -- k 2 = 1 + - - e 2 2 n bj..£ ( 0)2 : ~_2)...)
m 8 0.i~_1 (to2j _ t o 2 ) 2 + to2g2 i
(37) (e2)
m,eo 0)2 + g~
and
e 2 2 nb j togbj 2nk - ~'1
m% j= (to2j _ to2)2..{_ to2g~j
( e2 ) nfgf (38) + (to2
The parameters m and m* represent the masses of the bound and free electrons respec- tively, e is the charge of an electron, e 0 is the permittivity of free space, and to is the frequency of the incident radiation. Previous investigators [8, 22, 23] assumed that the damping constants changed with temperature in order to predict the variation of the refrac- tive index with respect to temperature. The results of this study indicate that the refractive index of the carbonaceous materials consid- ered are independent of temperature (within the temperature and spectral ranges of this study) and that the refractive index determined at any temperature is representative for all temperatures. Therefore, it is only necessary to calculate the Drude-Lorentz disper- sion parameters at one temperature and assume that these parameters are valid at all temperatures.
The dispersion model for carbonaceous materials assumes that the material is com-
posed of two types of bound electrons and one free electron. Each bound electron has an associated number density, natural frequency, and damping constant. The quantities associ- ated with the free electrons are number den- sity and damping constant since the natural frequency is zero. With these assumptions, there are eight dispersion parameters for the Drude-Lorentz dispersion model when it is applied to carbonaceous materials. Soot and amorphous carbon are assumed to possess the same optical transitions as those of graphite, meaning that its electrons have the same reso- nant frequencies as graphite. With this assumption [8], the resonant frequencies, tob, and w b take the values 1.25 × 10¹⁵ s -~ and 7.25 12{) 15 S -1 × whereas the damping constant of the free electrons is assumed to be [13] equal to 1.2 × 10¹⁵ s 1. Furthermore, a rela- tion is assumed between the number densities of the electrons [8], which is given as
rib, 2 = llnb, 1 - nf. (39)
Therefore, only four dispersion parameters (n f , rib, l , gb, l, g b , 2 ) remain to be determined. These four parameters are found by minimiz- ing the function
M
F = E [(rtth,i -- n 2 exp,i) + (/qh,i --/%~p,i)2], i = 1
(40)
where the subscript th represents the predic- tions of the dispersion model, the subscript exp represents the experimentally determined value at room temperature, and M is the number of experimental data points with respect to wave- length (M = 10 for these calculations). Note that n and k in Eq. 40 represent the real and imaginary parts of the complex refractive index and is not to be confused with the number density of electrons. The dispersion parame- ters found for the three carbonaceous samples are tabulated in Tables 6-8.
The agreement between the experimentally determined values and the predictions of the dispersion model utilizing the new dispersion constants is shown in Figs. 5-7. It should be noted that since these dispersion parameters were determined with data that cover a limited
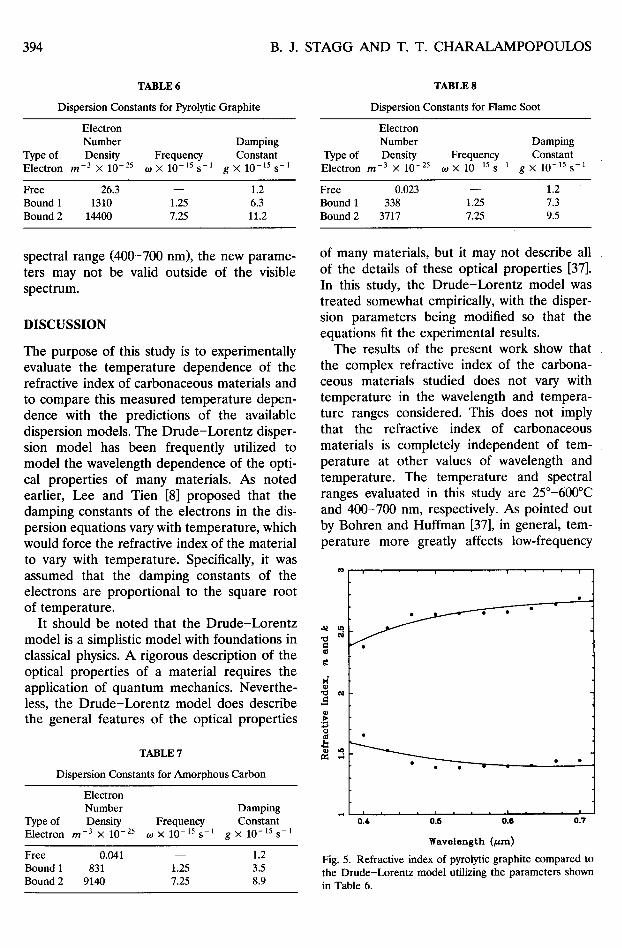
394 B . J . STAGG AND T. T. CHARALAMPOPOULOS
TABLE 6
Dispersion Constants for Pyrolytic Graphite
Electron Number
Type of Density Frequency Electron m -3 x 10 -25 t o x 10-15s -1
Damping Constant
g × 10 -15 S-1
Free 26.3 - - 1.2 Bound 1 1310 1.25 6.3 Bound 2 14400 7.25 11.2
TABLE g
Dispersion Constants for Flame Soot
Electron Number Damping
Type of Density Frequency Constant Electron m-3 × 10- 25 to x 10- is s - 1 g × 10-15 s - 1
Free 0.023 - - 1.2 Bound 1 338 1.25 7.3 Bound 2 3717 7.25 9.5
spectral range (400-700 nm), the new parame- ters may not be valid outside of the visible spectrum.
DISCUSSION
The purpose of this study is to experimentally evaluate the temperature dependence of the refractive index of carbonaceous materials and to compare this measured temperature depen- dence with the predictions of the available dispersion models. The Drude-Lorentz disper- sion model has been frequently utilized to model the wavelength dependence of the opti- cal properties of many materials. As noted earlier, Lee and Tien [8] proposed that the damping constants of the electrons in the dis- persion equations vary with temperature, which would force the refractive index of the material to vary with temperature. Specifically, it was assumed that the damping constants of the electrons are proportional to the square root of temperature.
It should be noted that the Drude-Lorentz model is a simplistic model with foundations in classical physics. A rigorous description of the optical properties of a material requires the application of quantum mechanics. Neverthe- less, the Drude-Lorentz model does describe the general features of the optical properties
TABLE 7
Dispersion Constants for Amorphous Carbon
Electron Number Damping
Type of Density Frequency Constant Electron m -3 × 10 -25 w × 10 -15 s -1 g × 10 -15 s -1
Free 0.041 - - 1.2 Bound 1 831 1.25 3.5 Bound 2 9140 7.25 8.9
of many materials, but it may not describe all of the details of these optical properties [37]. In this study, the Drude-Lorentz model was treated somewhat empirically, with the disper- sion parameters being modified so that the equations fit the experimental results.
The results of the present work show that the complex refractive index of the carbona- ceous materials studied does not vary with temperature in the wavelength and tempera- ture ranges considered. This does not imply that the refractive index of carbonaceous materials is completely independent of tem- perature at other values of wavelength and temperature. The temperature and spectral ranges evaluated in this study are 25°-600°C and 400-700 nm, respectively. As pointed out by Bohren and Huffman [37], in general, tem- perature more greatly affects low-frequency
g
o
&
0 1 , ' ' ' 01 ' ' ' 0 1 . ' ' ' o 1 7
Wavelength (/~m)
Fig. 5. Refractive index of pyrolytic graphite compared to the Drude-Lorentz model utilizing the parameters shown in Table 6.
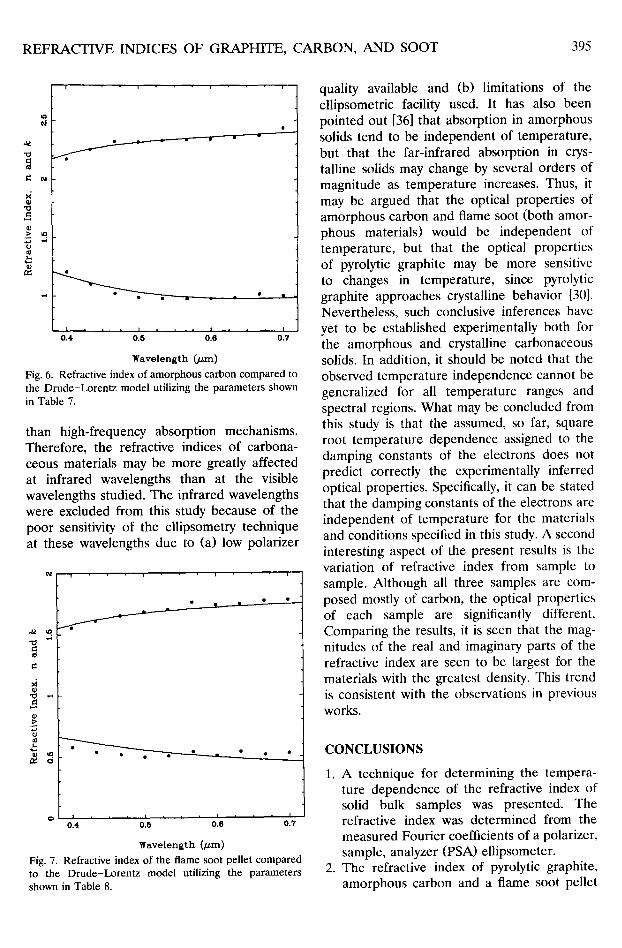
REFRACTIVE INDICES OF GRAPHITE, CARBON, AND SOOT 395
• .7.
01, ' o16 ' 01o ' ' 0 1 7
Wavelength (/zm)
Fig. 6. Refractive index of amorphous carbon compared to the Drude-Lorentz model utilizing the parameters shown in Table 7.
than high-frequency absorption mechanisms. Therefore, the refractive indices of carbona- ceous materials may be more greatly affected at infrared wavelengths than at the visible wavelengths studied. The infrared wavelengths were excluded from this study because of the poor sensitivity of the ellipsometry technique at these wavelengths due to (a) low polarizer
t~
¢9
_~_.__,,___.L._---,------ -'-----~ f
° o i , ' o16 ' o16 ' °17
Wavelength (/zra)
Fig. 7. Refractive index of the flame soot pellet compared to the Drude-Lorentz model utilizing the parameters shown in Table 8.
quality available and (b) limitations of the ellipsometric facility used. It has also been pointed out [36] that absorption in amorphous solids tend to be independent of temperature, but that the far-infrared absorption in crys- talline solids may change by several orders of magnitude as temperature increases. Thus, it may be argued that the optical properties of amorphous carbon and flame soot (both amor- phous materials) would be independent of temperature, but that the optical properties of pyrolytic graphite may be more sensitive to changes in temperature, since pyrolytic graphite approaches crystalline behavior [30]. Nevertheless, such conclusive inferences have yet to be established experimentally both for the amorphous and crystalline carbonaceous solids. In addition, it should be noted that the observed temperature independence cannot be generalized for all temperature ranges and spectral regions. What may be concluded from this study is that the assumed, so far, square root temperature dependence assigned to the damping constants of the electrons does not predict correctly the experimentally inferred optical properties. Specifically, it can be stated that the damping constants of the electrons are independent of temperature for the materials and conditions specified in this study. A second interesting aspect of the present results is the variation of refractive index from sample to sample. Although all three samples are com- posed mostly of carbon, the optical properties of each sample are significantly different. Comparing the results, it is seen that the mag- nitudes of the real and imaginary parts of the refractive index are seen to be largest for the materials with the greatest density. This trend is consistent with the observations in previous works.
CONCLUSIONS
1. A technique for determining the tempera- ture dependence of the refractive index of solid bulk samples was presented. The refractive index was determined from the measured Fourier coefficients of a polarizer, sample, analyzer (PSA) ellipsometer.
2. The refractive index of pyrolytic graphite, amorphous carbon and a flame soot pellet
396 B . J . STAGG AND T. T. CHARALAMPOPOULOS
was inferred in the temperature range 25°-600°C and the spectral range 400- 700 nm.
3. For all three carbonaceous samples studied, the inferred refractive index showed insig- nificant temperature dependence.
4. The present results differ by 30% or more from the predictions of the Drude-Lorentz dispersion model using the, so far, assumed square-root temperature dependence of the electron damping constants for these type of amorphous or crystalline solids.
5. A new set of dispersion constant is pre- sented for all three samples that accurately predicts the variation of the refractive indices with respect to wavelength in the temperature range 25°-600°C and the wave- length region 400-700 nm.
This research was supported in part by the National Science Foundation through grant CBT-8820480.
REFERENCES
1. Erickson, W. D., Williams, G. C., and Hottel, H. C., Combust. Flame 8:127-132 (1964).
2. Foster, P. J., and Howarth, C. R., Carbon 6:719-729 (1968).
3. Dalzell, W. H., and Sarofim, A. F., J. Heat Trans. 91:100-104 (1969).
4. Chippet, S., and Gray, W., Combust. Flame 31: 149-159 (1978).
5. Charalampopoulos, T. T., MSc thesis, Part I, SUNY/ Buffalo, 1981.
6. Tomasseli, V. P., Rivera, R., Edewaard, D. C., and Moiler, K. D., Appl. Opt. 20:3961-3967 (1981).
7. Bockhorn, H., Fetting, F., Meyer, V., Reck, R., and Wannemacher, G., Eighteenth Symposium (Interna- tional) on Combustion, The Combustion Institute, Pittsburgh, 1981, pp. 1137-1147.
8. Lee, S. C., and Tien, C. L., Eighteenth Symposium (International) on Combustion, The Combustion Institute, Pittsburgh, 1981, pp. 1159-1166.
9. Felske, J. D., Charalampopoulos, T. T., and Hura, H. S., Combust. Sci. Technol. 37:263-284 (1984).
10. Batten, C. E., Appl. Opt. 24:1193-1199 (1985). 11. Charalampopoulos, T. T., Rev. Sc. lnstrum. 58:
1638-1646 (1987). 12. Charalampopoulos, T. T., and Felske, J. D., Combust.
Flame 62:283-294 (1987).
13. Charalampopoulos, T. T., and Chang, H., Combust. Sc. Technol. 59:401-421 (1988).
14. Chang, H., and Charalampopoulos, T. T., Proc. R. Soc. Lond. A 430:557-591 (1990).
15. Prado, G., Jacoda, J., Neoh, K., and Lahaye, J., Eigh- teenth Symposium (International) on Combustion, The Combustion Institute, Pittsburgh, 1981, pp. 1127- 1136.
16. Janzen, J., J. Colloid Interface Sci. 69:436-447 (1979). 17. Medalia, A. I., and Richards, L. W., J. Colloid Inter-
face Sci. 40:233-252 (1972). 18. Graham, S. C., Combust. Sci. Technol. 9:159-163
(1974). 19. Sarofim, A. F., Twenty-First Symposium (International)
on Combustion, The Combustion Institute, Pittsburgh, 1986, pp. 1-23.
20. Plunkett, J. D., and Kingery, W. D., Proceedings of the Fourth Carbon Conference, 1960, pp. 457-472.
21. Autio, G. W., and Scala, E., Carbon 4:13-28 (1966). 22. Charalampopoulos, T. T., Chang, H., and Stagg, B.,
Fuel 68:1173 (1989). 23. Howarth, C. R., Foster, P. J., and Thrings, M. W.,
Third Int. Heat Transf Conf. 5:122-128 (1966). 24. Charalampopoulos, T. T., and Stagg, B. J., submitted. 25. Stagg, B. J., Ph.D. dissertation, Louisiana State
University, 1992. 26. Azzam, R. M. A., and Bashara, N. M., Ellipsometry
and Polarized Light, North-Holland, Amsterdam, 1977. 27. Aspnes, D. E., J. Opt. Soc. Am. 64:639 (1974). 28. Stagg, B. J., and Charalampopoulos, T. T., Appl. Opt.
31:479-484 (1992). 29. van der Muelen, Y. J., and Hien, N. C., J. Opt. Soc.
Am. 64:804-811 (1974). 30. Querry, M. R., and Holland, W. E., Appl. Opt.
13:595-598 (1974). 31. Taft, E. A., and Philipp, H. R., Phys. Rev. 138:
A197-A202 (1965). 32. Williams, M. D., and Aspnes, D. E., Phys. Rev. Lett.
41:1667-1670 (1978). 33. Stagg, B. J., and Charalampopoulos, T. T., Appl. Opt.
30:4113-4118 (1991). 34. Hernandez, R., MSc thesis, Louisiana State
University, 1990. 35. Stagg, B. J., and Charalampopoulos, T. T., Appl. Opt.
29:4638-4644 (1990). 36. Barford, N. C., Experimental Measurements: Precision,
Error and Truth, Wiley, Chishester, Great Britain, 1985.
37. Bohren, C. F., and Huffman, D. R., Absorption and Scattering of Light by Small Particles, Wiley, New York, 1983.
Received 12 October 1992; revised 23 February 1993